Outdoor Air Pollution and Population Health in China Haidong Kan, M.D., Ph.D. School of Public...
64
Outdoor Air Pollution and Population Health in China Haidong Kan, M.D., Ph.D. School of Public Health, Fudan University Shanghai, China [email protected] 5th International Conference on Environmental and Occupational Medicine Apr. 9, 2010
-
Upload
charles-nigel-weaver -
Category
Documents
-
view
216 -
download
0
Transcript of Outdoor Air Pollution and Population Health in China Haidong Kan, M.D., Ph.D. School of Public...

Outdoor Air Pollution and Population Health in China
Haidong Kan, M.D., Ph.D. School of Public Health, Fudan University
Shanghai, [email protected]
5th International Conference on Environmental and Occupational
MedicineApr. 9, 2010
Outline
Ambient air pollution levels in China
Air pollution epidemiologic studies in China
Health burden of air pollution in China
Co-benefits of GHGs reduction in China
Summary
Air pollution levels in China
Outline
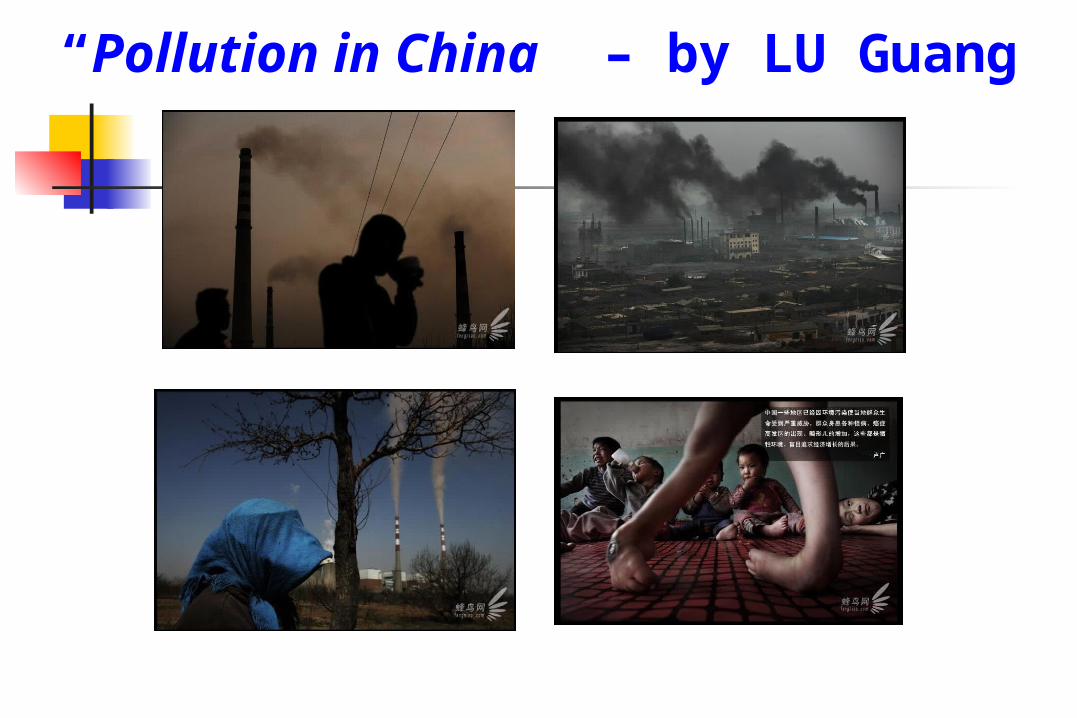
“Pollution in China” – by LU Guang

Estimated PM10 Concentration in World Cities (pop=100,000+)
Source: World Bank

Annual PM10 levels in 30 provincial capitals of China (μg/m3, 2004)

0
20
40
60
80
100
120
140
PM10 SO2 NO2
Chinese cities Nationwide(2004)
China National Air QualityStandard for residentialareas
WHO Global Air QualityGuideline
US National Ambient AirQuality Standards
Kan et al, CVD Prevention & Control, 2009
Comparison of the PM10/SO2/NO2 levels in Chinese cities and International/National Air Quality Standards
(annual average)

Kan et al, Env Int, 2007; Guo et al, Sci Total Environ, 2009
0 20 40 60 80 100 120 140
Beijing (2004-2006)
Shanghai (2005)
WHO Interim Target 1
WHO Interim Target 2
WHO Interim Target 3
US NAAQS
WHO Global AQG
Comparison of the PM2.5 levels in Shanghai, Beijing and International/National Air Quality Standards
Fine particle: PM2.5

Energy production and emissions of SO2 and dust in China, 1998 - 2008
Zhang et al, Lancet, 2010

Air pollution epidemiologic studies in China
Outline

A summary of air pollution epidemiologic studies in China
Short-term exposure studies: Time-series/case crossover studies
Single-city analysis: Beijing, Hong Kong, Shanghai, Shenyang, Taiyuan, Wuhan, etc.
Multi-city analysis: PAPA, CAPES Panel study: Beijing
Long-term exposure study Cross-sectional study: several Cohort study: ONE only
Intervention study Beijing Olympics Hong Kong

Public Health and Air Pollution in Asia (PAPA)
http://www.healtheffects.org/international.htm
Shanghai
Wuhan
Hong Kong
Bangkok
Short-term exposure: Time-series

Results: comparison between PAPA cities
BK had the biggest but less precise ER than the others
PM10: Health effects Levels
Wong et al, EHP, 2008

Traffic-originated particles has the largest health hazard!
% Increase in Daily Deaths by Specific PM2.5 Sources: Six Cities Study (1979-1988)1
Source factor % increase 95% CI
Crustal (Si) -2.3 -5.8, 1.2
Motor vehicles (Pb) 3.4 1.7, 5.2
Coal (Se) 1.1 0.3, 2.0
1 % increase in daily deaths associated with 10 ug/m3 increase in mass concentration from source;
Laden et al, EHP, 2000.
Source factor % increase 95% CI
Crustal (Si) -2.3 -5.8, 1.2
Motor vehicles (Pb) 3.4 1.7, 5.2
Coal (Se) 1.1 0.3, 2.0
1 % increase in daily deaths associated with 10 ug/m3 increase in mass concentration from source;
Laden et al, EHP, 2000.

Similar ERs across cities, but less precise in BK
Wong et al, EHP, 2008; Kan et al, Env Res, 2010
SO2: Health effects Levels
Results: comparison between PAPA cities

Wong et al, EHP, 2008
NO2: Health effects Levels
Results: comparison between PAPA cities

Wong et al, EHP, 2008
O3: Health effects Levels
Results: comparison between PAPA cities

PM10, concentration-response curve
WHO AQG
China National Standard II

Public Health and Air Pollution in Asia (PAPA)
http://www.healtheffects.org/international.htm
Shanghai
Wuhan
Hong Kong
Bangkok
Short-term exposure: Time-series

CAPES
China Air Pollution and Health Effects Study
A new multi-city time-series study in Mainland China
Supported by China Ministry of Environmental Protection PIs: Haidong Kan and Bingheng Chen
Short-term exposure: Time-series

CAPES cities
上海杭州
桂林
天津太原
沈阳
福州
广州
西安
鞍山乌鲁木齐

SO2 NOx PM10
PM2.5 CO VOCs
Spatial Distribution of Emissions in China, 2005

Panel study
Wu et al, EHP, 2009
Association of Heart Rate Variability in Taxi Drivers with Marked Changes of Particulate Air Pollution in Beijing in 2008
Short-term exposure

Among PM10, PM2.5: significant
effects on daily mortality;
PM10-2.5: NO significant health effects
PM10: PM2.5 vs. PM10-2.5
Kan et al, Environ Int, 2007
Short-term exposure

Interaction between pollutants
Chen et al, Biomed Environ Sci, 2007
Higher PM10 significantly increased the effect of O3 on total mortality;
O3 also increased the effect of PM10.
Short-term exposure

Visibility and mortality risk
Huang et al, Sci Total Environ 2009
Short-term exposure
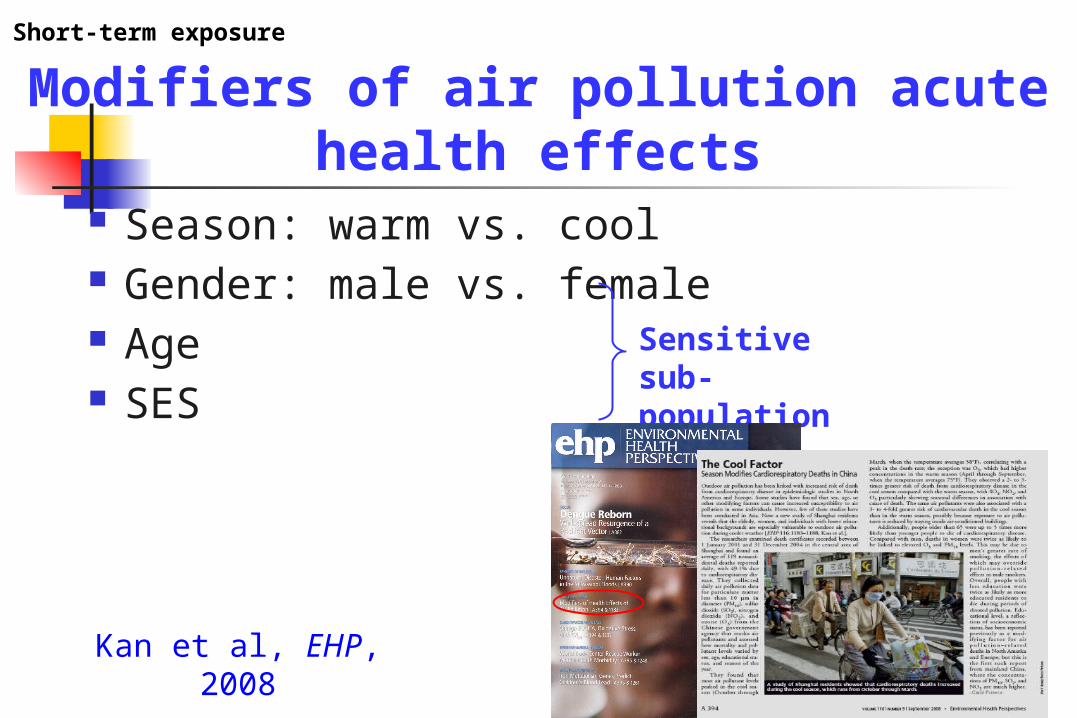
Modifiers of air pollution acute health effects
Season: warm vs. cool Gender: male vs. female Age SES
Sensitive sub-population
Kan et al, EHP, 2008
Short-term exposure

Warm season Cool season
Total mortality PM10 0.21 (0.09, 0.33) 0.26 (0.22, 0.30)
SO2 0.79 (0.16, 1.42) 1.41 (0.98, 1.83)
NO2 0.88 (0.34, 1.42) 1.61 (1.21, 1.99) *
O3 0.22 (-0.08, 0.52) 1.18 (0.52, 1.83) *
Cardiovascularmortality
PM10 0.26 (0.00, 0.51) 0.30 (0.20, 0.40)
SO2 0.56 (-0.44, 1.55) 1.46 (0.84, 2.07)
NO2 0.76 (-0.09, 1.62) 1.77 (1.19, 2.33)
O3 0.26 (-0.22, 0.74) 1.35 (0.41, 2.28) *
Respiratorymortality
PM10 -0.21 (-0.82, 0.41) 0.79 (0.47, 1.11) *
SO2 -0.31 (-2.06, 1.43) 3.05 (2.04, 4.07) *
NO2 -1.01 (-2.50, 0.48) 3.34 (2.40, 4.28) *
O3 0.09 (-0.75, 0.92) 0.39 (-1.19, 1.97)
Warm (May-Oct) and cold (Nov-Apr) seasons
Kan et al, EHP, 2008
Short-term exposure

Warm (May-Oct) and cold (Nov-Apr) seasons
Cao et al, Sci Total Environ, 2009
Short-term exposure

Female vs. male
Female Male
PM10 0.33 (0.18, 0.47) 0.17 (0.03, 0.32)*
SO2 1.05 (0.61, 1.49) 0.85 (0.43, 1.27)
NO2 1.10 (0.69, 1.50) 0.88 (0.49, 1.27)
O3 0.40 (0.03, 0.76) 0.19 (-0.16, 0.54)*
Kan et al, EHP, 2008
Short-term exposure

Young vs. old5-44 45-64 65+
PM10 0.04 (-0.52, 0.59)
0.17 (-0.11, 0.44)
0.26 (0.14, 0.38)
SO2 1.20 (-0.47, 2.87)
0.22 (-0.60, 1.03)
1.00 (0.65, 1.35)
NO2 0.52 (-1.02, 2.06)
0.64 (-0.11, 1.39)
1.01 (0.69, 1.33)
O3 -0.08 (-1.39, 1.24)
0.47 (-0.19, 1.12)
0.32 (0.03,0.61)
Short-term exposure
Kan et al, EHP, 2008

Educational level: a measure of SES
Short-term exposure
Kan et al, EHP, 2008

Air pollution and mortality in Beijing
Zhang et al, Sci Total Environ, 2000
Long-term exposure: cross-sectional
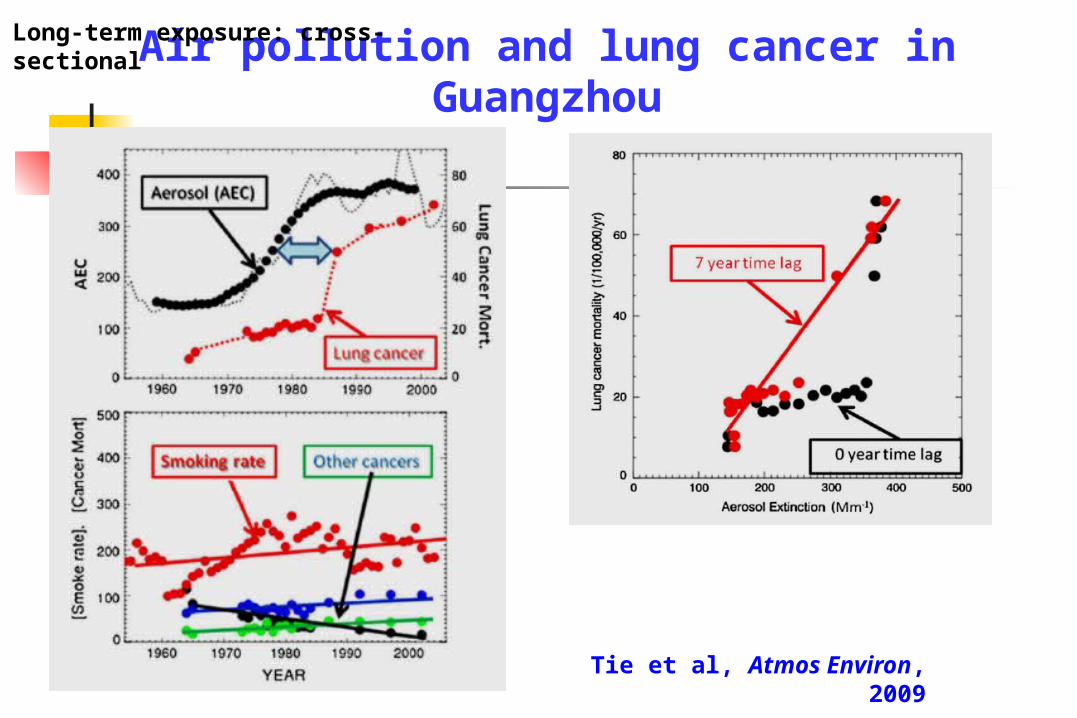
Air pollution and lung cancer in Guangzhou
Tie et al, Atmos Environ, 2009
Long-term exposure: cross-sectional

CNHS Air Study
China National Hypertension Survey (CNHS) Baseline survey in 1991 Follow-up visit in 1999 158,666 participants in 17 provinces of China
(including both urban and rural areas)
CNHS Air: a retrospective cohort analysis of outdoor air pollution and mortality in China 90,167 urban participants in 41 Chinese cities
Long-term exposure: cohort study

Previous findings from the CNHS
Gu et al, JAMA, 2006He et al, NEJM, 2005 Gu et al, NEJM, 2009
Long-term exposure: cohort study

CNHS Air cities
Mean Range
TSP 293 135 - 489
SO2 83 13 - 209
NOX 47 11 - 106
Outdoor air pollution levels
(in 1991-1993, μg/m3)
Long-term exposure: cohort study

CNHS Air Results
Each 10 μg/m3 increase in TSP was associated with increased risk of death *: 0.2% for total mortality (p=0.222) 0.8% for cardiovascular mortality
(p=0.003) 0.4% for respiratory mortality (p=0.448) 1.0% for lung cancer mortality (p=0.095)
Long-term exposure: cohort study
* After adjustment for age, gender, smoking (smoking status, age at starting smoking, years smoked, and cigarettes per day), alcohol intake, physical activity, education, hypertension

Comparison with the ACS study
CNHS*: 10 μg/m3 increase of PM2.5 was associated with
- 0.6% ↑ of total mortality - 2.5% ↑ of cardiovascular
mortality- 1.2% ↑ of respiratory
mortality- 3.1% ↑ of lung cancer
mortality
*: assuming PM2.5/PM10≈0.65 and PM10/TSP ≈0.5
ACS:10 μg/m3 increase of PM2.5 was associated with
- 4% ↑ of total mortality - 6% ↑ of cardiopulmonary
mortality- 8% ↑ of lung cancer
mortality
Pope et al, JAMA, 2002
Long-term exposure: cohort study

1.0000
1.0100
1.0200
1.0300
1.0400
1.0500
1.0600
Acute effects Chronic effects
China
WesternCountries
Kan et al, Biomed Environ Sci, 2005

Strengths and limitations of CNHS Air
Strengths Large sample size Detailed individual information on potential
confounders
Limitations TSP only Air pollution exposure on the aggregated city
level, rather than individual level
Long-term exposure: cohort study

Health benefits gained from environmental intervention
Hong Kong Dublin Atlanta Beijing Olympics
Intervention study

1988 1989 1990 1991 1992 1993 1994 1995
020
4060
80
NO2
SO2
O3
PM10
Mic
rogr
am
s pe
r cu
bic
met
re
Year
HALF YEARLY MEAN LEVELSFuel restriction on sulphur
50% reduction in SO2 after the intervention
No change in other pollutants
Hedley et al 2002
Hong Kong: air pollutants 1988 – 95

-6-5
-4-3
-2-1
0
15-64 65+ 15-64 65+ 15-64 65+
Reductions In Deaths After Sulfur Restriction
All causes Cardiovascular Respiratory
% R
educ
tion
in a
nnua
l tre
nd
-1.8%
-2.8%
-1.6%
-2.4%
-4.8%
-4.2%
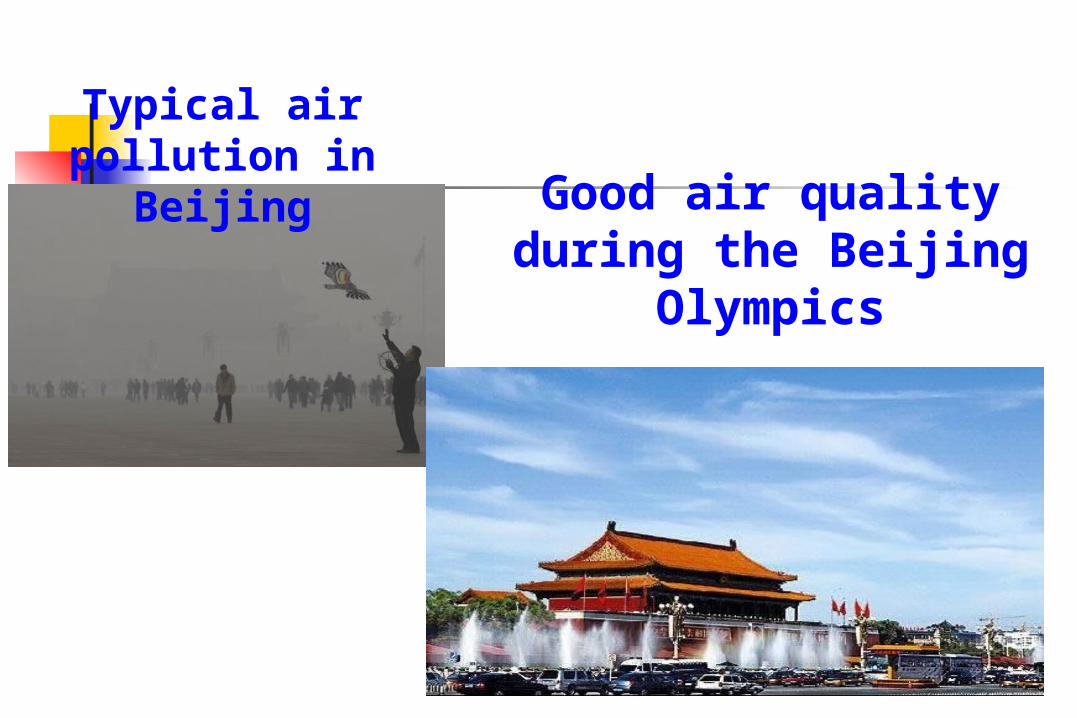
Typical air pollution in
Beijing Good air quality during the Beijing
Olympics

2008 Beijing Olympic Games

2008 Beijing Olympic Games
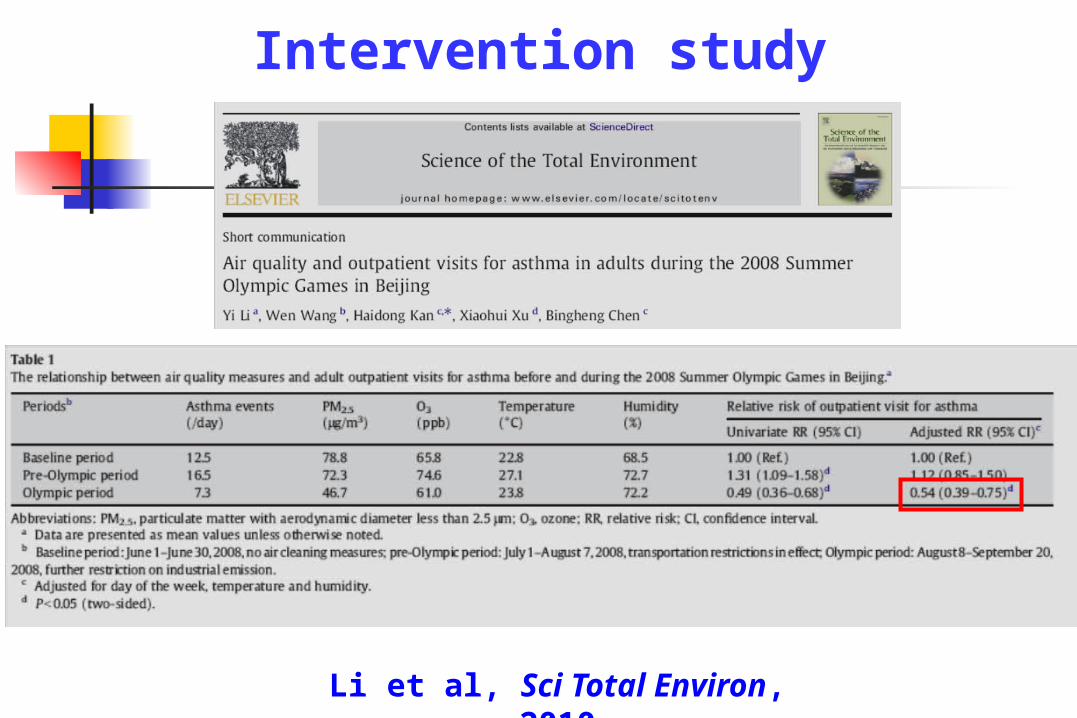
Intervention study
Li et al, Sci Total Environ, 2010
Health burden of air pollution in China
Outline

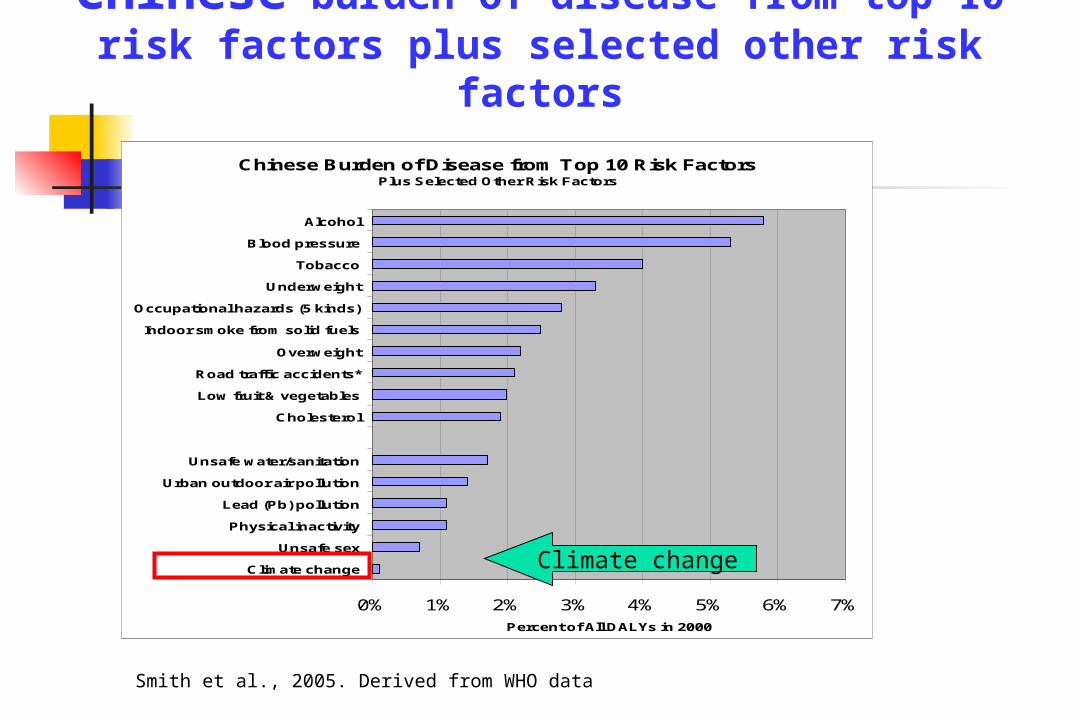
Chinese Burden of Disease from Top 10 Risk FactorsPlus Selected Other Risk Factors
0% 1% 2% 3% 4% 5% 6% 7%
Climate change
Unsafe sex
Physical inactivity
Lead (Pb) pollution
Urban outdoor air pollution
Unsafe water/sanitation
Cholesterol
Low fruit & vegetables
Road traffic accidents*
Overweight
Indoor smoke from solid fuels
Occupational hazards (5 kinds)
Underweight
Tobacco
Blood pressure
Alcohol
Percent of All DALYs in 2000
Smith et al., 2005. Derived from WHO data
Chinese burden of disease from top 10 risk factors plus selected other risk factors
Outdoor air pollution

Economic analysis: national
3.8% of GDP
1.2% of GDP

Estimation of the economic cost of health impacts due to PM10 exposure in Shanghai in 2000
Health outcomes mean (95% CI) Premature death 787.8 Chronic bronchitis 91.9 Respiratory Hospital admission 2.9
Cardiovascular Hospital admission 2.9
Outpatient visits (internal medicine) 4.0
Outpatient visits (pediatrics) 0.4 Acute bronchitis 3.7 Asthma attack(<15) 0.3
Total 893.8*
* Accounting for 1.62% of Shanghai GDP in 2000
Kan and Chen, Sci Total Environ, 2004
Chinese Burden of Disease from Top 10 Risk FactorsPlus Selected Other Risk Factors
0% 1% 2% 3% 4% 5% 6% 7%
Climate change
Unsafe sex
Physical inactivity
Lead (Pb) pollution
Urban outdoor air pollution
Unsafe water/sanitation
Cholesterol
Low fruit & vegetables
Road traffic accidents*
Overweight
Indoor smoke from solid fuels
Occupational hazards (5 kinds)
Underweight
Tobacco
Blood pressure
Alcohol
Percent of All DALYs in 2000
Smith et al., 2005. Derived from WHO data
Chinese burden of disease from top 10 risk factors plus selected other risk factors
Climate change

Total yearly worldwide, US, Chinese, and western European CO2 emissions (left) and per-head yearly CO2 emissions (right)
Zhang et al, Lancet, 2010

Modifiers of the temperature-mortality association in Shanghai
Ma et al, submittedKan et al, Env Res, 2007
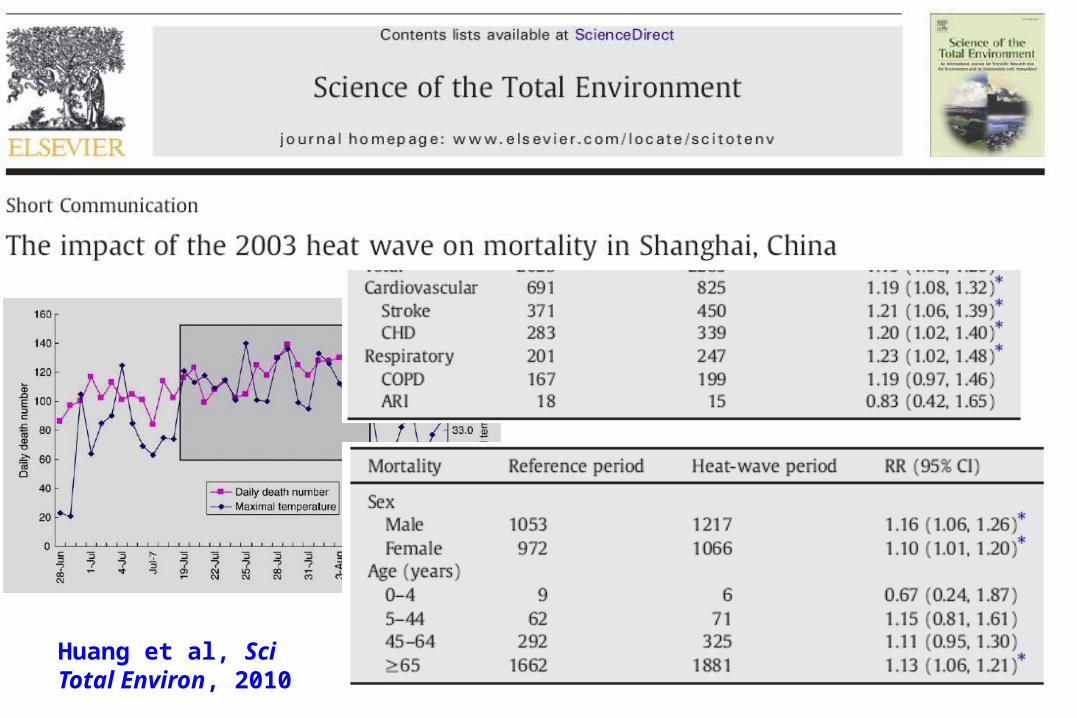
Huang et al, Sci Total Environ, 2010

Diurnal temperature range (DTR)
Easterling DR et al, Science, 1997, 277: 364-367


Ancillary benefits of low-carbon policy
Low carbon policy
Acting Locally While Thinking Globally
Greenhouse Gases Emission
(global effect)
Air Pollutants Emission
Air Quality Changes
(local effect)
Population Exposure
Health Outcomes

Solar hot water heater in China
Solar powered Christmas tree
Low carbon life

Endpoints EE GAS WIND SO2b SO2c
Premature death 9870 22210 23100 27280 27340Chronic bronchitis
20700 46330 48160 56770 56890
Respiratory Hospital admission
5057 12030 12560 15150 15190
Cardiovascular Hospital admission
2537 6075 6347 7672 7691
Outpatient visits (internal medicine)
348600 844200 882700 1072000 1074000
Outpatient visits (pediatrics)
36210 87620 91620 111200 111500
Acute bronchitis 659700 1478000 1537000 1812000 1816000Asthma attack 13580 29590 30700 35860 35930
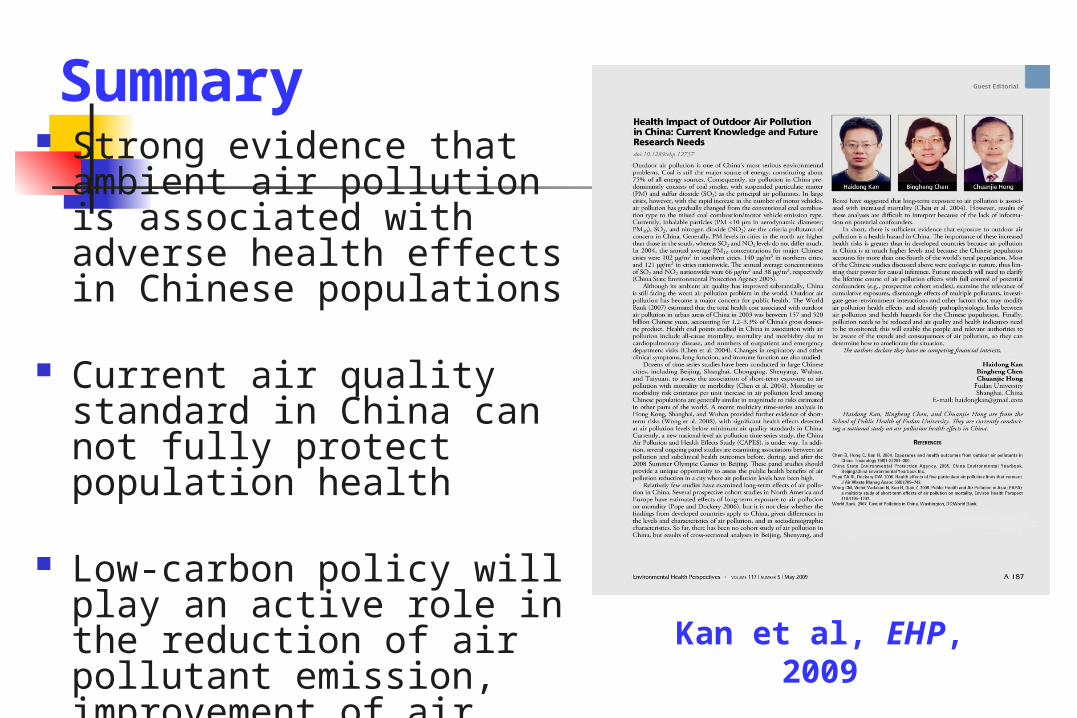
Summary Strong evidence that ambient
air pollution is associated with adverse health effects in Chinese populations
Current air quality standard in China can not fully protect population health
Low-carbon policy will play an active role in the reduction of air pollutant emission, improvement of air quality and the promotion of public health Kan et al, EHP,
2009

Acknowledgement Fudan Univ.: Bingheng Chen, Weimin Song US NIH/NIEHS: Stephanie J. London Shanghai CDC: Guixiang Song, Lili Jiang Shanghai Environmental Monitoring Center:
Guohai Chen Peking Univ. : Wei Huang Graduate Students: Renjie Chen, Wenjuan
Ma, Chunxue Yang