![18B [c#6629] DVD DVD PDF 17B DVD DVD PDF ä&b) 1997 2004 ... · 18B [c#6629] DVD DVD PDF 17B DVD DVD PDF ä&b) 1997 2004 2010 1984-1985 2001 2002 2006 2009](https://static.fdocuments.us/doc/165x107/5c670dce09d3f2c14e8cf09a/18b-c6629-dvd-dvd-pdf-17b-dvd-dvd-pdf-aeb-1997-2004-18b-c6629-dvd.jpg)
Outcomes-Based Accountability “Turning the Curve” The Fiscal Policy Studies Institute Websites...
66
Outcomes-Based Accountability “Turning the Curve” The Fiscal Policy Studies Institute Websites raguide.org resultsaccountability.com Book - DVD Orders amazon.com resultsleadership.org TM
-
Upload
damian-pope -
Category
Documents
-
view
216 -
download
0
Transcript of Outcomes-Based Accountability “Turning the Curve” The Fiscal Policy Studies Institute Websites...

Outcomes-BasedAccountability
“Turning the Curve”
The Fiscal Policy Studies Institute
Websitesraguide.org
resultsaccountability.com
Book - DVD Ordersamazon.com
resultsleadership.org
TM

SIMPLE
COMMON SENSE
PLAIN LANGUAGE
MINIMUM PAPER
USEFUL

Outcomes-Based Accountabilityis made up of two parts:
Performance Accountabilityabout the well-being of
CUSTOMER POPULATIONSFor Services – Agencies – and Service Systems
Population Accountabilityabout the well-being of
WHOLE POPULATIONSFor Communities – Cities – Counties – States - Nations

COMMONLANGUAGE

THE LANGUAGE TRAPToo many terms. Too few definitions. Too little discipline
Benchmark
Target
Indicator Goal
Result
Objective
Outcome
Measure
Modifiers Measurable Core Urgent Qualitative Priority Programmatic Targeted Performance Incremental Strategic Systemic
Lewis Carroll Center for Language DisordersMeasurable urgent systemic indicatorsCore qualitative strategic objectivesYour made up jargon here
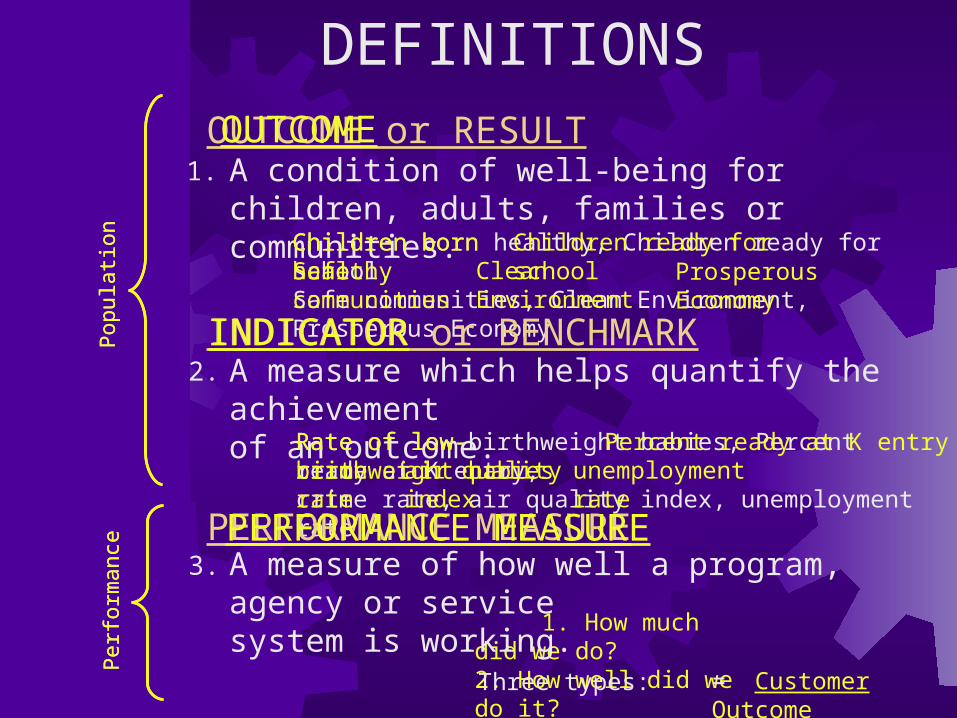
DEFINITIONS
Children born healthy, Children ready for school, Safe communities, Clean Environment, Prosperous Economy
Rate of low-birthweight babies, Percent ready at K entry, crime rate, air quality index, unemployment rate
1. How much did we do? 2. How well did we do it? 3. Is anyone better off?
OUTCOME or RESULT
INDICATOR or BENCHMARK
PERFORMANCE MEASURE
A condition of well-being for children, adults, families or communities.
A measure which helps quantify the achievement of an outcome.
A measure of how well a program, agency or service system is working. Three types:
Popu
latio
nPe
rform
ance
Children born healthy
Rate of low-birthweight babies Percent ready at K entry
Children ready for school
crime rate
Safe communities
air quality index
Clean Environment
unemployment rate
Prosperous Economy
INDICATOR
OUTCOME
PERFORMANCE MEASURE
Popu
latio
nPe
rform
ance
= Customer Outcome
1.
2.
3.

1. Safe Communities
2. Crime rate
3. Average police response time
4. People are physically & mentally healthy
5. Rate of heart disease
6. People have living wage jobs and income
7. % of people with living wage jobs and income
8. % of participants in job training who get living wage jobs
IS IT A RESULT, INDICATOR OR PERFORMANCE MEASURE?
RESULT
INDICATOR
PERF. MEASURE
RESULT
INDICATOR
RESULT
INDICATOR
PERF. MEASURE
POPULATIONACCOUNTABILITY

Community Outcomesfor Christchurch, NZ
1. A Safe City
2. A City of Inclusive and Diverse Communities
3. A City of People who Value and Protect the Natural Environment
4. A Well-Governed City
5. A Prosperous City
6. A Healthy City
7. A City for Recreation, Fun and Creativity
8. City of Lifelong Learning
9. An Attractive and Well-Designed City

City of London Ontario, CanadaPriority Results
● A Strong Economy
● A Vibrant Diverse Community
● A Green and Growing City
● A Reliable Infrastructure
● A Safe City
Source: Draft Strategic Plan Sept 2011

CARDIFF, WALESCommunity Outcomes
1. People in Cardiff are healthy
2. Cardiff has a clean attractive and sustainable environment
3. People in Cardiff are safe and feel safe
4. Cardiff has a thriving and prosperous economy
5. People in Cardiff achieve their full potential.
6. Cardiff is a great place to live, work and play.
7. Cardiff has a fair, just and inclusive society.

New Zealand
Kruidenbuurt Tilburg, Netherlands
Cardiff, Wales
Santa Cruz County


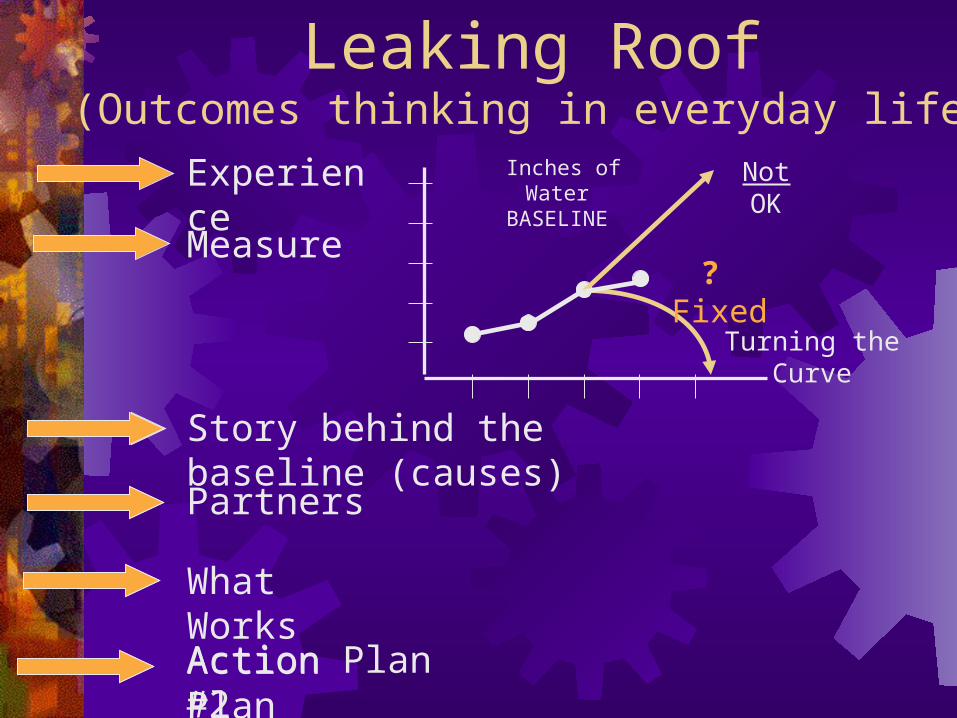
Leaking Roof(Outcomes thinking in everyday life)
Experience
Measure
Story behind the baseline (causes)
Partners
What Works
Action Plan
Inches of WaterBASELINE
? Fixed
Not OK
Turning the Curve
Action Plan #2
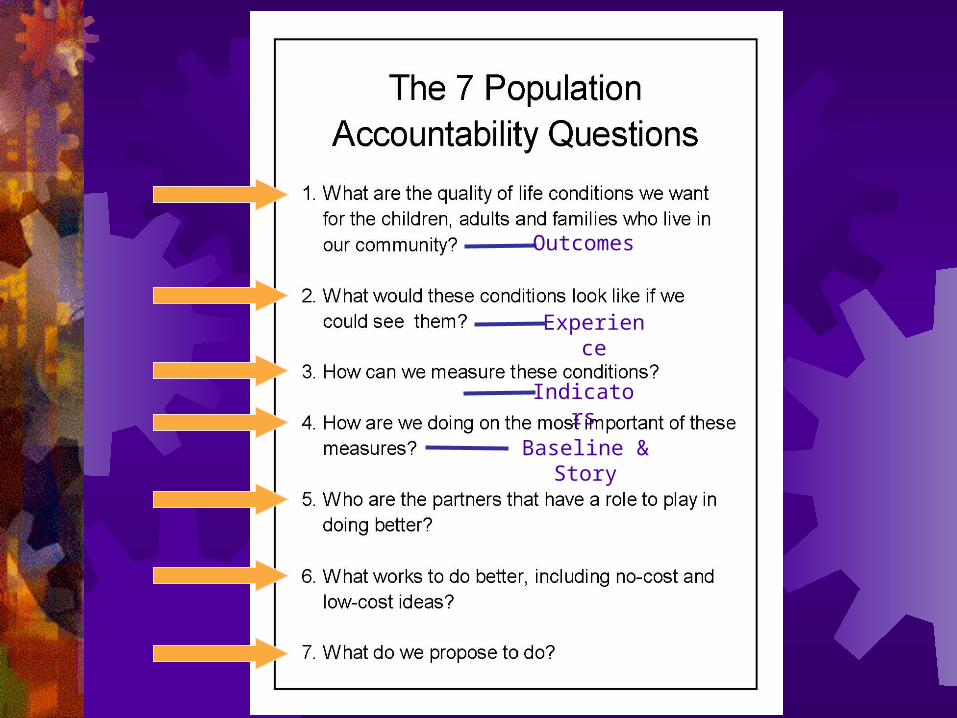
Baseline & Story
Outcomes
Indicators
Experience
1975
1980
1982
1990
2000
2005
0
5
10
15
20
25
30
Tho
usan
ds
Source 1982 to 2005: Actual data from the NHTSA Fatality Analysis Reporting System (FARS)Source 1975 to 1981: Estimate based on NHTSA data on % of fatality drivers with BAC of .10 or greater.
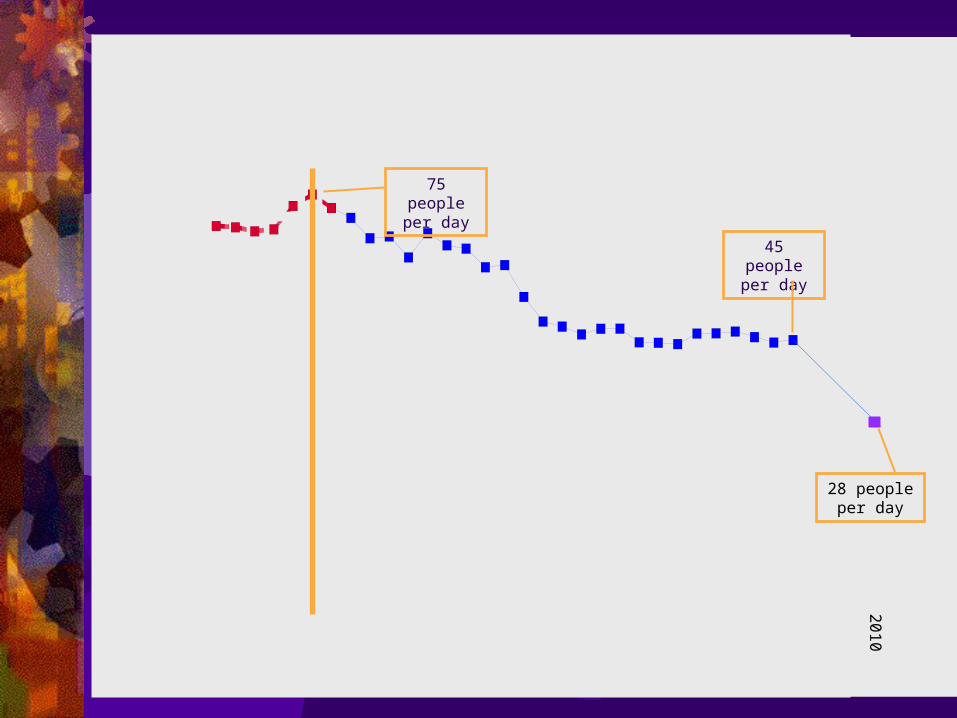
Alcohol-Related Traffic FatalitiesUnited States 1975 to 2005
45 people per day
75 people per day
2010
28 peopleper day
MADD

no. of Tagged Sites visited
02000400060008000
1000012000140001600018000
2001
/02
2002
/03
2003
/04
2004
/05
2005
/06
2006
/07
2007
/08
2008
/09
2009
/10
year
no
. of
site
s
2001/02
2002/03
2003/04
2004/05
2005/06
2006/07
2007/08
2008/09
2009/10
Christchurch, New ZealandNumber of Graffiti Sites
FY 2002 to FY 2010

6.00%
8.00%
10.00%
12.00%
14.00%
16.00%
18.00%
20.00%
Ncle 14.5 14.5 16.8 14.5 17 15 11.9 10.6 9.5 9.3
1998 1999 2000 2001 2002 2003 2004 2005 2006 2007
Source: Connexions Tyne and Wear, UK
Newcastle, UK
Revised 9 Nov 2007
Nov 08 – Jan 09
8.5


PERFORMANCEACCOUNTABILITY
“All Performance Measures
that have ever existed
for any service
in the history of the universe
involve answering two sets of
interlocking questions.”
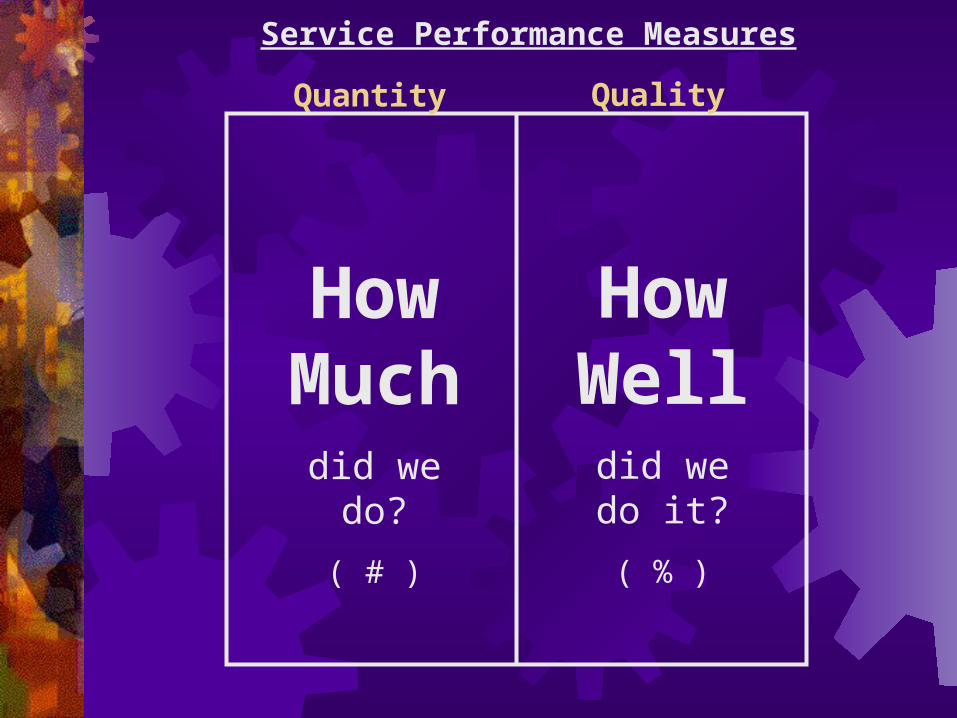
HowMuchdid we do?
( # )
HowWell
did we do it?
( % )
Quantity Quality
Service Performance Measures
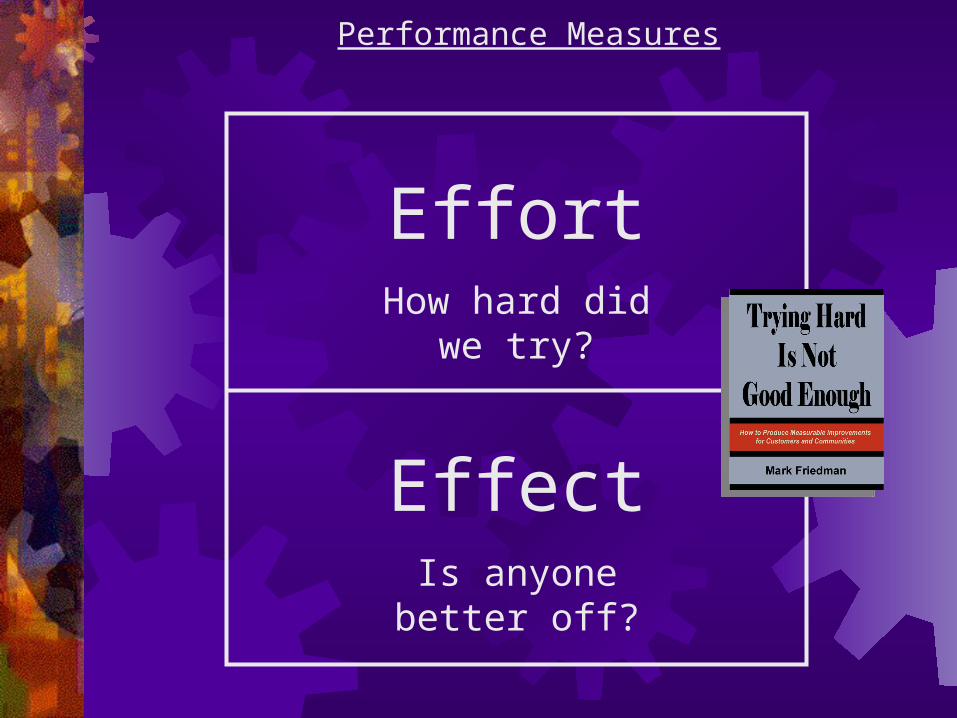
EffortHow hard did we try?
EffectIs anyone better off?
Performance Measures
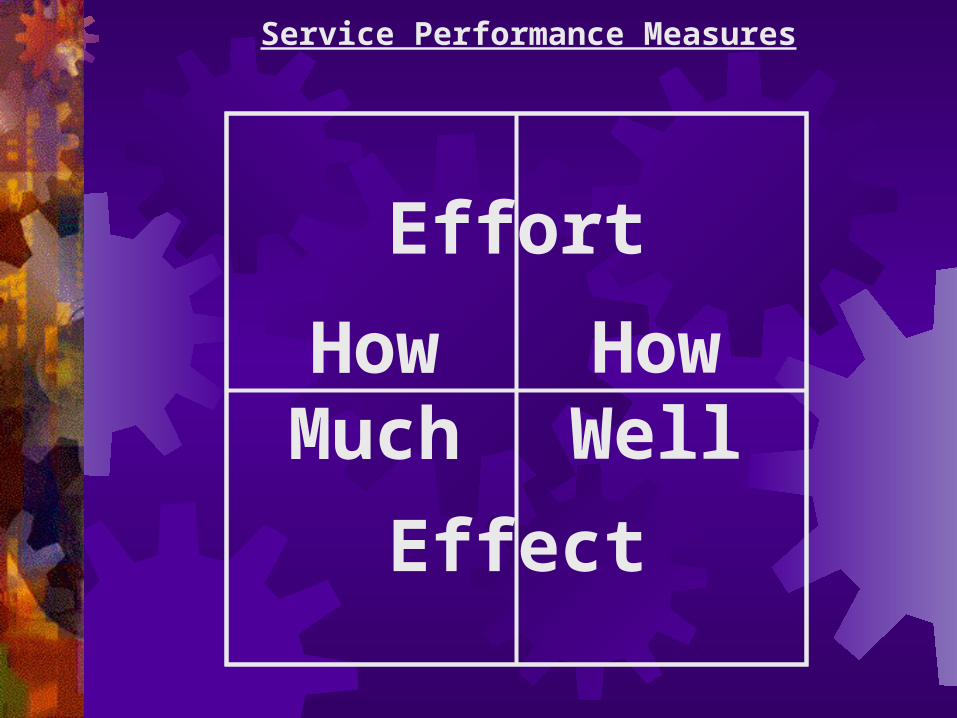
Effort
Effect
HowMuch
HowWell
Service Performance Measures
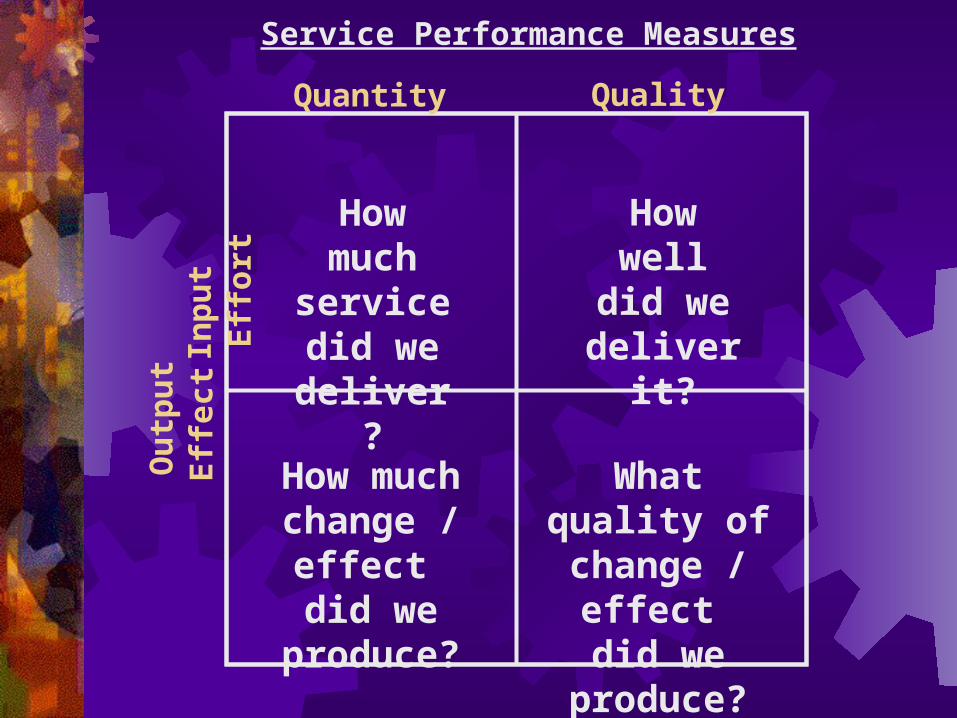
How much service did we deliver?
Service Performance Measures
How welldid we
deliver it?
How much change / effect
did we produce?
What quality of change / effect
did we produce?
Quantity Quality
Effe
ct
Effo
rt
O
utpu
t
In
put

How much did we do?
Service Performance Measures
How welldid we do it?
Is anyonebetter off?
Quantity Quality
Effe
ct
Effo
rt
# %
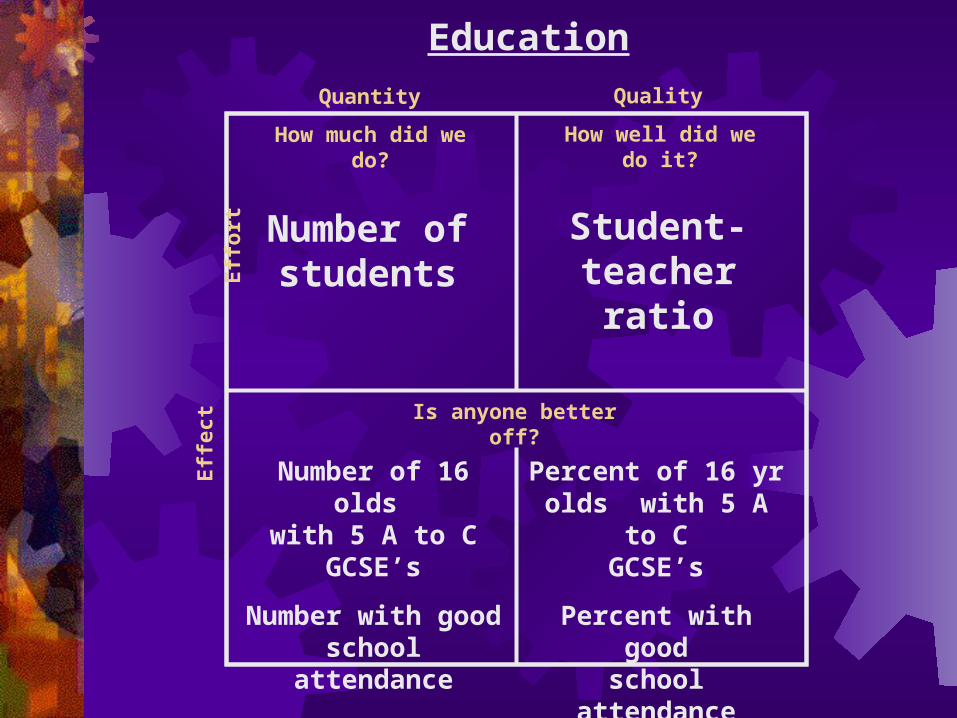
How much did we do?
Education
How well did we do it?
Is anyone better off?
Quantity Quality
Effe
ct
E
ffort Number of
studentsStudent-teacher
ratio
Number of 16 olds with 5 A to C
GCSE’s
Number with goodschool attendance
Percent of 16 yr olds with 5 A to C
GCSE’s
Percent with goodschool attendance
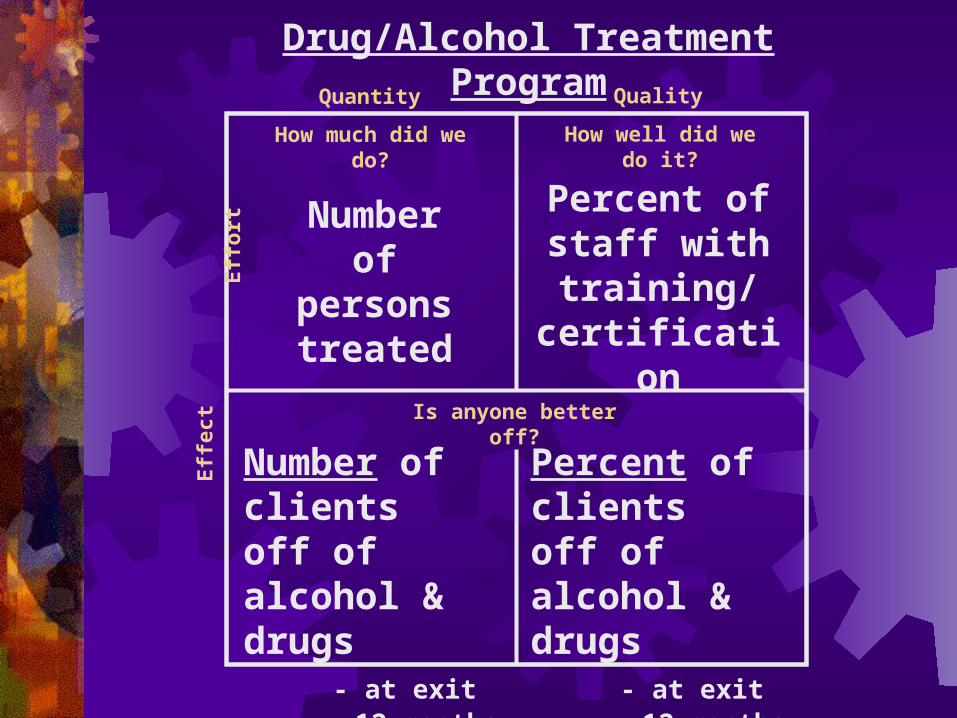
How much did we do?
Drug/Alcohol Treatment Program
How well did we do it?
Is anyone better off?
Number ofpersonstreated
Percent ofstaff withtraining/
certification
Number of clientsoff of alcohol & drugs - at exit - 12 months after exit
Percent of clientsoff of alcohol & drugs - at exit - 12 months after exit
Quantity Quality
Effe
ct
E
ffort
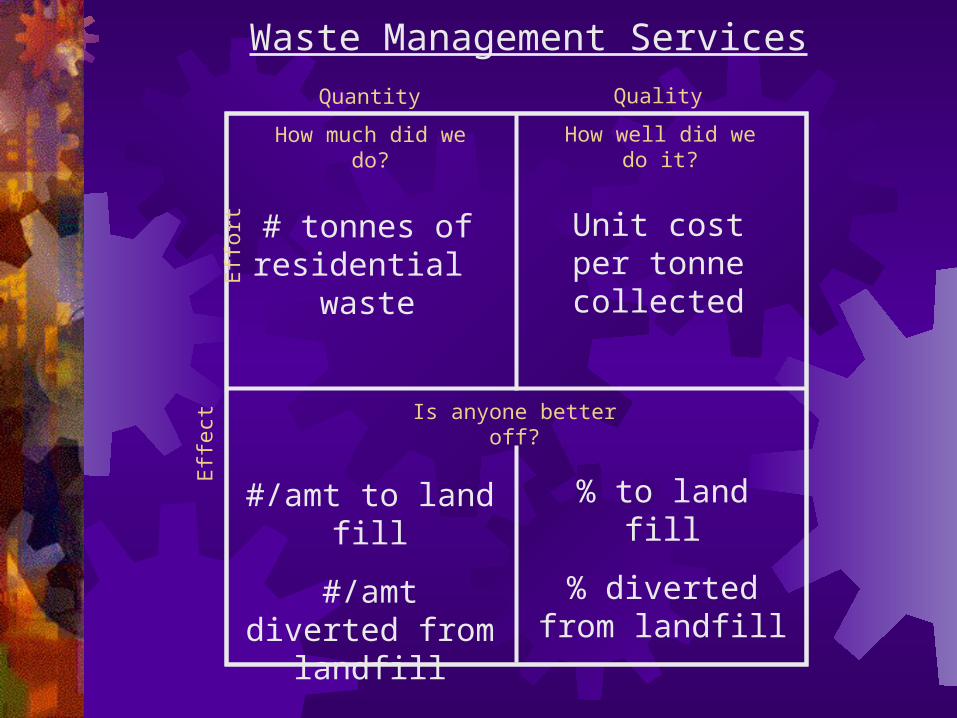
How much did we do?
Waste Management Services
How well did we do it?
Is anyone better off?
Quantity Quality
Effe
ct
E
ffort
# tonnes of residential
waste
Unit costper tonnecollected
% to land fill
% diverted from landfill
#/amt to land fill
#/amt diverted from landfill
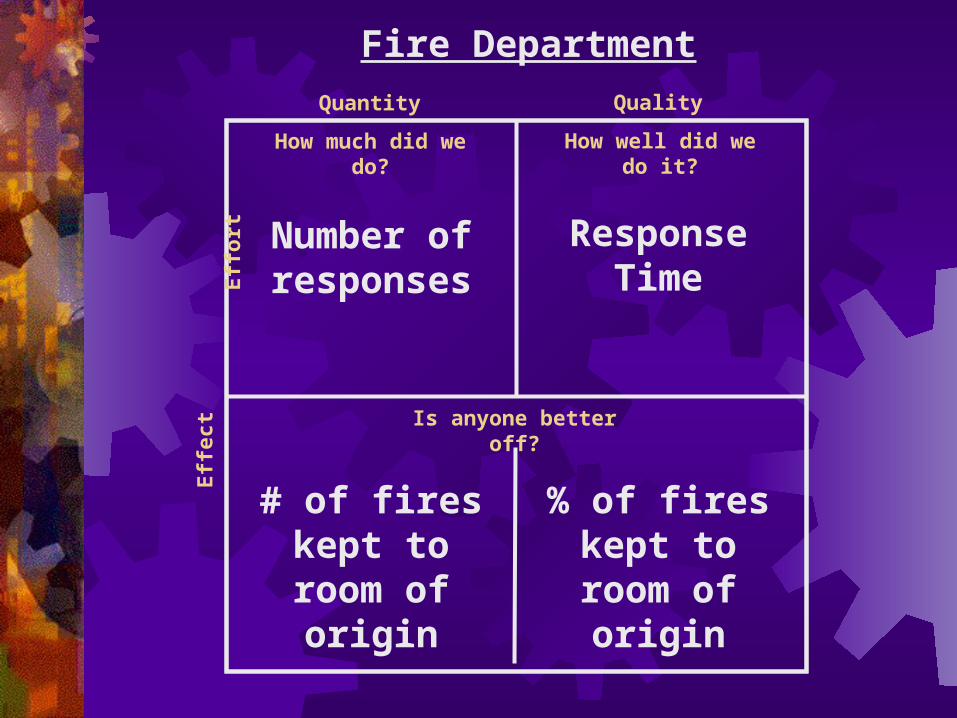
How much did we do?
Fire Department
How well did we do it?
Is anyone better off?
Number ofresponses
ResponseTime
Quantity Quality
Effe
ct
E
ffort
# of fireskept to
room of origin
% of fireskept to
room of origin

How much did we do?
Not All Performance Measures Are Created Equal
How well did we do it?
Is anyone better off?
LeastImportant
Quantity Quality
Effe
ct
E
ffort
MostImportant
Least
Most
AlsoVery Important
Quality
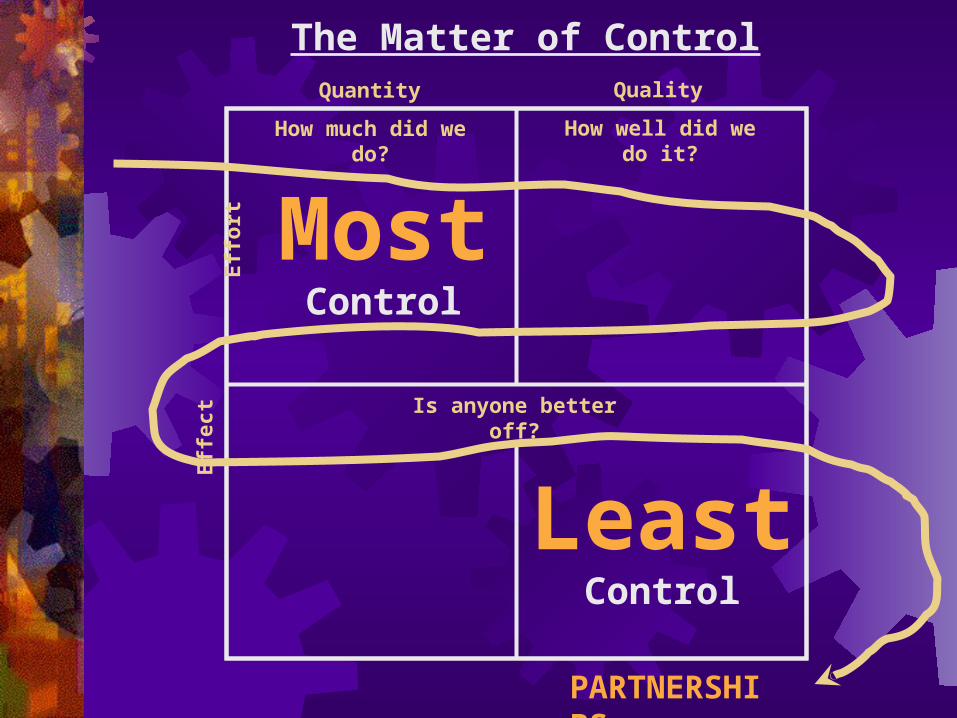
How much did we do?
The Matter of Control
How well did we do it?
Is anyone better off?
Quantity Quality
Effe
ct
E
ffort
LeastControl
PARTNERSHIPS
MostControl

How much did we do?
Performance AccountabilityTypes of Measures found in each Quadrant
How well did we do it?
Is anyone better off?
# Clients/customers served
# Activities (by type of activity)
% Common measurese.g. client staff ratio, workload ratio, staffturnover rate, staff morale, % staff fully trained, % clients seen in their own language,worker safety, unit cost
% Skills / Knowledge (e.g. parenting skills)
#
% Attitude / Opinion (e.g. toward drugs)
#
% Behavior (e.g.school attendance)
#
% Circumstance (e.g. working, in stable housing)
#
% Activity-specific measures
e.g. % timely, % clients completing activity, % correct and complete, % meeting standard
Point in Timevs.
2 Point Comparison
# %

How much did we do?
Service: __________________________________
How well did we do it?
Is anyone better off?
Primary customers# studentspatientspersons trained
Primary activity# hours of
instructiondiagnostic testsjob coursesalarms responded to
If your service works really well,how are your customer's better off?
# students who graduatepatients who fully recoverfires kept to room of origin
%
Unit cost
Workload ratio
% of ___x___ that happen on time
persons who get jobs
School Hospital Job Training Fire Department

LR
UR
Primary v. Secondary
Direct v. Indirect
Internal v. External
Baseline & Story


Watermain Breaks per yearLondon Ontario

Advanced Baseline Display
Your Baseline
Comparison Baseline
Goal (line)
Target or Standard
Instead:Count anything better than baseline as progress.
Avoid publicly declaringtargets by year if possible.
●
Create targets only when they are:
FAIR & USEFUL
x
AspirationNOT
Punishment
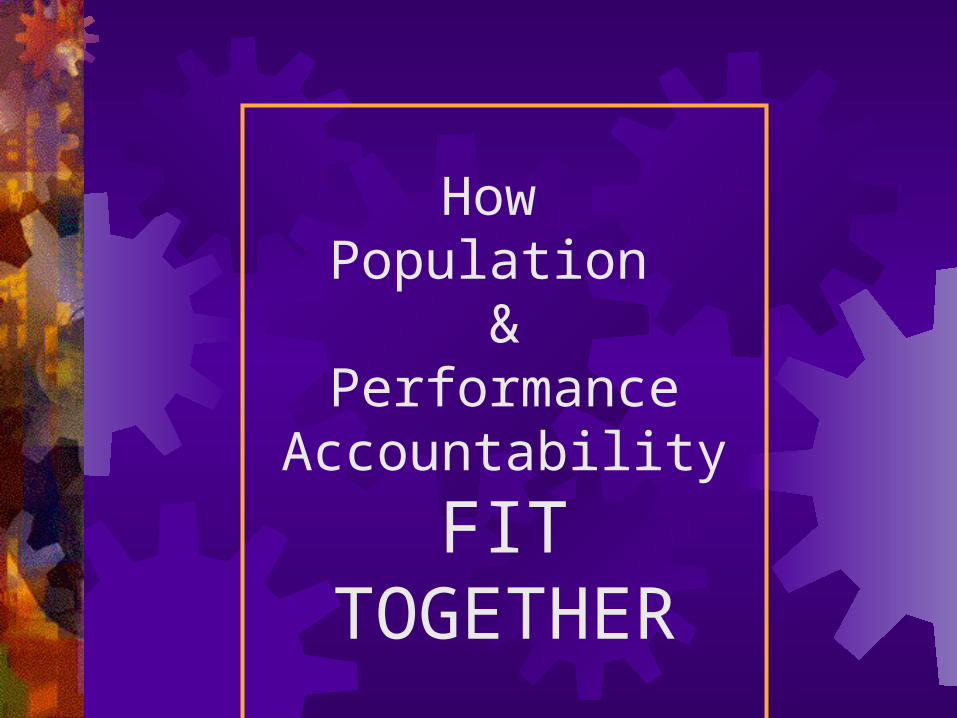
How Population
&Performance Accountability
FIT TOGETHER

Contributionrelationship
Alignmentof measures
Appropriateresponsibility
THE LINKAGE Between POPULATION and PERFORMANCE
POPULATION ACCOUNTABILITY
Healthy Births Rate of low birth-weight babiesChildren Ready for School Percent fully ready per K-entry assessmentSelf-sufficient Families Percent of parents earning a living wage
CUSTOMEROUTCOMES
# personsreceivingtraining
Unit costper person
trained
# who getliving wage jobs
% who getliving wage jobs
PERFORMANCE ACCOUNTABILITY
POPULATIONOUTCOMES
Job Training Program

Different Kinds of Progress
1. Data
a. Population indicators Actual turned curves: movement for the better away from the baseline.
b. Service performance measures: customer progress and better service: How much did we do?
How well did we do it? Is anyone better off?
2. Accomplishments: Positive activities, not included above.
3. Anecdotes: Stories behind the statistics that show how individuals are better off.
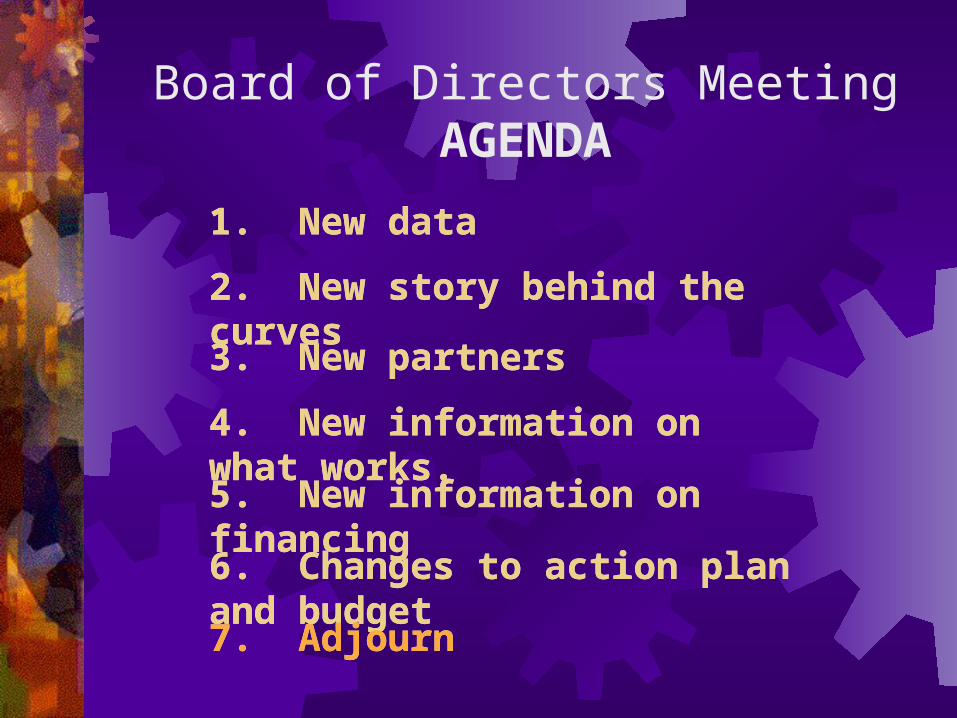
Board of Directors MeetingAGENDA
1. New data
2. New story behind the curves
3. New partners
4. New information on what works.
5. New information on financing
6. Changes to action plan and budget
7. Adjourn
1. New data
2. New story behind the curves
3. New partners
4. New information on what works.
5. New information on financing
6. Changes to action plan and budget
7. Adjourn

SUMMARY


3 - kinds of performance measures. How much did we do? How well did we do it? Is anyone better off?
OBA in a Nutshell2 – 3 - 7
2 - kinds of accountability Population accountability Performance accountability
7 - questions from ends to means in less than an hour. Baselines and Turning the Curve
plus language discipline Outcomes & Indicators Performance measures
- Rosell
“If I include you,you will be my partner.
If I exclude you,you will be my judge.”


Turn the Curve ExercisePOPULATION


Creating a Working Baselinefrom Group Knowledge
Now
Indicator or Performance Measure
65% Not OK?
BackcastingForecasting

Turn the Curve Exercise: Population Well-being
5 min: Starting Points - timekeeper and reporter - geographic area - two hats (yours plus partner’s)
10 min: Baseline - pick an outcome, and an indicator curve to turn - forecast to 2017 – OK or not OK?
15 min: Story behind the baseline - causes/forces at work - information & research agenda part 1 - causes
15 min: What works? (What would it take?) - what could work to do better? - each partners contribution - no-cost / low-cost ideas - information & research agenda part 2 – what works
10 min: Report convert notes to one page
Two pointers to action
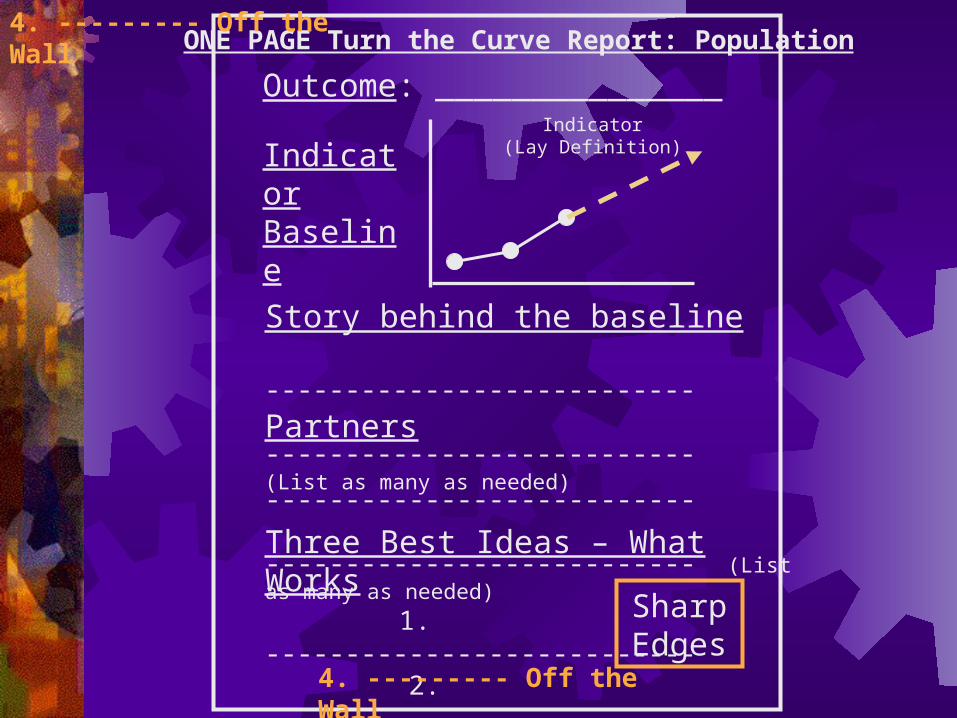
ONE PAGE Turn the Curve Report: Population
Outcome: _______________Indicator
(Lay Definition)IndicatorBaseline
Story behind the baseline --------------------------- --------------------------- (List as many as needed)
Partners --------------------------- --------------------------- (List as many as needed)
Three Best Ideas – What Works 1. --------------------------- 2. --------------------------- 3. ---------No-cost / low-cost
SharpEdges
4. --------- Off the Wall
4. --------- Off the Wall

Turn the Curve Exercise – LessonsTalk to Action in an hour
1. How was this different from other processes? What worked and what didn’t work?
2. Why did we ask for:a. Results before indicators?b. Forecast?c. Story? d. No cost / low cost?e. Two hats?f. Crazy idea?g. Only 3 best ideas?
3. Do you think a lay audience could understand the reports?
4. How many think you could lead this exercise with a small group? (2+ curves at the same time)
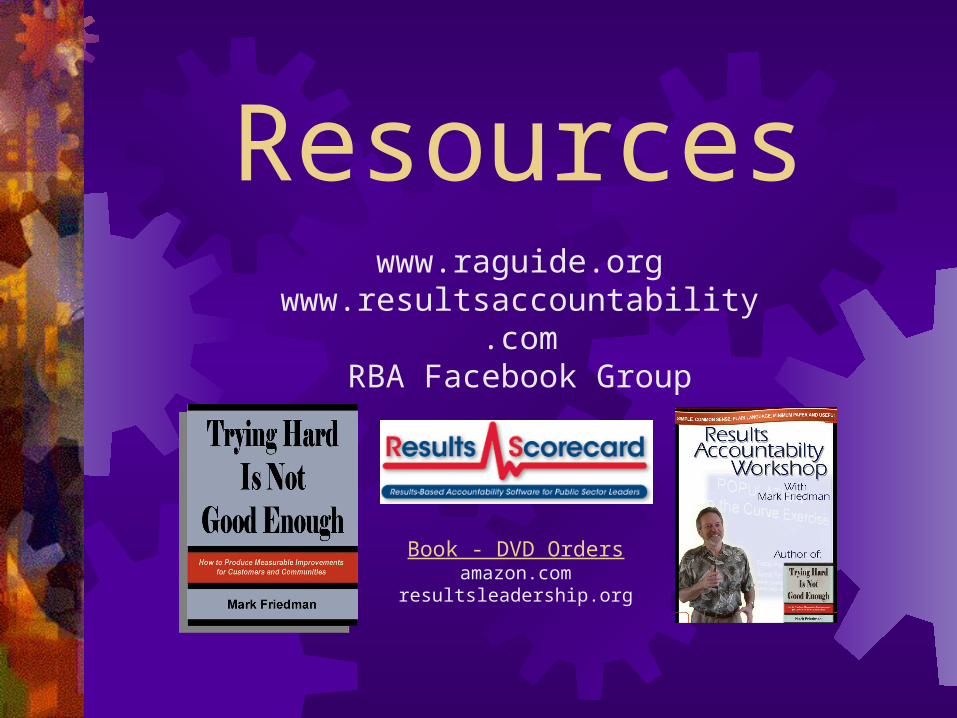
Resources
Book - DVD Ordersamazon.com
resultsleadership.org
www.raguide.orgwww.resultsaccountability.com
RBA Facebook Group

“If you do what you always did,
you will get what you always got.”
Kenneth W. JenkinsPresident, Yonkers NY NAACP
--------Book - DVD Orders--------amazon.com
resultsleadership.org
THANK YOU !Websites
raguide.orgresultsaccountability.com