Outcomes and Indicators of a Positive Start to School ... Web viewThis project reports on world...
181
Outcomes and Indicators of a Positive Start to School: Development of Framework and Tools Prepared for: Department of Education and Early Childhood Development Prepared by the teams of: The Centre for Community Child Health Murdoch Childrens Research Institute The Royal Children’s Hospital, Melbourne Led by Sue West School of Education Victoria University Led by Assoc Prof Andrea Nolan February 2012
Transcript of Outcomes and Indicators of a Positive Start to School ... Web viewThis project reports on world...

Outcomes and Indicators of a Positive Start to School: Development of Framework and Tools
Prepared for: Department of Education and Early Childhood Development
Prepared by the teams of:
The Centre for Community Child HealthMurdoch Childrens Research InstituteThe Royal Children’s Hospital, MelbourneLed by Sue West
School of EducationVictoria UniversityLed by Assoc Prof Andrea Nolan
February 2012

Outcomes and Indicators Report i
Acknowledgements
Many people contributed their ideas to this project and to the writing of the final report.
Centre for Community Child Health
Sue West
Carmen Schroder
Lauren Barber
Leonie Symes
Mary Sayers
Dr Myfanwy McDonald
Ellen Kellett
Dr Meredith O’Connor
Victoria University
Assoc Prof Andrea Nolan
John McCartin
Jan Hunt
Jennifer Aitken
Caroline Scott
The authors of this report wish to acknowledge a number of people for their support of the
research:
The Expert Reference Group which provided invaluable input into the development of
the four surveys.
The Department of Education and Early Childhood Development for critical input at
key points in the project.
Assoc Prof Susan Donath from the Clinical Epidemiological and Biostatistics Unit
(CEBU) for the enhancement component of the project related to statistical analysis.
The Quality Improvement Learning Transitions managers, Regional Network
Leaders, Koorie Engagement Support Officers and Wannik Unit of the Department of
Education and Early Childhood Development, Early Childhood Australia and the
Gippsland and East Gippsland Aboriginal Co-Operative who assisted in the
promotion and recruitment of schools and early childhood education services for the
trialling of the surveys.

Outcomes and Indicators Report ii
The children, parents, educators, principals, early childhood services and schools
that participated in the focus groups or the trial. Without their respective
contributions, this research would not have been possible
We appreciate their time and commitment.

Outcomes and Indicators Report 3
Table of contents
Acknowledgements .................................................................................................................. i
Executive Summary ................................................................................................................. 6
Abbreviations ..........................................................................................................................13
Tables ......................................................................................................................................14
Figures.....................................................................................................................................15
1. Introduction ......................................................................................................................16
1.1 Project objectives ............................................................................................................16
1.2 Project team ....................................................................................................................17
1.3 Background .....................................................................................................................17
1.4 Responding to the evidence ............................................................................................19
Transition to school ............................................................................................................19
Measuring transition to school............................................................................................21
2 Methodology ....................................................................................................................23
2.1 Tool development ............................................................................................................24
2.1.1 Phase 1 – Preparation...............................................................................................24
2.1.2 Phase 2 – Tool development.....................................................................................25
2.1.3 Phase 3 – Tool review...............................................................................................26
2.2 Trialling the tools .............................................................................................................27
2.2.1 New tools and evaluation surveys .............................................................................27
2.2.2 Trial participants........................................................................................................28
2.2.3 Cohort 1 – Selection and recruitment ........................................................................29
2.2.4 Cohort 2 – Selection and recruitment ........................................................................32
2.3 Project enhancement.......................................................................................................32
2.4 Analysis of tools...............................................................................................................34

Outcomes and Indicators Report 4
2.5 Project limitations ............................................................................................................37
2.5.1 Use of the survey results...........................................................................................37
2.5.2 Including the voices of children .................................................................................37
3 Participation rates............................................................................................................38
3.1 Schools and early childhood services ..............................................................................38
3.2 Cohort 1 and 2.................................................................................................................39
3.3 Focus groups...................................................................................................................39
3.4 Implications of participation rates.....................................................................................40
4 Psychometric properties .................................................................................................42
4.1 Validity.............................................................................................................................42
4.1.1 Face validity ..............................................................................................................42
4.1.2 Content validity .........................................................................................................43
4.1.3 Validity and timing of data collection..........................................................................45
4.2 Statistical analysis of validity and reliability ......................................................................46
4.2.1 Internal validity ..........................................................................................................46
4.2.2 Preliminary analysis of reliability................................................................................47
4.2.3 Internal consistency ..................................................................................................49
4.3 Implications .....................................................................................................................61
5 Inclusivity .........................................................................................................................67
5.1 Survey responses............................................................................................................67
5.2 Focus group feedback .....................................................................................................68
5.3 Implications .....................................................................................................................69
6 Accessibility .....................................................................................................................71
6.1 Instructions ......................................................................................................................71
6.2 Child engagement in the Child Survey .............................................................................72

Outcomes and Indicators Report 5
6.3 Difficulties encountered when completing surveys ...........................................................72
6.3.1 Survey respondents ..................................................................................................72
6.3.2 CALD parents ...........................................................................................................75
6.3.3 Indigenous parents....................................................................................................75
6.3.4 Parents of children with a disability ...........................................................................76
6.4 Time taken to complete survey ........................................................................................77
6.5 Implications for accessibility.............................................................................................78
7 Lessons from implementation ........................................................................................81
7.1 Early Childhood Educator Survey ....................................................................................81
7.2 Prep Teacher Survey.......................................................................................................83
7.3 Parent Survey..................................................................................................................84
7.4 Child Survey ....................................................................................................................84
7.5 Suggestions for implementation.......................................................................................85
7.6 Timing of data collection ..................................................................................................86
7.7 Implications of the lessons from implementation ..............................................................86
8 Use of data collected .......................................................................................................89
8.1 Participant feedback ........................................................................................................89
8.2 Implications .....................................................................................................................90
9 Conclusion and recommendations.................................................................................91
References ............................................................................................................................. .96
All appendices are available in Part B of Outcomes and Indicators of a PositiveStart to School: Development of Framework and Tools

Outcomes and Indicators Report 6
Executive Summary
Introduction
Outcomes and Indicators of a Positive Start to School is world-leading research. It provides the
first evidence to support an understanding of how to measure the outcomes and indicators of a
positive transition to school.
The Department of Education and Early Childhood Development (DEECD) commissioned this
research to examine the application of an outcomes measurement of a positive transition to
school and build upon the findings of an earlier project that identified these outcomes for
children, their families and educators (Nolan, Hamm, McCartin and Hunt, 2009). The evidence
is clear that children’s readiness, transition and initial adjustment to school is critical for their
development, wellbeing and progress throughout the school years. This evidence has informed
a number of Victorian State Government policies and initiatives and much has been learnt about
transition processes. However, until recently, little research had examined what a positive start
to school looks like for children, families and educators.
By committing to the development and trialling of tools to measure the outcomes and indicators
of a positive start to school for children, parents/families, early childhood educators and school
teachers in Victoria, DEECD has contributed to the body of knowledge about the critical nature
of transition to school.
The project was undertaken by the Centre for Community Child Health (Murdoch Childrens
Research Institute and the Royal Children’s Hospital) in partnership with Victoria University
(authors of the ‘Outcomes and Indicators of a Positive Start to School 2010’ report) and the
Clinical Epidemiological and Biostatistics Unit (CEBU) of the Royal Children’s Hospital (RCH).
Project objectives
The specific objectives of the project were to:
Develop outcome-focused data collection and monitoring tools to measure the outcomes
and indicators of a positive start to school for children, parents/families and early
childhood and school educators. The project developed four tools: an Early Childhood

Outcomes and Indicators Report 7
Educator Survey (ECES), a Prep Teacher Survey (PTS), a Parent Survey (PS) and a
Child Survey (CS).
Test the validity of these newly developed data collection tools, including an
investigation of whether these tools will be applicable and inclusive of all children. In
particular, families with an Indigenous or Culturally and Linguistically Diverse (CALD)
background or who have a child with a disability.
Make recommendations to DEECD on the further development and utilisation of these
data collection tools (also referred to as surveys throughout the document).
Methodology
The research methodology was designed to inform:
Content validity: Ensuring the measures are theoretically sound and representative of the
transition experience.
Face validity: The tools developed appear to measure what they are designed to measure,
therefore are perceived as valuable to the respondent.
Reliability and internal consistency: To ensure the surveys can be interpreted consistently
across different situations.
Inclusivity: The survey items represent families with an Indigenous or CALD background or
who have a child with a disability.
Accessibility: The tools are understandable to the respondent, easy to complete and able to be
completed in a timely way without burdening respondents.
Expert endorsed: A reference group of experts has provided advice on the logic map and the
selection of measures and survey items.
An additional task of the project was to trial the administration of the survey tools, examining the
logistics of engaging respondents, the best time of year for the survey to be undertaken and
overall administration and co-ordination strategies for a complex data collection process.
On that basis the project methodology involved three stages:
Stage 1: Tool development with theoretical input and expert endorsement.
Stage 2: Trialing the tools with children, parents and educators across Victoria.

Outcomes and Indicators Report 8
Stage 3: Analysis of trial results to build on the psychometric properties, inclusiveness,
accessibility and administration of the tools.
Key findings
Content and face validity
The findings indicate the four surveys developed have a degree of face and content validity.
Specifically, the project found:
All four surveys appeared to be appropriate measures of the transition experience.
Respondents perceived the information collected by the surveys to be useful.
The information collected by the surveys was largely comprehensive of the transition
experience.
Reliability and internal consistency
The findings provide support for the use of the ECES, PTS, and PS as consistent measures of a
positive transition to school and provide evidence for changes to improve the survey tools for
further trialling. The internal consistency of the CS was found to be unacceptable; however
across-survey comparisons evidenced a degree of reliability, thus provided grounds for
modification of the rating scale to allow for further trialling.
Inclusivity
The findings showed that the four surveys were overwhelmingly perceived to be inclusive of the
general population. However, questions were raised around how inclusive they were of CALD
families, Indigenous families, families with low literacy and families of children with a disability.
Minor modifications, such as simplifying the wording of questions, will increase the inclusivity of
the surveys for most of these groups. Further work is needed to determine which questions to
modify and how to modify them in order to increase the accessibility for these groups.
Accessibility
The accessibility of the tools was analysed to provide an indication of the utility of the tools. The
findings indicate that:
The survey instructions were clear to the majority of the participants.
The surveys were reported as easy to complete by almost all participants.
Outcomes and Indicators Report 9
CALD and Indigenous parents found the surveys easy to complete but the concepts
behind the questions were not well understand by some.
Child engagement in the CS was high.
The average time taken to complete each survey was 10 – 20 minutes and was not
considered burdensome.
The project identified an opportunity to include the school focused items in the PTS in the Mid
Year School Supplementary Census1 (Section 16: Transition to School).
Implementation
The project evaluated the process of implementing the four tools and identified improvements
and refinements for future implementation. The findings suggest that, in particular, the difficulty
gaining participation from early childhood educators presented a significant barrier to
implementation of the current trial. The complex consent process and the time of year during
which the ECES was rolled out were cited as the key factors preventing participation. Additional
implementation findings include that:
The provision of online versions of the tools as an alternative to hard copies will reduce
the burden for many respondents.
CALD and low literacy families need assistance to understand and complete the PS.
Indigenous families will be supported by a more culturally appropriate form of invitation
and administration.
The use of props during the administration of the CS helps sustain children’s
concentration and increase their engagement in the survey (e.g. provide a tactile bead
frame for them to play with while the survey is being administered).
Conclusion and recommendations
The project findings provide support for the use of the ECES, PTS and PS as appropriate and
accurate measures of a positive transition to school and provide insight to inform improvements
to the tools. Additionally, the results provide insights that will support future implementation of
the tools. Together, these findings point to important considerations for the ongoing
development of these tools.
1 DEECD Annual school data collection tool.

Outcomes and Indicators Report 10
Recommendation 1: Modify the four outcome measurement tools
When considered individually, all of the surveys were found to have statistical merit for
collecting data against the outcomes. Despite some difficulties, the surveys were found to be
applicable and inclusive of all children and did not place undue burden on those who
participated. Revision of each tool is recommended based on the findings of this research (full
details of the proposed modified tools are included in Appendices 26, 28, 29 and 30), in order
to:
increase validity and reliability
improve the accessibility of the tools to all participant groups
increase inclusivity
increase ease of completion by respondents.
Recommendation 2: Trial the modified tools
Once modified, the four tools will require further testing to understand how well they operate.
Specifically, it is important that the psychometric properties of validity and reliability of the four
modified tools are established. This will provide further support for the accuracy and
generalizability of the four tools as measures of a positive transition to school, in turn endorsing
the use of the data yielded by the four tools.
Specific analyses recommended include:
Recalculation of Cronbach’s alpha to inform internal consistency of the modified tools.
Across-survey comparisons by outcome to determine whether there is a reliable pattern
of responding to questions mapped to an outcome across the four respondent groups.
Recommendation 3: Refine implementation
The findings point to a number of important considerations to support successful administration
and completion of future data collections. In particular, it is essential that the process is both
feasible and does not place undue burden on participants. Recommended refinements to the
implementation process include:
Conduct the ECES as early in the year as possible with the other data collections
occurring around the end of Term 1 and the start of Term 2.

Outcomes and Indicators Report 11
Provide online versions of the surveys as an alternative to hard copies to increase the
ease of completion by respondents.
Provided support for CALD and families with low literacy to assist them to understand
and complete the PS.
Develop a more culturally appropriate form of invitation and administration to
successfully engage Indigenous families.
Consider redesign methodology to capture children’s views/voices. This may involve
using multiple strategies and tools such as observation of children’s play, conversational
narratives, simplified surveys, stories or photos to prompt discussion.
An important question to be answered for future implementation relates to how the tools can be
administered by schools in the future and how the data can be used to improve transition to
school programs at a local level.
Recommendation 4: Test the utility of the data
Understanding how to measure the outcomes and indicators of a positive transition to school
has been the focus of the current project. However, successful indicators need to be more than
technically sound: they need to produce data that is useful for the end user. It is therefore
recommended that data collected in a trial of the revised tools, be provided to participating
schools in user friendly format and in a timeframe that supports schools to make adjustments (if
needed) to orientation processes for children beginning school the following year. Monitoring
this process and an evaluation of the utility of the data will help the ongoing tool development
process.
Recommendation 5: Disseminate the research findings
This project reports on world first research; that is: it provides the first evidence to support an
understanding of how to measure the outcomes and indicators of a positive transition to school.
Although the survey tools to measure these outcomes will be improved in the next trial, the
project is, nonetheless, an important piece of work from a policy perspective and from a
research perspective. Transition to school is of interest and importance to a range of audiences
nationally and internationally, including academics, policy makers, educators, and parents. The
following strategies for disseminating the results to these audiences are recommended:
Provide a summary report to study participants.

Outcomes and Indicators Report 12
Make the summary report available to early childhood and school sectors via the
DEECD website.
Present the research at academic and practitioner conferences.
Seek to publish the research in peer-reviewed journals, with international reach.

Outcomes and Indicators Report 13
Abbreviations
AEDI Australian Early Development Index
CALD Culturally and Linguistically Diverse
CCCH Centre for Community Child Health
CEBU Clinical Epidemiological and Biostatistics Unit
CEIEC Centre for Equity and Innovation in Early Childhood
CRT Casual Relief Teacher
CS Child Survey
DEECD Department of Education and Early Childhood Development
ECES Early Childhood Educator Survey
EMA Education Maintenance Allowance
KESO Koorie Engagement Support Officer
POS Parent Opinion Survey (DEECD)
PS Parent Survey
PTS Prep Teacher Survey
QILT Quality Improvement Learning and Transition
RCH Royal Children’s Hospital
RNL Regional Network Leader
SEIFA Socio-Economic Index for Areas
SES Socio-Economic Status

Outcomes and Indicators Report 14
Tables
Table 1: Configuration of the final version of new tools .............................................................27
Table 2: Participation of schools by DEECD region...................................................................38
Table 3: Cohort 1 response rate for respective tools .................................................................39
Table 4: Evaluation survey response rate for cohorts 1 and 2 ...................................................39
Table 5: Focus group participation by specific population .........................................................40
Table 6: Participant responses to the question: ‘Is there anything that you believe should be
added (to the survey)?’ .............................................................................................................44
Table 7: Participant perception of best time to administer the survey ........................................45
Table 10: Early Childhood Educator Survey – Different combinations of survey items and the
effect on Cronbach’s alpha and inter-item correlation................................................................50
Table 9: Prep Teacher Survey – Different combinations of survey items and the effect on
Cronbach’s alpha and inter-item correlation ..............................................................................53
Table 10: Parent Survey – Different combinations of survey items and the effect on Cronbach’s
alpha and inter-item correlation .................................................................................................56
Table 11: Child Survey – Different combinations of survey items and the effect on Cronbach’s
alpha and inter-item correlation .................................................................................................60
Table 12: Participant responses to the question: 'Are the questions on the survey inclusive of all
children and families?'...............................................................................................................68
Table 13: Clarity of instructions regarding survey administration by participant group ...............71
Table 14: Participant responses to the question: 'Was this survey easy to complete?' ..............73
Table 15: Participant responses to the question: ‘Did you encounter any difficulties when
completing this survey?’ ............................................................................................................73
Table 16: Questions identified as difficult and/or problematic for CALD participants .................75
Table 17: Time taken to complete the survey ............................................................................78
Table 18: Participant barriers to participation cohort 1...............................................................81

Outcomes and Indicators Report 15
Table 19: Administering the surveys more than once ................................................................86
Figures
Figure 1: Study design for cohorts 1 and 2 ................................................................................29
Figure 2: Focus group methodology design ..............................................................................33

Outcomes and Indicators Report 16
1. Introduction
The evidence is clear – children’s readiness, transition and initial adjustment to school is critical
for their development, wellbeing and progress throughout the school years (Margetts, 2007;
Smart, Sanson, Baxter, Edwards, & Hayes, 2008). This evidence has informed a number of
Victorian State Government policies and initiatives and much has been learnt about transition
processes. However, until recently, little research had examined what a positive start to school
looks like for children, families and educators. In response to this knowledge gap, the
Department of Education and Early Childhood Development (DEECD) commissioned a
research project to identify the outcomes of a positive transition to school for children, their
families and educators by reflecting the intended impact of participating in transition activities or
processes. The project report (Nolan, Hamm, McCartin & Hunt, 2009), described in more detail
in section 1.3 below, proposed a suite of indicators and corresponding measures, as well as
instruments for data collection, for the consideration of DEECD. As a result, DEECD
commissioned further work to examine the application of an outcomes measurement approach.
1.1 Project objectives
This project aimed to develop and test tools for measuring the outcomes and indicators of a
positive transition to school for children, parents/families, early childhood educators and school
teachers in Victoria.
The specific objectives were:
a) Develop outcome-focused data collection and monitoring tools to measure the outcomes
and indicators of a positive start to school for children, parents/families and early
childhood and school educators.
b) Test the validity of these newly developed data collection tools, including an
investigation of whether these tools will be applicable and inclusive of all children. In
particular, families with an Indigenous or Culturally and Linguistically Diverse (CALD)
background or who have a child with a disability.
c) Make recommendations to DEECD on the further development and utilisation of these
new data collection tools.

Outcomes and Indicators Report 17
The intention of this project is to enable educators to measure how well children have
transitioned into school and to determine what, if any, changes and supports are needed for
schools to be ready for children and families.
1.2 Project team
The Centre for Community Child Health (CCCH) was engaged by DEECD to lead this project. In
order to deliver on the project objectives, the CCCH established a project team that included a
partnership with Victoria University (authors of the ‘Outcomes and Indicators of a Positive Start
to School 2010’ report) as well as statisticians from the Clinical Epidemiological and Biostatistics
Unit (CEBU) of the Royal Children’s Hospital (RCH).
Additionally, the project team sought advice from experts in the field of early childhood
development through an Expert Reference Group (see Appendix 1 for the Terms of Reference).
The Expert Reference Group comprised representatives from school and early years services,
services supporting families with an Indigenous or CALD background or with a child with a
disability, and academics in the field of transition to school and social research. The group met
on two occasions during the life of the project to provide feedback on the tools as they were
being developed.
1.3 Background
The Transition: A Positive Start to School initiative (the Initiative) was launched for state-wide
implementation in August 2009. The Initiative aimed to improve children’s experience of starting
school by strengthening the development and delivery of transition programs, and to provide a
consistent and inclusive approach to transition to school.
The Initiative recognises that:
every child learns and develops differently and that transition planning is an effective
way to help prepare and support children’s entry to school and to provide continuity of
learning for children from birth to eight years.
for all children, and especially those with additional needs, the exchange of information
between parents, early childhood services and schools is particularly important to
optimise success at school.
The Initiative was developed on:

Outcomes and Indicators Report 18
a strong evidence base of the critical nature of early learning and development.
the importance of supporting periods of transition to provide continuity of learning.
the desire to establish a foundation for future positive outcomes for children – socially
and academically – and their level of engagement and attendance at school.
the understanding that transition is a process—not a point in time event. It starts well
before and extends far beyond the first day of school and involves and affects children,
families, early childhood services and schools.
A key component of the Initiative was the introduction of the Transition Learning and
Development Statement (the Statement). The Statement is a tool to enable consistent sharing
and transfer of information about a child’s learning and development in the early years,
irrespective of the setting to or from which the child is transitioning, and supports the continuity
of the child’s early learning.
In order to support children and families to manage this transition well, early childhood services
and schools offer transition to school programs and activities. Many services and schools
across Victoria have well-established and effective programs and activities to support a positive
start to school. The Initiative builds on these ‘local’ successes and identifies best practices and
strategies for facilitating and supporting children’s adjustment to the changes they will
experience, and creates a common planning approach for families, services and schools to
access and adapt to local contexts.
In 2009, a research project titled Outcomes and Indicators of a Positive Start to School (2009)2
was completed by Victoria University. The purpose of the project was to provide a coherent
description of what a positive start to school looks like for children, families and educators.
Nolan et al. (2009) identified 15 outcomes of a positive start to school for children, families and
educators, with 22 corresponding indicators and possible measures for these outcomes. The
outcomes and indicators reflected the need to be sensitive to the diverse nature of Victorian
families and communities (e.g. CALD, Indigenous, refugee, low or high SES). However, they
also identified a lack of tools to measure some of the indicators and argued that new measures
were needed to reflect a comprehensive, ecological view of transition to school (such an
approach incorporates all stakeholders including the child, their family and social networks, the
2 Nolan, Hamm, McCartin & Hunt, Outcomes and Indicators of a Positive Start to School (2009), Victoria University h tt p: // w w w . edu c a t io n . v i c . gov . au / e ar l y le arn in g /t ran s i t io n s c hoo l / re s e a r c h . ht m

Outcomes and Indicators Report 19
school and the community as well as constructs, such as the child’s disposition for learning,
social/emotional characteristics and experience).
The authors recommended the following:
development of a Prep Teacher Survey (PTS) and an Early Childhood Educator3 Survey
(ECES)
refinement of the DEECD Parent Opinion Survey (POS)
development of a Child Opinion Survey4 (CS).
This report responds to recommendations identified by Nolan et al. (2009).
1.4 Responding to the evidence
The evidence informing this project falls into two key areas: transition to school and measuring
indicators.
Transition to school
According to research (Margetts, 2007; Smart et al. 2008) children’s readiness, transition and
initial adjustment to school is critical for the child’s development, wellbeing and progress
throughout their school years. Much of the research highlights the importance of seamless
transitions between early childhood services and schools however, there is clear evidence that
children vary in their ‘readiness’ for this transition, with marked differences visible in children’s
cognitive and social/emotional skills on school entry (Smart et al. 2008).
Dockett and Perry (2006) argue that being ready for school means different things to different
people but refrain from formulating a picture of a good start to school because a child ‘could well
be ready for one school and not another … people in different communities have different
expectations of readiness’ (p. 46). They stress that school readiness is not only about children;
it is about families, schools and communities and promote the theme of ‘working together’
where they envisage the involvement of a range of stakeholders, the formation of positive
3 Early Childhood Educators are defined in the Early Years Learning Framework for Australia as all ‘early childhood practitioners who work directly with children in early childhood settings’ (DEECD Victorian Early Years Learning and Development Framework Professional Support Program) w w w . ccc v ic . o r g . au / co n t en t . c f m ? con t en t = 1 0 7 4 Child Opinion Survey has been titled Child Survey in the current trial

Outcomes and Indicators Report 20
relationships, mutual trust and reciprocal communication as a starting point for children having a
good start at school.
A study by Wai Ling Chan (2010) emphasised the importance of a continual, developmental and
transactional process involving experiencing primary school life, welcoming programs,
lengthening transition periods, joint activities and responsive two-way communication. A
community approach to children’s transition to school is also advocated by Rous and Hallam
(2006). They identify communication, cooperation, coordination and collaboration as part of the
process of developing effective transition programs. Ongoing communication between
educators in early childhood services and schools, the preparation of children for the transition,
and the continuing involvement of families are essential components of a successful transition.
Increasingly, the importance of congruence between home, community, and school
philosophies and experiences is being recognised. This is supported by Hare and Anderson
(2010) who recognise the importance of open lines of communication between educators in
kindergartens, primary schools and families. Successful transitions to school are more likely
when such partnerships exist, ensuring a balance between continuity and new experiences
(Ashton, Woodrow, Johnston, Wangmann & Singh, 2008).
Attendance in formal childcare settings is recognised as beneficial in preparing children for
school (Sanagavarapu, 2010). How easy or difficult children find the transition between early
childhood settings and school partly depends upon the degree of discontinuity they have to
negotiate (Margetts, 2002).
Discontinuities include changes in the physical environment of buildings, classrooms, a
difference in pedagogy and teaching strategies, a difference in the number, gender and role of
staff, a change to the peer group, and changes in the relationships between children and the
adults responsible for their care and education.
A number of studies suggest that children from ethnic and racial minority groups may find
transition to school challenging because of mismatches between home and school language
and culture (Bowman, 1999 cited in la Paro, Pianta & Cox, 2000; Pianta & Cox, 2002; Sauvau,
1998 cited in Yeboah, 2002). In a study of Bangladeshi parents in Sydney, Sanagavarapu
(2010) found that friendships with peers who share a similar or cultural linguistic background
supported a positive transition to school. Thomasson (2010) found that relatively few numbers
of schools specifically cater for children and families from diverse socio-cultural backgrounds
and recommends that schools consider the needs of these children and families.

Outcomes and Indicators Report 21
The aspirational Transition to School Position Statement (2011) positions transition within a
human rights framework, which is based on national and international understanding of the
importance of transition to school and, as such, calls on governments, organisations and
individuals to strive for policies and practices to provide the best start to school for all children.
The position statement reconceptualises transition to school in the context of social justice,
human rights, educational reform and ethical agendas and the established impact of transition
to school on children’s ongoing wellbeing, learning and development.
It has been suggested (Margetts, 2007) that transition programs should be flexible, inclusive
and responsive to the complexity of local communities and demonstrate respect for, and
acceptance of cultural and linguistic diversity and the requirements of all stakeholders. A review
of literature undertaken by the Centre for Equity and Innovation in Early Childhood (CEIEC;
2008) found there was ‘no substantial long-term evidence that any specific transition to school
program was better than any other …’ and that there were, instead, ‘a number of promising
practices’ that could be identified as being of proven value. These promising practices were
summarised and grouped according to children’s perspectives, families’ perspectives, and the
perspectives of educators and have been used to inform the development of the outcomes and
indicators of a positive start to school.
Measuring transition to school
Much of the literature around measuring transition to school focuses on skills-based
measurements of individual children’s readiness for school, rather than focusing on whether
transition to school programs have been successful. Tools to measure individual children’s
readiness for school (e.g. measuring their social competence or functional skills) have been
widely criticised because they have been considered ineffectual (Maley & Bond, 2007), limited
in their scope (Bagnato, 2007), and inappropriate in their application (Kagan & Kauerz, 2007).
An observation from the literature, mostly coming from the USA, is that school readiness tests
have had ‘very mixed successes’ in predicting school outcomes (Snow, 2007, p.197).
From the emphasis in the literature on the importance of roles and relationships of parents,
early childhood educators and schools (described above) it can be inferred that the key
informants for measuring transitions to school are parents, early childhood staff and teachers.
This view is supported by Seefeldt and Wasik (2006a) who argue for the development of
comprehensive tools applying authentic techniques, with best practice positioned as involving
‘those individuals that know the child best, their parents and teachers’ (Bagnato, 2007, p.246).

Outcomes and Indicators Report 22
This view is also supported by leading researchers internationally (Dockett et al. 2011), who
further call for children themselves, as active agents in the transition process, to be consulted
on their experiences (rather than assessed for skill level). The current project responds to this
call through the inclusion of measurement tools for children, parents/families and early
childhood and school educators.

Outcomes and Indicators Report 23
2 Methodology
A key goal of this project was to develop survey tools that effectively measure the indicators of a
positive transition to school. Accordingly, the methodology below outlines a process of drawing
on evidence as well as accumulating evidence to ensure the measures developed are accurate,
appropriate, meaningful and useful.
The research methodology was designed to inform:
Content validity: Ensuring the measures are theoretically sound and representative of
the transition experience. The outcomes, indicators and measures have been selected
with reference to theoretical considerations and existing survey tools. A logic map links
outcomes to indicators and measures.
Face validity: The tools developed appear to measure what they are designed to
measure, therefore are perceived as valuable to the respondent.
Reliability and internal consistency: To ensure the surveys can be interpreted
consistently across different situations.
Inclusivity: The survey items represent families with an Indigenous or CALD
background or who have a child with a disability.
Accessibility: The tools are understandable to the respondent, easy to complete and
able to be completed in a timely way without burdening respondents.
Expert endorsed: A reference group of experts has provided advice on the logic map
and the selection of measures and survey items.
An additional task of the project was to trial the administration of the survey tools, examining the
logistics of engaging respondents, the best time of year for the survey to be undertaken and
overall administration and co-ordination strategies for a complex data collection process.
On that basis the project methodology involved three stages:
Stage 1: Tool development with theoretical input and expert endorsement.
Stage 2: Trialing the tools with children, parents and educators across Victoria.
Stage 3: Analysis of trial results to build on the psychometric properties, inclusiveness,
accessibility and administration of the tools.

Outcomes and Indicators Report 24
2.1 Tool development
There were three phases involved in the tool development stage of the project.
2.1.1 Phase 1 – Preparation
The preparation phase included a comprehensive review and update of the recommendations,
outcomes and indicators previously developed by Nolan et al. (2009).
Due to copyright, the DEECD Parent Opinion Survey (POS) was unable to be revised as
originally recommended by the Nolan et al. (2009) study, resulting in the need for a new Parent
Survey (PS) to be developed as part of this project.
Preparation also involved a reflection on how to report against these outcomes using the
indicators originally proposed by Nolan et al. (2009). During consultation among the project
team it became apparent that some outcomes would be better positioned as indicators.
Outcomes and indicators were therefore realigned and, as a result, the original 15 outcomes
and 22 indicators were reduced to 11 outcomes and 34 indicators (see Appendix 2).
Finally, preparation involved an audit of existing Australian and international data collection tools
currently used to measure child and family outcomes and transition to school. These included:
Australian Early Development Index (AEDI)
DEECD Parent Opinion Survey
DEECD Staff Opinion Survey
DEECD Student Attitudes to School Survey
South Australian Department of Education, Training and Employment Reflect Tool
Linking Schools and Early Years consultations and questionnaires
Emotionality, Adaptability and Sociability Temperament Survey: Parent and Teacher
Ratings
DEECD School Entrant Health Questionnaire 2010
Victorian Child Health and Wellbeing Survey.
The purpose of the audit was twofold: to ensure that survey items weren’t duplicated; and to
ascertain whether existing Victorian surveys could be extended to include new questions
relevant to transition to school.

Outcomes and Indicators Report 25
2.1.2 Phase 2 – Tool development
The second phase involved preparation of an initial draft of the tools, and feedback from the
Expert Reference Group.
The first step was to map at least one survey item to each indicator from the perspective of each
of the four stakeholders: child, parent, prep teacher and early childhood educator. Using the
existing measures, discrete survey items (questions) were selected and mapped to one or more
of the indicators (see Appendix 3). Items selected from an existing tool in relation to a specific
stakeholder were rephrased in order to measure the same indicator from the perspectives of the
other stakeholders. These new items were also mapped to the transition indicators. This
methodology promoted validity in two ways: using items from tools known to be validated; and
the use of triangulation of data from the parent, child, prep teacher and early childhood educator
to report to each indicator. Where no survey item had been identified to report on an indicator, a
new item was created and also mapped to the transition indicators.
The tools were then presented to the Expert Reference Group. Initial feedback concerned
several survey items on the CS and the PS. Some items in the CS appeared to place a burden
on the child. For example, the question ‘I have friends at school’ may make children feel judged
or pressured to answer in a certain way. In response to these concerns, survey items were
rephrased. For example, the question ‘I have friends at school’ was amended to read: ‘I have at
least one good friend at school’.
The Expert Reference Group also expressed concerns that some elements of the PS may be
open to interpretation. For example, the question ‘I am actively engaged with the school in
supporting my child’s learning’ could be interpreted in different ways as ‘actively engaged’ may
mean very different things to different families. The project team modified this question so that
parents could choose from a list of suggestions about what active engagement activities they
have been involved in, as well as giving them an option to comment on other activities that were
not listed.
The Expert Reference Group was also concerned with the inclusivity and applicability of the new
tools to children from Indigenous, CALD families or children with a disability. There was a
suggestion to create separate surveys for these groups of children. However, considering the
primary purpose of this project was to develop and trial new tools and not to measure the

Outcomes and Indicators Report 26
difference between various groups of children, it was decided that every child and family use the
same survey.
The Expert Reference Group explored the implications in the instance when a child had not
attended an early childhood service prior to starting school. Each of the four surveys assumed
that a child had spent time in an early childhood setting. In response, the project team included
a ‘not applicable’ response to individual survey items and considered that the credibility and
validity would not be significantly compromised when triangulating data from three surveys as
opposed to four.
2.1.3 Phase 3 – Tool review
After the tools were revised, they were again presented to the Expert Reference Group for
review. During the second review, the Expert Reference Group expressed a number of
concerns that were discussed and responded to in Phase three.
The Expert Reference Group expressed concern that the survey format may not elicit an
authentic and truthful response from a child and explored more appropriate ‘non-verbal’ options.
One option explored was including an image to represent ‘yes’, ‘no’, or ‘sometimes’ that the
child could point to when read the question. However, there wasn’t consensus among the Group
about what images represent ‘yes’, ‘no’, and ‘sometimes’.
Another option discussed was providing images of scenarios to enable the child to point to the
scenario that they felt best portrayed their experience or to provide the child with an opportunity
to draw a picture representing their transition to school. Providing the child with an opportunity
to draw a picture representing their own experience was considered to be valuable because it
would allow the child time and space to think about their transition experience using a medium
that was familiar and comfortable.
All the options discussed by the Expert Reference Group were considered by the project team.
However, the extent to which these suggestions could be implemented was limited by the time
and resources available to undertake the project. Furthermore, modification of the response
scale would limit the team’s ability to triangulate the data.5 In response, the project team
reviewed each of the CS items to ensure the language used was ‘child friendly’. It was decided
5All other surveys used a Likert scale.

Outcomes and Indicators Report 27
that the original format of the child data collection tool would be maintained, with a possible
recommendation of the project being that future research explore more appropriate methods of
collecting data from children.
The Expert Reference Group also expressed concern about the length of the surveys and
queried the need for reverse order questions6. The Group discussed the need to include reverse
order questions to test the level of acquiescence. For example, acquiescence occurs when a
participant answers ‘agree’ to all questions where it would be expected they would answer
‘disagree’ to the negatively posed questions.
Importantly, the Expert Reference Group examined the notion of when transition has occurred
and reflected upon the best time to administer the survey. There was little consensus on an
exact transition point, although most agreed that if a child had not transitioned successfully by
early March then their particular transition was probably not successful. In response to this
advice, the project team decided that for the purpose of the trial the tools would be administered
in March. It was also decided that feedback from children, parents, prep teachers and early
childhood educators would be sought in the evaluation section of the surveys to inform
recommendations for future implementation.
2.2 Trialling the tools
After the tools had undergone intensive review and modification by the project team, they were
ready to be trialled7.
2.2.1 New tools and evaluation surveys
The final surveys were configured as demonstrated in Table 1. All survey items were mapped
against the revised indicators of a positive start to school for all surveys (see Appendix 3). For a
copy of each of the four surveys see Appendices 4, 5, 6 & 7.
Table 1: Configuration of the final version of new tools
6With the exception of the CS which contained no negative questions, each survey comprised a number of questions that sought the
same information, one seeking positive or present behaviours and one seeking negative or absent behaviours. Negative questions seeking the same information were included in the surveys to assess internal validity.7Although development of these tools is evidence-based, outcomes-focused and rigorously reviewed by experts in the field, the project team considers that the process of validation is still in its infancy. The new tools do have a degree of face, content and criterion validity but have not been developed with respect to having sound psychometric properties of construct and convergent validity.

Outcomes and Indicators Report 28
Survey Number of questions
Likert Scale of questions
Completed by
Child Survey (CS) 22 3 point8 Administered by an adult at the school familiar to the child e.g. welfare officer
Parent Survey (PS) 43 5 point9 The parent
Prep Teacher Survey (PTS) 35 5 point The prep teacher
Early Childhood EducatorSurvey (ECES)
50 5 point The early childhood educator
In addition to the aforementioned surveys, the project team developed four evaluation surveys
to accompany each of the four new tools. The evaluation surveys gathered information on
whether there were items that were difficult to understand, unclear or ambiguous; how long it
took to complete; or (for the CS) whether children became fatigued or lost interest.
The evaluation surveys also identified participants’ views on the logistics of implementing the
tools in the future. Therefore, they were asked about issues such as the timing of administering
the tools in the school calendar, who should co-ordinate and manage the data collection and
who should administer the CS. The evaluation surveys were completed by the parent, the prep
teacher, the early childhood educator and the person who administered the CS.
The next step in the process was to trial the tools with children, parents and educators across
Victoria.
2.2.2 Trial participants
Two cohorts of participants were selected and invited to participate in the project. Participants in
cohorts 1 and 2 were selected to represent diversity in many areas (described below) and
hence are not representative of a specific population.
Cohort 1 included children and the adults associated with those children (e.g. parents and
educators). The purpose of including this cohort was to use the individual responses from both
the tool and the evaluation survey to inform reliability, face validity, inclusiveness, accessibility
and future implementation. The aim was to receive responses from up to 270 prep children and
8 ‘Yes’, ‘No’, ‘Sometimes’ and ‘Don’t know/Unsure’
9 ‘Strongly disagree’, ‘Disagree’, ‘Neutral’, ‘Agree’, ‘Strongly Agree’ and ‘Not applicable/Don’t know’

Outcomes and Indicators Report 29
their parents (270), 36 prep teachers and 45 early childhood educators for this first cohort of
participants.
Cohort 2 consisted of adult educators not associated with the child. The purpose of including
this cohort was to further inform the evaluation of the surveys. The aim was to invite up to 45
prep teachers and 45 early childhood educators for this second cohort of participants.
Figure 1 provides an outline of the process of recruitment for both cohorts. The following
discussion provides information about each step in this recruitment process.
Figure 1: Study design for cohorts 1 and 2
2.2.3 Cohort 1 – Selection and recruitment
The design of the recruitment process was complicated as it required the consent and
involvement of many stakeholders. The project team was available by phone and email to
support schools and early childhood centres through this process. The project team also
successfully applied for Casual Relief Teacher (CRT) funding on behalf the participating
schools.

Outcomes and Indicators Report 30
The process of recruitment began with selecting the schools in November 2010. This was
followed by identification of the prep teacher participants by February 2011, followed by the
identification of the child and parent participants in first few weeks of Term 2 and lastly,
identifying the early childhood educator participants by end of Term 2.
Selection and recruitment of the schools (cohort 1)
The first step in the recruitment of cohort 1 was to recruit schools to the trial. Schools were
selected to participate through consultation with the Quality Improvement Learning Transitions
(QILT10) managers and Regional Network Leaders (RNL11) from the DEECD.
Twenty-five schools were invited by the project team to participate, approximately two from each
of the nine education regions. Schools were selected to represent diversity in the following
domains:12
at least one school represented in each of the nine education regions of Victoria
location classification (urban/regional/rural/remote)
proportion of children vulnerable on one or two AEDI domains
CALD population
Socio-Economic Index for Areas (SEIFA).
The principal of each school was contacted and, if they were interested, provided with a
Principal Pack that included an introduction letter, an information letter, a consent form and a
copy of each of the four new tools (see Appendix 10).
Written consent from the principal was required prior to the next phase of recruitment. The
principals who consented then indicated which prep teacher/s could be invited to participate and
provided advice regarding the logistics of administering the CS, advertising the project, and
organising additional supports such as the Koorie Engagement Support Officer (KESO) and
interpreting services.
10 A QILT manager is responsible for implementing new reforms aimed at driving quality improvement in early childhood education
and care services.11 The role of an RNL is to lead the development of school improvements within regional networks of schools by developing leadership capacity and the quality of teacher practice, deploying network resources, creating a culture of collaboration and collective accountability and facilitating partnerships with community, business and other agencies.12
See Appendix 9 for an overview of how each participating school met these criteria.

Outcomes and Indicators Report 31
Selection and recruitment of prep teachers, parents and children (cohort 1)
The prep teachers identified by their principal as being able to participate were invited by the
project team to participate in the study. The prep teachers were contacted and provided with a
Prep Teacher Pack that included an introduction letter, an information letter, a copy of the PTS
and guidelines for selecting the child participants from their class (see Appendix 11).
Once a prep teacher agreed to participate, they then selected approximately eight children from
their 2011 class. They were then asked to complete a PTS for each participating child in their
class and one Prep Teacher Evaluation Survey.
The parents of children identified by the prep teacher for possible inclusion in the trial were then
invited by the project team to participate in the study. The prep teacher provided children with a
Parent Pack to take home to their parents. The Parent Pack included an introduction letter, an
information letter, a consent form for both their child and themselves to participate and a copy of
the CS and the PS (see Appendix 12). Parents were asked to complete the PS and the Parent
Evaluation Survey and consent form and return it to the project team.
Written consent from the parents was required by the project team for the parent and their child
to participate in the study. The parent was asked to indicate on the consent form the name of
the early childhood educator and the centre where their child had attended if appropriate.
A ‘neutral’ adult familiar to the child participants (e.g. welfare officer) administered a CS for each
respective child and completed an Evaluation Survey.
Recruitment of the Early Childhood Centres (cohort 1)
The early childhood centres and early childhood educators were recruited in a similar manner to
the schools and prep teachers. The director of the early childhood centre identified by the parent
was contacted and provided with a Director Pack that included an introduction letter, an
information letter, a consent form and a copy of each of the four tools. Written consent from the
director was required prior to contact with the early childhood educator.
When written consent from the early childhood centre director had been provided, the early
childhood educators were contacted and provided with an Early Childhood Educator Pack that
included a letter of introduction, a letter of information and a copy of the ECES (see Appendix
13). The early childhood educators were asked to complete an ECES for each participating child
from their 2010 class and one Early Childhood Educator Evaluation Survey and return it to the
project team.

Outcomes and Indicators Report 32
2.2.4 Cohort 2 – Selection and recruitment
In cohort 2, the criteria for selecting prep teachers and early childhood educators to participate
were similar to the educators from cohort 1, although the manner of recruitment varied. The
criteria required that they were not participating in cohort 1. The participants were identified from
schools or early childhood centres where other educators were participating in cohort 1 and in
consultation with the RNL or QILT managers, principals and early childhood professional
organisations such as Early Childhood Australia.
The prep teachers and early childhood educator participants were invited to participate in the
study in a similar manner to educators in cohort 1. If the school or early childhood service was
already participating in cohort 1, the principal or director identified the prep teachers or early
childhood educators to participate and then passed on the Prep Teacher or Early Childhood
Educator Packs (see Appendices 13 & 14).
In other sites, the principal or director of the early childhood service was contacted to discuss
the project. If they expressed an interest, they were sent the relevant information packs. If this
principal or director agreed to participate they were required to provide written consent and pass
on the information packs to the teachers/educators they had identified. The participating prep
teachers and early childhood educators were asked to complete a PTS or ECES and the
respective Evaluation Survey and return them to the project team.
2.3 Project enhancement
Two additional components were added to the project during the implementation phase. The
intention of this was to increase the validity of the tools and build upon data from the evaluation
surveys to better understand the applicability of the tools to specific populations of children for
future use.
Firstly, further statistical analysis was conducted by the CEBU team with data gathered from the
trial of the newly developed tools. The purpose of this was to build upon the analyses of the
project team and confirm the validity of the tools. Specifically, the purpose was to increase the
psychometric qualities of the four newly developed tools by measuring the structure of each
survey. The unidentified quantitative survey data from cohort 1 was provided to CEBU for
analysis.
Secondly, the project team sought to test the inclusiveness and accessibility of the survey items.
In contrast to the non-specific populations in cohorts 1 and 2, the focus group consultations

Outcomes and Indicators Report 33
sought to gather data from specific population groups e.g. Indigenous families, CALD families
and families with a child who has a disability. Focus group consultations were undertaken to
gather further information on the issues addressed in the evaluation survey (e.g. how the survey
operated, how long it took to compete etc).
The aim was to facilitate six focus groups in total (two for each specific population) with six to
ten parents in each group (see Figure 2). Key stakeholders involved in the governance or
provision of early years services (e.g. DEECD; Early Childhood Australia and Gippsland and
East Gippsland Aboriginal Co-Operative) were consulted to provide recommendations on how
to invite the participation of parents from these specific groups.
Parents were required to provide written consent prior to participating and those who did
participate were given a $20 gift voucher on completion of the focus group (see Appendix 15).
During the focus group each parent was first asked to complete the Parent Survey and then the
group was guided through a series of semi-structured questions on the applicability of the
survey items, and of their understanding of the survey items and of transition to school (see
Appendix 16 - focus group questions).
Figure 2: Focus group methodology design

Outcomes and Indicators Report 34
2.4 Analysis of tools
As described above, data gathered for this project came from three sources:
four new tools (ECES, PS, CS, PTS)
four evaluation surveys
six focus group consultations.
Both the quantitative and qualitative data were analysed by the project team and the methods of
analyses are described below.
Preliminary statistical analysis of internal validity and reliability was performed by the project
team. For this analysis the data from the ECES, PS, and PTS was considered ordinal (i.e.
where the response options are ordered, but the distance between each option is not fixed, in
contrast to measurement scales like kilograms). Spearman’s correlation coefficient is an

Outcomes and Indicators Report 35
appropriate method for examining associations between ordinal variables, and hence was used
here to examine the relationships between items for these surveys (Field, 2009).
Data from the CS was treated as categorical (response options were limited to ‘yes’, ‘no’,
‘sometimes’, or ‘don’t know’). Accordingly when across survey comparisons were conducted,
ordinal data from the ECES, PTS and PS was re-coded and Chi square tests were used to
examine associations between items for this survey (Field, 2009).
Given the number of analyses performed in this study, the likelihood of finding a significant
relationship between variables by chance alone, where no actual relationship exists, is
heightened. To address this, we designated findings with a probability value of less than .001
(i.e. that had a very low probability of being due to chance rather than a real difference) as
statistically significant.
There were three separate, but interrelated analyses of the data.
Internal validity: The surveys (excluding the CS) included pairs of items that were
identical except in being positively or negatively worded. If participants were responding
accurately and consistently, we would expect these pairs of items to be highly related.
To test this, correlations between the negatively and positively worded pairs of questions
were examined.
Outcome reliability: The questions within each survey were grouped to measure 11
different ‘positive start to school’ outcomes or underlying constructs (see Appendix 3 -
list of the outcomes and indicators). Each outcome was measured by a number of
survey items. Using correlations, we assessed the consistency of responses across
items that were assumed to measure the same outcome.
Across survey comparisons: Each of the surveys contained questions that measured
the same information from the perspectives of the four informants. Chi-square analysis
was used to examine how consistent the four informants were when responding to the
matched questions.
Further statistical analysis of the quantitative responses from the PS, PTS, ECES and CS was
conducted by the project team and the CEBU of the Royal Children’s Hospital, Melbourne.
Calculations were made using STATA 11 software.
The statistical analysis aimed to further determine the psychometric properties of the four
individual outcomes and indicators measures by examining the structure of each survey. This

Outcomes and Indicators Report 36
would provide evidence of the reliability of the four newly developed tools, supplementary to
qualitative and preliminary quantitative analysis.
Cronbach's alpha is a widely drawn on measure of internal consistency, that is, how closely
related a set of items are as a group. With respect to the current study, it provides a unique
estimate of the reliability for each outcome (Gliem & Gliem, 2003). A ‘high’ value of alpha is
often used as evidence that the items measure an underlying (or latent) construct. For the
purpose of this project a Cronbach’s alpha > 0.7 is considered to be a sufficient indicator of
internal consistency.
Most items in the questionnaires (excluding all items in the child questionnaire) used Likert
scales. In order to include the non-Likert scale questions in the analyses, Cronbach’s alpha has
been calculated using standardised scores.
For the Cronbach’s alpha, including non-Likert items, questions such as the example below
were regarded as six separate questions, and each was coded as ‘1’ if selected and ‘0’ if not.
For each outcome/indicator in each questionnaire, the contribution of each question to the
overall Cronbach’s alpha for that outcome/indicator, and possible redundancy of items, was
investigated as follows:
i. Cronbach’s alpha and the average inter-item correlation when all items were included
was calculated.
ii. For every included item, the value of Cronbach’s alpha if that item were to be omitted
was calculated.
iii. The item for which Cronbach’s alpha would be greatest if it were omitted was identified.
iv. Cronbach’s alpha (and average inter-item correlation) was recalculated omitting this
item.
v. Steps (ii) to (iv) were repeated dropping one extra questionnaire item each time until
there were only two questionnaire items left.

Outcomes and Indicators Report 37
Finally, qualitative data gathered from the evaluation surveys and the focus groups were
analysed by the project team using qualitative methods to explore emerging themes regarding
the applicability, useability and future use of the newly developed tools.
2.5 Project limitations
The project team identified two main limitations impacting the project.
2.5.1 Use of the survey results
The indicator literature strongly supports the notion that whilst successful indicators are
technically sound (the focus of the current project), it is equally important that they are
developed with potential data users in mind (Holden, 2009). This ensures surveys produce data
that are useful and useable in a policy and practice context. This view is supported by a review
of indicator projects in the United States undertaken by Dluhy and Swartz (2006) which found
that a key factor for successful indicator projects is being able to link indicator projects with the
policy and decision making processes (Dluhy & Swartz, 2006). Future piloting should include
testing of the use of data with surveyed communities.
2.5.2 Including the voices of children
The project team recognises that children are active agents in their transition to school and that
their experiences of the transition to school should be given ‘voice’ in a project that measures
the outcomes and indicators of a positive transition to school. However, this brings with it
significant challenges such as ensuring the methodology is participatory and children-centred
(Barker & Weller, 2003), seen as relevant, meaningful and an important task by the child,
attempts to overcome the unequal power relations between an adult and a child (Einarsdottir,
2007), and that the data produced is an authentic representation of the child’s perspective
(Dockett & Perry, 2005). Surveying children has been noted as at risk of being tokenistic if it is
the only strategy that allows a young child to convey their views and experiences (Clark, 2005),
and questionable as a strategy as it does not allow children to have influence or some form of
control over the method like they may be able to exert in a more conversational style approach
or a drawing activity (Dockett & Perry, 2005).

Outcomes and Indicators Report 38
3 Participation rates
The section below details the participation rate of schools and ECE centres as well as the
number of respondents to each of the surveys. Participation rates have been reported to inform
the power of the inferences drawn from the data. That is, consideration has been given to
whether the sample is of sufficient size and representative of the diversity in the Victorian
population. A secondary cause for reporting participation rates is in relation to the purpose of
the study, which was to develop and examine data collection tools that draw on the perspectives
of parents, prep teachers, early childhood educators and the child. Given gaining participation
from all four respondent groups was complex and dependent on the voluntary support and
participation of many stakeholders, the achievability of collecting the data was unknown. By
examining the participation rates we are able to better understand the feasibility of collecting
such data as well as where focus is needed to boost participation rates in the future.
3.1 Schools and early childhood services
The project team invited 25 schools to participate in cohort 1, with a total of 19 schools
participating in the data collection phase.
Table 2: Participation of schools by DEECD region
Schools
Region Invited Unable Participated
Northern Metropolitan 2 0 2
Southern Metropolitan 3 1 2
Eastern Metropolitan 2 0 2
Western Metropolitan 6 3 3
Hume 2 0 2
Grampians 2 0 2
Loddon Mallee 2 0 2
Barwon South West 2 0 2
Gippsland 4 2 2
Total 25 6 19

Outcomes and Indicators Report 39
Ninety-six early childhood services were invited to participate by the project team. Of these,
three declined the initial invitation, while a further 49 either failed to return completed surveys or
indicated they were unable to complete surveys despite agreeing to participate. In total, 44 early
childhood services participated.
3.2 Cohort 1 and 2
CS, PS, PTS and ECES response rate
The project team invited 340 child participants in cohort 1 with the aim of receiving at least 270
sets of all four surveys completed. Of those invited to participate, 95 complete sets of all the four
tools (CS, PS, PTS and ECES) were returned to the project team (Table 5).
Table 3: Cohort 1 response rate for respective tools
Tools Cohort 1
Parent (PS) 227
Prep Teacher (PTS) 210
Child (CS) 208
Early Childhood Educator (ECES) 95
Evaluation survey response rateOf the participants in cohort 1 who completed or administered of the new tools, 367 also
returned an evaluation survey and of the participants invited to participate in cohort 2, 37 people
completed an evaluation survey.
Table 4: Evaluation survey response rate for cohorts 1 and 2
Evaluation questionnaire Cohort 1 Cohort 2 Total
Early childhood educator 91 26 117
Prep teacher 35 11 46
Administrator of Child Survey 16 N/A 16
Parent 225 N/A 225
3.3 Focus groups
Two focus group consultations were held for each specific population: Indigenous, CALD and
children with a disability. It was anticipated that a total of 36 parents would participate in the

Outcomes and Indicators Report 40
focus groups (e.g. six parents in each of the six focus groups). A total of 28 parents participated
in the focus groups, with the lowest participation rates being Indigenous parents.
Table 5: Focus group participation by specific population
Specific population group Total number of participants
Parents of Culturally and Linguistically Diverse children 12
Parents of Indigenous children 4
Parents of children with a disability/developmental delay 12
Total 28
3.4 Implications of participation rates
The overall participation rates across the four stakeholder groups of children, parents, prep
teachers and early childhood educators were sufficient to enable key inferences to be drawn
from the data. However, it must be recognised that substantially fewer ECES were received
when compared to the PTS, PS and CS; that is, although prep teachers, parents and children
tended to respond to surveys for most children that participated, a significant proportion of data
about these children was unavailable from early childhood educators. For example for a total of
208 children that responded to the survey, 226 parent surveys were received, 206 prep teacher
surveys were returned, but only 95 early childhood educator surveys were obtained. This means
that we do not have data from early childhood educators for around 113 children. Whenever we
try and compare the early childhood educator survey with any of the other surveys we must
remember that we are only really comparing data from the early childhood educators for 95
children out of a possible 208. While this has little to no impact for the majority of the inferences
drawn from the sample data, the most important implication of this low response rate is when
we make comparisons across the surveys. As a result, when responses from each of the four
surveys are compared, for half of the responses comparison can only be made for three or less
surveys. This impacts on the strength of the inferences we are able to make from these
comparisons.
The lower response rates for the ECES indicate additional support may be required for early
childhood educators to complete the survey in order to measure transition from an ecological
perspective. The barriers to participation discussed in section 7, provide some insight as to what
such supports might include.

Outcomes and Indicators Report 41
Missing data is less of a concern for data drawn from the evaluation surveys and the within-
survey comparisons; however the results still need to be interpreted with the differences in the
sample make-up in mind.
Schools
The schools invited to participate in the data collection phase were selected so as to enable the
tools to be trialled on a sample that was sensitive to the diversity across Victorian population.
For example, local classification (urban/regional/rural/remote) and the Socio-Economic Index for
Areas were taken into account when selecting schools. While a number of the invited schools
were unable to participate, those that did participate represented the intended domains of
diversity (see Appendix 9 – Primary School Site Selection Criteria). The findings and
implications detailed throughout this report are therefore drawn from data that is responsive to
the opinions of specific and diverse subgroups in the population that may have been lost in a
more generalised sample of the Victorian population.
Early Childhood Services
A low response rate was noted for early childhood services, with over half the centres invited to
participate in cohort 1 failing to return surveys. This is reflective of the low response rate
recorded for the ECES discussed above.
Focus groups
Whilst overall participation rates in the focus groups were sufficient to draw qualitative findings,
insufficient participation by Indigenous parents means that the perspective of Indigenous
families remains under-reported in the findings.

Outcomes and Indicators Report 42
4 Psychometric properties
The psychometric properties, namely the validity and reliability of the four newly developed tools
were investigated to determine the quality of the inferences drawn from the data they provide.
While validity was largely informed by drawing on qualitative feedback, a number of statistical
analyses were conducted to determine the reliability of each survey. It is important to note that
although a number of implications can be drawn from these analyses, establishing the validity
and reliability of any measure is a process of accumulating evidence overtime. Findings and
implications presented below are therefore not considered as definitive.
4.1 Validity
In order to provide support for the inferences drawn from the four newly developed tools, the
validity of each tool as a measure of a positive transition to school was considered. That is, a
specific methodology and number of data sources were drawn on to establish the extent to
which the surveys accurately and appropriately measured the transition experience. The degree
to which the four surveys demonstrated face validity was examined, as was feedback on the
content validity of the PS and PTS. An additional consideration was given to when the most
accurate, and therefore valid, time of year to assess the transition would be. Data drawn on to
demonstrate the validity of the four surveys was provided by specific questions included in the
evaluation surveys.
4.1.1 Face validity
The perceived value of completing a survey can influence the attention and consideration given
to the responses provided. In turn, this can impact on the accuracy of the measure and the
implications made. Whether respondents perceived the surveys to be accurate and appropriate
measures of a successful transition, or the face validity, was therefore an important condition for
consideration when trialling the tools. Participant responses to the question: ‘In your opinion
does the survey collect appropriate information to the transition experience?’, as well as data
pertaining to the value and potential use of the information provided by the surveys were
examined.
Almost all participants agreed the survey they completed collected information appropriate to
the transition experience (early childhood educator 95%, prep teacher 93%, parent 94%, CS

Outcomes and Indicators Report 43
administrator 93%). This provides evidence to suggest that all four surveys appear to measure
the transition experience as intended, thus demonstrating a degree of face validity. With the
exception of parents of children with a disability, focus group participants also agreed the
information collected by the PS was relevant to the transition experience. This suggests that the
questions may also be valid for use with CALD and Indigenous children and families.
An additional question was posed to prep teachers and parents about the value of collecting the
information yielded by the four newly developed tools. These participants were asked to specify
how the information collected from the surveys could be used for planning and practices that
support the transition to school. The data drawn from this question was considered so as to
supplement the findings in regards to face validity. That is, if participants perceived the
information yielded by the survey to be of value, this would provide further evidence that the
survey appears to measuring the transition experience effectively.
Survey respondents could see the value of the information collected, with all participant groups
providing a variety of suggestions as to how the data could be applied (see section 7.1).
Similarly, the majority of focus group participants also indicated the data could be useful in
planning and practices that support the transition. Parents of children with a disability, however,
expressed concern that results that included data drawn from children with special needs or a
disability would sway overall findings and therefore impact on the accuracy and usefulness of
the data. The survey would need to be amended to be valid for children with a disability.
4.1.2 Content validity
The questions that comprised the four surveys were developed in accordance with the previous
work by Nolan et al. (2009). The theoretical concepts behind the outcomes and indicators were
drawn on to ensure the surveys comprehensively measured a positive start to school, thus
provided evidence of content validity. In order to supplement the methodology and strengthen
the content validity, respondents were asked if there was anything they would add to the survey
they completed.
The majority of respondents did not indicate additional questions should be added to the four
tools (see Table 6). This suggests the tools are a comprehensive measure of what a successful
transition to school looks like. However, there were some valuable suggestions made in regards
to additional factors to consider when measuring the transition experience.
Outcomes and Indicators Report 44
Table 6: Participant responses to the question: ‘Is there anything that you believe should be
added (to the survey)?’
Yes No
Early childhood educator 34% 66%
Prep teacher 15% 85%
Parent 9% 91%
Child 14% 86%
Early childhood educators were the cohort most likely to indicate further information should be
collected, with comments almost exclusively relating to the lack of any direct reference to
Transition Statements. That is, early childhood educators suggested examining whether
teachers drew on the information provided in the transition statements and the correspondence
that occurs as a result of the Transition Statement exchange would add value to the
understanding of the transition experience drawn from the surveys.
Prep teacher responses also highlighted the importance of including Transition Statements into
the measurement of a successful transition, with several teachers suggesting it would be useful
to include on the PTS whether a child has a Transition Statement. Information regarding what
type of early childhood service the child attended (e.g. kindergarten or day care) was also
identified as valuable, as was demographic information about the school (e.g. socio-economic
status of children/families, Education Maintenance Allowance (EMA) and whether it is in an
urban, regional or rural area). Given the transition process is not standardised across schools,
two teachers also recommended gaining ‘specific information’ on what the transition process
entails at each school.
The CS administrators suggested that due to the eagerness of the child participants to elaborate
on the questions that more space could be provided to record this information. The addition of a
question asking the child to recall some transition experiences was also proposed as useful.
While less than one in ten parents suggested further information could be collected as a part of
the PS (9%), a variety of suggestions were provided as to what this additional information could
be. This included:
Information about age in months of school commencement and if [the child] completed
one or two years of 4 year old preschool.
Did the child transition with other children they knew prior to school?

Outcomes and Indicators Report 45
Has your child made new friends outside of those they previously knew at the early
years service they attended?
Satisfaction rating of early childhood provider.
Whether the transition had been a positive or negative experience.
Parents from all focus groups stated that they believed the child’s position in the family was an
important factor to assess, that is,, whether the child has an older sibling that has already made
the transition to school.
4.1.3 Validity and timing of data collection
The time of year that the data is collected is also considered to have an impact on the validity of
the results. That is, the best time to accurately assess whether the transition has been
successful is dependent on when the transition occurs and for how long it lasts. Accordingly,
participant opinions on when the information collected by the surveys would be most valid were
examined. Table 9 illustrates the breakdown of responses from the cohorts 1 and 2 participants
in relation to the question: When would be the best time to administer the survey? As can be
seen, the most popular preference was late Term 1. This correlates with comments from other
participants who were concerned that too much time had passed since the transition had taken
place once the survey was undertaken in the current study (during Term 2).
Table 7: Participant perception of best time to administer the survey13
Early Childhood Educator
PrepTeacher
Parent Child Survey administrator
OverallAverage
Early Term 1 22% 12% 13% 12% 15%
Late Term 1 38% 57% 20% 63% 45%
Early Term 2 14% 26% 37% 6% 21%
Late Term 2 2% 5% 20% 13% 10%
Early Term 3 3% - 4% 6% 3%
Late Term 3 4% - 1% - 1%
Early Term 4 7% - 2% - 2%
Lat e T er m 4 10% - 3% - 3%
13 Evaluation survey responses of participants in cohorts 1 and 2, n= 375
Outcomes and Indicators Report 46
Focus group participants had a range of views regarding when the transition period had finished
and hence when the survey should be conducted. Indigenous parents believed transition can
occur at different times for different children. One participant in the Indigenous focus group
stated, “Some children may fit right in; others may take a year to settle.”
On the other hand, parents of children with a disability believed transition began early. One
parent indicated transition started at three years of age. Parents of children with a disability
believed the survey should be implemented at different points throughout the year based on the
individual child’s progress. Participants in the CALD parent focus group had differing opinions
on the timing of the survey implementation. Many stated it should be implemented in the last
Term of kindergarten and others stated that late Term 1 of prep is the most appropriate time.14
4.2 Statistical analysis of validity and reliability
While validity is a necessary condition of any measure it is not a sufficient condition. An
additional consideration in tool development is reliability. This refers to whether a tool can be
interpreted consistently across varying situations. In this case, we want to know whether the
four surveys provide a consistent measure of a positive start to school. Accordingly, a number of
statistical analyses were conducted to further investigate the validity and reliability of the tools.
These included:
Internal validity: The extent to which participants responded consistently to the
positively and negatively worded questions.
Preliminary analysis or reliability:
o Outcome reliability: the strength of the relationship between items mapped to
each outcome.
o Consistency of responses across the four surveys.
Internal consistency: How closely related a set of items are as a group.
4.2.1 Internal validity
With the exception of the CS, each survey comprised a number of questions that sought the
same information, but where one question was worded positively (e.g. ‘My child has friends at
14 It is believed the CALD participants understood kinder to mean prep year.

Outcomes and Indicators Report 47
school’) and the other was worded negatively (‘My child has no friends at school’). If participants
were responding consistently, we would expect these pairs of items to be highly related. For
example, we would expect parents who agreed with the statement ‘My child has friends at
school’ to disagree with the statement ‘My child has no friends at school’.
Negatively worded questions were reverse-scored before statistical analysis so as to highlight
the comparison with positively worded questions. Spearman correlations were performed to
examine the level of agreement between these pairs of positively and negatively worded
questions. Correlations here and in the subsequent analyses were considered to be either
strong, moderate or weak based on the following criteria:
Strong rs ≥ .50 were considered to be strong.
Moderate rs = .30 to .49 were considered to be moderate.
Weak rs ≤ .29 were considered to be weak.
The results revealed that there were mostly strong negative correlations between these pairs of
items for the parent, prep teacher, and early childhood educator surveys, indicating a high level
of consistency in participant responses for these items (see Appendices 17, 18 & 19 – Internal
validity of each survey). For example, where parents agreed that the child ‘separates easily from
me at school’, they tended to disagree that the child ‘does not separate easily from me at
school’. While, there were also some item pairs that shared a weaker than expected association
(defined here as <.5; these are bolded in the accompanying tables), as the negatively worded
items were included only as a means of evaluating the consistency of participant responses,
and the information they provide is the same as the positively worded items. The negatively
phrased counterparts of each pair of questions can therefore be considered redundant.
4.2.2 Preliminary analysis of reliability
A number of preliminary analyses of reliability were conducted to investigate whether each of
the surveys demonstrated some degree of reliability as well as to identify questions that may be
redundant. Specifically, the relationship between items underlying each of the constructs was
examined as was the consistency of the responses to the same information across the surveys.
Outcome reliability
The questions within each survey were grouped to measure 11 different ‘positive start to school’
outcomes or underlying constructs (see Appendix 3). Each outcome was measured by a
number of survey items. For example, in the PS, outcome 1 ‘Children feel safe, secure and
Outcomes and Indicators Report 48
supported in the school environment’ was measured by 11 items, such as ‘My child looks
forward to going to school’ and ‘My child separates easily from parent/caregiver’ (e.g. does not
cry; is not clingy). If these survey items are assessing the same underlying construct of
‘Children feel safe, secure and supported in the school environment’, then we would expect to
find that these items are all related to one another. For example, when parents agree that the
child looks forward to school, they also tend to agree that their child separates easily. To assess
this level of agreement, correlations between items that were assumed to measure the same
outcome were examined.
Additionally, if participants tend to respond in exactly the same way to all of the items measuring
an outcome, then there is redundancy in the items. That is, if respondents answer the same way
to two questions, we could ask them only one of these questions and still have the same
amount of information. This issue (when the relationships between items are very high) is
referred to as multicollinearity. An example would be if parents who agreed that their child looks
forward to school always agreed that their child also separates easily. Multicollinearity is
considered likely to be a problem when correlations between a pair of items is close to rs=0.8, or
rs=0.7 if the items appeared very similar on face value (Tabachnick & Fidell, 2007).
Note that this analysis could not be conducted for the Child Survey as responses were
considered categorical rather than ordinal. That is, categorical data can only be sorted
according to category and cannot be ranked. Ordinal data on the other hand, allows responses
to be ranked according to a natural order.
Results showed that while a number of items correlated weakly with other items or were
multicollinear, most inter-item correlations were moderate to high (see Appendices 20, 21 & 22
– Survey inter-item correlations). This finding suggests the majority of questions mapped to an
outcome are sufficiently related to be considered consistent measures of the respective
outcome. Those items found to be weakly correlated or mulitcollinear, are therefore considered
for removal.
Consistency of responses across the four surveys
Some of the survey questions were consistent across all four surveys (with appropriate changes
to wording, see Appendix 23). For example, children were asked ‘Do you like going to school?’,
the parent was asked ‘My child looks forward to going to school’, the teacher was asked ‘The
child looks forward to coming to school’, and the early years educator answered the question
‘The child looked forward to coming to this early childhood service’. The way in which children,

Outcomes and Indicators Report 49
parents, prep teachers and early childhood educators responded to these questions was
examined to see if it was consistent between each of the respondent groups. For example if a
child responded that they were happy at school, did the parent, prep teacher and early
childhood educator respond the same way? If the surveys are reliable we would expect the four
different participant groups to be responding in the same (or similar) way as each other. The
cross-survey items comparison uses Chi square to answer this question.
Chi square works out if the proportions are similar within these responses. However, in order to
perform this analysis some of the data needed to be re-coded to make the responses to each
survey comparable. This is because the child responses were rated categorically; whereas the
three ‘adult’ surveys were rated on an ordinal scale. To make the response comparable across
all four surveys the data for the prep teacher, parent and early childhood educator surveys were
first re-coded as Strongly Agree and Agree = ‘Yes’, and Strongly Disagree and Disagree = ‘No’;
‘Don’t Know’ and ‘Neutral’ responses were excluded from this analysis.
Results of the analysis revealed that for the majority of the questions informants tended to
provide similar responses. Furthermore, for the responses that were found to be significantly
different across the four surveys, this difference was minimal once percentages were examined.
For example, parents and prep teachers had different perceptions about the quality of
communication between the staff and parents at schools (x2=7.33, p<.01): 100% of prep
teachers agreed that communication with parents was good, while 92% of parents agreed with
this statement. That is, although the difference was considered statistically different, over 90%
of teachers and parents agreed with this statement. Appendix 23 shows each category of
question, the surveys in which they appear, and the Chi square result.
4.2.3 Internal consistency
The combined findings of the preliminary analysis provide evidence that the ECES, PTS and PS
may be operating reliably and that specific questions can be considered for removal.
Furthermore the across-survey comparisons suggest that the respondents to the ECES, PTS
and PS are responding in a similar way to children on the CS. On this basis, work to establish
the internal consistency of each survey, and provide a further indication of the questions that
may be redundant, was conducted.
The internal consistency of the questions measuring each of the outcomes was indicated by
Cronbach’s alpha. The tables presented below (Tables 10, 11, 12 & 13) show the effect on

Outcomes and Indicators Report 50
Cronbach’s alpha and the average inter-item correlation (rho) as successive questions are
omitted from the analysis for each outcome/indicator on each of the surveys. For example,
when question 20 is omitted from the analysis for outcome 1 on the ECES (Table 10),
Cronbach’s alpha increases from 0.85 to 0.86, and the average inter-item correlation increases
from 0.35 to 0.40. Please note, for each outcome/indicator, the combination of questions which
give the highest Cronbach’s alpha and average inter-item correlation with the smallest number
of questions has been highlighted in yellow in each of the tables.
Early Childhood Educator Survey
When all survey items were included, Cronbach’s alpha and average inter-item correlation were
very high for outcomes 1, 2, 3, 4, 5, 6 and 11 (see Table 10). Cronbach’s alpha was low for
outcomes 7 and 10 suggesting that the questions in each of these outcomes may not be
measuring the desired outcome. Please note that although the level of internal consistency is
acceptable for outcome 10 when specific questions are omitted, the result for outcome 7
remains poor. Therefore, with the exception of outcome 7, acceptable internal consistency is
evident for all outcomes measured by the ECES.
Table 8: Early Childhood Educator Survey – Different combinations of survey items and the
effect on Cronbach’s alpha and inter-item correlation
Outcome Number of questions
Questions used to measure this outcome
Cronbach’salpha
Average inter-item correlation
Outcome 1 10 1,2,3,5,6,9,12,15,17,20 .85 .35
9 1,2,3,5,6,9,12,15,17, .86 .40
8 1,3,5,6,9,12,15,17, .86 .43
7 3,5,6,9,12,15,17, .86 .48
6 3,5,9,12,15,17, .87 .52
5 3,5,9,12,17, .87 .58
4 3,5,9,17, .88 .64
3 3,5,9, .86 .68
2 3,9, .84 .73
Outcome 2 9 3,4,7,8,9,10,11,12,16 .90 .49
8 3,4,7,8,9,10,11,16 .90 .52
7 3,4,7,9,10,11,16 .89 .54
6 3,4,9,10,11,16 .89 .56

Outcomes and Indicators Report 51
Outcome Number of questions
Questions used to measure this outcome
Cronbach’salpha
Average inter-item correlation
5 3,9,10,11,16 .87 .58
4 3,9,10,11, .86 .60
3 3,9,10, .85 .66
2 3,9, .84 .73
Outcome 3 9 3,4,5,8,9,11,12,16,17 .90 .50
8 3,4,5,8,9,11,16,17 .90 .53
7 3,4,5,9,11,16,17 .90 .56
6 3,5,9,11,16,17 .89 .57
5 3,5,9,11,17 .88 .60
4 3,5,9,17 .88 .64
3 3,5,9, .86 .68
2 3,9, .84 .73
Outcome 4 13 1,2,3,4,7,8,9,10,11,12,13,14,16 .90 .41
12 2,3,4,7,8,9,10,11,12,13,14,16 .90 .43
11 3,4,7,8,9,10,11,12,13,14,16 .91 .47
10 3,4,7,8,9,10,11,13,14,16 .91 .49
9 3,4,7,9,10,11,13,14,16 .90 .51
8 3,4,7,9,10,11,13,16 .90 .52
7 3,4,7,9,10,11,16 .89 .54
6 3,4,9,10,11,16 .89 .56
5 3,9,10,11,16 .87 .58
4 3,9,10,11, .86 .60
3 3,9,10, .85 .66
2 3,9, .84 .73
Outcome 5 5 5,7,10,17,19 .86 .54
4 5,7,10,17, .87 .63
3 5,10,17, .87 .70
2 5,17, .86 .75
Outcome 6 10 1,3,5,6,7,10,12,17,18,19 .88 .43
9 3,5,6,7,10,12,17,18,19 .89 .47
8 3,5,6,7,10,17,18,19 .89 .51
7 3,5,7,10,17,18,19 .89 .53

Outcomes and Indicators Report 52
Outcome Number of questions
Questions used to measure this outcome
Cronbach’salpha
Average inter-item correlation
6 3,5,7,10,17,18, .88 .55
5 3,5,7,10,17, .89 .61
4 3,5,10,17, .88 .65
3 5,10,17, .87 .70
2 5,17, .86 .75
Outcome 7* 2 21,27 .50 .33
Outcome 10 5 20,21,22,27,34 .69 .30
4 20,21,22,34 .73 .40
3 20,21,22, .70 .44
2 20,21, .66 .49
Outcome 11 11 24,25,26,28,29,30,31,32,33,35,23 .89 .42
10 24,26,28,29,30,31,32,33,35,23 .89 .46
9 24,26,28,29,30,31,33,35,23 .90 .49
8 24,26,28,29,30,31,35,23 .89 .51
7 24,28,29,30,31,35,23 .89 .54
6 24,28,29,30,31,23 .89 .58
5 28,29,30,31,23 .89 .62
4 28,29,30,31, .90 .68
3 28,29,31, .88 .71
2 28,31, .84 .73
* denotes Cronbach’s alpha for this outcome is unsatisfactory
Prep Teacher Survey
When all survey items were included, Cronbach’s alpha and average inter-item correlation were
satisfactory for outcomes 1, 2, 3, 4, 5, 6, 8, 9 and 11 (see Table 11). Cronbach’s alpha was low
for outcomes 7 and 10 when all the questions underlying this construct were included
suggesting that the questions in this outcome may not be measuring the desired outcome.
However, the alpha for these outcomes can be improved by omitting some questions.
Therefore, an acceptable level of internal consistency can be demonstrated for all outcomes
measured by the PTS.

Outcomes and Indicators Report 53
Table 9: Prep Teacher Survey – Different combinations of survey items and the effect on
Cronbach’s alpha and inter-item correlation
Outcome Number of questions
Questions used to measure this outcome
Cronbach’salpha
Average inter-item correlation
Outcome 1 15 1,2,3,5,6,8,11,12,15,18,20,21,43,47,48 .89 .34
14 1,2,3,5,6,8,11,12,15,18,20,21,43,48 .90 .38
13 2,3,5,6,8,11,12,15,18,20,21,43,48 .90 .41
12 2,3,5,6,8,11,12,15,18,20,21,48 .90 .44
11 2,3,5,6,8,11,12,15,18,20,21, .91 .48
10 2,3,5,6,8,12,15,18,20,21, .91 .51
9 3,5,6,8,12,15,18,20,21, .92 .56
8 3,5,8,12,15,18,20,21, .92 .59
7 3,5,8,12,15,20,21, .92 .62
6 3,5,8,12,20,21, .92 .64
5 3,5,12,20,21, .91 .67
4 3,5,12,20, .90 .70
3 3,12,20, .89 .72
2 3,12, .93 .86
Outcome 2 12 3,4,7,9,10,12,13,14,15,19,22,23 .92 .49
11 3,4,7,9,10,12,13,14,15,19,23 .92 .50
10 3,4,7,9,10,12,13,14,15,19, .91 .51
9 3,4,7,9,10,12,13,14,19, .91 .52
8 3,4,7,9,10,12,13,19, .90 .53
7 3,4,7,9,12,13,19, .89 .55
6 3,4,7,12,13,19, .89 .57
5 3,4,7,12,13, .89 .62
4 3,7,12,13, .90 .69
3 3,12,13, .89 .73
2 3,12, .93 .86
Outcome 3 10 4,5,7,9,10,13,14,19,21,24 .91 .51
9 4,5,7,9,10,13,14,19,21, .91 .53
8 4,5,7,9,10,13,19,21, .91 .55
7 4,5,7,10,13,19,21, .90 .56
6 4,5,7,13,19,21, .89 .58

Outcomes and Indicators Report 54
Outcome Number of questions
Questions used to measure this outcome
Cronbach’salpha
Average inter-item correlation
5 4,5,7,13,21, .88 .60
4 5,7,13,21, .88 .66
3 5,13,21, .87 .68
2 13,21, .82 .70
Outcome 4 15 1,2,3,4,7,9,10,11,12,13,14,15,16,17,19 .91 .42
14 2,3,4,7,9,10,11,12,13,14,15,16,17,19 .92 .45
13 3,4,7,9,10,11,12,13,14,15,16,17,19 .92 .47
12 3,4,7,9,10,12,13,14,15,16,17,19 .92 .50
11 3,4,7,9,10,12,13,14,15,16,19 .92 .51
10 3,4,7,9,10,12,13,14,16,19 .92 .53
9 3,4,7,9,10,12,13,16,19 .91 .54
8 3,4,7,9,12,13,16,19 .91 .55
7 3,4,7,12,13,16,19 .90 .58
6 3,4,7,12,13,16, .90 .60
5 3,7,12,13,16, .91 .66
4 3,7,12,13, .90 .69
3 3,12,13, .89 .73
2 3,12, .93 .86
Outcome 5 5 5,7,13,20,25 .88 .60
4 5,7,13,20, .89 .67
3 5,13,20, .89 .72
2 5,20, .88 .78
Outcome 6 17 1,3,5,6,7,8,12,13,15,20,21,22,24,25,26_1,26_2,26_3
.92 .42
16 3,5,6,7,8,12,13,15,20,21,22,24,25,26_1,26_2,26_3
.93 .45
15 3,5,6,7,8,12,13,15,20,21,22,24,25,26_1,26_3
.93 .48
14 3,5,6,7,8,12,13,15,20,21,22,24,25,26_3 .94 .51
13 3,5,6,7,8,12,13,15,20,21,22,24,25, .94 .55
12 3,5,6,7,8,12,13,15,20,21,24,25, .94 .56
11 3,5,6,7,8,12,13,15,20,21,25, .94 .58
10 3,5,6,7,8,12,13,15,20,21, .94 .60

Outcomes and Indicators Report 55
Outcome Number of questions
Questions used to measure this outcome
Cronbach’salpha
Average inter-item correlation
9 3,5,7,8,12,13,15,20,21, .94 .62
8 3,5,7,8,12,13,20,21, .94 .64
7 3,5,7,12,13,20,21, .93 .66
6 3,5,12,13,20,21, .93 .67
5 3,5,12,13,20, .92 .69
4 3,12,13,20, .90 .70
3 3,12,13, .89 .73
2 3,12, .93 .86
Outcome 7 5 27,31,32,33,37 .66 .28
4 27,31,32,33, .64 .31
3 27,32,33, .67 .41
2 27,32, .85 .74
Outcome 8 2 28,29 .76 .61
Outcome 9 7 33,34,35,36,37,40,50 .81 .38
6 33,34,35,36,37,50 .84 .47
5 33,34,35,36,50 .86 .54
4 33,35,36,50 .85 .59
3 35,36,50 .85 .66
2 35,36, .89 .81
Outcome 10 14 27,31,32,42,43,48,41_1,41_2,41_3,41_4,41_5,41_6,41_7,41_8
.59 .09
13 27,31,32,42,43,48,41_1,41_2,41_3,41_4,41_5,41_6,41_8
.62 .11
12 27,31,32,42,43,48,41_1,41_3,41_4,41_5,41_6,41_8
.64 .13
11 27,31,32,42,43,48,41_1,41_3,41_4,41_6,41_8
.66 .15
10 27,31,32,42,43,48,41_1,41_3,41_4,41_8 .68 .17
9 27,32,42,43,48,41_1,41_3,41_4,41_8 .70 .20
8 27,32,42,43,48,41_1,41_3,41_4, .71 .23
7 27,32,42,43,48,41_1,41_3, .72 .26
6 32,42,43,48,41_1,41_3, .72 .30
5 32,42,43,41_1,41_3, .73 .35
4 32,42,41_1,41_3, .72 .39

Outcomes and Indicators Report 56
Outcome Number of questions
Questions used to measure this outcome
Cronbach’salpha
Average inter-item correlation
3 32,42,41_1, .70 .44
2 42,41_1, .68 .51
Outcome 11 7 38,44,45,46,47,49,39 .85 .44
6 38,44,45,46,47,39 .89 .56
5 38,44,45,46,47, .89 .62
4 38,44,46,47, .88 .64
3 38,46,47, .86 .68
2 38,47, .83 .71
Parent Survey
When all survey items were included, Cronbach’s alpha and average inter-item correlation were
satisfactory for outcomes 1, 2, 3, 4, 6, 7, and 9 (see Table 10). Cronbach’s alpha was somewhat
poor for outcomes 8 and 10 and very low for outcome 5, suggesting that when all the questions
are included these outcomes may not be measuring the desired outcome. However, with the
exception of outcome 5 the alpha for these outcomes can be improved sufficiently by omitting
some questions resulting in an acceptable level of internal consistency can be demonstrated for
all other outcomes measured by the PS.
Table 10: Parent Survey – Different combinations of survey items and the effect on Cronbach’s
alpha and inter-item correlation
Outcome Number of questions
Questions used to measure this outcome Cronbach’salpha
Average inter-item correlation
Outcome 1 12 1,2,4,6,7,10,13,14,15,18,19,41 .79 .24
11 1,2,4,6,7,10,13,14,18,19,41 .81 .28
10 1,2,4,6,7,10,14,18,19,41 .82 .32
9 1,2,4,6,7,10,14,19,41 .83 .34
8 1,2,4,7,10,14,19,41 .83 .38
7 1,2,4,7,14,19,41 .82 .40
6 1,2,7,14,19,41 .83 .44
5 1,2,7,14,41 .82 .48
4 1,2,7,14, .81 .51
3 1,2,14, .79 .56

Outcomes and Indicators Report 57
Outcome Number of questions
Questions used to measure this outcome Cronbach’salpha
Average inter-item correlation
2 1,14, .77 .62
Outcome 2 12 3,4,5,8,9,10,11,12,13,15,20,21 .82 .27
11 3,4,5,8,9,10,11,12,13,20,21 .83 .31
10 3,4,8,9,10,11,12,13,20,21 .85 .36
9 3,4,8,9,10,11,12,20,21 .86 .41
8 4,8,9,10,11,12,20,21 .86 .43
7 8,9,10,11,12,20,21 .86 .46
6 8,9,10,11,12,20, .86 .50
5 8,9,11,12,20, .87 .56
4 8,9,11,20, .86 .61
3 8,9,11, .87 .70
2 8,9, .90 .81
Outcome 3 9 3,5,8,9,11,12,13,19,22 .81 .33
8 3,8,9,11,12,13,19,22 .83 .38
7 3,8,9,11,12,19,22 .85 .45
6 3,8,9,11,12,19, .85 .49
5 3,8,9,11,12, .85 .53
4 3,8,9,11, .86 .61
3 8,9,11, .87 .70
2 8,9, .90 .81
Outcome 4 15 1,2,3,4,5,8,9,10,11,12,13,15,16,17,18 .84 .26
14 1,2,3,4,5,8,9,10,11,12,13,16,17,18 .85 .29
13 1,2,3,4,8,9,10,11,12,13,16,17,18 .86 .32
12 1,2,3,4,8,9,10,11,12,16,17,18 .87 .35
11 1,2,3,4,8,9,10,11,12,16,17, .87 .38
10 1,3,4,8,9,10,11,12,16,17, .87 .39
9 1,4,8,9,10,11,12,16,17, .86 .41
8 4,8,9,10,11,12,16,17, .86 .43
7 8,9,10,11,12,16,17, .85 .45
6 8,9,11,12,16,17, .85 .48
5 8,9,11,12,16, .85 .53
4 8,9,11,12, .85 .59

Outcomes and Indicators Report 58
Outcome Number of questions
Questions used to measure this outcome Cronbach’salpha
Average inter-item correlation
3 8,9,11, .87 .70
2 8,9, .90 .81
Outcome 5 3 5,12,23 .45 .21
2 12,23 .63 .46
Outcome 6 11 1,4,5,7,10,12,15,19,20,22,23 .82 .29
10 1,4,5,7,10,12,19,20,22,23 .84 .35
9 1,4,7,10,12,19,20,22,23 .87 .42
8 4,7,10,12,19,20,22,23 .86 .44
7 7,10,12,19,20,22,23 .86 .46
6 7,12,19,20,22,23 .85 .49
5 7,12,19,20,23 .84 .51
4 7,19,20,23 .83 .55
3 19,20,23 .80 .57
2 19,20, .77 .63
Outcome 7 6 24,25,28,30,31,35 .75 .33
5 24,25,30,31,35 .74 .36
4 24,30,31,35 .76 .44
3 24,31,35 .74 .49
2 24,31, .74 .59
Outcome 8 15 26,29,27_1,27_2,27_3,27_4,27_5,27_6,43_1,43_2,43_3,43_4, 43_5,43_6,43_7
.71 .14
14 26,29,27_1,27_2,27_3,27_4,27_5,43_1,43_2,43_3,43_4,43_5, 43_6,43_7
.72 .15
13 26,29,27_1,27_2,27_3,27_4,27_5,43_1,43_2,43_3,43_4,43_5, 43_6,
.72 .17
12 26,29,27_2,27_3,27_4,27_5,43_1,43_2,43_3,43_4,43_5, 43_6,
.72 .18
11 26,29,27_2,27_4,27_5,43_1,43_2,43_3,43_4,43_5,43_6,
.72 .19
10 26,29,27_2,27_5,43_1,43_2,43_3,43_4,43_5,43_6,
.71 .20
9 26,29,27_2,43_1,43_2,43_3,43_4,43_5,43_6,
.70 .21
8 26,29,43_1,43_2,43_3,43_4,43_5,43_6, .69 .22
7 29,43_1,43_2,43_3,43_4,43_5,43_6, .67 .23

Outcomes and Indicators Report 59
Outcome Number of questions
Questions used to measure this outcome Cronbach’salpha
Average inter-item correlation
6 43_1,43_2,43_3,43_4,43_5,43_6, .66 .25
5 43_2,43_3,43_4,43_5,43_6, .67 .29
4 43_2,43_3,43_4,43_6, .64 .31
3 43_2,43_3,43_4, .64 .37
2 43_3,43_4, .67 .51
Outcome 9 13 31,32,34,35,36,37,42,33a1,33a2,33a3,33a4,33a5,33a6
.86 .32
12 31,32,34,35,36,37,42,33a1,33a2,33a3,33a4,33a5,
.88 .38
11 31,32,34,35,36,37,42,33a2,33a3,33a4,33a5, .89 .41
10 31,32,34,35,36,37,42,33a2,33a4,33a5, .88 .43
9 31,32,34,35,36,37,42,33a4,33a5, .88 .46
8 31,32,34,35,36,37,42,33a5, .89 .50
7 31,32,34,35,36,37,42, .89 .54
6 31,32,34,36,37,42, .90 .59
5 31,32,34,36,37, .90 .63
4 31,32,34,37, .88 .65
3 31,32,34, .87 .68
2 31,32, .85 .74
Outcome 10 6 24,25,28,30,38,39 .70 .28
5 24,25,28,30,38, .68 .30
4 24,25,28,30, .67 .34
3 25,28,30, .62 .35
2 25,28, .65 .49
Child Survey
When all survey items were included, Cronbach’s alpha and average inter-item correlation were
unacceptable for all outcomes (see Table 11). When questions were omitted, results for all
outcomes remained unacceptable, except for outcome 1 which demonstrates an acceptable
level of internal consistency when only questions 1 and 6 contribute to its measurement.

Outcomes and Indicators Report 60
Table 11: Child Survey – Different combinations of survey items and the effect on Cronbach’s
alpha and inter-item correlation
Outcome Number of questions
Questions used to measure this outcome Cronbach’salpha
Average inter-item correlation
Outcome 1 9 1,2,4,5,6,7,8,12,22 .58 .13
8 1,2,4,6,7,8,12,22 .59 .15
7 1,2,4,6,7,12,22 .61 .18
6 1,2,4,6,7,22 .61 .21
5 1,2,6,7,22 .60 .23
4 1,2,6,22 .63 .30
3 1,2,6, .63 .36
2 1,6, .73 .58
Outcome 2 8 4,9,10,11,12,13,14,15 .15 .02
7 9,10,11,12,13,14,15 .25 .05
6 9,10,11,13,14,15 .26 .06
5 9,10,11,14,15 .27 .07
4 9,11,14,15 .28 .09
3 9,14,15 .28 .11
2 9,14, .31 .18
Outcome 3 7 5,9,10,11,15,16,17 .34 .07
6 5,9,10,11,15,16, .38 .09
5 5,10,11,15,16, .40 .12
4 5,10,11,15, .36 .12
3 5,10,11, .34 .15
2 5,10, .33 .19
Outcome 4 9 1,2,4,9,10,11,12,15,17 .39 .07
8 1,2,4,10,11,12,15,17 .42 .08
7 1,2,4,11,12,15,17 .44 .10
6 1,2,4,12,15,17 .43 .11
5 1,2,4,15,17 .43 .13
4 1,2,4,17 .42 .16
3 1,2,17 .41 .19
2 1,2, .41 .26
Outcome 5 3 5,15,18 .33 .14

Outcomes and Indicators Report 61
Outcome Number of questions
Questions used to measure this outcome Cronbach’salpha
Average inter-item correlation
2 15,18 .32 .19
Outcome 6 8 3,4,5,6,12,13,15,18 .48 .10
7 3,4,5,6,12,15,18 .52 .13
6 3,4,6,12,15,18 .53 .16
5 3,6,12,15,18 .54 .19
4 3,6,15,18 .53 .22
3 3,6,18 .56 .30
2 3,18 .60 .43
Outcome 10 2 20,21 .29 .17
4.3 Implications
Validity
Findings indicate all four of the surveys have a degree of face validity, while further evidence
was provided in regard to the content validity. Specifically, the findings suggest:
All four surveys appear to be accurate measures of the transition experience.
Respondents perceive the information collected by the surveys to be useful.
The information collected by the surveys was largely comprehensive of the transition
experience.
These findings provide support for the use of the ECES, PTS, PS and CS as accurate
measures of a positive transition to school.
Suggestions made by some respondents as to additional information that could be collected by
the surveys and therefore increase the content validity, were also considered. Given early
childhood educators and prep teachers consistently indicated Transition Statements to be
relevant to the measurement of a positive transition, questions in regard to Transition
Statements should be included in the ECES and PTS. However, further work needs to be done
to examine the wording of such questions as well as the outcomes to which these questions
would be mapped. Additional questions proposed for inclusion by participants were not
considered for inclusion on a number of grounds:
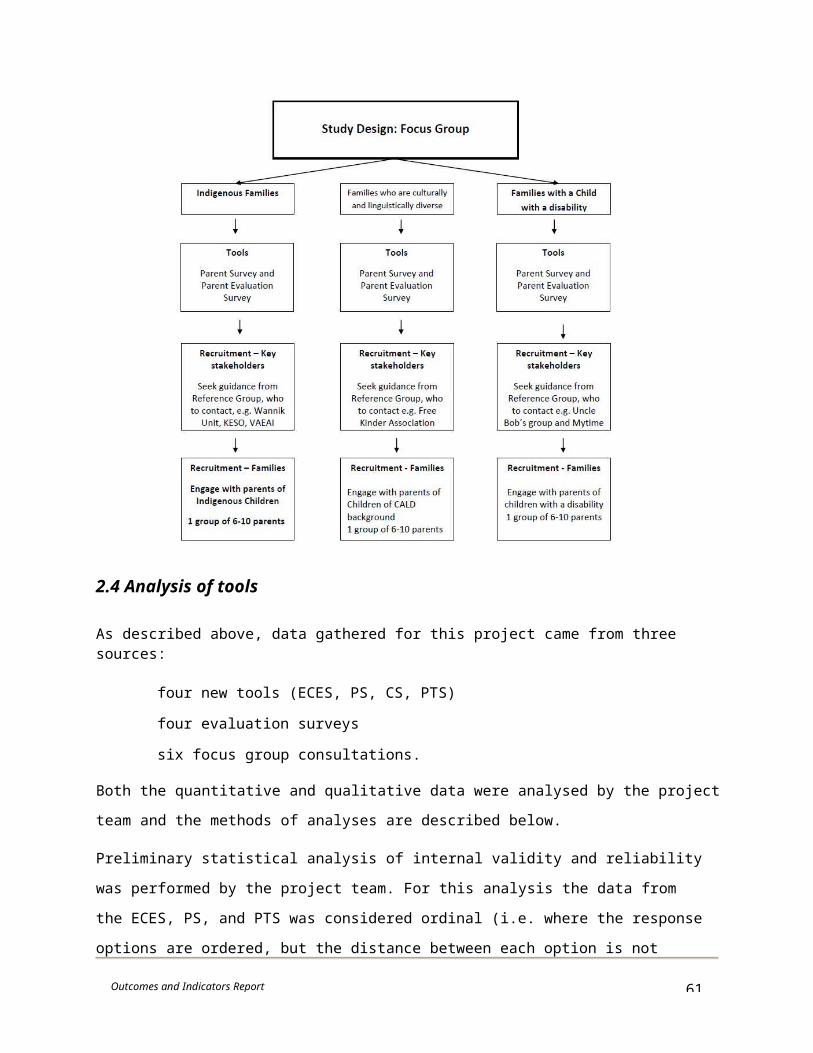
Outcomes and Indicators Report 62
Information collected by proposed questions does not underscore the outcomes.
Information provided by proposed question is available to public, therefore can be
considered in conjunction with the data resulting from the four tools.
Questions yielding similar information are included in the survey, thus inclusion of the
proposed questions is unlikely to significantly contribute to the measurement of
transition.
The information such a question would provide is not reflected in the research, therefore
is unlikely to contribute to the content validity.
Important information was also provided by participants in regards to an appropriate time of year
for data collection. The majority of participants indicated late in Term 1 or early in Term 2 as the
most valid time to collect information on the transition experience, therefore in order to collect
information to accurately reflect a positive transition to school, data collection should occur at
these times.
A question for future research is whether the timing of transition varies for CALD and Indigenous
children when compared to the general population.
It is important to note the difference in timing of data collection suggested by focus group
participants. These participants illustrated limited understanding of the measurement of
transition outcomes, confusing it with individual child assessment. In turn, this impacted on their
views about the most valid time to measure whether a positive transition had taken place. A
number of focus group participants suggested that multiple surveys occur across the year to
monitor the changes occurring for the individual child.
Also noteworthy is that although the surveys were deemed appropriate for use among the
general population as well as Indigenous and CALD groups, parents of children with a disability
disagreed that the PS collected information that accurately reflected the transition experience of
children with a disability. Given a number of questions were common across all four of the
surveys this may imply that each of the surveys would need to be amended to be valid for
children with a disability making the transition to school. One option is to include an additional
set of questions specifically for children with a disability, that measure the supports and
experience that are identified as crucial to these children experiencing a positive transition to
school. This would also provide the opportunity to develop data on how these children are
transitioning and the additional supports schools, early childhood services and parents could
provide.

Outcomes and Indicators Report 63
Statistical analysis
Findings of the statistical analysis provided some insight into the psychometric properties of the
four newly developed tools.
The examination of internal validity indicates participants are responding consistently to the
negatively and positively worded questions included on the ECES, PTS and PS. Given the
negatively worded questions provide the same information as their positively worded
counterparts these questions are therefore redundant and can be removed from the analysis.
As mentioned previously, the preliminary analysis of reliability provides evidence that the
questions underlying each outcome on the ECES, PTS and PS to be consistent and therefore
likely to be measuring the same outcomes. This examination also provides some indication that
specific questions could be considered for removal. By comparing the responses to questions
that are the same or similar across the four surveys, another aspect of reliability has been
demonstrated.
The incorporation of the child survey into the analysis of across survey comparisons allowed for
a degree of reliability to be established for this survey. However, as this was largely based on
the responses to the three adult surveys, it is important to note the impact of the low response
rate to the ECES (as discussed in section 2). That is, given that only 95 ECES were returned,
over half of these comparisons are based on only two adult surveys (or less when a comparable
question was not included in the respective survey). While the inferences drawn from the cross-
survey comparisons nonetheless provide an indication of the degree to which participants are
responding consistently, the broader inferences drawn from this analysis are less robust.
Further analysis of reliability, namely internal consistency, was drawn on to build on the
preliminary demonstration of reliability and provide more conclusive advice on which questions
can be considered for removal. With the exception of the CS, findings from this analysis of
internal consistency were largely consistent with the preliminary analysis. That is, questions
underlying most of the outcomes were found to be reliable measures of that outcome, however,
differences as to which questions to remove were noted.
The implications drawn from these findings are presented below.

Outcomes and Indicators Report 64
Early Childhood Educator Survey
Analysis of the data provided by the ECES found that the combination of survey items
was sufficiently different to distinguish each outcome.
The most reliable combination and the smallest combination of questions per outcome is
highlighted in yellow in Table 8. These questions are therefore the questions
recommended for inclusion in the ECES.
While negatively posed questions Q4, Q11, Q17 were found to contribute to a higher
level of internal consistency, deleting these questions does not substantially compromise
the internal consistency of the questions underlying any outcome. Given they do not
provide any unique information due to the inclusion of their positive counterparts, the
inclusion of these questions in the ECES is not recommended.
The survey items that currently map to outcome 7 have low internal consistency, which
indicate that Q21 and Q27 may not be reliable measures of outcome 7. In the future,
new questions to collect data against outcome 7 will therefore need to be developed.
Prep Teacher Survey
Analysis of the data provided by the PTS found that the combination of survey items was
sufficiently different to distinguish each outcome.
The most reliable combination and the smallest combination of questions per outcome
are highlighted in yellow in Table 9. These questions are recommended for inclusion in
the PTS.
While Q20, a negatively posed question, contributed to a higher level of internal
consistency, deleting all the negatively posed questions will not substantially
compromise the internal consistency of the questions for any outcome.
Parent Survey
Analysis of the PS data found that the most reliable combination of survey items was the
same for outcomes 2, 3 and 4. This may indicate that parents had difficulty
distinguishing between the concepts of outcomes 2, 3 and 4. Alternatively, the questions
mapped to these outcomes may not be an accurate measure of the three individual
outcomes. It will be important to differentiate data collected to these outcomes. Retaining
Q20 for outcome 2, Q19 for outcome 3 and Q16 for outcome 4 will not substantially

Outcomes and Indicators Report 65
compromise the internal consistency. In order to ensure the combination of survey items
are sufficiently different to distinguish each outcome, these questions are recommended
for inclusion (as shown in Table 10).
The survey items that currently map to outcome 5 were found to have unacceptable
internal consistency. This indicates the respective current survey items are not reliable
measures of outcome 5. In the future, new questions will need to be developed to collect
data against this outcome.
While Q35 was found to contribute to a higher level of internal consistency, deleting all
the negatively posed questions will not substantially compromise the internal
consistency of the questions for any outcome and are therefore recommended for
removal.
Child Survey
Calculation of Cronbach’s alpha found that the only combination of survey items that
reliably measured an outcome was those mapped to outcome 1, as shown in Table 13.
While this finding indicates the CS may not be a reliable measure of a positive transition
to school, the across survey comparisons indicate that children are showing similar
patterns of responding as respondents to the three adult surveys (bearing in mind the
low response rate from early childhood educators discussed in Section 2). This provides
evidence of across survey reliability.
Further work is required to develop this survey. An immediate improvement would be to
change the response options in the CS to the same scale as the adult surveys e.g. the 5
point Likert scale. This would support stronger comparison analysis and may increase
the internal consistency of the CS.
Given the surveys were developed to be outcome based-measures of transition, it will be
important for future analysis to be focused on across survey comparisons according to outcome.
Making the suggested change to the CS response scale, that is child responses are rated on a
5 point Likert scale, will strengthen such an analysis and the data provided by the adult surveys
would not require recoding. Furthermore, an outcomes analysis is likely to provide a more
accurate appraisal of the responses provided because the wording of the questions vary slightly
across surveys, where as the outcomes are identical for each survey.

Outcomes and Indicators Report 66
Lastly, it is important to note that if the questions identified as redundant (within each of the
adult surveys) are removed in the modified version of the tools, each of the adult surveys would
lose the ability to generate data for a number of the indicators (see Appendix 24). However, the
remaining list of survey items will continue to be mapped to each of the outcomes shown to be
reliably measured in the current trial.
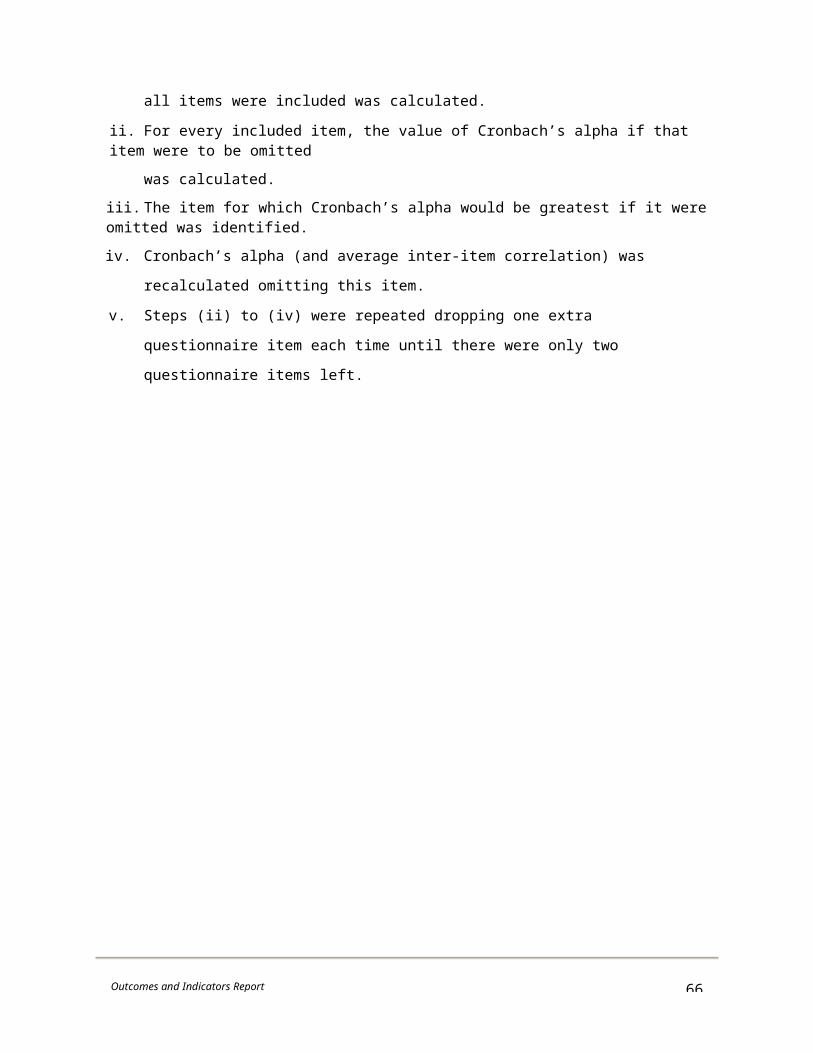
Outcomes and Indicators Report 67
5 Inclusivity
In accordance with recommendations put forward by Nolan et al (2009) foundational work on
measuring outcomes and indicators of a positive start to school, consideration was given to
ensure the four surveys were sensitive to the diversity of children and their families. That is,
whether the surveys were inclusive of families and children that are under-represented in the
general Victorian population, such as those from CALD backgrounds or an Indigenous
background as well as families of children with a disability. Feedback from the evaluation
surveys and the focus groups was drawn on to inform whether the tools were appropriate for
use across all groups, with particular reference to those mentioned above.
5.1 Survey responses
Respondents to the evaluation surveys were asked to indicate whether ‘questions in the survey
were inclusive of all children and families?’ While specific reference to CALD families,
Indigenous families as well as families of children with a disability was made, the question was
posed so as to allow participants to also specify groups outside of these that may not be
represented by the survey questions.
On average, 93% of participants in cohort 1 and 2 reported that the survey was inclusive of all
children/families, with the breakdown of agreement according to participant group demonstrated
in Table 12. Those participants who did not feel the survey was inclusive reported that it was not
inclusive of families from CALD backgrounds, children with additional needs as well as families
with low literacy levels.
Suggestions made by participants to address issues of inclusivity included:
Asking about ‘special needs’ children in particular ‘because they usually have better or
more transition and more meetings and reports’.
Adding a question reflecting the fact that children with additional needs require additional
strategies with transition.
Allowing space so responses can be qualified, especially for children with diverse needs,
which will allow additional information to be recorded (i.e. speech pathology).
Consideration given to how a child with specific conditions can engage with the survey
(ability of child to communicate, express feelings and understand what is being asked).

Outcomes and Indicators Report 68
Simplifying the language for CALD background and low literacy families.
Acknowledge / reflect multicultural understandings / perspectives.
Table 12: Participant responses to the question: 'Are the questions on the survey inclusive of all
children and families?'
Yes No
Early childhood educator 96% 4%
Prep teacher 91% 9%
Parent 97% 3%
Child 88% 12%
5.2 Focus group feedback
Focus group participants were asked whether the survey was inclusive of all children, however
considerable focus was placed on whether it was applicable and representative of their own
child’s transition experience. Parents of children with a disability were the most vocal about and
the least likely to agree that the survey was inclusive. An overwhelming majority of these
parents believed that the survey was not inclusive of children with a disability or developmental
delay. Parents believed that many questions were not relevant to their child’s experience of
transition. Accordingly, these parents expressed concern about how the data drawn from the
surveys would be used. More specifically, parents were concerned that any data that included
the responses in regards to children with a disability would not be representative of the broad
population. The participants made suggestions to rectify this, including:
Provide an opportunity for survey participants to identify, at the beginning of the survey,
the child’s disability or additional need.
Include comment boxes next to each question in order to qualify responses.
Develop a specific survey targeted towards children with additional needs.
The participants in the CALD focus group believed that the survey was inclusive and
representative in content of their own child’s transition experience. However, these parents
suggest the PS would be more inclusive of CALD families if the survey was available to them in
their first language.
Although the participants in the Indigenous focus group did not explicitly identify that the survey
was not inclusive, the project workers’ observation of the difficulties some experienced

Outcomes and Indicators Report 69
completing the survey suggest that it could be modified to make it more accessible to
Indigenous families. For example, one participant indicated drawing on a more conversational or
story-telling method might be a more effective method for engaging Indigenous families in the
surveys.
5.3 Implications
Overwhelmingly the four surveys were perceived to be inclusive of the general population.
However, questions were raised around how inclusive they were of CALD families, Indigenous
families, families with low literacy and families of children with a disability. Minor modifications,
such as simplifying the wording of questions, will increase the inclusivity of the surveys for most
of these groups. However, participants did not indicate which questions in particular these
modifications referred to. Therefore, further work is needed to determine which questions to
modify as well as how to modify them, in order to increase the accessibility for these sub-
populations.
Additionally, consideration should be given to engaging Indigenous families in the PS via a more
culturally appropriate approach. This could include drawing or story-telling as a prelude to the
survey being administered, to provide Indigenous families with an understanding as to why
transition is important as well as the relevance of the questions. In addition to engaging
Indigenous groups in the surveys, such an approach would have the added benefit of allowing
the data based on Indigenous children to be included in the data from the general population as
it does not require modification of the questions. Given the transition experience is so different
for children with a disability, modifying the surveys to make them accessible for these children
was considered to be more problematic.
Based on the discrepancies highlighted by parents of children with a disability, a number of
changes would need to be made to ensure the surveys reflect what a positive transition looks
like for these children. For example questions regarding their child’s relationships with educators
and other children such as ‘my child has friends at school’ were highlighted as inapplicable as
they were note relevant to their child’s transition. While these parents provided suggestions as
to how the surveys could be made more inclusive, many would limit the ability of the data based
on children with a disability to be included with findings drawn from the children without a
disability. For instance, most parents agreed providing a space to qualify their responses to the
questions would ease the anxiety felt during survey completion as well as make the information

Outcomes and Indicators Report 70
yielded by the questions more relevant to their child’s transition. Incorporating such changes
however, would limit the extent to which the data can be analysed and reported on at a local
level. Alternatively, a data set for children with a disability across communities will help build an
understanding of the different transition experience for this particular group. As such, any
changes to the survey, in response to the issues raised about the inclusion of the experience of
children with a disability, should be made with reference to the intended use of the data.

Outcomes and Indicators Report 71
6 Accessibility
In order to assess whether the tools were accessible to all participant groups, responses from
the evaluation surveys as well as feedback from the focus groups were drawn on. The data
analysed in this section provide an indication of the utility of the tools in regards to:
The clarity of instructions.
Child engagement in the Child Survey.
Difficulties encountered when completing the tools for:
o Survey respondents
o CALD parents
o Indigenous parents
o Parents of children with a disability.
Time taken to complete the surveys.
6.1 Instructions
Instruction as to the administration and completion of the survey were provided with each of the
four surveys. The clarity of the instruction was considered so as to ensure the surveys could be
administered and completed with ease, to maximise the consistency in which the data was
collected and to highlight any additional support that may be required.
When asked about the administration instructions for the survey, 97% of participants considered
these to be clear and detailed (Table 13).
Table 13: Clarity of instructions regarding survey administration by participant group15
Yes No
Early childhood educator 99% 1%
Prep teacher 98% 2%
Parent 97% 3%
Child 94% 6%
15 Evaluation survey responses of participants in cohorts 1 and 2, n=390

Outcomes and Indicators Report 72
6.2 Child engagement in the Child Survey
Given the method used to gain the perspective of the child in the CS was a relatively untested
(i.e. self-report on closed ended questions and the use of the administrator), the extent to which
children engaged in the survey was important to gauge. CS administrators were asked to
indicate whether children became fatigued during the survey as well as provide comment.
When asked if any of the child participants lost interest or focus at any stage of the survey or
became fatigued, 81% of CS administrators gave a ‘No’ response. The comments that
participants made in regards to this question included:
A couple [of child participants] found it hard to sit still for 10 minutes without fidgeting or
moving.
Some less able students were easily distracted.
The children had the option of playing with a tactile bead frame while we chatted.
6.3 Difficulties encountered when completing surveys
All respondents to the evaluation surveys as well as the focus group participants were asked
how easy it was to complete the survey and if they encountered any difficulties. The reasons for
asking these questions were two-fold. One reason was to determine the burden of completing
the survey on the four respondents groups as this would impact on the likelihood of them
finishing the survey. The second reason was to assess whether participants experienced
particular difficulties with any questions that could have impacted on their ability to respond to
the survey correctly. The data provided by these questions was examined to inform whether
specific questions needed to be clarified, rephrased or removed to ensure ease and accuracy of
completion.
6.3.1 Survey respondents
Most participants in cohort 1 and 2 stated that the tool was easy to use (see Table 14). Ease of
completion was associated with the survey being straightforward, unambiguous, easy to
understand, and questions that flowed well. One educator participant mentioned that being
familiar with the child and family aided in completion of the survey: ‘Working in a small rural
kinder I feel I know this child and their family reasonably well’.

Outcomes and Indicators Report 73
Table 14: Participant responses to the question: 'Was this survey easy to complete?'
Yes No
Early childhood educator 96% 4%
Prep Teacher 100% 0%
Parent 98% 2%
Administrator of CS 100% 0%
Interestingly, all four groups in cohorts 1 and 2 (i.e. early childhood educators, prep teachers,
parents and child survey administrators) also reported some difficulties completing the survey
(see Table 15). The group that most commonly reported difficulties was the child survey
administrators (19%), with the parent participant group the least likely to report difficulties (6%).
Table 15: Participant responses to the question: ‘Did you encounter any difficulties when
completing this survey?’
Yes No
Early childhood educator 12% 88%
Prep teacher 18% 82%
Parent 6% 94%
Child 19% 81%
Difficulties completing the survey fall into three categories: specificity/ambiguity; elaborating on
responses, and knowledge. Each is discussed below.
Specificity/Ambiguity
A total of seven participants reported that the questions were not specific enough or were
ambiguous. Two prep teachers and two parents reported confusion about some of the questions
because they were not sufficiently specific however, they did not provide detail as to whether
this was in regards to certain questions or the whole survey. Clarification of terms such as ‘Early
Childhood Service’ was also suggested by some parents, with responses indicating that they
were confused when asked about early childhood services as they did not know whether this
referred to kindergarten or prep teachers.
Three early childhood educators reported that questions explicitly regarding relationships with
schools (i.e. Q30) were difficult to answer because relationships with schools varied depending
upon the school. For example, one early childhood educator stated: ‘Some questions could not
be answered simply. They needed more opportunity to clarify e.g. We have good transition

Outcomes and Indicators Report 74
contact with some schools but not all the schools our children go to. Our children can go to 5 to
10 different schools’.
Clarification of terms such as ‘Local Transition Network’ was also suggested by early childhood
educators.
For those completing the CS, issues regarding specificity related to those questions that asked
about ‘friends’ and ‘play’ (Q9, Q10, Q11 & Q20). One participant administering the survey
asked: ‘Children mainly played with children in class. Is this ‘other’ children or was it implying
children in other classes?’ Another stated: ‘[I wasn’t] sure if [in relation to questions about play]
you mean planned, structured play or if you mean all the time’.
One CS administrator stated: ‘Some children hesitated because play-like activities are referred
to as learning not play’.
Asking children what teachers do (Q14) was also identified as causing confusion for some
children as it was reported that very few children were able to articulate that the teacher was
‘there to teach them’. It was suggested that this question could be presented in two parts, i.e.
teacher’s name and what does the teacher do.
Elaborating on responses
Four participants reported they would have liked more space/greater opportunity to elaborate on
their responses and/or provide more information. For example, one early childhood educator
participant stated: ‘the ‘project child’ had additional needs and I would have appreciated space
to qualify some answers.’ One CS administrator noted that child participants were keen to
elaborate upon their responses.
Knowledge
Two parent participants reported that they didn’t have the required information to respond to
some survey questions. For example one parent participant stated: ‘[It’s] frustrating when you
don’t know the answer [to the question], i.e. how much child asks for help at school.’
Some parents (14 responses) felt that they were unable to comment on aspects such as:
similarities between the early childhood service and the school programs (Q39); opportunities to
be involved in planning and deciding things at the school if they wished (Q29); and whether
there was good and clear two-way communication between the staff and parents at the school
(Q31 and Q35).

Outcomes and Indicators Report 75
6.3.2 CALD parents
Much like the general population, the CALD focus group participants varied in their level of
English fluency and literacy. In some circumstances an interpreter was required for the entire
survey. The feedback from these participants was therefore valuable in gauging the extent to
which the surveys could be understood and used by certain CALD groups.
While participants in the CALD focus groups generally agreed the PS asked questions relevant
to their child’s transition, those with poor English fluency or no English struggled most with
understanding reverse order questions. Additional questions that were identified by participants
as difficult to answer are outlined in Table 16.
Table 16: Questions identified as difficult and/or problematic for CALD participants16
Question Difficulty
Q7: My child is making good progress in adapting to the structure and learning environment of school
The wording was unclear. ‘Structure’ and ‘learningenvironment’ were not well understood.
Q24: The school provided information about transition to school in ways suited to us as parents/caregivers
Did not understand this question well. Didn’t understandwhat kind of information they would provide. Simply said that at the end of kindergarten they are toldwhether their child needs to repeat another year of kindergarten.
Q29: I have the opportunity to get involved in planning and deciding things at the school if I wish
Asked what was meant by ‘planning and deciding’.
Q33: The school values our input as parents/caregivers
The word ‘value’ and use of ‘input’ did not translate inthis sense.
6.3.3 Indigenous parents
Indigenous participants also provided feedback in regards to any difficulties encountered when
completing the PS. While these parents did not identify any difficulties with PS questions and
stated the survey was generally easy to complete, they did note that the survey may be easier
to complete if there was more space to comment in order to qualify their responses. This aligns
with the common theme regarding elaboration noted above.
16 Source focus group consultations, n=12

Outcomes and Indicators Report 76
Despite the direct feedback received from the Indigenous participants, project workers
facilitating the focus group noted that they took a relatively long period of time to answer the
questions when compared with other participants, and some looked puzzled and unconfident
when answering some questions. Upon further discussion during the focus group one
participant stated that: ‘Parents in the [Indigenous] community would struggle with the survey
and the whole idea of transition. Some people just don’t understand the importance or the
concept [of school transition].’
It may be that a lack of appreciation and understanding around transition to school among the
Indigenous population results in confusion, not only about specific questions in the PS, but also
in regards to the purpose and completion of the entire survey. As one participant pointed out
‘(Indigenous) families would struggle to complete the survey if not given any support in how
transition works and what transition is’, and that if no support is offered, Indigenous parents
would only make a ‘half-hearted attempt’ to complete the survey.
6.3.4 Parents of children with a disability
Parents of children with a disability generally indicated that the survey was very difficult to
complete. The difficulty encountered by these parents was for a number of reasons:
The survey would not accurately reflect their child’s transition to school as it differed
vastly from transition experienced by children without a disability.
Completing the PS was ‘anxiety producing’ and made many of the parents feel sad.
They elaborated on this saying:
o It could be perceived as judgemental.
o It highlights what their children cannot do.
o It makes parents feel they should know more about their child than they are
actually able to given the disability, in turn reflecting badly on them as parents.
o The survey highlights all the things that they could be offered to make the
transition better for everyone: For example, more visits to the Prep classroom
during kindergarten and better communication between schools, kindergartens
and early intervention services and schools.
In accordance with the survey respondents, parents of children with a disability
highlighted a lack of knowledge as a major barrier to answering many questions. This
was especially problematic and more frequent for parents of children with a disability as

Outcomes and Indicators Report 77
many reported their children were non-verbal therefore their knowledge of the child’s
experiences at school was limited to what they were told by teachers. For example,
many participants indicating questions such as Q1 ‘My child looks forward to going to
school’, Q5 ‘My child tells me that he/she rarely speaks to his/her teachers’ and Q6 ‘My
child shares information about their day at school’ to be problematic to answer.
Similar to the feedback provided by survey respondents and Indigenous parents, a lack
of room to comment/elaborate was specified for many questions. This was due to the
transition experience being so different for children with a disability, rendering many of
the answers irrelevant without further comment.
The survey did not probe around factors specific to the special needs of their child that
would ease the transition to primary school. This included the availability or opportunity
to use specific tools and the school’s understanding of, and ability to cater for, the child’s
needs. For example, use of sign language, provision of a sensory break as well as the
provision and number of teacher’s aides.
Based on the above points the participants collectively suggested a number of improvements
and/or changes that could be made:
The PS could be more focused on strengths.
An additional page of questions specific to the needs of children with a disability be
provided. This page would also include space to comment on the questions included in
the survey that are not specific to children with special needs.
Provide room to elaborate on each of the questions or the option to indicate when a
question is not applicable.
For a list of all the questions parents of children with a disability found problematic refer to
Appendix 25.
6.4 Time taken to complete survey
The time required to complete each of the four surveys was also reported on via the evaluation
surveys. This was considered so as to determine the time burden completing the survey placed
on each of the participants as well as the feasibility of using these surveys in the future.
Outcomes and Indicators Report 78
The majority of general survey participants across all four groups were able to complete the
survey in 10 to 20 minutes. Overall, 90% completed the survey within 20 minutes, while only
8.5% took between 20 to 30 minutes.
Table 17: Time taken to complete the survey17
10-20Minutes
20-30 minutes
30-40 minutes
40-50 minutes
60 +minutes
Early childhood educator 98% 2%
Prep teacher 80% 16% 4%
Parent 89% 10% 0.5% 0.5%
Child 94% 6%
6.5 Implications for accessibility
Instructions
Findings indicate the survey instructions were clear to the majority of the participants and,
therefore, don’t need amendment.
Child engagement in the CS
A large majority of children were reported to remain engaged in the CS during its administration.
The closed-ended questions that comprise the CS, as well as the length of the survey therefore
make the CS an effective method of including the voice of the child. However it is important to
note, fewer than 20 per cent of the children were reported to lose focus or start ‘fidgeting’ when
completing the CS—additional supports could increase the engagement for these children. For
example, one CS administrator reported children were given the option of playing with a tactile
bead frame while the survey was being administered. There are several reasons which may
contribute to this observation, including the length of time required to complete the survey and
the methodology used. Future implementation of the CS should additional tools designed to
authentically capture the child’s voice.
17 Source: Evaluation survey responses of participants in cohorts 1 and 2, n=390

Outcomes and Indicators Report 79
Difficulties
The surveys were reported as easy to complete by almost all participants. Although this
indicates that completing the surveys places minimal burden on respondents, addressing the
difficulties identified by a small number of participant groups may increase the accessibility of
the surveys as well as the accuracy of the responses provided. In order to address the
difficulties reported, the following changes need to be made:
Clarify what the term ‘early childhood service’ means in the PS by providing brief
introductory explanation of the term and/or further explanation of the term where it is
utilised within the ECES questions.
Provide a list of terms and definitions at the beginning of the ECES e.g. ‘local transition
network’.
Rephrase questions that probe around relationships with multiple schools in the ECES,
for example ‘I liaise with MOST local school educators throughout the school year’.
Clarify what is meant by ‘play’ on the CS by providing examples with the questions about
form of play being referred to.
Present Q14 as two distinct questions: ‘What is the teacher’s name?’ and ‘What does
the teacher do?’
Rephrase specific questions on the PS to be more strength-based, such as including ‘to
the best of my knowledge’ at the beginning of the question. This will help to reduce the
frustration parent’s experience when they do not have the knowledge to respond to a
question.
Remove negatively worded questions to enhance the ability of CALD groups to
comprehend and complete the survey.
Further research to determine how to effectively rephrase the questions highlighted as
difficult by CALD groups (as outlined in Table 18).
Given the extent of difficulties and anxiety experienced by parents of children with a disability
when completing the survey, the use of the surveys among this population is again
questionable. While the suggested amendments provided by parents of children with a disability
may work to increase the accessibility of the surveys to these children, they would limit the
ability of the data to be reported in conjunction with that of children without a disability.

Outcomes and Indicators Report 80
Time taken to complete surveys
The average time taken to complete each survey was 10 to 20 minutes. While this is a relatively
non-burdensome length of time for parents who are required to only complete one survey, it
could place a considerable burden on prep teachers and early childhood educators who, in
many cases, completed multiple surveys. For the current trial CRT funding was received to
allow prep teachers sufficient time to complete the surveys. Consideration for future
implementation should be given to strategies that minimise the impact of completing the surveys
on the prep teachers and early childhood educators. While one intended outcome of this trial is
to consider the removal of unnecessary and inaccurate questions, in turn decreasing the time
taken to complete the survey, an additional way to reduce the survey length is by separating the
child centric questions from the questions that probe around school/early childhood centre
transition process. That way questions specific to the children would still require multiple
responses, while questions specific to the school would only require one response.
One option is to include the school focused items in the Mid Year School Supplementary
Census (Section 16: Transition to School). The Census is undertaken each year by Victorian
schools and captures school level data. By including school focused items from the PS, DEECD
could collect school related data for all children in one survey. Individual child focused surveys
would then be completed by the prep teacher for each child. Similarly, a service level survey
could be developed from the ECES for early childhood services.
This has the added benefit of producing data that provides a stronger measure of a successful
transition. That is, currently the data produced by a survey is specific to one child; however
several questions within the survey pertain to the school the child attends. The responses to the
questions that are specific to the school will be the same for all children attending the same
school. Therefore when responses to multiple surveys are combined, the information provided
by the school centred questions is repeated, while the child centric questions offer a unique
response every time. As a result the data specific to how children at the school are transitioning
is filtered or soften by the data provided via the repeated school specific responses based on
the school processes. By separating out the child centric questions from the school centric
questions, we are therefore able to get a stronger measure of successful transition. The same
filtering of data will occur for responses to the ECES as several questions on the ECES are
specific to the centre.

Outcomes and Indicators Report 81
7 Lessons from implementation
Many of the processes involved in the data collection were relatively complex and untested, as
research into measuring the outcomes and indicators of a positive start to school, is new. By
drawing on feedback from those involved in the implementation and administration of the trial
(most commonly teachers and child administrators), the project team sought to understand how
the surveys could best be implemented in the future. Observations and anecdotal evidence
provided by the project team was drawn on to guide the implementation findings. Factors
considered to inform the future implementation of the surveys are:
barriers to participation
the best way to administer surveys within schools
the potential to and value of implementing the surveys twice in one year.
7.1 Early Childhood Educator Survey
As discussed in section 3, the lowest response rate was recorded for the ECES which impacts
dramatically on the ability to provide an ecological measure of a positive transition to school.
Accordingly, a number of barriers to participation were noted.
Table 18: Participant barriers to participation cohort 118
Survey type and reasons Number
ECES not returned 74
PS returned too late to ask prep teacher and early childhood educator to complete 12
Early childhood educator unavailable 16
Did not attend kindergarten19 7
Returned PS without consent form 7
Does not consent 1
No early childhood educator information provided 10
Total 132
18 Source: project team observations and conversations with principals, prep teachers, directors and early educators.
19 Source: parent consent form

Outcomes and Indicators Report 82
The methodology drawn on to engage respondents in the trial relied on a cascade of consent
that resulted in logistical barriers to the participation of early childhood educators. That is,
consent (which included providing information about the child’s early childhood education) was
required from parents before teachers, children, and early childhood educators could be invited
to participate. Inviting early childhood educators to participate was therefore dependant on
receiving completed consent forms from parents.
The barriers associated with this method of engaging participants were two-fold. Firstly, a
proportion of consent forms from parents were received late in the trialling phase. This allowed
for little time to provide early childhood educators with a survey, let alone sufficient time for
educators to complete and return the surveys. Secondly, in many cases parents failed to
provide adequate, accurate, or in some cases, any information about the child’s early childhood
education. This limited the project team’s ability to locate, contact and in turn invite early
childhood educators to participate in the trial. While follow-up requests were made to the school
to provide the early childhood service details of children whose parents had provided consent
(but not the education details), this information again came too late to administer and return the
ECES. An associated complication was if the director of the early childhood service was
delayed in providing their consent for the centre to participate.
Despite being provided with sufficient information in a timely manner, locating and contacting
early childhood educators was further problematic in 16 instances. For example, some early
childhood educators were on extended leave or no longer working at the centre specified by the
parent. Additional efforts by the project team to trace educators that had moved centres were
unsuccessful. Similarly, in the weeks following the roll out of the ECES several attempts were
made to boost the ECES response rate by following up on the surveys that had not been
returned. Despite this, a further 74 ECES surveys were not returned by the close of trial.
Feedback provided directly to the project team provided further insight into the barriers to
participation for early childhood educators. These barriers included:
lack of staff/time
could not recall child
could not distinguish child from another child based on the initials provided
surveys not received/did not check mail
surveys misplaced
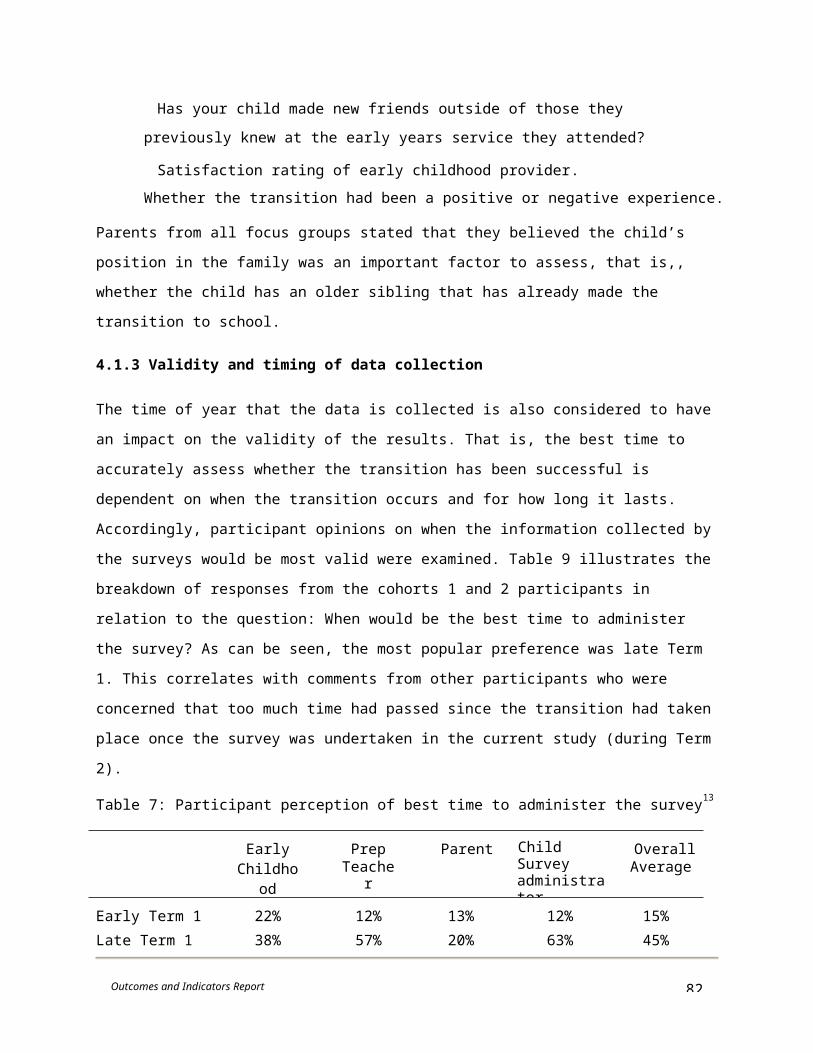
Outcomes and Indicators Report 83
timing of data collection was impractical e.g. late in term when educators are already
under pressure to complete other task by holidays
miscommunication between staff e.g. staff member did inform colleagues of project or
pass on surveys to specified educator.
An enabler to participation noted by the project team was communication with potential ECES
respondents in late Term 4, prior to the roll out of the trial. That is, early childhood services were
identified by principals at participating schools as services that children at the school had
commonly transitioned from in the past. The project team then contacted the service to alert
them to the trial and, if selected, what their participation would require. This allowed for early
childhood services to make known potential barriers to participation e.g. a lack of staff/resources
or if an educators was moving on to another service. Discussing the trial prior to the roll out of
the ECES also allowed centres to prepare for the time and administration required to complete
the surveys e.g. check the mail regularly as well as make requests for copies of parent consent.
7.2 Prep Teacher Survey
Although, a relatively high response rate was recorded for the PTS, prep teachers also reported
barriers to participation. Capacity and resources available was a major issue at both the school
and teacher level. For example, one school had newly amalgamated with four other schools,
had in excess of 20 new teachers and did not have the capacity to undertake research at their
school in 2011.Successful application of CRT funding at the end of Term 1 allowed schools that
were keen to be involved to participate, however the capacity of the prep teacher then became
a barrier to participation. Factors impacting on the capacity of teachers to be involved included if
the teacher was a new graduate or their normal teaching workload did not allow time to
incorporate the tasks associated with this project.
Furthermore, despite the support participating schools received through CRT funding, school
report writing conflicted with the roll out (timing) of the PTS in the current trial. That is, many
teachers said it was difficult to juggle their workload as well as find the time to complete the
surveys at a time when school reports are due. Although, the majority of teachers received the
PTS earlier in Term 2, this conflict became a particular barrier when completing the PTS for the
children whose participation was not secured (via parent consent) until late in the term. The time
of year during which the data is collected, therefore, impacts on teacher’s ability to complete the
survey.

Outcomes and Indicators Report 84
The project team also noted that communication with and between schools hindered the smooth
roll out of the PTS in schools. For example, despite securing consent from principals as well as
attempts to discuss the trial directly with participating teachers, once the PTS was rolled out
several teachers indicated they had not been informed of the trial and therefore were unaware
of what their participation in the trial required. While the support from the project team quickly
clarified any confusion, such instances highlighted communication with and within schools
created challenges when rolling out the PTS in schools.
7.3 Parent Survey
While the contact details of the project team were made available to parents invited to
participate, the project team did not speak directly to these parents, nor were parents provided
with an opportunity to advise on the barriers to participation specific to them. Prep teachers did,
however, observe some challenges to gaining the participation of parents. Anecdotal feedback
given from many prep teachers (who had the task of handing out the Parent Pack and recruiting
parents to the project) suggested that parents are ‘time poor’ and did not see the survey as a
priority, mainly because the survey provided no direct benefit to their child. One particular
teacher commented: “The school faces challenges in receiving consent forms from parents for
‘vital’ programs, e.g. consent forms for children to receive free fruit and lunches, let alone for
things the parent sees as an extra task for them to complete with no benefit.”
Further feedback indicates some parent’s literacy levels also contributed to a lack of parent
responses as did the capacity of schools to assist in organising supports (e.g. KESO or
interpreting services) for parents completing the survey.
7.4 Child Survey
In addition to securing consent for each child to participate in the trial, barriers to completing the
CS were noted for children who did have consent. For example, teachers indicated some
children were absent due to illness, on holiday, attending sports carnivals or on school
excursions when the CS was scheduled to be completed. This became particularly problematic
when consent for a particular child was received late in the term leaving little opportunity to
administer the CS at a busy time of year.

Outcomes and Indicators Report 85
7.5 Suggestions for implementation
As outlined in the methodology section of this report, the process for engaging participants in
the pilot was inherently complicated. While the project team provided support via email and
telephone, the success of the pilot to engage participants and collect sufficient and accurate
data was highly dependent on the staff at schools. Prep teachers were therefore asked ‘If this
survey were to be implemented at your school in the future, how would this best occur?’ as well
as ‘Who would/should coordinate the data collection and how?’
A variety of responses were received as to what the best process of implementation would be.
Principals and vice principals were nominated as possible people to oversee the process.
Having the surveys returned to classroom teachers was noted as a way to know which families
have not responded, thereby making it easier for teachers to follow up. Utilising paid evaluators
or releasing classroom teachers from other duties in order to complete the survey were provided
as suggested processes to follow. Three prep teachers in cohort 1 further suggested that the
implementation process should be online to make it more streamlined and efficient.
When asked who should coordinate the data collection, the two most common suggestions
were prep teacher (12 responses), closely followed by the person in charge of the transition
program (9 responses).
Given, the CS required an administrator to complete, the opinion of the administrators as to who
would be the best person to administer the child survey was also requested. A neutral person
known to the child, such as a well-known relief teacher or specialist teacher at the school,
transition coordinator, assistant principal or the class teacher were all suggested.
Lastly, focus group participants were asked what the most effective way to implement the PTS
would be. While few suggestions were provided, the Indigenous parent focus group agreed that
the most effective way to implement the survey was in a conversational format, as one
participant described: “Talked [it] through with the parent during the first term parent interview.”
Two participants stated that the response rate would be significantly higher from parents if the
parents were supported to complete the survey by a staff member at the school, e.g. during a
parent teacher interview.

Outcomes and Indicators Report 86
7.6 Timing of data collection
The possibility of measuring the transition twice, and thereby tracking the outcomes of transition
over time, was considered but not supported for this trial. The Expert Reference Group did not
support dual measurement in one year on the grounds of feasibility. Additionally, administration
of the survey again later in the year was not considered to be an accurate reflection of
transition. However, the idea was tested through the inclusion of a question in the evaluation
survey probing the value and feasibility of administering the survey more than once. Responses
indicated the majority of the focus group participants believed that the survey should only be
administered once (Table 19). Participants of cohorts 1 and 2 cited a range of reasons why the
survey should not be administered more than once, including time constraints and the heavy
workloads of teachers. A prep teacher noted the difficulty of getting some parents to complete
the survey once, let alone asking them to complete it more often.
Table 19: Administering the surveys more than once20
Yes No
Early childhood educator 17% 83%
Prep teacher 12% 88%
Parent 28% 72%
Child 31% 69%
7.7 Implications of the lessons from implementation
The implementation lessons learnt from trialling the four newly developed tools have a number
of implications for a future data collection strategy measuring the outcomes a positive start to
school.
Early Childhood Educator Survey
Given the low number of responses to the ECES as well as the barriers to participation
observed, additional support is required in order to engage early childhood educators in the data
collection.
20 Source: evaluation survey responses of participants in cohorts 1 and 2, n=363

Outcomes and Indicators Report 87
Accessing early childhood educators presented as a major barrier to gaining their participation.
For example, the methodology for inviting early childhood educators in the current trial relied on
information about their contact details being provided by parents via a consent form. However,
despite providing consent, many parents failed to provide the details of the early childhood
service. Getting consent from parents and then attaining the details of the early childhood
service from schools may work to overcome such a barrier. Furthermore, the method of making
a phone call late in Term 4 to discuss the trial with early childhood educators worked to engage
a number of educators in the survey, future implementation of the data collection would be
supported by adopting a similar communication process.
The time of year during which the ECES is rolled out seems to have a considerable impact on
the educator’s ability to complete the survey. Feedback provided by the evaluation survey
respondents, as well as anecdotal evidence noted by the project team during the administration
of the surveys, suggests data collection of the ECES should occur as close as possible to when
the transition occurs. Given the ECES does not require educators to complete the survey after
the transition has been completed, an option may be for early childhood educators to complete
the ECES when the transition statement exchange occurs. This would allow educators to
complete the ECES during a time when they have a clearer picture of the child’s transition
experience in mind as well as the added benefit of overcoming barriers such as the impractical
timing noted for the current trial.
Lastly, consideration should be given to administering the survey online. This would address the
issues of misplaced surveys, minimise paper work associated with participation (e.g. returning
the surveys) and overcome the barrier of not checking/receiving mail. An additional benefit of
such an approach would be an earlier return of ECES and ease the process of data collation
and analysis.
Prep Teacher Survey
Despite the relatively high response rate to the PTS, a number of changes can be made to
support the future implementation of the PTS. An enabler of school and prep teacher
participation was provision of CRT funding by the DEECD to allow prep teachers adequate time
release.
According to the advice provided by participants, the principal or vice-principal should oversee
the process of implementing the PTS in future rollouts, with prep teachers or the Transition
Leaders within the school coordinating the process of data collection in each participating class.

Outcomes and Indicators Report 88
Establishing clear lines of responsibility overcomes the communication barrier noted by several
teachers in the current trial. Like early childhood educators, timing of data collection was a
problem for many prep teachers. Future PTS implementation should avoid periods of high work
load such as report writing time.
Parent Survey
Changes to support a more successful rollout of the PS in the future include parents returning
the PS to schools rather than back to the research team enabling teachers to more readily
monitor parent participation and determine who may require additional support. For CALD
families and parents with low literacy levels, additional support (interpreter service, verbal
participation in favour of written participation) may be made required to facilitate parent
participation. In order to successfully engage Indigenous families in the PS a more culturally
appropriate form of invitation and administration is required, for instance, story telling or a more
conversational format.
Child Survey
Anecdotal feedback from teachers and coordinators of the survey rollout in schools, suggested
providing more time for parents to return consent forms and for the CS to be administered. This
would allow children who may absent to participate, thereby increasing the number of surveys
completed. As recommended by CS administrators, a neutral adult known to the child such as a
relief or specialist teacher, assistant principal or another teacher should administer the CS.

Outcomes and Indicators Report 89
8 Use of data collected
Data collected on the perceived value of the information provided in the survey, was drawn on to
inform validity. Similarly, information gathered was used to examine how survey information
could be used to most effectively support parents and teachers to maximise a positive transition.
8.1 Participant feedback
Overwhelmingly parents could see the value of this information in assisting with transition
programs. Much of the focus was on improving transition programs for the futurein accordance
with the survey findings, as well as checking that ‘current practices are at their optimum’ and in
doing so gaining a better understanding of ‘how children really cope [with school transition]’.
Similar to the parents, prep teachers could see the data collected as useful in driving
improvement in transition programs from an evidence informed perspective. In relation to local
planning, these teachers noted that the information could be used to improve communication
and relationships between early childhood organisations and schools about best processes for
transitioning children. One teacher suggested that using these tools across a region could lead
to more collaborative practice and transition outcomes.
In terms of professional practice, prep teachers noted the value of the survey for adjusting
programs to ensure a smoother transition to school for parents and children. A number of prep
teachers also noted that the survey data could be used to plan for the following year from a
more informed perspective and coordinate this process with preschools.
Amongst the focus group participants who were also asked how the information could best be
used, one participant from the Indigenous parent focus group stated the information should be
collated and developed locally so: “Koori teachers have an understanding of where the child is
at.” The data may provide evidence as to how many children are attending or have attended
kindergarten, how it affects the transition to school and what the children liked/gained from
attending kindergarten. This would allow the benefits of kindergarten to be promoted throughout
the Indigenous community and encourage participation.

Outcomes and Indicators Report 90
8.2 Implications
The importance of clear communication about the purpose of data collection is seen as a critical
implication to the way the final tool could be designed and the information used. That is, the trial
tools were developed to measure the outcomes of a positive start to school and most relevant to
the school at a local level. Participants intimated that the survey could also be of value as an
individual child assessment. Any implementation of the four surveys in the future needs to be
accompanied with a clear message of the purpose of data collected and its intended use.

Outcomes and Indicators Report 91
9 Conclusion and recommendations
This project successfully developed and trialled tools to measure transition to school outcomes
from the perspective of parents, early childhood educators, school teachers and children. It was
both ambitious and ground breaking. The findings establish aspects of validity and reliability of
the tools and the extent to which the tools were inclusive and easily completed by respondents.
Specifically, the findings indicate that:
The surveys comprehensively measured the transition experience.
The surveys appear to be accurate and reliable measures of the transition experience,
with the exception of the CS which, despite its validity, requires further work to determine
the reliability.
Respondents perceive the information collected by the surveys to be useful.
These findings provide support for the use of the ECES, PTS and PS as appropriate and
accurate measures of a positive transition to school and provide insight to inform improvements
to the tools. Additionally, the results provide insights that will support future implementation of
the tools. Together, these findings point to important considerations for the ongoing
development of these tools.
Recommendation 1: Modify the four outcome measurement tools
When considered individually, all of the surveys were found to have statistical merit for
collecting data against the outcomes. Despite some difficulties, the surveys were found to be
applicable and inclusive of all children and did not place undue burden on those who
participated. Considerations from the findings to refine the four tools are outlined below, in order
to:
increase validity and reliability
improve the accessibility of the tools to all participant groups
increase inclusivity
increase ease of completion by respondents.
Early Childhood Educator Survey
The ECES appears to include appropriate measures of the transition experience and
respondents perceived the information collected by the surveys to be useful. The most

Outcomes and Indicators Report 92
significant issue for the ECES related to participation levels and this is addressed in section
Error! Reference source not found.. The following specific changes to the survey items are
ecommended:
Separate the ECE-centred questions from the child-centric questions and create a
service level survey to collect data common to all children.
Remove the negatively posed questions.
Remove the questions based on the findings of the analysis of internal consistency.
Develop new questions to measure outcome 7.
Revise wording of some questions based on feedback from participants.
Add spaces after some questions to allow explanations for children with a disability.
Addition of question related to whether a transition statement was provided for the child.
See Appendix 26 for the recommended ECES.
Prep Teacher Survey
The findings suggest a number of changes to the PTS will improve the statistical validity and
accessibility of the survey. One change includes separating the school-focused questions from
the child-centric questions. The school-focused questions (listed in Appendix 27), common to all
children in a prep cohort, should be considered for inclusion in the Mid Year School
Supplementary Census (Section 16: Transition to School). This would develop a stronger
measure of what a successful transition looks like as the repeated information provided by the
school-centric questions (responses will the same for every child at that school) will no longer
dilute the information provided by the child-centric questions (unique response for every child).
The following additional changes to the survey items are recommended:
Remove the negatively posed questions.
Remove the questions based on the findings of the analysis of internal consistency.
Revise wording of some questions based on feedback from participants.
Add spaces after some questions to allow explanations for children with a disability.
Addition of question related to transition statement available for the child.
See Appendix 28 for the recommended PTS.

Outcomes and Indicators Report 93
Parent Survey
Parents agree that it is important to measure transition to school outcomes and, their
engagement in the survey was very high. However, the findings suggest that some of the
concepts in the PS were unclear to them. It is apparent that rephrasing some questions will
increase parent understanding. The following specific changes to the survey items are
recommended:
Remove the negatively posed questions.
Remove the questions based on the findings of the analysis of internal consistency.
Revise wording of some questions based on feedback from participants.
Develop new questions to measure outcome 5.
Add spaces after some questions to allow explanations for children with a disability.
Include questions related to transition statements.
See Appendix 29 for the recommended PS. Prior to finalisation it will be important to give
additional consideration to understanding how the survey can work better for Indigenous
families. Specific consultation with the Wannik Unit of the DEECD will assist this process.
Child Survey
The project team initially noted the limitations of conducting a quantitative survey for capturing
the experience of children. The findings showed that this was indeed a challenge however they
also showed that many aspects of the survey worked well. The qualitative findings further
suggested that children were eager to participate in the research and wanted to provide
additional information in response to the questions. Given the importance of the child’s
experience of the transition to school, and the role this knowledge has for informing
improvements (Dockett et al. 2011), there is value in striving for ways that the child’s voice can
be captured. On that basis we recommend the following changes to the Child Survey:
Change the items from categorical to ordinal responses.
Remove the negatively posed questions.
Inclusion of spaces for children to make additional comments.
Change the wording of some questions.
Inclusion of additional questions.
See Appendix 30 for the recommended CS.

Outcomes and Indicators Report 94
Recommendation 2: Trial the modified tools
Once modified, the four tools will require further testing in order to understand how well they
operate. Specifically, it is important that the psychometric properties of validity and reliability of
the four modified tools are established. This will provide further support for the accuracy and
generalizability of the four tools as measures of a positive transition to school, in turn endorsing
the use of the data yielded by the four tools.
Specific analyses recommended include:
Recalculation of Cronbach’s alpha to inform internal consistency of the modified tools.
Across survey comparisons by outcome to determine whether there is a reliable pattern
of responding to questions mapped to an outcome across the four respondent groups.
Recommendation 3: Refine implementation
The findings point to a number of important considerations to support successful administration
and completion of future data collections. In particular, it is essential that the process is both
feasible and does not place undue burden on participants. Recommended refinements to the
implementation process include:
Conduct the ECES as early in the year as possible with the other data collections
occurring around the end of Term 1 and the start of Term 2.
Provide online versions of the surveys as an alternative to hard copies to increase the
ease of completion by respondents.
Provide support for CALD families and families with low literacy to assist them to
understand and complete the PS.
Develop a more culturally appropriate form of invitation and administration to
successfully engage Indigenous families.
Consider redesigning the methodology to capture children’s views/voices. This may
involve using multiple strategies and tools such as observation of children’s play,
conversational narratives, simplified surveys, stories or photos to prompt discussion.
An important question to be answered for future implementation relates to how the tools can
be administered by schools in the future and how the data can be used to improve transition
to school programming at a local level.

Outcomes and Indicators Report 95
Recommendation 4: Test the utility of the data
Understanding how to measure the outcomes and indicators of a positive transition to school
has been the focus of the current project. However, successful indicators need to be more than
technically sound: they need to produce data that is useful for the end user. It is therefore
recommended that data collected in a trial of the revised tools, be provided to participating
schools in a format and timeframe that supports schools to make adjustments (if needed) to
orientation processes for children beginning school the following year. Monitoring this process
and an evaluation of the utility of the data will help the ongoing tool development process.
Recommendation 5: Disseminate the research findings
This project reports on world first research; that is: it provides the first evidence to support an
understanding of how to measure the outcomes and indicators of a positive transition to school.
Although the survey tools to measure these outcomes will be improved in the next trial, the
project is, nonetheless, an important piece of work from a policy perspective and from a
research perspective. Transition to school is of interest and importance to a range of audiences
nationally and internationally, including academics, policy makers, educators, and parents. The
following strategies for disseminating the results to these audiences are recommended:
Provide a summary report to study participants.
Make the summary report available to early childhood and school sectors via the
DEECD website.
Present the research at academic and practitioner conferences.
Seek to publish the research in peer-reviewed journals, with international reach.

Outcomes and Indicators Report 96
References
Ackerman, DJ & Barnett, WS 2005, Prepared for kindergartens: what does “readiness” mean?
National Institute for early Education Research, New Brunswick, NV. viewed
ht t p : / / sd e. s t a t e. o k . u s / P r o g r am s / ECE d u c / p d f/ KR e a di n e ss . p d f
Ashton, J Woodrow, C Johnston, C Wangmann, J & Singh, L 2008, ‘Partnerships in learning:
linking early childhood services, families and schools for optimal development’,
Australian Journal of Early Childhood vol.33, no.2, pp.10-16.
Bagnato, SJ 2007, Authentic assessment for early childhood intervention: best practices,
Guilford Press, New York.
Barker, J. & Weller, S. 2003 “Is it fun?” Developing children centred research methods.
International journal of Sociology and Social Policy, 23 (1/2) 33-58.
Bowman, 1999 cited in la Paro, Pianta & Cox, 2000; La Paro, K Pianta, R & Cox, M 2000,
‘Kindergarten teachers' reported use of kindergarten to first grade transition practices’
The Elementary School Journal, vol.101, no.1, pp.63-78.
Centre for Community Child Health (2008). ‘Rethinking school readiness’. CCCH Policy Brief
No. 10. Parkville, Victoria: Centre for Community Child Health, The Royal Children’s
Hospital. htt p:// www.r ch.org . au/ emplibrar y/ ccch/PB10_SchoolReadiness. pdf
Centre for Equity and Innovation in Early Childhood 2008, Transition: A Positive Start to School:
Literature Review, The University of Melbourne Centre for Equity and Innovation in Early
Childhood, Melbourne.
Clark, 2005. Listening to and involving young children: a review of research and practice. Early
Childhood Development and Care, 175 (6) 489-505.
Cohen, J 1988, Statistical power analysis for the behavioural sciences (2nd ed.), Academic
Press, New York.
Cohen, J 1992, A power primer. Psychological Bulletin, vol.112, no.1, pp. 155-159.

Outcomes and Indicators Report 97
Department of Education and Early Childhood Development 2008, Blueprint for Education and
Early Childhood Development, Department of Education and Early Childhood
Development, Victoria.
Department of Education and Early Childhood Development 2009, Transition: A Positive Start to
School, Department of Education and Early Childhood Development, Victoria.
Department of Education and Early Childhood Development 2009, Victorian Early Years
Learning and Development Framework: A Draft for Trial and Validation, Department of
Education and Early Childhood Development, Victoria.
Department of Education, Training and Employment, 2000, REFLECT: Reflect and evaluate for
learning: an early childhood tool, University of South Australia, Adelaide.
Dluhy, M., & Swartz, N 2006. Connecting knowledge and policy: The promise of community
indicators in the United States. Social Indicators Research, 79(1), 1-23.
Dockett, S & Perry, B 2001, ‘Starting school: effective transitions’, Early Childhood Research
and Practice, Vol.3, No.2, Fall, h tt p : // e c r p.u i u c . e d u/ v 3 n 2/do c k e t t. h tm l
Dockett, S. &Perry, B. 2005, Researching with children: insights from the Starting School
Research Project. Early Childhood Development and Care, 175(6) 507-521.
Dockett, S & Perry, B 2005, ‘You Need to Know How to Play Safe: Children’s Experiences of
Starting School’ Contemporary Issues in Early Childhood, vol.6, no.1 pp.4-18.
Dockett, S & Perry, B 2006, Our Family is Starting School, Pademelon Press, Baulkman Hills.
Einarsdottir, J. 2007 Research with children: methodological and ethical challenges. European
Early Childhood Education Research Journal, 15 (2) 197-211.
Field, A 2009, Discovering Statistics Using SPSS (3rd ed.). Sage, London.
Gliem, J A & Gliem, R R 2003. Calculating, Interpreting, and Reporting Cronbach’s Alpha
Reliability Coefficient for Likert-Type Scales. Midwest Research-to-Practice Conference
in Adult, Continuing, and Community Education, retrieved from
ht t p : / / h dl . h a n dl e.n e t/ 1 8 0 5/344

Outcomes and Indicators Report 98
Holden, M. (2009). Community interests and indicator system success. Social Indicators
Research, 92: 429 – 448.
Kagan, SL. and Rigby, DE. (2003). Improving the Readiness of Children for School:
Recommendations for State Policy. Washington, DC: Centre for the Study of Social
Policy.
Kagan, SL & Kauerz, K 2007, ‘Reaching for the whole: Integration and alignment in early
education policy’ in R Pianta, MCox, & K Snow (eds), School readiness and the
transition to kindergarten in the era of accountability, Paul H Brookes Publishing Co,
Baltimore, USA.
Kreider, H 2002, Getting parents “ready” for kindergarten: the role of early childhood education,
Harvard Graduate School of Education, Cambridge, MA.
Maley, CR & Bond, TG 2007, Measuring up for big school: a role for cognitive development,
AARE 2007, International Education Research Conference Papers Collection,
Fremantle.
Margetts, K 2002, ‘Transition to school- complexity and diversity’, European Early Childhood
Education Research Journal, vol.10, no.2, pp.103-114.
Margetts, K 2007, ‘Preparing Children for School- benefits and privileges’, Australian Journal of
Early Childhood, vol.32, no.2, pp.43-50.
Nolan, A. Hamm, C. McCartin, J & Hunt, J 2009, ‘Outcomes & Indicators of a Positive Start to
School’ Final project report prepared for the Victorian Department of Education and
Early Childhood Development, Victoria University, Australia.
Oberklaid, F 2005, ‘School readiness’, Community Paediatric Review Vol,14, No.3, pp. 1-3,
September, Centre for Community Health, Royal Children’s Hospital, Melbourne.
Pianta, RC & Cox, MJ 2002, Transition to Kindergarten, Early Childhood Research and Policy
Briefs 2, vol.2 Winter, 1-4,National Centre for Early Development and Learning,
University of North Carolina, Chapel Hill, accessed from
ww w . f p g . u n c . e d u/N CE D L/P D Fs / T r a n sF a c . p d f

Outcomes and Indicators Report 99
Rhode Island KIDS COUNT (2005). Getting Ready: Findings from the National School
Readiness Indicators Initiative - A 17 State Partnership. Providence, Rhode Island:
Rhode Island KIDS COUNT.
Rogoff, B. 2003. The cultural nature of child development. New York: Oxford, as cited in
in Dockett, S Perry, B & Kearney, E 2010, School readiness: what does it mean
for Indigenous children, families, schools and communities? vol. 2, Closing the
Gap Clearinghouse, accessed from
ht t p : / / ww w . b i n g . c o m/ se a r ch ? q =R o g o ff + %28 i n+ D oc k e t t %2 C +P e rr y + % 2 6 + K e a r n e y +2010
%29. &sr c=I E- SearchBox&adlt =str ict
Rous, BS & Hallam, RA 2006, Tools for transition in early childhood: a step-by-step guide for
agencies, teachers & families, Paul H Brookes Publishing, Baltimore.
Sanagavarapu, P 2010, ‘Children’s Transition to school: voices of Bangladeshi parents in
Sydney’, Australia, Australasian Journal of Early Childhood, vol.35, no. 4.
Sauvau, 1998 cited in Yeboah, 2002 (need correct reference)
Seefeldt, C & Wasik, BA 2006, Early education: three-, four-, and five-year-olds go to school,
Merrill-Prentice Hall, Upper Saddle River, NJ.
Smart, D Sanson, A Baxter, J Edwards, B & Hayes, A 2008, Home to School Transitions for
Financially Disadvantaged Children: Final Report, Accessed from
ht t p : / / ww w .t h e s m i t h f ami l y . com . a u / w e b d a t a/ r es o u r ces / f il es/H o m e t o S ch o o l _ F u llR e p or t W
EB . p d f
Snow, KL 2006, ‘Measuring school readiness: Conceptual and practical considerations’, Early
Education & Development, vol.17, no.1 pp.7-41.
Sylva, K Melhuish, E Sammons, P Siraj-Blatchford I & Taggart, B 2004, ‘The effective provision
of pre-school education (EPPE) project’, Findings from pre-school to end of Key Stage 1,
Institute of Education, University of London and University of Oxford, Birkbeck,
University of London – University of Nottingham, viewed
ht t p : / / ww w . d o t w a i d e ce n t r e. or g . a u / p d f/ EPPE . p d f

Outcomes and Indicators Report 10
Tabachnick, B. & Fidell, L. 2007, Multivariate Statistics, Pearson / Allyn & Bacon, Boston.
Thomasson, H 2010, Primary school practices in relation to children’s transition to school,
Masters Research Thesis, Education The University of Melbourne.