Outcome Based Management - Department of Treasury WA · Cabinet and the Office of the Auditor...
38
Guidelines for use in the Western Australian Public Sector NOVEMBER 2004 Outcome Based Management Department of Treasury and Finance Government of Western Australia
Transcript of Outcome Based Management - Department of Treasury WA · Cabinet and the Office of the Auditor...

Guidel ines for use in the Western Austral ian Publ ic Sector
NOVEMBER 2004
Outcome BasedManagement
Department of Treasury and FinanceGovernment of Western Australia

Department of Treasury and Finance197 St Georges TerracePerth WA 6000
Website Address: www.dtf.wa.gov.auThis publication is available in electronic format from this website.
ISBN 0730 7 45317

Outcome BasedManagement
Department of Treasury and FinanceGovernment of Western Australia
Guidel ines for use in the Western Austral ian Publ ic Sector
NOVEMBER 2004

Page i
Government agencies exist to achieve desired
outcomes for the community. Recognising that
they provide services for this purpose, Western
Australia’s performance management framework
has been retitled ‘Outcome Based Management’
(OBM).
OBM retains the acronym and most of the
elements of the previous framework, but its
emphasis is more forward looking – it focuses on
why things are done not just what is done, and
facilitates managing for results.
OBM dovetails with Better Planning: Better
Services – A Strategic Planning Framework for the
Western Australian Public Sector, which
articulates government’s goals and strategic
outcomes.
The changes to OBM will be seamless for
reporting the performance of government
agencies – annual reports will still report (and have
audited) key performance indicators (KPIs) for
each desired outcome and the services delivered
by agencies. Budget papers will continue to
report outcomes and key effectiveness indicators,
but outputs are now referred to more broadly as
services and key efficiency indicators will replace
output measures. The result – annual reports and
budget papers will be aligned for the first time.
The emphasis on managing for results and the
alignment between plans in the budget papers
and results in annual reports should help agencies
streamline their management and monitoring
practices and synchronise internal and external
reporting. This will lead to improved efficiency,
more effective service delivery and ultimately
better results for the community.
David Smith
ACTING UNDER TREASURER
Outcome Based Management
FOREWORD

Page ii
1. Introduction ......................................................................................................................................1
About These Guidelines......................................................................................................................1
Elements of OBM ...............................................................................................................................1
The OBM Process ..............................................................................................................................1
OBM and Management Approaches ..................................................................................................2
2. Developing Desired Outcomes and Services .................................................................................3
Outcomes ..........................................................................................................................................3
Services..............................................................................................................................................5
Outcome Structure Review Group......................................................................................................7
3. Developing Performance Indicators................................................................................................8
Characteristics of Good KPIs..............................................................................................................8
Process of Developing Indicators........................................................................................................9
Internal Management........................................................................................................................12
Presenting Indicators ........................................................................................................................12
Examples of Outcomes, Services, and KPIs .....................................................................................15
4. Performance Monitoring and Reporting .......................................................................................20
Benefits of Performance Monitoring and Reporting ..........................................................................20
Reporting .........................................................................................................................................20
Benchmarking ..................................................................................................................................21
5. OBM and the Budget .....................................................................................................................22
OBM and Budget Formulation..........................................................................................................22
OBM and Budget Presentation.........................................................................................................23
Appendix 1: Further Assistance .........................................................................................................26
Department of Treasury and Finance ................................................................................................26
Department of the Premier and Cabinet ...........................................................................................26
Office of the Auditor General ............................................................................................................26
Appendix 2: Further Reading..............................................................................................................27
Appendix 3: Background to OBM ......................................................................................................28
Historical Background ......................................................................................................................28
OBM Stakeholders ...........................................................................................................................28
Using OBM Generated Information...................................................................................................28
Appendix 4: Glossary ..........................................................................................................................29
Outcome Based Management
CONTENTS

Page iii
List of Tables
Table 1: Outcome Checklist.....................................................................................................................4
Table 2: Service Specification Checklist ...................................................................................................6
Table 3: Comparison of Unit Cost Efficiency and Productivity Efficiency.................................................11
Table 4: Indices – Gross Unit Cost Index ...............................................................................................13
Table 5: Cost of Registration Services ...................................................................................................13
Table 6: Key Performance Indicator Checklist ........................................................................................14
Table 7: Performance Targets Checklist .................................................................................................23
Table 8: Relationship to Government Goals ...........................................................................................23
List of Figures
Figure 1: The OBM Cycle ........................................................................................................................2
Figure 2: The OBM Process ....................................................................................................................2
Figure 3: Performance Management Hierarchy ........................................................................................3
Figure 4: Performance Management Hierarchy Example..........................................................................3
Figure 5: Control Versus Results..............................................................................................................5
Figure 6: Line Graph Examples..............................................................................................................12
Figure 7: Bar Graph Example ................................................................................................................12
Figure 8: Agency Planning within the OBM Framework .........................................................................25
Outcome Based Management

1 INTRODUCTION
Page 1
About These GuidelinesWestern Australia’s performance management
framework, referred to as Outcome Based
Management (OBM), facilitates the monitoring of
progress towards achievement of outcomes
through the delivery of services.
These guidelines reflect the results of an extensive
departmental review of OBM and incorporate
feedback from a range of key stakeholders
including other jurisdictions in Australia and
overseas, Members of Parliament and public
sector agencies, including those represented on
the Financial Reform Consultative Committee1, in
particular the Department of the Premier and
Cabinet and the Office of the Auditor General.
Chapter 1 explains what OBM is all about and to
whom it is relevant. It defines the elements of
OBM (outcomes, services and indicators).
Readers should go to Chapters 2 and 3 for details
on how to develop these individual elements.
Chapter 4 discusses the means by which
monitoring and reporting is undertaken. Chapter 5
outlines OBM’s relationship to the budget process
including the costing of services.
Further guidance and information may be
obtained by contacting the Financial Policy
Division on 9222 9358 or by viewing the list of
publications at Appendix 2.
Elements of OBM
Outcomes
Outcomes are defined as the effects, impacts,
results on or consequences for the
community/target clients of services delivered by
agencies.
All outcomes in the Western Australian Public
Sector are expressed as government desired
outcomes, which can be either strategic or
agency level. As part of the policy development
process, government identifies the broader
strategic outcomes that contribute to its higher
level goals. These strategic outcomes are high
level, long term, and often qualitative in nature.
In order to give effect to the government’s goals
and strategic outcomes, agency level government
desired outcomes should be developed. Agency
level outcomes are pitched at a level more
relevant to agencies and are required to link to
government goals. They are intended to either
bring about behavioural change or satisfy a
community or client need.
Services
Services are the activities and goods that agencies
deliver to external users in order to achieve
outcomes. They can be in the nature of outputs or
programs. The external reporting of services
should be at a level that conveys meaningful
understanding of an agency’s performance. It
should not be at a level so high as to obscure the
agency’s service delivery, or so low as to result in
very detailed listing of all activities and tasks.
Key Performance Indicators
Relevant and useful key performance indicators
(KPIs) provide an overview of the critical or
material aspects of outcome achievement (in
terms of effectiveness) and service delivery (in
terms of efficiency).
The OBM ProcessFigure 1 illustrates the cyclical nature of OBM.
Having developed their strategic and operational
plans, agencies should develop performance
targets each year. The effectiveness and efficiency
of services are monitored as they are delivered,
which feeds into further planning.
Outcome Based Management
1 The Financial Reform Consultative Committee is chaired by the Department of Treasury and Finance and hasrepresentation from 22 public sector agencies.

Page 2
Figure 1 is expanded on by Figure 2, which
provides an overview of the OBM process. The
starting point is the government’s strategic
planning framework, which provides guidance on
strategic planning at agency level.
Agency planning generates OBM elements. The
first of these is agency level government desired
outcomes, which the agency’s Minister confirms
on behalf of government. At this stage agencies
also determine which services would contribute to
the achievement of the desired outcomes, and
KPIs to assess how well they are doing.
Development of targets for KPIs informs and
underpins the budget process – i.e. resources are
allocated for the purpose of achieving the
government desired outcomes through service
delivery.
As agencies work towards achieving outcomes
they generate performance information that is
reported internally and externally in the form of
KPIs to assist with the assessment of
performance. Assessment of performance then
feeds into every level of planning including what
services should be delivered in the future.
OBM and Management Approaches
Treasurer’s Instruction 904 prescribes the
mandatory requirements of OBM for agencies,
but it does not preclude the application of other,
consistent, management methodologies. In
addition, OBM is expected to further evolve on
the basis of experience in this State and
with similar systems in other jurisdictions.
Consequently, constructive feedback on how
OBM can be improved is always welcomed.
Outcome Based Management
Figure 1: The OBM Cycle
Figure 2: The OBM Process
Government Strategic
Planning Framework
• Goals
• Strategic outcomes
Performance reporting in annual reports
• Effectiveness of outcome
achievement
• Efficiency of service delivery
Performance Assessment
Agency Strategic Planning
• Mission statement
• Strategic plan
Delivery of services
Budgeting
• Agency level desired outcomes(a)
• Agreed (funded) services(b)
• Key Performance Indicator Targets
(a) Includes link to government goals/strategic outcomes
(b) Includes link to agency level government desired outcomes
Planning(Strategic/
Operational)
Budgeting(Performance
targets)
Reporting(Performance
results)

2 DEVELOPING DESIRED OUTCOMES AND SERVICES
Page 3
OutcomesAs defined in Chapter 1, outcomes are the
effects, impacts, results on or consequences for
the community of the provision of services.
Outcomes may be described as why services are
delivered. Consequently, outcomes should not be
written in such a way as to describe how services
are delivered. By describing the ends while not
prescribing the means, outcomes give decision
makers the flexibility to fully explore alternative
service delivery strategies.
Strategic Planning Framework
Agency level government desired outcomes
integrate with the government’s strategic
directions articulated in its document Better
Planning: Better Services – A Strategic Planning
Framework for the Western Australian Public
Sector. This document sets out government’s
vision and goals as well as a number of strategic
outcomes.
The strategic outcomes contribute to the
realisation of five goals, relating to:
• people and communities;
• the economy;
• the environment;
• the regions; and
• governance.
Every agency level government desired outcome
relates to at least one of these goals.
Further details of the government’s goals and
strategic outcomes are available on the internet at
http://www.dpc.wa.gov.au/psmd/pubs/psrd/spfn
ov2.pdf.
Specifying agency level outcomes
An agency level outcome needs to clearly state
the end result or impact that the agency is
contributing to – it is a focus on results, not effort.
It should reflect one of government’s goals
without being so generalised as to diminish its
usefulness. The relationship between government
goals/strategic outcomes, agency level outcomes
and services is illustrated in Figure 3.
Figure 3: Performance Management
Hierarchy
For an individual agency, this hierarchy could
translate into an OBM structure analogous to the
example in Figure 4.
Figure 4: Performance Management
Hierarchy Example
Outcome Based Management
Goal
Strategic Outcomes
Agency Level Outcomes
Services
Goal
People and Communities
To enhance the quality of life and wellbeing
of all people throughout Western Australia
Strategic Outcome
Access to a safe and reliable transport
system and road network
Agency Level Outcome
Accessible, reliable and safe
public transport system
Services
Metropolitan and regional passenger services
Country passenger rail and road
coach services
Regional school bus services

Page 4
Outcome examples
For on-budget agencies (i.e. agencies that are
Divisions of the Consolidated Fund Estimates),
the desired outcomes are those specified in the
budget statements each year. For off-budget
agencies, the desired outcomes are either
identified within enabling legislation or specified
by the Minister.
Example 1
Accessible, reliable and safe public transport
system.
Example 2
A fair and independent criminal prosecution
service for the State of Western Australia.
Presentation of outcome information
Information presented in graphic form is more likely
to have an impact and be useful to stakeholders.
User friendly presentation of data helps agency
managers and other stakeholders to quickly
recognise variations, identify trends and monitor
performance over a number of reporting periods.
Use of outcome information by agencies
Outcome information is only as good as the
management decisions it informs. Knowing how
outcome information will be used, and actually
using it in decision making, helps focus
measurement on the right outcomes. Outcome
information can be used to2:
• Trigger corrective action, for example:
– identify problem areas requiring changes in
service delivery;
– evaluate which changes in service delivery
led to improvements in outcomes; and
– re-prioritise resources.
• Identify and encourage best practice such as:
– identify successful services; and
– disseminate best practice information.
• Motivate employees by:
– using it as a basis for demonstrating
performance; and
– recognising and acknowledging good
practice.
• Plan and budget, for example:
– set priorities and allocate resources; and
– develop plans and set targets.
Users of outcome information should continually
ask why differences occur and what can be done
to improve the mix of services that are
contributing to desired outcomes.
Outcome Based Management
When developing an agency level government desired
outcome, the checklist in Table 1 could be helpful.
Table 1 OUTCOME CHECKLIST
Characteristic Check
Does it describe an end result, impact or consequence for the community or target client group?
Is it well aligned with the agency’s or business unit’s mission or purpose?
Is it consistent with one of government’s goals (and strategic outcome where appropriate)?
Is it consistent with any enabling legislation?
Does it have a strategic focus, without being pitched at too high a level?
Does it describe why an agency delivers particular services, rather than ‘what’ or ‘how’ services are delivered?
Is it designed to avoid perverse incentives on staff and managerial behaviours?
Is it measurable using potential KPIs?
2 Based on Hatry, H. P., Morley, E., Rossman, S. B.& Wholey, J. S. (May 2003). How Federal Programs Use OutcomeInformation: Opportunities for Federal Managers. National Academy of Public Administration.
Page 5
As outcome information increasingly becomes
more available to service managers it is more
likely to be routinely used in decision making.
Use of outcome information by externalstakeholders
Outcome information for public sector agencies is
particularly important to government and the
Parliament, and should be useful as a basis for
allocating resources to deliver services.
Other uses of outcome information and its
associated KPI information include:
• economic analysis – to assess the economic
health of the State;
• to provide informed commentary (social and
environmental analysis) to interest groups and
the public in general; and
• benchmarking – to provide a reliable basis of
comparison with similar service delivery in
other jurisdictions or the private sector.
Agency Control
Achievement of agency level government desired
outcomes may be influenced by other agencies’
performance, other levels of government and
external influences such as cost pressures and
demographic changes. In these circumstances it
is important for agencies to report on their
progress towards outcome achievement, as well
as to discuss other influences on the outcome.
Other Agencies
Where more than one agency is contributing to a
desired outcome, agencies are encouraged to
coordinate their efforts and reporting, facilitating
‘joined up government’. A lead agency should be
identified that has overall responsibility for
coordinating the delivery of, and reporting on, that
outcome. In this situation each non-lead (or
support) agency should include its contribution to
the overall government desired outcome in its
own reporting.
The government has a range of cross-agency
initiatives in place, which reflect this multiple
agency or ‘joined up’ approach to achieving
policy priorities of government. Examples of such
initiatives include the ‘Response to the Gordon
Inquiry into Family Violence and Child Abuse’,
‘State Salinity Strategy’, ‘WA Greenhouse
Strategy’ and the ‘State Homelessness Strategy’.
The mechanisms currently in place to identify and
report progress on cross-agency initiatives include
the budget papers (Budget Overview and Budget
Paper Number 2, Chapter 3 – Major Achievements
and Major Initiatives), various interagency
committees and resource agreements.
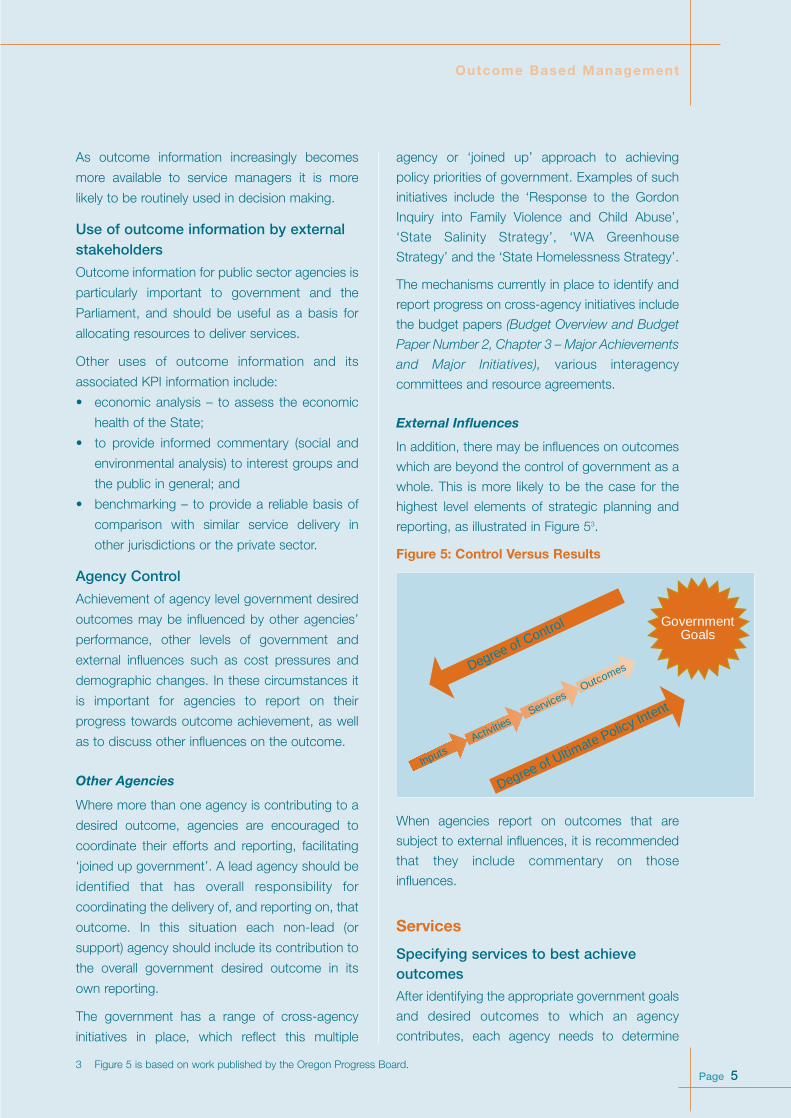
External Influences
In addition, there may be influences on outcomes
which are beyond the control of government as a
whole. This is more likely to be the case for the
highest level elements of strategic planning and
reporting, as illustrated in Figure 53.
Figure 5: Control Versus Results
When agencies report on outcomes that are
subject to external influences, it is recommended
that they include commentary on those
influences.
Services
Specifying services to best achieveoutcomes
After identifying the appropriate government goals
and desired outcomes to which an agency
contributes, each agency needs to determine
Outcome Based Management
GovernmentGoals
Degree of Control
Degree of Ultimate Policy Intent
InputsActivities
ServicesOutcomes
3 Figure 5 is based on work published by the Oregon Progress Board.

Page 6
what services it will deliver to help achieve the
desired outcomes. OBM places the onus on
agencies to demonstrate the link between desired
outcomes and the services (what is delivered) for
which they seek resources in the budget process.
As a guiding principle, resources should not be
allocated to any service unless it can be
demonstrated to contribute to the achievement of
a government desired outcome.
There is no requirement that services be aligned
with current organisational structure. But where
such an alignment is achieved, the collection of
cost and performance data is generally more
readily facilitated.
Once the services have been specified agencies
are expected to review service specifications as
part of their ongoing strategic planning process,
and may be required to do so as part of any service
evaluations4. Such reviews and any subsequent
revisions should take into account both lessons
learnt and changes to government priorities.
Service Checklist
When specifying services the following questionsshould be asked:• What services are delivered, or should be
delivered, by the agency?• What outcomes are the services addressing?
Are they consistent with the government’sgoals and strategic outcomes?
• What results are the services generating?• If a particular service ceased, what would be
the consequences?• Who has responsibility for the delivery of the
service?
The checklist in Table 2 should also beconsidered.
Outcome Based Management
Table 2 SERVICE SPECIFICATION CHECKLIST
Characteristic Test Check
External Focus Does the service describe a distinct service or group of activitiesdelivered to external customers?
Strategic focus Can a link be demonstrated between the service and one or more ofgovernment’s goals (and a strategic outcome where appropriate)?
Clarity Is the service information pitched at the right level to assiststakeholders to understand what is being delivered?
Measurability Can the service be routinely measured so that government will knowif it is getting the services for which it has allocated resources?
Comparability Does the service specification enable comparison of the performanceof existing and potential providers of the service?
Structural alignment Does the service (where appropriate) closely align with theorganisational structure of the agency?
4 Further details on evaluations may be found in the Department of the Premier and Cabinet’s publication Guidelines forPublic Sector Reviews and Evaluations.
Level of service specification
Finding the right level of service definition to assist
management and reporting is ultimately a matter
of judgment by individual agencies and their
Ministers. Considerations in determining the level
of service specification include:
• materiality of the resources involved;
• the relationship of the services to achievement
of desired outcomes;
• the provision of adequate information
for government decision making and
Parliamentary scrutiny; and
• where activities are aggregated to form a
service for external reporting purposes, the
activities should be of a similar type.

Page 7
A service is in the nature of an output when it is a
standard, discrete unit that can be measured in
terms of quantity and cost. This allows cost per
unit to be calculated with reasonable accuracy.
Where an agency’s effort does not result in
discrete, measurable units of output but
continuous or non-standard units, the service is in
the nature of a program.
Examples of outputs and programs are given
below.
Output example
Resolution of complaints. (Provides an independent
review and complaint resolution process, which
resolves cases in a timely manner and balances the
competing needs and expectations of applicants,
agencies and Parliament within legislative
requirements prescribed by the Freedom of
Information Act 1992.)
Program example
Industry development services. (Facilitates the
growth of internationally competitive industry,
assists indigenous clients to develop their
business capability and promotes Western
Australia as a source of internationally competitive
products and services.)
Under the OBM framework agencies should
clearly specify all the services they deliver and
their full costs. A guiding rule is that information
disclosed for external budget reporting should
have a strategic or whole-of-government focus,
which may require some aggregation of services.
However, lower level information may be more
relevant for internal management purposes and
for resource agreements.
Policy advice
Policy advice is generally considered a service of
central agencies such as the Department of the
Premier and Cabinet and the Department of
Treasury and Finance. As with other services, it
should only be defined as a service when it is
provided to clients external to the agency.
Outcome Structure Review Group
In December 2003 government approved the
establishment of an Outcome Structure Review
Group (OSRG). Membership of the group
comprises senior representatives of the
Department of Treasury and Finance (chair), the
Department of the Premier and Cabinet, the
Office of the Auditor General (on an advisory
basis), and a line agency representative.
The primary role of the OSRG is to ensure that all
proposals for major changes to OBM structures
increase the relevance and usefulness of
performance information and are acceptable from
a whole of government perspective prior to the
changes being endorsed by agency Ministers.
With the increasing recognition that achievement
of outcomes is not always agency specific, the
OSRG may also be able to assist in defining
shared outcomes and identifying the participating
‘lead’ and ‘support’ agencies.
Although the OSRG operates under delegated
authority of the Under Treasurer to review OBM
structures, the group has no direct input to the
resource allocation process.
When submitting details of proposed changes to
outcome/service structures to the OSRG,
agencies are required to include the following
supporting information:
• linkage of agency level desired outcomes to
the higher level goals and strategic outcomes
of government;
• rationale for proposed changes, including
evidence of government policy changes
(where applicable);
• evidence of consultation with key
stakeholders, including agency Ministers; and
• details of continuing and/or revisions to KPIs
(where applicable).
Agencies may make submissions to the OSRG at
any time during the year, however deadlines for
reflecting changes in the budget papers will apply.
These deadlines will be determined each year as
part of the budget process.
Outcome Based Management
Page 8
Performance indicators enable performance to be
measured, monitored, evaluated, reported and
improved. They play a key role in managing
performance at all levels in the organisation –
strategic and operational. The performance
indicators comprise:
• effectiveness indicators (including cost
effectiveness); and
• efficiency indicators (such as cost efficiency
and productivity).
Treasurer’s Instruction 904 mandates the
reporting of KPIs, which is consistent with the
annual advice to agencies by the Department of
Treasury and Finance regarding the content of
budget papers.
Measuring performance enables managers to
achieve the benefits discussed below.
• Continuous improvement. KPIs assist
assessment of the extent to which desired
outcomes have been achieved and the
efficiency with which services have been
provided to contribute to outcome
achievement. They assist agency managers to
identify emerging issues, specify the best
services and improve service delivery.
• Accountability. KPIs help agencies account for
their expenditure of public monies. Major
stakeholders including government,
Parliament and members of the public have a
legitimate interest in what public sector
agencies do and how well they do it.
Characteristics of Good KPIs
Treasurer’s Instruction 904 requires the reporting
of KPIs, which should:
• be relevant;
• be appropriate; and
• fairly represent indicated performance.
Relevance means the performance indicators
logically relate to the needs of stakeholders. The
indicators should relate to clearly defined agency
level government desired outcomes and services
that communicate what is to be measured and
assist with resource allocation decisions.
Appropriateness means the performance
indicators should enable users to assess an
agency’s performance. The performance
indicators need to provide an accurate
understanding of the extent to which an agency
has achieved predetermined targets, trends in
performance over time and performance relative
to the performance of similar service providers.
Appropriateness can be achieved by examining
the indicators currently being used or developed
by other organisations or peak bodies in the same
field. Using widely recognised indicators facilitates
benchmarking. Indicators are also more likely to
be appropriate if they are used for internal
management as well as for external reporting.
Appropriate indicators reduce the risk of distorting
the incentives of agencies. For example, it would
be inappropriate for performance indicators to
encourage agencies to focus on a large number
of less severe cases (e.g. health or criminal) when
better results could be achieved by focusing on a
smaller number of more severe cases.
Appropriate indicators should be supported by
explanations, either in the form of narrative or
notes to tables, to ensure that the significance of
statistics is clearly explained.
Fairly represent indicated performance means
the performance indicators are free from bias, and
should be measurable (in either quantitative or
qualitative terms) so that appropriately qualified
individuals working independently can verify them.
Outcome Based Management
3 DEVELOPING PERFORMANCE INDICATORS

Page 9
Process of Developing Indicators
The information in this section may be
supplemented by the publication Preparing
Performance Indicators – A Practical Guide5
which is available from the Department of the
Premier and Cabinet web site.
Evaluation
The development of useful performance
indicators relies on clear specification of desired
outcomes and services.
Once the desired outcome and service structure
has been documented, the next step is to critically
evaluate the existing performance information
published in budget statements, strategic plans
and agency annual reports, to determine which
information should be retained.
As well as being relevant, appropriate, and fairly
representative of indicated performance,
performance indicators should be:
• developed in consultation with major
stakeholders – the Minister, the Department of
Treasury and Finance, agency staff and key
customer groups; and
• in the case of effectiveness indicators, linked
directly to government goals and either directly
or indirectly to government strategic
outcomes.
Identify alternatives
In addition to reviewing currently reported
performance information, agencies are
encouraged to continually explore other potential
sources of useful performance indicators, such as:
• benchmarks from other jurisdictions;
• Productivity Commission – Report on
Government Services (annual);
• Commonwealth Grants Commission –
comparisons across jurisdictions;
• Commonwealth agencies – e.g. Training and
Health funding arrangements; and
• Australian Bureau of Statistics – relevant
statistical publications.
Consultation with Key Stakeholders
Key stakeholders should be consulted when KPIs
are reviewed. Consultation should be ongoing,
not just at the final stage of a review. As well as
assisting the development of good indicators,
consultation will enhance their acceptance by
stakeholders. As far as possible performance
indicators should be developed that are relevant
to both agency management and stakeholders.
Changes to performance indicators are required
to be endorsed by the Outcome Structure Review
Group, as discussed in Chapter 2.
Summary of the development process
The preparation of good performance indicators
requires agencies to follow the steps below:
• identify the linkages between government
goals, desired outcomes and services;
• consult internal and external stakeholders;
• ensure that the proposed KPIs are endorsed
by the agency’s executive and Minister;
• promote an organisational culture that
emphasises the achievement of outcomes,
self-evaluation, staff participation and
consultation;
• assign development of indicators to
appropriately skilled staff;
• use performance indicators for agency
planning and management at both strategic
and operational levels; and
• remember that performance indicators by
definition provide indicative rather than
absolute and all-embracing measures of
performance.
Effectiveness Indicators
Effectiveness indicators provide information that
assists with assessment of the extent to which
government desired outcomes have been
achieved through the resourcing and delivery of
services to the community. Desired
characteristics of effectiveness indicators include
the measurement of how well services meet client
needs and the accessibility and affordability of
particular services.
Outcome Based Management
5 Co-produced by Department of the Premier and Cabinet, Office of the Auditor General and Department of Treasury andFinance.

Page 10
As examples, how easily the community can
obtain education and police services, or the
proportion of clients receiving the services that
they need.
It is recognised that there may be lags between
the delivery of services and achievement of
desired outcomes. To reflect this, it is appropriate
for agencies to estimate the timing of outcome
achievement and utilise agreed milestones to
indicate progress towards achieving desired
outcomes. The role of milestone reporting is
recognised in the statutory reporting framework
(Treasurer’s Instruction 904).
Effectiveness indicators will generally be derived
from some characteristic of the outcome and they
should be designed to identify as clearly as
possible the causal relationship between the
service(s) and the outcome. Some effectiveness
indicators will be derived from a specific service.
This may occur where there is a clear one-to-one
causal relationship between the outcome and the
service, or where the optimal means of identifying
the achievement of the outcome is through
reporting the separate effects of a number of
services.
Designing indicators of effectiveness also checks
the appropriateness of the associated outcome
and service framework. If, for example, a service
is not well specified, it may prove difficult to
identify robust and reliable indicators of its
contribution to the outcome. Similarly, if the
outcome itself is too general or couched in
inappropriate language, it may not be possible to
establish effectiveness criteria that demonstrate a
link between a service(s) and the outcome.
The design process for outcomes, services and
effectiveness indicators should provide
opportunities to cross-check the fit and alignment
of each element of the structure.
As previously mentioned, an outcome may be
influenced by the services of a number of
agencies, other levels of government and non-
government influences such as cost pressures
and demographic changes. Consequently,
effectiveness needs to be reported with expanded
narrative. The narrative should not only disclose
the amount of inputs and progress towards the
desired outcome, but also discuss other
influences on the outcome such as the work of
other agencies and external influences.
Cost effectiveness
Cost effectiveness permits an overview of agency
effectiveness and efficiency, as it relates
outcomes directly to the cost of the services
produced to achieve them. In other words, cost
effectiveness compares change in outcome to
total cost and may be expressed as an average
over time. Cost effectiveness ensures that
efficiency can in some sense be accounted for
where per unit measurement of cost is
impractical, for example when services are
delivered in the form of programs rather than
standardised outputs.
Agencies are encouraged to report cost
effectiveness when doing so clarifies their
performance or adds value to performance
information. However, reporting cost effectiveness
is only mandatory where reporting efficiency is not
feasible.
As more than one service delivered by an agency
may contribute to a government desired
outcome, the inputs allocated to those services
may have to be aggregated when cost
effectiveness is being calculated.
Efficiency Indicators
Efficiency indicators monitor the relationship
between the service delivered and the resources
used to produce the service. They compare
inputs and outputs and are usually expressed as
a fraction, percentage or ratio.
Efficiency indicators provide information about the
production of a service at a given level of
resources and can be used to demonstrate an
entity’s relative efficiency when compared with
benchmarks such as previous results, internally
established goals and objectives, generally
Outcome Based Management

Page 11
accepted norms or standards, or results achieved
by similar jurisdictions. Although required to
address the scope of agency operations, key
efficiency indicators need only cover material
expenditure or activity levels of the services to
which they are applied. Materiality is meant in the
same sense as in the Accounting Standards.
Efficiency indicators can be expressed in terms of
unit cost or productivity.
Cost efficiency
The comparison of input to output (resources
used divided by number of units produced) can
be used to create a cost efficiency indicator.
This indicator focuses on the cost of the
resources used in dollars per unit of output.
Examples of cost efficiency indicators include:
• cost per full-time-equivalent student;
• cost per student graduated;
• cost per public transport place kilometre;
• cost per kilometre of road repaired; and
• cost per licence issued.
Productivity
The comparison of output to input (number
produced divided by resources used, holding
other things constant) can create indicators of
productive efficiency. The inputs used are often
time related. Examples of productivity efficiency
indicators include:
• licences/permits processed per employee
hour;
• phone calls handled per hour;
• cases resolved per officer;
• units produced per week; and
• students taught per teacher.
Efficiency Improvements
An efficiency gain or improvement is achieved
when:
• the same level of output (of the same quality)
is produced at a lower cost (unit cost
efficiency); or
• more output and/or output of higher quality is
produced for the same cost (productive
efficiency).
Outcome Based Management
Table 3 COMPARISON OF UNIT COST EFFICIENCY AND PRODUCTIVITY EFFICIENCY
Unit cost Productivity
Cost per full-time-equivalent student Number of full-time-equivalent students per
university or per $’s in education budget
Cost per student graduated Students graduated per semester
Cost per public transport place kilometre Public transport place kilometres per trip
Cost per kilometre of road repaired Kilometres of road repaired per year
Cost per licence/permit issued Number of licences/permits processed per
employee
Cost per phone call Phone calls handled per hour
Cost per case resolved Cases resolved per officer
Cost per unit Units produced per week or other agreed
timeframe
Cost per student Students taught per teacher

Page 12
Internal Management
A good indication of the quality of performance
indicators is that they are used for internal
management purposes such as strategic and
operational planning, as well as for indicating
where corrective action is required.
An integrated set of performance indicators is
preferable, rather than different sets for different
purposes. More detailed information could be
provided to assist frontline management, with
aggregated data being used for more strategic
purposes.
Internal and external reporting should, therefore,
as far as possible be aligned or be capable of
being reconciled. Agencies should consider
whether to develop a hierarchy of information,
with different parts of the information being used
for different purposes.
Presenting Indicators
Changes in effectiveness and efficiency over time
may be more meaningful to managers, members
of Parliament and other analysts rather than an
actual dollar figure or production level at a specific
point in time.
Wherever possible, agencies should present time
series information in a form that enables trends to
be easily identified.
Examples of presentation methods using graphs,
indices and tables are illustrated in the following
pages.
Graphs
The three graphs present performance
information on effectiveness relating to the
desired outcome ‘quality education for all Western
Australians who choose government schooling’.
Figure 6: Line Graph Examples
% ASSESSED STUDENTS ACHIEVING NATIONALLITERACY AND NUMERACY BENCHMARKS
Line graph (b) presents the line graph (a) with the
performance target included.
Figure 7: Bar Graph Example
% ASSESSED STUDENTS ACHIEVING NATIONALLITERACY AND NUMERACY BENCHMARKS
Figure 7 presents the same performance
measurement information as Figure 6, but with
comparative information from other jurisdictions.
Outcome Based Management
0
20
40
60
80
100
200420032002200120001999
Per
cent
(a)
0
20
40
60
80
100
200420032002200120001999
Per
cent
(b)
Target
Actual
0
20
40
60
80
100NSW QLDWA
200420032002200120001999
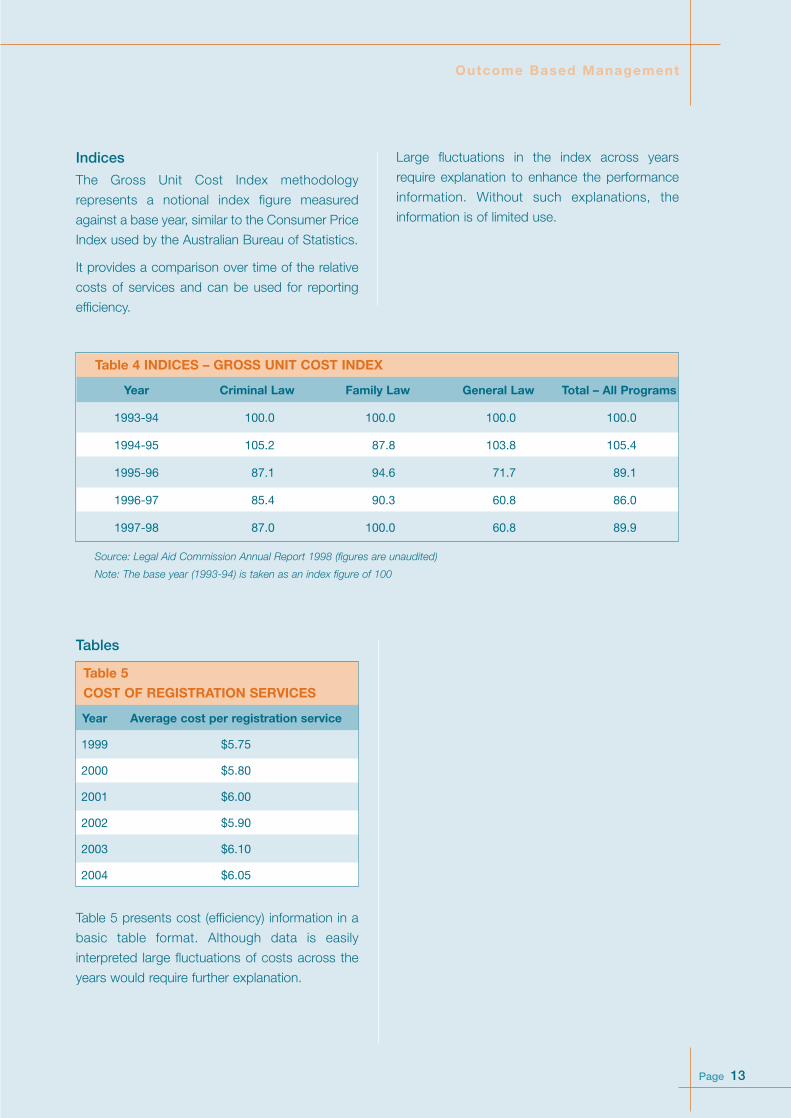
Table 4 INDICES – GROSS UNIT COST INDEX
Year Criminal Law Family Law General Law Total – All Programs
1993-94 100.0 100.0 100.0 100.0
1994-95 105.2 87.8 103.8 105.4
1995-96 87.1 94.6 71.7 89.1
1996-97 85.4 90.3 60.8 86.0
1997-98 87.0 100.0 60.8 89.9
Page 13
Outcome Based Management
Source: Legal Aid Commission Annual Report 1998 (figures are unaudited)
Note: The base year (1993-94) is taken as an index figure of 100
Tables
Table 5
COST OF REGISTRATION SERVICES
Year Average cost per registration service
1999 $5.75
2000 $5.80
2001 $6.00
2002 $5.90
2003 $6.10
2004 $6.05
Table 5 presents cost (efficiency) information in a
basic table format. Although data is easily
interpreted large fluctuations of costs across the
years would require further explanation.
Large fluctuations in the index across years
require explanation to enhance the performance
information. Without such explanations, the
information is of limited use.
Indices
The Gross Unit Cost Index methodology
represents a notional index figure measured
against a base year, similar to the Consumer Price
Index used by the Australian Bureau of Statistics.
It provides a comparison over time of the relative
costs of services and can be used for reporting
efficiency.

Page 14
Outcome Based Management
Checklist
The following checklist may assist in developing KPIs.
Table 6 KEY PERFORMANCE INDICATOR CHECKLIST
Characteristic Check
Are the linkages between government goals, agency level desired outcomes and services
clearly identifiable?
Does the KPI enable assessment of service delivery by key stakeholders, including
government, Parliament and the Department of Treasury and Finance? For example:
• the effectiveness indicator should assist stakeholders to assess the extent to which
desired outcomes are being achieved (any cost effectiveness indicator should enable
comparison between the achievement of desired outcomes and the resources being
contributed to achieve them); and
• the efficiency indicator should provide useful information to decision makers about the
economical use of inputs.
Does the KPI assist agency managers with strategic planning, resource allocation and
identification of situations in which timely corrective action is warranted?
Does the KPI facilitate comparison with other service providers?
Does the KPI describe what is to be measured, e.g. the crime rate (as opposed to the desired
direction of change in the crime rate)?
Can data be readily collected and reported against the indicator when required?
Have the KPIs been endorsed by the agency’s executive?
Are the requirements of Treasurer’s Instruction 904 and the Financial Administration and Audit
Act sections 63 or 68 met?
Has the Outcome Structure Review Group endorsed the performance information changes?
Further assistance with developing performance indicators may be obtained from the Department of
Treasury and Finance and the Department of the Premier and Cabinet – see contact details in Appendix 1.

Page 15
Outcome Based Management
Lawful road-usebehaviour
• Traffic lawenforcementandmanagement
• Percentage of driverstested for drink-driving who arefound to be withinthe lawful alcohollimit
• Percentage ofvehicles monitoredfor speeding byspeed cameras thatare found to bewithin the lawfulspeed limit
• Estimated change inspeed relatedcrashes afterexpenditure onrelevant safetycampaigns1
• Average cost ($) perhour of traffic lawenforcement andmanagement
• Average number ofvehicles monitoredper speed camerahour1 (productivity)
Accessible,reliable and safepublic transportsystem
• Metropassengerservices(1)
• Use of publictransport –passengers perservice kilometre
• Average cost perpassenger kilometre
• Average cost per1,000 placekilometres
Qualityeducation for allWesternAustralians whochoosegovernmentschooling
• SecondaryEducation
• Secondarygraduation rate(proportion of year 8cohort achievingsecondary graduationin year 12)
• Percentage ofassessed studentsachieving nationalliteracy andnumeracybenchmarks
• Average cost perstudent graduating1
• Average cost perstudent
• Student to teacherratio (productivity)
Restoration ofthe health ofpeople withacute illness
• Preventionand promotion
• Diagnosis andtreatment
• Person years of lifelost per 1,000population due topreventable diseaseor injury
• Percentage of acutehospital separationsthat are dischargesto home
• Waiting times forelective surgery1
• Estimated number ofpeople who quitsmoking after ahealth campaign tocost of campaign1
• Average cost perpriority healthpromotion program
• Average cost perweighted separationat public hospitals
• Relative stay index –actual number ofacute bed days byexpected number ofacute bed days1
(productivity)
1 These indicators are new suggestions, whereas all other information in this table is sourced from agency annual reportsand the budget papers.
Examples of Outcomes, Services, and KPIsThe following tables provide examples of the various elements of the outcome based management
framework. In the case of KPIs (the final three columns) accompanying text should explain the significance
of the indicators, for example the distinction between passenger kilometres and place kilometres.
PEOPLE AND COMMUNITIES
To enhance the quality of life and wellbeing of all people throughout Western Australia
Desired Service Effectiveness Cost Effectiveness Efficiency Outcome Indicators Indicators Indicators

Page 16
THE ECONOMY
To develop a strong economy that delivers more jobs, more opportunities and greater wealth toWestern Australians by creating the conditions required for investment and growth
Desired Service Effectiveness Cost Effectiveness Efficiency Outcome Indicators Indicators Indicators
Outcome Based Management
Increasedcompetitivenessand profitabilityof agriculture,food and fibreindustries
• Food and fibreindustrydevelopment
• Total FactorProductivity Index
• Gross Value ofProduction
• % change in uptakeof grain varieties
• Change in value ofproduction per dollarof governmentspending1
• Average hourly costper person involvedin investmentattraction andmarket development
Responsibledevelopment ofthe State’sindustry andresources forthe benefit ofWesternAustralians
• Industrydevelopmentservices
• Environmentalperformance of theindustry measured asa % of auditedprojects which attractzero major correctiveaction reports
• Percentage ofAustralian mineralexplorationexpenditureexpended in WesternAustralia
• Average cost ofindustry and tradeprojects facilitated
Science andinnovation hasincreased insignificance as adriver ofeconomicgrowth forWesternAustralia
• Science andinnovationpromotion andsupport
• Change in the levelof total investment inscientific researchand development inWestern Australia
• Index of fundingleverage obtained forWestern Australiafrom Centres ofExcellence grants
• Cost per $m changein the level ofinvestment1
• Cost per % pointchange in the index1
• Average cost ofadministration perresearch capabilityand infrastructuregrant
• Average cost perscience andinnovation programand project managed
WesternAustralia ispromoted as anattractivedestination
• Destinationmarketing
• Awareness amongstpotential visitors thatWA offers iconictourist experiences
• Ratio of WA increasein visitor expenditureto the nationalaverage increase invisitor expenditure
• Ratio of cost ofincremental tourismactivities to visitorexpendituregenerated
• Cost per consumerawareness strategy
1 These indicators are new suggestions, whereas all other information in this table is sourced from agency annual reportsand the budget papers.

Page 17
Outcome Based Management
THE ENVIRONMENT
To ensure that Western Australia has an environment in which resources are managed, developedand used sustainably, biological diversity is preserved and habitats protected
Desired Service Effectiveness Cost Effectiveness Efficiency Outcome Indicators Indicators Indicators
An increase inthe adoption ofrenewableenergy andenergy efficiency
• Developmentandimplementationof sustainableenergy policyand programs
• Use of renewableenergy throughincentive programs,indicated by thedisplacement offossil fuel. Kilowatthour of fossil fueldisplaced by:
– Solar Hot WaterSubsidy Scheme
– Renewable RemotePower GenerationProgram
– Renewable EnergyWater PumpingProgram
• Estimated cost ofreducing fossil fuelusage by x% perkilowatt hour1
• Average cost perincentive grantadministered
• Average cost ofmeeting major policyand programimplementationmilestones
Conservationand sustainabledevelopment ofthe State’s fishresources
• Managementof the State’scommercialfisheries
• The proportion (%) of fisheries wherebreeding stocks ofthe major targetspecies are bothassessed andadequate to ensurecatches aresustained atmaximum levelswithin the rangeexpected undertypical environmentalconditions
• Cost of managingcommercial fishstocks at asustainable level permajor target species1
• Average cost perhour for research
• Average number ofassessed catchesper inspection hours1 (productivity)
Conservation ofwildlife
• Wildlifecollectionmanagement
• Percentage ofspecies in the animalcollection that arepart of a regionallymanaged program
• Average cost perspecies
Protection andenhancementof the quality ofthe State’ssurface andgroundwater
• Waterprotectionpolicies,guidelinesandregulation
• The percentage ofplans completed toguide the protectionof the State’s watersupplycatchments/basins1
• Cost of reduction inspecified pollutantsin the State’s watersupply1
• Average cost per keyprotection policiesdeveloped
• Average cost permillion kilolitres ofgroundwatermanaged andprotected
1 These indicators are new suggestions, whereas all other information in this table is sourced from agency annual reportsand the budget papers.

THE REGIONS
To ensure that regional Western Australia is strong and vibrant
Desired Service Effectiveness Cost Effectiveness Efficiency Outcome Indicators Indicators Indicators
Page 18
Outcome Based Management
Effectivemanagement ofbiosecurity
• Biosecurity • Identifications ofnotifiable animaldiseases
• Interceptions ofsignificant pests,diseases and weeds
• Average cost perdiagnostic sampleprocessed (animaland plant diseaseand plant pest)
• Average cost perpassenger quarantinechecking post
Enhancement of the Pilbararegion’seconomic andsocialdevelopment
• Business andIndustryDevelopment
• Customers satisfiedthat the PilbaraDevelopmentCommission iseffective inencouragingbusiness andindustry developmentthrough theidentification andcoordination ofprojects
• Value of newbusiness investmentper cost of projects1
• Average cost perproject
Protection of theproductiveresource base
• Agricultureresourceprotection
• Proportion ofinspected propertieswith infestations ofdeclared animalpests, plant pestsand diseases
• Value of agriculturalproduction impactedper successfuleradication campaign1
• Average cost perproperty contact foragencycontrol/eradicationactivities for animalpests, plant pestsand diseases
1 These indicators are new suggestions, whereas all other information in this table is sourced from agency annual reportsand the budget papers.

Page 19
Outcome Based Management
Compliance withlawful gamblingand liquorservices inaccordance withthe legislation
• Complianceaudits andinspections
• Licensees/serviceproviders thatcomply with auditrequirements andstatutory criteria
• Cost per complianceaudit/inspection
Improvedintegrity andreducedincidence ofmisconduct inthe public sector
• Investigationsintomisconduct inthe publicsector
• Strategicassessmentsindicating theincidence ofmisconduct in thepublic sector
• Cost per allegationassessed
• Average time takento respond to anallegation1
All electors areable toparticipate inimpartial,effective anddemocraticelections orreferendaconducted bythe Commission
• Electoralservices
• Average participationrate of eligibleelectors in elections
• Average cost pervalid vote cast1
• Proportion ofaffected electors perelection that areaware of boundarychanges1
• Average cost perelector of conductingelections
1 These indicators are new suggestions, whereas all other information in this table is sourced from agency annual reportsand the budget papers.
GOVERNANCE
To govern for all Western Australians in an open, effective and efficient manner that also ensures asustainable future.
Desired Service Effectiveness Cost Effectiveness Efficiency Outcome Indicators Indicators Indicators

Page 20
Benefits of Performance Monitoringand ReportingThe benefits of performance monitoring andreporting are realised when an agency’s internalstakeholders, i.e. management and employees,embrace a culture that focuses on performance.These benefits are also heavily dependant onexternal stakeholders keeping an eye onperformance reports and utilising the results intheir decision making.
Such benefits include:• enhanced knowledge in Parliament of what
agency budgets are planning to provide;• greater public transparency of agency
services;• help to identify successful (‘best’) practices
and promulgate those practices to other areaswithin and between agencies and/orgovernment (refer to the section‘Benchmarking’ in this chapter for furtherinformation);
• the ability of agencies to assess theirperformance against targets;
• the ability to investigate the reasons for anyinconsistent performance against targets, andsuggest remedial action to prevent recurrenceand/or improve results; and
• assisting agencies to estimate performancelevels in out-years.
To obtain these benefits performance reportsshould be evaluated. Information on undertakingevaluations can be found in Guidelines on AgencyStrategic Management, which is produced by theDepartment of the Premier and Cabinet.
ReportingPerformance monitoring and reporting should beundertaken by agencies on an ongoing basis,rather than as an annual compliance exercise, ifthe potential benefits are to be realised byagencies and government as a whole.
Agencies are required to report performance
information to key stakeholders through thefollowing means:• budget statements;• strategic development plans/statements of
corporate intent;• annual reports; and• agency management reports.
Budget StatementsThe budget statements are the primary documentagainst which the performance of on-budgetagencies is assessed. They disclose results andforecasts for KPIs over the previous, current andbudget years. The disclosure of trends using timeseries information is considered to be more usefulthan the results for any single year.
The primary target audience of the budgetstatements is Parliament, to which the statementsprovide detailed information in support of agencyresourcing. The budget statements are accessibleby all members of the public. Chapter 5 containsmore detail about OBM and the budget.
From the 2005–06 budget, mandatory reportingof output measures (quantity, quality, timelinessand cost) has been discontinued. For monitoringpurposes the emphasis is now on the auditedKPIs of effectiveness and efficiency. Developmentof these indicators is dealt with in Chapter 3 ofthese guidelines.
Strategic Development Plans/Statementsof Corporate IntentThese corporate planning documents areprepared annually by a number of off-budgetagencies that have a commercial focus.
The Strategic Development Plan (SDP) is a rollingplan with a five-year outlook while the Statementof Corporate Intent (SCI) looks at the first year indetail. In some cases, applicable legislationspecifies the matters which are to be included inthe SDP and SCI, which generally includesreference to performance targets and othermeasures against which financial and non-financial performance may be reviewed.
Outcome Based Management
4 PERFORMANCE MONITORING AND REPORTING

Page 21
Annual ReportsThe Financial Administration and Audit Actrequires that KPIs be included in annual reportsand that they be audited. More specifically,Treasurer’s Instruction 904 requires that at leastone key effectiveness indicator is required foreach agency level government desired outcomeand one key efficiency indicator for each service(or cost effectiveness indicator in the absence ofan appropriate efficiency indicator). AdditionalKPIs should be published where they add value.
In order to facilitate meaningful comparison andassessment of agency performance, the KPIspublished in the annual report should be the sameas those published in either the budgetstatements or the SDP/SCI. At the conclusion ofthe current rolling review of agency OBMstructures, the intention is that all major on-budget agencies will have had all their publishedKPIs reviewed by the Outcome Structure ReviewGroup. The same KPIs should be subsequentlyaudited and published in agency annual reportsand the budget statements.
Annual reports are public documents that aretabled in Parliament and are available on theParliament and agency web sites. The annualreport provides a significant opportunity forgovernment agencies to publish theirachievements. Further assistance in preparingannual reports can be obtained from theDepartment of the Premier and Cabinet’spublications Annual Report Framework andPremier’s Circular 2004/08 Annual Reporting.
Agency Management ReportsKPIs should be designed to be used as bothmanagement tools and for reporting.Management should be aware of progresstowards the annual targets in order to takecorrective action if progress is not satisfactory.
State Progress ReportAlignment of agency level outcomes togovernment’s goals and strategic outcomesensures that agency performance is in line withgovernment expectations. It is envisaged thatselected effectiveness KPIs together with relevantdata published by independent organisations
such as the Australian Bureau of Statistics will beused to help report future progress againstgovernment goals and strategic outcomes asoutlined in Better Planning: Better Services.
Benchmarking
What is benchmarking?Benchmarking is the process of assessing anagency’s performance in producing a serviceagainst a comparable service within or external tothe agency.
Benchmarking is not just about setting targetlevels. It entails searching for the methods andprocesses that lead to best practice performance,and developing an action plan to implement themwhere they are not being used.
Why benchmark?Major reasons why government agencies shouldbenchmark their service delivery include:• the scarcity of resources increases the
pressure to know about best practice inresource usage, to raise productivity in servicedelivery and to improve outcomes;
• better management tools are required to instilan increased customer focus and ensure thatcustomers become the main judges of servicequality; and
• government services are becomingincreasingly contestable and governmentsoften consider alternative means of servicedelivery.
Benchmarking aligns with OBM by:• testing the competitiveness of the cost of
services relative to other jurisdictions orservice providers;
• identifying inefficiencies within agencies;
• comparing the effectiveness and quality ofservice delivery against other jurisdictions orservice providers; and
• setting goals or standards for agencies toimprove efficiency and effectiveness.
Benchmarking assists agencies to:• review priorities;• reallocate resources; and• improve the quality of services they deliver.
Outcome Based Management

Page 22
The budget is the blueprint for the government’s
plans for the budget year and beyond, setting out
the projected financial implications of delivering
those plans. The budget is framed in light of the
following set of financial management principles,
which are stipulated in the Government Financial
Responsibility Act:
• funding for current services is to be provided
by the current generation;
• spending and taxing policies are to be
formulated and applied so as to give rise to a
reasonable degree of stability and
predictability;
• financial risks are to be managed prudently;
and
• spending and taxing policies are to be
formulated and applied with consideration to
the effect of these policies on employment and
the economic prosperity of the State.
These financial management principles are
underpinned by financial targets that set the
boundaries within which the plans are to be
delivered.
Performance information has a dual role in relation
to the budget. Firstly, it is available to assist
decision making in the budget formulation phase
and secondly, it illustrates and articulates plans in
the budget statements.
OBM and Budget FormulationEach year the Department of Treasury and
Finance advises agencies (through the annual
budget circular) of the steps involved in the
budget formulation process, as approved by the
government of the day. One of the steps will
typically be for agencies, through their Ministers,
to submit details of cost and demand pressures,
capital investment plans and any new spending
proposals.
In addition to the financial impact, budget
submissions for new spending proposals by
agencies should provide the information
described below.
• The relationships between the agency level
government desired outcome(s), government
goals and strategic outcomes.
• Quantitative and qualitative information on
what services are to be delivered. This may be
at a lower level (e.g. product or activity) than
the services published in the budget
statements, but nevertheless should link
through to the services level.
• The expected impact on KPI targets for the
level of resources sought and, if possible, the
expected impacts at a range of resource
levels.
Submissions involving cost and demand
pressures can also be enhanced by providing this
information, and any scrutiny of existing levels of
service delivery is also likely to examine these
elements.
The characteristics illustrated in Table 7 below
should be considered when determining targets.
Outcome Based Management
5 OBM AND THE BUDGET

Page 23
Actual results are then published in annual
reports, including a comparison against targets,
to complete the OBM cycle. Those actual results,
in conjunction with any changes in policy settings,
resourcing levels and the external environment,
provide a basis for setting future targets in the
next cycle.
OBM and Budget Presentation
Relationship to government goals
As previously indicated, government goals are
documented in the publication Better Planning:
Better Services. They are listed below:
• People and Communities – to enhance the
quality of life and wellbeing of all people
throughout Western Australia;
• The Economy – to develop a strong economy
that delivers more jobs, more opportunities
and greater wealth to Western Australians by
creating the conditions required for investment
and growth;
• The Environment – to ensure that Western
Australia has an environment in which
resources are managed, developed and used
sustainably, biological diversity is preserved
and habitats protected;
• The Regions – to ensure that regional Western
Australia is strong and vibrant; and
• Governance – to govern for all Western
Australians in an open, effective and efficient
manner that also ensures a sustainable future.
As discussed in Chapter 2, the strategic
outcomes in Better Planning: Better Services
contribute to these goals. For budget
presentation purposes, agencies are required to
link their desired outcomes (and services) to the
most appropriate government goal(s).
Ideally, agency level outcomes should also relate
to government strategic outcomes. In rare
instances it is possible for an agency level
outcome to be the same as a strategic outcome,
but generally agency outcomes are at a lower
level, describing a more tangible result or impact.
An example of this relationship is shown in
Table 8.
Outcome Based Management
Table 7 PERFORMANCE TARGETS CHECKLIST
Characteristic Check
Does it represent a balance between being realistic and challenging?
Is it achievable within the agency’s approved resources?
Can data be collected and reported against the targets?
Are targets expressed simply?
Do stakeholders regard the targets as appropriate?
Is there consistency with the agency’s strategic plan?
Are targets consistent with government’s overarching goals and strategic outcomes?
Table 8 RELATIONSHIP TO GOVERNMENT GOALS
Government Goal Strategic Outcome Agency Level Outcome
People and Communities – to Accessible and reliable Accessible, reliable and safe enhance the quality of life and public transport public transport systemwellbeing of all people throughout Western Australia
Note that presently the table in the budget statements shows the sequence: government goal, agency level
desired outcome(s) and services – strategic outcomes are not shown.

Page 24
Cost of Services
The total cost of each service is disclosed in the
budget statements for the budget year and the
previous two years. The aggregate total cost of all
services is disclosed for the forward estimate
years, and the total cost of all services for all years
should equal the amount shown against that line
in the Income Statement (formerly known as the
Statement of Financial Performance).
The Department of Treasury and Finance
publication Costing and Pricing Government
Outputs6 provides guidelines to assist agencies
with the costing of services. Whilst the guidelines
point out that there is no single universally
applicable costing methodology, the following
principles should be applied generally to costing
exercises:
• all costs should be accurate and verifiable;
• full costs are to be used, including any indirect
costs (i.e. costs shared between a number of
services);
• recurrent impact of capital costs such as
depreciation and opportunity cost of capital
(capital user charge) are to be included; and
• the cost of resources received free of charge
from other agencies is to be included as part
of the total cost of services.
Key Performance Indicators, initiativesand achievements
KPIs assist in assessing achievement of
outcomes and efficiency of services. KPIs are
published in the budget statements with targets
for the budget year, and actual and expected
results for the previous two years. The KPIs are
subsequently audited and published with the
audit opinion in agency annual reports. Due to
space considerations, it may not be practical for
agencies that have a large number of KPIs to
include all of them in strategic documents such as
the budget statements. Significant variations
between actuals, estimates or targets require
explanation in the budget statements (as they
would in annual reports).
Major initiatives and achievements are also
published in the budget statements – initiatives for
the budget year and achievements for the
previous year. These are expressed in narrative
form and pitched at a level lower than services,
such as product, activity or project. They should
describe what is being done and why it is being
done.
Where practical, demonstration of a direct
relationship with KPIs or desired outcomes is
preferable for major initiatives and achievements.
Phrases like ‘continue to’ should be avoided, as
should other business as usual statements.
The results of major initiatives in one year should
be reported as major achievements in the
following year’s budget statements to achieve
continuity. It is not intended, however, to publish
initiatives that were not progressed to the point of
being major achievements in the following year.
Despite this, agencies should be prepared to
discuss in forums such as Parliament’s Estimates
Committee hearings progress towards achieving
major initiatives or the reasons why an initiative
may have been discontinued.
Capital Works and AdministeredExpenses
Direct expenditure on capital works (e.g.
purchase of assets) does not form part of total
cost of services. These outlays are, however,
reflected in the total cost of services as a
depreciation expense (i.e. allocation of the cost of
assets over their useful life).
Asset needs that are identified through the
planning, management and review processes
should be specified in the agency’s strategic asset
plan. This broad plan should then be articulated
through an appropriate capital investment plan,
asset maintenance and operation plan, and/or
asset disposal plan and associated processes.
Agency planning at strategic and
business/operational levels within the OBM
framework is illustrated in Figure 8.
Outcome Based Management
6 A forthcoming edition will be known as Costing and Pricing Government Services.
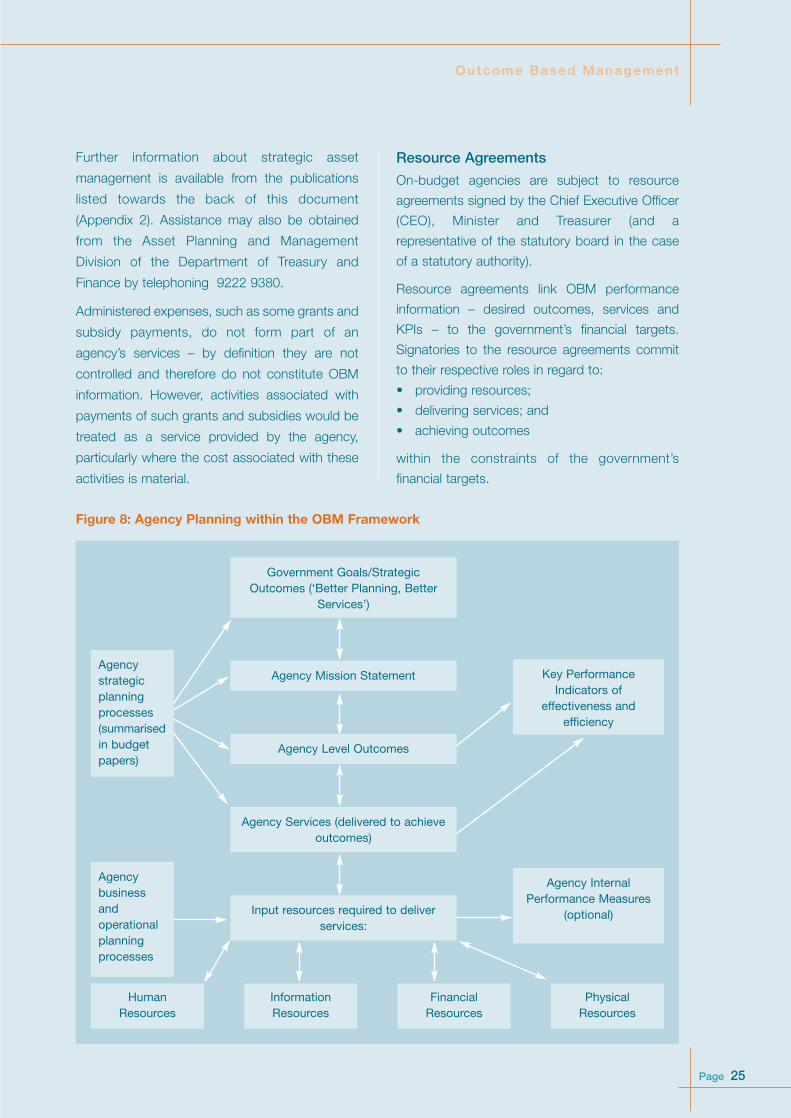
Page 25
Further information about strategic asset
management is available from the publications
listed towards the back of this document
(Appendix 2). Assistance may also be obtained
from the Asset Planning and Management
Division of the Department of Treasury and
Finance by telephoning 9222 9380.
Administered expenses, such as some grants and
subsidy payments, do not form part of an
agency’s services – by definition they are not
controlled and therefore do not constitute OBM
information. However, activities associated with
payments of such grants and subsidies would be
treated as a service provided by the agency,
particularly where the cost associated with these
activities is material.
Resource Agreements
On-budget agencies are subject to resource
agreements signed by the Chief Executive Officer
(CEO), Minister and Treasurer (and a
representative of the statutory board in the case
of a statutory authority).
Resource agreements link OBM performance
information – desired outcomes, services and
KPIs – to the government’s financial targets.
Signatories to the resource agreements commit
to their respective roles in regard to:
• providing resources;
• delivering services; and
• achieving outcomes
within the constraints of the government’s
financial targets.
Outcome Based Management
Figure 8: Agency Planning within the OBM Framework
Government Goals/StrategicOutcomes (‘Better Planning, Better
Services’)
Agency Mission Statement
Input resources required to deliverservices:
Agencybusinessandoperationalplanningprocesses
Key PerformanceIndicators of
effectiveness andefficiency
Agency InternalPerformance Measures
(optional)
HumanResources
InformationResources
FinancialResources
PhysicalResources
Agencystrategicplanningprocesses(summarisedin budgetpapers)
Agency Level Outcomes
Agency Services (delivered to achieveoutcomes)

Page 26
Department of Treasury and Finance
197 St George’s Terrace
Perth WA 6000
Queries to the Department of Treasury and
Finance should be raised in the first instance by
contacting the Agency Resources Division on
9222 9169 and asking for the Analyst responsible
for the relevant agency.
Issues of a broad policy nature may be directed
to the Financial Policy Division by telephoning
9222 9358.
Department of the Premier and Cabinet
197 St George’s Terrace
Perth WA 6000
Tel. 9222 8741
The Public Sector Management Division within
the Department of the Premier and Cabinet can
advise on the development of performance
indicators and related reporting requirements. The
department can also refer agencies to other
publications and relevant information.
Office of the Auditor General
4th Floor, Dumas House
2 Havelock Street
West Perth WA 6005
Tel. 9222 7500
The Office of the Auditor General is able to offer
general advice. Please contact the Performance
Indicator Coordinator on the number listed above.
Outcome Based Management
APPENDIX 1 FURTHER ASSISTANCE

APPENDIX 2 FURTHER READING
Page 27
Department of Treasury and Financewebsite: www.dtf.wa.gov.au
• Accrual Appropriations and Capital User
Charge – A User Manual, Second edition,
December 2003
• Costing and Pricing Government Outputs –
Guidelines for use by agencies, Fourth edition,
October 2001
• Purchasing and Analysing Outputs, June 2000
• Strategic Asset Management – An Overview,
June 1994
Department of the Premier andCabinet website:www.dpc.wa.gov.au
• Annual Report Framework
• Better Planning: Better Services – A Strategic
Planning Framework for the Western
Australian Public Sector, November 2003
• Guidelines for Public Sector Reviews and
Evaluations
• Guidelines on Agency Strategic Management
• Premier’s Circular 2003/16 – Agency Strategic
Management
• Premier’s Circular 2004/08 – Annual Reporting
• Preparing Performance Indicators –
A Practical Guide, Revised April 1997
Office of the Auditor Generalwebsite: www.audit.wa.gov.au
• Listen and Learn – Using Customer Surveys to
Report Performance in the Western Australian
Public Sector
• OAG Audit Standard – The Audit of
Performance Indicators
Other publications
• Hatry, H. P., Morley, E., Rossman, S. B.&
Wholey, J. S. (May 2003). How Federal
Programs Use Outcome Information:
Opportunities for Federal Managers. National
Academy of Public Administration
• Productivity Commission – Report on
Government Services (annual)
Outcome Based Management

Page 28
Historical BackgroundOBM has been progressively implemented as partof an inter-related package of financial andadministrative reforms.
In the 1997–98 Budget, agencies were firstrequired to identify and report outcomes and keyoutputs, the latter defined as discrete goods orservices. The requirement for agencies to reportactual results against output targets in theirannual reports was introduced for the 1998-99financial year.
In the 200–02 Budget, the historical cash basedappropriations regime was replaced by theaccrual appropriations regime, which defines anappropriation in terms of the full cost of resourcesrequired to deliver specific outputs, consistentwith the move to OBM.
Comprehensive output measures and keyindicators of efficiency and effectiveness have beenprogressively developed to measure agencyperformance in delivering outputs and achievementof desired outcomes. The current challenges are tointegrate agency level desired outcomes with thegoals and strategic outcomes identified in BetterPlanning: Better Services and to develop morerelevant and useful performance indicators.
As the focus has shifted from outputs tooutcomes, the framework is now referred to asOutcome Based Management. This name changereflects the fact that government agencies areestablished and operate with a view to achievingoutcomes that are desired by government for thecommunity and should utilise their resourceseffectively and efficiently to achieve those desiredoutcomes.
OBM StakeholdersPublic sector agencies have many stakeholders.Any person or organisation to which an agency isaccountable or which is affected by the actions ofan agency is a stakeholder of that agency. Anexternal stakeholder is one outside the agency.
In terms of accountability the key externalstakeholders are Parliament, governmentMinisters and the central agencies: Department ofTreasury and Finance, Department of the Premierand Cabinet, and Office of the Auditor General.
Relevant and useful information on performanceis disclosed to stakeholders in order to satisfyaccountability. Performance information shouldalso facilitate improved decisions about resourceallocation.
Using OBM Generated InformationPerformance information should not only beanalysed by stakeholders, but also by themanagers striving to achieve the desiredoutcomes. Managers should use performanceinformation to monitor the efficiency of theirservices and to determine how and what servicesto deliver in order to best achieve the desiredoutcomes.
Performance results should be reviewed andcompared to targets, but falling short of targetsshould not necessarily be seen as constitutingfailure. External factors may influence results. Forexample, if demand for a service falls the cost perunit may rise, even though service provision isefficient. Conversely, exceeding a target is notnecessarily a sign of success.
Results are compared to targets in order to:
• highlight any issues in the way that, or whichtype of, services are delivered; and
• obtain a better understanding of any externalinfluences on outcomes in addition to anagency’s own efforts.
Fluctuations in results from year to year should,therefore, trigger reappraisal of both an agency’sown operations and its understanding of theenvironment in which it operates. This should bedone both as part of the budget cycle and anyservice evaluations.
Outcome Based Management
APPENDIX 3 BACKGROUND TO OBM

APPENDIX 4 GLOSSARY
Page 29
Agency A department or statutory authority as defined in the FAAA.
Agency level government desired outcome A government desired outcome pitched at a level more
relevant to agencies. These lower level outcomes are
required to link to one of government’s goals.
Better Planning: Better Services The document which outlines the government’s strategic
planning framework for the Western Australian public
sector.
Benchmarking The process of assessing an agency’s performance in
producing a service against a comparable service external
to the agency.
FAAA Financial Administration and Audit Act 1985.
Financial Reform Consultative Committee The FRCC is a committee which facilitates agency
(FRCC) participation in the public sector financial policy process. It
is chaired by the Department of Treasury and Finance and
has representation from 22 agencies.
Government desired outcome An outcome endorsed by government and classified as
either strategic or agency level. The desired outcomes
pitched at agency level may involve a number of agencies.
Government goal An expression of high level policies and/or priorities that
support the government’s vision. Government desired
outcomes contribute to these goals.
Inputs The resources expended in the process of delivering
services.
Key cost effectiveness indicator Relates achievement of an agency level government desired
outcome to the cost of the services which achieved it.
Key effectiveness indicator (KPI) Provides information on the extent of, or progress in a
reporting period towards, achievement of an agency level
government desired outcome through the delivery of agreed
services.
Key efficiency indicator Relates a service to the level of resource input required to
deliver it.
Key performance indicator (KPI) Provides an overview of the critical or material aspects of
outcome achievement or service delivery.
Off-budget agencies Agencies that are not Divisions of the Consolidated Fund
Estimates.
Outcome Based Management

Page 30
On-budget agencies Agencies that are Divisions of the Consolidated Fund
Estimates.
Operational Plan A plan, usually with a focus of a year or less, outlining how
to achieve government goals and desired outcomes set out
in an agency strategic plan.
Outcome Structure Review Group (OSRG) A group which comprises senior representatives of central
and line agencies and has a primary role of ensuring that all
proposals for major changes to OBM structures are
acceptable from a whole of government perspective prior to
the changes being endorsed by agency Ministers.
Outcome The effect, impact, result on, or consequence for the
community, environment or target clients of government
services. The reason why services are delivered.
Outcome Based Management The Western Australian public sector’s framework for
managing the performance of agencies. It identifies the
outcomes desired by government that agencies are
expected to contribute to, and the services to be delivered
to help achieve the desired outcomes.
Output A service that is standardised, so that it readily lends itself to
meaningful per unit measurement.
Performance Information Information reported under OBM or a comparable
performance management system, encompassing desired
outcomes, services, KPIs and major initiatives or
achievements.
Performance Target The current estimate of the future result to be achieved if the
resources provided for that purpose are used as per the
agreed plan.
Program A service that comprises related but non-standardised
activities.
Service The supply of an activity or good to a user external to the
agency providing the service.
Stakeholder A person or organisation to which an agency is accountable,
or which is affected by the actions of an agency.
Statement of Corporate Intent (SCI) The SCI is a public document prepared annually and is
aimed at satisfying the accountability requirements of
government. It is required by legislation for some of the
more commercial public sector agencies.
Strategic Asset Management The management of assets to achieve better value for
money by a systematic approach to capital investment
decision making, including the examination of non asset
solutions.
Outcome Based Management
Page 31
Strategic Development Plan (SDP) The SDP is a confidential document prepared annually
which looks forward five years and sets out the agency’s
economic and financial objectives and operational targets
and how these are to be achieved. It is required by
legislation for some of the more commercial public sector
agencies.
Strategic Outcome An outcome pitched at a high level, long term, often
qualitative and intended to contribute to a government goal.
Strategic Plan At agency level, it is a plan on how to achieve government
goals and desired outcomes. It will usually have a multi-year
focus, but may be revised annually. For above agency level,
see ‘strategic planning framework’.
Strategic Planning Framework A policy structure that facilitates high level long term
planning. The strategic planning framework for the Western
Australian public sector is in the document Better Planning:
Better Services.
Treasurer’s Instructions Under section 58 of the FAAA the Treasurer may issue
instructions with respect to matters of financial
administration. These have the force of law and prescribe
requirements at a minimum level on matters such as
accounting for revenue, expenditure and property and the
standards of reporting.
Outcome Based Management

Department of Treasury and FinanceGovernment of Western Australia