Out of Sight, Out of Mind: The Effects of Expenses on Mutual Fund
26
Brad M. Barber Graduate School of Management, University of California, Davis Terrance Odean Haas School of Management, University of California, Berkeley Lu Zheng Ross School of Business, University of Michigan Out of Sight, Out of Mind: The Effects of Expenses on Mutual Fund Flows* I. Introduction We analyze the fees charged by mutual funds over the last several decades. Mutual funds have dramatically changed the way that they charge expenses. The proportion of diversified U.S. eq- uity mutual fund assets invested in front-end-load funds has dropped from 91% in 1962 to 35% in 1999 (see fig. 1). In contrast, asset-weighted op- erating expenses for these funds increased by more than 60%, from 54 basis points in 1962 to 90 basis points in 1999 (see fig. 2), despite the great increase in total assets under management. In addition to documenting these facts, which are (Journal of Business, 2005, vol. 78, no. 6) B 2005 by The University of Chicago. All rights reserved. 0021-9398/2005/7806-0002$10.00 2095 * This paper was previously entitled ‘‘The Behavior of Mutual Fund Investors.’’ We benefited from the comments of Nicholas Barberis, Shlomo Benartzi, Marshall Blume, William Goetzmann, Daniel Hirsch, John Rea, Brian Reid, Jason Zweig, and seminar participants at Duke, the NBER Behavioral Finance Group, UCLA, the Western Finance Association Meetings (June 2001), and the Conference on Distribution and Pricing of Dele- gated Portfolio Management ( Wharton Financial Institutions Center May 2002). We are grateful to the discount brokerage firm that provided us with the data for this study. Zheng thanks Fang Cai and Michael Clare for excellent research assistance. All er- rors are our own. We argue that the purchase decisions of mutual fund investors are influenced by salient, attention-grabbing information. Investors are more sensitive to salient, in-your-face fees, like front-end loads and commissions, than operating expenses; they buy funds that attract their attention through exceptional performance, marketing, or advertising. We analyze mutual fund flows over the last 30 years and find negative relations between flows and front-end-load fees. In contrast, we find no relation between operating expenses and flows. Additional analyses indicate that marketing and advertising, the costs of which are often embedded in funds’ operating expenses, account for this surprising result.
Transcript of Out of Sight, Out of Mind: The Effects of Expenses on Mutual Fund

Brad M. BarberGraduate School of Management,University of California, Davis
Terrance OdeanHaas School of Management,University of California, Berkeley
Lu ZhengRoss School of Business, University of Michigan
Out of Sight, Out of Mind:The Effects of Expenseson Mutual Fund Flows*
I. Introduction
We analyze the fees charged by mutual fundsover the last several decades. Mutual funds havedramatically changed the way that they chargeexpenses. The proportion of diversified U.S. eq-uity mutual fund assets invested in front-end-loadfunds has dropped from 91% in 1962 to 35% in1999 (see fig. 1). In contrast, asset-weighted op-erating expenses for these funds increased bymore than 60%, from 54 basis points in 1962 to90 basis points in 1999 (see fig. 2), despite thegreat increase in total assets under management.In addition to documenting these facts, which are
(Journal of Business, 2005, vol. 78, no. 6)B 2005 by The University of Chicago. All rights reserved.0021-9398/2005/7806-0002$10.00
2095
* This paper was previously entitled ‘‘The Behavior ofMutual Fund Investors.’’ We benefited from the comments ofNicholas Barberis, Shlomo Benartzi, Marshall Blume, WilliamGoetzmann, Daniel Hirsch, John Rea, Brian Reid, Jason Zweig,and seminar participants at Duke, the NBER Behavioral FinanceGroup, UCLA, the Western Finance Association Meetings (June2001), and the Conference on Distribution and Pricing of Dele-gated Portfolio Management (Wharton Financial InstitutionsCenterMay 2002).We are grateful to the discount brokerage firmthat provided us with the data for this study. Zheng thanks FangCai and Michael Clare for excellent research assistance. All er-rors are our own.
We argue that thepurchase decisions ofmutual fund investorsare influenced by salient,attention-grabbinginformation. Investorsare more sensitive tosalient, in-your-face fees,like front-end loads andcommissions, thanoperating expenses;they buy funds thatattract their attentionthrough exceptionalperformance,marketing, oradvertising. We analyzemutual fund flows overthe last 30 years andfind negative relationsbetween flows andfront-end-load fees.In contrast, we findno relation betweenoperating expensesand flows. Additionalanalyses indicatethat marketing andadvertising, the costsof which are oftenembedded in funds’operating expenses,account for thissurprising result.
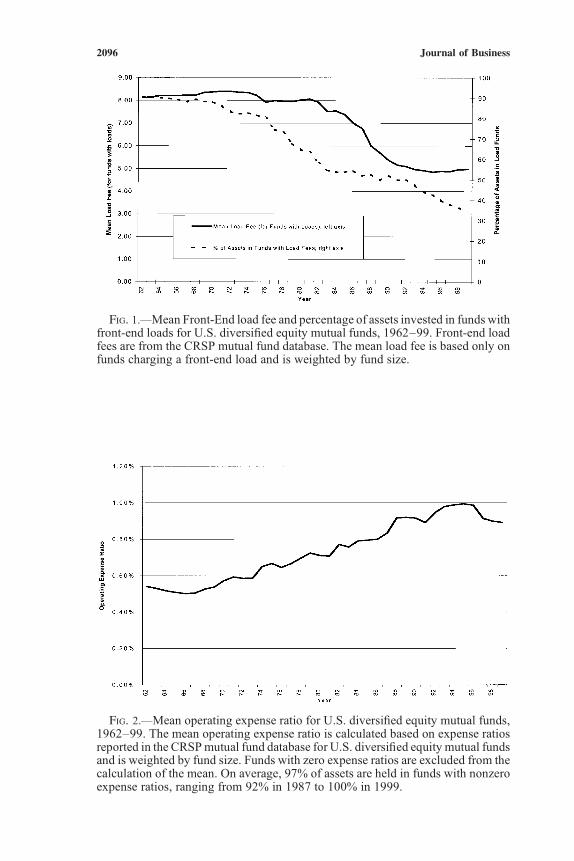
Fig. 1.—Mean Front-End load fee and percentage of assets invested in funds withfront-end loads for U.S. diversified equity mutual funds, 1962–99. Front-end loadfees are from the CRSP mutual fund database. The mean load fee is based only onfunds charging a front-end load and is weighted by fund size.
Fig. 2.—Mean operating expense ratio for U.S. diversified equity mutual funds,1962–99. The mean operating expense ratio is calculated based on expense ratiosreported in the CRSPmutual fund database for U.S. diversified equity mutual fundsand is weighted by fund size. Funds with zero expense ratios are excluded from thecalculation of the mean. On average, 97% of assets are held in funds with nonzeroexpense ratios, ranging from 92% in 1987 to 100% in 1999.
2096 Journal of Business

interesting on their own, we argue that the most plausible explanationfor this change over time is investor learning. Investors have learnedby experience to avoid mutual fund expenses. However, they learnedmore quickly about front-end-load fees, which are large, salient, one-time fees, than operating expenses, which are smaller, ongoing fees thatare easily masked by the volatility of equity returns.When shopping for a mutual fund, investors can choose from thou-
sands of funds, far more than any investor can carefully consider.Most investors have no formal training in what factors to weigh whenselecting a fund. Academic finance advises investors that low fees arepreferable to high fees, that past returns are poor predictors of futurereturns in the long run, and that there is little, or no, evidence that activemanagers can outperform indices. Thus, investors would be best off choos-ing any well-diversified mutual fund with low fees (e.g., an index fund).Over the last three decades, mutual fund investing has increased dra-
matically.1 Investors, in aggregate and individually, have had the op-portunity to learn about mutual funds and to change the ways in whichthey weigh various factors when buying funds. Funds, too, have had theopportunity to adapt to a changing marketplace.In this paper, we focus on changes in how investors treat various
mutual fund expenses, that is, front-end-load fees, commissions, andoperating expenses. We contend that, over time, investors have becomeincreasingly aware of and averse to mutual fund costs. However, theyhave learned more quickly to avoid high front-end-load and commis-sion costs than high operating expense costs.We argue that front-end loads are more salient than operating ex-
penses. Front-end-load fees are paid when a fund is purchased andgenerally obvious in nominal terms on the first statement following thetransaction (load fees are approximately the difference between theamount initially invested in the fund and the fund value on the firstmonthly statement). Therefore, front-end-load fees are transparent andthus salient, in-your-face expenses. While the salience of these expensesmay come too late for first-time fund investors (e.g., may coincide withfirst monthly statement), it is likely to be remembered when they buyagain. Thus, we hypothesize that investors have learned to avoid front-end-load funds by experience. We test this hypothesis in two ways. First,we use fund flows data from 1970 to 1999 to estimate cross-sectionalregressions of fund flows on front-end-load fees and other fund char-acteristics. Consistent with our hypothesis, we find a significant nega-tive relation between fund flows and front-end-load fees. Second, usingbrokerage account data pulled from the trades of 78,000 households from
1. For example, from 1989 to 1998, the percentage of households owning mutual fundsnearly doubled from 7.1% to 16.2%. In contrast, the percentage of households owning stockdirectly increased from 16.2% to 19.2% (Kennickell and Starr-McCluer (1994, 2000)).
2097Expenses on Mutual Fund Flows

1991 to 1996, we contrast first-time mutual fund purchases with repeatmutual fund purchases. The results of this test provide direct evidence oflearning; experienced fund purchasers pay, on average, about half thefront-end-load fees of first time purchasers.Operating expenses are less salient than loads. While operating ex-
penses constitute a steady drain on a fund’s performance, the effect ofthat drain is masked by the considerable volatility in the returns onequity mutual funds.2 Thus, we hypothesize that investors are less likelyto avoid funds with high operating expenses. Using fund flows datafrom 1970 to 1999 and cross-sectional regressions, we document thatthere is at best no relation, and at worst a perverse positive relation, be-tween fund flows and operating expenses. Using brokerage data from1991 to 1996, we find virtually no difference between the operating ex-penses of first-time fund purchases and repeat fund purchases.Our analyses help to inform ongoing policy discussions regarding
how mutual fund expenses should be disclosed to investors. The im-plicit assumption underlying this debate is that mutual fund investorsare sensitive to the form in which fund expenses are disclosed to inves-tors. For example, in June 2000, the General Accounting Office (GAO)issued the following recommendation:
Although most industry officials that the GAO interviewed consid-ered mutual fund disclosures to be extensive, others, including someprivate money managers and academic researchers, indicated that theinformation currently provided does not sufficiently make investorsaware of the level of fees they pay. These critics have called for mutualfunds to disclose to each investor the actual dollar amount of fees paidon their fund shares. Providing such information could reinforce toinvestors the fact that they pay fees on their mutual funds and pro-vide them information with which to evaluate the services their fundsprovide. In addition, havingmutual funds regularly disclose the dollaramounts of fees that investors pay may encourage additional fee-based competition that could result in further reductions in fund ex-pense ratios. GAO is recommending that this information be providedto investors.
In December 2000, the Securities and Exchange Commission issued areport recommending ‘‘that information about the dollar amount of [mutualfund] fees and expenses be presented in a fund’s shareholder reports.’’Both front-end-load fees and operating expenses are used to pay for
marketing (e.g., distribution payments to brokers or advertising). We donot contend that load fees spent on marketing are less efficacious than
2. Mutual funds report returns net of operating expenses. This may cause investors to beless sensitive to operating expenses than if operating expenses and gross returns werereported separately. Thaler (1985) shows that, in general, people are less sensitive to losses(e.g., operating expenses) when those losses are aggregated with other losses (e.g., negativegross fund returns) or with larger gains (e.g., gross fund returns in excess of expenses).
2098 Journal of Business

operating expenses spent on marketing. Rather, we believe that over timeinvestors have learned more quickly to avoid salient load fees than ob-fuscated operating expenses. While virtually all front-end-load fees areused for marketing, operating expenses can be disaggregated into 12B-1fees (fees earmarked for marketing) and other operating expenses.We findthe significant positive relation between flows and expenses is confinedto 12B-1 fees. Thus, all else equal, investors do not prefer to buy mutualfunds with high operating expenses, but they do buy funds that attract theirattention through advertising and distribution. In short, consistent with thefindings of Jain and Wu (2000), mutual fund advertising works.After discussing related literature, we describe our data, present re-
sults, and conclude.
II. Related Literature
Several academic studies have documented a negative relation between afund’s operating expense ratio and performance (e.g., Gruber 1996 andCarhart 1997). Thus, it is sensible for investors to eschew the purchase offunds with high operating expenses. Generally, investors pay fees to mu-tual funds through operating expense ratios applied to assets under man-agement or through load fees charged when investors purchase (or lesscommonly sell) a mutual fund. When purchasing funds through a broker,investors pay a commission to the broker for some mutual funds, but notfor others, which are designated as nontransaction fee (NTF) funds.Survey and experimental evidence support our contention that mu-
tual fund investors are generally unable to assess the trade-off betweendifferent fees charged by mutual funds. Wilcox (2003) presents 50consumers who currently invest in mutual funds with profiles of stockmutual funds with different expense ratio and load combinations. Hedocuments that 46 of the 50 study participants overemphasized loadsrelative to expense ratios. Alexander, Jones, and Nigro (1998) docu-ment that less than 20% of 2,000 surveyed mutual fund investors couldgive an estimate of the expenses incurred for their largest mutual fundholding. Furthermore, despite empirical evidence to the contrary, 84%of respondents believed that mutual funds with higher expenses earnedaverage or above average returns.Surprisingly little empirical research has been done on how investors
consider expenses when investing in mutual funds. The only empiricalwork that we are aware of is Sirri and Tufano (1998), who document anegative relation between fund flows and total fund expenses (amor-tized front-end-load fees and operating expenses).We fill this void in the empirical literature by analyzing new money
flowing into mutual funds from 1970 through 1999. When we separatefront-end-load fees and expense ratios, we find strong evidence thatinvestors treat the two differently. In both univariate and multivariate
2099Expenses on Mutual Fund Flows

analyses, we document a significant negative relation between fund flowsand front-end-load fees, but no relation, or a positive one, between fundflows and operating expenses. When we disaggregate operating expensesinto 12B-1 fees and other operating expenses for the limited sample pe-riod for which we have 12B-1 fee data (1993–99), we find the significantpositive relation between flows and expenses confined to 12B-1 fees.
III. Data
We obtained data on mutual funds from the Center for Research in Se-curity Prices (CRSP) mutual fund database. Consistent with many priormutual fund studies, we restricted our analysis to diversified U.S. equitymutual funds.3 Thus, we exclude from our analyses bond funds, inter-national equity funds, and specialized sector funds. The number of fundsmeeting these data requirements grew over time. In 1970, 465 funds metthese requirements, while in 1998, 3,533 funds met these requirements.We analyze the period 1970 through 1999, since the CRSP database
reports total net assets (TNA) on a quarterly basis beginning in 1970.Consistent with prior research, we calculate new money as a percentageof beginning-of-period TNA as
TNAit ! TNAi; t!1ð1þ RitÞTNAi; t!1
;
where Rit is the return of fund i in period t. Essentially, this is a percent-age growth in new money during period t. Here we assume that newmoney flows in and out of each fund at the end of each period since wedo not know the exact timing of cash flows. For some analyses we usequarterly growth, while for others we use annual growth. The medianmutual fund experiences annual growth of 5.3% and quarterly growthof 1.2%. There is considerable cross-sectional variation in growth. Theinterquartile range is !21 to 51% for annual growth and!3 to 11% forquarterly growth. High growth in new money relative to other fundsgenerally leads to a greater market share.4
3. We selected funds according to the following criteria. First, we selected fundswith the follow-ing Investment Company Data, Inc. (ICDI) objectives: aggressive growth, growth and income,long-termgrowth, or total return (only if they have the following Strategic Insight’s fund objectives:flexible, growth, or income growth). If ICDI objectives are missing, we select funds with the fol-lowing Strategic Insight’s fund objectives: aggressive growth, growth and income, growth, incomegrowth, or small company growth. If both ICDI and Strategic Insight’s objectives are missing, weselect funds with the following Weisenberger fund types: AAL, AGG, G, G-I, G-I-S, G-S, G-S-I,GCI, GRI, GRO, I-G, I-G-S, I-S, I-S-G,MCG, SCG, or TR. If all three of these criteria aremissing,we select funds described as common stock funds according to the policy and objective codes.4. There are obviously exceptions to this general relationship. For example, a fund with
strong performance and negative growth in new money might lose market share—clearly anunusual occurrence since it is well documented that the highest growth in new money occursfor funds with strong performance.
2100 Journal of Business

IV. Results
A. Univariate Sorts
Our primary focus is the relation between different forms of expensesand the growth of new money. We begin by presenting basic descriptivestatistics for two partitions of our data. In the first partition, we constructdeciles on the basis of expense ratios; in the second partition, we com-pare funds with front-end loads to those without front-end loads. Foreach partition, we calculate mean expense ratios, front-end-load fees,and TNA for the sorting year, while we calculate the annual growth ofnew money and fund returns during the following year.We calculate the mean monthly return for funds in each partition and
two performance measures: the capital asset pricing model (CAPM)alpha and a three-factor alpha. These performance measures are basedon the time-series of mean monthly returns for mutual funds within apartition (Rpt), where funds are reassigned to partitions annually. TheCAPM alpha is the intercept from the following time-series regression:
ðRpt " RftÞ ¼ aþ bðRmt " RftÞ þ "t;
where
Rft = the monthly return on T-bills,5
Rmt = the monthly return on a value-weighted market index,a = the CAPM intercept (Jensen’s alpha),b = the market beta, and"i = the regression error term.
The Fama-French alpha is the intercept from the three-factor modeldeveloped by Fama and French (1993):
ðRpt " RftÞ ¼ aþ bðRmt " RftÞ þ sSMBt þ hHMLt þ "t;
where SMBt is the return on a value-weighted portfolio of small stocksminus the return on a value-weighted portfolio of big stocks andHMLt isthe return on a value-weighted portfolio of high book-to-market stocksminus the return on a value-weighted portfolio of low book-to-marketstocks.6 The regression yields parameter estimates of a, b, s, and h. Theerror term in the regression is denoted by "t .The results of this analysis are presented in table 1. In panel A,
we present results for mutual funds sorted into deciles on the basis of
5. The return on T-bills is from Stocks, Bonds, Bills, and Inflation, 2000 Yearbook ,Ibbotson Associates, Chicago.6. The construction of these portfolios is discussed in detail in Fama and French (1993).
We thank Kenneth French for providing us with these data.
2101Expenses on Mutual Fund Flows

TABLE 1 Descriptive Statistics for Mutual Funds Sorted by Expense Ratio Deciles and Front-End-Load versus No-Load Funds, 1970–99
DecileMean Expense
Ratio (%)Mean LoadFee (%)
Mean TNA($mil.)
Mean New Money(% of TNA)
Mean MonthlyReturn (%)
CAPM Alpha(%)
Fama-FrenchAlpha (%)
Panel A. Operating Expense Partition
1 ( low) .47 3.77 844.821 !1.33 1.056 !.059 !.0042 .72 4.19 456.255 !.89 1.038 !.068 !.0063 .85 3.84 301.311 1.57 1.066 !.057 .0064 .96 4.36 232.351 2.76 1.010 !.102 !.0355 1.07 4.23 151.334 6.76 1.079 !.037 .0556 1.18 4.19 112.470 9.79 1.010 !.149 !.0527 1.34 3.90 93.703 9.37 1.027 !.119 !.0408 1.53 3.10 77.198 17.37 1.055 !.057 .0269 1.76 2.68 46.936 20.82 1.096 !.029 .03010 (high) 3.18 1.67 25.037 20.77 .816 !.366** !.256*
Panel B. Front-End-Load vs. No-Front-End-Load Funds
No load 1.07 0 158.479 6.61 1.079 !.059 .012Load 1.13 6.77 296.890 .04 1.026 !.098 !.017
Note.—In panel A, funds are sorted into deciles on the basis of operating expense ratios in year t ! 1 from 1969–1998. In panel B, funds are sorted into deciles on the basis offront-end-load fees in year t ! 1 from 1969 to 1998. The table presents the number of funds, mean expense ratio, front-end-load fee, and mean TNA in sorting year (t ! 1). Newmoney as a percentage of TNA and the equally weighted mean monthly return for each performance decile are for the subsequent year (t). The CAPM alpha is the intercept from amonthly time-series regression of the mean monthly excess return for each sample partition on the market excess return. The Fama-French alpha is the intercept from a monthlytime-series regression of the mean monthly excess return for each sample partition on the market excess return, a zero-investment portfolio formed on the basis of firm size, and azero-investment portfolio formed on the basis of book-to-market ratios.**, * Significant at the 5% or 10% level, two -tailed test.
2102Jou
rnal
ofBusin
ess

expense ratios, while panel B contrasts front-end-load and no-front-end-load funds. Load fees and operating expenses are not perfect substitutes.Although low expense funds have higher front-end-load fees than highexpense funds, the relation between expenses and front-end loads is farfrom monotonic. In addition, front-end-load funds have higher averageexpense ratios than funds without front-end loads. Clearly, investors couldchoose a fund with no front-end load and low expenses. For example, inMay 2002, the Vanguard 500 Index fund charged no front-end load andsported an expense ratio of 18 basis points.Funds with low expense ratios are dramatically larger than funds with
high expense ratios. For example, the funds in the lowest expense decilerepresent 36% of assets in mutual funds, while funds in the highest ex-pense decile represent only 1%. This is consistent with the evidence inKhorana and Servaes (2000), who document fund families with low ex-penses have a higher market share than fund families with higher ex-penses. Low expenses may attract investors, or new money may lead toeconomies of scale that allow funds to lower expenses. Thus, it is un-clear whether low expenses lead to a greater market share or a greatermarket share leads to lower expenses.If low expenses lead to a greater market share, we would expect growth
rates to be higher for funds with low expenses. This is not the case duringour sample period. In fact, our crude univariate sorts indicate a nearlymonotonic positive relationship between expenses and growth rates.Funds with high expenses have the highest growth rates. In contrast,funds without front-end loads, which tend to be smaller than front-end-load funds, enjoy higher growth rates.In the last three columns of table 1, we present the mean monthly
returns for each partition, the CAPM alpha, and the Fama-French alpha.Although there is no discernible relationship between performance andexpenses for the majority of funds, investors clearly pay a large price forinvesting in funds with the highest expenses. These funds underperformby an economically large margin (26 to 37 basis points per month).7
Furthermore, the returns on front-end-load funds are not significantlydifferent from the returns on other funds. Thus, these results confirm theconventional wisdom that investors should spurn funds with front-endloads or high expenses.
B. Multivariate Analyses
The results based on univariate sorts are insufficient evidence to drawstrong conclusions about the relationship between new money and op-erating expenses or front-end-load fees. It is possible that the univariate
7. During our sample period, the CAPM alpha for the average diversified U.S. equitymutual fund is !0.10% per month, while the Fama-French alpha is !0.02% per month.Neither figure is reliably different from zero.
2103Expenses on Mutual Fund Flows

relationships are driven solely by mean reversion in market share overtime: small funds, which have high expense ratios, gain market share,while large funds, which have low expense ratios, lose market share.To address this possibility, we estimate a series of cross-sectional
regressions. The dependent variable in these regressions is the quarterlynet flow scaled by beginning of quarter TNA for each diversified U.S.equity mutual fund from the first quarter of 1970 to third quarter of1999.8 For each quarter, we regress this dependent variable on a series ofindependent variables, which we describe next. Test-statistics are basedon the time series of coefficient estimates across the 119 quarters. Notethat our dependent variable measures changes in investor buying be-havior over time. For example, if flow scaled by TNA is negativelyrelated to front-end-load fees, then investors are putting relatively lessmoney into front-end-load funds over time.To control for the effect of performance on fund flows, we include the
annual market-adjusted returns on the fund during each of the 2 yearspreceding quarter t as independent variables in the regressions. Theannual market-adjusted return is the annual fund return less the annualreturn on the CRSP NYSE/ASE/NASDAQ value-weighted index. Weinclude squared market-adjusted returns for each of the previous 2 yearsto capture the well-documented nonlinear relation between performanceand fund flows (Sirri and Tufano 1998; Chevalier and Ellison 1997). Wealso include a fund’s monthly return standard deviation (measured overthe 2 years leading up to quarter t), as an independent variable in theregression. Monthly return standard deviation measures the short-termvolatility of a fund. All independent variables in the regressions are fromthe CRSP mutual fund database.9
Our primary focus is the relation between fund flows and expenses.First, we replicate the results of Sirri and Tufano (1998) by calculatingtotal expenses for each fund. As in Sirri and Tufano (1998), total ex-penses are defined to be the operating expense ratio plus one-seventhof the percentage front-end-load fee, if any.10 This calculation assumesthat an investor in a load fund would hold the fund for 7 years, thus
8. To reduce the effect of outliers on the coefficient estimates, we winsorize the depen-dent variables at the ninety-ninth percentile. Our results are qualitatively similar when weinclude these outliers. We also exclude 26 funds that were closed to new investment duringour sample period. Fund closing data are from CRSP. These funds are excluded in the yearof closing and all subsequent years.9. The CRSP mutual fund database reports zero operating expenses and turnover for a
large number of funds. Based on our discussions with CRSP, zero operating expenses likelyindicate missing information. Thus, we exclude funds with either zero operating expensesfrom these analyses. From 1990 to 1995, CRSP reports nonzero operating expense ratios for87% of funds.10. We exclude back-end-load fees from our calculation of total expenses for two reasons.
First, data on back-end loads is not available in the CRSP database prior to 1993. (The post-1993 data on back-end loads also often reports a redemption fee as a back-end load.) Second,back-end loads are often waived if an investor holds a fund for a specified period of time.
2104 Journal of Business

amortizing the front-end-load fee over that holding period. This re-gression specification obviously assumes that investors respond simi-larly to load fees and expense ratios. To test our conjecture that they donot, we then estimate regressions that include operating expenses andfront-end-load fees as separate independent variables. We include adummy variable that takes on a value of 1 if a fund is in the highestexpense decile, since it is among these funds where high expensesextract the largest performance penalty. To control for the possibilitythat fund families are steering money into new funds (with lower front-end loads and higher operating expenses) and thus creating a spuriouscorrelation between loads and growth, we include the log of fund age asan independent variable. We also estimate these regressions excludingfunds less than 5 years old. Since we are concerned that our resultsmight be driven by small funds, we include the log of total net assetvalue as an independent variable. We also estimate these regressions ineach quarter for the 50 mutual funds with the largest beginning-of-quarter TNA and estimate regressions excluding the smallest 30% offunds in our sample.In a plausible equilibrium, we would expect no relation between fund
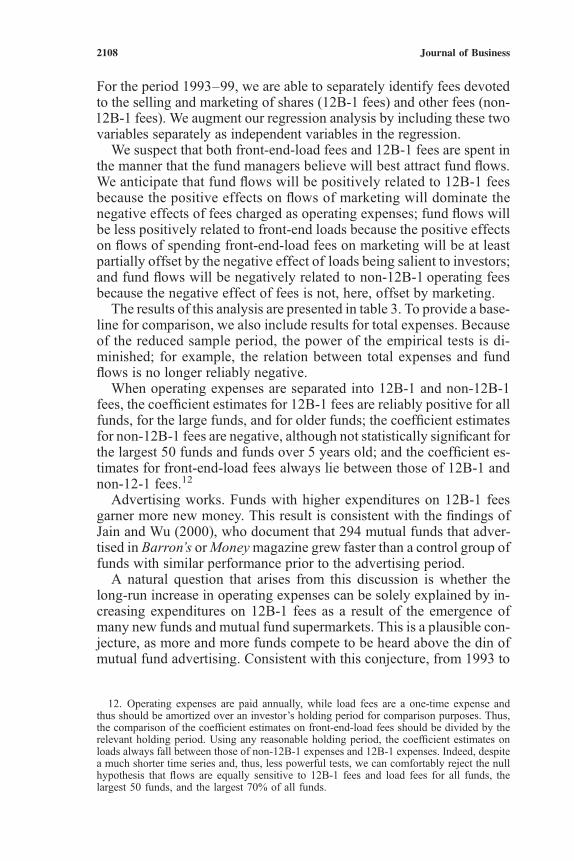
flows and any of our expense variables. For example, one group ofinvestors might reasonably prefer front-end-load funds with lowexpenses, while a second group of investors might reasonably prefer no-load funds with higher expenses. Assuming the preferences of the twogroups do not change over time and the wealth of the two groups growssimilarly over time, expenses and loads would be unrelated to fundflows. Thus, the coefficient estimates on our expense variables from thecross-sectional regressions are tests of changing preferences over time.We hypothesize that investors have learned to avoid front-end-loadfunds but not operating expenses. Thus, we predict a stronger negativerelation between front-end-load fees and flows than between operatingexpenses and flows.The results of this analysis are presented in table 2. Consider first the
results for the control variables. The coefficient estimates on the returnvariables are consistent with the nonlinearity in the relationship betweenperformance and fund flows. The cross-sectional standard deviation ofmarket-adjusted returns for mutual funds is roughly 10%. Thus, ourregression estimates for all funds indicate that a fund that beats themarket by 10% (roughly a one standard deviation event) experiencesgrowth of 5% (e.g., using coefficients from the second column of table 2,0:393*0:1þ 1:01*0:12 " 0:05), while a fund that lags the market by10% shrinks by 3%. A fund that beats the market by 20% experiencesgrowth of 12%, while a fund that lags the market by 20% shrinks byonly 4%. Consistent with the evidence in Chevalier and Ellison (1997),these patterns are less pronounced for larger and older funds. There is anegative relationship between monthly volatility and flows. Small funds
2105Expenses on Mutual Fund Flows
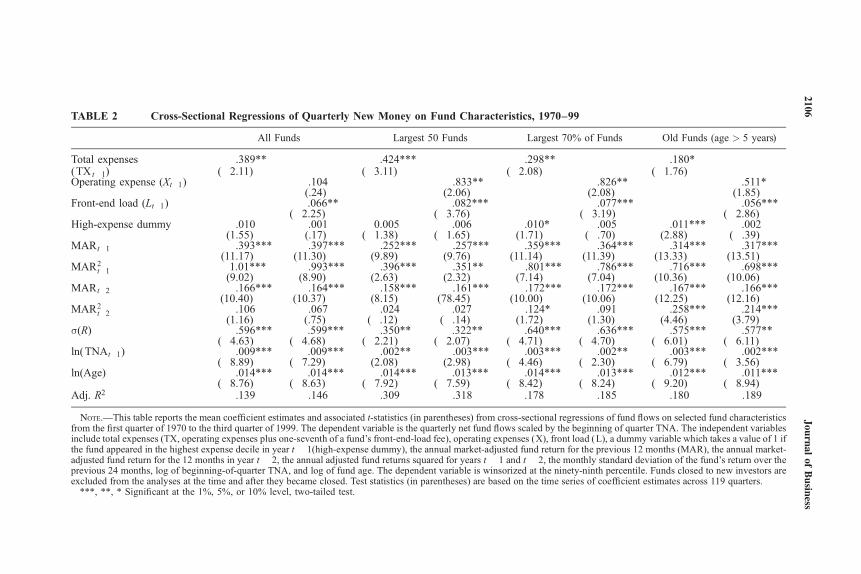
TABLE 2 Cross-Sectional Regressions of Quarterly New Money on Fund Characteristics, 1970–99
All Funds Largest 50 Funds Largest 70% of Funds Old Funds (age > 5 years)
Total expenses !.389** !.424*** !.298** !.180*(TX t!1) (!2.11) (!3.11) (!2.08) (!1.76)Operating expense (Xt!1) .104 .833** .826** .511*
(.24) (2.06) (2.08) (1.85)Front-end load (Lt!1) !.066** !.082*** !.077*** !.056***
(!2.25) (!3.76) (!3.19) (!2.86)High-expense dummy .010 .001 !0.005 !.006 .010* !.005 .011*** !.002
(1.55) (.17) (!1.38) (!1.65) (1.71) (!.70) (2.88) (!.39)MARt!1 .393*** .397*** .252*** .257*** .359*** .364*** .314*** .317***
(11.17) (11.30) (9.89) (9.76) (11.14) (11.39) (13.33) (13.51)MAR2
t!1 1.01*** .993*** .396*** .351** .801*** .786*** .716*** .698***(9.02) (8.90) (2.63) (2.32) (7.14) (7.04) (10.36) (10.06)
MARt!2 .166*** .164*** .158*** .161*** .172*** .172*** .167*** .166***(10.40) (10.37) (8.15) (78.45) (10.00) (10.06) (12.25) (12.16)
MAR2t!2 .106 .067 !.024 !.027 .124* .091 .258*** .214***
(1.16) (.75) (!.12) (!.14) (1.72) (1.30) (4.46) (3.79)s(R) !.596*** !.599*** !.350** !.322** !.640*** !.636*** !.575*** !.577**
(!4.63) (!4.68) (!2.21) (!2.07) (!4.71) (!4.70) (!6.01) (!6.11)ln(TNAt!1) !.009*** !.009*** .002** .003*** !.003*** !.002** !.003*** !.002***
(!8.89) (!7.29) (2.08) (2.98) (!4.46) (!2.30) (!6.79) (!3.56)ln(Age) !.014*** !.014*** !.014*** !.013*** !.014*** !.013*** !.012*** !.011***
(!8.76) (!8.63) (!7.92) (!7.59) (!8.42) (!8.24) (!9.20) (!8.94)Adj. R2 .139 .146 .309 .318 .178 .185 .180 .189
Note.—This table reports the mean coefficient estimates and associated t-statistics (in parentheses) from cross-sectional regressions of fund flows on selected fund characteristicsfrom the first quarter of 1970 to the third quarter of 1999. The dependent variable is the quarterly net fund flows scaled by the beginning of quarter TNA. The independent variablesinclude total expenses (TX, operating expenses plus one-seventh of a fund’s front-end-load fee), operating expenses (X), front load (L), a dummy variable which takes a value of 1 ifthe fund appeared in the highest expense decile in year t ! 1(high-expense dummy), the annual market-adjusted fund return for the previous 12 months (MAR), the annual market-adjusted fund return for the 12 months in year t ! 2, the annual adjusted fund returns squared for years t ! 1 and t ! 2, the monthly standard deviation of the fund’s return over theprevious 24 months, log of beginning-of-quarter TNA, and log of fund age. The dependent variable is winsorized at the ninety-ninth percentile. Funds closed to new investors areexcluded from the analyses at the time and after they became closed. Test statistics (in parentheses) are based on the time series of coefficient estimates across 119 quarters.***, **, * Significant at the 1%, 5%, or 10% level, two-tailed test.
2106Jou
rnal
ofBusin
ess

experience higher growth rates, although this relation reverses when weanalyze only the largest 50 funds. Older funds also experience lowergrowth rates than younger funds.There is a significant negative relation between total expenses and
fund flows, consistent with the results reported by Sirri and Tufano(1998). This relation holds for all funds, although the economic signif-icance of the relation is modest. A 100 basis point decrease in total ex-penses is associated with 0.39% growth in new money. The results ofour remaining analyses are generally consistent with this negative buteconomically small relation between total expenses and flows.However, when we include operating expenses and front-end-load
fees as separate independent variables in the regression, the negativerelation between total expenses and flows is clearly driven by a signifi-cant negative relation between front-end load fees and flows. For allfunds, there is no relation between operating expenses and flows, whilefor the largest 50 funds, the largest 70% of funds, and funds older than 5years there is a positive relation. This evidence indicates that the resultsfrom the univariate sorts presented previously are not driven solely bysmall or young funds. Thus, consistent with our hypothesis that inves-tors respond differently to different expenses, we document a signifi-cant negative relation between flows and front-end loads. In contrast,there is, at best, no relation between operating expenses and flows and, atworst, a perverse positive relation between expenses and flows for largefunds.11
C. The Role of Advertising
The lack of relation between expense ratios and fund flows suggests thatmutual funds can raise operating expense ratios with impunity. This isnot the case. Mutual fund managers have a choice between pocketingexpenses or spending on marketing. In this section, we present evidencethat expenditures on marketing can largely explain the lack of relationbetween expense ratios and fund flows.Mutual funds can take out up to 1.25% of average daily fund assets
each year to cover the costs of selling and marketing shares, an ar-rangement allowed by the SEC’s Rule 12B-1, which was passed in 1980.CRSP provides data on these so-called 12B-1 fees beginning in 1993.
11. A significant portion of cash flows to mutual funds come from employee-sponsoredretirement plans. These cash flows also tend to be persistent, as investors in employee-sponsored retirement plans do not change their fund allocations regularly. Although we areunable to identify the source of funds in the analyses that rely on aggregate flows usingCRSP data, we later analyze flows at brokerage accounts that do not include employee-sponsored retirement plans. Similar to the results discussed here, we find a negative relationbetween front-end loads and flows but no reliable relation between operating expenses andflows. Furthermore, these results are similar when we separately identify flows in taxableaccounts and tax-deferred accounts (e.g., 401k and Keogh).
2107Expenses on Mutual Fund Flows
For the period 1993–99, we are able to separately identify fees devotedto the selling and marketing of shares (12B-1 fees) and other fees (non-12B-1 fees). We augment our regression analysis by including these twovariables separately as independent variables in the regression.We suspect that both front-end-load fees and 12B-1 fees are spent in
the manner that the fund managers believe will best attract fund flows.We anticipate that fund flows will be positively related to 12B-1 feesbecause the positive effects on flows of marketing will dominate thenegative effects of fees charged as operating expenses; fund flows willbe less positively related to front-end loads because the positive effectson flows of spending front-end-load fees on marketing will be at leastpartially offset by the negative effect of loads being salient to investors;and fund flows will be negatively related to non-12B-1 operating feesbecause the negative effect of fees is not, here, offset by marketing.The results of this analysis are presented in table 3. To provide a base-
line for comparison, we also include results for total expenses. Becauseof the reduced sample period, the power of the empirical tests is di-minished; for example, the relation between total expenses and fundflows is no longer reliably negative.When operating expenses are separated into 12B-1 and non-12B-1
fees, the coefficient estimates for 12B-1 fees are reliably positive for allfunds, for the large funds, and for older funds; the coefficient estimatesfor non-12B-1 fees are negative, although not statistically significant forthe largest 50 funds and funds over 5 years old; and the coefficient es-timates for front-end-load fees always lie between those of 12B-1 andnon-12-1 fees.12
Advertising works. Funds with higher expenditures on 12B-1 feesgarner more new money. This result is consistent with the findings ofJain and Wu (2000), who document that 294 mutual funds that adver-tised in Barron’s orMoneymagazine grew faster than a control group offunds with similar performance prior to the advertising period.A natural question that arises from this discussion is whether the
long-run increase in operating expenses can be solely explained by in-creasing expenditures on 12B-1 fees as a result of the emergence ofmany new funds and mutual fund supermarkets. This is a plausible con-jecture, as more and more funds compete to be heard above the din ofmutual fund advertising. Consistent with this conjecture, from 1993 to
12. Operating expenses are paid annually, while load fees are a one-time expense andthus should be amortized over an investor’s holding period for comparison purposes. Thus,the comparison of the coefficient estimates on front-end-load fees should be divided by therelevant holding period. Using any reasonable holding period, the coefficient estimates onloads always fall between those of non-12B-1 expenses and 12B-1 expenses. Indeed, despitea much shorter time series and, thus, less powerful tests, we can comfortably reject the nullhypothesis that flows are equally sensitive to 12B-1 fees and load fees for all funds, thelargest 50 funds, and the largest 70% of all funds.
2108 Journal of Business

TABLE 3 Cross-Sectional Regressions of Quarterly New Money on Fund Characteristics: 1993–99
All Funds Largest 50 Funds Largest 70% of Funds Old Funds (Age > 5 Years)
Total expenses (TX t!1) !.523(!1.58)
!.050(!.18)
.221(.79)
.122(.64)
Front-end load (Lt!1) .040(.65)
!.039(!.73)
.037(.68)
.080*(2.02)
High-expense dummy .006(.66)
.008(.69)
!.001(!1.00)
!.003(!1.00)
.017**(2.08)
.018*(1.87)
.011**(2.64)
.011**(2.11)
Non-12Bt!1 !1.828***(!2.95)
!1.223(!1.39)
!1.171**(!2.69)
!.212(!.67)
12Bt!1 1.454***(2.81)
1.542***(3.23)
1.432***(2.89)
.957**(2.42)
MARt!1 .781***(11.33)
.788***(11.10)
.494***(9.70)
.506***(9.49)
.715***(10.66)
.721***(10.71)
.602***(15.61)
.605***(15.57)
MAR2t!1 1.634***
(6.83)1.678***(7.38)
!.277(!.75)
!.141(!.39)
1.564***(5.43)
1.602***(5.68)
1.039***(7.38)
1.057***(7.44)
MARt!2 .246***(7.05)
.251***(7.29)
.228***(5.37)
.236***(5.38)
.273***(8.63)
.274***(8.61)
.285***(13.92)
.290***(14.18)
MAR2t!1 !.026
(!.18).064(.46)
!1.235**(!2.22)
!1.379**(!2.50)
!.224(!1.61)
!.189(!1.35)
.278**(3.56)
.315***(4.04)
S(R) !1.094***(!4.01)
!1.029***(!3.74)
!.310(!.80)
!.139(!.35)
!1.263***(!4.67)
!1.201***(!4.40)
!.957***(!5.31)
!.939***(!5.16)
ln(TNAt!1) !.020***(!8.32)
!.021***(!8.60)
.001(.37)
!.0002(!.07)
!.006***(!6.35)
!.008***(!7.35)
!.005***(!8.28)
!.005***(!8.01)
ln(age) !.015***(!7.23)
!.013***(!6.00)
!.017***(!7.60)
!.016***(!6.81)
!.019***(!8.87)
!.018***(!8.51)
!.013***(!7.68)
!.012***(!7.57)
Adj. R2 .099 .101 .402 .417 .153 .156 .174 .177
Note.—This table reports the mean coefficient estimates and associated t-statistics (in parentheses) from cross-sectional regressions of fund flows on selected fund characteristicsfrom the first quarter of 1993 to the third quarter of 1999. The dependent variable is the quarterly net fund flows scaled by the beginning of quarter TNA. The independent variablesinclude total expenses (TX, operating expenses plus one-seventh of a fund’s front-end-load fee), front load (L), a dummy variable which takes a value of 1 if the fund appeared in thehighest expense decile in year t! 1 (high-expense dummy), non-12B expenses, 12B expenses, the annual market-adjusted fund return for the previous 12 months (MAR), the annualmarket-adjusted fund return for the 12 months in year t! 2, the annual adjusted fund returns squared for years t! 1 and t! 2, the monthly standard deviation of the fund’s return overthe previous 24 months, log of beginning-of-quarter TNA, and log of fund age. The dependent variable is winsorized at the ninety-ninth percentile. Funds closed to new investors areexcluded from the analyses at the time and after they became closed. Test statistics (in parentheses) are based on the time series of coefficient estimates across 27 quarters.***, **, * Significant at the 1%, 5%, or 10% level, two -tailed test.
2109Expen
seson
Mutual
FundFlow
s

1999 the mean (TNA-weighted) 12B-1 fee charged by mutual fundsincreased from 0.139% to 0.202%. (There was also a marked increase inthe proportion of funds charging 12B-1 fees during this period, from34% of all funds in 1993 to 57% of all funds in 1999.) However, from1962 to 1999, the mean (TNA-weighted) operating expense increasedby 35 basis points. Thus, increased expenditures on 12B-1 fees, thoughthey may have contributed to the long-run increase in operating ex-penses, cannot totally explain the increase.
D. Mutual Fund Commissions
With the exception of front-end-load fees, mutual fund investors cangenerally purchase mutual funds directly from the fund complex at zerotransaction costs. However, many mutual funds are traded throughmutual fund marketplaces at major brokerage firms. When purchasingmutual funds through a broker, a commission is charged for the pur-chase or sale of some funds, but not others. Generally fund complexeswill pay a fee to the broker to gain status as a nontransaction fee fund.Laplante (2001) documents that funds traded with NTF status on market-places have expense ratios that are 17 to 19 basis points higher than fundsnot available in the marketplaces.13 We hypothesize that commissions,like load fees, are salient expenses for many investors and thus expectthat funds with NTF status will garner more new money, despite higheraverage operating expenses.To test this hypothesis, we analyze the mutual fund purchase and
sale decisions of households with accounts at one nationwide discountbroker. The data span the period 1991 through 1996 (see Barber andOdean 2000 for a more complete description of these data). Of the78,000 sampled households, 32,199 (41%) had positions in mutualfunds during at least 1 month; the remaining households held either cashor investments in securities other than mutual funds. For the 78,000households, 17% of all market value was held in mutual funds and 64%in individual common stocks. There were over 3 million trades in allsecurities. Mutual funds accounted for 18% percent of all trades; indi-vidual common stocks accounted for 64%. By virtue of being bought orsold through one brokerage, all of the funds traded in this sample arepart of that brokerage’s mutual fund ‘‘supermarket,’’ but not all funds inthe supermarket have NTF status. In our sample, 76% of fund purchasesand 49% of sales are NTF funds.
13. Ciccotello, Greene, and Walsh (2003) analyze funds traded in a supermarket andthose that are not. They document that the mean expense ratios of funds traded in mar-ketplaces are similar to those not traded in a marketplace. They also find that funds do notincrease their expense ratios or the 12B-1 fees after they join an NTF supermarket. In con-trast, the conclusions of Laplante (2001) are based on a multivariate regression of operatingexpenses on fund characteristics.
2110 Journal of Business

Of the 32,199 households with positions in mutual funds, the averageheld 3.6 mutual funds worth $36,988. Both of these numbers are pos-itively skewed. The median household held two mutual funds worth$12,844 dollars. For these households, the positions in mutual fundsand individual common stocks were roughly equal. Forty-two percentof the market value in these accounts was held in mutual funds and 39%in individual common stocks. In aggregate, these households held 1,073mutual funds worth $1.4 billion in December 1996.For each fund (i ) in each month (t), we estimate new money as the
value of buys (B) less the value of sells (S ) scaled by beginning of monthtotal net assets (TNA): ðBit " SitÞ=TNA i; t"1. Unlike that in the aggre-gate case, here we know the exact amount and timing of new money. Asbefore, we estimate cross-sectional regressions for each month thenaverage coefficient estimates across months. We also include a dummyvariable that takes on a value of 1 if a fund can be traded without a com-mission (a nontransaction fee fund).14
The results of this analysis are presented in table 4. Consistent withour prior results, we find either no relation or a positive relation betweenfunds’ operating expenses and new money for these households. Alsoconsistent with our prior evidence, we find a significant negative rela-tion between front-end-load fees and new money.The primary variable of interest—the NTF dummy—is consistently
positive for all eight regressions and significant for six of these. NTFfunds garner significantly more new money than funds for which in-vestors pay a commission to buy or sell. Commissions are salient, one-time expenses to which investors attend.
E. Experienced versus First-Time Mutual Fund Buyers
We contend that front-end-load fees are more obvious and salient toinvestors than operating expense fees. We believe that a large, one-timefee is more likely to capture an investor’s attention than a smaller, on-going expense. Both loads and fees are usually quoted in percentageterms. However, the dollar cost of a front-end load is likely to be obviouswhen an investor receives the first fund statement (i.e., approximately thedifference between the amount invested and the first statement balance).The immediate effect of operating expenses on the investor’s principalis small and the subsequent drain of operating expenses on return islikely to be masked by fund volatility. An important implicit assumptionin our argument is that investors learn by experience and they learnmorequickly about salient load fees than the less obvious operating expenses.We are able to test this hypothesis directly using the discount brokerageaccount data.
14. We define a fund as a nontransaction fee fund if more than 90% of the trades in thefund were executed without a commission during our sample period.
2111Expenses on Mutual Fund Flows

TABLE 4 Cross-Sectional Regressions of Monthly New Money from Discount Brokerage Accounts, 1991–96
All Funds Largest 50 Funds Largest 70% of Funds Old Funds (Age > 5 Years)
Total expenses(TXt!1) 990.64 !989.92*** !1,103.60 1,002.82(.67) (!3.17) (!1.20) (.64)
Operating expense Xt!1) 6,264.49** !338.17 5,837.25*** 4,716.46*(2.41) (!.34) (2.63) (1.78)
Front-end load(Lt!1) !1,018.58*** !179.74* !1,033.02*** !682.60***(!4.14) (!1.92) (!4.40) (!3.00)
High-expense dummy 66.52* !11.70 7.35 6.19 103.36 3.49 32.55 !26.26(1.66) (!0.26) (1.60) (1.30) (1.62) (.05) (.89) (!.63)
NTF dummy 30.20** 52.65*** 5.94 7.05** 8.38 25.52*** 34.52*** 51.41***(2.63) (4.54) (1.55) (2.05) (.77) (2.67) (3.44) (4.80)
MARt!1 1,081.23*** 1,095.17*** 155.96*** 192.01*** 841.94*** 849.86*** 883.96*** 900.24***(7.39) (7.51) (2.60) (3.07) (7.21) (7.44) (6.61) (6.64)
MAR2t!1 2,887.57*** 2,671.81*** 712.34 562.33 3,026.80*** 2,878.48*** 1,769.01** 1585.74**
(3.37) (3.19) (1.11) (.92) (4.77) (4.58) (2.25) (2.05)MARt!2 53.19 54.65 193.66*** 160.57*** 46.82 19.05 104.59 106.51***
(.47) (.47) (3.28) (2.73) (.42) (.18) (.99) (.99)MAR2
t!2 !666.86 !1,027.06 !341.61 !287.18 !1,287.98* !1,607.39** !380.15 !710.38(!.94) (!1.47) (!.72) (!.60) (!1.81) (!2.23) (!.55) (!1.06)
S(R) !4,928.40*** !4,934.79*** !868.63** !897.09** !1,820.23 !1,805.24 !5,307.07*** !5,254.63***(!3.31) (!3.33) (!1.96) (!1.96) (!1.61) (!1.61) (!3.78) (!3.75)
ln(TNAt!1) 6.81 14.91* .34 .71 !12.31** !1.32 12.70 18.59**(.93) (1.77) (.16) (.41) (!2.51) (!.26) (1.64) (2.07)
ln(age) 15.68** 21.49*** .46 1.05 7.47 14.25* 13.82** 18.42**(2.29) (2.81) (.15) (.30) (1.13) (1.80) (2.04) (2.52)
Adj. R2 .082 .088 .190 .206 .112 .121 .079 .085
Note.—This table reports the mean coefficient estimates and associated t-statistics (in parentheses) from cross-sectional regressions of fund flows based on the accounttransaction data from a U.S. discount brokerage firm on selected fund characteristics from January 1991 to November 1996. The dependent variable, ðBit ! SitÞ=TNAi;t!1, is thetotal value of buys less the total value of sells for fund i scaled by the beginning-of-month TNA. The independent variables include total expenses (TX, operating expenses plusone-seventh of a fund’s load fee), operating expenses (X ), front load (L), a dummy variable which takes a value of 1 if the fund appeared in the highest expense decile in year t !1(high-expense dummy), the annual market-adjusted fund return for the previous 12 months (MAR), the annual market-adjusted fund return for the 12 months in year t ! 2, theannual adjusted fund returns squared for years t ! 1 and t ! 2, the monthly standard deviation of the fund’s return over the previous 24 months, log of beginning-of-quarter TNA,and log of fund age. The dependent variable is winsorized at the ninety-ninth percentile and is multiplied by 1 million. Funds closed to new investors are excluded from the analyses atthe time and after they became closed. Test statistics (in parentheses) are based on the time series of coefficient estimates across 72 months.***, **, * Significant at the 1%, 5%, or 10% level, two-tailed test.
2112Jou
rnal
ofBusin
ess

Many investors purchase more than one mutual fund in their life.If we are correct in our contention that load fees are more salient thanoperating expenses and investors learn over time, then we would expectrepeat buyers to demonstrate more aversion to loads than first-time buy-ers and more aversion to loads than operating expenses. Table 5 reportsdescriptive statistics for first-time fund purchases and subsequent fundpurchases by investors in our large discount brokerage data set.15 Ourestimate of total expenses is unchanged for first-time and subsequentpurchases. Experienced fund buyers have a small, but statistically sig-nificant, tendency to buy funds with higher operating expenses. As weanticipated, experienced buyers choose funds with much lower loadsthan first-time buyers: 0.06% for experienced buyers vs. 0.11% for first-time buyers. Experienced buyers also put apparently less weight on afund’s previous returns than first-time buyers.To test the robustness of these results, we separately analyze the
three major fund categories in our dataset: aggressive growth, growthand income, and long-term growth. In each of these three fund cate-gories, the front-end loads paid by first-time buyers are reliably greaterthan those paid by experienced buyers. In contrast, the pattern for op-erating expenses is not consistent across these three fund categories;the operating expenses paid by first-time buyers is lower for aggressivegrowth and growth and income funds but higher for long-term growthfunds.
15. We categorize purchases as first time if the investor has not previously purchased afund at this brokerage during our sample period. Obviously, some purchases categorized asfirst time were made by investors who had previously purchased funds elsewhere or beforeour sample period. Purchases incorrectly labeled first time will only make it more difficult todistinguish differences in the characteristics of funds actually purchased for the first time andother funds.
TABLE 5 Mean Characteristics of First Mutual Fund Purchases (19,056) versusSubsequent Purchases (188,506) from Discount Broker Trades Data,1991–96
First Purchases Subsequent Purchases Difference
Total expenses (%) .95 .95 .00 (.82)Operating expenses (%) .93 .94 !.01** (!2.18)Front-end-load fees (%) .111 .061 .05***(10.69)NTF status (%) 39.67 39.09 .58 (1.57)Fund MAR t!1(%) 7.16 5.58 1.57***(14.22)Fund MAR t!2(%) 6.14 5.00 1.14***(10.46)
Note.—Descriptive statistics are for 19,056 first mutual fund purchases of households and 188,506subsequent purchases. Data are from trades made at a large discount broker from 1991 through 1996.Variables include total expenses (operating expenses plus one-seventh of a fund’s load fee), operatingexpenses, front load, nontransaction fee (NTF ) status at the broker, the annual market-adjusted fundreturn for the previous 12 months (MAR), and the annual market-adjusted fund return for the 12 monthsin year t ! 2. The t-statistics are in parentheses.***, ** Significant at the 1% and 5% level, respectively (two-tailed test).
2113Expenses on Mutual Fund Flows

F. Changes in Expenses
We find evidence that mutual fund investors pay attention to salient, in-your-face fees like front-end loads and commissions, while they attendless to operating expense ratios. Yet low expense mutual funds havegreater average market share than high expense mutual funds. Our resultsindicate that the high market share enjoyed by low expense funds is not aresult of new money flowing into low expense funds. Low expense fundsmay have greater averagemarket share because fund growth leads to lowerexpenses; indeed, many mutual fund prospectuses prescribe reductionsin operating expenses as assets under management grow. In this section,we present empirical evidence consistent with this conjecture.To test whether funds lower expenses as they grow, we calculate the
change in operating expenses for all funds, the 50 largest funds, the largest70% of funds, and funds older than 5 years. Assets under managementcan grow by attracting newmoney or posting strong returns. Sincemutualfunds enjoy economies of scale (Baumol et al. 1990), increased assetsunder management would allow funds to lower expenses. In each year,we regress the change in operating expenses on new money received inthe prior 2 years and the fund’s raw return in the prior 2 years. We includethe raw return squared, since it is unlikely that economies of scale arelinearly related to fund size. We include changes in front-end-load fees asan independent variable, since some funds may increase expenses whenthey lower or eliminate a front-end-load fee. Fund size and the monthlystandard deviation of fund returns are also included as control variables.The results of this analysis are presented in table 6. For all funds, the
largest 70% of funds, and funds older than 5 years, there is strongevidence that growth leads to lower expenses for mutual funds. Newmoney and strong returns lead to lower expenses. For example, thecoefficient estimate for all funds of !0.00591 on a fund’s prior yearreturn indicates that a 10% return is associated with an average decreasein the expense ratio of 6 basis points in the following year. When werestrict our analysis to the 50 largest funds, we find no evidence that newmoney or fund performance predicts expense changes. This is not sur-prising, since large funds already enjoy economies of scale.
V. An Alternative Hypothesis: Search Costs and Service
A possible alternative explanation for our results is search costs. Perhapsinvestors find it extremely costly to search for mutual funds. Thus, ratherthan incur the hassle of finding a fund, they merely invest in funds thatcome to their attention through advertising. In short, these investorsknowingly sacrifice performance (i.e., the cost of advertising, which is a netdrain on fund performance) to reduce the hassle of picking a mutual fund.We believe attention influences investors’ choices of mutual fund just
as it influences their choices of stocks (Barber and Odean 2003). We do
2114 Journal of Business

not believe, however, that our results are driven solely by rational in-vestors who, to minimize search costs, buy mutual funds that catch theirattention. On the one hand, many—if not most—mutual fund investorsdo not minimize search costs. On the other hand, even when attention isnot an issue, individuals overemphasize front-end loads relative to ex-pense ratios. Several facts support this view.First, Wilcox (2003) presents 50 consumers who currently invest in
mutual funds with profiles of stock mutual funds with different expenseratio and load combinations. He documents that 46 of the 50 study par-ticipants overemphasize loads relative to expense ratios. There is clearlyno search cost in this experimental design, yet he observes the samegeneral patterns that we find in flow data.Second, many investors actively trade mutual funds. In the brokerage
account data that we use, mutual fund turnover exceeds 70% annually(which corresponds to a holding period of less than 18 months). Ingeneral, redemption rates for mutual funds are quite high, reaching 40%
TABLE 6 Cross-Sectional Regressions of Annual Expense Changes on FundCharacteristics, 1970–99
All FundsLargest
50 FundsLargest 70%of Funds
Old Funds(Age > 5 Years)
Change in frontloads (Lt ! Lt!1)
.00176(.79)
!.00446(!1.16)
!.00591**(!2.28)
.00212(.92)
New money(t ! 1) NM t!1
!.00048**(!2.41)
!.00054(!1.39)
!.00043**(!2.10)
!.00063*(!1.89)
New Money(t ! 2) NM t!2
!.00005(!.42)
.00011(.31)
!.00008(!.91)
!.00008(!.63)
MARt!1 !.00591** .00271 !.00463** !.00485*(!2.21) (.60) (!2.65) (!2.00)
MAR2t!1 .00964 !.00642 .00282 .00898
(1.28) (!.57) (.62) (1.22)MARt!2 !.00753*** !.00764 !.00652** !.00896**
(!2.75) (!1.30) (!2.24) (!2.61)MAR2
t!2 .00952* .011060 .00758* .01325**(1.85) (.99) (1.33) (2.14)
s(R) !.00723 .00530 !.00741 !.00823(!1.02) (1.04) (!.96) (!1.10)
ln(TNAt!1) !.00001 !.00001 .00001 !.00001(!.41) (!.25) (.11) (!.37)
ln(age) .00005 .00008 .00001 .00004(.47) (.74) (.16) (.34)
Adj. R2 .069 .103 .095 .079
Note.—This table reports the mean coefficient estimates and associated t-statistics (in parentheses)from cross-sectional regressions of annual expense changes on selected fund characteristics from 1970to 1999. The dependent variable, Xt ! Xt!1, is the change in expense ratios. The independent variablesinclude change in front-end load fees (L), annual fund new money scaled by the beginning of year TNA(NM), the annual market-adjusted fund return for the previous 12 months (MAR), the annual market-adjusted fund return for the 12 months in year t ! 2, the annual adjusted fund returns squared for yearst ! 1 and t ! 2, the monthly standard deviation of the previous 24 months fund returns, log of TNAat the beginning of each quarter, and log of fund age. The new money variables are winsorized at theninety-ninth percentile.***, **, * Significant at the 1%, 5%, or 10% level, two-tailed test.
2115Expenses on Mutual Fund Flows
in the late 1990s, which implies a holding period of 30 months.16 Ifsearch costs loom large, we would expect investors to trade their mutualfunds somewhat less often than they do.Third, we can bring some data to bear on this issue. Using the bro-
kerage data, we are able to identify mutual fund sales followed bymutual fund purchases within 3 weeks. It is unlikely that these saleswere liquidity motivated, since they were followed by a purchase within3 weeks. Although some of these sales might have been made to realizea tax loss, the average sale clearly was not, since the average fund soldoutperformed the market (by more than 4% during a period when themarket averaged more than 17% annually). Thus, it is likely that thesesales followed by purchases were speculative in nature. It is worthnoting that roughly half of all mutual fund sales in our brokerage dataare followed by purchases within 3 weeks.Clearly, the most straightforward way for investors who already own
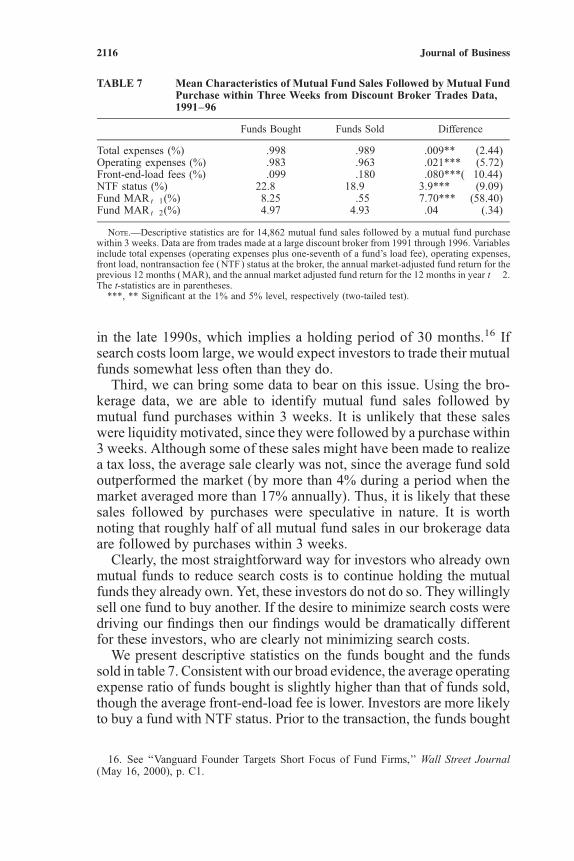
mutual funds to reduce search costs is to continue holding the mutualfunds they already own. Yet, these investors do not do so. They willinglysell one fund to buy another. If the desire to minimize search costs weredriving our findings then our findings would be dramatically differentfor these investors, who are clearly not minimizing search costs.We present descriptive statistics on the funds bought and the funds
sold in table 7. Consistent with our broad evidence, the average operatingexpense ratio of funds bought is slightly higher than that of funds sold,though the average front-end-load fee is lower. Investors are more likelyto buy a fund with NTF status. Prior to the transaction, the funds bought
16. See ‘‘Vanguard Founder Targets Short Focus of Fund Firms,’’ Wall Street Journal(May 16, 2000), p. C1.
TABLE 7 Mean Characteristics of Mutual Fund Sales Followed by Mutual FundPurchase within Three Weeks from Discount Broker Trades Data,1991–96
Funds Bought Funds Sold Difference
Total expenses (%) .998 .989 .009** (2.44)Operating expenses (%) .983 .963 .021*** (5.72)Front-end-load fees (%) .099 .180 !.080***(!10.44)NTF status (%) 22.8 18.9 3.9*** (9.09)Fund MAR t!1(%) 8.25 .55 7.70*** (58.40)Fund MAR t!2(%) 4.97 4.93 .04 (.34)
Note.—Descriptive statistics are for 14,862 mutual fund sales followed by a mutual fund purchasewithin 3 weeks. Data are from trades made at a large discount broker from 1991 through 1996. Variablesinclude total expenses (operating expenses plus one-seventh of a fund’s load fee), operating expenses,front load, nontransaction fee (NTF ) status at the broker, the annual market-adjusted fund return for theprevious 12 months (MAR), and the annual market adjusted fund return for the 12 months in year t! 2.The t-statistics are in parentheses.
***, ** Significant at the 1% and 5% level, respectively (two-tailed test).
2116 Journal of Business

had exceptional performance; the funds sold also beat the market, thoughby a much smaller margin.In addition to search costs, investors might choose mutual funds with
high expenses if high expense funds provided better service than otherfunds. We believe that different levels of service are unlikely to explainour results since first-rate service and low expenses are not mutuallyexclusive. For example, Vanguard, which is well-known for its low-costmutual fund offerings, has won numerous service awards.17
VI. Conclusions
Investing is a learning process. Over the last several decades investorshave learned about mutual funds. They have grown less willing to investin funds with higher front-end-load fees. However, funds with higheroperating expense ratios have not lost market share. Using mutual fundflows from 1970 to 1999 and actual mutual fund purchase and saledecision by investors at a large discount broker from 1991 to 1996, ourempirical analysis documents consistently negative relations betweenfund flows and front-end-load fees or commissions but no relation (or aperverse, positive relation) between fund flows and operating expenses.When we split operating expenses into marketing expenses (12B-1 fees)and other expenses, we find that investors are more likely to buy fundswith higher marketing expenses but less likely to buy those with higherother operating expenses. We argue that, all else equal, investors preferto pay lower fees to mutual fund companies, but they have grown sensi-tive to front-end-load fees and commissions more quickly than to op-erating expenses. This is because front-end-load fees and commissionsare more obvious and salient. Front-end-load fees are particularly sa-lient for investors who have previously paid them. We find that expe-rienced mutual fund investors are less likely to pay front-end loads thanfirst-time buyers, but experienced mutual fund investors do not invest inmutual funds with lower operating expenses.We report evidence that mutual fund marketing does work. On av-
erage, any negative effect of expense fees on fund flows is more thanoffset when that money is spent on marketing; nonmarketing expenses,however, reduce fund flows. Although front-end load fees are also spenton marketing, the positive effect of marketing on flows does not appearto be sufficient to offset investors’ growing awareness of and aversionto loads.
17. Mutual Funds named Vanguard #1 in the Best Service category and as the favorite fundfamily overall, based on a 1999 survey of 2,000 subscribers. A November 2000 SmartMoneysurvey of 600 randomly selected readers named Vanguard as the Best Fund Family. Worthdesignated Vanguard the winner in both the Best Fund Family and Best Discount Brokercategories for service and performance, based on a 1999 survey of 4,000 readers.
2117Expenses on Mutual Fund Flows

From 1962 to 1999, the average operating expense charged bymutualfunds has steadily increased (see fig. 2), while the proportion of fundscharging front-end-load fees and the level of those load fees have de-clined (see fig. 1). While, no doubt, there are many plausible explan-ations for this observed pattern, one possibility is that mutual fundmanagers have figured out that investors are sensitive to load fees butless so to operating expenses.Investors would benefit from a greater understanding and awareness
of mutual fund expenses. While educating investors is a complex andmultifaceted task, our results support the GAO’s recommendation thatone step in that process could be for mutual funds to disclose to in-vestors the actual dollar amount of fees paid. Expenses that remain outof sight are likely to remain out of mind.
References
Alexander, Gordon, Jonathan D. Jones, and Peter J. Nigro. 1998. Mutual fund shareholders:Characteristics, investor knowledge, and sources of information. Financial ServicesReview 7:301–16.
Barber, Brad M., and Terrance Odean. 2000. Trading is hazardous to your wealth: Thecommon stock investment performance of individual investors. Journal of Finance55:773–806.
———. 2003. All that glitters: The effect of attention and news on the buying behavior ofindividual and institutional investors. Working paper, University of California.
Baumol, William J., Steven M. Goldfeld, Lilli A. Gordon, and Michael F. Koehn. 1990. Theeconomics of mutual fund markets: Competition versus regulation. Norwell, MA: KluwerAcademic Publishers.
Carhart, Mark M. 1997. On persistence in mutual fund performance. Journal of Finance52:57–82.
Chevalier, Judith, and Glenn Ellison. 1997. Risk taking by mutual funds as a response toincentives. Journal of Political Economy 105:1167–1200.
Ciccotello, Conrad S., Jason T. Greene, and Lori S. Walsh., 2003. No-transaction fee su-permarket distribution of open-end mutual funds. Working paper, Georgia State Uni-versity, Atlanta.
Fama, Eugene F., and Kenneth R. French., 1993. Common risk factors in returns on stocksand bonds. Journal of Financial Economics 33:3–56.
General Accounting Office. 2000. Mutual fund fees: Additional disclosure could encourageprice. GAO/GGD-00-126. Washington, DC: General Accounting Office.
Gruber, Martin J. 1996., Another puzzle: The growth in actively managed mutual funds.Journal of Finance 51:783–810.
Jain, Prem C., and Wu, Joanna Shuang. 2000. Truth in mutual fund advertising: Evidence onfuture performance and fund flows. Journal of Finance 55:937–58.
Kennickell, Arthur B., and Martha Starr-McCluer. 1994. Changes in family finances from1989 to 1992: Evidence from the Survey of Consumer Finances. Federal Reserve Bulletin80:861–82.
———. 2000., Recent changes in U.S. family finances: Results from the 1998 Survey ofConsumer Finances. Federal Reserve Bulletin 86:1–29.
Khorana, Ajay, and Henri Servaes. 2000. What drives market share in the mutual fundindustry? Working paper, London Business School.
Laplante, Michele. 2001. Influences and trends in mutual fund expenses. Journal of Fi-nancial Research 24:45–63.
Securities and Exchange Commission. 2000. Report on mutual fund fees and expenses Wash-ington, DC: Securities and Exchange Commission, Division of Investment Management .
2118 Journal of Business

Sirri, Erik R., and Peter Tufano. 1998. Costly search and mutual fund flows. Journal ofFinance 53:1589–1622.
Thaler, Richard. 1985. Mental accounting and consumer choice. Marketing Science 4:199–214.
Wilcox, Ronald T. 2003. Bargain hunting or star gazing? How consumers choose mutualfunds. Journal of Business 76, no. 4 (October 2003): 645–665.
2119Expenses on Mutual Fund Flows