Out in the cold? Iceland's trade performance outside the EU
29
CENTRAL BANK OF ICELAND WORKING PAPERS No. 26 Out in the cold? Iceland’s trade performance outside the EU by Francis Breedon and Thórarinn G. Pétursson December 2004 CENTRAL BANK OF ICELAND Economics Department
Transcript of Out in the cold? Iceland's trade performance outside the EU
CENTRAL BANK OF ICELAND
WORKING PAPERS No. 26
Out in the cold? Iceland’s trade performance outside the EU
byFrancis Breedon and Thórarinn G. Pétursson
December 2004
CENTRAL BANK OF ICELAND
Economics Department

Central Bank of Iceland Working Papers are published by the Economics Department of the Central Bankof Iceland. The views expressed in them are those of their authors and not necessarily the views of theCentral Bank of Iceland.
Also available on the Central Bank of Iceland World Wide Web site (http://www.sedlabanki.is)
All rights reserved. May be reproduced or translated provided the source is stated.ISSN: 1028-9445
Out in the cold? Iceland’s trade performance outside the EU*
byFrancis Breedon
The Tanaka Business School, Imperial College London
Thórarinn G. PéturssonCentral Bank of Iceland and Reykjavík University
December 2004
AbstractAlthough entering a currency union involves both costs and benefits, an increasing body ofresearch is finding that the benefits – in terms of international trade creation – are remarkablylarge. For example, Rose (2000) suggests that countries can up to triple their trade by joining acurrency union. If true the impact on trade, income and welfare should Iceland join EMU couldbe enormous. However, by focussing simply on EMU rather than the broad range of currencyunions studied by Rose, we find that the trade impact of EMU is smaller – but still statisticallysignificant and economically important. Our findings suggest that the Iceland's trade with otherEMU countries could increase by about 60% and that the trade-to-GDP ratio could rise by 12percentage points should Iceland join the EU and EMU. This trade boost could consequentlyraise GDP per capita by roughly 4%. These effects would be even larger if the three current EMUouts (Denmark, Sweden and the UK) were also to enter EMU.
Keywords: Keywords: F15; F33.
JEL Classification: Currency unions; international trade; Iceland.
* We would like to thank Ásgeir Daníelsson, Gudmundur Gudmundsson, Ragnar Árnason, Torsten Slok and TryggviT. Herbertsson and participants at the 50th Year Anniversary Conference for Fjármálatíðindi (the Central Bank ofIceland economic journal) 18-19 November 2004 for useful comments and suggestions. The views expressed in thispaper do not necessarily represent those of the Central Bank of Iceland.
2
1. Introduction As the smallest country in the world with a freely floating currency, the question of
exchange rate policy in general and EMU membership in particular is a significant
one for Iceland.1 Certainly, Iceland shares many of the characteristics of other small
economies that the IMF (see Mussa et al., 2000) has judged to make them particularly
strong candidates for exchange rate pegs of some sort. However, much of the current
political debate in Iceland concerning possible EMU membership has been focused on
the implications of EMU (and EU) membership for Icelandic fisheries, whether
Iceland would be a net benefactor of fiscal transfers from the EU, and the relatively
weak correlation of Iceland’s business cycle with that of Europe. The equally
fundamental issue of the potential effect of EMU membership on Icelandic trade has
not been so widely discussed.
The trade creation effect of currency union membership has become a major
area of research following the seminal paper by Rose (2000). His early results
suggested that joining a currency union could increase trade with other countries by
the astounding 100-300%, which in turn could have large beneficial effects on income
and growth in these countries. In fact, if this result is correct, it is hard to think of any
government policy that could have such a large welfare effect for the average family.
More recent estimates, using country samples more relevant for potential EMU
countries are much more modest, but still remain statistically significant and
economically important. The consensus from this literature therefore seems to be that
joining a currency union, such as the euro area, increases trade with the other
members of the union with no corresponding negative impact on trade with non-
members. These results are certainly consistent with the observed increase in trade
intensity among the EMU members since the launch of the euro.
This paper analyses the potential implications of EU and EMU membership
for Icelandic trade and income.2 The results suggest that EMU (and EU) membership
could increase Icelandic trade with other EMU members by about 60%. Overall, the 1 In terms of population, using the IMF classification of actual exchange rate regimes. Although a number of smaller countries have their own currency, most of these are currency boards. Of the remainder, they are either pegged against another currency (Netherlands Antilles and Vanuatu), pegged against a currency basket (Samoa and Seychelles), operate a crawling peg (Tonga) or a managed float (Sao Tome Principe). 2 Although the focus of this paper is very much on EMU rather than the EU, a full membership in the monetary union is really not an option without joining the EU. EU membership without adopting the euro could, however, be an option although the experience of the new EU members might suggest that this is no longer the case.
3
share of trade in GDP could rise by 12 percentage points. There are many theoretical
and empirical arguments that suggest that more open economies tend to grow faster
and enjoy a higher standard of living. The empirical findings used here suggest that
the increased trade intensity could boost per capita income by about 4% which could
be spread over two to three decades. However, we also find that Iceland’s business
cycle is remarkably unsynchronised with that of the EMU countries and, though not a
focus of this study, would be an important factor in assessing the overall costs and
benefits of EMU entry for Iceland.
The paper is organised as follows. The next section discusses Icelandic trading
patterns and how trade with EU and EMU countries has gradually been increasing in
importance. The third section reviews the literature on how currency unions affect
trade and the early empirical findings. The fourth section tries to answer the question
why countries join monetary unions, which provides candidates for instruments when
estimating the trade creation effects of EMU membership to control for the fact that
currency union membership is not a random event. Section 5 gives estimates of this
trade creation effect using different model specifications and estimation techniques.
The sixth section draws on these results to explore the potential impact of Iceland’s
EMU membership on Icelandic trade and income, and the seventh section concludes.
2. Icelandic trade patterns
Iceland is a very small (population just under 300 thousand), resource-based island
economy which mainly exports products based on its abundant natural resources, i.e.
fish and hydroelectric power, and imports final goods. These characteristics are
reflected in the country’s trade patterns. For example, it turns out that the share of
trade in GDP is somewhat smaller than could be expected given the small population
of the country (see, for example, Gudmundsson et al., 2000), as smaller populations
have fewer opportunities to trade among themselves and therefore find it harder to
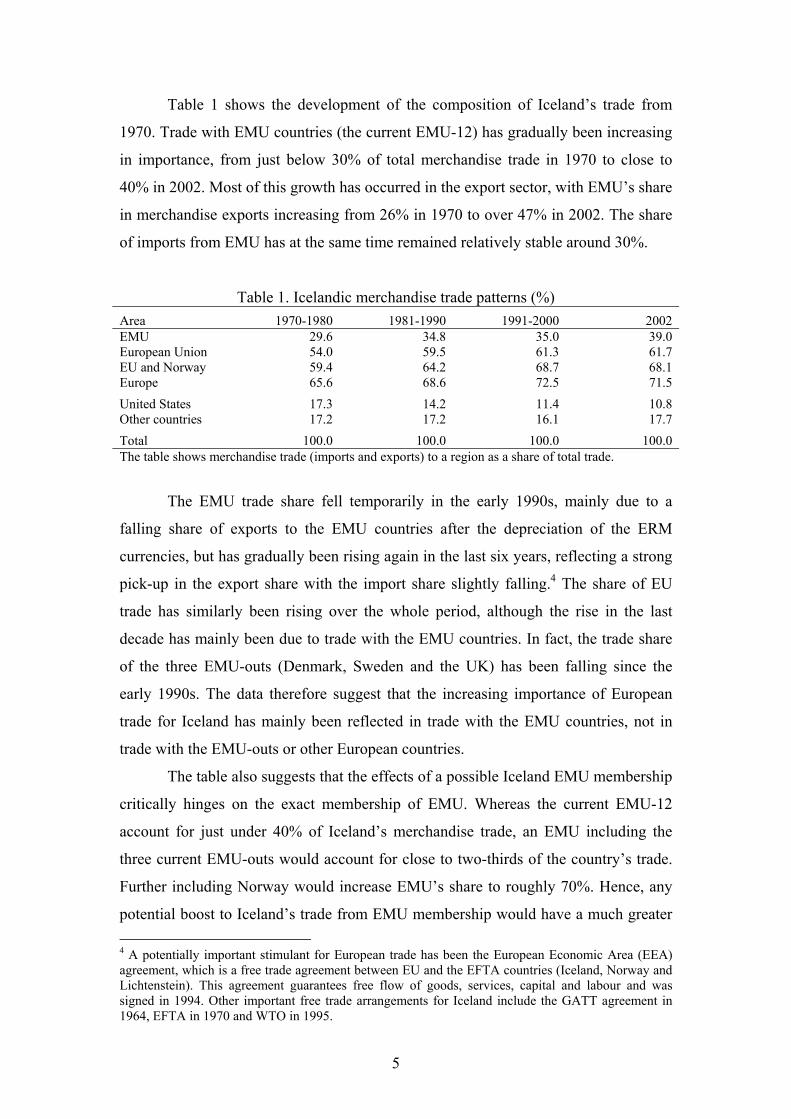
take advantages of scale economies. Figure 1 shows the development of the trade
share from 1960 to 2002 (the average of exports plus imports divided by GDP). The
share of total trade has fluctuated between 30 and 40% of GDP in the last thirty years,
with the merchandise trade share fluctuating within the 20-30% range. In fact the
trade share has not increased over the whole period, although it has been recovering in
4
the last ten years from a historical low with most of the growth occurring in service
trade.
20
25
30
35
40
45
50
1960 1963 1966 1969 1972 1975 1978 1981 1984 1987 1990 1993 1996 1999 2002
Total trade Merchandise trade Figure 1. Iceland’s trade share, (imports + exports)/2, as a ratio to GDP (%)
As reported in Gudmundsson et al. (2000), this trade share is also lower than
in most other small European countries. The relative lack of openness is also reported
in Andersen and Herbertsson (2003), using a multivariate factor analysis to measure
globalisation. They find that Iceland consistently ranks among the bottom half among
the 23 OECD countries. Iceland’s trade share is also relatively low compared with the
average for small countries worldwide of about 50% (see Mussa et al. 2000).
Gudmundsson et al. (2000) argue that the main reason for this is the characteristics of
Icelandic trade mentioned above. Imports of intermediate goods is an important
source of international trade in many other small European countries, where these
countries import intermediate goods and export them as processed or final goods. This
implies a large trade share in terms of imports and exports as a ratio to GDP. This
‘through-put’ is much lower in Iceland’s case reflecting its heavy reliance on natural
resources as the main source of exports.3 The theoretically more accurate measure of
openness would be value added in trade as a share of GDP rather than trade volume,
which would presumably give a larger trade share for Iceland than the data above
suggest. Such data is, however, not available. Another reason for the relatively low
trade ratio is the country’s geographical distance from major population centres, as the
empirical results reported below suggest.
3 This is also reflected in smaller imports of fossil fules due to the country’s relative self-sufficiency with respect to energy production.
5
Table 1 shows the development of the composition of Iceland’s trade from
1970. Trade with EMU countries (the current EMU-12) has gradually been increasing
in importance, from just below 30% of total merchandise trade in 1970 to close to
40% in 2002. Most of this growth has occurred in the export sector, with EMU’s share
in merchandise exports increasing from 26% in 1970 to over 47% in 2002. The share
of imports from EMU has at the same time remained relatively stable around 30%.
Table 1. Icelandic merchandise trade patterns (%)
Area 1970-1980 1981-1990 1991-2000 2002 EMU 29.6 34.8 35.0 39.0 European Union 54.0 59.5 61.3 61.7 EU and Norway 59.4 64.2 68.7 68.1 Europe 65.6 68.6 72.5 71.5
United States 17.3 14.2 11.4 10.8 Other countries 17.2 17.2 16.1 17.7
Total 100.0 100.0 100.0 100.0 The table shows merchandise trade (imports and exports) to a region as a share of total trade.
The EMU trade share fell temporarily in the early 1990s, mainly due to a
falling share of exports to the EMU countries after the depreciation of the ERM
currencies, but has gradually been rising again in the last six years, reflecting a strong
pick-up in the export share with the import share slightly falling.4 The share of EU
trade has similarly been rising over the whole period, although the rise in the last
decade has mainly been due to trade with the EMU countries. In fact, the trade share
of the three EMU-outs (Denmark, Sweden and the UK) has been falling since the
early 1990s. The data therefore suggest that the increasing importance of European
trade for Iceland has mainly been reflected in trade with the EMU countries, not in
trade with the EMU-outs or other European countries.
The table also suggests that the effects of a possible Iceland EMU membership
critically hinges on the exact membership of EMU. Whereas the current EMU-12
account for just under 40% of Iceland’s merchandise trade, an EMU including the
three current EMU-outs would account for close to two-thirds of the country’s trade.
Further including Norway would increase EMU’s share to roughly 70%. Hence, any
potential boost to Iceland’s trade from EMU membership would have a much greater 4 A potentially important stimulant for European trade has been the European Economic Area (EEA) agreement, which is a free trade agreement between EU and the EFTA countries (Iceland, Norway and Lichtenstein). This agreement guarantees free flow of goods, services, capital and labour and was signed in 1994. Other important free trade arrangements for Iceland include the GATT agreement in 1964, EFTA in 1970 and WTO in 1995.
6
effect on the country’s openness if EMU would include these four countries.5 This
especially applies to the UK, which historically is Iceland’s most important export
market (accounting for just under 18% of Iceland’s total merchandise exports in
2002).
3. Currency unions and trade 3.1. Review of the literature An interesting finding in the international trade literature is that trade within a country
seems to be much more intensive than trade between countries, taking into account
factors such as income, distance and other factors important for trade directions. This
is the ‘home bias’, first recorded by McCallum (1995) who found that trade between
two bordering Canadian provinces was up to twenty times greater than trade between
a bordering Canadian province and US state, other things equal.
The modelling approach used by McCallum was the so-called gravity model
of trade (see, e.g., Anderson, 1979), which tries to explain bilateral trade with factors
such as output levels in both countries (often using GDP per capita or population).
The idea is based on models of increasing returns to scale and product differentiation
(e.g. Helpman and Krugman, 1985) which suggests that trade between two countries
will be greater, the greater number of goods being produced in these countries, other
things being equal. As the quantity of goods being produced in a given country is
proportional to its size, this trade effect can be captured by standard measures of size
such as GDP or population. One can also argue that countries that share common
borders, language, or culture trade more, other things being equal. The same would
apply the less the geographical distance is between them and if these countries are
members of a custom or a free trade union. The findings by McCallum (1995) suggest
that even taking account of these factors, the need to trade in different currencies can
have important effects on trade, even though later theoretical developments have
reduced this effect somewhat (see Anderson and van Wincoop, 2001).
Although this border-effect literature does suggest an important effect of
currency unions on trade, it does not give a direct estimate of these effects. This was
first provided in a seminal paper by Rose (2000). He used a simple gravity model,
5 This will be even further strengthened with the inclusion of the new Eastern European members, although bilateral trade between Iceland and these countries is much smaller.
7
adding a dummy variable for currency unions in a large data set consisting mainly of
small developing countries.6 Rose finds a remarkably large impact of over 200%
increase in trade for members of a currency union. The results also seem robust to
different approaches with respect to specification of the model, variables or sample.
Rose’s findings have, not surprisingly, generated controversy and many
attempts to overturn his results but with surprisingly little success. In fact most studies
tend to confirm an important currency union effect. This also applies to studies of the
trade effect of currency unions in developed countries. They tend to confirm that the
trade effect of currency unions is statistically significant and economically important,
but much less than originally suggested by Rose (2000) derived from other currency
unions.7 Some of these empirical results are discussed in more detail in Section 5.
The theoretical reasons for currency unions to affect trade are numerous. The
most obvious effect is that a common currency eliminates bilateral nominal exchange
rate volatility, therefore reducing uncertainty and risk associated with international
trade.8 Empirical studies, however, find mixed evidence for the importance of this
effect. In fact most studies find quite small effects that seem declining over time (see,
e.g. the survey in Edison and Melvin, 1990). A possible explanation for the failure to
find empirical support for this popular notion is that these studies usually use short-
term exchange rate variability to measure exchange rate risk. While it is relatively
easy and cheap to hedge this type of risk in the derivatives market (at least in
developed countries), hedging fully against large, long-lasting exchange rate changes
is difficult as uncertainty about demand for the firm’s product are also important in
that case (see Kenen, 2002). It is likely that this latter type of exchange rate risk is
more important for trade than the former measure typically used in empirical studies
and that this effect is reflected in the large effect using Rose’s currency union dummy.
6 His sample included 186 ‘countries’, including dependencies, territories and colonies, generating over 300 common currency pairs. Most of these pairs are, however, either currency unions between very small or poor countries such as those in the Eastern Caribbean Currency Area, or very small or poor countries adopting a currency of large trading partners, such as Tonga adopting the Australian dollar or Panama adopting the US dollar. 7 Rose (2003) surveys 34 recent studies of the trade generating effect of currency unions. All imply an important trade generating effect, although smaller than originally found in Rose (2000). Using a meta-analysis he finds a currency union effect of between 30% and 90%. 8 Currency risk is obviously not completely eliminated if the country trades with countries outside the currency union. Overall currency exposure may even increase if fluctuations in the newly adopted currency are greater than those experienced by the old currency and as hedging possibilities arising due to a negative correlation between outside currencies and the union currency cannot be exploited. But one can probably argue that the greater the share of trade with the potential currency union, the greater the reduction in currency risk.
8
There are other reasons as well for believing that trade costs associated with
multiple currencies goes beyond the cost of nominal exchange rate volatility (short
and long-term). Currency unions, for example, eliminate (or at least reduce) the
transaction costs arising from trading in different monies. For example, De Grauwe
(1994) finds that the cost of exchanging Belgian francs for Dutch guilders or German
marks is about ½%, which is similar to the cost of exchanging them for French francs,
pounds sterling or US dollars, despite the low volatility of the Belgian franc vis-à-vis
the guilder or the mark. Emerson et al. (1992) finds these costs to be as high as ½% of
GDP for the EU as a whole (HM Treasury, 2003, give similar estimates for the UK),
and even larger for the small, more open economies with less liquid currencies, or as
much as 1% of GDP.
A common currency may also increase market transparency, increasing the
information content of cross-border prices and therefore lead to greater specialisation
and increased competition. For small economies with less liquid currencies, joining a
monetary union may also improve its hedging possibilities in trade with non-member
countries by opening access to much deeper and sophisticated domestic financial
markets.
It is therefore clear that a common currency and a completely fixed exchange
rate are not the same. The former is a much more serious and durable commitment
that may be expected to effect trade well beyond any possible direct effects of
suppressed exchange rate volatility on trade.9 In this paper we provide estimates of
both these effects.
3.2. Criticism of Rose’s findings Criticism of Rose’s (2000) findings mainly focuses on two issues. The first concerns
the sample he uses. Before EMU there were few currency unions and those that
existed were most often between small developing countries (such as the CFA Franc
Zone in Africa). Thus within Rose’s original sample of countries less than 1% were in
a currency union, and even those were mostly unrepresentative of the larger
developed countries such as those joining the EMU.10
9 A number of studies also suggest a positive correlation between increased international trade and foreign direct investment (see e.g. Brealy and Kaplanis, 1996). See also the discussions in Barr et al. (2003). 10 This criticism was also raised in the British Parliament during an EMU debate when the leader of the opposition questioned the Chancellor’s assumptions concerning the trade benefits of EMU by asking
9
This led Persson (2001) to argue that the bilateral trade of the currency union
pairs studied by Rose (2000) are atypical and one should therefore be careful in
generalising his results to trade between other country pairs. To prove this point,
Persson undertook an analysis similar to that of Rose but using different matching
procedures to generate more comparable country pairs. He found some trade
generating effects but much smaller than Rose (ranging from 13-65%). In a response
Rose (2001) uses Persson’s matching techniques on a more extensive data set with
respect to period and countries (therefore including a number of currency unions that
were dissolved after the Second World War) and still finds large and statistically
significant effects.11 These results are also consistent with Kenen (2002) who uses
similar matching techniques. Although important for interpreting Rose’s results and
their implications for trade for any set of countries, the relevance of his and Persson’s
results to the set of countries studied here is limited, since the country group used is
much more homogenous. That statistically significant trade effects are still found (and
in other studies, such as Micco et al., 2003), suggests that this effect exists and that
the results do not depend on the exact group of countries used (although the exact size
of the effect certainly does).
The second criticism centres on the issue of endogeneity of the currency union
dummy variable. If it were the case that countries expecting a large increase in trade
tend to form currency unions, then the estimated relationship between trade and
currency unions cannot be interpreted as a currency union effect. If this is a problem,
the estimated impact of currency unions may to a significant extent be due to the
impact of a third variable that predicts entry into a currency union and more trade, e.g.
a historically close cultural relationship.
To explain the underlying problem the following two-equation model can be
used
(1) TRADE = α + βEMU + γX + θZ +ε,
(2) EMU = ψ +δZ + χW + ξ.
“Will he confirm that that expert’s assumptions, on which the Chancellor relies, are based on studies of currency unions involving Angola and Mozambique, Burkina Faso and Chad, Vatican City and San Marino, and Tuvalu and Tonga?”. 11 Using regression estimates gives similar effects as in his original study. Applying non-parametric methods (as Persson does) gives a much smaller effect although it remains statistically significant (ranging from 21-43%).
10
Here trade is a function of EMU membership, a variable X and a variable Z
(equation 1), and EMU entry is a function of variable W, and is also a function of
variable Z (equation 2). When the impact of EMU on trade is estimated, we must
attempt to control for all possible variables that can influence trade other than EMU
entry. In particular, were we to leave out variable Z from our model, then the estimate
of β (the trade impact of EMU) would be biased since it would include both the
impact of EMU and, indirectly, the impact of variable Z. The problem we face is that
unless we control for all possible variables that influence trade, then we cannot be
sure that our estimated EMU effect is correct since we may have excluded a variable
like Z.
Rose (2000) tackles this problem by including an extensive range of variables
that might influence trade. This approach was also criticised by Persson (2001) who
pointed out that even if the list of variable was exhaustive, if some of those variables
influenced trade in a non-linear way, but were assumed to have linear effects, then the
estimate of the currency union effect could still be biased. In his response, Rose
(2001) adds non-linearity to his basic model, but still the trade effect remains
statistically significant.
An alternative approach is to include country-pair fixed effects in the gravity
model that control for any differences in characteristics of EMU and non-EMU
countries. This involves allowing for a dummy variable for every country-pair and
means that the EMU effect is only significant if there is a change in trade post-EMU
rather than just higher trade on average for EMU-ins. As a result, even if all the
differences in characteristics between countries cannot be explicitly identified, the
fixed effect will pick them up.12
However, even allowing for fixed effects there is still a potential endogeneity
problem. This arises if the variable inadvertently excluded predicts both the decision
to join EMU and higher trade post-EMU. For example, if a country observes a change
in its circumstances that will increase trade with the EMU countries in the future, it
may choose to join EMU as a way of maximising the benefit of that change. As a
12 As pointed out by Glick and Rose (2001) the simple gravity estimates in Rose (2000) only captures whether countries within a currency union trade more than countries not sharing a common currency. These models do not really give an answer to the more interesting question on how joining a currency union affects trade for a country joining the union. To answer this one needs to use a panel approach allowing for fixed effects. Both approaches are adopted here.
11
result, we will observe the decision to join EMU followed by higher trade and so even
the fixed effect estimate will ascribe the increase in trade to EMU. To get around this
problem, an instrumental variable is needed – something that predicts EMU entry, but
cannot have been influenced by the potential trade increase post-EMU (such as
variable W in equation 2). If such a variable (or variables) can be found, then we can
use it to assess the probability that a country will join EMU, and see if that probability
predicts higher trade post-EMU. If it does then we can ascribe the increase in trade to
EMU membership since, if the instrument is valid, it could not have been influenced
by the post-EMU increase in trade. It is this instrumental variables approach that
taken in this paper (see also the discussion in Barr et al., 2003).
4. Why do countries join currency unions?13 Before undertaking an analysis of the trade effects of EMU membership, some
explanation of why the outs chose to stay out and the ins chose to join is needed.
Without such an explanation, it is difficult to argue that any observed differences
between the ins and outs is due to monetary union as opposed to another factor that
explains both the observed difference and the propensity to join EMU.
The starting point for such an explanation is the work of Alesina and Barro
(2000) (which is itself an extension of the work of Mundell, 1961). They identify the
main economic determinants of the propensity to join a currency union as:
1) Trade – the more two countries trade already the greater will be the benefit of
forming a currency union (though this result depends on ‘reasonable’
assumptions about the elasticities of substitution). Alesina and Barro also argue
that other variables that may influence trade (such as distance between
countries) could have an independent effect on the desire to join a currency
union – these effects are ignored in this section.
2) Co-movements of output – the greater the co-movement of output between
countries, the smaller the cost of giving up monetary independence through a
currency union.
3) Co-movements of prices – as with output co-movement, greater price co-
movement reduces the cost of giving up an independent monetary policy.
13 This section draws heavily on Barr et al. (2003).
12
4) History of high and volatile inflation – a country may wish to join an existing
currency union, or form a union with a larger partner, in order to gain the
discipline and credibility of the anchor currency’s monetary policy.
For the purposes of this paper, the first three of these determinants are the most
relevant as EMU, arguably, has no one ‘anchor’ currency to which other countries are
linked.14 Table 2 outlines estimates of these three determinants for countries within
the EU and EFTA (excluding Luxembourg and Liechtenstein for data reasons).15
Looking at Table 2, in the row labelled ‘all’ we present the average value of
each of the three determinants (trade, output co-movement and price co-movement)
for all possible bilateral pairings in the country sample. The row labelled ‘EMU’ then
shows the same calculation but now only for bilateral pairings involving two EMU
countries. Focusing on the four non-EMU members in the sample, the average value
of each determinant for all pairings involving each of these countries with every EMU
member is also shown. So ‘Iceland with EMU’ shows the average value of the
determinants for all pairings involving Iceland and an EMU country – similarly for
Denmark, Sweden and the UK. For example, for trade we calculate bilateral trade as a
share of GDP for every possible pairing in the sample (136 combinations) over the
period 1978 to 1991 (up to the signing of the Maastricht treaty). The row labelled
‘All’ shows the average of all these combinations, the row labelled ‘EMU’ shows the
average bilateral trade only for combinations involving two EMU members. The
‘Iceland with EMU’ row shows Iceland average trade share with each EMU country,
similarly for Denmark, Sweden and the UK.
The table also reports z-tests to see if the EMU-ins are significantly different
from the outs. For each indicator this involves finding the average value of the
indicator for bilateral pairings involving two EMU-ins and comparing that with the
average value of the indicator for all bilateral pairings involving at least one EMU out.
The individual country tests (for Denmark, Iceland, Sweden and the UK) simply
compare the EMU-in sample with the average indicator value for every pairing
involving each of those countries. The z-test is then a test of whether the mean of the
14 Although Germany was the largest single economy in the union, the fact that a new currency and central bank were created suggests that EMU cannot be simply seen as a DM currency zone. 15 The countries are Austria, Belgium, Denmark, Germany, Greece, Finland, France, Iceland, Ireland, Italy, Netherlands, Norway, Portugal, Spain, Sweden, Switzerland and the UK.
13
EMU-in sample is significantly different from the mean of the out, or individual
country, sample.
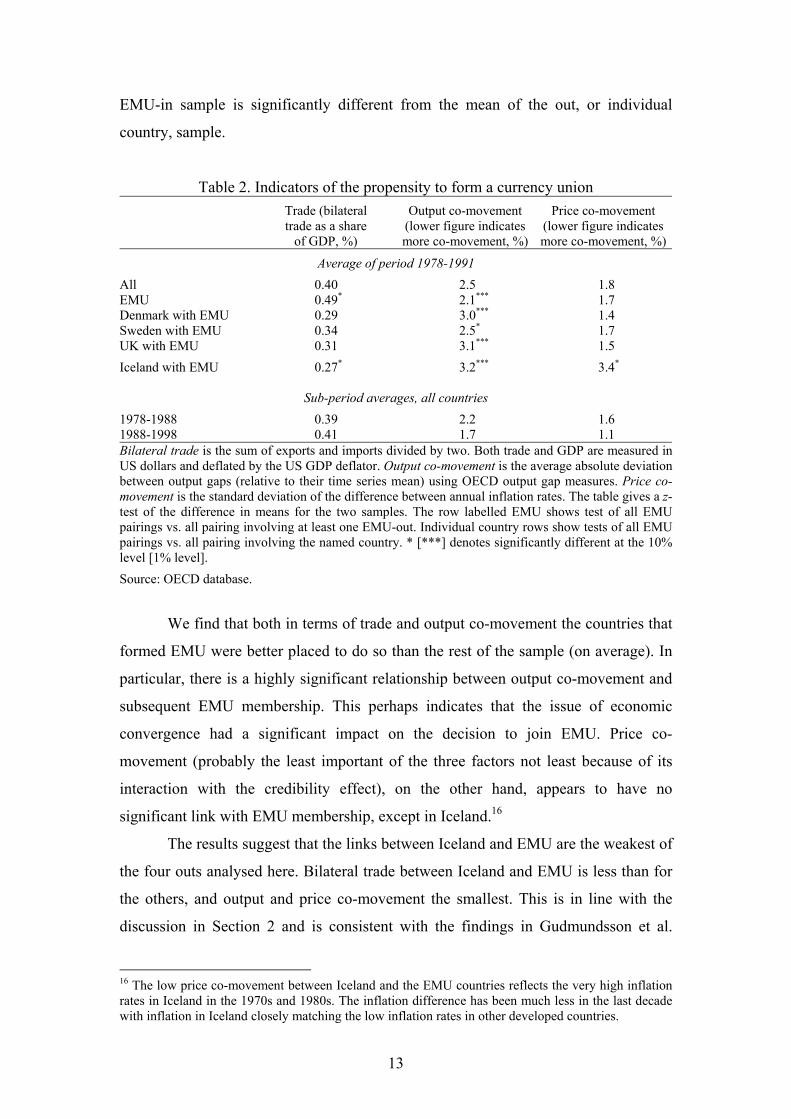
Table 2. Indicators of the propensity to form a currency union
Trade (bilateral trade as a share
of GDP, %)
Output co-movement (lower figure indicates more co-movement, %)
Price co-movement (lower figure indicates more co-movement, %)
Average of period 1978-1991
All 0.40 2.5 1.8 EMU 0.49* 2.1*** 1.7 Denmark with EMU 0.29 3.0*** 1.4 Sweden with EMU 0.34 2.5* 1.7 UK with EMU 0.31 3.1*** 1.5
Iceland with EMU 0.27* 3.2*** 3.4*
Sub-period averages, all countries
1978-1988 0.39 2.2 1.6
1988-1998 0.41 1.7 1.1
Bilateral trade is the sum of exports and imports divided by two. Both trade and GDP are measured in US dollars and deflated by the US GDP deflator. Output co-movement is the average absolute deviation between output gaps (relative to their time series mean) using OECD output gap measures. Price co-movement is the standard deviation of the difference between annual inflation rates. The table gives a z-test of the difference in means for the two samples. The row labelled EMU shows test of all EMU pairings vs. all pairing involving at least one EMU-out. Individual country rows show tests of all EMU pairings vs. all pairing involving the named country. * [***] denotes significantly different at the 10% level [1% level].
Source: OECD database.
We find that both in terms of trade and output co-movement the countries that
formed EMU were better placed to do so than the rest of the sample (on average). In
particular, there is a highly significant relationship between output co-movement and
subsequent EMU membership. This perhaps indicates that the issue of economic
convergence had a significant impact on the decision to join EMU. Price co-
movement (probably the least important of the three factors not least because of its
interaction with the credibility effect), on the other hand, appears to have no
significant link with EMU membership, except in Iceland.16
The results suggest that the links between Iceland and EMU are the weakest of
the four outs analysed here. Bilateral trade between Iceland and EMU is less than for
the others, and output and price co-movement the smallest. This is in line with the
discussion in Section 2 and is consistent with the findings in Gudmundsson et al.
16 The low price co-movement between Iceland and the EMU countries reflects the very high inflation rates in Iceland in the 1970s and 1980s. The inflation difference has been much less in the last decade with inflation in Iceland closely matching the low inflation rates in other developed countries.
14
(2000). They find that business cycle co-movement with both EU and EMU,
measured with output growth, terms of trade, export growth and export revenue, is in
general much less for Iceland (and Norway) than for other European countries.17 They
also suggest that the incentives to join EMU are the weakest for Iceland among the
non-member countries analysed in this paper.
A potential problem with the results reported in Table 2 is that while they
appear to help explain who will be in the currency union they do not tell us why the
union was formed when it was. Given the use of time series averages to construct our
indicators in Table 2, the timing of EMU is difficult to gauge. However, the latter half
of the table indicates that when the period 1978-88 is compared with the period 1988-
98, all of the indicators are more conducive to a currency union in the later period,
indicating perhaps that costs of monetary union have fallen and the benefits risen over
time. This goes some way to explaining why monetary union did not occur earlier.
Overall, it seems that economic variables that help explain why some
countries chose to join EMU and some did not can be found. In particular, output co-
movement proves to be an important predictor of the subsequent decision to join. Not
only does such a result undermine the argument that the decision was purely political
and unrelated to economic considerations, these predictors provide ideal candidates
for instruments in the analysis of the trade effect in the gravity model as they have a
very strong relationship with subsequent EMU entry.18 By focusing on co-movement
for the period 1978 to 1991 (before the Maastricht Treaty was signed) one can be
fairly confident that these co-movement variables are independent of the prospective
trade impact of EMU. So, even though there is evidence that increased trade can
increase co-movement (see for example Frankel and Rose, 1997), greater co-
movement is unlikely to be caused by future increases in trade.
However, both the co-movement variables have the limitation that they have
no time series variation (recall that they are defined as the average co-movement over
the period 1978 to 1991). As a result, although they can be used to predict which
17 Using a simple small, open economy growth model to identify permanent and transitory shocks in a structural VAR framework, they also find that output fluctuations in Iceland are dominated by idiosyncratic permanent (supply) shocks. 18 Tenreyro and Barro (2003) propose another highly ingenious instrument – namely the joint probability that two client countries adopt the same anchor currency – on the assumption that bilateral trade between the two clients is not influenced by the anchor economy, only by the common currency. Unfortunately, this instrument is not appropriate for our study as EMU has no defined anchor currency, or any alternative anchors.
15
countries will enter EMU, they cannot be used to predict when EMU entry will occur.
Fortunately, since the entry timing decision is highly correlated across countries (i.e.
other than Greece the timing of entry is identical across countries), the information
lost through not explaining the times series variation in entry decision is minor.
5. Trade impact of EU and EMU membership This section reports estimates of the effect of EMU (and EU) on trade (see also Barr
et al., 2003). The standard gravity model of Rose (2000) and a fixed effect version of
the model is estimated for the period 1978Q1 to 2002Q1 for a panel of European
countries. The sample of countries is once again all of the EU and EFTA except
Luxembourg and Liechtenstein thus giving 11 EMU member countries and 6 non-
member countries. Given that we are looking at every bilateral combination of the 17
countries, we have 136 different time series each covering the period 1978Q1 to
2002Q1 giving a total panel sample of 13,192 observations. Of these 136 country
pairs, 55 pairs share the euro, which is roughly 40% of the sample (compared to 1% in
the sample used by Rose, 2000).
Since the range of variables that might influence trade is myriad, the range of
possible specifications of the gravity model is virtually limitless. The field is therefore
narrowed by focusing on Rose’s original simple specification (though former
coloniser effects are excluded for obvious reasons). Table 3 gives the results for
ordinary least squares (OLS) estimates and instrumental variables (IV) estimates
using the two co-movement variables as instruments for EMU membership and
exchange rate volatility.19
19 The results are robust to various experimentations, such as excluding different countries in the sample, excluding different variables in the gravity model, changing the estimation period and experimenting with different instruments. The details can be found in the appendix in Barr et al. (2003).
16
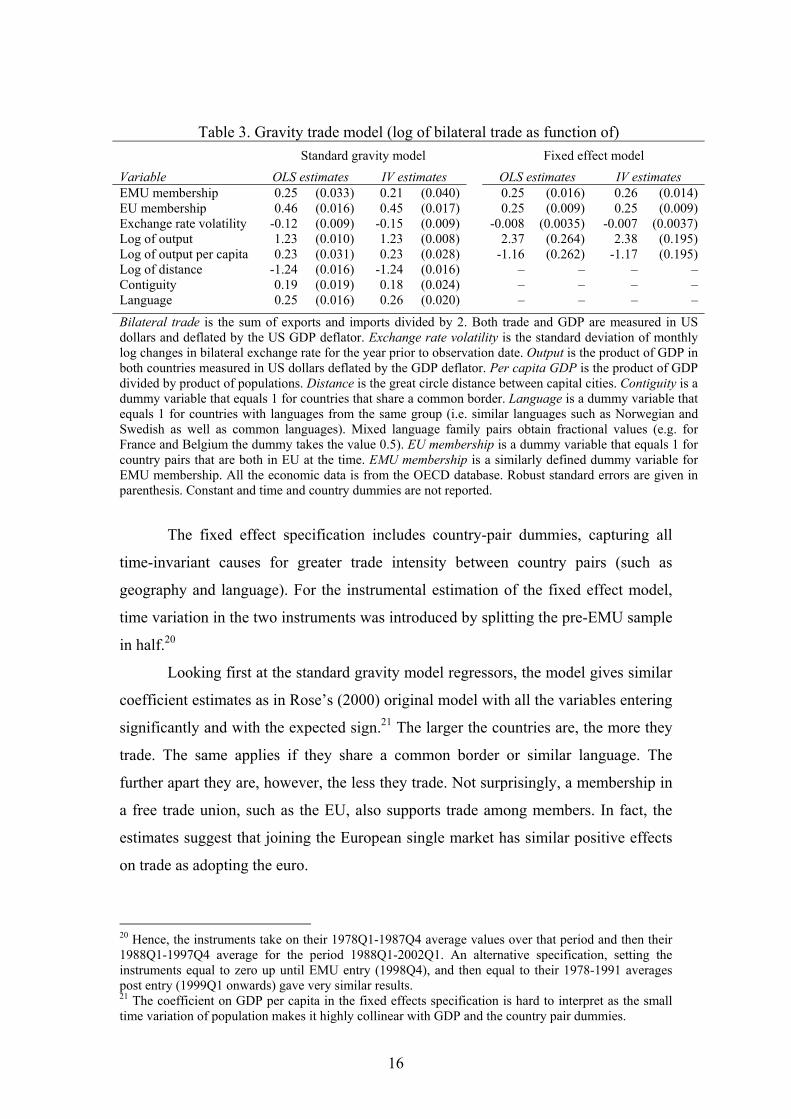
Table 3. Gravity trade model (log of bilateral trade as function of)
Standard gravity model Fixed effect model
Variable OLS estimates IV estimates OLS estimates IV estimates EMU membership 0.25 (0.033) 0.21 (0.040) 0.25 (0.016) 0.26 (0.014) EU membership 0.46 (0.016) 0.45 (0.017) 0.25 (0.009) 0.25 (0.009) Exchange rate volatility -0.12 (0.009) -0.15 (0.009) -0.008 (0.0035) -0.007 (0.0037) Log of output 1.23 (0.010) 1.23 (0.008) 2.37 (0.264) 2.38 (0.195) Log of output per capita 0.23 (0.031) 0.23 (0.028) -1.16 (0.262) -1.17 (0.195) Log of distance -1.24 (0.016) -1.24 (0.016) – – – – Contiguity 0.19 (0.019) 0.18 (0.024) – – – – Language 0.25 (0.016) 0.26 (0.020) – – – –
Bilateral trade is the sum of exports and imports divided by 2. Both trade and GDP are measured in US dollars and deflated by the US GDP deflator. Exchange rate volatility is the standard deviation of monthly log changes in bilateral exchange rate for the year prior to observation date. Output is the product of GDP in both countries measured in US dollars deflated by the GDP deflator. Per capita GDP is the product of GDP divided by product of populations. Distance is the great circle distance between capital cities. Contiguity is a dummy variable that equals 1 for countries that share a common border. Language is a dummy variable that equals 1 for countries with languages from the same group (i.e. similar languages such as Norwegian and Swedish as well as common languages). Mixed language family pairs obtain fractional values (e.g. for France and Belgium the dummy takes the value 0.5). EU membership is a dummy variable that equals 1 for country pairs that are both in EU at the time. EMU membership is a similarly defined dummy variable for EMU membership. All the economic data is from the OECD database. Robust standard errors are given in parenthesis. Constant and time and country dummies are not reported.
The fixed effect specification includes country-pair dummies, capturing all
time-invariant causes for greater trade intensity between country pairs (such as
geography and language). For the instrumental estimation of the fixed effect model,
time variation in the two instruments was introduced by splitting the pre-EMU sample
in half.20
Looking first at the standard gravity model regressors, the model gives similar
coefficient estimates as in Rose’s (2000) original model with all the variables entering
significantly and with the expected sign.21 The larger the countries are, the more they
trade. The same applies if they share a common border or similar language. The
further apart they are, however, the less they trade. Not surprisingly, a membership in
a free trade union, such as the EU, also supports trade among members. In fact, the
estimates suggest that joining the European single market has similar positive effects
on trade as adopting the euro.
20 Hence, the instruments take on their 1978Q1-1987Q4 average values over that period and then their 1988Q1-1997Q4 average for the period 1988Q1-2002Q1. An alternative specification, setting the instruments equal to zero up until EMU entry (1998Q4), and then equal to their 1978-1991 averages post entry (1999Q1 onwards) gave very similar results. 21 The coefficient on GDP per capita in the fixed effects specification is hard to interpret as the small time variation of population makes it highly collinear with GDP and the country pair dummies.
17
The main focus of this study is the effect of EMU membership on trade. This
variable is also found to be significantly positive and increases trade by 23-29%
(given as the exponential of the coefficient estimate minus one), depending on the
estimation method and model specification used. The estimated trade effect is
therefore found to be quite robust across different specifications and different
estimation techniques.22
These estimates of the currency union effect are significantly smaller than that
found by Rose (2000) (about 20-30% rather than more than 200%) – with the simple
Rose specification and the fixed effect specification giving very similar results. The
fact that the currency union effect is found smaller here than in Rose’s original study
is, however, somewhat offset by the fact that a larger exchange rate volatility effect is
found in the Rose specification of our model (12-15% trade impact for every 1%
change in standard deviation rather than the 2% trade impact found by Rose).
Alternative specifications also confirm that, unsurprisingly, the volatility effect
interacts quite strongly with the EMU effect. As an example, excluding volatility from
the simple Rose specification increases the EMU effect from 29% to about 40%.23
The volatility effect is, however, much smaller in the fixed effect specification, with
trade increasing by less than 1%, which is much closer to that found by Rose (2000)
and Dell’Ariccia (1999) and De Grauwe and Skudelny (2000) who use a similar
sample and approach to that used here. This suggests that the endogeneity problem
survives when estimating the volatility effect, even when using relatively long time
period samples. This also reflects the different interpretation of the coefficient
estimates. In the Rose specification the estimate reflects that a set of countries trade
more the less volatile the bilateral exchange rate is. The coefficient in the fixed effect
specification, however, gives an estimate of how much trade is affected when bilateral
exchange rate volatility is eliminated, which is again the more relevant question in our
context.
22 These estimates do not give any information about how quickly these effects will take to work through. Frankel and Rose (2002) argue, based on their findings and those in Glick and Rose (2001) that roughly two-thirds of the trade creating effect may be realised within three decades. The dynamic panel estimates in Bun and Klaassen (2002) and Micco et al. (2003) suggest a shorter period for the EMU countries. Their results imply that the long-run effect is attained within about twenty years. 23 The volatility coefficient also interacts strongly with the distance dummy, with the coefficient increasing significantly when the distance variable is dropped. This is consistent with findings in Engel and Rogers (1996) that relative price volatility increases with distance between Canadian and US cities.
18
Some may also find it surprising that the estimates using instrumental
variables are so similar to the OLS estimates, since many would expect the OLS
estimates to be significantly biased upward (arguing that countries with potential for
significant growth in trade are more likely to form currency unions). However, as
Barro and Tenreyro (2000) point out, the biases could go either way, and their study
(Tenreyro and Barro, 2003) actually finds stronger currency union effects on trade
once the currency union dummy has been instrumented. The fact that the same result
is not found here probably relates to the more homogeneous sample used in this paper
(no developing or hyperinflation countries) so that the endogeneity effect is only
minor in the case of EMU. It is also worth noting that although the two sets of
estimates of the direct EMU effect reported here are similar, Durbin-Wu-Hausman
tests of endogeneity indicate that instrumentation is appropriate.
The fact that the instrumental variables estimate suggests that it is membership
of EMU that is responsible for almost all the increase in trade within EMU (rather
than vice versa), need not mean that all of the trade impact is due to the mere act of
entering EMU. It is possible that countries that expected to enter EMU altered their
policies in ways that encouraged more trade (thus the trade impact is still caused by
EMU, but only indirectly). While it is difficult to unravel the direct from the indirect
impact of EMU, it is interesting to note that if the trade model is estimated with time
dummies just for the EMU-in countries, it appears that EMU is already affecting trade
well before EMU actually occurs (as far back as 1994 for the fixed effect version of
the model and 1998 for the Rose specification).24 This suggests that the trade impact
of EMU is more than just the impact of the single currency – the policy preparations
seem to have influenced trade as well.
Micco et al. (2003) use a comparable, albeit shorter, data set to estimate the
trade impact of EMU entry. Their estimates of the pure currency union effect are
similar to those reported here, although the estimated coefficient in their preferred
fixed effect specification is significantly smaller (ranging from 9% to 20% for the
most comparable sample), while using a Rose-type specification their results are very
similar to those reported here (an EMU effect ranging from 21% to 37%).
Experimentation in Barr et al. (2003) using a shorter data sample reveals that when
the sample is reduced to the period 1993 to 2002, the fixed effects version of the 24 These pre-EMU effects are also reported in Micco et al. (2003). Details can be found in the appendix in Barr et al. (2003).
19
model used here gives a lower estimate of the EMU effect (9%) whilst the Rose
specification gives very similar estimates (30%). Therefore, it seems that their shorter
sample (1992-2003) explains the difference between the results of Micco et al. and
those presented here and in Barr et al. (2003). Given that the analysis discussed above
suggests that the EMU effect on trade began as early as 1994 it is likely that some of
the EMU effect is subsumed into country fixed effects in the shorter sample.
However, it is also possible that the lack of a dynamic specification introduces more
biases into a longer time series such as the one reported here. Experimenting with
dynamic specifications of the panel suggests, however, that our results remain robust.
Several other papers have attempted to estimate the trade effect of EMU
membership.25 Rose and van Wincoop (2001) attempt to estimate the potential trade
effect of EMU membership based on pre-EMU data using a theoretical model of
bilateral trade from Anderson and van Wincoop (2001). They estimate that EMU
membership could increase trade by roughly 60%.26 Other studies (based on actual
post-EMU data), such as Bun and Klaassen (2002) and De Nardis and Vicarelli
(2003), find broadly similar results to the results reported here.27
6. Implications for Iceland
6.1. Implications for trade with EMU countries Given the estimated effects of EU and EMU membership on trade flows in Table 3,
we can now calculate the possible increase in international trade for Iceland had it
been a member of the union (Table 4). Also reported are the effects for the three
current EMU-outs for comparison. The table gives the pure currency effect of
adopting the euro and the exchange rate volatility effect, which could follow
elimination of exchange rate fluctuations vis-à-vis the euro. This effect is estimated by
calculating the predicted increase in trade that would have occurred if exchange rate
volatility had been zero since 2001 (Greece’s entry date), using the estimated
25 Also of some relevance are two studies using data from the gold standard period (Estevadeordal et al., 2002, and López-Córdova and Meissner, 2002). Both use a small sample of industrial countries, plus a small sample of large developing countries. Their results suggest that participation in the gold standard increased trade by roughly 30-70%. 26 It should be kept in mind that Rose’s and van Wincoop’s (2001) results are not based on actual trade data after the formation of the EMU, but on a theoretical model that depends critically on a number of assumptions, such as the elasticity of substitution between the countries’ goods. 27 Another interesting study on the trade effects of Ireland’s break from the pound sterling currency union by Thom and Walsh (2002) finds no significant effect.
20
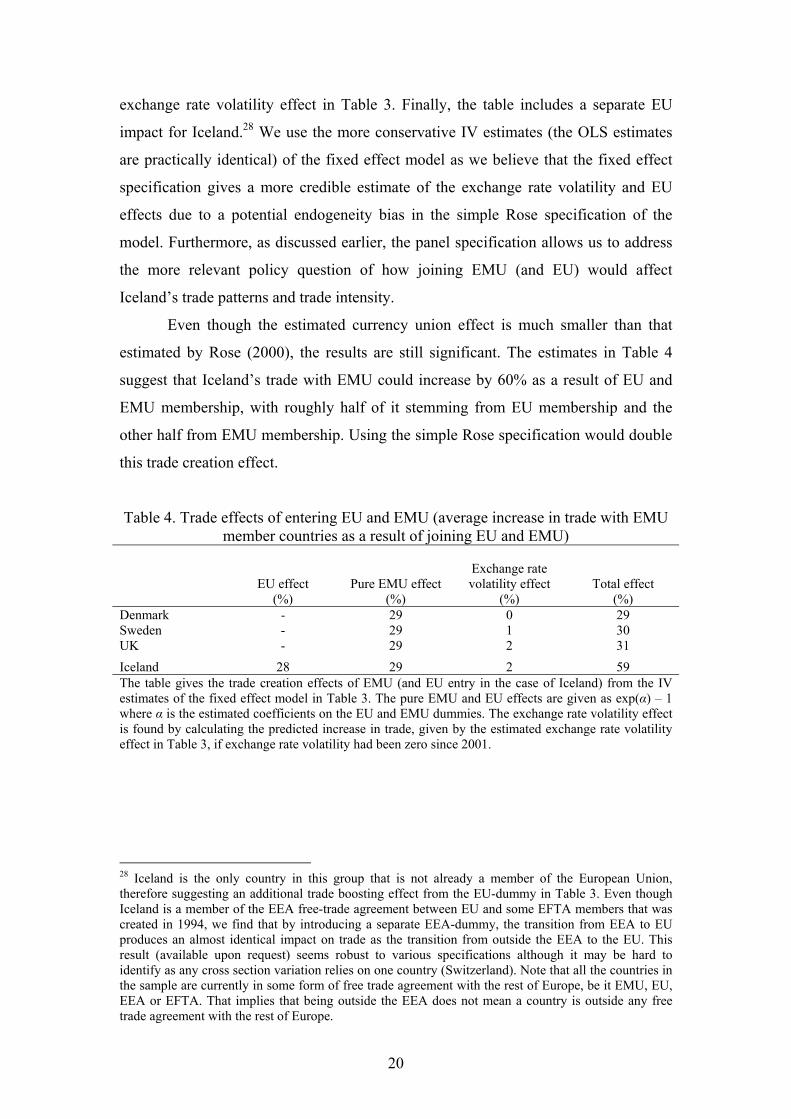
exchange rate volatility effect in Table 3. Finally, the table includes a separate EU
impact for Iceland.28 We use the more conservative IV estimates (the OLS estimates
are practically identical) of the fixed effect model as we believe that the fixed effect
specification gives a more credible estimate of the exchange rate volatility and EU
effects due to a potential endogeneity bias in the simple Rose specification of the
model. Furthermore, as discussed earlier, the panel specification allows us to address
the more relevant policy question of how joining EMU (and EU) would affect
Iceland’s trade patterns and trade intensity.
Even though the estimated currency union effect is much smaller than that
estimated by Rose (2000), the results are still significant. The estimates in Table 4
suggest that Iceland’s trade with EMU could increase by 60% as a result of EU and
EMU membership, with roughly half of it stemming from EU membership and the
other half from EMU membership. Using the simple Rose specification would double
this trade creation effect.
Table 4. Trade effects of entering EU and EMU (average increase in trade with EMU member countries as a result of joining EU and EMU)
EU effect (%)
Pure EMU effect
(%)
Exchange rate volatility effect
(%)
Total effect
(%) Denmark - 29 0 29 Sweden - 29 1 30 UK - 29 2 31
Iceland 28 29 2 59 The table gives the trade creation effects of EMU (and EU entry in the case of Iceland) from the IV estimates of the fixed effect model in Table 3. The pure EMU and EU effects are given as exp(α) – 1 where α is the estimated coefficients on the EU and EMU dummies. The exchange rate volatility effect is found by calculating the predicted increase in trade, given by the estimated exchange rate volatility effect in Table 3, if exchange rate volatility had been zero since 2001.
28 Iceland is the only country in this group that is not already a member of the European Union, therefore suggesting an additional trade boosting effect from the EU-dummy in Table 3. Even though Iceland is a member of the EEA free-trade agreement between EU and some EFTA members that was created in 1994, we find that by introducing a separate EEA-dummy, the transition from EEA to EU produces an almost identical impact on trade as the transition from outside the EEA to the EU. This result (available upon request) seems robust to various specifications although it may be hard to identify as any cross section variation relies on one country (Switzerland). Note that all the countries in the sample are currently in some form of free trade agreement with the rest of Europe, be it EMU, EU, EEA or EFTA. That implies that being outside the EEA does not mean a country is outside any free trade agreement with the rest of Europe.
21
6.2. Implications for openness At first sight these results suggest a large trade cost of not being a member of the EU
and EMU but an important caveat needs to be kept in mind as this model only
estimates the trade impact with EU and EMU countries. If much of that impact is
simply trade that has been from non-EU or EMU countries whose comparative
advantage is almost identical to EU and EMU countries then the economic impact
might be relatively small. However, Barr et al. (2003) find evidence against such trade
diversion. If EMU has no impact on trade between EMU-outs, then trade diversion
would imply that trade between EMU-ins and EMU-outs would decline relative to
trade between EMU-outs with the creation of EMU. They add a dummy variable for
trade between EMU-ins and EMU-outs and find no significant effects. This is
supported by the findings in Micco et al. (2003). They add a dummy variable to their
specification of the gravity model which is unity when only one of the countries
involved in bilateral trade is an EMU member and zero otherwise. If joining EMU
leads to trade diversion, the coefficient on this variable should be negative. They find
no evidence of trade diversion. In fact, they find some evidence of independent trade
creation, i.e. EMU membership not only increases trade with other EMU members but
also with other countries.29 Empirical evidence of an independent trade creation effect
is also found in Frankel and Rose (2002), using a much larger country set.
Taking these estimates at face value and assuming that no trade diversion
would follow, the potential effect of EMU membership on Iceland’s openness to
international trade could be economically important. Given that Iceland’s
merchandise trade as a share of GDP in 2002 was about 50% and that over 60% of
this trade was with the EU and almost 40% with the current EMU-12, this would
imply a total rise in merchandise trade as a share of GDP of 12 percentage points,
which amounts to roughly 1 billion US 2002 dollars per year.30 The effect on
Icelandic trade would obviously be larger if the EMU would also include the three
current EMU-outs. The estimates in Table 4 imply that the trade share would rise by
29 Micco et al. (2003) suggest that this additional trade creation effect with non-member countries could be because adopting a more liquid currency could enhance currency risk hedging, thus making trade with non-member countries less risky. 30 This is, however, much less than suggested by the estimates in Frankel and Rose (2002), which imply that Iceland’s merchandise trade as a share of GDP would rise by as much as 40-50 percentage points, or close to 3 billion US dollars just due to EMU.
22
18 percentage points in that case and 20 percentage points if Norway would also
become a member.
6.3. Implications for income and growth The increased trade intensity that would follow EU and EMU membership could also
have important effects on real income in Iceland.31 Classical trade theory suggests that
increased trade could increase the level of real income by allowing countries to focus
on the production of goods and services which they have comparative advantages in
producing, whether that stems from better technology or greater endowment in factors
required for production. More recent trade theory strengthens this claim by
introducing important roles for increasing returns to scale and scope, trade in
imperfect substitutes, and endogenous technology (see e.g. Helpman and Krugman,
1985). Some new trade theory even suggests that international spillover of
technology, ideas and knowledge (to name but few possible avenues) can result in a
relation between openness and the growth rate of income rather than just the level of
income. See the discussion in Frankel and Rose (2002) and some empirical support in
Gylfason and Herbertsson (2001).
There are also reasons to believe that a common currency will reduce the
home bias in domestic financial markets, thus promoting financial market integration
and risk sharing among individuals in the member countries, which again can promote
macroeconomic stability and welfare. It is also likely that these benefits are more
important for small countries, whose scope for internal specialisation is relatively
limited, and therefore fewer gains from internal trade, and where there is relatively
low degree of financial risk diversification available.
An alternative macroeconomic benefit often mentioned may follow via
reduced inflation and increased monetary policy credibility, therefore promoting
macroeconomic stability. The importance of this channel is, however, less in the
countries discussed here as all have low levels of inflation. In fact, Frankel and Rose
(2002) find that most of the currency union benefit to income comes via trade.
Currency unions can in fact also entail costs in terms of macroeconomic stability if
the business cycles in the member countries are poorly correlated; a finding that
31 A close relationship between real domestic income and export revenue at constant import prices (or purchasing power of exports) is a well documented empirical finding in Iceland. See, for example, Andersen and Gudmundsson (1998), page 5.
23
seems important for Iceland as discussed in Section 2. This should, however, be
measured against the findings in Frankel and Rose (1997) that international trade
seems to promote business cycle synchronisation, and evidence that foreign exchange
markets can be an independent source of shocks (see, for example, Neumayer, 1998).
Finally, Alesina and Barro (2000) suggest that a currency union may be an efficient
institutional arrangement for handling credibility problems.
In a comprehensive review of the empirical evidence on the effects of
international trade on income, HM Treasury (2003) suggests that ‘it seems reasonable
to assume that each 1 percentage point increase in the trade to GDP ratio increases
real GDP per head by at least ⅓ per cent in the long run’. This is consistent with the
conservative estimates in Frankel and Rose (2002), but the results in Frankel and
Romer (1999) suggest even a larger effect. Using the conservative estimate of ⅓,
would imply that a 12 percentage points in trade intensity following EU and EMU
membership could boost long-run real GDP per capita in Iceland by something like
4%, which amounts to over 1 thousand US 2002 dollars, or 6% if the current EMU-
outs would also be members. A representative estimate from Frankel and Romer
(1999) would be around 1 percentage point increase in GDP per capita for each
percentage point increase in the trade share, thus tripling the above numbers to 12%
for the currency union containing the current EMU-12, or 18% for a currency union
also containing the current EMU-outs.
7. Conclusions This paper uses information on international trade from the first four years since the
launch of the euro to try to estimate the potential effect of EMU membership for
Iceland. The results suggest that the Icelandic króna acts as a barrier to international
trade, and that by adopting the euro Icelandic trade with other EMU members could
increase by 60%, and that the share of trade in GDP could rise by 12 percentage
points which could boost per capita income by about 4% in the long run. We estimate
that about half of this effect comes from joining the EU and the other half from EMU
membership. These effects would be even larger would the three current outsiders
(Denmark, Sweden and the UK) also become members.
There are important caveats that need to be kept in mind. First, it should be
remembered that these are early days. The short history of the euro makes it unlikely
24
that the estimates in this paper are capturing all the long-run effects. This may suggest
that the effect of EMU membership on trade is even larger than reported here. Second,
this paper only focuses on the trade creating effects of EMU membership, thus
leaving out other potentially beneficial microeconomic effects of a common currency,
such as increased market transparency, specialisation and competition in the
economy, and financial services deepening with increased possibilities for risk sharing
across countries. Against this, there may be important macroeconomic costs of the
loss of independent monetary policy in the face of asymmetric business cycles.
Historical evidence from Iceland suggests that this can be a significant cost. This loss
may, however, be dampened if increased trade intensity leads to greater business
cycle co-movement as some empirical findings suggest. Finally, it is important to
keep in mind that there are substantial uncertainties surrounding these estimates that
should be considered in the overall assessment of the likely costs and benefits of
Iceland membership in EU and EMU. The decision to enter EU and EMU should be
based on a number of economic and political criteria of which the potential trade
creation effect is only one of important elements. Although these important issues are
not covered, we hope that this paper can contribute to the discussion on whether
Iceland should join the EU and adopt the euro.
25
References Alesina, A., and R. Barro (2000), “Currency unions”, NBER Working Paper no. 7927.
Andersen, P. S., and M. Gudmundsson (1998), “Inflation and disinflation in Iceland”,
Central Bank of Iceland, Working Papers, no. 1.
Andersen, T. M., and T. T. Herbertsson (2003), “Measuring globalization”, Institute
of Economic Studies, IoES Working Paper Series, W03:03.
Anderson, J., (1979), “A theoretical foundation for the gravity equation”, American
Economic Review, 69, 106-116.
Anderson, J., and E. van Wincoop (2001), “Gravity with gravitas: A solution to the
border puzzle”, NBER Working Papers, no. 8079.
Barr, D., F. Breedon and D. Miles (2003), “Life on the outside: Economic conditions
and prospects outside Euroland”, Economic Policy, 18, 575-613.
Barro, R., and S. Tenreyro (2000), “Closed and open economy models of business
cycles with marked-up and sticky prices”, NBER Working Paper no. 8043.
Brealy, R., and E. C. Kaplanis (1996), “The determination of foreign banking
location”, Journal of International Money and Finance, 15, 577-597.
Bun, M., and F. Klaassen (2002), “Has the euro increased trade?”, Tinbergen Institute
Discussion Paper, no. 02-108/2.
De Grauwe, P., (1994), The Economics of Monetary Integration. Oxford: Oxford
University Press.
De Grauwe, P., and F. Skudelny (2000), “The impact of EMU on trade flows”,
Weltwirtschaftliches Archiv, 136(3).
Dell’Ariccia, G., (1999), “Exchange rate fluctuations and trade flows: Evidence from
the European Union”, IMF Staff Papers, 46, 315-334.
De Nardis, S., and C. Vicarelli (2003), “The impact of the euro on trade: The (early)
effect is not so large”, European Network of Economic Policy Research
Institutes, Working Paper no. 017.
Edision, H., and M. Melvin (1990), “The determinants and implications of the choice
of an exchange rate system”, in W. S. Haraf and T. D. Willet (eds.), Monetary
Policy for a Volatile Global Economy. Washington DC: AEI Press.
26
Emerson, M., D. Gros, A. Italanier, J. Pisani-Ferry and H. Reichenbach (1992), One
Market, One Money: An Evaluation of the Potential Benefits and Costs of
Forming an Economic and Monetary Union. Oxford: Oxford University Press.
Engel, C., and J. H. Rogers (1996), “How wide is the border?”, American Economic
Review, 86, 1112-1225.
Estavadeordal, A., B. Frantz and A. Taylor (2002), “The rise and fall of world trade,
1870-1939”, Quarterly Journal of Economics, 118, 359-407.
Frankel, J. A., and D. Romer (1999), “Does trade cause growth?”, American
Economic Review, 89, 379-399.
Frankel, J. A., and A. K. Rose (1997), “Is EMU more justifiable ex post than ex ante?,
European Economic Review, 41, 753-760.
Frankel, J. A., and A. K. Rose (2002), “An estimate of the effect of common
currencies on trade and income”, Quarterly Journal of Economics, 118, 437-
466.
Glick, R., and A. K. Rose (2001), “Does a currency union affect trade? The time
series evidence”, NBER Working Paper no. 8396.
Gudmundsson, M., A. Sighvatsson and T. G. Pétursson (2000), “Optimal exchange
rate policy: The case of Iceland”, in M. Gudmundsson, T. T. Herbertsson and
G. Zoega (eds.), Macroeconomic Policy: Small Open Economies in an Era of
Global Integration. Reykjavík: University of Iceland Press.
Gylfason, T., and T. T. Herbertsson (2001), “Does inflation matter for growth?”,
Japan and the World Economy, 13, 405-428.
Helpman, E., and P. Krugman (1985), “Market Structure and Foreign Trade,
Cambridge, MA.: MIT Press.
HM Treasury (2003), EMU and Trade, HM Treasury, London.
Kenen, P., (2002), “Currency unions and trade: Variations on themes by Rose and
Persson”, Reserve Bank of New Zealand Discussion Papers, DP/2002/08.
López-Córdova, E., and C. Meissner (2002), “Exchange-rate regimes and
international trade: Evidence from the classical gold era”, American Economic
Review, 93, 344-353.
McCallum, J., (1995), “National borders matter: Canada-US regional trade patterns”,
American Economic Review, 85, 615-623.
Micco, A., E. Stein and G. Ordonez (2003), “The currency union effect on trade:
Early evidence from EMU”, Economic Policy, 18, 317-356.
27
Mundell, R., (1961), “A theory of optimum currency areas”, American Economic
Review, 51, 657-665.
Mussa M., P. Masson, A. Swoboda, E. Jadresic, P. Mauro and A. Berg (2000),
“Exchange rate regimes in an increasingly integrated world economy”, IMF
Occasional Paper, no. 193.
Neumayer, P. A., (1998), “Currencies and the allocation of risk: The welfare effects
of a monetary union”, American Economic Review, 88, 246-259.
Persson, T., (2001), “Currency unions and trade: How large is the treatment effect?”,
Economic Policy, 16, 435-461.
Rose, A. K., (2000), “One money, one market: The effect of common currencies on
trade”, Economic Policy, 15, 7-46.
Rose, A. K., (2001), “Currency union and trade: The effect is large”, Economic
Policy, 16, 435-461.
Rose, A. K., (2003), “A meta-analysis of the effect of common currencies on
international trade”, CEPR Discussion Paper Series, no. 4341.
Rose, A. K., and E. van Wincoop (2001), “National money as a barrier to
international trade: The real case for currency union”, American Economic
Review (Papers and Proceedings), 91, 386-390.
Tenreyro, S., and R. Barro (2003), “Economic effects of currency unions”, NBER
Working Paper no. 9435.
Thom, R., and B. Walsh (2002), “The effect of a common currency on trade: Lessons
from the Irish experience”, European Economic Review, 46, 1111-1123.