Our Purpose Model - London Stock Exchange · report Zambeef Products PLC Annual Report 2019 3...
126
Transcript of Our Purpose Model - London Stock Exchange · report Zambeef Products PLC Annual Report 2019 3...


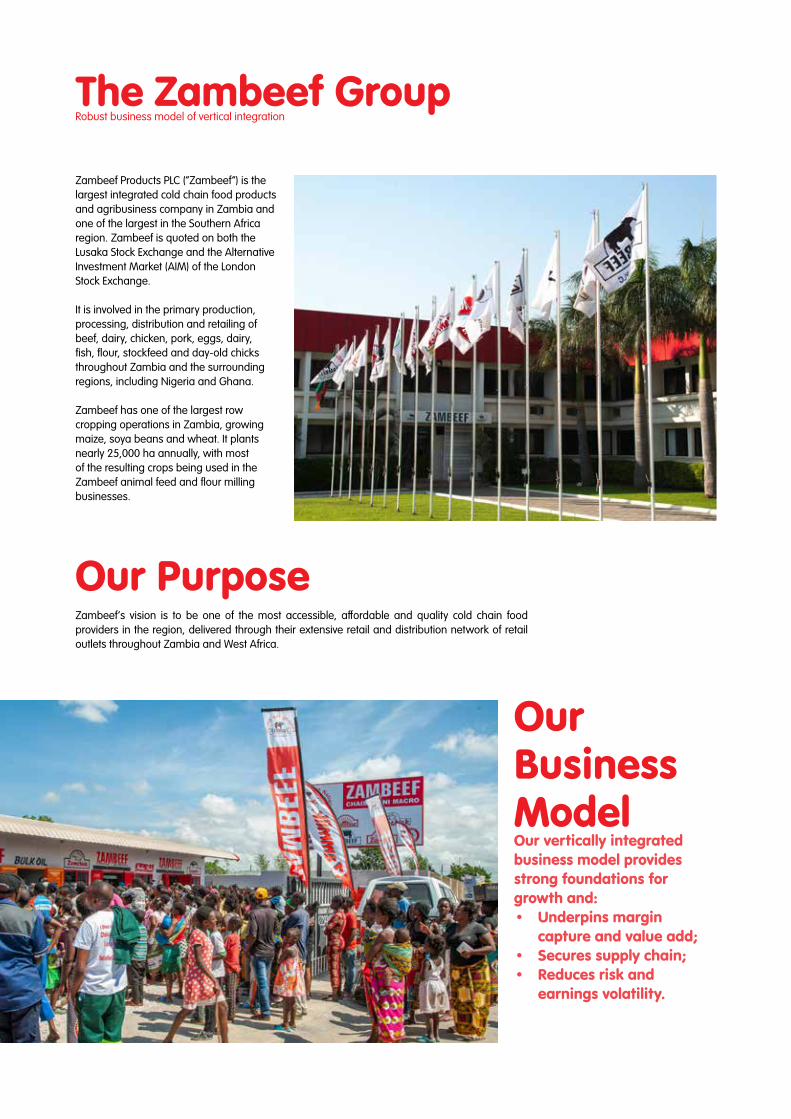
Our PurposeZambeef’s vision is to be one of the most accessible, affordable and quality cold chain food providers in the region, delivered through their extensive retail and distribution network of retail outlets throughout Zambia and West Africa.
OurBusiness Model Our vertically integrated business model provides strong foundations for growth and:• Underpins margin
capture and value add;• Secures supply chain;• Reduces risk and
earnings volatility.
Zambeef Products PLC (“Zambeef”) is the largest integrated cold chain food products and agribusiness company in Zambia and one of the largest in the Southern Africa region. Zambeef is quoted on both the Lusaka Stock Exchange and the Alternative Investment Market (AIM) of the London Stock Exchange.
It is involved in the primary production, processing, distribution and retailing of beef, dairy, chicken, pork, eggs, dairy, fish, flour, stockfeed and day-old chicks throughout Zambia and the surrounding regions, including Nigeria and Ghana.
Zambeef has one of the largest row cropping operations in Zambia, growing maize, soya beans and wheat. It plants nearly 25,000 ha annually, with most of the resulting crops being used in the Zambeef animal feed and flour milling businesses.
The Zambeef GroupRobust business model of vertical integration

ContentsOverview
Strategic report
2 Zambeef at a glance
4 History and key milestones
5 Feeding a growing region
Retail Cold Chain Food Products
6 Chairman’s report
8 Chief Executive Officer’s review
Cropping
Other businesses
12 Divisional performance
Stock Feed
20 Sustainability Report
Corporategovernanace
Financial Statements
26 Corporate governance
42 Report of the independent auditors
52 Consolidated statement of financial position
30 Board of directors
47 Consolidated Statement of comprehensive income
54 Company statement of financial position
32 Report of the directors
48 Consolidated statement of changes in equity
55 Consolidated statement of cash flows
57 Notes to the financial statements
37 Statement of directors’ responsibilities
50 Company statement of changes in equity
56 Company statement of cash flows
119 Proxy form
118 Notice of AGM and agenda
Cropping - Operating Profit
h 173% (USD)
h 177% (ZMW)2019: ZMW101.1m (USD8.2m)2018: ZMW29.4m (USD3.0m)
Stockfeed - Operating Profit
h 7% (USD)
14% (ZMW)2019: ZMW73.1m (USD5.9m)2018: ZMW68.3m (USD6.9m)
Combined Retail & CCFP - Operating Profit
41% (USD)
26% (ZMW)2019: ZMW107.7m (USD8.7m)2018: ZMW146.2m (USD14.7m)
Other businesses - Operating Profit
h 80% (USD)
h 123% (ZMW)2019: ZMW15.4m (USD1.24m)2018: ZMW6.9m (USD0.69m)
Good performance from Cropping with record wheat yields attained during a devastating regional drought
Agreement reached to sell
Sinazongwe Farm for a consideration of USD10 million
Stockfeed sales volumes increased 9%. Recorded a 46% increase in exports to 11 African countries
Turn around of Masterpork, West African Retail and Flour milling contributing to operational profits this year
Weakening of the Kwacha against the USD of 24%
Customers disposable income under pressure from serious macro economic headwinds
Reduced electricity availability due to an El-nino induced regional drought and a 19% increase in the cost of Diesel
Regional drought had increased the cost of maize and its products as the staples to human and animal nutrition
2019 Highlights
2019 Challenges

2 Zambeef Products PLC Annual Report 2019
Zambeef at a glanceRobust business model of vertical integration
Retail and distribution Zambeef’s products are retailed through a total of 226 outlets (2018: 206) directly to end-consumers, in a value-added form, either through the Zambeef concession agreement to operate Shoprite’s in-store butcheries (69 in 2019; 65 in 2018) or through Zambeef’s own retail and wholesale distribution network in Zambia (157 in 2019; 141 in 2018).
• 65 Zambeef retail outlets (2018: 67)• 35 Zambeef Macros (2018: 29)• 28 Novatek retail outlets (2018: 24)• 28 Zamshu outlets (2018: 19)• 1 Bakery• 38 Shoprite butcheries in Zambia (2018: 34)• 31 Shoprite butcheries in West Africa: 25 in Nigeria and 6 in Ghana (2018: 31)
Zambeef also operates one of the largest transport and trucking fleets in Zambia (230 Trucks), giving them control over its logistics and distribution.
Cold Chain Food Products• The largest processor of beef in Zambia.• Five beef abattoirs (capacity to slaughter 230,000 head p.a.) and three feedlots
located throughout Zambia (standing capacity 11,000 head).• Meat processing plant with a capacity to process over 100,000 cattle p.a. • One of the largest chicken processors producing fresh and frozen products
(capacity 8.8m broilers p.a.) and a table egg producer (285,000 layers). The Group’s breeding and hatchery operations also supply large quantities of day-old broiler chicks (capacity 22.4m p.a.) to small and medium scale poultry producers.
• One of the largest piggeries and pork processing plants in Zambia, producing bacon, pork sausages and other meat products. (capacity to slaughter 75,000 head p.a.)
• Dairy farm with approximately 2,738 cows and a dairy parlour milking capacity of 2,000 cows per day.
• Dairy processing plant (capacity 120,000 litres/day) to process milk, allowing Zambeef to add value by producing yoghurt, drinking yoghurt, cheese, butter and milk based juice).
Corporategovernance
Financialstatements
Overview Strategicreport
3Zambeef Products PLC Annual Report 2019
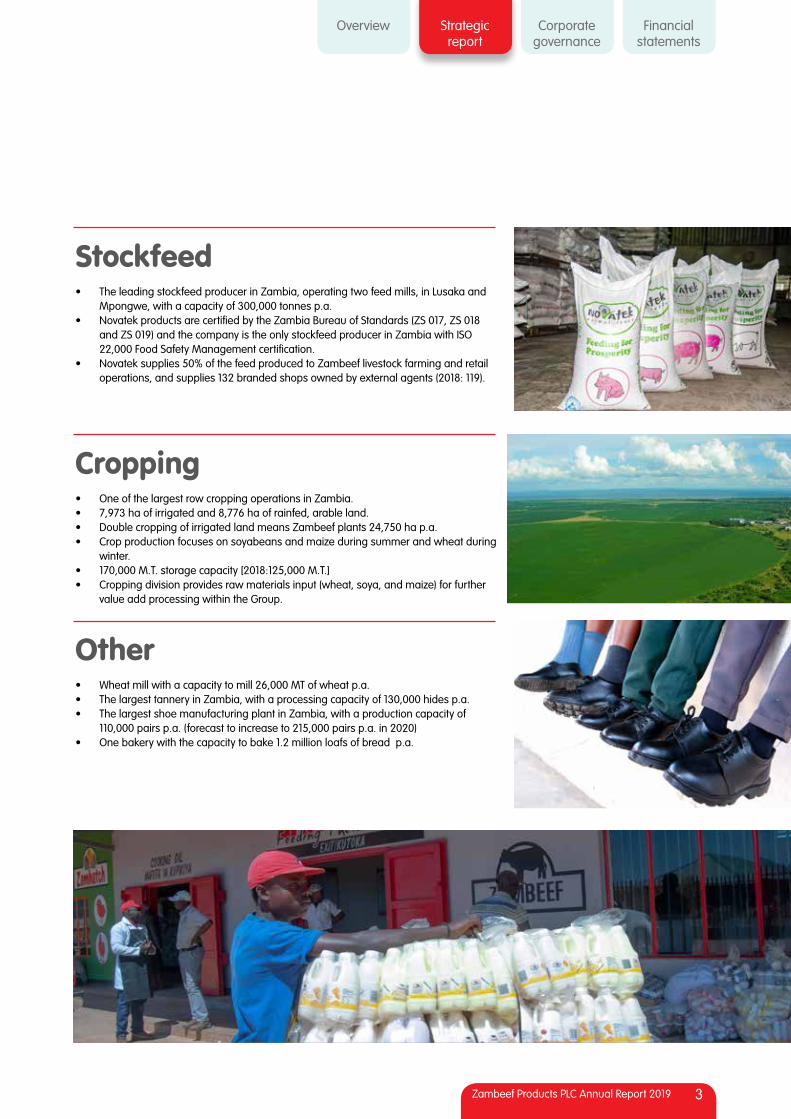
Stockfeed • The leading stockfeed producer in Zambia, operating two feed mills, in Lusaka and
Mpongwe, with a capacity of 300,000 tonnes p.a.• Novatek products are certified by the Zambia Bureau of Standards (ZS 017, ZS 018
and ZS 019) and the company is the only stockfeed producer in Zambia with ISO 22,000 Food Safety Management certification.
• Novatek supplies 50% of the feed produced to Zambeef livestock farming and retail operations, and supplies 132 branded shops owned by external agents (2018: 119).
Cropping • One of the largest row cropping operations in Zambia.• 7,973 ha of irrigated and 8,776 ha of rainfed, arable land.• Double cropping of irrigated land means Zambeef plants 24,750 ha p.a.• Crop production focuses on soyabeans and maize during summer and wheat during
winter.• 170,000 M.T. storage capacity [2018:125,000 M.T.]• Cropping division provides raw materials input (wheat, soya, and maize) for further
value add processing within the Group.
Other • Wheat mill with a capacity to mill 26,000 MT of wheat p.a.• The largest tannery in Zambia, with a processing capacity of 130,000 hides p.a.• The largest shoe manufacturing plant in Zambia, with a production capacity of
110,000 pairs p.a. (forecast to increase to 215,000 pairs p.a. in 2020)• One bakery with the capacity to bake 1.2 million loafs of bread p.a.

4 Zambeef Products PLC Annual Report 2019
History & Key Milestones
1995
2003
2005
2011 2015
2016 20182013
2017
2009
1994
1996
2004
2008
Secured concession to operate the butcheries in all Shoprite stores in Zambia
Listed on Lusaka Stock Exchange. Dr Jacob Mwanza became chairman.
Sinazongwe Abattoir built
Zampalm and Novatek Animal Feeds established
Zambeef Products Ltd. incorporated with 60 staff,
a rented abattoir & 2 butcheries, delivering 180 beef cattle per month in 3
land rovers
Acquired Huntley Farm (abattoir
and feedlot)
Acquired Sinazongwe
Farm, Shoprite expansion into
Nigeria & Ghana
First equity capital raise
(Acquired Masterpork,
Chiawa Farm, Zamanita Soya crushing
and refining plant)
Entered into JV’s with RCL Foods on Zamchick &
Zamhatch
CDC Group PLC acquires 38% Zambeef equity for US$65million. Put option settled to RCL Foods for
full interests in Zamchick & Zamhatch
IDC Zambia acquires 90% of Zampalm ltd for
US$16million
Commissioning of US$30million hatchery
and stockfeed mill at Mpongwe Farm
Disposal of Zamanita Ltd to Cargill for
US$26million
Listed on the London Stock exchange (AIM). Acquired
Mpongwe Farms

Corporategovernance
Financialstatements
Overview Strategicreport
5Zambeef Products PLC Annual Report 2019
Feeding a growing region
Nigeria
Shoprites 25 25 23
Master Meats Outlets
0 1 6
Total Nigeria 25 26 29
Ghana
Shoprites 6 6 6
Total Ghana 6 6 6
2019 2018 2017
Total Zambeef
157 141 135
Total Shoprites
69 65 60
Total Retail Network
226 206 195
2019 2018 2017
Zambia
Zambeef Outlets 65 67 81
Zambeef Macros 35 29 19
Novatek 28 24 17
Bakery 1 1 0
Zamshu Outlets 28 19 12
Total Zambeef Outlets 157 140 129
Shoprites 38 34 31
Total Zambia 195 174 160

6 Zambeef Products PLC Annual Report 2019
Chairman’s Report
The Board remains committed to achieving the strategic priorities that we set in 2014, with a key focus on the core divisions that generate sustainable and strong cashflows, particularly through our Retail and Cold Chain Food Products and Stockfeed divisions.
Dear Shareholders,I am pleased to present to you the Chairman’s Report with respect to the financial year ended 30 September, 2019.
As we had anticipated, 2019 proved a challenging year for the Group, driven by difficult economic and market conditions that impacted negatively on the Group’s financial performance, particularly in the first half of the year. Despite these challenges, the Group still generated a profit after tax of ZMW18.5 million (USD1.5 million) compared to ZMW10.5 million (USD1.1 million) in the prior financial year. This achievement, in the face of such economic and market difficulties, illustrates the Group’s fundamental strengths as a diversified and resilient business.
The Board remains committed to achieving the strategic priorities set out in 2014, with a key focus on the core divisions that generate sustainable and strong cashflows, particularly through our Retail and Cold Chain Food Products and Stockfeed divisions.
Another significant cornerstone of our strategy is our divestment of non-core assets, with realised proceeds used to reduce debt levels. Much progress has been made on this, with the disposal of Zamanita Ltd to Cargill Holdings BV in 2015, followed by the sale of our 90% shareholding in Zampalm Ltd to the Industrial Development Corporation in 2018.
During the year we entered into a binding sale and purchase agreement with Chenguang Biotech (Zambia) Agri-Dev Limited for the disposal of Sinazongwe Farm.
The Economic EnvironmentZambia experienced a challenging macroeconomic climate during the course of the Group’s 2019 financial year, which impacted on consumer spending power. The Minister of Finance stated when delivering his National Budget speech, that economic growth was expected to slow down to 2% by the end of 2019, compared with a target of 4% and growth of 3.7% in 2018. The slowdown in economic growth was primarily attributed to the severe drought the region was experiencing, and debt servicing challenges. The previous poor 2018/2019 rainy season led to poor agricultural production and constrained
electricity generation. The Kwacha weakened during the period, with the exchange rate ending the period at around ZMW13.20/USD, having started the period under review at ZMW12.24/USD.
Trading ResultsSet against this challenging macro economic backdrop, the Group’s results were reassuring, especially in the second half of the year, as management took proactive steps to deal with these challenges in both the short and long term, underpinned by continued focus on key strategic initiatives. The Group achieved profit after tax (from continuing operations) of ZMW35.9 million (USD2.9 million), compared with ZMW23.8 million (USD2.4 million) for the same period in the previous year. The increase in profitability was mainly driven by cropping, increased volumes and margins in the Stockfeed division and Retail and Cold Chain Food Products, in line with our strategic imperative of consistent revenue growth through expansion of our retail network. Net debt at the end of the period was ZMW 886.3 million (USD67.1 million) compared with ZMW684.9 million (USD55.9 million).
StockfeedThe stockfeed operations continued to grow during the year, against the backdrop of the drought, and the division remains a significant contributor to the Group. The division produced 218,762 tonnes of feed in 2019, compared to 200,846 tonnes in 2018, with Mpongwe producing 24.5% more than the previous year.
Retail and Cold Chain Food ProductsZambeef’s chain of 226 retail outlets - both own-brand and within Shoprite supermarkets - remain at the heart of the business, with demand from consumers driving supply. The Group’s focus continued with the successful roll out of seven new Macro outlets in strategic locations across Zambia and the closure of seven small retail stores as part of its ongoing drive to optimise revenue and efficiencies across the division.
CroppingThe Cropping division performed exceptionally well, despite the severe drought in summer, constrained electricity supply, and water shortages in the winter.
Corporategovernance
Financialstatements
Overview Strategicreport
7Zambeef Products PLC Annual Report 2019
Yields for all crops were above management expectations, and thus the division contributed positively to profitability.
Disposal of non-core assetsThe Group has entered into a binding sale and purchase agreement with Chenguang Biotech (Zambia) Agri-Dev Limited for the sale of Sinazongwe Farm, subject to the fulfilment of certain conditions precedent. This disposal is expected to complete by March 2020 for a cash consideration of USD10 million.
DIVIDEND While we are steadfast in our dedication to enhance shareholder value, in view of the financial performance and debt levels of the Group, no dividend will be paid in respect of this financial year. We will continue to monitor and review our dividend policy.
OUTLOOKThe macro-economic climate is expected to remain challenging for Zambia in 2020, characterised by high national debt levels, a volatile Kwacha and continued electricity supply constraints, negatively affecting business activity across the economy and in all sectors. This will impact growth of the Zambian economy and have a significant knock-on effect on our customers’ disposable incomes.
Despite these continued problems, the Group is committed to strengthening its earnings potential and unlocking value through reducing debt levels in the medium term, which will mitigate foreign exchange and interest rate risk exposures.
ACKNOWLEDGEMENTI express my sincere thanks to my fellow Board members for leading the Group through this challenging year. To our management and staff, I express our utmost appreciation for your dedicated efforts.
As a Board we would like to express our deepest gratitude to the Chief Executive Officer, Mr Francis Grogan, who will be retiring effective 31st December 2019. His leadership and profound business acumen have enabled the Zambeef Group to grow by leaps and bounds during his tenure. He has played a significant role in the Group and we all wish him all the very best.
Mr. Grogan will be succeeded from 1 January 2020 by Mr Walter Roodt, who was appointed to the Zambeef Board on 5 February 2019. Mr Grogan has been working closely with Mr Roodt and Mr Mike Lovett, the Group’s Chief Operating Officer, since January 2018 in a well-planned succession to ensure a successful and smooth transition.
On behalf of the Group, a warm welcome to our newest Board members, Mr Michael Mundashi, who was appointed as an Independent Non-Executive Director effective 11 September 2019, and Ms Faith Mukutu, the Chief Financial Officer, as an Executive Director of the Board. Their established professional backgrounds and valuable expertise will be an asset to the Group. We would also like to thank our shareholders, for their continued support of the Group. Our appreciation goes as well to our other stakeholders such as financiers, business associates and consultants for all their support.
Dr. Jacob Mwanza, Chairman 6 December 2019

8 Zambeef Products PLC Annual Report 2019
Chief Executive Officer’s ReviewOverviewThe financial year ended 30 September 2019 proved to be a challenging year amidst a regional drought and macroeconomic headwinds. The weakening of the Zambian Kwacha against the USD by approximately 24% over the period, an increase in the cost of fuel by 19% together with constrained electricity supply, due to reduced electricity generation arising from low water levels in the country’s major water reservoirs, impacted not only on Zambeef’s performance but also on our customers’ spending power. The inadequate supply of electricity has resulted in Zambeef running diesel powered generators, significantly increasing operational costs. Despite the challenges noted above, Zambeef achieved a Profit After Tax (from continuing operations) of ZMW35.9 million (USD2.9 million), compared with ZMW23.8 million (USD2.4 million), for the same period last year driven by good performance from the Cropping and Stockfeed divisions. Our revenue ended at ZMW3.1 billion (USD254.5 million), whilst we achieved a gross profit of ZMW1.1 billion (USD87.8 million), which were respectively 12.7% and 12.8% above prior year in Kwacha terms, but both down by 9.2% in USD terms. Zambeef continued to be one of the largest employers in Zambia with our total headcount averaging 7,407 per month at an average wage bill of ZMW38 million (USD3.5 million) per month.
Strategic focus areaZambeef’s management remains committed in focusing on core divisions to generate cash flow that will be channelled towards de-risking the business. Our plans are underpinned by:• Consistent revenue growth through
expansion of our retail network, driving our cold chain food products and stockfeed operations;
• Continued capital investment in the highest performing areas of the business;
• Cash generation through improved margins, cost control, working capital management and prudent capital expenditure;
• Continued divestment of non-core assets; and
• Environmental and food safety improvement projects.
During the year, Zambeef entered into a binding sale and purchase agreement with Chenguang Biotech (Zambia) Agri-Dev Limited for the sale of Sinazongwe Farm for a consideration of USD 10 million. This disposal is expected to be completed by March 2020 and the funds will be used to reduce our debt levels.
Whilst Zambeef recorded a loss after tax in the first half of the year, the second half was particularly pleasing as management managed to stabilise operations and the Group ended the year on a positive note. The cost to income ratio decreased from 26.4% (2018) to 25.1% (2019). However, due to the cash flow pressure arising from the steep increase in input costs, our net debt increased from ZMW685 million (USD56 million) to ZMW886 million (USD67 million).
Retail and Cold Chain Food ProductsThe disposable income of our customers was constrained during the financial year driven by the tough economic climate which resulted in a subdued performance. The constrained ability of the livestock production divisions to pass on the extra costs of inputs, such as feed prices and the cost of production, to the Zambian consumer was evident in the stagnant market selling prices of products in Kwacha terms.
Broiler day old chick prices reduced by 7% due to the pressure on the poultry value chain caused by the steep increase in feed prices. The chicken live market sales prices increased only 6% and whole frozen chicken prices increased by 7%. Market retail prices for a tray of 30 eggs increased by only 8%.
Beef prices remained under pressure due to the regional drought and escalating costs of feed forced farmers to sell more cattle. The prohibitive cost of finishing cattle for marketing due to shortages of maize bran, the main feed ingredient, and a 109% increase in its price impacted negatively on performance - the sales price for mixed beef increased by a mere 2%.
StockfeedZambeef’s Stockfeed division trades under the brand names Novatek and Zamfeed, with a 300,000 tons annual manufacturing capacity based in Lusaka and Mpongwe. Approximately 50% of all sales are generated through Zambeef macros and Zambeef internal livestock operations.
Zambeef’s management remains committed in focusing on core divisions to generate cash flow that will be channelled towards de-risking the business.
Corporategovernance
Financialstatements
Overview Strategicreport
9Zambeef Products PLC Annual Report 2019
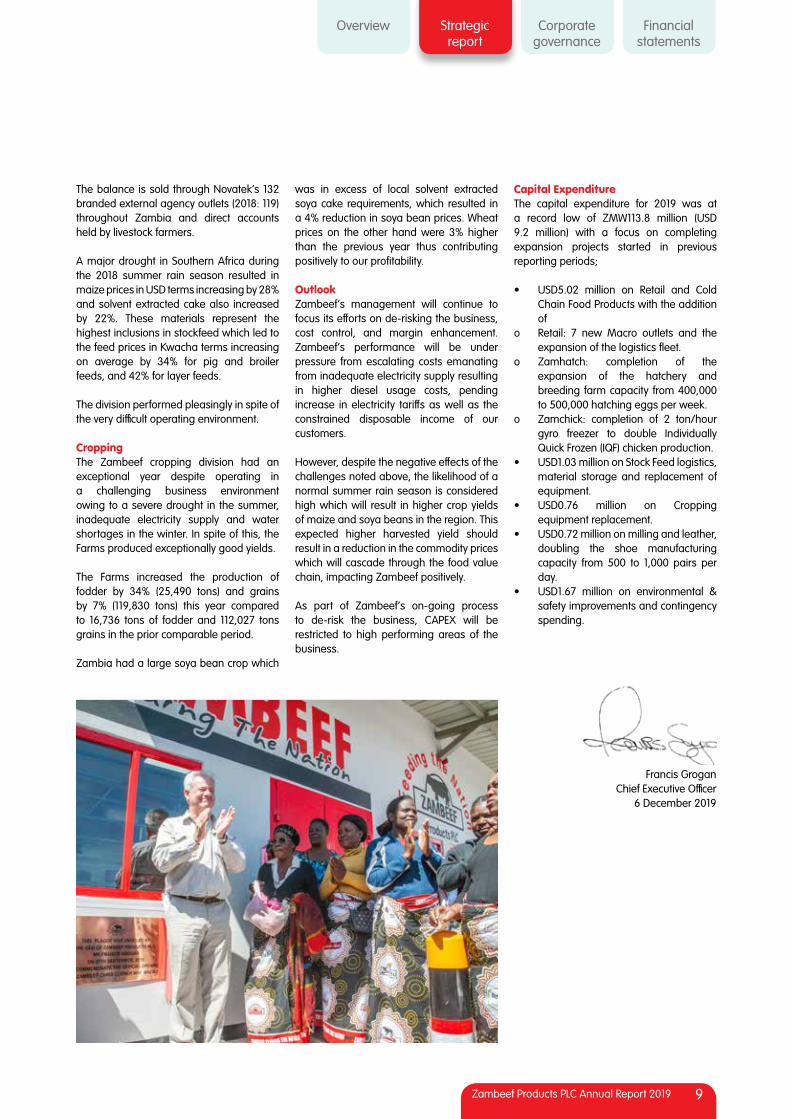
The balance is sold through Novatek’s 132 branded external agency outlets (2018: 119) throughout Zambia and direct accounts held by livestock farmers.
A major drought in Southern Africa during the 2018 summer rain season resulted in maize prices in USD terms increasing by 28% and solvent extracted cake also increased by 22%. These materials represent the highest inclusions in stockfeed which led to the feed prices in Kwacha terms increasing on average by 34% for pig and broiler feeds, and 42% for layer feeds.
The division performed pleasingly in spite of the very difficult operating environment.
CroppingThe Zambeef cropping division had an exceptional year despite operating in a challenging business environment owing to a severe drought in the summer, inadequate electricity supply and water shortages in the winter. In spite of this, the Farms produced exceptionally good yields.
The Farms increased the production of fodder by 34% (25,490 tons) and grains by 7% (119,830 tons) this year compared to 16,736 tons of fodder and 112,027 tons grains in the prior comparable period.
Zambia had a large soya bean crop which
was in excess of local solvent extracted soya cake requirements, which resulted in a 4% reduction in soya bean prices. Wheat prices on the other hand were 3% higher than the previous year thus contributing positively to our profitability.
OutlookZambeef’s management will continue to focus its efforts on de-risking the business, cost control, and margin enhancement. Zambeef’s performance will be under pressure from escalating costs emanating from inadequate electricity supply resulting in higher diesel usage costs, pending increase in electricity tariffs as well as the constrained disposable income of our customers.
However, despite the negative effects of the challenges noted above, the likelihood of a normal summer rain season is considered high which will result in higher crop yields of maize and soya beans in the region. This expected higher harvested yield should result in a reduction in the commodity prices which will cascade through the food value chain, impacting Zambeef positively.
As part of Zambeef’s on-going process to de-risk the business, CAPEX will be restricted to high performing areas of the business.
Capital ExpenditureThe capital expenditure for 2019 was at a record low of ZMW113.8 million (USD 9.2 million) with a focus on completing expansion projects started in previous reporting periods;
• USD5.02 million on Retail and Cold Chain Food Products with the addition of
o Retail: 7 new Macro outlets and the expansion of the logistics fleet.
o Zamhatch: completion of the expansion of the hatchery and breeding farm capacity from 400,000 to 500,000 hatching eggs per week.
o Zamchick: completion of 2 ton/hour gyro freezer to double Individually Quick Frozen (IQF) chicken production.
• USD1.03 million on Stock Feed logistics, material storage and replacement of equipment.
• USD0.76 million on Cropping equipment replacement.
• USD0.72 million on milling and leather, doubling the shoe manufacturing capacity from 500 to 1,000 pairs per day.
• USD1.67 million on environmental & safety improvements and contingency spending.
Francis GroganChief Executive Officer
6 December 2019

10 Zambeef Products PLC Annual Report 2019
Key Market Indicators
Reporting period market comparatives 2019 2018 Change
Economy ROE (ZMW/USD) 12.32 9.92 -24%
Copper ($/Ton) 6102 6726 -9%
Breakfast Maize meal (K/25kg) 101.8 73.7 38%
Annual Inflation rate (%) 8.4 7.1 18%
Overhead Costs
TBS 364day (Yield %) 24.7 17.4 42%
Fuel Pump Price - Diesel ZMW/Litre 13.9 11.7 19%
Commodities
Maize ($/ton) 207 161 28%
Wheat ($/ton) 447 433 3%
Soya Beans ($/Ton) 400 417 -4%
Solvent Extracted Soya Cake ($/ton) 442 363 22%
Input Prices
Maize Bran (K/ton) 1434 686 109%
Broiler Grower feed (K/50kg) 242 181 34%
Pig Grower feed (K/50kg) 200 149 34%
Layer feed (K/50kg) 175 123 42%
Day-Old Chick (K/DOC) 5.9 6.4 -7%
Selling prices
Beef Mixed Cut (K/Kg) 35.8 35.0 2%
Chicken Frozen (K/Kg) 28.9 26.9 8%
Chicken Live Market (K/Chicken) 38.2 35.9 6%
Egg Tray (K/Tray of 30 Eggs) 28.0 25.8 8%

Corporategovernance
Financialstatements
Overview Strategicreport
11Zambeef Products PLC Annual Report 2019

12 Zambeef Products PLC Annual Report 2019
Table 1: Segmental Financial summary in ZMW’000s
Table 1: Segmental Financial summary in ZMW’000s
Division
Revenue 2019
ZMW'000
Revenue 2018
ZMW'000
Gross Profit 2019 ZMW'000
Gross Profit 2018 ZMW'000
Overheads 2019
ZMW'000
Overheads 2018
ZMW'000
Operating Profit 2019 ZMW'000
Operating Profit 2018 ZMW’000
Retailing 2 038 675 1 693 234 213 502 199 117
CCFP 1 388 492 1 313 052 367 657 379 870
Less Interco (1 303 519) (1 001 575)
Combined Retail & CCFP
2 123 648 2 004 711 581 159 578 987 (419 417) (385 484) 107 744 146 215
Stock Feed 986 075 706 008 191 011 163 442 (103 751) (82 460) 73 092 68 264
Cropping 474 202 515 585 270 116 189 601 (126 413) (118 729) 101 082 29 380
Others 210 348 141 452 39 261 27 129 (21 930) (18 521) 15 361 6 885
Total 3 794 273 3 367 756 1 081 547 959 159 (671 511) (605 194) 297 279 250 744
Less: Intra/Inter Group Sales
(659 306) (587 167)
Central Overhead
(136 070) (129 907) (136 070) (132 474)
Group Total 3 134 967 2 780 589 1 081 547 959 159 (807 581) (735 101) 161 209 118 270
Divisional performance

Corporategovernance
Financialstatements
Overview Strategicreport
13Zambeef Products PLC Annual Report 2019
Division
Revenue 2019
USD’000
Revenue 2018
USD’000
Gross Profit 2019 USD’000
Gross Profit 2018 USD’000
Overheads 2019
USD’000
Overheads 2018
USD’000
Operating Profit 2019 USD’000
Operating Profit 2018 USD’000
Retailing 165 477 170 689 17 330 20 071
CCFP 112 702 132 364 29 843 38 293
Less Interco (105 805) (100 965)
Combined Retail & CCFP
172 374 202 088 47 173 58 364 (34 043) (38 859) 8 745 14 739
Stock Feed 80 039 71 170 15 503 16 476 (8 421) (8 313) 5 933 6,881
Cropping 38 490 51 974 21 925 19 113 (10 262) (11 969) 8 205 2 962
Others 17 074 14 259 3 187 2 736 (1 780) (1 867) 1 247 694
Total 307 977 339 491 87 788 96 689 (54 506) (61 008) 24 130 25 276
Less: Intra/Inter Group Sales
(53 515) (59 190)
Central Overhead
(11 045) (13 095) (11 045) (13 354)
Group Total 254 462 280 301 87 788 96 689 (65 551) (74 103) 13 085 11 922
Table 2: Segmental financial summary in USD’000s
Divisional performance (continued)
14 Zambeef Products PLC Annual Report 2019
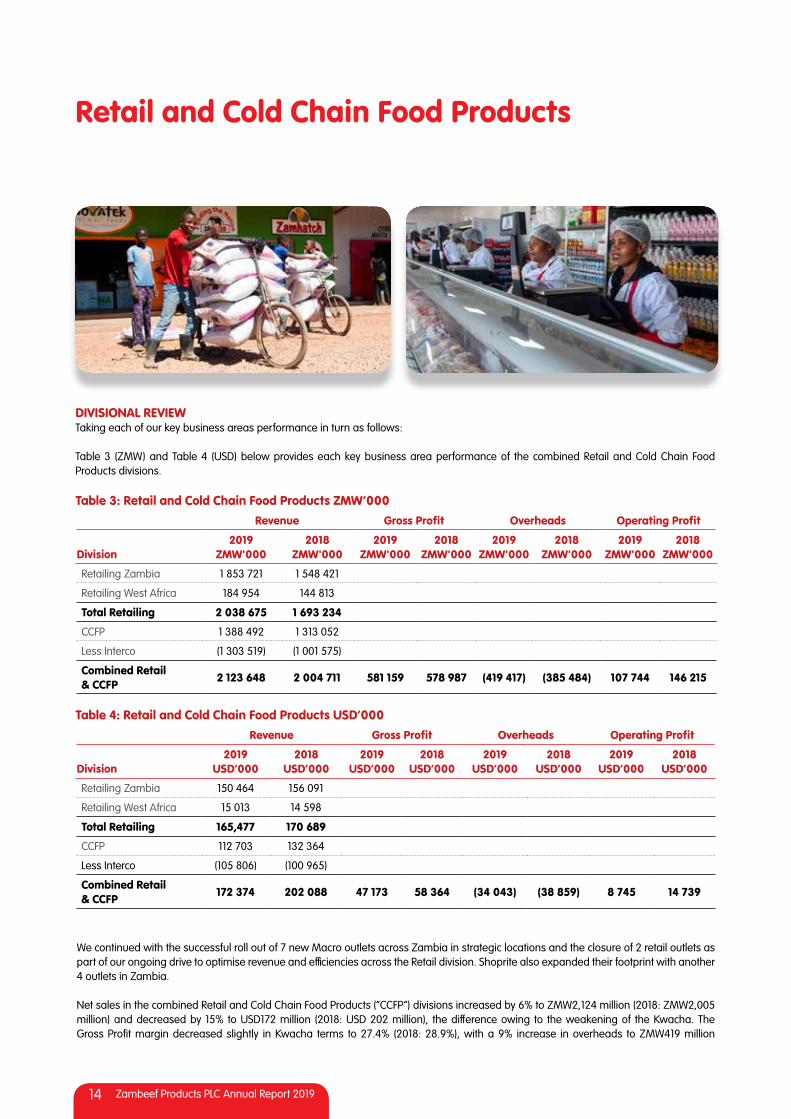
Retail and Cold Chain Food Products
DIVISIONAL REVIEWTaking each of our key business areas performance in turn as follows:
Table 3 (ZMW) and Table 4 (USD) below provides each key business area performance of the combined Retail and Cold Chain Food Products divisions.
Table 3: Retail and Cold Chain Food Products ZMW’000Revenue Gross Profit Overheads Operating Profit
Division2019
ZMW'0002018
ZMW'0002019
ZMW'0002018
ZMW'0002019
ZMW'0002018
ZMW'0002019
ZMW'0002018
ZMW'000
Retailing Zambia 1 853 721 1 548 421
Retailing West Africa 184 954 144 813
Total Retailing 2 038 675 1 693 234
CCFP 1 388 492 1 313 052
Less Interco (1 303 519) (1 001 575)
Combined Retail & CCFP
2 123 648 2 004 711 581 159 578 987 (419 417) (385 484) 107 744 146 215
Table 4: Retail and Cold Chain Food Products USD’000Revenue Gross Profit Overheads Operating Profit
Division2019
USD’0002018
USD’0002019
USD’0002018
USD’0002019
USD’0002018
USD’0002019
USD’0002018
USD’000
Retailing Zambia 150 464 156 091
Retailing West Africa 15 013 14 598
Total Retailing 165,477 170 689
CCFP 112 703 132 364
Less Interco (105 806) (100 965)
Combined Retail & CCFP
172 374 202 088 47 173 58 364 (34 043) (38 859) 8 745 14 739
We continued with the successful roll out of 7 new Macro outlets across Zambia in strategic locations and the closure of 2 retail outlets as part of our ongoing drive to optimise revenue and efficiencies across the Retail division. Shoprite also expanded their footprint with another 4 outlets in Zambia.
Net sales in the combined Retail and Cold Chain Food Products (“CCFP”) divisions increased by 6% to ZMW2,124 million (2018: ZMW2,005 million) and decreased by 15% to USD172 million (2018: USD 202 million), the difference owing to the weakening of the Kwacha. The Gross Profit margin decreased slightly in Kwacha terms to 27.4% (2018: 28.9%), with a 9% increase in overheads to ZMW419 million
Corporategovernance
Financialstatements
Overview Strategicreport
15Zambeef Products PLC Annual Report 2019
(2018: ZMW385 million) or a 12% reduction to USD34 million (2018: USD39 million).The combined Retail and CCFP divisions have still generated a satisfactory 5.1% Operating Profit margin (2018: 7.3%). The weak economy and the increase in costs from the inputs into the livestock divisions and the fuel costs used in transport and electricity generation could not be passed on to our customers through the retail network. The Operating Profit decreased by 27% to ZMW107 million (2018: ZMW146 million) in Kwacha terms and 41% to USD8.8 million (2018: USD14.7 million) in USD terms.
Zambia RetailZambia Retail revenue increased 20% to ZMW1,854 million (2018: ZMW1,548 million) whilst the Gross Profit increased by 4%. However due to the depreciation in the Kwacha relative to the USD, the revenue decreased by 3% to USD165 million (2018: USD171 million).
Strong revenue growth of 82% in the stockfeed, flour, cooking oil and other dry goods increased this segments contribution to 17% in the retailing sales mix from the previous two years contributions of 11%. Difficult trading conditions saw a decline in revenue growth on CCFP for most of the year, with a good comeback on CCFP revenue growth in the last quarter of the year. CCFP increased its revenue by 12% from the previous year. This change in the mix of products had degraded the average Gross Profit margin by 1.4%.
West Africa RetailSales in West Africa (via the Nigeria and Ghana Shoprite concessions) have increased 28% from ZMW145 Million to ZMW185 million. The turnaround of the Group’s operations in the region started showing positive results in the latter part of the previous reporting period and continued through this year. During the current period the overhead costs in Kwacha were reduced by a further 14%, although this was negatively impacted by the recent xenophobic attacks that were directed at South African businesses in Nigeria towards the end of the financial year (Shoprite has its origins in South Africa). Stock losses and the shutdown of the majority of the outlets during September detracted from the positive anticipated results from this business for the year. West African retail only contributes 9% to the retail revenue, it has however turned cash flow positive and marginally contributed to the Operating Profit in the division.
BeefBeef is the largest contributor to revenue in the CCFP. Beef sales volumes increased by 4% compared to the financial year 2018, with the number of cattle slaughtered reducing 4% due to foot and mouth disease outbreaks restricting the movement of cattle from affected areas in Zambia to our slaughter facilities, but the average slaughter weight increased by 5%. Revenue increased by 4% whilst the Gross Profit only marginally increased by 2% from ZMW125 million in 2018 to ZMW128 million in 2019.
Poultry (Zamchick, Zamhatch and ZamEgg)Revenue of the poultry business increased by 3% in 2019. It is the second largest revenue contributor to the CCFP business. Gross profits decreased by 12% from ZMW143 million in 2018 to ZMW126 million in 2019, mainly due to the higher input costs which could not be passed on to the customers.
The Zamhatch Breeder Farm and Hatchery, based on the Mpongwe Farms in the north of Zambia, continued its expansion programme, with a further investment of USD2 million during the period, ramping up the production capacity to 430,000 day-old chicks per week by year end. The day-old chick sales increased by 13% as a result of further investments into the logistics fleet as well as expansion of the Zambeef retail network which allowed for the Zamhatch distribution footprint to expand to all provinces of the country. Zamhatch continued to excel in its production efficiency and was the proud recipient of the Cobb Champion Awards for best Breeder Performance for 2018 for the EMEA region (Europe, Middle East and Africa).Increased stockfeed prices were cushioned somewhat by a reduction in day-old chick prices, with the Novatek stockfeeds and Zamhatch day-old chick basket continuing to offer an attractive opportunity for growth in this important sector of the market. The informal and small scale chicken farming sector was much more resilient and competitive than the formal poultry sector as the cost and availability of electricity had a lower impact on this sector. This positively contributed to the volumes of sales for Zamhatch and Novatek stockfeeds that are receiving the bulk of their sales from the informal sector.
The year under review was a challenging one for Zamchick with volumes increasing by 1% compared to the prior year. Multiple stockfeed price increases had a significant
negative impact on margins. Operational challenges were also experienced during the 2018/2019 summer rain season as the industry faced widespread dysbacteriosis, which negatively impacted broiler growth performance. Despite a challenging economic climate, Zamchick continued its investment into production infrastructure, with commissioning of an additional spiral freezer which allowed for increased production of Individually Quick-Frozen chicken portions, to meet the increasing demand for these products.Demand for eggs remained relatively constant during the year, while egg production dropped marginally by 3% in 2019 compared to 2018.
Pork (Masterpork)The pork division has seen a number of improvements during the year with a focus on merchandising and brand building activities undertaken. The Kwacha overhead costs were held flat (with only a 1.6% increase) together with a 5% increase in sales volumes being recorded. The revenue increased 13% and the Gross Profit increased 12% from ZMW35 million to ZMW39 million. The division was turned around from a loss making Operating Profit in 2018 to a marginal Operating Profit in 2019.
Management focus was on passing on input costs effectively to its customers by ensuring cost reflective prices of its goods. Improving the carcass quality of pigs slaughtered through advances in the grading and pricing system, resulted in 3% fewer pigs being slaughtered and increased the average pig weight by 4%, with an 8% increase in slaughtered carcass prices. Milk (ZamMilk)Milk revenue increased 16% with the Gross Profit remaining flat at ZMW67 million (2018: ZMW66 million. Sales volumes increased 8% from 19 million litres (2018) to 21 million litres processed.
The Kalundu dairy herd has had a very good year in contrast to the previous year’s challenge with a foot and mouth disease outbreak. The average milk production increased by 12% from 23.7 litres/day in 2018, to 26.6 litres/day, with 1,222 cows daily being milked at the year end. The feed cost of the milking herd increased by 48% due to the price increase in maize ingredients (maize meal, maize bran and maize silage) included in the dairy feeds.

16 Zambeef Products PLC Annual Report 2019
Stockfeed (Novatek)
Revenue Gross Profit Overheads Operating Profit
2019 ZMW'000
2018 ZMW'000
2019 ZMW'000
2018 ZMW'000
2019 ZMW'000
2018ZMW'000
2019 ZMW'000
2018 ZMW'000
986,075 706,008 191,011 163,442 (103,751) (82,460) 73,092 68,264
USD’000 USD’000 USD’000 USD’000 USD’000 USD’000 USD’000 USD’000
80,039 71,170 15,503 16,476 (8,421) (8,313) 5,933 6,881
Stockfeed increased sales volumes by 9%, producing 218,762 tons of stock feed compared to 200,846 tons in 2018. The sales volumes have again grown ahead of expectations at the Mpongwe Mill with an increase of 25% year on year.
Although revenue in Kwacha terms grew by 40% (12% in USD terms), the operating profit was only able to slightly increase by 7% to ZMW73 million (2018: ZMW68 million), or stated in USD terms, a decrease of 14% to USD6 million (2018: USD7 million). The Gross Margin reduced to 19% from 23% in the previous reporting period. Increased production costs due to running backup diesel generators for prolonged periods to generate electricity and the 19% increase in diesel costs also impacted on the logistics fleet.
The large and growing poultry sector in Zambia consumes 75% of the feed sales generated by Zambeef. The stockfeed division recorded a 46% increase in export sales with 12,718 tons having been exported to 11 neighbouring and other African countries, generating revenues in hard currencies. Although a small part of the total sales mix, the aquaculture feed sales segment recorded an impressive increase of 39% in sales volumes.
Corporategovernance
Financialstatements
Overview Strategicreport
17Zambeef Products PLC Annual Report 2019
Revenue Gross Profit Overheads Operating Profit
2019 ZMW'000
2018ZMW'000
2019 ZMW'000
2018 ZMW'000
2019 ZMW'000
2018 ZMW'000
2019 ZMW'000
2018 ZMW'000
474,202 515,585 270,116 189,601 (126,413) (118,729) 101,082 29,380
USD’000 USD’000 USD’000 USD’000 USD’000 USD’000 USD’000 USD’000
38,490 51,974 21,925 19,113 (10,262) (11,969) 8,205 2,962
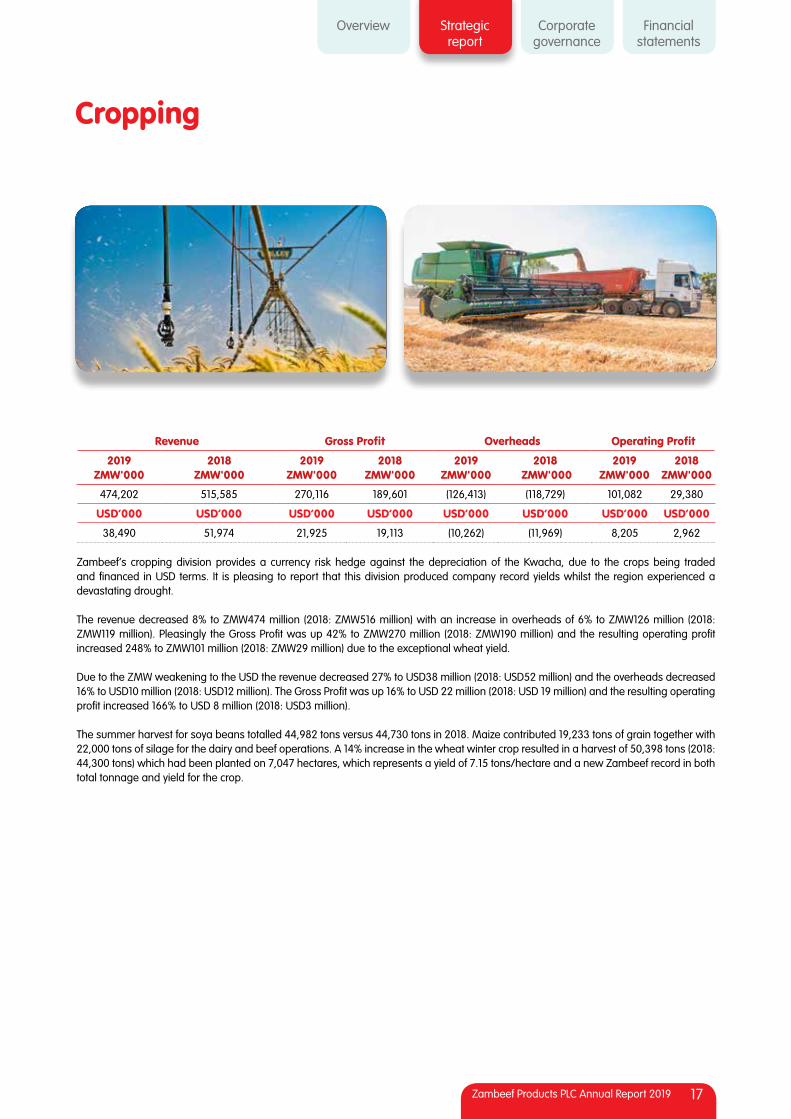
Zambeef’s cropping division provides a currency risk hedge against the depreciation of the Kwacha, due to the crops being traded and financed in USD terms. It is pleasing to report that this division produced company record yields whilst the region experienced a devastating drought.
The revenue decreased 8% to ZMW474 million (2018: ZMW516 million) with an increase in overheads of 6% to ZMW126 million (2018: ZMW119 million). Pleasingly the Gross Profit was up 42% to ZMW270 million (2018: ZMW190 million) and the resulting operating profit increased 248% to ZMW101 million (2018: ZMW29 million) due to the exceptional wheat yield.
Due to the ZMW weakening to the USD the revenue decreased 27% to USD38 million (2018: USD52 million) and the overheads decreased 16% to USD10 million (2018: USD12 million). The Gross Profit was up 16% to USD 22 million (2018: USD 19 million) and the resulting operating profit increased 166% to USD 8 million (2018: USD3 million).
The summer harvest for soya beans totalled 44,982 tons versus 44,730 tons in 2018. Maize contributed 19,233 tons of grain together with 22,000 tons of silage for the dairy and beef operations. A 14% increase in the wheat winter crop resulted in a harvest of 50,398 tons (2018: 44,300 tons) which had been planted on 7,047 hectares, which represents a yield of 7.15 tons/hectare and a new Zambeef record in both total tonnage and yield for the crop.
Cropping

18 Zambeef Products PLC Annual Report 2019
Other businesses
Revenue Gross Profit Overheads Operating Profit
2019 ZMW'000
2018ZMW'000
2019 ZMW'000
2018 ZMW'000
2019 ZMW'000
2018ZMW'000
2019 ZMW'000
2018 ZMW'000
210,348 141,452 39,261 27,129 (21,930) (18,521) 15,361 6,885
USD’000 USD’000 USD’000 USD’000 USD’000 USD’000 USD’000 USD’000
17,074 14,259 3,187 2,736 (1,780) (1,867) 1,247 694
Total revenue from the other business units increased by 49% from ZMW141 million in 2018, to ZMW210 million this financial year. The Gross Profit increased by 45% and Operating Profit increased by 123% in ZMW terms.
Flour MillingThe milling division performed above expectations, increasing sales volumes by 29% from 13,165 tons in 2018 to 16,966 tons in 2019. The milling division had absorbed the weaker exchange rate with higher selling prices. Higher volumes were achieved by producing consistently high quality flour.
Zamleather2019 has been one of the toughest years in recent times for Zamleather. The global wet blue market, which is the main channel of revenue for Zamleather, continued on a multi-year downward trend, weakening further during the financial year on the back of already record low prices. Only 84,657 hides were processed, a reduction of 31% from the prior year, with stricter focus on only sourcing higher quality grades of hides.
Shoe sales at 79,396 pairs were almost in-line with the prior year. The doubling of the shoe manufacturing factory capacity for Zamshu is in progress as part of the turnaround strategy for the Zamleather business. The Capacity of the shoe plant is being doubled from 500 pairs per day to 1,000 pairs per day to be able to value-add all the cattle hides being processed into leather at Zamleather, with a view of attaining higher margin shoe products.
The new shoe factory is expected to be commissioned in the 2020 financial period and will focus on increasing the supply of school shoes to the market.

Corporategovernance
Financialstatements
Overview Strategicreport
19Zambeef Products PLC Annual Report 2019

Zambeef Products PLC Annual Report 201920
Sustainability Report
Zambeef takes a ‘triple bottom line’ approach to its sustainability
Zambeef takes a ‘triple bottom line’ approach to the sustainability of its operations, to help deliver a positive economic, social, and environmental impact. We believe that economic sustainability is not simply our traditional corporate capital, but is measured by the impact our business has on its economic environment. We believe that our business’ sustainability is rooted in the economic and social success of the local economy.
We believe that we can deliver positive financial results whilst concurrently delivering sound social and environmental performance. Zambeef is committed to providing a safe and healthy workplace for its employees and contractors, protecting the environment and being a responsible corporate citizen in the communities in which it operates. This commitment is enshrined in our Environmental & Social and Health, Safety & Welfare Policies.
Zambeef upholds the principles set out in the International Finance Corporation Performance Standards on environmental and social sustainability.
The Board of Directors provides oversight through the Environmental and Social Committee. Through this committee, the Board provides strategic advice and guidance regarding systemic and strategic environmental and social issues. The committee ensures that the Company has adequate and robust systems in place for monitoring the environmental, health and safety and social management and performance, in accordance with applicable legislation and Good International Industry Practice (“GIIP”). Zambeef has an Environmental and Social Action Plan (“ESAP”) that has been agreed on with its development finance partners to help ensure continuous performance improvement at an operational level. The committee also monitors the adequacy of the resources devoted/allocated to the implementation of the ESAP.
Zambeef has a dedicated environmental and social corporate team of ten people, dedicated to the compliance and improvements in the operational Divisions. Across business activities, there are 25 people who are dedicated to environmental and social activities at the operational level.
Environmental performanceZambeef aims to work towards international good practice, by implementing a process of continual improvement in environmental and social management. During the year under review, the Company submitted five Environmental Project Briefs (EPB) to the Zambia Environmental Management Agency (ZEMA), as governed by Statutory Instrument No. 28 of 1997 ‘Environmental Impact Assessments Regulations’ read together with the Environmental Management Act (EMA) No. 12 of 2011. The underlisted projects were allowed by the ZEMA Board;

Corporategovernance
Financialstatements
Overview Strategicreport
21Zambeef Products PLC Annual Report 2019
1. Replacement of old incinerator at Huntley processing complex with 600 kg/hour animal incinerator unit whose emissions are compliant with EU standards.
2. Construction of new shoe/footwear factory by Zamleather near the Head Office premises.
3. Installation of 22,500 litre above ground diesel tank at Masterpork.
4. Installation of 39,000 litre above ground diesel tank at Novatek Lusaka plant.
Zambeef carried out several other upgrades in its operations aimed at improving environmental compliance.
Social performanceZambeef continues to align its social investments to meet the United Nations Sustainable Development Goals (UN SDGs).
Inclusive business model: Zambeef believes in inclusivity, consequently, it continues to source the bulk of its raw
materials from rural communities in Zambia. 100% of the beef processed by the business is sourced from local farmers, 85% of the pork handled by Masterpork is externally supplied from local farmers. Out-growers supply 70% of the broiler chickens processed by Zamchick. 85% of the maize used at Novatek Animal Feeds is externally supplied, predominantly by small scale rural farmers.
This strong linkage to rural based suppliers helps fight poverty in these otherwise ‘economically excluded’ communities, meeting the aspirations of UN SDG 1, of ‘ending poverty in all its forms everywhere’.
Community engagement: Zambeef continues engaging with neighbouring communities in the areas where we operate. Consultations are held on a regular basis and every time developmental projects are initiated at company sites. Zambeef fully complies with IFC PS 5 in all its land related engagements.
Support to vulnerable communities/groups through foodstuff donations: The Company renders support to the vulnerable (hospices/hospitals, orphanages, care homes) through donations of foodstuffs. This is done on a weekly or monthly basis, for those institutions with adequate storage facilities. There are currently 21 institutions hosting vulnerable people that the company supports through the food supply program.This gesture by the Company aligns strongly with UN SDG 2, whose main aspiration is to ‘end hunger, achieve food security and improve nutrition ….’
Support to educational and health-care institutions:Zambeef continues to fund educational and healthcare institutions. This includes institutions like Mpongwe School and the nearby medical clinic, wholly owned by the company, where teachers, teaching aids, healthcare workers, equipment and facilities are fully funded by the Company.

Zambeef Products PLC Annual Report 201922
Sustainability report continued
The Mpongwe expenses amounted to US$165,000.00 in the year under review.The company also supports community/government schools and healthcare institutions located in the communities where it operates. These company activities align with UN SDG 3 and 4, whose aspirations are to ‘ensure
healthy lives and promote well-being for all at all ages’ and ‘ensure inclusive and equitable quality education and promote lifelong learning opportunities for all’, respectively.Zambeef also supports a number of traditional ceremonies and sporting activities.
Economic performanceZambeef is a significant contributor to the country’s economic activities, with a turnover of more than 1% of the national GDP.
Employment• Zambeef continues to be one of the largest employers in the
country, with an average of 7,407 staff, 14.5 % of whom are women.
• Over 99.5% of employees are Zambian.• The Group’s cropping division provides significant employment
to rural communities, where poverty levels are higher than in urban areas.
• Most of Zambeef’s raw material suppliers are located in, and provide employment to communities in rural areas.
TaxesThe Group is a significant contributor to government revenues.
Local capital markets• A significant percentage of the Group’s shareholding is owned
by local institutional investors and pension funds, including the National Pension Scheme Authority (NAPSA), which means every working Zambian has a stake in the Company.
Export Earnings• The Group is a member of the Zambia Development Agency’s
elite Million Dollar Club of leading exporters.Skills development• The Group is fully committed to developing and training its
employees at all levels.• During the year, specific trainings in food safety, occupational
health and safety and, safe handling of hazardous materials (asbestos, chemicals) were offered to employees.
• The Group’s continual reinvestment in human resources has resulted in many senior positions being held by Zambians.
Food security• Zambeef plays a pivotal role in the national food security of
Zambia, ensuring that the country has sufficient capacity to feed its growing population as well as a surplus for export to help feed neighbouring countries. The company produced over 120,280 metric tonnes of grains (50,380 MT of wheat, 44,400 MT of Soya beans and 25,500 MT of maize) in the year under review.

Corporategovernance
Financialstatements
Overview Strategicreport
23Zambeef Products PLC Annual Report 2019
Building a nation
24 Zambeef Products PLC Annual Report 2019
Corporategovernance
Financialstatements
Overview Strategicreport
25Zambeef Products PLC Annual Report 2019
Corporate Governance

26 Zambeef Products PLC Annual Report 2019
Corporate governance
High ethical standards in the conduct of business, and a verifiable framework of corporate governance policies and procedures, underpin all Zambeef’s decision-making and management.
Zambeef Products PLC (“Zambeef” or the “Company”) values excellence in corporate governance, and the principles that enhance openness, integrity, transparency and accountability. High ethical standards in the conduct of business, and a verifiable framework of corporate governance policies and procedures, underpin all Zambeef’s decision-making and management.The Board of Directors believes that good corporate governance must be demonstrated and verifiable. This fosters trust and confidence in the management of our business, among all our stakeholders.
Corporate Governance codesThe Board has a Corporate Governance Code that complies with the Lusaka Securities Exchange (LuSE) Corporate Governance Code. Further to this, it has formally adopted the Quoted Companies Alliance QCA Corporate Governance Code (“QCA Code”) on a ‘comply or explain’ basis, as required by the AIM Rules for Companies.
The Chairman of the Board acknowledges his leadership role and responsibility in promoting good corporate governance for Zambeef. The Board is confident that it is applying the QCA Code across the main areas of delivering growth, maintaining a dynamic management framework and building trust. The Company will provide
annual updates on its compliance with the QCA Code in its Annual Report and website (www.zambeefplc.com).Board of DirectorsThe Board is responsible for the performance and direction of Zambeef, through the establishment of strategic objectives and key policies, as well as approving major business decisions, in accordance with its charter.The Board comprises 13 directors, of whom ten are Non Executive Directors, and three are Executive Directors. Seven Non-Executive Directors are considered to be independent by the Board in terms of the guidelines prescribed in the QCA Code. They are Dr Jacob Mwanza, Dr Lawrence Sikutwa, John Rabb, Margaret Kunda Chalwe Mudenda, Prof. Enala Lyson Tembo-Mwase,Michael Mundashi, and Jonathan Andrew Kirby. Details of the current Directors, their roles and background are set out in the Company’s website at zambeefplc.comThe Board believes that its overall composition is appropriate, with no individual or group dominating the decision-making process, and with a good balance between knowledge, experience and independence. The role of Chairman is a separate role and position from that of the Chief Executive Officer. The Chairman is considered to be independent.The role of the Chairman is to provide leadership to the Board and ensure its effectiveness on all aspects of its remit, in addition to providing leadership in corporate governance implementation and practice.The role of the Chief Executive Officer is the strategic development of the Group and its clear communication to the Board, and once approved by the Board, its implementation. In addition, the Chief Executive Officer is responsible for overseeing the management of the Group and its executive management.Interaction with Stakeholders un-der QCA ApplicationZambeef has several shareholder meetings, formally through annual AGMs (and EGMs where required) and informally
through biennial, quarterly or monthly meetings for institutional shareholders. Shareholders’ views are shared in an open and frank manner, with senior management taking due note of their concerns. The Board believes that this has proved successful as their views have fed into the current corporate strategy. The CFO, CEO, and Deputy Managing Director meet and conduct formal result presentations with shareholders on a biannual basis in Zambia, South Africa and the UK.The Group publishes the outcome of all shareholder resolutions immediately after each AGM/EGM. As required under the AIM Rules, Zambeef maintains all market announcements and Annual Reports on its website for the last 10 years.The Zambeef business model has identified and understands the importance of maintaining strong working relationships with:• key small-scale suppliers across
grains and livestock;• larger commercial raw material/input
suppliers and livestock suppliers; • wide customer base across stockfeed,
cold chain food products, and other products;
• regulators such as the Zambia Environmental Management Agency (ZEMA), Patents and Companies Registration Agency (PACRA), Water Resources Management Agency (WARMA), Lusaka Securities Exchange (LuSE), Securities and Exchange Commission (SEC), and AIM Nominated Advisor;
• financiers; and• social responsibility partners in
communities.
Their feedback is received through face-to-face meetings, customer care hotlines, technical advisor meetings and written communication. In the case of customer feedback, products have been developed in the stockfeed division according to customer requirements, for example. Product improvement programmes have been adopted in production of certain cold
Corporategovernance
Financialstatements
Overview Strategicreport
27Zambeef Products PLC Annual Report 2019
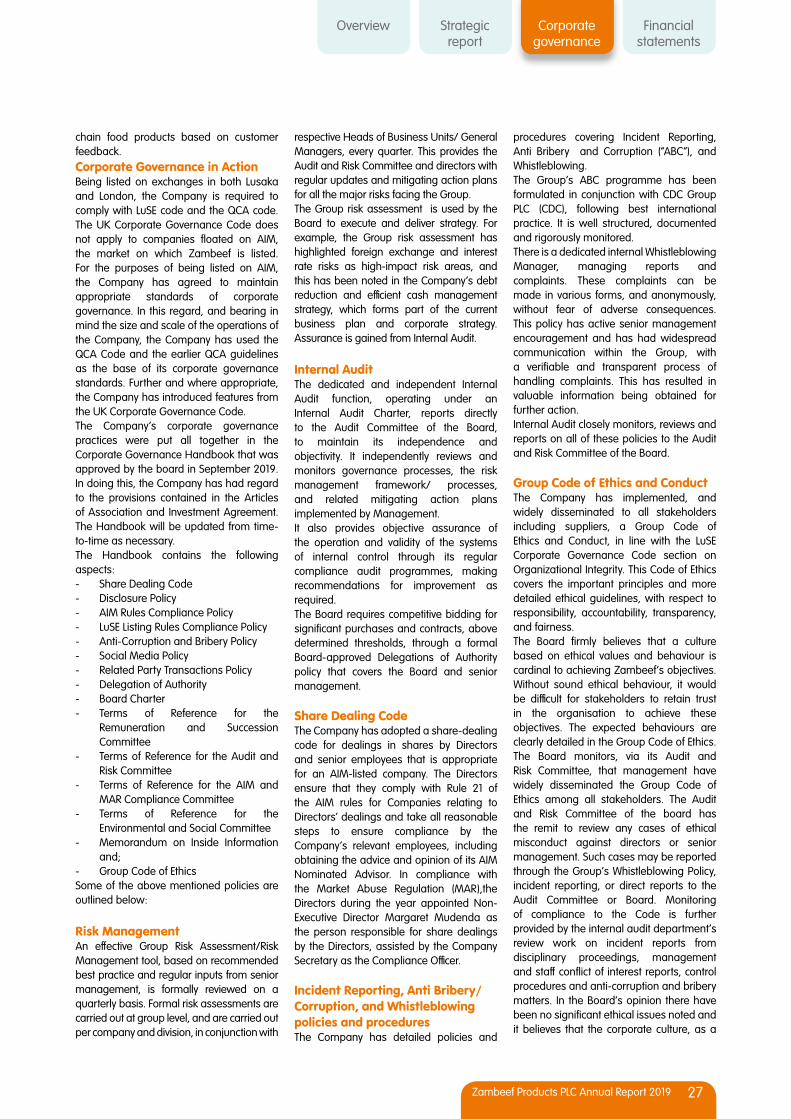
chain food products based on customer feedback.Corporate Governance in ActionBeing listed on exchanges in both Lusaka and London, the Company is required to comply with LuSE code and the QCA code. The UK Corporate Governance Code does not apply to companies floated on AIM, the market on which Zambeef is listed. For the purposes of being listed on AIM, the Company has agreed to maintain appropriate standards of corporate governance. In this regard, and bearing in mind the size and scale of the operations of the Company, the Company has used the QCA Code and the earlier QCA guidelines as the base of its corporate governance standards. Further and where appropriate, the Company has introduced features from the UK Corporate Governance Code. The Company’s corporate governance practices were put all together in the Corporate Governance Handbook that was approved by the board in September 2019. In doing this, the Company has had regard to the provisions contained in the Articles of Association and Investment Agreement. The Handbook will be updated from time-to-time as necessary.The Handbook contains the following aspects:- Share Dealing Code- Disclosure Policy- AIM Rules Compliance Policy- LuSE Listing Rules Compliance Policy- Anti-Corruption and Bribery Policy- Social Media Policy- Related Party Transactions Policy- Delegation of Authority- Board Charter- Terms of Reference for the
Remuneration and Succession Committee
- Terms of Reference for the Audit and Risk Committee
- Terms of Reference for the AIM and MAR Compliance Committee
- Terms of Reference for the Environmental and Social Committee
- Memorandum on Inside Information and;
- Group Code of Ethics Some of the above mentioned policies are outlined below:
Risk ManagementAn effective Group Risk Assessment/Risk Management tool, based on recommended best practice and regular inputs from senior management, is formally reviewed on a quarterly basis. Formal risk assessments are carried out at group level, and are carried out per company and division, in conjunction with
respective Heads of Business Units/ General Managers, every quarter. This provides the Audit and Risk Committee and directors with regular updates and mitigating action plans for all the major risks facing the Group.The Group risk assessment is used by the Board to execute and deliver strategy. For example, the Group risk assessment has highlighted foreign exchange and interest rate risks as high-impact risk areas, and this has been noted in the Company’s debt reduction and efficient cash management strategy, which forms part of the current business plan and corporate strategy. Assurance is gained from Internal Audit.
Internal AuditThe dedicated and independent Internal Audit function, operating under an Internal Audit Charter, reports directly to the Audit Committee of the Board, to maintain its independence and objectivity. It independently reviews and monitors governance processes, the risk management framework/ processes, and related mitigating action plans implemented by Management. It also provides objective assurance of the operation and validity of the systems of internal control through its regular compliance audit programmes, making recommendations for improvement as required.The Board requires competitive bidding for significant purchases and contracts, above determined thresholds, through a formal Board-approved Delegations of Authority policy that covers the Board and senior management.
Share Dealing Code The Company has adopted a share-dealing code for dealings in shares by Directors and senior employees that is appropriate for an AIM-listed company. The Directors ensure that they comply with Rule 21 of the AIM rules for Companies relating to Directors’ dealings and take all reasonable steps to ensure compliance by the Company’s relevant employees, including obtaining the advice and opinion of its AIM Nominated Advisor. In compliance with the Market Abuse Regulation (MAR),the Directors during the year appointed Non-Executive Director Margaret Mudenda as the person responsible for share dealings by the Directors, assisted by the Company Secretary as the Compliance Officer.
Incident Reporting, Anti Bribery/Corruption, and Whistleblowing policies and procedures The Company has detailed policies and
procedures covering Incident Reporting, Anti Bribery and Corruption (“ABC”), and Whistleblowing. The Group’s ABC programme has been formulated in conjunction with CDC Group PLC (CDC), following best international practice. It is well structured, documented and rigorously monitored. There is a dedicated internal Whistleblowing Manager, managing reports and complaints. These complaints can be made in various forms, and anonymously, without fear of adverse consequences. This policy has active senior management encouragement and has had widespread communication within the Group, with a verifiable and transparent process of handling complaints. This has resulted in valuable information being obtained for further action. Internal Audit closely monitors, reviews and reports on all of these policies to the Audit and Risk Committee of the Board.
Group Code of Ethics and ConductThe Company has implemented, and widely disseminated to all stakeholders including suppliers, a Group Code of Ethics and Conduct, in line with the LuSE Corporate Governance Code section on Organizational Integrity. This Code of Ethics covers the important principles and more detailed ethical guidelines, with respect to responsibility, accountability, transparency, and fairness.The Board firmly believes that a culture based on ethical values and behaviour is cardinal to achieving Zambeef’s objectives. Without sound ethical behaviour, it would be difficult for stakeholders to retain trust in the organisation to achieve these objectives. The expected behaviours are clearly detailed in the Group Code of Ethics. The Board monitors, via its Audit and Risk Committee, that management have widely disseminated the Group Code of Ethics among all stakeholders. The Audit and Risk Committee of the board has the remit to review any cases of ethical misconduct against directors or senior management. Such cases may be reported through the Group’s Whistleblowing Policy, incident reporting, or direct reports to the Audit Committee or Board. Monitoring of compliance to the Code is further provided by the internal audit department’s review work on incident reports from disciplinary proceedings, management and staff conflict of interest reports, control procedures and anti-corruption and bribery matters. In the Board’s opinion there have been no significant ethical issues noted and it believes that the corporate culture, as a
28 Zambeef Products PLC Annual Report 2019
whole, is healthy.
Board evaluationEvery year the Board undertakes a self-assessment of its performance, based on its Charter’s objectives, with the Company Secretary collating and reporting on the findings from each Board member. Board evaluation details and updates are provided in the Annual Report and website.Areas covered in the self-assessment include:• Management of Board meetings and
discussions;• External and internal Board
relationships;• Skills of Board members;• Reaction to events;• Chairman;• Chairman and CEO relationships;• Attendance and contribution in
meetings;• Open channels of communication;• Risk and Control frameworks;• Composition;• Terms of reference;• Committees of the Board;• Company Secretary;• Timeliness of information;• Board agenda;
• AGM;• External stakeholders;• Induction and training and• Succession planning.
Board committeesDuring the year, the Board reconstituted the three principal standing committees, led by a chairman who is a Non-Executive Director in each instance, and with written terms of reference. The terms of reference are in line with recommended best practice for AIM-quoted companies under the QCA code, and also per requirements from co-operating partners.
Remuneration and Succession CommitteeChairman - David OsborneMembersYollard Kachinda, Jonathan Kirby, Margaret Mudenda and Frank Braeken
Responsibilities:• To regularly review the structure, size,
knowledge, experience and diversity of the Board, as well as the sub-committees of the Board, and make recommendations to the Board with regard to changes.
• To be responsible for identifying, evaluating and nominating for the approval of the Board, candidates to fill Board vacancies, as and when they arise.
• To give full consideration to succession planning for Directors and other senior executive management, and in particular, for the key roles of Chairman and Chief Executive Officer of the Company. The appointment of CEO and directors can only be made following a formal, rigorous assessment by this committee and its formal recommendations being made to the Board, having also evaluated the balance of skills, knowledge, experience and diversity on the Board.
• To determine and agree with the Board the framework or broad policy for the remuneration of the Chief Executive, the Chairman of the Board, the Executive Directors, the company secretary, and such other members of the executive management of the Group to whom the Board has extended the remit of the committee.
• In determining the remuneration policy, take into account all factors which it deems necessary including relevant
Main Board Audit and Risk E&S Remuneration
Non-Executive A B A B A B A B
Dr. Jacob Mwanza 5 5 - - - - - -
Dr. Lawrence Sikutwa 5 4 4 4 - - - -
John Rabb 5 4 - - 4 4 3 3
David Osborne 5 5 4 3 4 3 3 -
Yollard Kachinda 5 2 - - - - 3 2
Margaret Mudenda 5 5 4 3 - - 3 3
Enala Mwase 5 3 4 3 - -
Frank Braeken 5 5 - - - - 3 3
Micheal Mundashi # 1 1 - - - - - -
Jonathan Kirby 5 5 4 4 - - 3 3
Executive
Francis Grogan 5 5 - - 4 4 - -
Faith Mukutu # 1 1 - - - - - -
Walter Roodt # 2 2 - - - - - -
Danny Museteka 5 5 4 4 4 4 3 3
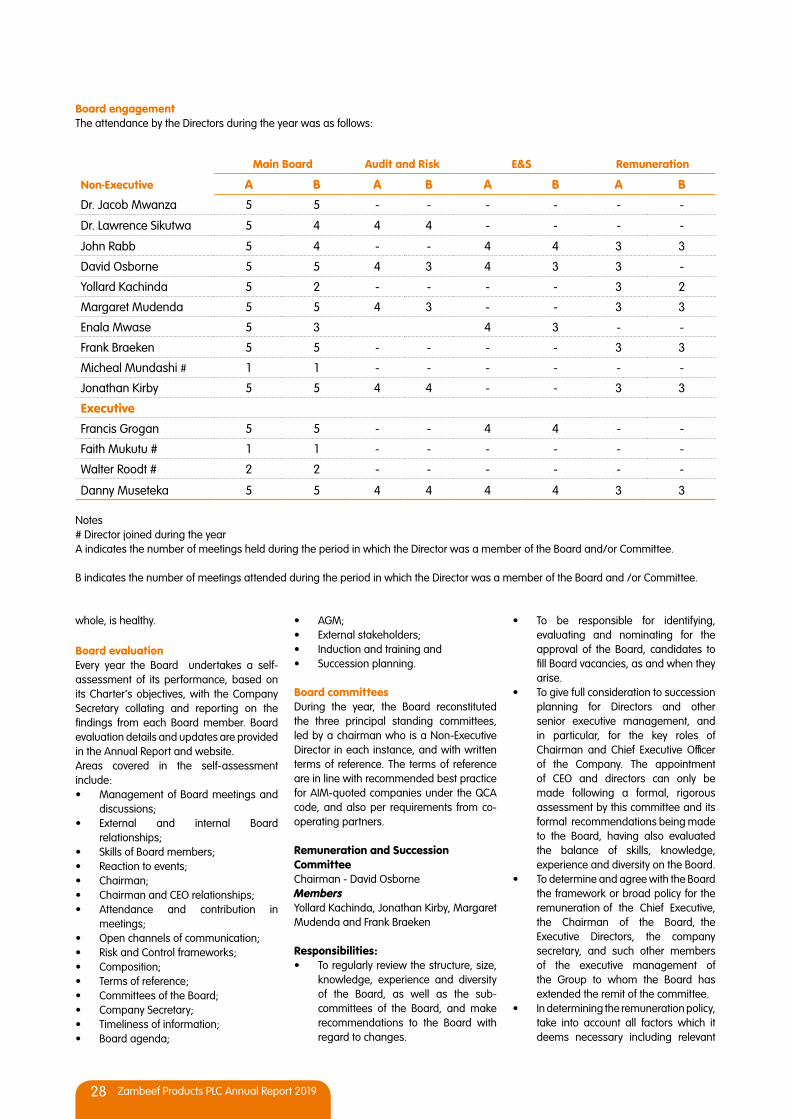
Notes # Director joined during the yearA indicates the number of meetings held during the period in which the Director was a member of the Board and/or Committee. B indicates the number of meetings attended during the period in which the Director was a member of the Board and /or Committee.
Board engagementThe attendance by the Directors during the year was as follows:

Corporategovernance
Financialstatements
Overview Strategicreport
29Zambeef Products PLC Annual Report 2019
legal and regulatory requirements, the provisions and recommendations of the QCA Code and associated guidance. The objective of this policy shall be to ensure that executive management of the Group are provided with appropriate incentives to encourage enhanced performance and are, in a fair and responsible manner, rewarded for their individual contributions to the success of the Group.
• The committee ensures clear, transparent reporting of the Remuneration Committee’s agreed fees and remuneration, for both the executive directors and non-executive directors, in the formal Report of the Directors in the Annual Report. This requires formal approval by the shareholders in an AGM. The Chairman ensures he is available to answer any questions/comments put forward by the shareholders in the AGM regarding directors’ fees and remuneration.
• Perform evaluations of the Board, Board Committees (and their constituents), and recommend training where necessary.
Audit CommitteeChairman - Lawrence SikutwaMembersMargaret Mudenda, David Osborne and Jonathan Andrew Kirby
Independent advisor and co-opted member- Hastings Mtine (QCA Code principle 6: He has extensive experience as a Chartered Accountant in the fields of financial reporting, external audit, internal audit, corporate governance and risk management gained in public practice as well as on various corporate boards. He is a former Senior Partner for KPMG Zambia. He provides a detailed review and advisory service to the Audit Committee across each of these areas.)
Responsibilities:• The primary role of the audit committee
is to ensure the integrity of the financial reporting and audit process, including review of the interim and annual financial statements before they are submitted to the board for final approval.
• To ensure that a sound risk management and internal control system is maintained as well as reviewing the system for monitoring compliance with applicable laws and regulations.
• To give due consideration and review
of corporate governance matters in accordance with relevant frameworks including the LuSE Corporate Governance Code and the QCA Code.
• Monitor and review the reports and function of the internal audit department, in line with its own charter, which requires systematic evaluation of the effectiveness of risk management, control, compliance and governance processes for the Group.
• Monitor and review the reports of the external auditors and their performance.
• At least once a year, the members of the committee should meet the external auditors without the presence of any Executive Director.
• The committee should also consider and make recommendations to the Board, to be put to shareholders for approval at the Annual General Meeting, as regards the appointment and/or reappointment of the company’s external auditor.
• Monitor the ethical conduct of the Company, its executives and senior officials.
• Environmental and Social Committee
Environmental and Social CommitteeChair - Professor Enala Lyson Tembo-Mwase MembersJohn Rabb and David Osborne
Responsibilities:• Provide strategic advice and guidance
to the Board in relation to systemic and strategic environmental and social (“E&S”) issues which affect the Company’s business model and strategy.
• Ensure that the Company has in place adequate and robust systems, policies and procedures for monitoring the E&S management of the Company, in accordance with applicable legislation and Good International Industry Practice (“GIIP”), defined by IFC Performance Standards.
• Monitor the implementation of the Environmental and Social Action Plan and any corrective action plans that may be developed in due course.
• Oversee any Company investigations relating to breaches of E&S laws, regulations and standards and/or the Company’s E&S policies, management systems and plans.
• Ensure good corporate citizenship through promotion of equality, prevention of unfair discrimination and reduction of corruption.
• Ensure contribution to development of the communities in which its activities are predominantly conducted, or within which its products or services are predominantly marketed.
Directors’ interests in other companiesIn compliance with Section 110 of the Companies Act of Zambia, all Directors are required to declare to the Board their interests in other companies, and this is taken into account in the event that any such company enters into any contract with any Group company. The Group has a Related Parties Transactions policy which aims to ensure transparency in related party transactions as well as appropriate management of any approved transactions.
Directors’ shareholdingsIn compliance with Sections 30, 110 and 195 of the Companies Act of Zambia, all Directors are required to disclose their shareholdings in the Company and any related companies.
Company SecretaryThe Board appoints the Company Secretary, and all Directors have access to his services. If deemed necessary, the Board may seek independent professional advice on some matters. • The Company Secretary ensures the
following:• Sufficient and timeous information is
provided to all the Directors prior to Board and sub-committee meetings.
• Promotion of Good Corporate Governance, and related frameworks and standards.
• Good relations and liaison with the Security and Exchange Commission (SEC), the Lusaka Securities Exchange (LuSE), and Patents and Companies Registration (PACRA).
• Maintenance of statutory registers.• Key liaison for investors and contact
point for shareholders.• Providing updates on relevant statutory
amendments and developments.
During the year, the Board constituited a Search Committee, the mandate of which was to search, interview and recommend to the Board a suitable candidate to replace Dr Jacob Mwanza, who is due to retire on December 31, 2019. The Committee was comprised of Dr Jacob Mwanza, Frank Braeken, John Rabb, Prof. Enala Mwase, Margaret Mudenda and Yollard Kachinda. Over a period of six months, the Committee interviewed various individuals and elected to nominate Mr Michael Mundashi as a suitable candidate to replace Dr Mwanza.

30 Zambeef Products PLC Annual Report 2019
Board of Directors
Dr. Jacob Mwanza(age 83)Non-Executive ChairmanNationality: Zambian
Qualifications:PhD (Cornell University, (USA)MA Economics(W. Germany).
Experience:Over 30 years’ businessmanagementexperience, both in the public and private sectors. PreviouslyGovernor of the Bank of Zambia, currently Chancellor of the University of Zambia.
External appointmentsHas served and iscurrently serving onseveral boards, including IMF Advisory Group onSub-Sahara AfricanEconomic and SocialAffairs, PangaeaSecurities, David Shepard Foundation and Kafue Sanctuary.
Francis Grogan(age 58)CEONationality: Irish
Qualifications:BSc Agriculture (Ireland)
Experience:Over 22 years’experience in agricultureand meat, both in Ireland and Zambia.Co-founder of Zambeef.
External appointmentsOther directorshipsinclude ChisambaRanching and Cropping Ltd,Fraca Meat Company Ltd and Tractorzam Ltd.
Faith Mukutu(age 39)Chief Financial OfficerNationality: Zambian
Qualifications:A.C.C.A. (Chartered Certified Accountant) – Zambia Centre for Accountancy Studies, Zambia; Certified Accounting Technician – Zambia Centre for Accountancy Studies, Zambia
Experience:Over 15 years experience in senior finance positions of major corporates, including Zambia Sugar Plc and Zambian Breweries (part of SABMiller Group)
External appointmentsCurrent directorships include: Bayport Financial Services Ltd; National Breweries Plc.
Margaret Chalwe-Mudenda(age 47)Non-Executive DirectorNationality: Zambian
Qualifications:LLB (University of Zambia); postgraduate diploma in legislative drafting (Zambia Institute of Advanced Legal Education); LLM in Information Technology and Telecommunications (Southampton University, UK).
Experience:Over 10 years’ legal experience including finance, banking and labour law. Over seven years’ experience in ICT and telecommunications. Former Director General of Zambia Information and Communications Authority.
External appointmentsCurrently serving on the Boards of Madison Financial Services Plc, Medical Stores Ltd and MCK Legal Practitioners.
Prof. Enala Tembo-Mwase(age 60)Non-Executive DirectorNationality: Zambian
Qualifications:BSc Biological Sciences (University of Zambia)MSc Medical Parasitology (University of London, UK)PhD in Zoology – Entomology (University of London, UK)
Experience:Over 30 years’ research and teaching experience. Associate Professor at University of Zambia. A founding member of the Zambia Association of Women in Science and Technology. Has previously served on a number of boards and technical committees.
External appointmentsDeputy Vice Chancellor of University of Zambia (UNZA)
Walter Roodt (age 43)Deputy Managing DirectorNationality: Namibian
Qualifications:BSc. (Agric.) Animal Science (University of Pretoria, RSA); MSc. (Agric.) Nutrition Science (University of Pretoria, RSA); Senior Executive Programme (London Business School, UK)
Experience:Over 15 years of experience in Agriculture in Southern Africa.
External appointments:Director of City Dental Ltd.
John Rabb(age 76)Non-Executive DirectorNationality: South African
Qualifications:BSc (Agriculture)MBA (RSA).
Experience:Over 30 years’ business managementexperience. FormerlyManaging Director of the Wooltru Groupin South Africa, which was listed on the Johannesburg Stock Exchange.
External appointmentsHas served on, and is currently serving on, several boards, including Wellspring Ltd.

Corporategovernance
Financialstatements
Overview Strategicreport
31Zambeef Products PLC Annual Report 2019
Yollard Kachinda(age 56)Non-Executive DirectorNationality: Zambian
Qualifications:BSc (Ed.) Mathematics and Statistics (University of Zambia) MSc Social Protection Financing (Maastricht University, Netherlands)
Experience:Over 25 years’ experience at the Zambian National Pension Scheme Authority (NAPSA), Zambeef’s biggest local shareholder.
External appointmentsDirector General of NAPSA. Currently serving on the Board of Trustees of NAPSA Lusaka Trust Hospital Staff Pension Scheme.
Dr. Lawrence Sikutwa(age 65)Non-Executive DirectorNationality: Zambian
Qualifications:MBAFCIIPost Grad Diploma in Insurance (UK).Honorary doctorate(University of Lusaka)
Experience:Over 30 years’experience in business management. Previously General Manager of Zambia State InsuranceCorporation Limited.
External appointmentsCurrently Chairman of Lawrence SikutwaAssociates Ltd Group of Companies.
Jonathan Kirby(age 57)Non-Executive DirectorNationality: South African
QualificationsBachelor of Accounting (University of the Witwatersrand, RSA)Higher Diploma in Tax Law (Rand Afrikaans University, RSA) CA (RSA)
Experience:Over 30 years’ business management and banking in London, Hong Kong, Singapore and South Africa. Previously Vice President (Finance) of AB Inbev Africa and CFO of SABMiller Africa.
External appointmentsCurrently on the board of Delta Corporation, Zimbabwe and Consol Holdings (Pty) Ltd, South Africa.
David Osborne(age 55)Non-Executive DirectorNationality: British
Qualifications:Cambridge University;Trinity College (NaturalSciences).
Experience:Over 30 years’investment experience in private equity and infrastructure in UK,Europe, Africa and Asia. Previously Managing Partner and Head of the Islamic Infrastructure Fund at CapAsia.
External appointmentsDirector of Direct EquityTeam and Head ofPortfolio Managementwith CDC Group PLC.
Frank Braeken(age 59)Non-Executive DirectorNationality: Belgian
Qualifications:MBA in Finance (Leuven University, Belgium)Degree in Law with major in Corporate Law (Catholic University Lueven, Belgium)Adavanced Management Program (Wharton Penn University, USA)
Experience:Over 30 years of experience in the Fast-Moving Consumer Goods (@FMCG@) industry. Previously head of Unilever Africa and Chief Investment officer of Amatheon Agri Holding
External appointmentsCurrently serving on the boards of Feronia Inc., Buhler AG, Alliance for a Green Revolution in Africa, F.M.B BWC-LLC, Marie Stopes International and Seven Hills Ranch Limited.
Michael Mundashi (age 61)Non-Executive DirectorNationality: Zambian
Qualifications:Bachelor of Laws Degree (University of Zambia); Post Graduate qualification as an Advocate of the High Court of Zambia
Experience:Over 30 years post qualification experience in both the public and private sectors. Served as Chairman of the Zambian Tax Appeals Court and as Independent Non-Executive Chairman of Standard Chartered Bank Zambia Plc.
External appointmentsCurrently serving as Chairman of British American Tobacco Zambia Plc and Sanlam Insurance; Director of Nico General Insurance. Also, full time Managing Partner of the law firm of Mulenga Mundashi Legal Practitioners.

32 Zambeef Products PLC Annual Report 2019
Report of the DirectorsIn compliance with Section 275 of the Zambian Companies Act, the Directors submit their report on the activities of the Group for the year ended 30 September 2019.
1. Principal activitiesZambeef Products PLC and its subsidiaries (“The Group”) is one of the largest agri-businesses in Zambia. The Group is principally involved in the production, processing, distribution and retailing of beef, chicken, pork, milk, dairy products, eggs, edible oils, stock feed and flour. The Group also has large row cropping operations (principally maize, soya beans and wheat), with approximately 7,973 Ha of row crops under irrigation and 8,776 Ha of rain-fed/dry-land crops available for planting each year. The Group also has operations in West Africa in Nigeria and Ghana.
2. The CompanyThe Company, Zambeef Products Plc, is a public limited company incorporated and domiciled in Zambia.
Business address Postal addressPlot 4970, Manda Road Private Bag 17Industrial Area WoodlandsLusaka LusakaZAMBIA ZAMBIA
3. Share capitalDetails of the Company’s authorised and issued share capital are as follows:
30 September 2019 30 September 2018
ZMW'000s USD'000s ZMW'000s USD'000s
Authorised
700,000,000 ordinary shares of ZMW0.01 each 7,000 938 7,000 938
Issued and fully paid
Ordinary shares
300,579,630 of ZMW0.01 each 3,006 449 3,006 449
Preference shares – Convertible Redeemable
100,057,658 of ZMW0.01 each 1,000 100 1,000 100
4. ResultsThe Group’s results are as follows:
Group Note
2019 2019 2018 2018
ZMW’000s USD’000s ZMW’000s USD’000s
Revenue 5 3,134,967 254,462 2,780,589 280,301
Profit before taxation 38,653 3,138 28,011 2,823
Taxation charge 10 (2,780) (226) (4,257) (429)
Loss from discontinued operation (17,379) (1,411) (13,261) (1,337)
Group profit for the year 18,494 1,501 10,493 1,057
Group profit/(loss) attributable to:
Equity holders of the parent 18,100 1,469 10,601 1,068
Non-controlling interest 394 32 (108) (11)
18,494 1,501 10,493 1,057

Corporategovernance
Financialstatements
Overview Strategicreport
33Zambeef Products PLC Annual Report 2019
5. DividendsThere has been no dividend proposed for the year ended 30 September 2019 (2018: ZMW nil).
6. ManagementThe senior management currently comprises:Francis Grogan - Chief Executive Officer Walter Roodt - Deputy Managing DirectorFaith Mukutu - Chief Financial OfficerMike Lovett - Chief Operating OfficerDanny Museteka - Company SecretaryYusuf Koya - Group Head – Banking & AdministrationFelix Lupindula - Corporate Affairs ManagerPravin Abraham - Chief Internal AuditorEbrahim Israel - General Manager – International RetailingMurray Moore - General Manager – Beef and DairyLewis Potgieter - General Manager – Sinazongwe FarmRobert Hoskins Davies - General Manager – Chiawa Farm Francis Mondomona - General Manager – Huntley Farm Richard Franklin - General Manager – Zamleather LimitedHarry Hayden-Payne - General Manager – Zampalm LimitedMathews Ngosa - General Manager – Zam Chick Limited, Zamhatch LimitedWillem Abraham Vorster - General Manager – DairyAlun Maskell - General Manager – Masterpork LimitedChristian Engelbrecht - General Manager – Stock FeedTheo de Lange - Group Technical ManagerBartholomew Mbao - Dairy Processing ManagerLenard Mwanamumbula - Piggery ManagerCharles Milupi - Poultry ManagerIvor Chilufya - Group Financial ControllerJustin Rust - Commercial ManagerBasil Webber - Commercial Manager Phillip Diedericks - Commercial ManagerNiyaas Dalal - Finance Manager – Zambeef Products Plc, Zam Chick Limited, Zamhatch LimitedSimon Nkhata - Finance Manager – Zambeef Retailing LimitedWinston Magutswi - Finance Manager – Masterpork Limited Baron Chisola - Finance Manager – Zamleather Limited, Zampalm Limited, Group InventoryShadreck Banda - Financial Controller – Group Fixed AssetsChizola Daka - Financial Controller – Group SuppliersGbenga Ibitoye - Financial Controller – West AfricaCaroline Mulaga - Group Head – Debtors and Credit ControlAnthony Seno - Head of ITMathews Mbasela - Head of Payroll ProcessingEddie Tembo - Chief Security ManagerJones Kayawe - Head of Environment, Health and SafetyField Musongole - Maintenance ManagerErnest Gondwe - Regional Manager – Shoprite & Excellent MeatsFrancis Mulenga - Regional Manager – ShopriteNoel Chola - Regional Manager – ShopriteRodgers Chinkuli - Regional Manager – Zambeef Outlets Hillary Anderson - National Retail Manager - ShopriteLufeyo Nkhoma - General Manager – Master Meats GhanaClement Mulenga - General Manager – Master Meats Nigeria
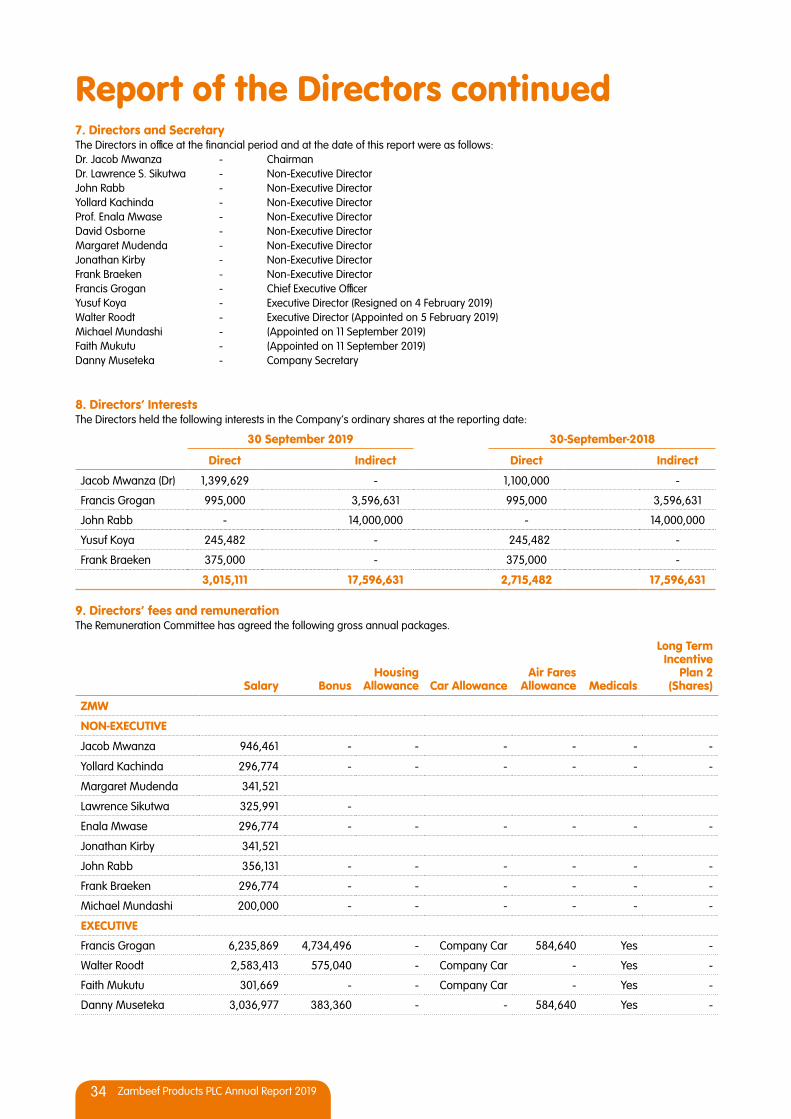
34 Zambeef Products PLC Annual Report 2019
Report of the Directors continued7. Directors and SecretaryThe Directors in office at the financial period and at the date of this report were as follows:Dr. Jacob Mwanza - ChairmanDr. Lawrence S. Sikutwa - Non-Executive DirectorJohn Rabb - Non-Executive DirectorYollard Kachinda - Non-Executive DirectorProf. Enala Mwase - Non-Executive DirectorDavid Osborne - Non-Executive DirectorMargaret Mudenda - Non-Executive DirectorJonathan Kirby - Non-Executive DirectorFrank Braeken - Non-Executive DirectorFrancis Grogan - Chief Executive OfficerYusuf Koya - Executive Director (Resigned on 4 February 2019) Walter Roodt - Executive Director (Appointed on 5 February 2019)Michael Mundashi - (Appointed on 11 September 2019)Faith Mukutu - (Appointed on 11 September 2019)Danny Museteka - Company Secretary
8. Directors’ InterestsThe Directors held the following interests in the Company’s ordinary shares at the reporting date:
30 September 2019 30-September-2018
Direct Indirect Direct Indirect
Jacob Mwanza (Dr) 1,399,629 - 1,100,000 -
Francis Grogan 995,000 3,596,631 995,000 3,596,631
John Rabb - 14,000,000 - 14,000,000
Yusuf Koya 245,482 - 245,482 -
Frank Braeken 375,000 - 375,000 -
3,015,111 17,596,631 2,715,482 17,596,631 9. Directors’ fees and remunerationThe Remuneration Committee has agreed the following gross annual packages.
Salary BonusHousing
Allowance Car AllowanceAir Fares
Allowance Medicals
Long Term Incentive
Plan 2 (Shares)
ZMW
NON-EXECUTIVE
Jacob Mwanza 946,461 - - - - - -
Yollard Kachinda 296,774 - - - - - -
Margaret Mudenda 341,521
Lawrence Sikutwa 325,991 -
Enala Mwase 296,774 - - - - - -
Jonathan Kirby 341,521
John Rabb 356,131 - - - - - -
Frank Braeken 296,774 - - - - - -
Michael Mundashi 200,000 - - - - - -
EXECUTIVE
Francis Grogan 6,235,869 4,734,496 - Company Car 584,640 Yes -
Walter Roodt 2,583,413 575,040 - Company Car - Yes -
Faith Mukutu 301,669 - - Company Car - Yes -
Danny Museteka 3,036,977 383,360 - - 584,640 Yes -
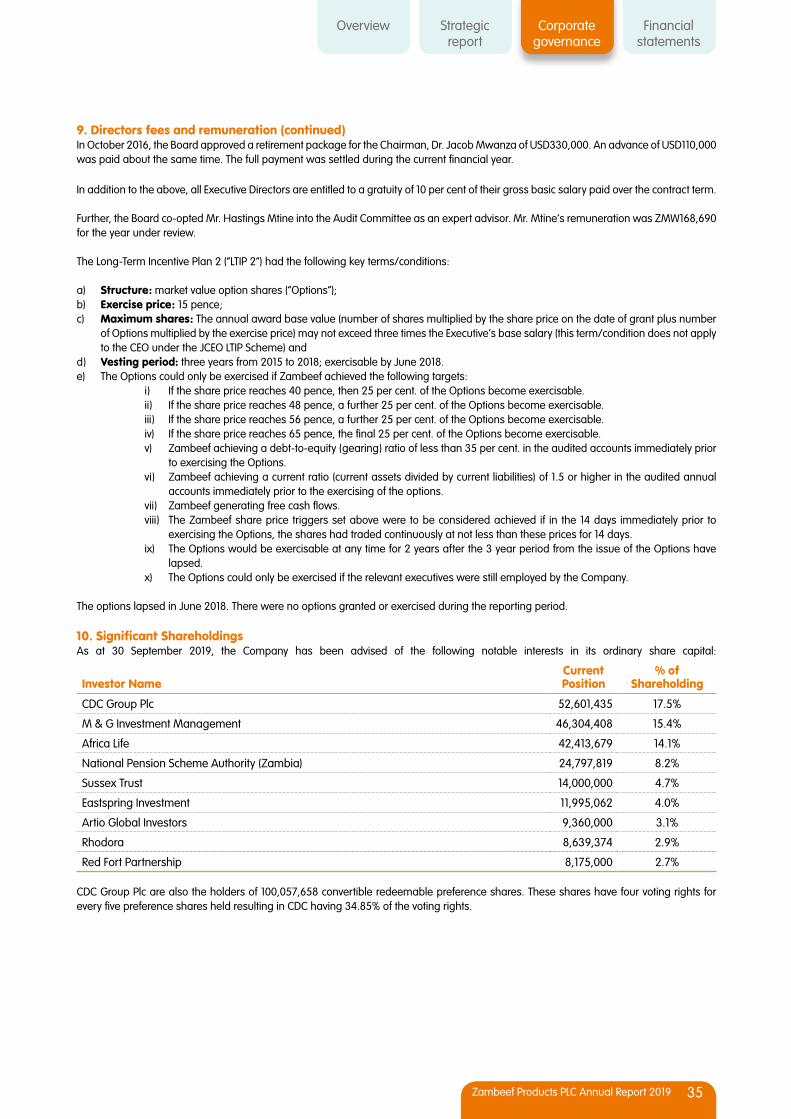
Corporategovernance
Financialstatements
Overview Strategicreport
35Zambeef Products PLC Annual Report 2019
9. Directors fees and remuneration (continued)In October 2016, the Board approved a retirement package for the Chairman, Dr. Jacob Mwanza of USD330,000. An advance of USD110,000 was paid about the same time. The full payment was settled during the current financial year.
In addition to the above, all Executive Directors are entitled to a gratuity of 10 per cent of their gross basic salary paid over the contract term.
Further, the Board co-opted Mr. Hastings Mtine into the Audit Committee as an expert advisor. Mr. Mtine’s remuneration was ZMW168,690 for the year under review.
The Long-Term Incentive Plan 2 (“LTIP 2”) had the following key terms/conditions:
a) Structure: market value option shares (“Options”); b) Exercise price: 15 pence; c) Maximum shares: The annual award base value (number of shares multiplied by the share price on the date of grant plus number
of Options multiplied by the exercise price) may not exceed three times the Executive’s base salary (this term/condition does not apply to the CEO under the JCEO LTIP Scheme) and
d) Vesting period: three years from 2015 to 2018; exercisable by June 2018. e) The Options could only be exercised if Zambeef achieved the following targets:
i) If the share price reaches 40 pence, then 25 per cent. of the Options become exercisable. ii) If the share price reaches 48 pence, a further 25 per cent. of the Options become exercisable. iii) If the share price reaches 56 pence, a further 25 per cent. of the Options become exercisable. iv) If the share price reaches 65 pence, the final 25 per cent. of the Options become exercisable. v) Zambeef achieving a debt-to-equity (gearing) ratio of less than 35 per cent. in the audited accounts immediately prior
to exercising the Options. vi) Zambeef achieving a current ratio (current assets divided by current liabilities) of 1.5 or higher in the audited annual
accounts immediately prior to the exercising of the options. vii) Zambeef generating free cash flows. viii) The Zambeef share price triggers set above were to be considered achieved if in the 14 days immediately prior to
exercising the Options, the shares had traded continuously at not less than these prices for 14 days. ix) The Options would be exercisable at any time for 2 years after the 3 year period from the issue of the Options have
lapsed. x) The Options could only be exercised if the relevant executives were still employed by the Company.
The options lapsed in June 2018. There were no options granted or exercised during the reporting period.
10. Significant ShareholdingsAs at 30 September 2019, the Company has been advised of the following notable interests in its ordinary share capital:
Investor NameCurrent Position
% of Shareholding
CDC Group Plc 52,601,435 17.5%
M & G Investment Management 46,304,408 15.4%
Africa Life 42,413,679 14.1%
National Pension Scheme Authority (Zambia) 24,797,819 8.2%
Sussex Trust 14,000,000 4.7%
Eastspring Investment 11,995,062 4.0%
Artio Global Investors 9,360,000 3.1%
Rhodora 8,639,374 2.9%
Red Fort Partnership 8,175,000 2.7%
CDC Group Plc are also the holders of 100,057,658 convertible redeemable preference shares. These shares have four voting rights for every five preference shares held resulting in CDC having 34.85% of the voting rights.
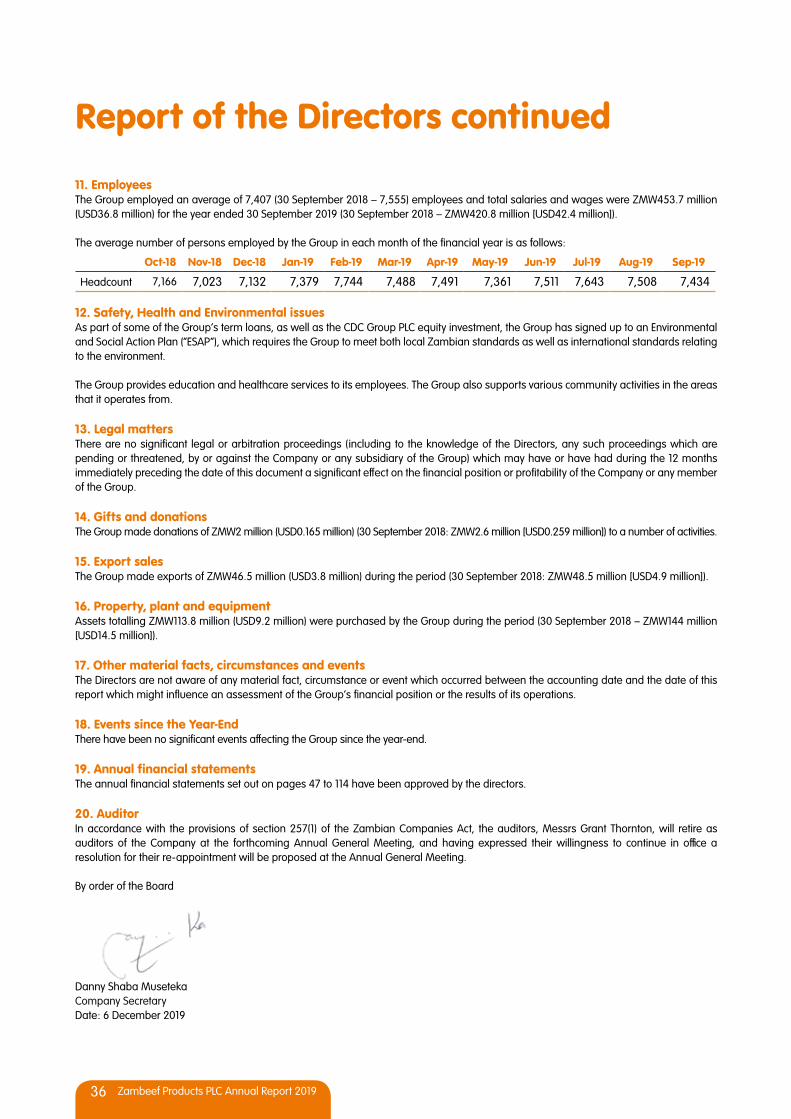
36 Zambeef Products PLC Annual Report 2019
11. EmployeesThe Group employed an average of 7,407 (30 September 2018 – 7,555) employees and total salaries and wages were ZMW453.7 million (USD36.8 million) for the year ended 30 September 2019 (30 September 2018 – ZMW420.8 million [USD42.4 million]).
The average number of persons employed by the Group in each month of the financial year is as follows:
Oct-18 Nov-18 Dec-18 Jan-19 Feb-19 Mar-19 Apr-19 May-19 Jun-19 Jul-19 Aug-19 Sep-19
Headcount 7,166 7,023 7,132 7,379 7,744 7,488 7,491 7,361 7,511 7,643 7,508 7,434
12. Safety, Health and Environmental issuesAs part of some of the Group’s term loans, as well as the CDC Group PLC equity investment, the Group has signed up to an Environmental and Social Action Plan (“ESAP”), which requires the Group to meet both local Zambian standards as well as international standards relating to the environment.
The Group provides education and healthcare services to its employees. The Group also supports various community activities in the areas that it operates from.
13. Legal mattersThere are no significant legal or arbitration proceedings (including to the knowledge of the Directors, any such proceedings which are pending or threatened, by or against the Company or any subsidiary of the Group) which may have or have had during the 12 months immediately preceding the date of this document a significant effect on the financial position or profitability of the Company or any member of the Group.
14. Gifts and donationsThe Group made donations of ZMW2 million (USD0.165 million) (30 September 2018: ZMW2.6 million [USD0.259 million]) to a number of activities.
15. Export salesThe Group made exports of ZMW46.5 million (USD3.8 million) during the period (30 September 2018: ZMW48.5 million [USD4.9 million]).
16. Property, plant and equipmentAssets totalling ZMW113.8 million (USD9.2 million) were purchased by the Group during the period (30 September 2018 – ZMW144 million [USD14.5 million]).
17. Other material facts, circumstances and eventsThe Directors are not aware of any material fact, circumstance or event which occurred between the accounting date and the date of this report which might influence an assessment of the Group’s financial position or the results of its operations.
18. Events since the Year-EndThere have been no significant events affecting the Group since the year-end.
19. Annual financial statementsThe annual financial statements set out on pages 47 to 114 have been approved by the directors.
20. AuditorIn accordance with the provisions of section 257(1) of the Zambian Companies Act, the auditors, Messrs Grant Thornton, will retire as auditors of the Company at the forthcoming Annual General Meeting, and having expressed their willingness to continue in office a resolution for their re-appointment will be proposed at the Annual General Meeting.
By order of the Board
Danny Shaba MusetekaCompany SecretaryDate: 6 December 2019
Report of the Directors continued

Corporategovernance
Financialstatements
Overview Strategicreport
37Zambeef Products PLC Annual Report 2019
Section 265 of the Zambian Companies Act 2017 requires the Directors to prepare financial statements for each financial year which give a true and fair view of the financial position of Zambeef Products PLC and its subsidiaries and of its financial performance and its cash flows for the year then ended. In preparing such financial statements, the Directors are responsible for:
• designing, implementing and maintaining internal control relevant to the preparation and fair presentation of financial statements that are free from material misstatement whether due to fraud or error;
• selecting appropriate accounting policies and applying them consistently;• making judgements and accounting estimates that are reasonable in the circumstances; and• preparing the financial statements in accordance with the applicable financial reporting framework, and on the going concern basis
unless it is inappropriate to presume that the Group will continue in business.
The Directors are responsible for keeping proper accounting records which disclose with reasonable accuracy at any time the financial position of the Group and enable them to ensure that the financial statements comply with the Zambian Companies Act 2017. They are also responsible for safeguarding the assets of the Group and hence for taking reasonable steps for the prevention and detection of fraud and other irregularities.
The Board of Directors confirm that in their opinion:(a) the financial statements give a true and fair view of the financial position of Zambeef Products PLC and its subsidiaries as at 30
September 2019, and of its financial performance and its cash flows for the year then ended;
(b) at the date of this statement there are reasonable grounds to believe that the Group will be able to pay its debts as and when these fall due; and
(c) the financial statements are drawn up in accordance with the provisions of the second schedule to Section 164 of the Companies Act and International Financial Reporting Standards.
This statement is made in accordance with a resolution of the Directors.
Signed at Lusaka on 6 December 2019
Dr. Jacob Mwanza Francis GroganChairman Chief Executive Officer
Statement Of Directors’ Responsibilities

38 Zambeef Products PLC Annual Report 2019
Approval of annual Financial Statements
Annual compliance certificate
The annual financial statements that appear on pages 47 to 114 were approved by the Board of Directors on 6 December 2019 andsigned on its behalf by:
Pursuant to the requirements of schedule 18 to the rules of the Lusaka Stock Exchange, I the undersigned Danny Museteka being the duly appointed and registered Secretary certify to the Lusaka Securities Exchange that Zambeef Products Plc has during the twelve months ended 30 September 2019, complied with every disclosure requirement for continued listing on the Lusaka Stock Exchange imposed by the Board of the Exchange during that period.In addition, I hereby confirm that for the year ended 30 September 2019, the Company has lodged with the Registrar of Companies all such returns as are required by a public company in terms of the Zambian Companies Act 1994 and that all such returns are true and correct.
Dr. Jacob MwanzaChairman
Signed in Lusaka on 6 December 2019
Fracis GroganChief Executive Officer
Danny MusetekaCompany Secretary6 December 2019

Corporategovernance
Financialstatements
Overview Strategicreport
39Zambeef Products PLC Annual Report 2019
40 Zambeef Products PLC Annual Report 201940 Zambeef Products PLC Annual Report 2015
Overview Strategicreport
Corporategovernance
Financialstatements
Zambeef Products PLC Annual Report 2019 41
Financialstatements
42 Zambeef Products PLC Annual Report 2019
Opinion We have audited the consolidated financial statements of Zambeef Products PLC (the ‘Company’) and its subsidiaries (the ‘Group’), which comprise the consolidated and separate statements of financial position as at 30 September 2019, and the consolidated statement of profit or loss and other comprehensive income, consolidated and separate statement of changes in equity and the consolidated and separate statements of cash flows for the year then ended, and notes to the financial statements, including a summary of significant accounting policies.
In our opinion, the accompanying financial statements give a true and fair view of the consolidated and company financial position of Zambeef Products PLC as at 30 September 2019, and of its consolidated and company financial performance and its consolidated and company cash flows for the year then ended in accordance with International Financial
Reporting Standards (IFRSs) and the requirements of the Companies Act and the Securities Act of Zambia.
Basis for Opinion We conducted our audit in accordance with International Standards on Auditing (ISAs). Our responsibilities under those standards are further described in the Auditor’s Responsibilities for the Audit of the Financial Statements section of our report. We are independent of the Group and Zambeef Products PLC in accordance with the International Ethics Standards Board for Accountants’ International Code of Ethics for Professional Accountants (IESBA Code) together with ethical requirements that are relevant to our audit of the financial statements in Zambia, and we have fulfilled our other ethical responsibilities in accordance with these
Description of matter How the matter was addressed in our audit
Valuation of biological assets
The valuation of biological assets is determined through use of estimates and category of the animals.
Due to the judgements required in arriving at biological assets values, the valuation of biological assets was considered a key matter.
We counted the livestock at the year-end and engaged an expert to review the categorization and quality of the animals. We also measured the crop fields, checked the yields and engaged experts to check the quality of the crop.
We also checked the valuations of biological assets.
Classification, measurement and impairment of financial assets
IFRS 9 was implemented during the financial year under review.
The directors are required to review the classifications of assets and align the classifications to the requirements of the financial reporting standards. The directors also reviewed the fair valuations and impairment model.
Due to the complex and subjective judgements required in estimating the timing and valuation of impairment and in estimating the fair value of assets, this was considered a key audit matter.
We reviewed the classification of the financial assets for compliance with the reporting standards.
In considering the reasonableness of the impairment provision, we tested the aging of the outstanding receivables to determine those that were overdue.
We further assessed their recoverability through testing of subsequent receipts.
Valuation of goodwill
Goodwill amounting to K167 million (USD 12.6 million) was carried in the statement of financial position. Under IFRS, the Company is required to test the amount of goodwill for impairment at least annually. In case of impairment triggers, goodwill requires impairment testing as well. The impairment tests were significant to our audit due to the complexity of the assessment process and judgements and assumptions involved which are affected by expected future market and economic developments.
We challenged the cash flow projections included in the annual goodwill impairment tests. For our audit we furthermore critically assessed and tested the assumptions and methodologies used by management.
Report of the Independent Auditors to the Members of Zambeef Products PLC and its Subsidiaries

Overview Strategicreport
Corporategovernance
Financialstatements
Zambeef Products PLC Annual Report 2019 43
Deferred tax assets
The group has a significant amount of deferred tax assets, mainly resulting from net operation losses. The risk exists that future (fiscal) profits will not be sufficient to fully recover the deferred tax assets.
The valuation of deferred tax assets is significant to our audit because the assessment process is complex and is based on estimates of future taxable income. In this area, our audit procedures included, among others, using our own tax specialists to assist us in assessing the appropriateness of the level of deferred tax asset balance recognized in the statement of financial position and reviewing management assumptions relating to projections of the deferred tax asset utilization.
requirements. We believe that the audit evidence we have obtained is sufficient and appropriate to provide a basis for our opinion.
Key Audit Matters Key audit matters are those matters that, in our professional judgement, were of most significance in our audit of the financial statements of the current period. These matters were addressed in the context of our audit of the financial statements as a whole, and in forming our opinion thereon, and we do not provide a separate opinion on these matters. Information Other than the Financial Statements and Auditor’s Report Thereon Management is responsible for the other information. The other information comprises the information included in the Chairman’s report, Directors’ report, Chief Executive Officer’s review, Sustainability report and Corporate Governance Statements, but does not include the financial statements and our auditor’s report thereon.
Our opinion on the financial statements does not cover the other information and we do not express any form of assurance conclusion thereon.
In connection with our audit of the financial statements, our responsibility is to read the other information and, in doing so, consider whether the other information is materially inconsistent with the financial statements or our knowledge obtained in the audit or otherwise appears to be materially misstated.
If, based on the work we have performed, we conclude that there is a material misstatement of this other information, we are required to report that fact. We have nothing to report in this regard.
Responsibilities of Management and Those Charged with Governance for the Financial StatementsManagement is responsible for the preparation and fair presentation of these financial statements in accordance with International Financial Reporting Standards and the requirements of the Companies Act and the Securities Act of Zambia and for such internal control as management determines is necessary to enable the preparation of financial statements that are free from material misstatement, whether due to fraud or error.
In preparing the financial statements, management is responsible for
assessing the Group’s and Company’s ability to continue as a going concern, disclosing, as applicable, matters related to going concern and using the going concern basis of accounting unless management either intends to liquidate the Group and/or the Company or to cease operations, or has no realistic alternative but to do so.
Those charged with governance are responsible for overseeing the Group’s and Company’s financial reporting process. Auditor’s Responsibilities for the Audit of the Financial Statements Our objectives are to obtain reasonable assurance about whether the financial statements as a whole are free from material misstatement, whether due to fraud or error, and to issue an auditor’s report that includes our opinion. Reasonable assurance is a high level of assurance, but is not a guarantee that an audit conducted in accordance with ISAs will always detect a material misstatement when it exists. Misstatements can arise from fraud or error and are considered material if, individually or in the aggregate, they could reasonably be expected to influence the economic decisions of users taken on the basis of these financial statements.
As part of an audit in accordance with ISAs, we exercise professional judgment and maintain professional skepticism throughout the audit. We also:
• Identify and assess the risks of material misstatement of the financial statements, whether due to fraud or error, design and perform audit procedures responsive to those risks, and obtain audit evidence that is sufficient and appropriate to provide a basis for our opinion. The risk of not detecting a material misstatement resulting from fraud is higher than for one resulting from error, as fraud may involve collusion, forgery, intentional omissions, misrepresentations, or the override of internal control.
• Obtain an understanding of internal control relevant to the audit in order to design audit procedures that are appropriate in the circumstances, but not for the purpose of expressing an opinion on the effectiveness of the Group’s and the Company’s internal control.
• Evaluate the appropriateness of accounting policies used and the reasonableness of accounting estimates and related disclosures made by management.
• Conclude on the appropriateness of management’s use of the going concern basis of accounting and, based on the audit evidence
44 Zambeef Products PLC Annual Report 2019
obtained, whether a material uncertainty exists related to events or conditions that may cast significant doubt on the Group’s and the Company’s ability to continue as a going concern. If we conclude that a material uncertainty exists, we are required to draw attention in our auditor’s report to the related disclosures in the financial statements or, if such disclosures are inadequate, to modify our opinion. Our conclusions are based on the audit evidence obtained up to the date of our auditor’s report. However, future events or conditions may cause the Group and/or the Company to cease to continue as a going concern.
• Evaluate the overall presentation, structure and content of the financial statements, including the disclosures, and whether the financial statements represent the underlying transactions and events in a manner that achieves fair presentation.
• Obtain sufficient appropriate audit evidence regarding the financial information of the entities or business activities within the Group to express an opinion on the financial statements. We are responsible for the direction, supervision and performance of the Group audit. We remain solely responsible for our audit opinion.
We communicate with those charged with governance regarding, among other matters, the planned scope and timing of the audit and significant audit findings, including any significant deficiencies in internal control that we identify during our audit.
We also provide those charged with governance with a statement that we have complied with relevant ethical requirements regarding independence, and to communicate with them all relationships and other matters that may reasonably be thought to bear on our independence, and where applicable, related safeguards.
From the matters communicated with those charged with governance, we determine those matters that were of most significance in the audit of the consolidated financial statements of the current period and are therefore the key audit matters. We describe these matters in our auditor’s report unless law or regulation precludes public disclosure about the matter or when, in extremely rare circumstances, we determine that a matter should not be communicated in our report because the adverse consequences of doing so would reasonably be expected to outweigh the public interest benefits of such communication.
Report on Other Legal and Regulatory RequirementsIn our opinion, the financial statements of Zambeef Products PLC and its subsidiaries as at 30 September 2019 have been properly prepared in accordance with the Zambian Companies Act 2017, and the accounting and other records and registers have been properly kept in accordance with the Act.
Grant ThorntonChartered Accountants
Christopher Mulenga (AUD/F000178)Name of Partner signing on behalf of the firm
LusakaDate: 6 December 2019

Overview Strategicreport
Corporategovernance
Financialstatements
Zambeef Products PLC Annual Report 2019 45

46 Zambeef Products PLC Annual Report 2019
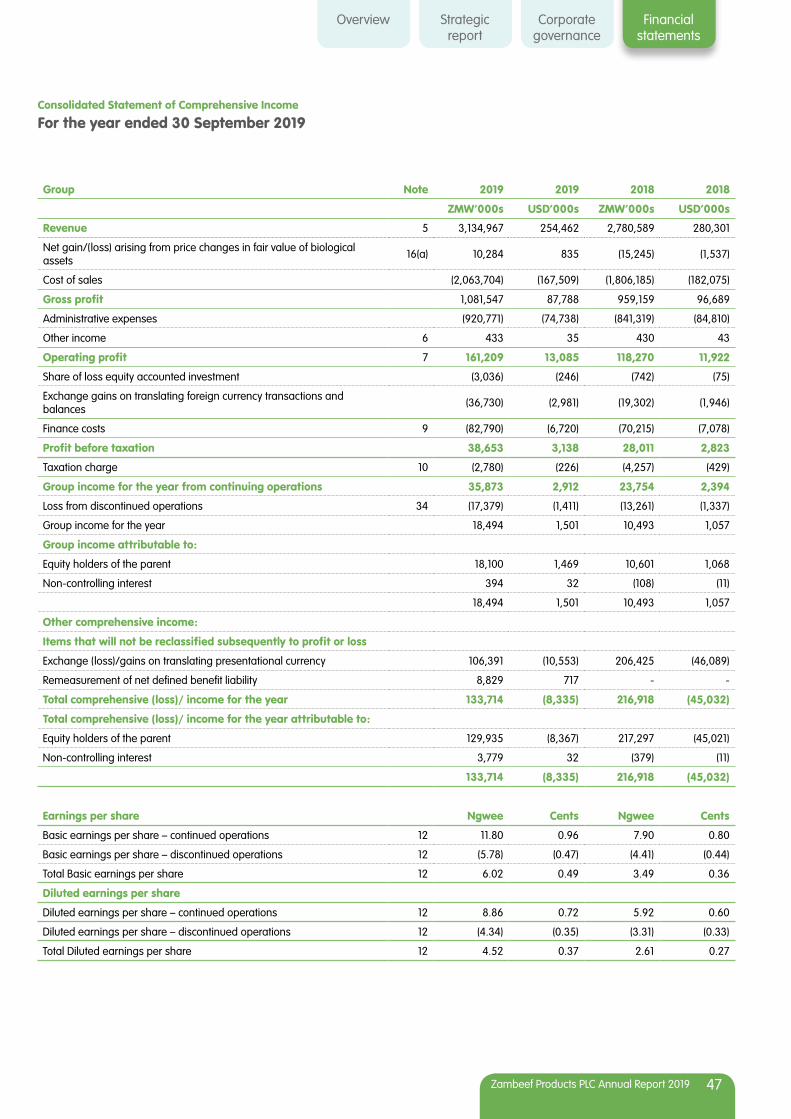
Overview Strategicreport
Corporategovernance
Financialstatements
Zambeef Products PLC Annual Report 2019 47
Consolidated Statement of Comprehensive Income
For the year ended 30 September 2019
Group Note 2019 2019 2018 2018
ZMW’000s USD’000s ZMW’000s USD’000s
Revenue 5 3,134,967 254,462 2,780,589 280,301
Net gain/(loss) arising from price changes in fair value of biological assets 16(a) 10,284 835 (15,245) (1,537)
Cost of sales (2,063,704) (167,509) (1,806,185) (182,075)
Gross profit 1,081,547 87,788 959,159 96,689
Administrative expenses (920,771) (74,738) (841,319) (84,810)
Other income 6 433 35 430 43
Operating profit 7 161,209 13,085 118,270 11,922
Share of loss equity accounted investment (3,036) (246) (742) (75)
Exchange gains on translating foreign currency transactions and balances (36,730) (2,981) (19,302) (1,946)
Finance costs 9 (82,790) (6,720) (70,215) (7,078)
Profit before taxation 38,653 3,138 28,011 2,823
Taxation charge 10 (2,780) (226) (4,257) (429)
Group income for the year from continuing operations 35,873 2,912 23,754 2,394
Loss from discontinued operations 34 (17,379) (1,411) (13,261) (1,337)
Group income for the year 18,494 1,501 10,493 1,057
Group income attributable to:
Equity holders of the parent 18,100 1,469 10,601 1,068
Non-controlling interest 394 32 (108) (11)
18,494 1,501 10,493 1,057
Other comprehensive income:
Items that will not be reclassified subsequently to profit or loss
Exchange (loss)/gains on translating presentational currency 106,391 (10,553) 206,425 (46,089)
Remeasurement of net defined benefit liability 8,829 717 - -
Total comprehensive (loss)/ income for the year 133,714 (8,335) 216,918 (45,032)
Total comprehensive (loss)/ income for the year attributable to:
Equity holders of the parent 129,935 (8,367) 217,297 (45,021)
Non-controlling interest 3,779 32 (379) (11)
133,714 (8,335) 216,918 (45,032)
Earnings per share Ngwee Cents Ngwee Cents
Basic earnings per share – continued operations 12 11.80 0.96 7.90 0.80
Basic earnings per share – discontinued operations 12 (5.78) (0.47) (4.41) (0.44)
Total Basic earnings per share 12 6.02 0.49 3.49 0.36
Diluted earnings per share
Diluted earnings per share – continued operations 12 8.86 0.72 5.92 0.60
Diluted earnings per share – discontinued operations 12 (4.34) (0.35) (3.31) (0.33)
Total Diluted earnings per share 12 4.52 0.37 2.61 0.27

48 Zambeef Products PLC Annual Report 2019
Consolidated Statement of Changes in Equity
For the year ended 30 September 2019
(i) In Zambian Kwacha
Issued share
capitalZMW’000s
Sharepremium
ZMW’000s
Preference share
capital ZMW’000s
Foreign exchange
reserve ZMW’000s
Revaluation reserve
ZMW’000s
Retained earnings
ZMW’000s
Total attributable to owners of
the parentZMW’000s
Non- controlling
interestZMW’000s
Total equity
ZMW’000s
At 1 October 2017 3,006 1,125,012 1,000 72,227 1,252,142 445,090 2,898,477 (8,281) 2,890,196
Profit for the year - - - - - 10,601 10,601 (108) 10,493
Transfer of surplus depreciation
- - - - (23,418) 23,418 - - -
Other comprehensive income:
Exchange gain/ (loss) on translating presentational currency
- - - 206,696 - - 206,696 (271) 206,425
Total comprehensive income
- - - 206,696 (23,418) 34,019 217,297 (379) 216,918
At 30 September 2018 3,006 1,125,012 1,000 278,923 1,228,724 479,109 3,115,774 (8,660) 3,107,114
Profit for the year - - - - - 18,100 18,100 394 18,494
Transfer of surplus depreciation
- - - - (29,666) 29,666 - - -
Other comprehensive income:
Exchange gain/ (loss) on translating presentational currency
- - - 103,006 - - 103,006 3,385 106,391
Remeasurement of net defined benefit liability
- - - - - 8,829 8,829 - 8,829
Total comprehensive income
- - - 103,006 (29,666) 56,595 129,935 3,779 133,714
At 30 September 2019 3,006 1,125,012 1,000 381,929 1,199,058 535,704 3,245,709 (4,881) 3,240,828
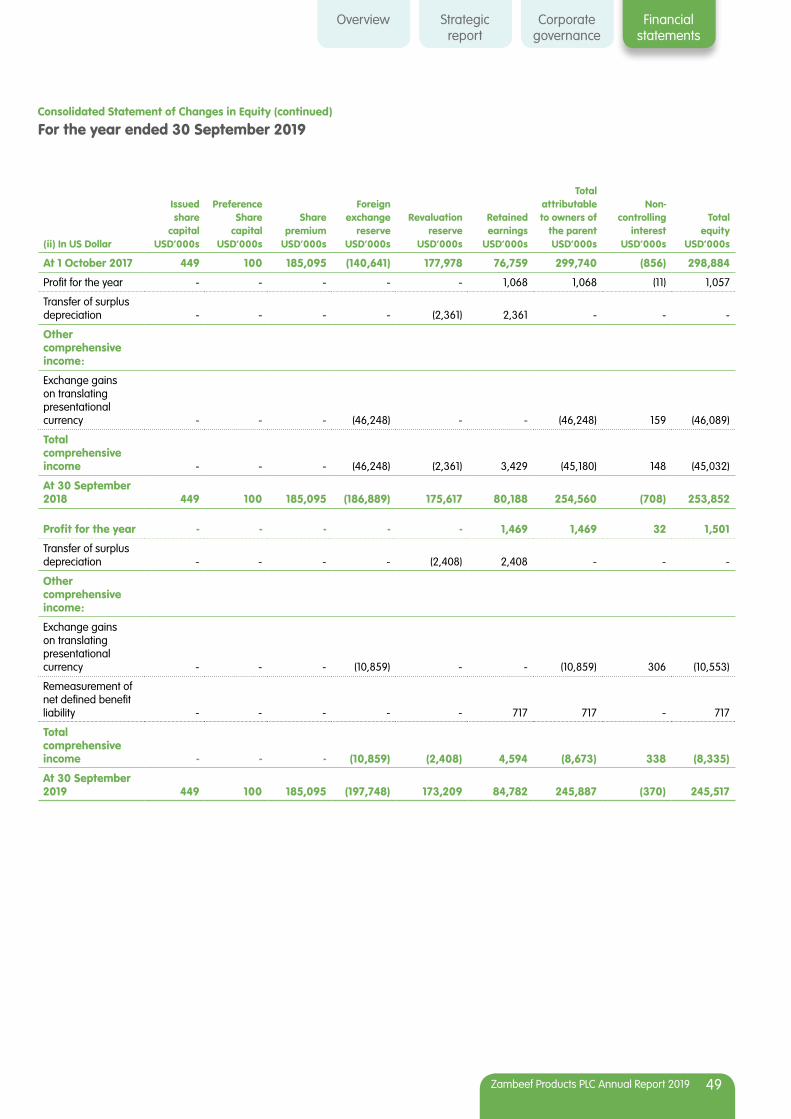
Overview Strategicreport
Corporategovernance
Financialstatements
Zambeef Products PLC Annual Report 2019 49
(ii) In US Dollar
Issued share
capitalUSD’000s
Preference Share
capitalUSD’000s
Share premium
USD’000s
Foreign exchange
reserve USD’000s
Revaluation reserve
USD’000s
Retained earnings
USD’000s
Total attributable to owners of
the parent USD’000s
Non- controlling
interestUSD’000s
Total equity
USD’000s
At 1 October 2017 449 100 185,095 (140,641) 177,978 76,759 299,740 (856) 298,884
Profit for the year - - - - - 1,068 1,068 (11) 1,057
Transfer of surplus depreciation - - - - (2,361) 2,361 - - -
Other comprehensive income:
Exchange gains on translating presentational currency - - - (46,248) - - (46,248) 159 (46,089)
Total comprehensive income - - - (46,248) (2,361) 3,429 (45,180) 148 (45,032)
At 30 September 2018 449 100 185,095 (186,889) 175,617 80,188 254,560 (708) 253,852
Profit for the year - - - - - 1,469 1,469 32 1,501
Transfer of surplus depreciation - - - - (2,408) 2,408 - - -
Other comprehensive income:
Exchange gains on translating presentational currency - - - (10,859) - - (10,859) 306 (10,553)
Remeasurement of net defined benefit liability - - - - - 717 717 - 717
Total comprehensive income - - - (10,859) (2,408) 4,594 (8,673) 338 (8,335)
At 30 September 2019 449 100 185,095 (197,748) 173,209 84,782 245,887 (370) 245,517
Consolidated Statement of Changes in Equity (continued)
For the year ended 30 September 2019

50 Zambeef Products PLC Annual Report 2019
Company Statement of Changes in Equity
For the year ended 30 September 2019
(i) In Zambian Kwacha
Issued share capital
ZMW’000s
Preference share
capital ZMW’000s
Share premium
ZMW’000s
Revaluation reserve
ZMW’000s
Retained earnings
ZMW’000sTotal equityZMW’000s
At 1 October 2017 3,006 1,000 1,125,012 917,897 511,607 2,558,522
Profit for the year - - - 14,413 14,413
Transfer of surplus depreciation - - - (27,562) 27,562 -
Other comprehensive income:
Exchange gains on translating presentational currency - - - - 217,367 217,367
Total comprehensive income - - - (27,562) 259,342 231,780
At 30 September 2018 3,006 1,000 1,125,012 890,335 770,949 2,790,302
Profit for the year - - - - 4,225 4,225
Transfer of surplus depreciation - - - (28,183) 28,183 -
Other comprehensive income: - - - - - -
Exchange gain on translating presentational currency - - - - 92,385 92,385
Total comprehensive income - - - (28,183) 124,793 96,610
At 30 September 2019 3,006 1,000 1,125,012 862,152 895,742 2,886,912

Overview Strategicreport
Corporategovernance
Financialstatements
Zambeef Products PLC Annual Report 2019 51
(ii) In US Dollars
Issued share capital
USD’000s
Preference share
capital USD’000s
Share premium
USD’000s
Revaluation reserve
USD’000s
Foreign exchange
reserve USD’000s
Retained earnings
USD’000sTotal equity
USD’000s
At 1 October 2017 449 100 185,095 122,600 (120,385) 76,725 264,584
Profit for the year - - - - - 1,453 1,453
Transfer of surplus depreciation - - - (3,904) - 3,904
Other comprehensive income: - - - - - - -
Exchange gain on translating presentational currency - - - - (38,071) - (38,071)
Total comprehensive income - - - (3,904) (38,071) 5,357 (36,618)
At 30 September 2018 449 100 185,095 118,696 (158,456) 82,082 227,966
Profit for the year - - - - - 342 342
Transfer of surplus depreciation - - - (2,288) - 2,288 -
Other comprehensive income: - - - - - - -
Exchange gain on translating presentational currency - - - - (9,603) - (9,603)
Total comprehensive income - - - (2,288) (9,603) 2,630 (9,261)
At 30 September 2019 449 100 185,095 116,408 (168,059) 84,712 218,705
Company Statement of Changes in Equity
For the year ended 30 September 2019

52 Zambeef Products PLC Annual Report 2019
Consolidated Statement of Financial Position
For the year ended 30 September 2019
2019 2019 2018 2018
ASSETS Note ZMW’000s USD’000s ZMW’000s USD’000s
Non-current assets
Goodwill 13 166,801 12,636 166,801 13,628
Property, plant and equipment 14 2,841,824 215,290 2,902,221 237,110
Investment in associate 15(e) 12,376 938 15,412 1,259
Deferred tax asset 10(e) 56,525 4,282 47,854 3,910
3,077,526 233,146 3,132,288 255,907
Current assets
Biological assets 16 170,417 12,910 181,674 14,843
Inventories 17 941,159 71,300 639,811 52,272
Trade and other receivables 18 98,025 7,426 156,314 12,771
Assets held for disposal 34 135,357 10,254 - -
Amounts due from related companies 19 41,554 3,148 50,272 4,107
Income tax recoverable 10(c) 2,767 210 3,885 317
1,389,279 105,248 1,031,956 84,310
Total assets 4,466,805 338,394 4,164,244 340,217
EQUITY AND LIABILITIES
Capital and reserves
Share capital 21 3,006 449 3,006 449
Preference share capital 21 1,000 100 1,000 100
Share premium 22 1,125,012 185,095 1,125,012 185,095
Other reserves 2,116,691 60,243 1,986,756 68,916
3,245,709 245,887 3,115,774 254,560
Non-controlling interest (4,881) (370) (8,660) (708)
3,240,828 245,517 3,107,114 253,852

Overview Strategicreport
Corporategovernance
Financialstatements
Zambeef Products PLC Annual Report 2019 53
Dr. Jacob Mwanza Chairman
Francis Grogan Chief Executive Officer
Consolidated Statement of Financial Position (continued)
For the year ended 30 September 2019
2019 2019 2018 2018
Note ZMW’000s USD’000s ZMW’000s USD’000s
Non-current liabilities
Interest bearing liabilities 23 228,099 17,280 308,312 25,189
Obligations under finance leases 24 19,297 1,462 20,163 1,647
Deferred liability 25 16,362 1,240 22,611 1,847
Deferred tax liability 10(e) 9,138 692 6,909 565
272,896 20,674 357,995 29,248
Current liabilities
Interest bearing liabilities 23 130,661 9,899 95,247 7,782
Collateral management agreement 23 212,381 16,089 107,213 8,759
Obligations under finance leases 24 21,487 1,628 18,248 1,491
Trade and other payables 26 259,585 19,665 297,390 24,294
Provisions 27 52,914 4,009 42,137 3,443
Amounts due to related companies 28 251 19 232 19
Taxation payable 10(c) 1,377 104 2,925 239
Bank overdrafts 20 274,425 20,790 135,743 11,090
953,081 72,203 699,135 57,117
Total equity and liabilities 4,466,805 338,394 4,164,244 340,217
The financial statements on pages 47 to 114 were approved by the Board of Directors on 6 December 2019 and were signed on its behalf by:

54 Zambeef Products PLC Annual Report 2019
Company Statement of Financial Position
For the year ended 30 September 2019
ASSETS Note2019
ZMW’000s2019
USD’000s2018
ZMW’000s2018
USD’000s
Non-current assets
Property, plant and equipment 14 2,060,110 156,069 2,154,822 176,048
Investments in subsidiaries 15(b) 245,807 18,622 245,807 20,082
Investment in associates 15(e) 12,376 938 15,412 1,259
Deferred tax asset 10(e) - - 24,792 2,025
2,318,293 175,629 2,440,833 199,414
Current assets
Biological assets 16 137,215 10,395 158,349 12,937
Inventories 17 683,600 51,788 481,319 39,324
Assets held for disposal 34 135,357 10,254 - -
Trade and other receivables 18 28,153 2,133 91,381 7,466
Amounts due from related companies 19 1,078,745 81,722 796,506 65,073
Income tax recoverable 10(c) 1,529 115 2,510 205
2,064,599 156,407 1,530,065 125,005
Total assets 4,382,892 332,036 3,970,898 324,419
EQUITY AND LIABILITIES
Capital and reserves
Share capital 21 3,006 449 3,006 449
Preference share capital 21 1,000 100 1,000 100
Share premium 22 1,125,012 185,095 1,125,012 185,095
Other reserves 1,757,894 33,061 1,661,284 42,322
2,886,912 218,705 2,790,302 227,966
Non-current liabilities
Interest bearing liabilities 23 228,099 17,280 308,312 25,189
Obligations under finance leases 24 11,505 872 12,503 1,022
Deferred liability 25 3,655 277 5,059 413
Deferred tax liability 10(e) 6,630 502 4,034 330
249,889 18,931 329,908 26,954
Current liabilities
Interest bearing liabilities 23 343,042 25,988 202,460 16,541
Obligations under finance leases 24 18,266 1,384 11,841 967
Trade and other payables 26 158,504 12,008 204,675 16,722
Provisions 27 40,462 3,065 26,108 2,132
Amounts due to related companies 28 490,045 37,124 328,633 26,849
Bank overdrafts 20 195,772 14,831 76,971 6,288
1,246,091 94,400 850,688 69,499
Total equity and liabilities 4,382,892 332,036 3,970,898 324,419 The financial statements on pages 47 to 114 were approved by the Board of Directors on 6 December 2019 and were signed on its behalf by:
Dr. Jacob Mwanza Francis GroganChairman Chief Executive Officer

Overview Strategicreport
Corporategovernance
Financialstatements
Zambeef Products PLC Annual Report 2019 55
Consolidated Statement of Cash Flows
For the year ended 30 September 2019
Note2019
ZMW’000s2019
USD’000s2018
ZMW’000s2018
USD’000s
Cash inflow from operating activities
Profit before taxation 38,653 3,138 28,011 2,823
Finance costs 9 82,790 6,720 70,215 7,078
(Profit)/ loss on disposal of property, plant and equipment (986) (80) (220) (22)
Depreciation 14 121,921 9,896 105,789 10,665
Share of loss on equity accounted investment 3,036 246 742 75
Loss on discontinued operations (17,379) (1,411) - -
Loss on disposal of investment - - 52,265 5,269
Fair value price adjustment 16 (10,284) (835) 15,245 1,537
Net unrealised foreign exchange losses 7,153 581 22,343 2,252
Earnings before interest, tax, depreciation and amortisation, fair value adjustments and net unrealised foreign exchange losses 224,904 18,255 294,390 29,677
(Increase)/decrease in biological assets 21,541 1,748 (29,062) (2,930)
Decrease/ (increase) in inventory (301,348) (24,460) (123,393) (12,439)
Decrease / (increase) in trade and other receivables 58,289 4,731 (65,522) (6,605)
Decrease /(increase) in amounts due from related companies 8,718 708 (38,850) (3,916)
(Decrease)/ (increase) in trade and other payables (27,028) (2,194) 47,684 4,807
Increase/ (decrease) in amounts due to related companies 19 2 151 15
Increase/ (decrease) in deferred liability (6,249) (507) 5,855 590
Income tax paid 10(c) (9,652) (783) (11,618) (1,171)
Net cash inflow from operating activities (30,806) (2,500) 79,635 8,028
Investing activities
Purchase of property, plant and equipment 14 (113,825) (9,239) (144,022) (14,518)
Proceeds from the sale of assets 11,776 956
Proceeds from the sale of Zampalm - - 151,680 16,000
Net cash (outflow)/ inflow (on)/ from investing activities (102,049) (8,283) 7,658 1,482
Net cash (outflow)/inflow before financing activities (132,855) (10,783) 87,293 9,510
Financing activities
Long term loans repaid (96,913) (7,866) (79,873) (8,052)
Receipt/(repayment) of short term funding 119,456 9,696 25,088 2,529
Lease finance (repayment)/ obtained 707 57 (12,044) (1,214)
Finance costs 9 (82,790) (6,720) (70,215) (7,078)
Net cash outflow on financing activities (59,540) (4,833) (137,044) (13,815)
(Decrease)/ increase in cash and cash equivalents (192,395) (15,616) (49,751) (4,305)
Cash and cash equivalents at beginning of the year (135,743) (11,090) (105,148) (10,874)
Effects of exchange rate changes on the balance of cash held in foreign currencies 53,713 5,916 19,156 4,089
Cash and cash equivalents at end of the year 20 (274,425) (20,790) (135,743) (11,090)
Represented by:
Cash in hand and at bank 20 56,753 4,299 101,123 8,262
Bank overdrafts 20 (331,178) (25,089) (236,866) (19,352)
(274,425) (20,790) (135,743) (11,090)
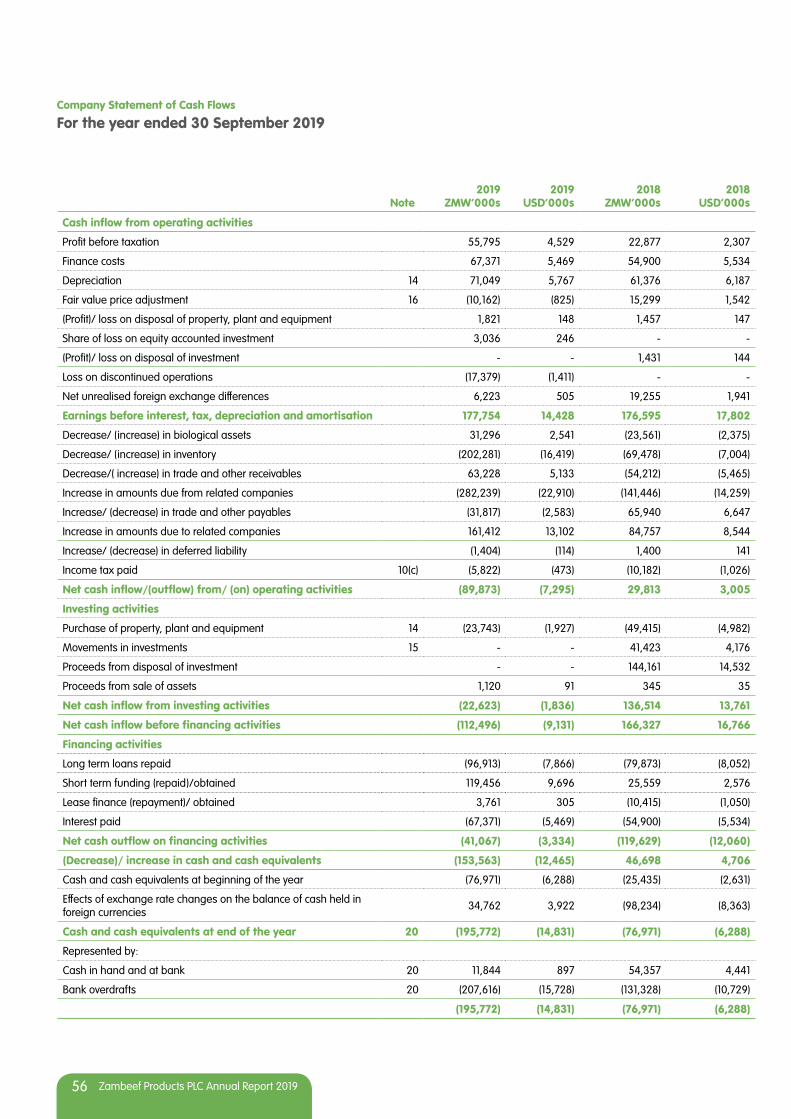
56 Zambeef Products PLC Annual Report 2019
Company Statement of Cash Flows
For the year ended 30 September 2019
Note2019
ZMW’000s2019
USD’000s2018
ZMW’000s2018
USD’000s
Cash inflow from operating activities
Profit before taxation 55,795 4,529 22,877 2,307
Finance costs 67,371 5,469 54,900 5,534
Depreciation 14 71,049 5,767 61,376 6,187
Fair value price adjustment 16 (10,162) (825) 15,299 1,542
(Profit)/ loss on disposal of property, plant and equipment 1,821 148 1,457 147
Share of loss on equity accounted investment 3,036 246 - -
(Profit)/ loss on disposal of investment - - 1,431 144
Loss on discontinued operations (17,379) (1,411) - -
Net unrealised foreign exchange differences 6,223 505 19,255 1,941
Earnings before interest, tax, depreciation and amortisation 177,754 14,428 176,595 17,802
Decrease/ (increase) in biological assets 31,296 2,541 (23,561) (2,375)
Decrease/ (increase) in inventory (202,281) (16,419) (69,478) (7,004)
Decrease/( increase) in trade and other receivables 63,228 5,133 (54,212) (5,465)
Increase in amounts due from related companies (282,239) (22,910) (141,446) (14,259)
Increase/ (decrease) in trade and other payables (31,817) (2,583) 65,940 6,647
Increase in amounts due to related companies 161,412 13,102 84,757 8,544
Increase/ (decrease) in deferred liability (1,404) (114) 1,400 141
Income tax paid 10(c) (5,822) (473) (10,182) (1,026)
Net cash inflow/(outflow) from/ (on) operating activities (89,873) (7,295) 29,813 3,005
Investing activities
Purchase of property, plant and equipment 14 (23,743) (1,927) (49,415) (4,982)
Movements in investments 15 - - 41,423 4,176
Proceeds from disposal of investment - - 144,161 14,532
Proceeds from sale of assets 1,120 91 345 35
Net cash inflow from investing activities (22,623) (1,836) 136,514 13,761
Net cash inflow before financing activities (112,496) (9,131) 166,327 16,766
Financing activities
Long term loans repaid (96,913) (7,866) (79,873) (8,052)
Short term funding (repaid)/obtained 119,456 9,696 25,559 2,576
Lease finance (repayment)/ obtained 3,761 305 (10,415) (1,050)
Interest paid (67,371) (5,469) (54,900) (5,534)
Net cash outflow on financing activities (41,067) (3,334) (119,629) (12,060)
(Decrease)/ increase in cash and cash equivalents (153,563) (12,465) 46,698 4,706
Cash and cash equivalents at beginning of the year (76,971) (6,288) (25,435) (2,631)
Effects of exchange rate changes on the balance of cash held in foreign currencies 34,762 3,922 (98,234) (8,363)
Cash and cash equivalents at end of the year 20 (195,772) (14,831) (76,971) (6,288)
Represented by:
Cash in hand and at bank 20 11,844 897 54,357 4,441
Bank overdrafts 20 (207,616) (15,728) (131,328) (10,729)
(195,772) (14,831) (76,971) (6,288)
Overview Strategicreport
Corporategovernance
Financialstatements
Zambeef Products PLC Annual Report 2019 57
Notes to the Financial Statements
For the year ended 30 September 2019
1. The GroupZambeef Products PLC and its subsidiaries (“Group”) is one of the largest agri-businesses in Zambia. The Group is principally involved in the production, processing, distribution and retailing of beef, chicken, pork, milk, dairy products, eggs, edible oils, stock feed and flour. The Group also has large row cropping operations (principally maize, soya beans and wheat), with approximately 7,973 Ha of row crops under irrigation and 8,776 Ha of rain-fed/ dry-land crops available for planting each year. The Group also has operations in West Africa in Nigeria and Ghana.
2. Principal accounting policiesThe principal accounting policies applied by the Group in the preparation of these financial statements are set out below. These policies have been consistently applied to all the periods presented, unless otherwise stated.
(a) Basis of consolidationThe consolidated financial statements include the financial statements of the parent Company and its subsidiary companies made up to the end of the financial year. The results of subsidiaries acquired or disposed of during the year are included in the consolidated statement of comprehensive income from the date of their acquisition or up to the date of their disposal. Intercompany transactions and profits are eliminated on consolidation and all income and profit figures relate to external transactions only.
Non-controlling interests, presented as part of equity, represent the portion of a subsidiary’s profit or loss and net assets that is not held by the Group. The Group attributes total comprehensive income or loss of subsidiaries between the owners of the parent and the non-controlling interests based on their respective ownership interests. Profit or loss and other comprehensive income of subsidiaries acquired or disposed of during the year are recognised from the effective date of acquisition or up to the effective date of disposal, as applicable.
(b) Going ConcernAt the reporting date loans and other finance amounts repayable within twelve months amount to ZMW364.5 million (USD27.6 million) [2018: ZMW220.7 million (USD18 million)]. After reviewing the available information including the Group’s strategic plans and continuing support from the Group’s working capital funders, the Directors have a reasonable expectation that the Group has adequate resources to continue in operational existence for the foreseeable future. For this reason, they continue to adopt the going concern basis in preparing the financial statements. All current liabilities will be settled from the continued liquidation of stock and expected increase in income from the capital expenditure carried out during the financial year.
(c) Basis of presentationThe financial statements are prepared in accordance with the provisions of the Zambian Companies Act 2017 and International Financial Reporting Standards (IFRS). The financial statements are presented in accordance with IAS 1 “Preparation of financial statements” (Revised 2007). The Group has elected to present the “Statement of Comprehensive Income” in one statement namely the “Statement of Comprehensive Income”.
The financial statements have been prepared under the historic cost convention, as modified by the revaluation of property, plant and equipment, and financial assets and liabilities at fair value through profit or loss. Biological assets are measured at fair value less costs to sell.
The preparation of financial statements in conformity with IFRS requires the use of certain critical accounting estimates. It also requires management to exercise its judgement in the process of applying the Group’s accounting policies. The areas involving a higher degree of judgement or complexity, or areas where assumptions and estimates are significant to the financial statements, are disclosed in note 3.
(d) Foreign currencies(i) Presentation and functional currencyThe Company has twelve operating branches, of which eleven have a functional currency of Zambian Kwacha (ZMW) and one (the Mpongwe Farms Branch) has a functional currency of United States Dollars (USD) being an operational branch set up during the year ended 30 September 2012. Management have chosen a variant on the functional currency of Mpongwe due to the following factors:- the majority of farm input costs (fertilizer, farming chemicals, agricultural machinery spares, etc.), which are primarily sourced from overseas, are
driven by USD to ZMW exchange rate due to origin prices being USD;- the pricing of Mpongwe’s principal outputs (wheat, soya and maize) are significantly influenced by world USD denominated grain prices;- the capital raised attached to the acquisition of the Mpongwe assets was denominated in foreign currency;- the Mpongwe assets were purchased in USD;- upon admission and dual listing on the AIM market of the London Stock Exchange (LSE), Zambeef was required to report in USD in addition to
reporting in ZMW for the LuSE listing; and- the majority of financial liabilities associated with working capital funding and capital expenditure are sourced in USD and repayable in USD, with
a substantial portion of the Company’s term liabilities secured on the assets of Mpongwe.
In light of this, Mpongwe’s assets and liabilities are translated to ZMW and consolidated with other branches of the Company for reporting and tax purposes in Zambia.
As a result of using a functional currency of USD for Mpongwe, there arose an exchange difference of ZMW92.4 million (2018: ZMW212 million) upon translating all assets and liabilities, which has been recognised as an unrealised gain in the statement of comprehensive income of the company and an exchange adjustment under property, plant and equipment.

58 Zambeef Products PLC Annual Report 2019
Notes to the Financial Statements (continued)
For the year ended 30 September 2019
2. Principal accounting policies (continued)
The Group’s reporting currency in Zambia is ZMW and the presentation of financial statements to Non-Zambian shareholders and for the purposes of being listed on the AIM market of the London Stock Exchange also necessitate the presentation of the financial statements in United States Dollars (USD).
(ii) Basis of translating presentation currency to USD for the purposes of supplementary informationIncome statement items have been translated using the average exchange rate for the year as an approximation to the actual exchange rate. Assets and liabilities have been translated using the closing exchange rate. Any differences arising from this process have been recognised in other comprehensive income and accumulated in the foreign exchange reserve in equity.
Equity items have been translated at the closing exchange rate. Exchange differences arising on retranslating equity items and opening net assets have been transferred to the foreign exchange reserve within equity.
The following exchange rates have been applied:
ZMW: USD Average exchange rate Closing exchange rate
Year ended 30 September 2018 9.92 12.24
Year ended 30 September 2019 12.32 13.20
All historical financial information, except where specifically stated, is presented in Zambian Kwacha rounded to the nearest ZMW’000s and United States Dollars rounded to the nearest USD’000s.
(iii) Basis of translating transactions and balancesForeign currency transactions are translated into the functional currency using the rates of exchange prevailing at the date of transactions. Foreign exchange gains and losses resulting from the settlement of such transactions and from the translation at year end exchange rates of monetary assets and liabilities denominated in foreign currencies are recognized in the Statement of Comprehensive Income.
Non-operating foreign exchange gains and losses mainly arise on fluctuations of the exchange rate between United States Dollars and Zambian Kwacha. Due to the instability of the exchange rate, which may result in significant unrealised variances of foreign exchange related assets and liabilities, these gains and losses have been presented below operating profit in the Statement of Comprehensive Income.
(iv) Basis of translating foreign operationsIn the consolidated financial statements, the financial statements of the foreign subsidiaries originally presented in their local currency have been translated into Zambian Kwacha. Assets and liabilities have been translated into Zambian Kwacha at the exchange rates ruling at the year end. Statement of comprehensive income items have been translated at an average monthly rate for the year. Any differences arising from this procedure are taken to the foreign exchange reserve.
ZMW: Nigeria Naira Average exchange rate Closing exchange rate
Year ended 30 September 2018 36.09 29.44
Year ended 30 September 2019 29.21 27.25
ZMW: Ghana Cedi Average exchange rate Closing exchange rate
Year ended 30 September 2018 0.46 0.39
Year ended 30 September 2019 0.42 0.41

Overview Strategicreport
Corporategovernance
Financialstatements
Zambeef Products PLC Annual Report 2019 59
(e) New Standards adopted as at 1 October 2018
IFRS 15 ‘Revenue from Contracts with Customers’IFRS 15 ‘Revenue from Contracts with Customers’ and the related ‘Clarifications to IFRS 15 Revenue from Contracts with Customers’ (hereinafter referred to as ‘IFRS 15’) replace IAS 18 ‘Revenue’, IAS 11 ‘Construction Contracts’, and several revenue-related Interpretations. The new Standard has been applied retrospectively without restatement. There were no incomplete contracts as at 1 October 2018 that would have required an adjustment to the opening balance of retained earnings as at that date.
In accordance with the transition guidance, IFRS 15 has only been applied to contracts that are incomplete as at 1 October 2018.
Contracts with multiple performance obligationsThe Group has a variety of grain contracts with several customers. Under IFRS 15, the Group must evaluate the separability of the promised goods or services based on whether they are ‘distinct’. A promised good or service is ‘distinct’ if both:
• the customer benefits from the item either on its own or together with other readily available resources, and• it is ‘separately identifiable’ (i.e. the Group does not provide a significant service integrating, modifying or customising it).
IFRS 9 replaces IAS 39 ‘Financial Instruments: Recognition and Measurement’. It makes major changes to the previous guidance on the classification and measurement of financial assets and introduces an ‘expected credit loss’ model for the impairment of financial assets.
When adopting IFRS 9, the Group has applied transitional relief and opted not to restate prior periods. Differences arising from the adoption of IFRS 9 in relation to classification, measurement, and impairment are recognised in retained earnings.
The adoption of IFRS 9 has impacted the following areas:
• The equity investment in Zampalm Limited classified under IAS 39 is measured at fair value through profit or loss as the cash flows are not solely payments of principal and interest (SPPI). The Group did not elect to irrevocably designate any of the equity investments at fair value with changes presented in other comprehensive income.
• The impairment of financial assets applying the expected credit loss model. This affects the Group’s trade receivables and investments in debt- type assets measured at amortised cost. For contract assets arising from IFRS 15 and trade receivables, the Group applies a simplified model of recognising lifetime expected credit losses as these items do not have a significant financing component.
2. Principal accounting policies (continued)
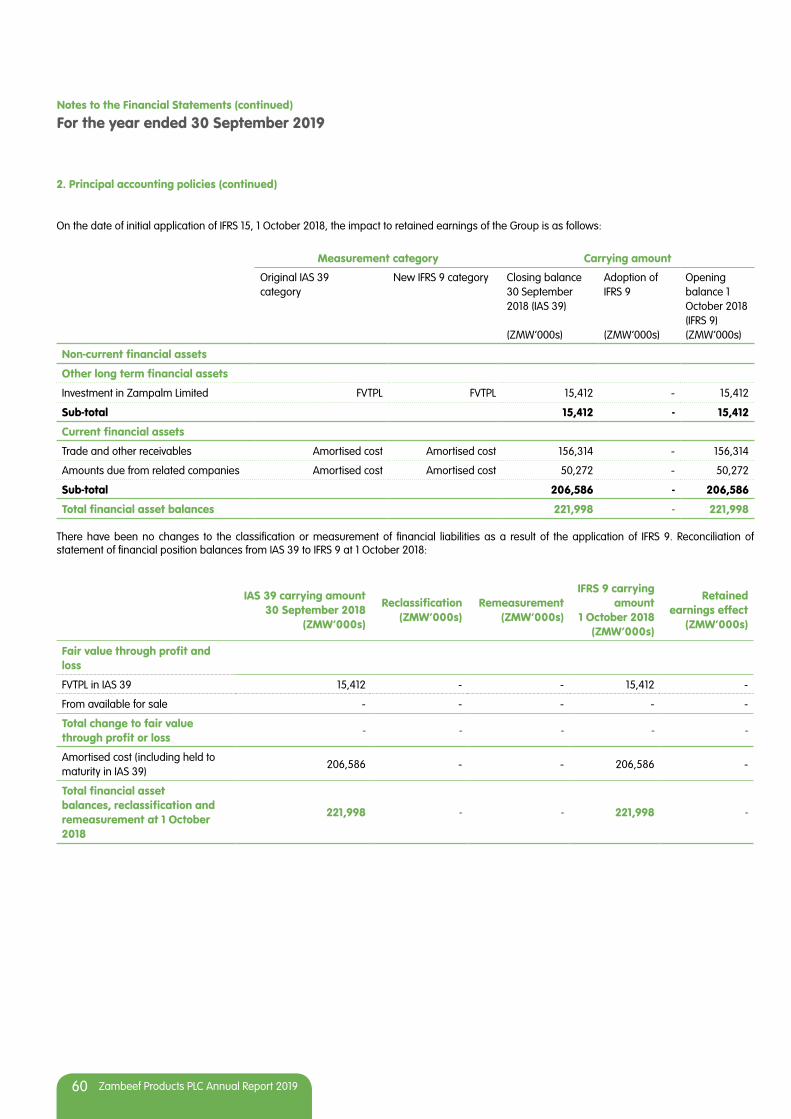
60 Zambeef Products PLC Annual Report 2019
Notes to the Financial Statements (continued)
For the year ended 30 September 2019
On the date of initial application of IFRS 15, 1 October 2018, the impact to retained earnings of the Group is as follows:
Measurement category Carrying amount
Original IAS 39 category
New IFRS 9 category Closing balance 30 September 2018 (IAS 39)
(ZMW’000s)
Adoption of IFRS 9
(ZMW’000s)
Opening balance 1 October 2018 (IFRS 9)(ZMW’000s)
Non-current financial assets
Other long term financial assets
Investment in Zampalm Limited FVTPL FVTPL 15,412 - 15,412
Sub-total 15,412 - 15,412
Current financial assets
Trade and other receivables Amortised cost Amortised cost 156,314 - 156,314
Amounts due from related companies Amortised cost Amortised cost 50,272 - 50,272
Sub-total 206,586 - 206,586
Total financial asset balances 221,998 - 221,998
There have been no changes to the classification or measurement of financial liabilities as a result of the application of IFRS 9. Reconciliation of statement of financial position balances from IAS 39 to IFRS 9 at 1 October 2018:
IAS 39 carrying amount 30 September 2018
(ZMW’000s)
Reclassification(ZMW’000s)
Remeasurement(ZMW’000s)
IFRS 9 carrying amount
1 October 2018(ZMW’000s)
Retained earnings effect
(ZMW’000s)
Fair value through profit and loss
FVTPL in IAS 39 15,412 - - 15,412 -
From available for sale - - - - -
Total change to fair value through profit or loss
- - - - -
Amortised cost (including held to maturity in IAS 39)
206,586 - - 206,586 -
Total financial asset balances, reclassification and remeasurement at 1 October 2018
221,998 - - 221,998 -
2. Principal accounting policies (continued)

Overview Strategicreport
Corporategovernance
Financialstatements
Zambeef Products PLC Annual Report 2019 61
(f) Standards, amendments and Interpretations to existing Standards that are not yet effective and have not been adopted early by the Group:
At the date of authorisation of these financial statements, several new, but not yet effective, Standards, amendments to existing Standards, and Interpretations have been published by the IASB. None of these Standards, amendments or Interpretations have been adopted early by the Group.
Management anticipates that all relevant pronouncements will be adopted for the first period beginning on or after the effective date of the pronouncement. New Standards, amendments and Interpretations neither adopted nor listed below have not been disclosed as they are not expected to have a material impact on the Group’s financial statements.
IFRS 16 ‘Leases’IFRS 16 will replace IAS 17 ‘Leases’ and three related Interpretations. It completes the IASB’s long running project to overhaul lease accounting. Leases will be recorded in the statement of financial position in the form of a right-of-use asset and a lease liability. There are two important reliefs provided by IFRS 16 for assets of low value and short-term leases of less than 12 months.IFRS 16 is effective from periods beginning on or after 1 January 2019. Early adoption is permitted; however, the Group have decided not to early adopt.
Management is in the process of assessing the full impact of the Standard. So far, the Group:• has decided to make use of the practical expedient not to perform a full review of existing leases and apply IFRS 16 only to new or modified
contracts. As some leases will be modified or renewed in 2019, the Group has reassessed these leases and concluded they will be recognised on the statement of financial position as a right-of-use asset.
• believes that the most significant impact will be that the Group will need to recognise a right of use asset and a lease liability for the office and production buildings currently treated as operating leases. At 30 September 2019 the future minimum lease payments amounted to ZMW28.9m (USD2.4m). This will mean that the nature of the expense of the above cost will change from being an operating lease expense to depreciation and interest expense.
• concludes that there will not be a significant impact to the finance leases currently held on the statement of financial position.
The Group is planning to adopt IFRS 16 on 1 October 2019 using the Standard’s modified retrospective approach. Under this approach the cumulative effect of initially applying IFRS 16 is recognised as an adjustment to equity at the date of initial application. Comparative information is not restated.
Choosing this transition approach results in further policy decisions the Group need to make as there are several other transitional reliefs that can be applied. These relate to those leases previously held as operating leases and can be applied on a lease-by-lease basis. The Group are currently assessing the impact of applying these other transitional reliefs.
IFRS 16 has not made any significant changes to the accounting for lessors, and therefore the Group does not expect any changes for leases where they are acting as a lessor.
(g) Business combinationsOn acquisition, the assets, liabilities and contingent liabilities of a subsidiary are measured at their fair values at the date of acquisition. Any excess of the cost of acquisition over the fair values of the identifiable net assets acquired is recognized as goodwill. Any deficiency of the cost of acquisition below the fair values of the identifiable net asset acquired is credited to the statement of comprehensive income in the period of acquisition. Changes in the Group’s ownership interest that do not result in a loss of control are accounted for as equity transactions. Purchase of non-controlling interests are recognized directly within equity being the difference between the fair value of the consideration paid and the relevant share acquired of the carrying value of the net assets to the subsidiary.
Contingent and deferred consideration arising as a result of acquisitions is stated at fair value. Contingent and deferred consideration is based on management’s best estimate of the likely outcome and best estimate of fair value, which is usually, but not always, a contracted formula based on a multiple of net profit after tax. All acquisition expenses are recognised in the statement of comprehensive income.
(h) Discontinued operationsA discontinued operation is a component of the entity that has been disposed of. A component can be distinguished operationally and for financial reporting purposes if:• its operating assets and liabilities can be directly attributed to it• its income (gross revenue) can be directly attributed to it• at least a majority of its operating expenses can be directly attributed to it.
Profit or loss from discontinued operations, including prior year comparatives, is presented in a single amount in the income statement. This amount comprises the post-tax profit or loss of discontinued operations and the post-tax gain or loss resulting from the disposal of the Group’s share of the entity’s net assets.
The disclosures for discontinued operations in the prior years relate to all operations that have been discontinued by the reporting date for the latest period presented.
2. Principal accounting policies (continued)
62 Zambeef Products PLC Annual Report 2019
Notes to the Financial Statements (continued)
For the year ended 30 September 2019
(j) GoodwillGoodwill represents future economic benefits arising from a business combination that is not individually identified and separately recognized. Goodwill is carried at cost less accumulated impairment losses and is tested annually for impairment. Refer to the note for a description of impairment testing
procedures.
(j) Revenue recognitionRevenue comprises the sale of goods as shown in note 5. Revenue is recognized when the significant risks and rewards of ownership have been transferred to the buyers and no significant uncertainties remain regarding the derivation of consideration, associated costs or the possible return of goods
To determine whether to recognise revenue, the Company follows a 5-step process:
1. Identifying the contract with a customer2. Identifying the performance obligations3. Determining the transaction price4. Allocating the transaction price to the performance obligations5. Recognising revenue when/as performance obligation(s) are satisfied.
Revenue comprises the fair value of consideration received or receivable for the sale of the Group’s products in the ordinary course of the Group’s activities. Revenue is shown net of trade allowances, duties and taxes paid and after eliminating sales within the Group.
Revenue from sale of agricultural commoditiesRevenue for the agribusiness division includes the invoice value of goods transferred to the customers. There are no discounts or other arrangements that create uncertainty over the level of revenue recognised.
Revenue from retail salesRevenue from the sale of products produced and supplied via Zambeef’s retail outlets and to external parties is recognised on delivery to customers either by way of cash sales or credit sales.
The Group often enters into transactions involving a range of the Group’s products. In all cases, the total transaction price for a contract is allocated amongst the various performance obligations based on their relative stand-alone selling prices. The transaction price for a contract excludes any amounts collected on behalf of third parties.
Revenue is recognised either at a point in time or over time, when (or as) the Group satisfies performance obligations by transferring the promised goods to its customers.
The Group recognises contract liabilities for consideration received in respect of unsatisfied performance obligations and reports these amounts as other liabilities in the statement of financial position. Similarly, if the Group satisfies a performance obligation before it receives the consideration, the Group recognises either a contract asset or a receivable in its statement of financial position, depending on whether something other than the passage of time is required before the consideration is due.
(k) Property, plant and equipmentAll classes of property, plant and equipment are stated at valuation except for plantation development expenditure and capital work in progress which are stated at historical cost. Capital work in progress relates to internally constructed building parts and plant and machinery and are categorised as such on completion. Historical cost includes expenditure that is directly attributable to the acquisition of the items.
Subsequent costs are included in the asset’s carrying amount or recognised as a separate asset, as appropriate, only when it is probable that future economic benefits associated with the item will flow to the Group and the cost of the item can be measured reliably. All other repairs and maintenance are charged to profit or loss in the statement of comprehensive income during the financial year in which they are incurred.
The Group has adopted a policy of revaluing all classes of property, plant and equipment, excluding capital work in progress and plantation development expenditure. Revaluations are conducted with sufficient regularity to ensure that the carrying amount does not differ materially from that which would be determined using fair value at the end of the reporting period.
Increases in the carrying amount arising on revaluation of property, plant and equipment are recognised in other comprehensive income and accumulated in the revaluation surplus in shareholders’ equity. Decreases that offset previous increases of the same asset are charged against the revaluation surplus in shareholders’ equity; all other decreases are charged to the statement of comprehensive income. Each year, the difference between depreciation based on the revalued carrying amount of the asset charged to the statement of comprehensive income and depreciation based on the asset’s original cost, net of any related deferred income tax, is transferred from the revaluation surplus to retained earnings.
2. Principal accounting policies (continued)

Overview Strategicreport
Corporategovernance
Financialstatements
Zambeef Products PLC Annual Report 2019 63
Depreciation is calculated to write off the cost of property, plant and equipment on a straight line basis over the expected useful lives of the assets concerned. The principal annual rates used for this purpose are:
Buildings 2%Motor vehicles 20%Furniture & equipment 10%Plant & machinery 10%Aircraft 10%
Land and capital work in progress is not depreciated.
The assets’ residual values and useful lives are reviewed at each reporting date and adjusted where appropriate.
An asset’s carrying amount is written down immediately to its recoverable amount if the asset’s carrying amount is greater than its recoverable amount.
Gains and losses on disposals are determined by comparing the proceeds with the carrying amount. These are included in the statement of comprehensive income in other income. When revalued assets are sold, the amounts included in the revaluation surplus relating to these assets are transferred to retained earnings.
(l) Leased assetsWhere property, plant and equipment are financed by leasing agreements which give rights approximating to ownership (finance leases) the assets are treated as if they had been purchased and the capital element of the leasing commitments is shown as obligations under finance lease. The lease rentals are treated as consisting of capital and interest elements. The capital element is applied to reduce the outstanding obligations and the interest element is charged to the statement of comprehensive income over the period of the lease so as to produce a constant periodic rate of interest in the remaining balance of the liability under the lease agreement for each accounting period.
Rentals payable under operating leases are charged to profit or loss in the statement of comprehensive income over the term of the relevant lease and
in accordance with the terms of the relevant leases.
(m) Financial assetsClassification and initial measurement of financial assetsExcept for those trade receivables that do not contain a significant financing component and are measured at the transaction price in accordance with IFRS 15, all financial assets are initially measured at fair value adjusted for transaction costs (where applicable).
Financial assets, other than those designated and effective as hedging instruments, are classified into the following categories:• amortised cost• fair value through profit or loss (FVTPL)• fair value through other comprehensive income (FVOCI).
In the periods presented the corporation does not have any financial assets categorised as FVOCI.
The classification is determined by both:• the entity’s business model for managing the financial asset• the contractual cash flow characteristics of the financial asset.
All income and expenses relating to financial assets that are recognised in profit or loss are presented within finance costs, finance income or other financial items, except for impairment of trade receivables which is presented within other expenses.
Subsequent measurement of financial assetsFinancial assets at amortised costFinancial assets are measured at amortised cost if the assets meet the following conditions (and are not designated as FVTPL):• they are held within a business model whose objective is to hold the financial assets and collect its contractual cash flows• the contractual terms of the financial assets give rise to cash flows that are solely payments of principal and interest on the principal amount
outstanding
After initial recognition, these are measured at amortised cost using the effective interest method.
Discounting is omitted where the effect of discounting is immaterial. The Group’s cash and cash equivalents, trade and most other receivables fall into this category of financial instruments as well as listed bonds that were previously classified as held-to-maturity under IAS 39.
2. Principal accounting policies (continued)(k) Property, plant and equipment (continued)

64 Zambeef Products PLC Annual Report 2019
Notes to the Financial Statements (continued)
For the year ended 30 September 2019
Financial assets at fair value through profit or loss (FVTPL)Financial assets that are held within a different business model other than ‘hold to collect’ or ‘hold to collect and sell’ are categorised at fair value through profit and loss. Further, irrespective of business model financial assets whose contractual cash flows are not solely payments of principal and interest are accounted for at FVTPL. All derivative financial instruments fall into this category, except for those designated and effective as hedging instruments, for which the hedge accounting requirements apply (see below).
The category also contains an equity investment. The Group accounts for the investment at FVTPL and did not make the irrevocable election to account for the investment in Zampalm Limited at fair value through other comprehensive income (FVOCI). The equity investment in Zampalm Ltd was measured at cost less any impairment charges in the comparative period under IAS 39, as it was determined that its fair value could not be estimated reliably. In the current financial year, the fair value was determined in line with the requirements of IFRS 9, which does not allow for measurement at cost.
Assets in this category are measured at fair value with gains or losses recognised in profit or loss. The fair values of financial assets in this category are determined by reference to active market transactions or using a valuation technique where no active market exists.
Financial assets classified as available for sale (AFS) under IAS 39 (comparative periods)AFS financial assets are non-derivative financial assets that are either designated to this category or do not qualify for inclusion in any of the other categories of financial assets (FVTPL or held to maturity and loans and receivables). The Group’s AFS financial assets include an equity investment in Zampalm Limited.
All AFS financial assets except for the investment in Zampalm Limited were measured at fair value. Gains and losses were recognised in other comprehensive income and reported within the AFS reserve within equity, except for interest and dividend income, impairment losses and foreign exchange differences on monetary assets, which are recognised in profit or loss. When the asset was disposed of or was determined to be impaired, the cumulative gain or loss recognised in other comprehensive income was reclassified from the equity reserve to profit or loss. Interest calculated using the effective interest method and dividends were recognised in profit or loss within finance income.
(n) Impairment of assets(i) Financial assets carried at amortised costImpairment of financial assetsIFRS 9’s impairment requirements use more forward-looking information to recognise expected credit losses – the ‘expected credit loss (ECL) model’. This replaces IAS 39’s ‘incurred loss model’. Instruments within the scope of the new requirements included loans and other debt-type financial assets measured at amortised cost and FVOCI, trade receivables, contract assets recognised and measured under IFRS 15 and loan commitments and some financial guarantee contracts (for the issuer) that are not measured at fair value through profit or loss.
Recognition of credit losses is no longer dependent on the Group first identifying a credit loss event. Instead the Group considers a broader range of information when assessing credit risk and measuring expected credit losses, including past events, current conditions, reasonable and supportable forecasts that affect the expected collectability of the future cash flows of the instrument.
In applying this forward-looking approach, a distinction is made between:• financial instruments that have not deteriorated significantly in credit quality since initial recognition or that have low credit risk (‘Stage 1’) and• financial instruments that have deteriorated significantly in credit quality since initial recognition and whose credit risk is not low (‘Stage 2’).
‘Stage 3’ would cover financial assets that have objective evidence of impairment at the reporting date.
‘12-month expected credit losses’ are recognised for the first category while ‘lifetime expected credit losses’ are recognised for the second category.Measurement of the expected credit losses is determined by a probability-weighted estimate of credit losses over the expected life of the financial instrument.
Previous financial asset impairment under IAS 39In the prior year, the impairment of trade receivables was based on the incurred loss model. Individually significant receivables were considered for impairment when they were past due or when other objective evidence was received that a specific counterparty will default. Receivables that were not considered to be individually impaired were reviewed for impairment in groups, which are determined by reference to the industry and region of the counterparty and other shared credit risk characteristics. The impairment loss estimate was then based on recent historical counterparty default
rates for each identified group.
(ii) Impairment of goodwillFor impairment assessment purposes, assets are grouped at the lowest levels for which there are largely independent cash inflows (cash generating units). As a result, some assets are tested individually for impairment and some are tested at cash-generating unit level. Goodwill is allocated to those cash-generating units that are expected to benefit from synergies of the related business combination and represent the lowest level within the Group at which management monitors goodwill.
2. Principal accounting policies (continued)(m) Financial assets (continued)
Overview Strategicreport
Corporategovernance
Financialstatements
Zambeef Products PLC Annual Report 2019 65
Cash-generating units to which goodwill has been allocated (determined by the Group’s management as equivalent to its operating segments) are tested for impairment at least annually. All other individual assets or cash-generating units are tested for impairment whenever events or changes in circumstances indicate that the carrying amount may not be recoverable.
An impairment loss is recognised for the amount by which the asset’s or cash-generating unit’s carrying amount exceeds its recoverable amount, which is the higher of fair value less costs to sell and value-in use. To determine the value-in-use, management estimates expected future cash flows from each cash-generating unit and determines a suitable interest rate in order to calculate the present value of those cash flows. The data used for impairment testing procedures are directly linked to the Group’s latest approved budget, adjusted as necessary to exclude the effects of future reorganisations and asset enhancements. Discount factors are determined individually for each cash-generating unit and reflect management’s assessment of respective risk profiles, such as market and asset-specific risks factors.
Impairment losses for cash-generating units reduce first the carrying amount of any goodwill allocated to that cash-generating unit. Any remaining impairment loss is charged pro rata to the other assets in the cash-generating unit. With the exception of goodwill, all assets are subsequently reassessed for indications that an impairment loss previously recognised may no longer exist. An impairment charge is reversed if the cash-generating unit’s recoverable amount exceeds its carrying amount.
(o) Financial liabilitiesClassification and measurement of financial liabilitiesAs the accounting for financial liabilities remains largely the same under IFRS 9 compared to IAS 39, the Group’s financial liabilities were not impacted by the adoption of IFRS 9. However, for completeness, the accounting policy is disclosed below.
The Group’s financial liabilities include borrowings, trade and other payables and derivative financial instruments.Financial liabilities are initially measured at fair value, and, where applicable, adjusted for transaction costs unless the Group designated a financial liability at fair value through profit or loss.
Subsequently, financial liabilities are measured at amortised cost using the effective interest method except for derivatives and financial liabilities designated at FVTPL, which are carried subsequently at fair value with gains or losses recognised in profit or loss (other than derivative financial instruments that are designated and effective as hedging instruments).
All interest-related charges and, if applicable, changes in an instrument’s fair value that are reported in profit or loss are included within finance costs or finance income.
(p) Biological assets(i) Current assetsBiological assets are valued at their fair values less estimated point of sale costs as determined by the Directors. The fair value of livestock is determined based on market prices of animals of similar age, breed and genetic merit. Standing crops are revalued to fair value at each reporting date based on the estimated market value of fully grown standing crops adjusted for the age and condition of the crops at the reporting date. Feedlot, standing and dairy cattle, chickens (broilers and layers), and pigs have been classified as current biological assets based on Directors’ expectation of their useful economic life. Upon maturity of biological assets, they are transferred to inventory through harvest and culling.
Net gains and losses arising from changes in fair value less estimated point of sale costs of biological assets are recognised in profit and loss in the
statement of comprehensive income.
(q) InventoryInventory is stated at the lower of cost and net realizable value. Cost is determined on a first in first out basis and includes all expenditure incurred in the normal course of business in bringing the goods to their present location and condition, including production overheads based on normal level of activity. Net realizable value takes into account all further costs directly related to marketing, selling and distribution.
Biological assets are transferred to inventory at the point of harvest/slaughter at fair value in accordance with IAS 41.(r) Cash and cash equivalentsCash and cash equivalents include cash in hand, bank overdrafts, deposits held at call with banks, structured agricultural finance, other short-term highly liquid investments and balances held with banks.
Bank overdrafts are defined as facilities which are repayable on demand and classified as current liabilities.
2. Principal accounting policies (continued)(n) Impairment of assets (continued)
66 Zambeef Products PLC Annual Report 2019
Notes to the Financial Statements (continued)
For the year ended 30 September 2019
(s) Borrowing costsBorrowing costs directly attributable to the acquisition, construction or production of qualifying assets, which are assets that necessarily take a substantial period of time to be prepared for their intended use or sale, are added to the cost of those assets, until such time as the assets are substantially ready for their intended use or sale.
Investment income earned on the temporary investment of specific borrowings pending their expenditure on qualifying assets is deducted from the borrowing costs eligible for capitalisation. All other borrowing costs are recognized within ‘finance costs’ in profit or loss in the statement of comprehensive income in the period in which they are incurred.
(t) Interest bearing liabilitiesShort term interest bearing liabilities include all amounts expected to be repayable within twelve months from the reporting date, including instalments due on loans of longer duration. Long term interest bearing liabilities represent all amounts payable more than twelve months from the reporting date.
(u) Other incomeOther income is income not related to the operation or management of the specific business activities of the Group, but which arises from the function of operating an agri-business. Other income comprises the fair value of the consideration received or receivable.
(v) TaxationCurrent income tax assets and/or liabilities comprise those obligations to, or claims from, fiscal authorities relating to the current or prior reporting periods, that are unpaid at the reporting date. Current tax is payable on taxable profit, which differs from profit or loss in the financial statements. Calculation of current tax is based on tax rates and tax laws that have been enacted or substantively enacted by the end of the reporting period.
Deferred income taxes are calculated using the liability method on temporary differences between the carrying amounts of assets and liabilities and their tax bases. However, deferred tax is not provided on the initial recognition of goodwill, or on the initial recognition of an asset or liability unless the related transaction is a business combination or affects tax or accounting profit. Deferred tax on temporary differences associated with investments in subsidiaries and joint ventures is not provided if reversal of these temporary differences can be controlled by the Group and it is probable that reversal will not occur in the foreseeable future.
Deferred tax assets and liabilities are calculated, without discounting, at tax rates that are expected to apply to their respective period of realization, provided they are enacted or substantively enacted by the end of the reporting period. Deferred tax liabilities are always provided for in full.
Deferred tax assets are recognized to the extent that it is probable that they will be able to be utilized against future taxable income.
Deferred tax assets and liabilities are offset only when the Group has a right and intention to set off current tax assets and liabilities from the same taxation authority.
Changes in deferred tax assets or liabilities are recognized as a component of tax income or expense in profit or loss, except where they relate to items that are recognized in other comprehensive income or directly in equity, in which case the related deferred tax is also recognized in other comprehensive income or equity, respectively.
(w) Employee benefits
(i) Pension obligationsThe Group has a plan with National Pension Scheme Authority (NAPSA) where the Group pays an amount equal to the employee’s contributions.
Employees contribute 5 per cent. of their gross earnings up to the statutory cap.
(ii) Termination benefitsTermination benefits are payable when employment is terminated before the normal retirement date, or whenever an employee accepts voluntary redundancy in exchange for these benefits. The Group recognises termination benefits when it is demonstrably committed to either terminating the employment of current employees according to a detailed formal plan without possibility of withdrawal; or providing termination benefits as a result of an offer made to encourage voluntary redundancy.
(x) Dividend distributionsDividend distributions to the Company’s shareholders are recognised as a liability in the financial statements in the year in which the dividends are
approved by the Company’s shareholders at a general meeting.(y) Equity and reservesShare capital represents the nominal value of shares that have been issued.
Share premium includes any premiums received on issue of share capital. Any transaction costs associated with the issuing of shares are deducted from share premium, net of any related income tax benefits.
The revaluation reserve within equity comprises gains and losses due to the revaluation of property, plant and equipment. This reserve is non-distributable.
2. Principal accounting policies (continued)
Overview Strategicreport
Corporategovernance
Financialstatements
Zambeef Products PLC Annual Report 2019 67
Foreign currency translation differences arising from translating to presentational currency and translating foreign operations are included in the foreign exchange reserve. These reserves are non-distributable.
Retained earnings include all current and prior period results as disclosed in the statement of comprehensive income. All transactions with owners of the parent are recorded separately within equity.
(z) Segmental reportingIFRS 8 requires segments to be identified on the basis of the internal reports about operating units of the Group that are regularly reviewed by the Chief Executive Officer of and the Chief Financial Officer who are the Chief Operating Decision Makers (CODMs) to allocate resources and to assess their performance. The Group operates 14 main reportable divisions which match the main external revenues earned by the Group:• Beef• Chicken• Pork• Crops• Stockfeed• Eggs• Retailing• Fish• Milk and dairy• Edible oils• Mill and bakery• Leather and shoe• Master Meats (Nigeria)• Master Meats (Ghana)
Due to the nature of the Group’s operations, namely that groups of assets and liabilities are each used to generate a number of the revenue streams above, balance sheet items cannot be discretely allocated to the above components, and the CODM also review management information regarding the operating assets and liabilities of the main reporting entities within the Group as follows:
• Zambeef• Retailing• Masterpork• Other
The ‘Other’ segment includes the foreign subsidiaries, Zamleather Limited and Zamhatch Limited. Foreign subsidiaries include the Group’s two majority-owned subsidiaries in Nigeria and Ghana. Inter and intra-divisional, and inter-company sales are recognised based on an internally set transfer price. The prices are reviewed periodically and aim to reflect what each Business segment could achieve if it sold its output to external parties at arm’s length.
(aa) Provisions (Restructuring costs and legal claims)Provisions for restructuring costs and legal claims are recognised when the Group has a present legal or constructive obligation as a result of past events it is more likely than not that an outflow of resources will be required to settle the obligation and the amount has been reliably estimated. Restructuring provisions comprise lease termination penalties and employee termination payments. Provisions are not recognised for future operating losses. Where there are a number of similar obligations, the likelihood that an outflow will be required in settlement is determined by considering the class of obligations as a whole.
(bb) Share-based employee remunerationThe Group operates equity-settled share-based remuneration plans for its employees. None of the Group’s plans are cash-settled.
All goods and services received in exchange for the grant of any share-based payment are measured at their fair values.
Where employees are rewarded using share-based payments, the fair value of employees’ services is determined indirectly by reference to the fair value of the equity instruments granted. This fair value is appraised at the grant date and excludes the impact of non-market vesting conditions (for example profitability and sales growth targets and performance conditions).
All share-based remuneration is ultimately recognised as an expense in profit or loss with a corresponding credit to retained earnings. If vesting periods or other vesting conditions apply, the expense is allocated over the vesting period, based on the best available estimate of the number of share options expected to vest.
Non-market vesting conditions are included in assumptions about the number of options that are expected to become exercisable. Estimates are subsequently revised if there is any indication that the number of share options expected to vest differs from previous estimates. Any adjustment to cumulative share-based compensation resulting from a revision is recognised in the current period. The number of vested options ultimately exercised by holders does not impact the expense recorded in any period.
2. Principal accounting policies (continued)(y) Equity and reserves (continued)
68 Zambeef Products PLC Annual Report 2019
Notes to the Financial Statements (continued)
For the year ended 30 September 2019
Upon exercise of share options, the proceeds received, net of any directly attributable transaction costs, are allocated to share capital up to the nominal (or par) value of the shares issued with any excess being recorded as share premium.
3. Critical accounting estimates and judgementsThe preparation of financial statements in conformity with adopted IFRS requires management to make judgements and estimates that affect the application of policies and reported amounts of assets, liabilities, income, expenses and contingent liabilities. Estimates are based on historical experience and other assumptions that are considered reasonable under the circumstances.
Significant management judgements Recognition of deferred tax assetsManagement applies judgement in assessing whether a deferred tax asset is recognised on carried forward trading losses based on anticipated futureprofits.
Estimation UncertaintyInformation about estimates and assumptions that may have the most significant effects on recognition and measurement of assets, liabilities, income and expenses is provided below. Actual results may be substantially different.
(i) Investments in associatesInvestments in associates are accounted for using the equity method. The carrying amount of the investment in associates is increased or decreased to recognise the Group’s share of the profit or loss and other comprehensive income of the associate adjusted, where necessary to ensure consistency with the accounting policies of the Group. Unrealised gains and losses on transactions with the Group and its associates are eliminated to the extent of the Group’s interest in those entities where the unrealised losses are eliminated. Management exercises judgement in determining the impairment of the underlying asset.
(ii) Translating to the presentational currencyManagement have applied the average exchange rate as an approximation to the actual exchange rate for the purposes of translating the Group’s consolidated financial statements into USD. The Directors have conducted an exercise to evaluate the impact of these fluctuations on the presentation of the Group’s results and has concluded that the application of the average exchange rate is a reasonable approximation to the actual rate. The Group has long-term borrowings denominated in USD and management has conducted sensitivity analysis on the Group’s reported profits and equity for the periods reported (see note 29).
(iii) Impairment of goodwillDetermining whether goodwill is impaired requires an estimation of the present value of future cash flows generated from the cash generating units to which the goodwill has been allocated. The present value calculation requires an estimation of the future cash flows expected to arise and a suitable discount rate in order to calculate present value (see note 13).
(iv) Valuation of biological assets and inventoryBiological assets are measured at fair value less estimated costs to sell. In estimating fair values and costs to sell, management takes into account the most reliable evidence at the times the estimates are made.
The most significant estimate relates to management’s assessment of anticipated yield per hectare for establishing the fair value of standing crops. This assessment takes into account historic yields, climate conditions and certain other key factors. Realisation of the carrying amounts of biological assets of ZMW170.4 million (USD12.9 million); ZMW10.3 million (USD0.8 million) (2018: ZMW181.7 million [USD14.8 million]; ZMW15.2 million [USD1.5 million]) is affected by price changes in different market segments, and ZMW613.5 million (USD49.8 million) (2018: ZMW634.9 million [USD64 million]) is affected by physical changes in different segments. Refer note to 16.
Inventories are measured at the lower of cost and net realizable value. In estimating net realizable values, management takes into account the most reliable evidence available at the times the estimates are made. Future realization of the carrying amounts of inventory assets of ZMW941.2 million (USD71.3 million) (2018: ZMW639.8 million [USD52.3 million]) is affected by price changes in different market segments.(v) Deferred liabilityThe deferred liability is estimated on an actuarial basis. In estimating the liability, the actuarial assumptions include the discount rate (the rate used to discount post-employment benefit obligation), rate at which salaries increase into the future and the mortality (deaths) expected of the members in the fund before retirement.
2. Principal accounting policies (continued)(z) Segmental reporting (continued)

Overview Strategicreport
Corporategovernance
Financialstatements
Zambeef Products PLC Annual Report 2019 69
4. Management of financial riskThe Group’s Board of Directors believes that the Group is well positioned in an improving economy. Factors contributing to the Group’s strong position are:
(a) Growth in the Zambian economy leading to higher disposable incomes.(b) Increase in the retail foot print of the Group.(c) Increase in production facilities of the Group leading to higher volumes available for retail.(d) Improvements in the management team across various areas of the Group leading to positive reinforcement of strong operational synergies.
Overall, the Group is in a strong position and has sufficient capital and liquidity to service its operating activities and debt.
4.1 Financial riskThe Group is exposed to a range of financial risks through its financial assets and financial liabilities. The most important components of this financial risk are cash flow risk, interest rate risk, foreign exchange risk and credit risk. These risks are exposed to general and specific market movements.
The Group manages these positions with a framework that has been developed to monitor its customers and return on its investments.
4.2 Credit riskThe Group has exposure to credit risk, which is the risk that a counterparty will be unable to pay amounts in full when due. The area where the Group is exposed to credit risk is amounts due from customers.
The Group structures the levels of credit risk it accepts by placing limits on its exposure to the level of credit given to a single customer. Such risk is subject to an annual or more frequent review. Limits on the level of credit risk by category and territory are approved annually by the Board of Directors.
4.3 Interest riskThe Group has exposure to both variable and fixed interest rates on its borrowings. The area where the Group is exposed to interest risk is where the variable rate benchmark such as LIBOR, Zambian Treasury Bill rate, or the Bank of Zambia Policy rate may change.
The Group structures its debt with low spreads over the variable rate benchmark and protects itself with matching fixed interest rates on its borrowings. Management periodically review economic conditions relating to such variable benchmarks and is allowed to consider alternate debt structures where
the need may arise.
3. Critical accounting estimates and judgements (continued)
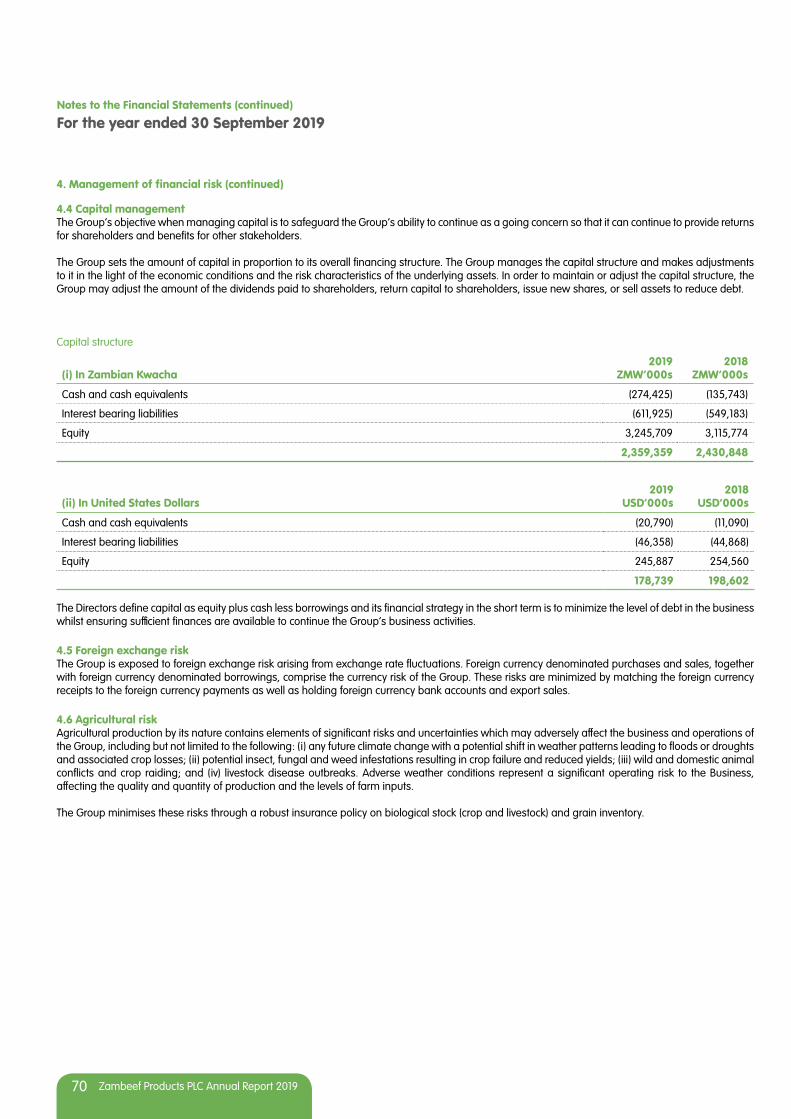
70 Zambeef Products PLC Annual Report 2019
Notes to the Financial Statements (continued)
For the year ended 30 September 2019
4.4 Capital managementThe Group’s objective when managing capital is to safeguard the Group’s ability to continue as a going concern so that it can continue to provide returns for shareholders and benefits for other stakeholders.
The Group sets the amount of capital in proportion to its overall financing structure. The Group manages the capital structure and makes adjustments to it in the light of the economic conditions and the risk characteristics of the underlying assets. In order to maintain or adjust the capital structure, the Group may adjust the amount of the dividends paid to shareholders, return capital to shareholders, issue new shares, or sell assets to reduce debt.
Capital structure
(i) In Zambian Kwacha2019
ZMW’000s2018
ZMW’000s
Cash and cash equivalents (274,425) (135,743)
Interest bearing liabilities (611,925) (549,183)
Equity 3,245,709 3,115,774
2,359,359 2,430,848
(ii) In United States Dollars2019
USD’000s2018
USD’000s
Cash and cash equivalents (20,790) (11,090)
Interest bearing liabilities (46,358) (44,868)
Equity 245,887 254,560
178,739 198,602
The Directors define capital as equity plus cash less borrowings and its financial strategy in the short term is to minimize the level of debt in the business whilst ensuring sufficient finances are available to continue the Group’s business activities.
4.5 Foreign exchange riskThe Group is exposed to foreign exchange risk arising from exchange rate fluctuations. Foreign currency denominated purchases and sales, together with foreign currency denominated borrowings, comprise the currency risk of the Group. These risks are minimized by matching the foreign currency receipts to the foreign currency payments as well as holding foreign currency bank accounts and export sales.
4.6 Agricultural riskAgricultural production by its nature contains elements of significant risks and uncertainties which may adversely affect the business and operations of the Group, including but not limited to the following: (i) any future climate change with a potential shift in weather patterns leading to floods or droughts and associated crop losses; (ii) potential insect, fungal and weed infestations resulting in crop failure and reduced yields; (iii) wild and domestic animal conflicts and crop raiding; and (iv) livestock disease outbreaks. Adverse weather conditions represent a significant operating risk to the Business, affecting the quality and quantity of production and the levels of farm inputs.
The Group minimises these risks through a robust insurance policy on biological stock (crop and livestock) and grain inventory.
4. Management of financial risk (continued)

Overview Strategicreport
Corporategovernance
Financialstatements
Zambeef Products PLC Annual Report 2019 71
5. Segmental reportingAn operating segment is a distinguishable component of the Group that engages in business activities from which it may earn revenues and incur expenses, whose operating results are regularly reviewed by the Group’s Chief Operating Decision Maker (‘CODMs’), which is the Chief Executive Officer and Chief Financial Officer, to make decisions about the allocation of resources and assessment of performance about which discrete financial information is available. Gross margin information is sufficient for the CODM to use for such purposes. The CODM reviews information regarding the operating divisions which match the main external revenues earned by the Group, and management information regarding the operating assets and liabilities of the main business divisions within the Group.
Year ended 30 September 2019
(i) In Zambian Kwacha
SegmentRevenue
ZMW’000sRevenue
ZMW’000sGross ProfitZMW’000s
Gross ProfitZMW’000s
Retailing – Zambia 1,853,721 172,031
Master Meats Nigeria 138,732 27,381
Master Meats Ghana 46,222 14,090
Retailing West Africa 184,954 41,471
Total Retailing 2,038,675 213,502
Beef 474,941 127,946
Chicken 247,580 52,405
Zamhatch 112,665 60,310
Pork 252,952 38,642
Milk and dairy 206,531 67,409
Fish 36,612 7,180
Eggs 57,211 13,765
Total Cold Chain Food Production 1,388,492 367,657
Gross Combined Retail and CCFP 3,427,167 581,159
Less: Intra/Inter Sales (1,303,519)
Combined Retail & CCFP 2,123,648 581,159
Stock Feed 986,075 191,011
Crops 474,202 270,116
Mill and Bakery 183,520 30,517
Leather and shoe 26,828 8,744
Total Other 210,348 39,261
Total 3,794,273 1,081,547
Less: Intra/Inter Group Sales (659,306)
Group total 3,134,967 1,081,547
Central operating costs and other income (920,338)
Operating profit 161,209
Foreign exchange losses (36,730)
Finance costs (82,790)
Share of loss on equity accounted investment (3,036)
Profit before tax 38,653

72 Zambeef Products PLC Annual Report 2019
Notes to the Financial Statements (continued)
For the year ended 30 September 2019
Operating assets/(liabilities)Zambeef
ZMW’000sRetailing
ZMW’000sMaster Pork
ZMW’000sOther
ZMW’000sTotal
ZMW’000s
Property plant and equipment 2,060,110 209,897 84,443 487,374 2,841,824
Biological assets and inventories 777,065 70,921 19,195 200,645 1,067,826
Cash, cash equivalents and bank overdrafts (195,772) (96,500) 1,461 16,386 (274,425)
Year ended 30 September 2018
SegmentRevenue
ZMW’000sRevenue
ZMW’000sGross ProfitZMW’000s
Gross ProfitZMW’000s
Retailing – Zambia 1,548,421 166,053
Master Meats Nigeria 109,798 22,088
Master Meats Ghana 35,015 10,976
Retailing West Africa 144,813 33,064
Total Retailing 1,693,234 199,117
Beef 456,613 125,148
Chicken 243,472 60,124
Zamhatch 103,779 66,792
Pork 223,085 34,610
Milk and dairy 178,684 66,160
Fish 49,354 10,631
Eggs 58,065 16,405
Total Cold Chain Food Production 1,313,052 379,870
Gross Combined Retail and CCFP 3,006,286 578,987
Less: Intra/Inter Sales (1,001,575)
Combined Retail & CCFP 2,004,711 578,987
Stock Feed 706,008 163,442
Crops 515,585 189,601
Mill and Bakery 110,713 19,810
Leather and shoe 30,739 7,319
Total Other 141,452 27,129
Total 3,367,756 959,159
Less: Intra/Inter Group Sales (587,167)
Group total 2,780,589 959,159
Central operating costs and other income (840,889)
Operating profit 118,270
Foreign exchange losses (19,302)
Finance costs (70,215)
Share of loss on equity accounted investment (742)
Profit before tax 28,011
5. Segmental reporting (continued)

Overview Strategicreport
Corporategovernance
Financialstatements
Zambeef Products PLC Annual Report 2019 73
Operating assets/(liabilities)Zambeef
ZMW’000sRetailing
ZMW’000sMaster Pork ZMW’000s
Other ZMW’000s
Total ZMW’000s
Property plant and equipment 2,154,822 196,004 85,302 466,093 2,902,221
Biological assets and inventories 639,665 61,984 20,408 99,429 821,486
Cash, cash equivalents and bank overdrafts (76,971) (66,994) 1,099 7,123 (135,743)
Year ended 30 September 2019
(ii) In US Dollars
SegmentRevenue
USD’000sRevenue
USD’000sGross Profit
USD’́000sGross Profit
USD’́000s
Retailing – Zambia 150,464 13,964
Master Meats Nigeria 11,261 2,222
Master Meats Ghana 3,752 1,144
Retail – West Africa 15,013 3,366
Total Retailing 165,477 17,330
Beef 38,550 10,385
Chicken 20,096 4,254
Zamhatch 9,145 4,895
Pork 20,532 3,137
Milk and dairy 16,764 5,472
Fish 2,972 583
Eggs 4,644 1,117
Total Cold Chain Food Production 112,703 29,843
Gross Combined Retail and CCFP 278,180 47,173
Less: Intra/Inter Sales (105,806) -
Combined Retail & CCFP 172,374 47,173
Stock Feed 80,039 15,503
Crops 38,490 21,925
Mill and Bakery 14,896 2,477
Leather and shoe 2,178 710
Total Other 17,074 3,187
Total 307,977 87,788
Less: Intra/Inter Group Sales (53,515)
Group total 254,462 87,788
Central operating costs and other income (74,703)
Operating profit 13,085
Foreign exchange losses (2,981)
Finance costs (6,720)
Share of loss on equity accounted investment (246)
Profit before tax 3,138
5. Segmental reporting (continued)
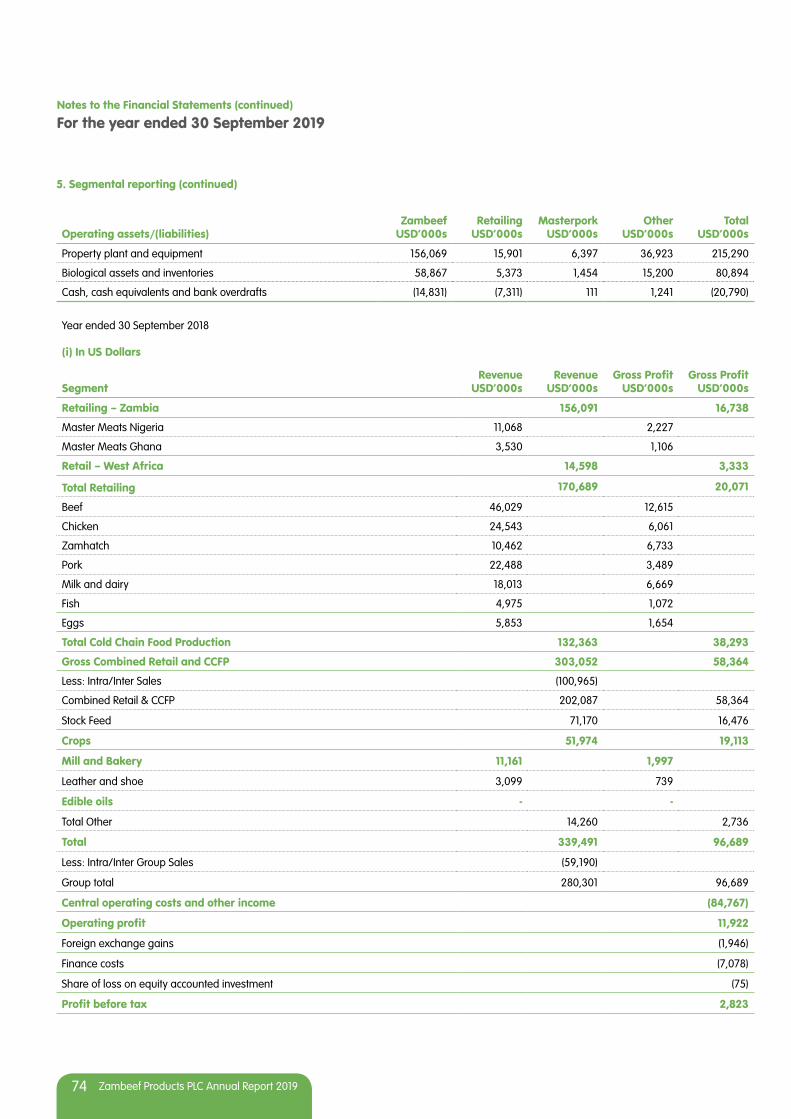
74 Zambeef Products PLC Annual Report 2019
Notes to the Financial Statements (continued)
For the year ended 30 September 2019
Operating assets/(liabilities)Zambeef
USD’000sRetailing
USD’000sMasterpork
USD’000sOther
USD’000sTotal
USD’000s
Property plant and equipment 156,069 15,901 6,397 36,923 215,290
Biological assets and inventories 58,867 5,373 1,454 15,200 80,894
Cash, cash equivalents and bank overdrafts (14,831) (7,311) 111 1,241 (20,790)
Year ended 30 September 2018
(i) In US Dollars
SegmentRevenue
USD’000sRevenue
USD’000sGross Profit
USD’000sGross Profit
USD’000s
Retailing – Zambia 156,091 16,738
Master Meats Nigeria 11,068 2,227
Master Meats Ghana 3,530 1,106
Retail – West Africa 14,598 3,333
Total Retailing 170,689 20,071
Beef 46,029 12,615
Chicken 24,543 6,061
Zamhatch 10,462 6,733
Pork 22,488 3,489
Milk and dairy 18,013 6,669
Fish 4,975 1,072
Eggs 5,853 1,654
Total Cold Chain Food Production 132,363 38,293
Gross Combined Retail and CCFP 303,052 58,364
Less: Intra/Inter Sales (100,965)
Combined Retail & CCFP 202,087 58,364
Stock Feed 71,170 16,476
Crops 51,974 19,113
Mill and Bakery 11,161 1,997
Leather and shoe 3,099 739
Edible oils - -
Total Other 14,260 2,736
Total 339,491 96,689
Less: Intra/Inter Group Sales (59,190)
Group total 280,301 96,689
Central operating costs and other income (84,767)
Operating profit 11,922
Foreign exchange gains (1,946)
Finance costs (7,078)
Share of loss on equity accounted investment (75)
Profit before tax 2,823
5. Segmental reporting (continued)

Overview Strategicreport
Corporategovernance
Financialstatements
Zambeef Products PLC Annual Report 2019 75
Operating assets/(liabilities)Zambeef
USD’000sRetailing
USD’000sMaster Pork
USD’000sOther
USD’000sTotal
USD’000s
Property plant and equipment 176,048 16,013 6,969 38,080 237,110
Biological assets and inventories 52,260 5,064 1,667 8,124 67,115
Cash, cash equivalents and bank overdrafts (6,288) (5,473) 90 581 (11,090)
2019 2018
GeographicalZMW’000s
Revenues
ZMW’000s Non-current
assetsUSD’000s Revenues
USD’000s Non-current
assetsZMW’000s
Revenues
ZMW’000s Non-current
assetsUSD’000s Revenues
USD’000s Non-current
assets
Zambia 2,903,553 3,054,396 235,679 231,394 2,587,262 3,110,257 260,814 254,107
West Africa 184,954 23,130 15,013 1,752 144,813 22,031 14,598 1,800
Rest of world 46,460 - 3,770 - 48,514 - 4,889 -
3,134,967 3,077,526 254,462 233,146 2,780,589 3,132,288 280,301 255,907 6. Other incomeOther income is derived from rental income received by the letting out of guest houses on Mpongwe farm.
7. Operating profit
2019 2018
Group ZMW’000s
Company ZMW’000s
Group ZMW’000s
Company ZMW’000s
Operating profit is stated after charging/(crediting):
Depreciation
– Owned assets 109,453 64,766 102,708 58,295
– Leased assets 12,468 6,283 3,081 3,081
Staff costs 453,701 250,627 420,787 234,758
Legal and other professional fees 7,178 3,065 25,741 18,248
Directors’ remuneration
– Executive 19,020 19,020 13,237 13,237
– Non-Executive 4,727 4,727 2,699 2,699
23,747 23,747 15,936 15,936
Auditors’ remuneration
– Audit services 2,104 1,303 2,494 2,460
– Non audit services - - - -
2,259 1,458 2,494 2,460
Impairment of trade receivables 1,201 652 2,863 205
Profit/(loss) on disposal of property, plant and equipment 986 1,821 (220) 1,457
Rentals under operating leases 12,842 - 10,583 -
5. Segmental reporting (continued)

76 Zambeef Products PLC Annual Report 2019
Notes to the Financial Statements (continued)
For the year ended 30 September 2019
2019 2018
Group USD’́000s
Company USD’000s
Group USD’000s
Company USD’000s
Operating profit before taxation is stated after charging/(crediting):
Depreciation
– Owned assets 8,884 5,257 10,354 5,876
– Leased assets 1,012 510 311 311
Staff costs 36,826 20,346 42,418 23,665
Legal and other professional fees 583 249 2,595 1,840
Directors’ remuneration
– Executive 1,543 1,543 1,335 1,335
– Non-Executive 384 384 269 269
1,927 1,927 1,604 1,604
Auditors’ remuneration
– Audit services 171 106 251 248
– Non audit services - - - -
184 119 251 248
Impairment of trade receivable 97 53 289 21
Profit/(loss) on disposal of property, plant and equipment 80 147 (220) -
Rentals under operating leases 1,042 - 1,067 -
8. Staff costsThe Group employed an average of 7,407 employees during the year ended 30 September 2019 (2018: 7,555).
2019 Number
2018 Number
Zambeef Products PLC, Zambeef Retailing Limited, Zam Chick Limited, Zamhatch Limited & Zamleather Limited 6,803 6,935
Master Pork Limited 284 275
Foreign Subsidiaries 320 345
Total 7,407 7,555
Employee costs for all employees of the Group, including Executive Directors, were:
2019 2018
ZMW’000s USD’000s ZMW’000s USD’000s
Salaries and wages 436,227 35,408 370,158 37,314
Social security costs 12,856 1,043 31,506 3,176
Pension costs 4,618 375 19,123 1,928
453,701 36,826 420,787 42,418
7. Operating profit (continued)
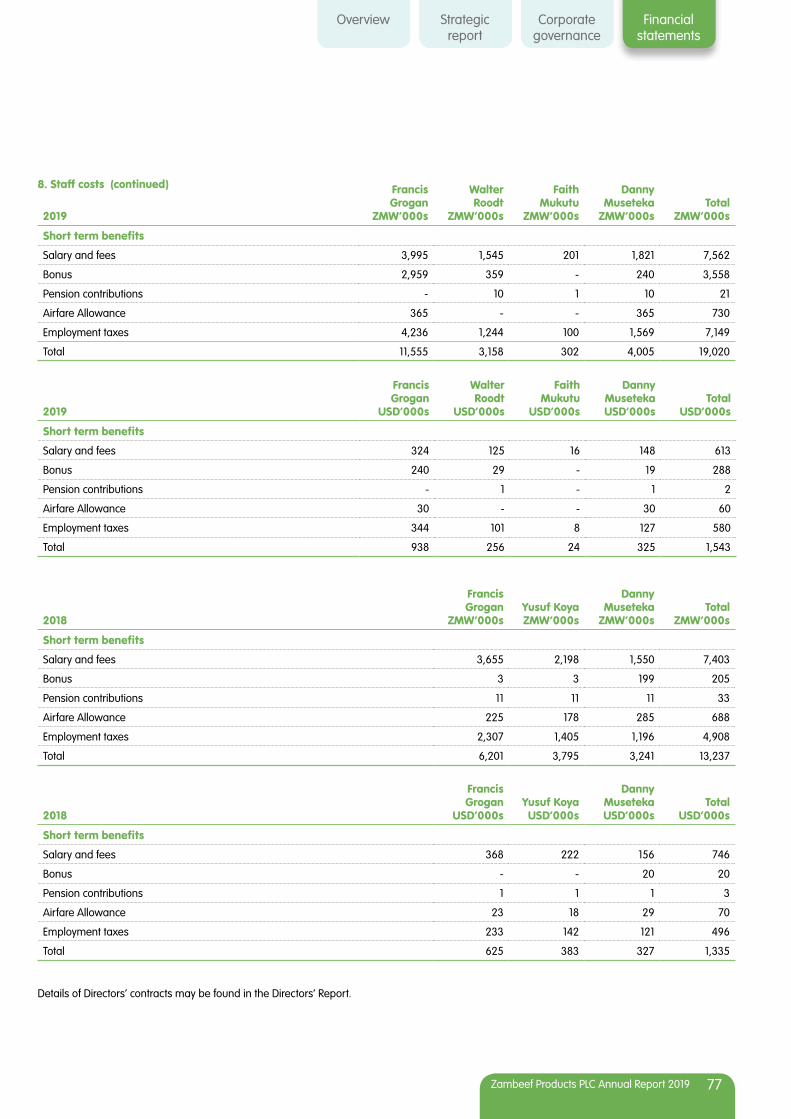
Overview Strategicreport
Corporategovernance
Financialstatements
Zambeef Products PLC Annual Report 2019 77
2019
Francis Grogan
ZMW’000s
Walter Roodt
ZMW’000s
Faith Mukutu
ZMW’000s
Danny Museteka
ZMW’000sTotal
ZMW’000s
Short term benefits
Salary and fees 3,995 1,545 201 1,821 7,562
Bonus 2,959 359 - 240 3,558
Pension contributions - 10 1 10 21
Airfare Allowance 365 - - 365 730
Employment taxes 4,236 1,244 100 1,569 7,149
Total 11,555 3,158 302 4,005 19,020
2019
Francis Grogan
USD’000s
Walter Roodt
USD’000s
Faith Mukutu
USD’000s
Danny MusetekaUSD’000s
Total USD’000s
Short term benefits
Salary and fees 324 125 16 148 613
Bonus 240 29 - 19 288
Pension contributions - 1 - 1 2
Airfare Allowance 30 - - 30 60
Employment taxes 344 101 8 127 580
Total 938 256 24 325 1,543
2018
Francis Grogan
ZMW’000sYusuf Koya ZMW’000s
Danny Museteka
ZMW’000sTotal
ZMW’000s
Short term benefits
Salary and fees 3,655 2,198 1,550 7,403
Bonus 3 3 199 205
Pension contributions 11 11 11 33
Airfare Allowance 225 178 285 688
Employment taxes 2,307 1,405 1,196 4,908
Total 6,201 3,795 3,241 13,237
2018
Francis Grogan
USD’000sYusuf Koya
USD’000s
Danny MusetekaUSD’000s
Total USD’000s
Short term benefits
Salary and fees 368 222 156 746
Bonus - - 20 20
Pension contributions 1 1 1 3
Airfare Allowance 23 18 29 70
Employment taxes 233 142 121 496
Total 625 383 327 1,335
Details of Directors’ contracts may be found in the Directors’ Report.
8. Staff costs (continued)
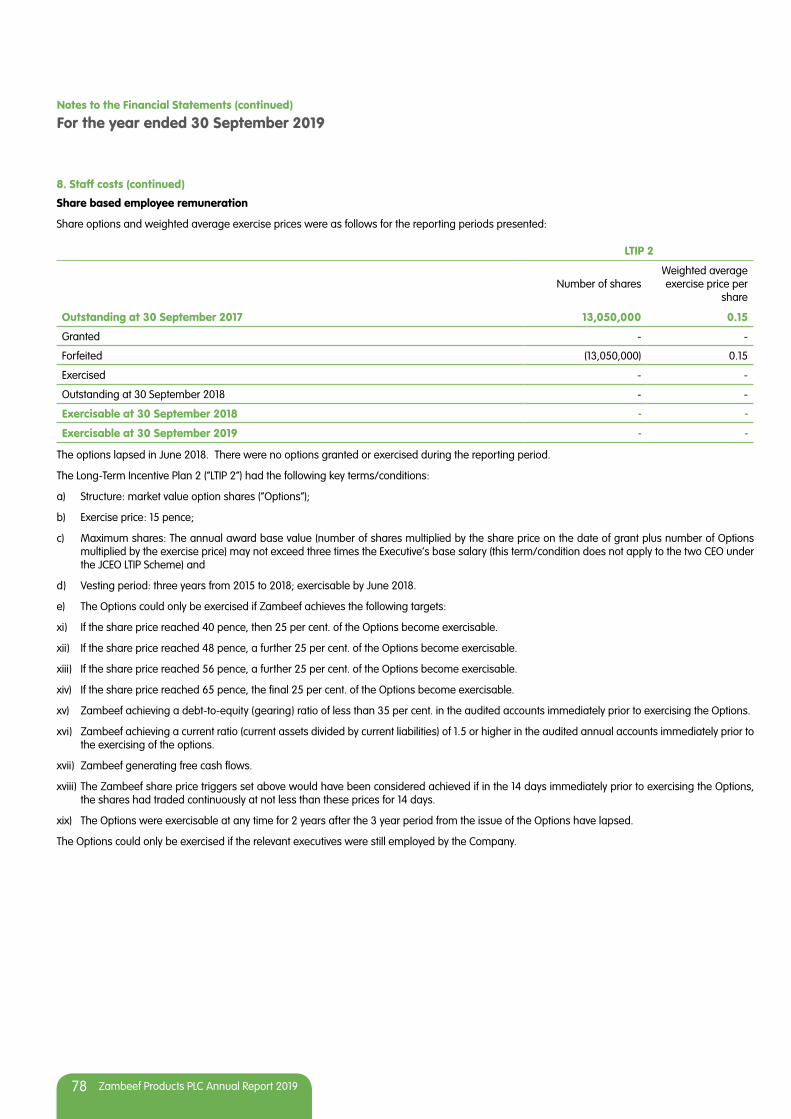
78 Zambeef Products PLC Annual Report 2019
Notes to the Financial Statements (continued)
For the year ended 30 September 2019
Share based employee remuneration
Share options and weighted average exercise prices were as follows for the reporting periods presented:
LTIP 2
Number of sharesWeighted average exercise price per
share
Outstanding at 30 September 2017 13,050,000 0.15
Granted - -
Forfeited (13,050,000) 0.15
Exercised - -
Outstanding at 30 September 2018 - -
Exercisable at 30 September 2018 - -
Exercisable at 30 September 2019 - -
The options lapsed in June 2018. There were no options granted or exercised during the reporting period.
The Long-Term Incentive Plan 2 (“LTIP 2”) had the following key terms/conditions:
a) Structure: market value option shares (“Options”);
b) Exercise price: 15 pence;
c) Maximum shares: The annual award base value (number of shares multiplied by the share price on the date of grant plus number of Options multiplied by the exercise price) may not exceed three times the Executive’s base salary (this term/condition does not apply to the two CEO under the JCEO LTIP Scheme) and
d) Vesting period: three years from 2015 to 2018; exercisable by June 2018.
e) The Options could only be exercised if Zambeef achieves the following targets:
xi) If the share price reached 40 pence, then 25 per cent. of the Options become exercisable.
xii) If the share price reached 48 pence, a further 25 per cent. of the Options become exercisable.
xiii) If the share price reached 56 pence, a further 25 per cent. of the Options become exercisable.
xiv) If the share price reached 65 pence, the final 25 per cent. of the Options become exercisable.
xv) Zambeef achieving a debt-to-equity (gearing) ratio of less than 35 per cent. in the audited accounts immediately prior to exercising the Options.
xvi) Zambeef achieving a current ratio (current assets divided by current liabilities) of 1.5 or higher in the audited annual accounts immediately prior to the exercising of the options.
xvii) Zambeef generating free cash flows.
xviii) The Zambeef share price triggers set above would have been considered achieved if in the 14 days immediately prior to exercising the Options, the shares had traded continuously at not less than these prices for 14 days.
xix) The Options were exercisable at any time for 2 years after the 3 year period from the issue of the Options have lapsed.
The Options could only be exercised if the relevant executives were still employed by the Company.
8. Staff costs (continued)

Overview Strategicreport
Corporategovernance
Financialstatements
Zambeef Products PLC Annual Report 2019 79
9. Finance costs
2019 2018
ZMW’000s USD’000s ZMW’000s USD’000s
Interest on bank loans and overdrafts 79,296 6,436 65,777 6,631
Finance lease cost 3,494 284 4,438 447
Total 82,790 6,720 70,215 7,078
10. Taxation The Group has various tax rates applicable on the basis of individual entities being defined as agricultural entities or divisions (income tax rate of 10%) or manufacturing entities or divisions (income tax rate of 35%). The Group has further obtained tax holidays through investment incentives offered by the Zambian Government.
(i) In Zambian Kwacha 2019 2018
Group ZMW’000s
Company ZMW’000s
Group ZMW’000s
Company ZMW’000s
(a) Tax charge
Current tax:
Tax charge 9,222 6,803 9,046 6,084
Deferred tax:
Deferred taxation (note 10(e)) (6,442) 27,388 (4,789) 1,638
Tax charge/(credit) for the year 2,780 34,191 4,257 7,722
(b) Reconciliation of tax charge
Profit/(loss) before taxation 38,653 55,795 28,011 22,877
Taxation on accounting (loss)/profit (24,681) 6,805 (15,231) 5,822
Effects of:
Permanent differences:
Disallowable expenses 3,774 533 4,353 680
Timing differences:
Capital allowances and depreciation 22,375 31,047 (9,420) (428)
Livestock and crop valuations adjustment 1,924 1,923 176 486
Other income 1,342 4 59 39
Unrealised exchange (gains)/ losses (903) (834) (997) 2,101
Unrealised tax losses (1,051) (5,287) 25,317 (978)
Tax charge for the year 2,780 34,191 4,257 7,722
(c) Movement in taxation account
Taxation recoverable at 1 October (960) (2,510) 1,612 1,588
Charge for the year 9,222 6,803 9,046 6,084
Taxation paid (9,652) (5,822) (11,618) (10,182)
Taxation payable/(recoverable) as at 30 September (1,390) (1,529) (960) (2,510)
Analysed as follows:
Taxation payable 1,377 - 2,925 -
Taxation recoverable (2,767) (1,529) (3,885) (2,510)
(1,390) (1,529) (960) (2,510)
Tax returns for the year ended 30 September 2019 will be made on the due date.
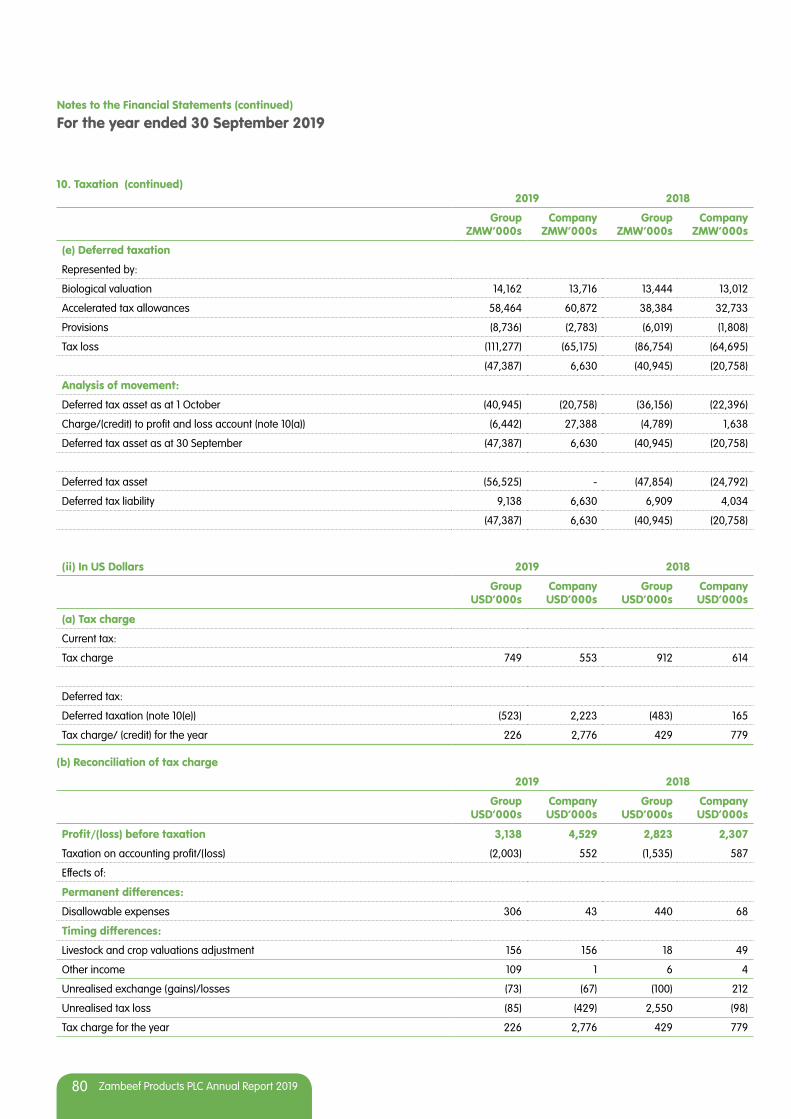
80 Zambeef Products PLC Annual Report 2019
Notes to the Financial Statements (continued)
For the year ended 30 September 2019
2019 2018
Group ZMW’000s
Company ZMW’000s
Group ZMW’000s
Company ZMW’000s
(e) Deferred taxation
Represented by:
Biological valuation 14,162 13,716 13,444 13,012
Accelerated tax allowances 58,464 60,872 38,384 32,733
Provisions (8,736) (2,783) (6,019) (1,808)
Tax loss (111,277) (65,175) (86,754) (64,695)
(47,387) 6,630 (40,945) (20,758)
Analysis of movement:
Deferred tax asset as at 1 October (40,945) (20,758) (36,156) (22,396)
Charge/(credit) to profit and loss account (note 10(a)) (6,442) 27,388 (4,789) 1,638
Deferred tax asset as at 30 September (47,387) 6,630 (40,945) (20,758)
Deferred tax asset (56,525) - (47,854) (24,792)
Deferred tax liability 9,138 6,630 6,909 4,034
(47,387) 6,630 (40,945) (20,758)
(ii) In US Dollars 2019 2018
Group USD’000s
Company USD’000s
Group USD’000s
Company USD’000s
(a) Tax charge
Current tax:
Tax charge 749 553 912 614
Deferred tax:
Deferred taxation (note 10(e)) (523) 2,223 (483) 165
Tax charge/ (credit) for the year 226 2,776 429 779
(b) Reconciliation of tax charge
2019 2018
Group USD’000s
Company USD’000s
Group USD’000s
Company USD’000s
Profit/(loss) before taxation 3,138 4,529 2,823 2,307
Taxation on accounting profit/(loss) (2,003) 552 (1,535) 587
Effects of:
Permanent differences:
Disallowable expenses 306 43 440 68
Timing differences:
Livestock and crop valuations adjustment 156 156 18 49
Other income 109 1 6 4
Unrealised exchange (gains)/losses (73) (67) (100) 212
Unrealised tax loss (85) (429) 2,550 (98)
Tax charge for the year 226 2,776 429 779
10. Taxation (continued)
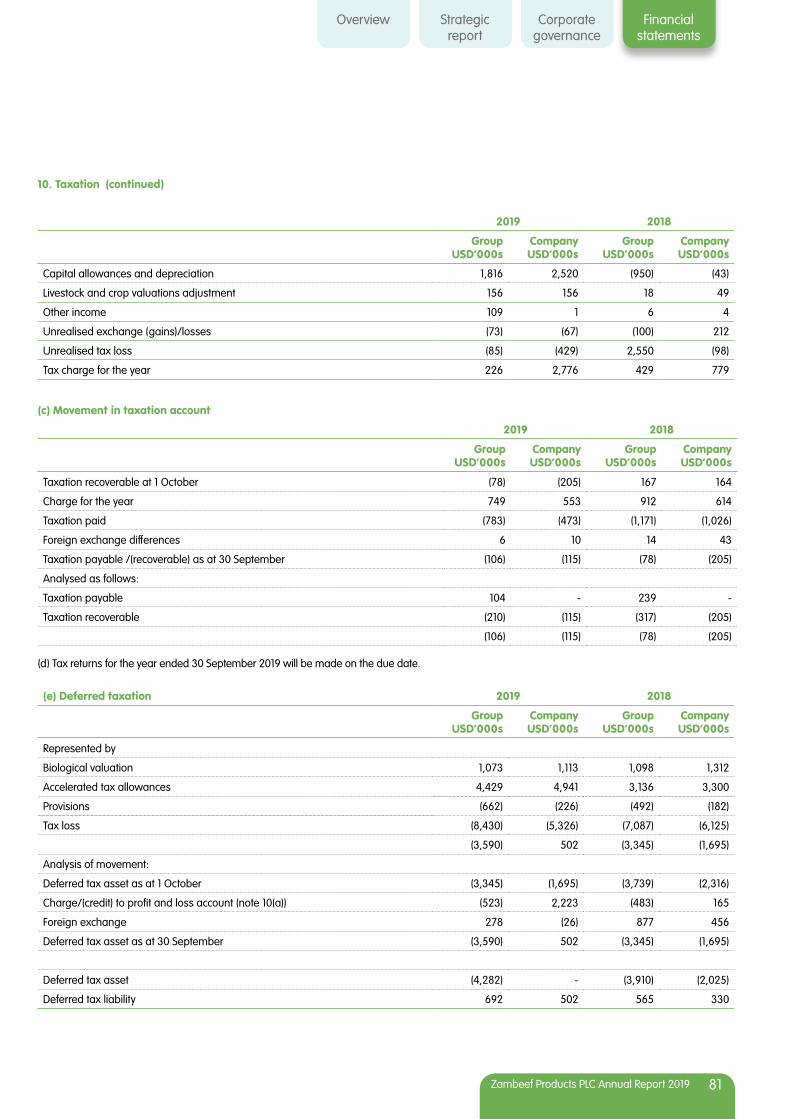
Overview Strategicreport
Corporategovernance
Financialstatements
Zambeef Products PLC Annual Report 2019 81
2019 2018
Group USD’000s
Company USD’000s
Group USD’000s
Company USD’000s
Capital allowances and depreciation 1,816 2,520 (950) (43)
Livestock and crop valuations adjustment 156 156 18 49
Other income 109 1 6 4
Unrealised exchange (gains)/losses (73) (67) (100) 212
Unrealised tax loss (85) (429) 2,550 (98)
Tax charge for the year 226 2,776 429 779
(c) Movement in taxation account
2019 2018
Group USD’000s
Company USD’000s
Group USD’000s
Company USD’000s
Taxation recoverable at 1 October (78) (205) 167 164
Charge for the year 749 553 912 614
Taxation paid (783) (473) (1,171) (1,026)
Foreign exchange differences 6 10 14 43
Taxation payable /(recoverable) as at 30 September (106) (115) (78) (205)
Analysed as follows:
Taxation payable 104 - 239 -
Taxation recoverable (210) (115) (317) (205)
(106) (115) (78) (205)
(d) Tax returns for the year ended 30 September 2019 will be made on the due date.
(e) Deferred taxation 2019 2018
Group USD’000s
Company USD’000s
Group USD’000s
Company USD’000s
Represented by
Biological valuation 1,073 1,113 1,098 1,312
Accelerated tax allowances 4,429 4,941 3,136 3,300
Provisions (662) (226) (492) (182)
Tax loss (8,430) (5,326) (7,087) (6,125)
(3,590) 502 (3,345) (1,695)
Analysis of movement:
Deferred tax asset as at 1 October (3,345) (1,695) (3,739) (2,316)
Charge/(credit) to profit and loss account (note 10(a)) (523) 2,223 (483) 165
Foreign exchange 278 (26) 877 456
Deferred tax asset as at 30 September (3,590) 502 (3,345) (1,695)
Deferred tax asset (4,282) - (3,910) (2,025)
Deferred tax liability 692 502 565 330
10. Taxation (continued)
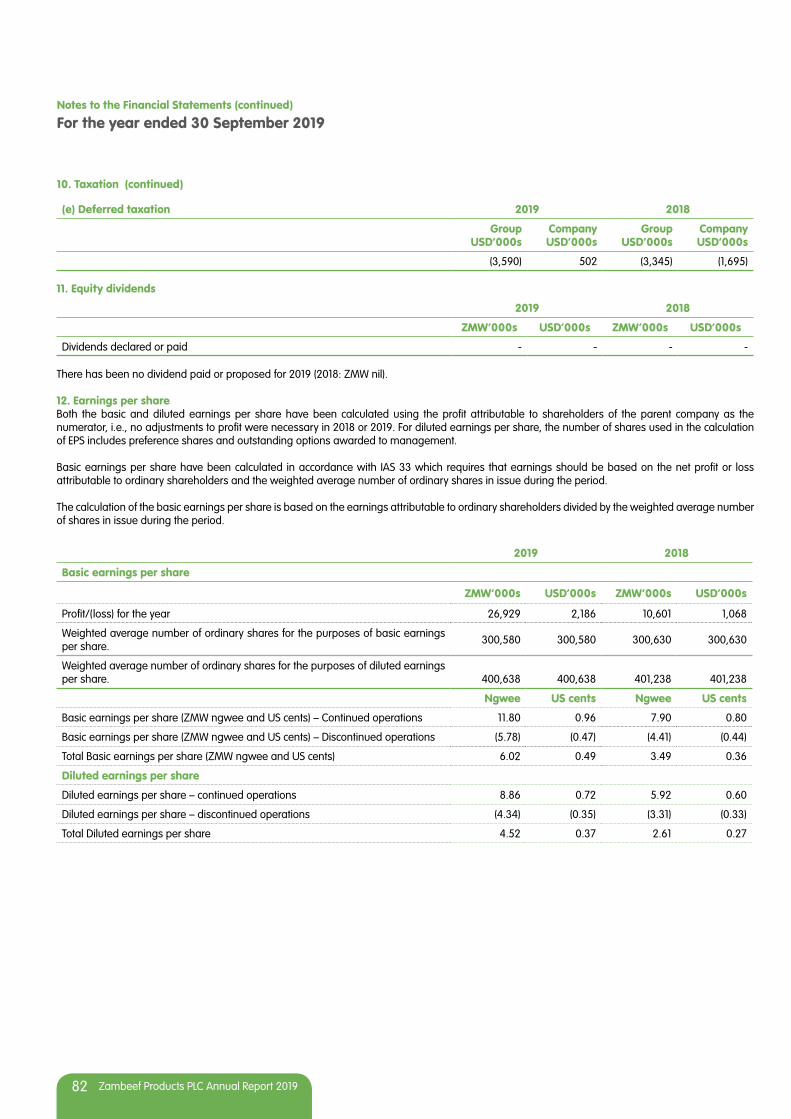
82 Zambeef Products PLC Annual Report 2019
Notes to the Financial Statements (continued)
For the year ended 30 September 2019
(e) Deferred taxation 2019 2018
Group USD’000s
Company USD’000s
Group USD’000s
Company USD’000s
(3,590) 502 (3,345) (1,695)
11. Equity dividends
2019 2018
ZMW’000s USD’000s ZMW’000s USD’000s
Dividends declared or paid - - - -
There has been no dividend paid or proposed for 2019 (2018: ZMW nil).
12. Earnings per shareBoth the basic and diluted earnings per share have been calculated using the profit attributable to shareholders of the parent company as the numerator, i.e., no adjustments to profit were necessary in 2018 or 2019. For diluted earnings per share, the number of shares used in the calculation of EPS includes preference shares and outstanding options awarded to management.
Basic earnings per share have been calculated in accordance with IAS 33 which requires that earnings should be based on the net profit or loss attributable to ordinary shareholders and the weighted average number of ordinary shares in issue during the period.
The calculation of the basic earnings per share is based on the earnings attributable to ordinary shareholders divided by the weighted average number of shares in issue during the period.
2019 2018
Basic earnings per share
ZMW’000s USD’000s ZMW’000s USD’000s
Profit/(loss) for the year 26,929 2,186 10,601 1,068
Weighted average number of ordinary shares for the purposes of basic earnings per share. 300,580 300,580 300,630 300,630
Weighted average number of ordinary shares for the purposes of diluted earnings per share. 400,638 400,638 401,238 401,238
Ngwee US cents Ngwee US cents
Basic earnings per share (ZMW ngwee and US cents) – Continued operations 11.80 0.96 7.90 0.80
Basic earnings per share (ZMW ngwee and US cents) – Discontinued operations (5.78) (0.47) (4.41) (0.44)
Total Basic earnings per share (ZMW ngwee and US cents) 6.02 0.49 3.49 0.36
Diluted earnings per share
Diluted earnings per share – continued operations 8.86 0.72 5.92 0.60
Diluted earnings per share – discontinued operations (4.34) (0.35) (3.31) (0.33)
Total Diluted earnings per share 4.52 0.37 2.61 0.27
10. Taxation (continued)
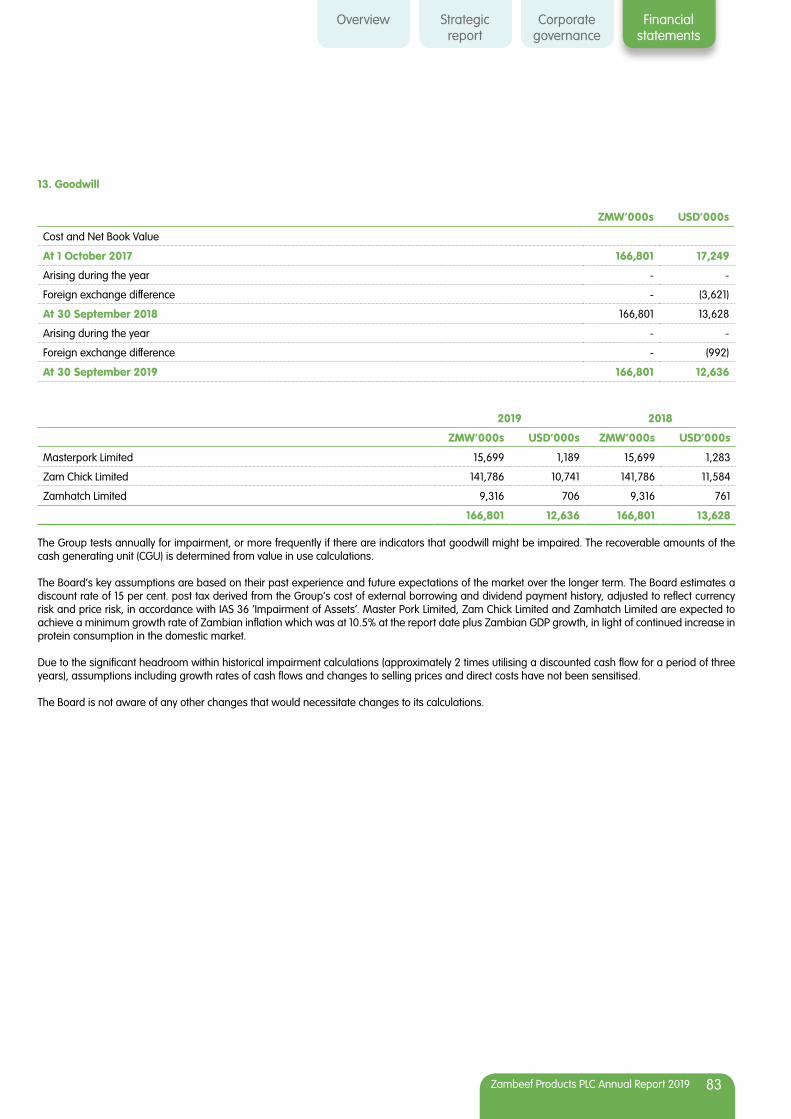
Overview Strategicreport
Corporategovernance
Financialstatements
Zambeef Products PLC Annual Report 2019 83
13. Goodwill
ZMW’000s USD’000s
Cost and Net Book Value
At 1 October 2017 166,801 17,249
Arising during the year - -
Foreign exchange difference - (3,621)
At 30 September 2018 166,801 13,628
Arising during the year - -
Foreign exchange difference - (992)
At 30 September 2019 166,801 12,636
2019 2018
ZMW’000s USD’000s ZMW’000s USD’000s
Masterpork Limited 15,699 1,189 15,699 1,283
Zam Chick Limited 141,786 10,741 141,786 11,584
Zamhatch Limited 9,316 706 9,316 761
166,801 12,636 166,801 13,628
The Group tests annually for impairment, or more frequently if there are indicators that goodwill might be impaired. The recoverable amounts of the cash generating unit (CGU) is determined from value in use calculations.
The Board’s key assumptions are based on their past experience and future expectations of the market over the longer term. The Board estimates a discount rate of 15 per cent. post tax derived from the Group’s cost of external borrowing and dividend payment history, adjusted to reflect currency risk and price risk, in accordance with IAS 36 ‘Impairment of Assets’. Master Pork Limited, Zam Chick Limited and Zamhatch Limited are expected to achieve a minimum growth rate of Zambian inflation which was at 10.5% at the report date plus Zambian GDP growth, in light of continued increase in protein consumption in the domestic market.
Due to the significant headroom within historical impairment calculations (approximately 2 times utilising a discounted cash flow for a period of three years), assumptions including growth rates of cash flows and changes to selling prices and direct costs have not been sensitised.
The Board is not aware of any other changes that would necessitate changes to its calculations.
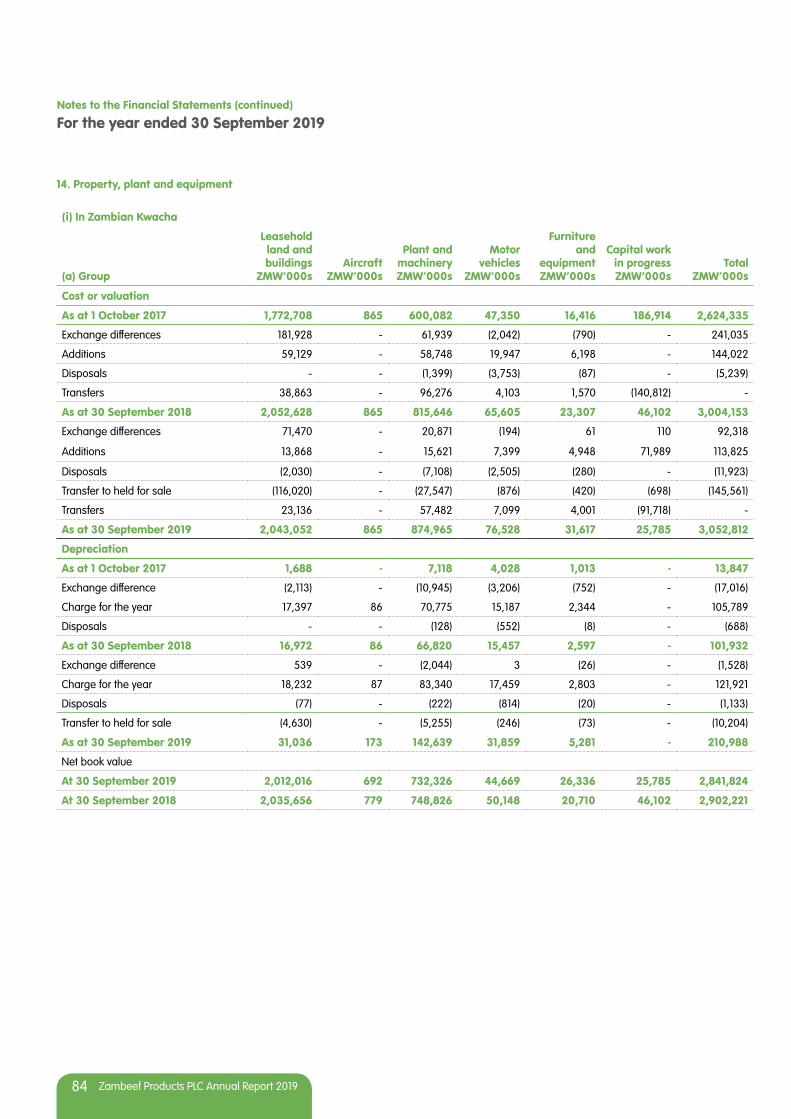
84 Zambeef Products PLC Annual Report 2019
Notes to the Financial Statements (continued)
For the year ended 30 September 2019
14. Property, plant and equipment
(i) In Zambian Kwacha
(a) Group
Leasehold land and buildings
ZMW’000sAircraft
ZMW’000s
Plant and machinery ZMW’000s
Motor vehicles
ZMW’000s
Furniture and
equipment ZMW’000s
Capital work in progress ZMW’000s
Total ZMW’000s
Cost or valuation
As at 1 October 2017 1,772,708 865 600,082 47,350 16,416 186,914 2,624,335
Exchange differences 181,928 - 61,939 (2,042) (790) - 241,035
Additions 59,129 - 58,748 19,947 6,198 - 144,022
Disposals - - (1,399) (3,753) (87) - (5,239)
Transfers 38,863 - 96,276 4,103 1,570 (140,812) -
As at 30 September 2018 2,052,628 865 815,646 65,605 23,307 46,102 3,004,153
Exchange differences 71,470 - 20,871 (194) 61 110 92,318
Additions 13,868 - 15,621 7,399 4,948 71,989 113,825
Disposals (2,030) - (7,108) (2,505) (280) - (11,923)
Transfer to held for sale (116,020) - (27,547) (876) (420) (698) (145,561)
Transfers 23,136 - 57,482 7,099 4,001 (91,718) -
As at 30 September 2019 2,043,052 865 874,965 76,528 31,617 25,785 3,052,812
Depreciation
As at 1 October 2017 1,688 - 7,118 4,028 1,013 - 13,847
Exchange difference (2,113) - (10,945) (3,206) (752) - (17,016)
Charge for the year 17,397 86 70,775 15,187 2,344 - 105,789
Disposals - - (128) (552) (8) - (688)
As at 30 September 2018 16,972 86 66,820 15,457 2,597 - 101,932
Exchange difference 539 - (2,044) 3 (26) - (1,528)
Charge for the year 18,232 87 83,340 17,459 2,803 - 121,921
Disposals (77) - (222) (814) (20) - (1,133)
Transfer to held for sale (4,630) - (5,255) (246) (73) - (10,204)
As at 30 September 2019 31,036 173 142,639 31,859 5,281 - 210,988
Net book value
At 30 September 2019 2,012,016 692 732,326 44,669 26,336 25,785 2,841,824
At 30 September 2018 2,035,656 779 748,826 50,148 20,710 46,102 2,902,221

Overview Strategicreport
Corporategovernance
Financialstatements
Zambeef Products PLC Annual Report 2019 85
(ii) In US Dollars
(a) Group
Leasehold land and buildings
USD’000sAircraft
USD’000s
Plant and machinery USD’000s
Motor vehicles
USD’000s
Furniture and
equipment USD’000s
Capital work in progress USD’000s
Total USD’000s
Cost or valuation
As at 1 October 2017 187,537 91 62,891 4,902 1,708 19,328 276,457
Foreign translation (28,988) (20) (11,045) (1,538) (548) (3,264) (45,403)
Additions 5,961 - 5,922 2,011 625 - 14,519
Transfers 3,918 - 9,705 414 158 (14,195) -
Disposals - - (141) (378) (9) - (528)
As at 30 September 2018 168,428 71 67,332 5,411 1,934 1,869 245,045
Foreign translation (7,701) (5) (4,317) (521) (210) 1,739 (11,015)
Additions 1,126 - 1,267 601 402 5,843 9,239
Transfers 1,878 - 4,666 576 325 (7,445) -
Disposals (165) - (577) (203) (23) - (968)
Transfer to held for sale (8,789) - (2,087) (66) (32) (53) (11,027)
As at 30 September 2019 154,777 66 66,284 5,798 2,396 1,953 231,274
As at 1 October 2017 3,229 - 2,751 417 102 - 6,499
Charge for the year 1,754 9 7,135 1,531 236 - 10,665
Disposals - - (13) (56) (1) - (70)
Foreign Translation (9,969) (2) 1,022 (243) 33 - (9,159)
As at 30 September 2018 (4,986) 7 10,895 1,649 370 - 7,935
Charge for the year 1,480 7 6,764 1,417 228 - 9,896
Disposals (6) - (18) (66) (2) - (92)
Transfer to held for sale (351) - (397) (19) (6) - (773)
Foreign Translation 6,214 (1) (6,437) (568) (190) - (982)
As at 30 September 2019 2,351 13 10,807 2,413 400 - 15,984
Net book value
At 30 September 2019 152,426 53 55,477 3,385 1,996 1,953 215,290
At 30 September 2018 173,414 64 56,437 3,762 1,564 1,869 237,110
(a) The Group’s property, plant and equipment situated in Zambia were revalued as at 30 September 2017 by Messrs Fairworld Properties Limited, Registered Valuation Surveyors, on the basis of market value. The surplus on valuation totalling ZMW790 million (USD82 million) was transferred to a revaluation reserve.
(b) The depreciation charge for the year includes ZMW29.7 million (USD2.4 million) (2018: ZMW23.4 million [USD2.4 million]) which relates to the surplus over the original cost of fixed assets shown at a valuation. As this amount should not be taken to reduce the Group’s distributable reserve, an equivalent amount has been transferred to distributable reserve from revaluation reserve.
(c) The carrying value of the Group’s property, plant and equipment includes an amount of ZMW55.6 million (USD4.2 million) (2018: ZMW23.4 million [USD2.5 million]) in respect of assets held under finance leases. The depreciation charged to the income statement in respect of such assets amounted to ZMW12.5 million (USD1 million) (2018: ZMW3.1 million [USD0.31 million]).
(d) The capital work in progress depicts all capital expenditure items on projects that are yet to be completed.(e) In the opinion of the Directors, the carrying values of property, plant and equipment stated above are not higher than their fair values.
14. Property, plant and equipment (continued)

86 Zambeef Products PLC Annual Report 2019
Notes to the Financial Statements (continued)
For the year ended 30 September 2019
(i) In Zambian Kwacha
(b) Company
Leasehold land and buildings
ZMW’000s
Plant and machinery ZMW’000s
Motor vehicles
ZMW’000s
Furniture and
equipment ZMW’000s
Capital work in progress ZMW’000s
Total ZMW’000s
Cost or valuation
At 1 October 2017 1,431,292 429,952 16,823 9,798 27,895 1,915,760
Exchange differences 189,491 61,140 1,758 414 - 252,803
Additions - 1,024 3,971 1,856 42,564 49,415
Transfers 8,590 20,311 2,427 691 (32,019) -
Disposals - (984) (1,005) (72) - (2,061)
As at 30 September 2018 1,629,373 511,443 23,974 12,687 38,440 2,215,917
Exchange differences 70,294 20,195 249 154 - 90,892
Additions 2,121 2,264 1,766 1,032 16,560 23,743
Transfers 3,107 23,238 1,984 2,796 (31,125) -
Disposals (1,675) (1,160) (421) (118) - (3,374)
Transfer to held for sale (116,020) (27,547) (876) (420) (698) (145,561)
As at 30 September 2019 1,587,200 528,433 26,676 16,131 23,177 2,181,617
Depreciation
As at 1 October 2017 - - - - - -
Charge for the year 10,564 45,397 4,306 1,109 - 61,376
Disposals - (90) (184) (7) - (281)
As at 30 September 2018 10,564 45,307 4,122 1,102 - 61,095
Charge for the year 11,003 53,302 5,299 1,445 - 71,049
Disposals (66) (223) (125) (19) - (433)
Transfer to held for sale (4,630) (5,255) (246) (73) - (10,204)
As at 30 September 2019 16,871 93,131 9,050 2,455 - 121,507
Net book value
At 30 September 2019 1,570,329 435,302 17,626 13,676 23,177 2,060,110
At 30 September 2018 1,618,809 466,136 19,852 11,585 38,440 2,154,822
14. Property, plant and equipment (continued)

Overview Strategicreport
Corporategovernance
Financialstatements
Zambeef Products PLC Annual Report 2019 87
(ii) In US Dollars
(b) Company
Leasehold land and buildings
USD’000s
Plant and machinery USD’000s
Motor vehicles
USD’000s
Furniture and
equipment USD’000s
Capital work in progress USD’000s
Total USD’000s
Cost or valuation
As at 1 October 2017 148,014 44,466 1,740 1,013 2,885 198,118
Exchange differences 19,102 5,689 108 41 - 24,940
Additions - 104 400 188 4,290 4,982
Transfers 866 2,047 245 70 (3,228) -
Disposals - (99) (101) (8) - (208)
Foreign translation (34,863) (10,504) (365) (267) (807) (46,806)
As at 30 September 2018 133,119 41,703 2,027 1,037 3,140 181,026
Exchange differences 5,706 1,639 20 12 - 7,377
Additions 172 184 143 84 1,344 1,927
Transfers 252 1,886 161 227 (2,526) -
Disposals (136) (94) (34) (10) - (274)
Transfer to held for sale (8,789) (2,087) (66) (32) (53) (11,027)
Foreign translation (10,081) (3,198) (230) (97) (149) (13,755)
As at 30 September 2019 120,243 40,033 2,021 1,221 1,756 165,274
Depreciation
As at 1 October 2017 - - - - - -
Charge for the year 1,065 4,576 434 112 - 6,187
Disposals - (9) (19) (1) - (29)
Foreign translation (202) (878) (79) (21) - (1,180)
As at 30 September 2018 863 3,689 336 90 - 4,978
Charge for the year 893 4,326 430 118 - 5,767
Disposals (5) (18) (10) (2) - (35)
Transfer to held for sale (351) (397) (19) (6) - (773)
Foreign translation (122) (544) (52) (14) - (732)
As at 30 September 2019 1,278 7,056 685 186 - 9,205
Net book value
At 30 September 2019 118,965 32,977 1,336 1,035 1,756 156,069
At 30 September 2018 132,256 38,014 1,691 947 3,140 176,048
(a) The Company’s property, plant and equipment situated in Zambia were revalued as at 30 September 2017 by Messrs Fairworld Properties Limited, Registered Valuation Surveyors, on the basis of market value. The surplus on valuation totalling ZMW651 million (USD54.1 million) was transferred to a revaluation reserve.
(b) The carrying value of the Company’s property, plant and equipment includes an amount of ZMW30.9 million (USD2.3 million) (2018: ZMW5 million [USD0.4 million]) in respect of assets held under finance leases. The depreciation charged to the income statement in respect of such assets amounted to ZMW6.3 million (USD0.5 million) (2018: ZMW0.8 million [USD0.083 million]).
(c) In the opinion of the Directors, the carrying values of property, plant and equipment stated above are not higher than their fair values.
15. Investments in subsidiaries, associates and minority interests (continued)

88 Zambeef Products PLC Annual Report 2019
Notes to the Financial Statements (continued)
For the year ended 30 September 2019
15. Investments in subsidiaries, associates and minority interestsThe principal subsidiaries and associates of the Company, their country of incorporation, ownership of their issued, ordinary share capital and the nature of their trade are listed below:
(a) Directly owned: Country of incorporation
Proportion of all classes of issued share capital owned by the Company
2019
Proportion of all classes of issued share capital owned by the Company
2018 Principal activity
Zambeef Retailing Limited Zambia 100 100Retailing of Zambeef
products
Zamleather Limited Zambia 100 100
Processing and sale of leather and production and
sale of shoes
Master Meat and Agro Production Co of Nigeria Limited Nigeria 80 80
Processing and sale of meat products
Master Meat (Ghana) Limited Ghana 90 90
Processing and sale of meat products
Masterpork Limited Zambia 100 100
Processing and sale of pork and processed
products
Zampalm Limited Zambia 10 10 Palm tree plantation
Zam Chick Limited Zambia 100 100Processing and sale of
poultry products
Zamhatch Limited Zambia 100 100
Chicken breeding, rearing and production of stock
feed
The proportion of voting rights held is the same as the proportion of shares held.
2019 2018
(b) Movement at cost: ZMW’000s USD’000s ZMW’000s USD’000s
At beginning of the year 245,807 20,082 245,807 25,420
Foreign translation - (1,460) - (5,338)
At end of the year 245,807 18,622 245,807 20,082
(c) The Company’s interests in its subsidiaries, which are unlisted, are as follows:
Name of companyCountry of
IncorporationAssets
ZMW’000sLiabilities
ZMW’000sRevenues
ZMW’000sProfit/(loss) ZMW’000s
Zambeef Retailing Limited Zambia 899,371 983,478 1,853,720 (53,340)
Zamleather Limited Zambia 91,242 63,868 26,828 (6,453)
West Africa Operations Nigeria & Ghana 21,158 68,093 184,954 2,592
Masterpork Limited Zambia 234,170 142,910 252,952 (49)
Zam Chick Limited Zambia 854,449 633,437 247,580 23,030
Zamhatch Limited Zambia 654,402 444,883 420,633 57,319
Total at the end of 30 September 2019 2,754,792 2,336,669 2,986,667 23,099
Zambeef Retailing Limited Zambia 726,987 757,746 1,584,421 (63,952)
Zamleather Limited Zambia 64,292 30,464 30,739 (5,286)
West Africa Operations Nigeria & Ghana 43,911 83,154 144,813 (12)
Masterpork Limited Zambia 246,924 155,738 223,085 (5,771)
Zampalm Limited Zambia 247,996 79,026 424 (18,581)
Zam Chick Limited Zambia 671,584 473,602 243,472 34,672
Zamhatch Limited Zambia 427,465 275,265 297,476 48,255
Total at the end of 30 September 2018 2,429,159 1,854,995 2,524,430 (10,675)
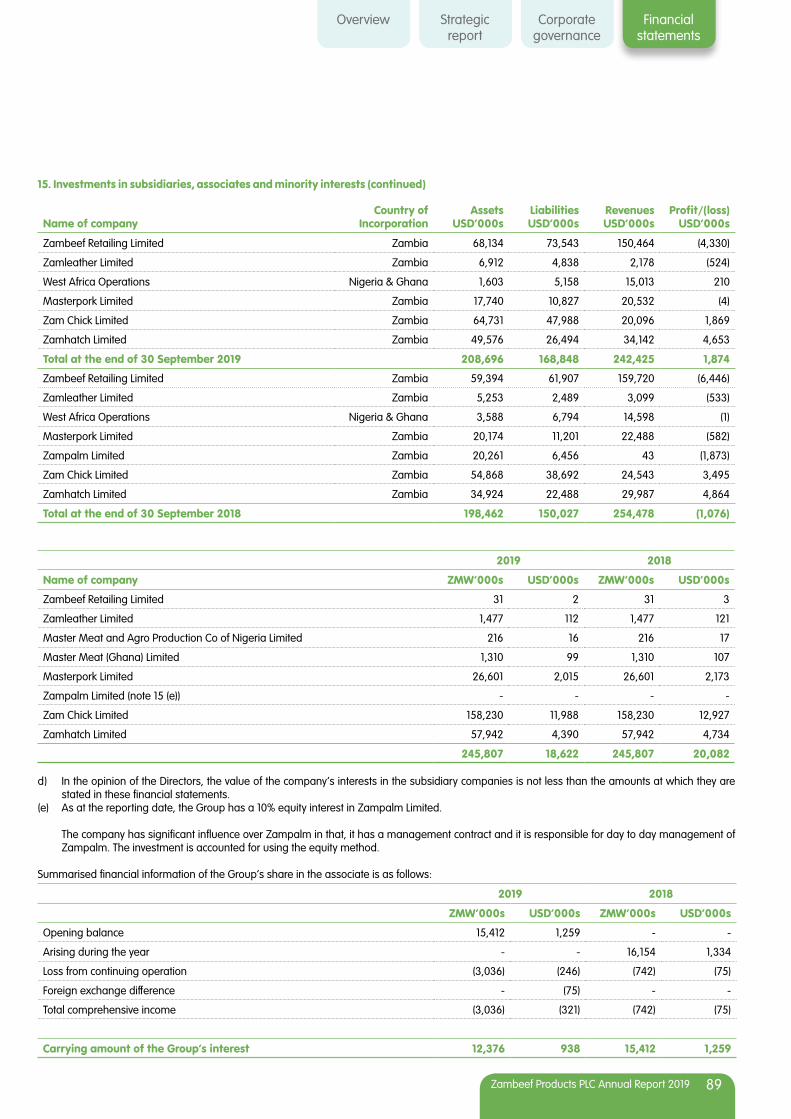
Overview Strategicreport
Corporategovernance
Financialstatements
Zambeef Products PLC Annual Report 2019 89
Name of companyCountry of
IncorporationAssets
USD’000sLiabilities USD’000s
Revenues USD’000s
Profit/(loss) USD’000s
Zambeef Retailing Limited Zambia 68,134 73,543 150,464 (4,330)
Zamleather Limited Zambia 6,912 4,838 2,178 (524)
West Africa Operations Nigeria & Ghana 1,603 5,158 15,013 210
Masterpork Limited Zambia 17,740 10,827 20,532 (4)
Zam Chick Limited Zambia 64,731 47,988 20,096 1,869
Zamhatch Limited Zambia 49,576 26,494 34,142 4,653
Total at the end of 30 September 2019 208,696 168,848 242,425 1,874
Zambeef Retailing Limited Zambia 59,394 61,907 159,720 (6,446)
Zamleather Limited Zambia 5,253 2,489 3,099 (533)
West Africa Operations Nigeria & Ghana 3,588 6,794 14,598 (1)
Masterpork Limited Zambia 20,174 11,201 22,488 (582)
Zampalm Limited Zambia 20,261 6,456 43 (1,873)
Zam Chick Limited Zambia 54,868 38,692 24,543 3,495
Zamhatch Limited Zambia 34,924 22,488 29,987 4,864
Total at the end of 30 September 2018 198,462 150,027 254,478 (1,076)
2019 2018
Name of company ZMW’000s USD’000s ZMW’000s USD’000s
Zambeef Retailing Limited 31 2 31 3
Zamleather Limited 1,477 112 1,477 121
Master Meat and Agro Production Co of Nigeria Limited 216 16 216 17
Master Meat (Ghana) Limited 1,310 99 1,310 107
Masterpork Limited 26,601 2,015 26,601 2,173
Zampalm Limited (note 15 (e)) - - - -
Zam Chick Limited 158,230 11,988 158,230 12,927
Zamhatch Limited 57,942 4,390 57,942 4,734
245,807 18,622 245,807 20,082
d) In the opinion of the Directors, the value of the company’s interests in the subsidiary companies is not less than the amounts at which they are stated in these financial statements.
(e) As at the reporting date, the Group has a 10% equity interest in Zampalm Limited.
The company has significant influence over Zampalm in that, it has a management contract and it is responsible for day to day management of Zampalm. The investment is accounted for using the equity method.
Summarised financial information of the Group’s share in the associate is as follows:
2019 2018
ZMW’000s USD’000s ZMW’000s USD’000s
Opening balance 15,412 1,259 - -
Arising during the year - - 16,154 1,334
Loss from continuing operation (3,036) (246) (742) (75)
Foreign exchange difference - (75) - -
Total comprehensive income (3,036) (321) (742) (75)
Carrying amount of the Group’s interest 12,376 938 15,412 1,259
15. Investments in subsidiaries, associates and minority interests (continued)

90 Zambeef Products PLC Annual Report 2019
Notes to the Financial Statements (continued)
For the year ended 30 September 2019
16. (a) Biological assets – GroupBiological assets comprise standing crops, feedlot cattle, dairy cattle, pigs and chickens. At 30 September 2019 there were 12,335 cattle (9,229 feedlot cattle and 3,106 dairy cattle) and 900,349 chickens (587,815 layers and 312,534 broilers), and 5,014 pigs. A total of 43,711 feedlot cattle, 642 dairy cattle, 9,430 pigs and 7,997,076 chickens were culled during the year.
(i) In Zambian Kwacha
As at 1 October
ZMW’000s
Increase due to
purchases ZMW’000s
Gains/(losses)
arising from fair value
attributable to physical
changes ZMW’000s
Gains arising from
fair value attributable
to price changes
ZMW’000s
Decrease due to
harvest/transferred
to inventoryZMW’000s
As at 30 SeptemberZMW’000s
Standing Crops 42,419 384,077 178,652 6,097 (583,985) 27,260
Feedlot Cattle 56,750 312,626 158,018 2,019 (486,535) 42,878
Dairy Cattle 48,336 67,939 140,024 - (206,532) 49,767
Pigs 4,431 10,637 2,237 122 (12,872) 4,555
Chickens 29,738 297,042 134,586 2,046 (417,455) 45,957
Total 181,674 1,072,321 613,517 10,284 (1,707,379) 170,417
(ii) In US Dollars
As at 1 October
USD’000s
Foreign exchange USD’000s
Increase due to
purchases USD’000s
Gains/(losses)
arising from fair value
attributable to physical
changes USD’000s
Gains arising from
fair value attributable
to price changes
USD’000s
Decrease due to
harvest/transferred
to inventory USD’000s
As at 30 September USD’000s
Standing Crops 3,466 (169) 31,175 14,501 495 (47,402) 2,066
Feedlot Cattle 4,636 (263) 25,375 12,826 164 (39,491) 3,247
Dairy Cattle 3,949 (295) 5,515 11,366 - (16,764) 3,771
Pigs 362 (27) 863 182 10 (1,046) 344
Chickens 2,430 (265) 24,111 10,924 166 (33,884) 3,482
Total 14,843 (1,019) 87,039 49,799 835 (138,587) 12,910
16. (b) Biological assets – CompanyBiological assets comprise standing crops, feedlot cattle, dairy cattle, and chickens. At 30 September 2019 there were 12,335 cattle (9,229 feedlot cattle and 3,106 dairy cattle), and 352,673 chickens (352,673 layers). A total of 43,711 feedlot cattle and 642 dairy cattle were culled during the year.
(i) In Zambian Kwacha
As at 1 October
ZMW’000s
Increase due to
purchases ZMW’000s
Gains/(losses)
arising from fair value
attributable to physical
changes ZMW’000s
Gains arising from
fair value attributable
to price changes
ZMW’000s
Decrease due to
harvest/transferred
to inventory ZMW’000s
As at 30 SeptemberZMW’000s
Standing Crops 42,419 384,077 178,652 6,097 (583,985) 27,260
Feedlot Cattle 56,751 312,626 158,018 2,019 (486,536) 42,878
Dairy Cattle 48,336 67,939 140,024 - (206,532) 49,767
Chickens 10,843 37,821 23,811 2,046 (57,211) 17,310
Total 158,349 802,463 500,505 10,162 (1,334,264) 137,215
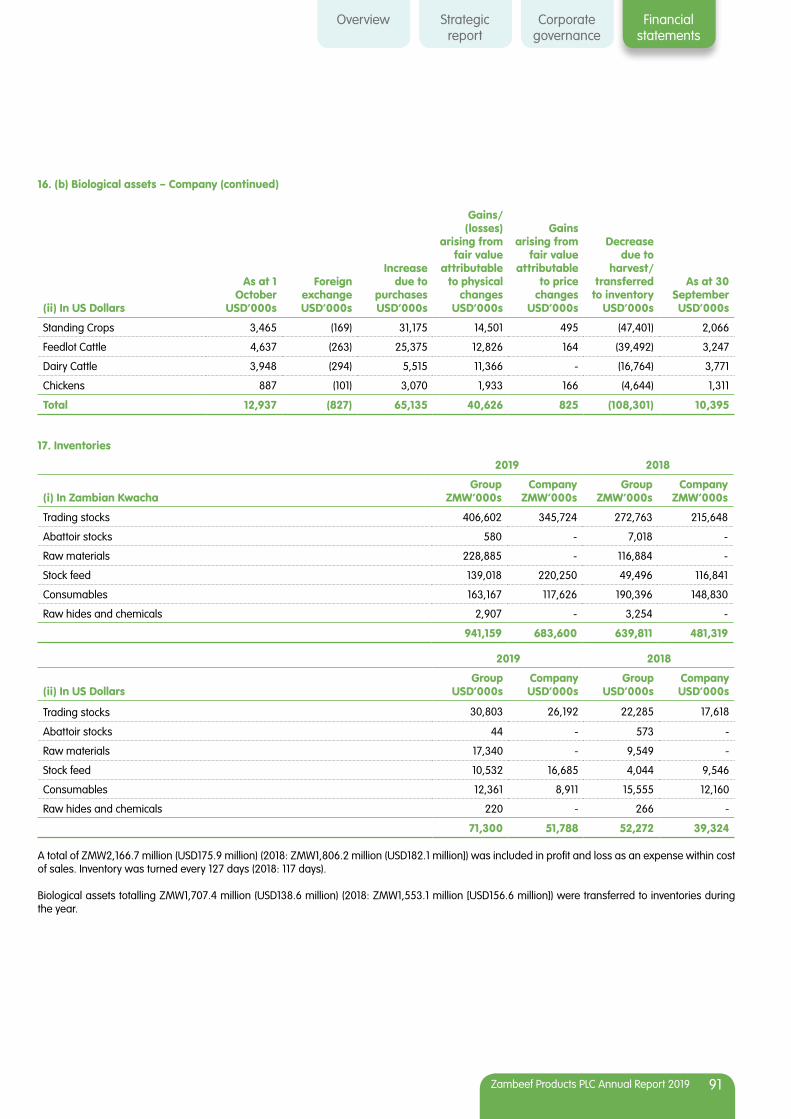
Overview Strategicreport
Corporategovernance
Financialstatements
Zambeef Products PLC Annual Report 2019 91
(ii) In US Dollars
As at 1 October
USD’000s
Foreign exchangeUSD’000s
Increase due to
purchasesUSD’000s
Gains/(losses)
arising from fair value
attributable to physical
changes USD’000s
Gains arising from
fair value attributable
to price changes
USD’000s
Decrease due to
harvest/transferred
to inventoryUSD’000s
As at 30 SeptemberUSD’000s
Standing Crops 3,465 (169) 31,175 14,501 495 (47,401) 2,066
Feedlot Cattle 4,637 (263) 25,375 12,826 164 (39,492) 3,247
Dairy Cattle 3,948 (294) 5,515 11,366 - (16,764) 3,771
Chickens 887 (101) 3,070 1,933 166 (4,644) 1,311
Total 12,937 (827) 65,135 40,626 825 (108,301) 10,395
17. Inventories
2019 2018
(i) In Zambian KwachaGroup
ZMW’000sCompany
ZMW’000sGroup
ZMW’000sCompany
ZMW’000s
Trading stocks 406,602 345,724 272,763 215,648
Abattoir stocks 580 - 7,018 -
Raw materials 228,885 - 116,884 -
Stock feed 139,018 220,250 49,496 116,841
Consumables 163,167 117,626 190,396 148,830
Raw hides and chemicals 2,907 - 3,254 -
941,159 683,600 639,811 481,319
2019 2018
(ii) In US DollarsGroup
USD’000sCompany USD’000s
Group USD’000s
Company USD’000s
Trading stocks 30,803 26,192 22,285 17,618
Abattoir stocks 44 - 573 -
Raw materials 17,340 - 9,549 -
Stock feed 10,532 16,685 4,044 9,546
Consumables 12,361 8,911 15,555 12,160
Raw hides and chemicals 220 - 266 -
71,300 51,788 52,272 39,324
A total of ZMW2,166.7 million (USD175.9 million) (2018: ZMW1,806.2 million (USD182.1 million]) was included in profit and loss as an expense within cost of sales. Inventory was turned every 127 days (2018: 117 days).
Biological assets totalling ZMW1,707.4 million (USD138.6 million) (2018: ZMW1,553.1 million [USD156.6 million]) were transferred to inventories during the year.
16. (b) Biological assets – Company (continued)

92 Zambeef Products PLC Annual Report 2019
Notes to the Financial Statements (continued)
For the year ended 30 September 2019
18. Trade and other receivables
2019 2018
(i) In Zambian KwachaGroup
ZMW’000sCompany
ZMW’000sGroup
ZMW’000sCompany
ZMW’000s
Gross trade receivables 55,758 18,820 122,237 59,710
Less: provision for impairment of trade receivables (4,910) (1,913) (4,822) (1,331)
Trade receivables 50,848 16,907 117,415 58,379
Prepayments 18,024 11,246 13,444 33,002
Other receivables 29,153 - 25,455 -
98,025 28,153 156,314 91,381
2019 2018
(ii) In US DollarsGroup
USD’000Company USD’000
Group USD’000
Company USD’000
Gross trade receivables 4,224 1,426 9,987 4,878
Less: provision for impairment of trade receivables (372) (145) (394) (109)
Trade receivables 3,852 1,281 9,593 4,769
Prepayments 1,364 852 1,098 2,697
Other receivables 2,210 - 2,080 -
7,426 2,133 12,771 7,466
(a) Provision for impairment of trade receivables The Directors have made a provision against some of the trade receivables that are long standing. Before accepting any new customer, the Group
assesses the potential customer’s credit quality and defines credit limits by customer.
The fair value of these short term financial assets is not individually determined as the carrying amount is a reasonable approximation of fair value.
Movements on the Group’s provision for impairment of trade receivables are set out in the table below:
2019 2018
(i) In Zambian KwachaGroup
ZMW’000sCompany
ZMW’000sGroup
ZMW’000sCompany
ZMW’000s
At 1 October 4,822 1,331 4,786 2,254
Utilised (1,113) (70) (2,827) (1,128)
Charge for the year 1,201 652 2,863 205
At 30 September 4,910 1,913 4,822 1,331
2019 2018
(ii) In US DollarsGroup
USD’000sCompany USD’000s
Group USD’000s
Company USD’000s
At 1 October 394 109 466 233
Foreign exchange (29) (11) (76) (32)
Utilised (90) (6) (285) (113)
Charge for the year 97 53 289 21
At 30 September 372 145 394 109

Overview Strategicreport
Corporategovernance
Financialstatements
Zambeef Products PLC Annual Report 2019 93
Some of the unimpaired trade receivables are past due as at the reporting date. Financial assets past due but not impaired are shown below:
2019 2018
(i) In Zambian KwachaGroup
ZMW’000s Company
ZMW’000sGroup
ZMW’000sCompany
ZMW’000s
More than 3 months but not more than 6 months 2,147 315 2,345 341
More than 6 months but not more than a year - - - -
More than one year - - - -
Total 2,147 315 2,345 341
2019 2018
(ii) In US DollarsGroup
USD’000s Company USD’000s
Group USD’000s
Company USD’000s
More than 3 months but not more than 6 months 163 24 192 34
More than 6 months but not more than a year - - - -
More than one year - - - -
Total 163 24 192 34
Management reviews recoverability of trade receivables on a continuous basis and where necessary makes provision for impairment on long outstanding receivables.
The matrix for the calculation of the expected credit losses is as detailed below.
30 September 2019 Trade receivable days past due
Current More than More than More than Total
30 days 60 days 90 days
Expected credit loss rate 2.5% 4.7% 17.1% 60.1%
Gross carrying amount - ZMW'000 45,719 774 4,268 4,998 55,758
Lifetime expected credit loss - ZMW'000 1,137 36 731 3,006 4,910
1 October 2018 Trade receivable days past due
Current More than More than More than Total
30 days 60 days 90 days
Expected credit loss rate 1.5% 4.5% 11.4% 63.6%
Gross carrying amount - ZMW'000 105,912 8,670 3,811 3,843 122,237
Lifetime expected credit loss - ZMW'000 1,552 388 435 2,447 4,822
30 September 2019 Trade receivable days past due
Current More than More than More than Total
30 days 60 days 90 days
Expected credit loss rate 2.5% 4.7% 17.1% 60.1%
Gross carrying amount - USD'000 3,464 59 323 379 4,224
Lifetime expected credit loss - USD'000 86 3 55 228 372
1 October 2018 Trade receivable days past due
Current More than More than More than Total
30 days 60 days 90 days
Expected credit loss rate 1.5% 4.5% 11.4% 63.6%
Gross carrying amount - USD'000 8,653 708 311 314 9,987
Lifetime expected credit loss - USD'000 127 32 36 200 394
18. Trade and other receivables (continued)

94 Zambeef Products PLC Annual Report 2019
Notes to the Financial Statements (continued)
For the year ended 30 September 2019
19. Amounts due from related companies
2019 2018
(i) In Zambian KwachaGroup
ZMW’000s Company
ZMW’000sGroup
ZMW’000sCompany
ZMW’000s
Chisamba Ranching and Cropping 258 601 - -
Danny Museteka 70 70 - -
Tractorzam Limited - - 1,321 1,321
Tembilo Farms Limited 59 - 174 -
Wellspring Limited 5,624 5,624 889 889
Lilian Limbuka 508 - - -
Zamleather Limited - 40,154 - 19,821
Zampalm Limited 35,035 20,184 47,888 32,732
Master Meat & Agro Production Co. of Nigeria Limited - 60,977 - 60,168
Zam Chick Limited - 534,335 - 421,639
Master Meat (Ghana) Limited - 2,728 - 2,076
Zamhatch Limited - 414,072 - 257,860
41,554 1,078,745 50,272 796,506
2019 2018
(ii) In US DollarsGroup
USD’000sCompany USD’000s
Group USD’000s
Company USD’000s
Chisamba Ranching and Cropping 20 45 - -
Tractorzam Limited - - 108 108
Danny Museteka 5 5
Tembilo Farms Limited 4 14 -
Wellspring Limited 427 427 73 73
Lilian Limbuka 38 - - -
Zamleather Limited - 3,042 - 1,619
Zampalm Limited 2,654 1,529 3,912 2,674
Zam Chick Limited - 40,479 - 34,448
Mastermeat & Agro Production Co. of Nigeria Limited - 4,619 - 4,915
Master Meat (Ghana) Limited - 207 - 169
Zamhatch Limited - 31,369 - 21,067
3,148 81,722 4,107 65,073
The above balances relate to arm’s length transactions between the transacting parties. External parties that fall under the ‘Related Party’ disclosure is with respect to all common shareholding companies of the Board of Directors of the Group. Unless otherwise stated, none of the transactions incorporate special terms and conditions and no guarantees were given or received. Outstanding balances are usually settled in cash.
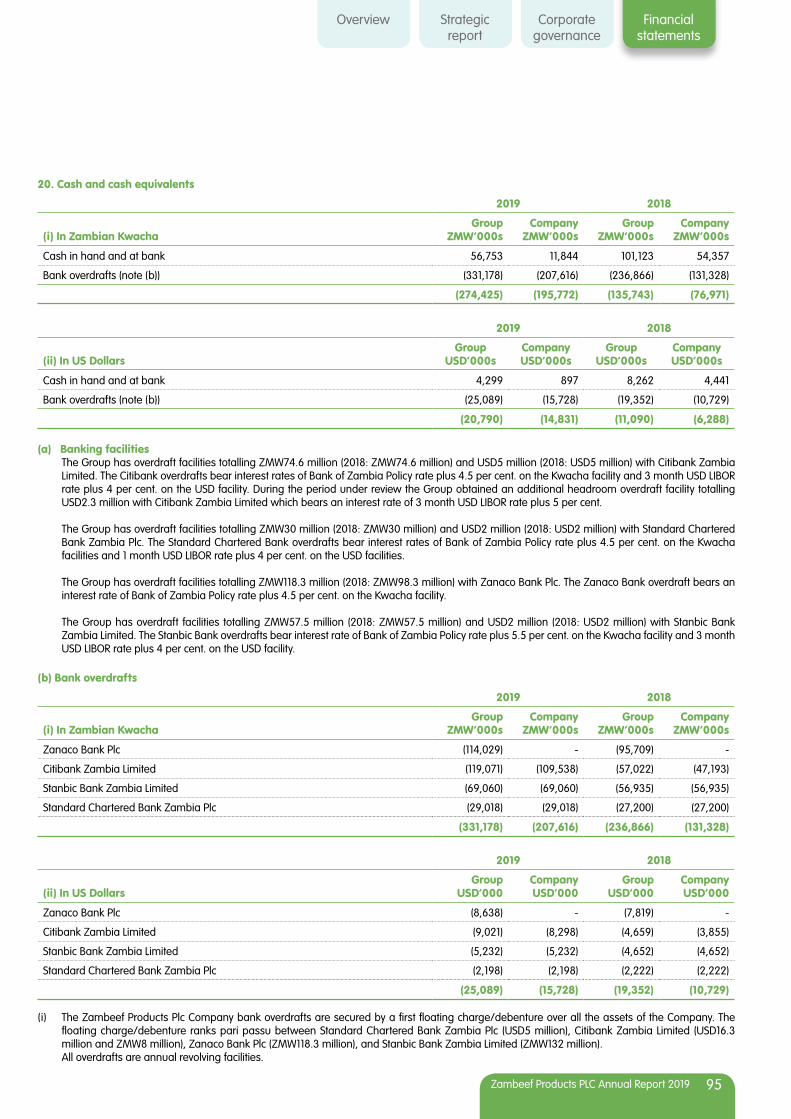
Overview Strategicreport
Corporategovernance
Financialstatements
Zambeef Products PLC Annual Report 2019 95
20. Cash and cash equivalents
2019 2018
(i) In Zambian KwachaGroup
ZMW’000sCompany
ZMW’000sGroup
ZMW’000sCompany
ZMW’000s
Cash in hand and at bank 56,753 11,844 101,123 54,357
Bank overdrafts (note (b)) (331,178) (207,616) (236,866) (131,328)
(274,425) (195,772) (135,743) (76,971)
2019 2018
(ii) In US DollarsGroup
USD’000sCompany USD’000s
Group USD’000s
Company USD’000s
Cash in hand and at bank 4,299 897 8,262 4,441
Bank overdrafts (note (b)) (25,089) (15,728) (19,352) (10,729)
(20,790) (14,831) (11,090) (6,288)
(a) Banking facilities The Group has overdraft facilities totalling ZMW74.6 million (2018: ZMW74.6 million) and USD5 million (2018: USD5 million) with Citibank Zambia
Limited. The Citibank overdrafts bear interest rates of Bank of Zambia Policy rate plus 4.5 per cent. on the Kwacha facility and 3 month USD LIBOR rate plus 4 per cent. on the USD facility. During the period under review the Group obtained an additional headroom overdraft facility totalling USD2.3 million with Citibank Zambia Limited which bears an interest rate of 3 month USD LIBOR rate plus 5 per cent.
The Group has overdraft facilities totalling ZMW30 million (2018: ZMW30 million) and USD2 million (2018: USD2 million) with Standard Chartered Bank Zambia Plc. The Standard Chartered Bank overdrafts bear interest rates of Bank of Zambia Policy rate plus 4.5 per cent. on the Kwacha facilities and 1 month USD LIBOR rate plus 4 per cent. on the USD facilities.
The Group has overdraft facilities totalling ZMW118.3 million (2018: ZMW98.3 million) with Zanaco Bank Plc. The Zanaco Bank overdraft bears an interest rate of Bank of Zambia Policy rate plus 4.5 per cent. on the Kwacha facility.
The Group has overdraft facilities totalling ZMW57.5 million (2018: ZMW57.5 million) and USD2 million (2018: USD2 million) with Stanbic Bank Zambia Limited. The Stanbic Bank overdrafts bear interest rate of Bank of Zambia Policy rate plus 5.5 per cent. on the Kwacha facility and 3 month USD LIBOR rate plus 4 per cent. on the USD facility.
(b) Bank overdrafts
2019 2018
(i) In Zambian KwachaGroup
ZMW’000sCompany
ZMW’000sGroup
ZMW’000sCompany
ZMW’000s
Zanaco Bank Plc (114,029) - (95,709) -
Citibank Zambia Limited (119,071) (109,538) (57,022) (47,193)
Stanbic Bank Zambia Limited (69,060) (69,060) (56,935) (56,935)
Standard Chartered Bank Zambia Plc (29,018) (29,018) (27,200) (27,200)
(331,178) (207,616) (236,866) (131,328)
2019 2018
(ii) In US DollarsGroup
USD’000Company USD’000
Group USD’000
Company USD’000
Zanaco Bank Plc (8,638) - (7,819) -
Citibank Zambia Limited (9,021) (8,298) (4,659) (3,855)
Stanbic Bank Zambia Limited (5,232) (5,232) (4,652) (4,652)
Standard Chartered Bank Zambia Plc (2,198) (2,198) (2,222) (2,222)
(25,089) (15,728) (19,352) (10,729)
(i) The Zambeef Products Plc Company bank overdrafts are secured by a first floating charge/debenture over all the assets of the Company. The floating charge/debenture ranks pari passu between Standard Chartered Bank Zambia Plc (USD5 million), Citibank Zambia Limited (USD16.3 million and ZMW8 million), Zanaco Bank Plc (ZMW118.3 million), and Stanbic Bank Zambia Limited (ZMW132 million).
All overdrafts are annual revolving facilities.

96 Zambeef Products PLC Annual Report 2019
Notes to the Financial Statements (continued)
For the year ended 30 September 2019
21. Share capital
(a) Ordinary share capital
2019 2018
ZMW’000s USD’000s ZMW’000s USD’000s
Authorised
700,000,000 ordinary shares of ZMW0.01 each 7,000 938 7,000 938
(2018: 700,000,000 ordinary shares of ZMW0.01 each)
Issued and fully paid
At 1 October 3,006 449 3,006 449
Issued during the year - - - -
At 30 September
300,579,630 ordinary shares of ZMW0.01 each 3,006 449 3,006 449
(2018: 300,579,630 ordinary shares of ZMW0.01 each)
(b) Preference share capital
Issued and fully paid
At 1 October 1,000 100 1,000 100
Issued during the year - - - -
At 30 September
100,057,658 preference shares of ZMW0.01 each 1,000 100 1,000 100
(2018: 100,057,658 preference shares of ZMW0.01 each)
The preference shares are convertible in whole or in part by CDC into ordinary shares on a one-for-one basis for the first eight years and thereafter on a basis of 3.0833 ordinary shares for each preference share. These shares have four voting rights for every five preference shares held.
Zambeef has the right to redeem all or part of the preference shares at the redemption price, which will give CDC a 12% compounded return on investment.
The zero-coupon preference shares pay a dividend only if a dividend is paid to ordinary shareholders, and in such cases, the dividend per share will be the same as that for ordinary shares.
22. Share premium
2019 2018
ZMW’000s USD’000s ZMW’000s USD’000s
At 1 October 1,125,012 185,095 1,125,012 185,095
Arising during the year - - - -
At 30 September 1,125,012 185,095 1,125,012 185,095
Proceeds received in addition to the nominal value of the shares issued have been included in share premium.
Notes to the Financial Statements (continued)
For the year ended 30 September 2019
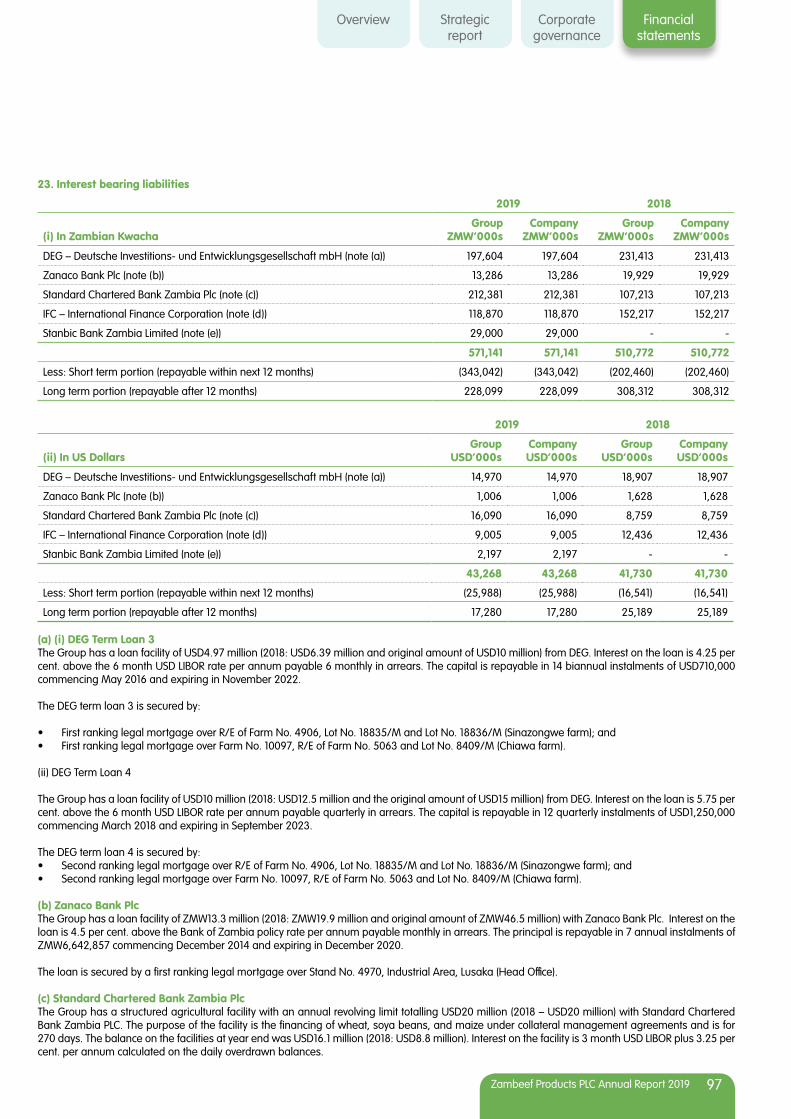
Overview Strategicreport
Corporategovernance
Financialstatements
Zambeef Products PLC Annual Report 2019 97
23. Interest bearing liabilities
2019 2018
(i) In Zambian KwachaGroup
ZMW’000sCompany
ZMW’000sGroup
ZMW’000sCompany
ZMW’000s
DEG – Deutsche Investitions- und Entwicklungsgesellschaft mbH (note (a)) 197,604 197,604 231,413 231,413
Zanaco Bank Plc (note (b)) 13,286 13,286 19,929 19,929
Standard Chartered Bank Zambia Plc (note (c)) 212,381 212,381 107,213 107,213
IFC – International Finance Corporation (note (d)) 118,870 118,870 152,217 152,217
Stanbic Bank Zambia Limited (note (e)) 29,000 29,000 - -
571,141 571,141 510,772 510,772
Less: Short term portion (repayable within next 12 months) (343,042) (343,042) (202,460) (202,460)
Long term portion (repayable after 12 months) 228,099 228,099 308,312 308,312
2019 2018
(ii) In US DollarsGroup
USD’000sCompany USD’000s
Group USD’000s
Company USD’000s
DEG – Deutsche Investitions- und Entwicklungsgesellschaft mbH (note (a)) 14,970 14,970 18,907 18,907
Zanaco Bank Plc (note (b)) 1,006 1,006 1,628 1,628
Standard Chartered Bank Zambia Plc (note (c)) 16,090 16,090 8,759 8,759
IFC – International Finance Corporation (note (d)) 9,005 9,005 12,436 12,436
Stanbic Bank Zambia Limited (note (e)) 2,197 2,197 - -
43,268 43,268 41,730 41,730
Less: Short term portion (repayable within next 12 months) (25,988) (25,988) (16,541) (16,541)
Long term portion (repayable after 12 months) 17,280 17,280 25,189 25,189
(a) (i) DEG Term Loan 3The Group has a loan facility of USD4.97 million (2018: USD6.39 million and original amount of USD10 million) from DEG. Interest on the loan is 4.25 per cent. above the 6 month USD LIBOR rate per annum payable 6 monthly in arrears. The capital is repayable in 14 biannual instalments of USD710,000 commencing May 2016 and expiring in November 2022.
The DEG term loan 3 is secured by:
• First ranking legal mortgage over R/E of Farm No. 4906, Lot No. 18835/M and Lot No. 18836/M (Sinazongwe farm); and• First ranking legal mortgage over Farm No. 10097, R/E of Farm No. 5063 and Lot No. 8409/M (Chiawa farm).
(ii) DEG Term Loan 4
The Group has a loan facility of USD10 million (2018: USD12.5 million and the original amount of USD15 million) from DEG. Interest on the loan is 5.75 per cent. above the 6 month USD LIBOR rate per annum payable quarterly in arrears. The capital is repayable in 12 quarterly instalments of USD1,250,000 commencing March 2018 and expiring in September 2023.
The DEG term loan 4 is secured by:• Second ranking legal mortgage over R/E of Farm No. 4906, Lot No. 18835/M and Lot No. 18836/M (Sinazongwe farm); and• Second ranking legal mortgage over Farm No. 10097, R/E of Farm No. 5063 and Lot No. 8409/M (Chiawa farm).
(b) Zanaco Bank PlcThe Group has a loan facility of ZMW13.3 million (2018: ZMW19.9 million and original amount of ZMW46.5 million) with Zanaco Bank Plc. Interest on the loan is 4.5 per cent. above the Bank of Zambia policy rate per annum payable monthly in arrears. The principal is repayable in 7 annual instalments of ZMW6,642,857 commencing December 2014 and expiring in December 2020.
The loan is secured by a first ranking legal mortgage over Stand No. 4970, Industrial Area, Lusaka (Head Office).
(c) Standard Chartered Bank Zambia PlcThe Group has a structured agricultural facility with an annual revolving limit totalling USD20 million (2018 – USD20 million) with Standard Chartered Bank Zambia PLC. The purpose of the facility is the financing of wheat, soya beans, and maize under collateral management agreements and is for 270 days. The balance on the facilities at year end was USD16.1 million (2018: USD8.8 million). Interest on the facility is 3 month USD LIBOR plus 3.25 per cent. per annum calculated on the daily overdrawn balances.

98 Zambeef Products PLC Annual Report 2019
Notes to the Financial Statements (continued)
For the year ended 30 September 2019
(d) International Finance Corporation Loan 2The Group has a loan facility of USD7.6 million and ZMW18.8 million (2018: USD10.3 million and ZMW25.7 million and original amount of USD20 million and ZMW49.6 million). Interest on the loan is 4.75 per cent. above the 6 month USD LIBOR rate per annum for the USD facility and 4.45 per cent. above the 91 day Treasury Bill rate plus a variable swap margin for the Kwacha facility payable quarterly in arrears. The principal is repayable in 29 equal quarterly instalments of USD689,655 and ZMW1,710,345 commencing June 2015 and expiring in June 2022.
The loan is secured through a first ranking legal mortgage over R/E of Farm No. 4450, R/E of Farm No. 4451 & R/E of Farm No. 5388 (Mpongwe farm).
(e) Stanbic Bank Zambia LimitedDuring the period under review the Group obtained a seasonal loan facility with an annual revolving limit totalling ZMW29 million from Stanbic Bank Zambia Limited. The balance on the facility at year end was ZMW29 million. Interest on the facility is 5.75 per cent. above the Bank of Zambia policy rate per annum payable monthly in arrears.This facility is secured by a first floating charge/debenture over all the assets of the Company. The floating charge/debenture ranks pari passu between Standard Chartered Bank Zambia Plc (USD5 million), Citibank Zambia Limited (USD16.3 million and ZMW8 million), Zanaco Bank Plc (ZMW118.3 million), and Stanbic Bank Zambia Limited (ZMW132 million).
24. Obligations under finance leases
2019 2018
(i) In Zambian KwachaGroup
ZMW’000sCompany
ZMW’000sGroup
ZMW’000sCompany
ZMW’000s
Freddy Hirsch Group Zambia Limited (note (a)) 11,013 - 14,067 -
Stanbic Bank Zambia Limited (note (b)) 29,771 29,771 24,344 24,344
40,784 29,771 38,411 24,344
Less: Payable within 12 months (21,487) (18,266) (18,248) (11,841)
Repayable after 12 months 19,297 11,505 20,163 12,503
2019 2018
(ii) In US DollarsGroup
USD’000sCompany USD’000s
Group USD’000s
Company USD’000s
Freddy Hirsch Group Zambia Limited (note (a)) 835 - 1,149 -
Stanbic Bank Zambia Limited (note (b)) 2,255 2,256 1,989 1,989
3,090 2,256 3,138 1,989
Less: Payable within 12 months (1,628) (1,384) (1,491) (967)
Repayable after 12 months 1,462 872 1,647 1,022
The ageing for the finance leases is as detailed below:
(i) In Zambian Kwacha
Within 1 year
ZMW’000s1 to 5 years ZMW’000s
After 5 years
ZMW’000sTotal
ZMW’000s
2019
Lease payments 22,018 20,295 - 42,313
Finance charges (531) (998) - (1,529)
Net present values 21,487 19,297 - 40,784
2018
Lease payments 18,678 21,179 - 39,857
Finance charges (430) (1,016) - (1,446)
Net present values 18,248 20,163 - 38,411
23. Interest bearing liabilities (continued)
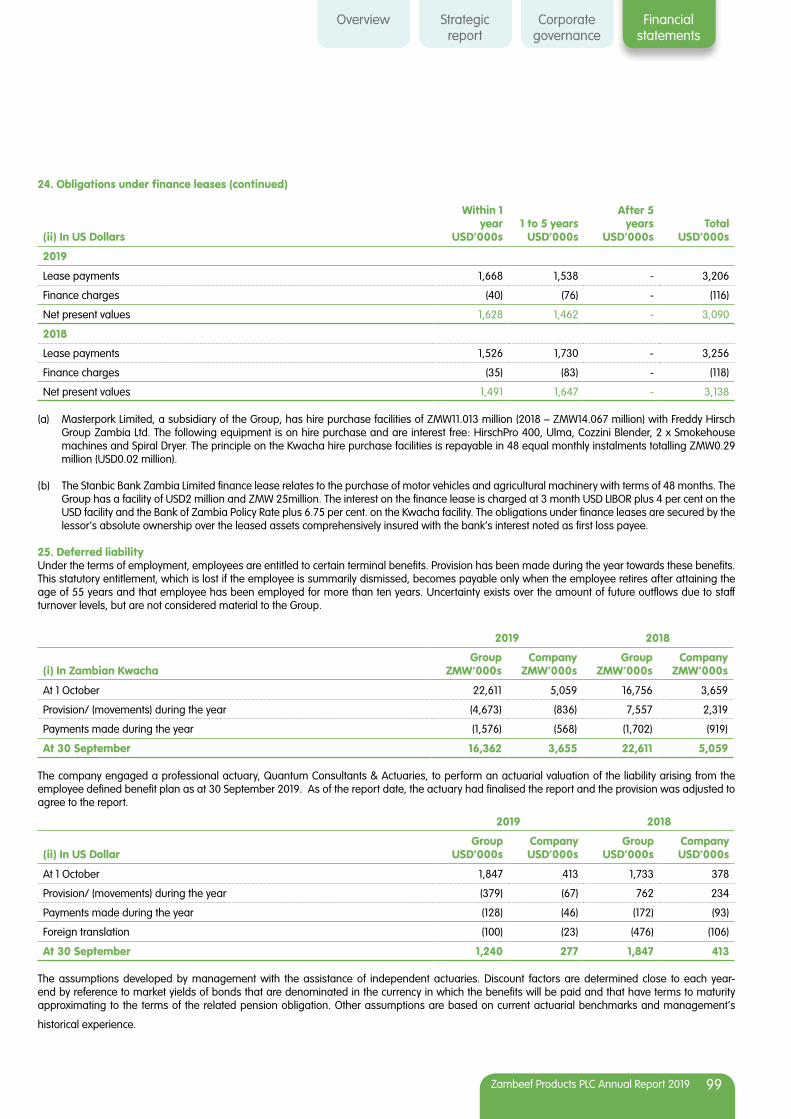
Overview Strategicreport
Corporategovernance
Financialstatements
Zambeef Products PLC Annual Report 2019 99
(ii) In US Dollars
Within 1 year
USD’000s1 to 5 years
USD’000s
After 5 years
USD’000sTotal
USD’000s
2019
Lease payments 1,668 1,538 - 3,206
Finance charges (40) (76) - (116)
Net present values 1,628 1,462 - 3,090
2018
Lease payments 1,526 1,730 - 3,256
Finance charges (35) (83) - (118)
Net present values 1,491 1,647 - 3,138
(a) Masterpork Limited, a subsidiary of the Group, has hire purchase facilities of ZMW11.013 million (2018 – ZMW14.067 million) with Freddy Hirsch Group Zambia Ltd. The following equipment is on hire purchase and are interest free: HirschPro 400, Ulma, Cozzini Blender, 2 x Smokehouse machines and Spiral Dryer. The principle on the Kwacha hire purchase facilities is repayable in 48 equal monthly instalments totalling ZMW0.29 million (USD0.02 million).
(b) The Stanbic Bank Zambia Limited finance lease relates to the purchase of motor vehicles and agricultural machinery with terms of 48 months. The Group has a facility of USD2 million and ZMW 25million. The interest on the finance lease is charged at 3 month USD LIBOR plus 4 per cent on the USD facility and the Bank of Zambia Policy Rate plus 6.75 per cent. on the Kwacha facility. The obligations under finance leases are secured by the lessor’s absolute ownership over the leased assets comprehensively insured with the bank’s interest noted as first loss payee.
25. Deferred liabilityUnder the terms of employment, employees are entitled to certain terminal benefits. Provision has been made during the year towards these benefits. This statutory entitlement, which is lost if the employee is summarily dismissed, becomes payable only when the employee retires after attaining the age of 55 years and that employee has been employed for more than ten years. Uncertainty exists over the amount of future outflows due to staff turnover levels, but are not considered material to the Group.
2019 2018
(i) In Zambian KwachaGroup
ZMW’000sCompany
ZMW’000sGroup
ZMW’000sCompany
ZMW’000s
At 1 October 22,611 5,059 16,756 3,659
Provision/ (movements) during the year (4,673) (836) 7,557 2,319
Payments made during the year (1,576) (568) (1,702) (919)
At 30 September 16,362 3,655 22,611 5,059
The company engaged a professional actuary, Quantum Consultants & Actuaries, to perform an actuarial valuation of the liability arising from the employee defined benefit plan as at 30 September 2019. As of the report date, the actuary had finalised the report and the provision was adjusted to agree to the report.
2019 2018
(ii) In US DollarGroup
USD’000sCompany USD’000s
Group USD’000s
Company USD’000s
At 1 October 1,847 413 1,733 378
Provision/ (movements) during the year (379) (67) 762 234
Payments made during the year (128) (46) (172) (93)
Foreign translation (100) (23) (476) (106)
At 30 September 1,240 277 1,847 413
The assumptions developed by management with the assistance of independent actuaries. Discount factors are determined close to each year-end by reference to market yields of bonds that are denominated in the currency in which the benefits will be paid and that have terms to maturity approximating to the terms of the related pension obligation. Other assumptions are based on current actuarial benchmarks and management’s
historical experience.
24. Obligations under finance leases (continued)

100 Zambeef Products PLC Annual Report 2019
Notes to the Financial Statements (continued)
For the year ended 30 September 2019
2019 2018
(ii) In US DollarGroup
USD’000sCompany USD’000s
Group USD’000s
Company USD’000s
Defined benefit obligation 1 October 22,611 1,847 16,756 1,733
Current service cost before deduction of beneficiary contributions 887 72 1,300 131
Interest expense 3,850 313 3,313 334
Remeasurement - actuarial losses from changes in demographic assumptions - - - -
Remeasurement - actuarial losses from changes in financial assumptions (3,097) (251) 3,113 314
Experience (gains)/Losses (5,731) (465) (1,061) (107)
Benefits paid (2,158) (175) (810) (82)
Translation Difference (101) (476)
Past Service cost - - -
Defined benefit obligation 30 September 16,362 1,240 22,611 1,847
Unfunded - - - -
Partly or wholly funded 16,362 1,240 22,611 1,847
The significant acturial assumptions for the determination of the defined obligation are the discount rate, the salary growth rate and the average life
expectancy. The assumptions used for the valuation of the defined benefit obligation are as follows:
30September
30September
2019 2018
Discount rate at date shown 20% 17.50%
Salary growth rate 14.50% 14.50%
Average life expectancies:
- 25 years of age at reporting date 47% 47%
- 30 years of age at reporting date 57% 57%
- 35 years of age at reporting date 66% 66%
- 40 years of age at reporting date 72% 72%
- 45 years of age at reporting date 78% 78%
- 50 years of age at reporting date 86% 86%
2019 ZMW’000s
2019 USD’000s
2018 ZMW’000s
2018 USD’000s
Current service cost 887 72 1,300 131
Past service cost - - - -
Net interest expenses 3,850 313 3,313 334
Total expenses recognised in profit or loss 4,737 385 4,613 465
Amounts recognised in other comprehensive income related to the group’s defined benefit plan are as follows;
25. Deferred liability (continued)

Overview Strategicreport
Corporategovernance
Financialstatements
Zambeef Products PLC Annual Report 2019 101
2019 ZMW’000s
2019 USD’000s
2018 ZMW’000s
2018 USD’000s
Actuarial losses from changes in demographic assumptions - - - -
Actuarial losses from changes in financial assumptions (3,097) (251) 3,113 314
Experience (gains)/losses (5,731) (465) (1,061) (107)
Return on plan assets (excluding amounts included in net interest) 0 0
Total expenses recognised in other comprehensive income (8,829) (717) 2,052 207
26. Trade and other payables
2019 2018
(i) In Zambian KwachaGroup
ZMW’000sCompany
ZMW’000sGroup
ZMW’000sCompany
ZMW’000s
Trade payables 233,245 152,362 241,715 162,644
Accruals 26,340 6,142 55,675 42,031
259,585 158,504 297,390 204,675
2019 2018
(ii) In US DollarsGroup
USD’000sCompany USD’000s
Group USD’000s
Company USD’000s
Trade payables 17,670 11,543 19,747 13,288
Accruals 1,995 465 4,547 3,434
19,665 12,008 24,294 16,722
The average credit period taken in 2019 was 33 days (2018: 47 days).
All amounts shown under trade and other payables fall due for payment within one year. The carrying value of trade and other payables are considered to be a reasonable approximation of fair value.
27. Provisions
StaffZMW’000
OthersZMW’000
TotalZMW’000
StaffUSD’000
Others
USD’000Total
ZMW’000s
Group
Carrying amount 1 October 2018 39,188 2,949 42,137 3,202 241 3,443
Additional provisions 30,367 113,743 144,110 2,465 9,232 11,697
Amount utilised (21,964) (111,369) (133,333) (1,783) (9,040) (10,823)
Foreign translation - - - (278) (30) (308)
Carrying amount 30 September 2019 47,591 5,323 52,914 3,606 403 4,009
Company
Carrying amount 1 October 2018 10,971 15,137 26,108 896 1,236 2,132
Foreign translation - - - (156) (76) (232)
Additional provisions 23,818 92,305 116,123 1,933 7,492 9,425
Amount utilised (6,950) (94,819) (101,769) (564) (7,696) (8,260)
Carrying amount 30 September 2019 27,839 12,623 40,462 2,109 956 3,065
Staff provisions relate to gratuity, leave pay and other related claims. Other provisions relate to suppliers’ claims for goods and services provided.
25. Deferred liability (continued)
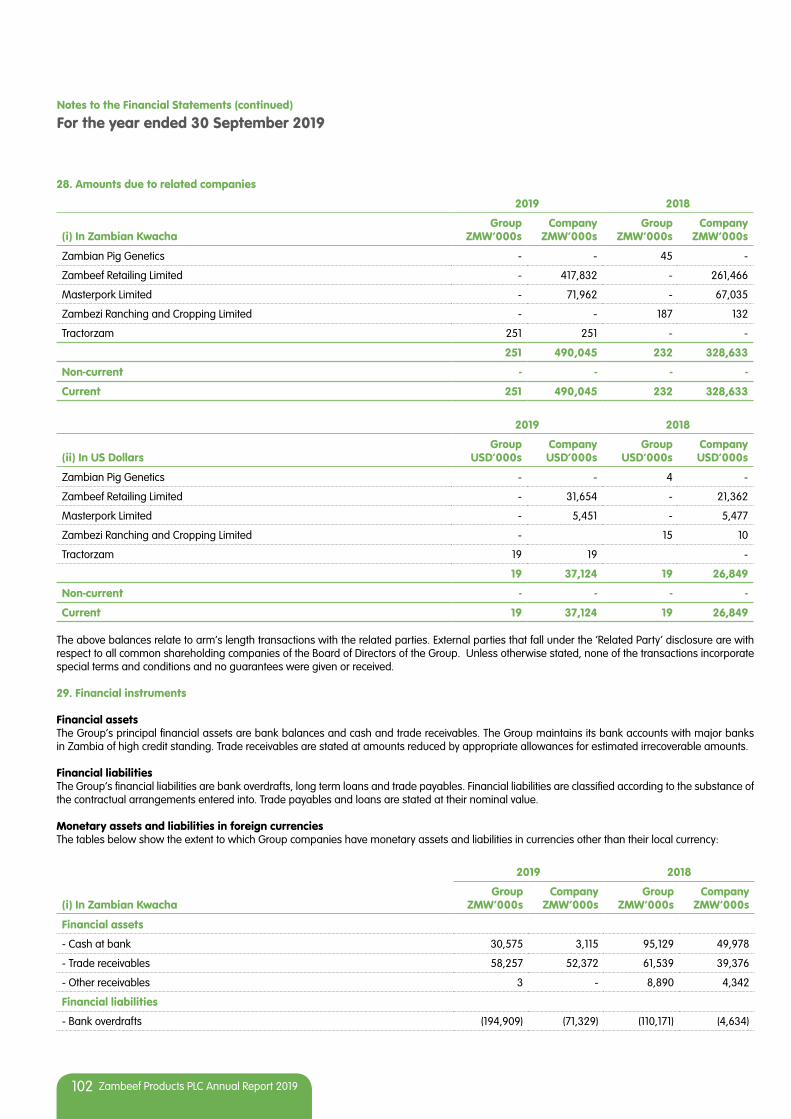
102 Zambeef Products PLC Annual Report 2019
Notes to the Financial Statements (continued)
For the year ended 30 September 2019
28. Amounts due to related companies
2019 2018
(i) In Zambian KwachaGroup
ZMW’000sCompany
ZMW’000sGroup
ZMW’000sCompany
ZMW’000s
Zambian Pig Genetics - - 45 -
Zambeef Retailing Limited - 417,832 - 261,466
Masterpork Limited - 71,962 - 67,035
Zambezi Ranching and Cropping Limited - - 187 132
Tractorzam 251 251 - -
251 490,045 232 328,633
Non-current - - - -
Current 251 490,045 232 328,633
2019 2018
(ii) In US DollarsGroup
USD’000sCompany USD’000s
Group USD’000s
Company USD’000s
Zambian Pig Genetics - - 4 -
Zambeef Retailing Limited - 31,654 - 21,362
Masterpork Limited - 5,451 - 5,477
Zambezi Ranching and Cropping Limited - 15 10
Tractorzam 19 19 -
19 37,124 19 26,849
Non-current - - - -
Current 19 37,124 19 26,849
The above balances relate to arm’s length transactions with the related parties. External parties that fall under the ‘Related Party’ disclosure are with respect to all common shareholding companies of the Board of Directors of the Group. Unless otherwise stated, none of the transactions incorporate special terms and conditions and no guarantees were given or received.
29. Financial instruments
Financial assetsThe Group’s principal financial assets are bank balances and cash and trade receivables. The Group maintains its bank accounts with major banks in Zambia of high credit standing. Trade receivables are stated at amounts reduced by appropriate allowances for estimated irrecoverable amounts.
Financial liabilitiesThe Group’s financial liabilities are bank overdrafts, long term loans and trade payables. Financial liabilities are classified according to the substance of the contractual arrangements entered into. Trade payables and loans are stated at their nominal value.
Monetary assets and liabilities in foreign currenciesThe tables below show the extent to which Group companies have monetary assets and liabilities in currencies other than their local currency:
2019 2018
(i) In Zambian KwachaGroup
ZMW’000sCompany
ZMW’000sGroup
ZMW’000sCompany
ZMW’000s
Financial assets
- Cash at bank 30,575 3,115 95,129 49,978
- Trade receivables 58,257 52,372 61,539 39,376
- Other receivables 3 - 8,890 4,342
Financial liabilities
- Bank overdrafts (194,909) (71,329) (110,171) (4,634)
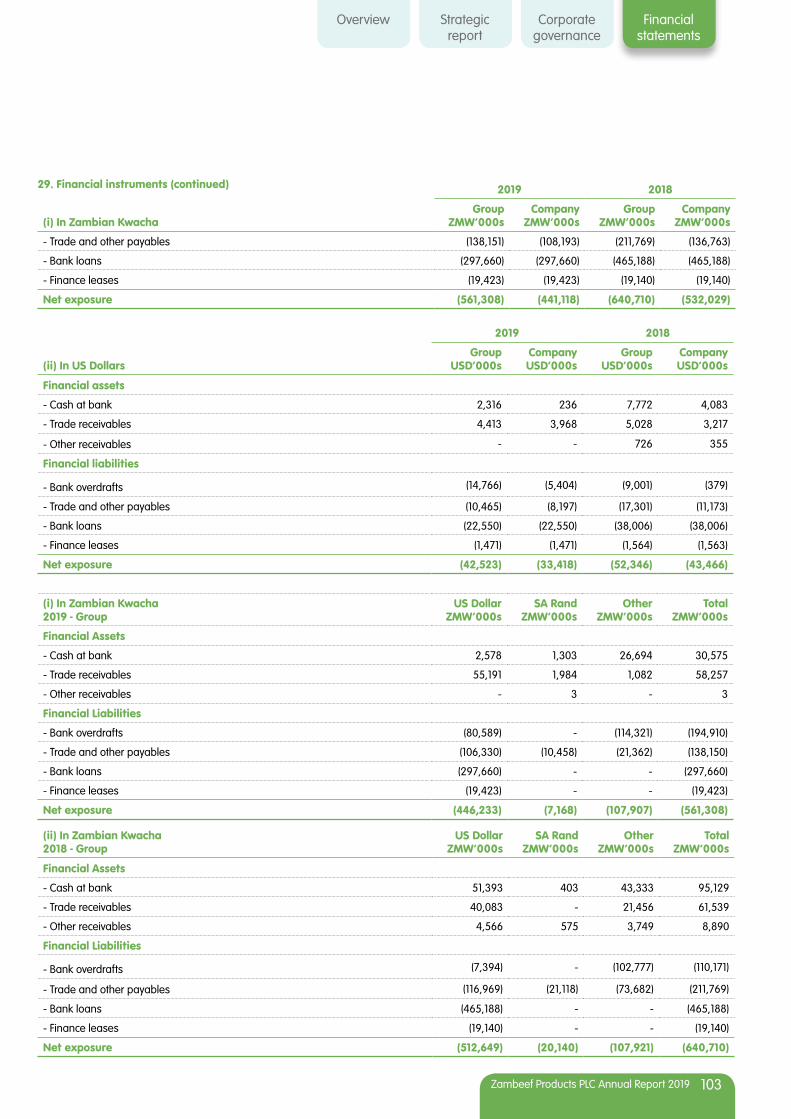
Overview Strategicreport
Corporategovernance
Financialstatements
Zambeef Products PLC Annual Report 2019 103
2019 2018
(i) In Zambian KwachaGroup
ZMW’000sCompany
ZMW’000sGroup
ZMW’000sCompany
ZMW’000s
- Trade and other payables (138,151) (108,193) (211,769) (136,763)
- Bank loans (297,660) (297,660) (465,188) (465,188)
- Finance leases (19,423) (19,423) (19,140) (19,140)
Net exposure (561,308) (441,118) (640,710) (532,029)
2019 2018
(ii) In US DollarsGroup
USD’000sCompany USD’000s
Group USD’000s
Company USD’000s
Financial assets
- Cash at bank 2,316 236 7,772 4,083
- Trade receivables 4,413 3,968 5,028 3,217
- Other receivables - - 726 355
Financial liabilities
- Bank overdrafts (14,766) (5,404) (9,001) (379)
- Trade and other payables (10,465) (8,197) (17,301) (11,173)
- Bank loans (22,550) (22,550) (38,006) (38,006)
- Finance leases (1,471) (1,471) (1,564) (1,563)
Net exposure (42,523) (33,418) (52,346) (43,466)
(i) In Zambian Kwacha2019 - Group
US Dollar ZMW’000s
SA Rand ZMW’000s
Other ZMW’000s
Total ZMW’000s
Financial Assets
- Cash at bank 2,578 1,303 26,694 30,575
- Trade receivables 55,191 1,984 1,082 58,257
- Other receivables - 3 - 3
Financial Liabilities
- Bank overdrafts (80,589) - (114,321) (194,910)
- Trade and other payables (106,330) (10,458) (21,362) (138,150)
- Bank loans (297,660) - - (297,660)
- Finance leases (19,423) - - (19,423)
Net exposure (446,233) (7,168) (107,907) (561,308)
(ii) In Zambian Kwacha2018 - Group
US Dollar ZMW’000s
SA Rand ZMW’000s
Other ZMW’000s
Total ZMW’000s
Financial Assets
- Cash at bank 51,393 403 43,333 95,129
- Trade receivables 40,083 - 21,456 61,539
- Other receivables 4,566 575 3,749 8,890
Financial Liabilities
- Bank overdrafts (7,394) - (102,777) (110,171)
- Trade and other payables (116,969) (21,118) (73,682) (211,769)
- Bank loans (465,188) - - (465,188)
- Finance leases (19,140) - - (19,140)
Net exposure (512,649) (20,140) (107,921) (640,710)
29. Financial instruments (continued)

104 Zambeef Products PLC Annual Report 2019
Notes to the Financial Statements (continued)
For the year ended 30 September 2019
(i) In US Dollars – Group - 2019 US Dollar USD’000s
SA Rand USD’000s
Other USD’000s
Total USD’000s
Financial Assets
- Cash at bank 195 99 2,022 2,316
- Trade receivables 4,181 150 82 4,413
- Other receivables - - - -
Financial Liabilities
- Bank overdrafts (6,105) - (8,661) (14,766)
- Trade and other payables (8,055) (792) (1,618) (10,465)
- Bank loans (22,550) - - (22,550)
- Finance leases (1,471) - - (1,471)
Net exposure (33,805) (543) (8,175) (42,523)
(ii) In US Dollars – Group - 2018 US Dollar USD’000s
SA Rand USD’000s
Other USD’000s
Total USD’000s
Financial Assets
- Cash at bank 4,199 33 3,540 7,772
- Trade receivables 3,275 - 1,753 5,028
- Other receivables 373 47 306 726
Financial Liabilities
- Bank overdrafts (604) - (8,397) (9,001)
- Trade and other payables (9,556) (1,725) (6,020) (17,301)
- Bank loans (38,006) - - (38,006)
- Finance leases (1,564) - - (1,564)
Net exposure (41,883) (1,645) (8,818) (52,346)
Exposure to currency exchange rates arise from the Group’s sales and purchases which are primarily denominated in US Dollar and South African Rand. It also arises from the retranslation of its foreign subsidiaries in West Africa. The Group activities expose it to a variety of financial risks. The main risks faced by the Group relate to foreign exchange rates, the risk of default by counter-parties to financial transactions and the availability of funds to meet business needs.
These risks are managed as described below:
(i) Currency riskSome of the interest bearing borrowings are denominated in foreign currencies and therefore lead to a risk of fluctuation of value due to changes in the foreign exchange rate. This risk is partially hedged by holding United States Dollar bank balances and United States Dollar denominated exports.The table below shows the extent to which Group companies have interest bearing liabilities in currencies other than their functional currency:
2019 2018
ZMW’000s USD’000s ZMW’000s USD’000s
DEG - Deutsche Investitions- und Entwicklungsgesellschaft mbH 197,604 14,970 231,413 18,907
International Finance Corporation 100,056 7,580 126,562 10,340
297,660 22,550 357,975 29,247
(ii) Foreign currency risk sensitivity analysisZambian Kwacha/United States Dollar exchange riskThe following tables illustrate the sensitivity of the net result for the year and equity with regard to the Group’s foreign currency borrowings “with all other things being equal”. It assumes a +/-10 per cent. and 5 per cent., movement in the United States Dollar/Zambian Kwacha exchange rate for the year ended 30 September 2019.If the Zambian Kwacha had weakened against the United States dollar by 10 per cent. (2018: 10 per cent.) then this would have resulted in the following impact on net profit and equity:
29. Financial instruments (continued)

Overview Strategicreport
Corporategovernance
Financialstatements
Zambeef Products PLC Annual Report 2019 105
2019 2018
Weakening of the Kwacha ZMW’000s USD’000s ZMW’000s USD’000s
Net profit/(loss) (2,443) (180) (25,291) (2,318)
Equity 3,215,943 221,484 3,079,990 228,757
If Zambian Kwacha had strengthened against the United States Dollar by 5 per cent. (2018: 5 per cent) then this would have resulted in the following impact on net profit and equity:
2019 2018
Strengthening of the Kwacha ZMW’000s USD’000s ZMW’000s USD’000s
Net profit/(loss) 42,206 3,606 28,385 3,012
Equity 3,260,592 260,015 3,133,666 269,493
There is no material difference between the carrying value and the fair value of the Group’s financial liabilities.
(iii) Interest rate riskAs the Group has no significant interest-bearing assets, the Group’s income and operating cash flows are substantially independent of changes in market interest rates. The Group’s interest rate risk arises from overdraft facilities and long-term borrowings. Borrowings issued at variable rates expose the Group to interest rate risk. The interest rates to which the Group is exposed are set out in notes 20, 23 and 24. The risk of interest rate movements is managed through on-going monitoring of the Group’s overdrafts and long-term borrowings, the spreading of debt between a number of financial institutions and the denomination of debt in Zambian Kwacha and USD.
The Group’s term facilities are medium to long term with fixed spread over LIBOR. A 0.5 per cent. movement in the LIBOR rate would not have a material impact on the interest expense for the Group.
(iv) Market riskThe Group is not exposed to the risk of the value of its financial assets fluctuating as a result of changes in market prices.
(b) Credit risk(i) Trade receivablesThe Directors believe the credit risk of trade receivables is low. The credit risk is managed by the selective granting of credit.
(c) Liquidity riskLiquidity risk is the risk that the Group might be unable to meet its obligations associated with its financial liabilities. The Group monitors rolling forecasts of the Group’s liquidity requirements to ensure it has sufficient cash to meet operational needs while maintaining sufficient headroom on any undrawn borrowing facilities so that the Group does not breach limits or covenants (where applicable) on any of its borrowing facilities. The maturity of the Group’s financial liabilities with respect to borrowings is set out in notes 20, 23 and 24.
30 September 2019 Current Non-current
Within 6 months
6 to 12 months 1 to 5 years
later than 5 years
ZMW’000 ZMW’000 ZMW’000 ZMW’000
Interest bearing liabilities 50,830 50,831 228,099 -
Other bank borrowings - 241,381 - -
Finance lease obligations 10,743 10,744 19,297 -
Trade and other payables 312,499 - - -
29. Financial instruments (continued)
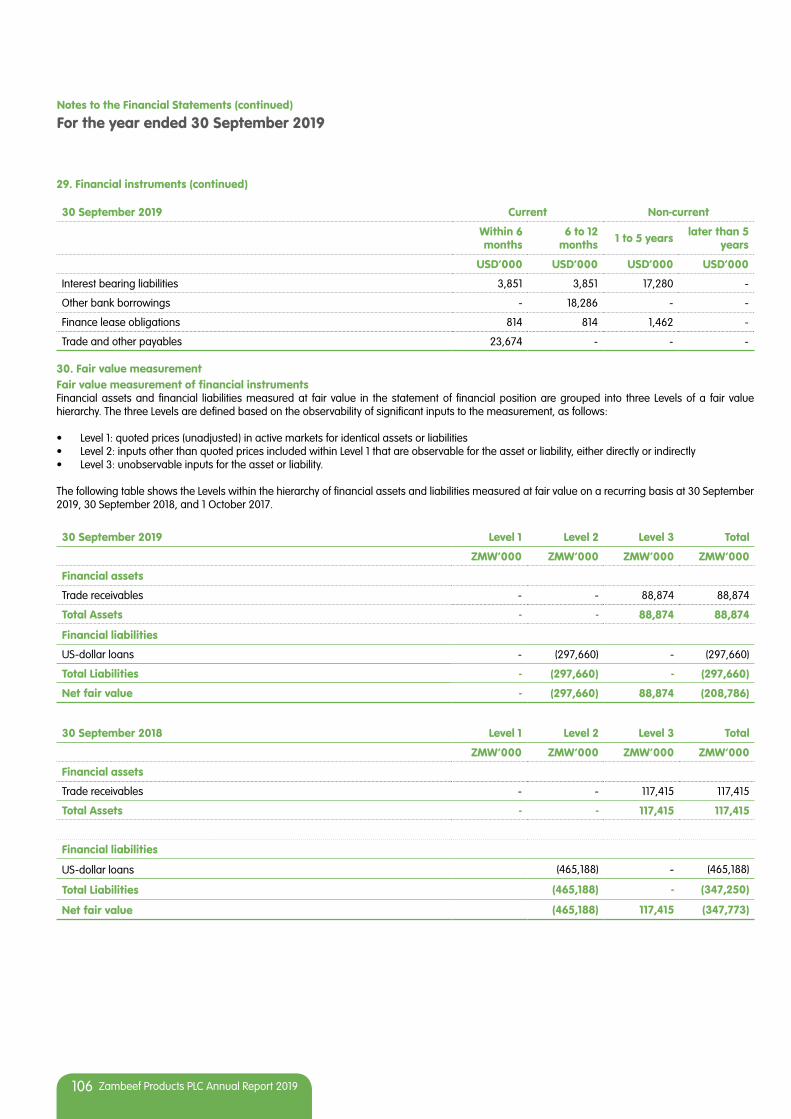
106 Zambeef Products PLC Annual Report 2019
Notes to the Financial Statements (continued)
For the year ended 30 September 2019
30 September 2019 Current Non-current
Within 6 months
6 to 12 months 1 to 5 years later than 5
years
USD’000 USD’000 USD’000 USD’000
Interest bearing liabilities 3,851 3,851 17,280 -
Other bank borrowings - 18,286 - -
Finance lease obligations 814 814 1,462 -
Trade and other payables 23,674 - - -
30. Fair value measurementFair value measurement of financial instrumentsFinancial assets and financial liabilities measured at fair value in the statement of financial position are grouped into three Levels of a fair value hierarchy. The three Levels are defined based on the observability of significant inputs to the measurement, as follows:
• Level 1: quoted prices (unadjusted) in active markets for identical assets or liabilities• Level 2: inputs other than quoted prices included within Level 1 that are observable for the asset or liability, either directly or indirectly• Level 3: unobservable inputs for the asset or liability.
The following table shows the Levels within the hierarchy of financial assets and liabilities measured at fair value on a recurring basis at 30 September 2019, 30 September 2018, and 1 October 2017.
30 September 2019 Level 1 Level 2 Level 3 Total
ZMW’000 ZMW’000 ZMW’000 ZMW’000
Financial assets
Trade receivables - - 88,874 88,874
Total Assets - - 88,874 88,874
Financial liabilities
US-dollar loans - (297,660) - (297,660)
Total Liabilities - (297,660) - (297,660)
Net fair value - (297,660) 88,874 (208,786)
30 September 2018 Level 1 Level 2 Level 3 Total
ZMW’000 ZMW’000 ZMW’000 ZMW’000
Financial assets
Trade receivables - - 117,415 117,415
Total Assets - - 117,415 117,415
Financial liabilities
US-dollar loans (465,188) - (465,188)
Total Liabilities (465,188) - (347,250)
Net fair value (465,188) 117,415 (347,773)
29. Financial instruments (continued)

Overview Strategicreport
Corporategovernance
Financialstatements
Zambeef Products PLC Annual Report 2019 107
1 October 2017 Level 1 Level 2 Level 3 Total
USD’000s USD’000s USD’000s USD’000s
Financial assets
Trade receivables - - 61,651 61,651
Total Assets - - 61,651 61,651
Financial liabilities
US-dollar loans - (407,498) - (407,498)
Total Liabilities - (407,498) - (407,498)
Net fair value - (407,498) 61,651 (345,847)
30 September 2019 Level 1 Level 2 Level 3 Total
USD’000s USD’000s USD’000s USD’000s
Financial assets
Trade receivables - - 6,733 6,733
Total Assets - - 6,733 6,733
Financial liabilities
US-dollar loans - (22,550) - (22,550)
Total Liabilities - (22,550) - (22,550)
Net fair value - (22,550) 6,733 (15,817)
30 September 2018 Level 1 Level 2 Level 3 Total
USD’000s USD’000s USD’000s USD’000s
Financial assets
Trade receivables - - 9,593 9,593
Total Assets - - 9,593 9,593
Financial liabilities
US-dollar loans - (38,006) - (38,006)
Total Liabilities - (38,006) - (38,006)
Net fair value - (38,006) 9,593 (28,413)
30. Fair value measurement (continued)

108 Zambeef Products PLC Annual Report 2019
Notes to the Financial Statements (continued)
For the year ended 30 September 2019
1 October 2018 Level 1 Level 2 Level 3 Total
USD’000s USD’000s USD’000s USD’000s
Financial assets
Trade receivables - - 6,376 6,376
Total Assets - - 6,376 6,376
Financial liabilities
US-dollar loans - (42,140) - (42,140)
Total Liabilities - (42,140) - (42,140)
Net fair value - (42,140) 6,376 (35,764)
There were no transfers between Level 1 and Level 2 in 2019 or 2018.
Measurement of fair value of financial instrumentsThe Group’s finance team performs valuations of financial items for financial reporting purposes, including Level 3 fair values, in consultation with third party valuation specialists for complex valuations. Valuation techniques are selected based on the characteristics of each instrument, with the overall objective of maximising the use of market-based information. The finance team reports directly to the Chief Financial Officer (CFO) and to the audit committee.
Valuation processes and fair value changes are discussed among the audit committee and the valuation team at least every year, in line with the Group’s reporting dates. The valuation techniques used for instruments categorised in Levels 2 and 3 are described below:
Foreign currency forward contracts (Level 2)The Group’s foreign currency forward contracts are not traded in active markets. These have been fair valued using observable forward exchange rates and interest rates corresponding to the maturity of the contract. The effects of non-observable inputs are not significant for foreign currency forward contracts.
US-dollar loans (Level 2)The fair values of the US-dollar loans are estimated using a discounted cash flow approach, which discounts the contractual cash flows using discount rates derived from observable market interest rates of similar loans with similar risk. The interest rate used for this calculation is 4.81% (2018: 4.81%).
Contingent consideration (Level 3)The group did not have any contingent consideration during the year.
30. Fair value measurement (continued)

Overview Strategicreport
Corporategovernance
Financialstatements
Zambeef Products PLC Annual Report 2019 109
Fair value measurement of non-financial assetsThe following table shows the Levels within the hierarchy of non-financial assets measured at fair value on a recurring basis at 30 September 2019, 30 September 2018, and 1 October 2017:
30 September 2019 Level 1 Level 2 Level 3 Total
ZMW’000 ZMW’000 ZMW’000 ZMW’000
Property, plant and equipment:
Land held for production in Zambia - 1,166,494 - 1,166,494
Office building in Zambia - 48,856 - 48,856
30 September 2018 Level 1 Level 2 Level 3 Total
ZMW’000 ZMW’000 ZMW’000 ZMW’000
Land held for production in Zambia - 1,182,870 - 1,182,870
Office building in Zambia - 40,225 - 40,225
1 October 2017 Level 1 Level 2 Level 3 Total
ZMW’000 ZMW’000 ZMW’000 ZMW’000
Land held for production in Zambia - 1,178,526 - 1,178,526
Office building in Zambia - 39,407 - 39,407
30 September 2019 Level 1 Level 2 Level 3 Total
USD’000 USD’000 USD’000 USD’000
Property, plant and equipment:
Land held for production in Zambia - 88,371 - 88,371
Office building in Zambia - 3,701 - 3,701
30 September 2018 Level 1 Level 2 Level 3 Total
USD’000 USD’000 USD’000 USD’000
Land held for production in Zambia - 96,640 - 96,640
Office building in Zambia - 3,286 - 3,286
1 October 2017 Level 1 Level 2 Level 3 Total
USD’000 USD’000 USD’000 USD’000
Land held for production in Zambia - 121,874 - 121,874
Office building in Zambia - 4,075 - 4,075
Fair value of the Group’s main property assets is estimated based on appraisals performed by independent, professionally-qualified property valuers, Fairworld Properties Limited. The significant inputs and assumptions are developed in close consultation with management. The valuation processes and fair value changes are reviewed by the Board of Directors and audit committee at each reporting date.
30. Fair value measurement (continued)

110 Zambeef Products PLC Annual Report 2019
Notes to the Financial Statements (continued)
For the year ended 30 September 2019
Further information is set out below.
Land held for production in Zambia (Level 2)Land has been valued using the direct comparison method. This method has been adopted as the most appropriate for the purpose of this valuation as there are enough comparisons available on the open market for land. The land was revalued on 30 September 2017.
The significant unobservable input is the adjustment for factors specific to the land in question. The extent and direction of this adjustment depends on the number and characteristics of the observable market transactions in similar properties that are used as the starting point for valuation. Although this input is a subjective judgement, management considers that the overall valuation would not be materially affected by reasonably possible alternative assumptions.
The fair values of the office buildings are estimated by using the direct comparison method. This method has been adopted as the most appropriate for the purpose of this valuation as there are enough comparisons available on the open market for buildings.
31. Capital commitments
2019 2018
ZMW’000s USD’000s ZMW’000s USD’000s
Capital commitments entered into at the reporting date 15,008 1,137 24,296 1,985
Not contracted for at the reporting date 50,992 3,863 85,864 7,015
32. Operating leases
The total value of future minimum annual lease payments under non-cancellable operating leases is as follows:
2019 2018
(i) In Zambian KwachaGroup
ZMW’000sCompany
ZMW’000sGroup
ZMW’000sCompany
ZMW’000s
Within one year 12,842 - 10,583 -
One to five years 11,871 - 18,321 -
2019 2018
(ii) In US DollarsGroup
USD’000sCompany USD’000s
Group USD’000s
Company USD’000s
Within one year 973 - 865 -
One to five years 899 - 1,497 -
The Company’s subsidiary, Zambeef Retailing Limited, has operating leases for its butcheries that are for a minimum period of 12 months and a maximum period of 5 years and renewable at the request of either party. There are no purchase options, contingent rent payments or restrictions arising on these leases.
30. Fair value measurement (continued)
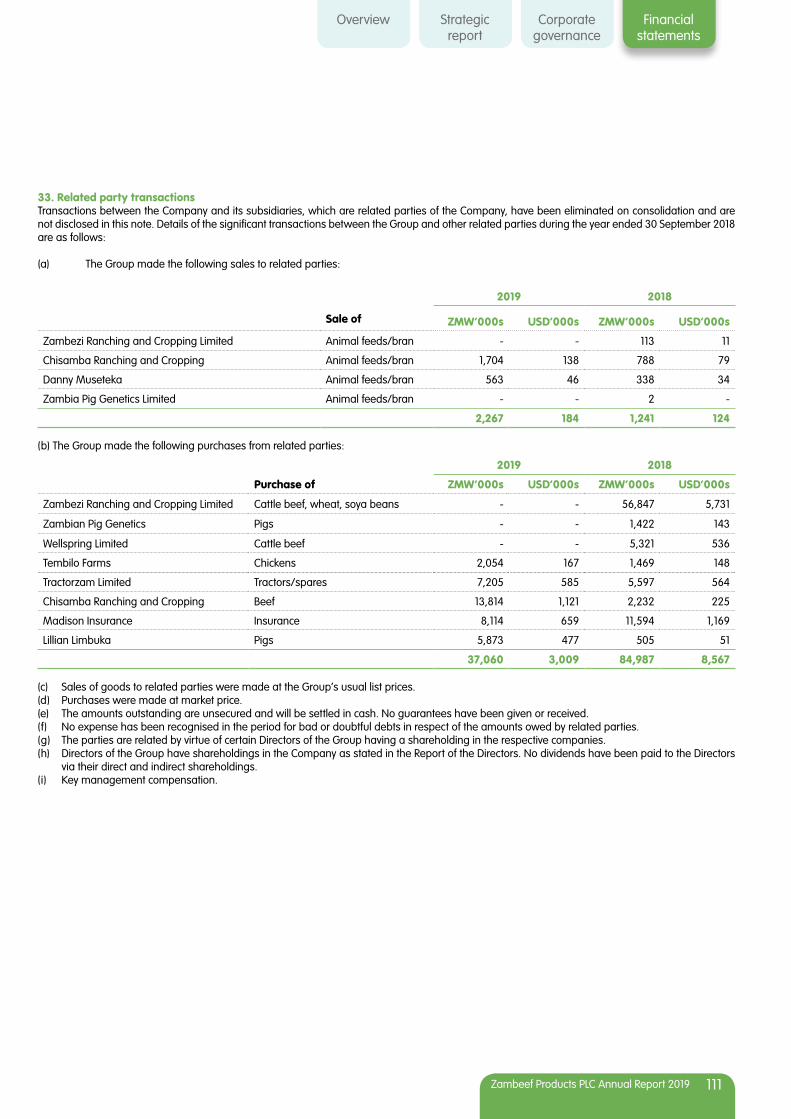
Overview Strategicreport
Corporategovernance
Financialstatements
Zambeef Products PLC Annual Report 2019 111
33. Related party transactionsTransactions between the Company and its subsidiaries, which are related parties of the Company, have been eliminated on consolidation and are not disclosed in this note. Details of the significant transactions between the Group and other related parties during the year ended 30 September 2018 are as follows:
(a) The Group made the following sales to related parties:
2019 2018
Sale of ZMW’000s USD’000s ZMW’000s USD’000s
Zambezi Ranching and Cropping Limited Animal feeds/bran - - 113 11
Chisamba Ranching and Cropping Animal feeds/bran 1,704 138 788 79
Danny Museteka Animal feeds/bran 563 46 338 34
Zambia Pig Genetics Limited Animal feeds/bran - - 2 -
2,267 184 1,241 124
(b) The Group made the following purchases from related parties:
2019 2018
Purchase of ZMW’000s USD’000s ZMW’000s USD’000s
Zambezi Ranching and Cropping Limited Cattle beef, wheat, soya beans - - 56,847 5,731
Zambian Pig Genetics Pigs - - 1,422 143
Wellspring Limited Cattle beef - - 5,321 536
Tembilo Farms Chickens 2,054 167 1,469 148
Tractorzam Limited Tractors/spares 7,205 585 5,597 564
Chisamba Ranching and Cropping Beef 13,814 1,121 2,232 225
Madison Insurance Insurance 8,114 659 11,594 1,169
Lillian Limbuka Pigs 5,873 477 505 51
37,060 3,009 84,987 8,567
(c) Sales of goods to related parties were made at the Group’s usual list prices.(d) Purchases were made at market price.(e) The amounts outstanding are unsecured and will be settled in cash. No guarantees have been given or received.(f) No expense has been recognised in the period for bad or doubtful debts in respect of the amounts owed by related parties.(g) The parties are related by virtue of certain Directors of the Group having a shareholding in the respective companies.(h) Directors of the Group have shareholdings in the Company as stated in the Report of the Directors. No dividends have been paid to the Directors
via their direct and indirect shareholdings.(i) Key management compensation.
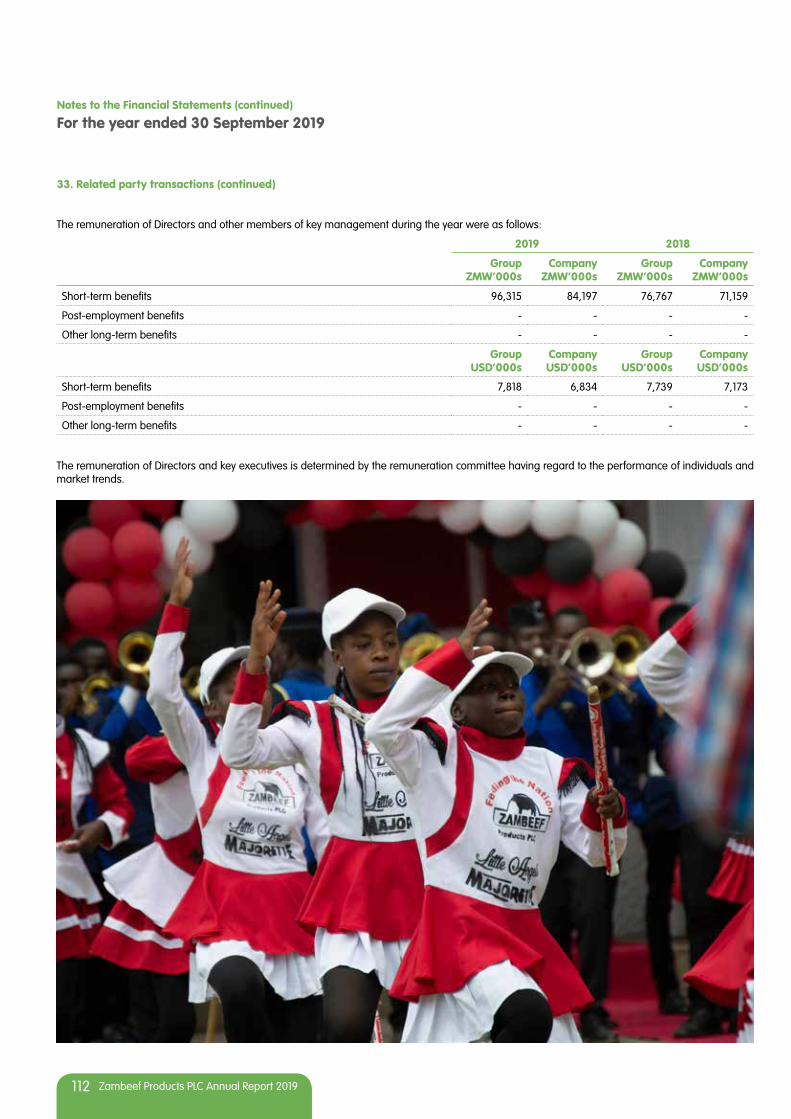
112 Zambeef Products PLC Annual Report 2019
Notes to the Financial Statements (continued)
For the year ended 30 September 2019
The remuneration of Directors and other members of key management during the year were as follows:
2019 2018
Group ZMW’000s
Company ZMW’000s
Group ZMW’000s
Company ZMW’000s
Short-term benefits 96,315 84,197 76,767 71,159
Post-employment benefits - - - -
Other long-term benefits - - - -
Group USD’000s
Company USD’000s
Group USD’000s
Company USD’000s
Short-term benefits 7,818 6,834 7,739 7,173
Post-employment benefits - - - -
Other long-term benefits - - - -
The remuneration of Directors and key executives is determined by the remuneration committee having regard to the performance of individuals and market trends.
33. Related party transactions (continued)

Overview Strategicreport
Corporategovernance
Financialstatements
Zambeef Products PLC Annual Report 2019 113
(j) There were no loans to related parties and key management personnel.
(k) The Company made the following sales to related parties:
2019 2018
ZMW’000s USD’000s ZMW’000s USD’000s
Zambeef Retailing Limited 989,956 80,354 869,969 87,698
Zambezi Ranching and Cropping Limited - - 113 11
Zambia Pig Genetics Limited 3,478 282 2 -
Masterpork Limited 28,182 2,287 16,681 1,681
Zam Chick Limited 123,200 10,000 106,636 10,750
Zamhatch Limited 142,402 11,559 91,303 9,204
Zamleather Limited 187 15 1,930 195
Zampalm Limited 7 1 - -
Danny Museteka 563 46 338 34
Chisamba Ranching and Cropping 1,704 138 788 79
1,289,679 104,682 1,087,760 109,652
(l) The Group made the following purchases from related parties:
2019 2018
ZMW’000s USD’000s ZMW’000s USD’000s
Zambeef Retailing Limited 2,326 189 6,629 668
Zambezi Ranching and Cropping Limited - - 13,070 1,318
Zamleather Limited 846 69 714 72
Zam Chick Limited 264 21 123 12
Tractorzam Limited 7,205 584 5,597 564
Masterpork Limited 44,027 3,574 56,082 5,653
Zamhatch Limited 25,148 2,041 13,490 1,360
Chisamba Ranching and Cropping 7,831 636 2,232 225
Wellspring Limited - - 5,321 536
87,647 7,114 103,258 10,408
33. Related party transactions (continued)
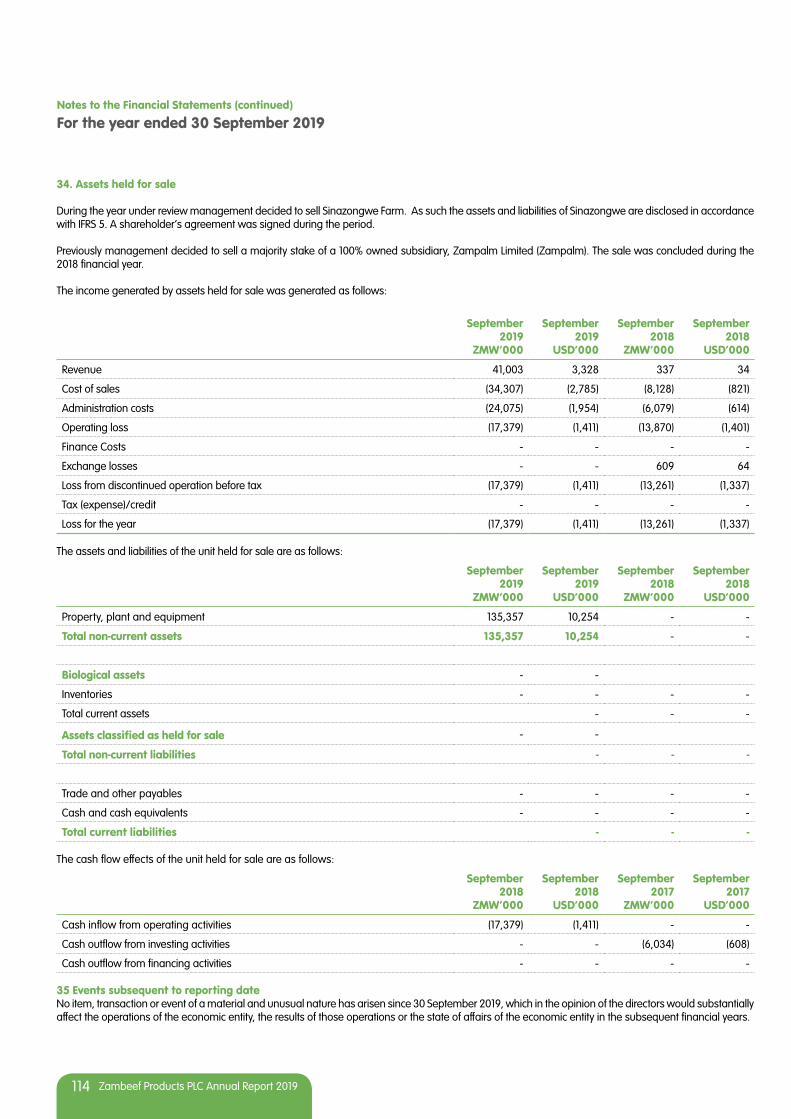
114 Zambeef Products PLC Annual Report 2019
Notes to the Financial Statements (continued)
For the year ended 30 September 2019
34. Assets held for sale
During the year under review management decided to sell Sinazongwe Farm. As such the assets and liabilities of Sinazongwe are disclosed in accordance with IFRS 5. A shareholder’s agreement was signed during the period.
Previously management decided to sell a majority stake of a 100% owned subsidiary, Zampalm Limited (Zampalm). The sale was concluded during the 2018 financial year.
The income generated by assets held for sale was generated as follows:
September2019
ZMW’000
September 2019
USD’000
September 2018
ZMW’000
September 2018
USD’000
Revenue 41,003 3,328 337 34
Cost of sales (34,307) (2,785) (8,128) (821)
Administration costs (24,075) (1,954) (6,079) (614)
Operating loss (17,379) (1,411) (13,870) (1,401)
Finance Costs - - - -
Exchange losses - - 609 64
Loss from discontinued operation before tax (17,379) (1,411) (13,261) (1,337)
Tax (expense)/credit - - - -
Loss for the year (17,379) (1,411) (13,261) (1,337)
The assets and liabilities of the unit held for sale are as follows:
September 2019
ZMW’000
September 2019
USD’000
September 2018
ZMW’000
September 2018
USD’000
Property, plant and equipment 135,357 10,254 - -
Total non-current assets 135,357 10,254 - -
Biological assets - -
Inventories - - - -
Total current assets - - -
Assets classified as held for sale - -
Total non-current liabilities - - -
Trade and other payables - - - -
Cash and cash equivalents - - - -
Total current liabilities - - -
The cash flow effects of the unit held for sale are as follows:
September 2018
ZMW’000
September 2018
USD’000
September 2017
ZMW’000
September 2017
USD’000
Cash inflow from operating activities (17,379) (1,411) - -
Cash outflow from investing activities - - (6,034) (608)
Cash outflow from financing activities - - - -
35 Events subsequent to reporting dateNo item, transaction or event of a material and unusual nature has arisen since 30 September 2019, which in the opinion of the directors would substantially affect the operations of the economic entity, the results of those operations or the state of affairs of the economic entity in the subsequent financial years.

Overview Strategicreport
Corporategovernance
Financialstatements
Zambeef Products PLC Annual Report 2019 115

116 Zambeef Products PLC Annual Report 2019
Notes to the Financial Statements (continued)
For the year ended 30 September 2019

Overview Strategicreport
Corporategovernance
Financialstatements
Zambeef Products PLC Annual Report 2019 117
118 Zambeef Products PLC Annual Report 2019
Notes to the Financial Statements (continued)
For the year ended 30 September 2019
Notice is hereby given that the 25th Annual General Meeting of Zambeef Products PLC will take place at the Taj Pamodzi Hotel, along Addis Ababa Drive, Lusaka, on Monday, December 30, 2019 at 09:00hrs
AGENDA
1. To read the Notice of the Meeting and confirm that a quorum is present2. To read and confirm the minutes of the 24th Annual General Meeting held on December 18, 2018.3. Consider any matters arising from the minutes4. To receive the report of the Directors, the Auditors report and the Financial Statements for the year ended September 30, 2019 (Resolution 1)5. To re-appoint Grant Thornton (Zambia) as Auditors for 2019/2020 and authorize the Directors to fix their remuneration. (Resolution 2)6. To Ratify the appointments of the following as Directors: a. Michael Mundashi Non-Executive Director (Resolution 3) b. Walter Roodt Executive Director (Resolution 4) c. Faith Mukutu Executive Director (Resolution 5)7. In terms of the Companies Act, David Osborne and John Rabb retire but are eligible to offer themselves for re-election (Resolution 6 and 7).8. That pursuant to section 27 of the Companies Act, number 10 of 2017, the amended articles of association of the Company tabled at the meeting
(new Articles), be adopted as articles of association of the Company. Further that the New Articles shall be effective from the date of the Annual General Meeting. (Special Resolution 1)
9. To Consider any competent business of which due notice has been given.
By order of the Board, Danny Museteka, Company Secretary
Note: A Member is entitled to appoint one or more proxies to attend, speak and vote in his or her stead. A proxy need not be a member of the Company. Proxies must be lodged at the registered office of the Company at least 48 hours before the time fixed for the meeting.
Notice of Annual General Meeting and agenda

Overview Strategicreport
Corporategovernance
Financialstatements
Zambeef Products PLC Annual Report 2019 119
I/We, ……………………………………………………………..........................................................................................................................
of ……………………………………………………………................................................................................................................................
being a member/s of and the registered holder/s of ..........................................................................................................................................
Zambeef shares hereby appoint ……………………………………………………………...………………...................................................
of ...........................................................................................................................................................................................................................
or, in his/her absence, the Chairman of the Company.
As my/our proxy to vote for me/us on my/our behalf at the Annual/Extraordinary General Meeting of the Company at be held on the 30th day December 2019 and at any adjournment of that meeting.
In Favour of/against (please tick) In Favour Against
Resolution 1 To recieve, approve and adopt financial statements for the year ended 30 September 2019 Resolution 2 To re-appoint Grant Thornton as Auditors for 2019/20 and authorise the Directors to fix their remuneration. Resolution 3 To Ratify the Appointment of Michael Mundashi as a Non-Executive Director Resolution 4 To Ratify the Appointment of Walter Roodt as an Executive Director Resolution 5 To Ratify the Appointment of Faith Mukutu as an Executive Director Resolution 6 To re-elect Mr. David Osborne as a Non-Executive Director
Resolution 7 To re-elect Mr. John Rabb as a Non-Executive Director
Special Resolution 1 Pursuant to Section 27 of the Companies Act, number 10 of 2017, the amended articles of association of the company tabled at the meeting (new Articles), be adopted as articles of association of the Company. Further that the New Articles shall be effective from the date of the Annual General Meeting.
Unless otherwise instructed, the proxy will vote as he/she thinks fit.
Signed: ………………………………........................................................................................................…………………………..........................……..........
Name: ………………………………........................................................................................................……………………………..........................…...........
Date: ………………………………................................................................................………………………………...............................................................
Witnessed by: ………………………………........................................................... Signature: ………………………………...................................................
Name: ………………………………........................................................................................................……………………………….....................................
Address: ………………………………........................................................................................................……………………………….................................
.......................................................................………………………………..................................................................................................................................
Proxy form

120 Zambeef Products PLC Annual Report 2019
Notes to the Financial Statements (continued)
For the year ended 30 September 2019
1. A shareholder may insert the name of a proxy or the names of two alternative proxies of his/her choice in the space provided, with or without deleting “the Chairman of the Company”. The person whose name stands first on the form of proxy and who is present at the Annual General Meeting will be entitled to act as proxy to the exclusion of those whose names follow. Any such proxy, who need not be a shareholder of the Company, is entitled to attend, speak and vote on behalf of the shareholder.
2. A proxy is entitled to one vote on a show of hands and, on a poll, one vote for each share held. A shareholder’s instructions to the proxy must be indicated in the appropriate spaces.
3. If a shareholder does not indicate on this instrument that the proxy is to vote in favour of or against any resolution or to abstain from voting or gives contradictory instructions, or should any further resolution/s or any amendment/s which may be properly put before the Annual General Meeting be proposed, the proxy shall be entitled to vote as he/she thinks fit.
4. This form of proxy must be received by the Company secretary at the registered head office, Plot 4970, Manda Road, Industrial Area, P/B 17, Woodlands, Lusaka, by no later than 09:30 on Monday, 26th December, 2018.
5. Documentary evidence establishing the authority of the person signing the proxy in representative capacity must be attached hereto unless previously recorded by the Company’s transfer secretaries.
6. The completion and lodging of this form of proxy will not preclude a shareholder from attending the Annual General Meeting and speaking and voting in person there at to the exclusion of any proxy appointed in terms of this proxy form.
7. Any alteration or correction made to this form of proxy must be initialed by the signatory/ies.
8. The Chairman of the meeting may accept or reject any form of proxy, which is completed and/or received other than in accordance with these notes.
Notes to the Proxy Form
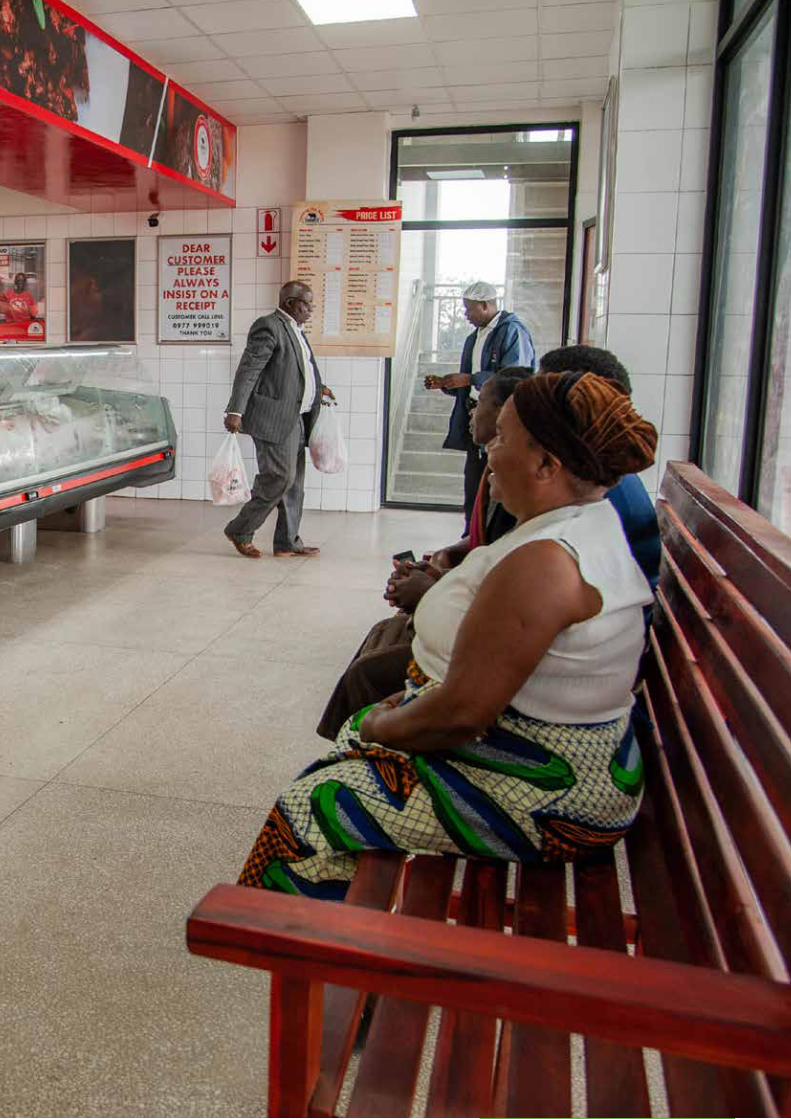
Overview Strategicreport
Corporategovernance
Financialstatements
Zambeef Products PLC Annual Report 2019 121

122 Zambeef Products PLC Annual Report 2019
Notes to the Financial Statements (continued)
For the year ended 30 September 2019

Overview Strategicreport
Corporategovernance
Financialstatements
Zambeef Products PLC Annual Report 2019 123