
Our National Energy Picture:Our National Energy Picture… · Our National Energy Picture: ......
32
Our National Energy Picture: Our National Energy Picture: A Path to Marine Renewable Energy Renewable Energy Bob Thresher, PhD, PE NREL Research Fellow NREL Research Fellow A Workshop on Renewable Ocean Energy & the Marine Ocean Energy & the Marine Environment Hosted by Southeast National Marine Renewable Energy Center Florida Atlantic University Pl B h Fl id NREL is a national laboratory of the U.S. Department of Energy Office of Energy Efficiency and Renewable Energy operated by the Alliance for Sustainable Energy, LLC Palm Beach, Florida 3-5 November 2010
Transcript of Our National Energy Picture:Our National Energy Picture… · Our National Energy Picture: ......
Our National Energy Picture:Our National Energy Picture: A Path to Marine
Renewable EnergyRenewable Energy
Bob Thresher, PhD, PENREL Research FellowNREL Research Fellow
A Workshop on Renewable Ocean Energy & the MarineOcean Energy & the Marine
Environment
Hosted by Southeast National Marine Renewable Energy CenterFlorida Atlantic University
P l B h Fl id
NREL is a national laboratory of the U.S. Department of Energy Office of Energy Efficiency and Renewable Energy operated by the Alliance for Sustainable Energy, LLC
Palm Beach, Florida3-5 November 2010
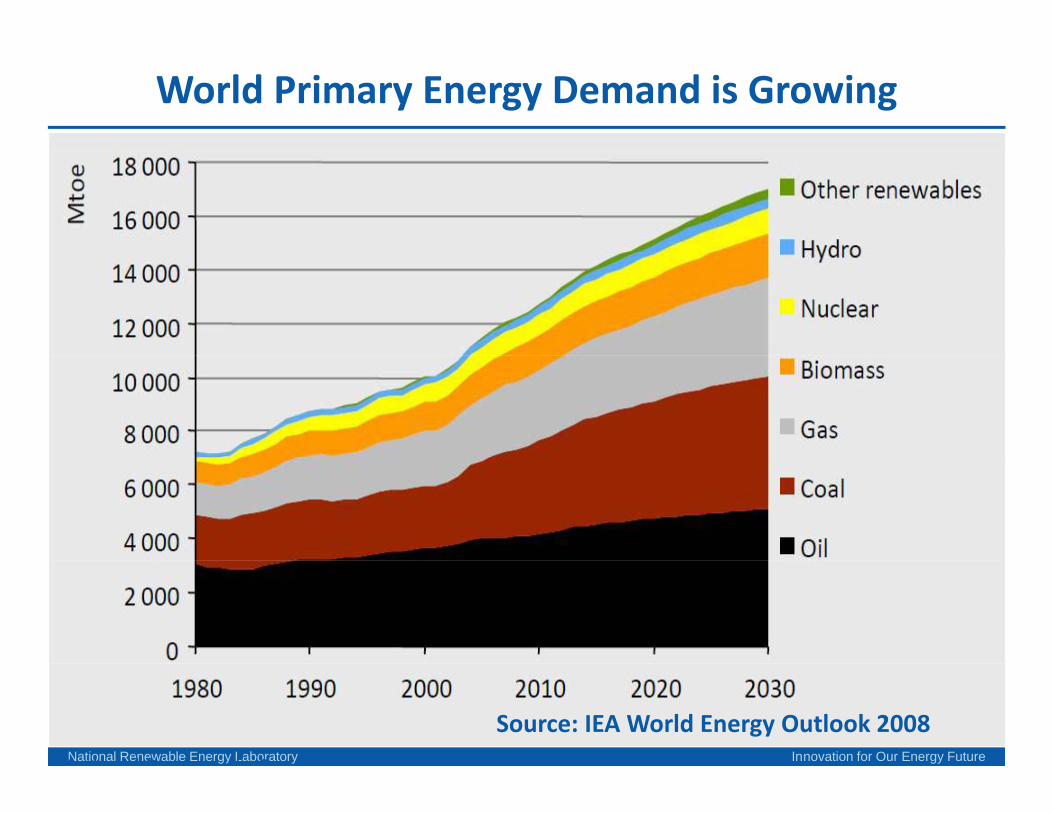
World Primary Energy Demand is Growing
National Renewable Energy Laboratory Innovation for Our Energy FutureNational Renewable Energy Laboratory
Source: IEA World Energy Outlook 2008
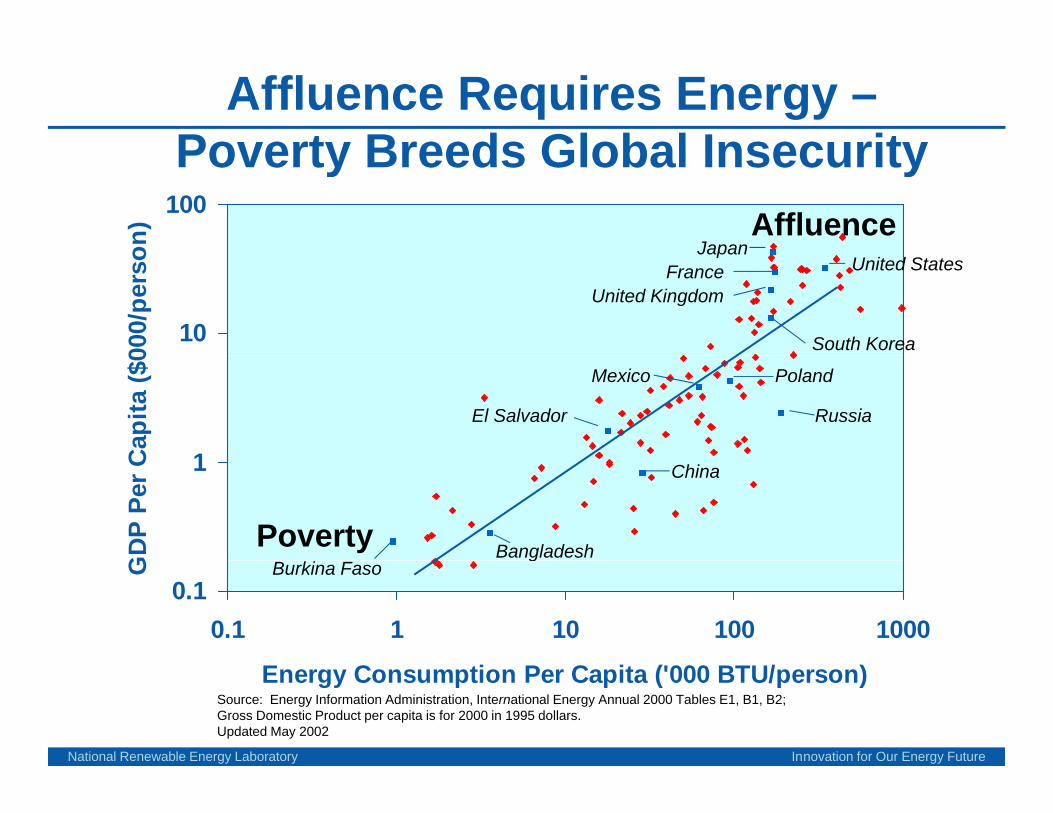
Affluence Requires Energy –Poverty Breeds Global InsecurityPoverty Breeds Global Insecurity
100
on) Affluence
Japan
10
000/
pers
o
United Kingdom
South Korea
United StatesFranceJapan
1Cap
ita ($
0
Mexico Poland
El Salvador Russia
1
GD
P Pe
r C
Poverty Bangladesh
China
0.10.1 1 10 100 1000
G Burkina Fasog
National Renewable Energy Laboratory Innovation for Our Energy Future
Energy Consumption Per Capita ('000 BTU/person)Source: Energy Information Administration, International Energy Annual 2000 Tables E1, B1, B2; Gross Domestic Product per capita is for 2000 in 1995 dollars. Updated May 2002
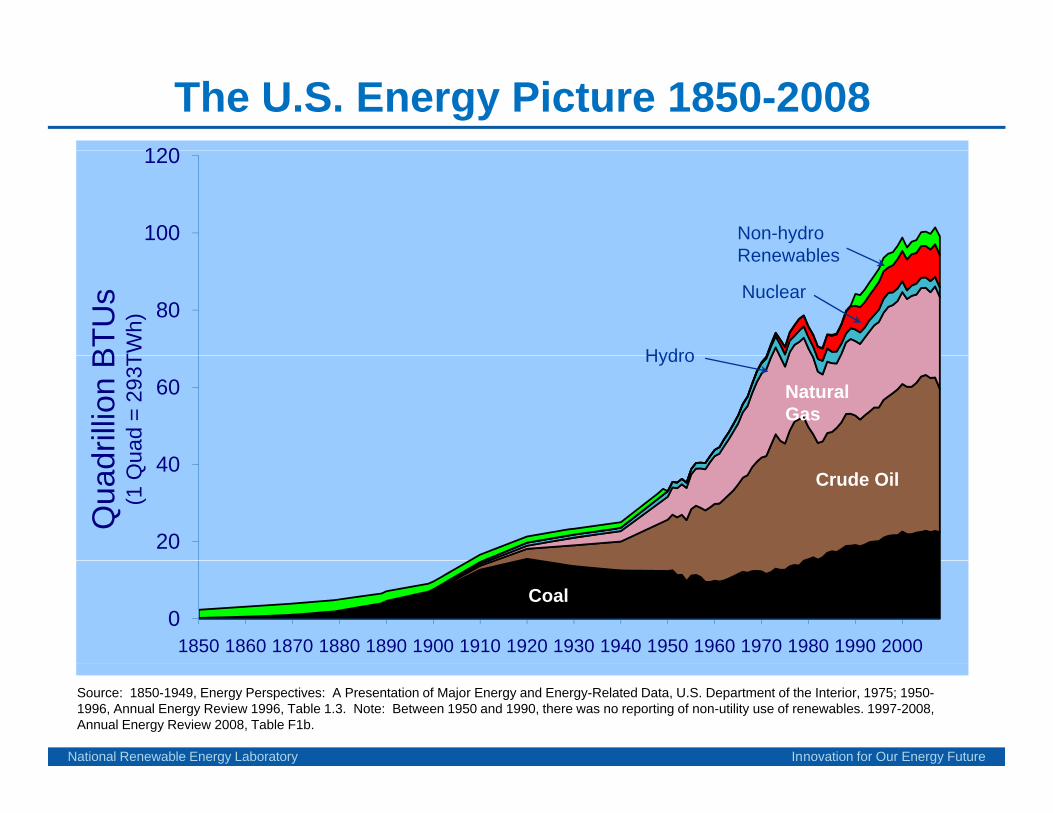
The U.S. Energy Picture 1850-2008120
100
120
Non-hydro Renewables
80
BTU
sTW
h)
Nuclear
Hydro
Renewables
40
60
drilli
on B
uad
= 29
3T
Natural Gas
Hydro
20
40
Qua
d(1
Qu
Crude Oil
01850 1860 1870 1880 1890 1900 1910 1920 1930 1940 1950 1960 1970 1980 1990 2000
Coal
National Renewable Energy Laboratory Innovation for Our Energy Future
Source: 1850-1949, Energy Perspectives: A Presentation of Major Energy and Energy-Related Data, U.S. Department of the Interior, 1975; 1950-1996, Annual Energy Review 1996, Table 1.3. Note: Between 1950 and 1990, there was no reporting of non-utility use of renewables. 1997-2008, Annual Energy Review 2008, Table F1b.
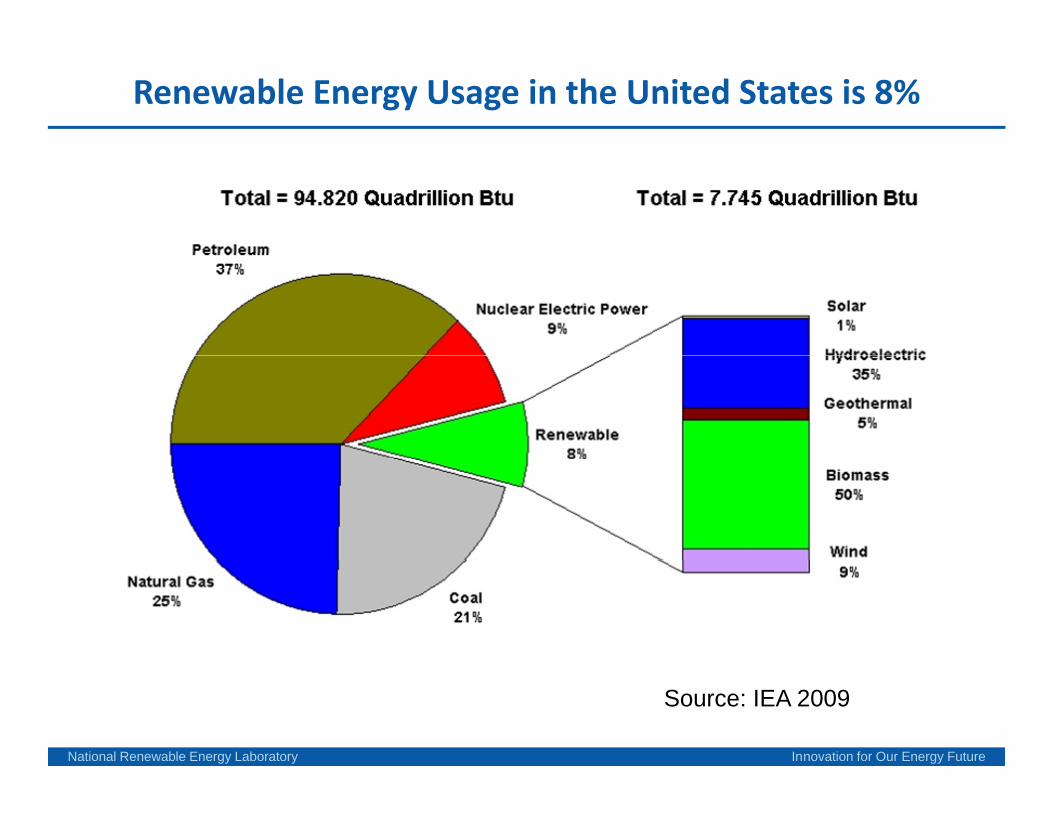
Renewable Energy Usage in the United States is 8%
National Renewable Energy Laboratory Innovation for Our Energy Future
Source: IEA 2009
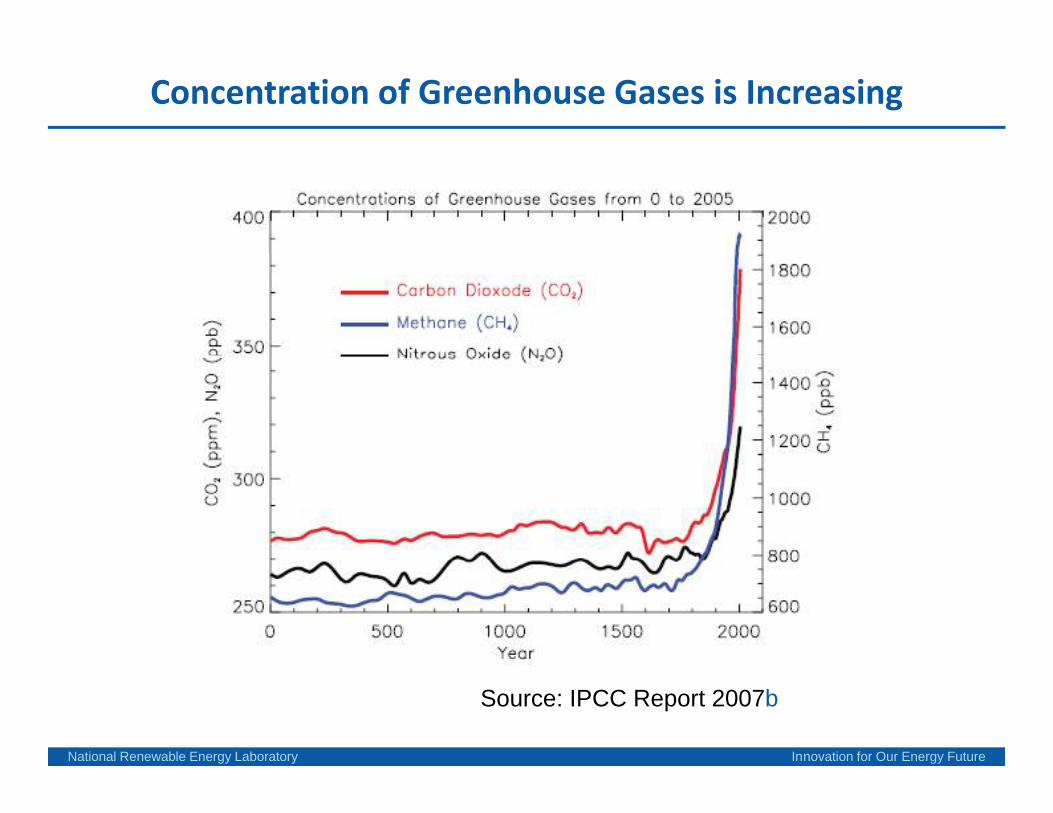
Concentration of Greenhouse Gases is Increasing
National Renewable Energy Laboratory Innovation for Our Energy Future
Source: IPCC Report 2007b
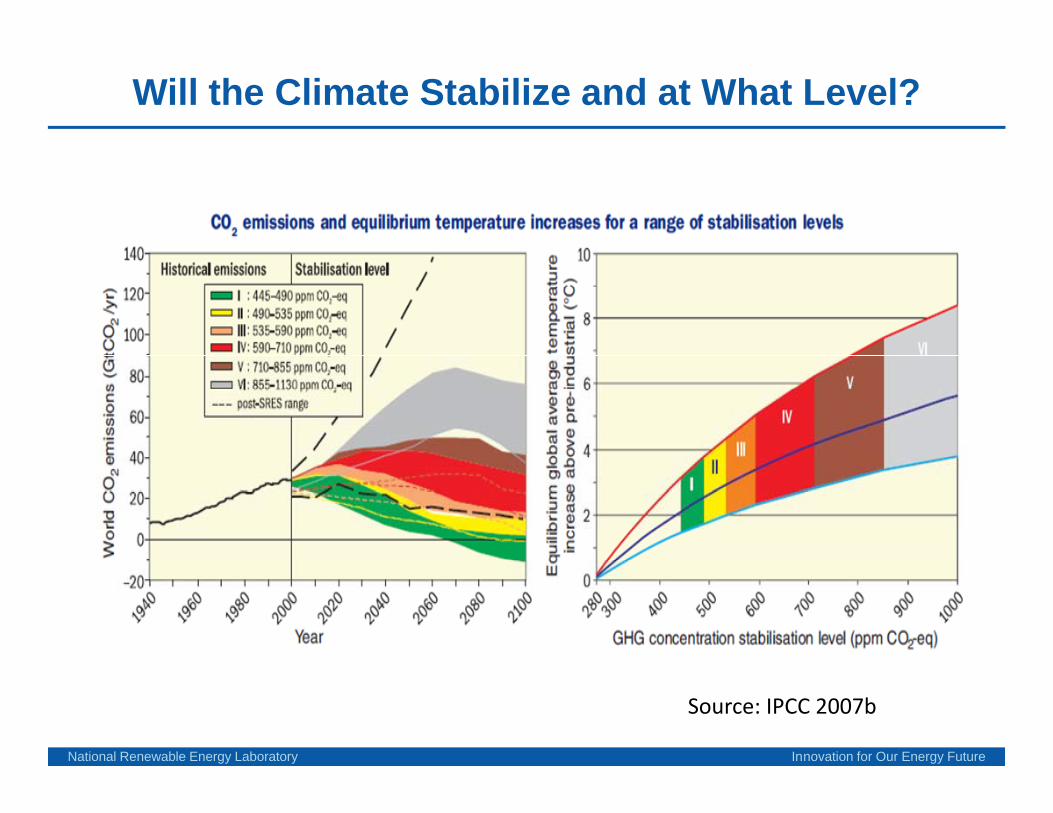
Will the Climate Stabilize and at What Level?
National Renewable Energy Laboratory Innovation for Our Energy Future
Source: IPCC 2007b
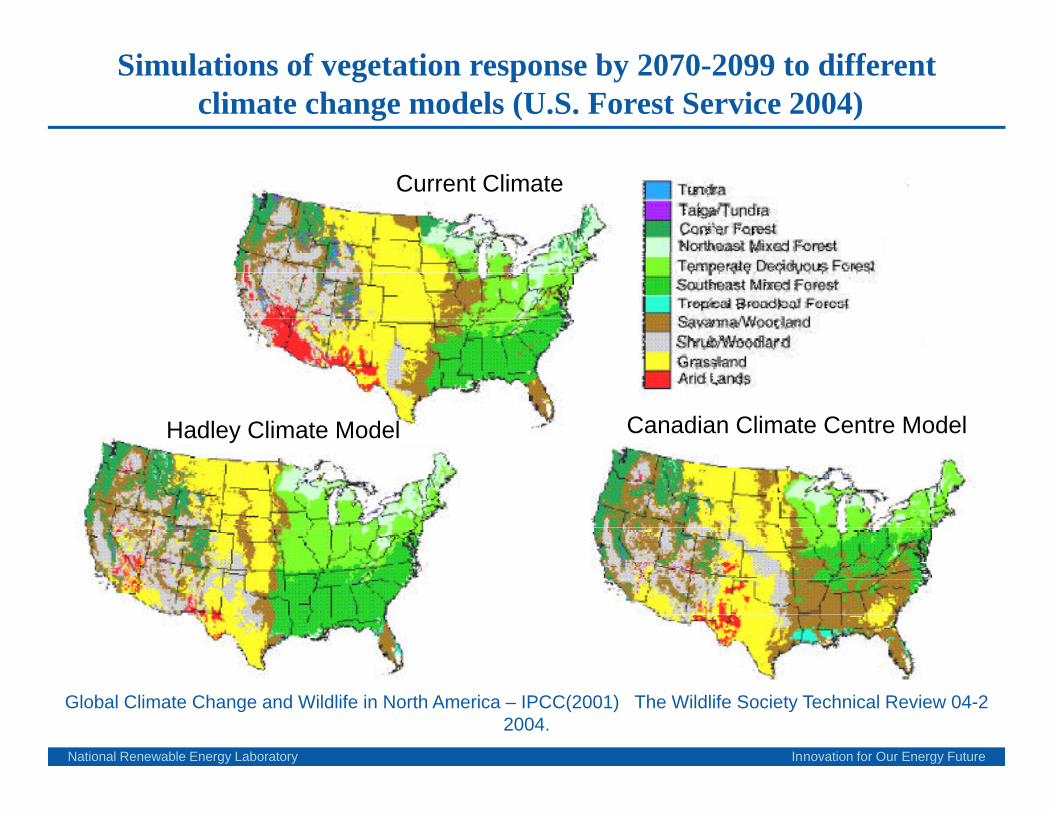
Simulations of vegetation response by 2070-2099 to differentclimate change models (U.S. Forest Service 2004)
Current Climate
Hadley Climate Model Canadian Climate Centre Model
National Renewable Energy Laboratory Innovation for Our Energy Future
Global Climate Change and Wildlife in North America – IPCC(2001) The Wildlife Society Technical Review 04-2 2004.
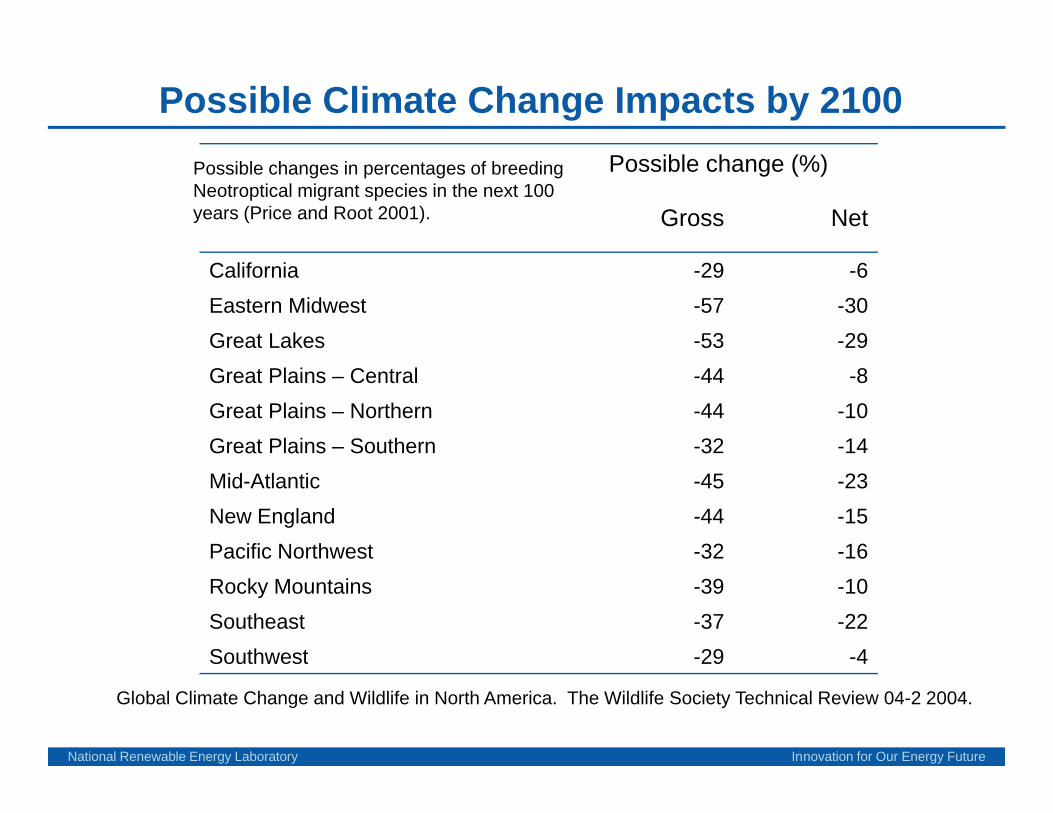
Possible Climate Change Impacts by 2100Possible change (%)
Gross Net
Possible changes in percentages of breeding Neotroptical migrant species in the next 100 years (Price and Root 2001).
California -29 -6Eastern Midwest -57 -30Great Lakes -53 -29Great Plains – Central -44 -8Great Plains – Northern -44 -10Great Plains – Southern -32 -14Mid-Atlantic -45 -23New England -44 -15Pacific Northwest -32 -16Rocky Mountains -39 -10Southeast -37 -22Southwest -29 -4
National Renewable Energy Laboratory Innovation for Our Energy Future
Southwest 29 4
Global Climate Change and Wildlife in North America. The Wildlife Society Technical Review 04-2 2004.
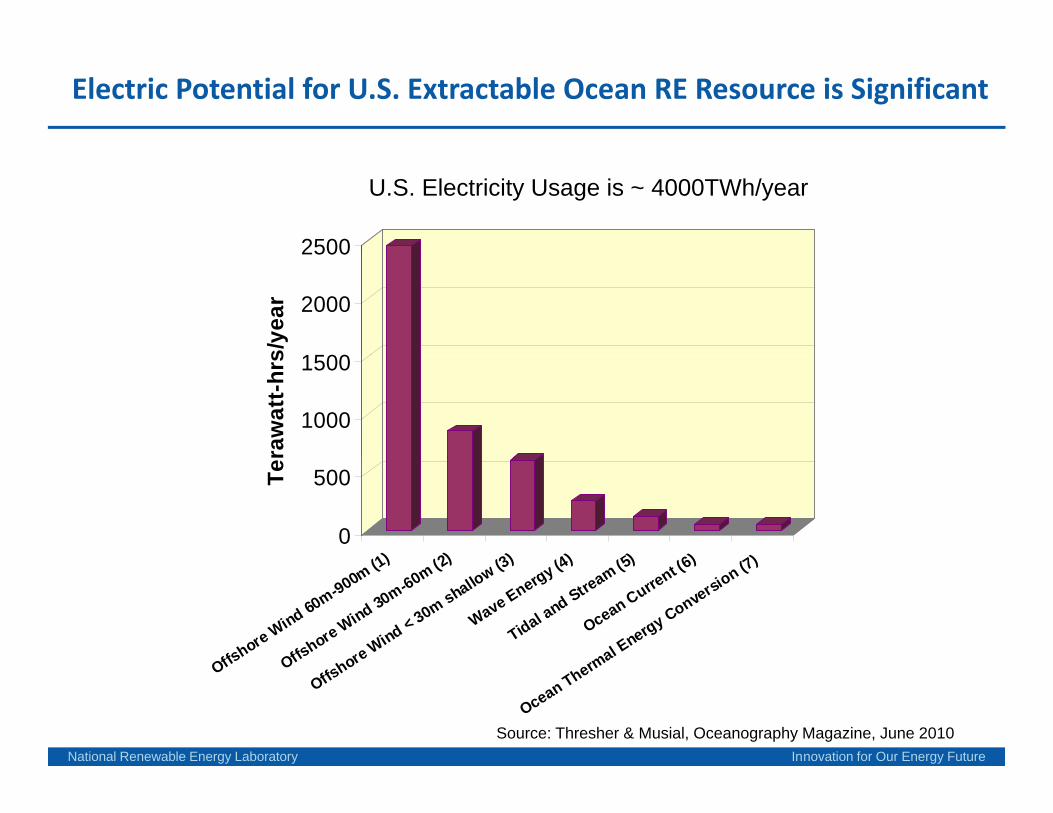
Electric Potential for U.S. Extractable Ocean RE Resource is Significant
2500
U.S. Electricity Usage is ~ 4000TWh/year
1500
2000
2500s/
year
1000
1500
raw
att-
hrs
0
500Te
(1) (2) (3) (4) (5) (6) 7)
Offshore Wind 60m-900m (1)
Offshore Wind 30m-60m (2)
hore Wind < 30m shallow (3)
Wave Energy (4)
Tidal and Stream (5)
Ocean Current (6
)
rmal Energy Conversion (7)
National Renewable Energy Laboratory Innovation for Our Energy Future
Off OOffshor
Ocean Therm
Source: Thresher & Musial, Oceanography Magazine, June 2010
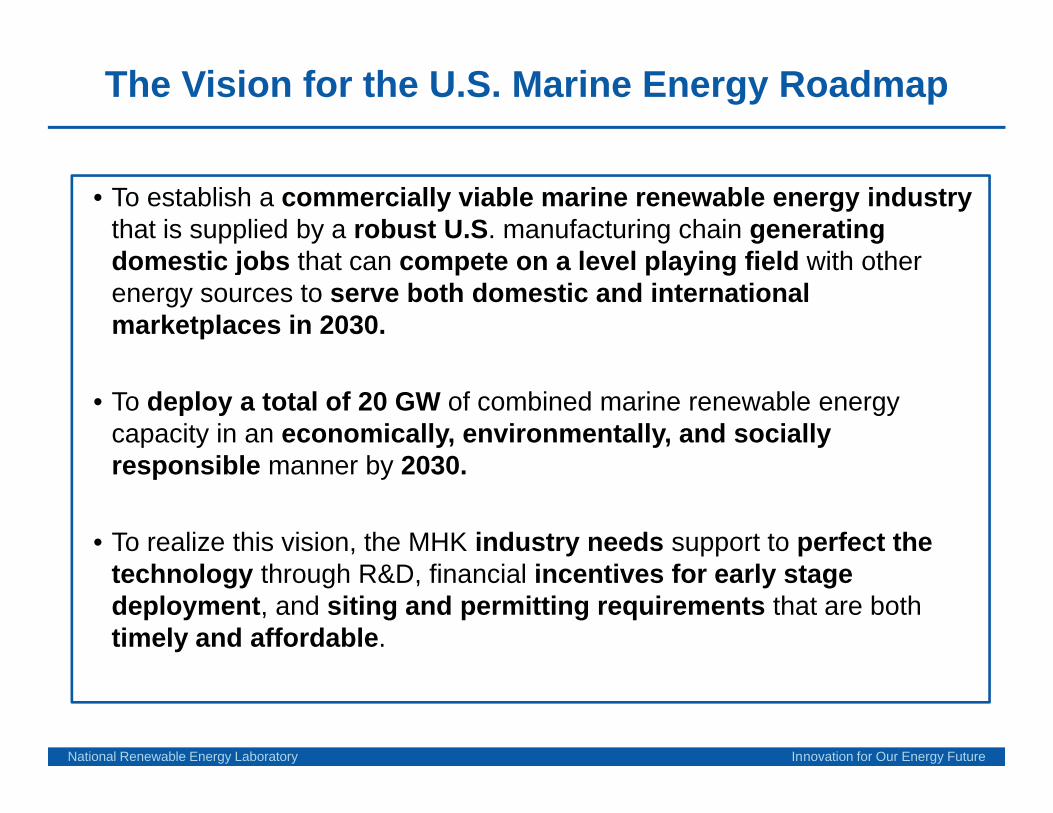
The Vision for the U.S. Marine Energy Roadmap
• To establish a commercially viable marine renewable energy industry that is supplied by a robust U.S. manufacturing chain generating d ti j b th t t l l l i fi ld ith thdomestic jobs that can compete on a level playing field with other energy sources to serve both domestic and international marketplaces in 2030.
• To deploy a total of 20 GW of combined marine renewable energy capacity in an economically, environmentally, and socially
ibl b 2030responsible manner by 2030.
• To realize this vision, the MHK industry needs support to perfect the technology through R&D, financial incentives for early stage deployment, and siting and permitting requirements that are both timely and affordable.
National Renewable Energy Laboratory Innovation for Our Energy Future
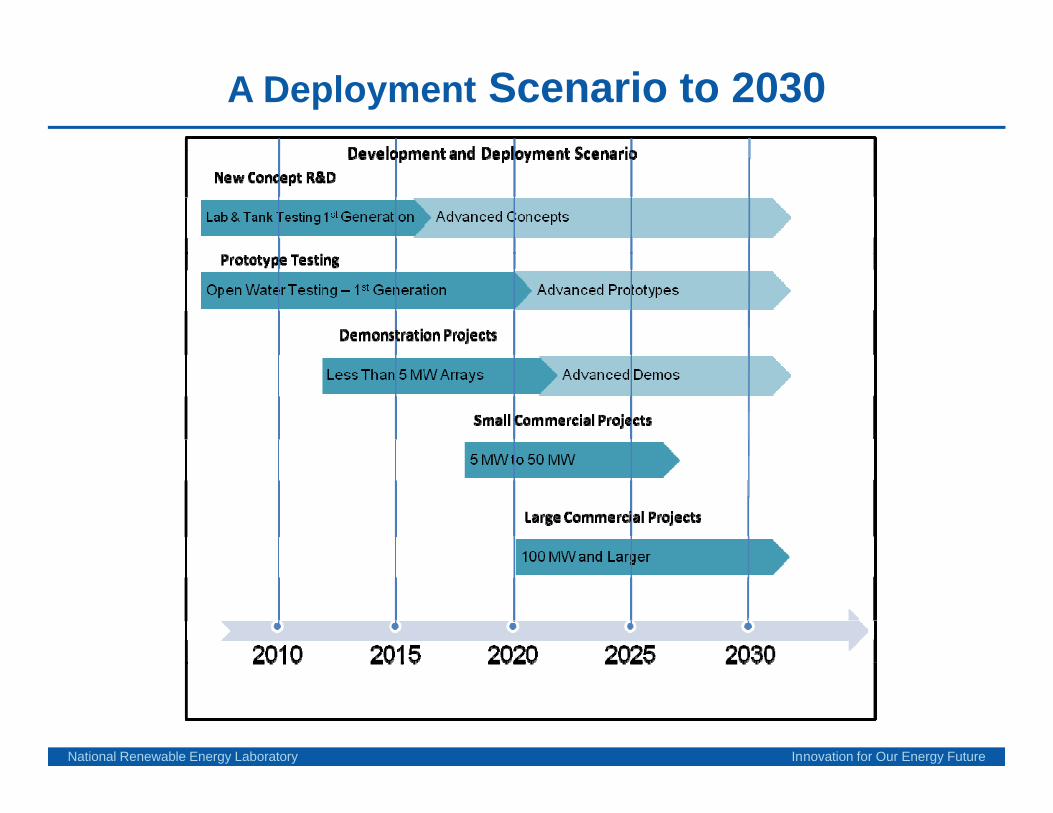
A Deployment Scenario to 2030
National Renewable Energy Laboratory Innovation for Our Energy Future
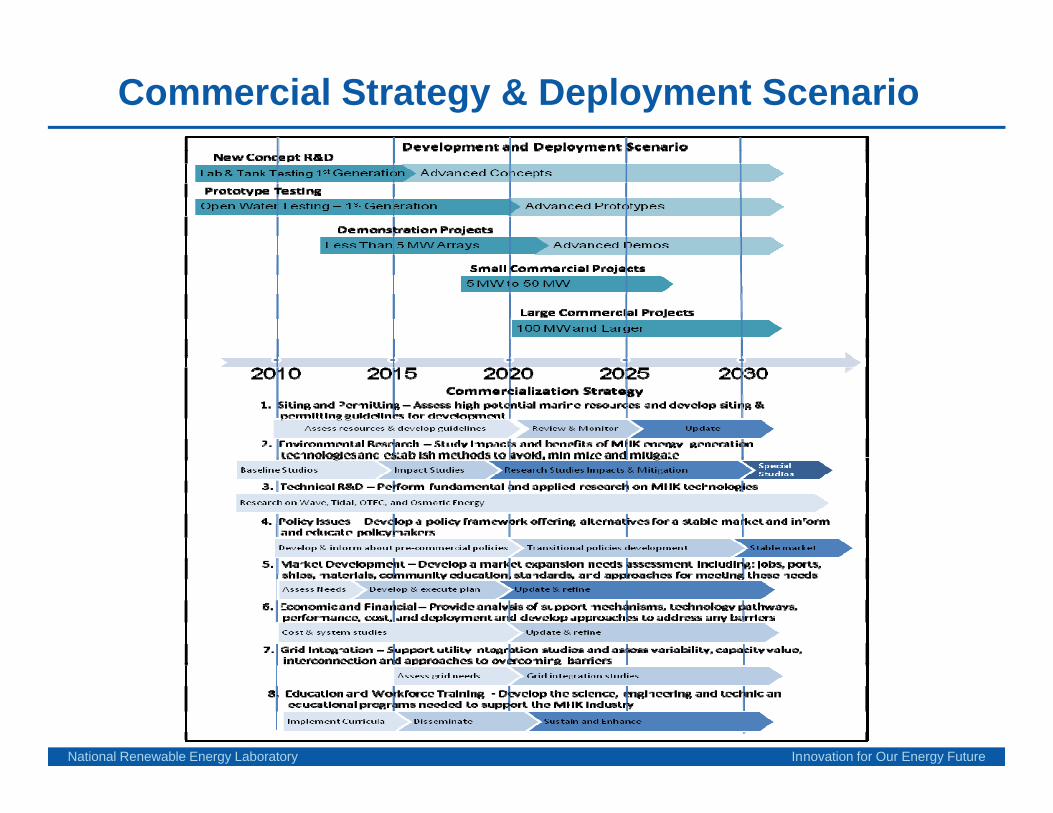
Commercial Strategy & Deployment Scenario
National Renewable Energy Laboratory Innovation for Our Energy Future
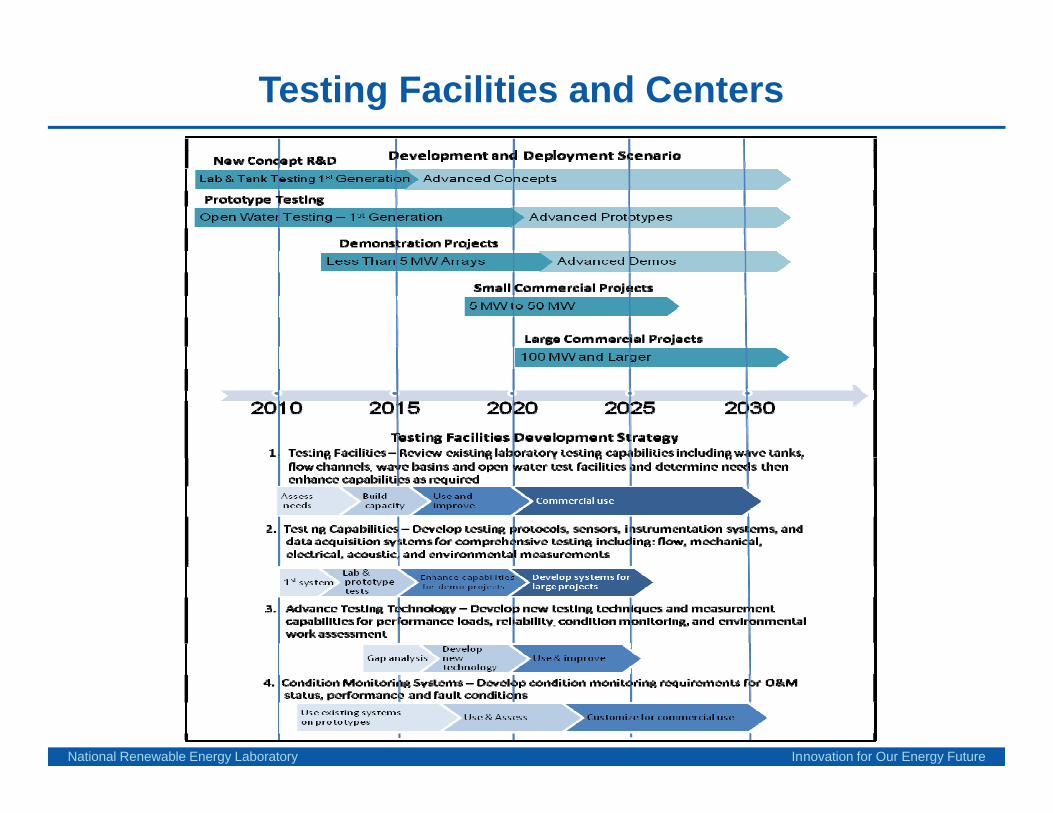
Testing Facilities and Centers
National Renewable Energy Laboratory Innovation for Our Energy Future
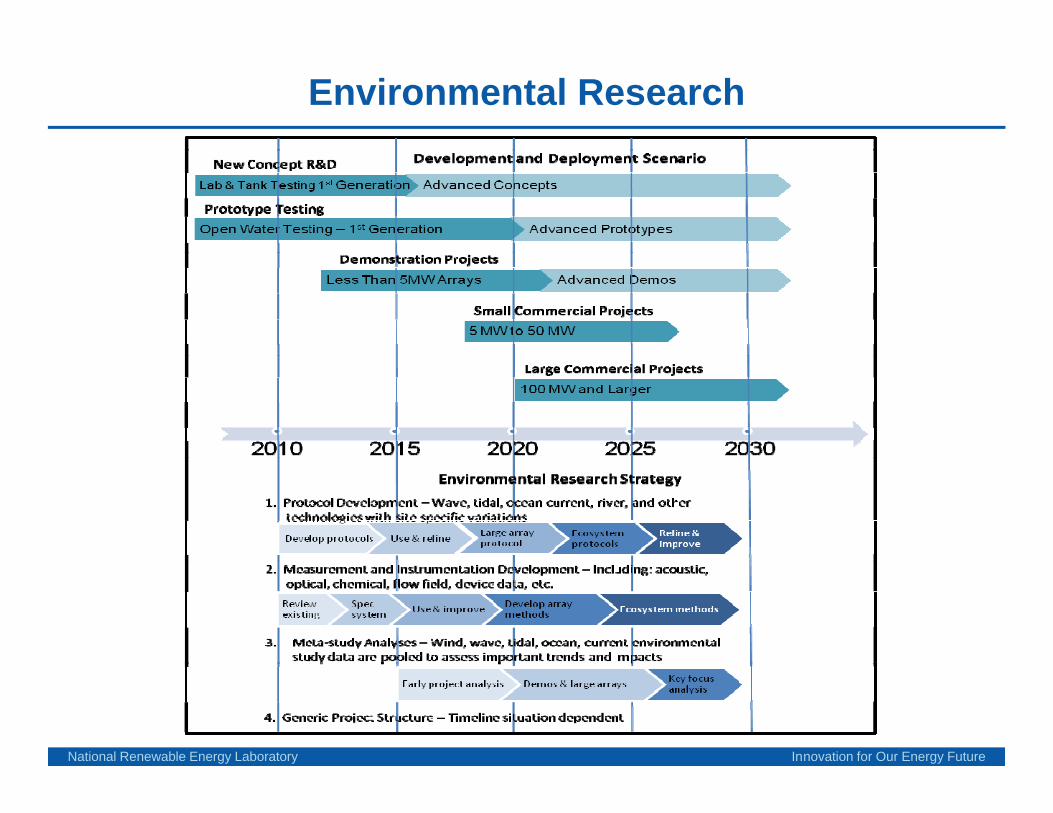
Environmental Research
National Renewable Energy Laboratory Innovation for Our Energy Future
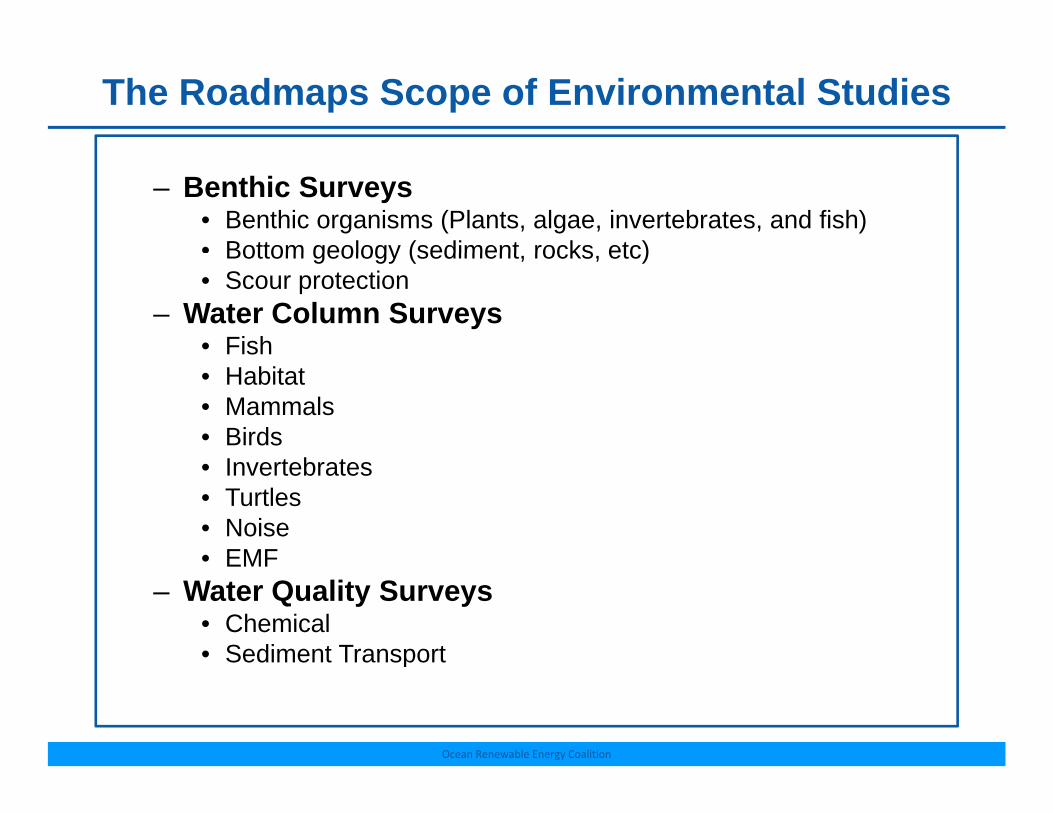
The Roadmaps Scope of Environmental Studies
– Benthic Surveys• Benthic organisms (Plants, algae, invertebrates, and fish)• Bottom geology (sediment rocks etc)Bottom geology (sediment, rocks, etc)• Scour protection
– Water Column Surveys• Fish• Habitat• Mammals• Birds
I t b t• Invertebrates• Turtles• Noise• EMF• EMF
– Water Quality Surveys• Chemical • Sediment Transport
National Renewable Energy Laboratory Innovation for Our Energy Future
p
Ocean Renewable Energy Coalition
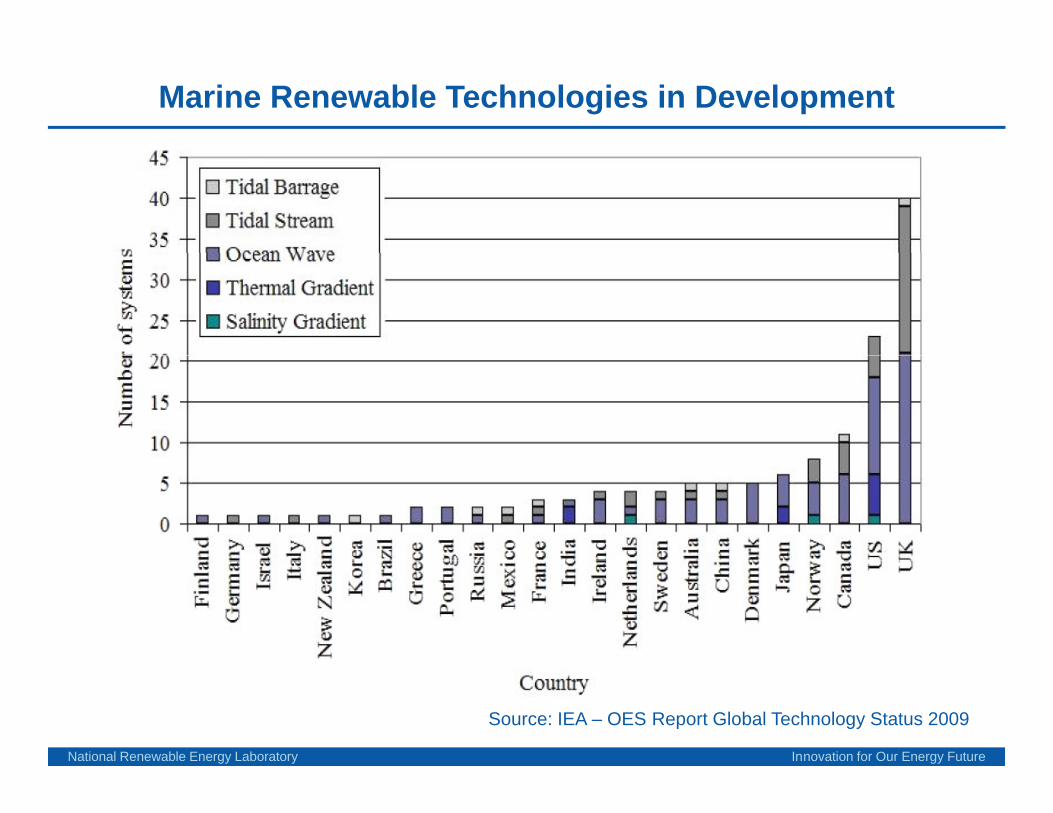
Marine Renewable Technologies in Development
National Renewable Energy Laboratory Innovation for Our Energy Future
Source: IEA – OES Report Global Technology Status 2009
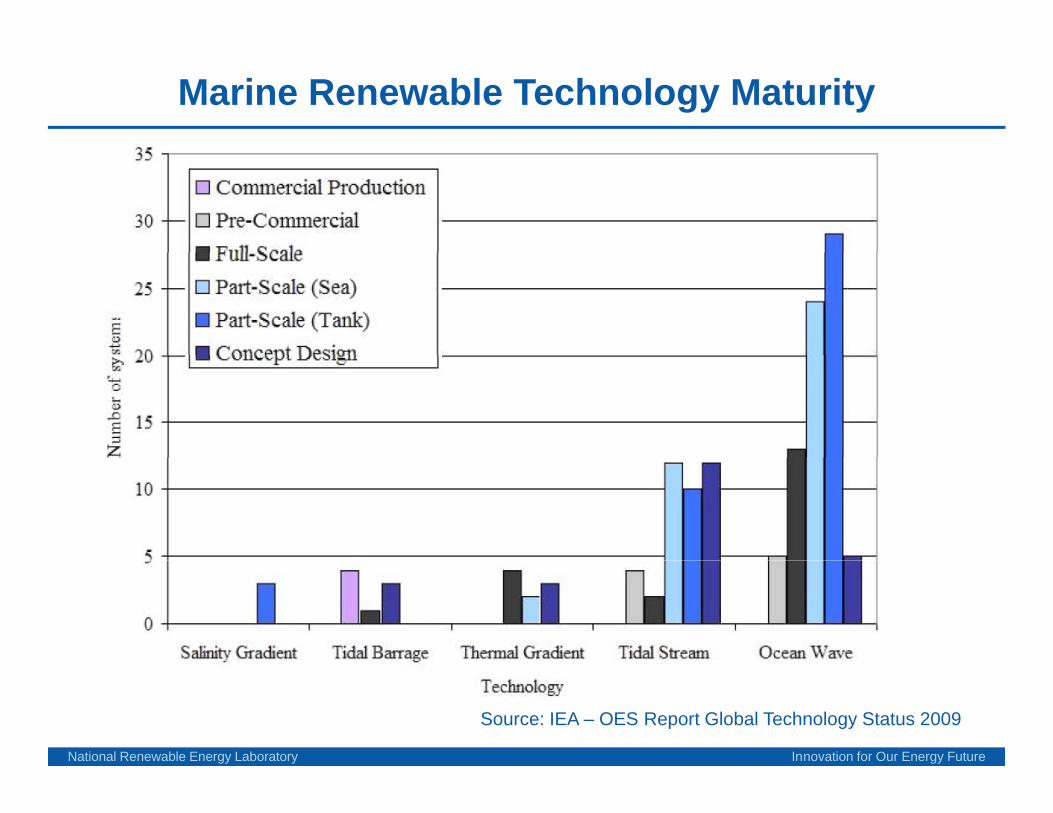
Marine Renewable Technology Maturity
National Renewable Energy Laboratory Innovation for Our Energy Future
Source: IEA – OES Report Global Technology Status 2009
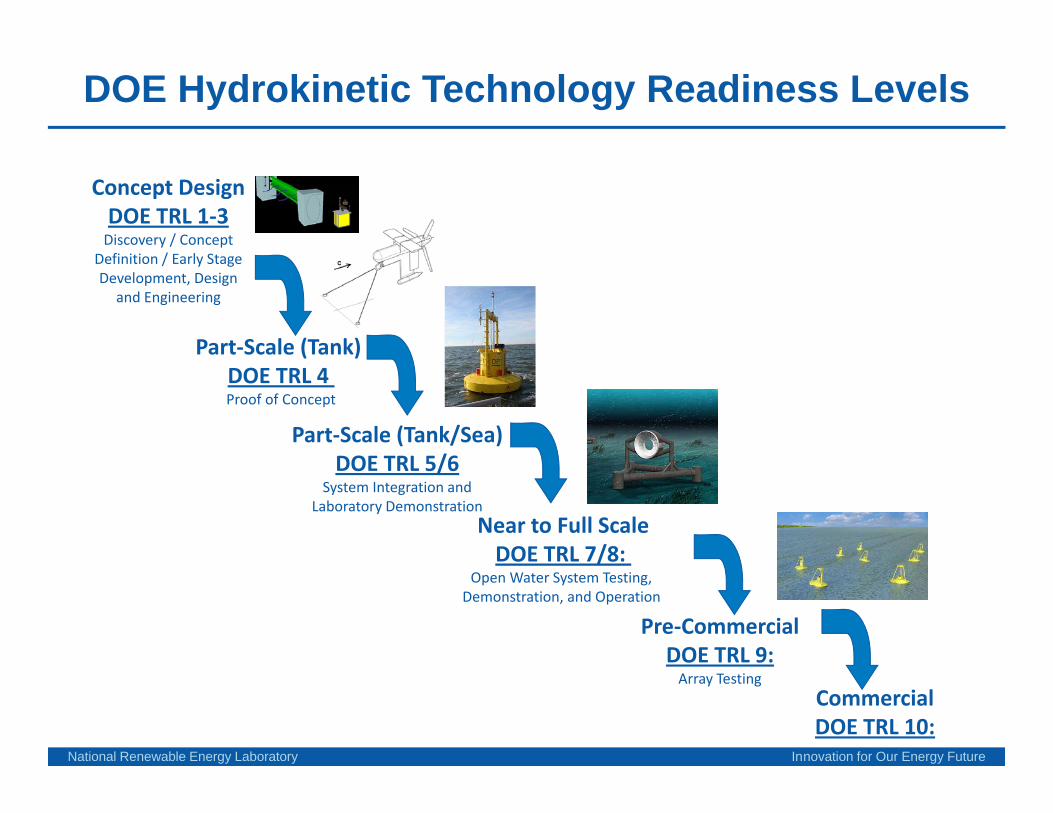
DOE Hydrokinetic Technology Readiness Levels
Concept DesignDOE TRL 1‐3 Discovery / Concept
/Definition / Early Stage Development, Design
and Engineering
Part‐Scale (Tank) ( )DOE TRL 4 Proof of Concept
Part‐Scale (Tank/Sea)DOE TRL 5/6DOE TRL 5/6
System Integration and Laboratory Demonstration
Near to Full ScaleDOE TRL 7/8:DOE TRL 7/8:
Open Water System Testing, Demonstration, and Operation
Pre‐CommercialDOE TRL 9:
National Renewable Energy Laboratory Innovation for Our Energy Future
Array TestingCommercialDOE TRL 10:
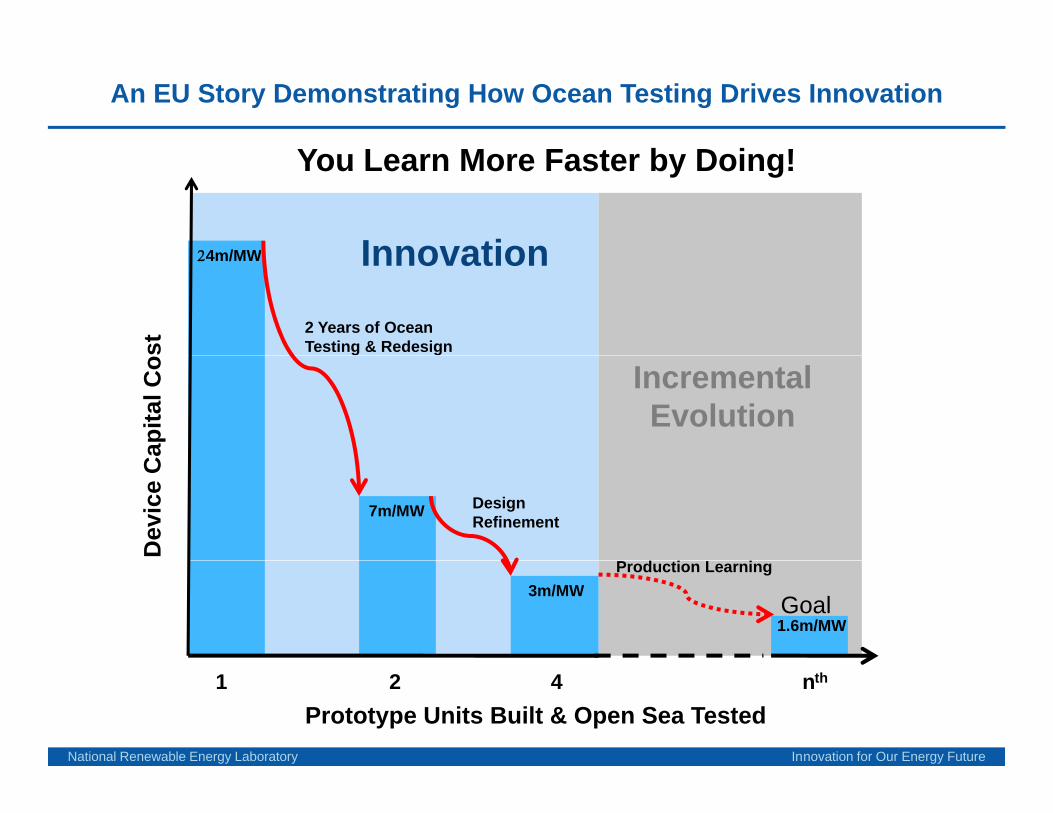
An EU Story Demonstrating How Ocean Testing Drives Innovation
Y L M F t b D i !
24m/MW Innovation
You Learn More Faster by Doing!st
24m/MW
2 Years of Ocean Testing & Redesign
Innovation
Cap
ital C
o IncrementalEvolution
Dev
ice
C
7m/MW DesignRefinement
3m/MWGoal1.6m/MW
Production Learning
National Renewable Energy Laboratory Innovation for Our Energy Future
Prototype Units Built & Open Sea Tested1 2 4 nth
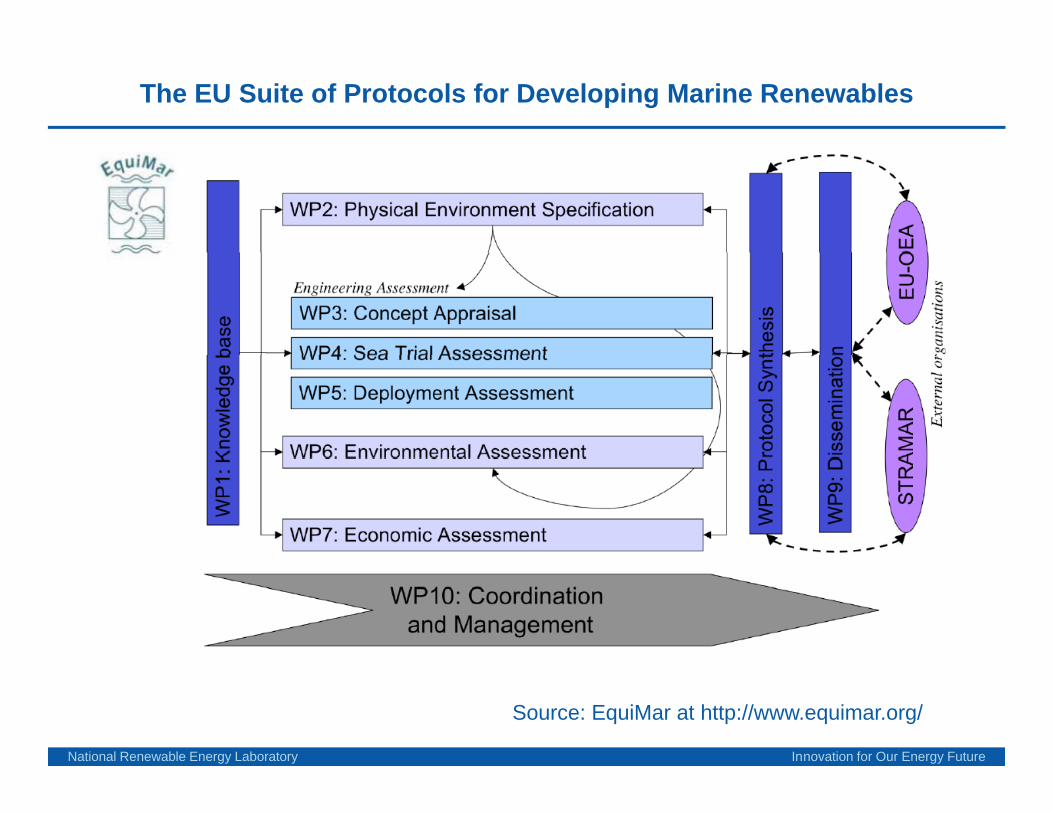
The EU Suite of Protocols for Developing Marine Renewables
National Renewable Energy Laboratory Innovation for Our Energy Future
Source: EquiMar at http://www.equimar.org/
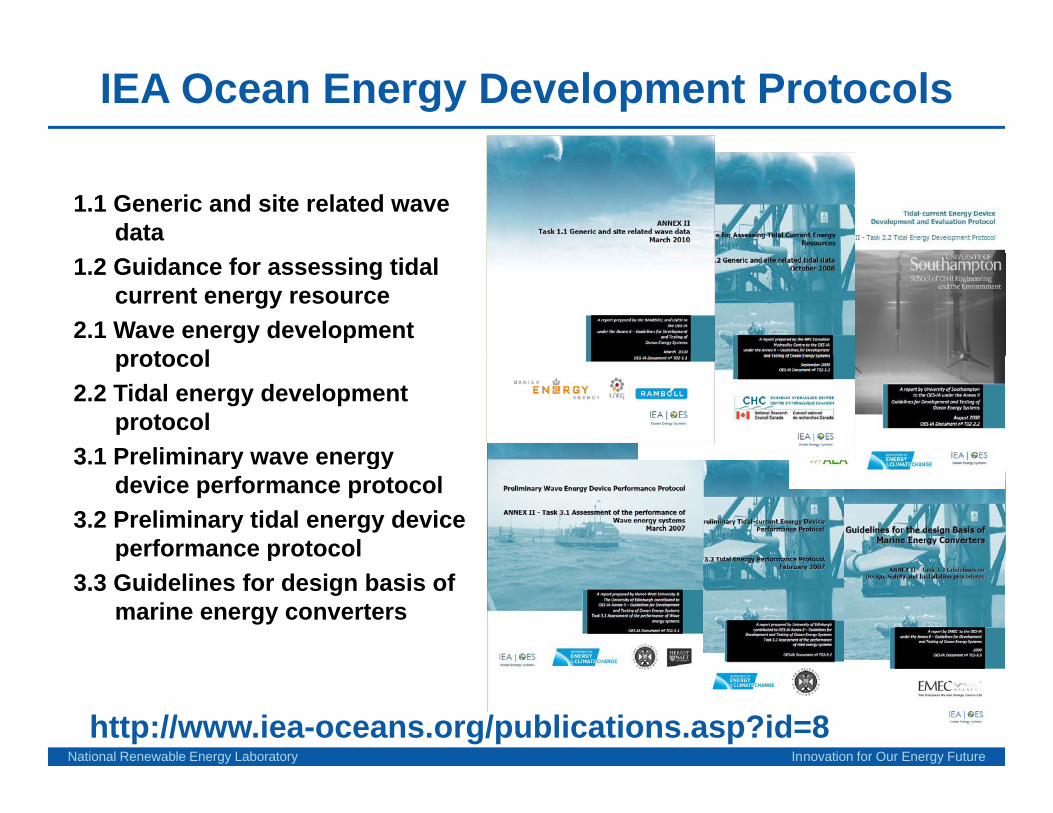
IEA Ocean Energy Development Protocols
1.1 Generic and site related wave data
1.2 Guidance for assessing tidal current energy resource
2.1 Wave energy development protocolprotocol
2.2 Tidal energy development protocol
3 1 Preliminary wave energy3.1 Preliminary wave energy device performance protocol
3.2 Preliminary tidal energy device performance protocolp p
3.3 Guidelines for design basis of marine energy converters
National Renewable Energy Laboratory Innovation for Our Energy Future
http://www.iea-oceans.org/publications.asp?id=8
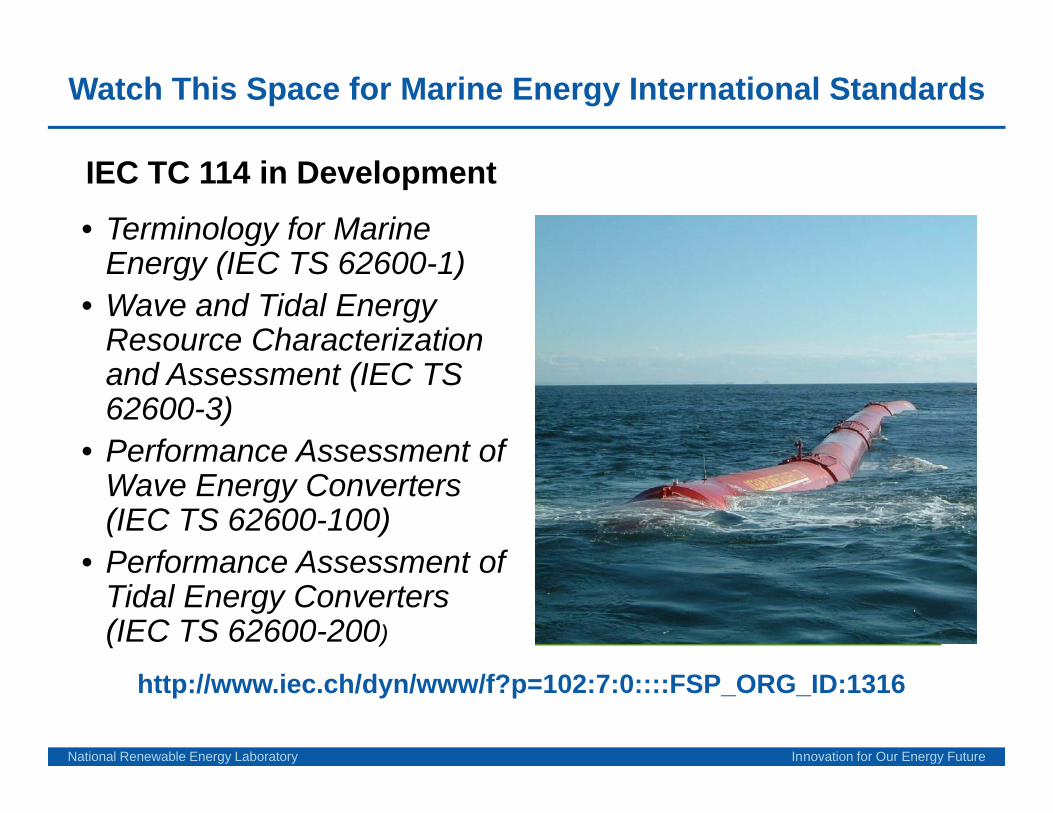
Watch This Space for Marine Energy International Standards
IEC TC 114 in Development
• Terminology for Marine E (IEC TS 62600 1)Energy (IEC TS 62600-1)
• Wave and Tidal Energy Resource Characterization and Assessment (IEC TS 62600-3)
• Performance Assessment ofPerformance Assessment of Wave Energy Converters (IEC TS 62600-100)
• Performance Assessment of• Performance Assessment of Tidal Energy Converters (IEC TS 62600-200)
National Renewable Energy Laboratory Innovation for Our Energy Future
http://www.iec.ch/dyn/www/f?p=102:7:0::::FSP_ORG_ID:1316
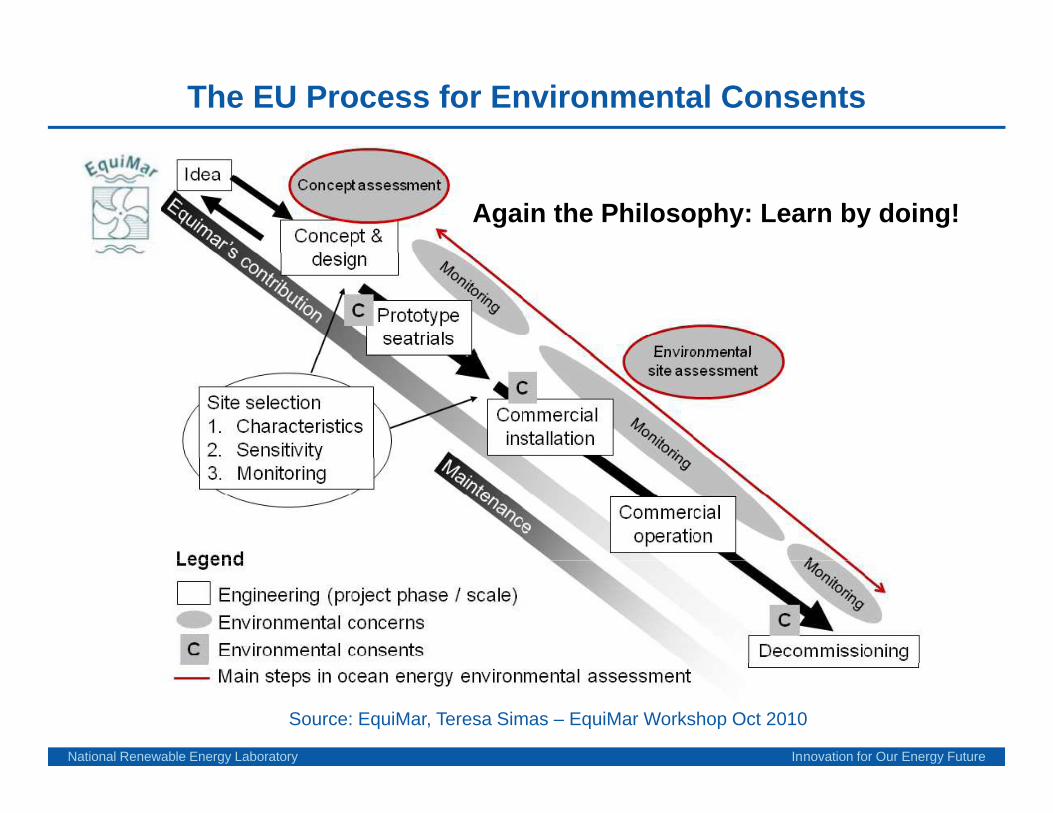
The EU Process for Environmental Consents
Again the Philosophy: Learn by doing!
National Renewable Energy Laboratory Innovation for Our Energy Future
Source: EquiMar, Teresa Simas – EquiMar Workshop Oct 2010
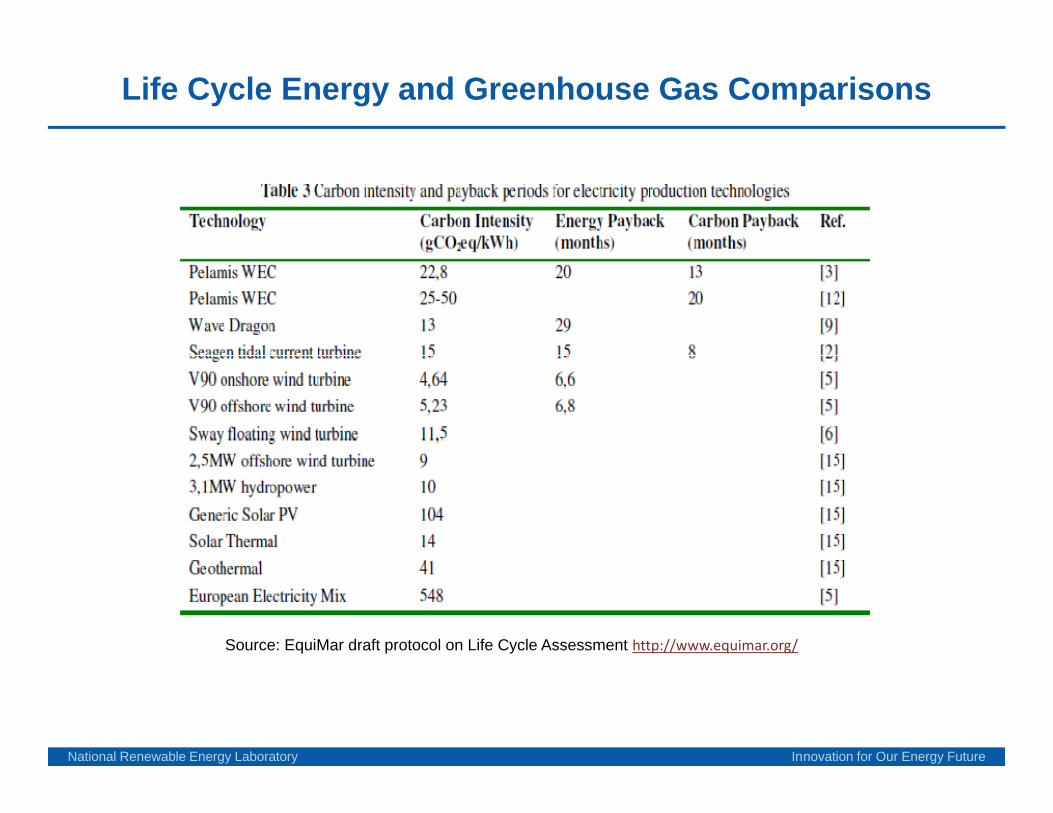
Life Cycle Energy and Greenhouse Gas Comparisons
Source: EquiMar draft protocol on Life Cycle Assessment http://www.equimar.org/
National Renewable Energy Laboratory Innovation for Our Energy Future
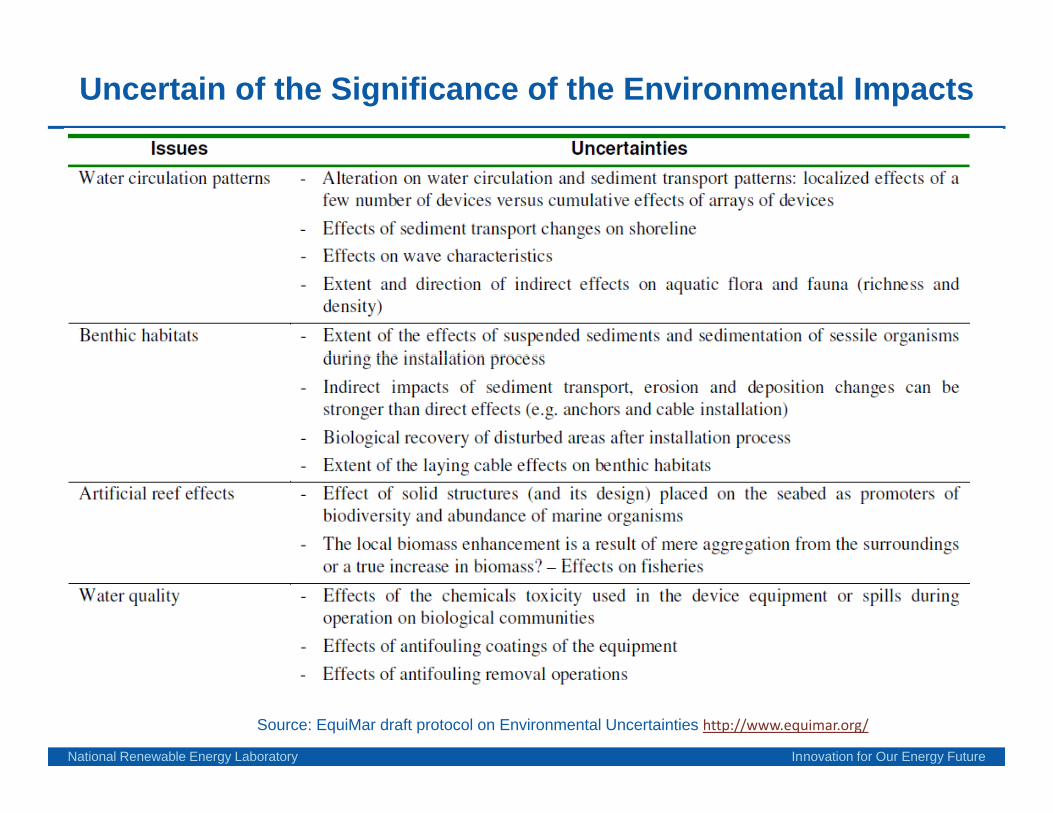
Uncertain of the Significance of the Environmental Impacts
National Renewable Energy Laboratory Innovation for Our Energy Future
Source: EquiMar draft protocol on Environmental Uncertainties http://www.equimar.org/
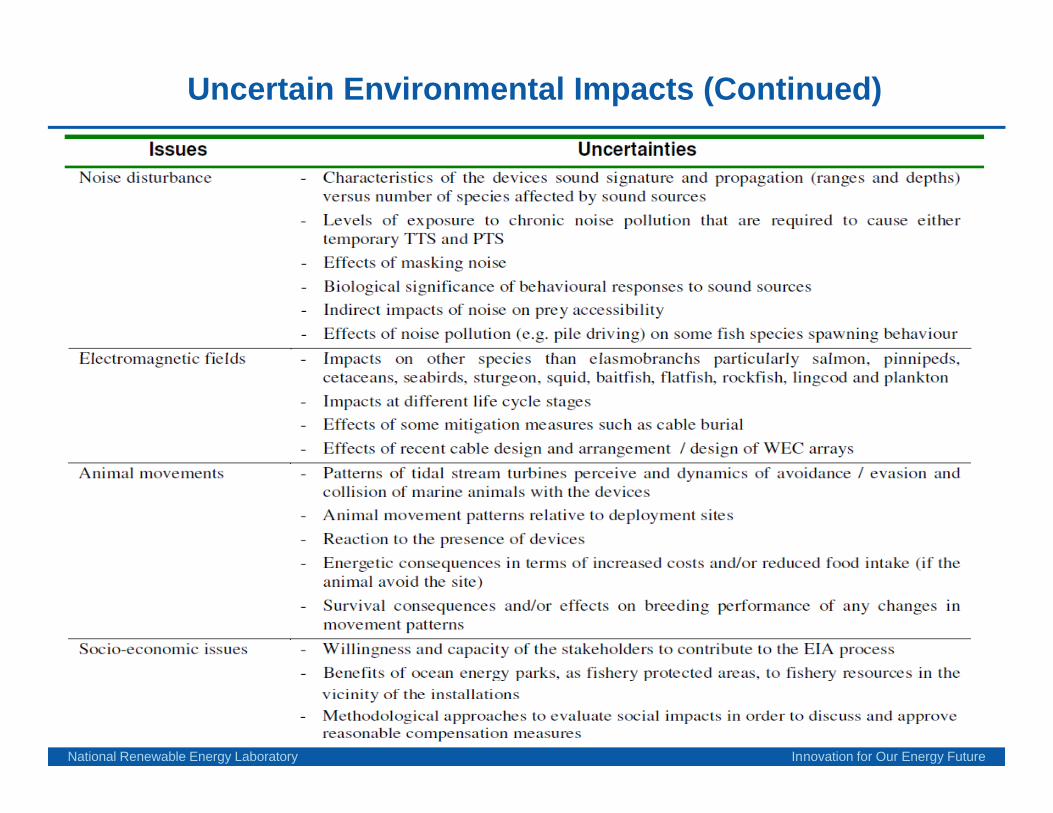
Uncertain Environmental Impacts (Continued)
National Renewable Energy Laboratory Innovation for Our Energy Future
A Wind Energy Example: Minnesota Local Economic Impacts
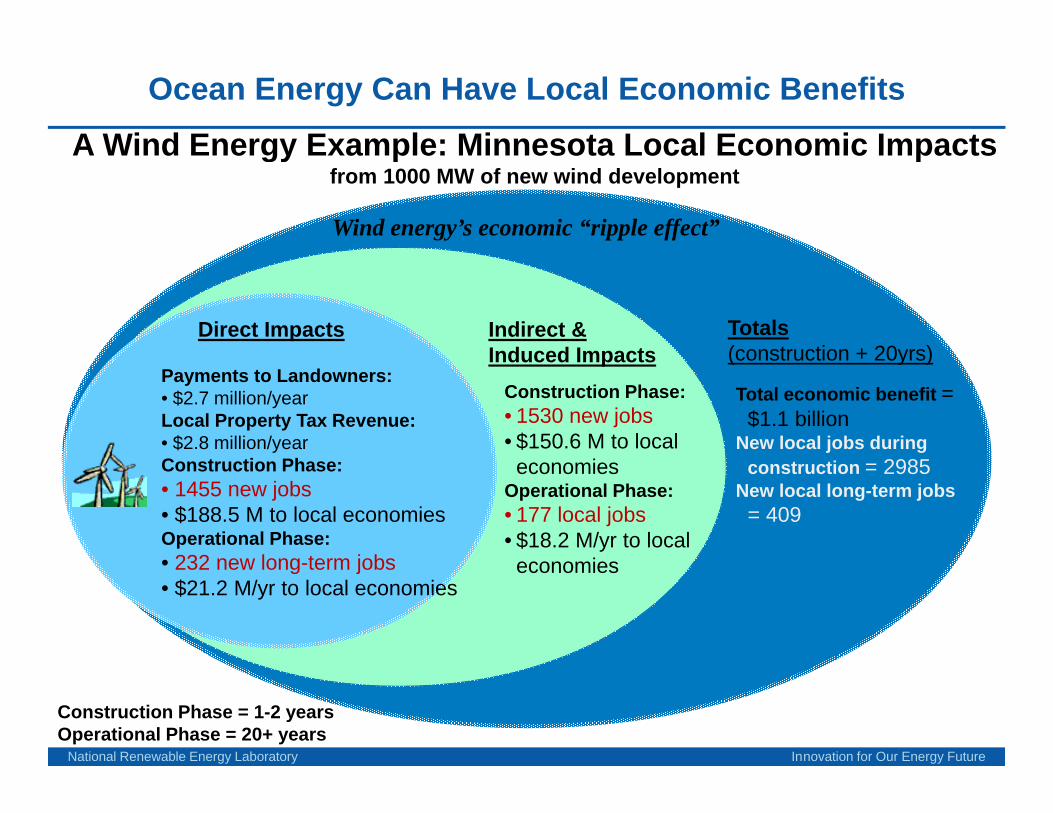
Ocean Energy Can Have Local Economic Benefits
A Wind Energy Example: Minnesota Local Economic Impacts from 1000 MW of new wind development
Wind energy’s economic “ripple effect”
Direct Impacts Indirect & Induced Impacts
Totals (construction + 20yrs)
Payments to Landowners: • $2.7 million/yearLocal Property Tax Revenue:• $2.8 million/yearC
Construction Phase:• 1530 new jobs• $150.6 M to local
Total economic benefit = $1.1 billion
New local jobs during
Induced Impacts (construction + 20yrs)
Construction Phase:• 1455 new jobs• $188.5 M to local economiesOperational Phase:• 232 new long term jobs
economiesOperational Phase:• 177 local jobs• $18.2 M/yr to local
i
construction = 2985New local long-term jobs= 409
• 232 new long-term jobs• $21.2 M/yr to local economies
economies
National Renewable Energy Laboratory Innovation for Our Energy Future
Construction Phase = 1-2 yearsOperational Phase = 20+ years
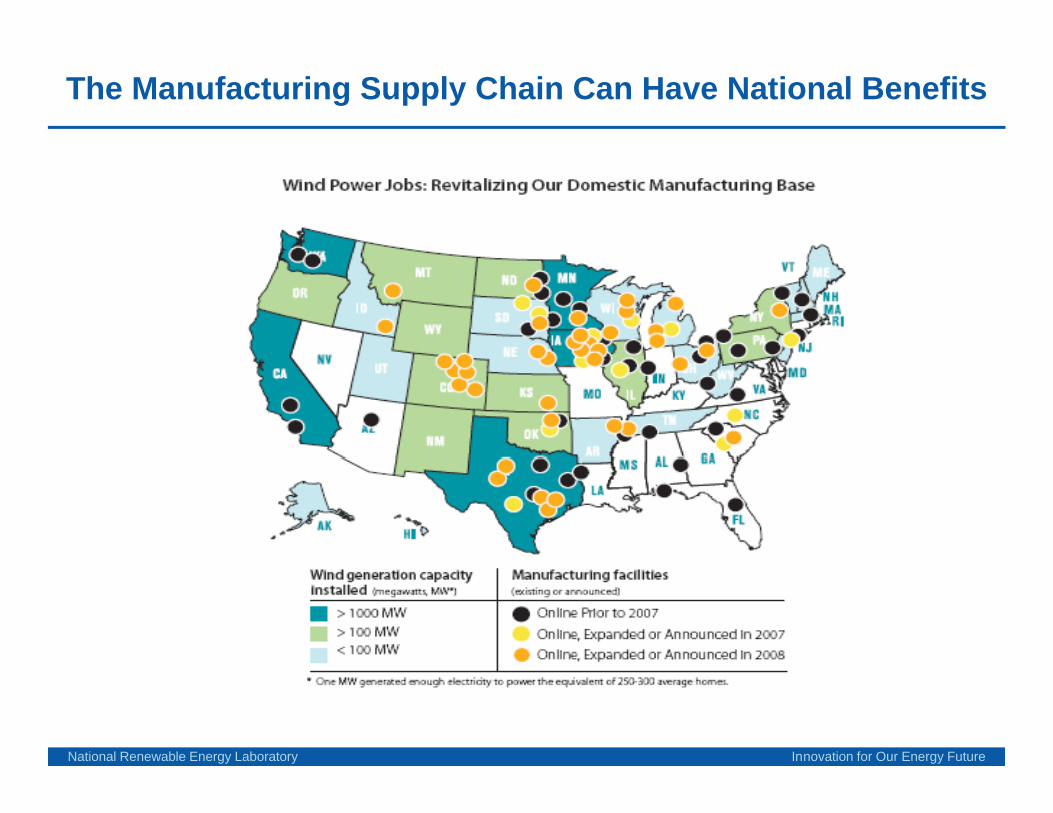
The Manufacturing Supply Chain Can Have National Benefits
National Renewable Energy Laboratory Innovation for Our Energy Future
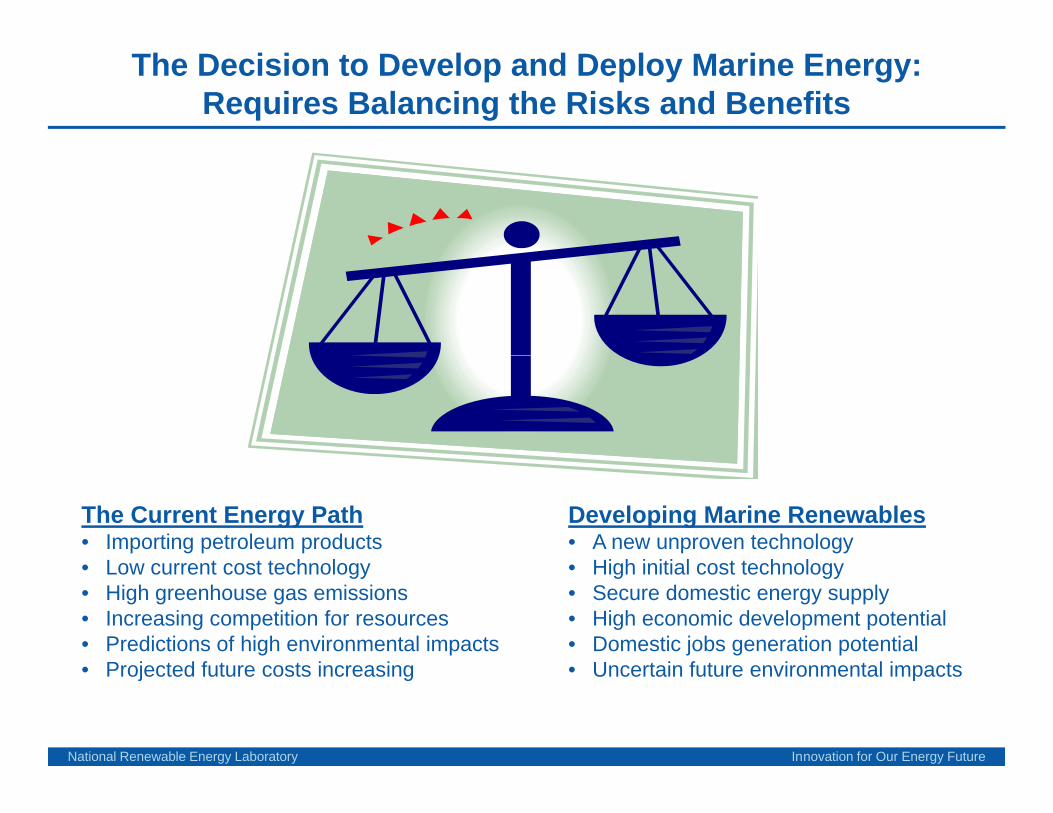
The Decision to Develop and Deploy Marine Energy: Requires Balancing the Risks and Benefits
The Current Energy Path• Importing petroleum products
L t t t h l
Developing Marine Renewables• A new unproven technology
Hi h i iti l t t h l• Low current cost technology• High greenhouse gas emissions• Increasing competition for resources • Predictions of high environmental impacts
P j t d f t t i i
• High initial cost technology • Secure domestic energy supply • High economic development potential • Domestic jobs generation potential
U t i f t i t l i t
National Renewable Energy Laboratory Innovation for Our Energy Future
• Projected future costs increasing • Uncertain future environmental impacts
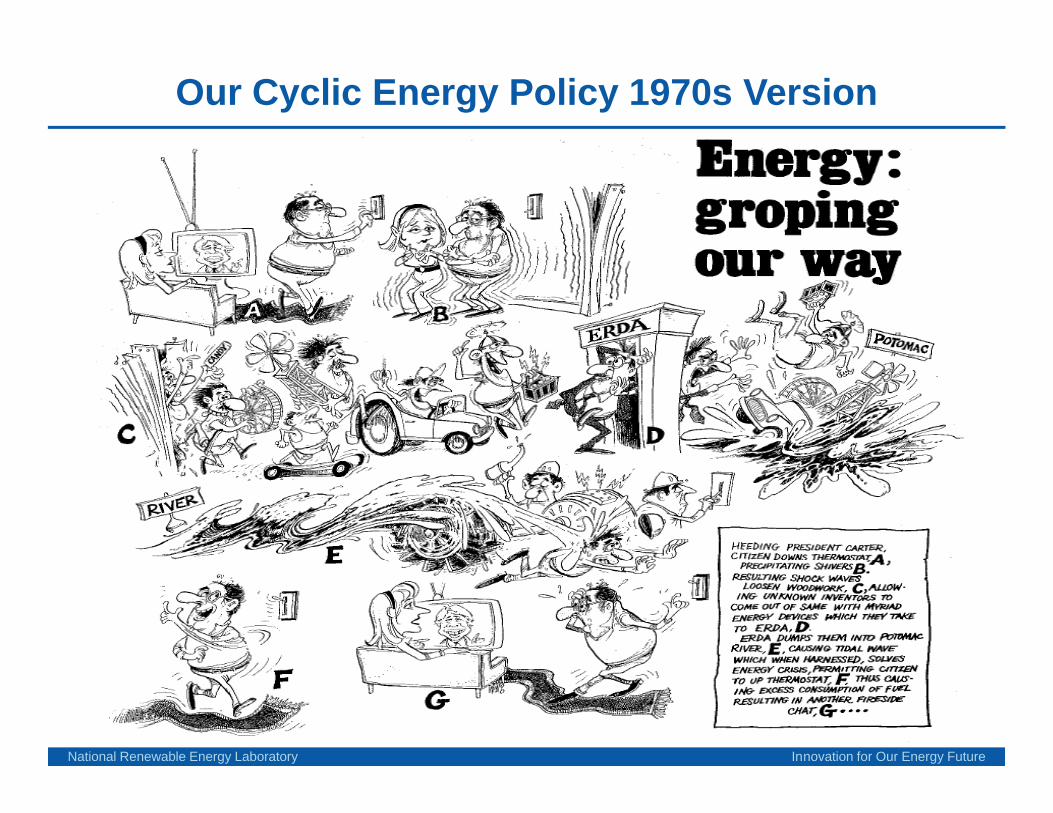
Our Cyclic Energy Policy 1970s Version
National Renewable Energy Laboratory Innovation for Our Energy Future
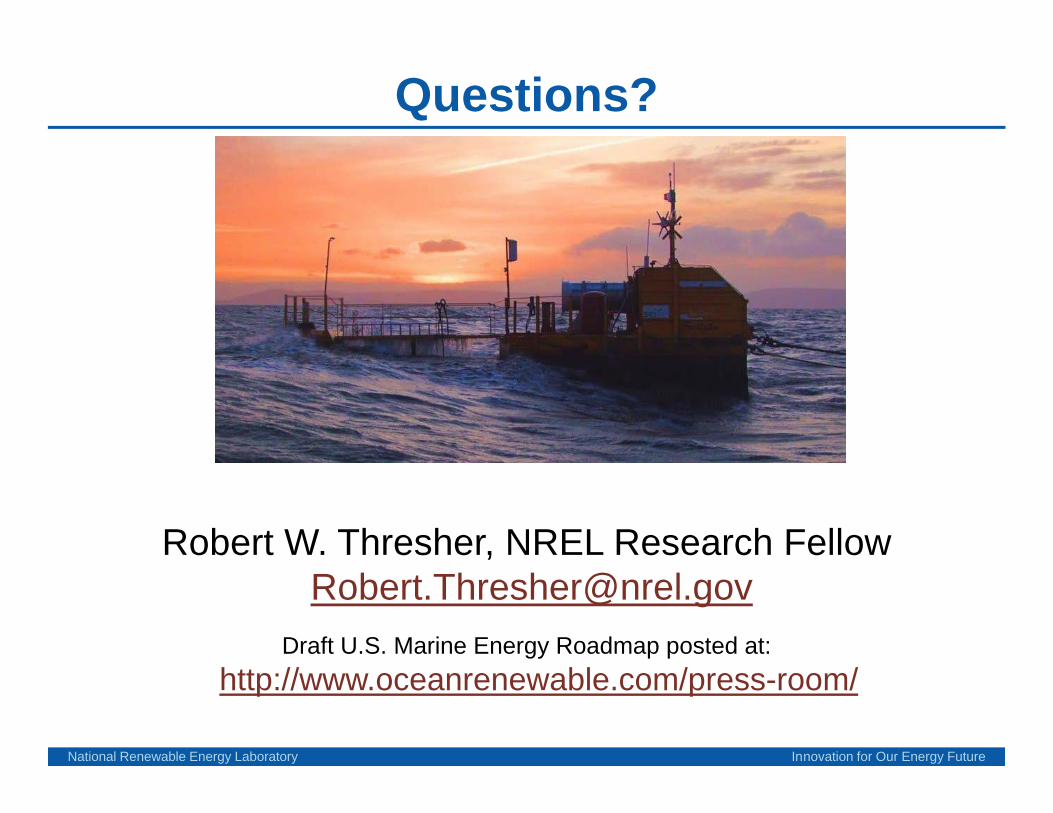
Questions?
Robert W. Thresher, NREL Research [email protected]
Draft U.S. Marine Energy Roadmap posted at:
National Renewable Energy Laboratory Innovation for Our Energy Future
http://www.oceanrenewable.com/press-room/


