Our atmosphere is incredibly unique and hospitable. Without our atmosphere, life would not be...
73
UNIT XV: WEATHER AND CLIMATE
-
Upload
darren-sharrow -
Category
Documents
-
view
220 -
download
1
Transcript of Our atmosphere is incredibly unique and hospitable. Without our atmosphere, life would not be...

UNIT XV: WEATHER AND CLIMATE

Our atmosphere is incredibly unique and hospitable. Without our atmosphere, life would not be possible on Earth. Fortunately, the gravitational pull of the Earth holds our atmosphere against the planet.
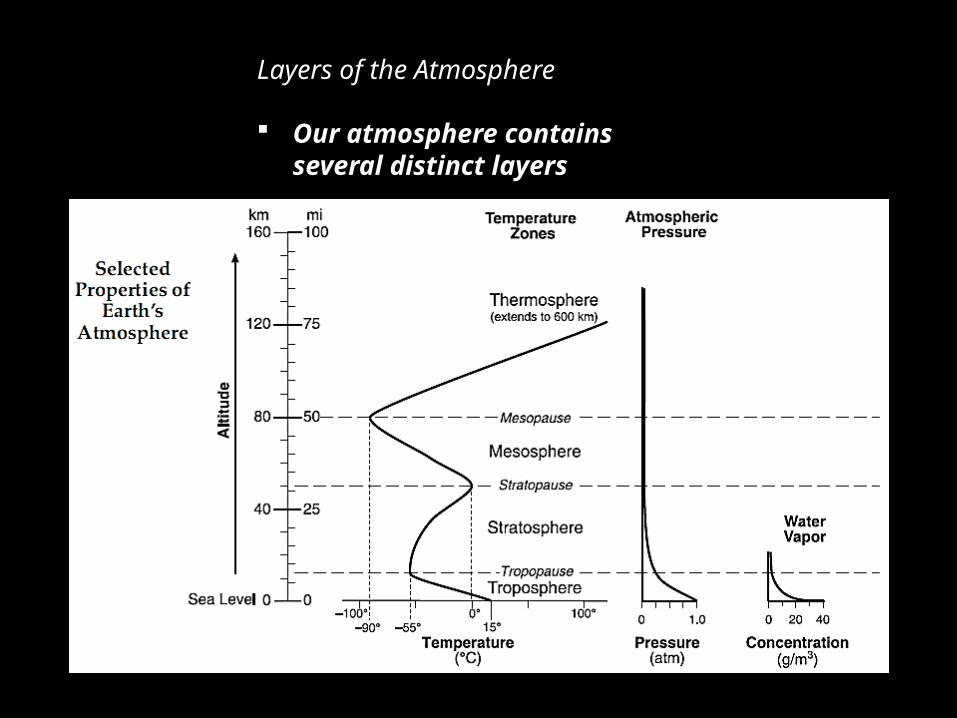
Layers of the Atmosphere
Our atmosphere contains several distinct layers

Characteristics of the Atmosphere
The layers of the atmosphere are defined by changes in temperature

Unique Layer: The Ozone Layer
The ozone layer is located in the stratosphere
Ozone (O3) protects organisms on Earth’s surface from the majority of the Sun’s ultraviolet (UV) radiation
To truly understand weather and climate, you must first understand the methods of transference of heat energy that take place on and around Earth. Once heat is transferred, it impacts the density of a substance causing it to change its properties and positioning. This applies to solids, liquids, and gases.
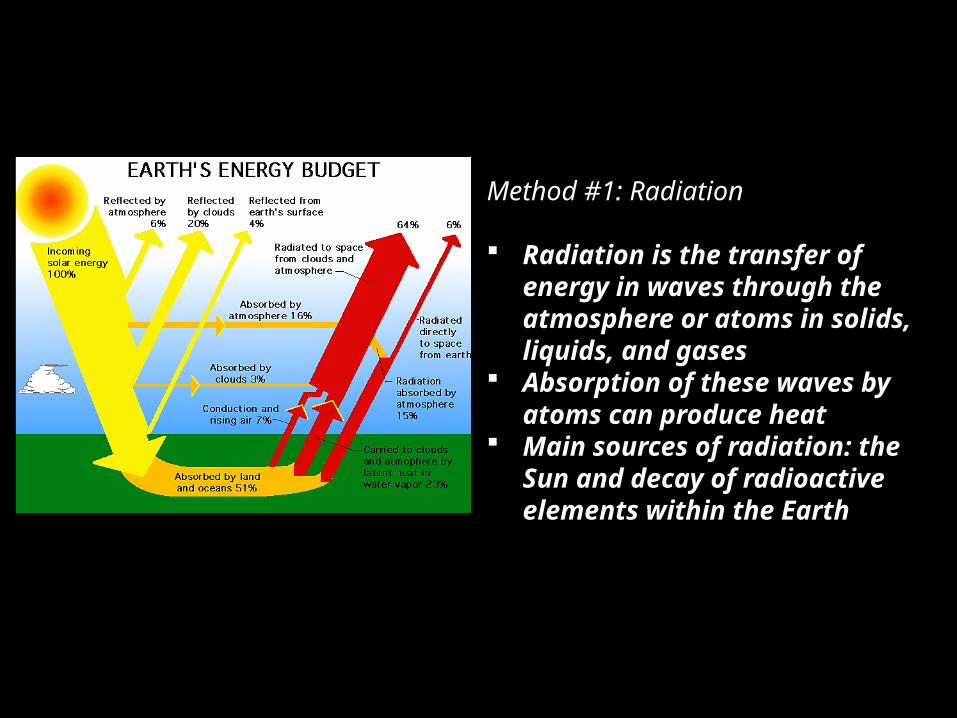
Method #1: Radiation
Radiation is the transfer of energy in waves through the atmosphere or atoms in solids, liquids, and gases
Absorption of these waves by atoms can produce heat
Main sources of radiation: the Sun and decay of radioactive elements within the Earth

Method #2: Convection
Warmer, less dense substances rise and transfer their heat energy upward
Commonly found: atmosphere (rising warm air, cloud formation as it cools); asthenosphere (mantle convection)

Method #3: Conduction
Transfer of energy through atoms in contact with each other
Example: metamorphism of rocks in contact with magma; as distance from magma increases, the grade of metamorphism decreases

The Greenhouse Effect: Allowing Life to Continue
Atmospheric gases insulate the Earth in a phenomenon known as the greenhouse effect The sun warms the
surface of the Earth as its rays strike the ground and oceans
Infrared radiation bounces back into the atmosphere where it is absorbed and reemitted by gases that are present
This increased warming is called the greenhouse effect
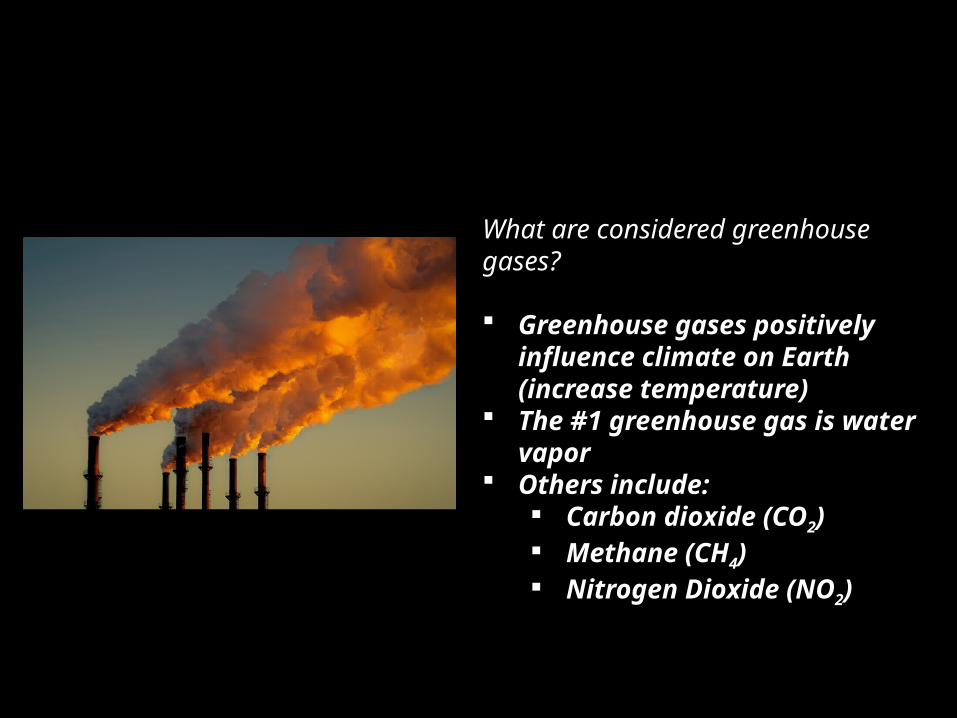
What are considered greenhouse gases?
Greenhouse gases positively influence climate on Earth (increase temperature)
The #1 greenhouse gas is water vapor
Others include: Carbon dioxide (CO2) Methane (CH4) Nitrogen Dioxide (NO2)
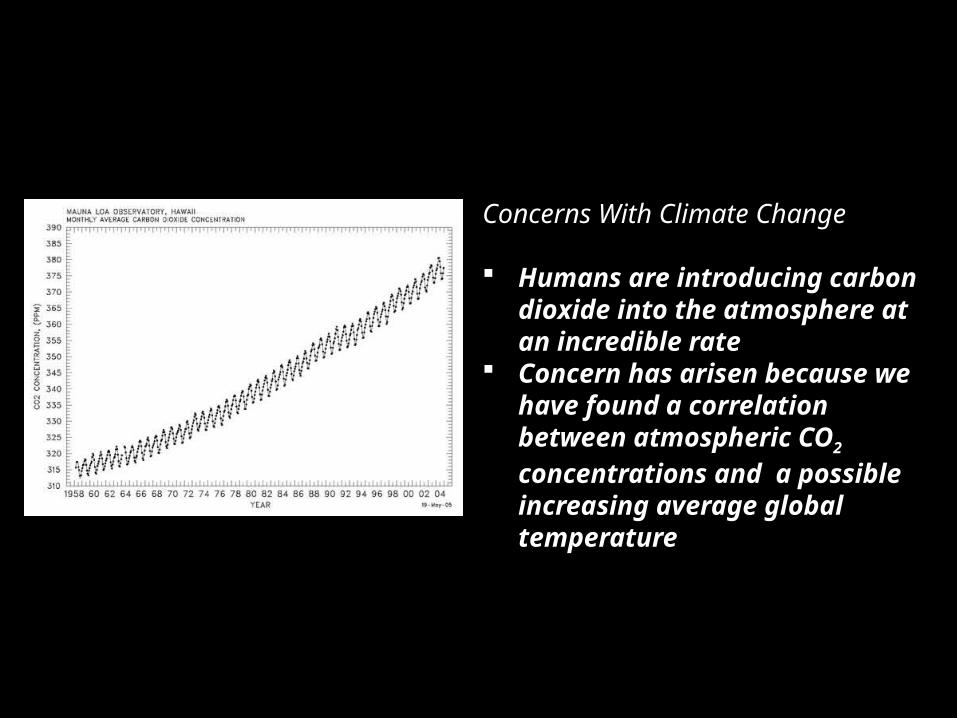
Concerns With Climate Change
Humans are introducing carbon dioxide into the atmosphere at an incredible rate
Concern has arisen because we have found a correlation between atmospheric CO2 concentrations and a possible increasing average global temperature

Other Influences on Worldwide Climate
Volcanic eruptions cool worldwide climate as particulates and sulfur dioxide are released into the atmosphere

Regional Climate Factors
Ocean currents increase humidity in an area and moderate climate (warmer or cooler based on the type of current)
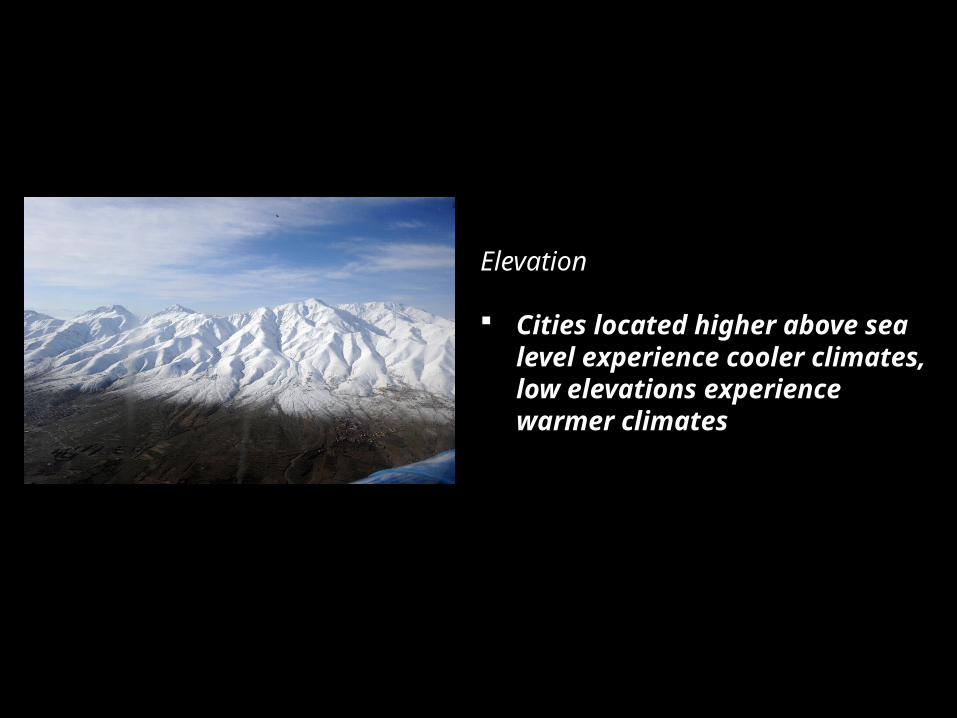
Elevation
Cities located higher above sea level experience cooler climates, low elevations experience warmer climates

Latitude
Latitude has the most significant impact on climate
Recall that the Sun is directly overhead latitudes between 23.5o North and 23.5o South depending on the time of year
The more direct the rays, the warmer the climate (also more evaporation)

Angle of Incoming Solar Radiation (Insolation)
The more direct the rays, the warmer the climate (also more evaporation)
The rays are more direct during the summer for the Northern Hemisphere

While climate is the long-term description of temperature and humidity trends in an area, weather is the short-term description of these factors in an area. There are many variables to consider when generating a forecast.

Introducing Air Pressure
Air is a mixture of gases, primarily nitrogen and oxygen
These gases have mass, and this mass creates pressure on the surface of the Earth
This pressure is called air pressure

Measuring Air Pressure
Air pressure (more appropriately barometric pressure) is measured using a barometer

Barometric Pressure Conversions
Barometric pressure can be measured using the following units: atmospheres, millibars, and inches of mercury
Unfortunately, the units are not uniform or equal, so a conversion chart must be used (ESRT)
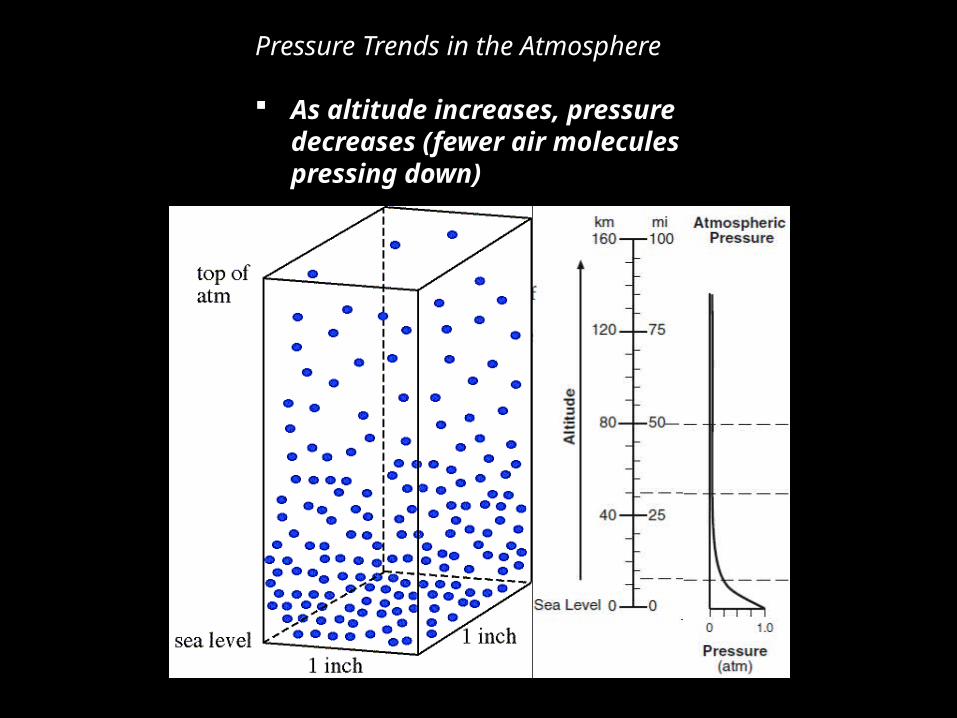
Pressure Trends in the Atmosphere
As altitude increases, pressure decreases (fewer air molecules pressing down)
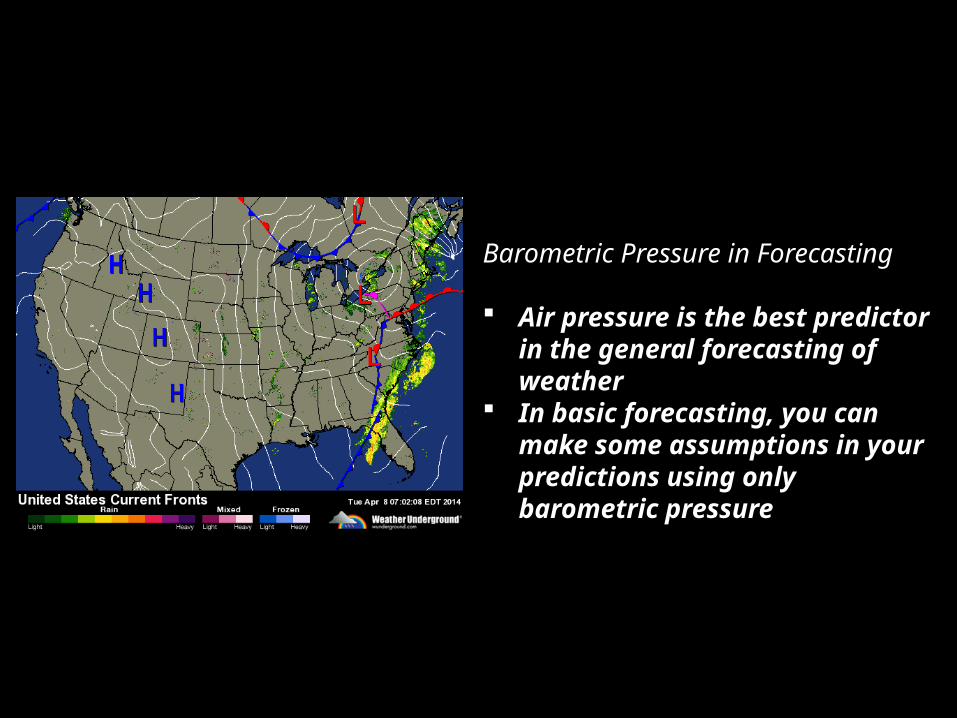
Barometric Pressure in Forecasting
Air pressure is the best predictor in the general forecasting of weather
In basic forecasting, you can make some assumptions in your predictions using only barometric pressure
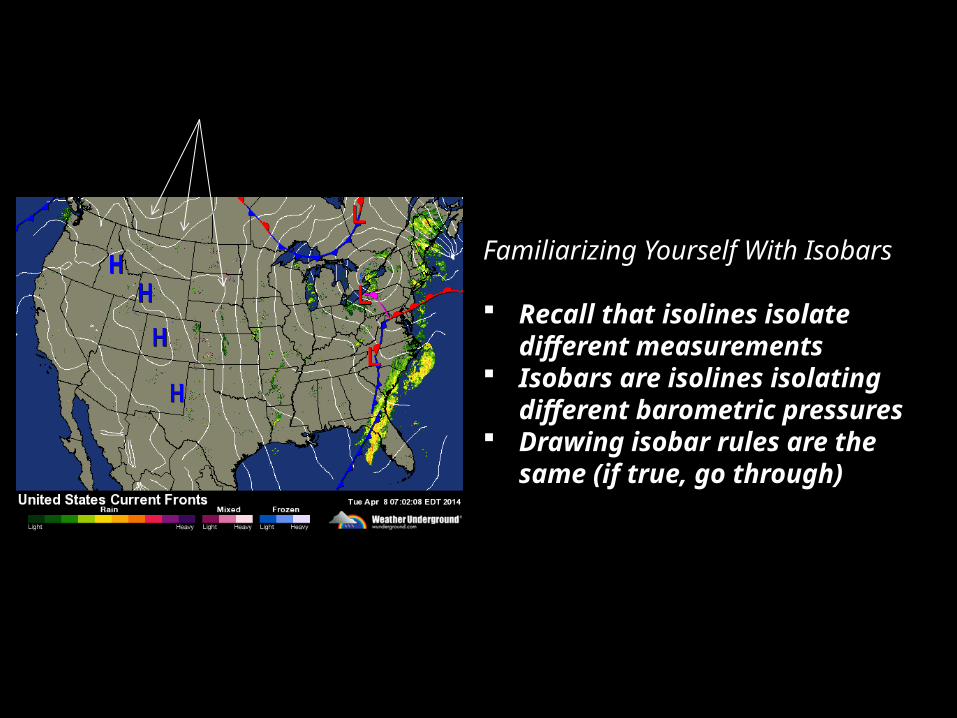
Familiarizing Yourself With Isobars
Recall that isolines isolate different measurements
Isobars are isolines isolating different barometric pressures
Drawing isobar rules are the same (if true, go through)

Meteorologists term pressure centers high or low depending on the barometric pressure values associated with that particular system.

Rotation of Pressure Centers
Winds flow:
Into a Low pressure center
Out of a High pressure center
Low pressure rotates counterclockwise
High pressure rotates clockwise
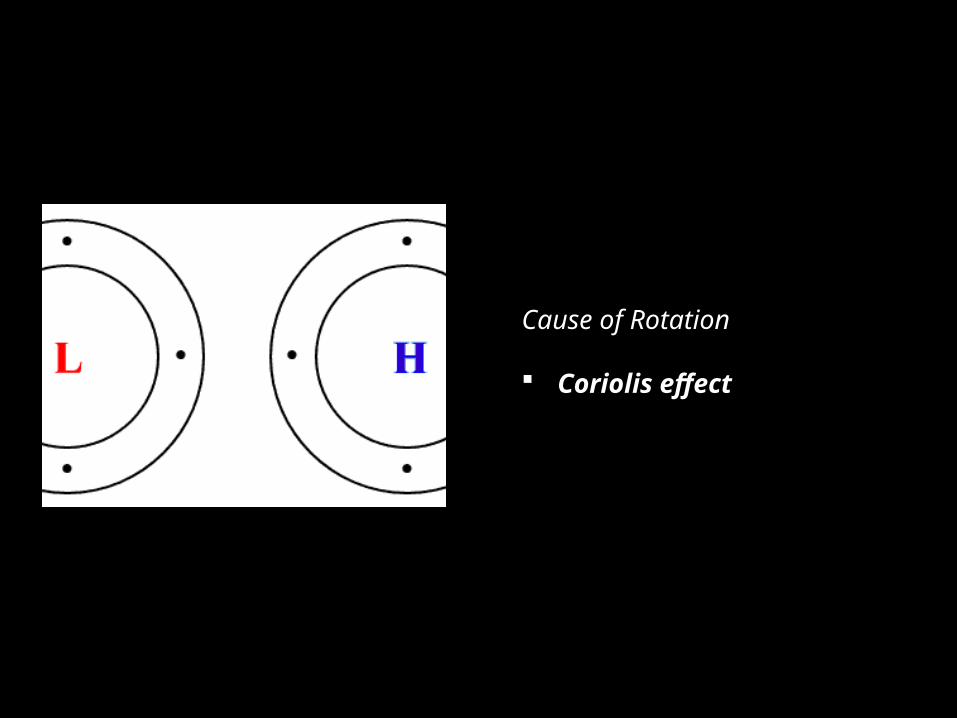
Cause of Rotation
Coriolis effect
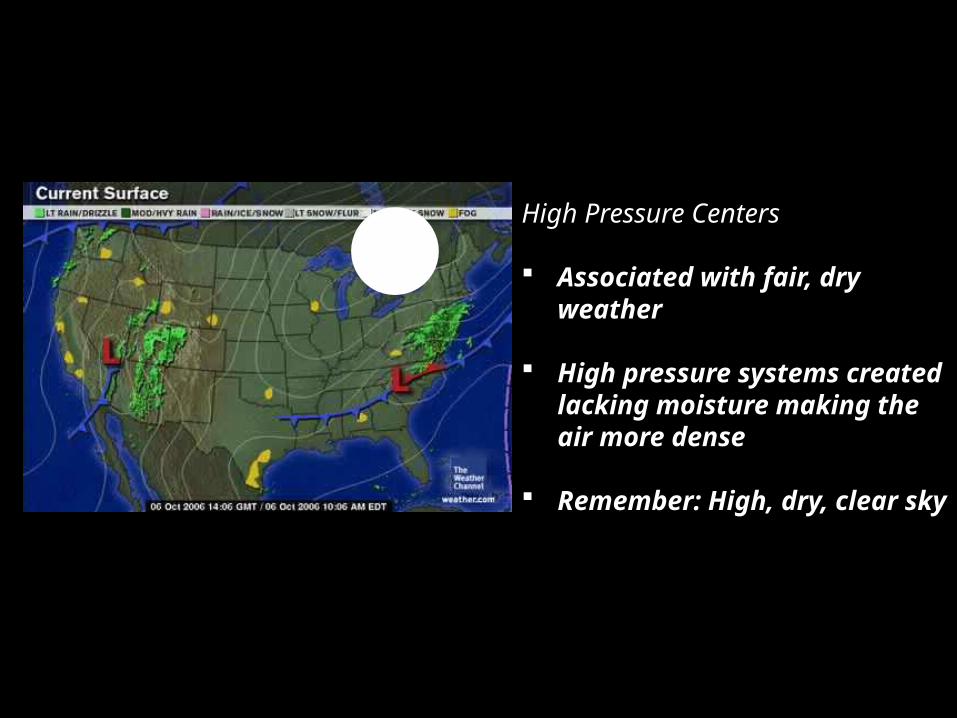
High Pressure Centers
Associated with fair, dry weather
High pressure systems created lacking moisture making the air more dense
Remember: High, dry, clear sky
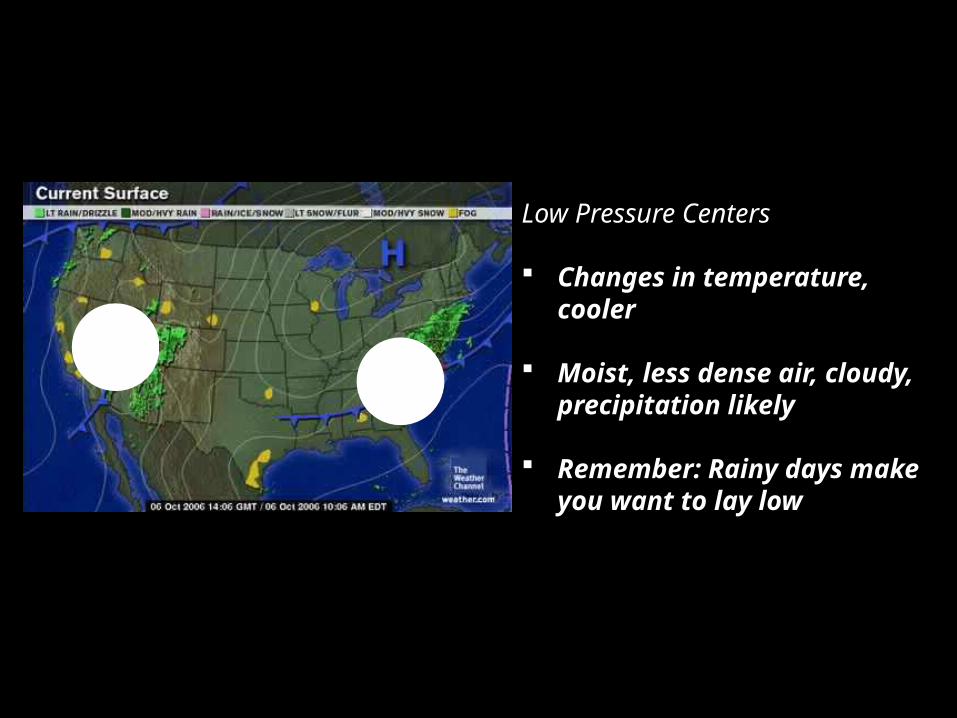
Low Pressure Centers
Changes in temperature, cooler
Moist, less dense air, cloudy, precipitation likely
Remember: Rainy days make you want to lay low

Low pressure centers contain fronts that show the advancing change in air characteristics. Of these the most important are cold and warm fronts.

Fronts are defined by the characteristics of the air that follows them.
Cold: Cooler air follows Warm: Warmer air follows Stationary: Boundary
between opposing cold and warm fronts
Occluded: More rapidly moving cold front overtakes the warm front
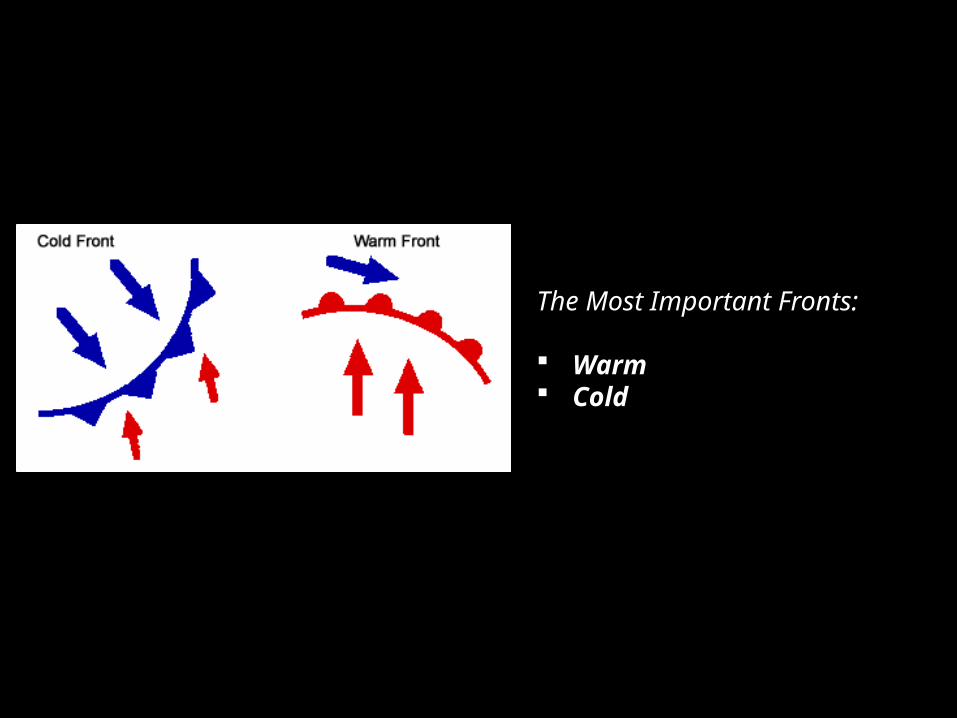
The Most Important Fronts:
Warm Cold

Warm Fronts
Frontal boundary followed by warm air
Cloud formation and possible light precipitation on the leading edge

Cold Fronts
Leading edge of the cold front brings more violent storms from rapid rising of air above the approaching cool air

How are areas of Low and High Pressure modeled?
Isobar maps are created

What is an isobar?
Isobars isolate pressures that are alike
All values connected by the isobar line will be EXACTLY the same

Drawing Isobars
Isolines rules apply “If true, go through”

What is the connection between wind and air pressure?
Winds circulate in the directions on this diagram

Wind and Air Pressure
Winds also flow from a High pressure system into a Low pressure system
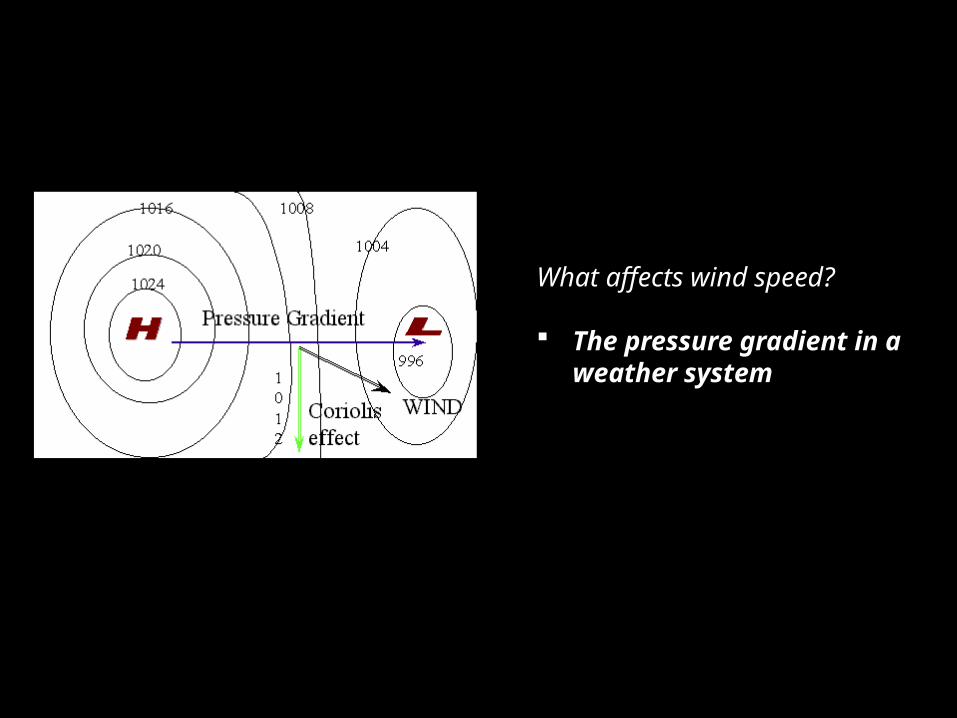
What affects wind speed?
The pressure gradient in a weather system
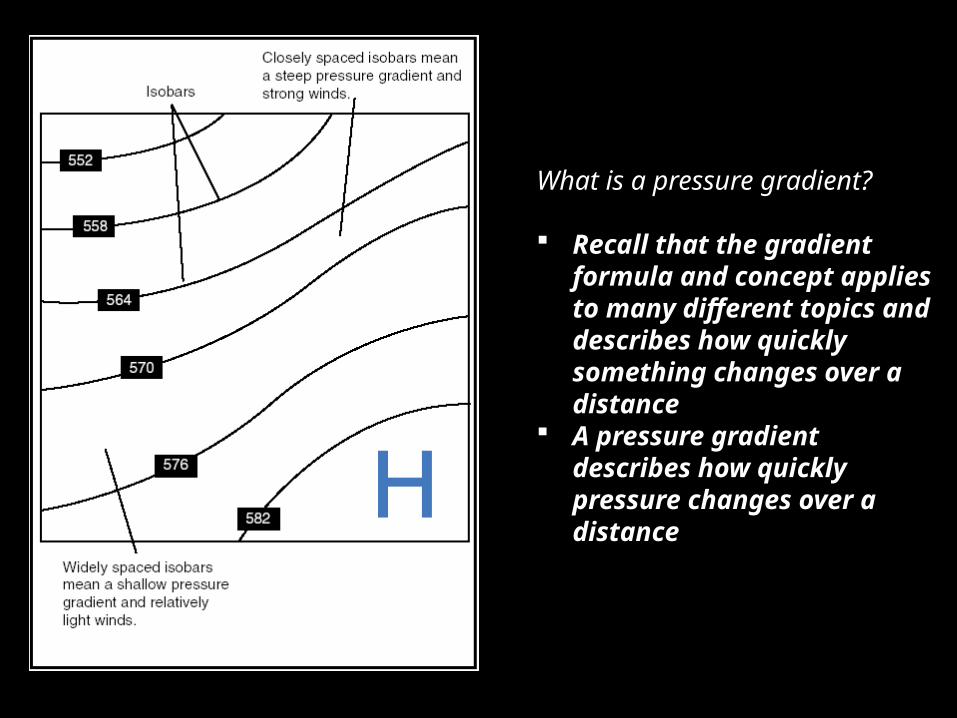
What is a pressure gradient?
Recall that the gradient formula and concept applies to many different topics and describes how quickly something changes over a distance
A pressure gradient describes how quickly pressure changes over a distance
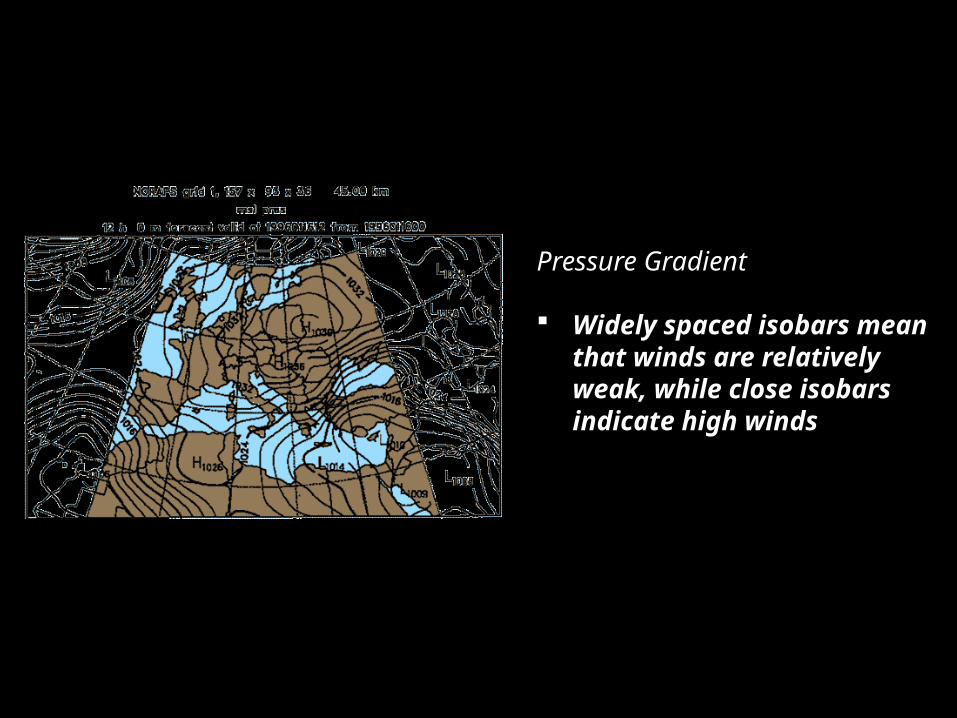
Pressure Gradient
Widely spaced isobars mean that winds are relatively weak, while close isobars indicate high winds

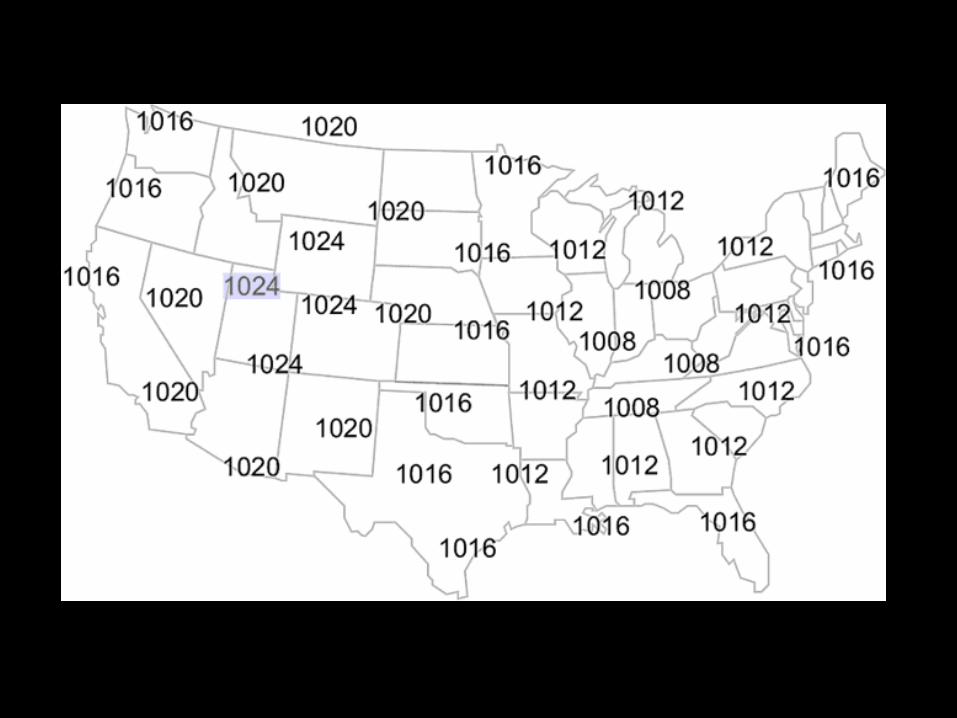
Identify locations with high winds on this map

Instruments Used to Measure Wind
Anemometer (speed) Wind vane (direction)

Primary Cause of Wind
Uneven heating of the Earth’s surface causes some air to rise when it is heated while other air cools and sinks (convection)
The Coriolis Effect causes the East to West, cyclonic and anti-cyclonic motion of wind
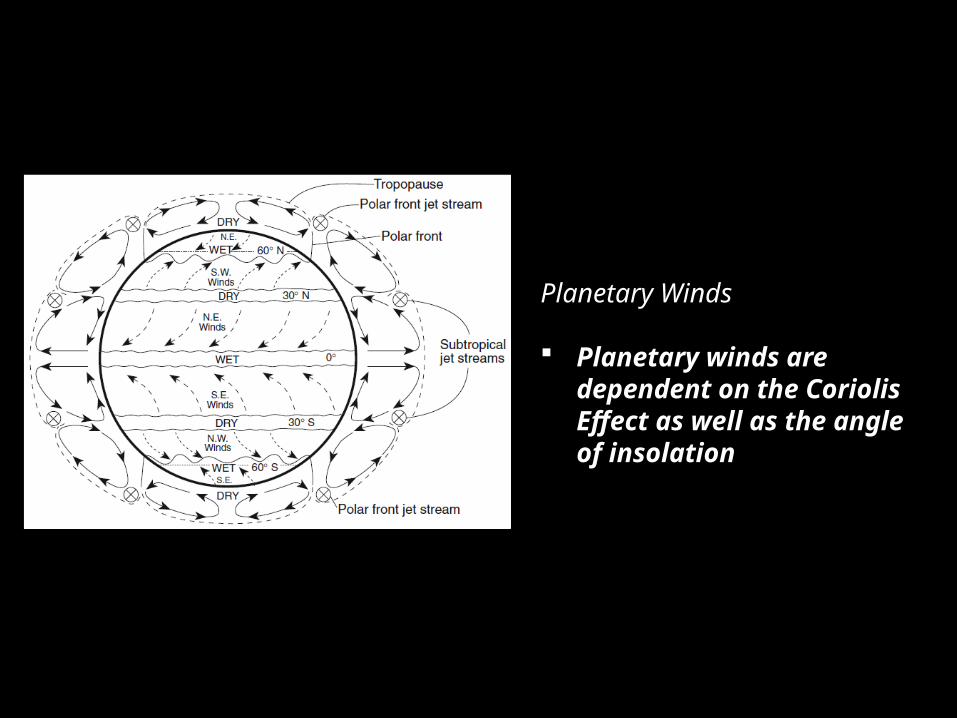
Planetary Winds
Planetary winds are dependent on the Coriolis Effect as well as the angle of insolation

Surface Winds
Deflected as a result of the Coriolis Effect
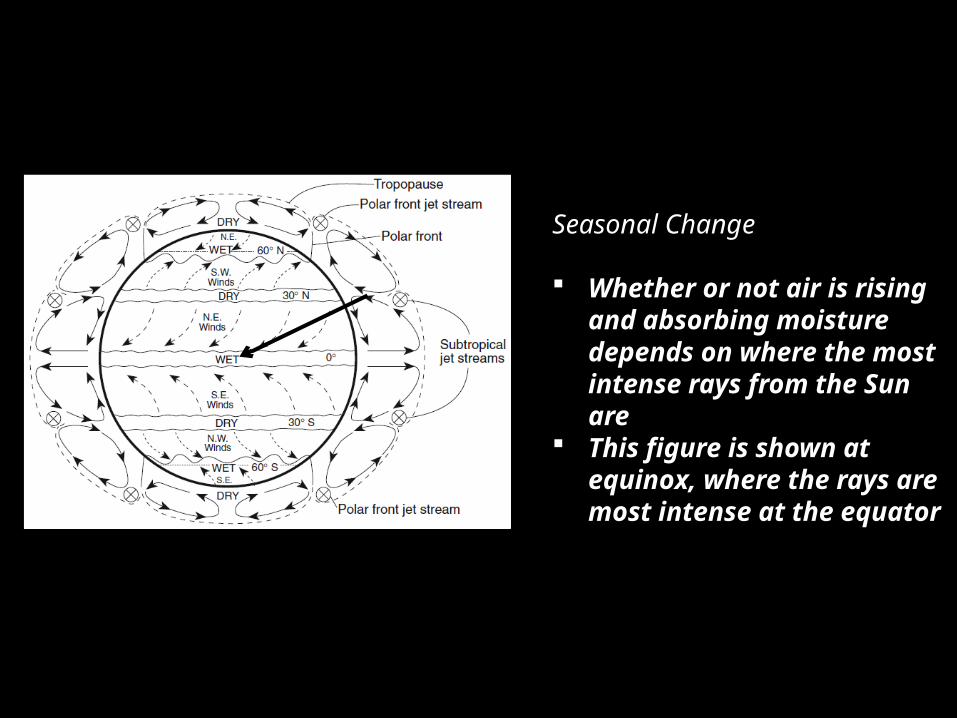
Seasonal Change
Whether or not air is rising and absorbing moisture depends on where the most intense rays from the Sun are
This figure is shown at equinox, where the rays are most intense at the equator

Upper Troposphere
Warmer air will rise into the atmosphere, but then will sink farter to the North or South
The moist, warm air at the equator is a reason for most rainforests being found there


Prevailing Winds In NYS
Most storm systems traveling to New York arrive from the SW
Basic weather prediction point: look the SW for our oncoming weather

Jet Stream
The Jet Stream is rapidly moving air aloft that generates movement of pressure centers
Jet Streams vary with season based on heating of the Earth’s surface; moving generally North or South

Wind Influences the Formation of Air Masses
Air masses named based on their source region
Their source region determines their characteristics
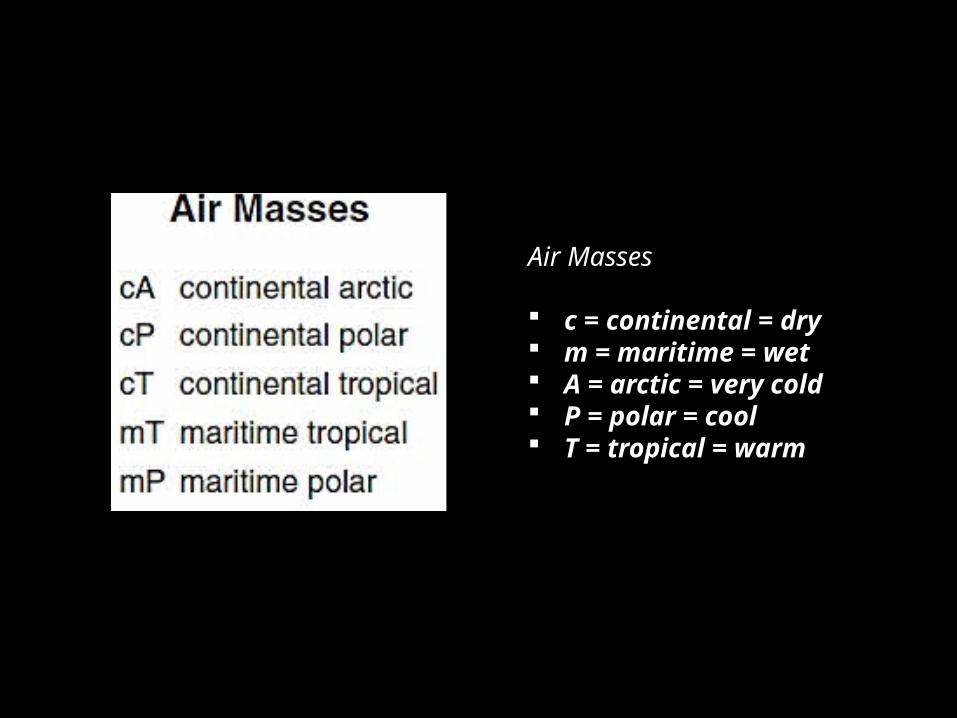
Air Masses
c = continental = dry m = maritime = wet A = arctic = very cold P = polar = cool T = tropical = warm
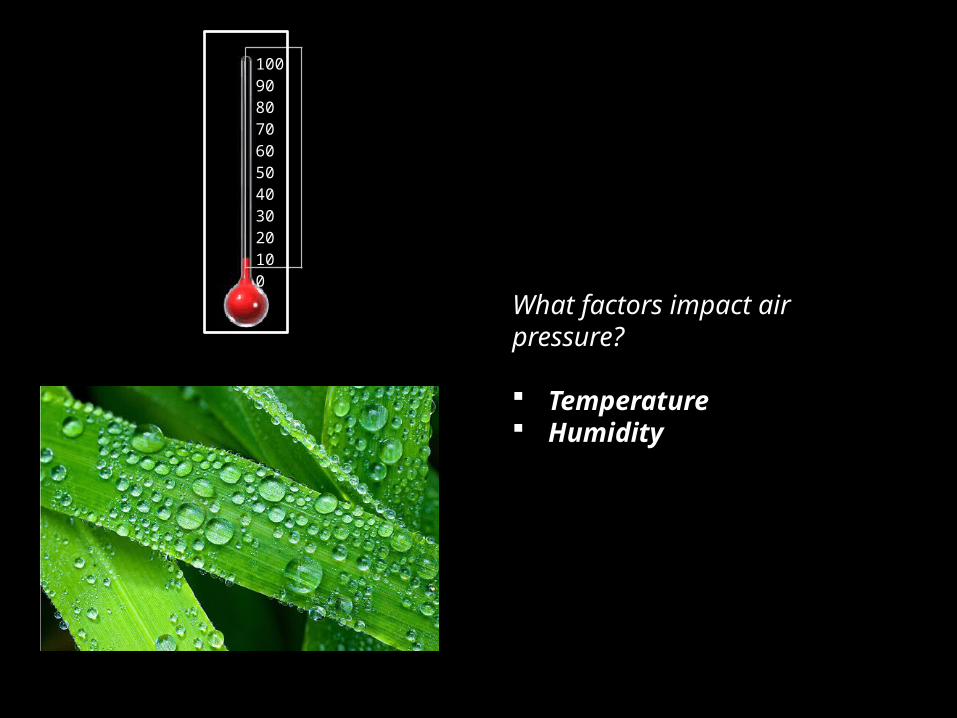
What factors impact air pressure?
Temperature Humidity
1009080706050403020100
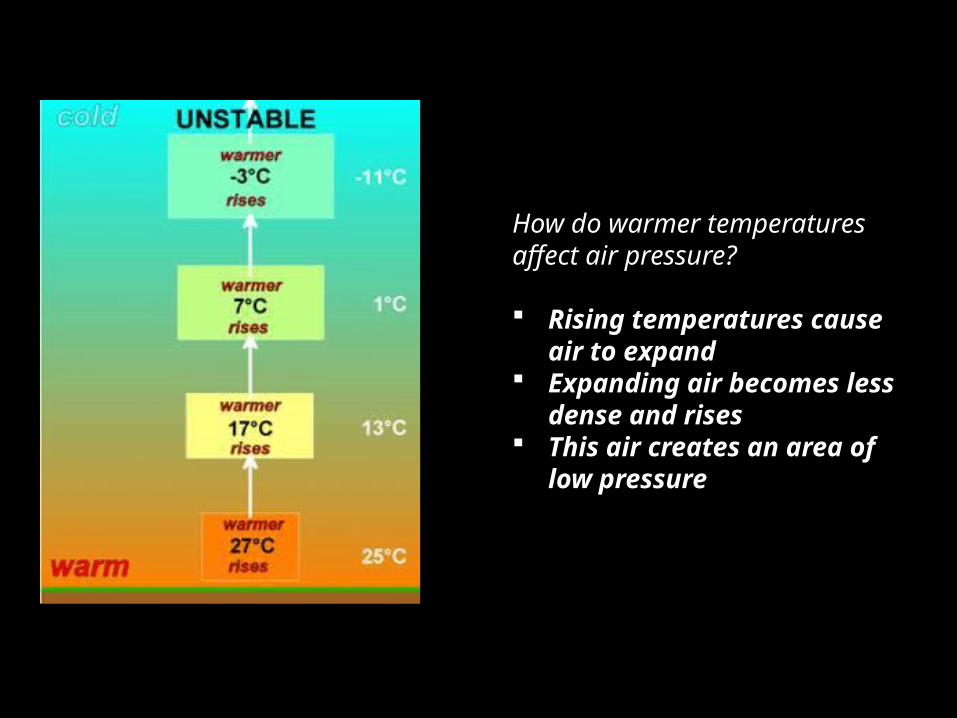
How do warmer temperatures affect air pressure?
Rising temperatures cause air to expand
Expanding air becomes less dense and rises
This air creates an area of low pressure
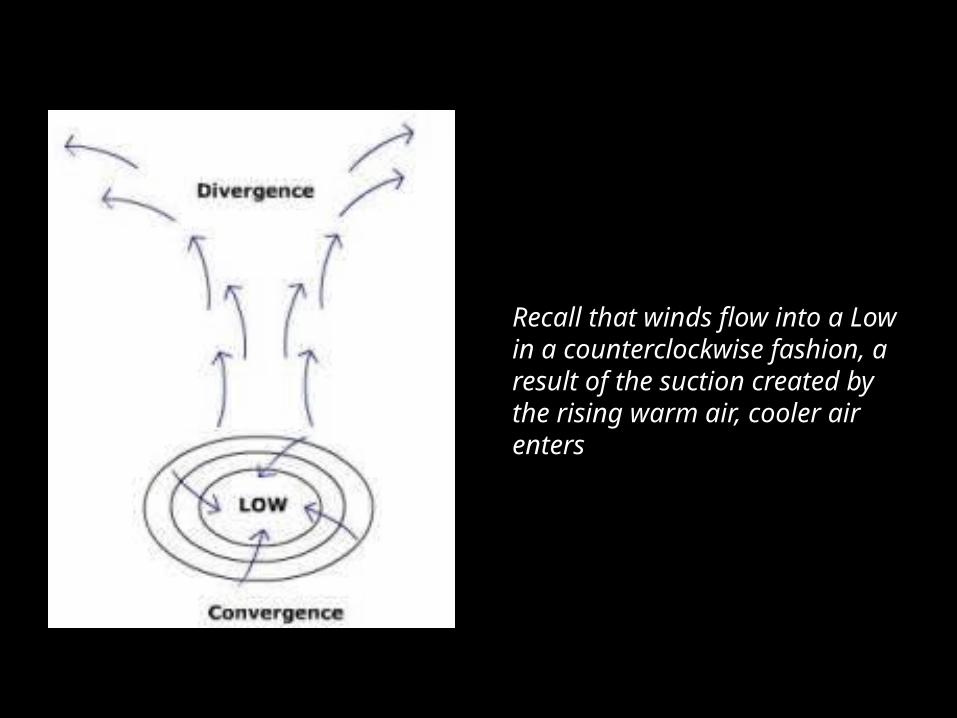
Recall that winds flow into a Low in a counterclockwise fashion, a result of the suction created by the rising warm air, cooler air enters
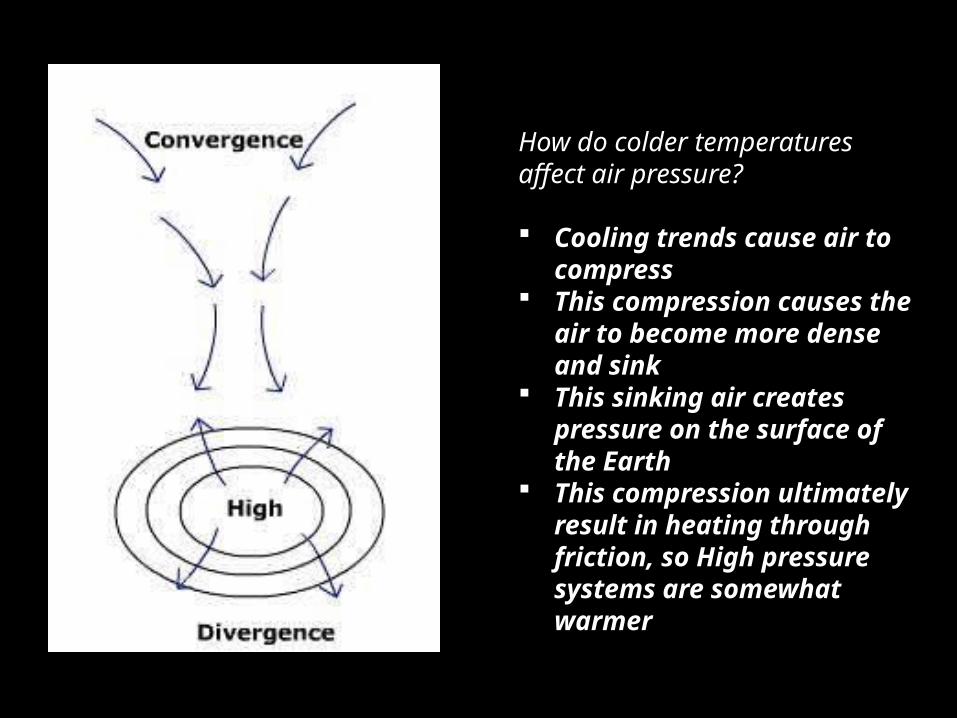
How do colder temperatures affect air pressure?
Cooling trends cause air to compress
This compression causes the air to become more dense and sink
This sinking air creates pressure on the surface of the Earth
This compression ultimately result in heating through friction, so High pressure systems are somewhat warmer
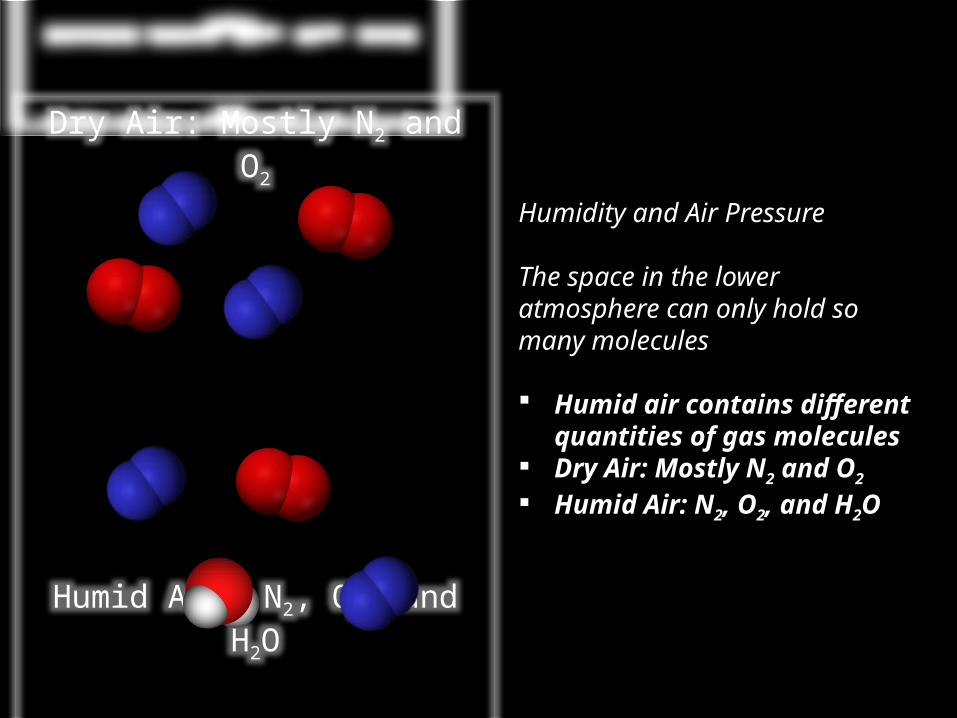
Humidity and Air Pressure
The space in the lower atmosphere can only hold so many molecules
Humid air contains different quantities of gas molecules
Dry Air: Mostly N2 and O2
Humid Air: N2, O2, and H2O
Dry Air: Mostly N2 and O2
Humid Air: N2, O2, and H2O

Masses of Molecules
N2 = 28 g/molO2 = 32 g/molH2O = 18 g/mol
When water is present in the atmosphere, its mass is lower
This lower mass results in lower pressure
Dry Air: Mostly N2 and O2
Humid Air: N2, O2, and H2O
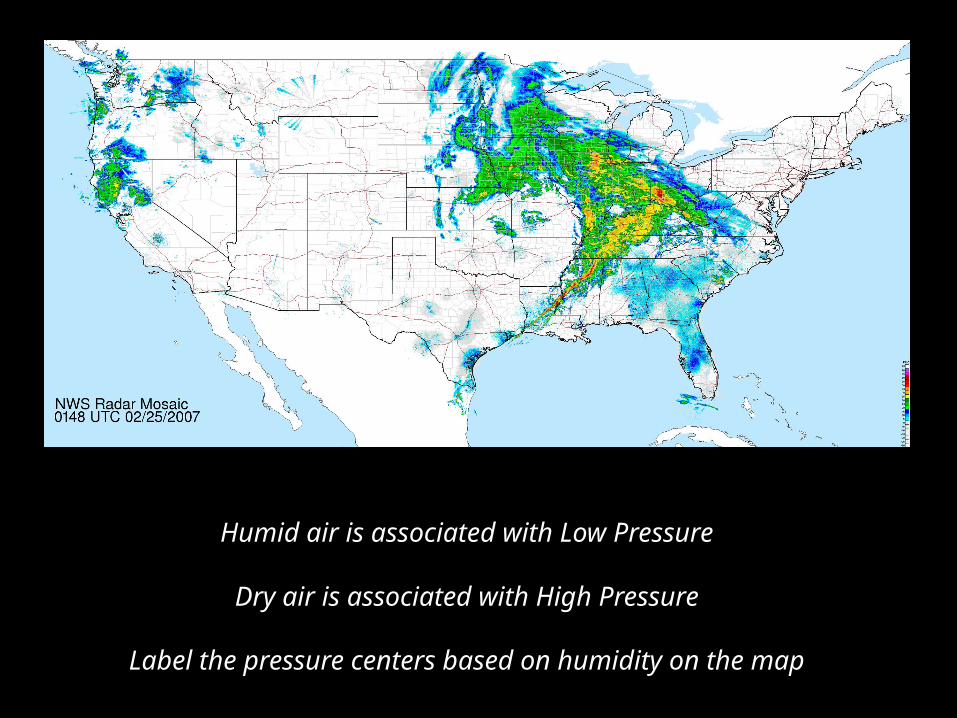
Humid air is associated with Low Pressure
Dry air is associated with High Pressure
Label the pressure centers based on humidity on the map
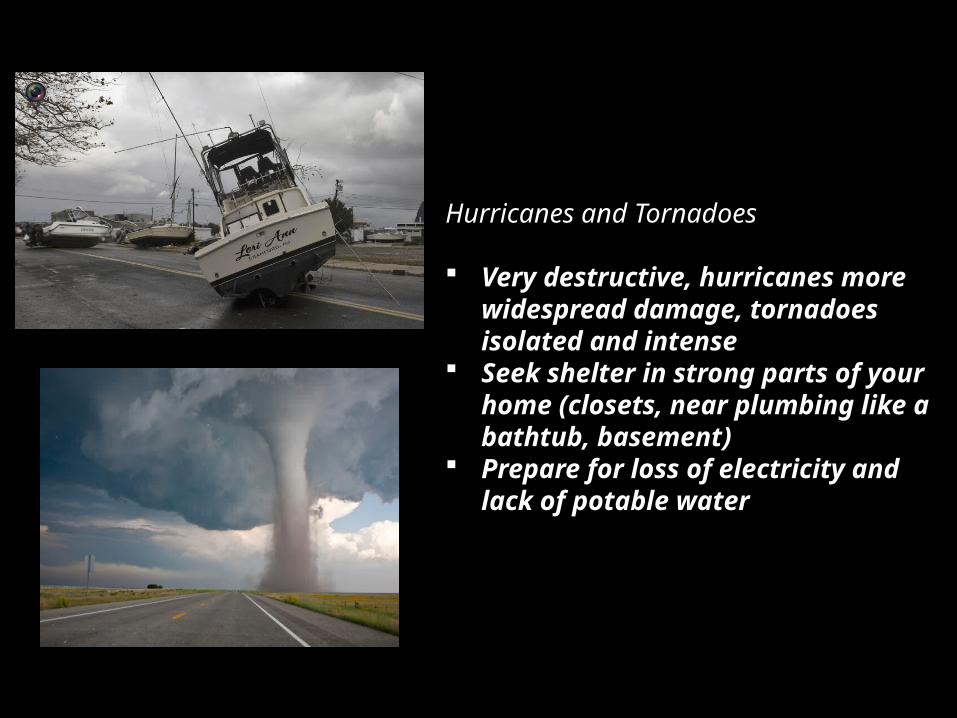
Hurricanes and Tornadoes
Very destructive, hurricanes more widespread damage, tornadoes isolated and intense
Seek shelter in strong parts of your home (closets, near plumbing like a bathtub, basement)
Prepare for loss of electricity and lack of potable water

Communication is vitally important in weather prediction and preparation. Local meteorologists are able to communicate conditions in their area through weather station models.
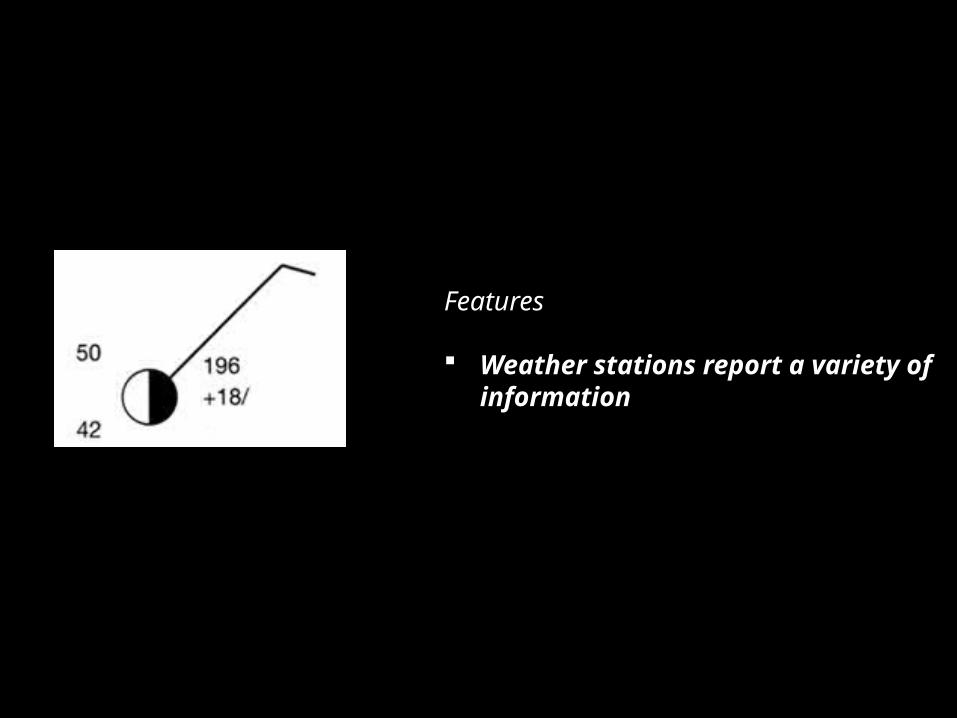
Features
Weather stations report a variety of information

Cloud Cover
How much of the sky is covered by clouds?
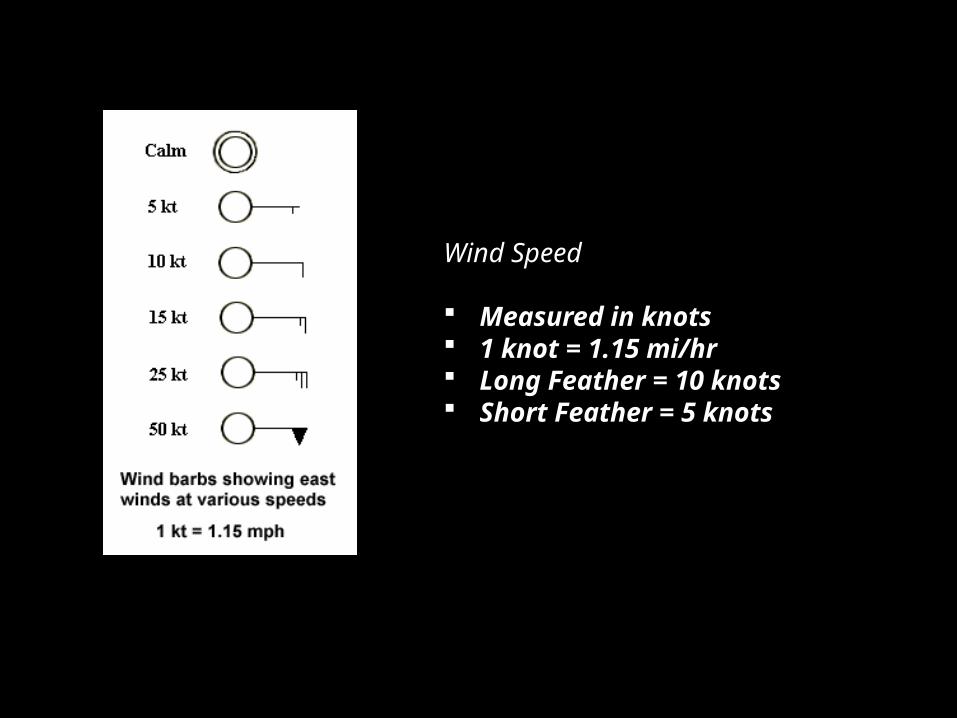
Wind Speed
Measured in knots 1 knot = 1.15 mi/hr Long Feather = 10 knots Short Feather = 5 knots

Temperature
In degrees Fahrenheit
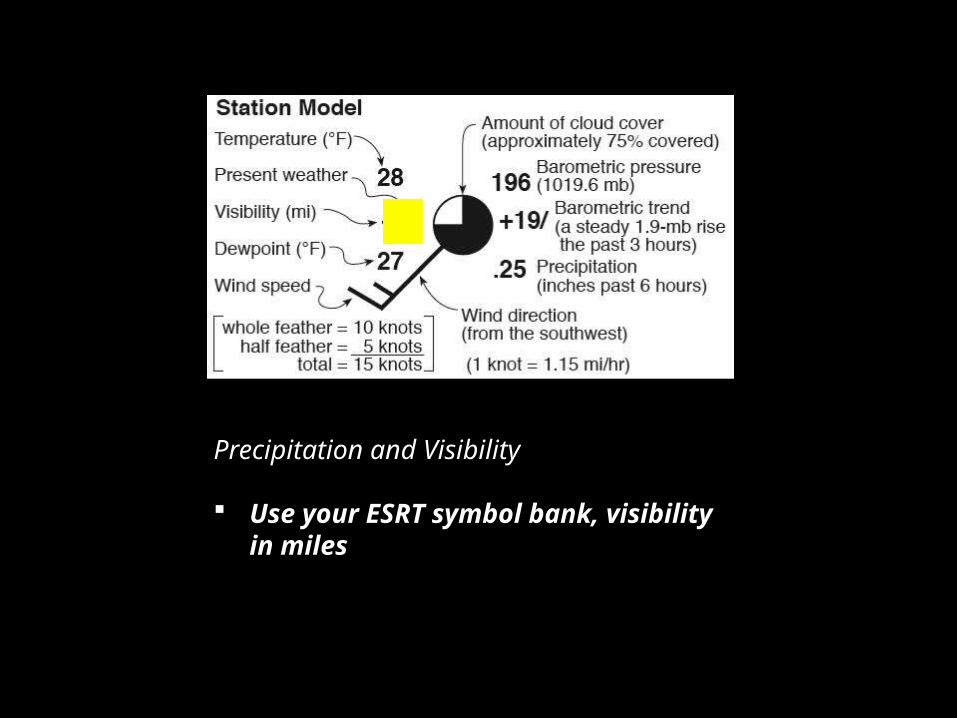
Precipitation and Visibility
Use your ESRT symbol bank, visibility in miles
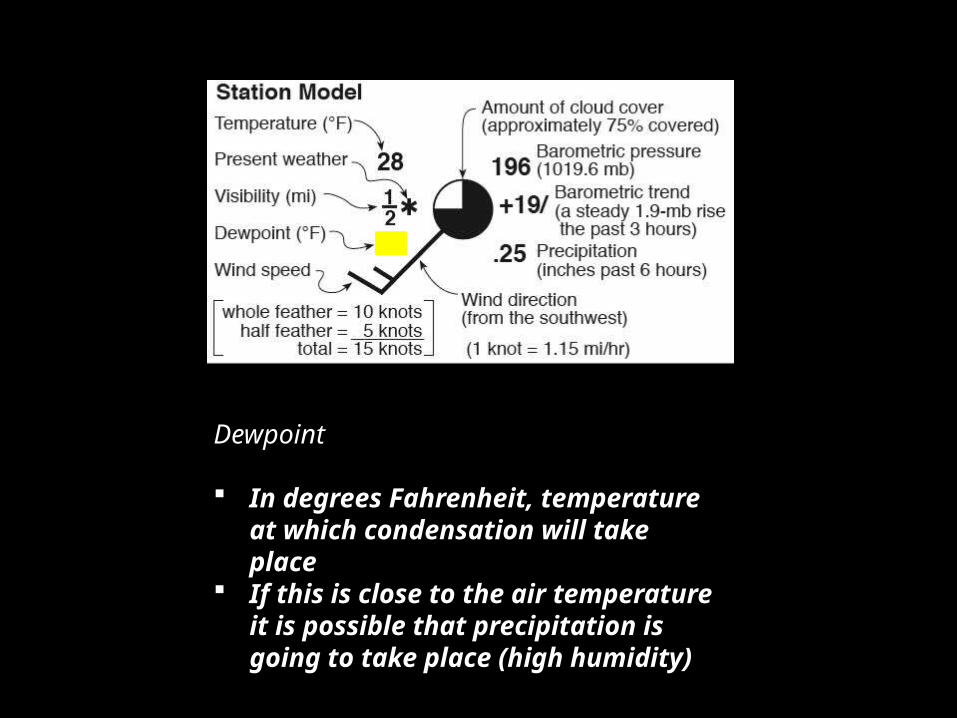
Dewpoint
In degrees Fahrenheit, temperature at which condensation will take place
If this is close to the air temperature it is possible that precipitation is going to take place (high humidity)

Barometric Pressure
You need to convert units before plotting on the weather station model
If above 1000 mb, remove the preceding “10”
If below 1000 subtract the first “9”
No decimals on the diagram!
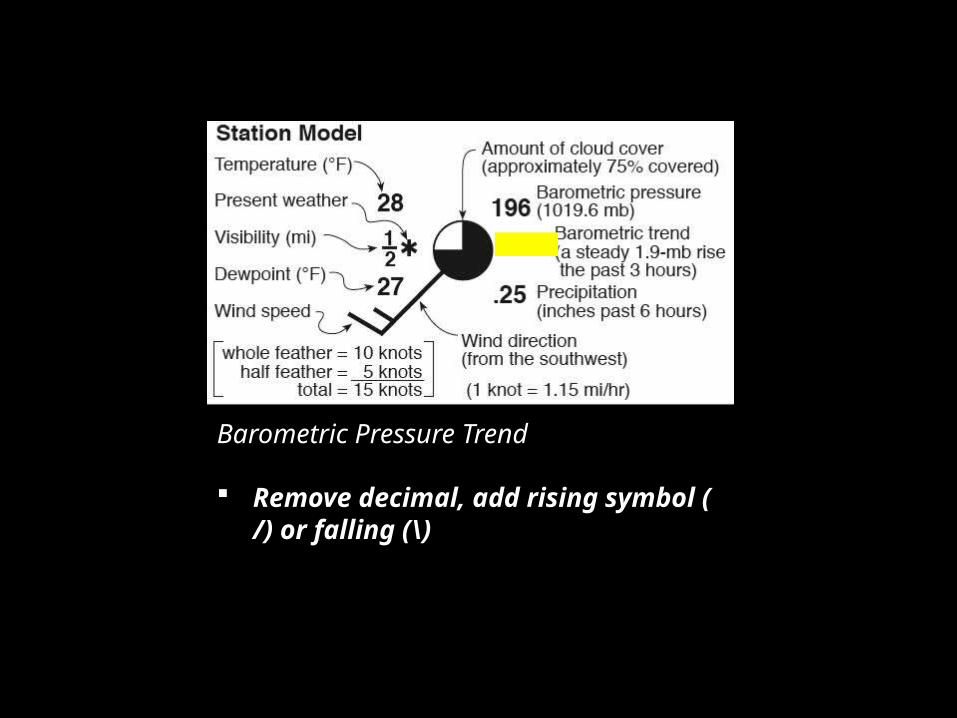
Barometric Pressure Trend
Remove decimal, add rising symbol ( /) or falling (\)

Recent Precipitation
In decimal form