OUI 2014 – Boston, July 29 Innovation by patients with rare diseases and chronic needs 1 Pedro...
25
OUI 2014 – Boston, July 29 Innovation by patients with rare diseases and chronic needs 1 Pedro Oliveira CATÓLICA-LISBON School of Business and Economics Leid Zejnilović Carnegie Mellon University | CATÓLICA-LISBON | IST Helena Canhão University of Lisbon, School of Medicine Eric von Hippel MIT Sloan School of Management
-
Upload
shanon-richard -
Category
Documents
-
view
214 -
download
0
Transcript of OUI 2014 – Boston, July 29 Innovation by patients with rare diseases and chronic needs 1 Pedro...

1
OUI 2014 – Boston, July 29
Innovation by patients with rare diseases and chronic needs
Pedro OliveiraCATÓLICA-LISBON School of Business and Economics
Leid ZejnilovićCarnegie Mellon University | CATÓLICA-LISBON | IST
Helena CanhãoUniversity of Lisbon, School of Medicine
Eric von HippelMIT Sloan School of Management

2
Motivation: the problem
• Between 5000 – 8000 rare diseases afflicting 6% – 8 % of the world’s population; 55 million in the US and EU (Song et al., 2012)
• Definition: Rare - based on prevalence Orphan - a market where no profit can be
extracted
• Need is extremely high• Rare diseases are frequently chronic and disabling• Patients can expect little help available from producers
or health care• The patients are clinically and scientifically
underserved (e.g. Griggs et al., 2009)

British engineer, Tal Golesworthy (a Marfan syndrome patient), designed own heart implant and saved own life (2004)
3
Personalized External Aortic Root Support
Image Source: Daily Mail, UK
Source: Habicht, Oliveira, Shcherbatiuk, 2012

Sharing Solutions, Improving Life 4
Personalized External Aortic Root Support

Sharing Solutions, Improving Life 5
Personalized External Aortic Root Support
Diffusion: currently being used by 35 other patients. Tal has been very energetically involved in its diffusion
Source: Habicht, Oliveira, Shcherbatiuk, 2012

6
Simple solutions, great results
Images Source: www.patient-innovation.com
Source: This study

7
Diffusion: other parents reported applying the same solution
Simple solutions, great results
Images Source: www.patient-innovation.com
Source: This study

8
Research Questions
RQ1: What are the levels of innovation activity among rare diseases patients? RQ2: What drives patients to innovate? RQ3: To what extent do patients diffuse their solutions, and when is it likely to occur?

9
Research methodology
Survey form development
Data collection via phone-interviews (n=500)
Additional data collection from external
databases (for 251
diseases)
Validation of novelty
(2 health professionals)
Multivariate regression
models
Subjects selected from the list of individuals who contacted the helpline of an association of rare diseasesfrom 2009 to 2012.

10
Socio-demographic characteristics of the respondents
Variable N % Mean SD Min MaxRespondent’s Age (years) 45.2 13.2 18 84Disease Duration (years) 12.5 12.5 0.2 65Women 425 85 University Degree 194 38.8Employed 255 51Married 322 64.4
SD = standard deviation

11
Innovations
New to the respondent
(n = 223)
New to the world
( n = 40)
Total(n = 263)
Equipment (medical & non-medical / aid devices)
2% 22% 5%
Treatments 57% 8% 49.%
Strategy / behavior 41 % 70% 46%
Total (% of 263) 85% 15% 100%

12
Innovations
New to the respondent
(n = 223)
New to the world
( n = 40)
Total(n = 263)
Equipment (medical & non-medical / aid devices)
2% 22% 5%
Treatments 57% 8% 49.%
Strategy / behavior 41 % 70% 46%
Total (% of 263) 85% 15% 100%

13
Innovations
New to the respondent
(n = 223)
New to the world
( n = 40)
Total(n = 263)
Equipment (medical & non-medical / aid devices)
2% 22% 5%
Treatments 57% 8% 49.%
Strategy / behavior 41 % 70% 46%
Total (% of 263) 85% 15% 100%

14
Innovations
New to the respondent
(n = 223)
New to the world
( n = 40)
Total(n = 263)
Equipment (medical & non-medical / aid devices)
2% 22% 5%
Treatments 57% 8% 49.%
Strategy / behavior 41 % 70% 46%
Total (% of 263) 85% 15% 100%

15
Innovations
New to the respondent
(n = 223)
New to the world
( n = 40)
Total(n = 263)
Equipment (medical & non-medical / aid devices)
2% 22% 5%
Treatments 57% 8% 49.%
Strategy / behavior 41 % 70% 46%
Total (% of 263) 85% 15% 100%
MSc Thesis Defense | Matilde Czernin | 01/11/13
Motivation Our Research Methodology Results Conclusions
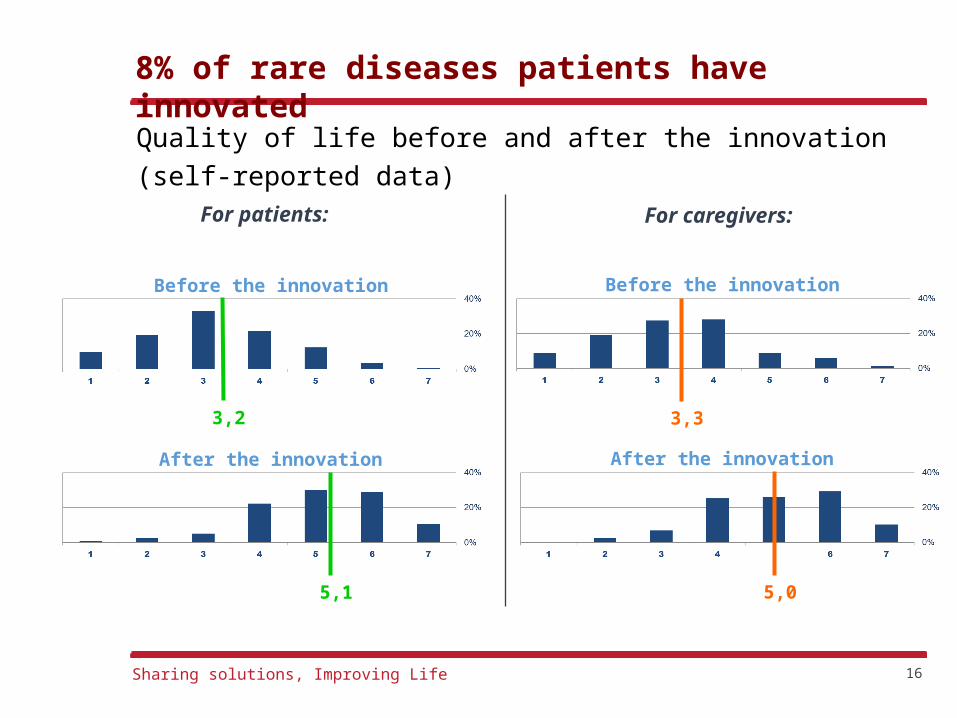
For patients: For caregivers:
Quality of life before and after the innovation (self-reported data)
Before the innovation Before the innovation
After the innovation After the innovation
3,2
5,1 5,0
3,3
16
8% of rare diseases patients have innovated
Sharing solutions, Improving Life 16
17
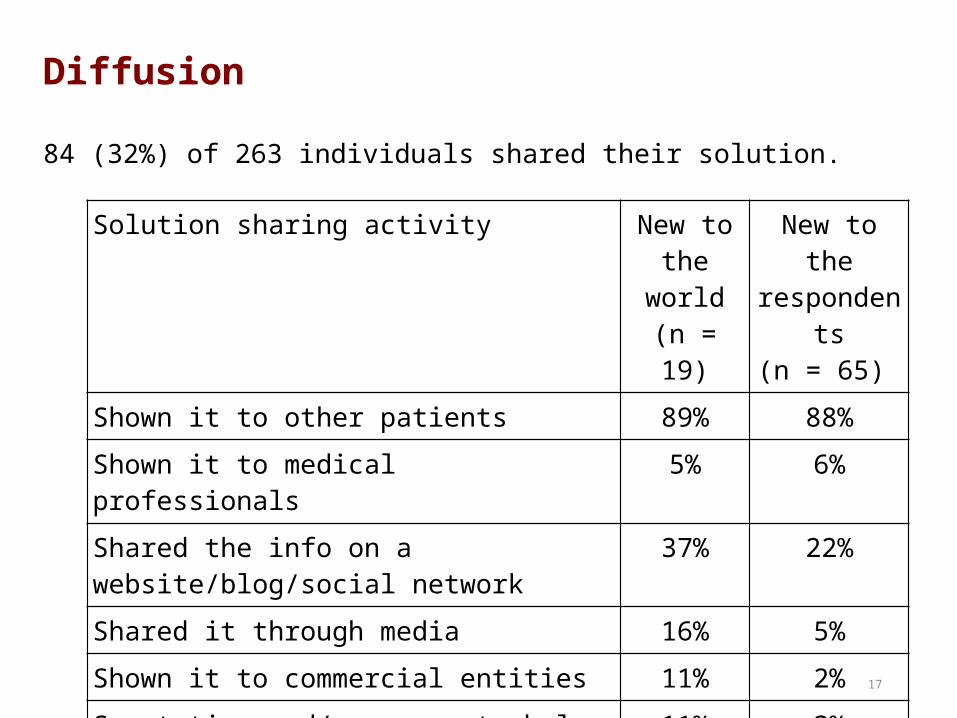
Diffusion
Solution sharing activity New to the world(n = 19)
New to the respondents
(n = 65)
Shown it to other patients 89% 88%
Shown it to medical professionals 5% 6%
Shared the info on a website/blog/social network
37% 22%
Shared it through media 16% 5%
Shown it to commercial entities 11% 2%
Spent time and/or money to help others (people, companies) use the solution
11% 3%
Made a manual or documentation that helps using the solution
5% 3%
84 (32%) of 263 individuals shared their solution.

18
Diffusion
Solution sharing activity New to the world(n = 19)
New to the respondents
(n = 65)
Shown it to other patients 89% 88%
Shown it to medical professionals 5% 6%
Shared the info on a website/blog/social network
37% 22%
Shared it through media 16% 5%
Shown it to commercial entities 11% 2%
Spent time and/or money to help others (people, companies) use the solution
11% 3%
Made a manual or documentation that helps using the solution
5% 3%
84 (32%) of 263 individuals shared their solution.

19
Diffusion
Solution sharing activity New to the world(n = 19)
New to the respondents
(n = 65)
Shown it to other patients 89% 88%
Shown it to medical professionals 5% 6%
Shared the info on a website/blog/social network
37% 22%
Shared it through media 16% 5%
Shown it to commercial entities 11% 2%
Spent time and/or money to help others (people, companies) use the solution
11% 3%
Made a manual or documentation that helps using the solution
5% 3%
84 (32%) of 263 individuals shared their solution.

20
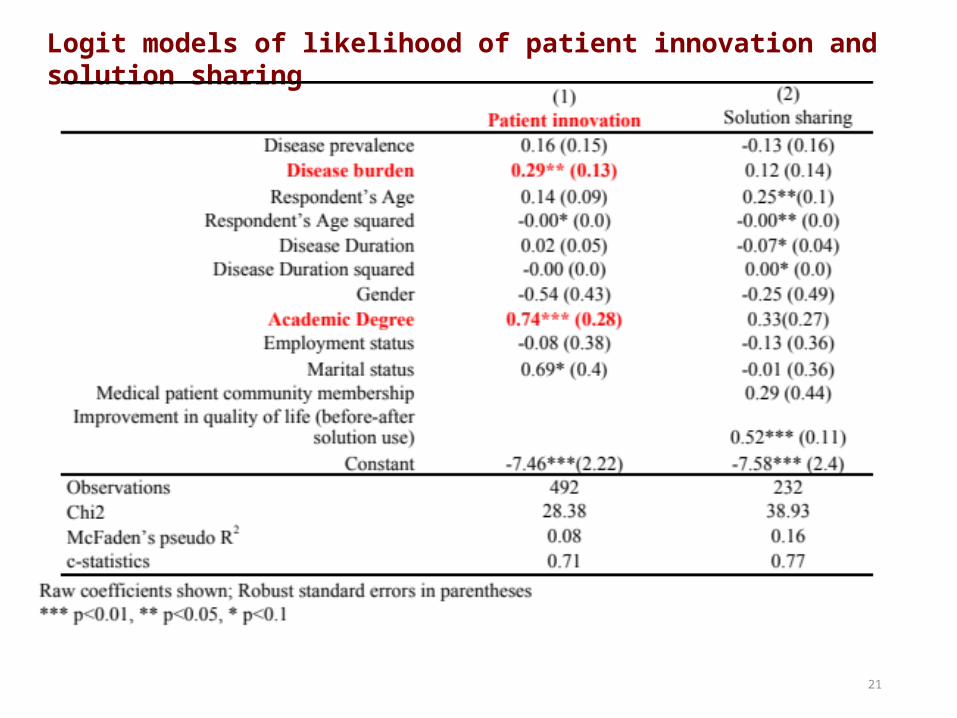
Logit models of likelihood of patient innovation and solution sharing
(1) (2) Patient innovation Solution sharing
Disease prevalence 0.16 (0.15) -0.13 (0.16) Disease burden 0.29** (0.13) 0.12 (0.14)
Respondent’s Age 0.14 (0.09) 0.25**(0.1) Respondent’s Age squared -0.00* (0.0) -0.00** (0.0)
Disease Duration 0.02 (0.05) -0.07* (0.04) Disease Duration squared -0.00 (0.0) 0.00* (0.0)
Gender -0.54 (0.43) -0.25 (0.49) Academic Degree 0.74*** (0.28) 0.33(0.27)
Employment status -0.08 (0.38) -0.13 (0.36) Marital status 0.69* (0.4) -0.01 (0.36)
Medical patient community membership 0.29 (0.44) Improvement in quality of life (before-after
solution use) 0.52*** (0.11) Constant -7.46***(2.22) -7.58*** (2.4)
Observations 492 232 Chi2 28.38 38.93 McFaden’s pseudo R2 0.08 0.16 c-statistics 0.71 0.77
Raw coefficients shown; Robust standard errors in parentheses *** p<0.01, ** p<0.05, * p<0.1
21
Logit models of likelihood of patient innovation and solution sharing

22
Logit models of likelihood of patient innovation and solution sharing

• 52% of our sample of rare disease patients and/or their non-professional caregivers have developed improvements
• 15% of these were new-to-the-world (judged new to the world by our expert clinician raters)
• An estimated 6% to 8% of the world’s population – hundreds of millions of people - are afflicted by rare diseases.
• a massive, non-commercial source of medical innovations exists, hidden due to a lack of diffusion efforts by innovating patients
23
Conclusions

• Mode of sharing: patient-to-patient (88% of those who shared solutions) vs 6% of patients reported describing their innovations to their clinicians.
• Contributions by patients may complement the efforts by policy makers, research entities, and producers, to help improve the difficult situation of rare disease patients, whose needs for innovations are often underserved.
24
Conclusions

• Sample:
• Potentially biased towards active individuals: patients and caregivers are retrieved from a population of those who have already reached out towards the rare disease association for help via a helpline.
• Our respondents are dominantly women
• Estimates of frequency:
• Telephone interviews rather than site visits are likely to understate the level of patient and caregiver innovations that actually exist.
• Validation:
• No external evaluation of the efficacy of reported solutions. Self-assessment of satisfaction inflated.
• Measures:
• Quality of life measure is a single item scale; limits the ability to compare it across different individuals. 25
Limitations