Ototoxicity risk assessment combining distortion product ...
12
Ototoxicity risk assessment combining distortion product otoacoustic emissions with a cisplatin dose model a) Marilyn F. Dille b and Garnett P. McMillan National Center for Rehabilitative Auditory Research, VA Medical Center, 3710 SW US Veterans Hospital Road, Portland, Oregon 97239 Kelly M. Reavis Department of Otolaryngology/Head & Neck Surgery, Irvine Medical Center, University of California, Building 56, 101 The City Drive South, Orange, California 92868 Peter Jacobs, Stephen A. Fausti, and Dawn Konrad-Martin National Center for Rehabilitative Auditory Research, VA Medical Center, 3710 SW US Veterans Hospital Road, Portland, Oregon 97239 Received 4 February 2010; revised 2 July 2010; accepted 6 July 2010 An objective method for identifying ototoxic hearing loss among patients receiving cisplatin is necessary since the ability of patients to take a behavioral test may change over the course of treatment. Data from 56 monitoring visits by 19 Veterans taking cisplatin were used to identify combinations of distortion-product otoacoustic emission DPOAE metrics and ototoxicity risk factors that best identified ototoxic hearing loss. Models were tested that incorporated DPOAE metrics generated statistically using partial least-squares analysis. Models were also tested that incorporated a priori DPOAE change criteria, such as a minimum DPOAE level shift of 6 dB. Receiver Operating Characteristic analysis was used to compare the accuracy of these models. The best performing model incorporated weighted combinations of pre-treatment hearing, cumulative cisplatin dose and DPOAE metrics that were determined using partial least-squares and evaluated over a quarter octave range near each subjects’ high frequency DPOAE limit. Using this model and the DPOAE recording methods described herein, the chance of ototoxic hearing change can be determined at any given observed change in DPOAE level. This approach appears to provide an accurate and rapid ototoxicity risk assessment ORA that once validated can be used clinically. DOI: 10.1121/1.3473693 PACS numbers: 43.64.Jb, 43.64.Kc, 43.64.Ri, 43.64.Bt BLM Pages: 1163–1174 I. INTRODUCTION A cornerstone of treatment for many cancers is the ad- ministration of cisplatin, an antineoplastic chemotherapeutic agent. In adults, cisplatin is used to treat a variety of cancers, including bladder, testicular, ovarian, head and neck, lung, and cervical cancer and is higly effective. However, a dose- limiting side effect of cisplatin administration is hearing im- pairment, termed ototoxicity. Ototoxicity can present unilaterally or bilaterally of varying degrees or as an aggravation of an existing hearing loss. The amount of the ototoxic hearing change is dependent primarily on cisplatin dose, but there is marked individual variability related to other subject risk factors Fischel- Ghodsian et al., 1993; Forge and Schacht, 2000. Left un- treated, ototoxic hearing changes can be associated with de- pression, anxiety, decreased participation in communication opportunities and/or stress on intimate relationships Koch- kin and Rogin, 2000. Further, hearing changes can lead to decreases in health literacy at a time when health-related decisions are vitally important Dalton et al., 2003; Amalraj et al., 2009. Despite major impacts on quality of life, hear- ing loss tends to be overlooked by the sufferer, as well as under-treated by health professionals, particularly when it coincides with a disease that threatens a patient’s general health Durrant et al., 2005. Early detection of ototoxic hearing loss provides the medical team an opportunity to reduce dosages, change treat- ment regimens and/or change to lesser toxic medication to mitigate hearing changes. If hearing changes are unavoid- able, early detection provides the audiologist an opportunity to educate the patient and the family regarding hearing loss, its effects and management. Traditionally, early detection is achieved by the monitor- ing of pure-tone thresholds at each chemotherapy patient- visit. However this has drawbacks. The main drawback is that more than one-third of patients who receive ototoxic medications are, at some point in treatment, unable to be tested using behavioral techniques Fausti et al., 1991, 1992 either because of the effects of the disease or the side-effects of treatment. There is a clear need for an objective monitor- a Portions of this work were presented at the American Auditory Society Meeting, Scottsdale, Arizona, March 2009 and by invitation at the Ameri- can Academy of Audiology AudiologyNOW! Meeting, Dallas, Texas, April 2009 and the National Center for Rehabilitative Auditory Research 2009 NCRAR International Conference, Portland, OR. b Author to whom correspondence should be addressed. Electronic mail: [email protected] J. Acoust. Soc. Am. 128 3, September 2010 1163 0001-4966/2010/1283/1163/12/$25.00 Author's complimentary copy
Transcript of Ototoxicity risk assessment combining distortion product ...
Ototoxicity risk assessment combining distortion productotoacoustic emissions with a cisplatin dose modela)
Marilyn F. Dilleb� and Garnett P. McMillanNational Center for Rehabilitative Auditory Research, VA Medical Center, 3710 SW US Veterans HospitalRoad, Portland, Oregon 97239
Kelly M. ReavisDepartment of Otolaryngology/Head & Neck Surgery, Irvine Medical Center, University of California,Building 56, 101 The City Drive South, Orange, California 92868
Peter Jacobs, Stephen A. Fausti, and Dawn Konrad-MartinNational Center for Rehabilitative Auditory Research, VA Medical Center, 3710 SW US Veterans HospitalRoad, Portland, Oregon 97239
�Received 4 February 2010; revised 2 July 2010; accepted 6 July 2010�
An objective method for identifying ototoxic hearing loss among patients receiving cisplatin isnecessary since the ability of patients to take a behavioral test may change over the course oftreatment. Data from 56 monitoring visits by 19 Veterans taking cisplatin were used to identifycombinations of distortion-product otoacoustic emission �DPOAE� metrics and ototoxicity riskfactors that best identified ototoxic hearing loss. Models were tested that incorporated DPOAEmetrics generated statistically using partial least-squares analysis. Models were also tested thatincorporated a priori DPOAE change criteria, such as a minimum DPOAE level shift of 6 dB.Receiver Operating Characteristic analysis was used to compare the accuracy of these models. Thebest performing model incorporated weighted combinations of pre-treatment hearing, cumulativecisplatin dose and DPOAE metrics that were determined using partial least-squares and evaluatedover a quarter octave range near each subjects’ high frequency DPOAE limit. Using this model andthe DPOAE recording methods described herein, the chance of ototoxic hearing change can bedetermined at any given observed change in DPOAE level. This approach appears to provide anaccurate and rapid ototoxicity risk assessment �ORA� that once validated can be used clinically.�DOI: 10.1121/1.3473693�
PACS number�s�: 43.64.Jb, 43.64.Kc, 43.64.Ri, 43.64.Bt �BLM� Pages: 1163–1174
r's
com
plim
enta
ry c
op
y
I. INTRODUCTION
A cornerstone of treatment for many cancers is the ad-ministration of cisplatin, an antineoplastic chemotherapeuticagent. In adults, cisplatin is used to treat a variety of cancers,including bladder, testicular, ovarian, head and neck, lung,and cervical cancer and is higly effective. However, a dose-limiting side effect of cisplatin administration is hearing im-pairment, termed ototoxicity.
Ototoxicity can present unilaterally or bilaterally ofvarying degrees or as an aggravation of an existing hearingloss. The amount of the ototoxic hearing change is dependentprimarily on cisplatin dose, but there is marked individualvariability related to other subject risk factors �Fischel-Ghodsian et al., 1993; Forge and Schacht, 2000�. Left un-treated, ototoxic hearing changes can be associated with de-pression, anxiety, decreased participation in communicationopportunities and/or stress on intimate relationships �Koch-
a�Portions of this work were presented at the American Auditory SocietyMeeting, Scottsdale, Arizona, March 2009 and by invitation at the Ameri-can Academy of Audiology AudiologyNOW! Meeting, Dallas, Texas, April2009 and the National Center for Rehabilitative Auditory Research 2009NCRAR International Conference, Portland, OR.
b�Author to whom correspondence should be addressed. Electronic mail:
[email protected]J. Acoust. Soc. Am. 128 �3�, September 2010 0001-4966/2010/128�3
kin and Rogin, 2000�. Further, hearing changes can lead todecreases in health literacy at a time when health-relateddecisions are vitally important �Dalton et al., 2003; Amalrajet al., 2009�. Despite major impacts on quality of life, hear-ing loss tends to be overlooked by the sufferer, as well asunder-treated by health professionals, particularly when itcoincides with a disease that threatens a patient’s generalhealth �Durrant et al., 2005�.
Early detection of ototoxic hearing loss provides themedical team an opportunity to reduce dosages, change treat-ment regimens and/or change to lesser toxic medication tomitigate hearing changes. If hearing changes are unavoid-able, early detection provides the audiologist an opportunityto educate the patient and the family regarding hearing loss,its effects and management.
Traditionally, early detection is achieved by the monitor-ing of pure-tone thresholds at each chemotherapy patient-visit. However this has drawbacks. The main drawback isthat more than one-third of patients who receive ototoxicmedications are, at some point in treatment, unable to betested using behavioral techniques �Fausti et al., 1991, 1992�either because of the effects of the disease or the side-effects
of treatment. There is a clear need for an objective monitor-1163�/1163/12/$25.00 Au
tho
r's
com
plim
enta
ry c
op
y
ing strategy for all patients and, in particular, for those whocannot be tested using traditional behavioral means.
Distortion-product otoacoustic emission �DPOAE� test-ing holds promise as an excellent objective ototoxic monitor-ing technique. It is generally accepted that DPOAE genera-tion depends on the physiological status of the outer haircells, which are the auditory receptor cells damaged first bymost ototoxic drugs �Hodges and Lonsbury-Martin, 1998;Alam et al., 2000; Laurell et al., 2000; Mukherjea et al.,2006�. Because DPOAEs are likely by-products of the samemechanism that provides the extreme threshold sensitivityand frequency selectivity that characterizes the normal audi-tory system, DPOAEs have been used clinically to identifythe presence of hearing loss in hard-to-test populations.DPOAEs are diminished in ears with mild to moderate hear-ing losses up to approximately 50–60 dB HL, and are typi-cally absent with more severe hearing losses �Gorga et al.,1996, 1997�. These relationships also support the applicationof DPOAEs for monitoring ototoxicity. Moreover, severalreports show that DPOAEs can be successfully monitoredeven in older patients in whom normal pre-exposure hearingcannot be assumed �Ress et al., 1999; Reavis et al., 2008�.
Previously, DPOAE level differences have been notedbetween pre- and post-ototoxin exposure in both adults andchildren �Ress et al., 1999; Stavroulaki et al., 2002; Knightet al., 2007�. Some studies have compared rates of changefor DPOAEs and pure tone thresholds in exposed popula-tions. In general, comparatively fewer changes were foundusing pure tone thresholds measured at conventional audio-metric frequencies �Ress et al., 1999; Knight et al., 2007�.However, similar proportions of exposed patients hadchanges in DPOAEs and ultra-high frequency hearingthresholds �Ress et al., 1999; Stavroulaki et al., 2002; Knightet al., 2007; Reavis et al., 2008�. Previous work suggeststhen, that prospective testing using DPOAE may detect oto-toxic changes in auditory function, but it does not provide abasis for interpreting DPOAE changes in relation to a goldstandard measure of ototoxicity. Interpretation of resultsfrom an ototoxicity monitoring test requires an understand-ing of the overall test accuracy.
Just as DPOAEs have previously been compared to theaudiogram in order to determine their ability to identify hear-ing impairment, changes in DPOAE level can be comparedto hearing changes that meet gold standard criteria for oto-toxic hearing change, such as those criteria recommended byASHA �1994�. A drawback of this approach is that it assumesany disagreement between DPOAE and hearing results is adiagnostic error associated with the DPOAE measurements,which may not be true. Audiometric testing is done usingrelatively coarse �5 dB� steps and clinical thresholds are as-sociated with test-retest variability in the 5 to 10 dB rangedepending on test frequency. There is also the potential forDPOAE changes to signal subclinical changes in auditoryfunction that do not yet cause a hearing change. However,advantages of this approach include a comparison of truepositive rates and false positive rates for various DPOAEmetrics and cut-off criteria. Perhaps more importantly, thisapproach can be used to determine the probability that any
DPOAE change is arising from an ear with changed hearing.1164 J. Acoust. Soc. Am., Vol. 128, No. 3, September 2010
There is evidence that suggests DPOAEs at widelyspaced frequencies can give an inaccurate picture of the cor-responding audiogram because constructive and destructiveinteractions can occur between the distortion and reflectionsource emissions comprising the ear canal recorded DPOAE�Mauermann and Kollmeier, 2004�. DPOAEs collected withsmaller step-sizes �fine-structure paradigm� and thensmoothed may lead to better correspondence with behavioralhearing change.
The goal of the current study was to develop a diagnos-tic method that uses changes in DPOAE levels collected withfine-frequency step sizes to distinguish ears with ototoxichearing shift from those with stable hearing. A diagnosticmethod was developed, based on weighted combinations ofseveral DPOAE metrics and a Dose-Hearing model whichincorporates pre-treatment hearing and cisplatin dose thatbest identified ototoxic hearing shift in Veterans taking cis-platin. For comparison, we also evaluated test accuracy for asingle DPOAE criterion value, a 6 dB change in DPOAElevel, because this value is frequently suggested for DPOAEototoxicity monitoring applications �Franklin et al., 1992;Roede et al., 1993; Beattie et al., 2003�. We hypothesizedthat DPOAE test performance would be optimized by a mul-tivariate approach and by applying statistical methods to se-lect candidate DPOAE metrics.
II. METHODS
A. Sample
Subjects receiving cisplatin for the treatment of cancerwere recruited from the Portland Veteran Affairs MedicalCenter. A list of patients prescribed cisplatin generated by theChemotherapy Unit was used to identify potential subjectsfor the study. Patients’ electronic medical charts were re-viewed for the purpose of subject recruitment from October,2007 through June, 2009. Inclusion criteria included: a� cog-nitively and physically able to participate, b� ability to pro-vide reliable behavioral responses; c� hearing no worse than70 dB HL at and below 4 kHz; d� no active or recent historyof middle-ear disorder, Meniere’s disease, or retrocochleardisorder; and e� willingness to participate in the study. Allsubjects were consented to participate in the study followingthe guidelines of the medical center’s Institutional ReviewBoard and were compensated for their time.
B. Testing schedule
Subjects completed a battery of tests at the baseline ses-sion and during follow-up visits that included questions re-garding tinnitus and vertigo onset or changes, otoscopy, im-mittance testing, behavioral audiometry, and DPOAE testing.Out of time considerations, DPOAE testing was done in oneear only chosen either as the better hearing ear or, in the caseof symmetrical hearing, by coin toss. Baseline testing wasperformed within 24 h of initial treatment with cisplatin.Subsequent monitoring visits were completed within 24 h ofeach chemotherapy treatment. The total number of patientvisits �PV� and intervals between visits varied across subjectssince treatment regimens depend on cancer type, patient
health and other medical factors. Additionally, testing wasDille et al.: Ototoxic risk assessment Au
tho
r's
com
plim
enta
ry c
op
y
performed at one month after cessation of treatment. Ototox-icity monitoring protocols seek to identify presence or ab-sence of hearing change at each patient visit. Since the VAMedical Center in Portland, OR is regional, often Veteransreturned here only on the day of treatment.
C. Behavioral audiometry measurements
The gold standard for hearing change in this study wasdetermined by serial pure tone threshold monitoring. Pure-tone thresholds were obtained using the modified Hughson-Westlake technique �Carhart and Jerger, 1959�. Baseline�pre-exposure� thresholds were measured from 2–20 kHz us-ing a Virtual Corporation, Model V320 audiometer andmodified Koss Pro/4X Plus earphones. The audiometer andearphones were calibrated twice each month. Detailed de-scriptions of the set-up including calibration have been de-scribed elsewhere; see Fausti et al., 1979.
A behavioral sensitive range for ototoxicity, SROBEH,was identified for each ear from the baseline pure-tonethresholds �2–20 kHz�. The upper bound of the SROBEH wasdefined as the highest frequency at which a threshold couldbe obtained using a pure-tone signal of 100 dB SPL or less.The pure-tone thresholds of the six lower adjacent frequen-cies in 1/6-octave steps were then obtained. Thus, seven fre-quencies constituted the behavioral SROBEH, which was thefrequency range tested at all monitoring visits. If a hearingchange was noted within the SROBEH, then full frequency�2–20 kHz� testing was done.
Behavioral hearing change was assessed relative to theSROBEH measured at baseline. Presence or absence of behav-ioral hearing change was based on published clinical guide-lines �ASHA, 1994� and includes: a� �20 dB change at anyone test frequency; b� �10 dB change at any two consecu-tive test frequencies; or c� loss of response at three consecu-tive test frequencies where responses were previously ob-tained. Using these criteria, a binary indicator for presence orabsence of hearing change was constructed for each post-baseline PV in the sample. This binary indictor is the goldstandard against which all candidate objective measures arecompared.
D. Distortion-product otoacoustic emissionmeasurements
DPOAEs were collected using custom software �Otoa-coustic Emission Averager, EMAV; Boys Town National Re-search Hospital; �Neely and Liu, 1994�� run on a PC. Thesoftware utilized a CardDeluxe digital signal processingboard �Digital Audio Laboratories� to generate stimuli andrecord responses. The primary frequencies �f1 and f2, wheref1� f2� were separately digitized, converted to analog volt-ages, passed through custom headphone buffers to two ear-phones �Etymotic Research, ER-2� and delivered to thesealed ear canal. The probe also contained a low-noise mi-crophone �Etymotic Research, ER-10B+� to record re-sponses. The signal was sampled at a rate of 32 kHz, ampli-fied 20 dB by the ER-10B+ pre-amplifier, digitized in 64-mstime windows, and stored in two interleaved buffers, which
were averaged in the time domain. The DPOAE level atJ. Acoust. Soc. Am., Vol. 128, No. 3, September 2010
2f1-f2 was estimated from a Fast Fourier transform of thegrand average of the two response buffers ��A+B� /2�. Thenoise level was estimated at the DPOAE frequency from theA–B spectrum. Measurement-based stopping rules wereused, such that at each f2 frequency, averaging stopped whenthe noise floor was �−26 dB SPL or after 32 s of artifact-free averaging, whichever occurred first. The system waselectrically calibrated annually according to the EMAVmanual.
DPOAEs as a function of f2 frequency were measuredfirst in seven half-octave steps with f2 ranging from 2–14kHz using a fixed primary frequency ratio f1 / f2=1.22. Thelevels of the f1 and f2 primaries were L1=L2=65 dB SPL.The two highest half-octave steps �i.e., a one octave range�that elicited DPOAEs at +6 dB signal to noise ratio definedthe individualized SRODP. DPOAEs as a function of f2 fre-quency were then measured across this highest octave in1/48-octave steps with f2 ranging over the SRODP andsweeping from high to low frequencies. Thus the SRODP
comprised 48 DPOAE measurements. Because mea-surement-based stopping rules were used, testing time waslonger for subjects with greater physiological noise and/orDPOAE monitoring limited to frequencies below about 2kHz. That is, a low frequency SRODP, imposed by impairedhearing at higher frequencies, increased testing time sincebiological noise in DPOAE measurements is greater at thelower frequencies. Total test time for octave-range frequen-cies measured in fine steps ranged from 20–45 min with 45min being the typical upward limit of tolerable testing forour patients. As a result, due to time constraints, the lowerhalf-octave of the SRODP was not always collected, resultingin missing data. Thus, this report only describes DPOAEsmeasures derived from the highest half-octave with valid re-sponses.
Both DPOAE and stimulus levels were measured at theplane of the microphone near the entrance to the ear canal.In-the-ear calibration was used to adjust voltage applied tothe source transducers in order to set the SPL of f1 and f2 todesired values. Ear canal transfer functions obtained duringin-the-ear calibration for baseline recordings were employedas target calibration spectra in order to ensure consistentprobe placement across PV and thus improve test-retest reli-ability. Recorded DPOAE levels were smoothed using a5-point running average at every PV in order to minimizefine structure level variations.
System distortion was estimated as the DPOAE level at2f1-f2 measured in a standard 2cc cavity �Brüel and Kjær4153 Coupler� for the frequencies and intensity levels usedin the present study. For the purpose of assessing systemperformance, estimates of system distortion were madeweekly to ensure that system distortion remained at levelsless than �20 dB SPL. In order to determine whether aDPOAE response recorded at a PV was valid, ear canalDPOAE and noise level measurements were compared to thecorresponding system distortion averaged across 7 separatecoupler measurements.
Specifically, data from the 7 coupler runs were con-verted to intensity values and means and standard deviations
�SD� were calculated from them. For each ear canal measure-Dille et al.: Ototoxic risk assessment 1165 Au
tho
r's
com
plim
enta
ry c
op
y
ment, biological noise was converted to intensity, added tothe corresponding mean coupler intensity level and the com-bined noise and distortion value was transformed to dB SPL.The signal to noise ratio was defined as the observedDPOAE level in dB SPL minus the back transformed sum ofthe subject noise and system distortion in dB SPL.
For a given stimulus condition, a DPOAE ear canal re-sponse was considered valid and present if the SNR was atleast 6 dB. If the SNR was less than 6 dB and if the subjectnoise was less than or equal to mean system distortion plus 2SDs, the DPOAE measure was still considered valid, i.e., thelow level emission was considered present, interpretable, andthe measurement value was used in the analyses. If the SNRwas less than 6 dB and the subject noise was greater than themean system distortion plus 2 SDs, the DPOAE measure wasset to missing, i.e., the measurement was considered un-interruptable and was not used in the analyses.
For the analyses, the highest frequency tested was f =1,followed by f =2 for the next highest 1/48-octave step, andso forth. Change in DPOAE level was computed as
�OAEf = �Baseline DPOAEf� − �PV DPOAEf�,
f = 1,2, . . . ,24 �1�
so that positive values indicate a decrease in DPOAE level atstep f and negative values indicate an increase. Cisplatin isexpected to cause a positive �OAEf, corresponding to a re-sponse decrement.
E. Data analysis
The purpose of this analysis is to develop a scoringfunction, denoted Ri, for the ith PV that best distinguishesPVs with a hearing change from those without a hearingchange:
Ri = �KwkMik, k = 1,2, . . . ,K , �2�
where Mik is one of K measurements taken on the ith PV, andwk are weights assigned to each metric. A single DPOAEcriterion value was initially selected, a 6 dB change at anyDPOAE test frequency, and denoted throughout this analysisas the ‘6 dB method’. Using this notation, the 6 dB methodhas K=1 metric, such that
Mik = �1 max��OAEf� � 6 dB
0 otherwise� with wk = 1.
�3�
The 6 dB method thus simply assigns a risk score, Ri, of 0 or1 to each PV based solely on the largest observed �OAEf.
The larger goal was to define Mik more generally, in-cluding DPOAE summary metrics as well as patient charac-teristics and aspects of the cisplatin treatment regimen.
There were three stages to this analysis. 1� Identify can-didate scoring functions, each distinguished by the metricsincluded in K, for diagnosing hearing change. Partial least-squares regressions were used as well as some relativelysimple summary metrics to identify candidate scoring func-tions in stage 1. 2� Determine the weights, wk, to assign to
each metric so that PVs with a hearing change have higher1166 J. Acoust. Soc. Am., Vol. 128, No. 3, September 2010
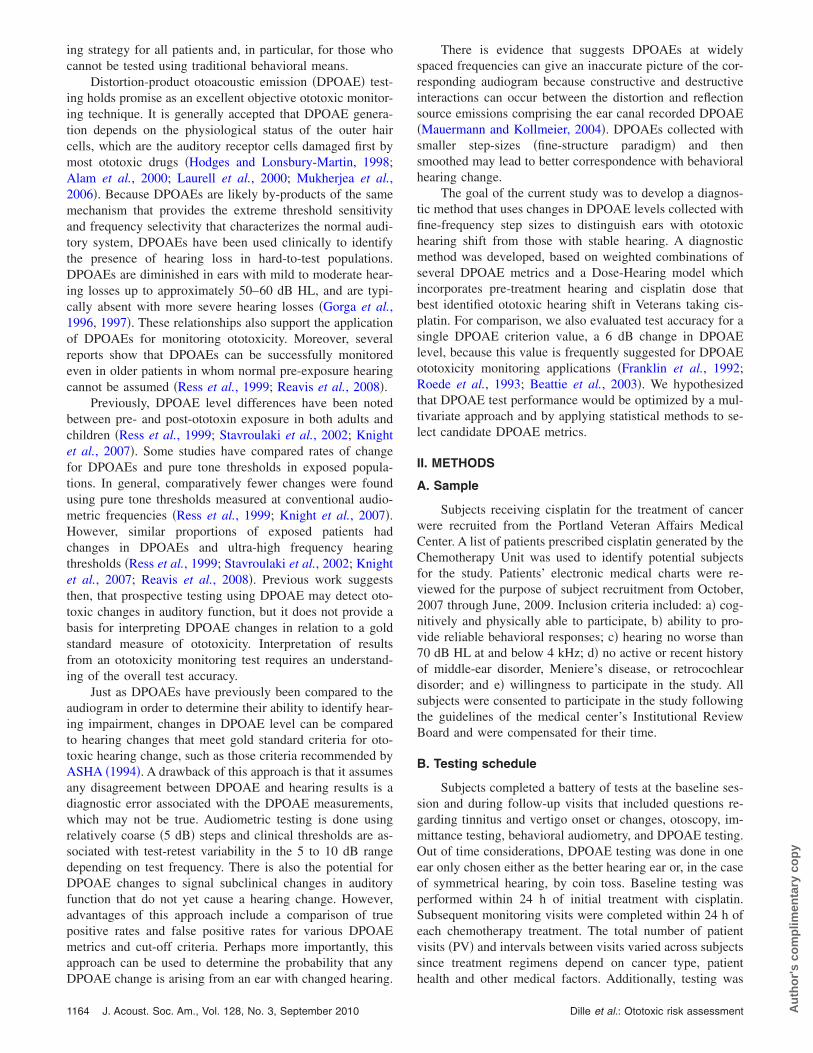
values of Ri than PVs without any hearing change. Logisticregression was used to establish the weights in each candi-date scoring function in stage 2. 3� Compare empirically theaccuracy of each scoring function against the gold standardof ASHA-significant hearing change. Receiver OperatingCharacteristic �ROC� curve analysis was used to assess ac-curacy in stage 3. An advantage to this approach is that scor-ing functions determined a priori �such as the 6 dB method�can be objectively compared against alternative scoring func-tions. Simon and others �Radmacher et al., 2002; Simon,2005a� provide an accessible introduction to the data analyticprogram used here. A schematic outline of the approach usedhere is shown in Fig. 1, and is described in the remainder ofthis section.
1. Identify candidate scoring functions
In a previous study among Veterans �Reavis et al.,2010�, pre-treatment hearing �specifically, a subject’s averagepure tone threshold in the behavioral SRO frequencies,SROBEH� and cumulative cisplatin dose �in mg� were foundto be associated with risk of an ASHA-significant hearingshift during treatment. Therefore, prior to DPOAE analysis, abaseline model relating ASHA-significant hearing change totreatment regimen and patient features was developed usinglogistic regression, denoted as the Dose-Hearing model. Cor-relation among repeated measurements on a patient bothwithin a monitoring appointment and at successive monitor-ing appointments was modeled using generalized estimatingequations �Fitzmaurice et al., 2004� in order to adjust forthese correlations. Other potential patient and treatment risk
FIG. 1. Diagram of Leave One Out Cross-Validation �LOOCV� analysisfrom which the area under the receiver operating characteristic curve �AUC�and standard error of the AUC were computed from Table I and from whichthe best candidate scoring function for the Ototoxicity Risk Assessment�ORA� was determined.
factors for hearing loss were also tested in the same model. It
Dille et al.: Ototoxic risk assessment Au
tho
r's
com
plim
enta
ry c
op
y
was found that patient age, cancer type, cancer stage andlocation at diagnosis, single dose volume or dose level ofcisplatin, concomitant medications, and concurrent radiationtherapy did not significantly alter the risks of hearing changein this sample. However, mean thresholds from the pre-treatment SROBEH and cumulative cisplatin dose were againfound to be statistically important variables �p�0.05�. Morespecifically, the Dose-Hearing model is defined for the stan-dardized �mean=0; SD=1�, pre-treatment SROBEH averagepure-tone threshold in dBHL �Bj� and the standardized logcumulative cisplatin dose in mg �Lij�, as the average lo-g�odds� of hearing change for the jth subject at the ith PV:
Log�odds of hearing changeij�
= − 0.24 + 0.84 · Lij − 1.28 · Bj − 1.04 · Bj · Lij. �4�
The DPOAE analysis begins with this Dose-Hearing modelembedded within it.
There were 24 DPOAE level measurements taken duringeach PV at 1/48-octave steps in the highest half-octave of theSRODP. Simple summaries of change in OAE level werecomputed, including mean �OAEf, maximum �OAEf, andsum �OAEf. These, in combination with the Dose-Hearingmodel, are among the candidate scoring functions to be com-pared in this analysis �Table I�. The 6 dB method was alsoconsidered alone and with the Dose-Hearing model �Table I�.
An alternative approach to simple summary measures isto use partial least-squares �PLS� regression to generate op-timal DPOAE summary measures. PLS is suited to situationswhere there are many measures that are highly correlatedsuch as, DPOAE data. As such PLS constructs new explana-tory variables, denoted “components,” which are linear com-binations of the �OAEf that best predict hearing change. Inthis approach, each component is defined such that it hasmaximum covariance with the observed hearing changes�i.e., how much these two variables change together�, and is
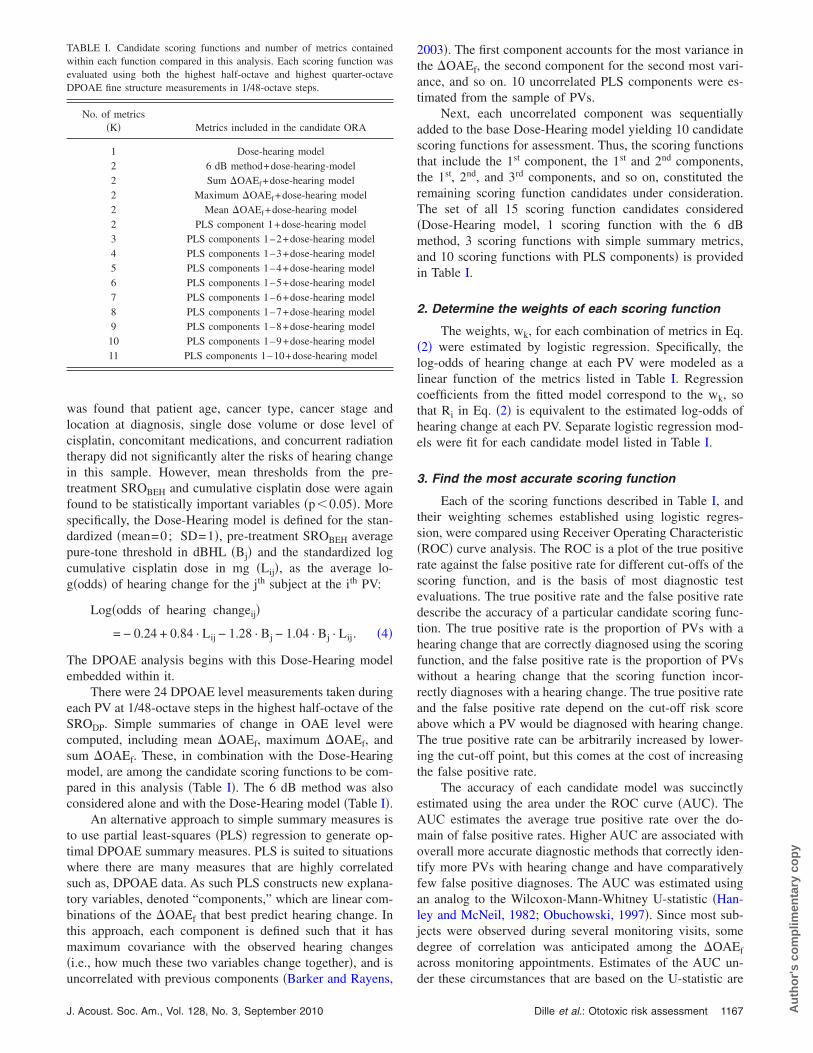
TABLE I. Candidate scoring functions and number of metrics containedwithin each function compared in this analysis. Each scoring function wasevaluated using both the highest half-octave and highest quarter-octaveDPOAE fine structure measurements in 1/48-octave steps.
No. of metrics�K� Metrics included in the candidate ORA
1 Dose-hearing model2 6 dB method+dose-hearing-model2 Sum �OAEf+dose-hearing model2 Maximum �OAEf+dose-hearing model2 Mean �OAEf+dose-hearing model2 PLS component 1+dose-hearing model3 PLS components 1–2+dose-hearing model4 PLS components 1–3+dose-hearing model5 PLS components 1–4+dose-hearing model6 PLS components 1–5+dose-hearing model7 PLS components 1–6+dose-hearing model8 PLS components 1–7+dose-hearing model9 PLS components 1–8+dose-hearing model10 PLS components 1–9+dose-hearing model11 PLS components 1–10+dose-hearing model
uncorrelated with previous components �Barker and Rayens,
J. Acoust. Soc. Am., Vol. 128, No. 3, September 2010
2003�. The first component accounts for the most variance inthe �OAEf, the second component for the second most vari-ance, and so on. 10 uncorrelated PLS components were es-timated from the sample of PVs.
Next, each uncorrelated component was sequentiallyadded to the base Dose-Hearing model yielding 10 candidatescoring functions for assessment. Thus, the scoring functionsthat include the 1st component, the 1st and 2nd components,the 1st, 2nd, and 3rd components, and so on, constituted theremaining scoring function candidates under consideration.The set of all 15 scoring function candidates considered�Dose-Hearing model, 1 scoring function with the 6 dBmethod, 3 scoring functions with simple summary metrics,and 10 scoring functions with PLS components� is providedin Table I.
2. Determine the weights of each scoring function
The weights, wk, for each combination of metrics in Eq.�2� were estimated by logistic regression. Specifically, thelog-odds of hearing change at each PV were modeled as alinear function of the metrics listed in Table I. Regressioncoefficients from the fitted model correspond to the wk, sothat Ri in Eq. �2� is equivalent to the estimated log-odds ofhearing change at each PV. Separate logistic regression mod-els were fit for each candidate model listed in Table I.
3. Find the most accurate scoring function
Each of the scoring functions described in Table I, andtheir weighting schemes established using logistic regres-sion, were compared using Receiver Operating Characteristic�ROC� curve analysis. The ROC is a plot of the true positiverate against the false positive rate for different cut-offs of thescoring function, and is the basis of most diagnostic testevaluations. The true positive rate and the false positive ratedescribe the accuracy of a particular candidate scoring func-tion. The true positive rate is the proportion of PVs with ahearing change that are correctly diagnosed using the scoringfunction, and the false positive rate is the proportion of PVswithout a hearing change that the scoring function incor-rectly diagnoses with a hearing change. The true positive rateand the false positive rate depend on the cut-off risk scoreabove which a PV would be diagnosed with hearing change.The true positive rate can be arbitrarily increased by lower-ing the cut-off point, but this comes at the cost of increasingthe false positive rate.
The accuracy of each candidate model was succinctlyestimated using the area under the ROC curve �AUC�. TheAUC estimates the average true positive rate over the do-main of false positive rates. Higher AUC are associated withoverall more accurate diagnostic methods that correctly iden-tify more PVs with hearing change and have comparativelyfew false positive diagnoses. The AUC was estimated usingan analog to the Wilcoxon-Mann-Whitney U-statistic �Han-ley and McNeil, 1982; Obuchowski, 1997�. Since most sub-jects were observed during several monitoring visits, somedegree of correlation was anticipated among the �OAEf
across monitoring appointments. Estimates of the AUC un-
der these circumstances that are based on the U-statistic areDille et al.: Ototoxic risk assessment 1167 Au
tho
r's
com
plim
enta
ry c
op
y
correct, but the standard error of the estimated AUC is incor-rect �Obuchowski, 1997�. Therefore, the non-parametric es-timator suggested by Obuchowski �1997� to compute thestandard error of AUC was used and denoted as SE�AUC�.
The accuracy of any diagnostic method that is applied tothe same sample from which the risk score weights werederived will always be overly optimistic. A scoring functioncandidate that works well to construct the scoring functionon this data set might perform poorly in a separate sample ofcisplatin patients. A common approach for obtaining nearlyunbiased estimates of the diagnostic accuracy is leave-one-out cross-validation �LOOCV; �Simon, 2005a; Hastie et al.,2009��. This is a computational algorithm whereby each pa-tient is successively excluded from the training data set, thuspartitioning the data into a test sample, which includes theomitted subject’s PVs, and a “training” sample composed ofall remaining PVs. The risk score weights for all candidatemetrics in Table I are determined from the training sample,and each is then used to predict the excluded patient’s risk ofhearing change at each PV. The procedure is iterated by leav-ing out a different patient at each step until all PVs are as-signed a risk score according to each candidate in Table I.Nearly unbiased cross-validated ROC curves, AUCs, andSE�AUC� of each candidate in Table I are then computedfrom the risk scores. Note that these estimates are ‘nearlyunbiased’ �as opposed to unbiased� because LOOCV is asample re-use algorithm, which always induces a certain de-gree of bias. Molinaro et al. �2005� use simulations and dataexamples to show that LOOCV provides the smallest biasamong a variety of sample re-use algorithms.
A test that is rapid is preferable, but only insofar thataccuracy is not sacrificed. Therefore, the half-octave analysiswas repeated by using only DPOAE frequencies restricted tothe highest quarter-octave. Given the same level of accuracy,the quarter-octave model would be preferable to the half-octave model since it would take half as long to implementin a real world clinical setting.
More complex models tend to be more accurate thansimpler models when evaluated within the sample used todevelop the model, but may not generalize to other samples.This is because complex models tend to ‘adapt’ to the idio-syncrasies of the training data sets, which may not representother, independent samples. Accordingly, model reduction isnecessary to enhance generalizability. Model reduction tech-niques are commonly used in standard statistical practice, butmost are unsuitable for the current analysis. The PLS modelsare non-nested, so methods based on the likelihood ratio areinappropriate. Metrics often proposed for selecting amongnonnested models, such as Akaike’s Information Criterion�AIC�, are also inappropriate because all of the models listedin Table I are fit to the same sample and are, therefore, cor-related. Furthermore, these reduction methods are based onthe likelihood, which is ill defined in the LOOCV setting.Because the likelihood is conditional on the fitted model,which is different at each LOOCV iteration, the AIC or like-lihood ratio statistics are incorrect. In light of the fact thatformal ranking and testing methods are unavailable for gen-eral problems such as that in the current study, researchers in
machine learning advocate model reduction according to the1168 J. Acoust. Soc. Am., Vol. 128, No. 3, September 2010
‘One Standard Error Rule’ �Hastie et al., 2009�. The bestmodel is the scoring function with the smallest number ofmetrics �K� that is within one SE�AUC� of the most accuratescoring function. Put another way, the simplest model that isstatistically indistinguishable from the best model is pre-ferred. Also, scoring functions using the quarter-octave finestructure that are within one SE�AUC� of the most accuratescoring function are preferable to scoring functions usinghalf-octave fine structure for reasons noted. Once selectedaccording to these criteria, the best scoring function, hereaf-ter called the “Ototoxicity Risk Assessment” �ORA�, wastrained on the entire sample, and constitutes the best methodamong those considered for diagnosing hearing change dur-ing a follow-up PV.
III. RESULTS
Patients were recruited into the study over a 17 monthperiod. One-hundred twenty three patients were identifiedfrom pharmacy lists and chart reviews as receiving cisplatin.Fifty-six �45.5%� of these patients met inclusion criteria forthe study. Of these, 36 �64%� agreed to participate in thestudy. Of the 36 patients who agreed to participate, 19�55.6%� passed the screening physical examination and pro-vided two or more total visits for use in the analysis. Refus-als to participate or complete the protocol requirements wereprimarily due to the time commitment, inconvenience and/ordiscomfort associated with going to the research laboratoryfor testing after chemotherapy treatment was administered.This underscores the need for objective and portable mea-sures of hearing.
Table II summarizes the sample used in this analysis.Fifty-six post-baseline PVs from 19 subjects contributeddata. The average number of post-baseline PVs per subjectwas 2.9, ranging from 1 to 12 PVs. Twenty-three of the 56PVs �41.1%� had an ASHA-significant hearing change. Thesample was generally composed of older veterans �mean age62.6; range 51–79 years�. Baseline average pure tone thresh-old in the SRO frequencies was 69.9 dB SPL and rangedfrom 43.6 to 86.7 dB SPL. The majority �n=12; 63.2%� ofsubjects had head and neck cancers, followed by lung �n=5; 26.3%�, and one each of bladder and skin cancer. Onaverage, the median starting cisplatin dose level was100 mg /m2, and ranged from 50 to 100 mg /m2.
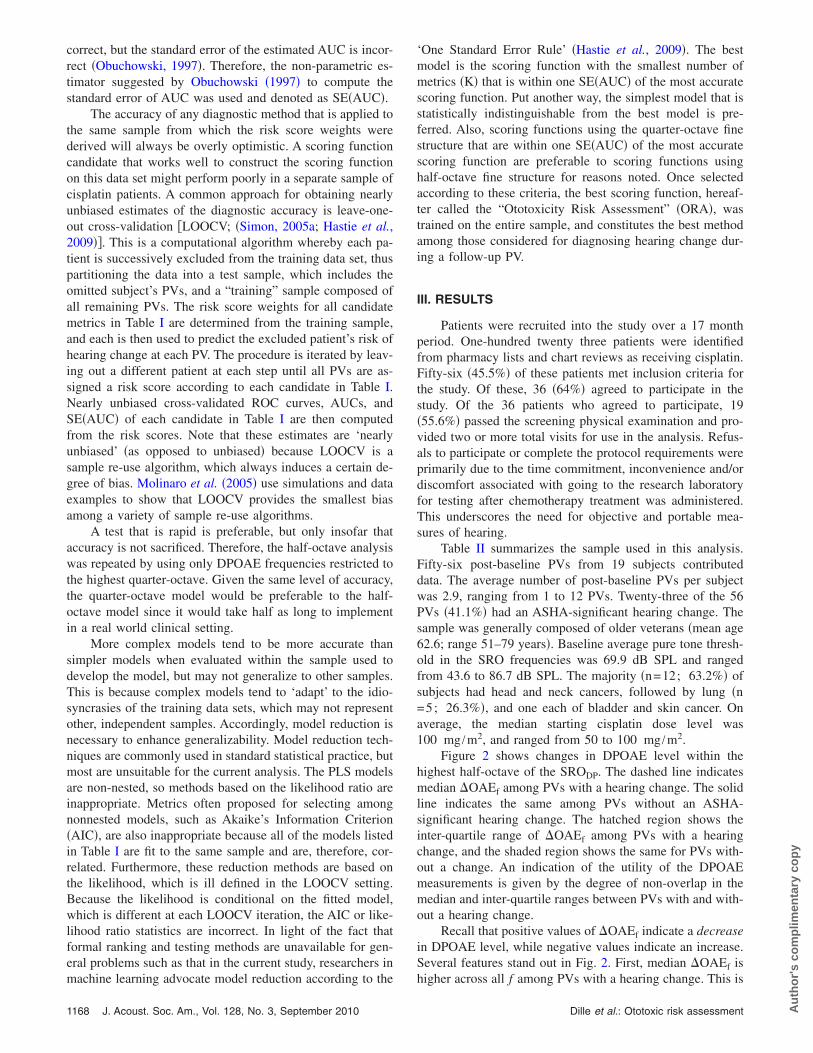
Figure 2 shows changes in DPOAE level within thehighest half-octave of the SRODP. The dashed line indicatesmedian �OAEf among PVs with a hearing change. The solidline indicates the same among PVs without an ASHA-significant hearing change. The hatched region shows theinter-quartile range of �OAEf among PVs with a hearingchange, and the shaded region shows the same for PVs with-out a change. An indication of the utility of the DPOAEmeasurements is given by the degree of non-overlap in themedian and inter-quartile ranges between PVs with and with-out a hearing change.
Recall that positive values of �OAEf indicate a decreasein DPOAE level, while negative values indicate an increase.Several features stand out in Fig. 2. First, median �OAEf is
higher across all f among PVs with a hearing change. This isDille et al.: Ototoxic risk assessment Au
tho
r's
com
plim
enta
ry c
op
y
promising evidence of the utility of DPOAEs for monitoringhearing change among patients treated with cisplatin. Sec-ond, the difference in the median �OAEf appears greater at
TABLE II. Study sample patient and treatment characteristics.
All
All N 19Patient ear-visits �post-baseline� Total 56
Mean 2.9Min 1Max 12
Visits with hearing change N 23% 41.1%
Age Mean 62.6Min 51Max 79
Baseline SRO average threshold Mean 69.6Min 43.6Max 86.7
Cancer LocationBladder N 1
% 5.3All
Head/Neck N 12% 63.2
Lung N 5% 26.3
Skin N 1% 5.3
Starting Dose Level Cisplatin �mg /m2� Median 100Min 50.0Max 100
FIG. 2. Graph of median and inter-quartile range for the indexed �OAEf
�Baseline DPOAEf−PV DPOAEf� as a function of DPOAE fine structuresteps �f� ordered from highest �f =1� to lowest �f =24� frequency. Thedashed line represents the mean �OAEf for those subjects with an ASHA-significant change in hearing �inter-quartile range indicated with horizontalshading lines�. The solid line represents the mean �OAEf for those subjectswith no change in hearing �inter-quartile range indicated with solid grayshading�. The vertical reference line separates the upper and lower quarter
octave.J. Acoust. Soc. Am., Vol. 128, No. 3, September 2010
the highest �left edge of the horizontal axis� and lowest �rightedge� steps, and smaller in the middle region. More thananything, this suggests that frequencies should be weighteddifferently for predicting hearing change, and underscoresthe potential advantage of PLS over simply averaging the�OAEf since the latter assumes constant weights. Finally, theinter-quartile range shows the biggest separation at the low-est steps �f =12 to 24�, suggesting that a complete half-octave of testing may be necessary to accurately predicthearing change.
Observations on Fig. 2 provide a better understanding ofthe differences in the distribution of DPOAE fine structurebetween PVs with and without a hearing change. However,Fig. 2 does not adjust for the fact that some patients providedmany more PVs than other, which might influence the ap-pearance of Fig. 2. This is mitigated using the LOOCVanalysis with the candidate scoring functions described inTable I. The LOOCV procedure successively holds out eachbiologically independent unit �i.e., the subject� while devel-oping the predictive model. Subjects with a relatively largenumber of PVs cannot influence predicted hearing change ontheir own PVs, since that subject does not contribute tomodel fitting during that iteration of the LOOCV procedure.
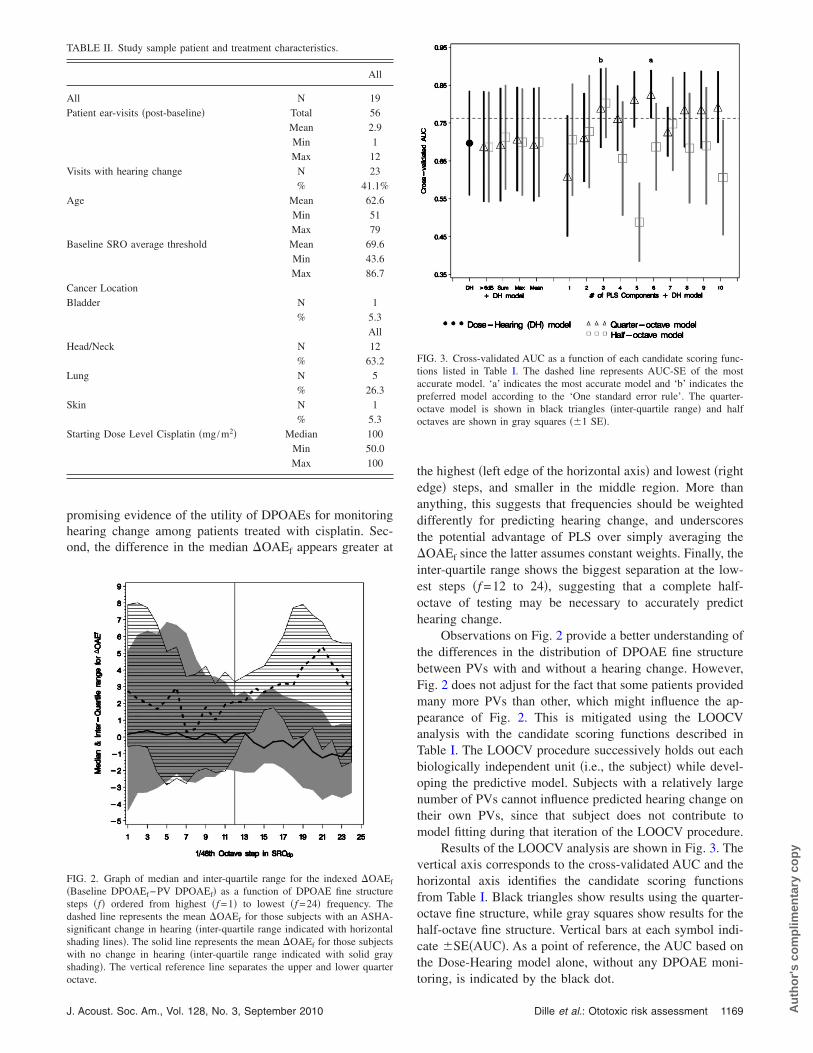
Results of the LOOCV analysis are shown in Fig. 3. Thevertical axis corresponds to the cross-validated AUC and thehorizontal axis identifies the candidate scoring functionsfrom Table I. Black triangles show results using the quarter-octave fine structure, while gray squares show results for thehalf-octave fine structure. Vertical bars at each symbol indi-cate �SE�AUC�. As a point of reference, the AUC based onthe Dose-Hearing model alone, without any DPOAE moni-
FIG. 3. Cross-validated AUC as a function of each candidate scoring func-tions listed in Table I. The dashed line represents AUC-SE of the mostaccurate model. ‘a’ indicates the most accurate model and ‘b’ indicates thepreferred model according to the ‘One standard error rule’. The quarter-octave model is shown in black triangles �inter-quartile range� and halfoctaves are shown in gray squares ��1 SE�.
toring, is indicated by the black dot.
Dille et al.: Ototoxic risk assessment 1169 Au
tho
r's
com
plim
enta
ry c
op
y
Figure 3 shows that simple summary metrics based onchanges in DPOAE fine structure offer little improvementover the Dose-Hearing model alone, which already achievessome success in identifying hearing change �AUC=0.7�.However, several of the PLS models using more than twocomponents show considerably higher accuracy than thesimple Dose-Hearing model or the simple �OAEf summarymetrics in conjunction with the Dose-Hearing model. Themost accurate model is the six PLS component model, la-beled ‘a’, based on one quarter octave DPOAE fine structure,with a cross-validated AUC of 0.83. However, with six PLScomponents �and the Dose-Hearing model�, this scoringfunction is more complex than some other candidates thathave only slightly lower accuracy. The preferred scoringfunction is thus selected according to the ‘One Standard Er-ror Rule’, that is the simplest model with an AUC that iswithin one standard error of the most accurate model. Thedashed, horizontal line marks the AUC minus SE�AUC� ofthe six PLS component, quarter-octave model. The preferredscoring function is the one with the fewest components thathas an AUC above the dashed reference line. According tothese criteria, the preferred scoring function is the quarter-octave model using the top 3 PLS components �AUC=0.79� and is labeled ‘b’ in Fig. 3.
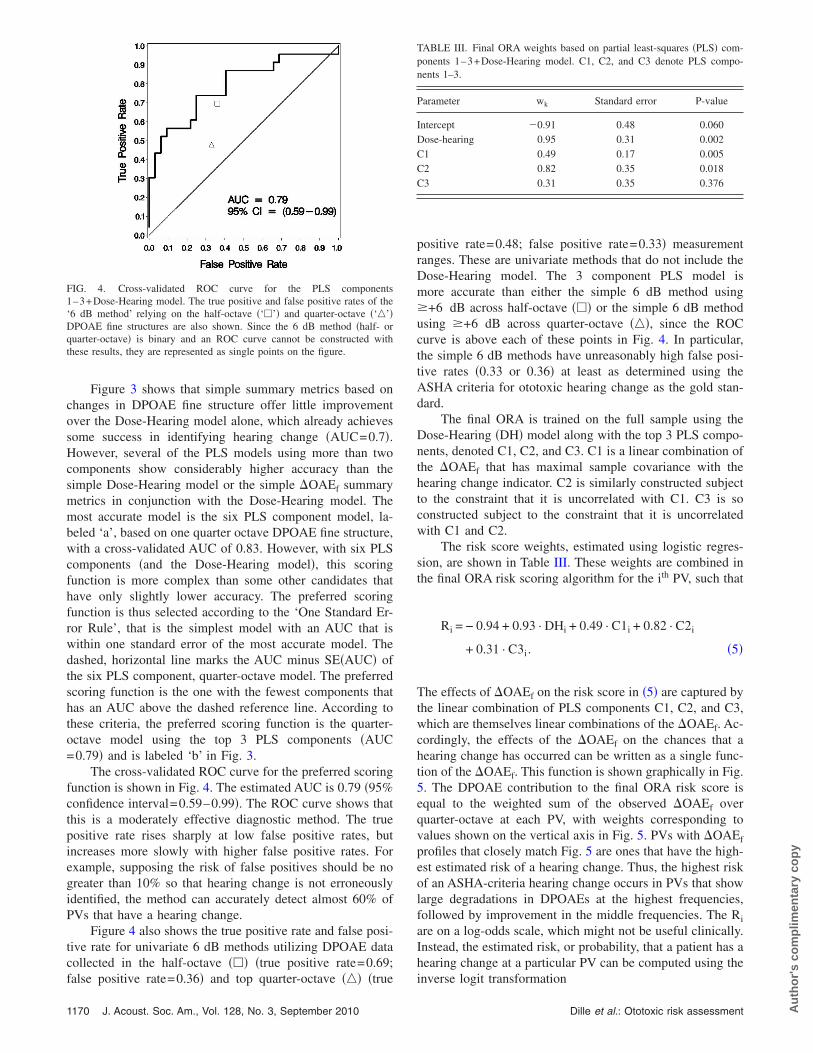
The cross-validated ROC curve for the preferred scoringfunction is shown in Fig. 4. The estimated AUC is 0.79 �95%confidence interval=0.59–0.99�. The ROC curve shows thatthis is a moderately effective diagnostic method. The truepositive rate rises sharply at low false positive rates, butincreases more slowly with higher false positive rates. Forexample, supposing the risk of false positives should be nogreater than 10% so that hearing change is not erroneouslyidentified, the method can accurately detect almost 60% ofPVs that have a hearing change.
Figure 4 also shows the true positive rate and false posi-tive rate for univariate 6 dB methods utilizing DPOAE datacollected in the half-octave ��� �true positive rate=0.69;
FIG. 4. Cross-validated ROC curve for the PLS components1–3+Dose-Hearing model. The true positive and false positive rates of the‘6 dB method’ relying on the half-octave �‘�’� and quarter-octave �‘�’�DPOAE fine structures are also shown. Since the 6 dB method �half- orquarter-octave� is binary and an ROC curve cannot be constructed withthese results, they are represented as single points on the figure.
false positive rate=0.36� and top quarter-octave ��� �true
1170 J. Acoust. Soc. Am., Vol. 128, No. 3, September 2010
positive rate=0.48; false positive rate=0.33� measurementranges. These are univariate methods that do not include theDose-Hearing model. The 3 component PLS model ismore accurate than either the simple 6 dB method using�+6 dB across half-octave ��� or the simple 6 dB methodusing �+6 dB across quarter-octave ���, since the ROCcurve is above each of these points in Fig. 4. In particular,the simple 6 dB methods have unreasonably high false posi-tive rates �0.33 or 0.36� at least as determined using theASHA criteria for ototoxic hearing change as the gold stan-dard.
The final ORA is trained on the full sample using theDose-Hearing �DH� model along with the top 3 PLS compo-nents, denoted C1, C2, and C3. C1 is a linear combination ofthe �OAEf that has maximal sample covariance with thehearing change indicator. C2 is similarly constructed subjectto the constraint that it is uncorrelated with C1. C3 is soconstructed subject to the constraint that it is uncorrelatedwith C1 and C2.
The risk score weights, estimated using logistic regres-sion, are shown in Table III. These weights are combined inthe final ORA risk scoring algorithm for the ith PV, such that
Ri = − 0.94 + 0.93 · DHi + 0.49 · C1i + 0.82 · C2i
+ 0.31 · C3i. �5�
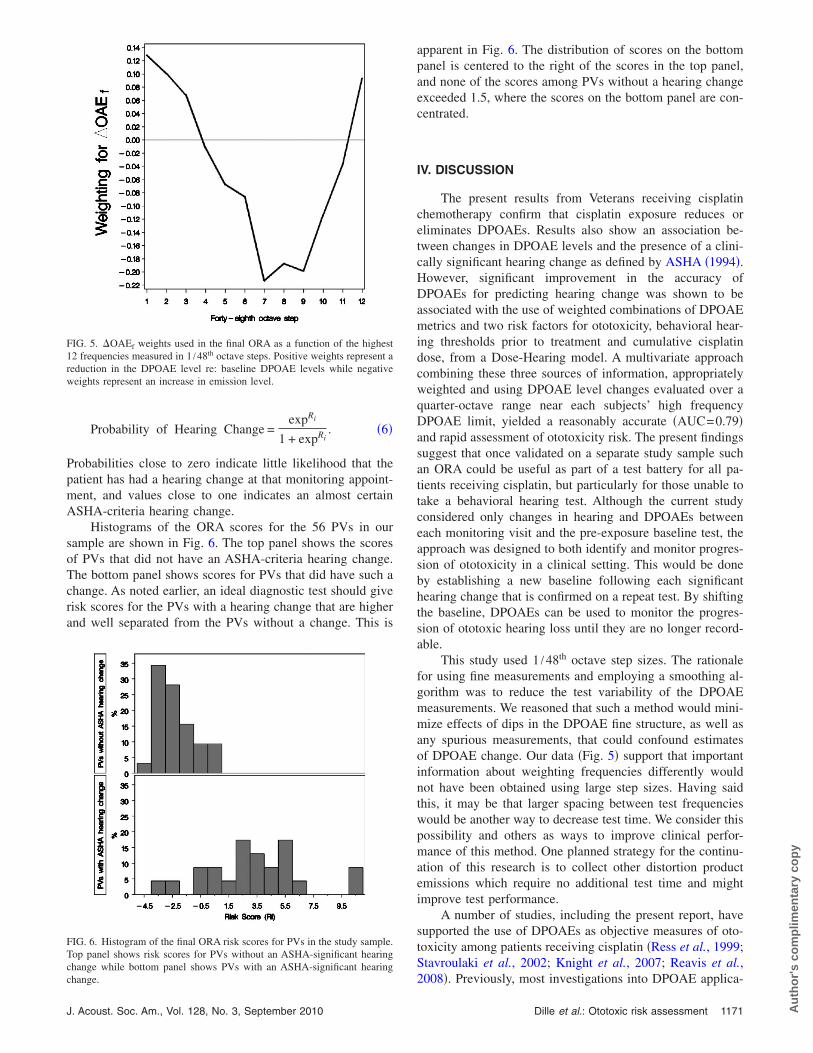
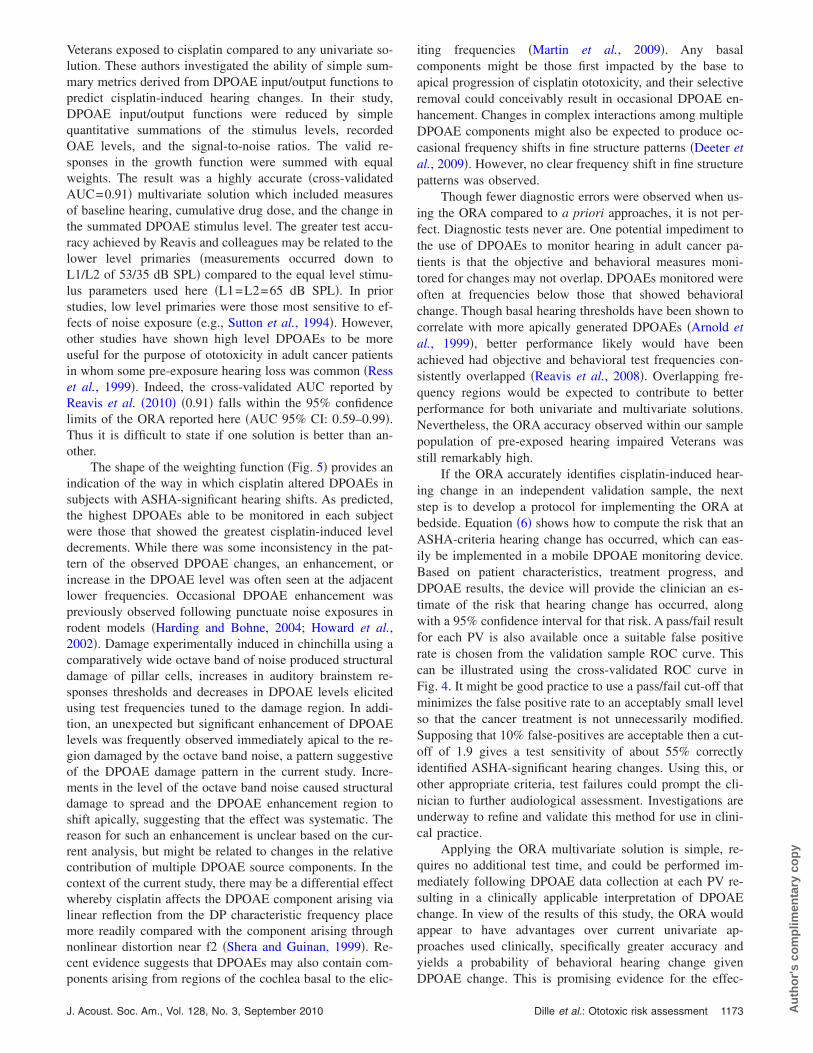
The effects of �OAEf on the risk score in �5� are captured bythe linear combination of PLS components C1, C2, and C3,which are themselves linear combinations of the �OAEf. Ac-cordingly, the effects of the �OAEf on the chances that ahearing change has occurred can be written as a single func-tion of the �OAEf. This function is shown graphically in Fig.5. The DPOAE contribution to the final ORA risk score isequal to the weighted sum of the observed �OAEf overquarter-octave at each PV, with weights corresponding tovalues shown on the vertical axis in Fig. 5. PVs with �OAEf
profiles that closely match Fig. 5 are ones that have the high-est estimated risk of a hearing change. Thus, the highest riskof an ASHA-criteria hearing change occurs in PVs that showlarge degradations in DPOAEs at the highest frequencies,followed by improvement in the middle frequencies. The Ri
are on a log-odds scale, which might not be useful clinically.Instead, the estimated risk, or probability, that a patient has ahearing change at a particular PV can be computed using the
TABLE III. Final ORA weights based on partial least-squares �PLS� com-ponents 1–3+Dose-Hearing model. C1, C2, and C3 denote PLS compo-nents 1–3.
Parameter wk Standard error P-value
Intercept �0.91 0.48 0.060Dose-hearing 0.95 0.31 0.002C1 0.49 0.17 0.005C2 0.82 0.35 0.018C3 0.31 0.35 0.376
inverse logit transformation
Dille et al.: Ototoxic risk assessment Au
tho
r's
com
plim
enta
ry c
op
y
Probability of Hearing Change =expRi
1 + expRi. �6�
Probabilities close to zero indicate little likelihood that thepatient has had a hearing change at that monitoring appoint-ment, and values close to one indicates an almost certainASHA-criteria hearing change.
Histograms of the ORA scores for the 56 PVs in oursample are shown in Fig. 6. The top panel shows the scoresof PVs that did not have an ASHA-criteria hearing change.The bottom panel shows scores for PVs that did have such achange. As noted earlier, an ideal diagnostic test should giverisk scores for the PVs with a hearing change that are higherand well separated from the PVs without a change. This is
FIG. 5. �OAEf weights used in the final ORA as a function of the highest12 frequencies measured in 1 /48th octave steps. Positive weights represent areduction in the DPOAE level re: baseline DPOAE levels while negativeweights represent an increase in emission level.
FIG. 6. Histogram of the final ORA risk scores for PVs in the study sample.Top panel shows risk scores for PVs without an ASHA-significant hearingchange while bottom panel shows PVs with an ASHA-significant hearing
change.J. Acoust. Soc. Am., Vol. 128, No. 3, September 2010
apparent in Fig. 6. The distribution of scores on the bottompanel is centered to the right of the scores in the top panel,and none of the scores among PVs without a hearing changeexceeded 1.5, where the scores on the bottom panel are con-centrated.
IV. DISCUSSION
The present results from Veterans receiving cisplatinchemotherapy confirm that cisplatin exposure reduces oreliminates DPOAEs. Results also show an association be-tween changes in DPOAE levels and the presence of a clini-cally significant hearing change as defined by ASHA �1994�.However, significant improvement in the accuracy ofDPOAEs for predicting hearing change was shown to beassociated with the use of weighted combinations of DPOAEmetrics and two risk factors for ototoxicity, behavioral hear-ing thresholds prior to treatment and cumulative cisplatindose, from a Dose-Hearing model. A multivariate approachcombining these three sources of information, appropriatelyweighted and using DPOAE level changes evaluated over aquarter-octave range near each subjects’ high frequencyDPOAE limit, yielded a reasonably accurate �AUC=0.79�and rapid assessment of ototoxicity risk. The present findingssuggest that once validated on a separate study sample suchan ORA could be useful as part of a test battery for all pa-tients receiving cisplatin, but particularly for those unable totake a behavioral hearing test. Although the current studyconsidered only changes in hearing and DPOAEs betweeneach monitoring visit and the pre-exposure baseline test, theapproach was designed to both identify and monitor progres-sion of ototoxicity in a clinical setting. This would be doneby establishing a new baseline following each significanthearing change that is confirmed on a repeat test. By shiftingthe baseline, DPOAEs can be used to monitor the progres-sion of ototoxic hearing loss until they are no longer record-able.
This study used 1 /48th octave step sizes. The rationalefor using fine measurements and employing a smoothing al-gorithm was to reduce the test variability of the DPOAEmeasurements. We reasoned that such a method would mini-mize effects of dips in the DPOAE fine structure, as well asany spurious measurements, that could confound estimatesof DPOAE change. Our data �Fig. 5� support that importantinformation about weighting frequencies differently wouldnot have been obtained using large step sizes. Having saidthis, it may be that larger spacing between test frequencieswould be another way to decrease test time. We consider thispossibility and others as ways to improve clinical perfor-mance of this method. One planned strategy for the continu-ation of this research is to collect other distortion productemissions which require no additional test time and mightimprove test performance.
A number of studies, including the present report, havesupported the use of DPOAEs as objective measures of oto-toxicity among patients receiving cisplatin �Ress et al., 1999;Stavroulaki et al., 2002; Knight et al., 2007; Reavis et al.,
2008�. Previously, most investigations into DPOAE applica-Dille et al.: Ototoxic risk assessment 1171 Au
tho

r's
com
plim
enta
ry c
op
y
tions for the detection of ototoxicity have utilized either sta-tistical tests of group differences, or clinically significant dif-ferences determined a priori in control populations.Additionally, reports from normal hearing subjects’ unex-posed to ototoxic agents have suggested using a level changecriteria of 6 to 9 dB based on test-retest reliability and whichcorresponds to the upper bound of the 95% confidence limits�Beattie et al. 2003; Franklin et al. 1992; Roede et al. 1993�.This criterion was developed to reduce false positive ratesbut the corresponding specificity and sensitivity in adult can-cer patients was unknown prior to this report. Evaluating theunivariate 6 dB method against the behavioral gold-standard,we found unacceptably high false positive rates using the 6dB method with only modest sensitivity. Previous work lead-ing to the proposed 6 dB method involved studies of DPOAElevel repeatability performed in healthy, normal-hearing re-search subjects. A DPOAE level change of approximately 6dB was identified in a number of these studies as a changethat is large relative to normal test-retest variability, wouldyield an estimated false positive rate of only about 5%, andtherefore that would potentially indicate a real DPOAEchange in an exposed ear. Test repeatability among younghealthy volunteers, however, may not be representative ofthe current sample of adult cancer patients, many of whomhad some hearing loss prior to treatment, and therefore mayhave had DPOAEs that were lower in level and more likelyto be contaminated by noise. Alternatively, the unexpectedlyhigh false positive rates obtained for the 6 dB method maybe associated with real cisplatin-induced changes inDPOAEs at a given PV for ears that lacked correspondingASHA-significant hearing changes.
While the second possibility could not be tested becausethere is no gold standard test for subclinical changes in oto-toxicity, a post hoc analysis of test repeatability was per-formed on two control subjects using the same systems andprotocols described for the current data set. These were Vet-eran subjects with pre-existing hearing loss who were hospi-talized at the Portland VA Medical Center for either severeinfection or cancer but were taking no ototoxic medications.Otherwise, they were recruited using the same exclusionarycriteria as the cisplatin exposed subjects in this study. Thecontrol subjects were seen across 7 PVs over 6–12 weekswith an average of 3.5 visits yielding up to 168 possibletest-retest �OAEf calculations. These data are presented inFig. 7 in the form of cumulative distributions, with cumula-tive percent represented on the y axis and test-retest differ-ences on the x axis given in 2-dB bins. Separate curves areshown for the top half octave �gray line� and quarter octave�black line� ranges of recordable DPOAEs. Vertical lines in-dicate the proportion of observed DPOAE test-retest levelchanges that were 6 dB or smaller �73.2% and 54.8% for halfand quarter octave ranges of data, respectively�. These re-sults correspond to an estimated false positive rate for the 6dB method of 26.8% and 45.2% for the top half or quarteroctave ranges of data, respectively. Though test-retest differ-ence data were available from only two unexposed hospital-ized Veteran patients, the false positive rates estimated em-
pirically from these data agreed with actual DPOAE false1172 J. Acoust. Soc. Am., Vol. 128, No. 3, September 2010
positive rates determined using a gold standard measure ofototoxic hearing change among subjects administered cispl-atin. Furthermore, adding the a priori 6 dB change criterionto the Dose-Hearing model to form a multivariate 6 dBmethod, did not increase test accuracy. The overall test ac-curacy was comparable to the Dose-Hearing model by itselfwhich can be determined from data available at baselinewithout information from subsequent monitoring visits. Bothunivariate and multivariate 6 dB methods were inferior toalternative tests for the early detection of ototoxicity.
Analysis of other DPOAE fine-structure summary met-rics developed a priori revealed performances that were onlyslightly better than the 6 dB method. Additionally, resultsseen in Fig. 2 highlight the need to weight DPOAE changesdifferently across the half-octave test range. The ototoxicityrisk assessment �ORA� in which �OAEf were allowed to beweighted differently �through PLS methods� and combinedwith the Dose-Hearing model, resulted in improvements intest performance over that achieved with either the 6 dBmethod or simple summary metrics. Thus, the ORA resultedin greater separation of the response distributions from earsexhibiting changed hearing as compared to those with stablehearing when compared to the more traditional approaches.
Consistent with other published reports, multivariate so-lutions were found to be more accurate than univariate meth-ods. Dorn et al. �1999� compared single variable with mul-tivariate methods and found that clinical decision methodswere improved when multiple frequencies �measured in halfoctave steps� from the DPOAE were used. Gorga et al.�1999� provided much needed but often overlooked valida-tion of this finding and, further, demonstrated that no addi-tional time will be spent in data collection using multivariatemethods to improve test performance.
Recently, Reavis et al. �2010� similarly found that a
FIG. 7. Cumulative distribution functions �%� for smoothed �OAEf mea-sured over 7 visits from 2 control subjects. Gray line represents levelchanges over highest half octave while black line includes level changes forhighest quarter octave.
multivariate solution better predicted hearing changes among
Dille et al.: Ototoxic risk assessment Au
tho
r's
com
plim
enta
ry c
op
y
Veterans exposed to cisplatin compared to any univariate so-lution. These authors investigated the ability of simple sum-mary metrics derived from DPOAE input/output functions topredict cisplatin-induced hearing changes. In their study,DPOAE input/output functions were reduced by simplequantitative summations of the stimulus levels, recordedOAE levels, and the signal-to-noise ratios. The valid re-sponses in the growth function were summed with equalweights. The result was a highly accurate �cross-validatedAUC=0.91� multivariate solution which included measuresof baseline hearing, cumulative drug dose, and the change inthe summated DPOAE stimulus level. The greater test accu-racy achieved by Reavis and colleagues may be related to thelower level primaries �measurements occurred down toL1/L2 of 53/35 dB SPL� compared to the equal level stimu-lus parameters used here �L1=L2=65 dB SPL�. In priorstudies, low level primaries were those most sensitive to ef-fects of noise exposure �e.g., Sutton et al., 1994�. However,other studies have shown high level DPOAEs to be moreuseful for the purpose of ototoxicity in adult cancer patientsin whom some pre-exposure hearing loss was common �Resset al., 1999�. Indeed, the cross-validated AUC reported byReavis et al. �2010� �0.91� falls within the 95% confidencelimits of the ORA reported here �AUC 95% CI: 0.59–0.99�.Thus it is difficult to state if one solution is better than an-other.
The shape of the weighting function �Fig. 5� provides anindication of the way in which cisplatin altered DPOAEs insubjects with ASHA-significant hearing shifts. As predicted,the highest DPOAEs able to be monitored in each subjectwere those that showed the greatest cisplatin-induced leveldecrements. While there was some inconsistency in the pat-tern of the observed DPOAE changes, an enhancement, orincrease in the DPOAE level was often seen at the adjacentlower frequencies. Occasional DPOAE enhancement waspreviously observed following punctuate noise exposures inrodent models �Harding and Bohne, 2004; Howard et al.,2002�. Damage experimentally induced in chinchilla using acomparatively wide octave band of noise produced structuraldamage of pillar cells, increases in auditory brainstem re-sponses thresholds and decreases in DPOAE levels elicitedusing test frequencies tuned to the damage region. In addi-tion, an unexpected but significant enhancement of DPOAElevels was frequently observed immediately apical to the re-gion damaged by the octave band noise, a pattern suggestiveof the DPOAE damage pattern in the current study. Incre-ments in the level of the octave band noise caused structuraldamage to spread and the DPOAE enhancement region toshift apically, suggesting that the effect was systematic. Thereason for such an enhancement is unclear based on the cur-rent analysis, but might be related to changes in the relativecontribution of multiple DPOAE source components. In thecontext of the current study, there may be a differential effectwhereby cisplatin affects the DPOAE component arising vialinear reflection from the DP characteristic frequency placemore readily compared with the component arising throughnonlinear distortion near f2 �Shera and Guinan, 1999�. Re-cent evidence suggests that DPOAEs may also contain com-
ponents arising from regions of the cochlea basal to the elic-J. Acoust. Soc. Am., Vol. 128, No. 3, September 2010
iting frequencies �Martin et al., 2009�. Any basalcomponents might be those first impacted by the base toapical progression of cisplatin ototoxicity, and their selectiveremoval could conceivably result in occasional DPOAE en-hancement. Changes in complex interactions among multipleDPOAE components might also be expected to produce oc-casional frequency shifts in fine structure patterns �Deeter etal., 2009�. However, no clear frequency shift in fine structurepatterns was observed.
Though fewer diagnostic errors were observed when us-ing the ORA compared to a priori approaches, it is not per-fect. Diagnostic tests never are. One potential impediment tothe use of DPOAEs to monitor hearing in adult cancer pa-tients is that the objective and behavioral measures moni-tored for changes may not overlap. DPOAEs monitored wereoften at frequencies below those that showed behavioralchange. Though basal hearing thresholds have been shown tocorrelate with more apically generated DPOAEs �Arnold etal., 1999�, better performance likely would have beenachieved had objective and behavioral test frequencies con-sistently overlapped �Reavis et al., 2008�. Overlapping fre-quency regions would be expected to contribute to betterperformance for both univariate and multivariate solutions.Nevertheless, the ORA accuracy observed within our samplepopulation of pre-exposed hearing impaired Veterans wasstill remarkably high.
If the ORA accurately identifies cisplatin-induced hear-ing change in an independent validation sample, the nextstep is to develop a protocol for implementing the ORA atbedside. Equation �6� shows how to compute the risk that anASHA-criteria hearing change has occurred, which can eas-ily be implemented in a mobile DPOAE monitoring device.Based on patient characteristics, treatment progress, andDPOAE results, the device will provide the clinician an es-timate of the risk that hearing change has occurred, alongwith a 95% confidence interval for that risk. A pass/fail resultfor each PV is also available once a suitable false positiverate is chosen from the validation sample ROC curve. Thiscan be illustrated using the cross-validated ROC curve inFig. 4. It might be good practice to use a pass/fail cut-off thatminimizes the false positive rate to an acceptably small levelso that the cancer treatment is not unnecessarily modified.Supposing that 10% false-positives are acceptable then a cut-off of 1.9 gives a test sensitivity of about 55% correctlyidentified ASHA-significant hearing changes. Using this, orother appropriate criteria, test failures could prompt the cli-nician to further audiological assessment. Investigations areunderway to refine and validate this method for use in clini-cal practice.
Applying the ORA multivariate solution is simple, re-quires no additional test time, and could be performed im-mediately following DPOAE data collection at each PV re-sulting in a clinically applicable interpretation of DPOAEchange. In view of the results of this study, the ORA wouldappear to have advantages over current univariate ap-proaches used clinically, specifically greater accuracy andyields a probability of behavioral hearing change given
DPOAE change. This is promising evidence for the effec-Dille et al.: Ototoxic risk assessment 1173 Au
tho

co
mp
limen
tary
co
py
tiveness of the ORA, even so, the ORA must be validated inan independent sample prior to being implemented clinically.
ACKNOWLEDGMENTS
Work supported by the Department of Veterans AffairsRR&D Service �Grant Nos. C4183R and C4447K� and theVA RR&D National Center for Rehabilitative Auditory Re-search, Portland, OR. The authors wish to thank Stephen T.Neely, D. Sc. and Boys Town National Research Hospital forthe Emav System that was used to collect the DPOAE re-sponses.
Alam, S., Ikeda, K., Oshima, T., Suzuki, M., Kawase, T., Kikuchi, T., andTakasaka, T. �2000�. “Cisplatin-induced apoptotic cell death in Mongoliangerbil cochlea,” Hear. Res. 141, 28–38.
Amalraj, S., Starkweather, C., Nguyen, C., and Naeim, A. �2009�. “Healthliteracy, communication, and treatment decision-making in older cancerpatients,” Oncology 23, 369–375.
Arnold, D., Lonsbury-Martin, B., and Martin, G. �1999�. “High-frequencyhearing influences lower-frequency distortion-product otoacoustic emis-sions,” Arch. Otolaryngol. Head Neck Surg. 125, 215–222.
ASHA �1994�. “Guidelines for the audiologic management of individualsreceiving cochleotoxic drug therapy,” American Speech-Language-Hearing Association, www.ashaorg/docs/html/GL1994-00003.html, pp.11–19.
Barker, M., and Rayens, W. �2003�. “Partial least squares for discrimina-tion,” J. Chemom. 17, 166–173.
Beattie, R., Kenworthy, O., and Luna, C. �2003�. “Immediate and short-termreliability of distortion-product otoacoustic emissions,” Int. J. Audiol. 42,348–354.
Carhart, R., and Jerger, J. �1959�. “Preferred method for clinical determina-tion of pure-tone thresholds,” J. Speech Hear Disord. 24, 330–345.
Dalton, D., Cruickshanks, K., Klein, B., Klein, R., Wiley, T., and Nondahl,D. �2003�. “The impact of hearing loss on quality of life in older adults,”Gerontologist 43, 661–668.
Deeter, R., Abel, R., Calandruccio, L., and Dhar, S. �2009�. “Contralateralacoustic stimulation alters the magnitude and phase of distortion productotoacoustic emissions,” J. Acoust. Soc. Am. 126, 2413–2424.
Dorn, P., Piskorski, P., Gorga, M., Neely, S., and Keefe, D. �1999�. “Pre-dicting audiometric status from distortion product otoacoustic emissionsusing multivariate analysis,” Ear Hear. 20, 149–163.
Durrant, J., Palmer, C., and Lunner, T. �2005�. “Analysis of counted behav-iors in a single-subject design: Modeling of hearing-aid intervention inhearing-aid patients with Alzheimer’s disease,” Int. J. Audiol. 44, 31–38.
Fausti, S., Frey, R., Erickson, D., Rappaport, B., Cleary, E., and Brummert,R. �1979�. “A system for evaluating auditory function from 8,000–20,000Hz,” J. Acoust. Soc. Am. 66, 1713–1718.
Fausti, S., Frey, R., Henry, J., Olson, D., and Schaffer, H. �1992�. “Earlydetection of ototoxicity using high-frequency, tone-burst-evoked auditorybrainstem responses,” J. Am. Acad. Audiol 3, 397–404.
Fausti, S., Rappaport, B., Frey, R., Henry, J., Phillips, D., Mitchell, C., andOlson, D. �1991�. “Reliability of evoked responses to high-frequency�8–14 kHz� tone bursts,” J. Am. Acad. Audiol 2, 105–114.
Fischel-Ghodsian, N., Prezant, T., Bu, X., and Oztas, S. �1993�. “Mitochon-drial ribosomal RNA gene mutation in a patient with sporadic aminogly-coside ototoxicity,” Am. J. Otolaryngol. 14, 399–403.
Fitzmaurice, G., Laird, N., and Ware, J. �2004�. Applied Longitudinal Analy-sis �Wiley, Hoboken, NJ�, pp. 291–321.
Forge, A., and Schacht, J. �2000�. “Aminoglycoside antibiotics,” Audiol.Neuro-Otol. 5, 3–22.
Franklin, D., McCoy, M., Martin, G., and Lonsbury-Martin, B. �1992�.“Test/retest reliability of distortion-product and transiently evoked otoa-coustic emissions,” Ear Hear. 13, 417–429.
Gorga, M., Neely, S., and Dorn, P. �1999�. “Distortion product otoacousticemission test performance for a priori criteria and for multifrequency au-diometric standards,” Ear Hear. 20, 345–362.
Gorga, M., Neely, S., Ohlrich, B., Redner, J., and Peters, J. �1997�. “Fromlaboratory to clinic: A large scale study of distortion product otoacousticemissions in ears with normal hearing and ears with hearing loss,” EarHear. 18, 440–455.
1174 J. Acoust. Soc. Am., Vol. 128, No. 3, September 2010
Gorga, M., Stover, L., Neely, S., and Montoya, D. �1996�. “The use ofcumulative distributions to determine critical values and levels of confi-dence for clinical distortion product otoacoustic emission measurements,”J. Acoust. Soc. Am. 100, 968–977.
Hanley, J., and McNeil, B. �1982�. “The meaning and use of the area undera receiver operating characteristic �ROC� curve,” Radiology 143, 29–36.
Harding, G., and Bohne, B. �2004�. “Temporary DPOAE level shifts, ABRthreshold shifts and histopathological damage following below-critical-level noise exposure,” Hear. Res. 196, 94–108.
Hastie, T., Tibshirani, R., and Friedman, J. �2009�. The Elements of Statis-tical Learning: Data Mining, Inference and Prediction �Springer, NewYork�, pp. 241–245.
Hodges, A., and Lonsbury-Martin, B. �1998�. Hearing Management �Singu-lar, San Diego�, pp. 269–290.
Howard, M., Stagner, B., Lonsbury-Martin, B., and Martin, G. �2002�. “Ef-fects of reversible noise exposure on the suppression tuning of rabbitdistortion-product otoacoustic emissions,” J. Acoust. Soc. Am. 111, 285–296.
Knight, K., Kraemer, D., Winter, C., and Neuwelt, E. �2007�. “Earlychanges in auditory function as a result of platinum chemotherapy: Use ofextended high-frequency audiometry and evoked distortion product otoa-coustic emissions,” J. Clin. Oncol. 25, 1190–1195.
Kochkin, S., and Rogin, C. �2000�. “Quantifying the obvious: The impact ofhearing instruments on the quality of life,” Hear. Rev. 7, 6–34.
Laurell, G., Viberg, A., Teixeira, M., Sterkers, O., and Ferrary, E. �2000�.“Blood-perilymph barrier and ototoxicity: An in vivo study in the rat,”Acta Oto-Laryngol. 120, 796–803.
Martin, G., Stagner, B., Fahey, P., and Lonsbury-Martin, B. �2009�. “Steepand shallow phase gradient distortion product otoacoustic emissions aris-ing basal to the primary tones,” J. Acoust. Soc. Am. 125, EL85–EL92.
Mauermann, M., and Kollmeier, B. �2004�. “Distortion product otoacousticemissions �DPOAE� input/output functions and the influence of the secondDPOAE source,” J. Acoust. Soc. Am. 116, 2199–2212.
Molinaro, A., Simon, R., and Pfeiffer, R. �2005�. “Prediction error estima-tion: A comparison of resampling methods,” Bioinformatics 21, 3301–3307.
Mukherjea, D., Whitworth, C., Nandish, S., Dunaway, G., Rybak, L., andRamkumar, V. �2006�. “Expression of the kidney infury molecule 1 in therat cochlea and induction by cisplatin,” Neuroscience 139, 733–740.
Neely, S., and Liu, Z. �1994�. EMAV: Otoacoustic Emission Averager �BoysTown National Research Hospital, Omaha, NE�.
Obuchowski, N. �1997�. “Nonparametric analysis of clustered ROC curvedata,” Biometrics 53, 567–578.
Radmacher, M., McShane, L., and Simon, R. �2002�. “A paradigm for classprediction using gene expression profiles,” J. Comput. Biol. 9, 505–511.
Reavis, K., McMillan, G., Austin, D., Fausti, S., and Konrad-Martin, D.�2010�. “Distortion-product otoacoustic emission test performance for oto-toxicity monitoring,” Ear Hear. In press.
Reavis, K. M., Phillips, D. S., Fausti, S. J., Gordon, J. S., Helt, W. J.,Willington, D., Bratt, G. W., and Konrad-Martin, D. �2008�. “Factors af-fecting sensitivity of distortion-product otoacoustic emissions to ototoxichearing loss,” Ear Hear. 29, 875–893.
Ress, B. D., Sridhar, K. S., Balkany, T. J., Waxman, G. M., Stagner, B. B.,and Lonsbury-Martin, B. L. �1999�. “Effects of cis-platin chemotherapy onotoacoustic emissions: The development of an objective screening proto-col,” Otolaryngol.-Head Neck Surg. 121, 693–701.
Roede, J., Harris, F., Probst, R., and Xu, L. �1993�. “Repeatability of distor-tion product otoacoustic emissions in normally hearing humans,” Audiol-ogy 32, 273–281.
Shera, C., and Guinan, J. �1999�. “Evoked otoacoustic emissions arise bytwo fundamentally different mechanisms: A taxonomy for mammalianOAEs,” J. Acoust. Soc. Am. 105, 782–798.
Simon, R. �2005a�. “Roadmap for developing and validating therapeuticallyrelevant genomic classifiers,” J. Clin. Oncol. 23, 7332–7341.
Stavroulaki, P., Vossinakis, I., Dinopoulou, D., Doudounakis, S., Ada-mopoulos, G., and Apostolopoulos, N. �2002�. “Otoacoustic emissions formonitoring aminoglycoside-induced ototoxicity in children with cystic fi-brosis,” Arch. Otolaryngol. Head Neck Surg. 128, 150–155.
Sutton, L. A., Lonsbury-Martin, B. L., Martin, G. K., and Whitehead, M. L.�1994�. Sensitivity of distortion-product otoacoustic emissions in humansto tonal over-exposure: Time course of recovery and effects of loweringL2,” Hear. Res. 75 1–2, 161–174.
Dille et al.: Ototoxic risk assessment Au
tho
r's