Otjiherero First Language - NIED
32
Duke Law Journal VOLUME 64 MARCH 2015 NUMBER 6 THE BEST FOR LAST: THE TIMING OF U.S. SUPREME COURT DECISIONS LEE EPSTEIN† WILLIAM M. LANDES†† RICHARD A. POSNER††† ABSTRACT This Article investigates the hypothesis that the most important and, often, controversial and divisive cases—so called “big” cases— are disproportionately decided at the end of June. We define a “big case” in one of four ways: front-page coverage in the New York Times; front-page and other coverage in four national newspapers (the New York Times, Los Angeles Times, Washington Post, and Chicago Tribune); the number of amicus curiae briefs filed in a case; and the number of subsequent citations by the Supreme Court to its decision in a case. We find a statistically significant association between each measure of a big case and end-of-term decisions even after controlling for the month of oral argument (cases argued later in the term are more likely to be decided near the end of the term) and Copyright © 2015 Lee Epstein, William M. Landes, and Richard A. Posner. † Ethan A.H. Shepley Distinguished University Professor, Washington University in St. Louis. †† Clifton R. Musser Professor Emeritus of Law and Economics and senior lecturer, University of Chicago Law School. ††† Judge of the U.S. Court of Appeals for the Seventh Circuit and senior lecturer at the University of Chicago Law School. Professor Epstein thanks the National Science Foundation and the John Simon Guggenheim Foundation, and Professor Landes and Judge Posner thank the law and economics program at the University of Chicago, for research support. All data used in this article are available at http://epstein.wustl.edu/research/SupCtTiming.html. We are grateful to Todd Collins, Christopher Cooper, Ryan Black, Maron W. Sorenson, and Tim Johnson for providing some of the data we used in this paper; and to Mitu Gulati, Adam Liptak, and Andrew Puzder for insights on which we’ve drawn.
Transcript of Otjiherero First Language - NIED
PEL IN PRINTER FINAL (DO NOT DELETE) 3/6/2015 3:19 PM
Duke Law Journal VOLUME 64 MARCH 2015 NUMBER 6
THE BEST FOR LAST: THE TIMING OF U.S. SUPREME
COURT DECISIONS
LEE EPSTEIN† WILLIAM M. LANDES†† RICHARD A. POSNER†††
ABSTRACT
This Article investigates the hypothesis that the most important and, often, controversial and divisive cases—so called “big” cases—are disproportionately decided at the end of June. We define a “big case” in one of four ways: front-page coverage in the New York Times; front-page and other coverage in four national newspapers (the New York Times, Los Angeles Times, Washington Post, and Chicago Tribune); the number of amicus curiae briefs filed in a case; and the number of subsequent citations by the Supreme Court to its decision in a case. We find a statistically significant association between each measure of a big case and end-of-term decisions even after controlling for the month of oral argument (cases argued later in the term are more likely to be decided near the end of the term) and
Copyright © 2015 Lee Epstein, William M. Landes, and Richard A. Posner. † Ethan A.H. Shepley Distinguished University Professor, Washington University in St. Louis. †† Clifton R. Musser Professor Emeritus of Law and Economics and senior lecturer, University of Chicago Law School. ††† Judge of the U.S. Court of Appeals for the Seventh Circuit and senior lecturer at the University of Chicago Law School. Professor Epstein thanks the National Science Foundation and the John Simon Guggenheim Foundation, and Professor Landes and Judge Posner thank the law and economics program at the University of Chicago, for research support. All data used in this article are available at http://epstein.wustl.edu/research/SupCtTiming.html. We are grateful to Todd Collins, Christopher Cooper, Ryan Black, Maron W. Sorenson, and Tim Johnson for providing some of the data we used in this paper; and to Mitu Gulati, Adam Liptak, and Andrew Puzder for insights on which we’ve drawn.

PEL IN PRINTER FINAL (DO NOT DELETE) 3/6/2015 3:19 PM
992 DUKE LAW JOURNAL [Vol. 64:991
case attributes (e.g., dissents and concurrences) that increase the time it takes to decide a case. We also speculate on why big cases cluster at the end of the term. One possibility is legacy and reputational concerns: when writing what they think will be a major decision, the Justices and their law clerks take more time polishing until the last minute with the hope of promoting their reputations. Another is that the end-of-term clustering of the most important cases may tend to diffuse media coverage of and other commentary regarding any particular case, and thus spare the Justices unwanted criticism just before they leave Washington for their summer recess.
TABLE OF CONTENTS
Introduction ............................................................................................. 992 I. Some Preliminaries ............................................................................. 996
A. Defining a Big Case .............................................................. 997 B. A First Look at Whether Big Cases Cluster at the End
of the Term .......................................................................... 1001 II. Evaluation of the Three Hypotheses ............................................ 1002
A. Work-Time Factors and End-of-Term Clustering .......... 1003 1. Regression Models ........................................................... 1003 2. Results ............................................................................... 1008
B. So Why Do Big Cases Cluster at the End of the Term? . 1010 1. Gross and Net (or Pure) Big-Case Effects .................... 1011 2. Results ............................................................................... 1014 3. Additional Empirical Analysis. ...................................... 1015
Conclusion .............................................................................................. 1021
INTRODUCTION
High court judges manipulate the timing of their decisions. In Brazil, for example, judges have been known to delay hearing the case or announcing or publishing the decision until there is a more favorable political climate (or court).1 Strategic timing of judicial
1. See, e.g., Diego Werneck Arguelhes & Ivar A. Hartmann, Timing Control Without Docket Control: How Individual Justices Shape the Brazilian Supreme Court’s Agenda (May 28, 2014) (unpublished paper presented at the Conference on Empirical Studies on Constitutional Courts, FGV Direito Rio, Rio de Janeiro, Brazil) (on file with the Duke Law Journal). Werneck and Hartmann describe a procedure in which an individual Justice can request to “take a look” at a case (pedido de vista). Id. at *5. According to the data Werneck and Hartmann collected, use of the pedido de vista procedure has delayed decisions “for years, even decades.” Id. at *4.

PEL IN PRINTER FINAL (DO NOT DELETE) 3/6/2015 3:19 PM
2015] THE BEST FOR LAST 993
decisions also seems to occur in the U.S. state courts.2 In contrast, the Justices of the U.S. Supreme Court, once they accept a case for review,3 rarely if ever delay decision in this way.4 The Court usually issues its decision within three months of oral argument;5 only the very rare case bounces around the chambers for more than six months, and almost every decision is issued in the same term in which the case is argued.6
Still, commentators have long speculated that the most important and, often, controversial and divisive cases—the “big” or “blockbuster” cases (we’ll use “big cases” for brevity)—are issued in June (the last month before the Court’s summer recess) and mostly in the last week or two of June7—the so-called “end-of-term crunch.”8
2. An example is the Supreme Court of Connecticut, which delayed an opinion in connection with the 2006 nomination of Associate Justice Peter Zarella for chief justice:
Upon the announcement of Chief Justice Sullivan’s impending retirement, Governor M. Jodi Rell nominated Associate Justice Peter Zarella to be elevated to chief justice. However, unbeknownst to the governor and just before her announcement, the chief justice had already begun to play politics with the Zarella nomination. In early March 2006, the chief justice had ordered the reporter of judicial decisions to delay the printing of a controversial decision regarding freedom of information and the judicial branch. Thus, in his attempt to aid and elevate his friend Justice Zarella, Chief Justice Sullivan obstructed the course of the nomination process by depriving the Connecticut General Assembly’s Judiciary Committee of knowledge of Justice Zarella’s concurrence in the opinion.
J. Michael Green, Constitutional Crisis Averted in Connecticut, 29 JUST. SYS. J. 114, 114–15 (2008) (citations omitted). 3. There are many examples, though there is little systematic evidence, that the Justices use their discretionary power over which cases they will hear to set their plenary agenda to avoid certain issues. See, e.g., DORIS MARIE PROVINE, CASE SELECTION IN THE UNITED
STATES SUPREME COURT (1980). 4. The Court can avoid reaching a decision on the merits even after it has agreed to decide the case, for example, by finding that the Court lacks jurisdiction (if there’s no jurisdiction, the case is nonjusticiable), though it usually explains its decision. See, e.g., Hollingsworth v. Perry, 133 S. Ct. 2652, 2659 (2013); Lujan v. Defenders of Wildlife, 504 U.S. 555, 578 (1992); DeFunis v. Odegaard, 416 U.S. 312, 319–20 (1974). 5. Our sample includes 7219 cases decided between the 1946 and 2012 terms. We exclude all reargued cases and those argued or decided in special sessions (usually in July, August, or September), as well as Dixon v. Duffy, 344 U.S. 143 (1952), which was continued twice. This eliminates 181 cases. The mean time from oral argument to decision in the 7219 sample is 83.6 days (the median is 75), with a standard deviation of 46.2. 6. This holds for 99 percent of the cases. Only reargued cases are held over. Of the 7400 cases decided between the 1946 and 2012 terms, 171 were reargued but only 34 in the same term. 7. The Supreme Court’s term begins on the first Monday in October. The Court begins its summer recess in June or early July. Of the 67 terms in our dataset (1946–2012), only 12 ended in July (OT 1995 was the last to do so).
PEL IN PRINTER FINAL (DO NOT DELETE) 3/6/2015 3:19 PM
994 DUKE LAW JOURNAL [Vol. 64:991
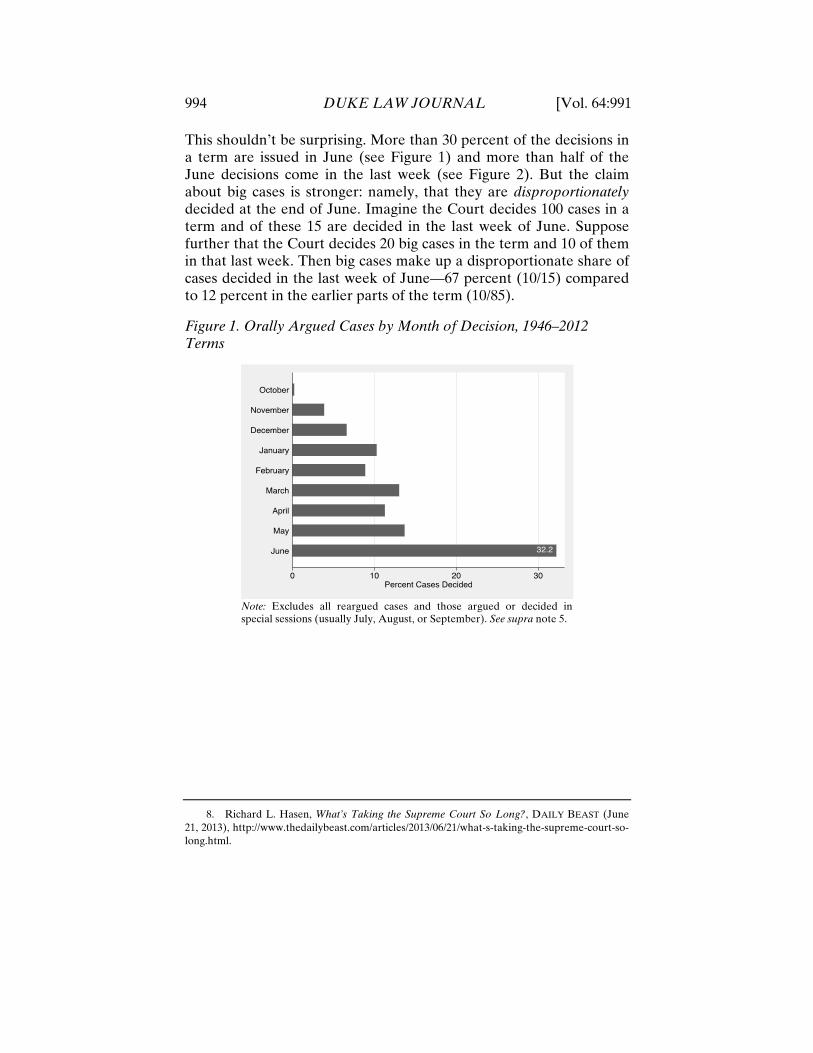
This shouldn’t be surprising. More than 30 percent of the decisions in a term are issued in June (see Figure 1) and more than half of the June decisions come in the last week (see Figure 2). But the claim about big cases is stronger: namely, that they are disproportionately decided at the end of June. Imagine the Court decides 100 cases in a term and of these 15 are decided in the last week of June. Suppose further that the Court decides 20 big cases in the term and 10 of them in that last week. Then big cases make up a disproportionate share of cases decided in the last week of June—67 percent (10/15) compared to 12 percent in the earlier parts of the term (10/85).
Figure 1. Orally Argued Cases by Month of Decision, 1946–2012 Terms
Note: Excludes all reargued cases and those argued or decided in special sessions (usually July, August, or September). See supra note 5.
8. Richard L. Hasen, What’s Taking the Supreme Court So Long?, DAILY BEAST (June 21, 2013), http://www.thedailybeast.com/articles/2013/06/21/what-s-taking-the-supreme-court-so-long.html.

PEL IN PRINTER FINAL (DO NOT DELETE) 3/6/2015 3:19 PM
2015] THE BEST FOR LAST 995
Figure 2. Cases Decided in the Last Four Weeks of the Term, 1946–2012 Terms
Note: Our sample consists of 2210 cases decided in June and 115 in July. Cases decided in July are included in the “Last Week” category.
This Article investigates the phenomenon just described. We
begin in Part I by identifying four approaches to determining a “big case”: front-page coverage in the New York Times; front-page and other coverage in four national newspapers (the New York Times, Los Angeles Times, Washington Post, and Chicago Tribune); the number of amicus curiae briefs filed in a case; and the number of subsequent citations by the Supreme Court to its decision in a case. Also in Part I we ask whether a disproportionate number of big cases fall at the end of the term. The answer is yes: We find a statistically significant association between each measure of a big case and end-of-term decisions.
Part II of this Article considers three hypotheses for why big cases cluster in the last week of the term:
1. Suppose a case argued close to the end of the term is more likely to be decided near the end of the term than a case argued early in the term (what we call the “compression effect”). If big cases were disproportionately argued later in the term, this would make an end-of-term decision more likely.
2. Big cases have attributes such as more dissents and concurrences that tend to increase the time it takes the Court to decide a case, and thereby increase the probability that a
PEL IN PRINTER FINAL (DO NOT DELETE) 3/6/2015 3:19 PM
996 DUKE LAW JOURNAL [Vol. 64:991
case will be decided near the end of the term (holding constant the month of oral argument, as hypothesis 1 suggests).
3. The Court follows, or acts as if it follows, a policy of issuing the big decisions at the end of the term quite apart from the month of oral argument or the presence of attributes that increase the time it takes to decide a case.
Our test of hypothesis 1, the “compression effect,” uncovered no significant relation between big cases and the date of oral argument. Part II.A analyzes hypothesis 2 by estimating two sets of regressions: one aimed at understanding the factors that predict the length of time from oral argument to decision and the other aimed at understanding the factors that predict whether a case is big or not. From that analysis we learn that big cases possess many of the same attributes that lengthen decision time. For example, they are often more controversial and divisive than the average case and therefore require more time to decide.9 Cases that take more time to decide will tend to cluster at the end of the term.
Part II.B considers whether the Court is more likely to decide big cases at the end of the term even after we hold constant variables such as the month of oral argument (critical to the compression effect), the term of the decision, and work-related and other attributes that lengthen the time it takes to decide a case. The regression analysis shows that there is still a significant “pure” or “net” big-case effect separate from the compression effect, the term of the Court, and work-related and other attributes. In other words, we are left with the finding that the Court does, in fact, save the best for last—or at least acts as if it does.
We conclude with some speculation, based on reputational, public-relations, and social concerns, about why the Justices appear to follow a policy of issuing a disproportionate number of big-case decisions late in the term.
I. SOME PRELIMINARIES
Without concrete measures of what is a “big case,” we can’t systematically test claims about the Court issuing its important decisions at the end of the term. We explain the measures we use and
9. On the basis of anecdotal evidence, Hasen reaches a similar conclusion. Id.
PEL IN PRINTER FINAL (DO NOT DELETE) 3/6/2015 3:19 PM
2015] THE BEST FOR LAST 997
then show that there is an association between big cases (regardless of the measure we use) and end-of-term decisions.
A. Defining a Big Case
Although it’s widely believed that decisions in the big cases are disproportionately issued at the term’s end, to our knowledge no one has subjected the proposition to empirical testing. This may be because of the difficulty in defining a big case other than by “I know it when I see it.” We take a more systematic approach by using four measures of whether a case is “big”:
(1) New York Times: whether the Times carried a front-page story about the case on the day after the Court decided it.10 About 14 percent (1016 cases) of the 7219 cases in our database received front-page coverage.
(2) Case Salience Index: whether the Times, Washington Post, Los Angeles Times, or Chicago Tribune carried a story about the case. A case that received front-page coverage is scored as a 2; if it received coverage elsewhere in the paper, 1. The index ranges from 0 to 8 (8 being coverage on the first page of all four papers).11
(3) Total Amicus Briefs: total number of amicus curiae briefs filed in the case. At least one amicus brief was filed in 62 percent of the cases in our sample (4460 out of 7219 cases); a single amicus brief in 17 percent (1245 cases); two to five amicus briefs in 28 percent (2053 cases); and more than five in 16 percent (1162 cases). One hundred forty-three amicus briefs were filed in one case, but that’s rare; in fewer than 2 percent of the cases were 20 or more briefs filed (131 cases).
(4) Citations: number of Supreme Court citations between 1946 and 2001 to cases in our dataset.12 Obviously the older the case, the greater the number of citations it is capable of
10. Lee Epstein & Jeffrey A. Segal, Measuring Issue Salience, 44 AM. J. POL. SCI. 66, 72 (2000). 11. The Case Salience Index was invented by Todd A. Collins and Christopher A. Cooper, Case Salience and Media Coverage of Supreme Court Decisions: Toward a New Measure, 65 POL. RES. Q. 396 (2012). We thank the authors for their data, which span the 1953–2004 terms. 12. The dataset, available at http://jhfowler.ucsd.edu/judicial.htm, was developed and used by James H. Fowler and Sangick Jeon in The Authority of Supreme Court Precedent, 30 SOC. NETWORKS 16 (2008).

PEL IN PRINTER FINAL (DO NOT DELETE) 3/6/2015 3:19 PM
998 DUKE LAW JOURNAL [Vol. 64:991
receiving.13 Because we’re comparing the number of citations to cases decided at the end of June with the number decided earlier in the term, the fact that older cases tend to have more citations shouldn’t bias our results too much. (Cases decided early in the term are, at most, only nine months older than those decided in June.) Still, when we use citations as a proxy for big cases we include dummy variables for each term in order to hold constant the effect of the age of a case on citations.
Table 1. Summary Information on the Four Measures of Big Cases14
Measure Coding No. of Cases (Terms Covered)
Mean (Std. Dev.)
Range
(1) New York Times
1 (on front page); 0 (not on front page)
7219 (1946-2012)
0.141 (0.348)
0-1
(2) Case Salience Index (CSI)
0 (no coverage in any of four newspapers) to 8 (front-page coverage in all of four newspapers)
5896 (1953-2004)
2.761 (2.160)
0-8
(3) Total Amicus Briefs
Number of briefs 7219 (1946-2012)
3.033 (6.162)
0-143
(4) Citations Number of Supreme Court citations to Supreme Court cases
6304 (1946-2001)
11.467 (16.064)
0-266
Note: The N of 6304 in row 4 (Citations) is the number of cases that cite the cases in our dataset.
Political scientists often use the first two measures15—as we have
in our work16—but there are two difficulties.17 The first is that newspaper coverage (particularly front-page coverage, which is the New York Times measure and part of the Case Salience Index) of a Supreme Court decision is negatively affected by competition from other events that occur at the same time, including another Supreme Court decision (or decisions) issued the same day. As a result even a big case may sometimes not receive much or even any newspaper coverage. The second difficulty is that newspaper coverage, being 13. A simple regression of the number of citations to each case on the logarithm of the term yields a regression coefficient of -0.475 and a t-value of 17.8. 14. For cases included in and excluded from our sample, see supra note 5. 15. The Case Salience Index is more recent, see supra note 11, but the concept underlying it is similar to that of the New York Times measure. 16. LEE EPSTEIN, WILLIAM M. LANDES & RICHARD A. POSNER, THE BEHAVIOR OF FEDERAL JUDGES: A THEORETICAL AND EMPIRICAL STUDY OF RATIONAL CHOICE (2013). 17. Epstein & Segal, supra note 10.

PEL IN PRINTER FINAL (DO NOT DELETE) 3/6/2015 3:19 PM
2015] THE BEST FOR LAST 999
motivated by journalistic concerns, may bear little relation to the legal importance of a case. For example, in 2009, Melendez-Diaz v. Massachusetts18 appeared on the front page of the Times, but Ashcroft v. Iqbal19 did not. Melendez-Diaz is an important case. It held that reports by crime labs are inadmissible unless the analyst who prepared the report testifies at the defendant’s trial20—a ruling that upset ninety years of practice in most states.21 Although less interesting to the average newspaper reader, Iqbal is the more important case because along with the Court’s earlier decision in Bell Atlantic Corp. v. Twombly22 it made it easier for federal district courts to dismiss cases before pretrial discovery. To date courts have cited Iqbal in nearly 69,000 decisions, compared to only 2160 decisions that have cited Melendez-Diaz.23 Yet this deficiency in the two criteria that rely on newspaper coverage need not undermine our analysis; if the Justices delay decisions in order to blunt criticism they should be more apt to do so in cases, like Melendez-Diaz, that are likely to generate substantial media attention.
Our third measure, Total Amicus Briefs, stands for the importance of the case to persons who either consider it very interesting or significant or are most likely to be affected by the Court’s decision. Unlike our other criteria, amicus briefs are not only an indicator of the importance of a case but also a factor that may increase the time between oral argument and decision and so cause a case to be decided later in the term independently of the importance of the case.24 Although the Justices probably read few of the amicus
18. Melendez-Diaz v. Massachusetts, 557 U.S. 305 (2009). 19. Ashcroft v. Iqbal, 556 U.S. 662 (2009). 20. Or, if the analyst is unavailable, the defense must have had a “prior opportunity for cross-examination.” Melendez-Diaz, 557 U.S. at 309. 21. See id. at 349 (Kennedy, J., dissenting). 22. Bell Atl. Corp. v. Twombly, 550 U.S. 544 (2007). 23. Figures are from Shepard’s, accessed through LEXIS Advance on September 22, 2013. 24. See Anthony J. Franze & R. Reeves Anderson, The Supreme Court’s Reliance on Amicus Curiae in the 2012-13 Term, NAT’L L.J. (Sept. 18, 2013), available at http://www.arnoldporter.com/resources/documents/NLJ_The%20Supreme%20Court’s%20Reliance%20on%20Amicus%20Curiae%20in%20the%202012-13%20Term_Franze%20and%20Anderson.pdf. They ask why the Court hasn’t “discouraged amicus filings” if “more briefs equal more work.” Id. at *1. The answer, they propose, is that the Justices “find the briefs useful.” Id. This conclusion may be self-serving (the authors are lawyers at Arnold & Porter, which represents amici in the Supreme Court), but scholarly studies confirm it. See, e.g., Paul M. Collins, Jr., FRIENDS OF THE
SUPREME COURT (2008); Joseph D. Kearney & Thomas W. Merrill, The Influence of Amicus Curiae Briefs on the Supreme Court, 148 U. PA. L. REV. 743 (2000). In addition to providing empirical evidence of the influence of amicus briefs, Kearney and Merrill note that “the most

PEL IN PRINTER FINAL (DO NOT DELETE) 3/6/2015 3:19 PM
1000 DUKE LAW JOURNAL [Vol. 64:991
briefs filed, their law clerks at least skim them in order to “separate the wheat from the chaff” for their bosses.25 The fact that most Justices cite to amicus briefs in a third or more of their opinions suggests that someone is reading them (though probably only a law clerk—yet law clerks write most judicial opinions, in the Supreme Court as in most other American courts). And the more there are, the more there is to read,26 although this doesn’t mean that more is read. Conceivably if more amicus briefs are filed in cases decided late in the term, this could be a sign that these were big cases or could just mean that cases in which a large number of briefs are filed take more time to decide.
The fourth measure of case importance that we use is citations in Supreme Court opinions to earlier Supreme Court decisions. Citations are a widely used measure of importance and influence and have the virtue of relying on the Court to tell us ex post what it considers to have been an important or unimportant decision.27 Of course it’s always possible that the Justices who believed a case to be big at the time they decided it turned out to be mistaken.28
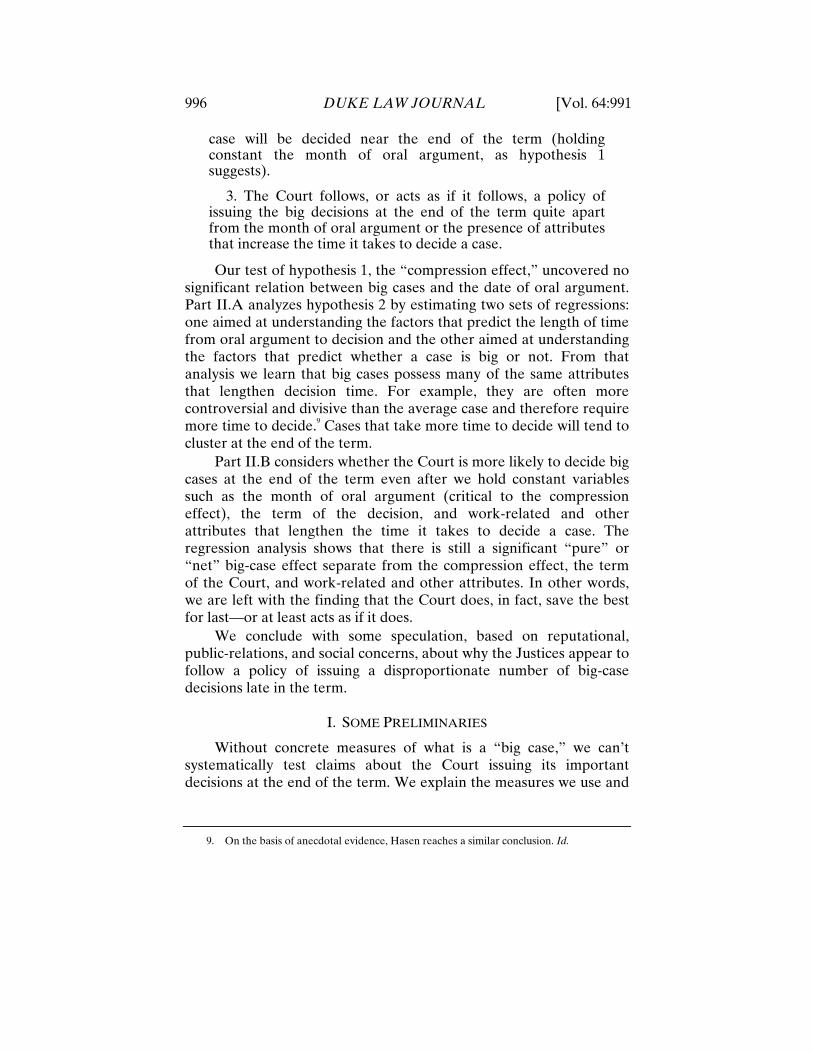
As Table 2 shows, the four measures are positively and significantly correlated. The strongest correlation is between the two media measures, since the New York Times is a factor in both. Overall, the correlations are modest. This justifies our approach of using several measures of a big case rather than just one.
common reaction among lawyers and judges [toward amicus briefs] is moderately supportive. Amicus briefs, it is said, can provide valuable assistance to the Court in its deliberations.” Kearney & Merrill, supra, at 745. This view, they point out, is not universally shared. Id. at 745–46. One of us (Posner) has written, “The vast majority of amicus curiae briefs are filed by allies of the litigants and duplicate the arguments made in the litigants’ briefs, in effect merely extending the length of the litigant’s brief.” Ryan v. Commodity Futures Trading Comm’n, 125 F.3d 1062, 1063 (7th Cir. 1997). 25. See Franze & Anderson, supra note 24, at *1. (citing ANTONIN SCALIA & BRYAN A. GARNER, MAKING YOUR CASE: THE ART OF PERSUADING JUDGES 102–03 (2008)). 26. See, e.g., id.; Ryan J. Owens & Lee Epstein, Amici Curiae During the Rehnquist Years, 89 JUDICATURE 127, 132 (2005). 27. See William M. Landes & Richard A. Posner, Legal Precedent: A Theoretical and Empirical Analysis, 19 J.L. & ECON. 249, 251–52 (1976); William M. Landes, Lawrence Lessig & Michael Solimine, Judicial Influence: A Citation Analysis of Federal Courts of Appeals Judges, 27 J. LEGAL STUD. 271, 271–72 (1998); see also James H. Fowler, Timothy R. Johnson, James F. Spriggs II, Sangick Jeon & Paul J. Wahlbeck, Network Analysis and the Law: Measuring the Legal Importance of Supreme Court Precedents, 15 POL. ANALYSIS 324, 325–26 (2007). 28. Also bear in mind, as noted earlier, that the number of citations is biased downward because the data cover all citations in the 1946 to 2001 period. Thus, the closer the decision date of a case to 2001, the fewer the number of years to accumulate citations.
PEL IN PRINTER FINAL (DO NOT DELETE) 3/6/2015 3:19 PM
2015] THE BEST FOR LAST 1001
Table 2. Correlation Coefficients for the Four Measures of Whether a Case Is Big
CSI Amicus Briefs Citations
New York Times 0.62** 0.23** 0.28** CSI 0.26** 0.30** Amicus Briefs 0.10** Notes: (1) Correlations of Citations with the other measures of big cases are partial correlations that hold constant the term of the decision to take account of the negative relationship between citations and term. (2) **Significant at .01 level.
B. A First Look at Whether Big Cases Cluster at the End of the Term
As Figure 3 shows, all four measures of a big case support the existence of an end-of-term cluster effect. Overall, 24.2 percent of all cases decided in the last week of June make the front page of the New York Times compared to only 15.3 percent for cases decided earlier in June and to 11.3 percent for cases decided in all other months combined. The CSI averages 3.6 for cases decided in the last week in June, 2.8 for earlier in June, and 2.6 for the other months. The average number of amicus curiae briefs per case is 5.2 for cases decided in the last week of June, 3.1 for cases decided earlier in June, and 2.5 for cases decided in other months. The number of citations averages 16.3 per case for cases decided in the last week of June, 11.1 for cases decided in other weeks in June, and 10.4 for cases decided in other months. These differences between the last week and earlier in the term are statistically significant for all four measures.

PEL IN PRINTER FINAL (DO NOT DELETE) 3/6/2015 3:19 PM
1002 DUKE LAW JOURNAL [Vol. 64:991
Figure 3. Big Cases as the Term Progresses, Month-by-Month (with the Last Week of June Separated Out)
Notes: (1) Month is the month the case was decided. We include the small number of cases decided in July (115) in the last week of the term in June. (2) p ≤ .01 for all month comparisons (and the first three weeks of June) with the last week of June. (3) We exclude 18 cases decided in October; 171 reargued cases; 9 cases argued or decided in special sessions (usually over the summer); and one case that was continued twice. See supra note 5.
II. EVALUATION OF THE THREE HYPOTHESES
Figure 3 provides evidence that the Court does stack a disproportionate number of decisions in big cases in the last week of the term. We explore three explanatory hypotheses. Hypothesis 1, the compression effect, is that because the Court almost always decides
PEL IN PRINTER FINAL (DO NOT DELETE) 3/6/2015 3:19 PM
2015] THE BEST FOR LAST 1003
cases in the same term they were argued,29 the later the date of oral argument the more likely the case will be decided near the end of the term. So if more big than small cases happen to be argued late in the term, they would be expected to be decided later. The data, however, does not support this hypothesis. We find no significant relation between any of our four measures and the date of oral argument.30
A. Work-Time Factors and End-of-Term Clustering
Hypothesis 2 states that big cases possess attributes that lengthen the time to decision. They may be more contentious, more divisive, and therefore generate a higher fraction of dissenting and concurring opinions, and are very unlikely to be decided in short per curiam opinions. The more opinions in a case, the longer the case should take to decide. Justices writing separately—that is, dissenting or concurring—may not begin to write until the majority opinion is circulated, or if they do begin earlier, they will often have to revise when they see that opinion. The Justice assigned the majority opinion may feel that he has to revise it in light of the separate opinions, and his revisions may engender a new round of revisions by the authors of those other opinions. It wouldn’t be at all surprising, therefore, that multi-opinion decisions would cluster at the end of the term—not because they are big but because they have attributes that elongate the work time required for completion and issuance. We use regression analysis to explore this hypothesis.
1. Regression Models. To test the effect of work-time factors on end-of-term clustering, we estimate the following two regression models from data on orally argued cases in the 1946 to 2012 terms.
(1) Days-to-Decide = f(Month, Work-Related Attributes, Other
Case Attributes, Term) + u (2) Big Case = g(Case Attributes, Term) + w
29. This holds for about 99 percent of the cases argued in the 1946–2012 terms. See supra note 6. 30. We estimated regressions in which the dependent variable is one of the four big measures and the independent variable is the difference in days between the end-of-term date and the oral-argument date (the smaller the difference, the closer oral argument is to the end of the term). In three regressions (New York Times, Citations, and Amicus), the coefficient on the independent variable is insignificant. In one (the CSI) it is significant but indicates that the earlier (not later) the case is argued, the greater the value of the CSI.
PEL IN PRINTER FINAL (DO NOT DELETE) 3/6/2015 3:19 PM
1004 DUKE LAW JOURNAL [Vol. 64:991
In equation (1), the dependent variable Days-to-Decide is the difference in number of days from the date of oral argument to the date of decision. The independent variables are as follows; u denotes the residual.
a. Seven dummy variables (denoted by Month) for the month of oral argument (starting in October and ending in April where May/June is the omitted variable31). These variables test the compression effect. We expect the coefficients on the monthly dummies to be positive (since May and June have the shortest time between argument and decision), declining the closer the month is to the end of the term.
b. Work-Related Variables, such as the number of opinions in a case, are expected to affect the time to decision. The variables we use are the fraction of dissents (Dissent) and concurrences (Concur); the number of issues (Issues) in the case (79 percent of our sample involve one issue, 17 percent involve two issues, and only 4 percent involve three or more issues); the number of Justices (Justices) voting (9 Justices vote in 78 percent of the cases, 8 in 18 percent, and between 5 and 7 in fewer than 5 percent); and a Per Curiam variable (about 7 percent of our sample are per curiam decisions), which is likely to reduce the time to decision because cases decided per curiam tend to be less contentious, and more often unanimous, than cases decided in a signed opinion.32 Thus we expect positive coefficients on all the work-related variables but a negative coefficient on the Per Curiam variable.
c. Other Attributes include characteristics of cases that may lengthen decision time, but we lack a strong conviction that they do. Consider the number of amicus briefs (the Amicus variable). One could argue that the greater the number, the more time the Justices and their clerks will spend reading them and therefore the more time it will take to decide the case. But one could equally argue that amicus briefs may supply information or arguments that reduce the amount of research and analysis that law clerks need to do. We also include in Other Attributes dummy variables for whether the decision holds a statute unconstitutional (Unconstitutional) or formally alters,
31. We combine May and June into a “single” month because only 79 (about 1 percent) of the cases in our sample are argued during these two months. 32. In our dataset, the Court decided 59.2 percent of the per curiam decisions by a unanimous vote compared with 36 percent of the cases resulting in a signed opinion. The difference is statistically significant.

PEL IN PRINTER FINAL (DO NOT DELETE) 3/6/2015 3:19 PM
2015] THE BEST FOR LAST 1005
by overruling or limiting, a precedent (Precedent Alteration).33 Other Attributes also include Civil Liberties and Economic Activity dummy variables (where the omitted variable is all other issues) to account for the possibility that these areas may present more (or less) difficult questions and take more (or less) time to decide.34
All these variables may indicate a more complex case, implying positive coefficients in equation (1).
d. Last we include dummy variables for each term (Term). This allows us to hold constant term-specific effects that may elude the other variables in the regression.
In equation (2) the dependent variable is a dummy variable of one of three measures of a big case: New York Times, CSI, and Citations. We do not estimate equation (2) for the number of amicus briefs because they are filed before the case is decided and so can’t be influenced by the outcome variables in equation (2).
A key feature of equation (2) is that it contains many of the same independent variables as are in (1) because many of the work-related and other attributes tested in equation (1) are also proxies for the more important and divisive cases, which are the cases likely to receive media coverage and many citations. Equation (2) also includes the Civil Liberties and Economic Activity variables in order to test whether newspapers are more likely to cover civil liberties than other areas of law, and a dummy variable for the ideological direction of the decision (the Conservative variable, 0 for a liberal and 1 for a conservative decision). Liberal newspapers may find a liberal decision more newsworthy, or at least more pleasing to their readers, than a conservative one; a further reason may be to avoid calling attention to conservative decisions.35
Table 3 defines and presents summary statistics of the variables used in the regression analysis, and Table 4 presents the regression
33. Unconstitutional and Precedent account for 6.6 percent and 1.9 percent of the cases respectively. 34. Civil Liberties accounts for 51.5 percent of all cases, Economic Activity (including labor and tax cases) for 29.5 percent, and all other issues (which include judicial power, federalism, interstate relations, and a few other small categories) for about 19 percent. 35. Matthew Gentzkow & Jesse M. Shapiro, What Drives Media Slant? Evidence from U.S. Daily Newspapers, 78 ECONOMETRICA 35 (2010), show that the political slant of newspapers depends on the views of their readers. An extension of this argument is that newspapers are more likely to cover Supreme Court decisions that conform to their readers’ ideological preferences. Another possibility, however, is that liberal and conservative papers cover the same cases but slant coverage to conform to their readers’ preferences.

PEL IN PRINTER FINAL (DO NOT DELETE) 3/6/2015 3:19 PM
1006 DUKE LAW JOURNAL [Vol. 64:991
results. (To simplify the table we omit the individual regression coefficients for the monthly and term dummy variables.36)
Table 3. Variable Definitions in Analysis of Important Cases
Variable Definition No. Observations
(Terms)
Mean (Std.
Deviation)
Range
Dependent Variables Time To Decide Number of days from oral
argument to decision date 7219
(1946-2012) 83.57
(46.20) 0-269
NYT 1=front-page coverage in New York Times & 0=otherwise
7219 (1946-2012)
0.14 (0.35)
0-1
CSI Index of coverage in four major newspapers
5896 (1953-2004)
2.76 (2.16)
0-8
Cites Number of citations in Supreme Court cases
6304 (1946-2001)
11.47 (16.06)
0-266
Independent Variables Month Dummy variables for month of
oral argument 7219
(1946-2012) -- 0-1
Work-Related Dissent Fraction of Justices dissenting 7219
(1946-2012) 0.19
(0.17) 0-0.44
Concur Fraction of Justices concurring 7219 (1946-2012)
0.09 (0.14)
0-0.89
Per Curiam 1=per curiam decision & 0=otherwise
7219 (1946-2012)
0.07 (0.26)
0-1
Two Issues Dummy variable=1 if 2 issues & 0=otherwise
7219 (1946-2012)
0.17 (0.38)
0-1
Three Issues Dummy variable=1 if 3 or more issues & 0=otherwise
7219 (1946-2012)
0.04 (0.19)
0-1
Nine Justice Vote Dummy variable=1 if 9 Justices vote & 0=otherwise
7219 (1946-2012)
0.78 (0.42)
0-1
Other Attributes Total Amicus Number of amicus briefs filed 7219
(1946-2012) 3.03
(6.16) 0-143
Civil Liberties 1=civil liberties & 0=otherwise 7219 (1946-2012)
0.51 (0.50)
0-1
Economic Activity 1=economic activity & 0=otherwise
7219 (1946-2012)
0.29 (0.46)
0-1
Unconstitutional 1= unconstitutional & 0=otherwise
7219 (1946-2012)
0.07 (0.25)
0-1
Precedent Alteration
1=formal alteration of precedent & 0=otherwise
7218 (1946-2012)
0.02 (0.14)
0-1
Ideology 1=conservative decision and 0=liberal decision
7143 (1946-2012)
0.49 (0.50)
0-1
Term Dummies Dummy variables for each term 7219 (1946-2012)
-- 0-1
36. The full regressions are available from the authors.
PEL IN PRINTER FINAL (DO NOT DELETE) 3/6/2015 3:19 PM
2015] THE BEST FOR LAST 1007
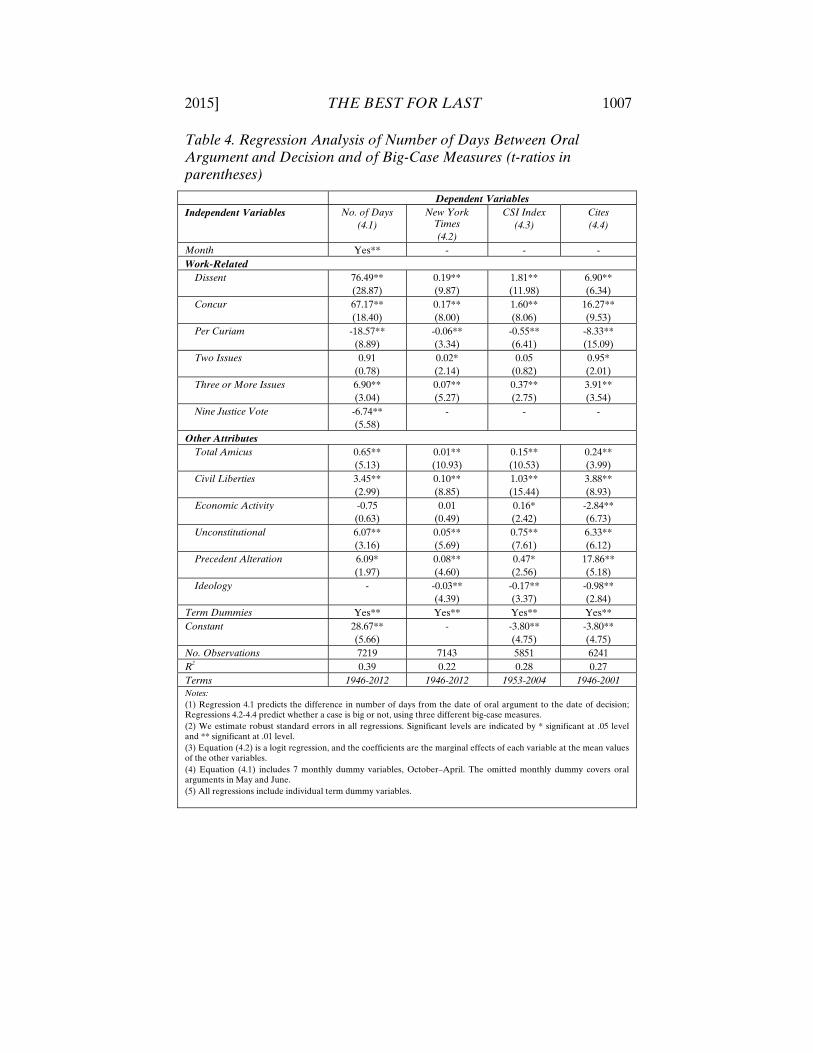
Table 4. Regression Analysis of Number of Days Between Oral Argument and Decision and of Big-Case Measures (t-ratios in parentheses)
Dependent Variables Independent Variables No. of Days
(4.1) New York
Times (4.2)
CSI Index (4.3)
Cites (4.4)
Month Yes** - - - Work-Related
Dissent 76.49** (28.87)
0.19** (9.87)
1.81** (11.98)
6.90** (6.34)
Concur 67.17** (18.40)
0.17** (8.00)
1.60** (8.06)
16.27** (9.53)
Per Curiam -18.57** (8.89)
-0.06** (3.34)
-0.55** (6.41)
-8.33** (15.09)
Two Issues 0.91 (0.78)
0.02* (2.14)
0.05 (0.82)
0.95* (2.01)
Three or More Issues 6.90** (3.04)
0.07** (5.27)
0.37** (2.75)
3.91** (3.54)
Nine Justice Vote -6.74** (5.58)
- - -
Other Attributes Total Amicus 0.65**
(5.13) 0.01** (10.93)
0.15** (10.53)
0.24** (3.99)
Civil Liberties 3.45** (2.99)
0.10** (8.85)
1.03** (15.44)
3.88** (8.93)
Economic Activity -0.75 (0.63)
0.01 (0.49)
0.16* (2.42)
-2.84** (6.73)
Unconstitutional 6.07** (3.16)
0.05** (5.69)
0.75** (7.61)
6.33** (6.12)
Precedent Alteration 6.09* (1.97)
0.08** (4.60)
0.47* (2.56)
17.86** (5.18)
Ideology - -0.03** (4.39)
-0.17** (3.37)
-0.98** (2.84)
Term Dummies Yes** Yes** Yes** Yes** Constant 28.67**
(5.66) - -3.80**
(4.75) -3.80** (4.75)
No. Observations 7219 7143 5851 6241 R2 0.39 0.22 0.28 0.27 Terms 1946-2012 1946-2012 1953-2004 1946-2001 Notes: (1) Regression 4.1 predicts the difference in number of days from the date of oral argument to the date of decision; Regressions 4.2-4.4 predict whether a case is big or not, using three different big-case measures. (2) We estimate robust standard errors in all regressions. Significant levels are indicated by * significant at .05 level and ** significant at .01 level. (3) Equation (4.2) is a logit regression, and the coefficients are the marginal effects of each variable at the mean values of the other variables. (4) Equation (4.1) includes 7 monthly dummy variables, October–April. The omitted monthly dummy covers oral arguments in May and June. (5) All regressions include individual term dummy variables.
PEL IN PRINTER FINAL (DO NOT DELETE) 3/6/2015 3:19 PM
1008 DUKE LAW JOURNAL [Vol. 64:991
2. Results. As expected, the individual dummy month variables in 4.1 are positive and statistically significant (compared to cases argued in May and June, the omitted variable), and indicate that cases argued later in the term take significantly less time to decide. Starting with November, the values of the monthly dummy variable are smaller the later the month of oral argument (although the difference between November and December is not statistically significant). The one exception is for cases argued in October; the regression coefficient is significantly smaller than for cases argued in November, December, or January. On average it takes 55 days to decide cases argued in April, 94 days for cases argued in January, and 101 days for cases argued in November (holding constant at their mean values the other variables in the regression). In short, we find a significant compression effect.
Most of the work-related variables are significant and in the predicted direction. For example, one dissent increases decision time by 8.5 days (76.49 times 1/9), one concurrence by 7.5 days (67.17 times 1/9), and a per curiam opinion decreases decision time by almost 18.6 days (holding constant the values of the other independent variables). Two exceptions are worth mentioning. We find no significant difference in decision time between a case with one and two issues but a significant increase of 6.9 days for cases with three or more issues (fewer than 5 percent of the decisions in our sample resolve three or more issues, and about 91 percent of those decide no more than four issues). The other exception is that cases in which 9 Justices participate take 6.7 fewer days to decide than cases with fewer than 9 Justices. This is puzzling because one would think that with more Justices voting, more time would be devoted to consultation and coordination among the Justices. A possible explanation for the anomaly is that the author of the assigned majority opinion (assigned in the hope that he can get 5 votes) has to work harder for 5 votes if there are 8 than if there are 9 Justices, and he can afford therefore to lose 4. With 8 Justices (which account for about 80 percent of the cases with fewer than 9 Justices), he can afford to lose only 3, so there may be more negotiating, increasing the time to decision.37
37. The difficulty with this explanation is that we also find that it takes more rather than less time to decide a case with 7 justices than a case with 8 Justices (only 304 cases have 7 compared to 1279 with 8 Justices). If the critical factor is whether there is an even or odd number of Justices, we should have observed that cases with 7 Justices took less time to decide than ones with 8 Justices.

PEL IN PRINTER FINAL (DO NOT DELETE) 3/6/2015 3:19 PM
2015] THE BEST FOR LAST 1009
Among the non-work-related variables we find that the number of amicus briefs, civil liberties cases, cases that find a statute unconstitutional, and cases that formally alter a precedent are associated with significant increases in decision time. This suggests that these variables signify more complex and important cases that lengthen decision time independent of the work-related variables that are included in the regression. The regression results indicate that 10 amicus briefs increase decision time by about 6.5 days compared to a case with zero amicus briefs, civil liberties cases add about 3.5 days to decision time, and holding a statute unconstitutional or formally altering a precedent increases decision time by 6.1 days.
Here are some examples of the interplay among the variables in regression 4.1. Suppose a single-issue civil liberties case is argued in February, the decision is 5–4 with 2 concurrences, 9 Justices vote, and 10 amicus briefs are filed (holding constant the other variables at their mean values). Equation (4.1) predicts that the case will take nearly 4 months (116 days) to decide compared to 2 months (61 days) for a case argued in the same month and decided with a unanimous signed opinion, no concurring opinions, and no amicus briefs. At the other extreme, it takes only 15 days to decide a civil liberties case argued in April that results in a per curiam decision without a single dissent or concurrence and with no amicus briefs.
Now consider the two media measures of a big case (regressions 4.2 and 4.3).38 The results support the hypothesis that coverage is positively and significantly related to the variables that proxy for the more important and controversial decisions.39 For example, regression 4.2 predicts that a highly important and controversial civil liberties case with 4 dissents, 2 concurrences, and 10 amicus briefs has a 0.55 probability of coverage on the front page of the New York Times compared to a 0.05 probability for a unanimous civil liberties case with no amicus briefs. And if a civil liberties case with the same characteristics also holds a law unconstitutional or formally alters an established precedent, the probability of coverage is 0.69 if unconstitutional and 0.74 if a precedent is altered.
38. Regression 4.2 is a logit regression because the dependent variable is a dummy variable, which takes the value 1 if the decision receives front-page coverage in the New York Times and 0 otherwise. 39. We exclude from the big-case regressions the month dummy variables and number of Justices voting because they should have no bearing on the importance or divisiveness of a case.
PEL IN PRINTER FINAL (DO NOT DELETE) 3/6/2015 3:19 PM
1010 DUKE LAW JOURNAL [Vol. 64:991
At the other extreme, there is only a 0.02 probability of front-page coverage of a per curiam decision with no dissents, concurrences, or amicus briefs. Similarly, the CSI in civil liberties cases is 4.6 for 5–4 decisions with 2 concurrences and 10 amicus briefs, but only 1.5 for a per curiam decision with no dissents, concurrences, or amicus briefs.
Regressions 4.2 and 4.3 show that conservative decisions are less likely to receive media coverage. The coefficients on the Ideology variable imply that the probability of front-page coverage in the New York Times for a conservative decision is 0.03 lower (or about 20 percent lower than the mean coverage value of 0.14) and 0.17 lower in the CSI (or about 6 percent lower than its 2.76 mean).
Our third big-case measure is the number of times a case is cited by the Supreme Court (regression 4.4). We expect and find that the number is positively and significantly related to variables that indicate the importance of a case. Less obviously, case citations in later cases are positively and significantly related to the divisiveness of a decision (not just its importance), as indicated by the regression coefficients on the fraction of dissents and concurrences. A possible explanation (which also explains the positive coefficients on the number-of-issues variables) is that a case with dissents and concurrences, because it thus has a greater number of opinions, provides more opportunities for subsequent citations. We also find that civil liberties cases generate significantly more citations (about 4 more) and economic cases significantly fewer (about 3 less) than cases in the omitted category, which account for about 19 percent of our sample and consist almost entirely of judicial power and federalism cases. And finally a possible explanation for why a liberal decision (the Ideology variable) is cited more often (almost 1 more citation per case) is that our sample contains slightly more liberal than conservative decisions (51 versus 49 percent).40
B. So Why Do Big Cases Cluster at the End of the Term?
The regressions in Table 4 confirm our second hypothesis: big cases have attributes that tend to increase the time taken to decide a
40. The later the date of a Supreme Court decision, the fewer the number of subsequent terms in which the case can garner citations. We adjust for this by including term dummy variables. As expected, the term dummy variables tend to become smaller the closer the decision is to the 2001 term, although many of the differences from year to year are not significant.

PEL IN PRINTER FINAL (DO NOT DELETE) 3/6/2015 3:19 PM
2015] THE BEST FOR LAST 1011
case, and so increase the probability that the case will be decided near the end of the term. But the regressions do not eliminate the third hypothesis: that the Justices act as if they postpone decision in a disproportionate number of big cases to the end of the term.
We test this hypothesis by estimating what we call “gross” and “net” (or “pure”) big-case effects. The gross effect estimates the increase in the probability that the Court decides a big case in the last week or last two weeks of the term controlling for the month of oral argument and the term of the case;41 the net effect estimates this increase but also controls for attributes of the case that lengthen (or decrease, in the case of a per curiam decision) the time from oral argument to decision.
1. Gross and Net (or Pure) Big-Case Effects. We estimate gross and net big-case effects for each of our four measures of big cases by means of the following equations.
Gross Big-Case Effect (3) End of Term = f(Big Case, Month & Term Dummies) + u Net or Pure Big-Case Effect (4a) End of Term = f(Big Case, Month & Term Dummies,
Work-Related Attributes) + v (4b) End of Term =f(Big Case, Month & Term Dummies,
Work-Related Attributes, Other Attributes) + w
End of Term is a dummy variable equal to 1 if the Court issues its decision in the last week or last two weeks of the term and 0 otherwise; Big Case is one of our four measures of a big case; Month & Term Dummies are dummy variables for the month of oral argument and the term of the court; Work-Related Attributes are the variables in Table 3 that directly affect the time the Court needs in order to decide a case; and Other Attributes include variables that are not clearly related to work time (like a civil liberties case) but still
41. The compression effect has two features: cases argued near the end of term take less time to decide because the Justices face the end-of-term constraint and are more likely to be decided in the last week or two of the term even though they take less time to decide. It still follows, however, that holding constant the month of oral argument, a case that takes more time to decide is more likely to be decided at the end of the term.
PEL IN PRINTER FINAL (DO NOT DELETE) 3/6/2015 3:19 PM
1012 DUKE LAW JOURNAL [Vol. 64:991
affect time to decision (see regression 4.1 in Table 4).42 We estimate two net big-case equations: 4a includes attributes that directly influence work time while 4b adds other attributes, such as a civil liberties dummy variable, that influence time to decision but are not clearly work-related attributes. From a statistical standpoint, we should find a smaller net big-case effect in 4b than 4a because the other attributes in 4b are positively correlated with our big-case measures and so should weaken the impact of a big case on the likelihood of a late decision.
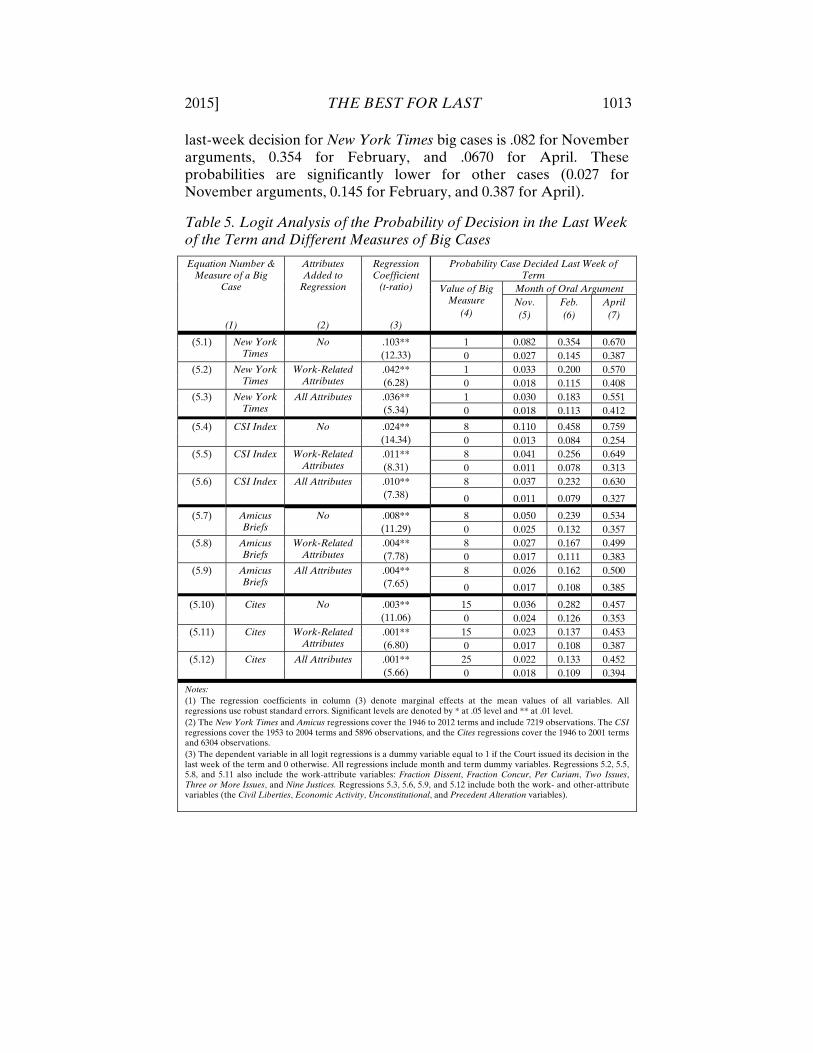
Table 5 presents the regression results. To simplify, we present the regression coefficients (column 3) for only the four big-case measures and not the other independent variables.43 To understand the organization of Table 5, consider the three New York Times regressions. Regression 5.1 indicates that big cases have a higher probability (0.103) of being decided in the last week holding constant the month and term of the decision. When we add the work-related attributes in 5.2, the Times coefficient falls to 0.042, and when we also add the other attributes in 5.3 the coefficient falls farther, to 0.036. All three regression coefficients are highly significant and, as predicted, the gross big-case effect (5.1) is significantly greater than the two net effects (5.2 and 5.2). We also find that the difference between the two net-effect coefficients is not significant, so that we cannot reject the hypothesis that the increase in the probability of a last-week decision is the same for the two net big-case regressions. Although the regression coefficients of 0.103, 0.042, and 0.036 may appear small, they are large relative to the mean probability (0.160) of a last-week decision: the gross big-case effect adds 63 percent (0.103/0.160) and the two net effects between 23 and 26 percent (.036/.160 and .042/.160) to the mean probability. The final three columns of the table show the predicted probabilities of a last-week decision for cases argued in November, February, and April to highlight the interaction between big cases and month of oral argument. For example, the first row of regression 5.1 shows that the probability of a
42. We do not include the Amicus Briefs variable in equation (4b) or the regressions in Table 5 when we use the New York Times, CSI, or Cites as the big-case measure because we would then have two big-case measures (not one) in the regression for estimating the effects of a big case on the probability of an end-of-term decision. Moreover, since the Amicus measure is positively correlated with the other three big-case measures (see Table 2), we would weaken the effect of the other measures on the probability of a last-week decision by including the amicus measure. 43. The complete regressions are available from the authors.
PEL IN PRINTER FINAL (DO NOT DELETE) 3/6/2015 3:19 PM
2015] THE BEST FOR LAST 1013
last-week decision for New York Times big cases is .082 for November arguments, 0.354 for February, and .0670 for April. These probabilities are significantly lower for other cases (0.027 for November arguments, 0.145 for February, and 0.387 for April).
Table 5. Logit Analysis of the Probability of Decision in the Last Week of the Term and Different Measures of Big Cases
Equation Number & Measure of a Big
Case
(1)
Attributes Added to
Regression
(2)
Regression Coefficient
(t-ratio)
(3)
Probability Case Decided Last Week of Term
Value of Big Measure
(4)
Month of Oral Argument Nov. (5)
Feb. (6)
April (7)
(5.1) New York Times
No .103** (12.33)
1 0.082 0.354 0.670 0 0.027 0.145 0.387
(5.2) New York Times
Work-Related Attributes
.042** (6.28)
1 0.033 0.200 0.570 0 0.018 0.115 0.408
(5.3) New York Times
All Attributes .036** (5.34)
1 0.030 0.183 0.551 0 0.018 0.113 0.412
(5.4) CSI Index
No .024** (14.34)
8 0.110 0.458 0.759 0 0.013 0.084 0.254
(5.5) CSI Index Work-Related Attributes
.011** (8.31)
8 0.041 0.256 0.649 0 0.011 0.078 0.313
(5.6) CSI Index
All Attributes .010** (7.38)
8 0.037 0.232 0.630
0 0.011 0.079 0.327
(5.7) Amicus Briefs
No .008** (11.29)
8 0.050 0.239 0.534 0 0.025 0.132 0.357
(5.8) Amicus Briefs
Work-Related Attributes
.004** (7.78)
8 0.027 0.167 0.499 0 0.017 0.111 0.383
(5.9) Amicus Briefs
All Attributes .004** (7.65)
8 0.026 0.162 0.500
0 0.017 0.108 0.385
(5.10) Cites
No .003** (11.06)
15 0.036 0.282 0.457 0 0.024 0.126 0.353
(5.11) Cites Work-Related Attributes
.001** (6.80)
15 0.023 0.137 0.453 0 0.017 0.108 0.387
(5.12) Cites
All Attributes .001** (5.66)
25 0.022 0.133 0.452 0 0.018 0.109 0.394
Notes: (1) The regression coefficients in column (3) denote marginal effects at the mean values of all variables. All regressions use robust standard errors. Significant levels are denoted by * at .05 level and ** at .01 level. (2) The New York Times and Amicus regressions cover the 1946 to 2012 terms and include 7219 observations. The CSI regressions cover the 1953 to 2004 terms and 5896 observations, and the Cites regressions cover the 1946 to 2001 terms and 6304 observations. (3) The dependent variable in all logit regressions is a dummy variable equal to 1 if the Court issued its decision in the last week of the term and 0 otherwise. All regressions include month and term dummy variables. Regressions 5.2, 5.5, 5.8, and 5.11 also include the work-attribute variables: Fraction Dissent, Fraction Concur, Per Curiam, Two Issues, Three or More Issues, and Nine Justices. Regressions 5.3, 5.6, 5.9, and 5.12 include both the work- and other-attribute variables (the Civil Liberties, Economic Activity, Unconstitutional, and Precedent Alteration variables).
PEL IN PRINTER FINAL (DO NOT DELETE) 3/6/2015 3:19 PM
1014 DUKE LAW JOURNAL [Vol. 64:991
2. Results. There is a significant increase in the probability of a last-week decision for the four big-case measures in every regression (column (3)). As expected, the gross big-case effect is always significantly greater than the two net effects; it varies from about twice (the amicus measure) to three times (the citations measure) the net measures. We find no significant difference between the two net big-case effects (one in the regression that includes work-related but not other attributes and the other in the regression that includes both types of variables).
We showed in Table 4 that the compression effect results in cases argued later in the term taking less time on average to decide than cases argued early in the term (for example, 55 days for cases argued in April, 94 days for cases argued in January, and 101 days for cases argued in November). Notwithstanding the decline in decision time, it still turns out that the later in the term a case is argued, the likelier it is to be decided the last week, as seen in columns (5) through (7) for all big-case measures. The likelihood that a case will be decided the last week of June is always significantly greater if it is argued in April than in February, or in February than in November.44 And the impact of the month variable is large. For example, regression 5.1 estimates that the probability of a last-week decision is 0.67 for a case covered on the front page of the New York Times and argued in April but 0.39 if the case does not receive front-page coverage (column (7)). These probabilities decline sharply the earlier the month of oral argument (0.35 and 0.15 for a February case and 0.08 and 0.03 for a November case). We find comparably large differences and sharp declines across months in the two net New York Times big-case regressions (5.2 and 5.3) and, more generally, in all big-case measures.
In the net big-case regressions, the coefficient in column (3) estimates the increase in the probability that a big case will be decided in the last week of the term holding constant the other variables at their mean values. Suppose the case attributes in the regression take different values than their means. For example, assume a 5–4 decision with 2 concurrences, 9 Justices voting, and 2 issues decided. Using the New York Times big measure and regression 5.2 (the net big-case regression that includes work-related attributes), the probability of a last-week decision for a big case argued in April is 0.91 compared to 0.85 for other cases, 0.66 versus 44. More generally, this is true as we move from an earlier to later month, although the differences are not always statistically significant.
PEL IN PRINTER FINAL (DO NOT DELETE) 3/6/2015 3:19 PM
2015] THE BEST FOR LAST 1015
0.51 if the case is argued in February, and 0.22 versus 0.12 if it is argued in November.45 At the other extreme, consider a unanimous per curiam decision with 9 Justices voting on a single issue. Although a New York Times big case still makes a last-week decision more likely, the probabilities are small—0.17 versus 0.09 for a case argued in April, 0.04 versus 0.02 for one argued in February, and 0.005 versus 0.003 for a case argued in November; and the differences for each month are not significant.
Though not shown in Table 5, the Dissent, Concur, and Civil Liberties variables have significant positive effects, and the Per Curiam a significant negative effect (in all but the Citations regression), on the probability that a case will be decided in the last week. Cases having three or more issues are significantly more likely to be decided in the last week in the New York Times and Amicus regressions but not in the other two big-case measures. The number of Justices voting and the Unconstitutional and Economic Activity variables are insignificant in all regressions. Precedent Alteration is significant in the CSI Index and Amicus regressions but not in the Times and Citations regressions. The monthly dummy variables are individually significant in all but a few of the regressions, and the term dummy variables are always jointly significant.
3. Additional Empirical Analysis.
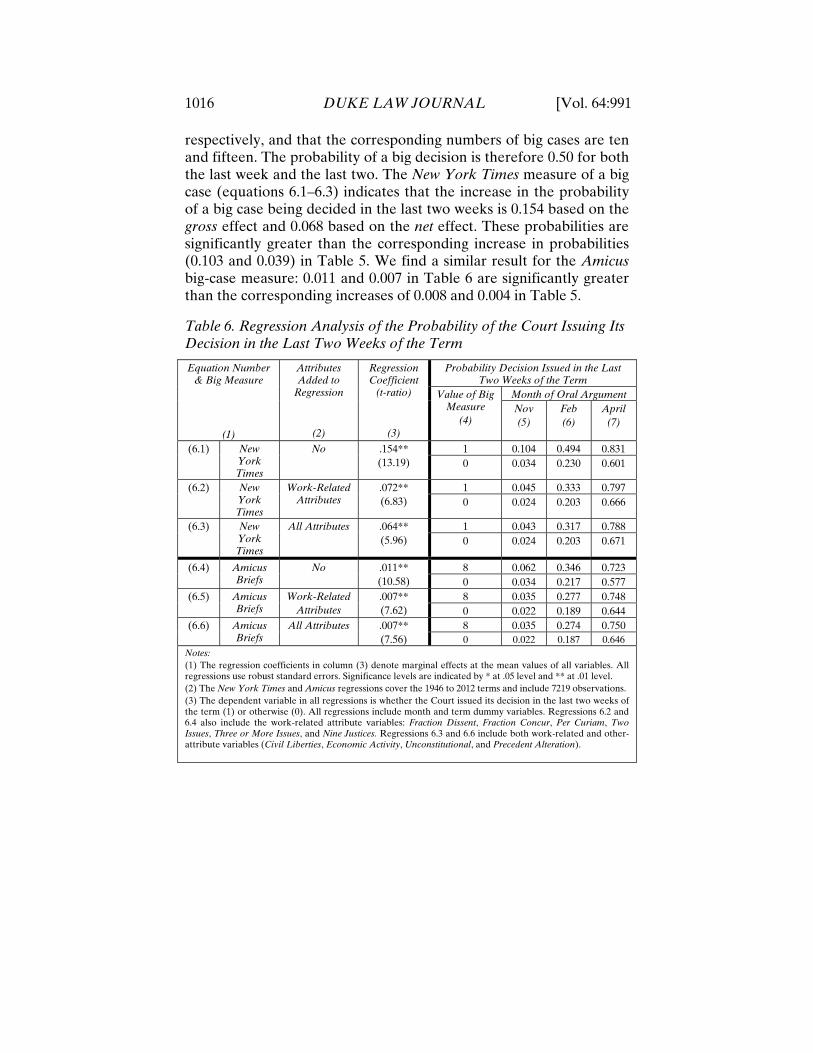
a. The Last Two Weeks of the Term. In Table 6 (which follows the same format as Table 5 but presents results only for the New York Times and Amicus big-case measures46), we substitute the last two weeks of the term for the last week because the last week may be too stringent a test of the hypothesis that big cases disproportionately cluster near the end of the term.
Overall, 23.8 percent of the cases in our database are decided in the last two weeks compared to 16 percent in the last week. But this may not signify that a big case is more likely to be decided in the last two weeks than in the last week. Suppose that a total of twenty and thirty cases are decided in the last week and the last two weeks,
45. Note that the probability differences between a big case and non-big case are statistically significant for each of the three months. 46. The results for the other two big-case measures are similar to those in Table 5—that is, the regression coefficients on the big-cases measures are always positive and significant, the gross coefficient is always greater than the two net coefficients, and the differences between the two net coefficients are never significant.
PEL IN PRINTER FINAL (DO NOT DELETE) 3/6/2015 3:19 PM
1016 DUKE LAW JOURNAL [Vol. 64:991
respectively, and that the corresponding numbers of big cases are ten and fifteen. The probability of a big decision is therefore 0.50 for both the last week and the last two. The New York Times measure of a big case (equations 6.1–6.3) indicates that the increase in the probability of a big case being decided in the last two weeks is 0.154 based on the gross effect and 0.068 based on the net effect. These probabilities are significantly greater than the corresponding increase in probabilities (0.103 and 0.039) in Table 5. We find a similar result for the Amicus big-case measure: 0.011 and 0.007 in Table 6 are significantly greater than the corresponding increases of 0.008 and 0.004 in Table 5.
Table 6. Regression Analysis of the Probability of the Court Issuing Its Decision in the Last Two Weeks of the Term
Equation Number & Big Measure
(1)
Attributes Added to
Regression
(2)
Regression Coefficient
(t-ratio)
(3)
Probability Decision Issued in the Last Two Weeks of the Term
Value of Big Measure
(4)
Month of Oral Argument Nov (5)
Feb (6)
April (7)
(6.1) New York Times
No .154** (13.19)
1 0.104 0.494 0.831 0 0.034 0.230 0.601
(6.2) New York Times
Work-Related Attributes
.072** (6.83)
1 0.045 0.333 0.797 0 0.024 0.203 0.666
(6.3) New York Times
All Attributes .064** (5.96)
1 0.043 0.317 0.788 0 0.024 0.203 0.671
(6.4) Amicus Briefs
No .011** (10.58)
8 0.062 0.346 0.723 0 0.034 0.217 0.577
(6.5) Amicus Briefs
Work-Related Attributes
.007** (7.62)
8 0.035 0.277 0.748 0 0.022 0.189 0.644
(6.6) Amicus Briefs
All Attributes .007** (7.56)
8 0.035 0.274 0.750 0 0.022 0.187 0.646
Notes: (1) The regression coefficients in column (3) denote marginal effects at the mean values of all variables. All regressions use robust standard errors. Significance levels are indicated by * at .05 level and ** at .01 level. (2) The New York Times and Amicus regressions cover the 1946 to 2012 terms and include 7219 observations. (3) The dependent variable in all regressions is whether the Court issued its decision in the last two weeks of the term (1) or otherwise (0). All regressions include month and term dummy variables. Regressions 6.2 and 6.4 also include the work-related attribute variables: Fraction Dissent, Fraction Concur, Per Curiam, Two Issues, Three or More Issues, and Nine Justices. Regressions 6.3 and 6.6 include both work-related and other-attribute variables (Civil Liberties, Economic Activity, Unconstitutional, and Precedent Alteration).
PEL IN PRINTER FINAL (DO NOT DELETE) 3/6/2015 3:19 PM
2015] THE BEST FOR LAST 1017
In all models, the probability that a case will be decided in the last two weeks of the term is significantly greater for big cases than for other cases even after controlling for the month of oral argument, the term, and work-related and other case attributes.47 We also continue to observe significantly greater gross than net big-case effects in Table 6 as shown by the regression coefficients in column (3) and the predicted probabilities in columns (5)–(7).
b. Does the Chief Justice Matter? We consider here whether the big-case effects observed in Tables 5 and 6 depend on the identity of the Chief Justice. Maybe some Chief Justices follow a policy of saving the best for last and others do not. To test for this possibility, we use only the New York Times and Amicus big-case measures because they cover all cases decided between the 1946 and 2012 terms and so allow us to test for differences across the five Chief Justices during that period.48
Table 7 presents the percentage of decisions covered on the front page of the New York Times during the last week of the term (column (3)) and in all other weeks (column (2)) for each Chief Justice. We do the same for cases with four or more amicus briefs (columns (5) and (4)).49 Since the Amicus measure is continuous (ranging from 0 to 143), there is no obvious dividing line between a big and non-big case; our choice of four is arbitrary, and results in big cases being 25 percent of our sample, compared to 14 percent if the New York Times measure is used instead.
47. The coefficients on the Dissent, Concur, Per Curiam, Civil Liberties, and Unconstitutional variables are significant and in the predicted directions in the Table 6 regressions. Three or More Issues is positive and significant in regressions 6.2 and 6.5 but only marginally significant in regressions 6.3 and 6.6. The other work-related and other-attribute variables are in the predicted directions but are not significant except for the negative coefficient on the Nine Justices variable in regression 6.3. 48. Recall that the CSI covers the 1953–2004 terms and Citations the 1946–2001 terms, so these measures would exclude the Roberts era. 49. Table 7 compares only the last week of the term to earlier weeks, but notice that the results are substantially the same if we substitute the last two weeks for the last week.
PEL IN PRINTER FINAL (DO NOT DELETE) 3/6/2015 3:19 PM
1018 DUKE LAW JOURNAL [Vol. 64:991
Column (1) shows that the percentage of cases decided in the last week of the term has remained relatively constant (in the range of 15.6 to 17.3 percent) since the Vinson Court. Big cases are disproportionately decided at the end of the term for all Chief Justices in our dataset (compare columns (2) and (3) with columns (4) and (5)).50
Notice the sharp upward trend, starting with the Burger Court, in the percentage of cases in which four or more amicus briefs are filed. For cases decided in the last week (column (4)), the percentage rises from an average of 32.8 during Burger’s tenure to 86 percent during Roberts’ tenure. A similar result holds for cases decided before the last week; cases with four or more amicus briefs increase from 20 to 60.8 percent. This is consistent with a large body of literature indicating that amicus curiae participation has increased markedly over time.51 Notice also that there is a slight downward trend in New York Times coverage since the Warren Court (columns (2) and (3)), which is more pronounced for cases decided before the last week of the term (column (2)).
50. Except for the Vinson era, all differences between columns (2) and (3) and columns (4) and (5) are statistically significant. 51. See, e.g., Kearney & Merrill, supra note 24, at 751; Karen O’Connor & Lee Epstein, Amicus Curiae Participation in U.S. Supreme Court Litigation: An Appraisal of ‘Hakman’s Folklore’, 16 LAW & SOC’Y REV. 311, 315–16 (1981).

PEL IN PRINTER FINAL (DO NOT DELETE) 3/6/2015 3:19 PM
2015] THE BEST FOR LAST 1019
Table 7. Coverage on Front Page of the New York Times and Number of Amicus Briefs by Week of Decision and Chief Justice, 1946–2012
Chief Justice Percentage of Decisions
Issued in the Last Week of
the Term (1)
Percentage of Cases Receiving Front-Page
Coverage in the New York Times
Percentage of Cases with 4 or More Amicus Briefs
Case Decided Before
Last Week (2)
Case Decided
Last Week
(3)
Decisions Issued
Before Last Week
(4)
Decisions Issued
During Last Week
(5)
Vinson Court (1946-52 Terms)
15.6 9.5 (606)
14.3 (112)
3.5 (606)
5.4 (112)
Warren Court (1953-68 Terms)
16.2 15.7 (1459)
26.6** (282)
3.2 (1459)
6.7** (282)
Burger Court (1969-85 Terms)
16.0 11.1 (1965)
21.4** (373)
20.0 (1965)
32.4** (373)
Rehnquist Court (1986-04 Terms)
15.8 12.8 (1554)
29.2** (291)
44.1 (1554)
61.9** (866)
Roberts Court (2005-12 Terms)
17.3 6.7 (477)
24.0** (100)
60.8 (477)
86.0** (100)
Notes: (1) Numbers in parentheses in columns (1)–(4) denote the number of cases decided either in the last week of the term or in all other weeks. (2) The levels of significance are * at the .05 level and ** at the .01 level. Statistical comparisons are within each Chief Justice’s era. For example, for the Vinson Court the percentage of cases receiving front-page coverage in the New York Times is 14.3 for a case decided in the last week and 9.5 for cases decided in all other weeks. The absence of a * or ** indicates that the difference between 14.3 and 9.5 is not statistically significant.
To explore the significance of the differences across Chief
Justices, we re-estimate the regression models in Table 5, adding five dummy variables (one for each Chief Justice) which we interacted with our big-case variable. For the New York Times measure, the regression coefficient on each interacted Chief Justice variable estimates the increase in the probability of a last-week decision in cases that receive front-page Times coverage during the tenure of that Chief Justice. Because the interacted Amicus measure captures the increase in the probability for an additional amicus brief (which
PEL IN PRINTER FINAL (DO NOT DELETE) 3/6/2015 3:19 PM
1020 DUKE LAW JOURNAL [Vol. 64:991
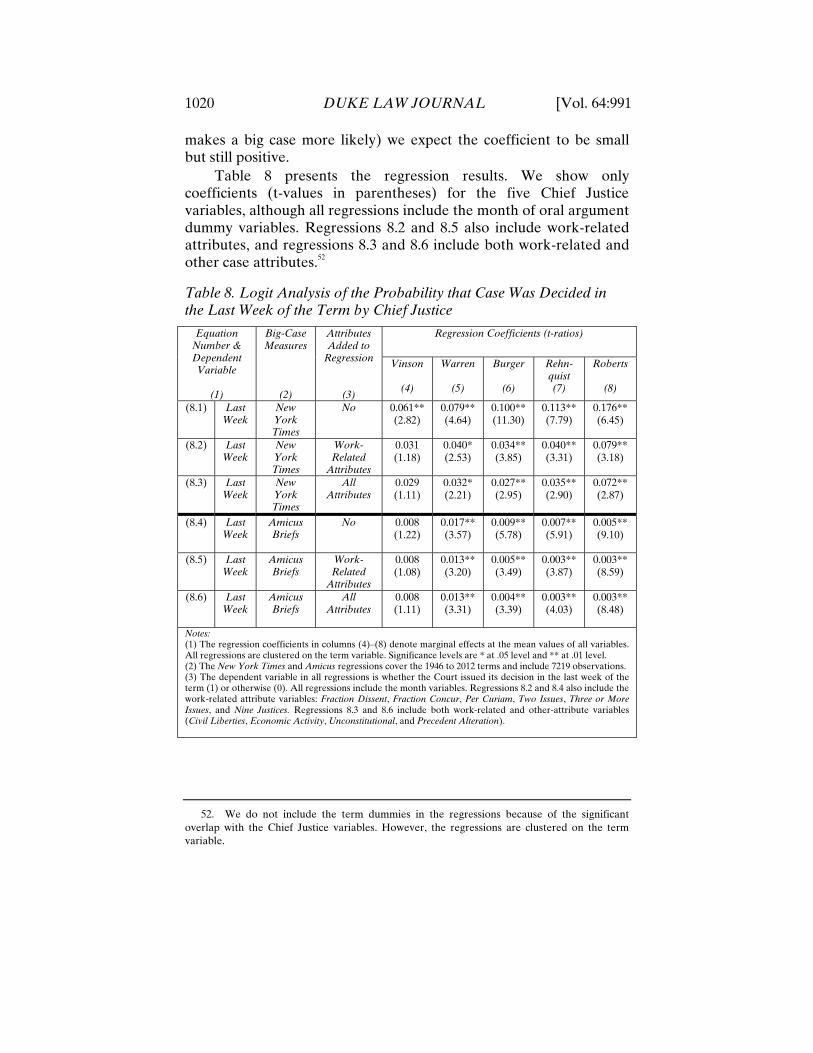
makes a big case more likely) we expect the coefficient to be small but still positive.
Table 8 presents the regression results. We show only coefficients (t-values in parentheses) for the five Chief Justice variables, although all regressions include the month of oral argument dummy variables. Regressions 8.2 and 8.5 also include work-related attributes, and regressions 8.3 and 8.6 include both work-related and other case attributes.52
Table 8. Logit Analysis of the Probability that Case Was Decided in the Last Week of the Term by Chief Justice
Equation Number & Dependent Variable
(1)
Big-Case Measures
(2)
Attributes Added to
Regression
(3)
Regression Coefficients (t-ratios)
Vinson
(4)
Warren
(5)
Burger
(6)
Rehn-quist (7)
Roberts
(8)
(8.1) Last Week
New York Times
No 0.061** (2.82)
0.079** (4.64)
0.100** (11.30)
0.113** (7.79)
0.176** (6.45)
(8.2) Last Week
New York Times
Work- Related
Attributes
0.031 (1.18)
0.040* (2.53)
0.034** (3.85)
0.040** (3.31)
0.079** (3.18)
(8.3) Last Week
New York Times
All Attributes
0.029 (1.11)
0.032* (2.21)
0.027** (2.95)
0.035** (2.90)
0.072** (2.87)
(8.4) Last Week
Amicus Briefs
No 0.008 (1.22)
0.017** (3.57)
0.009** (5.78)
0.007** (5.91)
0.005** (9.10)
(8.5) Last Week
Amicus Briefs
Work- Related
Attributes
0.008 (1.08)
0.013** (3.20)
0.005** (3.49)
0.003** (3.87)
0.003** (8.59)
(8.6) Last Week
Amicus Briefs
All Attributes
0.008 (1.11)
0.013** (3.31)
0.004** (3.39)
0.003** (4.03)
0.003** (8.48)
Notes: (1) The regression coefficients in columns (4)–(8) denote marginal effects at the mean values of all variables. All regressions are clustered on the term variable. Significance levels are * at .05 level and ** at .01 level. (2) The New York Times and Amicus regressions cover the 1946 to 2012 terms and include 7219 observations. (3) The dependent variable in all regressions is whether the Court issued its decision in the last week of the term (1) or otherwise (0). All regressions include the month variables. Regressions 8.2 and 8.4 also include the work-related attribute variables: Fraction Dissent, Fraction Concur, Per Curiam, Two Issues, Three or More Issues, and Nine Justices. Regressions 8.3 and 8.6 include both work-related and other-attribute variables (Civil Liberties, Economic Activity, Unconstitutional, and Precedent Alteration).
52. We do not include the term dummies in the regressions because of the significant overlap with the Chief Justice variables. However, the regressions are clustered on the term variable.

PEL IN PRINTER FINAL (DO NOT DELETE) 3/6/2015 3:19 PM
2015] THE BEST FOR LAST 1021
Consider the coefficient of 0.176 for Roberts in regression 8.1. It tells us that the predicted probability of decision in the last week of the term is 0.176 greater for a Roberts Court case that appears in the New York Times than for one that does not, holding constant the month of the oral argument (the gross big-case effect for Chief Justice Roberts). We find smaller but still significant probability increases for the other Chief Justices. Except for Roberts, the differences across Chief Justices in regression 8.1 are not significant. As expected, we find smaller but still significant net big-case effects for all our Chief Justices, except Vinson, when we include work-related attributes (regression 8.2), and work-related plus other attributes (regression 8.3). We also find no significant difference in the coefficients across Chief Justices in regressions 8.2 and 8.3—that is, we accept the null hypothesis that net or pure big-case effects across the five Chief Justices are not significantly different from each other. Turning to the Amicus measure, we find significant big-case effects in the three regressions for all the Chief Justices except Vinson. We also find no significant differences across Burger, Rehnquist, and Roberts for both the gross and net big-case effects but a larger effect for Warren. We have no explanation why the Warren Court Amicus effects are significantly greater than the effects for the other Chief Justices. Overall, the effects we observed in Table 5 do not depend on the identity of the Chief Justice.
CONCLUSION
Although the Supreme Court decides its cases with dispatch—with a tiny exception for the rare case held over for reargument in the next term, all cases are decided in the same term in which they are argued, hence in less than a year53—there is this curious phenomenon, quantified in this Article, of decisions in big cases tending to cluster at the end of the Court’s term. It could just be that big cases (as determined by our four measures of “bigness”) have attributes that make it take longer for the Court to decide them, most clearly perhaps the number of separate opinions in a case, which are bound to lengthen the path from argument to decision. But while the work-
53. Many federal court of appeals decisions are decided a year or more after oral argument. See ADMIN. OFFICE OF THE U.S. COURTS, U.S. COURTS OF APPEALS SUMMARY—12-MONTH PERIOD ENDING JUNE 30, 2014, at 2 (last visited Feb. 6, 2015), http://www.uscourts.gov/viewer.aspx?doc=/uscourts/Statistics/FederalCourtManagementStatistics/2014/appeals-fcms-summary-pages-june-2014.pdf.

PEL IN PRINTER FINAL (DO NOT DELETE) 3/6/2015 3:19 PM
1022 DUKE LAW JOURNAL [Vol. 64:991
time attributes do lengthen the path, clustering near the end of the term occurs even when they are not present; that is what we called the big-case net effect.
And so the question is why. We can only speculate, but three possibilities come to mind. The first centers on legacy and reputational concerns: when writing what they think will prove to be major decisions the Justices take more time, polishing and polishing (or making their law clerks polish and polish, since nowadays law clerks do most judicial writing even in the Supreme Court) until the last possible moment, with the hope of promoting their own reputation. After all, excerpts of some of these big cases will find their way into the popular press and, more importantly, into casebooks that generations of law students will read; and, most importantly, the cases may continue to be remembered, discussed, and cited long, long after they are decided.54
A second possible explanation is that the Justices delay certain decisions for public-relations reasons. The close proximity of decisions in the most important cases may tend to diffuse media coverage of and other commentary regarding any particular case, and thus spare the Justices unwanted criticism. But the opposite effect is possible: the expectation of a crowd of important cases at the end of the term can increase media attention, as in Slate’s “Breakfast Table” end-of-term roundup.
Finally, though related to the second explanation, the Justices, most of whom have busy social schedules in Washington, may want to avoid tensions at their social functions by clustering the most controversial cases in the last week or two of the term—that is, just before they leave Washington for their summer recess.55
54. Another way to state this point is that the variables we include in the end-of-term regressions (month and term dummies, work-related and other attributes) do not fully account for the time the Justices spend on a case, so there remains a net big-case effect. 55. When asked by a questioner where Chief Justice Roberts was going after the end of the term, Roberts said that he “was about to leave for Malta, where he would teach a two-week class on the history of the Supreme Court. ‘Malta, as you know, is an impregnable island fortress,’ he said on Friday, according to news reports. ‘It seemed like a good idea.’” Adam Liptak, Roberts Makes a Getaway from the Scorn, N.Y. TIMES, July 3, 2012, at A10.