
Otg bench marking 2004
17
Orang Tua Group Tarps Bench Marking
-
Upload
aji-nugroho -
Category
Data & Analytics
-
view
138 -
download
1
Transcript of Otg bench marking 2004
Orang Tua Group
Tarps Bench Marking

Contents
• Ad Spends 2004• By Medium• By Category• By Company
• OTG Positioning in each category present• How big is OTG under it’s category/sub-category (tarp base)
• Tarp Skyline of OTG brands vs competitors• Weekly basis
• TV Usage• Channel Mix• Duration Mix• Day Part Mix• Program Type Selection
• YOY SOV growth by brand category• Growth of the category in tarps level

Ad Spending in 2004
Glimpse on the Tops

Advertising Spends continues to increase over the years
3.2
4.9
7.1
9.1
12.4
16.86
21.5
'98 '99 '00 '01 '02 '03 '04
Advertising Expenditure All Categories (TV+Print) – Rp TrillionExclusive of : Services (Media & Promotion ) and Non-Commercial Advertisement
Source: AC Nielsen
Just a shy away of .5 trillion from the predicted estimate of 22 Trillion exit 2004
+27%
‘98-’03 data source : AC Nielsen 2004

TV still the main medium for advertisers
11.7 15.21
4.3 5.29
1.00.9
2003 2004
Mag
Npp
TV
Advertising Expenditure All Categories by MediaExclusive of : Services (Media & Promotion ) and Non-Commercial Advertisement
Source: AC Nielsen
Rp Trillion 21.516.8
+23%
+30%
+11%

Spending Share TV Share
JogjaTV
BALI TV
TVBR
JTV
TVRI1
GTV
METRO
ANTV
TV7
LATV
TPI
TRANS
SCTV
RCTI
IVM
Big channels RCTI, IVM, and SCTV still dominates the channels,however secondary and small channels are not far behind
January – December 2004 Reading
Advertising Expenditure All Categories Exclusive of : Services (Media & Promotion ) and Non-Commercial Advertisement
Source: AC Nielsen
100% ShareRp.15,265 Bio
18%
12%
2%
11%
17%
18%
14%
13%
1%
7%
13%
16%
7%
7%
6%
12%
6%
5%6%3%2%
Secondary
Channels
Getting
stronger
Big
Channels
Small
Channels
Gaining
shares from
big
channels
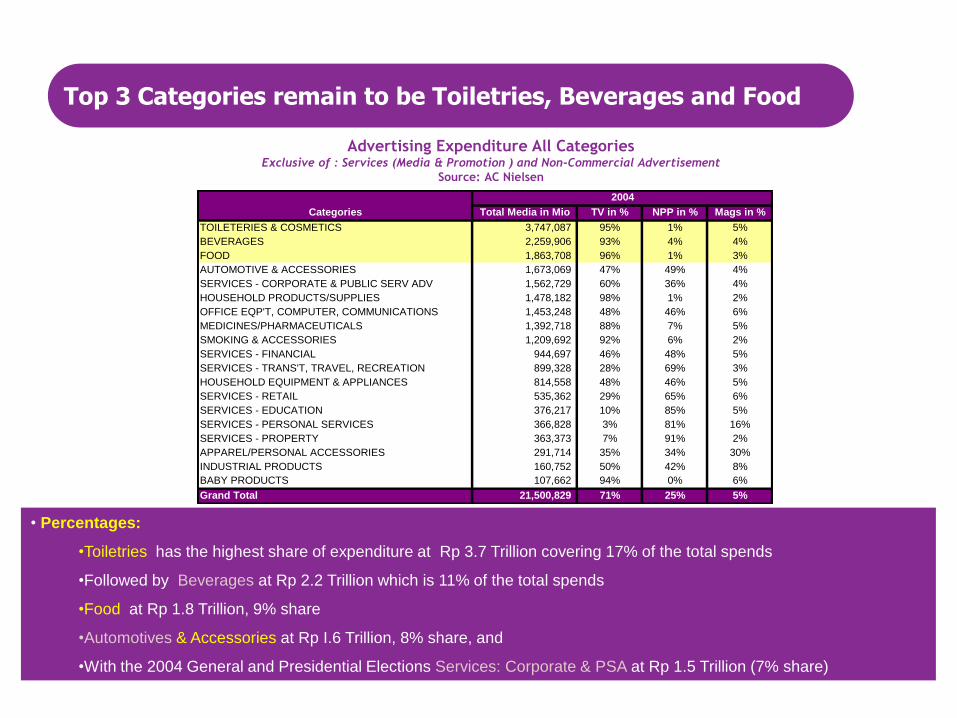
Top 3 Categories remain to be Toiletries, Beverages and Food
Advertising Expenditure All Categories Exclusive of : Services (Media & Promotion ) and Non-Commercial Advertisement
Source: AC Nielsen
• Percentages:
•Toiletries has the highest share of expenditure at Rp 3.7 Trillion covering 17% of the total spends
•Followed by Beverages at Rp 2.2 Trillion which is 11% of the total spends
•Food at Rp 1.8 Trillion, 9% share
•Automotives & Accessories at Rp I.6 Trillion, 8% share, and
•With the 2004 General and Presidential Elections Services: Corporate & PSA at Rp 1.5 Trillion (7% share)
Categories Total Media in Mio TV in % NPP in % Mags in %
TOILETERIES & COSMETICS 3,747,087 95% 1% 5%
BEVERAGES 2,259,906 93% 4% 4%
FOOD 1,863,708 96% 1% 3%
AUTOMOTIVE & ACCESSORIES 1,673,069 47% 49% 4%
SERVICES - CORPORATE & PUBLIC SERV ADV 1,562,729 60% 36% 4%
HOUSEHOLD PRODUCTS/SUPPLIES 1,478,182 98% 1% 2%
OFFICE EQP'T, COMPUTER, COMMUNICATIONS 1,453,248 48% 46% 6%
MEDICINES/PHARMACEUTICALS 1,392,718 88% 7% 5%
SMOKING & ACCESSORIES 1,209,692 92% 6% 2%
SERVICES - FINANCIAL 944,697 46% 48% 5%
SERVICES - TRANS'T, TRAVEL, RECREATION 899,328 28% 69% 3%
HOUSEHOLD EQUIPMENT & APPLIANCES 814,558 48% 46% 5%
SERVICES - RETAIL 535,362 29% 65% 6%
SERVICES - EDUCATION 376,217 10% 85% 5%
SERVICES - PERSONAL SERVICES 366,828 3% 81% 16%
SERVICES - PROPERTY 363,373 7% 91% 2%
APPAREL/PERSONAL ACCESSORIES 291,714 35% 34% 30%
INDUSTRIAL PRODUCTS 160,752 50% 42% 8%
BABY PRODUCTS 107,662 94% 0% 6%
Grand Total 21,500,829 71% 25% 5%
2004
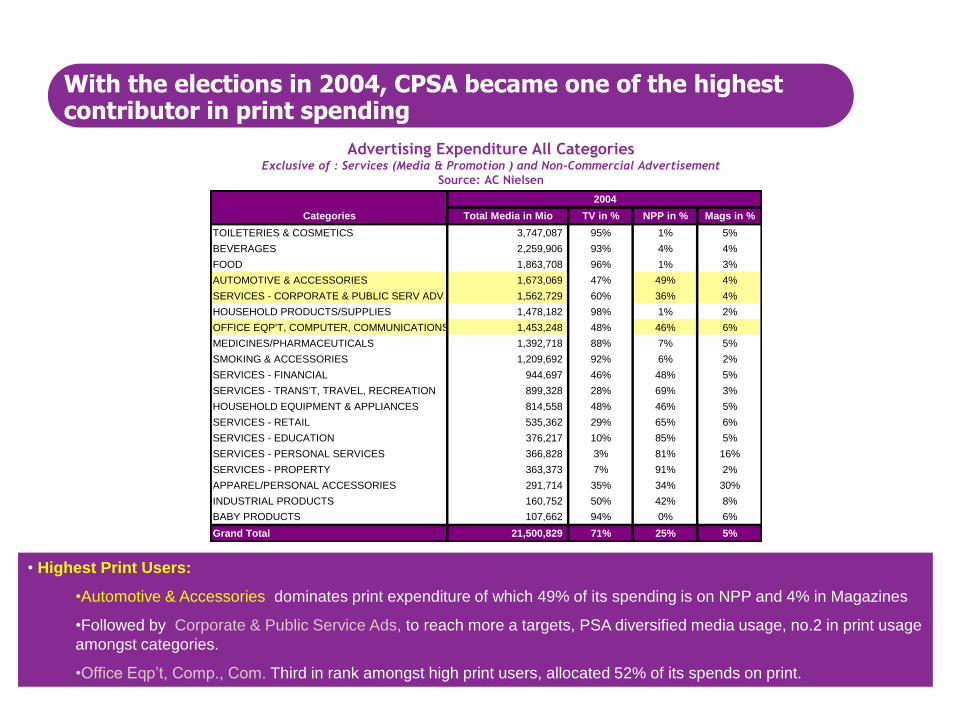
With the elections in 2004, CPSA became one of the highest contributor in print spending
Advertising Expenditure All Categories Exclusive of : Services (Media & Promotion ) and Non-Commercial Advertisement
Source: AC Nielsen
• Highest Print Users:
•Automotive & Accessories dominates print expenditure of which 49% of its spending is on NPP and 4% in Magazines
•Followed by Corporate & Public Service Ads, to reach more a targets, PSA diversified media usage, no.2 in print usage
amongst categories.
•Office Eqp’t, Comp., Com. Third in rank amongst high print users, allocated 52% of its spends on print.
Categories Total Media in Mio TV in % NPP in % Mags in %
TOILETERIES & COSMETICS 3,747,087 95% 1% 5%
BEVERAGES 2,259,906 93% 4% 4%
FOOD 1,863,708 96% 1% 3%
AUTOMOTIVE & ACCESSORIES 1,673,069 47% 49% 4%
SERVICES - CORPORATE & PUBLIC SERV ADV 1,562,729 60% 36% 4%
HOUSEHOLD PRODUCTS/SUPPLIES 1,478,182 98% 1% 2%
OFFICE EQP'T, COMPUTER, COMMUNICATIONS 1,453,248 48% 46% 6%
MEDICINES/PHARMACEUTICALS 1,392,718 88% 7% 5%
SMOKING & ACCESSORIES 1,209,692 92% 6% 2%
SERVICES - FINANCIAL 944,697 46% 48% 5%
SERVICES - TRANS'T, TRAVEL, RECREATION 899,328 28% 69% 3%
HOUSEHOLD EQUIPMENT & APPLIANCES 814,558 48% 46% 5%
SERVICES - RETAIL 535,362 29% 65% 6%
SERVICES - EDUCATION 376,217 10% 85% 5%
SERVICES - PERSONAL SERVICES 366,828 3% 81% 16%
SERVICES - PROPERTY 363,373 7% 91% 2%
APPAREL/PERSONAL ACCESSORIES 291,714 35% 34% 30%
INDUSTRIAL PRODUCTS 160,752 50% 42% 8%
BABY PRODUCTS 107,662 94% 0% 6%
Grand Total 21,500,829 71% 25% 5%
2004

General & Presidential Elections ensued huge increase in CPSA
•Top 10 Section Category which comprises 82% of total ad spends, excluding Media & Promotion
Services and Non-Commercial Advertisement increased 34% in 2004.
•All Categories have increased except, Household Equipment & Appliances with 5% decrease in
spending, however it still sitting in the top 10 at the 6th position.
•Amongst Section Category Corporate & Public Service Ads has the most increment at 111% due to
the 2004 general and presidential elections, followed by Smoking & Accessories with 76% increase in
spends, and Office Equipment, Computer, Communications at 75%.
Advertising Expenditure by CategoryExclusive of : Services (Media & Promotion ) and Non-Commercial Advertisement
Source: AC Nielsen
Total Media in Mio TV in % NPP in % Mags in % Total Media in Mio TV in % NPP in % Mags in % Growth
TOILETERIES & COSMETICS 2,807,496 94% 1% 5% TOILETERIES & COSMETICS 3,747,087 95% 1% 5% 33%
BEVERAGES 1,717,495 92% 4% 4% BEVERAGES 2,259,906 93% 4% 4% 32%
FOOD 1,435,886 95% 2% 3% FOOD 1,863,708 96% 1% 3% 30%
AUTOMOTIVE & ACCESSORIES 1,337,710 42% 53% 4% AUTOMOTIVE & ACCESSORIES 1,673,069 47% 49% 4% 25%
HOUSEHOLD PRODUCTS/SUPPLIES 1,270,218 98% 1% 2% SERVICES - CORPORATE & PUBLIC SERV ADV 1,562,729 60% 36% 4% 111%
MEDICINES/PHARMACEUTICALS 1,212,936 89% 6% 5% HOUSEHOLD PRODUCTS/SUPPLIES 1,478,182 98% 1% 2% 16%
HOUSEHOLD EQUIPMENT & APPLIANCES 853,292 54% 41% 4% OFFICE EQP'T, COMPUTER, COMMUNICATIONS 1,453,248 48% 46% 6% 75%
OFFICE EQP'T, COMPUTER, COMMUNICATIONS 830,779 38% 55% 7% MEDICINES/PHARMACEUTICALS 1,392,718 88% 7% 5% 15%
SERVICES - FINANCIAL 826,500 48% 47% 5% SMOKING & ACCESSORIES 1,209,692 92% 6% 2% 76%
SERVICES - TRANS'T, TRAVEL, RECREATION 782,937 37% 60% 3% SERVICES - FINANCIAL 944,697 46% 48% 5% 14%
Categories Categories20042003

Hair Care continues to hold the no. 1 rank in Toiletries& Cosmetics
0.00
500,000.00
1,000,000.00
1,500,000.00
2,000,000.00
2,500,000.00
3,000,000.00
3,500,000.00
4,000,000.00
Toiletries & Cosmetics
Razor Blades
Acne Treatment
Talcum Powder
Mouthwash &Oral Higiene
Tissue
Handsoap
Cosmetics & Make Ups
Range of Toiletries
Sanitary Napkin & Adult Diaper
Deodorant
Perfumes & Cologne
Body Care & Lotion
Tooth (Paste&Brush)
Toilet & Liquid Soap
Facial Cleanser
Hair Care
Rp. 3.74 Bio
17%
31%
15%
7%
12%
Toiletries & Cosmetics is driven by
Hair Care covering 31% share of
spends with Sunsilk Nutrient, Clear Anti
Ketombe, Lifebouy Hydro Shampoo,
Pantene, and Head & Shoulders as Top
5 big spenders
Facial Cleanser at 17% includes,
Pond’s Beauty White- Skin, Citra
Refreshing, Pond’s White Shake &
Clean, Dove – Facial Foam, and Biore
Anti Acne (Top 5)
Toilet & Liquid Soap at 15% from,
Lifebouy Puralin, Lux Bath, Giv Bath,
Dove Bath, and Dettol (Top 5)
Toothpaste & Toothbrush at 12%,
Pepsodent all Toothpaste variants,
Ciptadent, Close Up, Pepsodent
Flexipick and Formula Discovery (Top 5)
Body Care at 7% includes, Citra White
Lotion, Vaseline Intensive Care,
Melanox, Emeron White,Purbasari
Whitening (Top 5)
Advertising Expenditure Toiletries & CosmeticsSource: Ad Quest/AC Nielsen (Jan-Dec Spending)

Beverage clings to the 2nd position, Health Drink leading
0
500,000
1,000,000
1,500,000
2,000,000
2,500,000
Beverages
Stout
Wines & Spirits
Range of Beverage Prods.
Fresh Milk
Beer
Other Drinks
Nutrition Drink
Sweetened Condensed Milk
Diet Drink
Liquid, Evaporated Milk
Other Milk
Pregnant & Nursing Women Milk
Range of Milk Products
Mineral Water
Non-Carbonated Softdrinks
Powdered Milk
Carbonated Softdrinks
Fruit & Vegetable Juices
Coffee & Tea
Growing & Follow Up Milk
Health Drink
Beverages is dominated by
Health Drink 25% share of spends with
Extra Joss All, Hemaviton All, M-150,
Krating Daeng All, and Ena’o (Top 5)
Growing Up Milk 15% includes, Dancow
All GUM, Bendera All GUM, Nutrilon All
GUM, Chil Kid All GUM, and PediaSure All
GUM (Top 5)
Coffee & Tea 13% from, Teh Sariwangi,
Nescafe 3 in 1 Instant, Nescafe Classic,
Cap Botol Teh Seduh, and Indocafe (Top
5)
Fruit & Vegetables Juices 11%, Adem
Sari, Jasjus, NutriSari, Marjan Boudin, and
ABC Syrup (Top 5)
Powdered Milk 8% includes, Dancow
Powder, Bendera Powder, Dancow All Milk,
L-Men, and Anlene Gold (Top 5)
Non-Carbonated Soft Drinks 6%,
includes FresTea, Teh Sosro Bottle, Teh
Sosro Fruit Tea, Birdy Iced Cofee, Lipton
Iced Tea
Rp 2.25Bio
15%
25%
6%
11%
13%
5%
Advertising Expenditure BeveragesSource: Ad Quest/AC Nielsen (Jan-Dec Spending)
8%

Leading food category is Seasoning, Condiments with 20% share
0
200,000
400,000
600,000
800,000
1,000,000
1,200,000
1,400,000
1,600,000
1,800,000
2,000,000
Foods
Flavour Oil
Fruits & Veges - Frozen Foods
Additional Foods - Chips
Grains, Bulk Foods
Diet Food
Bakery Good, Bakery Mixes, Flours
Canned/Processed Food
Cooking Oil
Range of Food Prods.
Baby Food, Baby Cereal
Margarine, Dairy Food
Cereals, Breakfast Food
Confectionary - Cough Drops
Desserts, Desserts Ingredients
Confectionary - Chocolates
Confectionary - Candies, Chewing Gums
Instant Foods, Instant Noodles
Snacks, Biscuits, Cookies, Cakes
Seasoning, Condiments
Foods is dominated by
Seasoning & Condiments 20% Cap
Bango, Royco Seasoning-Salt,
Masako, Royco Seasoning Liquid, and
ABC – Soy Sauce (Top 5)
Snacks, Biscuits, Cookies, Cakes
18% includes, Taro Snack, Danone
Biskuat, Roma Biscuit, Taro Stick, and
Tango Wafer (Top 5)
Instant Food, Instant Noodles 16%
from, Sedaap, Indomie, Sarimi, Salam
Mie, and Supermi(Top 5)
Confectionary Candies, Chewing
gums 11%, Relaxa, Jack n Jill
Dynamite, Pepsodent Delicio,
Alpenliebe, and Kopiko Milko (Top 5)
Desserts/Ingredients 10% includes,
Pop Ice, Walls’: Conello, Paddle pop, 2
in 1, and Selection (Top 5)
Rp 1.86 Bio
18%
20%
11%
16%
10%
Advertising Expenditure BeveragesSource: Ad Quest/AC Nielsen (Jan-Dec Spending)
9%

Company Ranking (Top 20)
•Top 20 Company stack up to 41% of total advertising spends, Unilever driving the expenditure with 14% share, followed by
Wings at 5%, Astra at 3%, PT. Djarum, H.M. Sampoerna, P & G, and Nestle at 2% a piece, other companies shares at
1%.
•Huge increments came from Reckitt & Benkissr at an enormous 506%, Indosat at 161% both making it to the Top 20
company advertisers.
•Decreased spends coming from Konimex at 42%, Indofood at 11%, and Suzuki at 6%, ABC Heinz and Fraisien Flag
are amongst those that are eliminated in the Top 20.
Advertising Expenditure All Categories
Source: Ad Quest/AC Nielsen
New Top 20Legend in Rank: Down NotchedIncrease Decrease
Rank Company Spends in Rp. Mio % Rank Company Spends in Rp. Mio % Growth
1 Unilever 2,404,981 14% 1 Unilever 2,938,429 14% 22%
2 Wings 788,915 5% 2 Wings 1,096,324 5% 39%
3 Astra 439,733 3% 3 Astra 555,444 3% 26%
4 Bintang Toedjoe 290,904 2% 4 PT Djarum 436,444 2% 68%
5 PT Djarum 259,823 2% 5 H.M. Sampoerna 391,969 2% 106%
6 Nestle 247,856 1% 6 Proctor & Gamble 386,845 2% 66%
7 Suzuki 244,025 1% 7 Nestle 357,513 2% 44%
8 Proctor & Gamble 233,034 1% 8 Bintang Toedjoe 308,890 1% 6%
9 Indofood 231,336 1% 9 KAO 245,729 1% 39%
10 Tempo Promosi 195,658 1% 10 Telkomsel 236,406 1% 156%
11 H.M. Sampoerna 189,890 1% 11 Suzuki 230,098 1% -6%
12 KAO 177,391 1% 12 Bank Mandiri 222,718 1% 51%
13 Konimex 165,100 1% 13 Yamaha 219,715 1% 41%
14 Yamaha 156,072 1% 14 Gudang Garam 213,611 1% 55%
15 Bank Mandiri 147,263 1% 15 Tempo Promosi 211,297 1% 8%
16 Gudang Garam 137,535 1% 16 Indofood 206,768 1% -11%
17 ABC Heinz 129,662 1% 17 Indosat 173,343 1% 161%
18 Frisien Flag 102,830 1% 18 Orang Tua Group 170,666 1% 81%
19 Orang Tua Group 94,494 1% 19 Reckitt & Benkisser 161,879 1% 506%
20 Telkomsel 92,234 1% 20 Konimex 143,932 1% -42%
Total Top 20 6,728,736 31% Total Top 20 8,908,020 41%
Total Advertisers 16,863,750 Total Advertisers 21,500,829
2003 2004
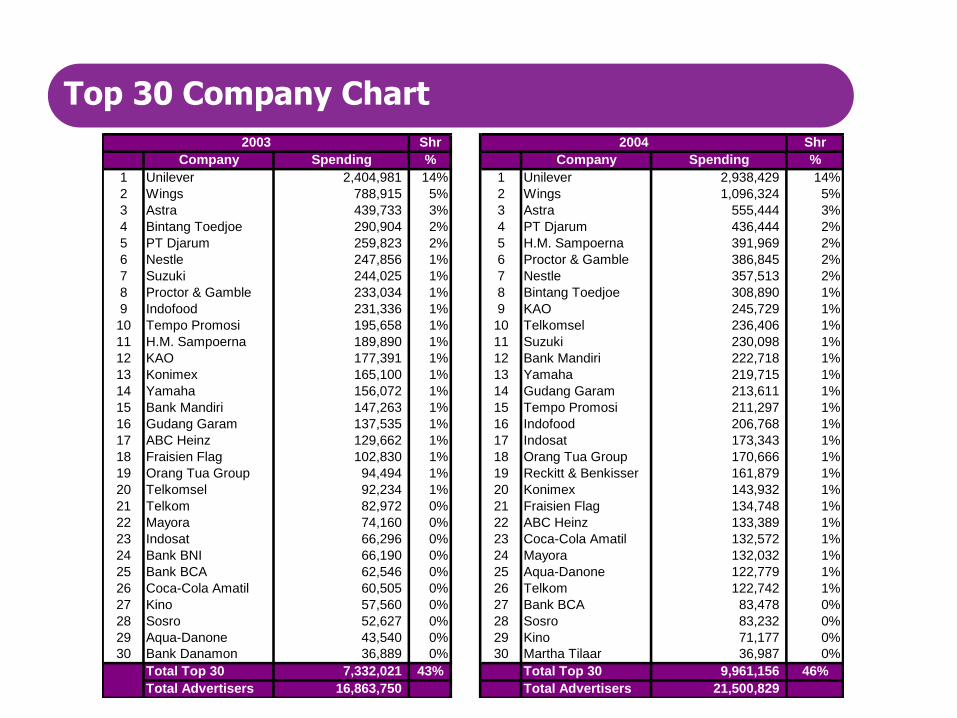
Top 30 Company Chart
Shr Shr
Company Spending % Company Spending %
1 Unilever 2,404,981 14% 1 Unilever 2,938,429 14%
2 Wings 788,915 5% 2 Wings 1,096,324 5%
3 Astra 439,733 3% 3 Astra 555,444 3%
4 Bintang Toedjoe 290,904 2% 4 PT Djarum 436,444 2%
5 PT Djarum 259,823 2% 5 H.M. Sampoerna 391,969 2%
6 Nestle 247,856 1% 6 Proctor & Gamble 386,845 2%
7 Suzuki 244,025 1% 7 Nestle 357,513 2%
8 Proctor & Gamble 233,034 1% 8 Bintang Toedjoe 308,890 1%
9 Indofood 231,336 1% 9 KAO 245,729 1%
10 Tempo Promosi 195,658 1% 10 Telkomsel 236,406 1%
11 H.M. Sampoerna 189,890 1% 11 Suzuki 230,098 1%
12 KAO 177,391 1% 12 Bank Mandiri 222,718 1%
13 Konimex 165,100 1% 13 Yamaha 219,715 1%
14 Yamaha 156,072 1% 14 Gudang Garam 213,611 1%
15 Bank Mandiri 147,263 1% 15 Tempo Promosi 211,297 1%
16 Gudang Garam 137,535 1% 16 Indofood 206,768 1%
17 ABC Heinz 129,662 1% 17 Indosat 173,343 1%
18 Fraisien Flag 102,830 1% 18 Orang Tua Group 170,666 1%
19 Orang Tua Group 94,494 1% 19 Reckitt & Benkisser 161,879 1%
20 Telkomsel 92,234 1% 20 Konimex 143,932 1%
21 Telkom 82,972 0% 21 Fraisien Flag 134,748 1%
22 Mayora 74,160 0% 22 ABC Heinz 133,389 1%
23 Indosat 66,296 0% 23 Coca-Cola Amatil 132,572 1%
24 Bank BNI 66,190 0% 24 Mayora 132,032 1%
25 Bank BCA 62,546 0% 25 Aqua-Danone 122,779 1%
26 Coca-Cola Amatil 60,505 0% 26 Telkom 122,742 1%
27 Kino 57,560 0% 27 Bank BCA 83,478 0%
28 Sosro 52,627 0% 28 Sosro 83,232 0%
29 Aqua-Danone 43,540 0% 29 Kino 71,177 0%
30 Bank Danamon 36,889 0% 30 Martha Tilaar 36,987 0%
Total Top 30 7,332,021 43% Total Top 30 9,961,156 46%
Total Advertisers 16,863,750 Total Advertisers 21,500,829
2003 2004

Unilever products still tops the brand list
• Currently there are 910 active brands from all categories
• Top brands mostly coming from toiletries & cosmetics lead by ULI brands
• With the presidential elections PSA from services boosts spends
• Other top brands comes from cigarettes, telecommunication, beverage, and automotive & accessories
Advertising Expenditure All Categories
Source: Ad Quest/AC Nielsen (Jan-Sep ’04)
Brands Rp. In Mio TV in % NPP in % Mags in %
1 SUNSILK NUTRIENT - SHAMPOO 272,408 97% 2%
2 CLEAR ANTI KETOMBE - SHAMPOO 203,889 97% 1% 2%
3 CALON PRESIDEN&WAKIL PRESIDEN 180,392 74% 25% 1%
4 DJARUM SUPER - FILTER CLOVE CIGARETTE 176,010 93% 5% 2%
5 TOP 1 FORMULA 1 - OIL LUBRICANT 144,866 95% 3% 2%
6 MOBILE 8 FREN - CDMA SIM CARD 142,365 93% 6% 1%
7 LIFEBUOY PURALIN PLUS - BATH SOAP 137,353 99% 1% 1%
8 LIFEBUOY HYDRO PROTEIN - SHAMPOO 134,437 97% 1% 2%
9 POND'S WHITE BEAUTY - SKIN LIGHTENING 133,014 100%
10 DJI SAM SOE 234 - CLOVE CIGARETTE 128,077 97% 2% 1%
11 KOMISI PEMILIHAN UMUM (KPU) 108,714 77% 21% 1%
12 EXTRA JOSS - ISOTONIC DRINK 107,619 89% 7% 4%
13 RINSO - POWDER DETERGENT 105,014 97% 1% 2%
14 TELKOMSEL SIMPATI - SIM CARD 99,283 62% 34% 4%
15 SEDAAP - INSTANT NOODLE 99,251 100%
16 NOKIA - GSM HANDPHONE 99,170 46% 45% 9%
17 TELKOM (TELEKOMUNIKASI INDONESIA) 93,006 64% 34% 2%
18 TEH SARIWANGI 84,139 95% 2% 2%
19 MOLTO - FABRIC SOFTENER 83,916 98% 2%
20 CITRA WHITE - SKIN WHITENING LOTION 82,022 99% 1%
Summary & Implication
ImplicationsSummary
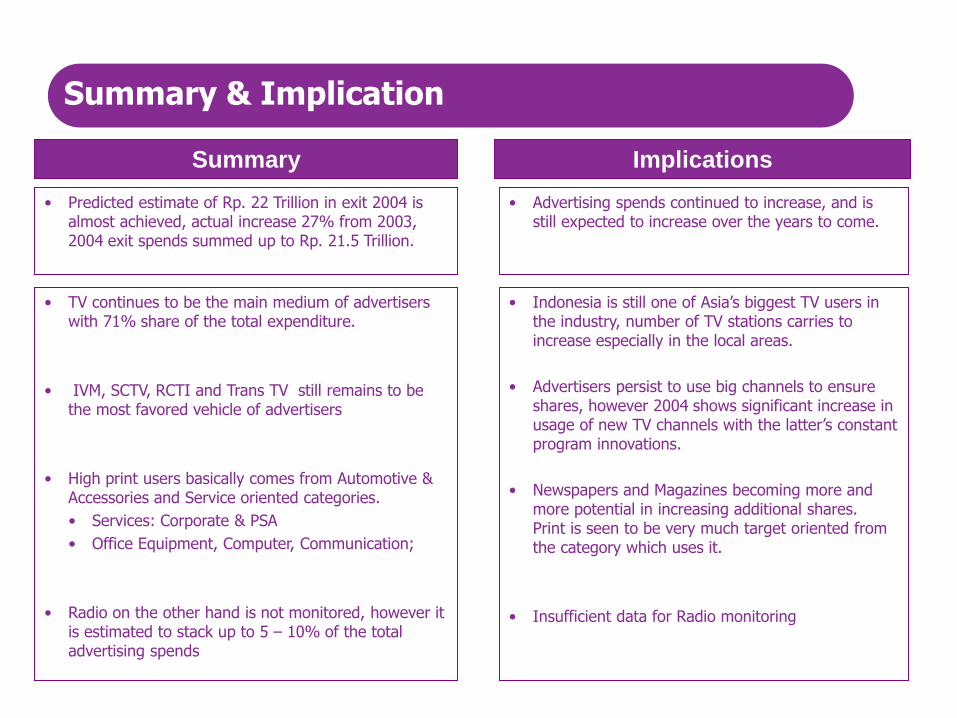
• Predicted estimate of Rp. 22 Trillion in exit 2004 is almost achieved, actual increase 27% from 2003, 2004 exit spends summed up to Rp. 21.5 Trillion.
• Advertising spends continued to increase, and is still expected to increase over the years to come.
• TV continues to be the main medium of advertisers with 71% share of the total expenditure.
• IVM, SCTV, RCTI and Trans TV still remains to be the most favored vehicle of advertisers
• High print users basically comes from Automotive & Accessories and Service oriented categories.
• Services: Corporate & PSA
• Office Equipment, Computer, Communication;
• Radio on the other hand is not monitored, however it is estimated to stack up to 5 – 10% of the total advertising spends
• Indonesia is still one of Asia’s biggest TV users in the industry, number of TV stations carries to increase especially in the local areas.
• Advertisers persist to use big channels to ensure shares, however 2004 shows significant increase in usage of new TV channels with the latter’s constant program innovations.
• Newspapers and Magazines becoming more and more potential in increasing additional shares. Print is seen to be very much target oriented from the category which uses it.
• Insufficient data for Radio monitoring

Summary & Implication
ImplicationsSummary
• Amid numerous categories, Toiletries & Cosmetics leads the expenditure making up 17% of the total advertising spends 2004.
• Beverage and Food category continues to follow Toiletries & Cosmetics in rank .
• Company spending continues to fluctuate. Fluctuation is driven by the priorities set for each and every brand of the companies.
• Top Brands still within consumer goods.
• With abundant products and variety to be advertised and more new product development that needs to be communicated to the audience this category drives the expenditure in the market.
• With the Indonesian characteristic of “you do, I do”, huge number of new products enter the market, e.g. Noodles “mie sedaap” (Wings) comes “supermi sedapp” (Indofood). With these new additions, advertising spends in these categories continued to escalate.
• Consumer goods still very dominant, followed by Automotive, Cigarettes, and Banking.


