OSO Satellite - ntrs.nasa.gov
123
OSO Satellite RICHARD G. TESKE May 1970 National Aeronautics and Space Administration Goddard Space Flight Center Contract No. NAS5-3176 Greenbelt, Maryland
Transcript of OSO Satellite - ntrs.nasa.gov

OSO Satellite
RICHARD G . TESKE
May 1970
National Aeronautics and Space Administration Goddard Space Flight Center Contract No. NAS5-3176 Greenbelt, Maryland

T H E U N I V E R S I T Y O F M I C H I G A N
C O L U G E OF LITERATURE, SCIENCE, AND T H E ARTS D e p a r t m e n t of A s t r o n o m y
Final R e p o r t
OSO S A T E L L I T E
R i c h a r d G. T e s k e
ORA project 05567
under contract w i t h :
NATIONAL AERONAUTICS AND SPACE ADMINISTRATION GODDARD SPACE F L I G H T CENTER
CONTRACT NO. N A S ~ -3176 GREENBELT, MARYLAND
a d m i n i s t e r e d through:
O F F I C E O F RESEARCH ADMINISTRATION ANN ARBOR
M a y 1970

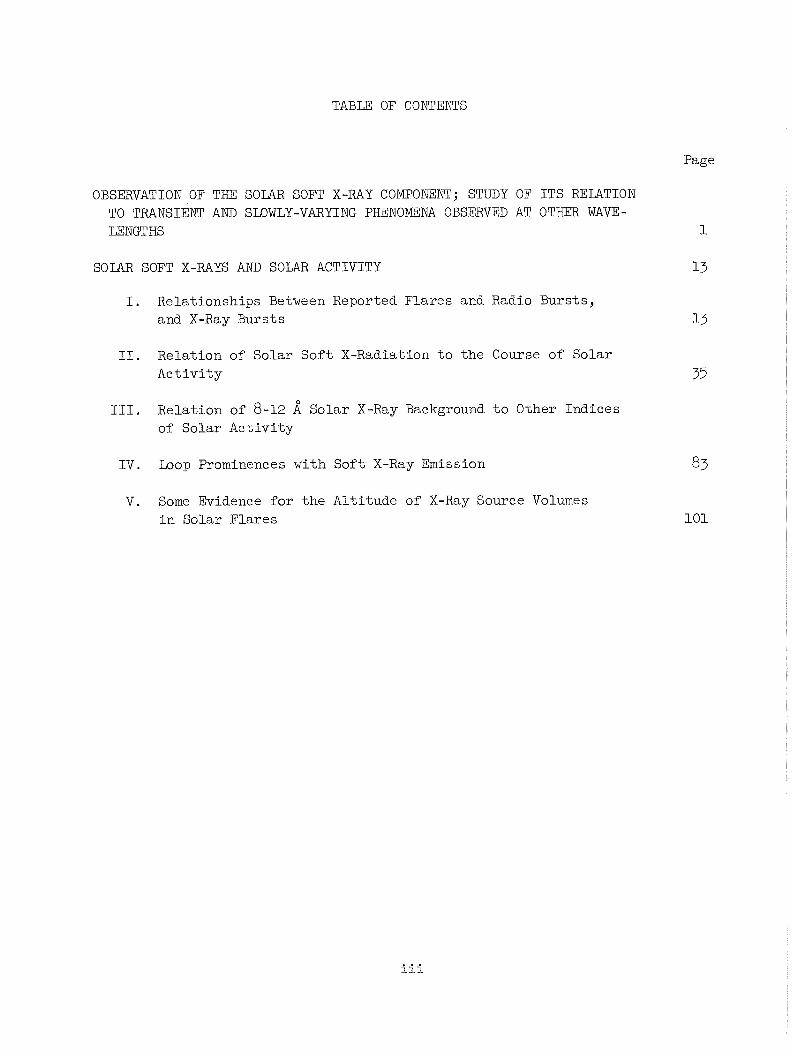
TABLE OF CONTENTS
Page
OBSERVATION OF THE SOLAR SOFT X-RAY COMPONENT; STUDY OF ITS RELATION TO TRANSIENT AND SLOWLY-VARYING PHENOMENA OBSERVED AT OTHEB WAVE- LENGTHS
SOLAR SOFT X-RAYS AND SOLAR ACTIVITY
I. Relationships Between Reported Flares and Radio Bursts, and X-Ray Bursts
11. Relation of Solar Sof t X-Radiation t o the Course of Solar Ac t iv i ty
111. Relation of 8-12 Solar X-Ray Background t o Other Indices of Solar Act iv i ty
I V . Loop Prominences with Sof t X-Ray Emission
V. Some Evidence f o r the Alt i tude of X-Ray Source Volumes i n Solar Flares

OBSERVATION OF THE SOLAR SOFT X-RAY COMPONENT;
STUDY OF ITS RELATION TO T R A N S I E N T A N D SLOWLY-
V A R Y I N G PHENOMENA OBSERVED A T OTHER
WAVELENGTHS
R I C H A R D G. TESKE
Depr. of Asfronon, and fhe McMnth-N~i/bel*t Observatory, The Uitiver.sity G "ichigari, Arin Arbor, Mich., U.S.A.
(Received 8 July, 1968)
Abstract. Solar X-rays from 8-12 A have been observed with an ion chamber photometer and fluxes derived from the observations after an assumption concerning the spectral distribution. The time variation of the X-ray flux correlates well with the radio flux, plage index, and sunspot number. Comparisons of X-ray and optical events are given; flares seem to produce soft X-rays, but some soft X-ray bursts are apparently not associated with flares. The total energy involved in the soft X-ray bursts may be a significant amount of the total flare radiation.
The Michigan soft X-ray ion chamber photometer is located in the wheel of OSO-111. The ion chamber is filled with about one atmosphere of dry nitrogen gas and has a 5-mil thickness aluminum foil window; the efficiency of response as a function of wavelength for such an ion chamber has been published (ACTON et al., 1963). The detector responds principally to energy in the wavelength range 8-12 A, though there is also a low efficiency of response between 2-5 A. In OSO-111, the cadence of main- frame telemetry rate and wheel rotation rate results in roughly one word of solar soft X-ray data and two words of particle background data for each period of wheel rotation.
Data generated by the instrument are converted to energy fluxes E(8, 12) ergs cmF2 sec-I for the wavelength band 8-12 under the assumption that the radiation is distributed as in a black-body curve for 2 x lo6 K (KREPLIN, 1961). If the slope of the actual flux-distribution curve departs from the assumed one (e.g., NEUPERT et al., 1967; FRITZ er al., 1967; RUGGE and WALKER, 1967), the true energy flux may be approximately recovered by applying a correction factor (Figure I). Attempts are being made to utilize observations obtained during occultations of the sun behind earth's atmosphere near satellite dawn and twilight to determine spectral slopes for the flux distribution which may be appropriately applied to this experiment.
Two automatically-selected ranges of operation are incorporated into the instru- ment, one with a high dynamic sensitivity (4400/1) and one with a lower dynamic sensitivity f 12511) covering a total flux range 0 < E(8 , 12) < 0.12. The instrument has been saturated by the peak emission from great flares. An electrical calibra.tion occurs about every 6 min, and has shown that the instrumental energy scale has been

RICHARD G. TESKE
stable to about 1% since launch. The absolute calibration is probably within 6% of correct.
Reliability of operation may be verified by using the sun itself as a standard source. There exists a good statistical - and physical - relationship between the 2800 MHz solar flux and the soft X-ray flux (e.g., Figures 2 and 3). Comparison of these two fluxes for April 1967 and for August 1967 separately gave very closely the same relationship. Over that 5-month interval, at least, no changes in ion-chamber response occurred.
Correction for error in adopted I
Fig. 1. If the temperature T
true solar flux distribution with wavelength approximates a black-body curve for (abscissa), energy fluxes quoted in this paper must be multiplied by the value of
the ordinate.
2. Observations of the Non-Flaring Sun
The slow variation of soft X-ray flux with solar activity is shown in Figure 2 for the period March through August 1967. The index which is here used to characterize the quiet X-ray sun is the daily base-level, which is the lowest known flux reached during the day and is thus an index of the non-flaring sun. The X-ray base-levels are still preliminary, since complete 24-hour data have not yet been analyzed for the full six months.
As may be judged from Figure 2, the soft X-ray daily base-level correlates well with other indices of the general level of solar activity: the 2800 MHz daily solar flux (p = 0.82), a McMath-Hulbert Observatory plage index (p ==0.72) and the Ziirich sunspot number ( ~ ~ 0 . 7 8 ) . Hence, the major component of the soft X-radiation being observed arises in the active centers (cf. UNDERWOOD and MUNEY, 1967). The
2

THE SOLAR SOFT X-RAY COMPONENT
base-level enhancements of August 181 19 and of August 3013 1, apparently uncorrelated with the other solar indices, coincide with East and West limb passages of a major active center on the sun (h4cMath plage region 8942) and apparently show it to have been strongly limb-brightened in X-radiation.
in addition to its correlatiol~ with the 2800 MHz flux density, the soft X-ray background changes in a predictable way with radio flux density at other frequencies
I MARCH APRIL MAY JUNE JULY I AUGUST I
1967
Fig. 2. Soft X-ray base level fluxes (bottom) are compared with the 2800 MHz daily flux density, with a plage index which is the sum of products of plage areas by excess intensity in the C ~ I I K
line core, and with the Ziirich daiIy sunspot number (top).
(Figure 3). For a given variation AE(8, 12) of soft X-ray flux, the variation of radio flux density is greater at 2800 MHz, and is less at higher and lower frequencies. A linear fit seems adequate for the data so far examined. When the data for Figure 3 were assembled, no account was taken of possible center-limb effects.
Figure 4 contains data for four days which are representative of a range of solar activity conditions. I11 the figure, each point represents a 67-second time-average of

RICHARD G. TESKE
X-ray flux. Vertical bars represent satellite night, which is about 35 min long. Satellite day is about an hour long. Times which are given, so as to provide a time-scale, refer to the time of a satellite dawn. For May 11, May 5, and June 1, times are dis- continuous across satellite night, while for April 15 the time is continuous.
On May 11 quiet solar conditions prevailed: the daily 2800 MHz flux density of 104.0 was lowest since late December 1966 and no regions of significant activity were present on the visible solar hemisphere. These quiet conditions are reflected in a nearly flat, uniform X-ray flux-time curve. Arrows indicate the reported starting times for two subflares. We have associated the nearby X-ray enhancements with those flares.
In contrast, on May 5 the X-ray flux-time curve was constantly.disturbed, showing significant variations throughout the period of time depicted. On this date a flare-rich plage region (No. 8791) was located in the Southwestern quadrant of the disk, and
f O;O' ' l ~ k l d 0 ' "1do'~' lbo" " " 170 " I ' 120
' I ' 190 " I 280 " I ' 330 I
Flux Units
Fig. 3. Radio flux densities at 2800 MHz are those reported by Algonquin Radio Observatory (Ottawa) and at other frequencies are those reported by the Research Institute of Atmospherics at Nagoya University (Toyokawa). Radio and X-ray fluxes were observed simultaneously when no flares were occurring. The Toyokawa and Ottawa data represent samples during different months.
One flux unit equals W m-2 HZ-l.
the 2800 MHz daily flux density was 125.8. Arrows point to enhancements which we have associated with subflares reported during our X-ray observing hours on May 5.
The flux-time curve for April 15 again refers to moderately active solar conditions, when the 2800 MHz flux stood at 123.2. It is inserted in Figure 4 to demonstrate operation of the instrument as it switches from its range of higher dynamic sensitivity to its range of lower sensitivity. The major enhancement in the diagram accompanied a reported subflare. The second enhancement was not accompanied by a reported

THE SOLAR SOFT X-RAY COMPONENT
optical event. We have tentatively associated it with a small event in plage No. 8760 on the Northwest limb, not seen very clearly on our flare films. There occurred a weak brightening of the plage, and a surge-like, faint feature was seen projecting above the limb. Times of beginning, maximum and end of the event coincide in time with the X-ray increase.
Flux E(8,12) ergs crn-' sec-'
JUNE 1, 1967
0.0050 -
. I I I I I I I I-
1 3 ~ 4gm MAY 5, 1967
0.008
0.004
I MAY 11, 1967
-
- - - . - APRIL 15, 1967
- *\ < r., - \ _CY
_* -w- i
- I I I I I I I I 1 5 ~ 4 1 ~ 2oh 28'
Fig. 4. Representative data for four days in 1967.
At times of great solar activity, such as on June 1, the solar soft X-ray flux varies almost constantly through a great range of flux values. On that date the 2800 MHz flux was 169.7. McMath plage region No. 8831, then in the Northeast quadrant of the disk, was at its peak of flare activity on June 1 and June 2. Enhancements of

RICHARD G. TESKE
X-ray flux seen in our record for June I accompanied subflares and flares of import- ance 1. X-ray flux increases which accompanied subflares on June 1 were generally greater than those accompanying subflares on the other dates in Figure 4.
Flare associated X-ray enhancements will be discussed in the next section. Our data show that during times when no reportable optical events occur on the
sun, the solar soft X-ray flux may still undergo some variations. Sometimes these non-flare X-ray fluctuations can be identified with fluctuations in Ha plage intensity and with events at the limb, but often there is no clearly-associated optical Ha counterpart. At times of relatively high solar activity, as evidenced by a relatively high X-ray base-level or by a relatively high 2800 MHz flux, these non-flare X-ray fluctuations occur frequently, with an amplitude of w 10% or more of the average flux level, and on a time scale of tens of minutes. As solar activity moderates, the X-ray fluctuations also moderate as to their amplitude and frequency of occurrence. At the quietest times seen so far, the X-ray flux-time curve becomes smooth, showing only occasional fluctuations of very small amplitude.
3. Observations of Active Events
The relationship of soft X-ray flux enhancements to transient solar events observed optically and at radio wavelengths is being more clearly outlined by the OSO-I11 data. As regards flares, the times of beginning, maximum and ending of the X-ray events, as well as the total flux enhancement, appear to be statistically related to the timing of the optical event and to its importance classification. (See, however, the discussion by UNDERWOOD (I 968).)
We have attempted to determine the frequency with which X-radiation accompanies flares. The study has been limited to those hours during each day for which we have already reduced data.
In a sample of 57 subflares reported on a world-wide basis, 51 were definitely accompanied by X-rays. Of 47 subflares which were observed cinematographically at the McMath-Hulbert Observatory during March, April and May of 1967,44 were definitely accompanied by soft X-rays. The three 'failures' occurred when our X-ray detector was operating in its range of lower sensitivity. If the subflare sample is confined to those subflares observed cinematographically at McMath during hours when the X-ray detector was operating in its higher sensitivity range, then it appears that all the subflares were associated with X-ray emission, although at times it was very weak emission.
Only six flares of importance 1 were observed cinematographically at the McMath Hulbert Observatory between March 10 and June 30 and during hours for which we already have reduced data. Each was accompanied by a significant X-ray increase. Only 23 out of 26 importance-1 flares reported on a world-wide basis during hours for which we have reduced data from March 10 through May 31, had X-rays with them. None of the three 'failures' was reported by more than one observing station, how- ever, and they may be accidental reports.
6

THE SOLAR SOFT X-RAY COMPONENT
Hence, we are of the opinion that probably all flares are the site of emission of soft X-rays, although at times the emission is indeed minor (Figure 4). In order for a flare-associated enhancement to be recognizable in our data as reduced so far, its duration and amplitude must be such as to yield a time-integrated flux between 8 and 12 A of a few times ergs at the sun, assuming emission into 4n steradians and no photon scattering.
On the other hand, we have asked with what frequency visible flares or other active events accompany X-ray bursts. In a sample of 79 flux enhancements of all sizes recorded during March, April and May of 1967, only 57 bursts could be identified with flares reported on a world-wide basis and four with limb events such as surges leaving 18 of them, or 23% which could not be identified with reported optical phenomena. More than half of these remaining bursts occurred during European observing hours, where subflares are usually not reported as a matter of course. The average flux enhancement for the unidentified bursts was smaller than the average flux enhancement accompanying reported subflares in the same sample.
Time-lapse filtroheliographic flare patrol films made at the McMath-Hulbert Observatory have been examined in connection with some of the preliminary X-ray data. The total film examined is about equivalent to 35 days of full-time day-light flare patrol. Two relatively large X-ray bursts have been found which are not clearly associated with visible flare activity; both are somewhat smaller than the enhancement usually associated with flares of importance 1. One of these may have possibly been associated with activity behind the Southwest limb (July 11). The second took place near the time of a subflare on the disk, but is in very poor time-association with the Ha event (July 29).
Studies of individual flare events in connection with the X-ray data have permitted us to draw some tentative generalizations which will be investigated further as more data are reduced. Sources for the studies include the McMath-Hulbert flare patrol films, the ESSA Solar-Geophysical Data Bulletin, HA0 Preliminary Reports, flare and SID lists from McMath and Manila and radio data from Toyokawa, Hiraiso, Sagamore Hill and Ottawa.
X-ray enhancements associated with flares appear to be fair guides to flare importance in the sense that subflares tend to be associated with smaller enhancements than flares of importance 1, and so on, yet flares within a given importance class may give rise to a great range of X-ray flux.
Generally the Ha flare and the X-ray event begin at about the same time. The Ha intensity peak will most frequently precede or coincide with the X-ray maximum. In about 20% of flares the Ha maximum intensity follows the X-ray peak. In flares of importance 1 -' and 1 the Ha and X-ray events tend to end together, while in major flares the X-rays tend to outlast the visible event for a length of time which depends upon flare importance. Following the great flares of March 22 and May 23, 1967, the soft X-ray flux remained above pre-flare levels for at least five hours. Many exceptions to these generalizations have been observed. For example, sometimes the visible flare will begin two or three min before the X-ray flux begins to increase (Figure 5). Again,
7

RICHARD G. TESKE
following the importance-2 flare of May 6, 1967, the soft X-ray flux returned to its pre-flare level quite precisely and almost at once after the Aare was reported to have ended. Flare events occurring close to the sun's limb sometimes demonstrate the greatest departures from these generalizations, an effect which is probably connected with the well-known decreased visibility and shorter duration of flares near the limb.
Examples of X-ray bursts accompanying flares of importance 1 and 2 are shown in Figures 6 and 7, together with photometric Ha intensity curves (intensity expressed in arbitrary units) and the accompanying cm-A bursts. In both events a slow brighten- ing in both Ha and X-rays preceded the cm-A burst. At that time the flares abruptly brightened in Ha and X-rays.
E(8,12)
Fig. 5. Photometric Ha intensity curves for two subflares (lower) and the associated X-ray flux enhancements. The sun was occulted behind earth's atmosphere beginning at about 20h51m. The
first subflare (S20E22) was associated with a great ejection of dark material, the second (S25E50) was not.
,004
I
In the July 25, 1967 event (Figure 6), the importance-1 flare lasted until after 1 5h00m, although the Ha light curve has not been carried along that far. The subflare which began at 14h50m on that date did not affect the X-ray record probably because our instrument was then operating in its 'flare mode' of low dynamic sensitivity, in which the weak emission accompanying subflares is often not detected (cf. Figure 5, where operation was in the higher sensitivity mode).
While the Ha and X-ray curves often appear qualitatively similar, as in Figures 6 and 7, the structure of the soft X-ray burst is usually very different from the structure of the accompanying cm-2 burst. Typically, the maximum of the cm-A burst occurs some minutes prior to the X-ray maximum (=80%), more rarely the two maxima coincide within a minute (= 15%) and in still rarer cases a weak cm-A maximum occurs after the soft X-ray peak. Thus, the X-ray maximum tends to associate itself most clearly with the post-burst phase of the radio emission at centimeter wavelengths. On the other hand, there is a strong tendency for the soft X-rays to begin their increase earlier than the reported beginning of the cm-2 burst.
~ K Q APRIL 4, 1967
- @, O-0,
U X-RAYS
ex 0'@0@~ c @--e ee
@ @ 0 eQ 0
- a , @ S e Q @ Q O a
m @ ~ w e a @ 0
- I0
1.4
1.2
1 .o
,- • .,."\, - ./ SUB-FLARE
A' *I---.. . 1.. ./.,-\
. / * - . . . .. c.'. .. * . *
2 0 ~ 2 0 ~ 20 h30m 2 0 ~ 4 0 ~ 2 0 ~ 5 0 ~

THE SOLAR SOFT X-RAY COMPONENT
This latter effect is suggestive of physical conditions in the flare volume, to which the mechanism that gives rise to the soft X-radiation is more sensitive than is the mechanism that generates cm-.A radiation. In flares, an increase of 2800 MHz flux density by 5 flux units (5 x Wm-2 HZ-') is accompanied by an X-ray increment d E(8, 12) of 0.005 e r g ~ c m - ~ sec-I (Figure 8). The relationship in the slowly-varying component (Figure 3) is such that an increase of 70 flux units at 2800 MHz accompa- nies an increment in X-ray flux of AE(8, 12) of 0.005 e r g ~ c m - ~ sec-l. WHITE (1964) noted a similar sensitivity in the 2-8 flux.
ergs cm-2sec''
JULY 25, 1967 i
Fig. 6. The gap in the X-ray record (top) occurred during tape-recorder playback. Clouds inter- fered with the Ha Aare observations (center). The 8800 MHz record was reported
by Sagamore Hill (lower).
4. X-Ray Energy Emitted by Flares
Information concerning physical conditions in flares may be obtained through knowledge of the energy invested by flares in various parts of the electromagnetic spectrum and in particle and plasma emissions. Further, the total energy emitted by flares and the time scale for its release are constraints upon possible flare mechanisms. Thus, it is of interest to obtain from our data some indication of the total energy emitted as soft X-rays.
Because the spectral distribution of X-radiation is a function of time during a flare event (RUGGE and WALKER, 1967; GULHANE et al., 1963), time-integrals of flare
9

RICHARD G. TESKE
energy between 8 and 12 A are uncertain, and it is difficult to estimate at this time what the uncertainty is. It may not be overly pessimistic to estimate errors by up to a factor of 3 for ordinary flares, and by up to a factor of 5 for flares of importance 2 and 3, in the sense that the measured total energies may be too high.
Fig. flare
7. The importance-2b flare took place at S23W72. Ha intensities measured in two parts of the are shown on a logarithmic scale, as are the X-ray fluxes. The cm-L event is drawn schematically
for two frequencies according to author's interpretation of data in ESSA Solar-Geophysical Data Bulletin.
TABLE I Total Flare Energies E(8, 12)dt
Date No, of Mean Energy (1967) Importance Flares (ergs)
Range (ergs)
- 1 - 8 3 x 1027 7 x 1025 - 8 x 1027 - 1 8 6 x 1028 1 x 1028 - 2 x 1029
March 22 3 - 1 w 1030 (Total) - May 23 2,2, 2 ,2 4 > 5 x 1030 (Total) -
THE SOLAR SOFT X-RAY COMPONENT
Fig. 8. Relation of peak fluxes for associated X-ray and cm-A events. Filled circles: simple bursts with flares; crosses: complex bursts with flares; open circles: simple bursts without reported flares.
All values are as measured at the earth, uncorrected for earth's orbital eccentricity.
Integrated X-Ray Flux
E(8.12) ergs cm"
* 2800 MHz
X 3750 MHz
A 9400 MHz
Fig. 9. Relation of time-integrals of X-ray and cm-3, events. The 2800 MHz point at 5.5 x 10⁻²⁰ Joules nl-Wz-1 represents an event on July 11 which was not clearly flare-associated. The two 2800 MHz points towards lower left represent estimated upper limits based upon no report during
observing hours. All values as measured at earth, uncorrected for earth's orbital eccentricity.
11

RICHARD G. TESKE
We have assumed that the flare radiation is released into 47-c steradians and that none of the inwardly-directed photons are scattered. Time-integrals of energy meas- ured by us in a number of flares, and computed for the wavelength band 8-12 8, are summarized in Table I. The estimates in the table should be viewed as upper limits.
The energy radiated by flares at cm-wavelengths is related to the soft X-ray energy in the sense that large X-ray events tend to accompany large cm-/2 events and vice versa. Peak X-ray flux and peak cm-2 flux density in associated events are plotted in Figure 8. We note that the X-ray peak is still high enough at a radio flux density peak of 1 or 2 flux units to be clearly discernable in our data. It appears likely that
'even smaller X-ray bursts than those investigated may be accompanied by unreport- ably small radio bursts.
When time-integrals of energy at cm- and X-ray wavelengths are examined, we find again that there is a strong tendency for the greater X-ray events to accompany the greater radio events (Figure 9). Time-integrals of radio flux density in Figure 9 were obtained by multiplying tabulated mean fluxes by tabulated durations. ARNOLDY et al. (1967) have shown that a definite relation like that suggested by Figure 9 exists for the 10-50 kV X-rays. Further study of our data will be necessary before quantitative relations can be confidently established with them.
References
ACTON, L. W., CHUBB, T. A., KREPLIN, R. W., and MEEKINS, J. F.: 1963, J. Geophys. Res. 68, 3335. ARNOLDY, R. L., KANE, S. R., and WINCKLER, J. R.: 1967, Solar Phys. 2, 171. CULHANE, J. A., WILLMORE, A. P., POUNDS, K. A., and SANFORD, P. W.: 1963, Space Res. IV, 741. FRITZ, G., KREPLIN, R. W., MEEKINS, J. F., UNZICKER, A. E., and FRIEDMAN, H.: 1967, Astrophys. J.
148, L133. KREPLIN, R. W. : 1961, Ann. Geophvs. 17, 151. NEUPERT, W. M., GATES, W. J., SWARTZ, M., and YOUNG, R.: 1967, Astrophys. J. 149, L79. RUGGE, H. R, and WALKER, A. B. C., Jr.: 1967, Preprint (Submitted to Space Res. VIII). UNDERWOOD, J. H.: 1968, Science 159, 383. UNDERWOOD, J. H. and MUNEY, W. S.: 1967, Solar Phys. 1, 129. WHITE, W. A.: 1964, in AAS-NASA Symposiirm on the Physics of Solar Flares (ed. by W. Hess),
(NASA SP-SO), p. 13 1.

S O L A R S O F T X-RAYS AND S O L A R A C T I V I T Y
I : Relationships between Reported Flares and Radio Bursts, and X-Ray Bursts
R I C E A R D G. TESKE and ROGER 3. THOMAS
Dept. of Astronomy and the McMath-Hulbert Observatory, The University of' Michigan, Ann Arbor, Jlich., U.S.A.
(Received 15 January, 1969)
Abstract. Soft solar X-rays (8 d 16 12 A) were observed from OSO-111. An analysis of the X-ray enhancements associated with 165 solar flares revealed that there is a tendency for a weak soft X-ray enhancement to precede the cm-l burst and Ha flare. The peak soft X-ray flux follows the cm-12 peak by about 4 min, on the average. Additionally, it was found that flare-rich active centers tend to produce flares which are stronger X-ray and cm-l emitters than are flares which take place in flare- poor active centers.
1. Introduction
The association between optical, radio and X-ray emission from solar flares has been scrutinized recently by several observers. DONNELLY (1968) compared the timing of soft X-ray bursts with the onset and maximum of the Ha flare and with the accom- panying microwave burst, concluding that there is a tendency of the soft X-ray flux to be enhanced prior to the detectable onset of other phenomena. In his study, Donnelly used preliminary data furnished by several experimenters. NEUPERT (1968) compared flux curves at 1.87 Hi obtained on OSO-I11 with radio flux-density records (2695 and 2700 MHz) for three flare events. The maximum rate of solar line emission at 1.87 A (Fexxv?) occurred 4-10 min after the peak microwave emission, while little or no change in flux from lower stages of ionization (Fe~x-Fexv~) took place. The data are consistent with a model in which X-ray emission is produced by ther- malization of the fast electrons which give rise to the impulsive radio burst.
The McMath-Hulbert Observatory has on OSO-I11 a soft X-ray ion chamber. In this communication we propose to describe, for 165 flare events observed by that instrument between March 9 and December 31, 1967, the statistical relations between timing of Hcr, X-ray and cm-i2 events accompanying flare phenomena. The relation- ships which are found are discussed in terms of a schematic model for X-ray produc- tion prior to and during flares.
2. Observations
Soft solar X-rays between 8 and 12 A were observed from the wheel of the OSO-111 satellite with an ion chamber having an aluminium foil window a d nitrogen gas filling (see ACTON et al., 1963). X-ray fluxes, calculated assuming a black-body energy distribution at T=2 x 10⁶ K, were observed once each rotation of the wheel (1.7-sec period) and measured in discrete steps. Up to E(8, 12)~0.0044 ergs ~ r n - ~ sec-l, the interval between steps is about 0.000035 ergs ~ m - ~ sec-I. Above E(8, 1 2 ) ~
Solar Physics 8 (1969) 348-368; 0 D. Reidel Publishing Company, Dordrecht-Holland
13

SOLAR SOFT X-RAYS AND SOLAR ACTIVITY
~ ~ 0 . 0 0 4 4 ergs cm-" sec-I, the interval between steps is about 0.00095 ergs ~ r n - ~ sec-I. The instrument saturates at E(8,12) E 0.12 ergs sec-l. Graphs of X-ray flux vs, time, prepared by a computer, were made by time-averaging 6.8 sec of data for each point that was plotted, not for reasons of signal noise but purely for economy of presentation. There is no evidence that the process of time-averaging has caused loss of significant information. Because the flow of X-ray data is interrupted periodic- ally by satellite night and by tape-recorder playback, and its quality is sometimes degraded by particle interference, we often do not observe a complete X-ray flux curve for flares.
In the present investigation the data were organized around the Ha flare event as argument of entry, and cover the period March 9, 1967 through December 31, 1967. While we have examined flare-patrol films and in some instances have made intensity measures from them (Figure I), our work here is concerned primarily with com- paring our data to reports of optical and radio events. The discusssion of photometric flare light curves is left to a subsequent paper.
A 1 APRIL 11, 1967 APRIL 11, 1967
Fig. 1. - (a) Importance-lb flare (N22 W24) of April 11, 1967. Abscissa: Universal Time in hours and minutes. The solid curves are X-ray fluxes. Note change of ordinate scale at 13h26m. Left-most ordinate scale is for high-sensitivity operation (prior to 13h26m) and the additional ordinate scale is for low-sensitivity operation. Units are E(8, 12) ergs ~ m - ~ sec-l, at earth, in band~pass 8-12 A. Dots are intensity measures made in 4 parts of the region on Ha filtroheliographic flare patrol films, expressed in log~ol/lo (right ordinate scale). l o is the intensity of the Ha image at the center of the disk. Only the initial flare phases were studied photometrically. Satellite sunset occurs at 13h53m. - (b) Non-flare brightening in the same region (N22 W24) on April 11, 1967. X-ray detector operation in high-sensitivity range only. Parts B and C of the region brightened perceptably beginning at about
16h42m. Satellite sunset at 17h03n1.

RICHARD G. TESKE AND ROGER J . THOMAS
We have attempted to limit the flare sample to single flares of importance 1 or greater. Since not all flare reports are equally reliable (DODSON and HEDEMAN, 1968), we have selected only those flares observed at 3 or more stations which were called importance 1 or greater in the Quarterly Bulletif? of Solar Activity (QB). Additionally, when it appeared that the X-ray or radio data might be confused by the occurrence of two or more flares close together in time, the events were ignored. After this culling process we are left with 165 events for which we have at least partial X-ray information.
Radio-burst reports have been taken from the E S S A Solar-Geoplzysical Data Bulletin (SGDB) and from the monthly compilations by Toyokawa and Hiraiso. As a result there is a 6-hour gap in the Universal Time distribution of our radio data, and there are fewer flares for which reports of related radio bursts were available than there are flares for which X-ray data were available.
The time-accuracy of the graphs of X-ray flux vs. time is limited only by the time- averaging mentioned earlier. In carrying out this investigation, we have read off relevant times to the nearest half-minute, since a greater precision is not warranted by the comparisons that were made.
3. Discussion of the Observations
A. X-RAY ENHANCEMENT AMPLITUDE : DEPENDENCE UPON FLARE IMPORTANCE
AND UPON CM-WAVE RADIO BURST AMPLITUDE
Several observers have previously noted the wide variation of amplitude of X-ray enhancement associated with flares of a given importance (e.g. UNDERWOOD, 1968) which we have found in our data. In general there is a loose relationship of X-ray amplitude with flare importance and brilliance, but there also is a good deal of overlap of this relationship between the different flare categories. Our data additionally point towards a dependence of flux enhancement upon the flare-richness of regions in which flares take place.
In Figure 2 we have plotted the amplitude of soft X-ray bursts for flares of differ- ent importance and brilliance categories. There is a further subdivision of the material into flares occurring in regions which were prolific flare-producers and those which occurred in relatively inactive regions. There is a clear tendency for the X-ray ampli- tude to increase from low values for faint importance-1 flares to higher values for flares of greater brilliance and importance. Among all importance-1 flares, though, that amplitude spans more than 2 orders of magnitude. Among all importance-2 flares, the span of amplitudes is greater than a factor of 10.
While one of us (TESKE, 1969) previously claimed that all flares of importance 2 1, and probably all subflares as well, are accompanied by at least a small soft X-ray enhancement, our flare sample here contains one event (the lowest data point in Figure 2) which apparently was not accompanied by soft X-rays. The flare was observed by three stations at N21 E80 on June 9, 1967, and was called importance 1 by two of them. It is of interest that the plage region in which it occurred (number 8843) was an old region which had had a small spot group in it for two days during

SOLAR SOFT X-RAYS AND SOLAR ACTIVITY
1 2 3 1 2 3 Importance
m
$ % O
0 . X '
;o
. O
0
' 8 n; o . . .
X
X .
0
. Non-prolific
a ' f n b ' f
Fig. 2. Soft X-ray flux enhancements observed in flares of importance > 1, divided according to flare importance and brilliance and further divided as to whether the flares occurred,
in our estimation, in flare-rich or flare-poor active centers.
its previous disk passage, and had no spots in it during the disk passage when the flare took place. Another importance-ln flare in the same region on June 11 was however accompanied by a detectable but small increase in soft X-rays (AE(~, 12)= =O.OOl 1).
In preparing Figure 2, we designated plage regions 8740, 8818, 8905, 8942, 9034 and 91 15 as 'prolific' flare-producers, and plotted X-ray amplitudes for flares occur- ring in them separately from data which refer to 'non-prolific' regions. (Plage regions 8791, 8907, 9004, 9047 and 9128 were left out of both categories, being considered as moderately flare-rich regions.) Table I summarizes our results for flares of im- portance 1. This separation of data sugg;sts that flares of importance 1 occurring in flare-rich regions tend to be better soft X-ray emitters than those flares seen to occur in relatively inactive regions. A similar relationship could probably be obtained if we used, for example, the radio brightness of regions as obtained by the Stanford observers, or some other suitable index for the general level of activity in individual regions, as independent variable. In particular, flare-rich regions are generally those with strong and complex magnetic fields.
. *
:
regions
n b ' f n b'

RICHARD 43. TESKE AND ROGER 3. THOMAS
TABLE P
Soft X-ray burst amplitude dependence upon Aare-richness of plage regions, all flares of importaIlCe 1 only
- - -
Percentage of flares investigated
X-ray amplitude dE(8, 12) AE< 0.001 0.001 < AE< 0.01 BE 2 0.01
Prolific regions Non-prolific regions
Median X-ray burst amplitude, all flares of imp 1
Prolific regions : Median AE = 0.017 ergs ~ m - ~ sec-I Non-prolific regions: Median AE = 0.0074 ergs ~ r n - ~ sec-I
Median X-ray burst amplitude, imp In only
Prolific regions : Median AE = 0.01 ergs ~ r n - ~ sec-l Non-prolific regions : Median AE = 0.0085 ergs sec-l
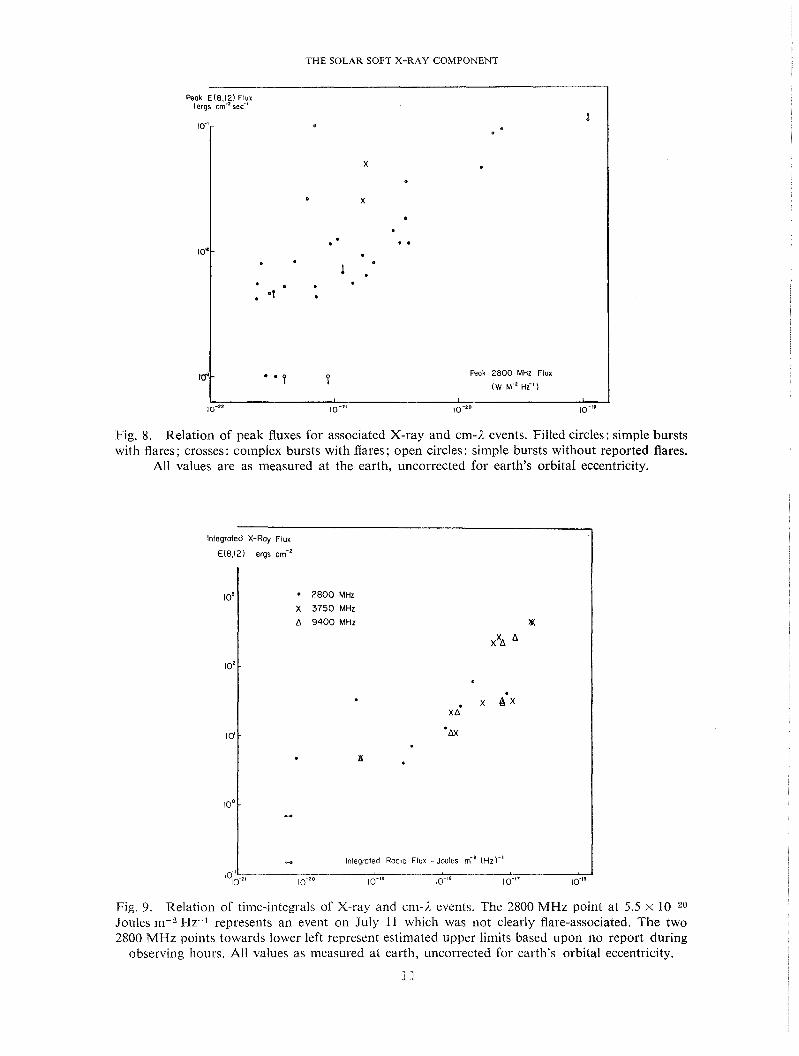
The great range of amplitude of X-ray bursts for flares of a given importance is qualitatively like the range found by DODSON et al. (1954) for the amplitudes of 2800 MHz bursts associated with Ha flares. We have previously compared 2800 MHz burst amplitude with soft X-ray burst amplitude (TESKE, 1969) and have shown that there is a strong tendency for the two to be correlated. There is, however, a large and real dispersion. We have in Figure 3 again compared 2800 MHz burst amplitude with X-ray burst amplitude, this time using only flares from the sample under study here. Distinguishing now between events occurring in 'prolific' and 'non-prolific' regions, we find that flares in 'non-prolific' regions are also poor emitters at 10.7 cm (Figure 3).
In examining flare reports in connection with our X-ray data, we have focussed upon start-times and times of maxima. Designation of these times by the individual flare observers is difficult at best; the reported times are often matters of the observer's judgment (DODSON and HEDEMAN, 1964). In the case of the X-ray flux curves, times of start and maximum may be designated more objectively.
We have selected as starting time of the X-ray event that time when the flux curve first changes slope. Subsequent to this time there may be a monotonic flux increase or there may be fl~actuations, during which the flux remains always above the pre-burst flux level. Since we are dealing with single flare events, however, the initial fluctuations, when they occur, are considered to be a part of a singl~omprehensive event (see Section 4A). Ending times are often as dificult to judge for X-ray events as for Ha events. We have therefore not studied them quantitatively at this time, but merely state that it is our i-mpression that, for flares of importance 2 1, the X-rays tend to outlast the reported end-time of a Bare by a length of time dependent upon flare importance and brilliance (Tsse~, 1969).
SOLAR SOFT X-RAYS AND SOLAR ACTIVITY
Fig. 3. Comparison for individual flares of associated enhancements of soft X-ray flux and 2800 MHz flux. Large dots and circled dots identify events in flare-rich and flare-poor regions.
1. Starting Times
At our disposal are starting times for Ha flares listed in both the Quarterly Bulletin and Solar-Geophysical Data Bulletin. We have, however, selected from the world-wide reports the earliest starting time recorded by a cinematographic or photographic station. Often a rapid initiation of the X-ray event is reflected by a small dispersion in Ha start-times as reported by the various observatories, while a slow X-ray rise is reflected by a wide dispersion of reported Ha start-times. The latter indicates an uncertainty among stations caused by a slow rise in Ha brightness. Thus the earliest reliable optical report is preferred in making the comparison attempted here, since something must have been taking place at that time on the sun. We cannot, of course, take into account possible clock errors at the various observing stations.
In Figure 4 we have diagrammed the start-time differences for flares within 60" (heliocentric) of the disk center, that is, for p = cos 0 > 0.5, and for flares beyond 60" from the disk center (p=cos0 <0.5). The diagram shows that: (i) there is probably a center-limb effect and (ii) the overall results depend strongly upon the sensitivity of the detector. Table I1 summarizes the information for starting times. In the table we also give confidence limits computed from a Fisher 't' test. Where too few data points have not permitted a reasonable application of the 't' test, no information is given.

RICHARD G. TESKE AND ROGER J. THOMAS
High Range @ O .
p> 0.5 ........I . e
r , I I 1 9 6
e o . B e .
LOW Range e eeee* ee e O 0-081e .B .OQ
p > 0.5 . . . ~(WWI..U .....me*.
I - I I I 1 6 +
Low Range e . . p < 0.5 o e e . . . . . . . e
I I I I 1 b
High Range p<0.5 ... e
I I I I a 1 -30 - 20 -1 0 0 10 20
9 (Start of X-ray event) minus (Star1 of Ha f l a re ) , minutes
Fig. 4. Conlparison of reported starting times of H a flares and associated soft X-ray enhancements. Each dot is a single event. Relative times are in the sense that negative indicates early X-rays. Arrows point to mean values. Data are divided according to instrumental sensitivity range at beginning of
event and according to ,v = cosQ.
TABLE I1
Mean differences between H a and soft X-ray starting times
Sensitivity Confidence that of cos e > 0.5 case< 0.5 center-limb dif-
detector ferences are real
Low sensitivity + 1.5 min - 0.25 min
(X-rays are late) (X-rays are early)
High sensitivity - 1.3 min - 10.3 min
(X-rays are early) (X-rays are early)
Confidence that sensitivity differences 95 % - are real
-
When our detector was operating in its mode of low sensitivity, where on the average an X-ray rise of AE=0.00048 ergs ~ m - ~ sec-I is needed before it can be detected as an increase, the X-ray start tends to come after the Ha start-time. How- ever, when the detector was operating in its high sensitivity range, in which an in- crease only 1125th as great may be discerned, there appears to be a definite tendency for the X-ray rise to precede the earliest reported cinematographic or photographic Ha start-time, especially towards the solar limb. Usually the early rise of X-rays is very slow, with an abrupt increase in rate of rise at about the reported time of start of the Ha flare, or shortly thereafter. Figures 5 , 6 and 7 reproduce typical flux-curves for three events. The center-limb effect found here is one in which the X-ray start-time relative to the I-Ia start-time becomes even earlier for flares near the limb.

SOLAR SOFT X-RAYS AND SOLAR ACTIVITY
Fig. 5. Fig. 6.
Fig. 5. A representative soft X-ray flux curve for an importance-ln flare (N29 E64) on June 17, 1967. Note scale change at 21h25m. For explanation of scales, see Figure l a caption. This flare has
early X-rays. Satellite sunrise: 21h00m. Fig. 6. A representative soft X-ray flux curve for an importance-lf flare (N29 E44) on July 25, 1967. Only two stations were reported by QB to have observed the flare, ahd this event is therefore not in our catalogue. Low-sensitivity operation only. X-rays appear to be late. For explanation of
scales, see Figure l a caption. Satellite sunrise at beginning of record.
Fig. 7'. A representative soft X-ray flux curve for an importance-lb flare (N28 E39) on July 25, 1967. Soft X-rays show early increase at 14h18m. Low-sensitivity operation only. Sunrise and sunset
at beginning and end of record.

RICHARD G. TESKE AND ROGER J. THOMAS
Because the early appearance of X-rays has great importance in understanding the flare event as a whole, and because their early appearance may be of considerable interest in possible flare-warning devices in future space applications, we have taken care to assure ourselves of the reality of our observations. All cases where other earlier reported flares might have caused confusion have been studied and eliminated from the material used. We reserve a detailed discussion for Section 4.
r"
2. Times of Maxima
Only rarely does a flare of importance 2 1 fail to carry our detector into its range of low sensitivity, so we need not distinguish sensitivity range in discussing maximum times. Figure 8 presents the time-differences found. In preparing Figure 8, reported times of maxima from the QB were used, after elimination of events with double maxima and of nearly simultaneous events overlapping in time. Table 111 summarizes the work. There appears to be no strong reason to believe that a center-limb effect exists. On the average, the X-ray flux maximum lags the Ha intensity maximum by about 3 min.
Ha flares occurring near the limb are apparently of shorter duration and usually are less easily visible than are flares which occur towards disk center (DODSON et al., 1956), an effect probably caused by absorption of visible radiation in the chromo- sphere. Because the flare-associated X-radiation is perhaps less affected by absorption
(X-roy maximum flux) mlnus (Ha maximum Intensity), minutes
Fig. 8. Comparison of reported times of maxima of Ha flares and associated soft X-ray fluxes. Each dot is a single event. Relative times are in the sense that negative indicates early X-rays. Arrows
point to mean values.
TABLE I11
Mean differences between Ha and soft X-ray maximum times
Confidence that center- to-limb difference is real
+ 2.4 min + 3.6 min (X-rays are late) (X-rays are late)
SOLAR SOFT X-RAYS AND SOLAR ACTIVITY
processes (however, cf, WARWICK and WOOD, 1959) we seem to find that the X-ray bursts begin anomalously early towards the limb, while it is likely that the start of the flare is just hard to see. However, the relative times of maxima of Ha and X-rays for p<0.5 and for ~ ~ 0 . 5 suggest that the deduced maximum time of the Ha event near the limb is not markedly affected by the process that lessens its visibility.
C . TIME-RELATIONS BETWEEN CM-/2 AND X-RAY BURSTS
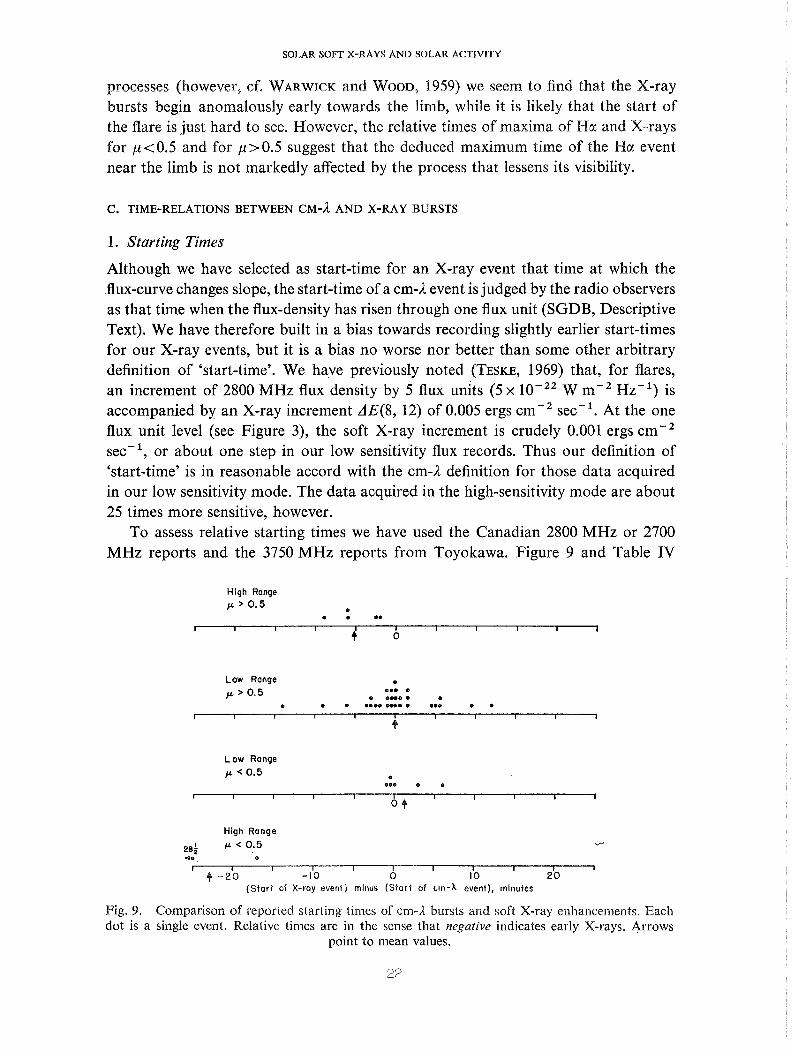
1. Starting Times
Although we have selected as start-time for an X-ray event that time at which the flux-curve changes slope, the start-time of a cm-/2 event is judged by the radio observers as that time when the flux-density has risen through one flux unit (SGDB, Descriptive Text). We have therefore built in a bias towards recording slightly earlier start-times for our X-ray events, but it is a bias no worse nor better than some other arbitrary definition of 'start-time'. We have previously noted (TESKE, 1969) that, for flares, an increment of 2800 MHz flux density by 5 flux units (5 x W m-2 HZ-') is accompanied by an X-ray increment AE(8, 12) of 0.005 ergs cm-2 sec-l. At the one flux unit level (see Figure 3)' the soft X-ray increment is crudely 0.001 ergs ~ r n - ~ sec-l, or about one step in our low sensitivity flux records. Thus our definition of 'start-time' is in reasonable accord with the cm-/2 definition for those data acquired in our low sensitivity mode. The data acquired in the high-sensitivity mode are about 25 times more sensitive, however.
To assess relative starting times we have used the Canadian 2800 MHz or 2700 MHz reports and the 3750 MHz reports from Toyokawa. Figure 9 and Table IV
High Range p > 0 . 5 .
Low Range 0
p > 0.5 a*. . 0 ewe. 0
a e 0 e o n m e e a.0 0 .
I I I 1 I I 1 I I I 1 t
Low Ronge p < 0 . 5
High Range
28f p < 0.5 V
e. * I I I I I I I I I I I
Q - 2 0 -10 0 10 2 0 (Start of X-ray event) minus ( S t a r t of cm-A event), minutes
Fig. 9. Comparison of reported starting tiines of cm-A bursts and soft X-ray enhancements. Each dot is a single event. Relative times are in the sense that negative indicates early X-rays. Arrows
point to mean values.

RICHARD 6. TESKE AND ROGER J . THOMAS
TABLE IV
Mean differences between cm-1- and soft X-ray start times
Seilsilivity of detector cos 0 2 0.5
Confidence that center- cos8< 0.5 limb differences are real
Low sensitivity A
+ 1.2 min (X-rays are late)
High sensitivity - 5.1 min - 22.8 iuin
(X-rays are early) (X-rays are early)
Confidence that sensiti- 96 % -
vity differences are real
show that, when we were recording in low-sensitivity mode, the X-ray burst and cm-A burst on the average began within a minute of one another, and that there is no clear center-limb effect. Some X-ray bursts in low range in fact began quite late relative to the cm-A burst. On the other hand, data acquired in the high-sensitivity mode give a different result: without exception the X-ray increase begins many minutes earlier than the cm-A burst. We have no confidence in the apparent center-limb difference for our higher sensitivity range, since for the sample under investigation there are only two elements in the limb sub-set.
The strong tendency for a weak soft X-ray enhancement to precede cm-A bursts is undoubtedly at least partly caused by the relative sensitivities of the instruments employed in detecting the radiation. The tendency is also indicative of physical conditions in the flare volume, to which the mechanism that gives rise to the soft X-radiation is more sensitive than is the mechanism that generates cm-A radiation (see Section 4 and cf. WHITE, 1964). In those cases where an early and slow rise of soft X-rays is seen, the rate of X-ray rise usually increases near the reported starting time of the cm-A burst.
2. Times of Maxima
As Figure 10 and Table V show, the X-ray maximum almost invariably follows the cm-A maximum, by 3-6 min on the average, and there is no clear center-limb effect. Thus, the radio maximum occurs on the rising branch of the soft X-ray flux curve. On the other hand, hard X-rays reach their maximum coincidentally with the cm-A maximum (ARNOLDY et al., 1967).
There are two highly discordant limb data points in Figure 10, designating cases where the X-ray maximum preceded the cm-A burst maximum by 34 min, and followed it by 31 min. Both events took place within 10 hours of one another and were both associated with events in plage region 8942 which was then on the East limb. We are inclined to consider them as being related to complex events which may have taken place partly behind the limb, since during the preceding 24 hours at least two signifi- cant X-ray events occurred in association with flares apparently going on behind the limb. Nevertheless we have not excluded the former two events from the valid data.

SOLAR SOFT X-RAYS AND SOLAR ACTIVITY
(X-roy moximum) minus (Cm-A rnoximum), minutes
Fig. 10. Comparison of reported maxima of cm-A bursts and soft X-ray fluxes. Each dot is a single event. Relative times are in the sense that negative indicates early X-rays. Arrows point to mean values.
TABLE V
Mean differences between cm-A and soft X-ray maximum times
Confidence that center- to-limb difference is real
f3 .1 min + 5.6 min (X-rays are late) (X-rays are late)
In summary we find a marked tendency for a weak enhancement of soft X-radia- tion to precede the reported starting times of cm-,I bursts which are associated with flares. The soft X-ray maximum in flare events almost invariably follows the cm-A maximum by 3-6 min. There is a similar, marked relationship between Ha maximum intensity and soft X-ray maximum flux, with the X-ray maximum following the reported Ha maximum by about 2-4 min. On the other hand, there is a considerable dispersion in the relative starting times of Ha flare and soft X-rays, though a definite tendency towards an early enhancement of soft X-rays is also found. The dispersion in the relative X-ray/Ha starting times is not improved by making comparisons with, for example, the starting times for flares adopted in the Quarterly Bulletin.
DODSON et al. (1954) have examined the relationships between Ha flare and 2800 MHz timing. They found that the two events tend to start together (on the average, the Ha flare preceded the radio event by 0.6 min), but that the radio burst reached maximum, on the average, 3.4 min before the Ha maximum intensity. We can deduce from the flare sample studied by us that the cm-,I flux reaches maximum roughly 1-2 min before flare maximum, in reasonable agreement with their result:
The distributions of time-differences both for the X-ray/cm-A and X-ray/H&: maxima are significantly non-random at the 99% confidence level. This effect is introduced by the presence in our sample of a very few events in which the X-rays reached maximum very late.

RICHARD G. TESKE AND ROGER J . THOMAS
There appears to be no dependence of the relative timing of soft X-rays, Ha and cm-A emission upon the spectrum of the radio burst event. Reported maximum radio flux densities were plotted for each event to produce our version of a burst spectrum. The events were sorted among seven categories of spectrum shape and the relative timing investigated for each category. No clear relationship between burst spectrum and 'earliness' or 'lateness' of X-rays emerged. Our negative results are consistent with the conclusions of TAKAKURA (1967)' who found that the spectrum characteris- tics of impuEive microwave bursts do not divide them into distinctly different sub- groups.
4. Analysis
A. STARTING TIMES : THE PREDECESSOR EVENT
The foregoing discussion of our data points out that usually a weak enhancement of soft X-rays precedes the start of the cm-2 event by some minutes. Apparently the soft X-rays also tend to precede the start of the Ha flare.
In Figure l a we illustrate the X-ray flux curve and the Ha intensity curves for the early phases of an importance-1 flare on April 11, 1968. In this event, which is rep- resentative of our sample of events having early soft X-ray fluxes, the X-ray rise began about 15 min prior to the first Ha brightening. There is no photometric evi- dence in Figurz l a that the region brightened significantly in Ha prior to the onset of the flare (which began in the position labelled D), although our curves show a minimum in Ha surface brightness just prior to 1315 UT. Photometric examination of other active centers on the disk at this time also gives no evidence of an Ha en- hancement which may have been associated with the soft X-ray flux. We have there- fore concluded that the X-rays which were observed prior to the flare depicted were generated by physical processes taking place in the vicinity of the plage.
While cm-wave activity was recorded near the time of the X-ray event, there does not appear to be a clear relationship like that found in many other events. A weak 2700 MHz burst was reported by Pennsylvania beginning at 1310.5 UT and lasting for 5.2 min. A series of weak 2700 MHz bursts was reported to have followed, the next beginning at 1323.6, after the small X-ray peak but at the time of the strong rise in X-rays. At 2800 MHz, a burst was recorded to have started at 1335, in good time- association with the optical flare.
In contradistinction to the lack of clear evidence for Ha brightening with the soft X-ray emission after 131 5, a subtle brightening of the same plage region did accom- pany an X-ray event 3 hours later (Figure lb). Too meager to be reported as a flare, the Ha intensity in two posititions (B and C) increased by only about 4% of the intensity of the Ha continuum measured at disk center. Although the soft X-ray amplitude of this event is equivalent to the amplitude of the small peak between 1320.5 and 1323.5 (Figure la) no certain Ha increase accompanied the small X-ray peak in the earlier event.
It has previously been pointed out (GREGORY and MREPLIN, 1967; TESKE, 1967) that fluctuations of the solar soft X-ray flux occur frequently, often accompanying
SOLAR SOFT X-RAYS AND SOLAR ACTIVITY
fluctuations in the Ha brightness of parts of plages. Of the flare events which we believe were accompanied by early soft X-rays, two were available for study on our flare patrol films. One is illustrated in Figure la. The other is an importance-lb flare on July 25 (Figure 7). In both cases we were unable to find other plages on the disk which showed Ha brightening, and so have ascribed the X-ray origin to a pre-flare event. While our full sample of early X-ray enhancements might be partly contaminat- ed by the effects of X-ray background fluctuations not associated with the pre-flare region, a study of the frequency of these fluctuations for the period of 10 March 1967 to 18 April 1967 shows that less than 20% of our flare X-ray enhancement start- times will be in error by 1 min or more because of confusion with the background variations. Thus the majority of the early events really represent a class of phenom- enon in which soft X-ray emission precedes the optical brightening.
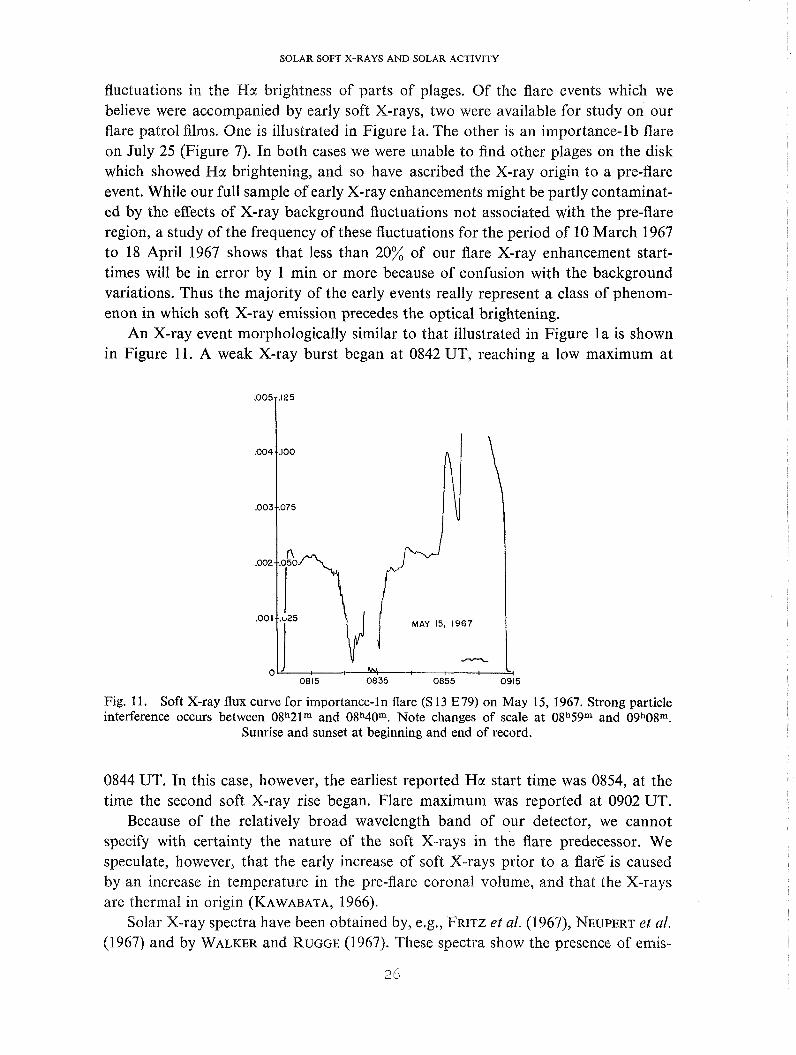
An X-ray event morphologically similar to that illustrated in Figure l a is shown in Figure 11. A weak X-ray burst began at 0842 UT, reaching a low maximum at
Fig. 11. Soft X-ray flux curve for importance-ln flare (S 13 E79) on May 15, 1967. Strong particle interference occurs between 0gh21rn and 08h40rn. Note changes of scale at 08h59m and 09h08rn.
Sunrise and sunset at beginning and end of record.
0844 UT. In this case, however, the earliest reported Ha start time was 0854, at the time the second soft X-ray rise began. Flare maximum was reported at 0902 UT.
Because of the relatively broad wavelength band of our detector, we cannot specify with certainty the nature of the soft X-rays in the flare predecessor. We speculate, however, that the early increase of soft X-rays prior to a flarE is caused by an increase in temperature in the pre-flare coronal volume, and that the X-rays are thermal in origin (MAWABATA, 1966),
Solar X-ray spectra have been obtained by, e.g., FRITZ et al. (1967), NEUPERT et al. (1967) and by WALKER and RUGGE (1967). These spectra show the presence of emis-

RICHARD G. TESKE AND ROGER J . THOMAS
sion lines of helium-like and hydrogen-like ions of Nerx, Nex, Nax, Naxr, M g x ~ and Mgx~r, among others. Table VI lists the wavelengths of some of the salient lines of these ions which are observed to lie within our band-pass. No recombination continua have been identified by these observers.
A TABLE VI Some emission lines observed in the solar X-ray spectrum
Identification wavelength (A)
Nax
Because the efficiency of our detector increases rapidly towards shorter wavelengths, down to 7.94 A, an increase in line emission from these ions and from recombination continua will be more readily detected by our higher efficiency at shorter wavelengths. However, because of the manner in which the data are reduced (a black-body energy distribution is assumed), the measured flux increase may not accurately reflect the true flux increase.
Ionization equilibrium calculations have been carried out for these ions. The neglect of dielectronic recombination in the calculations is not serious, in this case, below T,- lo7 K, and we find that the hydrogen-like ions of Mg, Na, Ne become important constituents at temperatures between 3.5 x lo6-5 x 10⁶ K.
The weak soft X-ray increase which precedes the reported cm-R event in some flares and the relationship between times of maxima are consistent with a schematic modeI which may be developed as follows.
During the initial X-ray rise, the cm-wave flux densities may remain sensibly unchanged in a typical event (Figure 9). Following ACTON (1968) we assume that the pre-flare coronal condensation is optically thin to cm-R radiation, and so write for the

SOLAR SOFT X-RAYS AND SOLAR ACTIVITY
radio flux density (MUNDU, 1965)
where A, =area of solar disk and dV= A ds, in which A =area of burst. The energy being detected in our band-pass originates as line emission (Table VI)
and in the continuum. The continuum radiation is predominantly recombination emission at temperatures near 2 x lo6 K (MANDEL'STAM, 1965). In our band-pass it arises principally from recombination of OVIII, Ne~x , Nex, Nax and several inter- mediate stages of Fe ionization. These free-bound emissions may be the primary contributor. FRITZ et al. (1967) observed that the continuum/line ratio was 2 in the wavelength interval 10-20 A.
In the recombination continuum of an ion in the ith stage of ionization, the volume emission coefficient integrated over wavelength (ELWERT, 1954) is pro- portional to
N T - 1 1 2 J ' F B ~ ~ z , ~ + ~ e e ( 3
The volume emission coefficient in an emission line (e.g. POTTASCH, 1964; EVANS and POUNDS, 1968) is proportional to
We may estimate NZ, , and Nz, i+l from formulae given by POTTASCH (1963), providing dielectronic recombination may be ignored and that Ne 5 loi0 ~ m - ~ . If only 2 stages of ionization dominate (the ith and (i- 1)th):
Nz, i
Nz, total
where
Here, the symbols are as defined by Pottasch. At temperatures above Te-2 x lo6 K, and for the ions of interest, 4 decreases
with increasing temperature. Line emission from hydrogenic ions, and from the continua of helium-like and hydrogen-like ions, therefore increases with Te.
We assume that the flare predecessor event occurs in a single homogeneous volume V, for purposes of illustration. The X-ray flux from the region, which is ob- served to increase, is given by .,-

RICHARD G . TESKE AND ROGER J. THOMAS
At the same time the radio flux-density remains essentially constant:
Thus an initial increase in temperature in the volume is required, although expression (8) requires other, simultaneous changes.
The conditions imposed by expression (8) are restrictive, but physical changes taking pla& prior to the flare need only follow (8) approximately. In particular we note the exponential dependence of E upon Te for the line emission, while S depends upon Te-'I2. A simple adiabatic compression of a spherical volume of radius r re- quires (y = 513) Teocr-' and Socr - 2 , possibly ruling out such a compression as the flare predecessor event.
Detailed theoretical calculations of the solar X-ray flux have been carried out by MANDEL~~TAM (1965). His results show that in the temperature range 2 x 1 0 6 ~ T e ~ 5 3 x lo6 K an increase of about 10% in Te approximately doubles the soft X-ray flux between 8-12 A in both the lines and continuum. Although FRITZ et al. (1967) observed a continuum/line ratio significantly different from that predicted by Mandel' Htam's calculations, it is certainly likely that the trend of flux increase with tempera- ture predicted by him is essentially correct.
The X-ray flux increment in the flare predecessor, when it occurs, is usually a fractional part of the total background soft X-ray flux, that is, the solar X-ray flux is not doubled. Because the radiation arises from a single active center, it may rep- resent an increase in soft X-radiation from that region of a factor of 2 or more. For the April 11, 1967 event, we estimate an increase of some 200-300% from the pre-flare region alone. According to Mandel's"tamYs calculations, such an increase can be attributed to a temperature increase of from 200000-400000 K. This in- crement in T, in the active center leads to a decrease in 2800 MHz radiation from the whole sun of a few tenths of a flux unit, if we assume no other changes take place.
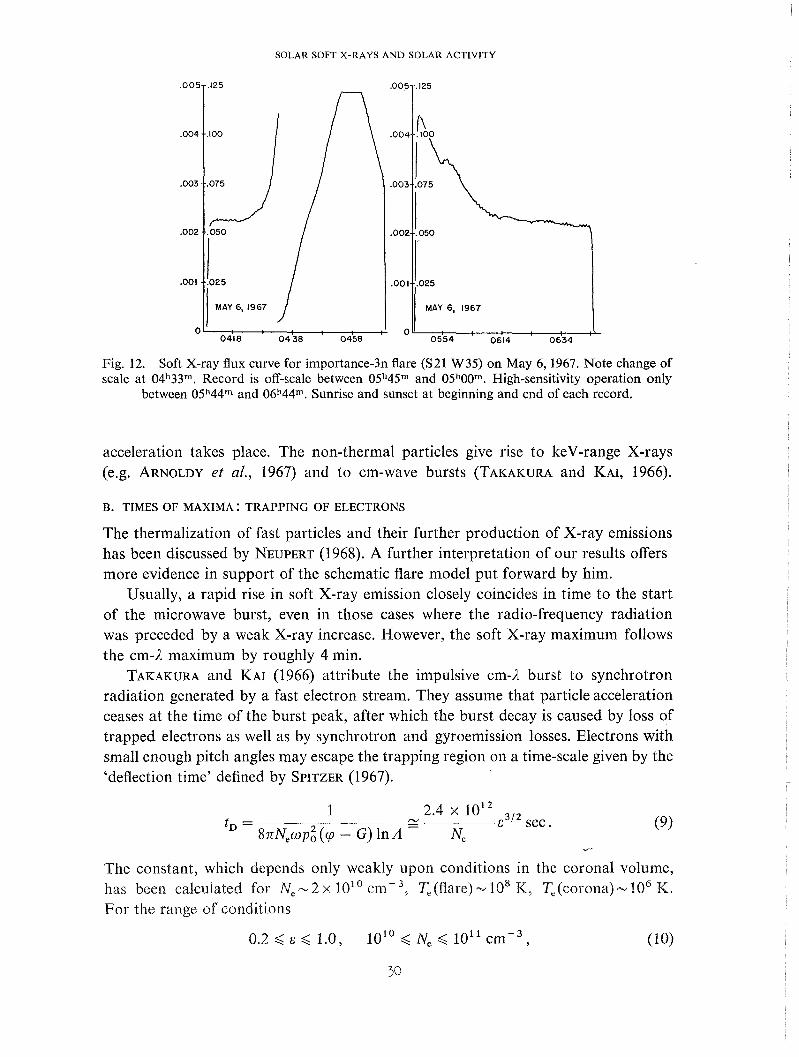
That the temperature increase during the flare predecessor event is not large is attested by other observations from OSO-III. NEUPERT (1968) obtained a flux curve at 1.87 A (Fexxv?) in the flare of July 25, 1967 (see our Figure 7). Our soft X-ray flux began a weak rise 9 min prior to the first enhancement at 1.87 A. NEUPERT et al. (1969) also published flux curves at 1.87 A and at 11.8 (Fexxn?) for the importance-3 flare of May 6, 1967 (see our Figure 12). Our soft X-ray flux began a weak increase 12 min prior to the first increase in the Fexx11 line, which rose in intensity nearly simultaneously with the Fexxv line. Both these lines require rather more extreme excitation conditions than do the lines of Table VI. On the other hand, the Fexx11 line does overlie the OVIII recombination continuum, which is expected to be strongest at Te-2.5 x 1 0 6 4 x lo6 K.
If our interpretation of the flare predecessor radiation is correct, an initial rise in temperature of no more than 2 to 4 x lo5 19 occurs in the pre-flare coronal volume. Following this initial thermal stage, which may be abrupt in many events and is protracted through minutes in the class of phenomenon being described here, particle
SOLAR SOFT X-RAYS AND SOLAR ACTIVITY
Fig. 12. Soft X-ray flux curve for importance-3n flare (S21 W35) on May 6,1967. Note change of scale at 04h33m. Record is off-scale between 05h45m and 05h00m. High-sensitivity operation only
between 05h44m and 06"44*. Sunrise and sunset at beginning and end of each record.
acceleration takes place. The non-thermal particles give rise to keV-range X-rays (e.g. ARNOLDY et al., 1967) and to cm-wave bursts (TAKAKURA and KAI, 1966).
B. TIMES OF MAXIMA: TRAPPING OF ELECTRONS
The thermalization of fast particles and their further production of X-ray emissions has been discussed by NEUPERT (1968). A further interpretation of our results offers more evidence in support of the schematic flare model put forward by him.
Usually, a rapid rise in soft X-ray emission closely coincides in time to the start of the microwave burst, even in those cases where the radio-frequency radiation was preceded by a weak X-ray increase. However, the soft X-ray maximum follows the cm-2 maximum by roughly 4 min.
TAKAKURA and KAI (1966) attribute the impulsive cm-2 burst to synchrotron radiation generated by a fast electron stream. They assume that particle acceleration ceases at the time of the burst peak, after which the burst decay is caused by loss of trapped electrons as well as by synchrotron and gyroemission losses. Electrons with small enough pitch angles may escape the trapping region on a time-scale given by the 'deflection time' defined by SPITZER (1967).
1 N
2.4 x 10¹² t , = E ~ / ~ sec .
8 a ~ , o ~ i (cp - G ) In A - Ne
The constant, which depends only weakly upon conditions in the coronal volume, has been calculated for N, - 2 x 10'' cm- 3, Te (flare) -- 108 K, Te (corona) - 106 K. For the range of conditions

RICHARD G . TESKE A N D ROGER J . THOMAS
we calculate that 2 6 tD 6 240 sec .
We are here assuming that the electrons being lost out of the trapping region interact with denser material in the lower corona and there excite the bulk of the thermal radiation being detected by us.
If the peak of the impulsive microwave burst represents the end of acceleration of electrons, which are presumed then to be lost from the trapping region by ther- malizing collisions, we would expect the peak thermal soft X-radiation to occur between a few seconds and a few minutes later. The observed average time lag is consistent with E N 1 and N,- 10'' ~ m - ~ . Because some electrons will be lost almost at once, the fast X-ray may be nearly coincident with the beginning of the impulsive radio burst.
Our inability to find a relation between radio burst spectrum and differences in times of radio and X-ray maxima also seems consistent with the above scheme. TAKAKURA and KAI (1966) computed the loss rate for all electrons of energy E < 1 and for different magnetic field strengths. They found that for an increase in field H from 500 to 1000 gauss, the loss-rate of electrons is not substantially increased. Thus, since the maximum in the radio flux density spectrum is directly proportional to H, we expect no relationship between lag time of maxima and the frequency of the maximum in the radio spectrum, nor is one found. Because there is also no apparent difference in lag times for bursts with and without a strong meter-wave and long decimeter-wave component, we deduce that at least the geometry and strength of the magnetic field are not critical to the production of soft X-radiation. However, they may affect the amplitude of the X-ray burst.
That the locus of X-ray production is spatially associated with solar magnetic fields is apparently shown by the very important flare X-ray photographs taken by VAIANA et al. (1968).
The schematic model for soft X-ray production presented here requires a close relationship between total soft X-ray energy and total cm-3, energy in flares. ARNOLDY et al. (1967) have shown such a relation exists for hard X-rays. TESKE (1969) suggests that such a relation might also exist for the soft X-rays. Although our schematic model does not require that the Ha energy in a flare be related to the X-ray energy, one of us (Thomas, unpublished) has shown that on the average the maximum Ha flux is directly related to the maximum soft X-ray flux in flares.
5. Summary
Observations of soft X-rays (8 < A < 12 A) associated with solar flares reveal that there is a strong tendency for a weak enhancement of X-radiation to precede the cm-/I burst and a wealcer tendency for X-rays to precede the Ha brightening. For some flares, then, there occurs a predecessor event which in our interpretation corresponds to the heating of a volume above the active center. The temperature rise may be

SOLAR SOFT X-RAYS AND SOLAR ACTIVITY
2 to 4 x lo5 K. Because of the requir-ernent of expression (8) the predecessor event may not simply take the form of a compressional adiabatic heating. Following the initial gentle X-ray rise in this class cf phenomenon, a more abrupt rise is seen usually in good time-association with the impulsive radio burst.
We attribute the lag of X-ray maximum relative to the cm-3, maximum to trapping of the high-energy electrons accelerated by the flare process itself. Thermalization of electrons escaping from the trapping region produces soft thermal X-radiation which constitutes the bulk of the radiation observed by our detector. The precipita- tion of electrons from the trapping region may continue for a long time following great flares.
There is a relationship between X-ray burst amplitude and cm-J. burst amplitude in the sense that strong cm-A radiation is accompanied by strong soft X-radiation. Additionally, we have found that flare-rich active centers tend to produce flares which are stronger emitters of both microwave radiation and X-radiation than are flares occurring in flare-poor active centers.
Acknowledgments
This work has been sponsored under Contract NAS5-3176 with the National Aero- nautics and Space Administration.
References
ACTON, L. W. : 1968, Astrophys. J. 152, 305. ACTON, L. W., CHUBB, T. A., KREPLIN, R. W., and MEEKINS, J. F.: 1963, J. Geophys. Res. 68, 3335. ARNOLDY, R. L.,-EANE, S. R., and WINCKLER, J. R. : 1967, Solar Plzys. 2, 171. DODSON, H. W. and HEDEMAN, E. R.: 1964, Planetary Space Sci. 12, 393. DODSON, H. W, and HEDEMAN, E. R.: 1968, World Data Center A Report UAG-2, August. DODSON, H. W., HEDEMAN, E. R., and COVINGTON, A. E.: 1954, Astrophys. J. 119, 541. DODSON, H. W., HEDEMAN, E. R., and MCMATH, R. R.: 1956, Astrophys. J. Suppl. 2, 241. DONNELLY, R. F.: 1968, ESSA Technical Report ERL81-SDL2, July. ELWERT, 6.: 1954, 2. Naturforsck. 9a, 637. EVANS, K. and POUNDS, K. A,: 1968, Astrophys. J. 152, 319. FRITZ, G., KREPLIN, R. W., MEEKINS, J. R., UNZICKER, A. E., and FRIEDMAN, H.: 1967, Astrophys. J.
148, L133. GREGORY, B. N. and KREPLIN, R. W.: 1967, J. Geophys. Res. 72,4815. KAWABATA, K.-A. : 1966, Report Ionosph. Space Res. Japan 20, 118. KUNDU, M. R.: 1965, Solnr Radio Astronomy, Interscience, New York. MANDEL'STAM, S. L.: 1965, Space Sci. Rev. 4, 587. NEUPERT, W. M. : 1968, Astr~oplzys. J. 153, L59. NEUPERT, W. M., GATES W., SWARTZ, M., and YOUNG, R. M.: 1967, Astrophys. J. 149, L79. NEUPERT, W. M., WHITE, W. A., GATES, W. J., SWARTZ, M., and YOUNG, R. M.: 1969, Solar Phys.
6, 183. POTTASCH, S. R.: 1963, Astrophys. J. 137, 945. - POTTASCH, S. R.: 1964, Space Sci. Rev. 3, 816. SPITZER, L., Jr.: 1967, Plrysics of Fully Ionized Gases, Interscience, New York. TAKAKURA, T. : 1967, Solnie Plrys. 1, 304. TAKAKURA, T. and KAI, K. : 1966, Pub/. Astrorz. Soc. Japnrz 18, 57. TESKE R. G.: 1967, Astroi~. J. 72, 832. TESKE, R. 6. : 1969, Solrrr Phys. 6, 193. UNDERWOOD, J. H.: 1968, Scier~ce 159, 383.

RICHARD G . TESKE AND ROGER J. THOMAS
VAIANA, G. S., REIDY, W. P., ZEHNPFENNIG, T., VAN SPEYBROCK, L., and ~ 1 A c c o ~ 1 , R. : 1968, Scieizce 161, 564.
WALKER, A. B. C., Jr. and RUGGE, H. R.: 1967, Astrort. J. 72, 825. WARWICK, C. and WOOD, M.: 1959, Astrophys. J . 129, 80i. WHITE, W. A.: 3964, AAS-NASA Syn~posium on Physics of Solar Flares (ed. by W . N. Hess), NASA
SP-50, p. 131.


SOFT SOLAR X-RAYS AND SOLAR ACTIVITY
11. Relation of Solar Soft X-Radiation to the Course of Solar Act ivi ty
March 10, 1967 - May 18, 1969
Summary
The performance of the Michigan OSO-111 X-ray ion chamber has been evaluated elsewhere i n t h i s repor t . Br ief ly: the instrumental energy scale remained s tab le t o within a few percent during the in te rva l March 10, 1967, a t l e a s t through April, 1968. Thus a long-term analysis of the data obtained by it and a compari- son of these data with the deta i led course of solar a c t i v i t y could be ins t ruc- t i v e and meaningful.
We have, accordingly, assembled our s o f t X-ray data in to summary form and have re la ted it t o deta i led op t ica l and radio records of solar a c t i v i t y obtained and compiled a t the McMath-Hulbert Observatory. The comparison covers the time period March 10, 1967, through Ma,y 18, 1968.
The summary X-ray records a r e shown graphically i n Figures 1 through 9. These summaries were prepared by students from our o r ig ina l data, which were computer-drawn p lo t s of X-ray f l ux vs . time, i n the following way. The or ig - i n a l p lo t s were scanned by individuals who noted time-breaks t h a t were due t o (1) s a t e l l i t e night, (2 ) tape-recorder playback, (3) pa r t i c l e interference, o r ( 4 ) o ther causes such a s noise. For a given uninterrupted data segment the
s t a r t i n g time, ending time, maximum flux, and minimum f lux during t ha t time seg- ment were recorded. Information f o r a l l data segments of whatever time length were then punched on cards and used a s input t o a computer program which pre- pared the data summaries i n graphical form.
These summaries ( ~ i g u r e s 1 through 9 ) a r e plot ted i n 27-day blocks which correspond t o "Bartels days." The maximum f l u x and minimum f l u x a re plot ted as shor t horizontal l i ne s of length equivalent t o the length of the data segment, and both a re joined by a v e r t i c a l l i n e placed a t the middle of the time i n t e r - va l . Data segments shor ter than 8 min were not plotted, because of t he small time-scale used i n the summaries.
Apparent i n the f igures i s the slow f luctuat ion of X-ray background a s - sociated with the general l eve l of a c t i v i t y on the v i s ib le so la r hemisphere. High background leve l s are seen during disk passages of great centers of ac- t i v i t y i n l a t e March and ear ly April, l a t e May, l a t e July and ear ly August, mid-December, 1967, and i n l a t e January and ea r ly February, 1968. These v a r i -

a t ions and the others which are apparent i n the data summaries have been asso- c ia ted by us with the appearance and de ta i l ed behavior of ac t ive centers on t he sun.
X-ray enhancements on a time scale of many hours a r e seen i n associa t ion with great f l a r e s such a s the PCA f l a r e s of March 22 and May 23, 1967, and with f l a r e s having s ign i f ican t gradual-rise-and-fall o r prolonged post-.burst enhance- ments a t centimeter wavelengths such a s on May 3, May 26, l a t e on August 18, and on September 19, 1967. Long enduring X-ray enhancements a r e a l so seen i n connec- t i o n with ver i f i ed major loop prominence systems such as those on June 1, and October 30 and 31, 1967. In addi t ion there a r e curious, long-enduring but minor X-ray events such a s those on February 22-23 and March 19, 1968 (and a few major ones l i k e t h a t of June 3, 1967), which have no c l e a r l y i den t i f i ab l e op t i ca l counter- pa r t . Some of these may be associated with f l a r e s behind the sun's limb, a s was
the case ea r ly on August 18, 1967.
Flare-associated spikes stand out on the summary graphs. Bot a l l the f l a r e s during the depicted time i n t e rva l a r e represented, since many were missed by OSO-111, and not a l l f lare-associa ted spikes portray the t r ue X-my amplitude because i n numerous cases the X-ray maximum was missed. I n terms of t he t o t a l r a t e of f l a r ing , the great regions of July-August, 1967, a r e well-portrayed by numerous spikes. The great 6 spot group of January-February, 1968, on the other hand, was not so productive of f l a r e s having s ign i f ican t X-ray enhancements, a l - though t h a t region provided the highest background f l u x during the 14 months analyzed here.
Differences i n endurance of X-ray emission following f l a r e s can be seen fo r the events of Apri l 26, May 6, and May 10, and fo r t he f l a r e on May 3, a l l i n 1967. The former three f l a r e s were a l l shor t - l ived a s X ray events, and a l l occurred i n the same plage region, while the l a t t e r event occurred i n a separate plage and was protracted over many hours, We have found t h a t c e r t a in ac t ive centers consis tent ly give r i s e t o f l a r e s accompanied by shor t X-ray burs t s while others a r e characterized by f l a r e s having r e l a t i v e l y long-enduring X-radiation.
These data have been discussed i n extenso i n a paper now being prepared. -

FIGURE CAPTIONS
Figures 1-9. Summary of solar soft x-ray flux. For each data-interval the maximum observed flux and minimum observed flux are plotted and joined by a vertical line. Data intervals shorter than 8 min have been omitted. The flux scale is logarithmic. The abscissa is divided according to "Bartels days."


A:::::
- +-
-- -
- - -
-- ----
--- v-
--
c;. - -
-- -- - -
-
-
J
-
-
- - - -
-+- - -- P
--- - -
-s
. -
-- 5s - -=- - -- - - . -


j
=%
3 =T=$
4-- - -
-- - --- -
-= - -
-= -
-. j, a-
pe
====='- -3
=d%
&
=I
-e-
-- -- I-,. 7-
-- -7- f
--


SOFT SOLAR X-RAYS AND SOLAR ACTIVITY
111. Relationship of 8-12 Solar X-Ray Background t o Other Indices of Solar Act ivi ty
March 10, 1967 - Apri l 30, 1968
Summary
For t h i s study we have defined a d a i l y s o f t X-ray background f l u x l eve l as being the lowest f l u x recorded during ach day, and have designated it a s the "dai ly base level" ~ ~ ( 8 , 1 2 ) ergs ~ m - ~ s e c - l , a s measured a t the ea r th . This de f in i t i on i s d ic ta ted by t he extreme s e n s i t i v i t y of so f t X-radiation t o minor a c t i v i t y on the sun. Since even sub-flare-associated enhancements may d i s tu rb the observed f l u x l eve l s f o r up t o a half-hour and more, and s ince subf lar ing may be near ly continuous a t some times, we a r e obliged t o seek a a background f l u x t h a t may only be f l e e t i ng ly observable. I n pract ice , t he base-level was measured only between the Universal hours 0600-2200, f o r two reasons: (1) the other indices of so l a r a c t i v i t y which were used i n t h i s study were based upon data gathered between 0500-2000 UT, generally; ( 2 ) occasionally t he base l eve l i s reached a t around 2400 UT, and thus a measurement obtained then would be ap- pl ied t o two dates without respect t o changes t h a t might take place a t l a t e r times.
The other indices of so la r a c t i v i t y used i n t h i s study a r e l i s t e d i n Table I. Except f o r t he plage index, a l l were taken from the Solar-Geophysical Data Bul le t ins , . and a l l corrections published i n the Bullet ins were applied t o t he data. I n addit ion, t he radio f luxes were reduced t o values a s observed from the ear th , uncorrected f o r eccen t r ic i ty of the e a r t h ' s o rb i t . The plage index used i s prepared a t the McMath-Hulbert Observatory from da i l y Calcium K spectro- heliograms. It is t h e sum of the areas of calcium plages ( i n mill ionths of a so l a r hemisphere) weighted individually by t h e i r i n t ens i t y excess above back- ground chromospheric in tensi ty , C A j x Ij, and i s an indicator of the t o t a l excess f l u x i n the C a I1 K l i n e due t o a l l v i s i b l e plages.
The da i l y indices f o r the i n t e rva l March 10, 1967, through Apri l 30, 1968, a r e portrayed graphical ly i n Figures 1 through 16. I n those diagrams, the data a r e displayed i n 27-day blocks, based upon "Bartels days,'' and separate ordin- a t e scales a r e supplied f o r each index a s indicated on the left-hand s ide of the f igures . The d a i l y plage indices have been scaled down by multiplying them by 0.01. (1n Figures 4 through 16, data f o r the f i r s t date i n each diagram were erroneously deleted by the computer.)

TABLE I
CORRELATION COEFFICIENTS FOR THE INTERVAL MARCH 10, 1967 - APRIL 30, 1968
Correlat ion Data Pair
Coefficient
8800 MHz / ~ ~ ( 8 ~ 1 2 )
4995 MHz / Q ( 8 , ~ ) 2800 MHz / EB (8,12)
2695 MHz / EB(8,12) 1415 MHz / E$j(8,12) 606 MHZ / ~ g ( 8 , 1 2 ) Rz / ~ g ( 8 , 1 2 )
C A x I / ~ ( 8 , 1 2 )
2800 MHz / Rz 0 .832 C A x I / 2800 MHz 0.825 R z / C A X I 0.739
Correlation coef f ic ien t s have been calcula ted from the 14 months of data and a re l i s t e d i n Table I. The corre la t ions of s o f t X-ray background with the radio indices a r e i n good agreement with those obtained by Wende and Van Allen f o r the 2-12 f l u x a s observed on Mariner V during a three-month in te rva l i n
1967. We have plot ted the observed re la t ionship between da i l y 2800 MHz f l u x and base-level X-ray f l u x i n Figure 17. This f igure shows t h a t the high corre- l a t i o n t h a t was obtained depends heavily upon data points measured a t lower levels of solar a c t i v i t y . It i s not c lea r whether the s c a t t e r of points a t higher a c t i v i t y l eve l s i s an indicat ion t h a t i n many instances the t r ue base- l eve l of X-rays was not seen, o r whether the s c a t t e r i s a r e a l one.
Although the time-base of 14 months i n our analysis i s only about 0 . 1 of a so la r cycle, we attempted t o determine whether the data showed any indica- t i o n of an evolution of the s t a t i s t i c a l re la t ionships between indices. An in - d icat ion of a secular change might, f o r example, suggest whether long-term changes i n the t o t a l coronal emission measure occur. Accordingly, we divided our data in to four part ial ly-overlapping time in te rva l s and calculated l i nea r least-squares f i t s t o pa i r s of the indices. The form of the regression was
y (any index) = a + b . ~ ~ ( 8 , 1 2 ) (1)
The coeff ic ients a, a,nd b fo r the four time in te rva l s a re given in Table I T . We a l so show some of the r e su l t s graphically i n Figures 18 and 19.

These regressions appear t o show a s l i g h t trend which i s consis tent within the d i f f e r en t pai rs of indices, but which must be viewed with considerable cau- t i on . While there i s f a i r l y good agreement among the regressions fo r the 1967 data, the data f o r the time i n t e rva l November 1, 1967, through April 30, 1968, suggest t ha t , a t t he higher so la r a c t i v i t y l eve l s a s indicated by, f o r example, t he 2800 MHz flux, the background X-ray base l eve l was below what might have been expected on the bas i s of the sun's performance i n 1967. We can th ink of three explanations f o r t h i s : (1) The ion chamber l o s t s e n s i t i v i t y i n e a r l y 1968. However, i n - f l i gh t ca l ib ra t ions show no e l e c t r i c a l deter iora t ion, and data obtained i n to 1969 do not indicate t ha t f i l l i n g gas was being l o s t from the ion chaniber. ( 2 ) The t rue base l eve l was being measured i n 1968 because of a decline i n t o t a l f l a r e r a t e , and the t r ue base l eve l was not always ob- ta ined i n 1967 becasue of the high r a t e of f l a r i n g when great ac t ive centers were present on the sun. (3) The observed e f f ec t i s r e f l e c t i ng conditions on t he sun associated with the dramatic decline i n r a t e of f l a r i n g a f t e r mid- February, 1968.
There a r e a l so s t a t i s t i c a l reasons f o r caution about in fe r r ing evolution- a ry t rends from the regressions. The l inear form t h a t was chosen i s only an approximation t o t he t r ue re la t ionships (see, e .g. , Figure 1 7 ) . Further, the s c a t t e r of data points a t higher l eve l s of a c t i v i t y introduces an e r ror in to each coef f ic ien t a and b.
Auto-correlation curves have been calculated f o r ~ ~ ( 8 , 1 2 ) , Rz, Aj x I j, and the 2800 MHz d a i l y f lux, see Figures 20 through 23. While the l a t t e r th ree indices show a negative minimum i n t h e i r auto-correlat ions a t l ags near 14 days, the ~ ~ ( 8 4 2 ) auto-corre la t ion does not d ip t o negative values bu t shows a small posit ive minimum near a l ag of 16 days. One possible in te rpre - t a t i o n of t h i s i s t h a t the X-radiation a r i s e s from l eve l s high enough i n the corona t o be e a s i l y detected even when the underlying plage i s approximately one day 's ro ta t ion 'beyond the sun's limb. As regards the r e l a t i ve amplitudes of the maximum near 25 days and t he minimum near 42 days, the X-ray curve be- haves most nearly l i k e t h a t f o r t he plage index, emphasizing the close associ- a t i on of s o f t X-ray emission with Ca I1 K s t ructure which i s revealed by d i - r e c t X-ray photography. Again, however, the posit ions of the maxima and min- im i n these two curves suggest a high atmospheric l eve l f o r the X-ray source volume .
Cross-correlation analyses have been ca r r ied out f o r lags between minus and plus two solar ro ta t ions . These a r e displayed i n Figures 24 through 29. The sense of the lags i s given i n the f igure captions.
These cross-correlat ions reproduce fo r the so la r X-radiation the f a - mil iar influence of sunspots upon the extent and l i fe t ime of t h e i r associated plage regions, i n the sense t h a t the more extensive spot groups, which strongly contribute t o RZ, a re usual ly associated with larger , br ighter , and longer-last ing plages (see Figures 25, 27, and 29), and a r e a l so thus associ- a ted with the most prominent X-ray source volumes. It i s tempting t o in fe r ,
from the amplitudes of the lagged peaks a t + 28 days i n the cross-corre la t ion of X-rays with the 2800 MHz f l u x ( ~ i g u r e 2 4 x t h a t t he development curve of X-ray emission from evolving act ive centers tends t o have a phase l ag with respect t o the development curve fo r the 2800 MHz radia t ion. However t h i s ef fect , i f r ea l , i s small.

FIGURE CAPTIONS
Figures 1-16. These diagrams graphically portray the da i l y var ia t ions of solar a c t i v i t y indices during t he i n t e rva l March 10, 1967 t o Apri l 30, 1968. The abscissa i s divided according t o "Bartels days." Separate ordinate scales a r e given f o r each quantity; a l l scales a re l i nea r . Generally the scales a r e such t h a t t h e X-ray data appear a s t he lowest curve and the 606 MHz da i l y f l u x appears a s the highest curve. (Beginning with Figure 4, data f o r t he f i r s t date of each graph was accidenta l ly omitted.) Radio f luxes a r e given i n u n i t s of watts mm2 H Z - ~ .
Figure 17. The d a i l y base l eve l of s o f t X-ray f l u x i s here p lo t ted against the d a i l y 2800 MHz f l u x l eve l . The radio f l u x densi ty i s given i n u n i t s of watts mm2 H Z - ~ .
Figure 18. Least-squares l i nea r f i t s t o segments of 14 months of data a r e shown. Here, the X-ray base l e v e l i s compared with t he da i l y McMath-Hulbert plage index.
Figure 19. Least-squares l i n e a r f i t s t o segments of the 14 months of data a re shown. Here, the X-ray base l eve l i s compared with the d a i l y 2800 MHz f lux .
Figures 20-23. Auto-correlation curves f o r da i l y so la r a c t i v i t y indices and f o r the so f t X-ray base l eve l .
Figure 24. Cross-correlation of s o f t X-ray base l e v e l with d a i l y 2800 MHz f lux. Negative lags correspond t o placing X-ray data upon l a t e r dates .of the 2800 MHz data s e t .
Figure 25. Cross-correlation of s o f t X-ray base l eve l with Rz. Negative lags corresponding t o placing X-ray data upon l a t e r dates of t h e R Z data s e t .
Figure 26. Cross-correlation of s o f t X-ray base l eve l with plage index. Nega- t i v e lags correspond t o placing X-ray data upon l a t e r dates of the C A x I data s e t .
Figure 27. Cross-correlation of 2800 MHz da i l y f l ux with R z . Negative lags correspond t o placing 2800 MHz data upon l a t e r dates of t h e R Z data s e t s .
Figure 28. Cross-correlation of the 2800 MHz da i l y f l ux with plage index, Nega- t i v e lags correspond t o placing 2800 MHz data upon l a t e r dates of the C A x I data s e t . This curve i s normalized a t zero l ag . The maximum occurs a t a l ag K = -1 day.

FIGURE CAPTIONS (concluded )
Figure 29. Cross-correlat ion of plage index with R,. Negative l ags correspond t o placing C A x I data upon l a t e r dates of the Rz data s e t .

.:
::
::
. -
. .
. .
."
""
'.
.
. .
.*
m'ws
w'm
s w
'mn
w'oa
w'w
z W
'WI
w.
X
IO'X
X
MI
3Wld

I.
..
..
..
..
..
..
..
..
..
..
..
w
w
m.m
m
.ml
W.W
I m
.m
m.
I
xnu
zw 5692
r.
..
..
..
..
..
..
..
..
..
..
..
4 w
'as W
'W
M'O
Y
mw
x m
.mt
m.m
l m
.m
w'
x xn
u zw
s
sh
I:
::
::
::
. .
..
..
..
..
..
..
.:
I
m'm
W
'OY
W
'W
W'b
O
M'D
Y
W'B
I W
'WI
P'I
00'
8
xnu
zuc w
se
b:
::
::
.:
.
..
..
..
..
..
..
..
:4
W
'W3
W'c
a
m'
m
00'001 M
'm?
W'W
l .'
X
IO'X XX
WI 3M
ld
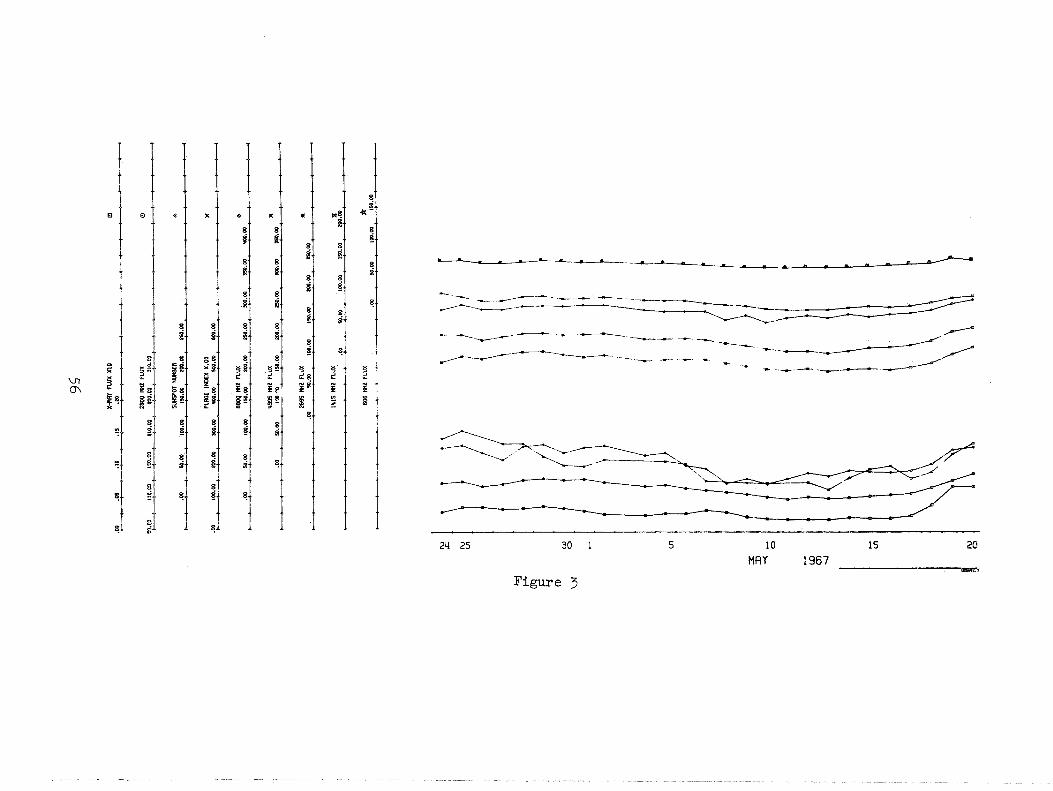
1:
::
::
:
~~
''
~'
''
''
'~
''
''
'.
4
W'O
Y
m'm
m
as
W
'Ml
wa
s
w.
I
xml zw
5692
I:
::
.:
: .
. .
: :
m.
&'a
o.
&~
m.
~.
w~
~w
&:
wt
l:
~.
X
IO
'X X
aY
l mu

+----C
---t-t--t--t--+
--+
'
'@,.& ' O
O.&
'w.oi,
W.W
Z
W.%
I W
'WI
M.%
W
' X
x
nv
zw
s66h
: 4
,:
::
::
."
""
.
02' S
l' 0
1'
LO'
W'
lil O
IX rill3
IW-X

28W
WZ
FLUX
W
m.w
11o.w
IW
.W
21o.w
?
.a.
a!o
.w,
. .
, ,
, .
: :
: :
: :
I
1415
MZ
FLU
X X
.w
54.m
~
w.w
154.w
y
.W
,
. .
. ,

: :
'm.d
t m
.ml
wffi
w
4
r m
4 zww gas
: :
:
. '@
.& 'w
&
'wo
a
'wan
'w
&
,oo'osl w
m1
I'ffi e
mu zw
W
B8
a:
::
::
::
.
. .
. .
. .
.o
i.
.r
i.
.~
ai
.'
*'
d.
O
IX xm4 A
WX

m'm
m
.003 W
'mh
m
'ca m
'm
m'm
l W
' X
IO
'X xm1 mu


I :
: :
: "@
,.&
'w.&
'w
.dt
'w.dl
'w
.k
' d
.'
'
' '
' '
+
i( x
nu
zw %
gz
I :
: '
' w.oir
'my&
w
.on w
.0~1
wm
.ml
WW
I w.ar
w.
X
4
xn
u zw
sssh
+:
::
:"
"'
~'
""
"'
~"
"~
W
'W
W'W
3 W
'Dm
W'bx
W'W
W
'Wl
w.
x IO
'X X
rn
I 3W
U
*:
::
. .
."
""
~"
""
~"
'~
I'
%I'
01' (0
' 00'
OIX
Xllll
AW
-X

I :
'w.&
, 'W
'i
,
'0
5
w.
s
xnu
zw 909
' W
'W
W
'WI
M'M
I W
'05
W.
:tt--C(
x xm
d zuu slh
~

I :
: :
: :
.e.& 'a
o&
'w.k
l 'w
.&j, '@
,.h'
J.
' '
' '
' '
* I
xnu zw
569z

0 :
: :
: .
. .
' ;
.m.&
'm
.&
'm.&
'm
.c&
'm.*
'@,.GI '
&. X
10'X
XM
I 3
WU
8 OL'
11' 01'
SO'
W'
Q
OIX m
u iw
-x

*-----+: :
:
:-
:
: :
: :
: :
:
:
I W
'WP
W
'MS
w
'mh
m'm
w'm
m'm
r w
' X
IO
'X X
3W
l Ml
d

,:
::
::
::
.:
. .
'.
~'
''
"'
.'
'+
W
'OE
I W
'WI
w.05
MI
4
mir zuu 309

a:
;:
::
::
::
:.
:
.:
..
. .
.:
::
:a
m
oa m
.m
m.ffil
m'w
c m
,ps m
. II
xnu zw 5692
t:
::
::
::
:.
.
. .
. .
. .
. .
::
:.
.
moa
m'rm
m
.mh
mm
moa
m.w
~
' d.
X
IO'X X
MI m
u
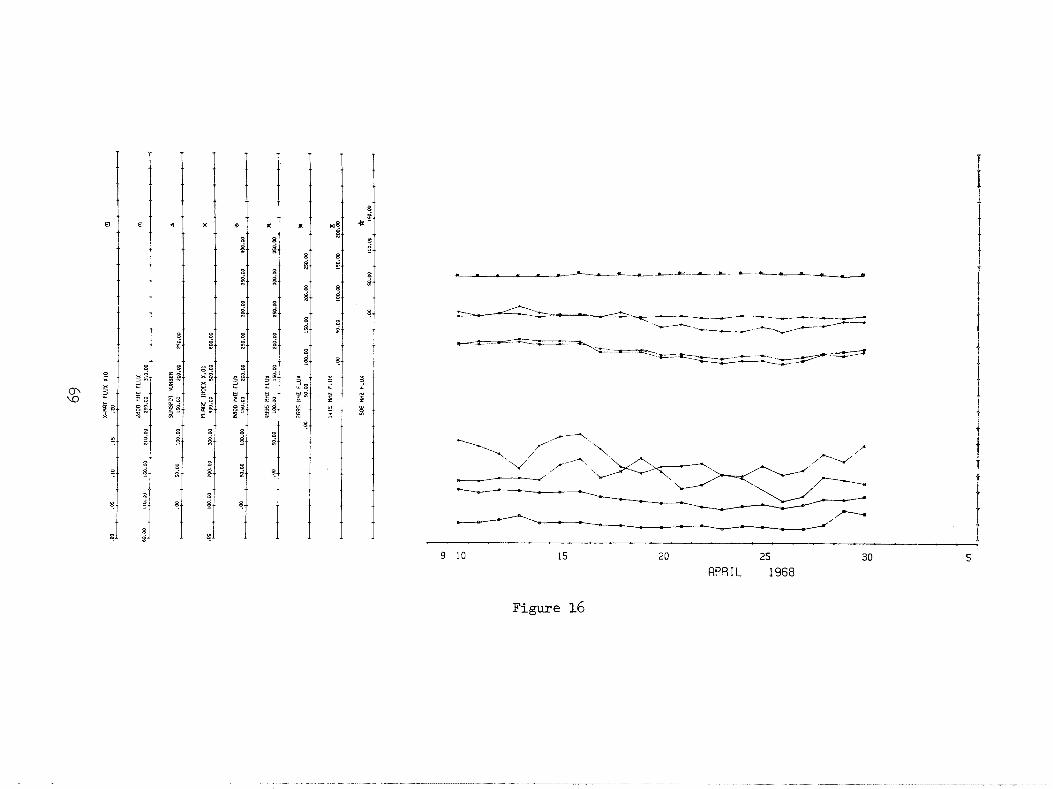
00'051 W
'WI
00.0s W
'
v m
il zuu 90s
,:
::
::
: i
..
..
.:
i
::
::
::
:.
W
'WO
W
'W5
W'W
O
W'
m
w'W
I W
'W!
' d.
X
IO'X
XW
I 3W
ld

0.020
0.018
0.0 16
- I o 0.014 W V)
9' 2 0.012 o V)
0.010 a W CI
. . a . a . . *. .-. . 0.008 . . . 00- . . . . . . . . t . : : . ;
u
. .:, : :... ..: . . : . 1
$ 0.006
....... . . . . . . :. . . . . . . . . . . . 0,004 . . . . . . . . . : ... . ': . . .
0.002
0.000 80 100 150 200 250
2800 MHz DAILY FLUX
Figure 17


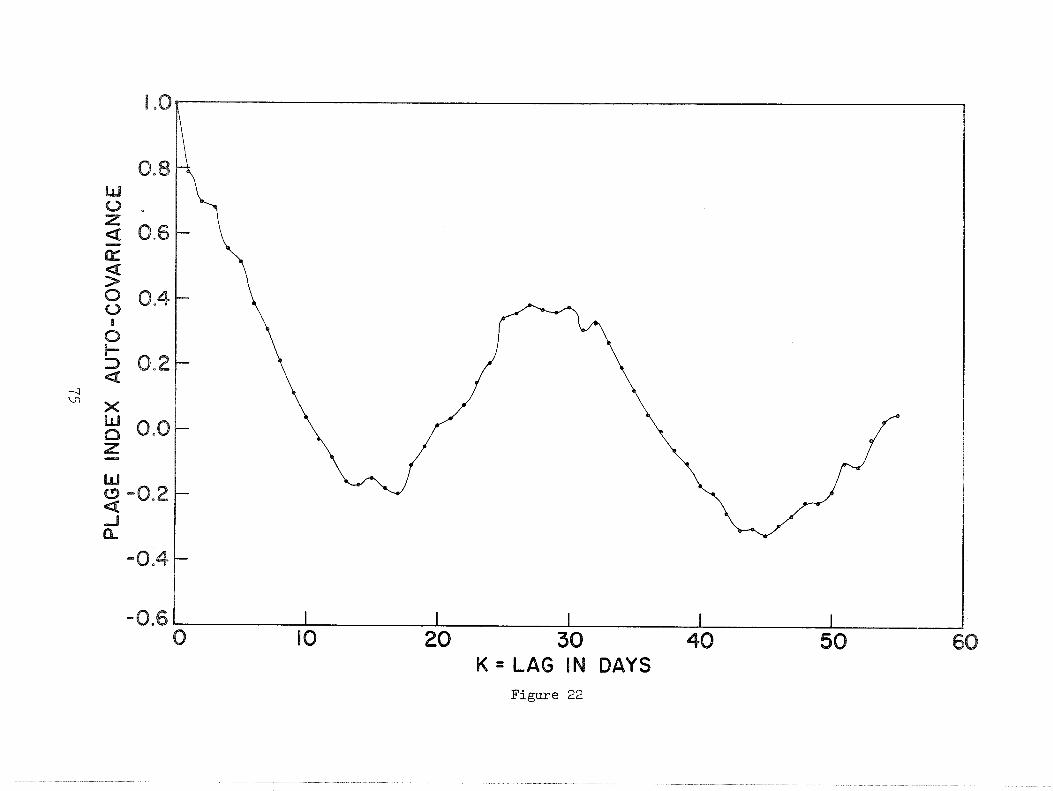


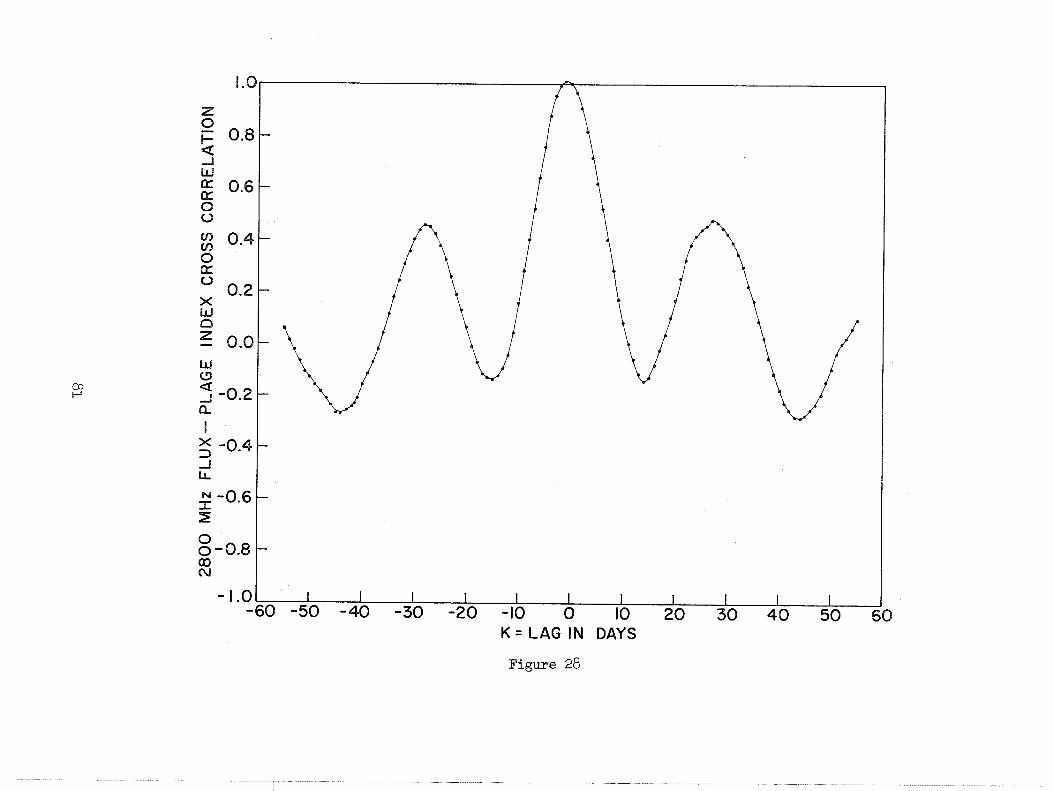


SOFT SOLAR X-RAYS AND SOLAR ACTIVITY
I V . Loop Prominences wi th So f t X-Ray Emission
I. In t roduc t ion
Great systems of l oop prominences a r e c l o s e l y a s soc i a t ed w i t h major f l a r e s . They were f i rs t i d e n t i f i e d a s f l a r e - a s s o c i a t e d s t r u c t u r e s by Dodson (1961). Bruzek (1964), i n a c l a s s i c a l obse rva t iona l study, i n v e s t i g a t e d t h e f l a r e / loop- prominence r e l a t i o n s h i p and descr ibed t h e loops a s a "prolonged f l a r e process which, s lowly decaying, propagates i n t o t h e s o l a r corona."
The major l oop systems which Bruzek descr ibed appear w i t h i n sporadic coronal condensations fol lowing t h e onse t of g r e a t f l a r e s . The f l a r e s a r e themselves found t o be t h e s i t e s of emission of Type I V r a d i a t i o n and a r e o f t e n product ive of subsequent PCA e f f e c t . J e f f r i e s and Orra l (1965a, 1965b) suggested t h a t t h e loop prominences have t h e i r o r i g i n i n t h e the rma l i za t ion of f a s t p a r t i c l e s which a r e guided along magnetic f i e l d l i n e s . I n t h e i r view and i n Kleczek 's (1964), a t l e a s t a s i g n i f i c a n t f r a c t i o n of t h e loop proGinence m a t e r i a l i s de l ive red t o t h e system i n t h e form of pro tons of keV and h igher ene rg i e s . The d e l i v e r y of t h e s e p a r t i c l e s onto t h e loops, i f it occurs , i s unobservable a t v i s u a l wavelengths, b u t t h e process may be expected t o be ob- servable i n t h e X-ray reg ion of t h e s o l a r spectrum.
Olson and Lykoudis (1967) have considered an a l t e r n a t i v e model f o r pro- duc t ion of l oop systems based upon a condensation process . I n t h e i r hypothesis , plasma confined t o t h e coronal condensat ion i s compressed and subsequent ly l o s e s energy by r a d i a t i o n and by conduction, becoming v i s i b l e i n Ha a s loops , Be- cause no m a t e r i a l i s added t o t h e system it i s u n l i k e l y t h a t t h i s mechanism can g i v e r i s e t o a major loop system, s i n c e t h e observa t ions r e q u i r e t h a t t h e loops con ta in more mass than i s a v a i l a b l e from t h e coronal condensation ( ~ l e c z e k , 1964). Olson and Lykoudis concluded t h a t loops produced by t h e i r mechanism would comprise smal l systems h 5 30,000 km, and t h a t t h e s e would be i n s i g n i f i - cant e m i t t e r s of X-radiat ion.
We have obtained e x c e l l e n t records of t h e s o l a r s o f t X-ray f l u x between
8 and 1 2 a covering t h e period March 9, 1967, t o June 28, 1968 ( ~ e s k e , 1969). These r eco rds were examined f o r s o f t X-radiat ion t h a t may have been a s soc i a t ed wi th major systems of l oop prominences, w i th t h e aim of understanding something f u r t h e r a,bout t h e processes which g ive r i s e t o those s t r u c t u r e s .

11. The Data
Major systems of loops a r e r a r e phenomena: Bruzek (1964) assembled twenty-nine cases of major systems a t t h e limb during a seven-year period November, 1956-~eptember, 1963, without commenting upon t h e completeness of h i s l i s t .
A l i s t was made by us of t h e twenty-six loop systems repor ted a t t h e s o l a r limb by Sacramento Peak ( i n Geophysics and Space Data Bu l l e t in : GSDB) during --- t h e i n t e r v a l March 10, 1967-~ecember 31, 1967. A twen ty - f i f th case (May 21, 1968) was added t o t h e l i s t because of i t s reported magnitude: t h e loop tops extended t o 0.08 s o l a r r a d i i from t h e limb. Seven a d d i t i o n a l cases of f l a r e s accompanied by loops were cu l l ed from t h e Quar t e r ly Bu l l e t in -- on Solar A c t i v i t y (a) f o r t h e same time period. A reasonably prominent s o f t X-ray enhancement was found t o accompany only t e n of t h e t h i r t y - t h r e e events i n t h e ca ta log a able I ) , although seve ra l o t h e r s may have been associa ted wi th very weak s o f t X-ray enhancements of amplitude ~ ~ ( € 5 ~ 1 2 ) 5 0.005 e rgs cm-2sec-1 a t t h e ea r th . I n our opinion, weak X-ray enhancements a r e e a s i l y confused by sub- f l a r i n g a c t i v i t y and wi th f l u c t u a t i o n s i n the background f lux , and s o t h e s e have not been studied.
Our f l a r e p a t r o l f i lms a r e not e spec ia l ly s u i t e d t o t h e examination of loop prominence images. Where poss ib le we have examined them t o confirm-the i d e n t i f i c a t i o n s . Our impression i s t h a t t h e majori ty of t h e "loops" reported i n GSDB a r e indeed loop-l ike configurat ions but a r e not t h e major systems de- scr ibed by Bruzek. Thus t h e low f r a c t i o n a l a s soc ia t ion of reported "loops" with s o f t X-radiat ion may have no meaning wi th r e spec t t o t h e g r e a t systems. We reserve comment a s t o whether t h e major i ty of t h e repor ted "loops" may be i d e n t i f i e d wi th phenomena generated by the Olson-Lykoudis mechanism (1967).
Optical (Ha) d a t a ava i l ab le t o us permit t h e reasonable i d e n t i f i c a t i o n of four o f t h e t e n "yes" cases of Table I a s major loop systems (Table 11). These four events a r e discussed below. I n Sect ion I11 we w i l l consider those f ea tu res of our observat ions which a r e r e l evan t t o t h e compression model and t o t h e i n j e c t i o n model.

TABLE I
REPORTED H a LOOPS
Date Time, UT Source P o s i t i o n Sof t X-Ray Enhancement
GSDB GSDB GSDB
QB QB QB
GSDB GSDB GSDB
QB GSDB GSDB GSDB GSDB
QB GSDB GSDB GSDB
QB GSDB GSDB GSDB GSDB GSDB GSDB
QB GSDB GSDB GSDB GSDB GSDB
QB GSDB
QB GSDB
No Yes
Poss ib le Yes
Weak No No Yes
Moderate Moderate
Yes* Moderate, sho r t - l i ved
No Yes No
Poss ib le? No
Weak No
Poss ib l e No No No No Yes Yes Yes* Yes*
Poss ib le No
Poss ib l e? Poss ib l e Poss ib le
Yes Yes* - - *
O p t i c a l l y i d e n t i f i e d as major loop system,

TABLE I1
LOOP PROMINENCES FOUND TO HAVE A SIGNIFICANT SOFT X-RAY ENHANCEMENT
X-Rays X-Ray Peak Flux EL Loops
Date Begin End Comments
(UT) (UT) A E ( ~ , l 2 ) e r g s cm-2sec-1 F i r s t V i s ib le (UT)
Unknown
1850
1912
2041 Poor H a da ta
A . OCTOBER 30 AND 31, 1967
Data r e l a t i n g t o t h e time-period October 30 ( 1 2 ~ UT) t o October 31 (24h UT) a r e presented i n Figure 1. We have associa ted the two prolonged X-ray enhance- ments on each day wi th l a r g e systems of loop prominences seen a t t h e s o l a r west limb. H a f i l t rohe l iog rams of these systems a r e s h a m i n Figure 2. These were very k indly made ava i l ab le by D r . Hyder a t Sacramento Peak ( ~ i g u r e 2a and 2b, October 31) and by M r . Mi l le r a t Lockheed Ca l i fo rn ia Company ( ~ i g u r e 2c, Octo- be r 30 ) .
Hyder (1969) e s t ima tes t h a t t h e t o p of t h e system on October 30 had reached an apparent a l t i t u d e h - 1.2 x lo5 km by ~ 3 ~ 1 5 ~ UT, while on October 31 t h e loop
4 h m t o p s appear t o have reached a pro jec ted a l t i t u d e h - 4 x 10 km by 19 24 UT. From a cons idera t ion of t h e probable loca t ion of t h e f l a r e s which may have i n i - t i a t e d these phenomena (Teske 1970) we have deduced a c t u a l he ights of t h e loop tops h 2 l o 5 km. These systems thus rank among t h e l a r g e s t s tudied by Bruzek
(1964)
Neither of these systems was associa ted with Type I V r ad ia t ion , an observa- t i o n t o be compared with Bruzek's (1964)~ i n which only four out of twenty- seven cases of loops a t t h e limb were accompanied by recognized Type I V (two cases occurred p r i o r t o Type IV ' s r ecogn i t ion ) . However, t h e phenomena seen i n October, 1967, appear t o be ranked with major loop systems on b a s i s of morphology and magnitude. There i s no evidence f o r an X-ray b u r s t associa ted wi th an i n i t i a t o r y f l a r e f o r e i t h e r loop event (Teske, 1970)) and so t h e s o f t X-rays being observed were very l i k e l y e n t i r e l y associa ted wi th t h e loop systems themselves.
h m The f i r s t loops on October 30 were seen on McMath-Hulbert f i lms a t 18 50 ,
about 35 min before s o f t X-ray maximum. On October 31, Sacramento Peak saw v i s i b l e loops beginning a t about 1 9 ~ 1 2 ~ , perhaps 15 min a f t e r t h e (approximate)

maximum X-ray f l u x . The t ime of appearance of a l oop system i s probably an obse rva t iona l a r t i f a c t , s i n c e t h e systems grow i n he igh t from low mounds ( ~ r u z e k , 1964), and t h e s e t imes correspond i n our p re sen t observa t ions t o t h e t imes of f i r s t r ecogn i t i on o f t h e prominences a s a system of loops. The d i f f e r e n c e s i n t ime o f loop r ecogn i t i on and time of X-ray maximum may be reconci led i f we a s - sume ( i ) t h a t on October 31 t h e system had t o r i s e t o a cons iderable a l t i t u d e (h - 60,000 km, Teske, 1970) before becoming v i s i b l e from t h e e a r t h and ( i i ) t h e X-ray source i s l oca t ed a t a l t i t u d e s above t h e limb and t h u s above t h e H a source. According t o Bruzek, loop systems r e q u i r e > lh t o grow t o 60,000 km a l t i t u d e . Thus, on October 31, recognizable bu t smal le r H a loops may have been i n v i s i b l y p re sen t 'below" t h e s o l a r limb, p r i o r t o X-ray maximum.
The a c t i v e c e n t e r w i t h which t h e s e two loop systems were a s soc i a t ed (McMath reg ion No. 9034) became exceedingly a c t i v e a c t i v e on October 29, whi le it was on t h e west limb. An importance 2b f l a r e which began a t 2347 UT on t h e 29th may have been a s s o c i a t e d wi th a system of loops, according t o t h e Quar te r ly B u l l e t i n -- on Solar Ac t iv i ty . Our s a t e l l i t e d a t a show t h e f l a r e X-ray b u r s t and a l i n g e r i n g s t r o n g enhancement of s o f t X-ray f l u x fo l lowing t h e f l a r e ; t h e f l u x dec l ined s lowly over an i n t e r v a l of 6-8 h r , from an i n i t i a l p o s t - f l a r e l e v e l comparable t o t h e l e v e l s observed with t h e o t h e r two October loop systems. The f l a r e i t s e l f was accompanied by s t r o n g cm-A r a d i a t i o n and by a s t rong pos t - b u r s t phase l a s t i n g more than 3 hr . No Type IV was repor ted . Thus t h i s a c t i v e cen te r produced, during a 48-hr i n t e r v a l , t h r e e systems o f loop-type prominences, none of them as soc ia t ed w i t h r epo r t ab le Type I V r a d i a t i o n .
We have not s tud ied t h e loops of October 29. We have no o p t i c a l d a t a con- cern ing them o t h e r than t h e comment i n t h e Quar t e r ly B u l l e t i n . It i s no te- worthy t h a t t h e loops were repor ted by Sacramento Peak a s beginning before t h e importance 2b f l a r e (Table I ) . Thus t h e loops may have had t h e i r o r i g i n i n an e a r l i e r event, perhaps a s u b f l a r e which began a t 2037 UT. Our X-ray d a t a do no t i n d i c a t e any major enhancement i n t h e i n t e r v a l 2042-2129 UT, however, and t h e cm-A b u r s t a t 2036 UT was very minor.
Data r e l a t i n g t o t h e phenomena of June L a r e shown i n Figure 3. Super- h m posed upon t h e extended X-ray enhancement which began a t 07 00 a r e many s h o r t
X-ray b u r s t s which a r e a s soc i a t ed wi th f l a r e s on t h e v i s i b l e d i sk . The X-ray h m background remains above normal u n t i l a t l e a s t 15 00 .
Sacramento Peak r epor t ed Loops a t t h e west limb, i n t h e p o s i t i o n of plage #8818, a t t h e beginning of observa t ions a t 1 2 ~ 1 4 ~ . The McMath-Hulbert f l a r e - p a t r o l f i l m s record t h e i r presence a t t h e beginning o f observa t ions a t l l h O j m . We have no d a t a which provide t,he t ime of f i r s t v i s i b i l i t y on t h e sun,
Evidence f o r an i n i t i a t o r y f l a r e has been d iscussed by Teske (1970). It i s l i k e l y t h a t t h e X-ray r i s e a f t e r 0 7 ~ 0 0 ~ i s a s s o c i a t e d wi th t h e f l a r e and t h e

h m r a d i o b u r s t . Fur ther , t h e maximum X-ray f l u x recorded a t around 09 00 may be t o a s l i g h t ex t en t contaminated by s u b f l a r i n g a c t i v i t y near t h a t time. It i s un l ike ly , though, t h a t t h e maximum seen i n s o f t X-rays r ep re sen t s only t h e X-rays of the i n i t i a t o r y f l a r e , because it occurs 110 min a f t e r t h e peak of t h e cm-A b u r s t . It i s unfor tuna te t h a t swept-frequency observa t ions a t meter-h were not being made around t h e time of t h e f l a r e .
C . MAY 21, 1968
" ~ o o p s " were r epo r t ed by Sacramento Peak Observatory on t h e n o r t h e a s t l imb h m 4 beginning a t 20 50 , even tua l ly extending t o 0.08 ( h - 6 x 1 0 km) above t h e
limb. These thus rank w i t h average l o o p he igh t s recorded by Bruzek (1964). Our f l a r e p a t r o l f i lm , which ceased a t 2 0 ~ 5 6 ~ ) i n d i c a t e s t r u c t u r e s t h a t resemble a g r e a t loop system a s e a r l y as 2oh41m. The assembled d a t a f o r t h i s event a r e i n Figure 4.
A s u b f l a r e on t h e no r theas t limb may be a s soc i a t ed wi th the formation of t he loop system. I f so, i t s importance r a t i n g i s perhaps i n c o r r e c t . A Type I1 b u r s t following the f l a r e i s sugges t ive of a s i g n i f i c a n t magnitude f o r t h e event, whi le t h e cm-A b u r s t amplitudes ( - 20 f l u x u n i t s ) would argue otherwise. As on October 30 and 31, 1967, no Type I V r a d i a t i o n was repor ted .
h m h m It i s l i k e l y t h a t t h e X-ray enhancement between 20 20 and 21 00 i s p r i -
mar i ly a b u r s t component a s soc i a t ed w i t h t h e sub f l a re . The b u r s t i s more pro- longed than i s u sua l f o r a s u b f l a r e , a l though t h e r a t e of decay of t he b u r s t
h m i s e s s e n t i a l l y f l a r e - l i k e . The low l e v e l of enhancement a f t e r 22 00 demon- s t r a t e s t h a t t h i s l oop prominence system was not a s product ive of X-radia t ion a s were t h e o t h e r s prev ious ly discussed. The H a d a t a a v a i l a b l e t o us do not i n d i c a t e t h a t t h e system w a s morphological ly d i f f e r e n t from o t h e r major l oop systems, a l though t h e s e d a t a a r e of poor q u a l i t y .
D o X-RAY ENERGIES OF THESE EVENTS
We have est imated t h e peak emission r a t e s and t ime- in t eg ra t ed s o f t X-ray energy of t h r e e of t h e events a able 111). That given f o r t h e June 1, 1967, loops i s s u r e l y an overest imate because of t h e d e t e c t i o n of some f l a r e b u r s t X-rays b u t i s no t t o o l a r g e by more than a f a c t o r of two. Thomas (1970) has analyzed the response of t h e Michigan ion chamber t o va r ious s p e c t r a l d i s - t r i bu t ions -bo th l i n e and continuous-and concluded t h a t t h e r e l a t i v e e r r o r s of quoted f luxes do not exceed 3% f o r t h e s p e c t r a l d i s t r i b u t i o n s t h a t may be reasonably expected even i f t ime-va r i a t i ons of spectrum occur . He has a l s o concluded t h a t sys temat ic sources of e r r o r ( c a l i b r a t i o n , p r imar i ly ) do not l e a d t o e r r o r s i n quoted energ ies exceeding a f a c t o r of t h ree , and t h a t t he t r u e sys temat ic e r r o r s may be l e s s t han t h a t ,

TABLE 111
SOFT X-RAY EMISSION FLATES, ENERGIES, RISE, AND DECAY TIMES FOR THREE MAJOR LOOP SYSTEMS
e- fo ld ing t imes X-Ray Peak Flux
Date / a ~ ( 8 , 1 2 ) d t ( e r g s ) Rise Decay a t Sun ( e r g s s e c - l )
( ~ i n u t e s ) ( ~ i n u t e s )
It i s s u r p r i s i n g t o f i n d t h r e e sepa ra t e events which produce such s i m i l a r peak r a t e s and t o t a l X-ray ene rg i e s . Energy e s t ima te s cannot r e l i a b l y be made f o r t h e May 21, 1968, loops. However, t h e peak r a t e of X-radia t ion and t o t a l X-ray energy f o r t h e loops on t h a t da t e a r e ve ry much smal le r t han those given i n Table 11. The fol lowing d i scuss ion (Sec t ion 111) w i l l consider t h e loop systems of October 30 and 31 a t l eng th , These were t h e l a r g e s t loops t h a t were i d e n t i f i e d o p t i c a l l y , and were among t h e s t r o n g e s t s o f t X-ray e m i t t e r s i n Table I. They may t h e r e f o r e not be t y p i c a l of l oop systems g e n e r a l l y ; t he loops o f May 21, 1968 may a l s o exemplify a morphologically s i m i l a r b u t l e s s e n e r g e t i c phenomenon.
111. Discussion
Because t h e Michigan i o n chamber responds t o a broad band of wavelength p r i n c i p a l l y between 8 and 1 2 ( s e e Thomas, 1970) it i s not poss ib l e t o u t i l i z e t h e observa t ions d i r e c t l y i n a deduct ive phys i ca l d i scuss ion . To do s o would r e q u i r e p r i o r information a s t o emission measure and temperature. Comparison of our d a t a w i th s o l a r X-ray d a t a a t 7,7 - 210 keV ene rg ie s obtained i n f l a r e events b y Pe terson and Hudson* i n d i c a t e s t h a t i n f l a r e s t h e f l u x l e v e l s ob- served by us a r e almost e n t i r e l y l i n e o r free-bound emissions. This i s deduced from t h e f a c t t h a t an e x t r a p o l a t i o n of t h e bremsstrahlung spectrum near 7.7 keV i n t o our band-pass f a i l s t o exp la in our f l u x l e v e l s by f a c t o r s o f from 1 0 t o 100. The complex i n t e r p l a y of v a r i a t i o n s of emission l i n e s and cont inua during t h e course of a t r a n s i e n t phenomenon makes i t extremely d i f f i c u l t t o e x t r a c t any but rudimentary information. However, Thomas (1970) has pointed ou t t h a t t h e r e l a t i v e f l u x l e v e l s measured a r e no t s i g n i f i c a n t l y a f f e c t e d by s p e c t r a l v a r i a t i o n s .
* We thank Drs. L. E. Peterson and H. S. Hudson of t h e Univers i ty of C a l i f o r n i a a t La JolEa f o r an oppor tuni ty t o i n spec t t h e i r da ta .

During the course of the October 30 and 31 loops, the cm-A radio emission was weak, non-impulsive and probably thermal in origin. Thus our X-ray fluxes probably represent line emission and some free-bound continua, for which the flux levels are given by
where we assume an isothermal-isotropic emitting volume. f ( ~ ~ ) is a function of temperature appropriate to the thermal emission mechanism.
The X-ray flux curves observed in October, 1967 are not directly associated with the inferred flare events, but principally with the loops. We ask whether the loops might be the result of a compression that is quite separate from a flare process. In considering the Olson-Lykoudis compression model, then, we may write (N V) = (N e total ), and
since no material is to be added to the magnetic field lines. During the com- pression stage, if it occurs, the decrease in volume, V, may possibly act to provide a temporarily increased rate of line and continuum emission. There are two difficulties with the compression model, however, beyond those already cited.
The first difficulty is that the Olson-Lykoudis model predicts that the highest temperatures will be achieved while the compression is still in pro- gress, and Te will have declined significantly before the compression is com- pleted. Thus, if indeed sufficient X-radiation is emitted, X-ray maximum will occur prior to the visible appearance of Ha loops in the system. This was not
the case on October 30, 1967. A second difficulty is inherent in the model calculations: an expression derived by Orgall and Zirker (1961) was used to specify the volume emission coefficient; comparison of this expression with
the calculations of Cox and Tucker (1969) shows it to be too small by about a factor of four in the relevant temperature range, Thus the predicted time- scale for development of visible loops in the compression-condensation model must be shortened well below the observed time-scale for the decay of the soft X-ray emission. We must therefore reject the model as incompatible with the observations.
In conjecturing that major loop systems are visible evidence for the storage of fast particles, Jeffries and Orrall (1965a,b) suggested that injec- tion of the particles onto magnetic field lines above the flare site leads to increased density near the tops of the field loops, where the keV protons are thermalized. As density and temperature rise the region will expand rapidly

and, cool ing, produce t h e v i s i b l e H a loops . It i s of i n t e r e s t t o a s k whether protons a r e i n j e c t e d on a s h o r t t ime-sca le o r over a long i n t e r v a l of t ime. J e f f r i e s and O r r a l l (1965b) suggested t h a t a continued i n j e c t i o n may sometimes OC cur .
We assume f i r s t t h a t a l l of t h e loops of a system a r e a consequence of a s i n g l e event t a k i n g p l ace on a s h o r t t ime-sca le and t h a t t h e pro tons a r e d i r e c t l y i n j e c t e d i n t o t h e magnetic f i e l d loops .
Reasons have been c i t e d f o r expect ing express ion (1 ) t o be a p p l i c a b l e t o t h e observa t ions under d iscuss ion , a t a t ime when t h e plasma i s thermalized. If t h e r e i s a s i n g l e i n j e c t i o n event , we may use express ion (2 ) i n d i scuss ing a s i n g l e l o o p subsequent t o t h e the rma l i za t ion s t a g e and explosion a t t h e t o p of t h e loop. A t t h e t ime o f t h e explosion, Ntotal w i l l be cons tan t , V i nc reas - ing and Te diminishing, l ead ing t o a dec l ine of s o f t X-ray emission from t h a t loop. On magnetic f i e l d l i n e s threading h igher a l t i t u d e s , however, t h e plasma w i l l n o t y e t be thermalized, s i n c e the rma l i za t ion t ime inc reases wi th decreas- i n g mean ambient dens i ty . While we do not know t h e i n i t i a l e n e r g i e s o f t h e i n - jec ted protons, t h e c a l c u l a t i o n s of J e f f r i e s and Orrall (1965a) i n d i c a t e t h a t f o r reasonable energ ies , protons i n j e c t e d i n t o even very high loops w i t h i n t h e permanent coronal condensation should be thermalized wi th in 1 0 min. I f , a f t e r t he rma l i za t ion and t h e conjectured explosion t h e plasma may be cha rac t e r i zed by Te - lo7 "K and Ne - lox1 cm-3, we may c a l c u l a t e t h e time f o r t h e gas t o coo l t o a temperature a t which t h e H a l i n e becomes v i s i b l e , using Cox and Tucker 's (1969) emission c o e f f i c i e n t s . Assuming t h a t t h e r a t e of change of i n t e r n a l energy o f t h e gas i s approximately
dE dT
e - d t
= 3.5 N k - e r g s ~ r n - ~ s e c - ' H d t
over t h e r e l e v a n t temperature range ( H and He f u l l y i on ized ) , we f i n d t h a t Te w i l l dec l ine from 107 O K t o 5 x lo4 OK i n 1 . 5 x lo3 seconds by r a d i a t i v e processes a lone . Elec t ron conduction may a l s o be an important cool ing process . A comparison of t h e t o t a l t ime f o r t he rma l i za t ion and r a d i a t i v e cool ing i n a s i n g l e l oop ( - 35 min f o r h igh loops t o f i r s t become v i s i b l e under t h e assump- t i o n s made) w i th t h e s o f t X-ray decay t ime-sca le f o r t h e e n t i r e system ( - 220 - 240 min) does no t support a s i n g l e - i n j e c t i o n scheme.
On t h e o t h e r hand, i f the plasma i s dr iven t o Te - lo8 OK during thermal iza- t i o n of t h e pro tons , t h e t ime-sca le f o r r a d i a t i v e cool ing t o 5 x lo4 OK i s 1.8 x 1 0 1 5 / ~ , seconds. The observed t ime-sca le f o r X-ray dec l ine then r e q u i r e s N - 1.3 x 0 cm3 . While t h i s number d e n s i t y s a t i s f i e s t h e o p t i c a l observa- t i o n s ( J e f f r i e s and O r r a l l , 1965a), we can show t h a t t he s i n g l e - i n j e c t i o n model, i f it i s v a l i d , would not produce such a high k i n e t i c temperature.
I n t h e s i n g l e - i n j e c t i o n model, a l l protons w i l l be thermalized w i t h - LO min, and t h e r e f o r e before r a d i a t i v e l o s s e s have caused a s i g n i f i c a n t d e c l i n e i n

Te, i f pr omine
Te i s - lo8 OK. Kleczek. (1964) has measured t h e t o t a l volumes of l oop n c e s v > 2 x 1027 cm3. ~ h u s , an emission measure N; V > 2 x 1049 cm-3 est imated from t h e requirement Ne = 1.3 x 10" ern-3. I f Te r i s e s t o t h e r e s u l t w i l l be an enormous f l u x of hard thermal bremsstrahlung
r a d i a t i o n , which i s not observed.
The s i n g l e - i n j e c t i o n model t hen cannot be invoked t o s a t i s f y t h e s o f t X-ray observa t ions i f Ne - 10" cm-3 i n t h e loops. We have t h e a l t e r n a t i v e s of (i) supposing Ne < 1011 cm-3 or (ii) invoking an i n j e c t i o n on a longer t ime- s c a l e .
As t o t h e former a l t e r n a t i v e , t h e X-ray decay t ime may be s a t i s f i e d f o r Te = 107 OK and Ne = 1 . 2 x l o l o cm-3 a t t h e tops of t h e loops fol lowing thermal- i z a t i o n . There s t i l l remains, however, t h e d i f f i c u l t y of t h e long t ime i n t e r - v a l over which succes s ive ly h ighe r loops appear i n t h e prominence system.
No s i n g l e l oop of a major system i s seen t o en l a rge o r t o r i s e i n a l t i t u d e ; r a t h e r t h e loops seem t o appear a t succes s ive ly h igher l e v e l s . Seve ra l hours a f t e r t h e i n i t i a t i n g f l a r e , loops a r e s t i l l appearing a t h igh a l t i t u d e s , bu t a t a much reduced r a t e ( ~ r u z e k , 1964). Undoubtedly t h e very l a t e appearance of higher loops i s a s soc i a t ed w i t h longer t he rma l i za t ion t imes a t t h e h igher a l t i t u d e s and wi th a longer r a d i a t i v e cool ing time imposed by t h e lower den- s i t i e s . We suggest t h a t it must a l s o be a s soc i a t ed wi th a l a t e r i n j e c t i o n of e n e r g e t i c protons onto t h e h ighes t loops.
The protons may be s t o r e d for long per iods on magnetic f i e l d l i n e s t h a t r i s e beyond t h e i n n e r corona ( ~ e f f r i e s ' a n d Orrall, 1965b) and de l ive red t o lower f i e l d l i n e s t o produce t h e loop system. Our X-ray f luxes , which depend
2 upon Ne V, probably p r o t r a y t h e d e l i v e r y of t h e p a r t i c l e s onto t h e prominence loops r a t h e r than t h e s t o r a g e r e s e r v o i r i t s e l f . It i s not c l e a r t o us, how- ever , why p a r t i c l e s s to red on f i e l d l i n e s r i s i n g t o high l e v e l s should be de l ivered t o t h e lowes t - ly ing loops of t h e prominence system f i r s t . An a l t e r - n a t i v e t o t h e s to rage model i s t h e hypothesis t h a t pro tons cont inue t o be ac- c e l e r a t e d wi th in t h e i n i t i a t o r y f l a r e during t h e formation o f t h e loop system. Under t h i s hypothesis , ou r X-ray f l u x curves t hen show a slow i n i t i a l develop- ment and slower decay of t h e secondary a c c e l e r a t i o n mechanism.
I V . Summary
Major systems of loop prominences appear t o be product ive of s o f t X- r a d i a t i o n on a long t ime-sca le . In a t l e a s t one such system, f o r which our i d e n t i f i c a t i o n i s n o t e n t i r e l y c l ea r - cu t , t h e X-ray emission was however q u i t e weak,

We have compared observations of X-rays from two systems of loops (October 30 and 31, 1967) with two models for production of the loops. The data are not compatible with a compression-condensation model. The data are however corn- patible with the single-injection model provided (i) Ne in the loops is - 10'~crn-~, an order of magnitude lower than the value derived from optical spectra. The particle-injection model may also be invoked, on the other hand, provided (ii) the delivery of protons into the prominence system takes place on a time-scale of hours. Our data cannot distinguish between these alternatives.

BIBLIOGRAPHY
Bruzek, A. 1964. Ap. J. 140, 746.
Cox, D. P. and W. H. Tucker. 1969. Ap. J. m, 1166.
Dodson, H. W. 1961. Proc. Nat. Acad. Sci . 47, 901.
Hyder, C . Private communication.
Je f f r i es , J. T. and F. Q. Orrall . 1965a. Ap. J. - 141, 505.
. 1965b. Ap. J. 141, 519.
Kleczek, J. 1964. AAS-NASA Symposium on t he Physics of Solar Flares, NASA SP-50.
Olson, C. A. and P. S. Lykoudis. 1967. Ap. J. m, 303.
Orrall , F. Q. and J. Zirker. 1961. Ap. J. - 134, 72.
Teske, R. G. 1969. Solar Phys. - 6, 193.
Teske, R. G. 1970. Paper V of t h i s repor t .
Thomas, R. J. 1970. Dissertat ion, University of Michigan.

FIGURE CAPTIONS
Figure 1. I n t h i s summary of s o l a r da ta f o r October 30 and 31, 1967, t h e t o p panels depic t t imes of beginning, maximum and ending of repor ted f l a r e s and t h e reported t imes of swept-frequency r a d i o spectrum events. Below t h e s e i s shown t h e s o f t X-ray f lux , which i s given a s t h e energy f l u x in t eg ra ted over t h e wavelength i n t e r v a l 8 t o 1 2 A a s measured a t t he ea r th . In t h e lower h a l f of t h e f igu re , s i n g l e - frequency r a d i o b u r s t s a r e schematized according t o t h e a u t h o r ' s i n t e r p r e t a t i o n of d a t a published i n t h e Quar t e r ly Bu l l e t in of Solar Ac t iv i ty . Radio f l u x dens i ty i s measured i n u n i t s of 1 0 - ' ~ X a t t s m-2 HZ-'. The observed times of loop prominence a c t i v i t y a r e shown j u s t above t h e X-ray record.
Figure 2. a . Sacramento Peak Observatory f i l m of west limb loops, h m s 21 42 53 UT October 31, 1967. H-alpha.
b . Sacramento Peak Observatory f i l m of west limb loops, 22h34m2~s UT October 31, 1967. H-alpha.
c. Lockheed Observatory f l a r e - p a t r o l f i l m (H-alpha) taken a t 2Oh08~ UT October 30, 1967.
Figure 3. Solar d a t a summary f o r June 1, 1967. The t o p panels dep ic t f l a r e occurrence and repor ted swept-frequency rad io spectrum events. Below t h e s e we schematical ly show repor ted cm-A and dcm-A s i n g l e - frequency b u r s t s . A t t h e bottom i s t h e s o f t X-ray f l u x record. Loop prominence occurrence i s shown j u s t above t h e X-ray record .
Figure 4. Solar d a t a summary f o r May 21, 1968. F lares , swept-frequency rad io spectrum events , s ingle-frequency b u r s t s and X-ray f luxes a r e shown. Loop prominence occurrence i s shown j u s t above the X-ray f l u x record.

k-r FLARE IMF!
&i 14 g I - 4 h H k
5 0 - - 8800 Mhz
0 1 A
6 0 0 -
408 Mhz
4 0 0
2 0 0
0
50- - 2800 Mhz
0 ,
5 OF - 2700 Mhz
0 A
-
5 0 - - 1415 Mhz
0 A A A A
-
I . . . l l l l - l l ( l l l l ( l ' ~ - n c * I 1 m c s ~ I 1 . ' ' . J
1 2 ~ 0 0 ~ 18 hOOm 0 0 ~ 0 0 ~ 0 6 ~ 0 0 ~ 1 2 ~ 0 0 ~ 1 8 ~ 0 0 ~ 0 0 ~ 0 0 ~
OCTOBER 30, 1967 OCTOBER 3l, 1967
-
Figure 1


FLUX 80 -
>3000 Mhz
Figure 3
I
I A,
J E(8.12) ergs cm-' set-'
0.03-
0.02
0.01
0
0 \ A 1
-
-
'1 - - 7 1 1 T
1 8 # ~ # ~ i ~ ~ ~ * 1 1 , 8 ~ ' ' l
FLUX 80-
1000-3000 Mhz
00" 0 6 ~ I 2" 18 I-, 24
JUNE 1 , 1967
-
A i 0 +
k <

FLARE IMP.
RADIO SPECTRUM
TYPE IP
FLUX 80 - -
I LOOPS
b
E (8,121 ergs cm" sec-'
> 3 0 0 0 Mhz
FLUX 80
1000 - 3 0 0 0
Mhz
- - - - - - - -
Figure 4
0 A A
- -
0 A 1
0 . 0 2
0.01
0
- -
-
1 -
- - - ' - - A - - - I. ' ; - :
I I I
I - -
I 2 " 1 8 ~ 2 4 h 0 6 ~
MAY 21, 1968 MAY 22, 1 9 6 8

SOFT SOLAR X-RAYS AND SOLAR ACTIVITY
V. Some Evidence f o r t h e A l t i t u d e of X-Ray Source Volumes i n Solar F l a r e s
In t roduc t ion
Current ly, s o l a r f l a r e observa t ions extending from t h e X-ray r eg ion of t h e spectrum i n t o t h e longer r a d i o wavelengths a r e provding information on f l a r e s t r u c t u r e and t h e phys i ca l processes w i t h i n them. I n t e r p r e t a t i o n of t h e d a t a has l e f t some ques t ions open, however.
The a l t i t u d e of t h e f l a r e - a s s o c i a t e d hard X-ray source has been p laced by some authors a t s o l a r atmospheric l e v e l s where Ne - l09cm-3 ( ~ u d s o n , Pe terson and Schwartz, 1969). Arnoldy, -- e t a l . (1968)) have suggested t h a t t h e microwave and hard X-ray source volumes a r e coextensive, and a l s o have argued t h a t t h e
14 r a d i o d a t a alone may be c o n s i s t e n t w i t h Ne - 10 cm-3. Takakura and K a i (1966) p re sen t evidence i n favor of a cm-h and X-ray source volume a t l e v e l s where Ne - 5 x 10'~cm-3, whi le Kiepenheuer ( 1964) suggested t h a t f l a r e s occur at a l e v e l a t which Ne - 1 0 ~ ~ - 2 ~ 1 0 ~ ~ c m - 3 . Z i r in , -- e t a l . (1969), have d iscussed a n event i n which t h e hard X-ray source appeared t o be c o - s p a t i a l wi th t h e Kx source, whi le Vaiana -- e t al . (1968)) i n t e r p r e t t h e i r June 8, 1968, f l a r e photo- graph a s showing t h a t t h e I-Ix and X-ray source volumes a r e not coextens ive Est imates of t h e emission measure, J N ~ dV, f o r X-ray source reg ions vary from
48 1047cm-3 ( ~ u d s o n , e t a l . , 1969) t o a few t imes 1 0 cm-3 (Culhane and P h i l l i p s ,
1970). These a r e i n gene ra l agreement w i t h t h e s i z e s of cm-h rad io-emi t t ing sources which a r e deduced from in te r fe rometry ( Kundu, 1965)) only i f e l e c t r o n d e n s i t i e s near 109cm-3 a r e invoked.
There thus i s a s y e t no c l e a r l y gene ra l agreement a s t o t h e p o s i t i o n s and s p a t i a l o rgan iza t ion of X-ray, cm-h and Kx source volumes assoc ia ted w i t h f l a r e s , a l though t h e s e ques t ions a r e being a t tacked by experiments-in progress and planned-which observe them w i t h good angular r e s o l u t i o n . It i s p o s s i b l e , however, t o i n v e s t i g a t e t h e s e problems w i t h a n experiment having no i n t r i n s i c angular r e s o l u t i o n , i f f l a r e events t a k i n g p l ace a t and j u s t behind t h e s o l a r limb a r e observed. I n such c a s e s t h e s p a t i a l r e s o l u t i o n i s afforded by t h e sun' limb and by t h e temporal behavior of r a d i a t i o n s t h a t a r e observe_d, a l though t h e s p a t i a l d i sc r imina t ion is , of course, very crude.
This c o n t r i b u t i o n r e p r e s e n t s an at tempt t o u t i l i z e observat ions of such limb events t o supply some information about t h e r e l a t i v e he ights of T la re source volumes w i t h i n t h e s o l a r atmosphere.
The X-ray d a t a which were used were gathered wi th t h e Michigan s o f t X-ray monitor on board t h e OSO-111 ( ~ e s k e , 1969; Thomas, 1970). This instrument observed t h e s o l a r s o f t X-ray component between 8 and 1 2 a w i t h a t ime-reso lu t ion

of 1.7 seconds; t h e whole d i s k was monitored without angular r e so lu t ion . I n t h e d a t a accumulated, the re a r e a number of events of s i g n i f i c a n t X-ray ampli- tude which a s soc ia t e very poorly o r not a t a l l w i t h v i s i b l e f l a r e phenomena. Almost always a t t h e time of such events t h e r e was a f l a r e - r i c h a c t i v e cen te r on or j u s t behind t h e so la r limb. We have thereby gained t h e impression t h a t t h e OSO-I11 s o f t X-ray ion chanber a t t imes viewed X-radiation from e leva ted source volumes associa ted wi th f l a r e s which occur s l i g h t l y beyond t h e s u n ' s limb ( inf ra- l imb f l a r e s ) . This impression i s cons i s t en t wi th what i s known from s t u d i e s of SID phenomena (Dodson and Hedeman, 1964)) wi th photographs of e levated X-ray source volumes above non-flar ing a c t i v e cen te r s (Vaiana e t a l . , 1968) and wi th cu r ren t concepts of f l a r e morphology. Because our instrument has no angular d iscr iminat ion , t h e assignment of an otherwise un iden t i f i ed X-ray enhancement t o an infra- l imb f l a r e i n a p a r t i c u l a r a c t i v e cen te r has g r e a t hazards unless t h e assignment can be based upon r e l i a b l e c r i t e r i a other than simply t h e f l a re - r i chness of t h e region . However, t h e study of c o r r e c t l y - i d e n t i f i e d events can supply rewarding information.
Five X-ray events which were observed during 1967 and which l i k e l y were a s soc ia t ed wi th infra- l imb f l a r e s were se l ec ted f o r study. Each i s d iscussed ind iv idua l ly below, i n order of c r e d i b i l i t y . The assembled information suggests t h a t t h e volume i n which t h e " f l a r e impulse" or explosion occurs may, i n some f l a r e s , poss ib ly be i n t h e v i c i n i t y of an a l t i t u d e of 104km, and t h a t t h e r e i s a separa t ion of source volumes, wi th t h e s o f t X-ray source ly ing below t h e cm-A source.
Observations
A. AUGUST 18, 1967, 0 2 ~ 2 3 ~ ~ ~
Severa l major X-ray b u r s t s accompanied t h e e a s t limb passage of McMath plage #8942. A very extensive and b r i g h t plage containing l a rge and magnetical ly- complex spot groups, it appears t o have been t h e amalgamation of seve ra l f l a r e - r i c h a c t i v e cen te r s from t h e previous r o t a t i o n . During i t s d i s k passage, plage #8942, l i k e i t s parents , dominated s o l a r a c t i v i t y .
The two g r e a t e s t X-ray events observed by OSO-I11 on August 18, 1967, have t h e appearance of homologous events." The second of t h e s e accompanied an imp I n f l a r e on t h e v i s i b l e s i d e of t h e limb, beginning a t 21h31mu~. The f i r s t X-ray event began a t 0223 UT, and we have i n f e r r e d it t o have been as soc ia t ed wi th an infra- l imb f l a r e i n t h e same region.
I n Figure 1 we present t h e X-ray and rad io observat ions f o r t h e time of t h e suspected inf ra- l imb f l a r e . The r a d i o d a t a were kindly commu.nicated t o us by D r . S. Enome a t Toyokawa. During t h e important time i n t e r v a l , t h e HaleakaLa photographic f l a r e p a t r o l and t h e Ikomasan v i s u a l p a t r o l were i n opera t ion .
*This was i n i t i a l l y pointed out t o us by D r . Hugh Hudson. 102

Both observator ies repor ted a subf l a re a t t h e e a s t limb. D r . John J e f f r i e s has very kindly made a v a i l a b l e t o us copies of t h e Haleakala f i l t rohe l iog rams . These show t h e appearance of a small f l a r e (p ro jec ted a rea - 100 mi l l ion ths of t h e d i s k ) from behind t h e e a s t limb a t 0239 UT, i t s maximum a t 0248 UT ( s e e Figure 2) and i t s disappearance a t 0306 UT.
Although o ther f l a r i n g a c t i v i t y was going on i n plage #8940 on t h e v i s i b l e d i s k around t h e t imes of i n t e r e s t t o us, it i s d i f f i c u l t t o a s soc ia t e t h e major r a d i o and X-ray b u r s t s t h a t were observed wi th t h a t v i s i b l e a c t i v i t y i f we use t h e t iming and r e l a t i v e f l u x amplitude c r i t e r i a t h a t have been es t ab l i shed f o r t h e s o f t X-rays and cm-h b u r s t s ( ~ e s k e and Thomas, 1969). On t h e o ther hand t h e same c r i t e r i a a r e a l s o v i o l a t e d by t h e very l a t e appearance of t h e limb f l a r e and by i t s small a rea , bu t i f we p o s t u l a t e t h a t t h e v i s i b l e limb phenom- enon was a p a r t of a l a r g e r inf ra- l imb f l a r e , t h e v i o l a t i o n s may be explained.
By intercomparing d a t a from t h e Michigarz s o f t X-ray photometer and t h e Universi ty of Ca l i fo rn ia hard X-ray counter (which a l s o observed t h e event from OSO-111) we have e rec ted c r i t e r i a f o r judging t h e consistency of behavior of f l a r e events . By t h e s e c r i t e r i a f o r v i s i b l e f l a r e s , t h e s o f t X-rays, hard X-rays and cm-h f l u x f o r t h i s f l a r e a r e a l l i n genera l agreement wi th one another a s regards r e l a t i v e s t a r t i n g times, t imes of maxima and r e l a t i v e peak f luxes ( o r spectrum). Moreover, t h e event showed decided impulsive c h a r a c t e r i s t i c s a t those wavelengths t h a t were observed. However, no swept-frequenc y m-h events (Types 11, 111, o r IV) were repor ted near t h e t imes of i n t e r e s t , a l though Sydney was observing.
I n our i n t e r p r e t a t i o n of t h i s event, both t h e region of t h e " f l a r e impulse" or explosion and most or a l l of t h e X-ray and r a d i o source volumes were above t h e s o l a r limb and were v i s i b l e a t t h e ea r th . The magnitude of these emissions toge the r w i t h t h e l a t e appearance, small p ro jec ted a rea and feeb le b r igh tness of t h e ILx aspect suggests t h a t only a p a r t of a l a rge r , lower-lying o p t i c a l source was seen a t v i s u a l wavelengths.
We have est imated t h e longi tude of t h e f l a r e t o have been 9' (+3',-6") behind t h e s o l a r limb by p l o t t i n g t h e longi tudes of subsequent f l a r e s , f i t t i n g them t o a l i n e of slope equal t o t h e r a t e of s o l a r r o t a t i o n a t t h e f l a r e s ' mean l a t i t u d e and by ex t rapo la t ing t h e l i n e back t o t h e t ime of r a d i o bur s t onset .
4 Thus, he ights down t o wi th in - 10 km above t h e f l a r e were being observed. The 4 v i s i b l e p a r t of t h e f l a r e may have extended t o - 2.0 x 10 km above i t s base.
McMath plage region #8818 t r a n s i t e d t h e d i s k during t h e l a t t e r ha l f of May, 1967. One of t h e most a c t i v e regions of 1967, it produced two PCA events (May 23 and May 28) and many o the r major f l a r e s . By May 30, f l a r i n g was most pronounced i n t h e western p a r t of t h e region so t h a t during i t s west limb passage on May 31, June 1 and 2, t h e most a c t i v e por t ions s e t behind t h e limb f i r s t .

On June 1 a s t rong s o f t X-ray enhancement began a t 0700 UT, near t h e t ime of a major b u r s t on 2000 MHz which was not i d e n t i f i a b l e wi th a v i s i b l e ED f l a r e ( s e e Figure 3) . The X-ray background remained high u n t i l a t l e a s t 1500 UT. A loop prominence system was subsequently observed on t h e west limb i n t h e p o s i t i o n angle of plage $8818 ( ~ e s k e , 1970). The loop system was we l l developed by 1103 UT when cinematographic observat ions were commenced a t McMath-Hulbert Observatory,
We have i n f e r r e d from t h e s e observat ions t h a t a n infra- l imb f l a r e probably occurred i n plage #8818 behind t h e west limb. The est imated f l a r e longi tude i s
4 w98O (-+6"), so t h a t he ights down t o - 10 km above t h e f l a r e were being observed.
Although t h e r a d i o b u r s t on 2000 MHz was s t rong (485 f l u x u n i t s ) and impul- s ive, t h e r a d i a t i o n a t higher frequencies was weaker and l e s s impulsive, implying an unusual radio-frequency spectrum. The accompanying s o f t X-ray burs t , between CT(00-CT(30 UT, was cha rac te r i zed by a slow r i s e having a l e s s s teep slope than i s usua l ly found i n a s soc ia t ion wi th major cm-h and dcm-h burs t s . The X-ray max- i m u m occurred -> 20 min a f t e r t h e 2000 MHz maximum, very long i n comparison wi th b u r s t s accompanying v i s i b l e f l a r e s (Teske and Thomas, 1969) Our da ta i n d i c a t e t h a t t h e s o f t X-ray maximum may have occurred near O9OO UT, but t h i s maximum i s probably contaminated t o an unknown extent by X-rays from a subf l a re and l i k e l y conta ins a component associa ted wi th t h e loop prominence system a s we l l (Teske,
1970). When we t a k e t h i s i n t o account, however, we f i n d t h a t t h e s o f t X-ray amplitude a s soc ia t ed wi th t h e r a d i o b u r s t i s not i n disaccord wi th t h e 3100 MHz b u r s t a q l i t u d e (Teske and Thomas, 1969).
Our i n t e r p r e t a t i o n of t h e s e observations, t h e r e l a t i v e l y slow X-ray r i s e and i t s delayed maximum which eventual ly reached a f l u x l e v e l appropr ia te t o t h e cm-h amplitude, i s t h a t t h e 2000 MHz source l a y a t atmospheric l e v e l s above t h e s o f t X-ray source, which t h e n rose o r expanded u n t i l a major f r ac t ion , at l e a s t , was v i s i b l e from e a r t h . The impulsive volume of t h e 2000 MHz source l a y at
4 a l t i t u d e s N> 1 0 km, a conclusion t h a t i s cons i s t en t wi th t h e e l ec t ron d e n s i t y model of t h e s o l a r atmosphere. The i n f e r r e d expansion or upward propagation of t h e s o f t X--ray source volume may be connected w i t h t h e subsequent formation of t h e system of loop prominences.
During i t s t r a n s i t of t h e western s l d e of t h e s o l a r d isk , &Math p lage region #9034 developed i n t o a r i c h l y - f l a r i n g a c t i v e cen te r ; t h e incumbent spot group was c l a s s i f i e d a s 8 on October 26 (and was not c l a s s i f i e d again u n t i l very c l o s e t o t h e limb on October 29, when it was described a s B ) . The increas- ing pace of v i s i b l e f l a r i n g a c t i v i t y a f t e r October 25 was culminated by a f l a r e of importance 2 on October 29 which was associa ted wi th a major cm-h impulsive bur s t followed by a strong, long-enduring pos t -burs t phase and repor ted loop prominences .
Two long-l ived s o f t X-ray enhancements were observed on October 30 and 31, during and a f t e r west limb passage of t h e region. Both events were accompanied by t h e appearance of major loop prominence systems (Teske, 1970).

The s o f t X-ray, r a d i o and o p t i c a l d a t a ?'or t h e two days a r e summarized i n Figure 4. I n t h e f igu re , t h e d e c l i n e i n X-ray background i s caused by t h e d i s - appearance of r eg ion #9034 behind t h e sun ' s limb. The s h o r t e r X-ray b u r s t s accompanied f l a r e s i n o the r a c t i v e c e n t e r s on t h e v i s i b l e d i s k ,
We f i r s t d i s c u s s t h e October 30 event .
The imp I n f l a r e i n #9034 on October 30 (1317-1320-1407 uT) apparent ly was unaccompanied by a s t rong s o f t X-ray b u r s t o r r a d i o b u r s t . ( 1n f l a r e s , gene ra l ly , a r e p o r t a b l e cm-h b u r s t i s accompanied by a d e t e c t a b l e s o f t X-ray b u r s t , a l though a weak X-ray b u r s t i s not n e c e s s a r i l y accompanied by a r e p o r t a b l e cm-h b u r s t . I n t h e mode of ope ra t ion of our photometer during October 30 and 31, X-ray b u r s t s of s m a l l amplitude - ~ E ( 8 , 1 2 ) 50.001 e r g s cm-2sec-1- would not have been recorded. Such smal l X-ray b u r s t s a r e not u s u a l l y accompanied by r e p o r t a b l e cm-h e v e n t s . ) The McMath f l a r e p a t r o l f i l m s s t a r t at 1401 UT and show an a c t i v e prominence ak t h e limb p o s i t i o n of #9034. A c t i v i t y i n t h e r eg ion cont inued s p o r a d i c a l l y dur ing t h e day on our f i l m s w i t h small surges, t h e development of a small e r u p t i v e prom- inence and muted b r igh ten ings a t t h e limb. None of t h e s e suggest themselves a s obvious sources f o r t h e prolonged slow r i s e i n X-ray f l u x t h a t began at about 1600 UT. An ADF repor t ed by Sacramento Peak Observatory ( ~ 2 4 E42) between 1654 UT and 2400 UT i s i n t h e wrong d i s k p o s i t i o n t o have produced t h e X-rays, which were observed t o come from t h e west limb by an angular ly- reso lv ing experiment on board OSO-IV ( ~ r e i g e r , 1969) .
However, Sacramento Peak r epor t ed p o s s i b l e very f a i n t loops a t t h e pos i - t i o n of #9034 between 165LE UT and 1746U UT and b r i g h t loops seen edgewise between 2Ol9E UT and 2400D UT. The loops were not p re sen t on exposures made a t 1813 UT. The system can be seen f a i n t l y on McMath f l a r e p a t r o l f i l m s begin- ning a t 1850 UT and developed slowly u n t i l t h e end of observa t ions a t 1956 UT. D r . Charles Hyder has k ind ly re-examined t h e Sacramento Peak f i l m s and r e p o r t s t h a t t h e loop system was f a i n t (-0.1 chromospheric i n t e n s i t y i n HX) when f i r s t seen when clouds c l e a r e d a f t e r 2019 UT, and t h a t t h e loops extended t o an a l t i - t ude of 1 . 0 x 105 k m by 2201 UT reaching, 1 .2 x 105 k m by 2315 UT (Hyder, 1969).
Lockheed Observatory repor ted a f l a r e i n #9034 a t (1959-2008-2035 UT). F igure 5c reproduces t h e Lockheed HX frame exposed a t 2008 UT showing t h e r epo r t ed f l a r e extending from t h e northwest limb i n t h e d i s k f i e l d of t h e photograph and t h e f e a t u r e which i s i d e n t i f i e d a s t h e loop prominence system i n t h e l imb f i e l d of t h e photograph. M r . Samuel Mi l le r very k indly made t h e photograph a v a i l a b l e t o us . The f l a r e i n F igure 5c occurred a f t e r t h e loop prominence system was a l r eady well-developed.
Loop prominences a r e u sua l ly a s s o c i a t e d w i t h t h e l a t e phases of f l a r e s of imp 2 and 3 (Bruzek, 1964) e s p e c i a l l y w i t h those tha,t produce Type I V r a d i a t i o n ( ~ o d s o n , 1961), al though Bruzek's l i s t shows t h a t loop systems a t t h e limb a r e seldom accompanied by Type I V (Bruzek, 1964). The absence of Type IV emission i n t h e p re sen t c a s e ( s e e below) does not s t rong ly m i l i t a t e a g a i n s t an in fe rence t h a t a major f l a r e occurred j u s t behind t h e limb, whi le t h e major system of loop prominences would appear t o be s u f f i c i e n t evidence f o r t h i s in ference . No d e f i n - i t i v e o p t i c a l evidence, o the r t han t h e loop system, can be c i t e d .
105

A t 1725 UT a low b r i g h t mound was seen on our EX f l a r e p a t r o l f i lms i n t h e limb p o s i t i o n of p lage #9034. It became r e l a t i v e l y prominent a t 1737 UT, reached a maximum height and br ightness a t 1759 UT when two small surges devel-
oped, and had subsided by 1850 UT when t h e f i r s t evidence f o r t h e loops could be seen. We do not regard t h i s evidence a s d e f i n i t i v e . The major cm-A burs t began a t 1737+ UT and reached a peak (-50 f l u x u n i t s on 2800 MHz) a t -1754 UT. During t h i s interval-1724 t o 1824 UT-the X-rays displayed a slow monotonic r i s e . Such a r e l a t i o n s h i p between t h e cm-h bur s t component and s o f t X-rays i s not a t a l l l i k e t h a t developed f o r v i s i b l e f l a r e s (Teske and Thomas, 1969), The r a d i o b u r s t s and X-rays t h u s cannot e a s i l y be associa ted wi th t h e v i s i b l e subf l a re t h a t occurred i n plage $9041 near these t imes (1707-1724-1754 UT),
Type I11 b u r s t s were occurr ing sporad ica l ly i n t h e i n t e r v a l 1429-1530 UT, somewhat e a r l i e r than t h e t imes of i n t e r e s t . Type I and continuum were repor ted throughout t h e i n t e r v a l 1330-2340 UT. Type I V was not repor ted , and t h e Fort Davis records were generously re-examined by D r . Maxwell, who again repor ted no evidence of any kind f o r Type I V o axw well, 1969). Thus t h e r e i s no i n d i r e c t evidence f o r an acce le ra t ion event t h a t would have produced an impulsive component.
It seems t o us l i k e l y t h a t t h e bulk of t h e s o f t X-radiat ion observed i n t h i s event and t h a t on October 31 was associa ted wi th t h e loop prominenece systems ( ~ e s k e , 1970). We note t h a t t h e cm-h bur s t , i f it had accompanied a f l a r e on t h e v i s i b l e d isk , would be expected t o be associa ted w i t h a s o f t X-ray bur s t of amplitude ~E(8,12)-0.03 - 0.04 e rgs cm-2sec-1, and i n reasonable time- a s soc ia t ion (Teske and Thomas, 1.969). Because no X-ray b u r s t was seen with t h e cm-h bur s t , t h e X-ray source volume associa ted wi th t h e cm-h source may have been a t atmospheric l e v e l s below t h e cm-h source and p a r t i a l l y o r wholly hidden by t h e s u n ' s limb.
I n summary, we i n f e r on t h e evidence of t h e loop prominences and t h e cm-h event t h e occurrence of a major inffra-limb f l a r e on October 30, beginning p r i o r t o 1850 UT and perhaps a s e a r l y a s 1737 UT, when t h e cm-h b u r s t began. The absence of a sharp inc rease i n s o f t X-ray f l u x a t t h e t ime of t h e 1737 UT r a d i o bur s t suggests a separa t ion of source volumes, wi th t h e s o f t X-ray source volume being t h e lower. We have estimated, again by p l o t t i n g f l a r e longi tudes and ex- t r a p o l a t i n g , t h a t t h e i n f e r r e d f l a r e occurred 9" (+2", -7') behind t h e limb,
4 g iv ing a s a g i t t a l height of -10 km, I f we specula te t h a t t h e loop prominences a r e evidence f o r an acce le ra t ion event, and t h a t an impulsive phase must have taken p lace , t hen t h e impulsive volume l a y below t h e lo4 km l e v e l . The absence of Type I1 and Type I V emissions a r e arrayed aga ins t t h i s speculat ion, however, a l t h ~ u g h it i s unusual f o r loops a t t h e limb t o be associa ted wi th Type I V (Bruzek, 1964). Yet we note t h e previously-discussed event of August 18, 1967, had an impulsive component without g iv ing r i s e t o Type 11, 111, or I V r a d i a t i o n s .
D. OCTOBER 31, 1967
A loop prominence system was observed o p t i c a l l y on October 31 a t t h e north- west limb p o s i t i o n of p lage #9034, and a slow X-ray event l i k e t h a t of t h e pre- vious day was aga in recorded i n t ime-assoc ia t ion w i t h t h e o p t i c a l event ( ~ i g u r e 4 ) . We i n f e r from t h e occurrence of t h e loops t h a t a major in f ra - l imb f l a r e took p lace , beginning p r i o r t o 1912 UT, when t h e f i r s t f a i n t t ops of t h e loop system were seen (Hyder, 1969) .
The loop system extended t o 20,000-30,000 km a l t i t u d e above t h e limb by 1916 UT and t o 40,000 km by 1924 UT, reaching maximum br igh tnes s by 1945-1955 UT
( m d e r , 1969). We es t ima te t h a t t h e i n f e r r e d f l a r e took p l ace 23' (+TO, -9') 4 behind t h e limb, g i v i n g a s a g i t t a l height of -6 x 1 0 km. Thus t h e loop system
probably extended t o -105 km above t h e f l a r e r eg ion by 1924 UT. The system, l i k e i t s predecessor on t h e day before , t hus ranks among t h e t a l l e s t loop systems d i s - cussed by Bruzek (1964). f i l t rohe l iog rams t aken a t Sacramento Peak have been
communicated t o us by D r . Q d e r , and a r e reproduced i n F igures 5a and 5b.
No Type I11 o r Type I V r a d i a t i o n was observed on October 31 t h a t might be connected w i t h t h i s event . There was no impulsive p a r t t o t h e cm-h b u r s t . A weak cm-h event t h & t was i n progress near 1300 UT (Figure 4) may be a s soc i a t ed w i t h sub f l a r ing a c t i v i t y on t h e v i s i b l e d i sk . The long-l ived byt weak 2700 MHz b u r s t which began j u s t a f t e r 1700 UT has no i d e n t i f i a b l e o p t i c a l coun te rpa r t and may be a s soc i a t ed i n some way w i t h t h e i n f e r r e d f l a r e .
Generally, f l a r e s accompanied by major systems of loop prominences a r e major f l a r e s of l a r g e a r e a which g ive r i s e t o s t rong cm-h r a d i a t i o n and t o s t r o n g X-radiat ion. We specu la t e t h a t on October 31, 1967, such a f l a r e d id occur, and t h a t t h e weak o r absent X-radiat ion and weak cm-h r a d i a t i o n s t i p u l a t e s t h a t t h e bulk of t h e X-ray and cm-h sources l a y below a n atmospheric l e v e l of - 6 x 10⁵ km. Subsequent t o t h e main f l a r e onset an expansion o r outward propagat ion of t h e s o f t X-ray source volume may have taken p l ace t h a t s h i f t e d t h e s o f t X-ray source t o l e v e l s above t h e limb t h a t made it v i s i b l e from t h e ea r th . A l t e r n a t i v e l y we may specula te t h a t t h e a c t i v e volume inco rpora t ing t h e loop prominences became a source of s o f t X-radiat ion a f t e r t h e main f l a r e phase. Since a motion of t h e
X-ray source i s un l ike ly , we p r e f e r t h e l a t t e r i n t e r p r e t a t i o n ( Teske, 1970).
E. JULY 11, 1967, 2 0 ~ 3 5 ~ UT
On J u l y 11, 1967 t h e r e occurred a weak, slow X-ray enhancement i n assoc ia- t i o n w i t h a small cm-h b u r s t and a Type I V dkm-h event . The d a t a a r e summarized i n F igure 6. During t h e t ime i n t e r v a l of i n t e r e s t no s i g n i f i c a n t a c t i v i t y was v i s i b l e i n our Kx f l a r e - p a t r o l records on t h e d i s k or on t h e limb. Because of t h e i n t e r v e n t i o n o f s a t e l l i t e n ight , we do not know i f t h e X-ray event had an impulsive component. There was no X-ray a c t i v i t y seen during t h e previous day- l i g h t pass , 1917-1948 UT. Although f o r our observa t ions we have no o p t i c a l or o the r d a t a t o a i d i n a s c r i p t i o n of t h e phenomena t o an inf ra - l imb f l a r e i n any

region, t h e importance of t h e occurrence of Type I V and s o f t X-rays i n c l o s e a s s o c i a t i o n without a v i s i b l e f l a r e has captured our a t t e n t i o n . There were then no r eg ions behind t h e e a s t limb t h a t had been f l a r e - p r o l i f i c dur ing t h e i r p re- v ious a p p a r i t i o n nor t h a t would be f l a r e -p roduc t ive a f t e r t h e i r e a s t limb passage i n Ju ly . There a r e , however, two candida tes t h a t were then behind t h e west limb t h a t might have produced a major f l a r e .
1, Plage #8871 ( L a t i t u d e ~28)
This reg ion ( C M P J u l y 1.3) w i t h i t s incumbent l a r g e a spot rounded t h e northwest limb on J u l y 8. While it was v i s i b l e on t h e d isk ,only a few s u b f l a r e s were seen p r i o r t o J u l y 5, when i t s pace of f l a r i n g picked up and cont inued mod- e r a t e l y h igh u n t i l west limb passage. These f l a r e s were of imp 1 and I-. Af t e r J u l y 5 t h e spot w a s b i f u r c a t e d and diminished, a l though t h e t r a i l i n g p a r t of t h e p l age grew i n br ightness . The f l a r e s took p l a c e p r e f e r e n t i a l l y i n a p a r t of t h e p l age preceding t h e a spot which rounded t h e limb on t h e 7 t h and w i t h i n t h e newly- developing t r a i l i n g p a r t of t h e p lage which rounded t h e limb on t h e 8 t h - Bgr J u l y 7, a l l f l a r e s were occurr ing i n t h e t r a i l i n g region, a n observa t ion t h a t may however be due t o t h e extreme limbward p o s i t i o n of t h e l a r g e a spot . I n i t s next a p p a r i t i o n a t t h e e a s t limb on J u l y 21 t h e reg ion was b r i g h t and ex tens ive , i n - co rpo ra t ing a l a r g e and magnet ica l ly complex spot group. This daughter plage, des igna ted #8905, dominated s o l a r a c t i v i t y during l a t e J u l y and e a r l y August. A t i t s subsequent e a s t limb appearance on August 18, t h e r eg ion was des igna ted #8942 and gave r i s e t o t h e f i r s t event s tud ied i n t h i s communication.
I f a f l a r e i n t h i s reg ion d i d a c t t o produce t h e observed Type I V and X-radiat ion, it must have taken p l a c e roughIy4O0 behind t h e west limb, and t h e e m i t t i n g s t r u c t u r e s have t o have r i s e n - 2.5 x 10⁵ km t o become at l e a s t par- t i a l l y v i s i b l e t o t h e e a r t h . While t h i s r a t h e r extreme, such s t r u c t u r e s have been observed a t r a d i o f requencies ( ~ u n d u , 1965). Se l ec t ion of t h i s r eg ion t o exp la in t h e observa t ions t h e n r e q u i r e s t h a t t h e observed Type IV and X-rays a r i s e i n a volume conta in ing r e l a t i v i s t i c e l e c t r o n s t h a t extends a s i g n i f i c a n t f r a c - t i o n of a s o l a r r a d i u s out i n t o t h e corona. It t h e n becomes d i f f i c u l t t o under- s t and t h e s h o r t du ra t ion of t h e cm-A b u r s t r e l a t i v e t o t h e d u r a b i l i t y of t h e o the r r a d i a t i o n s .
2 Plage #8875 ( L a t i t u d e 522)
The sunspot group i n p l age #8875 (CMP J u l y 4.5) underwent r a p i d growth 02 J u l y 1 and 2. On t h e 4 t h and 5 t h cons iderable f l a r i n g a c t i v i t y was observed i n it, w i t h f l a r e s a l l of imp < - 1. On t h e 9 t h an imp l b f l a r e was repor ted , whi le on Ju ly 11 one cinematographic f l a r e p a t r o l s t a t i o n (cape) r epo r t ed an imp 2n f l a r e on t h e limb a t 1027 UT. We have no X-ray d a t a f o r t h a t t ime. The spot group, r epo r t ed 8 on t h e 5 t h and 7 t h , had s imp l i f i ed t o a by west limb passage on t h e 1 0 t h of Ju ly .

Ascr ip t ion of t h e observed Type I V and s o f t X-rays t o an in f r a - l imb f l a r e i n t h i s reg ion poses l e s s he ight d i f f i c u l t i e s t han does a s c r i p t i o n t o p lage
#8871. Extrapolated f l a r e longi tudes i n d i c a t e it should have taken p l ace 11" 4 (42") behind t h e limb; s a g i t t a l he ights down t o 2 x 10 km were being observed.
That no v i s i b l e f l a r e was observed i s c o n s i s t e n t w i t h t h e observa t ions of August 18, 1967 and October 30, 1967, a l r eady d iscussed . Fur ther , t h e r e l a t i v e amplitudes of cm-h b u r s t and s o f t X-ray b u r s t a r e gene ra l ly i n accord wi th t h e r e l a t i o n e s t a b l i s h e d f o r v i s i b l e f l a r e s , a l though t h e r e l a t i v e t imes of maxima a r e i n v i o l a t i o n of t h e e s t a b l i s h e d r e l a t i v e t iming f o r maxima. The observa- t i o n of Type I V r a d i a t i o n l eads us t o be l i eve t h a t a p a r t i c l e a c c e l e r a t i o n event t ook p l ace . While our X-ray d a t a do not r u l e out a n impulsive phase, t h e 2800 MHz d a t a k indly s e n t t o u s by D r . Covington show t h a t t h e r e was no impulsive phase a t cm-h. Thus, i f an a c c e l e r a t i o n event d i d occur, it must have taken p l a c e a t a l t i t u d e s below 2 x lo4 km, i f we wish t o a s s i g n t h i s event t o a n i n f r a - l i m b f l a r e i n p l ace #8875.
Summary
Sof t X-ray, radio-frequency and o p t i c a l observa t ions have been descr ibed f o r f i v e i n f e r r e d inf ra - l imb f l a r e events .
4 On August 18, 1967, s o l a r atmospheric l e v e l s down t o - 10 k m were observed i n t h e event. A p o r t i o n of t h e ID f l a r e was seen above t h e limb and bo th t h e cm-A and X-rays were s t r o n g l y impulsive, The i n t e r r e l a t i o n s among t h e b u r s t t iming and amplit,udes were such a s t o suggest t h a t most o r a l l o f t h e source volumes were v i s i b l e t o t h e e a r t h .
4 I n t h e event of June 1, 1967, atmospheric l e v e l s down t o - 10 km were aga in observed. While t h e 2000 MHz b u r s t w a s s t r o n g l y impulsive, t h e s o f t X-rays were not , and we have i n f e r r e d a s epa ra t ion of source volumes w i t h t h e cm-h source l y i n g a t o r above lo4 km a l t i t u d e , and t h e i n i t i a l X-ray source below t h i s . Dur- i n g t h e event, t h e X-ray source appears t o have expanded t o higher l e v e l s , a phenomenon t h a t was probably a s soc i a t ed w i t h formation of a system of loop prominences .
4 Atmospheric l e v e l s down t o - 10 km were aga in observed on October 30, 1967. The cm-h and s o f t X-ray b u r s t s were not s t rong ly impulsive, a l though t h e occur- r ence of loop prominences may r e q u i r e t h a t an a c c e l e r a t i o n event d id occur. The d a t a aga in suggest a s e p a r a t i o n of source volumes, w i th t h e g r e a t e r p a r t of t h e s o f t X-rays a s s o c i a t e d w i t h t h e main f l a r e phase being generated below t h e s a g i t - t a l l e v e l whi le a t l e a s t a p a r t of t h e em-h source was loca t ed above t h a t a l t i t u d e , The slow development of t h e s o f t X-ray enhancement was a s soc i a t ed w i t h formation of loop prominences.

On October 31, 1967, atmospheric l e v e l s below 6 x lo4 km were unobservable. The d a t a suggest t h a t dur ing t h e i n f e r r e d main f l a r e phase both t h e s o f t X-ray and em-A sources l a y below t h a t a l t i t u d e . A s on October 30, a slow development of s o f t X-radiat ion was a s soc i a t ed w i t h a ma.jor loop prominence system.
The J u l y 11, 1967 cannot be a sc r ibed r e l i a b l y t o an i n f e r r e d inf ra - l imb f l a r e i n any p a r t i c u l a r a c t i v e c e n t e r .
It i s not advisable t o gene ra l i ze on b a s i s of t h i s small sample of observed phenomena, e s p e c i a l l y s i n c e an obse rva t iona l s e l e c t i o n has s t rong ly b i a sed t h e choice of events towards those i n f e r r e d inf ra - l imb f l a r e s which g ive r i s e t o loop prominence systems. It has not escaped our no t i ce , however, t h a t among t h e f i r s t t h r e e events discussed, a l l having roughly t h e same s a g i t t a l he ight
4 of LO km, only t h a t event having a c l e a r l y i d e n t i f i a b l e ED coun te rpa r t above t h e limb d isp layed impulsive c h a r a c t e r i s t i c s i n both cm-A and s o f t X-rays. This comment w i l l apply i f we choose t o a s c r i b e t h e J u l y 11, 1967, event t o a f l a r e i n p l age #8875, a l s o . The d a t a suggest t h a t t h e volume i n which t h e " f l a r e i m - pu lse" o r explos ion occurs c e r t a i n l y l i e s below 6 x 10⁴ km a l t i t u d e , and may i n
4 some f l a r e s l i e i n t h e v i c i n i t y of h = 1 0 km, a s on October 30, 1967.
It i s a p l easu re t o thank t h e fol lowing people who shared t h e i r d a t a and/or comments concerning t h e events d i scussed: D r . Arthur Covington, ARO, Nat iona l Research Council, Canada; D r . S. Enome, The Research I n s t i t u t e of Atmospherics, Nagoya Univers i ty ; D r . Charles Hyder, Sacramento Peak Observatory; D r , John J e f f r i e s and Mrs. Marie McCabe, I n s t i t u t e f o r Astronomy, Univers i ty ofHawaii; D r . A.Kreiger, American Science and Engineering; D r . Alan Maxwell, Harvard Radio Astronomy S t a t i o n ; M r . Samuel Mi l le r , Lockheed C a l i f o r n i a Company; D r s . L. E. Peterson and H. S. Hudson, The Univers i ty of C a l i f o r n i a a t La J o l l a .

BIBLIOGRAPHY
Arnoldy, R. L., S. R. Kane, and J. R. Winckler. 1968. Ap, J. - 151, 711.
Bruzek, A. 1964. Ap. J. - 140, 746.
Culhane, J. L. and K. J.H. P h i l l i p s . 1970. Solar Physics - 11, 11'7.
Dodson, H. W. and E. R. Hedeman. 1964. P1. and Sp. Sci . l2, 393.
Hudson, H. S., L. E. Peterson, and D. A. Schwartz. 1969. AP. J. '157, 389.
Hyder, C. R. 1969. Personal communication.
Kiepenheuer, K. 0. 1964. AAS/NASA Symposium on t h e Physics of Solar F la res , NASA SP-50.
G e i g e r , A. 1969. Personal cornmunicat ion.
Kundu, M. R. 1965. Solar Radio Astronomy, In te r sc i ence Publishers , New York.
Maxwell, A. 1969. Personal communication.
Takakura, T. and K. Kai. 1966. Pubs. Astron. Soc. Japan - 18, 57.
Teske, R. G. 1969. Solar Physics 6, 193.
Teske, R. G. 1 g 0 . Paper I V of t h i s r epor t .
Teske, R. G. and R. J. Thomas. 1969. Solar Physics - 8, 348.
Thomas, R. J. 1970. Disser ta t ion , The Universi ty of Michigan.
Vaiana, G. S. W. P. Reidy, T. Zehnpfennig, L. Van Speybrock, and R. Giacconi. 1968. Science, 161, 564.
Zi r in , H., W. Ingham, H. Hudson, and D. McKenzie. 1969. Solar Physics 2, 269.

FIGURE CAPTIONS
Figure 1. The August 18, 1967, s o f t X-ray burst-portrayed i n t h e t o p panel- s a tu ra t ed our OSO-I11 de tec to r f o r 8 min. A change i n s lope on t h e ascending branch of t h e X-ray f l u x curve occurs a t t h e time of t h e second component of t h e r a d i o bur s t . X-ray f l u x i s given a s t h e energy f l u x in t eg ra ted over t h e wavelength i n t e r v a l 8 t o 12 .k a s measured a t t h e e a r t h - Radio f l u x dens i ty i s measured i n u n i t s of
wa t t s rn-2~z-l .
Figure 2. H-alpha f l a r e p a t r o l frame taken a t Haleakala a t 0 2 ~ 4 8 ~ UT August 18, 1967. Solar nor th i s a t t h e top, e a s t t o t h e l e f t . The repor ted limb subf l a re may be seen on t h e e a s t limb.
Figure 3. A t t h e t o p of t h i s summary of s o l a r d a t a f o r June 1, 1967, we dep ic t t h e t imes of beginning, maximum and ending repor ted f o r f l a r e s . Radio spectrum events a r e shown below t h e f l a r e d a t a , On t h i s da te , only Type 111 b u r s t s were repor ted i n t h e Quar t e r ly Bu l l e t in of Solar A c t i v i t y (QB). Centimetric and decimetr ic wavelength r ad io b u r s t s a r e shown schematically, according t o t h e au thor ' s i n t e r p r e t a t i o n of d a t a published i n t h e QB. A t bottom i s t h e s o f t X-ray f lux . The loop prominence system was seen i n progress a t 1103 UT, ending by about 2040 UT.
Figure 4. Summary of d a t a f o r October 30 and 31, 1967. Reported f l a r e s and r a d i o spectrum events a r e shown a t t h e top . Below t h e s e i s shown t h e s o f t X-ray f l u x record and i n t h e lower h a l f of t h e f i g u r e we schematize single-frequency b u r s t s a s repor ted i n t h e QB. Times of observed loop prominence a c t i v i t y a r e shown j u s t above t h e X-ray record.
Figure 5. a . Loops i n H-alpha a t 2 1 ~ 4 2 ~ 5 3 ~ UT, October 31, 1967. Sacramento Peak f i lm.
b. Loops i n H-alpha a t 22h3hm20s UT, October 31, 1967. Sacramento Peak f i lm.
c . F la re -pa t ro l frame i n H-alpha, 2oh08m UT October 30, 1967. Lockheed Observatory f i lm. The f e a t u r e i d e n t i f i e d a s a system of loop prominences i s a t t h e lower l e f t , poin t ing a t t h e c lock image.

Figure 6. Data f o r J u l y 11, 1967, showing r epor t ed course of dekameter Type I V b u r s t , s o f t X-ray f l u x and 2700 MHz record . No f l u x s c a l e i s pro- vided f o r t h e l a t t e r , bu t t h e s c a l e may be judged from t h e r epo r t ed amplitude of t h e 2800 MHz b u r s t at 2043 UT: 2.6 f l u x u n i t s . The X-ray d e t e c t o r changed i t s energy s e n s i t i v i t y a t 2040 UT and aga in at; 2206 uT.

TOYOKAWA , JAPAN
Figure 1

Figure 2

FLARE IMP. 2
I Il-r 14 1 4 C - r S At14 Ah t 4 t 4 1 4 14k 14 H L-I 14 Li IL-ItL-r 3
111 ' NoN Dato ' 1 FLUX 80-
- >3000 Mhz
0 \ A h, A
* LOOPS i
FLUX 80
1000 - 3000 Mhz
E(8,12) ergs cm-': sec-'
- -
-
JUNE 1 , 1967
t'igure 3
0 h \ /4C
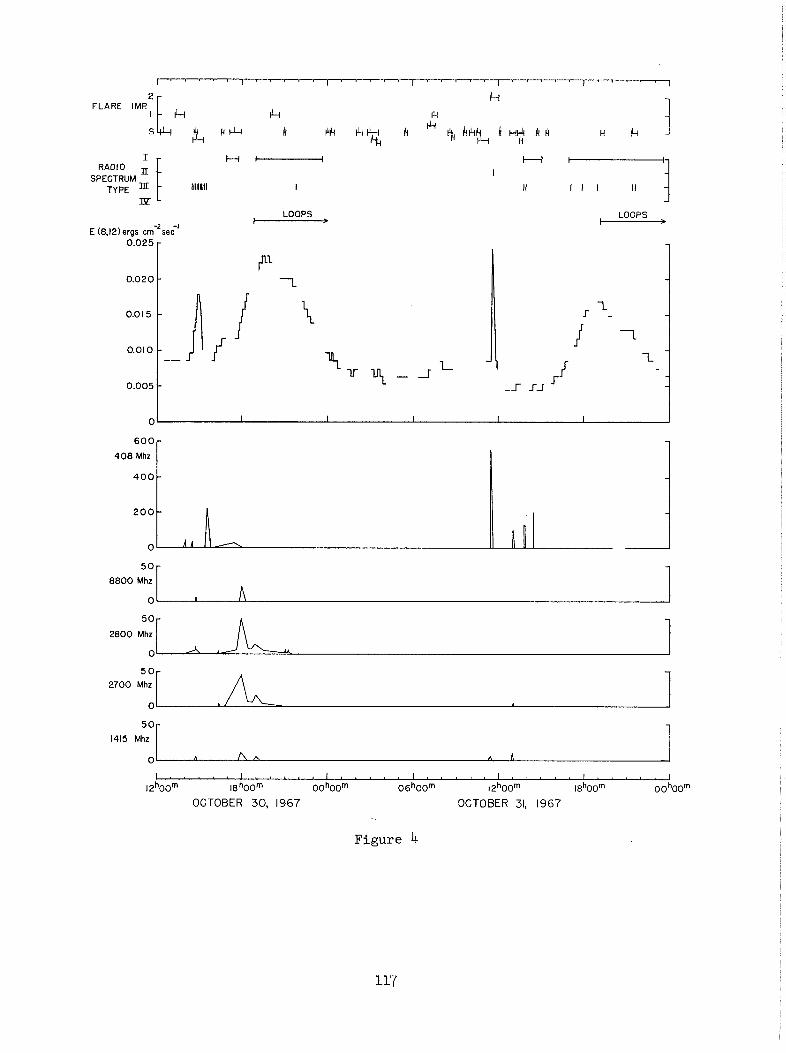
H- RADIO E
SPECTRUM TYPE IllllUlll I
LOOPS - E (8,121 ergs crn-'se;'
I
I1 I I I II - -1 LOOPS -
4 0 8 Mhz 600r
5 0 - - 8 8 0 0 Mhz
0 I A 5 0 - -
2 8 0 0 Mhz
0 A
5 0- - 2 7 0 0 Mhz
0 A
5 0 - - 1415 Mhz
0 A A A A A
I . . . I I l l . l o a l l l l l l l l l l l . l l s l l l l l . l l > I 1 2 ~ 0 0 ~ 18 hOOm 00~00"' 0 6 ~ 0 0 ~ 1 2"00m 1 8 ~ 0 0 ~ 0 0 ~ 0 0 ~
OCTOBER 30, 1967 OCTOBER 31, 1967
Figure 4