Osian Llwyd 2012 - Cardiff Universityorca.cf.ac.uk/43619/1/2012llwydophd.pdf · Osian Llwyd 2012 A...
271
The Involvement of CaMKII in Myocardial Ischaemia-Reperfusion Injury Osian Llwyd 2012 A thesis submitted in partial fulfillment of the requirements for the degree of Doctor of Philosophy
Transcript of Osian Llwyd 2012 - Cardiff Universityorca.cf.ac.uk/43619/1/2012llwydophd.pdf · Osian Llwyd 2012 A...

The Involvement of CaMKII in Myocardial
Ischaemia-Reperfusion Injury
Osian Llwyd
2012
A thesis submitted in partial fulfillment of the requirements
for the degree of Doctor of Philosophy

i
Declaration
This work has not been submitted in substance for any other degree or award at this or any other
university or place of learning, nor is being submitted concurrently in candidature for any
degree or other award.
Signed:
STATEMENT 1
This thesis is being submitted in partial fulfillment of the requirements for the degree of PhD
Signed:
STATEMENT 2
This thesis is the result of my own independent work/investigation, except where otherwise
stated. Other sources are acknowledged by explicit references. The views expressed are my
own.
Signed:
STATEMENT 3
I hereby give consent for my thesis, if accepted, to be available for photocopying and for inter-
library loan, and for the title and summary to be made available to outside organisations.
Signed:

ii
Abstract
CaMKII acts as a second messenger to Ca2+
signals within the cardiac myocyte.
Cellular stresses such as ischaemia and subsequent reperfusion perturb the normal
physiological oscillations of Ca2+
to cause an escalating concentration which damages
the cell. CaMKII has been implicated as an injury signal during such cellular
conditions. However, there are discrepancies as to whether CaMKII is a possible
mechanism of ischaemic preconditioning as its inhibition can abrogate or improve the
protective effect of preconditioning. This thesis investigated the effects of CaMKII
inhibition in models of ischaemia-reperfusion (I-R) injury. It was hypothesised that
CaMKII promotes irreversible injury caused by acute myocardial infarction (AMI), but
would also have a beneficial role in mediating cardioprotection by ischaemic
preconditioning. This work has demonstrated that: i) in an ex vivo rat heart model of
regional I-R injury, CaMKII promoted irreversible injury but is not a feasible target for
reperfusion therapy as only a pre-ischaemic intervention reduced myocardial infarction;
ii) CaMKII activation was not a pre-requisite for protection with ischaemic
preconditioning, although an additive protective effect of CaMKII inhibition and
ischaemic preconditioning was possible; iii) models of simulated I-R or oxidative stress
in the H9c2 cells did not involve CaMKII activity; iv) isolated cardiac myocytes paced
at 1Hz and subjected to simulated I-R do not engage a significant amount of CaMKII
activity. These studies substantiate the involvement of CaMKII during ischaemic injury
and establish that it does not play a substantial role in ischaemic preconditioning. It
highlights the characteristics of the kinase within in vitro models of I-R injury.
Understanding CaMKII role in I-R may underpin the development of future therapeutic
strategies for the management of AMI.

iii
Acknowledgments
A big diolch to everyone that has been involved with this thesis.
Diolch o galon to Gary, for opening the door to new opportunities within the field of I-
R injury, and giving me the competence to delve further into the subject. This is also
extended to everyone (past and present) in team GB, but in particular top boy Dwaine
for passing on his Langendorff skills. Diolch to everyone within the Tenovus research
group for letting me use their cell culture facilities and making it so enjoyable. Diolch
also to Chris George, for your time, expertise and showing me the other dimension to
calcium signaling.
Diolch yn arbennig i Dad a Mam, am eu cariad a’u cefnogaeth, nid yn unig dros y
cyfnod diweddar ond ar hyd y blynyddoedd. A Rhun, ti’n gwbod bod fi’n
gwerthfawrogi fe bra.
Ελένη, ευχαριστώ πολύ, που μου έδωσεs μια άλλη ζωή!
And last but not least, a big diolch to Henning Wackerhage for rekindling my appetite
for research.

iv
Nid wy'n gofyn bywyd moethus, / I’d not ask a life that’s easy,
Aur y byd na'i berlau mân: / Gold and pearls so little mean,
Gofyn wyf am galon hapus, / Rather seek a heart that’s joyful,
Calon onest, calon lân. / Heart that’s honest, heart that’s clean.
Daniel James (1848-1920) / translated by Daniel Cowen

v
Table of Contents Declaration ................................................................................................................................... i Abstract ........................................................................................................................................ ii Acknowledgments ..................................................................................................................... iii Table of Contents ....................................................................................................................... v List of Abbreviations ................................................................................................................ viii List of Figures & Tables ............................................................................................................. x CHAPTER 1: General Introduction ........................................................................................ 13
1.1. Ca2+ Signalling in the Cardiac Myocyte .................................................................... 14 1.1.1. Excitation-Contraction Coupling ......................................................................... 15
1.1.1.2. The Cardiac Action Potential ....................................................................... 15 1.1.1.3. Calcium-Induced Calcium Release ............................................................ 18 1.1.1.4. Cardiac Myocyte Relaxation ....................................................................... 20 1.1.1.5. Modulation with β-Adrenergic Signalling ................................................... 21
1.1.2. Gene Transcription and Regulation in Cardiac Myocytes .............................. 23 1.1.3. Cell Death and Auto-digestion ............................................................................ 24
1.2. Ca2+/Calmodulin-Dependent Protein Kinase II ........................................................ 25 1.2.1. The CaMK Family ................................................................................................. 25 1.2.2. Biology of CaMKII ................................................................................................. 26
1.2.2.1. Isoforms and Gene Splicing ........................................................................ 26 1.2.2.2. Structure and Functional Properties .......................................................... 27 1.2.2.3. Pharmacological Manipulation .................................................................... 31
1.2.3. Physiological Functioning in Cardiac Myocytes ............................................... 32 1.2.3.1. CaMKII & Excitation-Contraction Coupling ............................................... 32 1.2.3.2. Regulation of the L-type Ca2+ Channel ...................................................... 34 1.2.3.3. CaMKII and the RYR .................................................................................... 34 1.2.3.4. Ca2+ Uptake into SR: PLB and SERCA2a modifications ....................... 35 1.2.3.5. Regulation of Sarcolemmal Ion Channels ................................................. 36 1.2.3.6. Excitation-Transcription Coupling ............................................................... 37
1.3. Cardiovascular Disease .............................................................................................. 38 1.3.1. Current Trends ...................................................................................................... 38 1.3.2. The Cardiovascular Disease Continuum .......................................................... 40 1.3.3. Myocardial Infarction ............................................................................................ 42
1.3.3.1. Myocardial Ischaemia ................................................................................... 42 1.3.3.2. Cell Injury and Death .................................................................................... 46 1.3.3.3. Reperfusion Injury ......................................................................................... 52
1.3.4. Cardioprotective Paradigms ................................................................................ 55 1.3.4.1. Ischaemic Preconditioning ........................................................................... 56 1.3.4.2. Modified Reperfusion and Postconditioning ............................................. 60 1.3.4.3. Pharmacological Conditioning .................................................................... 62
1.3.5. CaMKII and Cardiovascular Disease ................................................................. 64 1.3.5.1. CaMKII as a Mediator of Cell Death .......................................................... 65 1.3.5.2. CaMKII and Ischaemia-Reperfusion Injury ............................................... 67 1.3.5.3. CaMKII in Models of Cardioprotection ....................................................... 70
1.4. Overview and Scope of Thesis .................................................................................. 73 1.4.1. Questions Addressed in this Thesis .................................................................. 73 1.4.2. General Hypothesis .............................................................................................. 73
CHAPTER 2: ............................................................................................................................. 74 Involvement of CaMKII in I-R Injury and Models of Cardioprotection .............................. 74
2.1. Introduction .................................................................................................................... 75 2.1.1. Mechanical Interventions for I-R Injury .............................................................. 75 2.1.2. Involvement of CaMKII in IPC and Postconditioning ...................................... 76 2.1.3. Hypothesis ............................................................................................................. 79
vi
2.1.4. Specific Objectives ............................................................................................... 79 2.2. Materials and Methods ................................................................................................ 80
2.2.1. The Isolated Perfused Heart ............................................................................... 80 2.2.1.1. Perfusion Protocol for the Rat Heart .......................................................... 84 2.2.1.2. Executing MI and Measurement of Infarct Size ....................................... 86
2.2.3. Statistical Analysis ................................................................................................ 94 2.3. Results ........................................................................................................................... 95
2.3.1. Exclusion Criteria .................................................................................................. 95 2.3.2. Baseline Cardiodynamics .................................................................................... 96 2.3.3. STUDY 1: ............................................................................................................... 98 The use of Mechanical Interventions for Cardioprotection ........................................ 98 2.3.4. STUDY 2(A):........................................................................................................ 102 Inhibition of CaMKII During I-R Injury ......................................................................... 102 2.3.5. STUDY 2(B):........................................................................................................ 106 Inhibition of CaMKII During Preconditioning .............................................................. 106 2.3.6. STUDY 2(C): ....................................................................................................... 110 Inhibition of CaMKII During Postconditioning ............................................................ 110
2.4. Discussion ................................................................................................................... 114 2.4.1. CaMKII Promotes Cellular Injury During Ischaemia ...................................... 115 2.4.2. The Non-specific Activity of the KN Compounds ........................................... 117 2.4.3. Postconditioning is Not as Robust as IPC in Limiting Infarct Size .............. 118 2.4.4. Inhibition of CaMKII Does Not Abrogate the Protective Effect of IPC ........ 119
2.5. Conclusion ................................................................................................................... 121 CHAPTER 3: ........................................................................................................................... 122 In Vitro Model of I-R with H9c2 cells ................................................................................... 122
3.1. Introduction .................................................................................................................. 123 3.1.1. In Vitro Models of Ischaemia-Reperfusion Injury ........................................... 123 3.1.2. In Vitro Models of Cellular Injury by CaMKII Activity ..................................... 124 3.1.3. Hypothesis ........................................................................................................... 127 3.1.4. Specific Objectives ............................................................................................. 127
3.2. Materials and Methods .............................................................................................. 128 3.2.1. The H9c2 Cell Line ............................................................................................. 128 3.2.2. Cell Maintenance ................................................................................................ 130
3.2.2.1 Cell Preparation/Subculture ....................................................................... 131 3.2.3. Characterisation of the Cells ............................................................................. 131
3.2.3.1. Dual Labelled Imaging ............................................................................... 131 3.2.4. In Vitro Models of Cell Injury ............................................................................. 132
3.2.4.1. Experimental Design and Treatment Groups ......................................... 132 3.2.4.2. Assessment of Cell Viability (MTS assay) .............................................. 135 3.2.4.3. Trypan Blue Exclusion ............................................................................... 137 3.2.4.4. LDH Assay ................................................................................................... 138
3.2.5. Statistical Analysis .............................................................................................. 138 3.3. Results ......................................................................................................................... 139
3.3.1. Characterisation of Cells ................................................................................... 139 3.3.2. Extent of Cell Injury After Periods of Simulated I-R Injury............................ 141 3.3.3. Inhibition of CaMKII During Simulated I-R Injury ........................................... 143 3.3.4. Inhibition of CaMKII During Oxidative Stress ................................................. 145
3.4. Discussion ................................................................................................................... 147 3.4.1. CaMKII Inhibition Does Not Promote H9c2 Cell Viability ............................. 148 3.4.2. The H9c2 Cells as a Model of I-R Injury ......................................................... 150
3.5. Conclusion ................................................................................................................... 152

vii
CHAPTER 4: ........................................................................................................................... 153 The Measurement of Ca2+ Transients in Adult Rat Ventricular Cells During Simulated I-R and CaMKII Inhibition ........................................................................................................ 153
4.1. Introduction .................................................................................................................. 154 4.1.1. Ca2+ handling During Ischaemia-Reperfusion ................................................ 154 4.1.2. Ca2+ Handling by CaMKII During I-R ............................................................... 156 4.1.3. Hypothesis ........................................................................................................... 159 4.1.4. Specific Objectives ............................................................................................. 160
4.2. Materials and Methods .............................................................................................. 161 4.2.1. Isolation of Adult Rat Cardiac Myocytes ......................................................... 161 4.2.2. Confocal Laser Scanning Microscopy ............................................................. 163 4.2.3. Experimental Protocol ........................................................................................ 166
4.2.3.1. Preparation of Cells .................................................................................... 167 4.2.3.2. Field Stimulation and Criteria for Cell Selection ..................................... 168 4.2.3.3. Simulation of Ischaemia and Reperfusion .............................................. 169 4.2.3.4. Treatment Groups ....................................................................................... 171
4.2.4. Analysis of the Ca2+ Oscillations ...................................................................... 174 4.2.4.1. Converting the Images to Raw Data in an Excel Spreadsheet ............ 174 4.2.4.2. Analysis of the Ca2+ Oscillations by SALVO Software .......................... 174 4.2.4.3. SALVO Parameters .................................................................................... 176 4.2.4.4. Incidences of Ca2+ Dysfunction and Stunning ........................................ 179
4.2.5. Statistical Analysis .............................................................................................. 179 4.3. Results ......................................................................................................................... 180
4.3.1. Exclusion Criteria ................................................................................................ 180 4.3.2. Characteristics of the Adult Rat Ventricular Myocytes .................................. 181 4.3.3. Effect of the CaMKII Inhibitors Under Normoxic Conditions ........................ 185 4.3.4. Response to Simulated Ischaemia and Reperfusion .................................... 191
4.3.4.1. Changes in Cell Dimensions ..................................................................... 191 4.3.4.2. The Effects of Simulated I-R on Cellular Ca2+ Handling ....................... 194 4.3.4.3. SALVO Analysis of the Cellular Ca2+ Handling ...................................... 198
4.4. Discussion ................................................................................................................... 209 4.4.1. The Similar Effects of the KN Compounds on Ca2+ Handling ...................... 210 4.4.2. The Arrhythmic Activity of the CaMKII Inhibitory Peptide ............................. 212 4.4.3. Simulation of I-R conditions .............................................................................. 213 4.4.4. Involvement of CaMKII During Simulated Ischaemia ................................... 215 4.4.5. Involvement of CaMKII During Restoration of Metabolism .......................... 216
4.5. Conclusion ................................................................................................................... 219 4.6. Study Limitations ........................................................................................................ 220
CHAPTER 5: General Discussion ....................................................................................... 221 5.1. Principal Findings ....................................................................................................... 222 5.2. The Work in Context .................................................................................................. 224 5.3. Limitations of the Thesis and Future Outlook ........................................................ 227 5.4. Concluding Remarks ................................................................................................. 229
Appendices .............................................................................................................................. 230 References .............................................................................................................................. 237

viii
List of Abbreviations [ion]i
[ion]0
2-DG
AIP
AMI
ATP
CaM
CaMKII
CAO
CaV
CFR
cGMP
CHD
CICR
CREB
CVD
DAD
EAD
E-C coupling
ECG
ER
GM
GPCR
HF
HR
ICa.L
IK
INa
InsP3
I-R
IHA
IP3R
- Intracellular ion concentration
- Extracellular ion concentration
- 2-Deoxyglucose
- Autocamtide-2 related inhibitory peptide
- Acute Myocardial Infarction
- Adenosine Triphosphate
- Calmodulin
- Ca2+
/Calmodulin Dependant Protein Kinase II
- Coronary Artery Occlusion
- Voltage-gated Ca2+
channels
- Coronary Flow Rate
- Cyclic Guanosine Monophosphate
- Coronary Heart Disease
- Calcium Induced Calcium Release
- Cyclic AMP response element-binding protein
- Cardiovascular Disease
- Delayed afterdepolarisation
- Early afterdepolarisation
- Excitation-Contraction Coupling
- Electrocardiogram
- Endoplasmic Reticulum
- Genetically Modified
- G-protein coupled receptors
- Heart Failure
- Heart Rate
- Ca2+
current
- K+ current
- Na+ current
- Inositol 1,4,5-triphosphate
- Ischaemia Reperfusion
- Intermittent High Altitude Hypoxia
- Inositol 1,4,5-triphosphate Receptor

ix
IPC
ITN
LDH
LTCC
LVDP
LVH
MI
mPTP
NaV
NCX
NFAT
NHE
NO
NSTEMI
PBS
PCI
PKG
PLB
Po
PLC
PI3K
PKC
PKA
RISK
RYR2
ROS
ROI
RPP
SERCA2a
SR
STEMI
TUNEL
Vfib
- Ischaemic Preconditioning
- Inter Transient Noise
- Lactate Dehydrogenase
- L-Type Ca2+
Channel
- Left Ventricle Developed Pressure
- Left Ventricle Hypertrophy
- Myocardial Infarction
- Mitochondrial Permeability Transition Pore
- Voltage-gated Na+ channels
- Na+/Ca
2+ Exchanger
- Nuclear Factor of activated T cells
- Na+ Hydrogen Exchange
- Nitric Oxide
- Non ST-Segment Elevation Myocardial Infarction
- Phosphate Buffered Saline
- Percutaneous Coronary Intervention
- cGMP-dependant protein kinase
- Phospholamban
- Open probability
- Phospholipase C
- Phosphatidylinositol 3-kinases
- Protein Kinase C
- Protein Kinase A
- Reperfusion Injury Salvageable Kinases
- Ryanodine Receptor
- Reactive Oxygen Species
- Region of Interest
- Rate Pressure Product
- Sarco/endoplasmic reticulum Ca2+
-ATPase pump
- Sarcoplasmic Reticulum
- ST-Segment Elevation Myocardial Infarction
- Terminal deoxynucleotidyl transferase dUTP nick end labeling
- Ventricular Fibrillation

x
List of Figures & Tables
Figures
Figure 1.1: Time course of excitation-contraction coupling in a rabbit
ventricular myocyte……………………………………………………………
Figure 1.2: Contraction-relaxation cycle of a cardiac myocyte, with
particular focus on the total Ca2+
movement and concentration of calcium-
induced calcium release……………………………………………………….
Figure 1.3: Biology of the CaMKII monomer and holoenzyme……………...
Figure 1.4: Cartoon of a CaMKII monomer…………………………………..
Figure 1.5: CaMKII targets within the cytosol………………………………..
Figure 1.6: Prevalence and mortality rates of CVD in the U.K. (England,
Scotland, Wales) population during the last 50 years…………………………
Figure 1.7: Cardiovascular Disease Continuum………………………………
Figure 1.8: Myocardial Infarction……………………………………………
Figure 1.9: The cascade of intracellular events that is triggered by ischaemia
and ends with cell death……………………………………………………….
Figure 1.10: Mechanisms that trigger cell death and survival after ischaemia-
reperfusion……………………………………………………………………..
Figure 2.1: The Langendorff perfused heart…………………………………
Figure 2.2: Stained transverse sections of rat hearts………………………….
Figure 2.3: Timeline of the experimental procedures used for the groups in
Study 1…………………………………………………………………………
Figure 2.4: Timeline of the experimental procedures used for the groups in
Study 2…………………………………………………………………………
Figure 2.5: The infarct size expressed as a percentage of the risk zone
volume for Study 1…………………………………………………………….
Figure 2.6: Time course of (A) Coronary Flow Rate, (B) Heart Rate (C)
Developed Pressure and (D) Rate Pressure Product, expressed as a
percentage of the baseline values during ischaemia and reperfusion………….
Figure 2.7: The infarct size expressed as a percentage of the risk zone
volume for Study 2(A)………………………………………………………...
Figure 2.8: Time course of (A) Coronary Flow Rate, (B) Heart Rate (C)
Developed Pressure and (D) Rate Pressure Product, expressed as a
percentage of the baseline values during Study 2(A)………………………….
Figure 2.9: The infarct size expressed as a percentage of the risk zone
volume for Study 2(B)…………………………………………………………
Figure 2.10: Time course of (A) Coronary Flow Rate, (B) Heart Rate (C)
Developed Pressure and (D) Rate Pressure Product, expressed as a
percentage of the baseline values during Study 2(B)………………………….
Figure 2.11: The infarct size expressed as a percentage of the risk zone
volume for Study 2(C)…………………………………………………………
Figure 2.12: Time course of (A) Coronary Flow Rate, (B) Heart Rate (C)
Developed Pressure and (D) Rate Pressure Product, expressed as a
percentage of the baseline values during Study 2(C)………………………….
Figure 3.1: Timeline of the experimental procedures for study 1…………….
Figure 3.2: Timeline of the experimental procedures for study 2…………….
Figure 3.3: Timeline for the cell viability and death comparison…………….
16
19
28
28
33
39
40
44
47
54
81
88
90
92
99
100
103
104
107
108
111
112
134
135
137

xi
Figure 3.4: H9c2 cells fixed and dual labeled with Rhodamin-Phalloidin and
Hoechst 33342…………………………………………………………………
Figure 3.5: The viability of H9c2 cells was determined after 14-16 hours of
simulated ischaemia and 2 hours restoration by MTS assay, LDH release and
trypan blue exclusion………………………………………………………….
Figure 3.6: Viability of H9c2 cells after 14 hours of ischaemic mimicking
solution and 2 hours restoration with/without the presence of CaMKII
inhibitors……………………………………………………………………….
Figure 3.7: Viability of H9c2 cells after 24 hours of H2O2, glucose/serum
deprivation and CaMKII related agents……………………………………….
Figure 4.1: Schematic diagram of Leica TCS-SP5 and the principal of
confocal imaging………………………………………………………………
Figure 4.2: Assembly and structure of the experimental ‘pod’……………….
Figure 4.3: Timeline of the experimental procedures used for the groups in
Study 1…………………………………………………………………………
Figure 4.4: Timeline of the experimental procedures used for the groups in
Study 2…………………………………………………………………………
Figure 4.5: An isolated adult rat cardiac myocyte and a recording of its mean
fluorescence intensity against time, which was then measured for Ca2+
transients’ peaks and valleys by the SALVO software………………………..
Figure 4.6: Mean data (± SEM) from all the cells first recordings of the Ca2+
transients’ parameters identified by SALVO………………………………….
Figure 4.7: Cardiac myocytes length measurements at rest (A) and after
electrical stimulation (B), before and after the treatments of study 1…………
Figure 4.8: Examples of the incidences of Ca2+
dysfunction during the one
minute post-treatment recordings……………………………………………...
Figure 4.9: Comparison of the cells Ca2+
transient recordings before and
after treatment in study 1………………………………………………………
Figure 4.10: Comparison of the cells Ca2+
transient recordings before and
after treatment in study 1………………………………………………………
Figure 4.11: Time course of the effects of simulated I-R on resting cell
length (A) and cell shortening (B) in the presence and absence of CaMKII
inhibitors……………………………………………………………………….
Figure 4.12: Example of Ca2+
transient recordings (mean intensity vs. time)
at selected time points during study 2…………………………………………
Figure 4.13: A tally of the episodes of Ca2+
dysfunction (A), Ca2+
waves (B)
or stunning (C), that occurred…………………………………………………
Figure 4.14: Time course of the SALVO parameters (Mean only) that
describe the cells Ca2+
transients’ morphology, when subjected to simulated
I-R……………………………………………………………………………..
Figure 4.15: Time course of the SALVO parameters (Mean only) that
describe the Ca2+
transients’ kinetics, when subjected to simulated I-R……...
Figure 4.16: Time course of the SALVO parameters (Mean only) that
describe the baseline and inter-transient activity of the cells when subjected
to simulated I-R……………………………………………………………….
Figure 4.17: Time course of the SALVO parameters that describe the
synchronicity amongst the cells ROI and regularity of the Ca2+
transients…...
Replica of Figure 4.14: Time course of the SALVO parameters (Mean ±
SEM) that describe the cells Ca2+
transients’ morphology, when subjected to
simulated I-R…………………………………………………………………..
140
142
144
146
164
166
172
173
175
183
186
187
189
190
192
195
196
199
202
204
208
233
xii
Replica of Figure 4.15: Time course of the SALVO parameters (Mean ±
SEM) that describe the Ca2+
transients’ kinetics, when subjected to simulated
I-R……………………………………………………………………………..
Replica of Figure 4.16: Time course of the SALVO parameters (Mean ±
SEM) that describe the baseline and inter-transient activity of the cells when
subjected to simulated I-R……………………………………………………..
Replica of Figure 4.17: Time course of the SALVO parameters (Mean ±
SEM) that describe the synchronicity amongst the cells ROI and regularity of
the Ca2+
transients……………………………………………………………..
234
235
236
Tables
Table 2.1: Total No. of hearts excluded and reported in studies 1-2…………..
Table 2.2: Baseline cardiodynamics……………………………………………
Table 4.1: Descriptive data (Mean ±SEM) of the cells first recordings prior to
the normoxic (study 1) or simulated ischaemia (study 2) experiments………...
95
97
182

13
CHAPTER 1:
General Introduction

14
1.1. Ca2+ Signalling in the Cardiac Myocyte
Calcium is an alkaline earth metal that adopts a divalent cation (Ca2+
) when present
freely in water. It binds readily to other molecules and has evolved into an intracellular
signal that is essential and with diverse effects in all living cells. The cardiac myocyte
provides an example of the varied signalling effects of Ca2+
. These signalling functions
include: muscle contraction and mechanical movement of the cell (Bers, 2000); the
stimulation of energy production to ‘parallel’ the cell’s energy demand (Griffiths &
Rutter, 2009); co-ordination and regulation of gene transcription and DNA synthesis
(Bootman et al., 2009); instigation of auto digestion of organelles or promotion of cell
death (HØyer-Hansen and Jääattelä, 2007).
In many cases, Ca2+
acts as an intracellular second messenger to the numerous
ligands that target cell membranes. The cell receptors pick up and relay the distant
hormonal or neuronal signals to specific molecules within the cytosol or organelles by
means of Ca2+
signalling. As its cation properties allow a high affinity towards an array
of intracellular proteins, it can influence several physiological activities. When bound
to a protein Ca2+
can change the conformation of the molecule and thus alter its activity
in a signalling cascade.
Ca2+
signalling is accomplished when the cells distinguish the change in
intracellular Ca2+
concentration ([Ca2+
]i) for a given location (Berridge, 2009). Whether
the transient delivery of the ion is global or localised it can also provide a valuable
electrochemical gradient that is used by the cells as a source of stored energy (Sheu and
Fozzard, 1982). Recent advances have been made in understanding how the cell
handles small and subtle localisation of [Ca2+
]i and the way this is interpreted by
organelles to produce specific cellular effects (Laude and Simpson, 2009).

15
1.1.1. Excitation-Contraction Coupling
Cardiac myocytes are excitable cells since they respond to an electrical impulse (e.g. an
action potential) with a rapid physical contraction. Broadly termed excitation-
contraction coupling (Sandow, 1952), Ca2+
has two roles to play in this process. The
first is during the excitation of the cells, when an action potential depolarises the
intracellular space and allows extracellular Ca2+
to enter the cell via voltage-gated Ca2+
channels (CaV). The second action occurs in response to the influx of Ca2+
, which
releases additional Ca2+
from the sarcoplasmic reticulum (SR). A global discharge of
stored Ca2+
will then flood the myofilaments, leading to cell shortening and effecting
systolic contraction of the myocardium. For relaxation of the muscle and diastolic
filling to occur, removal of Ca2+
from the cytosol is necessary to complete the cycle, by
activation of ionic pumps and exchangers positioned on the SR and sarcolemma.
1.1.1.2. The Cardiac Action Potential
The difference in ion concentration either side of the plasma membrane creates an
intracellular potential within all cells. This electrical charge can fluctuate in excitable
cells (figure 1.1) to form an action potential and provide a specific electrical stimulus.
In ventricular myocytes, during diastolic relaxation, the resting membrane potential
(termed phase 4) is around -80 to -90 mV (Zaza and Rosen, 2000).
Stimulated by an action potential (or a propagating impulse) that is conducted
throughout the heart, a sufficient amount of voltage-gated Na+ channels (NaV) will
allow Na+ ions to enter the cell down an electrochemical gradient (145 mM to 20 mM;
Klabunde, 2011). This movement activates the remaining NaV to allow an inward Na+
current (INa), which rapidly depolarises (phase 0) the cell. CaV1.2 channels, also known
as L-type Ca2+
channels (as it is a long lasting current, LTCC) have a threshold of
16
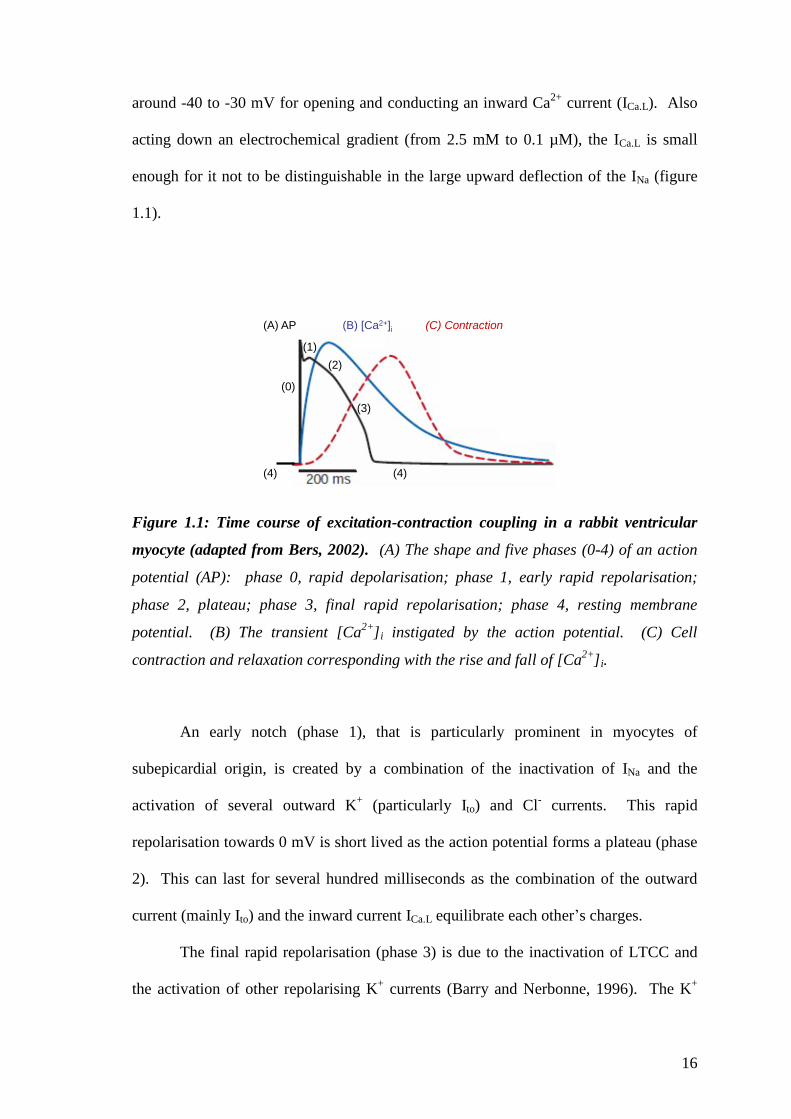
around -40 to -30 mV for opening and conducting an inward Ca2+
current (ICa.L). Also
acting down an electrochemical gradient (from 2.5 mM to 0.1 µM), the ICa.L is small
enough for it not to be distinguishable in the large upward deflection of the INa (figure
1.1).
(C) Contraction(B) [Ca2+]i(A) AP
(1)
(2)
(3)
(0)
(4)(4)
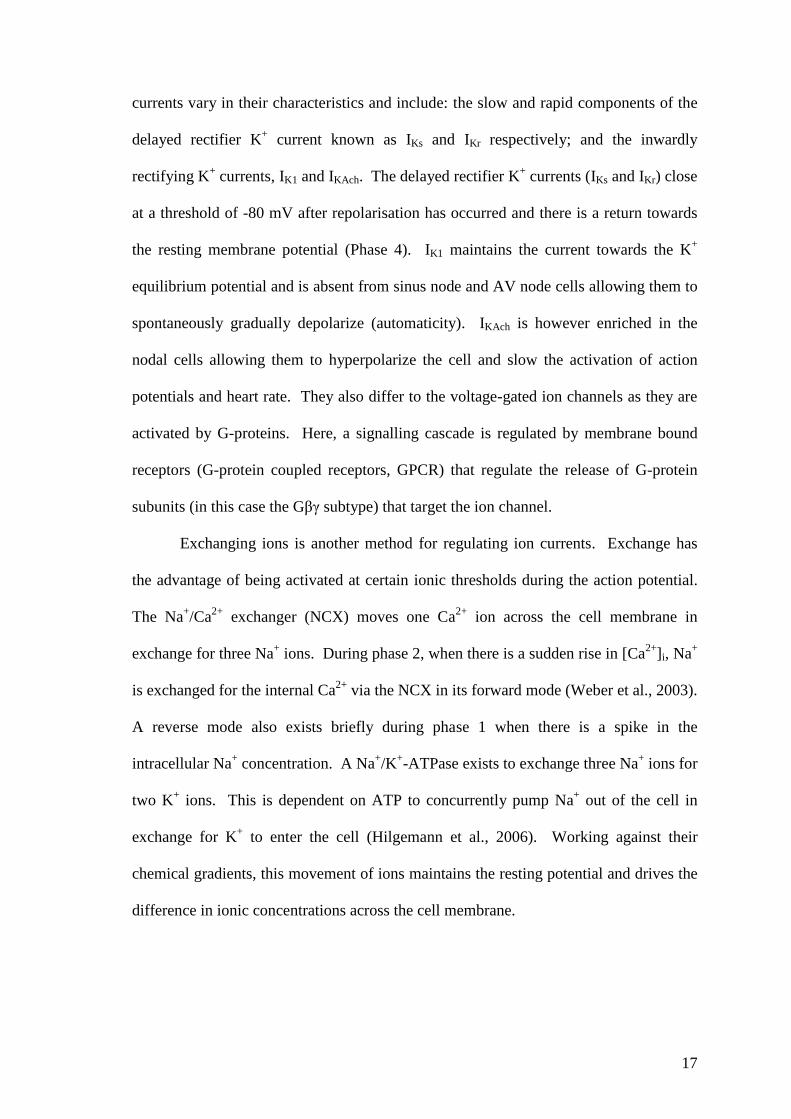
Figure 1.1: Time course of excitation-contraction coupling in a rabbit ventricular
myocyte (adapted from Bers, 2002). (A) The shape and five phases (0-4) of an action
potential (AP): phase 0, rapid depolarisation; phase 1, early rapid repolarisation;
phase 2, plateau; phase 3, final rapid repolarisation; phase 4, resting membrane
potential. (B) The transient [Ca2+
]i instigated by the action potential. (C) Cell
contraction and relaxation corresponding with the rise and fall of [Ca2+
]i.
An early notch (phase 1), that is particularly prominent in myocytes of
subepicardial origin, is created by a combination of the inactivation of INa and the
activation of several outward K+ (particularly Ito) and Cl
- currents. This rapid
repolarisation towards 0 mV is short lived as the action potential forms a plateau (phase
2). This can last for several hundred milliseconds as the combination of the outward
current (mainly Ito) and the inward current ICa.L equilibrate each other’s charges.
The final rapid repolarisation (phase 3) is due to the inactivation of LTCC and
the activation of other repolarising K+ currents (Barry and Nerbonne, 1996). The K
+
17
currents vary in their characteristics and include: the slow and rapid components of the
delayed rectifier K+ current known as IKs and IKr respectively; and the inwardly
rectifying K+ currents, IK1 and IKAch. The delayed rectifier K
+ currents (IKs and IKr) close
at a threshold of -80 mV after repolarisation has occurred and there is a return towards
the resting membrane potential (Phase 4). IK1 maintains the current towards the K+
equilibrium potential and is absent from sinus node and AV node cells allowing them to
spontaneously gradually depolarize (automaticity). IKAch is however enriched in the
nodal cells allowing them to hyperpolarize the cell and slow the activation of action
potentials and heart rate. They also differ to the voltage-gated ion channels as they are
activated by G-proteins. Here, a signalling cascade is regulated by membrane bound
receptors (G-protein coupled receptors, GPCR) that regulate the release of G-protein
subunits (in this case the Gβγ subtype) that target the ion channel.
Exchanging ions is another method for regulating ion currents. Exchange has
the advantage of being activated at certain ionic thresholds during the action potential.
The Na+/Ca
2+ exchanger (NCX) moves one Ca
2+ ion across the cell membrane in
exchange for three Na+ ions. During phase 2, when there is a sudden rise in [Ca
2+]i, Na
+
is exchanged for the internal Ca2+
via the NCX in its forward mode (Weber et al., 2003).
A reverse mode also exists briefly during phase 1 when there is a spike in the
intracellular Na+ concentration. A Na
+/K
+-ATPase exists to exchange three Na
+ ions for
two K+ ions. This is dependent on ATP to concurrently pump Na
+ out of the cell in
exchange for K+ to enter the cell (Hilgemann et al., 2006). Working against their
chemical gradients, this movement of ions maintains the resting potential and drives the
difference in ionic concentrations across the cell membrane.
18
1.1.1.3. Calcium-Induced Calcium Release
A key feature of excitation-contraction coupling in cardiac myocytes is the way that the
extracellular Ca2+
is used as a trigger for release of large pools of intracellular Ca2+
(figure 1.2; Fabiato, 1983). Known as calcium-induced calcium release (CICR), several
possible mechanisms have been proposed. The most widely accepted hypothesis
involves ICa.L (Bers, 2002). Other possibilities, such as Ca2+
entry via the NCX, may
have a modest effect, but are believed to be more prominent under abnormal conditions
(Bers, 2000).
The localisation of the LTCC and the ryanodine receptor (RYR2; cardiac muscle
ryanodine receptor isoform), which acts as a Ca2+
release channel for the SR, underpins
one of the key arguments for the CICR (Orchard and Brette, 2008). Assisted by the T
tubules that extend the extracellular matrix into the cell, each LTCC positioned on these
tubules administers Ca2+
to 6-20 RYR2 (Bridge et al., 1999; Bers, 2002). The
junctional regions between the T tubule and the SR allow a short and direct interaction
of the Ca2+
that enters through the LTCC.
The RYR2 has been thoroughly characterised and revealed to make molecular
conformational changes that release Ca2+
from the SR when activated by Ca2+
(Tunwell
et al., 1996). Four RYR2 monomer proteins associate to form the Ca2+
release channel.
The foot region acts as a scaffolding protein which allows the binding of other proteins
such as kinases and phosphatases close to the junctional complexes. One of the
proteins, called FKBP-12.6, acts to stabilise these regions. This allows ‘coupled gating’
of the numerous clusters of RYR2 that then co-ordinates the release of Ca2+
in
synchrony (Marx et al., 2001). Collectively, a substantial discharge of stored Ca2+
results in a spike of [Ca2+
]i. Contraction of the cell occurs when the surplus of Ca2+
binds to troponin C. This promotes the interaction between myosin heads and actin

19
filaments which results in rapid shortening of the sarcomere and a systolic contraction
of the myocyte.
Sarcomere
Sarcoplasmic Reticulumn
RYR
T. T
ub
ule
Cytoplasm
Extracellular MatrixNCX
(R)
70% 92%
28% 7%1% 0.5%
29% 8%
Mitochondria
1% 0.5%
SERCA
NCX
(F)
LTCC
Contraction
SystoleRelaxation
Diastole
Ca2+
Pump
Ca2+
(~100 µM)
Ca2+
Ca2+
Ca2+
(~0.1 µM)
A
B C
D
E
Ca2+
(~1 mM)
Na+ (135 mM)
Na+
(20 mM)
PLB
Action Potential
Ca2+
(2.5 mM)
NCXCaUP
Ca2+
Ca2+
Na+
Sarcomere
Sarcoplasmic Reticulumn
RYRRYR
T. T
ub
ule
Cytoplasm
Extracellular MatrixNCX
(R)
70% 92%
28% 7%1% 0.5%
29% 8%
Mitochondria
1% 0.5%
SERCASERCA
NCX
(F)
LTCC
Contraction
SystoleRelaxation
Diastole
Ca2+
Pump
Ca2+
(~100 µM)
Ca2+
Ca2+
Ca2+
(~0.1 µM)
A
B C
D
E
Ca2+
(~1 mM)
Na+ (135 mM)
Na+
(20 mM)
PLB
Action Potential
Ca2+
(2.5 mM)
NCXCaUP
Ca2+
Ca2+
Na+
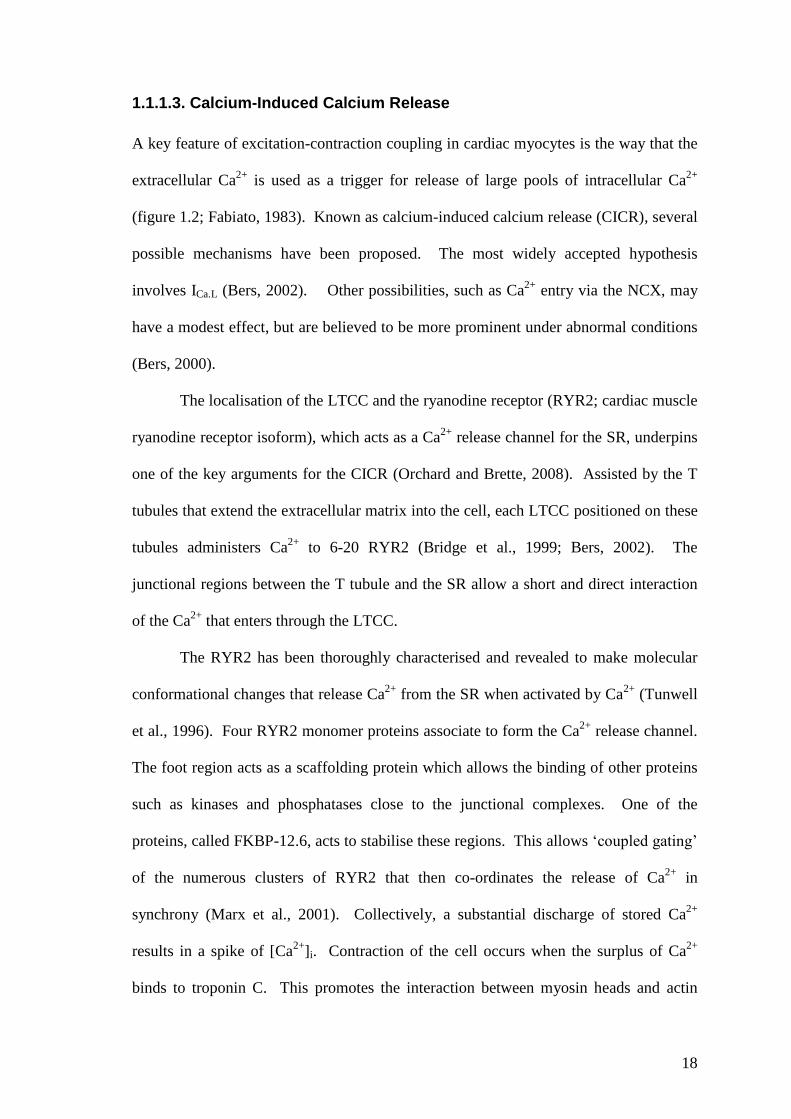
Figure 1.2: Contraction-relaxation cycle of a cardiac myocyte, with particular focus
on the total Ca2+
movement and concentration of calcium-induced calcium release.
(A) The depolarising current travels down a T. tubule allowing the LTCC threshold to
trigger Ca2+
entry. (B) Ca2+
entry triggers further release of Ca2+
from intracellular
stores such as the SR, using RYR2 causing a flood of Ca2+
towards myofilaments.(C)
Relaxation can only begin with the removal of Ca2+
back into the SR and (D) through
sarcolemmal transporters. (E) Other organelles such as the mitochondria play a minor
part in buffering any excess Ca2+
and use it to sense the altering transients to parallel
production of ATP with contraction. The relative percentages of Ca2+
cycled per
compartment for a human (red) and rat (blue) ventricle cell is also described (data
taken from Bers, 2000). LTCC, L-type Ca2+
channel; RYR2, ryanodine receptor; PLB,
phospholamban; SERCA2a, Sarco/Endoplasmic Reticulum Ca2+
-ATPase; NCX,
Na+/Ca
2+ Exchanger in Forward (F) and Reverse (R) mode; CaUP, Ca
2+ uniporter.
20
There are many Ca2+
binding proteins and buffering systems within cells that
compete for the binding of the ion (Bers, 2000). As such, the amount of Ca2+
/L cytosol
to raise [Ca2+
]i to peak systolic concentrations of 1 µM exceeds 100 µM. The total
amount of Ca2+
transported within the ventricular myocytes of rat and human are the
same. However, there are significant differences between species in the extent to which
each Ca2+
transport mechanism will be used. Figure 1.2 shows some of the key ion
exchanges. Human and rat myocytes will cycle 70% and 92% respectively of their Ca2+
with the SR. Thus, the reduced SR Ca2+
uptake within the human cells will have
consequences on their dependence for ion transporters such as the NCX to remove Ca2+
from the cytosol.
1.1.1.4. Cardiac Myocyte Relaxation
To allow diastolic filling, the cardiac myocytes must relax by reducing the [Ca2+
]i. This
requires removing the Ca2+
against its concentration gradient which is consequently
reliant on ATP-dependent mechanisms (Bers, 2002). The slower rate of removal and
prolonged decline in [Ca2+
]i (figure 1.1) demonstrates this effort.
The SR reabsorbs the same amount of Ca2+
that it has released through the
sarco/endoplasmic reticulum Ca2+
-ATPase pump (SERCA2a, the predominant cardiac
isoform) (Bers, 2000). For each ATP that is hydrolysed, two Ca2+
ions are taken up
(Lee and East, 2001). A phosphate receiver known as phospholamban (PLB) can
influence the activity of SERCA2a (Tada and Katz, 1982). Phosphorylation of PLB
removes the natural inhibition that it has on the SERCA2a pump allowing a greater
influx of Ca2+
and a faster rate of relaxation and diastolic filling (lusitropy). Storage of
Ca2+
within the SR can reach concentrations of up to 20 mM (with 1 mM in free Ca2+
)
21
and is aided by calsequestrin, a Ca2+
binding protein that can hold up to 50 Ca2+
ions
(Beard et al., 2004).
The NCX is responsible for the majority of Ca2+
extrusion through the
sarcolemma (Bers, 2000). The current matches the ICa.L (Bridge et al., 1990) and is
dependent on the [Ca2+
]i for activation and a stable and low [Na+]i to maintain the ion
gradient (Fearnley et al., 2011). As this relies on the Na+/K
+-ATPase, the NCX is
counted as having an energy consumption of 1 ATP molecule per Ca2+
ion that is
extruded (Bers, 2000). Thus, it is less efficient than SERCA2a. A sarcolemmal Ca2+
pump also exists to drive Ca2+
out of the cell; but as its transport capability is much less
than the NCX, its role is believed to be more to do with signal transduction than the
contraction-relaxation cycle of the cell (Cartwright et al., 2005).
1.1.1.5. Modulation with β-Adrenergic Signalling
To modify the cells’ contractile activity and cardiac output, Ca2+
handling proteins can
be targeted by a variety of signalling pathways. One of the most notable pathways is
the β-adrenergic system responsible for the heart’s response to sympathetic stimulation.
This enables the body to deal with increased demand by adapting the cardiac output
with an increase in heart rate (chronotropy), contractile force (inotropy) and lusitropy.
Stimulated by the release of noradrenaline from the sympathetic nervous system,
the β-adrenergic receptors are linked to GPCR. The Gαs subtype is responsible for the
increased activity of another transmembrane protein, adenylyl cyclase (Buck et al.,
1999). When activated, this enzyme converts ATP into the second messenger cyclic
adenosine-3’,5’-cyclic monophosphate (cAMP). This signalling messenger can interact
with and release the active C subunit of protein kinase A (PKA), which phosphorylates
many targets on Ca2+
handling proteins. These include: the LTCC (Yan et al., 2011)

22
and RYR2 (Shan et al., 2010) for greater peak force of contraction with augmented Ca2+
release; an increased Ca2+
to troponin-C interaction, that allows greater sensitivity for
the ion (Layland et al., 2004); and Ser16
on PLB to increase the removal of Ca2+
ready
for the next contracting cycle (Hagemann and Xiao, 2002).
A physiological response such as tachycardia can also stimulate a heart-rate
induced increase in Ca2+
release (Grimm and Brown, 2010). Here, kinases sensitive to
the repetitive release and increase in [Ca2+
]i, known as Ca2+
/Calmodulin-dependent
protein kinase II (CaMKII), target Ca2+
handling proteins to further augment the cycling
of cytosolic Ca2+
(see section 1.2).
23
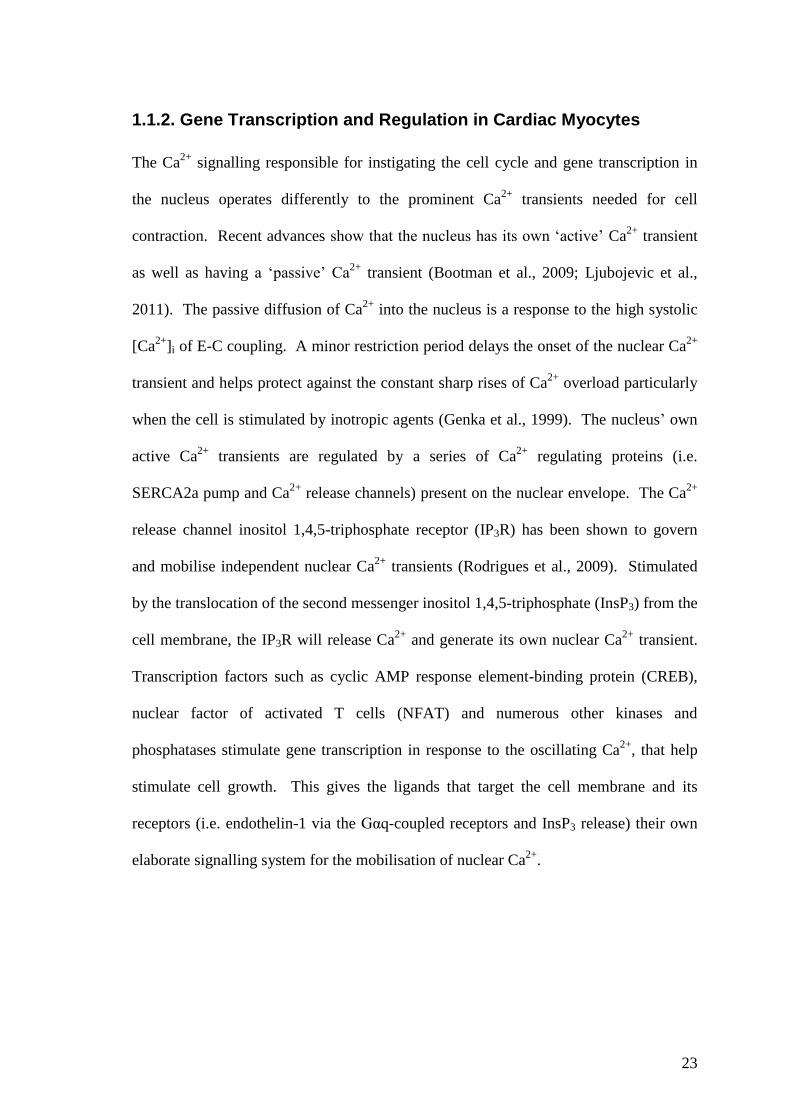
1.1.2. Gene Transcription and Regulation in Cardiac Myocytes
The Ca2+
signalling responsible for instigating the cell cycle and gene transcription in
the nucleus operates differently to the prominent Ca2+
transients needed for cell
contraction. Recent advances show that the nucleus has its own ‘active’ Ca2+
transient
as well as having a ‘passive’ Ca2+
transient (Bootman et al., 2009; Ljubojevic et al.,
2011). The passive diffusion of Ca2+
into the nucleus is a response to the high systolic
[Ca2+
]i of E-C coupling. A minor restriction period delays the onset of the nuclear Ca2+
transient and helps protect against the constant sharp rises of Ca2+
overload particularly
when the cell is stimulated by inotropic agents (Genka et al., 1999). The nucleus’ own
active Ca2+
transients are regulated by a series of Ca2+
regulating proteins (i.e.
SERCA2a pump and Ca2+
release channels) present on the nuclear envelope. The Ca2+
release channel inositol 1,4,5-triphosphate receptor (IP3R) has been shown to govern
and mobilise independent nuclear Ca2+
transients (Rodrigues et al., 2009). Stimulated
by the translocation of the second messenger inositol 1,4,5-triphosphate (InsP3) from the
cell membrane, the IP3R will release Ca2+
and generate its own nuclear Ca2+
transient.
Transcription factors such as cyclic AMP response element-binding protein (CREB),
nuclear factor of activated T cells (NFAT) and numerous other kinases and
phosphatases stimulate gene transcription in response to the oscillating Ca2+
, that help
stimulate cell growth. This gives the ligands that target the cell membrane and its
receptors (i.e. endothelin-1 via the Gαq-coupled receptors and InsP3 release) their own
elaborate signalling system for the mobilisation of nuclear Ca2+
.

24
1.1.3. Cell Death and Auto-digestion
Demaurex and Distelhorst (2003) stated “Organized life requires cell death, and
execution of cell death relies on the very machinery of life.” The execution of cell
death was a reference to the cell’s ability to induce cell suicide (apoptosis) or autophagy
(catabolic digestion) in order to defend against pathogens or maintain homeostasis in
injured cells. By using organelles such as the mitochondria and SR, cells have the
machinery that will respond to genetic or environmental clues and trigger the necessary
death signals. Apoptosis may be controlled by extrinsic death signals that are mediated
by receptors on the cell membrane (e.g. Fas). However, the primary focus will be the
intrinsic death pathway as it is regulated by the mitochondria and their regulation of
Ca2+
. The mitochondria handle Ca2+
through the Ca2+
uniporter (for influx) and NCX
(for efflux) which help stimulate energy production or buffer [Ca2+
]i during abnormal
Ca2+
load (Griffiths and Rutter, 2009). When the sequestered Ca2+
reaches a threshold it
acts as a death signal by releasing critical factors such as cytochrome c, which then
activate proteases called caspases (Demaurex and Distelhorst, 2003). The Bcl-2/Bax
family are other deaths signals that are important in deciding the mitochondrial
tolerance to Ca2+
or permeability of cytochrome c (Harr and Distelhort, 2011). The
significance and the interrelationships between the handling of Ca2+
by the SR, the
mitochondria’s tolerance to Ca2+
or the influence of signals such as the Bcl-2/Bax
family are strongly debated. Autophagy, or the degradation of organelles, does not
require caspase activation (Levine and Klionsky, 2004), but is associated with Ca2+
release from the endoplasmic reticulum (ER) or the IP3R (HØyer-Hansen and Jääattelä,
2007). This release induces the autophagy signalling system that is usually triggered by
the build up of misfolded proteins (ER stress) in order for them to be dealt with through
a catabolic pathway.

25
1.2. Ca2+/Calmodulin-Dependent Protein Kinase II
1.2.1. The CaMK Family
A family of Ser/Thr protein kinases called the CaMKs are responsible for transducing
the diverse Ca2+
oscillations that occur in the cardiac myocyte, into physiological
actions. The intermediary protein calmodulin (CaM) has a particular role in directing
the activity of the CaMKs. This occurs when four Ca2+
ions first bind to CaM to form a
Ca2+
/CaM complex. A ‘dedicated’ CaM exists on ion channels to sense and regulate
Ca2+
in a direct manner, whilst a ‘promiscuous’ CaM exists to adjust the behaviour of
other proteins such as the CaMKs (Saucerman and Bers, 2012).
The family of multifunctional kinases, CaMKII, CaMKK, CaMKI and CaMKIV
have an immense number of duties to fulfil, with the latter three acting as part of a
signalling cascade. Other members such as the myosin light chain kinase (MLCK),
CaMKIII (also known as eEF2-kinase) and phosphorylase kinase act specifically on one
substrate (Wayman et al., 2011). As they have different binding affinities for CaM, the
kinases detect different levels of [Ca2+
]i and specific propagations of Ca2+
/CaM
complexes (Song et al., 2008). Signalling involved with cell growth or specific
targeting in the nucleus can then be differentiated from the global Ca2+
signals that are
required for E-C coupling.

26
1.2.2. Biology of CaMKII
1.2.2.1. Isoforms and Gene Splicing
Mammalian cells possess four CaMKII gene products (α, β, γ, δ). The vasculature and
cardiac muscle express the γ and δ subtypes, whilst the α and β are predominantly found
in neuronal tissue (Schworer et al., 1993; Hudmon and Schulman, 2002). All four gene
products share a high degree of homology, in particular at the N-terminal catalytic
domain, where they have up to 92% similarity (Tobimatsu and Fujisawa, 1989). Gene
splicing of seven exons in a central variable domain allows these four subtypes of
CaMKII to diversify considerably both within and between the different organs and
tissues (Tombes et al., 2003).
The δ isoform contains 15 known mammalian isozymes, of which seven are
expressed in the heart (Tombes et al., 2003). Srinivasan et al. (1994) recognised that the
δB isoform possessed a unique nuclear translocation sequence in the variable domain,
speculating its activity might be for gene expression and cell proliferation. This was not
apparent in the sequencing of the neuronal specific δA or the ubiquitously expressed δC
subtype, which were confirmed to be contained within the cytosol by
immunofluorescence. Other variants for the heart (δF, δG, δH, δI, δJ) are thought to be
only conserved for neonatal and stages of development (Hoch et al., 2000).
Interestingly, extreme pathological stimuli can bring about non tissue specific variants.
Colomer et al. (2003) detected, after seven days of transverse aortic constriction (TAC)
in the mouse heart, the mRNA of the skeletal muscle specific δD isoform.

27
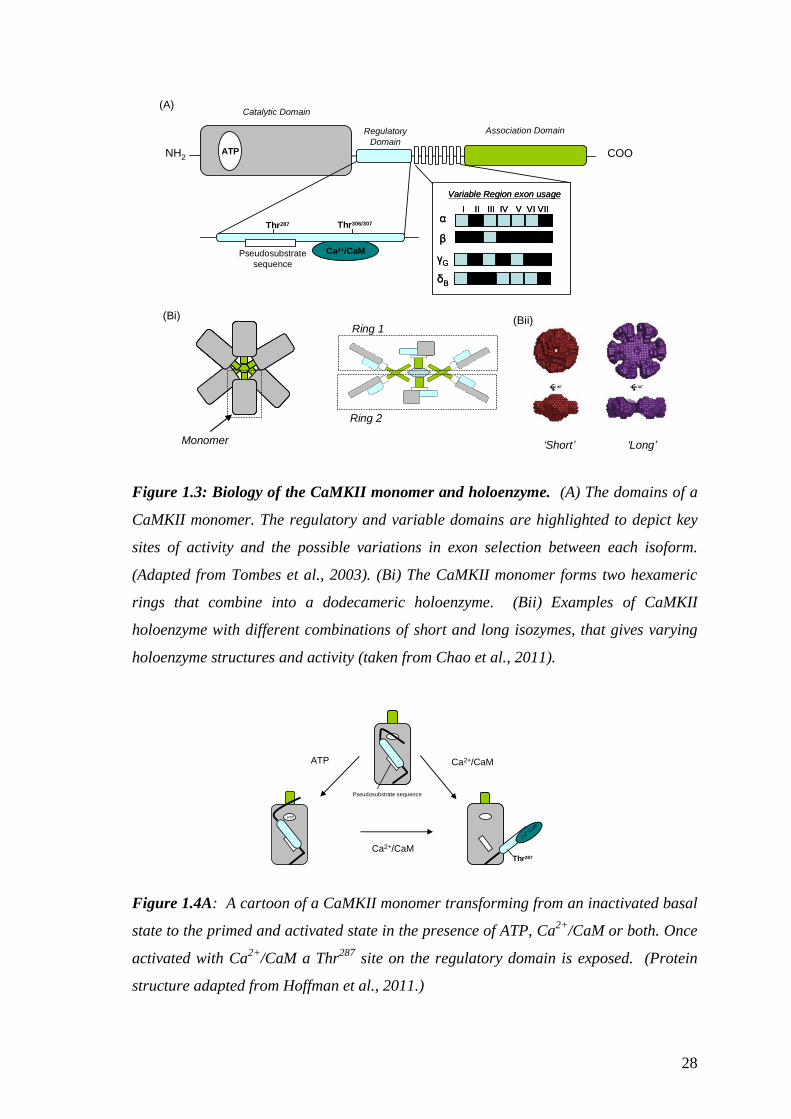
1.2.2.2. Structure and Functional Properties
The main domains that constitute the CaMKII monomer are illustrated in figure 1.3A.
They are: the highly conserved N-terminal catalytic domain that contains the ATP
binding site for its targeted proteins; the central regulatory domain that contains the
binding site for Ca2+
/CaM; the C-terminal association domain that allows the union of a
holoenzyme and the proximity for neighbouring kinase interactivity (Hudmon and
Schulman, 2002). The monomers gather into a dodecameric holoenzyme (figure
1.3B(i)&(ii)) via the association domains’ arrangement of two hexameric rings
(Rosenberg et al., 2006). A combination of isozymes may compromise the
holoenzyme, enabling varying lengths and properties (figure 1.3B(ii)) contributing to
various amounts of allosteric control (Chao et al., 2011).
As shown in figure 1.4A, at low [Ca2+
]i a pseudosubstrate sequence located in
the regulatory domain acts to auto-inhibit the kinase activity. This basal state also
interferes with the ATP binding site on the catalytic domain (Hoffman et al., 2011). A
rise in [Ca2+
]i and the binding of Ca2+
/CaM will render CaMKII active, as the α helix
that arranges the kinase into an auto-inhibitory state is broken (Chao et al., 2011). A
rearrangement of the regulatory domain will expose a Thr287
(Thr286
for CaMKIIα)
phosphorylation site and the ATP binding site on the catalytic domain. Recent research
suggests that at a high ATP concentration, it is possible that a ‘primed’ regulatory
domain may be available to assist in the binding of Ca2+
/CaM (Hoffman et al., 2011).
28
NH2 COOATP
Thr287 Thr306/307
Ca2+/CaM
α
β
γG
δB
Variable Region exon usage
I II III IV V VI VIIα
β
γG
δB
Variable Region exon usage
I II III IV V VI VII
(A)
(Bi)
ATPATPATP
ATPATPATP
ATPATPATP
ATP ATP ATP
ATP ATP ATP
ATP ATP ATP
ATPATPATP
ATPATPATP
ATPATPATP
ATP ATP ATP
ATP ATP ATP
ATP ATP ATP
Pseudosubstrate
sequence
Catalytic Domain
Regulatory
Domain
Association Domain
‘Short’ ‘Long’
(Bii)
Monomer
Ring 1
Ring 2
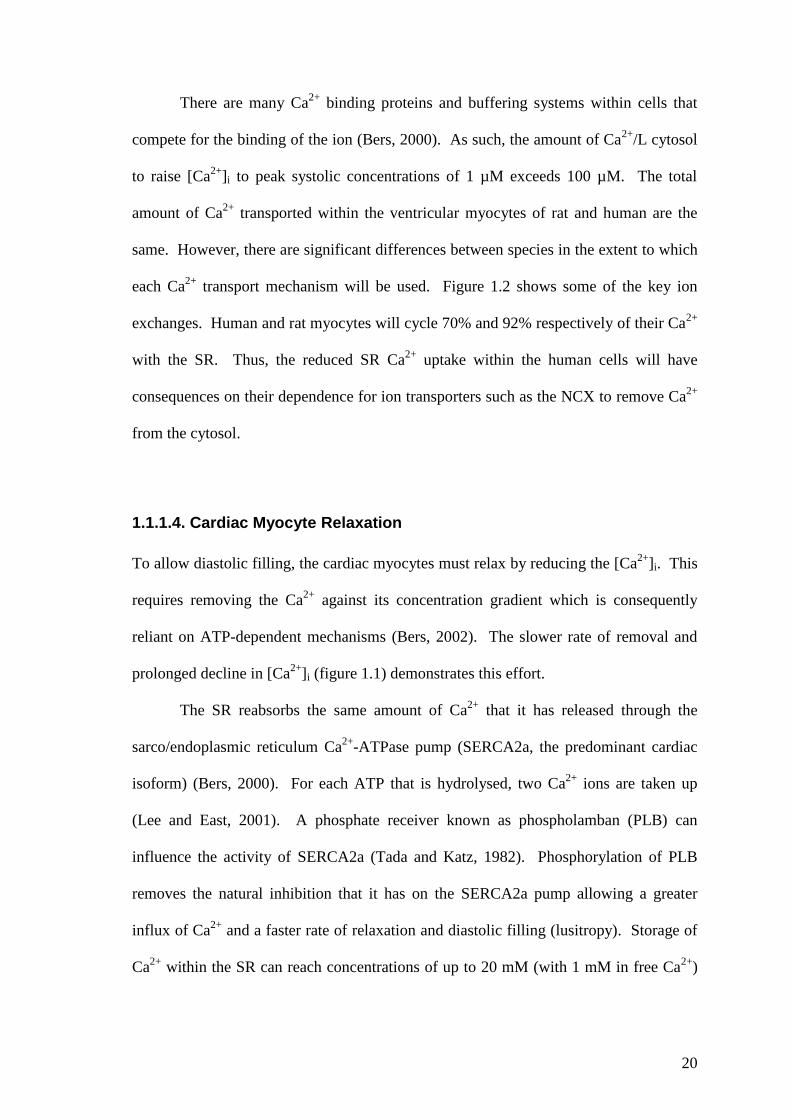
Figure 1.3: Biology of the CaMKII monomer and holoenzyme. (A) The domains of a
CaMKII monomer. The regulatory and variable domains are highlighted to depict key
sites of activity and the possible variations in exon selection between each isoform.
(Adapted from Tombes et al., 2003). (Bi) The CaMKII monomer forms two hexameric
rings that combine into a dodecameric holoenzyme. (Bii) Examples of CaMKII
holoenzyme with different combinations of short and long isozymes, that gives varying
holoenzyme structures and activity (taken from Chao et al., 2011).
ATP Ca2+/CaM
ATP
Ca2+ /C
aM
Ca2+/CaM
Pseudosubstrate sequence
Thr287
Figure 1.4A: A cartoon of a CaMKII monomer transforming from an inactivated basal
state to the primed and activated state in the presence of ATP, Ca2+
/CaM or both. Once
activated with Ca2+
/CaM a Thr287
site on the regulatory domain is exposed. (Protein
structure adapted from Hoffman et al., 2011.)

29
If a Ca2+
transient increases in frequency, amplitude or duration (figure 1.4B) it will
present two adjacent and ‘Ca2+
/CaM active’ CaMKII. This allows the newly exposed
Thr287
site to be autophosphorylated (Meyer et al., 1992). Moreover, the kinase gains
an improved association with Ca2+
/CaM, as its affinity increases by 1000 fold. Termed
‘CaM trapping’ this new affinity allows CaMKII to have an autonomously active status
even in the presence of low [Ca2+
]i (Meyer et al., 1992; Singla et al., 2001). Even with
the dissociation of Ca2+
/CaM, phosphorylation of Thr287
prevents the regulatory domain
from returning to an auto-inhibitory state and have further autonomy in the absence of
Ca2+
(Hoffman et al., 2011).
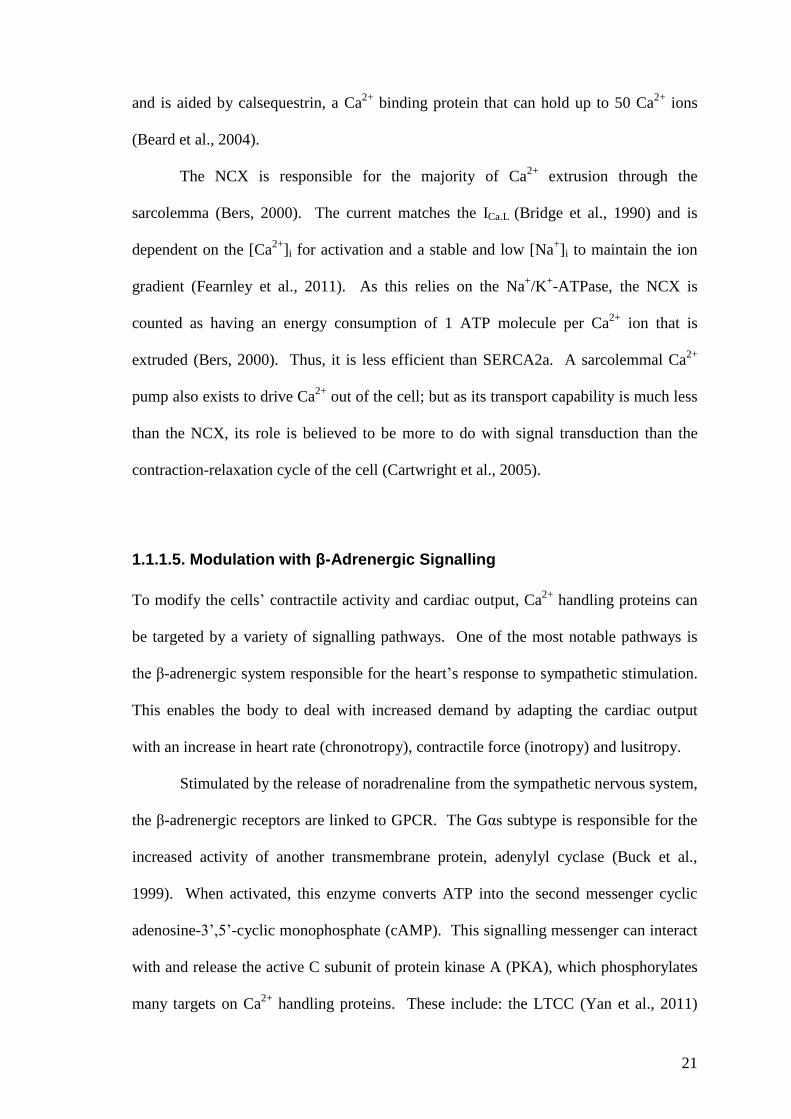
Autophosphorylation &
CaM Trapping
P P
Thr287
High [Ca2+] Low [Ca2+]
Figure 1.4B: Further active states of CaMKII can be achieved with persistent Ca2+
transients allowing kinase-kinase activity at the Thr287
site. This slows the dissociation
of Ca2+
/CaM (CaM trapping) from the kinase and the likelihood of it returning to an
auto-inhibitory state. P, phosphorylation
The phosphorylation of the Thr306/307
sites within the regulatory domain allows CaMKII
to be ‘capped’ and prevents Ca2+
/CaM from rebinding to the kinase (figure 1.4C).
‘CaM capping’ can only be done when Ca2+
/CaM is not associated to the region as they
normally share a similar location (figure 1.3A). This has been proposed to be a
mechanism that will differentiate between the stimulated and unstimulated kinases in
order to maintain a balance between the reactions (Colbran, 1993; Hudmon and
Schulman, 2002). Other states of activity have recently been discovered at the

30
Met280/281
sites within the regulatory domain (Erickson et al., 2008). Oxidation of these
sites when CaMKII is in the basal state would interfere with the binding of Ca2+
/CaM
and the phosphorylation of Thr287
(Rellos et al., 2010). Thus, it is proposed that Ca2+
is
not needed (or is required at a lower concentration) for this independent activity state of
CaMKII.
ROS
CaM Capping
ATP
Basal
Basal Oxidation
Figure 1.4C: Further activity states of CaMKII. (1) ‘CaM capping’ of CaMKII may
occur in the absence of Ca2+
/CaM and be a method of preventing its association with
the kinase. (2) Oxidation of CaMKII at Met280/281
gives further activity states in the
absence of Ca2+
.
For equilibrium, counteracting and deactivating CaMKII activity is achieved by
phosphatases that dephosphorylate the kinase and its downstream targets (Ishida et al.,
2008). These include the Ser/Thr protein phosphatases (classed as PPP), such as PP1
and PP2A. Although PP2B (calcineurin) can not directly dephosphorylate any CaMKII
targets, an indirect relationship exists via PP2B influence on Inhibitor-1, which is a
protein inhibitor of PP1. A more direct regulation of the kinase is believed to come
(1)
(2)

31
from a class of phosphatases called CaMK phosphatases, also expressed in a nuclear
form (Ishida et al., 2008).
1.2.2.3. Pharmacological Manipulation
Many small molecule and peptide inhibitors have been devised to uncover the
functional capacity of CaMKII. The organic small molecule inhibitors KN-62 and KN-
93 compete for the Ca2+
/CaM binding site, but have been criticised for their non-
specific ion channel activity (Ledoux et al., 1999; Gao et al., 2006; Rezazadeh et al.,
2006). The inactive analog, KN-92, is reported to also have the same non-specific
activity (Chelu et al., 2009, Said et al., 2008, Tsung et al., 2007). Thus, the inadequate
association with CaMKII gives KN-92 an important role as a negative control for
research within the field.
The auto-inhibitory substrate that lies within the kinase has been a target for
many of the peptides. These include; CaMKII (281–309), CaMKII (273–302),
autocamtide-2-inhibitory peptide (AC3-I) and the autocamtide-2 related inhibitory
peptide (AIP) which has been developed in a myristoylated form or with an
antennapedia transport peptide sequence to increase its cell permeability. These
peptides are believed to have cross activity with other Ca2+
/CaM regulated proteins
(Ishida et al., 2008). Another small peptide inhibitor, CN21 (Vest et al., 2007), is based
on a CaMKII inhibitory protein that was identified in the rat brain (Chang et al., 1998).
The advantage of having an increased specificity to CaMKII is however limited by only
partially inhibiting states of CaMKII activity.

32
1.2.3. Physiological Functioning in Cardiac Myocytes
In the heart, the role of the ‘multifunctional’ CaMKII is as wide-ranging as its upstream
activator Ca2+
. It primarily targets the proteins that maintain the homeostasis in Ca2+
cycling, whether for E-C coupling, or in the promotion of growth and transcription
within the nucleus. For the ventricles of the adult mouse, the ratio of the δ isoforms are
split 60% for the nuclear tagged δB and 40% for the cytosolic δC (Mishra et al., 2011).
Although the study also confirmed that these labels do not confine the isoforms to these
specific loci, much of the research in the field has followed this trend in characterising
the physiological capability of the δ-isoform. That is, the main interest of research has
either been (i) CaMKIIs function as a modulator of [Ca2+
]i during E-C coupling or; (ii)
as a mediator of gene transcription and regulation in the nucleus. This thesis will
largely focus on its role within E-C coupling, with only a brief description on its
regulatory role in gene transcription.
1.2.3.1. CaMKII & Excitation-Contraction Coupling
The components that enable E-C coupling in cardiac myocytes include multiple
CaMKII substrates (figure 1.5). The targets located on various ion channels indicate its
potential to influence the action potential, while in the CICR cascade, it is involved in
each step. Immunofluorescence staining for CaMKII in cardiac myocytes depicts this
strong relationship with the components of E-C coupling as it is co-localised within the
T tubules and the Z bands of the cell (Wu et al., 1999). These areas are enriched with
LTCC and RYR2 and signify the key role that CaMKII has on the Ca2+
that enters the
cytosol via these two ion channels.

33
Sarcomere
Sarcoplasmic Reticulumn
RYRRYR
T. T
ub
ule
Cytoplasm
Extracellular Matrix
SERCASERCALTCC
Ca2+
Pump
Ca2+
Ca2+
Ca2+
Na+
PLB
Ca2+
K.
ATP
K.
ATP Na+
Ch.
K+
Ch.
K+
Ch.
PP
PPPP
PP
PP PP
K+K+
Na+/
K +
Na+/
K +
K+
Na+/H+
Na+
H+
PP
Inotropy
Chronotropy
Na+
Lusitropy
Figure 1.5: CaMKII targets within the cytosol. Several phosphorylation sites are
located on Ca2+
handling proteins of the SR and the ion channels located on the
sarcolemmal. (1) CaMKII assists the CICR steps via phosphorylation of the LTCC, and
the RYR2. (2) Lusitropy is enhanced by its activities on SERCA2a and PLB. (3) Further
modifications to E-C coupling can be made by the ion channels located on the
sarcolemma, which can either lengthen or shorten the duration of the action potential
(highlighted by the respective dotted line) and thus the availability and timing of the
contracting myocyte. LTCC, L-type Ca2+
channel; RYR, ryanodine receptor; PLB,
phospholamban; SERCA, Sarco/Endoplasmic Reticulum Ca2+
-ATPase; Na+ Ch., Na
+
Channel; K+ Ch., K
+ Channel; NHE, Na
+/H
+ Exchange; P, phosphorylation.
(Lengthened and shortened action potential figures taken from Anderson, 2009).

34
1.2.3.2. Regulation of the L-type Ca2+ Channel
CaMKII is targeted to the sarcolemma by the binding site located on the regulatory β-
subunit of the LTCC (Grueter et al., 2008). The binding sequence (486-500) parallels
the sequence of the kinase regulatory domain (274-289), which interestingly includes
comparable phosphorylation sites at Thr498
and Thr287
, respectively. Phosphorylation
increases the ion channel open probability (Po) or facilitation, allowing a greater ICa.L.
Hudmon et al. (2005) also demonstrated that the pore forming α-subunit of the LTCC
contains various anchoring sites for CaMKII. Not only was an active CaMKII able to
tether and regulate the channel’s function but also its deactivated state, allowing it to
possibly act as a detector of Ca2+
frequency of influx.
The ‘positive force staircase’ is seen in cells that are repeatedly depolarised, and
demonstrates one of the actions of CaMKII on the LTCC (Lee, 1987; Hashambhoy et
al., 2009). The progression in the amplitude of ICa. demonstrates the facilitation of the
ion channel as CaMKII increases the Ca2+
entry and a slower rate of ion channel
inactivation. It may possibly compensate the Ca2+
dependent inactivation of the ion
channel that occurs with increased activity (Maier and Bers, 2007). To confirm the
involvement of the kinase, Anderson et al. (1994) used CaMKII inhibitors to block the
ion channel’s facilitation. It was also observed that the presence of [Ca2+
]i was needed
for CaMKII involvement. CaMKII inhibitors also had no effect upon β-adrenergic
stimulation of the ion channel, thus defining the two signalling pathways.
1.2.3.3. CaMKII and the RYR
The technical difficulties in conducting in situ experiments for investigating the RYR2
has made the role of CaMKII controversial. There is contradictory evidence as to
whether CaMKII increases the Po of the channel (Currie et al., 2004) or decreases its

35
sensitivity and subsequent release of Ca2+
(Yang et al., 2007). CaMKII phosphorylation
sites have been identified at residues Ser2808/2809
(Witcher et al., 1991) and Ser2814/2815
(Wehrens et al., 2004). This would imply that the ion channel is phosphorylated by
CaMKII. Also, studies using isolated cardiac myocytes that overexpress CaMKII
(Maier et al., 2003) or pharmacological blockade of the kinase (Li et al., 1997) support
its involvement in up regulating the RYR2 and increasing the release of stored Ca2+
from the SR. Kushnir et al., (2010) suggest that such activity is important for the force-
frequency relationship that enhances myocardial contractility. But this view is also
controversial due to the incapability of such activity to suffice loading of Ca2+
within
the SR that would be required to maintain inotropy (Eisner et al., 2009).
1.2.3.4. Ca2+ Uptake into SR: PLB and SERCA2a modifications
Any increase in [Ca2+
]i is balanced by the efficiency in its removal. CaMKII
phosphorylates PLB at Thr17
, releasing its natural inhibition of the SERCA2a pump and
admitting Ca2+
into the SR (Mattiazzi et al., 2005). There are possible sites of activity
on Ser38
of SERCA2a (Narayanan and Xu, 1997) but this has not been confirmed.
Although PLB activity is not essential for Ca2+
removal and subsequent relaxation of
the cell (Li et al., 1998, DeSantiago, 2002), there is some correlation between the
phosphorylation state of the Thr17
site and relaxation time (Hagemann et al., 2000).
Some reports also suggest this might be the case with SERCA2a activity and CaMKII
(Odermatt et al., 1996). During times of increased stimulation, such as increased heart
rate, a frequency dependent acceleration of relaxation is a necessity for ventricular
filling. Kemi et al. (2007) showed an interesting cardiac development in aerobically
exercised mice. Their cells/hearts had a decrease in PLB expression relative to the

36
SERCA2a pump, but an increase in Thr17
phosphorylation due to CaMKII. This meant
that the exercised mice had adapted a CaMKII dependent mechanism of Ca2+
uptake.
1.2.3.5. Regulation of Sarcolemmal Ion Channels
CaMKII’s ability to associate with ion channels confers its prominent role in E-C
coupling (Anderson, 2009). Tan et al. (2002) were the first to give a mechanistic
explanation of how Ca2+
is able to disrupt the inactivation properties of the Na+ channel.
They reported that interaction of the Ca2+
sensitive protein CaM with an IQ motif (first
two amino acids: isoleucine, glutamine) at the Na+ channel’s C terminus, was essential
in reducing its inactivation gating process. CaMKII was found to work in a similar way
to CaM, as it has a direct association with phosphorylation sites located on the ion
channel C terminus (Wagner et al., 2006). By regulating the inactivation properties of
the channel, CaMKII can increase and prolong the INa that would also augment the
action potential duration. Some of the differences between the two Ca2+
sensitive
proteins were investigated by Aiba et al. (2010), who showed that CaM does not alter
the Na+ channel’s recovery from inactivation or the magnitude of the late current as
CaMKII does.
Some balance with respect to action potential duration is kept through CaMKII’s
regulation of K+ channels. Tessier et al. (1999) were the first to show that the fast
outward current can be influenced by the CaMKII inhibitor KN-93 by allowing a faster
Ito inactivation. El-Haou et al. (2009) specified this regulation to the Kv4.3 with its
associated regulatory protein SAP97 being a key attachment site for CaMKII and its
subsequent gating effects. Variable concentrations of Ca2+
also affect the gating of
specific K+
channels subtypes. The Kv4.3 was effective during low ICa.L whilst the
Kv4.2 became essential during increased Ca2+
concentrations (Colinas et al., 2006).

37
Thus, CaMKII can also shorten the action potential duration by increasing Ito, which
will then reduce ICa.L. This modification can be seen as a form of self regulation as it
would subsequently limit CaMKII activity.
CaMKII is reported to phosphorylate the NHE (Fliegel et al., 1992) although
this has not been confirmed. During acidosis, CaMKII can still continue its activity on
substrates such as the SR. This allows some contractile activity to be maintained if such
cellular environment is achieved (Mattiazzi et al., 2007). Thus, the ability to
phosphorylate the NHE would also be a mechanism for restoring intracellular pH.
1.2.3.6. Excitation-Transcription Coupling
CaMKII’s role within the nucleus has a long term influence and underpins cellular
adaptation. CaMKIIδB, which has the nuclear translocation sequence, is the
predominant isoform in the adult heart (Mishra et al., 2011). It has gained much
attention for its role in pathological cardiac hypertrophy with several genes associated
with its activity including β-myosin heavy chain (Zhu et al., 2000), NCX (Mani et al.,
2010), ERK1/2 (Zou et al., 2001), NFκB (Kashiwase et al., 2005). The chromatin
repressor, histone deacetylase (HDAC) acts as the chief molecular mechanism for
regulating transcription factors and genes. The condensation of DNA can be alleviated
by HDAC phosphorylation and its subsequent translocation out of the nucleus (Zhang et
al., 2007; Lu et al., 2010). Direct phosphorylation sites have been found on HDAC4
(Backs et al., 2006) whilst an indirect relationship with HDAC5 exists via the Ca2+
released by the nuclear IP3R (Bossuyt et al., 2008; Wu et al., 2006). This pathway for
releasing Ca2+
close to the nucleus by the numerous neurohormonal agents that increase
the activity of the second messenger InsP3, stimulates CaMKII to relocate to the
nucleus (Bare et al., 2005).
38
1.3. Cardiovascular Disease
1.3.1. Current Trends
Cardiovascular disease (CVD) is the generic term that encompasses the many acquired
and inherited diseases of the heart and circulatory system. With 17 million deaths
recorded in 2008, which accounts for 31% of all mortalities, CVD is the leading cause
of death worldwide (WHO, 2011). In the U.K. this accounts for 191,000 deaths in
2008, with coronary heart disease (CHD) and stroke accounting for 88,000 (46%) and
43,000 (23%) respectively of the total cases (BHF, 2010).
The prevalence of the diseases in society has made them common terms, with
coronary thrombosis (or the more expressive phrase ‘heart attack’) a prime example.
On average acute myocardial infarction (AMI) occurs in the U.K. every two minutes
and with every six minutes, 30% of these victims will die (BHF, 2010). Mortality
occurs mainly from acute heart failure, as the sudden reduction in blood flow
(ischaemia) to the myocardium, reduces cardiac output and forces the tissue to die
(AMI). Those that do survive the acute event face further complications as the heart is
remodelled to compensate for the damaged tissue. In doing so, the heart struggles to
maintain cardiac output (chronic heart failure, CHF), which inevitably provides limited
capability for activity and a lower quality of life.
Scientific research on risk factors, causes and prevention of CHD has had
favourable results on prevalence and mortality rate within western society (BHF, 2011).
Since the 1960’s the U.K. mortality rate from CHD has decreased by around 50%
(figure 1.6). A greater understanding of the risk factors and public awareness to these
dangers is reported to have contributed to 50% of the reduction, with 40% attributed to
the advancement in medical therapies, such as reperfusion therapy (Unal et al., 2004).
These figures demonstrate the importance of the combined effect of primary prevention

39
and medical treatments in tackling such diseases. However, the estimated number of
people living with heart failure is increasing rapidly (figure 1.6). One reason for this is
due to an aging population as the number of people aged 85 and over has more than
doubled since 1981 (ONS, 2010). The predicted annual mortality rate for those
admitted to hospital with heart failure is 30% (Cleland et al., 2010). But patients
discharged from cardiology wards, and who have thus gained specialist care (diagnosis
and evidence based medicine to manage the condition), are more likely to survive, than
those discharged from general medical wards.
1960 1970 1980 1990 2000 20100
250
500
750
CHD HFCVD
Year
No
. o
f p
eo
ple
(x 1
03)
Figure 1.6: Prevalence and mortality rates of CVD in the U.K. (England, Scotland,
Wales) population during the last 50 years. Total deaths from cardiovascular disease
(CVD) and in particular coronary heart disease (CHD) have gradually declined whilst
the number of people living with heart failure (HF) has escalated (adapted from BHF,
2011).

40
1.3.2. The Cardiovascular Disease Continuum
Dzau and Braunwald in 1991 proposed a chain of events, known as the CVD continuum
(figure 1.7), to explain the pathogenic process of cardiovascular events such as AMI and
CHF. Originating with a multitude of risk factors consisting of dyslipidaemia,
hypertension, LVH, diabetes and smoking, it was proposed that if these factors were left
untreated, a pathological progression would begin with atherosclerosis, and develop into
myocardial ischaemia, heart failure and death. It was also suggested that it would be
possible to intervene at any stage in the development of the disease, to prevent or delay
its occurrence and thus prolong life.
Hypertension
Diabetes
Physical Inactivity
Dyslipidaemia
Smoking
Obesity
Genetic
Risk Factors CVD Continuum
Atherosclerosis
CHD
Ischaemia
AMI
Arrhythmias
Remodelling
Heart Failure
DEATH
Incre
ased r
isk o
f C
VD
Dete
riora
tion in
Health
Figure 1.7: Cardiovascular Disease Continuum. Manifestations of risk factors
promote a myriad of pathological events that include atherosclerosis, myocardial
ischaemia, arrhythmia and heart failure (adapted from Dzau and Braunwald, 1991).
The risk factors contribute to atherosclerosis and vascular disease with plaque
and fatty deposits that stenose (narrow) and harden the arteries. Hypertension in itself is
a prominent risk factor as it adds continued stress to arterial walls which are worsened
with plaque deposits. Immune cells (e.g. macrophages and T cells) and vascular smooth
muscle cells amass over time and dress the injured walls with an accumulation of

41
cholesterol. This growth causes stenosis (narrowing of the lumen) that limits blood
flow and can contribute to chronic ischaemia of the surrounding tissue.
Dependent on the location of the vascular disease, it may lead to several
outcomes. In the heart it is termed CHD and if a severe stenosis is formed, will cause
myocardial ischaemia. It becomes lethal when a coronary thrombosis is formed as the
fibrous cap of the atherosclerotic plaque ruptures and completely blocks the arteries and
impedes blood flow. The extent of MI is dependent on the timing of reperfusion
therapy (see section 1.3.3.3.). This will shape the extent of injury and further CVD as
remodelling of the scarred and surviving tissue has a significant effect on the
development of arrhythmias and heart failure.

42
1.3.3. Myocardial Infarction
1.3.3.1. Myocardial Ischaemia
The heart acts as a mechanical pump to ensure blood enriched with oxygen and
metabolic substrates is circulated to the tissues. It also needs to deliver blood to itself
via the coronary arteries. Due to the extravascular compression, coronary flow
opportunistically occurs during the diastolic phase of the contraction cycle (Klabunde,
2011). Originating at the base of the aorta are the right and left coronary arteries. They
lie on the epicardial surface of the heart and divide into smaller branches and a
microvascular network. These distal networks provide more vascular resistance than
the coronary vessels on the epicardium and thus provide transmural pressure that
influences the coronary blood flow. The coronary cycle is completed by the joining of
the capillaries with cardiac veins that drain into the coronary sinus located in the right
atrium.
Coronary blood flow is tightly regulated by the oxygen demand of the tissue. As
the basal oxygen consumption of the tissue is very high, oxygen extraction is already
near maximal at rest (70-80% of arterial oxygen content) (Duncker and Bache, 2008).
Under normal conditions, a balance exists between the oxygen demand of the
contracting heart (determined by heart rate, systolic pressure and LV contractility) and
the supply provided by the coronary blood flow. Ischaemia will arise if this balance is
disrupted (Klabunde, 2011).
Myocardial ischaemia can either occur when there is an increase in the tissue’s
metabolic demand, a decrease in the circulation of oxygenated blood or both. A rise in
the metabolic demand occurs with increases in heart rate, inotropy, or the blood volume
(preload), or the resistance that the heart has to work against in circulating blood
(afterload). A reduced capacity to circulate blood arises with conditions such as; spasm

43
of blood vessels (vasospasm), narrowing of vessels (stenosis), or formation of blood
clot (thrombus) that partly (non-occlusive) or entirely (occlusive) block a coronary
artery. A decrease in the ratio of oxygen supply/demand allows myocardial hypoxia to
develop. When this is sustained for a long period it gives rise to anginal chest pain.
Management of chronic stable angina with β-blockers, calcium channel blockers and
nitrates, reduces the oxygen demand of the tissue or improve its blood supply
alleviating the angina symptoms (Chaitman and Laddu, 2012).
An acute coronary syndrome is used to describe any condition of sudden
myocardial ischaemia associated with occlusive or non-occlusive thrombus formation
and includes a continuum of its intensity beginning with unstable angina and non-ST
segment elevation MI (NSTEMI), to the more severe ST-segment elevation MI
(STEMI; Overbaugh, 2009). Unstable angina and NSTEMI usually occur from a non-
occlusive thrombus, whilst a STEMI emerges from an occlusive thrombus that leads to
a large risk zone. The injury usually involves a large part of the ventricular wall. When
this is assessed with an electrocardiogram (ECG), the electrical conductance at systole
seems to end prematurely (due to a disrupted baseline voltage in the ischaemic tissue)
and elevates the ST-segment (figure 1.8A). With the QRS complex having the most
characteristic change, ECG leads that overlie the infarct zone gave rise to the term Q-
wave infarction. Any patients presenting to hospital with ST elevation are candidates
for reperfusion therapy (see section 1.3.3.3.).
There are two main types of MI: transmural infarcts, where myocardial necrosis
is incorporated through the full thickness of the ventricular wall; or nontransmural
infarcts where the necrosis occurs predominantly in the subendocardium. The extent of
injury not only depends on the location and the size of the occluded coronary artery

44
(and the amount of myocardium at risk of dying), but also the duration of ischaemia and
the collateral blood flow of the surrounding tissue.
LV
Reversible InjuryIrreversible Injury
Coronary Occlusion: 20 min 60 min 3 hrs >3-6 hrs
Consequences of I-R
-Stunning
-Preconditioning
-Tissue Viability
-No Necrosis
-Subendocardial necrosis
(Salvage of outer layers)
-Necrois extends into
midmyocardium,
subepicardium
-Near transmural
infarction (no salvage of
tissue but may decrease
LV remodelling)
(i) Ischaemia
(ii) Injury
(iii) Infarction
Coronary
Occlusion
ECG recording
P
Q
R
S
T
P
Q
R
ST
P
Q
R
S
T
Figure 1.8: Myocardial Infarction. (A) A coronary occlusion can disrupt the EC
coupling of the myocardium. This can be measured on an ECG to indicate the extent of
injury; (i) an inverted T wave is a sign of ischaemia, (ii) ST segment elevation indicates
injury, (iii) abnormal Q wave shows presence of infarction (adapted from Overbaugh,
2009). (B) Reversible damage such as stunning occurs when ischaemia lasts less than
20 minutes. After this time point and in the absence of collaterals irreversible injury will
extend as a wavefront from the endocardium to the epicardium: LV, left ventricle; Red,
ischaemic tissue; Yellow, infarct tissue; Blue, non-ischaemic tissue (adapted from
Kloner and Jennings, 2001).
(A)
(B)

45
Dependent on these factors, myocardial necrosis progresses as a wavefront over time,
from the subendocardium to the subepicardial layers (see figure 1.8B; Kloner and
Jennings, 2001). The survival of the myocardium distal to the coronary occlusion
depends primarily on the amount of collateral blood flow it receives and the timeliness
of reperfusion. Collateral flow is typically minimal in this region as coronary pressure
is low and distributed to the outer layers by the compression of contractions.
In the absence of significant collateral blood flow the duration of ischaemia is
the main determinant of infarct size (Kloner and Jennings, 2001). Ischaemia lasting up
to 20 minutes will induce changes that can be endured by the cells. Reperfusion therapy
within this time frame will completely restore myocardial contractility, although the
myocardium will exhibit some signs of temporary contractile dysfunction termed
stunning. The mechanisms for this reversible injury are not yet fully understood but are
believed to centre on the generation of reactive oxygen species (ROS) and the reversible
modification of the Ca2+
handling proteins (Eberli, 2004). Due to these intracellular
changes occurring at these later stages, stunning is seen as a form of reperfusion injury.
On the contrary, a protective element exists within ‘stunned’ cells that have been
subjected to ischaemia of no more than 10 minutes in duration. Known as
preconditioning (section 1.3.4), the cells will endure a subsequent ischaemia-
reperfusion insult better than cells that have not been conditioned in this way. Beyond
the ischemic threshold of 20 minutes, critical factors will drive the cells to irreversible
injury and death (see next section). Within 60 minutes the wavefront of tissue injury is
extended from the subendocardium and there is nearly fully transmural infarction after 3
hours of coronary occlusion (Kloner and Jennings, 2001).

46
1.3.3.2. Cell Injury and Death
Termination of blood flow and perfusate to the working myocardial tissue will have
detrimental consequences to the cellular activity of the cardiac myocytes. The decrease
in perfusion pressure promptly leads to hypokinesis, signified by a marked reduction in
global LV contractility and systolic pressure (Akaishi et al., 1991). The absence of
oxygen drives anaerobic metabolism, a rise in catabolites and an acidic environment.
Unable to supply the high energy demands of the cell, the loss of intracellular
homeostasis promotes various mechanisms of injury (figure 1.9). Mitochondrial stress
increases the production of ROS and oxidises membrane phospholipids, proteins and
nucleic acids. All mechanisms contribute in driving cell death by oncosis, apoptosis
and autophagy (Buja and Weerasinghe, 2010).
The Ischaemic Cascade
Much of the biochemical analysis of various ischaemic conditions and durations was
performed prior to the 1990’s, with a great deal of the research coming from the
laboratory of Jennings and Reimer. It was revealed that the cessation of perfusion had
immediate consequences on the cells’ metabolic activity. Residual oxygen is exhausted
within 10 seconds of coronary occlusion, and 90% of creatine phosphate reserve is
depleted in the first minute (Jennings et al., 1990). Consequently, the tissue relies
heavily on anaerobic glycolysis to maintain ATP synthesis, although this amount is only
one quarter of the aerobic glycolytic production (Jennings and Reimer, 1991). A
progressive reduction in ATP levels sees the values reach 35%, 9%, 7%, and 5% of
control levels after 15, 30, 40 and 60 minutes of ischaemia respectively (Jennings et al.,
1978). Irreversibly injured myocytes are characterised as exhibiting ATP levels below
10% of control and a cessation of anaerobic glycolysis (Jennings and Reimer, 1991).

47
O2 demand > O2 delivery
ATP Anaerobic Glycolysis
Lactate, Adenosine pool, ROS, Pi, H+ ( pH)
Na+/K+-ATPase
[K+]o [K+]i [Na+]i [Ca2+]i
SERCANHE
NCX
Necrosis - Apoptosis - Autophagy
Osmotic Swelling Mitochondria mPTP Arrhythmias
Irre
vers
ible
In
jury
R
evers
ible
In
jury
Duration of
Ischaemia
Figure 1.9: The cascade of intracellular events that is triggered by ischaemia and
ends with cell death. Anaerobic glycolysis and other components promote
unfavourable changes in the cell. Ion transporters are particularly vulnerable and
disrupt the intracellular and extracellular concentrations of ions. With other pro injury
mechanisms, such as mitochondrial stress, injury and cell death are inevitable if
ischaemic conditions continue.

48
A by product of anaerobic metabolism is acidosis and lactate production.
Combined with the increased catabolites from the nucleotide pools (AMP, NAD, Pi
etc.) a steadily increasing osmotic load is added to the cell. These conditions favour
further H20 absorption that shrinks the extracellular space (Fiolet et al., 1993).
Adenosine and other metabolites and neurotransmitters diffuse to the extracellular fluid.
A concomitant stimulation of adrenergic, purinergic and muscarinic receptors stimulate
intracellular signalling systems that also stretch and cause mechanical changes to the
tissue (Carmeliet, 1999; Kloner and Jennings, 2001). With increased production of
protons, the intracellular pH can reach 6.0 after just 10 minutes of ischaemia (Fleet et
al., 1985). Acidosis disrupts glycolysis and the contractile components of the cell,
which contributes to an onset of contracture (and a rising end diastolic pressure) that
generally occurs after 15 minutes of ischaemia (Allen et al., 1993).
Ischaemia has a significant effect on the cells’ ion concentrations and currents.
The reduced capacity to generate ATP limits the functional capability of ion transporters
such as the Na+/K
+-ATPase. This prevents the transporting of K
+ into the cell and
generates a net increase in [K+]o and a loss of [K
+]i. With ATP levels declining rapidly
a promotion of K+ efflux occurs by the activation of the energy sensitive IKATP (Billman,
2008). Promotion of further K+ efflux via the voltage gated K
+ channels occurs with a
move towards a positive membrane potential (of around -60 mV) and away from the K+
equilibrium, driven by the accumulation of intracellular Na+ and Ca
2+ (Carmeliet, 1999).
Ultimately this results in a shortening of the action potential duration.
A rise in [Na+]i is driven by two transporters: the deficiency of its extrusion by
the Na+/K
+-ATPase as a consequence of a dwindling ATP reserves; and an increased
inward leak through the Na+/H
+ exchanger as protons accumulate in the cell. Increase
in Na+ is shown to correlate with increases in Ca
2+ due to the activity of the NCX (Tani

49
and Neeley, 1989). The NCX goes into a reverse mode to counteract Na+ entry and
allow more Ca2+
entry, although recent reports suggest that the NCX is inhibited with
acidosis and thus is more pronounced during the early stages of reperfusion. There are
fluctuations in the systolic and diastolic level of [Ca2+
]i leading to Ca2+
transient
alternans, which produces fluctuations in the Ca2+
dependent membrane currents and the
action potential duration (Carmeliet, 1999). The rise in diastolic [Ca2+
]i slightly
precedes the development of contracture (Eisner et al., 1989). The peak [Ca2+
]i that can
be generated during systole is gradually reduced due to the inability of the SR to cycle
Ca2+
. Several factors present during ischaemia (i.e. acidosis, reduced ATP availability,
oxidative stress) are thought to contribute to this deterioration (Carmeliet, 1999).
Ischaemic Arrhythmias
The dramatic changes that occur to the cell’s ionic currents and constitution increase the
likelihood of irregular contractions and arrhythmias. Early ischaemic arrhythmias such
as ventricular premature beats or irregular ventricular tachycardia can take place within
the first 10 minutes of ischaemia (phase Ia). Advancement into a life threatening
ventricular fibrillation (Vfib), defined as an uncoordinated depolarisation of the tissue
with no cardiac output, is rare at this stage (Carmeliet, 1999). At 20-30 minutes of
ischaemia a second stage of ventricular arrhythmogenesis (phase Ib) begins. This phase
has an increased likelihood of Vfib and is particularly prominent in some species such
as the dog, rat and pig.
The mechanisms that trigger the arrhythmias are now better understood
(Luqman et al., 2007). Disparity in the tissue’s action potential duration, refractoriness
and the existence of a partial or unidirectional block of conductance, will allow re-entry
of some impulses to stimulate consecutive action potentials. Also, ventricular cells

50
have the ability to spontaneously depolarise (automaticity) under such abnormal
conditions. Diastolic depolarisation, which is normally reserved for pacemaker cells,
will occur in the presence of catecholamines by promoting K+ currents similar to the
pacemaker current If ; or in Ca2+
overloaded cells, a slow release of Ca2+
from the SR
may give a current via the NCX (Carmeliet, 1999). Early afterdepolarisation (EAD)
and delayed afterdepolarisation (DAD) are known as triggered arrhythmic activity as an
external stimulus is needed for their occurrence. During the plateau phase of the action
potential an EAD may occur when the LTCC or NCX trigger a second depolarisation
current and further release of Ca2+
from the SR. DAD is dependent on the cell’s
membrane potential upon repolarisation and is triggered late in phase 3 or early in phase
4 when the repolarisation period has begun. It is thought to be manifested by a high
[Ca2+
]i concentration during this end diastolic phase.
Cell Death
The promotion of oncosis that leads to lytic rupture is characteristic of necrosis: during
ischaemia, this is the pathway that the majority of cell death appears to occur through
(Dong et al., 2006). The rate of ATP reduction also determines whether there is death
by apoptosis or necrosis (Sebbag et al., 1996; Buja and Weerasinghe, 2010). To what
extent these pathways contribute to the final infarct has been debated over the years.
The mitochondria are central to the involvement of cellular stress and
mechanisms in activating death signals (pro-apoptotic). Opening of the mitochondrial
permeability transition pore (mPTP) is thought to be a pivotal contribution to death
signalling (Di Lisa and Bernardi, 2006; Halestrap, 2009). Normally the inner
membrane of the mitochondria is relatively impermeable but under cellular stress
(increase in [Ca2+
]i and ROS) the mPTP opens and allows mitochondrial swelling,

51
cytochrome c release and a loss of ATP. The majority of evidence however suggests
that opening of mPTP results in cell death by accelerated necrosis rather than apoptosis
(Halestrap, 2009). Release of pro-apoptotic factors such as cytochrome c etc. into the
cytosol will promote apoptosis. However, continued opening of mPTP is incompatible
with generation of ATP which is essential to drive the energy-dependent apoptotic
programme and as such its contribution to the full extent of this process is debated.

52
1.3.3.3. Reperfusion Injury
Reperfusion therapy through techniques such as thrombolysis and percutaneous
coronary intervention (PCI), has helped to lower the mortality rate of patients presenting
with AMI, due to its ability to return blood flow to the ischaemic region (Keeley et al.,
2003). Yet, over recent years it has become clear that this restoration in perfusion can
also cause injury to the remaining viable tissue (Buja, 2005). Research in animals has
demonstrated that some interventions at the time of reperfusion (see section 1.3.4.2) can
limit cell death and other forms of injury (Ferdinandy et al., 2007). Those that have
used infarct size as a primary end point, show that as much as 50% of the damage can
be attributed to reperfusion (Marzilli and Huqi, 2010). Reperfusion injury has been
classified into four types:
(i) Vascular injury that disrupts the coronary flow. Even with sufficient
blood flow, some areas within the myocardium will have insufficient perfusion. This is
a result of several complications including, coronary embolism, vasospasm and/or
inflammation (Prasad et al., 2009). Reperfusion brings endothelial disruption by the
inhibition of NO synthesis and endothelial blisters and blebs (Birnbaum et al., 1997).
Long ischaemic periods of over 3 hours will also allow neutrophil ‘plugging’ to
manifest in the microvasculature, which can cause the ‘no-reflow phenomenon’
(Entman and Smith, 1994).
(ii) Non-lethal injury such as myocardial stunning. The stunned myocardium
will delay the recovery of systolic and diastolic function in viable tissue despite the
presence of coronary flow. Stunning can respond to inotropic agents and is typically
seen with shorter ischaemic durations or in salvaged tissue (Kloner and Jennings, 2001).
(iii) Reperfusion arrhythmias. These occur during the early stages of
reperfusion and develop into ventricular tachycardia and fibrillation. Shorter durations
53
of ischaemia promote their maximal occurrence; longer duration of 1-3 hours or more
have a lower incidence possibly due to extensive cell death.
(iv) Lethal injury that results in cell death. Reperfusion causes death of cells
that have otherwise survived the preceding ischaemic insult. The difficulty in
differentiating between injuries incurred by ischaemia or subsequent reperfusion periods
created much of the early scepticism and debate (Garcia-Dorado et al., 2006a).
Research models of reperfusion injury can not occur without prior ischaemia. For this
reason, use of agents during the early reperfusion period has been the main approach to
demonstrating the existence of reperfusion injury and the potential for salvaging cells
by inhibiting it (Birnbaun et al., 1997, Ferdinandy et al., 2007).
Some key intracellular mechanisms that trigger reperfusion injury are beginning
to be disclosed (see figure 1.10). When the occluded artery is cleared, a rapid return of
perfusate reoxygenates the cells and increases their metabolic activity. The return of
ATP restores the contractile activity of the cells but with excessive activation and
hypercontracture that causes sarcolemmal rupture (Piper et al., 2004). Generation of
ROS from the reactivated mitochondrial electron transport chain creates a cascade
(although non-selective in its reactivity) of pro injury events to which Ca2+
handling
proteins are particularly vulnerable (Brookes et al., 2004). The restoration of the NHE
to exclude H+ for Na
+ triggers increases of activity in the NCX but in the reverse mode
(Talukder et al., 2009). This contributes to a rise in [Ca2+
]i and the mishandling of Ca2+
by the SR. Ca2+
overload induces the opening of the mPTP and a release of further
ROS, cytochrome c and pro-apoptotic factors. Other Ca2+
-dependent molecules such as
proteases and phospholipases endorse degradation of the cell membranes (Dong et al.,
2006). The osmotic load and sarcolemmal rupture contribute to cell death by necrosis
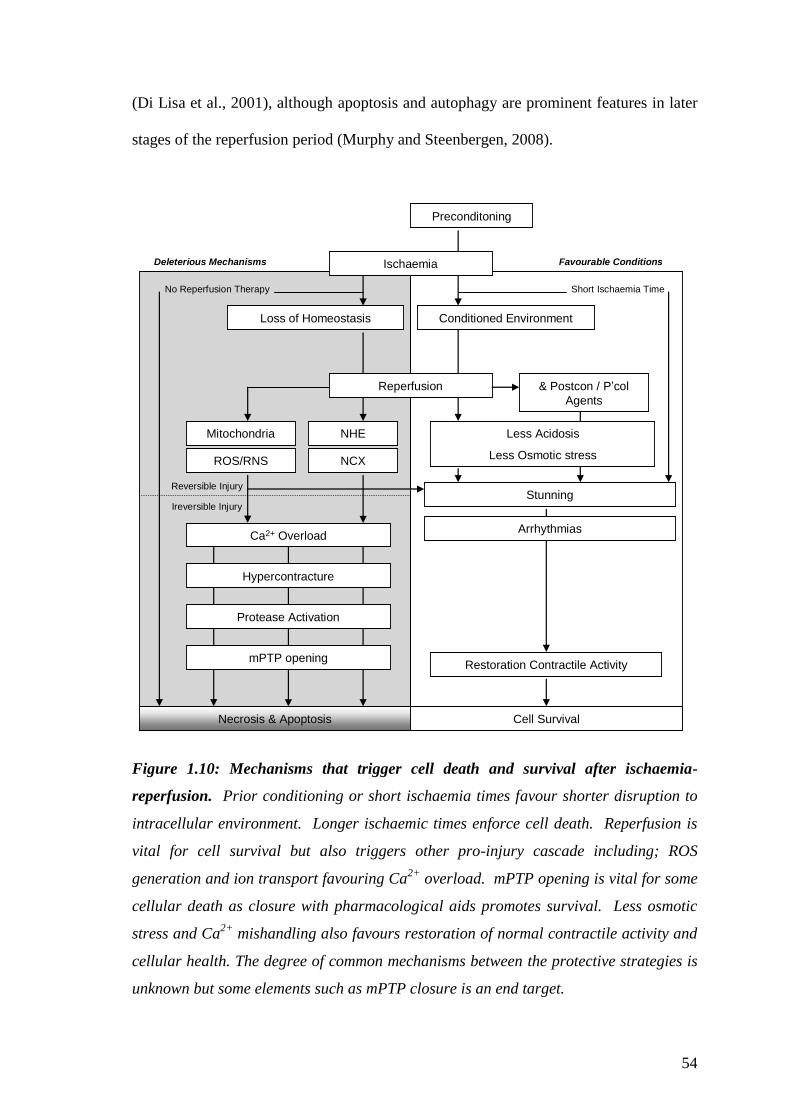
54
(Di Lisa et al., 2001), although apoptosis and autophagy are prominent features in later
stages of the reperfusion period (Murphy and Steenbergen, 2008).
Preconditoning
Mitochondria NHE
NCX
Necrosis & Apoptosis
ROS/RNS
Restoration Contractile Activity
No Reperfusion Therapy
Loss of Homeostasis
Ischaemia
Short Ischaemia Time
Cell Survival
StunningReversible Injury
Ireversible Injury
mPTP opening
Deleterious Mechanisms Favourable Conditions
Reperfusion
Conditioned Environment
Less Acidosis
Less Osmotic stress
Ca2+ Overload
Hypercontracture
Protease Activation
& Postcon / P’col
Agents
Arrhythmias
Figure 1.10: Mechanisms that trigger cell death and survival after ischaemia-
reperfusion. Prior conditioning or short ischaemia times favour shorter disruption to
intracellular environment. Longer ischaemic times enforce cell death. Reperfusion is
vital for cell survival but also triggers other pro-injury cascade including; ROS
generation and ion transport favouring Ca2+
overload. mPTP opening is vital for some
cellular death as closure with pharmacological aids promotes survival. Less osmotic
stress and Ca2+
mishandling also favours restoration of normal contractile activity and
cellular health. The degree of common mechanisms between the protective strategies is
unknown but some elements such as mPTP closure is an end target.

55
1.3.4. Cardioprotective Paradigms
Over the years, a range of cardioprotection models have been employed in various
species in an attempt to prevent or lessen I-R injury (Maroko et al., 1971; Murry et al.,
1986; Zhao et al., 2003). A few of the successful interventions have included:
pharmacological aids such as anti-anginal drugs (Maroko et al., 1971); inert gases
(Derwall et al., 2009); various synthetic receptor ligands (Ferdinandy et al., 2007);
hypothermia and cardiac arrest (Tyers et al., 1977); ischaemic pre-conditioning prior to
the injury (Murry et al., 1986); brief ischaemia in remote organs (Gho et al., 1996) and
limbs (Schmidt et al., 2007) termed per-conditioning; or brief ischaemia immediately
after the ischaemic insult, termed post-conditioning (Zhao et al., 2003). Many of the
strategies show clinical potential by improving cardiac function, by reducing the cell
death during ischaemia and reperfusion, or reducing contractile defects and the
incidence of arrhythmias.
A lot of knowledge exists on the mechanisms that are involved in the protective
effects of ischaemic or pharmacological conditioning (Ferdinandy et al., 2007;
Hausenloy and Yellon, 2007; Jennings, 2011; Vinten-Johansen, 2011). The stimuli and
triggers needed to activate the favourable signalling pathways (mediators) have been
thoroughly explored, although the end effectors of protection remain debatable or
unknown (Garcia-Dorado et al., 2006b; Buja and Weerasinghe, 2010; Yang et al., 2010;
Vinten-Johansen, 2011). The end effectors have a direct role in deciding the fate of the
ischaemic/reperfused cell and are of significance as potential pharmacological targets.

56
1.3.4.1. Ischaemic Preconditioning
Ischaemic preconditioning (IPC) is a potent endogenous cardioprotective strategy where
brief cycles of ischaemia-reperfusion are instigated before a longer duration of injurious
ischaemia (Murry et al., 1986). The initial exploration was to determine if the ATP
utilisation and catabolic build up of several cycles of I-R had the same effect as a
prolonged single duration of ischaemia (Reimer et al., 1986; Reimer, 1996). When this
was then developed to investigate whether the I-R cycles prior to an extended ischaemic
insult would accentuate the ATP depletion and the injury, it was surprising to discover
only a quarter of the potential infarct size had been developed. The following studies
suggested that IPC was capable of slowing the myocardial energy demand by reducing
the rate of ATP depletion and thus reducing the extent of anaerobic glycolysis and the
cellular load of catabolites (Murry et al., 1990). Although cellular arrest is the
mechanism that preserves the hypothermic heart (Tyers et al., 1977), with IPC, it was
later discovered that there was much more to its nature than limiting the cells metabolic
activity.
The triggers of IPC protection were revealed to include the many compounds
that accumulate in the ischaemic heart; including adenosine (Liu et al., 1991),
bradykinin (Goto et al., 1995), noradrenaline (Banerjee et al., 1993) and opioids (Miki
et al., 1998). Activation of the individual receptors with exogenous autacoids prior to I-
R, induced protection comparable to IPC, whilst pharmacological blockade of the
receptors during the IPC stimulus, prevented its protection (Ferdinandy et al., 2007).
The release of the autacoids during the short cycles of I-R allows activation of their
respective cell membrane receptors, of which many are linked to G proteins. The
receptor subtypes will determine which combinatorial interactions of G-proteins and
their respective signalling pathway are activated. To date, all Gαi-coupled receptors
57
(i.e. adenosine A1/A3, bradykinin B2, opioid δ-receptors) have demonstrated the ability
to trigger the IPC phenotype through protein kinase C (PKC) activation (Goto et al.,
1995; Sakamoto et al., 1995; Miki et al., 1998; Downey et al., 2007; Yang et al., 2010).
Typically, the Gαq-coupled receptor instigates the enzyme phospholipase C (PLC) to
cleave a phospholipid into a diacylglycerol (DAG) and InsP3, which can then directly or
indirectly activate PKC. However, it was found with a series of investigations that
although adenosine receptors (A1/A3) could couple to PLC and PKC activation (Parsons
et al., 2000), stimulation with acetylcholine (Ach) and the other mentioned Gαi-coupled
receptors, did so through a more complex pathway involving phosphatidylinositol-3
kinase/Akt (PI3K/Akt), and the generation of ROS from the mitochondria (Qin et al.,
2003; Downey et al., 2007).
The cardioprotection afforded by the ligands, even after they have been washed
out from heart preparations an hour earlier, is thought to be maintained via ROS
activation of PKC and is still classed as the trigger phase (Baines et al., 1997; Downey
et al., 2007). The IPC phenotype can be replicated by the sole exposure to small
quantities of oxygen radicals (Baines et al., 1997) and H2O2 (Sharma and Singh et al.,
2001) prior to ischaemia; and can be abolished when ROS scavengers are present with
the IPC stimulus (Tanaka et al., 1994; Baines et al., 1997). Forbes et al. (2001) have
suggested that a key mechanism for cardioprotection by increased generation of ROS
lies with the opening of the mitochondrial ATP sensitive potassium channels
(mitoKATP). But this is debated as the compound used to disclose such activity
(diazoxide) can also act through the opening of the sarcolemmal KATP channels (Garlid
and Halestrap, 2012). Sarcolemmal KATP channels had previously been suggested to be
a key factor of IPC as the promotion of shorter action potentials would limit Ca2+
entry
and the force of contraction, preserving valuable ATP (Gross and Fryer, 1999).

58
Costa et al., (2005) when using isolated mitochondria from cardiac myocytes
suggested that a key link for mitoKATP opening was the cyclic guanosine
monophosphate (cGMP) signalling pathway. But this would only be able to occur in
the presence of PKCε, as a cGMP-dependent protein kinase (PKG) would be too large
to pass the mitochondrial inner membrane. Nitric oxide and its downstream target PKG
had formerly been implicated as a trigger of IPC, with PI3K/Akt pathway central to
their activation (Lochner et al., 2000; Downey et al., 2007). Although PKC is also a
common factor for these pathways, there are differences between species as to whether
adenosine or NO is the dominant trigger of IPC.
Much of the work in the last decade has focused on IPC’s ability to mediate
protection during reperfusion. Hausenloy et al., (2005) were one of the first to focus on
roles of the PI3K/Akt pathway and the p42/p44 mitogen activated protein kinase
(MAPK) pathway (ERK1/2) during reperfusion. Earlier studies showed that their
phosphorylation activity were higher at 15 minutes of reperfusion when an IPC stimulus
had been used (Hausenloy et al., 2004). The IPC protection was abrogated when these
inhibitors were present at reperfusion, demonstrating their key involvement in
mediating protection during reintroduction of coronary flow. Evidence for the existence
of reperfusion injury had already gained attention in previous years when numerous
pharmacological agents had been cited as having the capability of reducing the injury if
applied concomitantly (Ferdinandy et al., 2007). Many of these agents depended on
PI3K/Akt and/or ERK1/2 for protection to occur, which was termed by Hausenloy and
Yellon (2004) as the Reperfusion Injury Salvage Kinase (RISK)-pathway. It has since
included other signalling pathways such as PKA and other members of the MAPK
pathway i.e. JAK/STAT pathway (Hausenloy and Yellon, 2006). The JAK/STAT

59
pathway has been termed Survival Activating Factor Enhancement (SAFE) pathway by
Lecour (2006).
The survival kinases carry the protective signal to the end effectors (Downey et
al., 2007). But the assortment of signal transduction pathways has created numerous
hypotheses for the mechanism that salvages the cells. The more established suggestions
centre on stabilising the mitochondria and the closure of the mPTP during reperfusion
(Javadov et al., 2003; Ferdinandy et al., 2007; Gottlieb, 2011). Juhaszova et al., (2004)
suggested the protection from the PKC, ERK1/2, and PI3K/Akt signalling pathways all
act to inhibit glycogen synthase kinase-3 β (GSK-3β), as it was revealed to have a direct
association with the mPTP and its closure. The same study also proposed that the
mitochondria’s threshold for ROS is reduced after hypoxia-reoxygenation and could be
reversed with pharmacological agents such as diazoxide, also implying a role for the
mitoKATP. A greater tolerance to the mPTP opening by Ca2+
overload was also
suggested after IPC by Argaud et al. (2004). However, this contradicts an earlier study
by Javadov et al. (2003), where using similar methods, they showed that preconditioned
cardiac myocytes that were subsequently isolated, had a greater Ca2+
sensitivity to
mPTP opening than the controls or hearts treated with the direct mPTP inhibitor
cyclosporine A. This suggested that although IPC did protect against reperfusion injury
by inhibiting the mPTP in situ, an indirect protection must also be in place to attenuate
Ca2+
overload and ROS overproduction. Hypercontracture and sarcolemmal rupture can
also cause cell death when the mPTP is closed (Garci-Dorado et al., 2006a). Thus,
physiological mechanisms that promote normal Ca2+
cycling and cytoskeletal integrity
during reperfusion are also critical for cell survival.
IPC has a window of cardioprotection that lasts one to two hours after its
induction (Yang et al., 2010). After this interval has passed, the protective phenotype is

60
withdrawn until a later second window of protection emerges 24-72 hours after the
stimulus (Baxter et al., 1997). Referred to as late or delayed preconditioning, its
protective mechanism centres on the gene expression and protein synthesis of a range of
cardioprotective proteins.
Other organs have the potential for IPC (Gho et al., 1996). This has been
developed further to using the peripheral tissues to condition the heart prior to the re-
introduction of coronary flow (Schmidt et al., 2007). Known as per-conditioning this
new phenomenon is already undergoing clinical trials (Vinten-Johansen and Shi, 2011).
BØtker et al. (2010) investigated the beneficial use of a blood pressure cuff to provide a
‘conditioning’ stimulus to STEMI patients being transported in an ambulance.
Incidence of mortality, re-infarction and heart failure were the same in both groups but
myocardial salvage was much improved in the per-conditioned group. The mechanisms
of protection and the method of triggering remote preconditioning and perconditioning
remain elusive, although possibly via the transfer of blood borne humoral factors,
immune cells or an unknown small molecule, some common pathways leading to KATP
opening and mPTP inhibition are a possibility (Vinten-Johansen and Shi, 2011).
1.3.4.2. Modified Reperfusion and Postconditioning
In the initial study on postconditioning, where repetitive bouts of ischaemia were
introduced during early reperfusion, it was found to be as effective as IPC in reducing
infarct size in anaesthetised open-chest dogs (Zhao et al., 2003). Cardioprotection was
attributed to preserving endothelial function, reducing neutrophil accumulation and
limiting ROS activity. The list of mechanisms quickly grew to include the triggering by
several autacoids, the RISK signalling pathway and other components similar to IPC
(Hausenloy et al., 2005). An additive protective effect of IPC and postconditioning was

61
reported to be possible in anaesthetised rabbit hearts (Yang et al., 2004), but this was
not reproduced in isolated rat hearts (Tsang et al., 2004).
The practice of postconditioning has been described as an ‘old wine in a new
bottle’ (Heusch, 2004) due to its similarities to a previous technique of staged
reperfusion. This involves lowering the coronary flow during the initial stages of
reperfusion and thus limiting post-ischaemic injury (Okamoto et al., 1986). In doing so,
the heart regains activity in a progressive manner and avoids a sudden alteration in the
intracellular conditions. One aspect of these techniques is that the gradual recovery
from acidosis averts several mechanisms of injury. These include: the NHE from
triggering a reversed NCX and Ca2+
overload (Inserte et al., 2009, Rodriguez-Sinovas et
al., 2009); prevention of calpain activation and degradation of proteins (Inserte et al.,
2009); opening of the mPTP (Cohen et al., 2007); hypercontracture and the Ca2+
cycling with the SR (Piper et al., 1998). The timing of the postconditioning protocol is
also fundamental and must occur immediately after the ischaemic period (Yang et al.,
2004).
Argaud et al. (2005) demonstrated that the threshold for mPTP opening in the
presence of Ca2+
was higher in cells that had been postconditioned or preconditioned.
However, a later study recorded a higher Ca2+
content in the mitochondria of
postconditioned cells than IPC cells (Argaud et al., 2008). It was thus suggested that
postconditioning increases the mitochondria’s tolerance to [Ca2+
]i whilst IPC reduced
the [Ca2+
]i and the exposure of mitochondria to Ca2+
. This is intriguing as much of the
injury that is proposed to occur from Ca2+
overload occurs during the early reperfusion
period and that postconditioning reduces the loss in ionic homeostasis. This was
suggested by Sun et al. (2005) in an in vitro model of hypoxia-reoxygenation with
postconditioning, as mitochondrial Ca2+
concentration, and ROS generation were much

62
lower than in controls. Apart from the differences in models used, the method of
measuring total Ca2+
compared to free Ca2+
could be an explanation for these
discrepancies (Ovize et al., 2010).
Postconditioning is a more complex phenomenon than IPC (Jennings, 2011).
Preconditioning gives robust protection against infarction and has not been disputed
within the literature (Cohen and Downey, 2011). But some investigations have been
unable to reproduce the cardioprotection gained by postconditioning in pig hearts
(Schwartz and Lagranha, 2006), rat hearts (Dow and Kloner, 2007) or anesthetised
rabbit hearts (Hale et al., 2008). This means an optimum protocol is yet to be found
(Vinten-Johansen and Shi, 2011). But its potential in clinical use has been
demonstrated by Thibault et al. (2008) who recorded in STEMI patients a reduced
infarct size and an improved long term functional recovery.
1.3.4.3. Pharmacological Conditioning
For technical reasons patients that are reperfused by thrombolysis (and not PCI) would
not be eligible for postconditioning and would thus benefit more from pharmacological
conditioning (Ovize et al., 2010). The list of successful agents in experimental models
is vast with some not having a direct role in the natural phenomenon of IPC or
postconditioning but able to trigger similar signalling pathways. A diverse group of
naturally occurring agents tested so far includes: natriuretic peptides, adrenomedullin,
erythropoietin, insulin, transforming growth factor-β (Ovize et al., 2010). A clinical
example is the J-WIND trial which investigated the use of atrial natriuretic peptide in
patients who had AMI (Kitakaze et al., 2007). The patients that received intravenous
ANP in conjunction with reperfusion treatment had lower infarct size (measured by
creatine kinase release) and reperfusion injuries than those that received a placebo.

63
Although the experimental design received some criticism, the modest improvement
shows potential for natriuretic peptides to be used as a pharmacological treatment
(Burley and Baxter, 2009; Ovize et al., 2010).
As the mishandling of Ca2+
is a key mechanism of cellular injury during AMI, it
is crucial that there is the development of a therapeutic strategy for its management
(Garcia-Dorado et al., 2012). Pharmacological agents that target the handling of
intracellular Ca2+
have had limited success in limiting I-R injury (Talukeder et al., 2009;
Garcia-Dorado et al., 2012). The most recent clinical trials have used caldaret (MCC-
135) that can reduce [Ca2+
]i at time of reperfusion by possibly preventing the [Na+]i via
inhibition of the NCX (Satoh and Kitada, 2004). The drug’s specific mechanism of
action is unknown, but is also thought to have a positive lusitropic effect on the heart by
promoting the uptake of Ca2+
in the SR (Satoh et al., 2001). However, its
administration in STEMI patients undergoing PCI gave no limitation in infarct size or
any improvement in ejection fraction (Bar et al., 2007; Tzivoni et al., 2009).

64
1.3.5. CaMKII and Cardiovascular Disease
Research concerning CaMKII involvement in CVD has progressed substantially since
Ramirez et al. (1997) reported that in rat ventricular myocytes the δB subtype had the
ability to increase the expression of atrial natriuretic factor (ANF), a well known marker
of pathological hypertrophy. It was soon established that the failing human
myocardium also had augmented levels of CaMKIIδB (Hoch et al., 1999). Kirchhefer et
al. (1999) reported that patients suffering from dilated cardiomyopathy had a three fold
increase in CaMKII activity, when they compared them to ‘healthy’ hearts that were
unsuccessfully used as transplants. These studies opened up the possibility that
CaMKII had some role to play in CVD, although it was yet to be established if it was an
epiphenomenon of hypertrophy or a key mediator. Work by Brown’s laboratory
substantiated the latter hypotheses by creating two transgenic mouse models: one that
targeted the nuclear δB subtype (Zhang et al., 2002); and one that targeted the primarily
cytosolic δC subtype (Zhang et al., 2003). Directed by a tissue specific promoter, the up
regulation of either CaMKII isoforms supported the development of cardiomyopathy
and abnormal functioning. Consequently, genetic models that ablated CaMKII in the
heart displayed less cardiac remodelling and dysfunctional phenotypes in models of
pathological hypertrophy induced by β-adrenergic stimulation (Zhang et al., 2005) and
pressure-overload (Ling et al., 2009). More recently, Sossalla et al., (2010) confirmed
that the failing human myocardium had increased levels of CaMKIIδB and CaMKIIδC.
They also explored the effect of the CaMKII inhibitors KN-93 and AIP on primary
isolated cells from these hearts. The inhibitors reversed the pathological phenotype of
the cells by improving their contractility and Ca2+
handling capabilities. As non-failing
sheep hearts exposed to the same CaMKII inhibitors showed no adverse effects in
65
contractility, the authors concluded that targeting CaMKII in patients with heart failure
could be a therapeutic strategy for the future.
Contractile dysfunction and arrhythmias regularly accompany maladaptation of
the heart, as the tissue develops disrupted conduction properties and Ca2+
handling
abilities (Dzau et al., 2006). Data soon emerged that CaMKII contributes to a pro-
arrhythmic role (Anderson, 2007). However, the involvement of CaMKII in acute
coronary syndromes is unclear. It was first suggested that CaMKII has a beneficial role
in promoting the Ca2+
handling properties of the SR if adverse conditions of ischaemia
and early reperfusion are present (Netticadan et al., 1999; Osada et al., 2000; Temsah et
al., 2002). But Mattiazzi’s group only found this benefit to exist under conditions of
acidosis or short ischaemic durations that promote stunning (Valverde et al., 2006;
Mattiazzi et al., 2007; Vila-Petroff et al., 2010). Recent research indicates that if these
changes to intracellular conditions are sustained, they permit CaMKII to promote injury
through Ca2+
overload and initiation of the intrinsic cell death pathways (Vila-Petroff et
al., 2007; Zhu et al., 2007; Salas et al., 2010). These studies suggest that a pathological
role for CaMKII exists but it is yet to be fully disclosed.
1.3.5.1. CaMKII as a Mediator of Cell Death
Several in vitro models of cell death provide evidence that CaMKII is instrumental in
promoting injury. Zhu et al. (2003) created a model of apoptosis by subjecting cardiac
myocytes from adult mice to sustained β-adrenergic stimulation. It was reported that
the ICa.L stimulates CaMKIIδC to be a key mediator of cell death and not the cAMP/PKA
pathway. The same laboratory also overexpressed a constitutively active CaMKIIδC in
rat cardiac myocytes (Zhu et al., 2007). Apoptotic cell death was instigated via the
intrinsic pathway of cytochrome c release but could be reduced if pharmacological

66
inhibitors of CaMKII were present. In addition, adenoviral expression of a dominant
negative CaMKIIδC (to demonstrate isoform specificity) not only abolished apoptosis in
the cells that overexpressed a constitutively active CaMKIIδC , but also in other standard
models of cell death, e.g. oxidative stress. Other laboratories have established similar
findings, with the use of angiotensin II (Palomeque et al., 2009), oubain (Sapia et al.,
2010), upregulation of the LTCC (Chen et al., 2005) and simulated I-R (Vila-Petroff et
al., 2007), implicating CaMKII as pro-injurious. CaMKII is not believed to directly
target the mitochondria, but rather has the ability to promote Ca2+
overload through
actions on the SR. Odagiri et al. (2009) incubated saponin-permbealized myocytes with
CaM and recorded (by using fluorescence microscopy) the generation of ROS,
depolarized mitochondria and opening of the mPTP, which were all reversible with
CaM and CaMKII inhibitors.
An interesting study by Peng et al. (2010) revealed that CaMKIIδB is not
associated with the same cell death pathways as CaMKIIδC. In an in vitro model of
oxidative stress or an in vivo model of I-R, the two isoforms had an inverse relationship
to one another. That is, the expression of δB isoform decreased with conditions of
cellular stress, whilst the δC isoform increased substantially and remained high for 4-24
hours after the insult had occurred. When cells that overexpressed CaMKIIδB were
subjected to oxidative stress the extent of their injury was also less than in the controls.
Gene microarray and pharmacological manipulation suggested that the heat shock
protein-70 family members were part of CaMKIIδB anti-apoptotic pathway. Wu et al.
(2006) had previously reported that activation of the δB subtype is downstream from
Ca2+
released by the IP3R and the nucleus and not the global Ca2+
oscillations incurred
by E-C coupling. Knowing that PKC is a dominant target for the IP3R and has a role

67
in other cardioprotection models, it would have been interesting to see whether PKC
had any involvement with CaMKIIδB activation.
1.3.5.2. CaMKII and Ischaemia-Reperfusion Injury
The initial studies investigating CaMKII in models of I-R measured the temporal
activity of the kinase and the relationship between cellular Ca2+
handling properties and
contractile recovery. The protein expression during short ischaemic times in rat
myocardium (15 minutes; Uemura et al., 2002) or gerbil cerebral tissue (5 minutes;
Zalewska et al., 1996), suggested that a proportion of CaMKII translocates to the cell
membrane and is restrained from autophosphorylation. Baseline samples had higher
expression values of CaMKII in the cytosolic fractions than in the particulate fractions,
but during ischaemia, a significantly smaller proportion was present in the cytosol and a
greater proportion was expressed in the cell membrane. Ischaemic myocytes also had
limited phosphorylation at the Thr287
site in the cytosolic fractions, while no
phosphorylation was measured in the particulate fraction. After 5 and 15 minutes of
reperfusion, a gradual recovery of cellular location and kinase activity had begun but
not to the same extent as pre-ischaemic values. The authors commented that longer
duration of ischaemia (30 minutes) resulted in irreversible damage and had prompted an
even weaker expression of CaMKII (Uemura et al., 2002).
Dhalla’s group investigated I-R injury in an ex vivo rat heart preparation, using
contractile recovery as a primary end point of injury, with the analysis of isolated SR
vesicles at specific periods to determine the tissue’s Ca2+
cycling abilities. The series of
investigations concluded that 30 minutes of ischaemia and up to 60 minutes reperfusion
depressed the SR uptake of Ca2+
which contributed to the reduced contractile activity
and cytosolic Ca2+
overload (Temsah et al., 1999; Netticadan et al., 1999; Osada et al.,

68
2000; Temsah et al., 2002). These studies included measurements of CaMKII activity.
No changes occurred in the cytosol during ischaemia (Netticadan et al., 1999), but a
significant absence was seen in the fractions that contained the SR vesicles. This
reduction in CaMKII correlated with the decline in active SR proteins (SERCA2a pump
and PLB phosphorylation) and the Ca2+
uptake by the SR (Netticadan et al., 1999).
Perfusion of radical scavengers (Netticadan et al., 1999), instigating IPC (Osada et al.,
2000) or altering the conditions of hypoxia and glucose deprivation (Temsah et al.,
2002) prevented the decline in CaMKII activity. As these interventions limited injury
to the SR and improved contractility recovery at reperfusion, it was suggested that
preservation of CaMKII is associated with maintenance of the heart’s normal function.
Comparable data later emerged from Benter et al. (2004) who pre-treated rats with KN-
93. The treated heart preparations had a significantly greater deterioration in cardiac
function after 40 minutes of ischaemia and 30 minutes of reperfusion, than did the
controls. These studies suggested that the molecular activity of CaMKII is influenced
by ischaemia and gradually recovers at the onset of reperfusion. They also suggested
that the CaMKII reduction in activity correlates with the I-R depression in Ca2+
handling by the SR and that this affected the contractile properties of the heart, which
suffers further depression if CaMKII is inhibited.
Mattiazzi’s laboratory has examined the influence of CaMKII on reversible and
irreversible ischaemic injury with a particular focus on the PLB Thr17
site. A detailed
western analysis of this CaMKII substrate disclosed that it was active during the first
minutes of ischaemia before being subdued to below control levels as ischaemic
duration continued (Vittone et al., 2002). But at 30 sec and 1 minute of reperfusion a
significant transient increase in activity occurred and lasted up to the third minute.
Hearts from PLB knockout mice in a model of stunning, had a significant deterioration

69
in functional recovery as a result of increased [Ca2+
]i (Valverde et al., 2006). Thus,
PLB and its regulator CaMKII appeared to be a key mechanism to regulate [Ca2+
]i
during reperfusion recovery after a short ischaemic time. Detailed western analysis also
demonstrated that key time points in previous studies had missed a window of CaMKII
activity. Uemura et al. (2002) started their analysis of CaMKII activity/expression after
5 minutes of reperfusion whereas Netticadan et al. (1999) measured it at the end of 30
minutes of reperfusion. Mattiazzi’s later studies used longer durations of ischaemia to
identify this transient period of CaMKII activity (Vila-Petroff et al., 2007; Salas et al.,
2010). Using infarct size as a primary end point, perfusion of KN-93 (2.5 µM) for 10
minutes prior to ischaemia (45 minutes) and for 10 minutes at early reperfusion,
significantly reduced the size of injury. Contractile recovery, lactate dehydrogenase
release, caspase 3 activity, cytochrome C release and Bcl-2/Bax ratio were more
favourable in hearts treated with a CaMKII inhibitor. The source for this CaMKII
activity at reperfusion was suggested to be the NCX (and not the LTCC), as its
inhibition during reperfusion limited PLB Thr17
phosphorylation and infarct size
(Vittone et al., 2002; Salas et al., 2010). Although phosphorylation of RYR2 (Ser2815
)
had increased significantly after 3 minutes of reperfusion, the total amount of the ion
channel had decreased giving similar ratios to the pre-ischaemic samples (Salas et al.,
2010).
When Erickson et al. (2008) first described the oxidative activation of CaMKII,
their investigation also suggested this to promote I-R injury. The genetic model
consisted of a knockout methionine sulfoxide reductase A (MSrA) that reverses Met
oxidation. These mice had greater methionine oxidation at the CaMKII Met280/281
sites,
increased myocardial apoptosis and a deteriorated in vivo mechanical function during
coronary ligation. Although infarct size was not measured, the knockout mice had a

70
reduced survival rate after MI. Of note is the study by Zhang et al. (2005) who used
genetic inhibition of CaMKII (promotion of an inhibitory peptide) to investigate in vivo
the effects of sustained β-adrenergic stimulation. When they subjected the mice to I-R
injury, there was no reduction in infarct size, but there was a significant improvement in
left ventricular contraction.
To summarise, the experimental data from Mattiazzi’s laboratory suggest that
pharmacological inhibition of CaMKII during long ischaemic times and at early
reperfusion can prevent cell death by necrosis and apoptosis. Shorter duration of
ischaemia and models of stunning the myocardium require CaMKII to maintain
contractile activity. The discrepancies between the studies of long ischaemia are due to
choice of analysis and the short window of CaMKII activity at early reperfusion. These
can either promote recovery from reversible injury or instigate death during irreversible
injury.
1.3.5.3. CaMKII in Models of Cardioprotection
Experimental models of cardioprotection have given supplementary information on how
CaMKII behaves under conditions of cellular stress. The previously mentioned studies
by Netticadan et al. (1999) and Osada et al. (2000) suggested that the presence of
antioxidants throughout I-R or an IPC stimulus promote improved Ca2+
cycling ability
via CaMKII. Pre-treatment with a pharmacological inhibitor of CaMKII (KN-93) can
abrogate these favourable conditions (Osada et al., 2000; Benter et al., 2005). However,
genetic inhibition of CaMKII in mice expressing the inhibitor peptide AIP (Zhang et al.,
2005) had contradictory outcomes. Li et al. (2007) subjected these mice to IPC prior to
I-R injury and demonstrated an additive protective effect to infarct limitation as a
nonsignificant trend was present without IPC. There was no improvement in the
71
mechanical recovery with either intervention, including the control hearts subjected to
IPC. But the study also focused on CaMKII’s role in triggering the IKATP, as their
previous work (Li et al., 2006) indicated a shortening of the action potential (via K+
channels) during its inhibition. In the absence of CaMKII, the pore forming subunit
(Kir6.2) was upregulated on the sarcolemma; IKATP was the same as that in control mice.
When treatment with pinacidil (opener) or HMR1098 (blocker) eliminated or increased
the size of MI between the control and AIP mice, it was concluded that CaMKII
inhibition during IPC enhances the opening of the IKATP. This study is interesting as
others have suggested a role for CaMKII in promoting opening of KATP.
Yan et al. (2009) investigated the open probability of IKATP in an in vitro model
of hypoxia or oxidative stress. Using pharmacological blockade of kinases (PKC, PKG
and CaMKII) channel opening was inhibited, suggesting these signalling pathways are
mediators of KATP opening under cellular stress. Of interest is that KN-93 and KN-62 at
concentrations above 1 µM and 5 µM respectively, significantly abrogated the IKATP.
Chai et al. (2011) have also recently confirmed the ability of a different
pharmacological inhibitor, AIP, to reduce the open probability of IKATP in rabbit
ventricular cells. This study suggested that CaMKII was upstream to a PKG pathway
and that generation of ROS was a key trigger. These methods of pharmacologically
manipulating CaMKII contradict the suggested mechanism at work in AIP-
overexpressing mice (Li et al., 2007). But they also suggest that an unseen protective
element might have occurred in the studies by Osada et al. (2000) and Benter et al.
(2005). Furthermore, it was reported that models of intermittent high altitude hypoxia
(IHA) develop their cardioprotection properties via the KATP channel, stimulated by
CaMKII activity. Six weeks of IHA treatment in rats, protected their hearts against
models of Ca2+
paradox (Xie et al., 2004) and I-R injury (Yu et al., 2009).

72
Pharmacological inhibition with either KN-93 or 5-HD abolished the protective
phenotype, implicating CaMKII and KATP channels as key mediators.
A favourable role for CaMKII was observed if volatile anaesthetic was used as a
cardioprotective intervention. Desflurane-induced preconditioning (Lange et al., 2008)
and postconditioning (Lange et al., 2009) limited infarct size in a rabbit in vivo model of
I-R injury. If KN-93 was administered prior to these interventions it abrogated the
protection, but had no significant effect on outcome per se. Desflurane protection also
promoted PLB phosphorylation as described by Osada et al. (2000). However, a
selective β-adrenergic inhibitor metoprolol could confer protection by down regulating
the Thr17
and Ser16
sites of PLB. This would agree with Mattiazzi’s hypothesis that
increased PLB activity during reperfusion promotes irreversible injury.
73
1.4. Overview and Scope of Thesis
The thesis interrogates the role of CaMKII in the acute conditions of myocardial I-R
injury. It intended to determine the consequences of using a pharmacological inhibitor
of CaMKII at specific time points of ischaemia or reperfusion and during the
mechanical interventions of IPC and postconditioning. In an ex vivo rat heart model of
regional I-R injury with infarct analysis, I determined if under these conditions CaMKII
was involved in irreversible injury (Chapter 2). Using a secondary cell line (H9c2 cells)
as an in vitro model of simulated I-R and oxidative stress (Chapter 3) I tried to replicate
the data in Chapter 2. The Ca2+
handling abilities of primary isolated cardiac myocytes
(Chapter 4) were also measured and analysed under conditions of simulated I-R in order
to further investigate the effects of pharmacological blockade of CaMKII.
1.4.1. Questions Addressed in this Thesis
The thesis sought to provide answers to the following questions:
i) Is CaMKII involved in promoting irreversible injury caused by acute
myocardial infarction?
ii) Does the phenomenon of IPC and postconditioning involve CaMKII?
iii) Under conditions of simulated I-R, what effect does pharmacological
blockade of CaMKII have on the Ca2+
handling properties of the cells?
1.4.2. General Hypothesis
CaMKII promotes injury in conditions of I-R injury by promoting Ca2+
overload.
However, when these abrupt changes in intracellular conditions are subdued, CaMKII
has a beneficial role in mediating the protection of IPC.

74
CHAPTER 2:
Involvement of CaMKII in I-R Injury and Models of Cardioprotection

75
2.1. Introduction
2.1.1. Mechanical Interventions for I-R Injury
Animal models of I-R injury have been essential in developing knowledge of the
pathophysiology of ischemic heart disease and in allowing the exploration of possible
therapeutic interventions. Within a couple of years of postconditioning’s discovery in
anaesthetized dogs (Zhao et al., 2003), small scale clinical trials were undertaken in
patients who required revascularization by PCI (Laskey et al., 2005; Staat et al., 2005).
The benefits of IPC can not apply to a patient with an acute coronary syndrome, but
there would be a use if I-R is prescheduled e.g. organ transplants and CABG, (Yellon et
al., 1993; Tomai et al., 1999). Also, IPC’s ability to limit infarction has led to the
discovery of pharmacological agents that can be used at reperfusion (Cohen and
Downey, 2011).
The optimum protocol for these mechanical interventions is still unknown.
Sandhu et al. (1997) reported that the rabbit heart had a 'dose-dependency' of IPC when
they compared one cycle of 5 minutes I-R to three cycles. The increased number of IPC
cycles reduced infarct-risk area to 4%, in comparison to 32% with the lower number.
Liu and Downey (1992) had previously recorded that the rat heart needed more than one
cycle of IPC (5 min I-R) for infarct limitation, although the single cycle did protect
against arrhythmias. But other studies have not been able to show an additional
improvement in contractile recovery if increased cycles of IPC were implemented
(Baker et al., 1999). It is important, however, to achieve an acceptable balance between
a preconditioned phenotype and the degree of myocardial stunning that accompanies
brief periods of ischaemia. Shorter cycles lasting up to 5 minutes are the norm for
instigating the IPC phenotype as periods lasting above 15 min go beyond the threshold
of reversible injury (Kloner and Jennings, 2001). The animal studies that used

76
pharmacological antagonists to abrogate the IPC phenotype established that blocking
only one of the GPCR can abolish the protection of a single IPC cycle (Goto et al.,
1995; Downey et al., 2007). If multiple preconditioning cycles were used in the
presence of the drug, the cardioprotected phenotype could be salvaged as further
generation of the autacoids would harness protection. It became apparent with studies
on postconditioning that shorter cycle durations favoured the hearts of smaller species
such as the rat (Crisostomo et al., 2006). The interventions used on human myocardium
have ranged between 2-6 cycles with 30-90 seconds in cycle duration (Yetgin et al.,
2010), whereas the rat heart requires 3-6 cycles of 10-30 sec in duration (Crisostomo et
al., 2006).
2.1.2. Involvement of CaMKII in IPC and Postconditioning
Research investigating the contribution of CaMKII to myocardial I-R injury is limited
in comparison to the numerous studies that have focused on its role in pathological
hypertrophy and arrhythmia. Very few studies have focused on its relationship with
IPC and none have investigated whether CaMKII might have any involvement in
postconditioning. What has been gathered so far is contradictory.
Some of the benefits of IPC are evident at reperfusion. These include an
improved Ca2+
cycling ability, resistance to Ca2+
overload and oxidative stress, and the
positive conditioning of the mitochondria by various signalling pathways (Yellon and
Downey, 2003). Thus, as CaMKII is a regulator of [Ca2+
]i, the first studies suggested
that the IPC phenotype was associated with enhanced CaMKII activity (Osada et al.,
2000). The improvements to the SR handling of Ca2+
can be removed if
pharmacological inhibitors of CaMKII are present, which also deteriorate the contractile
recovery usually seen during reperfusion (Osada et al., 2000; Benter et al., 2005). In

77
addition it was established that ischaemia has an influence on the activity of CaMKII,
stimulating its translocation to the sarcolemma and reducing its autophosphorylation
status (Uemura et al., 2002). How an IPC stimulus would later maintain an
improvement in CaMKII activity during ischaemia or at reperfusion is unknown. But it
was confirmed that shorter periods of ischaemia that cause stunning of the myocardium,
favour the preservation of CaMKII activity on targets on the SR such as PLB (Vittone et
al., 2002). A protective element of CaMKII might even go beyond the SR handling of
Ca2+
and engage sarcolemmal ion channels such as KATP. In vitro models of oxidative
stress have recently demonstrated an involvement of CaMKII with the IKATP (Yan et al.,
2009; Chai et al., 2011). The shortening of the action potential duration that occurs
during ischaemia could serve as an intrinsic mechanism by which CaMKII activity is
limited, by reducing the availability of the ICa.L. However, AIP transgenic hearts in
which CaMKII activity is reduced offer contradictory data to this possibility. This
method of CaMKII abrogation enhanced the IKATP and was the suggested cause for an
additive infarct limitation when an IPC stimulus was implemented (Li et al., 2007).
Two key differences in the current models investigating CaMKII are the
duration of I-R and the timing of intervention. The genetic mutant models (Li et al.,
2007) and Mattiazzi’s studies (Vila-Petroff et al., 2007) maintain CaMKII inhibition
during the early reperfusion period, whilst earlier work focused primarily on pre-
ischaemia treatment. It is suggested that an increase in PLB phosphorylation of the
Thr17
site and the SR Ca2+
load occurs during reperfusion and this window of activity
promotes cellular injury if a long period of index ischaemia is used (Vila-Petroff et al.,
2007; Salas et al., 2010). Pharmacological inhibitors or genetic manipulation of
CaMKII in in vitro and in vivo studies of sustained cellular stress can limit cell injury
and death (Zhang et al., 2005; Zhu et al., 2007). The key mechanisms during these

78
conditions have also been suggested to be the impaired handling of Ca2+
by the SR and
the effects that this has on the mitochondria (Odagiri et al., 2009). Similar mechanisms
are thought to be at work with reperfusion injury by opening of the mPTP under
conditions of increased [Ca2+
]i, and oxidative stress. The presence of a pharmacological
inhibitor of CaMKII before and during reperfusion inhibited cell death by apoptosis and
necrosis, as the NCX in reverse mode failed to trigger further loading of Ca2+
into the
SR (Vila-Petroff et al., 2007; Salas et al., 2010). Other studies that suggest CaMKII as
a mediator of cell death have included abrogation of CaMKII throughout the I-R period
(Erickson et al., 2008). However, Lange et al. (2009) found no limitation to infarct size
when rabbit hearts were subjected to 30 minutes of CAO and received a bolus of KN-93
only during the reperfusion period. This treatment did abolish desflurane induced
postconditioning, suggesting that CaMKII is involved in this form of postconditioning.
This window of CaMKII activity during reperfusion might also be a critical element of
mechanical postconditioning. A gradual recovery from acidosis and the limitation of
abrupt activation of the NHE and NCX is one of the suggested mechanisms of
postconditioning protection. But how CaMKII would react to such conditions and if it
is a vital component for restoration of intracellular conditions are unknown.

79
2.1.3. Hypothesis
The aim of these studies was to explore the role of CaMKII in I-R injury and whether it
had any involvement in the phenomena of IPC and postconditioning. Using the rat
isolated heart as a model the study was to determine whether a pharmacological
inhibitor of CaMKII (KN-93) would have any effect on irreversible injury caused
during ischaemia or at early reperfusion. The study also investigated the infarct
limitation associated with various IPC or postconditioning protocols and whether there
was any contribution by CaMKII.
It was hypothesised that:
i) Under control conditions, CaMK II activation beyond a certain threshold occurs at
reperfusion and promotes irreversible injury.
ii) Under preconditioning and postconditioning conditions, CaMKII promotes
cardioprotection.
2.1.4. Specific Objectives
(1). Develop a model of cardioprotection in an ex vivo model of I-R, using the
mechanical interventions of IPC and postconditioning.
(2). To examine the effects of perfusing a pharmacological inhibitor of CaMKII during
key stages of I-R and the cardioprotective interventions, with infarct analysis used as a
primary end point of injury. This would be broken down into smaller studies
investigating:
(A) CaMKII inhibition during normal I-R conditions
(B) CaMKII inhibition during IPC
(C) CaMKII inhibition during postconditioning.
80
2.2. Materials and Methods
The CaMKII organic inhibitor KN-93 (water soluble) and the inactive analog KN-92
were purchased from Calbiochem (Nottingham, UK). As a
methoxybenzenesulfonamide compound, KN-93 competes for the CaM binding site on
CaMKII with an inhibition constant of 0.37 µM (Sumi et al., 1991). KN-92 is a
structural analog of KN-93 devoid of activity on CaMKII at concentration below 25 M
(Anderson et al., 1998; Singh et al., 2009). The only difference between the two
compounds is that KN-93 possesses a 2-hydroxyethyl moiety. As KN-92 is not water-
soluble, it was dissolved in DMSO (final DMSO concentration in the Krebs-Henseleit
buffer 0.05%).
2.2.1. The Isolated Perfused Heart
The Langendorff isolated perfused heart has been a fundamental tool for investigating
models of I-R injury (Verdouw et al., 1998; Skrzypiec-Spring et al., 2007). It was
devised by Oscar Langendorff in 1895 to allow investigation of the mechanical activity
of the isolated mammalian heart (Doring and Dehnert, 1988). The original design
(figure 2.1(A)) involved an injection cannula inserted into the aorta of the heart. By
connecting it to a container full of defibrinated blood, a pressurised air bottle forces the
perfusate through the cannula. This closes the aortic valve (as occurs in the in situ heart
during diastole) and directs the blood through the ostia of the right and left coronary
arteries (Zimmer, 1998). Known as retrograde perfusion, only hearts perfused in this
way may be termed the ‘Langendorff heart’ (Doring and Dehnert, 1988). A string
attached to the apex of the heart and a membrane of a Marey capsule, enabled the
contractions to be transferred by air pressure to a kymograph (Zimmer, 1998).

81
Pressure Transducer
Baker Warming Coil
Warming Jacket
Coronary Effluent
Heater &
Circulating
System
Three-way
Tap
100 cm
95% O2: 5% CO2
Pressure
Transducer
Latex Balloon
Left Ventricle
Left
Atrium
Right
Ventricle
Cannula
Perfusate
Coronary EffluentBunsen Burner
Laptop
Computer
Pressure Air Bottle
Blood
Bottle
Manometer
Heart
Jacket/Container
Water Tub
Marey Capsule
Kymograph
Figure 2.1: The Langendorff perfused heart. (A) The original drawing and design of
apparatus described by Oscar Langendorff in 1895. Blood flowing retrogradely into the
aorta is driven by the pressure air bottle. Shortening of the heart is recorded by the
attachment of string to a Marey capsule and kymograph (taken from Zimmer, 1998). (B)
The constant hydrostatic pressure in this study is created by positioning reservoirs
containing Krebs-Henseleit buffer 100 cm (73 mmHg) above the cannulated heart. A
Baker warming coil is kept at 37oC by a circulator and allows the passing perfusate to
be heated. A latex balloon that is connected to a pressure transducer and computer is
inserted into the left ventricle in order to measure the cardiodynamic data.
(A)
(B)
82
Over the last century the Langendorff preparation has helped to develop our
understanding of myocardial function, regulation of coronary blood flow and cardiac
metabolism in healthy and pathological conditions. Some of Langendorff’s first
observations were that the heart retained its automaticity when perfused with a nutrient
fluid such as blood; and that high temperature or low temperature led to patterns of
tachycardia and bradycardia respectively (Zimmer, 1998). The model has since been
used to test an array of cardiovascular drugs and the effects of gene alterations on heart
physiology (Skrzypiec-Spring et al., 2007).
Various modifications have been made over the years to suit particular studies.
Katz (1939) developed a technique of using constant flow to deliver perfusate instead of
constant pressure (Skrzypiec-Spring et al., 2007). This method overrides the
autoregulatory mechanisms of the coronary arteries and delivers the perfusate regardless
of heart function and changes in vessel radius. The changes in the vessel radius will
however be inversely proportional to the changes in the coronary perfusion pressure.
As the two key measurements needed to calculate flow resistance are the perfusion
pressure and the coronary flow rate (CFR), if one of these variables is made constant the
other variable could be used to calculate the flow resistance. Katz realised that the
readings in coronary pressure were much easier and more sensitive than those of timed
collection with coronary flow. Thus Katz and colleagues used this method to evaluate
the vasoactive properties of many drugs. In Chapter 4, the constant flow technique is
used to isolate primary cardiac myocytes by perfusing low Ca2+
solutions and enzymatic
digestion of the extracellular matrix. This provides a constant flow regardless of the
deterioration in heart function and vasculature. Within this chapter the constant
pressure is the preferred method as it is more physiologically relevant and allows the
changes in vessel radius to produce the consequent changes in CFR.

83
The Langendorff isolated heart is limited by its lack of humoral and neuronal
background. The ex vivo preparation continually deteriorates but can remain viable for
several hours (Sutherland and Hearse, 2000) to measure biochemical, physiological and
pharmacological indices. The rat heart has become a popular choice for Langendorff
perfusion preparations and is the best characterised (Sutherland and Hearse, 2000).
Ease of handling, animal cost, low volume of perfusion fluids and the size of hearts (in
comparison to that of the mouse) are key advantages. With regard to I-R studies, the rat
has minimal collateral vessels allowing the study of regional ischaemia without the need
to measure and correct for collateral flow. There are key physiological differences
between the rat heart and the human heart i.e. the shorter action potential duration and a
dominant Ca2+
handling by the SR that need to be considered when evaluating the
experimental data.
84
2.2.1.1. Perfusion Protocol for the Rat Heart
Male Sprague Dawley rats (300-450 g) obtained from Harlan UK Ltd. (Oxon, UK) or
B&K Universal Ltd. (Hull, UK) were used for the studies. Animals were acclimatised
in the animal house for a minimum of 7 days and subjected to 12 hour light-dark cycles.
The water and feed (4% fat, 18% protein) were available ad libitum. All care and use of
animals were in accordance with the UK Home Office guidelines.
The rats were anaesthetised with a mixture of sodium pentobarbital (65 mg/kg)
and heparin (300 units) given concomitantly by i.p injection. Once the rat was
unconscious and evoked no reflexes the thoracic cage was opened to expose the heart.
The excised hearts were promptly cannulated via the aortic stump (figure 2.1) and
perfused at a constant pressure of 100 cm H20 (78 mmHg) with Krebs-Henseleit buffer
(in mM: NaCl 118.5, NaHCO3 24.8, d-Glucose 11, KCl 4.7, MgSO4.7H20 1.2, KH2PO4
1.2, CaCl2.2H2O 1.25) that was pre-heated to 37oC and aerated with 95% O2/5% CO2
(pH 7.3-7.5 at 37oC). A warm jacketed chamber surrounded the heart and a temperature
gauge inserted into the tissue of the right atrium was used to monitor the temperature,
which was maintained in the range of 36.5-37.5oC. A latex balloon was introduced
through the left atrium after removal of the atrial appendage and positioned within the
left ventricle to measure its contractile force. The balloon filled with purified water and
connected to a polypropylene cannula, enabled isovolumetric pressure to be measured
by a transducer that was linked to a data capture programme (Powerlab, Chart 4.0). A
mercury sphygmomanometer was used to calibrate the transducer beforehand. End
diastolic pressure (LVEDP) was set at 5-10 mmHg by adjusting the balloon volume.
The experiments began with a stabilisation period of 15-30 minutes in duration.
Haemodynamic measurements were taken at time points that included an initial reading,
after 10 minutes (designated baseline reading) and at one minute before an intervention.

85
The readings included; heart rate (HR; beats per minute, bpm), LVEDP, left ventricular
systolic pressure (LVSP), total developed pressure (LVSP - LVEDP), rate pressure
product (HR x LVSP) and coronary flow rate (CFR), measured by timed collection of
the coronary effluent. This period allowed an evaluation of the heart’s contractile
performance ensuring it was stable (from any defects). The several decades of research
on the isolated perfused rat heart, have allowed the normal physiological properties and
characteristics to be highly predictable (Doring and Dehnert, 1988; Bell et al., 2011).
Within this laboratory (Baxter and Yellon, 1993; Burley and Baxter, 2007) 20 years of
experience of this preparation has led to the development of the following inclusion
criteria:
Normal sinus rhythm devoid of bradycardia/tachycardia, numerous ectopic beats
or an episode of Vfib;
HR between 200 and 400 bpm. The in vivo heart rate can reach 500 bpm but
withdrawal of the autonomic influences subdues this rapid rate. A bradycardic
response below 200 bpm is generally a sign of injury;
A developed pressure of above 60 mmHg ensuring an acceptable inotropic
response to the perfusate and hydrostatic pressure;
CFR above 10 ml/min. Perfusion of hearts with saline solutions will entail
greater coronary flow than blood perfusion. For the size of the adult rats used in
this study an initial flow rate below 10 ml/min indicates deterioration in the
vasculature.
Any hearts not meeting all of these criteria during stabilisation were excluded from
further experimental manipulation.

86
2.2.1.2. Executing MI and Measurement of Infarct Size
Rat hearts have a consistent and prominent left anterior descending artery. This enables
consistency in locating the vessel and inserting a 3-0 silk suture (Ethicon, UK) around
it. A snare was formed by passing the two suture strands through a modified pipette tip.
The left coronary artery was then occluded (CAO) by pulling gently on the silk threads
whilst pushing with the plastic tip to compress the artery and surrounding tissue. A
second plastic pipette tip locked the suture in place for the remainder of the ischaemic
insult, which lasted for precisely 35 minutes. When competent with this technique, this
method of instigating CAO is highly reproducible. Measuring the CFR during the
initial ischaemic period will determine the extent of CAO achieved. A reduction in
CFR by less than 30% indicates a poor occlusion of the artery and/or small risk zone
and would not be sufficient to induce an adequate ischaemic insult to the tissue.
Releasing the locked pipette tips enabled reperfusion of the ischaemic region. After 120
minutes of reperfusion the silk suture was tied tightly before Evans Blue dye (0.4%)
was infused through the heart. This stained the non-ischaemic tissue as it entered the
regions that were perfused by vessels other than the left anterior coronary artery. Once
sufficient staining was achieved the heart was removed and stored immediately at -20oC
for a maximum of 72 hours.
The frozen hearts were allowed to thaw for a few minutes before being cut into
transverse sections, 2 mm thick, from the apex to the base. After the cut sections had
thawed for a further 2 minutes, they were then incubated at 37oC in triphenyltetrazolium
Chlorite (1% w/v), for 20 minutes with frequent agitation. The stained sections were
then fixed in 10% formalin for 24-48 hours to enhance contrast between stained and
non-stained regions before their images were scanned into the computer for planimetry
analysis by the author.

87
By using ImageJ (v1.38; Wayne Rasband, National Institutes of Health, USA),
each heart slice was characterised by three subdivisions depending on the staining
obtained (figure 2.2). The areas stained with Evans Blue were regarded as non
ischaemic tissue; the red areas were the ischaemic regions but with viable tissue;
white/yellow areas were measured as the infarct tissue. If there was poor staining of the
heart slices and not enough delineation between the regions, particularly the ischaemic
and non-ischaemic areas the hearts were excluded from analysis. The definition of a red
and viable tissue or a white and presence of infarction is further complicated by the
regions known as peri-infarction (sometimes pink in colour) which separates the two
regions. It is thus up to the analyst to decide whether to exclude or include these
regions as viable tissue. The peri-infarct areas were included consistently as an infarct
area within this study. If the experimental groups are known and thus predicted due to
the hypothesis, subjectivity of the peri-infarct area can also determine the outcome of
the analysis. As such, all analysis was done blind by coding each heart after the
experiment with a sequence (date and alphabetical) that was not related to the treatment
group. One method of overcoming such subjectivity is using an independent person,
who is also blind to the experimental groups, to analyse the regions. This ‘double-
blind’ method was not chosen in this study due to the workload and the consistency (i.e.
same person needs to analyse all experimental groups) required for these studies over
several months.
The volume of each heart section was also calculated by multiplying the areas
by their thickness (~2 mm). Myocardial infarct size was expressed as the volume of
infarct tissue/volume at risk x 100%. The volume of myocardium at risk was also
calculated as a ratio of the whole heart volume.

88
Infarct Area
Risk Area
Risk Zone
Non-
Risk Area
Side A Side B
Co
ntr
ol
Ca
rdio
pro
tecte
d
Figure 2.2: Stained transverse sections of rat hearts. Evans Blue and tetrazolium
staining was used to distinguish the non ischaemic tissue (Blue) from the ischaemic
tissue (Red), with enzyme washout from the infarct tissue (White/Yellow) indicating the
total extent of irreversible injury. Upper sections are from controlled experiments and
demonstrate considerable infarct areas; Lower sections are hearts that have been
protected by an intervention that reduces irreversible injury.
89
2.2.1.3. Treatment Groups
After a period of haemodynamic stabilisation (15-30 minutes), each isolated rat heart
was subjected to CAO of the left descending artery (35 minutes) followed by
reperfusion (120 minutes). Study 1 investigated the mechanical interventions of IPC
and postconditioning, using infarct limitation as a primary end point. The groups varied
in the duration and number of cycles that were used to trigger the cardioprotective
phenotype. Study 2(A) investigated the effect of CaMKII inhibition on ischaemia and
reperfusion injury. The two periods of injury were defined by the separation in
treatment periods, pre-ischaemia or at reperfusion alone, of the pharmacological
inhibitor (KN-93). The inactive analog of the organic inhibitor, KN-92, was used as a
negative control. Study 2(B) investigated the effect of a CaMKII inhibitor on IPC.
Treatment of KN-93 during the IPC cycles or at reperfusion intended to separate the
two trigger phases of the intervention. Study 2(C) investigated the effect of CaMKII
inhibition during the initiation of the postconditioning cycles. All experiments were
randomised and the treatment groups are further defined below.
Study 1: Effect of mechanical interventions on I-R injury
The mechanical interruption in coronary flow to effect IPC or postconditioning was
instigated by closing a tap above the cannula. This initiated global no-flow ischaemia
and prevented the risk of damaging tissue around the coronary artery. The loss of heat
supplied by the perfusate was counteracted by bathing the heart in pre-heated Krebs-
Henseleit. As the two IPC groups differed in the intervention duration (total of 27 or 33
minutes including stabilisation period) the control group was randomised to receive a
stabilisation period of either 20 or 30 minutes in duration. Figure 2.3 outlines each
experimental protocol.

90
Study 1
Stab. CAO Reperfusion
1. Control
2. IPC x2
3. IPC x3
4. Postcon 6x10
5. Postcon 3x30
6. Postcon 10-3x30
1st Baseline -1 0 5 15 34 36 65 95 125 155
Evans Blue
Staining
& Frozen -20oC
Haemodynamic
Measuremnets
10
Figure 2.3: Timeline of the experimental procedures used for the groups in Study 1.
All groups received a stabilisation period, followed by 35 min of regional ischaemia
and 2 hours of reperfusion (1. Control). Groups 2 and 3 included the IPC intervention
of 3 minutes global ischaemia and reperfusion, for either 2 or 3 cycles respectively.
Groups 4-6 received the intervention of postconditioning at reperfusion, with varying
cycle duration and numbers (described in text). Haemodynamic measurements were
made at specific time points throughout the experiments (time line not to scale). Stab.
Stabilisation period; CAO, Coronary Artery Occlusion; IPC: Ischaemic
Preconditioning; Postcon: Postconditioning.
Group 1, Control: Perfused with Krebs-Henseleit buffer and subjected to 20-30 min
stabilisation period, 35 min CAO and 120 min of reperfusion.
Group 2, IPC (2 cycles): 15 min of stabilisation, 2 cycles of 3 min global ischaemia
followed by 3 min reperfusion, 35 min CAO and 120 min of reperfusion.
Group 3, IPC (3 cycles): 15 min of stabilisation, 3 cycles of 3 min global ischaemia
followed by 3 min reperfusion, 35 min CAO and 120 min of reperfusion.

91
Group 4, Postconditioning (6 x 10 sec cycles): 20 min stabilisation and 35 min CAO,
immediately followed by six 10 sec cycles of reperfusion and global ischaemia. The
first cycle was considered the start of the reperfusion period although haemodynamic
data were recorded at 1 min after the last cycle.
Group 5, Postconditioning (3 x 30 sec cycles): The postconditioning protocol was
altered to three 30 sec cycles of reperfusion and global ischaemia.
Group 6, Postconditioning (10 sec reperfusion, then 3 x 30 sec cycles): An initial 10
second reperfusion period was followed by three 30 seconds of global ischaemia and
reperfusion.
Study 2: The effect of using a CaMKII inhibitor on I-R injury and the mechanical
interventions, IPC and postconditioning.
A drug reservoir was placed at the same height as the normal Krebs-Henseleit reservoir
(figure 2.1B) and connected to the system by a three way tap. Stock concentrations of
the drugs, KN-93 and KN-92, were added to a precise volume of Krebs-Henseleit buffer
to attain a final concentration of 2 μM. This is the concentration used throughout the
thesis and was based on concentrations reported in the literature; i.e. Dhalla’s group (1
µM) and Mattiazzi’s group (2.5 µM), and is 7-fold higher than the inhibition constant,
Ki of 0.37 µM (Sumi et al., 1991). Perfusion times in each treatment group are depicted
in figure 2.4 and defined further in the following text:

92
Study 2
Stab. CAO Reperfusion
1. Control
Study 2A
2. KN-93 Pre-Isch
3. KN-92 Pre-Isch
4. KN-93 @ Reper
Study 2B
2. IPC x 3
3. IPC & KN-93 Pre-Isch
4. IPC & KN-93 @ Reper
Study 2C
2. Postcon
3. Postcon & KN-93
4. KN-93 @ Reper
1st Baseline -1 0 5 15 34 36 65 95 125 155
Haemodynamic
Measuremnets
Evans Blue
Staining
& Frozen -20oC
Figure 2.4: Timeline of the experimental procedures used for the groups in Study 2.
The study explored CaMKII inhibition during; (A) normal ischaemia-reperfusion
protocol, (B) IPC intervention and (C) Postconditioning intervention. All groups
received an initial stabilisation period (15-30 min), followed by regional ischaemia (35
min) and reperfusion (120 min). Drug perfusion prior to ischaemia was limited to a
total of 12 min including the IPC intervention; and 15 min in total at reperfusion. Time
line not to scale. Stab. Stabilisation period; CAO, Coronary Artery Occlusion; IPC:
Ischaemic Preconditioning; Postcon: Postconditioning; Pre-Isch, Prior to Ischaemia;
@ Reper, during early reperfusion.

93
Study 2(A): CaMKII inhibition during ischaemia or reperfusion
Group 1, Control: Perfused with Krebs-Henseleit buffer and subjected to 20-30 min
stabilisation period, 35 min CAO and 120 min of reperfusion.
Group 2, KN-93 perfusion pre-Ischaemia: After 20 min of stabilisation, KN-93 was
globally perfused into the heart for 12 min before the 35 min CAO and 120 min of
reperfusion.
Group 3, KN-92 perfusion pre-Ischaemia: An analog of KN-93, KN-92 (2 μM) was
perfused in the same manner as group 2.
Group 4, KN-93 perfusion at reperfusion: 5 min prior to the reperfusion period, KN-
93 (2 μM) was perfused globally into the heart. This ensured the drug was present at
the opening of the ligated artery. Drug perfusion was continued for further 10 min into
the reperfusion period.
Study 2(B): CaMKII inhibition during ischaemic preconditioning
To limit variability, study 2(A) and study 2(B) were completed side by side and in
doing so incorporated the same control group.
Group 1, Control: randomly allocated as previously described.
Group 2, IPC (3 cycles x 3 min): Three cycles of 3 min IPC were initiated before the
CAO.
Group 3, KN-93 perfusion during IPC: 3 min prior to the IPC stimulus (3 cycles),
KN-93 (2 µM) was perfused globally into the heart. Once CAO had been secured,
drug-free Krebs-Henseleit perfusate was returned to the heart.
Group 4, KN-93 perfusion at reperfusion after IPC: The same IPC protocol as group
2, except that KN-93 (2 µM) was present at reperfusion as previously described.

94
Study 2(C): CaMKII inhibition during postconditioning
Group 1, Control: As the other described control groups.
Group 2, Postconditioning: 20 min stabilisation and 35 min CAO was immediately
followed by six, 10 sec cycles of reperfusion and global ischaemia.
Group 3, KN-93 perfusion with postconditioning: 5 min prior to reperfusion and the
postconditioning stimulus of 6 x 10 sec, KN-93 (2 µM) was perfused into the heart. A
further 10 min of drug perfusion was added during reperfusion.
Group 4, KN-93 perfusion at reperfusion: 5 min prior to the reperfusion period, KN-
93 (2 µM) was allowed to perfuse into the heart and continued for another 10 min
during reperfusion.
2.2.3. Statistical Analysis
For infarct size determination in this experimental model, previous work determined
that the expected difference between control and primary intervention is typically 50-
60% reduction in infarct size. The standard deviation in such experiments is 10-12%.
The conventional criterion of statistical significance (5%) and statistical power at 85%
were adopted. With factorial design and random allocation, the minimum number
required in each experimental group is 4, with randomisation to control groups
increasing the number of control experiments. All numerical data are presented as
mean values ± SEM. The statistical software PRISM® version 5.00 was used to
analyse all data. One way-analysis of variance (ANOVA) was used to compare the
mean infarct size of the groups within each study. A repeated measures ANOVA was
used to analyse the haemodynamic measurements of CFR, HR, developed pressure and
RPP between each group. A post hoc analysis (Newman-Keuls test) was used, and a
probability level of 5% (p< 0.05) was defined as the level of statistical significance.

95
2.3. Results
2.3.1. Exclusion Criteria
Hearts were excluded from the study if during the stabilisation period any of the criteria
of steady sinus rhythm, HR above 200 bpm, developed pressure above 60 mmHg or a
CFR above 10 ml/min were not met. Other exclusions included; insufficient reduction
in CFR during the first 15 minutes of ischaemia, or failure of the hearts to reperfuse
after releasing the coronary ligature. Exclusion of hearts during the analysis included:
insufficient risk zone delineation by the Evans Blue, insufficient tetrazolium staining.
In study 1 a total of 70 hearts were used, with 50 successfully completed and
further reported in this chapter. Study 2A and 2B had a total of 69 hearts, with 53
experiments reported. Study 2C had a total of 41 hearts, with 21 experiments reported.
Table 2.1: Total No. of hearts excluded and reported in studies 1-2
Study Excluded: Reported
Experimental Analysis
1 12 8 50
2A & 2B 8 8 53
2C 10 10 21
96
2.3.2. Baseline Cardiodynamics
None of the treatment groups within the studies were significantly different in their
baseline cardiodynamic data or their regions at risk of infarction (table 2.2). The hearts’
initial contractile performance and CFR recorded after 10 minutes of stabilisation were
consistent between all treatment groups. The control and postconditioning group of
study 2(C) had the highest mean CFR (15.6 ± 1.2 ml/min and 15.4 ± 1.2 ml/min
respectively) although this did not appear to be influenced by the rats’ body weight.
The mean risk zone volume was also greater in these two experimental groups (0.49 ±
0.03 cm3 and 0.48 ± 0.04 cm
3 respectively) for this study. This corresponds to a larger
risk-total area (64.8 ± 4.1% and 65.6 ± 5.0% respectively) indicating a higher
proportion of the left ventricle was occluded, although this was not significant within
the study. The risk-zone volume is consistent between the experimental groups in their
respective studies and thus indicates similar magnitude of coronary ligation was
implemented.

Table 2.2: Baseline cardiodynamics (Mean ± SEM) and number of hearts used for each of the studies. Including; contractility and
coronary flow data taken at 10 minutes stabilisation, the delineated risk zone volume after coronary ligation and its proportion to the total
heart volume.
CFR, Coronary CFR, Coronary flow rate; HR, heart rate; LVDP, left ventricle developed pressure.
Treatment Group
N
Weight (g)
CFR (ml/min)
HR (bpm)
LVDP (mmHg)
Risk Zone
Volume (cm3)
Risk-Total
Area (%)
Study 1
Control 14 350 ± 7 13.5 ± 0.7 294 ± 14 80.1 ± 4.3 0.36 ± 0.02 49.5 ± 2.6
IPC 2 x 3 7 356 ± 7 14.5 ± 0.7 288 ± 14 93.3 ± 4.6 0.36 ± 0.03 44.3 ± 3.4
IPC 3 x 3 4 406 ± 23 12.4 ± 1.0 255 ± 22 92.0 ± 5.3 0.33 ± 0.03 40.6 ± 2.0
Postcon 6 x 10 11 360 ± 6 13.2 ± 0.6 282 ± 14 71.2 ± 3.9 0.36 ± 0.02 45.1 ± 2.5
Postcon 3 x 30 4 364 ± 25 13.0 ± 1.0 269 ± 14 89.5 ± 10 0.33 ± 0.04 40.2 ± 2.2
Postcon 10-(3 x 30) 10 372 ± 11 13.5 ± 0.6 287 ± 9 80.8 ± 3.5 0.34 ± 0.02 47.1 ± 2.6
Study 2 (A) and (B)
Control 12 385 ± 12 12.6 ± 0.5 265 ± 8 83.2 ± 6.9 0.40 ± 0.02 49.8 ± 2.4
KN-93 pre-Ischaemia 6 391 ± 12 13.4 ± 0.6 298 ± 27 84.5 ± 3.9 0.37 ± 0.03 48.0 ± 3.8
KN-92 pre-Ischaemia 7 383 ± 7 13.1 ± 0.6 281 ± 12 89.9 ± 8.6 0.42 ± 0.02 49.8 ± 2.6
KN-93 @ Reperfusion 7 417 ± 27 13.6 ± 0.6 266 ± 12 95.0 ± 10.9 0.40 ± 0.02 47.6 ± 2.0
IPC x3 10 400 ± 13 13.3 ± 0.6 261 ± 11 89.1 ± 6.1 0.38 ± 0.02 47.3 ± 1.3
IPC & KN-93 5 377 ± 17 14.3 ± 1.5 289 ± 16 82.0 ± 5.2 0.38 ± 0.03 53.0 ± 3.7
IPC & KN-93 @ Reperfusion 6 414 ± 22 14.3 ± 0.3 252 ± 10 76.8 ± 3.3 0.38 ± 0.02 47.3 ± 3.1
Study 2(C)
Control 7 375 ± 29 15.6 ± 1.2 288 ± 12 90.6 ± 8.6 0.49 ± 0.03 64.8 ± 4.1
Postcon 6 x 10 6 374 ± 37 15.4 ± 1.2 291 ± 23 77.2 ± 6.6 0.48 ± 0.04 65.6 ± 5.0
KN-93 @ Reperfusion 4 346 ± 18 12.3 ± 2.3 300 ± 21 82.3 ± 7.5 0.44 ± 0.03 65.2 ± 4.8
KN-93 & Postcon 4 339 ± 13 12.0 ± 0.7 295 ± 25 64.8 ± 7.3 0.40 ± 0.04 55.0 ± 5.4
98
2.3.3. STUDY 1:
The use of Mechanical Interventions for Cardioprotection
Study 1 examined what effect short periods of global no-flow ischaemia and reperfusion
would have, if they were instigated before (IPC) or after (postconditioning) in the rat
heart. It also characterised whether the number and durations of the ischaemic cycles
influenced efficacy.
Infarct size data
The primary endpoint of this study was myocardial infarct size expressed as a
percentage of the risk zone volume (figure 2.5). Infarct size was 41.0 ± 3.6% in control
experiments. Initiating two (IPCx2) or three cycles (IPCx3) of IPC before 35 minutes
of CAO, significantly reduced the infarct size to 25.1 ± 2.0% and 18.1 ± 2.0%
respectively. A 39% and 56% relative reduction suggests there is increased
cardioprotection with an additional IPC cycle, but no significant difference existed
between the two. None of the postconditioning groups’ infarct size was significantly
different to the controls. Postconditioning with six short duration cycles (Postcon-6x10)
produced a lower mean infarct size (35.6 ± 4.7%) than postconditioning with three
longer duration cycles (Postcon-3x30, 50.2 ± 6.0%). An initial 10 sec period of
reperfusion followed by three longer cycles of global I-R (Postcon-10/3x30), had a
comparable infarct size to the six short cycles (Postcon-10/3x30, 37.3 ± 4.2% vs.
Postcon-6x10, 35.6 ± 4.7%). The SEM for the two IPC groups was less than the three
postconditioning interventions, indicating a smaller extent of variability in infarct size
when a prior intervention is used.

99
CONTR
OLS
IPC (2
X3)
IPC (3
X3)
POSTC
ON (6
X10
)
POSC
TON (3
X30
)
POSTC
ON (1
0-3X
30)
0
20
40
60
**
Infa
rct-
to-r
isk r
ati
o (
%)
Figure 2.5: The infarct size expressed as a percentage of the risk zone volume for
Study 1. Both IPC interventions significantly reduced the infarct size when compared
to control. None of the postconditioning interventions could effect a significant
limitation in infarct size. N number for each experimental group is given in table 2.2.
* Significantly different from Control (P<0.05, One way-ANOVA + Newman-Keuls
post-hoc)
Coronary flow and contractility data
The hearts subjected to an IPC intervention had a moderate increase in CFR prior to the
CAO (data not shown). This did not affect the reduction in CFR at the onset of
ischaemia, as all the groups fell below 62% of their baseline readings (figure 2.6A).
The reduced CFR remained stable until the ligature was released for reperfusion. This
restored the CFR to between 82-102% of the baseline readings, with Postcon-3x30
hearts having a significantly greater CFR than hearts treated to Postcon-10/3x30. All
groups had a gradual run down in their CFR during the course of reperfusion.
However, the IPCx3 hearts had a significantly better compensated CFR compared to
some of the other groups after 30 minutes (vs. Postcon-10/3x30) and 60 minutes (vs.
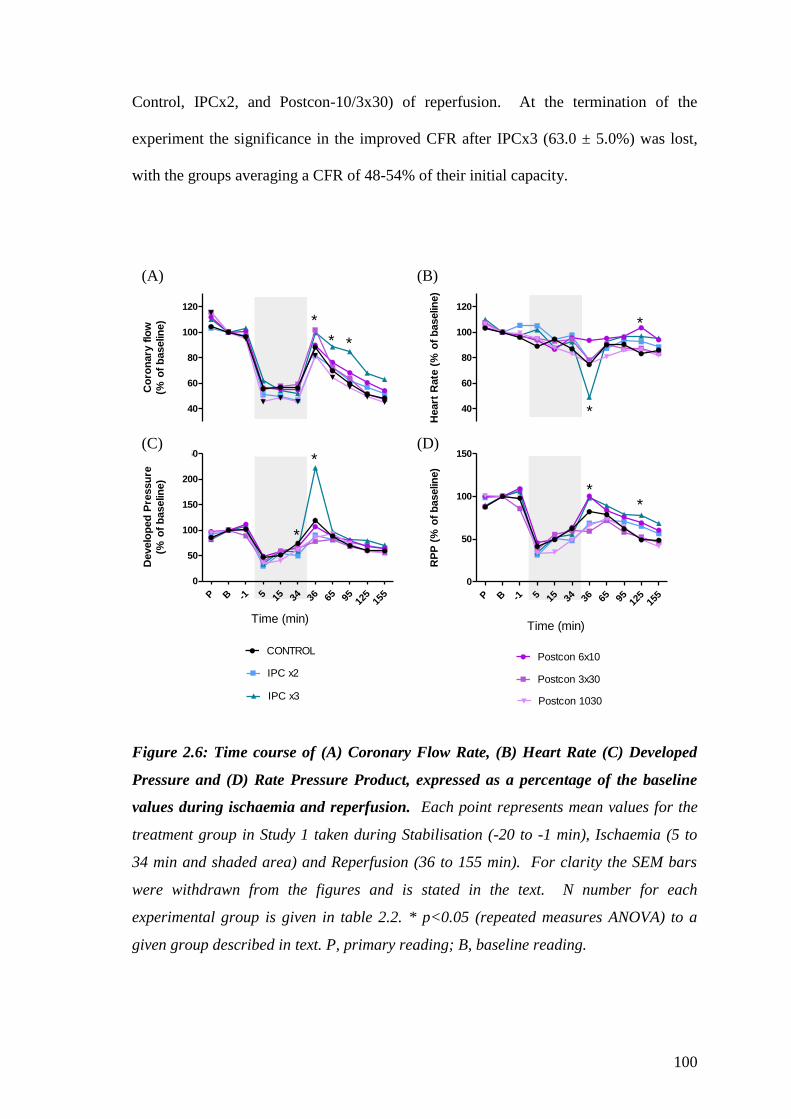
100
Control, IPCx2, and Postcon-10/3x30) of reperfusion. At the termination of the
experiment the significance in the improved CFR after IPCx3 (63.0 ± 5.0%) was lost,
with the groups averaging a CFR of 48-54% of their initial capacity.
40
60
80
100
120
Co
ron
ary
flo
w
(% o
f b
aselin
e)
P B -1 5 15 34 36 65 95 125
155
0
50
100
150
200
250
Time (min)
CONTROL
IPC x2
IPC x3
Develo
ped
Pre
ssu
re
(% o
f b
aselin
e)
40
60
80
100
120
Heart
Rate
(%
of
baselin
e)
*
*
*
*
**
*
*
P B -1 5 15 34 36 65 95 125
155
0
50
100
150
Time (min)
Postcon 6x10
Postcon 3x30
Postcon 1030
RP
P (
% o
f b
aselin
e)
*
Figure 2.6: Time course of (A) Coronary Flow Rate, (B) Heart Rate (C) Developed
Pressure and (D) Rate Pressure Product, expressed as a percentage of the baseline
values during ischaemia and reperfusion. Each point represents mean values for the
treatment group in Study 1 taken during Stabilisation (-20 to -1 min), Ischaemia (5 to
34 min and shaded area) and Reperfusion (36 to 155 min). For clarity the SEM bars
were withdrawn from the figures and is stated in the text. N number for each
experimental group is given in table 2.2. * p<0.05 (repeated measures ANOVA) to a
given group described in text. P, primary reading; B, baseline reading.
(A) (B)
(C) (D)
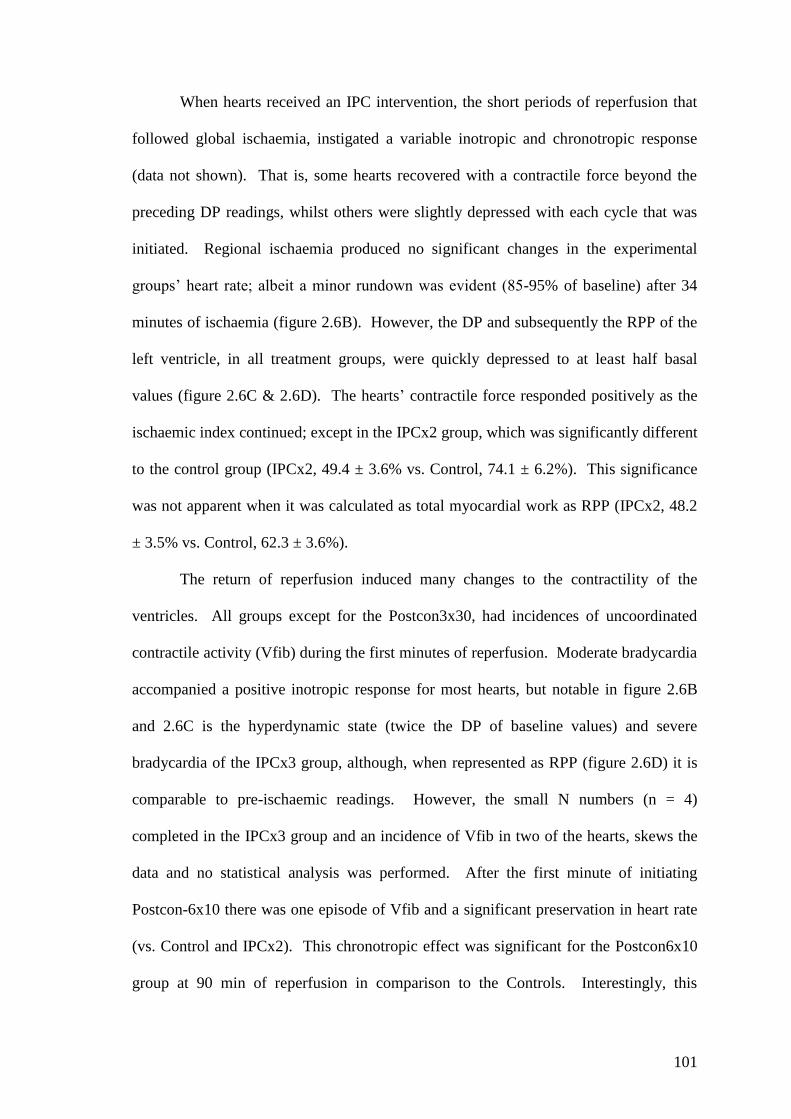
101
When hearts received an IPC intervention, the short periods of reperfusion that
followed global ischaemia, instigated a variable inotropic and chronotropic response
(data not shown). That is, some hearts recovered with a contractile force beyond the
preceding DP readings, whilst others were slightly depressed with each cycle that was
initiated. Regional ischaemia produced no significant changes in the experimental
groups’ heart rate; albeit a minor rundown was evident (85-95% of baseline) after 34
minutes of ischaemia (figure 2.6B). However, the DP and subsequently the RPP of the
left ventricle, in all treatment groups, were quickly depressed to at least half basal
values (figure 2.6C & 2.6D). The hearts’ contractile force responded positively as the
ischaemic index continued; except in the IPCx2 group, which was significantly different
to the control group (IPCx2, 49.4 ± 3.6% vs. Control, 74.1 ± 6.2%). This significance
was not apparent when it was calculated as total myocardial work as RPP (IPCx2, 48.2
± 3.5% vs. Control, 62.3 ± 3.6%).
The return of reperfusion induced many changes to the contractility of the
ventricles. All groups except for the Postcon3x30, had incidences of uncoordinated
contractile activity (Vfib) during the first minutes of reperfusion. Moderate bradycardia
accompanied a positive inotropic response for most hearts, but notable in figure 2.6B
and 2.6C is the hyperdynamic state (twice the DP of baseline values) and severe
bradycardia of the IPCx3 group, although, when represented as RPP (figure 2.6D) it is
comparable to pre-ischaemic readings. However, the small N numbers (n = 4)
completed in the IPCx3 group and an incidence of Vfib in two of the hearts, skews the
data and no statistical analysis was performed. After the first minute of initiating
Postcon-6x10 there was one episode of Vfib and a significant preservation in heart rate
(vs. Control and IPCx2). This chronotropic effect was significant for the Postcon6x10
group at 90 min of reperfusion in comparison to the Controls. Interestingly, this
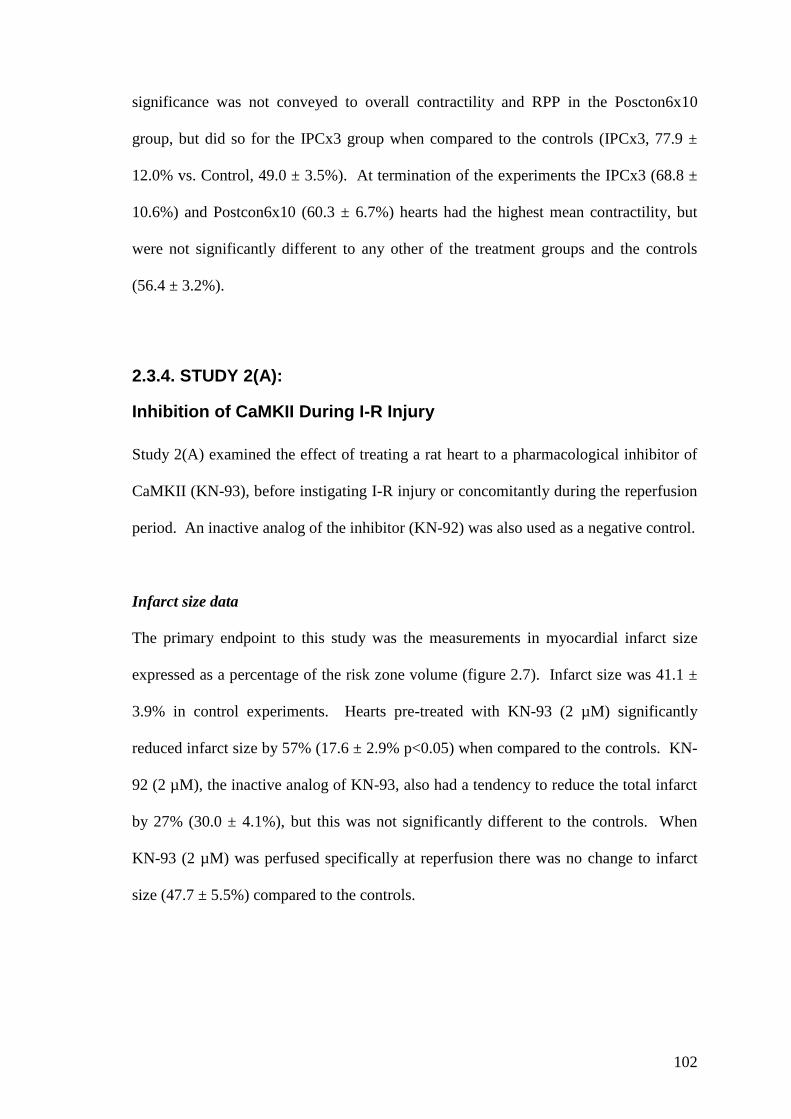
102
significance was not conveyed to overall contractility and RPP in the Poscton6x10
group, but did so for the IPCx3 group when compared to the controls (IPCx3, 77.9 ±
12.0% vs. Control, 49.0 ± 3.5%). At termination of the experiments the IPCx3 (68.8 ±
10.6%) and Postcon6x10 (60.3 ± 6.7%) hearts had the highest mean contractility, but
were not significantly different to any other of the treatment groups and the controls
(56.4 ± 3.2%).
2.3.4. STUDY 2(A):
Inhibition of CaMKII During I-R Injury
Study 2(A) examined the effect of treating a rat heart to a pharmacological inhibitor of
CaMKII (KN-93), before instigating I-R injury or concomitantly during the reperfusion
period. An inactive analog of the inhibitor (KN-92) was also used as a negative control.
Infarct size data
The primary endpoint to this study was the measurements in myocardial infarct size
expressed as a percentage of the risk zone volume (figure 2.7). Infarct size was 41.1 ±
3.9% in control experiments. Hearts pre-treated with KN-93 (2 µM) significantly
reduced infarct size by 57% (17.6 ± 2.9% p<0.05) when compared to the controls. KN-
92 (2 µM), the inactive analog of KN-93, also had a tendency to reduce the total infarct
by 27% (30.0 ± 4.1%), but this was not significantly different to the controls. When
KN-93 (2 µM) was perfused specifically at reperfusion there was no change to infarct
size (47.7 ± 5.5%) compared to the controls.

103
CONTR
OL
KN93
Pre
-ISCH
KN92
Pre
-ISCH
KN93
@ R
EPER
0
20
40
60
*
Infa
rct-
to-r
isk r
ati
o (
%)
Figure 2.7: The infarct size expressed as a percentage of the risk zone volume for
Study 2(A). Hearts pre-treated with the CaMKII inhibitor KN-93 (2 µM) had a
significant amount of infarct limitation when compared to the controls. Perfusion of the
CaMKII inhibitor during reperfusion had no effect on infarct size. KN-92 (2 µM) an
analog of KN-93 that does not inhibit CaMKII had a non-significant trend of lowering
the infarct size. N number for each experimental group is given in table 2.2.
* Significantly different from Control (P<0.05, One way-ANOVA + Newman-Keuls
post-hoc)
Coronary flow and contractility data
Pre-treatment of either KN compound increased CFR prior to CAO. After 5 minutes of
ischaemia (see figure 2.8A), hearts treated with KN-93 (PreKN-93) had a significant
increase in CFR. The vasodilator effect of the compound was reversed by the 15th
minute of ischaemia. This allowed all experimental groups to have a comparable CFR
at this time point, which was below 60% of the baseline readings. When hearts were
perfused with KN-93 5 minutes before the reperfusion period (ReperKN-93), there was
a significant increase in the CFR when compared to the controls (mean difference of
15.5%). However, all groups had an equivalent CFR when the ligature was released at
the start of reperfusion and at termination of the experiments.

104
40
60
80
100
120
Heart
Rate
(%
of
baselin
e)
40
60
80
100
120
Co
ron
ary
flo
w
(% o
f b
aselin
e)
*
*
*
* *
P B -1 5 15 34 36 65 95 125
155
0
50
100
150
Time (min)
KN-92 PRE-ISCH
KN-93 REPER
RP
P (
% o
f b
aselin
e)
P B -1 5 15 34 36 65 95 125
155
0
50
100
150
Time (min)
CONTROL
KN93 PRE-ISCH
Develo
ped
Pre
ssu
re
(% o
f b
aselin
e)
*
Figure 2.8: Time course of (A) Coronary Flow Rate, (B) Heart Rate (C) Developed
Pressure and (D) Rate Pressure Product, expressed as a percentage of the baseline
values during Study 2(A). Each point represents mean values for the treatment groups
taken during the periods of Stabilisation (-20 to -1 min), Ischaemia (5 to 34 min and
shaded area) and Reperfusion (36 to 155 min). For clarity the SEM bars were
withdrawn from the figures and is stated in the text. N number for each experimental
group is given in table 2.2. * p<0.05 (repeated measures ANOVA) to a given group
described in text. P, primary reading; B, baseline reading.
The pre-ischaemic perfusion of KN-93 and KN-92 had a brief (3-5 minutes)
effect on the hearts’ basal contractility. This is demonstrated in study 2B, figure 2.10 A
& C (p108) when the haemodynamic measurement was included during drug treatment.
(A) (B)
(C) (D)

105
The hearts produced a minor positive inotropic and chronotropic response before
returning back to basal levels for the remainder of the treatment. Some hearts perfused
with KN-93 also responded initially with negative inotropy that lasted for one or two
minutes. This was a distinct behaviour of the drug when it was perfused during the last
5 minutes of ischaemia.
The depressed contractile activity (RPP, figure 2.8D) associated with ischaemia
was more pronounced in PreKN-93 hearts. After 34 minutes of CAO, this was
significant when the RPP of the PreKN-93 group (36.0 ± 5.2% of baseline) was
compared to the ReperKN-93 group (67.7 ± 4.1%). The main component for this
depression was the decreased HR (figure 2.8B) rather than the decreased LVDP (figure
2.8C), although none were significantly different as sole parameters.
Reperfusion brought a momentary period of bradycardia which was significantly
greater within the PreKN-93 group than ReperKN-93 group. Some compensatory
positive inotropy meant that overall myocardial work (RPP) for all groups was similar.
Both KN-93 groups had one incidence of Vfib during reperfusion, whilst none were
instigated with the PreKN-92 group and four incidences occurred within the Control
hearts. During further reperfusion, the preKN-93 group’s heart rate did not recover to
the same degree as the Control heart rate (significant mean difference of 21.6% at 90
min and 23.1% at 120 min reperfusion) or the preKN-92 group (significant mean
difference of 24.9% at 90 min reperfusion). However, the preKN-93 group RPP was
comparable to the other groups at end of the experiments due to a non significant
improvement in the contractile force.
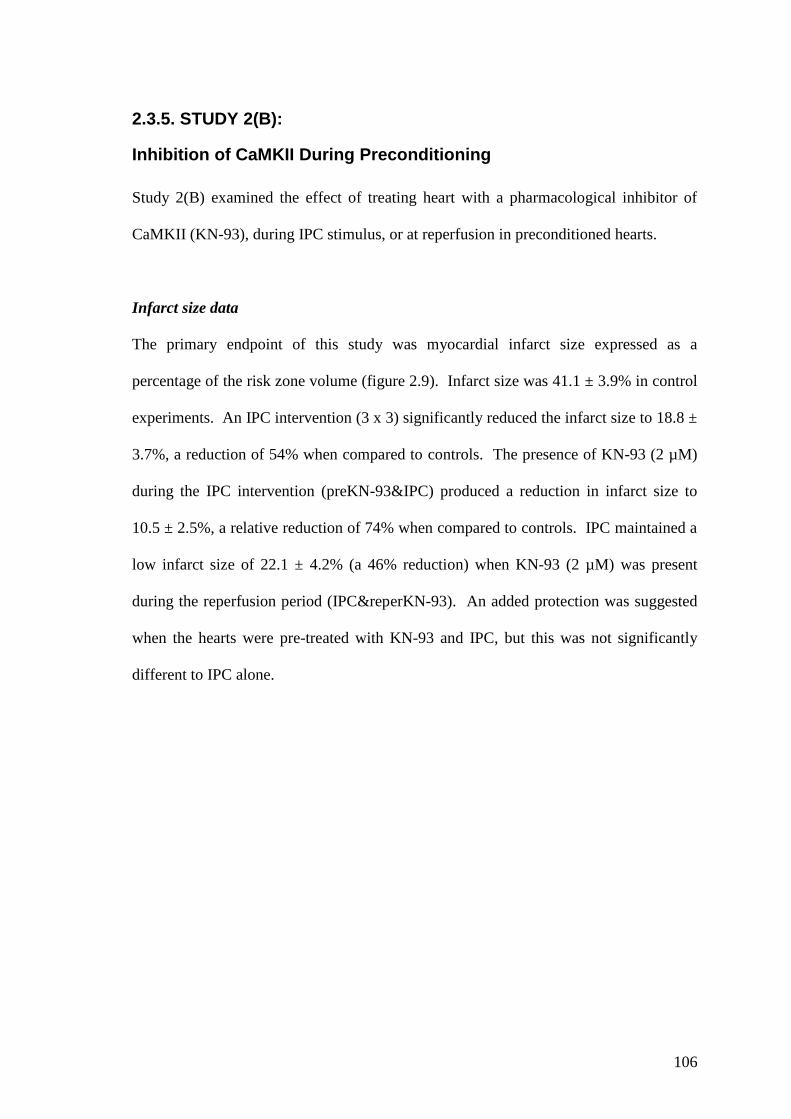
106
2.3.5. STUDY 2(B):
Inhibition of CaMKII During Preconditioning
Study 2(B) examined the effect of treating heart with a pharmacological inhibitor of
CaMKII (KN-93), during IPC stimulus, or at reperfusion in preconditioned hearts.
Infarct size data
The primary endpoint of this study was myocardial infarct size expressed as a
percentage of the risk zone volume (figure 2.9). Infarct size was 41.1 ± 3.9% in control
experiments. An IPC intervention (3 x 3) significantly reduced the infarct size to 18.8 ±
3.7%, a reduction of 54% when compared to controls. The presence of KN-93 (2 µM)
during the IPC intervention (preKN-93&IPC) produced a reduction in infarct size to
10.5 ± 2.5%, a relative reduction of 74% when compared to controls. IPC maintained a
low infarct size of 22.1 ± 4.2% (a 46% reduction) when KN-93 (2 µM) was present
during the reperfusion period (IPC&reperKN-93). An added protection was suggested
when the hearts were pre-treated with KN-93 and IPC, but this was not significantly
different to IPC alone.

107
CONTR
OL
IPC(3
x3)
IPC &
KN93
IPC &
KN93
@ R
EPER
0
20
40
60
**
*
Infa
rct-
to-r
isk r
ati
o (
%)
Figure 2.9: The infarct size expressed as a percentage of the risk zone volume for
Study 2(B). Hearts subjected to an IPC intervention in the presence of KN-93 (2 µM)
maintained their cardioprotective phenotype. Perfusion of KN-93 (2 µM) at
reperfusion, after an IPC protocol had been initiated also maintained significant infarct
limitation. N number for each experimental group is given in table 2.2. * Significantly
different from Control (P<0.05, One way-ANOVA + Newman-Keuls post-hoc)
Coronary flow and contractility data
In the preKN-93&IPC group, a final haemodynamic measurement was made during the
stabilisation period (at 14 minutes), in the presence of KN-93 (2 µM). This pre-
treatment prior to an IPC intervention significantly increased the CFR (129.2 ± 12.2%)
above baseline values and the other treatment groups (figure 2.10A). This significance
was maintained after 5 minutes of ischaemia but was reversed by the 15th
minute as
CFR fell to 55.1 ± 3.5% of baseline readings. A non-significant increase in CFR was
measured when KN-93 was perfused 5 minutes before reperfusion (mean difference
17.8% with Controls). All groups had an equivalent CFR when the ligature was
released and at termination of the experiments.

108
40
60
80
100
120
140
Co
ron
ary
flo
w
(% o
f b
aselin
e)
*
*
40
60
80
100
120
Heart
Rate
(%
of
baselin
e)
P B -1 5 15 34 36 65 95 125
155
0
50
100
150
Time (min)
CONTROL
IPC X3
Develo
ped
Pre
ssu
re
(% o
f b
aselin
e)
P B -1 5 15 34 36 65 95 125
155
0
50
100
150
Time (min)
IPC &KN93
IPC KN93 @REPER
RP
P (
% o
f b
aselin
e)
Figure 2.10: Time course of (A) Coronary Flow Rate, (B) Heart Rate (C) Developed
Pressure and (D) Rate Pressure Product, expressed as a percentage of the baseline
values during Study 2(B). Each point represents mean values for the treatment groups
taken during the periods of Stabilisation (-20 to -1 min), Ischaemia (5 to 34 min and
shaded area) and Reperfusion (36 to 155 min). For clarity the SEM bars were
withdrawn from the figures and is stated in the text. N number for each experimental
group is given in table 2.2. * p<0.05 (repeated measures ANOVA) to a given group
described in text. P, primary reading; B, baseline reading.
(D)
(B) (A)
(C)
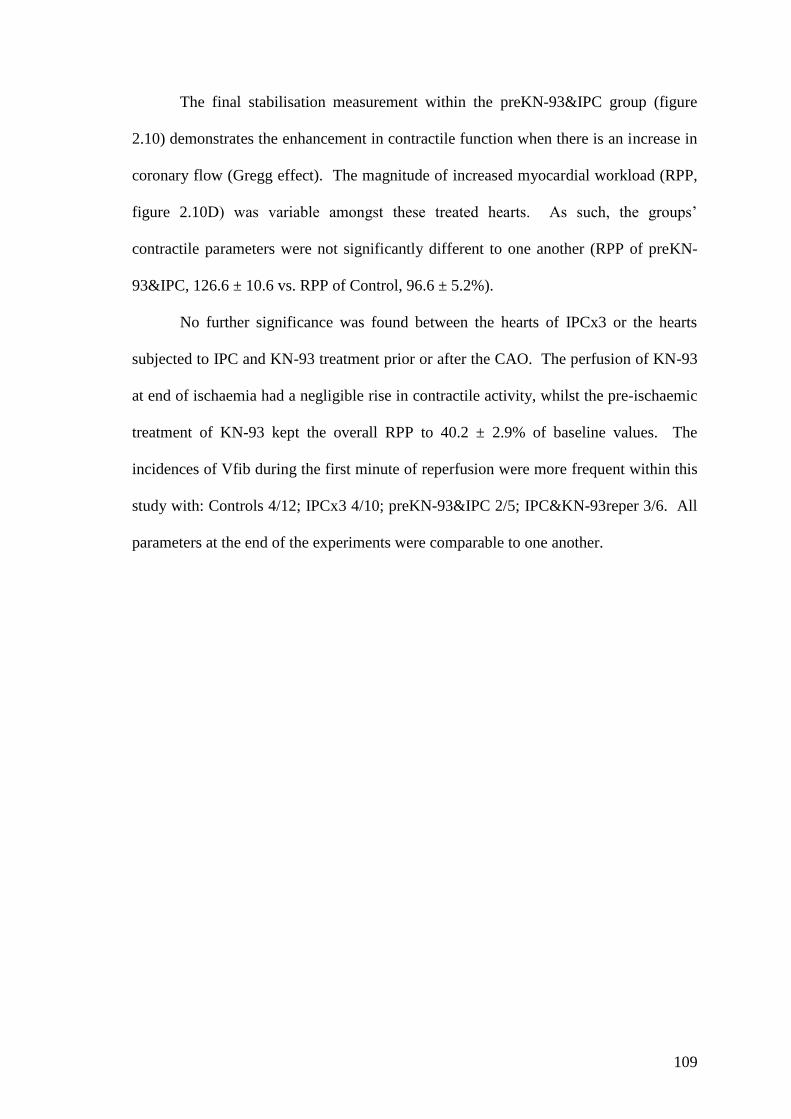
109
The final stabilisation measurement within the preKN-93&IPC group (figure
2.10) demonstrates the enhancement in contractile function when there is an increase in
coronary flow (Gregg effect). The magnitude of increased myocardial workload (RPP,
figure 2.10D) was variable amongst these treated hearts. As such, the groups’
contractile parameters were not significantly different to one another (RPP of preKN-
93&IPC, 126.6 ± 10.6 vs. RPP of Control, 96.6 ± 5.2%).
No further significance was found between the hearts of IPCx3 or the hearts
subjected to IPC and KN-93 treatment prior or after the CAO. The perfusion of KN-93
at end of ischaemia had a negligible rise in contractile activity, whilst the pre-ischaemic
treatment of KN-93 kept the overall RPP to 40.2 ± 2.9% of baseline values. The
incidences of Vfib during the first minute of reperfusion were more frequent within this
study with: Controls 4/12; IPCx3 4/10; preKN-93&IPC 2/5; IPC&KN-93reper 3/6. All
parameters at the end of the experiments were comparable to one another.

110
2.3.6. STUDY 2(C):
Inhibition of CaMKII During Postconditioning
Study 2(C) examined the effect of treating the heart with a pharmacological inhibitor of
CaMKII (KN-93), in parallel with a postconditioning intervention (6 x10 cycles).
Infarct size data
The primary endpoint of this study was myocardial infarct size expressed as a
percentage of the risk zone volume (figure 2.11). Infarct size was 30.1 ± 2.6% in
control experiments. There was no significant difference in the infarct size of hearts
that underwent a postconditioning intervention of 6 x10 cycles (24.8 ± 2.7%).
Inhibition of CaMKII with KN-93 during reperfusion also resulted in infarct size (25.5
± 5.4%) comparable with the controls and postconditioning group. Postconditioning in
the presence of KN-93 had no significant effect on infarct size (39.5 ± 6.2%). In fact, a
trend towards an increase in infarct size (additional 55-60%) was seen when these two
interventions were combined although some variability existed in the group.

111
CONTR
OL
POSTC
ON(6
X10
)
KN-9
3 @
REPE
R
POSTC
ON &
KN-9
3
0
20
40
60
Infa
rct-
to-r
isk r
ati
o (
%)
Figure 2.11: The infarct size expressed as a percentage of the risk zone volume for
Study 2(C). Postconditioning or the treatment of KN-93 at reperfusion has comparable
infarct size to controlled experiments. Combining postconditioning and KN-93
treatment had a non significant increase in infarct size. N number for each experimental
group is given in table 2.2.
Coronary flow and contractility data
The CFR for all groups was comparable during stabilisation and CAO (figure 2.12A).
An non-significant rise occurred with KN-93 treatment prior to reperfusion. When this
was combined with postconditioning a significant but variable rise to 123.8 ± 13.3% of
baseline levels occurred. This was reversed by 30 minutes of reperfusion, with all
groups having comparable CFR at termination of experiment.
The primary RPP reading (figure 2.12D) of the hearts subjected to
postconditioning and KN-93 treatment (postconKN-93) was significantly less than the
hearts subjected to postconditioning alone. KN-93 treatment at the end of ischaemia
brought a significant increase in overall contractility to hearts in the postconKN-93

112
group, but only a non significant rise in the heart rate of those treated only to KN-93
(KN-93reper).
P B -1 5 15 34 36 65 95 125
155
0
50
100
150
Time (min)
KN-93 REPER
POSTCON & KN93
RP
P (
% o
f b
aselin
e)
P B -1 5 15 34 36 65 95 125
155
0
50
100
150
Time (min)
CONTROL
POSTCON
Develo
ped
Pre
ssu
re
(% o
f b
aselin
e)
0
20
40
60
80
100
120
Heart
Rate
(%
of
baselin
e)
40
60
80
100
120
Co
ron
ary
flo
w
(% o
f b
aselin
e)
*
*
**
* **
Figure 2.12: Time course of (A) Coronary Flow Rate, (B) Heart Rate (C) Developed
Pressure and (D) Rate Pressure Product, expressed as a percentage of the baseline
values during Study 2(C). Each point represents mean values for the treatment groups
taken during the periods of Stabilisation (-20 to -1 min), Ischaemia (5 to 34 min and
shaded area) and Reperfusion (36 to 155 min). For clarity the SEM bars were
withdrawn from the figures and is stated in the text. N number for each experimental
group is given in table 2.2. * p<0.05 (repeated measures ANOVA) to a given group
described in text. P, primary reading; B, baseline reading.
(D)
(B)
(C)
(A)

113
Return of reperfusion instigated Vfib in all groups and was more prevalent in this study,
with every heart in the postconditioning group (6/6) and majority of the control group
(4/7) developing Vfib. Although sample numbers were low, KN-93 limited the Vfib
occurrence to one out of four hearts. Thus, no contractile data was available for the
postconditioning group at 1 min of reperfusion and is marked as zero on figures 2.12(B-
D). Overall myocardial work for postconKN-93 was high during the early stages of
reperfusion. Interestingly, whilst significant improvement was maintained during the
first 30 minutes of reperfusion, the HR continued to drop to significant levels at 60
minutes. The KN-93reper and postconKN-93 had similar HR at termination of
experiment, 20% lower than the controls and postconditioning group. Overall
contractility (RPP) for the groups was the same.

114
2.4. Discussion
The studies’ major findings are summarised as follows:
- The CaMKII inhibitor KN-93 is protective against ischaemia-reperfusion injury, if
administered before ischaemia but not during reperfusion. This suggests that CaMKII
at some stage in ischaemia promotes cellular injury. On these grounds, the first
hypothesis that CaMKII activation at reperfusion promotes irreversible injury can be
rejected. However, the KN compounds could have non-specific activity and this
warrants further investigation as the inactive analog, KN-92, demonstrated some degree
of protection when perfused prior to ischaemia.
- Postconditioning is not as robust as IPC in limiting infarct size in a rat isolated heart
model of acute myocardial infarction. The inhibition of CaMKII with KN-93 does not
abrogate the protective effect of IPC when administered at the time of the IPC stimulus
or at reperfusion, although an additive protective effect of IPC and CaMKII inhibition is
possible. These data suggest that cardioprotection by IPC does not require a functional
CaMKII, and thus leads to rejection of the second hypothesis that under IPC conditions,
CaMKII promotes cardioprotection. No significant protection was conferred with a
postconditioning intervention, although, the addition of a CaMKII inhibitor during the
intervention seemed to promote further injury. Further studies are needed to investigate
the activity of CaMKII during postconditioning.

115
2.4.1. CaMKII Promotes Cellular Injury During Ischaemia
The basis of the first hypothesis lies in previous research demonstrating that I-R and
other pathological diseases involve CaMKII activity to promote cellular injury (Zhu et
al., 2003; Li et al., 2007; Vila-Petroff et al., 2007). Study 2A, confirms this general
perception of CaMKII since the presence of KN-93 during ischaemia significantly
reduced infarct size. This is in agreement with research that used genetically modified
CaMKII (Li et al., 2007; Yang et al., 2006) or pharmacological inhibition of the kinase
(Vila-Petroff et al., 2007; Salas et al., 2010) to prevent I-R injury. However, a disparity
exists with the conclusion of Mattiazzi’s studies (Vila-Petroff et al., 2007; Salas et al.,
2010) that pharmacological inhibition of CaMKII, with KN-93 (2.5 µM), prevents
reperfusion injury. In study 2A, the treatment of the same inhibitor at a similar
concentration did not prevent irreversible injury if it was only administered at
reperfusion. This confirms the findings of Lange et al. (2009) which used a bolus of
KN-93 when reperfusion was initiated. A slightly different model of 45 min global
ischaemia was used by Vila-Petroff et al. (2007) and Salas et al. (2010), but their
protocol also involved a 10 minute pre and post-ischaemic treatment with the inhibitor.
This suggests that KN-93 must be present during early ischaemia for any protection to
occur.
Mattiazzi’s detailed western blot analysis suggested the window of CaMKII
activity (measured by phosphorylation of the PLB Thr17
site) during the first minutes of
reperfusion was the cause of irreversible injury. Uemura et al. (2002) also reported that
there was a restrained autophosphorylation state of CaMKII under ischaemic conditions
and at reperfusion. But, Mattiazzi’s studies were not conclusive on whether treatment
with KN-93 specifically conferred protection during reperfusion. A NCX inhibitor,
KBR7943 administered in a similar protocol to KN-93, limited PLB Thr17
116
phosphorylation at reperfusion, but no evidence for the actions of KN-93 treatment was
given. Thus either KN-93 is ineffective in competing with CaMKII during the short
window of its activation at reperfusion; or CaMKII augments injury that has already
been sustained during the ischaemic period. The latter concept would have to consider
the lack of phosphorylation reported on the Thr287
site during ischaemia. Another
CaMKII status (i.e. oxidation at Met280/281
) could be responsible for the injury.
The significant amount of salvaged tissue with pre-ischaemic treatment of KN-
93 did not improve the hearts’ overall contractility or CFR at the end of
experimentation. The hearts showed signs of bradycardia with KN-93 treatment but not
with KN-92 treatment, indicating that this reduced rate was a product of CaMKII
inhibition. If cardiac function had been used as the end point of injury, as measured in
the studies by Dhalla’s group (Osada et al., 2000) and Benter et al. (2004), then the
studies on CaMKII inhibition during ischaemia would not have shown any beneficial
effect. Yet, CaMKII is a vital component of E-C coupling and this outcome would be
expected. One interesting observation was that the RPP at the end of ischaemia was
lower after pre-treatment of KN-93, than in all other groups in study 2A and study 2B.
A limitation in ATP utilisation during ischaemia with CaMKII inhibition can not be
ruled out as a possible mechanism of its cardioprotection. However, it needs to be
emphasised that functional measurements in the present model are subsidiary to infarct
size. Regional ischaemia models do not have sufficient sensitivity to reliably determine
changes in global LV contractility.

117
2.4.2. The Non-specific Activity of the KN Compounds
The negative control, KN-92, demonstrated some degree of cardioprotection (27%
lower infarct than controls) when perfused prior to an ischemic insult (study 2A). It
matched the KN-93 increase in CFR during the stabilisation period and incurred no
incidences of Vfib during the first minute of reperfusion. KN-93 and KN-92 are
structurally similar, but differ in that KN-93 can compete with CaM for the binding site
of CaMKII regulatory domain. Studies have revealed that the KN compounds can
specifically inhibit the activity of the LTCC (Gao et al., 2006) and the Kv channels
(Rezazadeh et al., 2006). This could be one explanation for the anti-arrhythmic
activities of KN-92 during reperfusion. The vasodilator effect of the KN compounds
could also be due to effects on the LTCC, as demonstrated by the active hyperaemia
associated with LTCC blockers. However, KN-92 did not match the bradycardia
initiated by KN-93. This suggests that the concentration used in this study was not
sufficient to prolong action potential duration (via the inhibition of the Kv channels) and
that it was specifically an inhibitory role of CaMKII.
The potency and permeability of KN-93 has made it a favoured pharmacological
inhibitor of CaMKII in this study and several other published studies. Other research
has not revealed the same degree of activity for KN-92. Contradicting the anti-
arrhythmic activities in study 2A, it failed to emulate KN-93 in reducing atrial
fibrillation (Chelu et al., 2009) and post-acidosis arrhythmias (Said et al., 2008).
Research specifically looking at cell death has also reported no significant effect of KN-
92 in models of liver I-R injury (Tsung et al., 2007), neuronal cell death (Takano et al.,
2003) or oxidative stress (Palomeque et al., 2009).

118
2.4.3. Postconditioning is Not as Robust as IPC in Limiting Infarct Size
Although the widespread notion is that postconditioning of the heart can limit I-R injury
(Zhao et al., 2003; Hausenloy and Yellon, 2006), the data presented here are in
agreement with other recent research (Dow and Kloner, 2007; Manintveld et al., 2007)
that has failed to emulate the current trend. IPC successfully reduced infarct size by up
to 56% when compared to controls confirming that a mechanical intervention prior to an
ischaemic insult is robustly cardioprotective in rat hearts ex vivo. A 39% reduction in
infarct size was obtained in the 2 x 3 min IPC group and an additional IPC cycle (3 x 3
min) limited infarct by up to 56% in comparison to the controls. While the two IPC
groups were not significantly different to one another a 'dose-dependency' of
preconditioning has been described previously (Sandhu et al., 1997). The IPC stimulus
increased the CFR prior to the CAO (data not shown) which is reported to be an effect
of adenosine release and KATP channel opening (Akatsuka et al., 1994). Only the 3
cycle stimulus caused a significant improvement in CFR after 30 min and 60 min of
reperfusion, which was then lost at the end of the protocol.
Postconditioning with the 6 x 10 sec intervention showed a minor trend towards
protection (13-26% reduction in infarct size), but this was not significant. Several
studies, reviewed by Crisotomo et al. (2006) demonstrated that the cardioprotective
effect of postconditioning is less than that of IPC, but the degree of protection reported
was a minimum of 36% relative to the controls. A large variance (infarct size range 6-
50%) within the groups could indicate that either a variable amount of irreversible
damage was caused during ischaemia or that postconditioning only salvages tissue
under meticulous conditions that have yet to be established.
The optimum duration of the occlusion and subsequent reperfusion during
postconditioning is unknown, but data here and in the literature do indicate that shorter
119
cycle durations favour the hearts of smaller species such as the rat (Crisotomo et al.,
2006). The infarct size was 44% less when postconditioning with 6 x 10 sec was used,
than when the longer occlusion duration of 3 x 30 sec was used. But due to the variance
within each of these groups, this difference did not reach statistical significance. The
brief increase in CFR after postconditioning with 6 x 10 sec also suggest the release of
autacoids such as adenosine were in effect, but did not mediate further protection.
2.4.4. Inhibition of CaMKII Does Not Abrogate the Protective Effect of IPC
IPC successfully protected the heart from subsequent I-R injury. However, the original
hypothesis that IPC is mediated by CaMKII can be rejected, as perfusion of the CaMKII
inhibitor KN-93 either during the trigger phase of IPC (10.5 ± 2.5%) or during the early
reperfusion period after an IPC stimulus (22.1 ± 4.2%) did not abolish this protection.
Instead, an added protection occurred when the drug was perfused in conjunction with
an IPC stimulus. Li et al. (2007) have also reported additive cardioprotection with IPC
and CaMKII inhibition during I-R, although their model used mutant mice. This
contradicts Osada et al. (2000) and Benter et al. (2004) who used KN-93 to abrogate the
protection afforded with IPC. The treatment protocols varied slightly to the ones used
in study 2B, in that treatment of KN-93 was given prior to the IPC rather than during
the IPC cycles or at reperfusion. This pre-treatment eradicated the improved contractile
recovery of IPC in both studies, which also correlated well with the SR Ca2+
uptake
reported by Osada et al. (2000). As seen with the data in study 2A, KN-93 can
influence the cardiodynamics of the heart, but when using infarct as a final end point of
injury, this modification is cardioprotective. The cardiodynamic data for the IPC
groups did not improve in study 2B, but did so at occasions during reperfusion in study
1 further demonstrating that these surrogate measures of injury are unreliable. Also,

120
IPC did not reduce the incidence of Vfib even with KN-93 treatment, indicating that an
unknown pro-arrhythmic mechanism was in place at the return of reperfusion.
IPC is known to protect with a range of triggers and mediators such as activation
of the KATP channel and the RISK pathway. As CaMKII inhibition during ischaemia
limits irreversible injury, it could be speculated that IPC might also protect against I-R
injury by limiting CaMKII activity. The added protection with IPC and KN-93
treatment could also indicate that a dose dependent limitation in CaMKII activity
occurred. However if KN-93 at 2 µM concentration completely abolishes CaMKII
activity, then it might suggest that there are separate mechanisms of protection at work.
Further research is needed to determine if these stimuli work together or are different to
one another in achieving protection from I-R.
Inhibiting CaMKII during postconditioning, although not significantly different
to the other groups, had a moderate adverse effect on the intervention. The infarct size
after postconditioning in study 2C ranged between 15-32% whereas the presence of
KN-93 increased this to between 28-56%. One documented mechanism of
postconditioning protection is its effect on the Ca2+
handling of the SR. Whether
CaMKII inhibition by KN-93 would limit this beneficial activity remains to be seen in
models that show significant protection by a postconditioning intervention. In the
absence of a successful postconditioning protocol in these studies, further investigations
were not implemented.
121
2.5. Conclusion
The data reported here suggest that CaMKII has a pro-injury role during ischaemia but
is not a potential pharmacological target during the early reperfusion period. However,
caution is needed when using KN-93 as non specific activity of the drug could
contribute to the outcomes. This makes its analog KN-92 an essential tool as a negative
control. IPC could mediate some of its protection by regulating CaMKII rather than
supplementing its activity. It is possible that the two interventions are mechanistically
distinct as the combination of the two is additive. Postconditioning is not as robust as
IPC in limiting infarct size. In my hands, postconditioning was ineffective and it
remains to be seen if CaMKII plays any role in this phenomenon.

122
CHAPTER 3:
In Vitro Model of I-R with H9c2 cells

123
3.1. Introduction
3.1.1. In Vitro Models of Ischaemia-Reperfusion Injury
In vitro models of I-R have been developed to simulate the pathological state of cellular
injury. In doing so, several advantages are gained over whole heart models (Marber et
al., 2000). These include: the manipulation of the extracelluar environment; isolation
of cells from the influence of vascular, hormonal and neuronal components; prevention
of interaction with other cells of a different type; description of pharmacological actions
at a single cell level; genetic manipulation; and increased specificity in targeting the
signalling pathways. The disadvantages with the in vitro studies are that they lack all
the components of in situ conditions of I-R insult; and the cell phenotype may not match
those of the whole heart level.
The current models that mimic I-R injury are based on depriving the cells of
substrates. This has been done by limiting glucose in the medium (Matsui et al., 2007;
Lynn et al., 2008); arresting glycolis with the substitution of compounds such as 2-
deoxyglucose (2-DG, Agnetti et al., 2005); or lowering the oxygen levels to conditions
of hypoxia/anoxia (Hwang et al., 2008; Lynn et al., 2008). Matching the composition of
extracelluar ischaemic conditions with high sodium and lactate concentrations, or a
decreased pH level can also add to the models’ authenticity (Esumi et al., 1991; Lee et
al., 2007). A large amount of oxidative stress is generated during I-R injury, and thus
studies have replicated this by treating cells with H2O2, which is a direct product of
superoxide from the mitochondria (Brookes et al., 2004).
The phenomena of IPC and postconditioning have also been simulated at the
cellular level (Budas et al., 2004; Sun et al., 2005). This has confirmed that the
protection afforded by such strategies is inherent to cardiac myocytes (Diaz and Wilson,
124
2006). Many methods have been developed to determine the cells’ viability after these
cardioprotective strategies. The advantage of using a cell based model is that it can
differentiate between cell death by necrosis or apoptosis. The latter process will require
a longer duration for it to become apparent in order to allow such hallmarks as DNA
fragmentation to occur (Diaz and Wilson, 2006). In doing so, the ends of the nucleic
acids can then be labelled by terminal deoxynucleotidyl transferase dUTP nick end
labeling (TUNEL). However, more rapid determination of cells that are permeable to
staining dyes, such as trypan blue or propidium iodide can be done if the sarcolemma is
damaged. The uptake of dyes allows the damaged cells to be quantified by microscopic
examination. A colorimetric assay can also be used to determine the quantity of
enzymes such as creatine kinase or lactate dehydrogenase (LDH) that have been
released into the extracellular medium as a result of cell death. Alternatively, a
reducible reagent (MTS, see section 3.2.4.2) can be specific for intracellular
dehydrogenase enzymes that will determine if the cells are still viable or not. All in all,
in vitro models and measurements of cellular injury and viability have become common
methods in assessing various cardioprotective strategies. Combined with other
molecular, genetic, biochemical and pharmacological techniques they can help to
elucidate key mechanisms and signalling components that are at work in limiting or
stimulating cellular injury.
3.1.2. In Vitro Models of Cellular Injury by CaMKII Activity
A variety of in vitro models have investigated the possible role of CaMKII activity in
promoting cellular injury. Chronic exposure of cardiac myocytes to angiotensin-II,
oubain, β-adrenergic stimulation and H2O2 are all reported to have caused cell death by
the uncontrolled activity of CaMKII (Zhu et al., 2003; Palmoeque et al., 2009; Sapia et

125
al., 2010). These studies have suggested that pathological conditions that continually
subject cells to an enhanced Ca2+
entry (via LTCC or the reverse mode NCX) or its
mishandling by the SR lead to various cell death pathways. Yet, if CaMKII inhibitors
are present in these models, a significant amount of damage can be prevented.
Accordingly it has been proposed that CaMKII is a key mechanism for these
pathological pathways. However, an interesting exception has been suggested by
Palmoeque et al. (2009). That is, the generation of oxidative stress by continued
angiotensin-II stimulation can lead to CaMKII activity and apoptosis at subdiastolic
[Ca2+
]i. Twenty four hours of angiotensin-II stimulation in quiescent rat cardiac
myocytes led to cell death in the absence of changes to the [Ca2+
]i. Various conditions
were altered to demonstrate that CaMKII was the key mechanism of apoptosis and not
[Ca2+
]i, including compartmentalised Ca2+
(via activation of the IP3R), phosphatases or
ROS. Further analysis suggested that the downstream trigger for apoptotic cell death
was CaMKII regulation of p38MAPK and its disruption of the Bax/Bcl-2 proteins.
Other studies have confirmed that the activation of CaMKII is promoted with prolonged
H2O2 treatment (Zhu et al., 2007; Peng et al., 2010). Peng et al. (2010) have recently
suggested that it is isoform specific as overexpression of CaMKIIδB promoted cell
viability during H2O2 treatment whilst overexpression of CaMKIIδC exacerbated cell
injury.
Few in vitro models have investigated CaMKII with regard to simulated I-R
injury. Vila-Petroff et al. (2007) subjected isolated cardiac myocytes to an acute period
(45 minutes) of simulated ischaemia solution (high sodium-lactate, high K+, acidosis, no
glucose). When the cells returned to normal physiological solution, cell death was
accompanied by hypercontracture and Ca2+
overload, which CaMKII inhibitors, KN-93
and AIP, were successful in preventing. Zhu et al. (2007) used a variety of extracellular

126
conditions to challenge cardiac myocytes expressing a dominant negative CaMKIIδC.
Twenty four hours of chronic stimulation with H2O2, acidosis or hyperkalaemia
promoted apoptosis. But when CaMKII was suppressed, a significant reduction in
TUNEL-positive cells was measured.
Due to the reported non-specific activity of the KN compounds, corroboration of
another inhibitor is usually used to confirm a CaMKII role. Peptides are inefficient in
passing the cell membrane when perfused in the Langendorff heart. However, in a cell
culture model there is sufficient time for the peptides to penetrate the cell membrane
due to uptake through lipophilicity. Also, higher concentrations can be more effectively
and economically achieved. A more specific inhibitor of CaMKII, AIP (Ishida et al.,
1995) can thus be adopted. CaMKII is also involved with multiple targets within the
cell and several key hypotheses can be raised and tested within an in vitro model. Thus
the aim of this chapter was to replicate the conditions of chapter 2 within an in vitro
model and test the effects of two separate pharmacological inhibitors of CaMKII.

127
3.1.3. Hypothesis
The aim of these studies was to develop an in vitro model of I-R injury and to
investigate whether the pharmacological inhibitors of CaMKII afforded protection at
this cellular level. Using the H9c2 cell line, two models of cell death was used. The
first involved the simulation of the ischaemic extracelluar conditions (high lactate, high
K+, acidosis) and reperfusion. The second study involved prolonged exposure to
oxidative stress and glucose deprivation. Two pharmacological inhibitors of CaMKII,
KN-93 and AIP, were used in order to determine the involvement of CaMKII activity.
The inactive analog of KN-93, KN-92 was also used as a control for the unspecific
activity of these compounds.
It was hypothesised that:
CaMKII inhibitors will promote cell viability in a model of cellular injury by simulated
I-R or by oxidative stress.
3.1.4. Specific Objectives
(A) Develop an in vitro model of cell death and injury that simulated the conditions of
ischaemia.
(B) Test whether CaMKII inhibition with KN-93 or a more specific inhibitor, AIP,
protected against cell death within the model and use KN-92 as a negative control.
(C) Further investigate possible downstream mechanisms of protection with CaMKII
inhibition.

128
3.2. Materials and Methods
The organic CaMKII inhibitor KN-93 (water soluble), the inactive analog KN-92 and
the cell permeable autocamtide-2 related inhibitory peptide II (AIP) were purchased
from Calbiochem (Nottingham, UK). KN-92 and AIP were dissolved in DMSO (final
DMSO concentration in the solution was 0.07% and <0.03% respectively).
3.2.1. The H9c2 Cell Line
H9c2 cells are derived from embryonic rat heart. They can proliferate into myoblasts or
differentiate into non-proliferating myotubes if the serum, that contains natural
differentiating inhibitors, is withdrawn from the medium (Kimes and Brandt, 1976).
The cells have been thoroughly characterised since their first isolation by Kimes and
Brandt (1976) and have maintained many of the functional properties found in adult
cardiac myocytes (Hescheler et al., 1991; Sipido and Marban, 1991; Lax et al., 2005).
They can simultaneously contract and produce action potentials (Kimes and Brandt,
1976), which are characteristic of the cardiac action potential (Hescheler et al., 1991;
Sipido and Marban, 1991). The mitochondria are sensitive to the intracellular Ca2+
pools and respond to agents that release Ca2+
from the SR (Lax et al., 2005). A skeletal
muscle isoform of the α1S subunit of the LTCC is adopted upon differentiation into
myotubes, although this is reversible with retinoic acid stimulation (Menard et al.,
1999). Some other characteristics of skeletal muscle cells have also been compared to
the H9c2 cells. These include a smaller t-tubule system and an acetylcholine response
that is characteristic of skeletal myocytes rather than cardiac myocytes (Kimes and
Brandt, 1976). The authors concluded that muscle cell lines that are in long term

129
culture will tend to have similar characteristics as they are all derived from the
embryonic mesoderm.
The cell line has been used in several studies that have investigated I-R injury at
the cellular level. When introduced to models of hypoxia-reoxygenation and serum
withdrawal, loss of mitochondrial function and the up-regulation of pro-apoptotic
factors such as caspases and Bax accumulation induced cell death by apoptosis
(Bonavita et al., 2003). In a similar model, Hou and Hsu (2005) used GFP to monitor
the translocation of the Bax protein to the mitochondria, allowing further analysis of
this apoptotic pathway. When the cells were introduced to the metabolic inhibitor
rotenone (5 µM), they quickly adopted features of necrosis (rupture of cytoplasmic
membrane) that was independent of caspase activation (Yaglom et al., 2003). This
mode of cell death that occurred within a 4 hour time frame was preceded by the
generation of ROS and the depolarisation of mitochondrial membranes. Sardao et al.
(2007) have also reported that oxidative stress (by tert-butylhydroperoxide treatment)
alone generated sufficient ROS to cause cell death that had characteristics of membrane
blebbing and Bax accumulation around the mitochondria. The cells also possess
endogenous capabilities of protection. Preconditioning with cycles of hypoxia-
reoxygenation (Sakamoto et al., 1998; Jiao et al., 2008) or metabolic stress (Kabakov et
al., 2002) have all been reported to limit cell injury and promote cell viability. Also,
postconditioning models that include short cycles of hypoxia-reoxygenation at the end
of the ischaemic insult have recently been described (Mykytenko et al., 2008; Zhu et
al., 2011).
Hoch et al. (1998) reported that various isoforms of CaMKII (δC, δB, δD, δI) are
expressed in H9c2 cells. The isoforms were revealed to be dependent on the
differentiation state of the cell line, with the exception of the δC isoform which always

130
preserved a dominant expression. The sub-cellular localization of CaMKII was
identified to such structures as the plasma membrane, SR and the perinuclear region.
These loci are similar in adult cardiac myocytes, although the translocation of
CaMKIIδB to the nucleus was weak. However, when hypertrophy was stimulated in the
cells by IGF-II treatment, the increase in cell size could be reversed with a CaMKII
inhibitor cocktail (Chu et al., 2008). Up regulation of genes after vasopressin
(Woischwill et al., 2005) or digoxin (Chen et al., 2011) treatment has also been reported
to be CaMKII sensitive. Whether CaMKII is involved in simulated I-R injury in H9c2
cells has not been investigated.
3.2.2. Cell Maintenance
H9c2 cells were purchased from the European Collection of Cell Cultures and grown in
75cc vented flasks, with high glucose Dulbecco’s modified Eagle’s medium (DMEM,
Invitrogen, components listed in appendix 1.1) that was supplemented with 10% fetal
calf serum (HyClone, Peribo) at 37oC, 5% CO2. To maintain the myoblast phenotype
the cells were split when they reached a confluence of 60-70%. This was done by:
washing the cells briefly with phosphate buffered saline (PBS; Invitrogen, components
listed in appendix 1.2), trypsinizing the adherent cells by adding 3 ml of TrypLE
Express (Invitrogen) and incubating the cells for 2 minutes to dissociate the cells from
the flasks, re-suspending the cells in DMEM and then transferring appropriate aliquots
to new culture flasks. Each passage was recorded numerically with the addition of 1
point to every splitting procedure. All experiments involved cells with passage numbers
up to 20, with 0 considered as the original purchased passage number.

131
3.2.2.1 Cell Preparation/Subculture
Several culture flasks were used to harvest cells for each experiment. After the addition
of trypsin, the cells were centrifuged (at 110 x g for 5 min) and re-suspended into a
smaller volume of medium. Counting the cells with a haemocytometer allowed seeding
densities to be approximated prior to each experimental investigation. All cells were
seeded at a density of 3x 10⁴ (unless stated), in a 24 well plate. Each treatment group
contained three wells and the plates were left overnight in growth medium before the
investigation.
3.2.3. Characterisation of the Cells
3.2.3.1. Dual Labelled Imaging
Cells were seeded (1x 10⁵) overnight in a 35 mm glass bottom culture dish (MatTek
Corporation). After washing with PBS, cells were fixed in 2% paraformaldehyde (in
PBS) for 15 min. Cells were then washed with PBS prior to 10 min incubation with
Triton X-100 (0.1%). PBS containing Rhodamin-Phalloidin (1 µg/ml) and Hoechst
33342 (0.5 µg/ml) were used for the staining (15 min room temperature) of the
myofilaments and nucleus respectively. The fluorescent imaging was done with a
widescope microscope (Leica, DMIRB) at x63 magnification.

132
3.2.4. In Vitro Models of Cell Injury
3.2.4.1. Experimental Design and Treatment Groups
Two methods were used to induce cell death and injury. The first study used the
metabolic inhibitor 2-deoxyglucose (2-DG) and an ionic composition similar to that of
extracelluar ischaemic conditions (Esumi et al., 1991). This was composed of (in mM),
NaCl 137, KCl 12, MgCl2 0.49, CaCl2 0.9, HEPES 4, 2-DG 10, sodium lactate 20,
adjusted to a pH of 6.5 (with NaOH). The removal of glucose and its replacement with
its analogue 2-DG was intended to arrest metabolism by inhibiting hexokinase (Horton
et al., 1973). The addition of sodium lactate, lowering of the pH and the high K+
content (hyperkalemia) imitates the extracelluar conditions in the heart exposed to
ischaemia (Brar et al., 2000). Lack of blood and oxygen are needed for the term
‘ischaemia’ to be used, strictly speaking, but this solution was designated as ‘ischaemia-
mimicking’ within this study. A modified Krebs-Henseleit solution (in mM, NaCl 137,
KCl 3.8 mM, MgCl2 0.49, CaCl2 0.9 mM, HEPES 4, D-Glucose 10) adjusted to pH 7.4
(with NaOH), was used as the physiological buffer. This was given to the control group
as a time-matched control, as the pre-treatment solution and for the ‘reperfusion’ period
where metabolism was restored for 2 hours (designated restoration period). Both
solutions were prepared prior to each experiment, sterilised with 0.2 µm syringe filter
(Corning) and pre-heated to 37oC. Preliminary studies without replication over a period
of 2 to 24 hours (data not shown) had determined that a minimum of 14 hours of the
ischaemic solution and 2 hours of restoration were needed to reduce the cell viability
(assessed with an MTS assay) to below 50%.
The second study involved mimicking the oxidative stress that occurs during an
I-R insult. Large generation of oxidative stress can lead to necrotic and apoptotic cell
death (Brookes et al., 2004). A longer period of 24 hours was used to mimic other

133
investigations with no restoration period (Zhu et al., 2007). A manufactured DMEM
medium that had the exclusion of glucose, pyruvate and serum with the addition of
H2O2 was used to induce cell injury. The control group for this study was the no
glucose/serum DMEM that excluded the H2O2, as preliminary investigation revealed a
50% reduction in cell viability by substrate withdrawal alone. The addition of H2O2
further reduced cell viability. The H2O2 concentration reported within the literature that
inflicts cell damage ranges between 20 µM to 200 µM or even higher (Zhu et al., 2007;
Peng et al., 2010). A concentration gradient within the ranges used by Zhang et al.
(2007) of 20-50 µM was initially investigated and it was determined that 40 µM was
sufficient to reduce cell viability by another 50%. Further details of the treatment
groups and the concentration used for each of the drugs are given below. All solutions
were prepared in sterile tubes and pre-heated to 37oC.
Study 1: Metabolic inhibition and ischaemia-mimicking solution
All cells including the controls were washed once with PBS prior to an hour of pre-
treatment with a physiological buffer and the respected agents. The physiological
solution was replaced with the ischaemia-mimicking solution for 14 hours. Restoration
of metabolism was initiated by the replacement of a physiological buffer and included
changes for the control. The drug treatments included (figure 3.1): two concentrations
of the CaMKII inhibitor KN-93 (1 and 5 µM), its inactive analog KN-92 (5 µM), two
concentrations of AIP (40 and 200 nM), and a DMSO control equivalent to the highest
dissolved concentration (0.07%). Cell viability was assessed by a colorimetric assay
and involved an MTS reagent added to all wells for 2 hours, before being analysed by a
multiplate reader (see section 3.2.4.2).

134
Ischaemia-mimicking solution Restoration
Study 1
1. Physiological solution
2. I-R Control
3. KN-93 (1 µM)
4. KN-93 (5 µM)
5. KN-92 (5 µM)
6. DMSO control (0.07%)
7. AIP (40 nM)
8. AIP (200 nM)
Time (hrs) -24 -1 0 14 16 18
MTS
assay
Seed
Cells
Pre-
Treatment
MTS
reagent
Figure 3.1: Timeline of the experimental procedures for study 1. Cells were seeded
in three wells (all treatment groups were on one 24 well plate) for each treatment group
the day before the experiments. All groups were washed and subjected to their
respective 1 hour pre-treatment in physiological solution. The ischaemia-mimicking
solution including the respective treatment drugs or controls were applied to the cells
for 14 hours. Restoration of metabolism was instigated for 2 hours prior to the addition
of the MTS reagent for a further 2 hours. This enabled the measurements of activity of
dehydrogenase enzymes to determine cell viability. The experiment was performed on
three separate occasions.
Study 2: Oxidative Stress and Glucose Deprivation
A 10 mM H2O2 solution was freshly made with the no glucose DMEM, from a 30% w/v
H2O2 stock solution (Fisher Scientific). Stock concentrations of the drugs and the 10
mM H2O2 solution were then added to the no glucose DMEM to make a final 40 µM
H2O2 solution with the treatment groups (figure 3.2) respective drug concentrations.
After one wash with PBS the cells were incubated for 24 hours with the oxidative stress
solution. The MTS assay was then performed as described below.
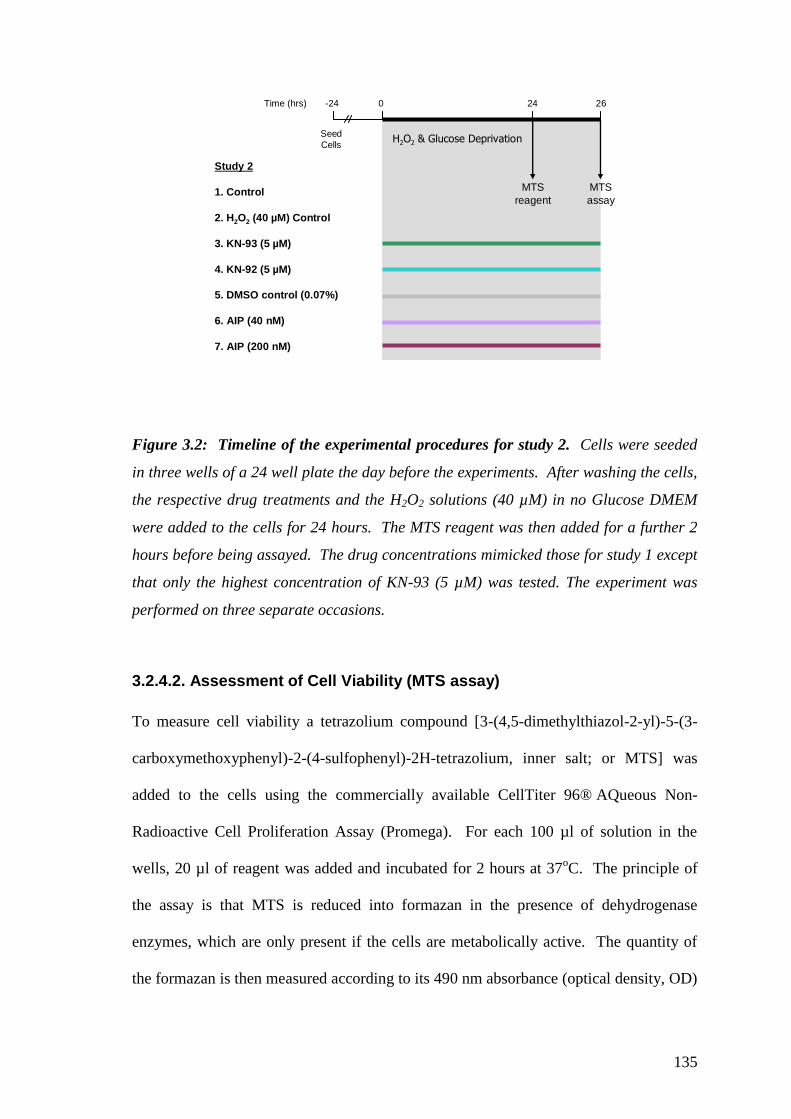
135
Study 2
1. Control
2. H2O2 (40 µM) Control
3. KN-93 (5 µM)
4. KN-92 (5 µM)
5. DMSO control (0.07%)
6. AIP (40 nM)
7. AIP (200 nM)
H2O2 & Glucose Deprivation
Time (hrs) -24 0 24 26
MTS
assay
Seed
Cells
MTS
reagent
Figure 3.2: Timeline of the experimental procedures for study 2. Cells were seeded
in three wells of a 24 well plate the day before the experiments. After washing the cells,
the respective drug treatments and the H2O2 solutions (40 µM) in no Glucose DMEM
were added to the cells for 24 hours. The MTS reagent was then added for a further 2
hours before being assayed. The drug concentrations mimicked those for study 1 except
that only the highest concentration of KN-93 (5 µM) was tested. The experiment was
performed on three separate occasions.
3.2.4.2. Assessment of Cell Viability (MTS assay)
To measure cell viability a tetrazolium compound [3-(4,5-dimethylthiazol-2-yl)-5-(3-
carboxymethoxyphenyl)-2-(4-sulfophenyl)-2H-tetrazolium, inner salt; or MTS] was
added to the cells using the commercially available CellTiter 96® AQueous Non-
Radioactive Cell Proliferation Assay (Promega). For each 100 µl of solution in the
wells, 20 µl of reagent was added and incubated for 2 hours at 37oC. The principle of
the assay is that MTS is reduced into formazan in the presence of dehydrogenase
enzymes, which are only present if the cells are metabolically active. The quantity of
the formazan is then measured according to its 490 nm absorbance (optical density, OD)

136
by a plate reader (Dynex Technologies, UK). A blank well that contains no cells and
thus no dehydrogenase, is created to measure the background absorbance of the culture
medium or the solution that the cells are present in. The equation below was then used
to calculate the cell viability for each of the treatment groups by comparing them to the
time-matched controls.
Mean OD of treated cells – Mean OD of blank (x 100) = Cell Viability
Mean OD of control cells – Mean OD of blank (as a % of control)
To determine the efficacy of the MTS assay in measuring cell viability and
death, a supplementary study was performed. This involved a comprehensive analysis
of cell death and viability during three similar time periods (14, 15 and 16 hours) of
simulated ischaemia used in study 1. These time periods identify a threshold of injury
for the H9c2 cell line, as extending the ‘ischaemic’ period by one or two hours
substantially increased the injury sustained by the cells. Figure 3.3 shows a timeline of
the cells subjected to 14, 15 or 16 hours of the ischemia-mimicking solution and then
two hours of restoration. Three measurements were then undertaken for these cells.
The MTS assay as previously described was initiated in three wells with a sample from
each of these wells also being used for the LDH assay (see next section). Three more
wells undergoing the same treatments were kept for measurements of the cells by
Trypan blue exclusion (described below).

137
Cell Viability & Death
1. 14 hours
2. 15 hours
3. 16 hours
Time (hrs) -24 -1 0 14/15/16 +2 +2
MTS
assay
Seed
Cells
Pre-
Treatment
MTS
reagent
LDH
assay
Trypan
Blue
count
Ischaemia-mimicking solution Restoration
Figure 3.3: Timeline for the cell viability and death comparison. Cells were treated to
same ischaemic solution as study 1 for 14-16 hours and then 2 hours of restoration.
Three measurements were used to determine the extent of cellular injury inflicted by the
different indexes. The MTS and LDH assay were performed from the same wells whilst
additional wells were plated for the trypan blue count.
3.2.4.3. Trypan Blue Exclusion
A viable cell will hold an intact cell membrane and thus will exclude dyes such as
trypan blue. Although it is an indirect measurement of cell viability, as the cell may
have lost its capacity to function even though the membrane is intact, it is a popular
method to count the number of viable cells within a population. Three wells were
designated for this measurement. The medium and cells for each individual well was
collected (by adding 250 µl TrypLE Express) and centrifuged at 18000 x g for 5 min.
The supernatant was discarded and the cell pellet was re-suspended in 50 µl medium
without serum. 50 µl of trypan blue (0.4%, Sigma-Aldrich) was then mixed with the
cell suspension and left for precisely 3 minutes. A cell count was then initiated on a
microscope using a haemocytometer. The unstained (viable) and stained (nonviable)
cells were then counted and calculated as a percentage of viable cells. After
centrifugation and resuspension, the total number of cells counted within the wells
treated to the ischaemic-mimicking solution was approximately 15% lower than the
wells treated with the physiological solution. This indicates that a portion of the cells

138
had been completely degraded or were otherwise non-collectable and were not
accounted for within this analysis. This is an inherent limitation of the technique since
the cells that are counted are always still intact.
3.2.4.4. LDH Assay
When the sarcolemma is ruptured during necrotic cell death a stable cytosolic enzyme
lactate dehydrogenase (LDH) is released into the solution. The CytoTox 96® Non-
Radioactive Cytotoxicity Assay (Promega) measures the released LDH by reduction of
a tetrazolium salt into a red formazan product. As a positive control, lysis buffer (to
stimulate 100% cell death, 9% v/v Triton X-100) is added to one group of time-matched
controls. After the 2 hour restoration period, 50 µl was taken from each well and added
to a 96 well plate. A further 50 µl of the LDH assay was added to each well for 30
minutes before the reaction was terminated by another 50 µl of stop solution (1M acetic
acid). The absorbance (490 nm) of each well was then recorded on a plate reader and
expressed as a percentage of the positive control (or complete cell death).
3.2.5. Statistical Analysis
All numerical data are presented as mean values ±SEM. The statistical software
PRISM® version 5.00 (Graphpad) was used to analyse all statistical data; with the
spreadsheet Excel (Microsoft) used for some of the data handling. Linear regression
analysis was performed to determine the relationship between the MTS assay and the
LDH assay or trypan blue counted cells. A one-way ANOVA compared the mean
scores of all treatment groups within each study, followed by a post hoc analysis
(Newman-Keuls test). A probability level of 5% (p<0.05) was defined as the level of
significance.

139
3.3. Results
3.3.1. Characterisation of Cells
Imaging of H9c2 cells
Bright field and dual labelled images (nucleus and myofilaments) of the H9c2 cells
were captured on a widescope microscope (figure 3.4). The bright field images depict
the mononucleated myoblast as a flat two dimensional cell with an outer membrane.
Figure 3.4A also shows that they link to each other by cytoplasmic bridges when
grouped close to one another. As originally described by Kimes and Brandt (1976), the
nucleus contain two to four prominent nucleoli. Staining for the actin filaments with
rhodamine-phalloidin enhances the structural dimensions of the cell. It makes obvious
the spindle-shaped structure of the cells which also organise in linear parallel array
when grouped together. Nuclear staining brings out the single nuclei in each myoblast.
Figure 3.4C is an example of the myoblasts immediately after cell division. These cells
have lost their spindle shaped structure and appear more like embryonic cardiac
myocytes.

140
Figure 3.4: H9c2 cells fixed and dual labelled with Rhodamin-Phalloidin and
Hoechst 33342. (A) Brightfield image of two H9c2 myoblasts. (B) H9c2 cells grouped
together or (C) after proliferating, captured by (1) brightfield image, (2) Rhodmain-
Phalloidin stained for actin filaments, (3) Hoechst 33342 staining for the nucleus, (4)
merged fluorescence images. All captured on a widescope microscope (Leica, DMIRB)
x63 magnification. White bar measures 15 µm.
(A)
(B1)
(B2)
(B3)
(B4)
(C1)
(C2)
(C3)
(C4)
141
3.3.2. Extent of Cell Injury After Periods of Simulated I-R Injury
Three different techniques were used to determine the viability of the cells after being
subjected to a period of simulated I-R. Preliminary investigations indicated that the
cells had a critical threshold for cellular injury when introduced to the ischaemic
solution (high sodium lactate, high K+, acidosis and 2-DG). As shown in figure 3.5A,
this threshold time was 14 hours of simulated ischaemia. When the mean data for the
four separate experiments were analysed, the viability of the cells as determined by the
MTS assay revealed that 14 hours (24.7 ± 13.5%) and 16 hours (24.5 ± 14.7%) of
simulated ischaemia were comparable in effect. When the cells were subjected to
trypan blue staining, which discloses the cells that do not have an intact cell membrane,
there was also only a small rise in cellular injury after the additional 2 hour period (62.7
± 16.4% vs. 73.8 ± 17.0%, not significant). The LDH assay, which measures the extent
of cells that have released their intracellular content, had a considerable increase during
the additional couple of hours (28.5 ± 6.7% vs. 63.0 ± 16.0%, p = 0.0943).
What is also evident from these data sets is the extent of variability that was
present within the cell preperations. A high MTS assay score of 64-67% was recorded
for one out of the four experiments in each of the time periods. This corresponded to a
lower amount of released LDH (10-17%) or the trypan blue counted cells (14-46%).
Thus, linear regression analysis was performed to compare the viability of cells
measured by an MTS assay with the two measurements of cell membrane integrity
(figure 3.5B). The LDH assay (r2 = 0.6203, p<0.0024) and the trypan blue count (r
2 =
0.8630, p<0.0001) had a significant correlation with the MTS assay. The negative
relationship indicates that when the MTS assay was reported to be low, it corresponded
with a high proportion of released LDH and an even higher proportion of trypan blue
staining.

142
14 15 160
20
40
60
80
100
0
20
40
60
80
100
MTS viability LDH release Trypan Blue
Hours of Metabolic Inhibitionprior to the 2 hours restoration period
MT
S C
ell V
iab
ilit
y
(% o
f C
on
tro
l)
Cell In
jury
dete
rmin
ed
by L
DH
rele
ase
an
d T
ryp
an
Blu
e e
xclu
sio
n
(% o
f Co
ntro
l)
0 20 40 60 800
20
40
60
80
100
LDH releaseTrypan Blue uptake
0.6203
0.8630
MTS score (% of matched control)
% o
f C
on
tro
l
Figure 3.5: The viability of H9c2 cells was determined after 14-16 hours of simulated
ischaemia and 2 hours restoration by MTS assay, LDH release and trypan blue
exclusion. Cells were seeded in 24 well plates and subjected to the I-R protocol the day
after. Three wells were used for each analysis that was performed on four separate
occasions. (A) Mean ± SEM data from four experiments for each of the ischaemic time
periods. (B) Linear regression of the cell viability determined by an MTS assay and the
trypan blue uptake (r2 = 0.8630) or LDH release (r
2=0.6203) in each individual
experiment.
(A)
(B)
143
When the cells maintained considerable viability, the cell membrane also maintained its
integrity. Stages of cell injury are also apparent within the data. When the metabolic
activity of the cell is low, the first sign of further injury is the uptake of trypan blue
staining. This is then followed by the complete rupture of the membrane that would
have allowed the release of intracellular contents such as LDH. The critical time point
for this complete rupture was at 14-15 hours of simulated ischaemia. The extent of
injury after 16 hours was considered too lethal for the cells with 15 hours also
containing much variability. As such, 14 hours ischaemia was considered as a suitable
index insult to reduce cell viability and produce a significant amount of sarcolemmal
injury, but with little variability in the LDH release.
3.3.3. Inhibition of CaMKII During Simulated I-R Injury
The H9c2 cells were subjected to 14 hours of simulated ischaemia with 2 hours of
restoration, in the presence or absence of CaMKII inhibitors/KN-92 (figure 3.6). The I-
R control (38.67 ± 13.8%), KN-92 treated cells (40.27 ± 13.6%) and the control for
DMSO (38.73 ± 14.7%) showed similar cell viability. There was some variability
within these groups as demonstrated by the high SEM. A one-way ANOVA did not
detect any significant difference between these controls and of those cells treated with
the CaMKII inhibitors KN-93 or AIP. The two concentrations of KN-93 at 1 µM
(42.60 ± 6.3%) and 5 µM (45.77 ± 5.4%) did not result in any difference to the controls
but were associated with less variability. The presence of AIP (40 nM) had the lowest
variability of all the treatment groups (54.17 ± 2.3%) and had a mean difference of
15.5% in its cells viability when compared to the I-R controls, but this was not
significant. Treatment with the higher concentration of AIP (200 nM), also resulted in

144
increased cell viability (51.10 ± 14.3%) after the I-R insult, but was associated with the
same high variability as the controls.
Contr
ol
I-R C
ontrol
M)
KN-9
3 (1
M)
KN-9
3 (5
M)
KN-9
2 (5
DM
SO C
ontrol
AIP
(40n
M)
AIP
(200
nM)
0
50
100
Cell S
urv
ival
(% o
f C
on
tro
l)
Figure 3.6: Viability of H9c2 cells after 14 hours of ischaemic mimicking solution
and 2 hours restoration with/without the presence of CaMKII inhibitors. H9c2 cells
were seeded in 24 well plates overnight. After pre-treatment for 1 hour with
physiological buffer and their respective treatment drugs, the cells were introduced to
14 hours of ischaemic solution and 2 hours restoration also in the presence of the
CaMKII related agents. Cell viability was then determined by an MTS assay. A one-
way ANOVA detected no significant difference between the I-R control and the drug
treatments. The data are for three separate experiments (N = 3).

145
3.3.4. Inhibition of CaMKII During Oxidative Stress
A preliminary investigation determined that H9c2 cells treated with a medium
containing no serum and glucose (XG DMEM) for 24 hours reduced the viability
(determined by an MTS assay) of the cells to 46.9% (figure 3.7A). Injury was
augmented by the addition of H2O2 (40 µM). This is presented in figure 3.7B as a
percentage of the cells treated with only XG DMEM. As such, the viability of these
cells within the new injury control group was halved (48.7 ± 5.4% of XG DMEM) by
the additional treatment with oxidative stress.
The presence of the CaMKII inhibitors did not prevent any significant amount
(determined by one-way ANOVA) of cellular injury, as a high concentration of KN-93
(5 µM) had a similar survival rate (47.8 ± 6.3%) to the injury control, whereas the AIP
treated cells were also not different. However, when all the groups means were
compared to one another (one-way ANOVA), the cells treated with both concentrations
of AIP were significantly less injured than the KN-92 (5 µM) treated cells. AIP at 40
nM also had the highest mean score (62.0 ± 4.7%) of all treatment groups, whilst a 5-
fold increase in AIP concentration (200 nM) produced a similar cell viability, but with
lower variability (59.3 ± 1.3%). However, although AIP-treated cells had higher
viability than the Injury Control cells, the differences were not statistically significant.
The DMSO control was not significantly different to any of the treatment groups (53.6
± 2.7%).

146
Figure 3.7: The viability of H9c2 cells determined by MTS assay after 24 hours of
H2O2, glucose/serum deprivation and CaMKII related agents. Cells were seeded in 24
well plates (3 wells per group) and subjected to oxidative stress and glucose/serum
deprivation (XG DMEM) for 24 hours. (A) Cell viability with the XG DMEM (n=2
seperate experiments). (B) Cell viability, expressed as a percentage of viability in the
XG DMEM group, is further reduced with the addition of 40 µM H2O2 (injury control).
CaMKII inhibitors KN-93 and AIP did not limit injury when compared to the injury
control. But both AIP concentrations were significantly different to the KN-92 treated
cells (n = 3 seperate experiments). XG DMEM, no glucose DMEM. (*P<0.05 one-way
ANOVA followed by Newman-Keuls post test).
(B)
(A)

147
3.4. Discussion
The study’s major findings can be summarised as follows:
- The small molecule CaMKII inhibitor, KN-93, or the more specific peptide inhibitor,
AIP, did not promote H9c2 cell viability after periods of simulated I-R or oxidative
stress. Thus, the original hypothesis that CaMKII inhibition would promote cell
viability in an in vitro model of cellular injury can be rejected.
- The cells treated with 40 nM AIP attained a higher mean viability score than all the
other treatment groups in both models of cellular injury, but this was deemed
statistically non-significant. This could indicate that some of the cellular stress might
have involved CaMKII activity, but as a high concentration of KN-93 did not match
such readings, further investigations and different methods of analysis would be needed.
- There was more variability (demonstrated by an increase in SEM) when the H9c2 cells
were treated to simulated I-R than when they were treated with oxidative stress. This
was not due to the methods used to analyse cell viability as three separate techniques
demonstrated similar amount of variability. As some of the treatment groups that
included CaMKII inhibitors reduced the variability, it is possible that an intracellular
signalling component contributed to these differences.

148
3.4.1. CaMKII Inhibition Does Not Promote H9c2 Cell Viability
The two models of cellular injury used in this study were designed to mimic the
conditions that occur in the in situ heart during ischaemia and subsequent reperfusion.
In doing so it was hypothesised that CaMKII activity and cellular injury would be
promoted and that they were both related. The conditions used in the studies have
previously been documented to promote cell injury and death (Esumi et al., 1991; Zhu
et al., 2007). This was replicated within these studies as less than 50% of the cells were
viable at the end of the experiments. However, the same pathological conditions have
been reported to exacerbate cellular injury through the activity of CaMKII (Vila-Petroff
et al., 2007; Zhu et al., 2007). This was not repeated in these models as the presence of
two different CaMKII inhibitors throughout the periods of cellular injury did not
promote a significant increase in cell viability. Thus, it can be concluded that when
H9c2 cells are exposed to simulated I-R or the combination of oxidative stress and
substrate deprivation, there is no involvement of CaMKII activity in the cellular injury.
The previous studies that have suggested a pro-injurious role of CaMKII during
cellular stress have not used the H9c2 cell line. Cells are either derived from the adult
(Zhu et al., 2007; Sapia et al., 2010) or neonatal hearts (Peng et al., 2010). The detailed
study by Hoch et al. (1998) demonstrated that CaMKIIδC is the prominent isoform in the
H9c2 myoblasts. CaMKIIδC targets the Ca2+
handling proteins in the cytosol and has
been made accountable for instigating cell death (Zhu et al., 2007; Peng et al., 2010).
Thus, as H9c2 cells maintain their ability to contract (Kimes and Brandt, 1976) and
respond to different Ca2+
agents that can stimulate apoptosis (Lax et al., 2005; Lax et
al., 2006) an active CaMKIIδC could have been expected in these cells. Nevertheless, as
the cells were unstimulated during the study, the lack of E-C coupling and Ca2+
cycling

149
activities might have made this isoform less active in comparison to cells that are
isolated from the whole heart.
If the cells did possess sufficient protein levels of CaMKII, the cellular stress
instigated within these studies would be expected to activate the kinase. Acidosis,
hyperkalemia and oxidative stress are known activators of CaMKII (Zhu et al., 2007).
When compared to the injury controls there was an insignificant increase in mean cell
viability when cells were treated with AIP (40 nM) after I-R (mean difference of 15.5%)
and oxidative stress (mean difference of 13.33%). These differences were above the
protective ranges demonstrated by the CaMKII inhibitors of Zhu et al. (2007). They
reported that KN-93 (2 µM) and AIP (5 µM) prevented apoptosis (<10 % of TUNEL
positive cells) in cardiac myocytes isolated from 2-3 months old rat hearts that were
subjected to 24 hours of acidosis (pH 5.5), hyperkalemia (K+ 60 mM) or oxidative stress
(H2O2 20 µM). Except for the concentration of H2O2, the individual components chosen
by Zhu et al. (2007) were more extreme than the conditions chosen in this study and
were more reliable in producing cellular injury. On the other hand, the H9c2 cells had
acquired sufficient cell injury within the models used in this study. But the variation
between experiments deemed the results not statistically significant. The only
exception was with the KN-92 treated cells which had a significant decrease in cell
viability after treatment with H2O2 if compared to the AIP treated cells. As the cells
were also treated with a high concentration of KN-93 (5 µM) and showed no clear
relationship between or within the pharmacological modulators of CaMKII, it would
support the fact that CaMKII could not have been a major factor for cellular injury
within the H9c2 cells.

150
3.4.2. The H9c2 Cells as a Model of I-R Injury
After 14 hours of simulated I-R injury the viability of the H9c2 cells had been reduced
to 38.67 ± 13.8% when measured by MTS assay. Measuring viability by trypan blue
exclusion or by LDH assay had determined that although some cell membrane integrity
had been lost, the majority of the cells had not undergone complete rupture that is
characteristic of cell death by necrosis. The MTS assay had a strong correlation with
the trypan blue measurements and would have been sufficient to demonstrate if the cells
had irreversible damage. Thus if the kinase had any significant involvement with the
resulting cell injury, this should have been detected in the measurements of cell viability
used in the study. Whether these measurements were also sensitive enough to
determine if the CaMKII inhibitors were protective against apoptotic signalling
pathways would require further investigations.
Secondary cell lines and immature cardiac myocytes are more resistant to
cellular stress than adult cardiac myocytes (Marber, 2000). It has also been suggested
that programmed cell death in embryonic cells is caspase dependent and that as they
develop to terminally differentiated cardiac myocytes they move to a caspase-
independent death pathway (Bahi et al., 2006). Although this theory challenges many
studies that have shown at the cellular (Uchiyama et al., 2004; Stephanou et al., 2001)
and the whole heart level (Mocanu et al., 2000; Holly et al., 2002) that adult cardiac
myocytes can instigate significant cell death through caspases, it could be suggested that
cell injury in this study was different to those that have previously investigated the
involvement of CaMKII through a caspase dependent pathway. The H9c2 cells have
shown to have both a caspase-dependent and a caspase-independent pathway to cell
death (Bahi et al., 2006). As the models used in this study included several factors that
could have determined cell viability it can not be certain which mechanisms were

151
relevant to cell injury. There is some inconsistency reported in the literature as Uetani
et al. (2009) prevented H9c2 cells from apoptosis during hypoxia treatment with a
caspase-3 inhibitor, but Aki et al. (2001) who used similar conditions saw no effect with
a pan-caspase inhibitor. When Yaglom et al. (2003) subjected H9c2 cells to a metabolic
inhibitor rotenone, rapid ATP depletion and cell death (within 4 hours) could also not be
prevented by caspase inhibitor and were characteristic of necrosis. But the inhibition of
the JNK pathway was capable of reducing rapid cell death by limiting the extent of
mitochondrial depolarisation. Jung et al. (2007) also used 2-DG and hypoxia to report
that JNK and p53 are the main effectors of H9c2 viability. CaMKII has been associated
with the p38MAPK pathway during conditions of oxidative stress in adult cardiac
myocytes (Palmoeque et al., 2009), but it has not been determined if it has any
involvement with the JNK pathway. Yet, when H9c2 cells were treated with H2O2 it
was reported to stimulate cell death through a caspase-dependent pathway (Youn et al.,
2005). Although this model of cellular injury showed the strongest trend of protection
by the CaMKII inhibitor AIP, in this study, it was surprising to see how little influence
the CaMKII inhibitors had over the fate of the H9c2 cells.

152
3.5. Conclusion
The presence of the CaMKII pharmacological inhibitors KN-93 or AIP did not promote
the viability of the H9c2 cells when they were subjected to simulated I-R or oxidative
stress. This would suggest that the patterns of injury sustained by the cells in both these
models were not promoted by CaMKII activity. Similar models of cell injury have
found the same pharmacological inhibitors of CaMKII to promote cell viability. But
these studies used primary cell lines and not a secondary cell line that lacks contractile
activity. Further studies determining the levels of CaMKII activity are needed to
determine whether the H9c2 cell line would be a suitable model in investigating the role
of CaMKII and cellular injury.

153
CHAPTER 4:
The Measurement of Ca2+
Transients in Adult Rat Ventricular Cells During Simulated I-R
and CaMKII Inhibition

154
4.1. Introduction
4.1.1. Ca2+ handling During Ischaemia-Reperfusion
A key feature of I-R injury is the failure to maintain intracellular Ca2+
homeostasis that
can trigger arrhythmic activity and cell death (Piper et al., 1999; Dong et al., 2006;
Luqman et al., 2007). During ischaemia, Ca2+
overload will occur just prior to the onset
of contracture (Barry et al., 1987; Eisner et al., 1989). Imbalances in ion transport
through the Na+/K
+-ATPase, NHE and NCX are thought to be central to the
accumulation of Ca2+
(Talukder et al., 2009) that is always preceded by a rise in [Na+]i.
The conditions at reperfusion also favour mishandling of Ca2+
which increases the
likelihood of arrhythmic activity (Murphy and Steenbergen, 2008; Talukder et al.,
2009). In both circumstances, the relationship between the SR and the mitochondria is
critical to how the cells will handle [Ca2+
]i (Dorn and Scorrano, 2010; Ruiz-Meana et
al., 2010). Both organelles act as buffering sinks to the rising [Ca2+
]i, but if the
mitochondria are compromised too much, opening of the mPTP and cell death is
inevitable (Halestrap, 2009).
It has been established over many years that Ca2+
uptake by the SR is impaired
during I-R (Lee et al., 1967; Toba et al., 1978; Osada et al., 2000). Models that have
genetically modified SERCA2a (either through abrogation or gain-of-function)
demonstrate that if uptake of Ca2+
into the SR is promoted, a reduced [Ca2+
]i, better
contractile recovery and infarct limitation are possible (Talukder et al., 2009; Shintani-
Ishida and Yoshida, 2011). However, it has also been noted that this sequestered Ca2+
may encourage cell death and hypercontracture, as it is released by the SR during the
next oscillation (Piper et al., 2006). A recent study by Valverde et al. (2010) has shed
new light on the changes that occur to the SR Ca2+
handling ability during I-R. By

155
using pulsed local field fluorescence, intracellular Ca2+
measurements were recorded in
the in situ mouse heart during global ischaemia (12 min in duration) and reperfusion. It
was revealed that the Ca2+
content of the SR gradually increases during ischaemia.
Then at reperfusion, the overloaded SR releases its Ca2+
content contributing to Ca2+
overload in the cytosol.
Many cell based models have suggested that the SR has a physiological
threshold for sequestration of Ca2+
(Lakatta, 1992; Jiang et al., 2004; Eisner et al.,
2009). When this upper limit of Ca2+
content is surpassed, diastolic events of
spontaneous Ca2+
release will occur from the RYR2 in the form of Ca2+
‘sparks’ and
propagating Ca2+
waves (Eisner et al., 2009). The generation of Ca2+
‘sparks’ from the
SR are believed to be caused by a small group of RYR2 or IP3R. These local Ca2+
events can raise the cytosolic [Ca2+
]i to ~200 nM (Cheng and Lederer, 2008).
Numerous sparks can propagate an event of CICR through the cell that emerges as a
Ca2+
wave (Bootman et al., 2001). If the Ca2+
activity is enough to generate an inward
current through the NCX it can lead to a pro-arrhythmic event such as an
afterdepolarisation (Eisner et al., 2009).
There has been much debate with respect to the interrelationship between the SR
Ca2+
load, its sequestered threshold and the activity of the RYR2 open probability (Po)
that is needed to stimulate a diastolic event. Many factors present during ischaemia,
such as oxidative stress and acidosis, have also been shown to limit the release rate of
Ca2+
through the RYR2 (Xu et al., 1996; Choi et al., 2000). An interesting study by
Yang and Steele (2001) measured the Ca2+
spark activity of rat ventricular myocytes in
an environment of reduced ATP content. They measured a reduction in the Ca2+
spark
frequency that subsequently caused an increase in the SR Ca2+
content. Thus, although
Ca2+
load in the SR was increased, ATP was a strong determinant of the spontaneous

156
Ca2+
release through the RYR2. Similar findings have been reported in a model using
metabolic inhibitors (Overend et al., 2001). These studies could explain why the
abnormal loading of Ca2+
into the SR was measured in a model of global ischaemia by
Valverde et al. (2010). However, what was also suggested by Yang and Steel (2001)
was that although the frequency of Ca2+
sparks was decreased, the magnitude of the
diastolic event to trigger arrhythmic activity (i.e. ischaemic arrhythmias) would be
greater. Accordingly, the various facets of ischaemia influence the activities of the SR
and its Ca2+
handling ability but it is still to be determined whether promoting or
discouraging these activities is beneficial under such conditions.
4.1.2. Ca2+ Handling by CaMKII During I-R
CaMKII could be foreseen to influence several factors during I-R injury, but its activity
on the cell’s Ca2+
handling ability is currently the best described (Hudmon and
Schulman, 2002; Maier and Bers, 2007). Yet, there is a lack of research on how
CaMKII influences the Ca2+
handling properties of cells during I-R. Dhalla’s studies
suggested that deterioration in CaMKII activity during I-R matched the same decline in
the Ca2+
handling ability of the isolated SR vesicles (Netticadan et al., 1999; Osada et
al., 2000). However, the significant reduction in infarct size with KN-93 pre-treatment
in Chapter 2 and the work of others (Vila-Petroff et al., 2007; Erickson et al., 2008)
suggest that CaMKII activity during I-R promotes irreversible injury. Mattiazzi’s
studies suggested that CaMKII activity through the reverse mode of the NCX causes
cellular injury during the first minutes of reperfusion. The study by Vila-Petroff et al.
(2007) used the fluorophore Indo-1 to record the Ca2+
activity of quiescent cardiac
myocytes subjected to simulated I-R protocol. Treatment with the CaMKII inhibitors
KN-93 (1 µM) or AIP (1 µM) prevented reperfusion injury by limiting the occurrence

157
of large and spontaneous Ca2+
oscillations that would have otherwise caused membrane
rupture and cell death. The key mechanism of protection with CaMKII inhibition was
suggested to be prevention of the phosphorylation of the Thr17
site on PLB.
Phosphorylaton would increase SERCA2a activity and promote SR Ca2+
overload.
There was no reference to the Ca2+
handling properties during ischaemia and whether
Ca2+
overload prior to reperfusion was also prevented. Yang et al. (2006) reported
similar findings to Mattiazzi’s studies with their genetically modified AC3-I mice. This
method of targeting CaMKII activity reduced the SR Ca2+
content making them less
susceptible to MI induced apoptosis. As PLB ablation (and increased SERCA2a
activity) removed the protection, it was strongly suggested that this was CaMKIIs’
primary target. Other in vitro models of sustained CaMKII activation have also
supported the hypothesis that promoting SR Ca2+
uptake and overload is a key
mechanism of cellular death (Zhu et al., 2003).
Whether uncontrolled activity on the RYR2 can contribute to cytosolic Ca2+
overload during the ischaemic period is questionable, but studies have focused on the
RYR2 as a pro-arrhythmic target for continued CaMKII activity. In conditions of
systolic dysfunction such as heart failure, increased RYR2 activity would promote
unregulated Ca2+
release. An interesting observation is that by preventing CaMKII
activity, either pharmacologically or by genetic manipulation, a reduced Ca2+
spark
frequency (and subsequently the occurrence of arrhythmias) have resulted in an
increased SR Ca2+
load (Ai et al., 2005; Sag et al., 2009). However, an earlier
investigation reported that under controlled conditions CaMKII inhibition with KN-93
reduced the SR Ca2+
load (Li et al., 1997).
An important element to these studies is the proportion or the fractional release
of Ca2+
into the cytosol to any given SR Ca2+
load (Trafford et al., 2001). In conditions

158
such as heart failure the sustained CaMKII activity may reduce the total Ca2+
content of
the SR, but it will (at least initially) also allow an augmented release of Ca2+
to maintain
the transients’ amplitude (Kohlhaa et al., 2006; Toischer et al., 2010). This can be
achieved via CaMKII facilitation on the LTCC and the RYR2. With subsequent
CaMKII inhibition, the SR fractional release of Ca2+
can be normalised due to limited
activities of these CaMKII targets. This is also the case when there is an increase in the
SR Ca2+
load. Although Ai et al. (2005) demonstrated the ability of KN-93 to
significantly increase the SR Ca2+
load, only minor inotropic effects and Ca2+
release
were measured as CaMKII targets on ion channels were also subdued. Thus, during
ischaemia the many factors (such as the NCX, LTCC and the SR) that force the
disproportionate cycling of Ca2+
and a rise in [Ca2+
]i will only have minor influence in
cells where CaMKII is inhibited. Whether CaMKII inhibition limits the initial rise in
[Ca2+
]i during ischaemia or whether it allows the cell to better handle this incursion
remains to be seen.

159
4.1.3. Hypothesis
The aim of these studies is to elucidate the protective role of CaMKII inhibition during
I-R injury and further characterise the pharmacological tools used in the thesis. By field
stimulating freshly isolated adult rat ventricular myocytes, their Ca2+
transients were to
be recorded under the influence of CaMKII inhibition, either during normoxic
conditions or in a model of simulated I-R injury. A new multi-parametric analytical
tool would analyse the activity of the baseline [Ca2+
]i and the Ca2+
transient’s
morphology, amplitude and kinetics in order to discriminate the cells Ca2+
cycling
ability under these conditions.
The main hypothesis:
Simulated ischaemia will have an adverse effect on intracellular Ca2+
homeostasis,
which will lead to a rise in the diastolic Ca2+
concentration.
It was also hypothesised that:
(i) The CaMKII inhibitor KN-93 and the peptide inhibitor AIP will have comparable
effects on the cells Ca2+
handling ability.
(ii) The non-specific activity of the KN compounds will have a comparable limitation on
the cells Ca2+
handling ability.
(iii) CaMKII inhibition during simulated ischaemia will promote cell viability and limit
the rise in diastolic Ca2+
concentration.
160
4.1.4. Specific Objectives
(A) Freshly isolate adult rat cardiac myocytes and determine suitable conditions that
would allow field stimulation to regulate their contractile activity.
(B) Load the cells with a suitable fluorophore in order to measure the cardiac myocytes’
Ca2+
transients.
(C) Find a suitable model that would allow the characterisation of the cells’ Ca2+
transients during a prolonged period of time.
(D) Develop a cell model of simulated I-R injury that would assess the interventions of
pharmacological CaMKII inhibition under such conditions.
(E) Use a new multi parametric analytical tool to analyse and characterise the cells’
Ca2+
transients.

161
4.2. Materials and Methods
The CaMKII organic inhibitor KN-93 (water soluble), the inactive analog KN-92 and
the cell permeable Autocamtide-2 related inhibitory peptide II (AIP) were purchased
from Calbiochem (Nottingham, UK). KN-92 and AIP were dissolved in DMSO (final
DMSO concentration in the solution was 0.05% and <0.006% respectively).
4.2.1. Isolation of Adult Rat Cardiac Myocytes
The isolation and culture of viable adult rat ventricular myocytes were radically
advanced in the late 1970’s. By using crude collagenase it became possible to
dissociate, with a greater viability of the cells, the strong and physically connected
intercalated discs and extracellular matrix (Powell and Twist, 1976). Prior to this,
trypsinisation that has no selectivity towards extracellular proteins and mincing of
younger hearts, including embryonic cardiac myocytes, was the method for harvesting
the cells (Harary and Farley, 1960). Embryonic and neonatal cells had an advantage in
allowing longer term culture but a key drawback was that they were physiologically
immature. This differentiation in their physiology and response to conditions such as
ischaemia were soon identified (Marber, 2000). The standard technique used in this
chapter was developed within the laboratory using the protocol from Sian Harding’s
laboratory (Jones et al., 1990).
Cell Isolation Procedure
All procedures leading to the excision of hearts from male Sprague Dawley rats (300-
400g) and their immediate cannulation on the Langendorff perfusion apparatus are
described in Chapter 2. The rig was modified with a peristaltic pump (Watson-Marlow,

162
Falmouth) that provided a constant volume of perfusate (10 ml/min), primarily to
regulate the flow rate during the enzymatic digestion of the connective tissue. The
raised reservoirs that supplied the constant pressure of perfusate in Chapter 2 were
replaced with 50 ml centrifuge tubes bathed in a 37oC water bath. The protocol then
followed similar methods described by Jones et al. (1990):
5 minutes perfusion with Krebs-Henseleit buffer (see Chapter 2); to resume
normal contractile activity and stabilise the heart.
5 min of a low Ca2+
perfusate (in mM: NaCl 120, D-glucose 20, KCl 5.4,
MgSO4 5, pyruvate 5, taurine 20, HEPES 10, nitrilotriacetic acid 5, CaCl2
0.014); bubbled with 95% O2 and 5% CO2. The combination of the Ca2+
chelator, nitrilotriacetic acid and the lowered CaCl2 concentration (predicted free
Ca2+
concentration of 0.9059 µM when calculated using a program for
determining free metal concentration http://maxchelator.stanford.edu) stops the
heart from contracting and lowers the intracellular Ca2+
concentration.
Minimum 10 min enzymatic digestion with recycled low dispase Liberase
(0.13 mg/ml, Roche Applied Science); contained in a similar perfusate to the
‘low Ca2+
’ solution with the exception of a higher Ca2+
concentration (200 µM)
and the absence of nitrilotriacetic acid, (in mM: NaCl 120, D-glucose 20, KCl
5.4, MgSO4 5, pyruvate 5, taurine 20, HEPES 10, CaCl2 0.2).
As soon as the heart was transferred to a petri dish inside a ventilated hood, all
conditions and materials were kept sterile. The right ventricle was removed and the
remaining left ventricular tissue was dissected into smaller pieces. Fresh enzyme
solution was passed through a 0.22 µm micro filter (Corning, USA) and added to the
sliced tissue before a magnetic stirrer separated the remaining suspension of cells at 200

163
rpm. As the supernatant from the first 5 min of stirring presented a large proportion of
rounded cells, it was discarded. The remaining tissue was then dissociated with a
further 15-30 minutes of stirring in new enzyme solution. Filtered through a wire sieve,
the second harvest contained the highest percentage of rod shape cells. This was
centrifuged for 1 minute, 1000 rpm at room temperature to form a pellet of dissociated
ventricular cells. The cells were then re-suspended in 3 ml of (1X) M199 media
(components listed in appendix 1.3; Sigma-Aldrich) containing additional metabolites
and antibiotics (in mM; pyruvate 2.5, creatine 5, taurine 5, insulin 10-7
M, penicillin 50
I.U.). As the Ca2+
concentration within the medium is 1.85 mM, this method rapidly re-
introduces Ca2+
to the cells. This eliminates the non-healthy and marginally Ca2+
tolerant cells. With this protocol a 40-50% population of rod shaped cardiac myocytes
was counted on a haemocytometer (from a total that included rounded cardiac
myocytes), which allowed the estimation of further seeding densities.
4.2.2. Confocal Laser Scanning Microscopy
The Leica TCS-SP5 RS Confocal Laser Scanning Microscope, based on a Leica DMI
6000 inverted microscope system, provided the platform to acquire detailed images of a
contracting myocyte and its Ca2+
oscillation. As shown in figure 4.1 the exciting laser
light will pass an acousto-optical tuneable filter (AOTF) and an acousto-optical beam
splitter (AOBS). This ‘tuneable’ device provides greater selectivity of the excitation
light (or wavelength) and enhances the resolution of the sample to be imaged. The
objective lens determines the field of view, magnification and resolution by focusing the
light transmission on the sample. The emitted light is then passed through a pinhole
that is conjugated to the determined focal point. This allows only the focused light to
reach the photodetection system, limiting the amount of blurring that is generated by the

164
out of focus light. A resonant scanner can oscillate mirrors that reflect the light at high
speed in order to scan or change the light direction. This enables fluorescent live cell
images to be captured at a rapid acquisition rate.
Laser
Pinhole
Beamspliter
Scanning
Mirrors
Eyepiece
Objective
Detector
Detector
Pinhole
Objective
Tube lens
Sample
Focal planeSample
Emission
light
Excitation
light
AOTFLaser
Pinhole
Beamspliter
Scanning
Mirrors
Eyepiece
Objective
Detector
Detector
Pinhole
Objective
Tube lens
Sample
Focal planeSample
Emission
light
Excitation
light
AOTF
Figure 4.1: Schematic diagram of Leica TCS-SP5 and the principal of confocal
imaging. (A) The Leica TCS-SP5 has acousto-optical components that can channel
(AOTF) and split the laser beams. The mirror arrangements can change the line scan
direction. With a resonant scanner this can be done at high-speeds that is suitable for
live cell imaging. The objective focuses the laser onto the sample and the emitted light
is captured on a photodetection system. (B) The key principal of a confocal microscope
is the ability to match the light excited by the objective with a pinhole. This limits the
amount of unfocused light emitted by the sample to be captured by the detector allowing
an enhanced resolution of the image (adapted from Demchenko, 2009).
(A)
(B)

165
Set-Up of the instrument
All experiments were recorded using: 40x oil-immersion objective (numerical aperture
= 1.4) in two dimensions (x,y) with time, 1280 x 256 pixels (pixel size: 189.39 nm x
189.95 nm), at a sample rate of 1 image per 49 ms. A large pinhole of 249.82 µm
compromises the ‘confocality’ of the microscope, but gives a deeper Z-slice and
provides the absorbance of Ca2+
to be conducted at a greater depth of field throughout
the cell. The 488 nm laser line from a class IIIb Argon laser running at 30% power was
selected to excite Fluo4 (Invitrogen) and the AOTF attenuated to 8% of the laser power
was selected whilst the photomultiplier tube (PMT) gain remained within the range of
820-860 V.
Choice of fluorophore
Fluo4 is a Ca2+
selective fluorescent probe favoured for its rapid imaging capabilities
(i.e. kinetics of Ca2+
binding/unbinding, high signal to noise range) and its excitation at
a single wavelength (488 nm) which is matched to the argon laser line. It was chosen as
the Ca2+
indicator, as it is an enhanced version of its predecessor Fluo-3. This includes
a brighter emission at equivalent concentration and a faster loading time. The Kd (Ca2+
)
is 345 nM and is ideal in quantifying cytosolic Ca2+
in the 100 nM to 1 µM range (Gee
et al., 2000). The high affinity for Ca2+
is based on the compound’s possession of a
calcium-specific polyaminocarboxylic acid, (1,2-bis(o-aminophenoxy)ethane-
N,N,N',N'-tetraacetic acid; BAPTA). However, one disadvantage of using such a
fluorophore is that the fluorophore can be saturated at low [Ca2+
] that would then give
errors in Ca2+
estimation (Takahashi et al., 1999). Calibration to known quantities of
[Ca2+
] was not implemented in these studies as they were designed as proof of concept
although semi-quantitative analysis could still be predicted, as the values are based on
the dissociation constant (Kd). A nonratiometric indicator will also not be able to
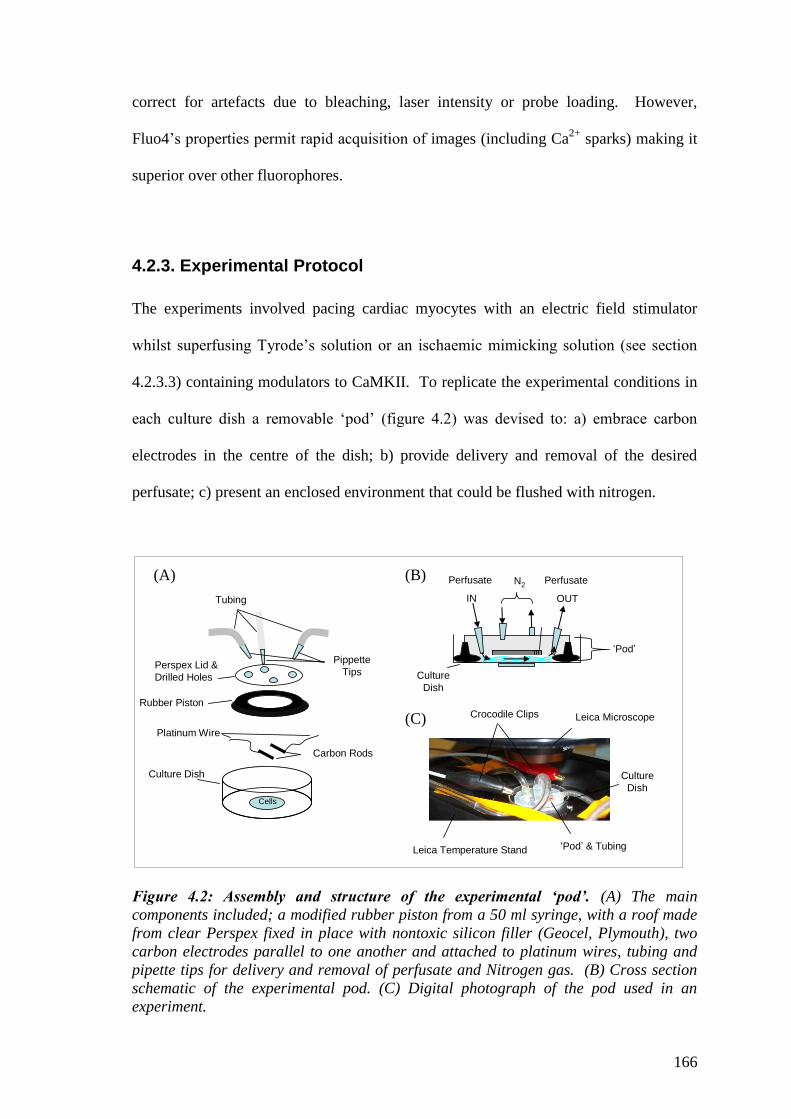
166
correct for artefacts due to bleaching, laser intensity or probe loading. However,
Fluo4’s properties permit rapid acquisition of images (including Ca2+
sparks) making it
superior over other fluorophores.
4.2.3. Experimental Protocol
The experiments involved pacing cardiac myocytes with an electric field stimulator
whilst superfusing Tyrode’s solution or an ischaemic mimicking solution (see section
4.2.3.3) containing modulators to CaMKII. To replicate the experimental conditions in
each culture dish a removable ‘pod’ (figure 4.2) was devised to: a) embrace carbon
electrodes in the centre of the dish; b) provide delivery and removal of the desired
perfusate; c) present an enclosed environment that could be flushed with nitrogen.
N2Perfusate
IN
Perfusate
OUT
Crocodile Clips
‘Pod’ & Tubing
Leica Microscope
Leica Temperature Stand
Perspex Lid &
Drilled Holes
Rubber Piston
Carbon Rods
Platinum Wire
Culture Dish
Cells
Tubing
Pippette
Tips
Culture
Dish
Culture
Dish
‘Pod’
Figure 4.2: Assembly and structure of the experimental ‘pod’. (A) The main
components included; a modified rubber piston from a 50 ml syringe, with a roof made
from clear Perspex fixed in place with nontoxic silicon filler (Geocel, Plymouth), two
carbon electrodes parallel to one another and attached to platinum wires, tubing and
pipette tips for delivery and removal of perfusate and Nitrogen gas. (B) Cross section
schematic of the experimental pod. (C) Digital photograph of the pod used in an
experiment.
(A) (B)
(C)

167
4.2.3.1. Preparation of Cells
A manufactured 35 mm petri dish (MatTek Corporation) containing an 11 mm glass
cover slip in the centre of the base was used to culture the cells. After pre-coating with
murine extracellular matrix (0.42 µg/µl; Sigma-Aldrich), 2 x 10³ rod shape cells were
seeded with 2 ml of the supplemented M199 medium. Before commencing the first
experiment, cells were settled for 30 min in a 37oC, 5% CO2 incubator with all other
experiments completed within the same day of isolation. The cells were washed twice
with Tyrode’s solution (in mM; NaCl 135, KCl 5, HEPES 5, glucose 10, MgCl2 1.2,
CaCl2 1.25, pH 7.4) prior to loading with the fluorophore at room temperature. To
enhance membrane penetration, an acetoxymethyl (AM) ester derivative of Fluo4 was
used. Once inside the cell, esterases cleave the ester creating an indicator that is
membrane impermeant. However, AM has a low affinity to aqueous solutions and
needs to be solubilised in DMSO. An initial concentration and loading time of 5 µM
for 10 minutes was used to load the cells in some of the initial time control experiments
of study 1 and 2. This was then modified to 2.5 µM for 15 minutes in all other
experiments to conserve the fluorophore and reduce the final concentration of the
solvent, DMSO, from 0.5% to 0.25%. Cells were washed three times with the Tyrode’s
solution and allowed 15 min at room temperature for the de-esterification of the
fluorescent probe.

168
4.2.3.2. Field Stimulation and Criteria for Cell Selection
The studies that have investigated electric field stimulation of cardiac myocytes have
noted the promotion of electrolysis at the site of the electrodes, particularly when high
stimulus voltage (above 50 V) is applied (Heller et al., 2003). The accumulation of
oxidation products can influence cell viability and as such would be a critical artefact of
the experimental protocol in a model of simulated I-R injury (Maddaford et al., 1999;
Heller et al., 2003). To avoid this, choice of material and configuration of the
electrodes were of utmost importance to limit any confounding injury to the cells.
Tandon et al. (2009) describe methods for stimulating cardiac myocytes with minimum
generation of electrolysis by using carbon rods and platinum wire. This set up was
replicated in these experiments with two 10 mm carbon rods (Goodfellow Cambridge
Ltd, Huntingdon) placed parallel to one another at a distance of 10 mm. For stimulation
efficiency, electrodes must be placed at the bottom of the dish and at the diameter of the
dish, with adequate medium to cover the electrodes in order to constrain the field lines
between them (Tandon et al., 2009). Holes (0.5 mm diameter) drilled at opposite ends
not only allowed the attachment of platinum wire (Goodfellow Cambridge Ltd,
Huntingdon) but also assisted in balancing the opposing polarity of the electric fields.
Steel rods with crocodile clips allowed easy attachment between the field stimulator and
the platinum wire. Square-wave pulses were delivered to the cells at a frequency of
~1Hz, 5ms in duration at 25 volts. The stimulation frequency and the pulse duration of
Ca2+
transients are the best understood regulators of CaMKII activation (Couchonnal
and Anderson, 2008). De Koninck et al. (1998) reported that pacing frequencies above
1Hz would stimulate the autophosphorylation site of Thr287
site. Thus, to prevent this
artificial activity, a low pacing frequency was selected. A slower pacing rate also
enables a period of resting diastolic phase between each Ca2+
transient. This allows any

169
‘inter-transient activity’ such as Ca2+
sparks to also be recorded (see section 4.2.4.3).
Before the first recording was initiated, a 15 min stimulation period was used to exclude
any of the rod shape cells that showed any irregular contractile activity. Other selection
criteria included visible striation patterns and absence of membrane blebbing or other
signs of injury.
4.2.3.3. Simulation of Ischaemia and Reperfusion
When compared to quiescent cells, electriclly stimulated cells exhibit a more frequent
and severe dysfunction when they are exposed to the same hypoxia protocol
(Maddaford et al., 1999). This is due to the contractile activity increasing metabolic
demand of the cell, which increases the demand for oxygen. Ischaemic conditions can
be mimicked by manipulating the Tyrode’s solution to exclude glucose and oxygen, an
acidic pH and an increased K+ concentration. A solution with a high K
+ concentration
was not employed owing to the effects on the specific signalling mechanisms that
CaMKII is involved with. The simulated ischaemia solution contained (in mM: NaCl
125, KCl 5, MgCl2 1.2, HEPES 10.4, CaCl2 1.25), pH 6.0. In contrast to the ischaemic
solution used in Chapter 3, the removal of glucose was not replaced by the metabolic
inhibitor 2-DG or sodium lactate. The latter has been shown to quickly enforce severe
irreversible injury and allowing the cells to generate their own intracellular lactate is a
better simulation of ischaemic conditions (Maddaford et al., 1999). With the removal of
glucose a replacement was needed to maintain osmolarity. This was done by adding a
higher HEPES content (Tyrode’s solution, 288 mOsm vs. Ischaemic mimicking
solution, 276 mOsm). The pH was lowered to 6.0 (with NaOH) to simulate the
extracellular pH conditions and has been shown to induce a [pH]i of ~6.7 (Zheng et al.,
2005).

170
Hypoxic solutions were prepared by vigorous bubbling (4 L/min) of the
ischaemic mimetic solutions with nitrogen gas (oxygen free, BOCs) for a minimum of
60 min. By introducing this gaseous environment to the perfusate a passive diffusion of
oxygen down its partial pressure gradient will make the solutions hypoxic. The partial
pressure of oxygen (pO2) was not measured during the experiments as a microelectrode
could not be used in conjunction with the gas pod. However, using a similar
preparation in another setting, the changes in pO2 were recorded as proof of concept.
By assuming that the oxygen tension of a normoxic solution is 150 mmHg (21% of
normal atmospheric pressure), a ProCFE 5 µm low noise polarised carbon fibre
microelectrode (Dagan corporation, Minneapolis, USA), recorded an 85-91% reduction
in the oxidised electrical current (using a VA-10 npi voltammetric/amperometric
amplifier; Scientifica, Sussex, U.K.). This converted the oxygen tension within the
solution to a pO2 of 14-23 mmHg. Equilibrating the solutions with nitrogen reduced
their temperature to 16oC, in comparison to the normal Tyrode’s solution of 21
oC. This
was corrected by placing the glass container in a pre-heated tub at 25oC. Tubes running
from the glass container to the water tub acted as a pressure vent to allow the nitrogen
gas to escape and prevent an increase in ambient pressure. Peristaltic pumps (Watson-
Marlow, Falmouth) controlled the delivery and removal of the perfusate to 5 ml/min.
To prevent diffusion of atmospheric oxygen to the hypoxic solutions during
superfusing, the ‘Gas Pod’ received a jet of Nitrogen (1 L/min) throughout the
simulated ischaemia period.
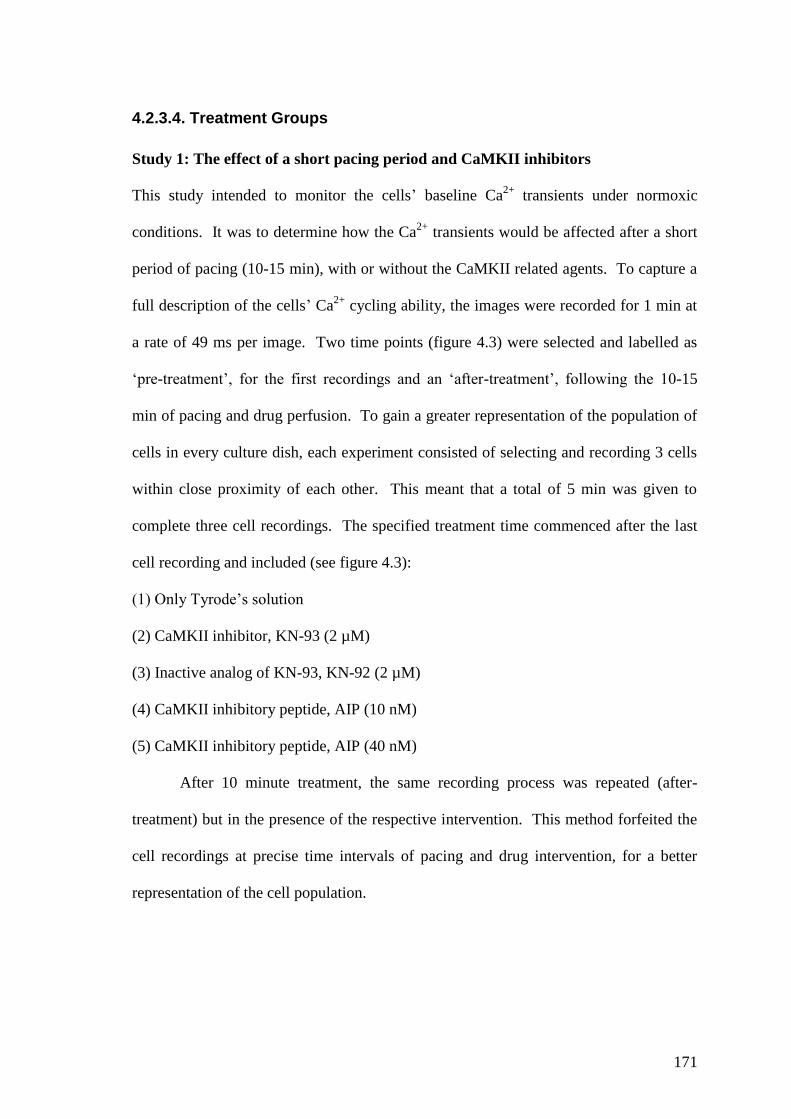
171
4.2.3.4. Treatment Groups
Study 1: The effect of a short pacing period and CaMKII inhibitors
This study intended to monitor the cells’ baseline Ca2+
transients under normoxic
conditions. It was to determine how the Ca2+
transients would be affected after a short
period of pacing (10-15 min), with or without the CaMKII related agents. To capture a
full description of the cells’ Ca2+
cycling ability, the images were recorded for 1 min at
a rate of 49 ms per image. Two time points (figure 4.3) were selected and labelled as
‘pre-treatment’, for the first recordings and an ‘after-treatment’, following the 10-15
min of pacing and drug perfusion. To gain a greater representation of the population of
cells in every culture dish, each experiment consisted of selecting and recording 3 cells
within close proximity of each other. This meant that a total of 5 min was given to
complete three cell recordings. The specified treatment time commenced after the last
cell recording and included (see figure 4.3):
(1) Only Tyrode’s solution
(2) CaMKII inhibitor, KN-93 (2 µM)
(3) Inactive analog of KN-93, KN-92 (2 µM)
(4) CaMKII inhibitory peptide, AIP (10 nM)
(5) CaMKII inhibitory peptide, AIP (40 nM)
After 10 minute treatment, the same recording process was repeated (after-
treatment) but in the presence of the respective intervention. This method forfeited the
cell recordings at precise time intervals of pacing and drug intervention, for a better
representation of the cell population.

172
Stabilisation &
Cell Selection
10 minute Treatment
1. Control
2. KN-93 (2 µM)
3. KN-92 (2 µM)
4. AIP (10 nM)
60 s Imaging @
49 ms/frame
Cell 1 2 3 Cell 1 2 3
-15 0 10
5. AIP (40 nM)
Time (minutes)
Figure 4.3: Timeline of the experimental procedures used for the groups in Study 1.
Each cell received 15 minute of electrical field stimulation prior to their 1 minute pre-
treatment recording. After the last cell recording the groups had a minimum of 10
minute treatment. Then another 1 minute after-treatment recording was taken for each
of the cells.
Study 2: The effect of simulated I-R with or without the CaMKII inhibitors
One cell was selected during the 15 minutes normalisation period on the same criteria as
study 1. Challenging the cells to simulated I-R required a total of 50 minute period and
thus involved subjecting the cells to a longer exposure of the laser treatment. The
imaging time was reduced to 10 seconds, for every minute of the experiment in order to
minimise phototoxicity. The first group of experiments included a time control lasting
50 minutes under normal conditions to evaluate the degree of cellular damage. The
second group were subjected to the standard I-R protocol that included; (1) 10 minutes
of a stabilisation period with Tyrode’s solution (5 ml/min) to characterise the Ca2+
oscillations under stable conditions. (2) A 30 minute ‘simulated ischaemia’ challenge
with a hypoxic and modified Tyrode’s solution. (3) 10 minutes of restoring the
metabolism with normal Tyrode’s solution. The treatment groups included the addition

173
of pharmacological agents 5 minutes prior to the ischaemic challenge, throughout the
ischaemic challenge, and during the first 5 minute period of restoration. Figure 4.4
depicts the timeline for the experimental groups and included:
1) Time controls- 50 minute of imaging the cells with normoxic Tyrode’s solution.
2) Ischaemic controls – 10 minute stabilisation, 30 minute of simulated ischaemia,
10 minute restoration of metabolism.
3) Ischaemia and drug perfusion - 5 minute of stabilisation, 5 minute of drug
perfusion under normoxic conditions, 30 minute of simulated ischaemia
including presence of drug, 5 minute reoxygenation including the drug, 5 minute
of normoxic conditions without the drug.
Stabilisation Restoration
1. Time Control
3. KN-93 (2 µM)
4. KN-92 (2 µM)
5. AIP (40 nM)
2. I-R ControlSimulated Ischaemia
10 s Imaging @ 49 ms/frame, every 1 minute
50 10 40 45 50
0 50
10 40 500
Figure 4.4: Timeline of the experimental procedures used for the groups in Study 2.
After 15 minutes of field stimulation one cell was selected for either; (1) 50 minute time
control experiment, (2) simulated ischaemia and restoration of metabolism, (3)
simulated ischaemia and restoration of metabolism in the presence of CaMKII
inhibitors. Every minute Ca2+
transients were recorded by 10 seconds of imaging at 49
ms/frame.

174
4.2.4. Analysis of the Ca2+ Oscillations
4.2.4.1. Converting the Images to Raw Data in an Excel Spreadsheet
The LAS AF Lite software (Leica, version 2.3.5) was used to convert the recorded
images of specific regions of interest (ROI) to raw numerical data in Excel (Microsoft).
Each ROI measures the mean intensity of the gray-scale values and to avoid X/Y
dimensional bias, square ROI with the dimensions 7.5 x 7.5 µm were selected to capture
the sufficient numbers of pixels. Avoiding any nuclear regions or the fringes subjected
to cell shortening, each image was mapped with five ROI (figure 4.5A). Although one
ROI would have been sufficient to measure the cell’s Ca2+
transient, additional boxes
allowed more scrutiny and the synchronicity of the intracellular events. For each ROI a
10 sec or 1 min experimental recording would produce 205 or 1225 consecutive data
points respectively. This enabled a comparable timeline in the changes in fluorescence
(∆F) to represent the cell’s Ca2+
oscillations (figure 4.5B). The cell length (um) during
cell shortening and its subsequent non-stimulated resting period were also recorded at
given time points by using the ruler supplied by the software. This represents the cell’s
contractile capability and is calculated by the change in cell length relative to the non-
stimulated length (%).
4.2.4.2. Analysis of the Ca2+ Oscillations by SALVO Software
Synchrony – Amplitude – Length – Variability of Oscillation (SALVO) is a new multi-
parametric analytical tool that has been developed by Dr. Chris George and Dr. Nicole
Sylvester (Welsh Heart Institute, Cardiff University). Using Python programming, the
software is designed to use algorithms to analyse a Ca2+
transient’s morphology,
amplitude and kinetics. As shown in figure 4.5C, the data entered into SALVO is
175
fashioned with transient ‘peaks’ and ‘valleys’ that have been automatically detected by
the software.
Figure 4.5: An isolated adult rat cardiac myocyte and a recording of its mean
fluorescence intensity against time, which was then measured for Ca2+
transients’
peaks and valleys by the SALVO software. (A) Image of a cardiac myocyte and its real
time Ca2+
fluorescence (green pixels), that were measured by five square region of
interest (coloured boxes). (B) The mean intensity of each ROI were converted to data
points plotted against time to depict the oscillations of Ca2+
. (C) Using specific
algorithms the SALVO software measures each characteristic data point to allow
analysis of specific parameters. Ti, transient initiation point; Tp, transient peak; Te,
transient end.
(A)
(B)
(C)
176
A transient initiation point (Ti) will be detected at a ‘valley’, when a negative
gradient (i.e. reduction in Ca2+
-dependent fluorescence) is followed by a positive
gradient (i.e. increase in Ca2+
-dependent fluorescence over a designated threshold).
Peak transient (Tp) will be determined when the positive rise of an oscillation returns to
a negative gradient. The end of a transient (Te) is detected upon another distinguished
positive change in gradient. Triangulation between these points allows the calculation
and determination of a myriad of parameters, which characterise an oscillation and the
Ca2+
handling properties of the cell. Such an auto detection method has limitations as it
is prone to error when the fluorescence signal to noise ratio is low, and thus needed to
be proof read and modified to limit any anomalies that might distort the data output.
Modifications and corrections were needed for: (i) the start and end of a trace, to ensure
they were matched to baseline values and not during a transient; (ii) any multiple Te
points that were detected on a transient (due to noise) but did not signify the end of the
transient was deleted; (iii) only one Tp was allowed per transient, and included the
deletion of a second Tp during Ca2+
dysfunction such as an EAD.
4.2.4.3. SALVO Parameters
The SALVO parameters dissect the transient’s recordings and their recurring phases
into specific data sets that can then describe the cellular Ca2+
profile. This includes; a
systolic phase which considers the magnitude of the Ca2+
oscillation and the kinetics at
which this fluctuation occurs; a diastolic phase, where the cells ‘inter-transient activity’
would be inspected for its fluorescent intensity and non stimulated Ca2+
events such as
Ca2+
sparks; and other parameters such as synchrony and the regularity of Ca2+
transients height that describe the organisation and robustness of each oscillation. The
definitions of the SALVO parameters that are used to scrutinise each Ca2+
transient are
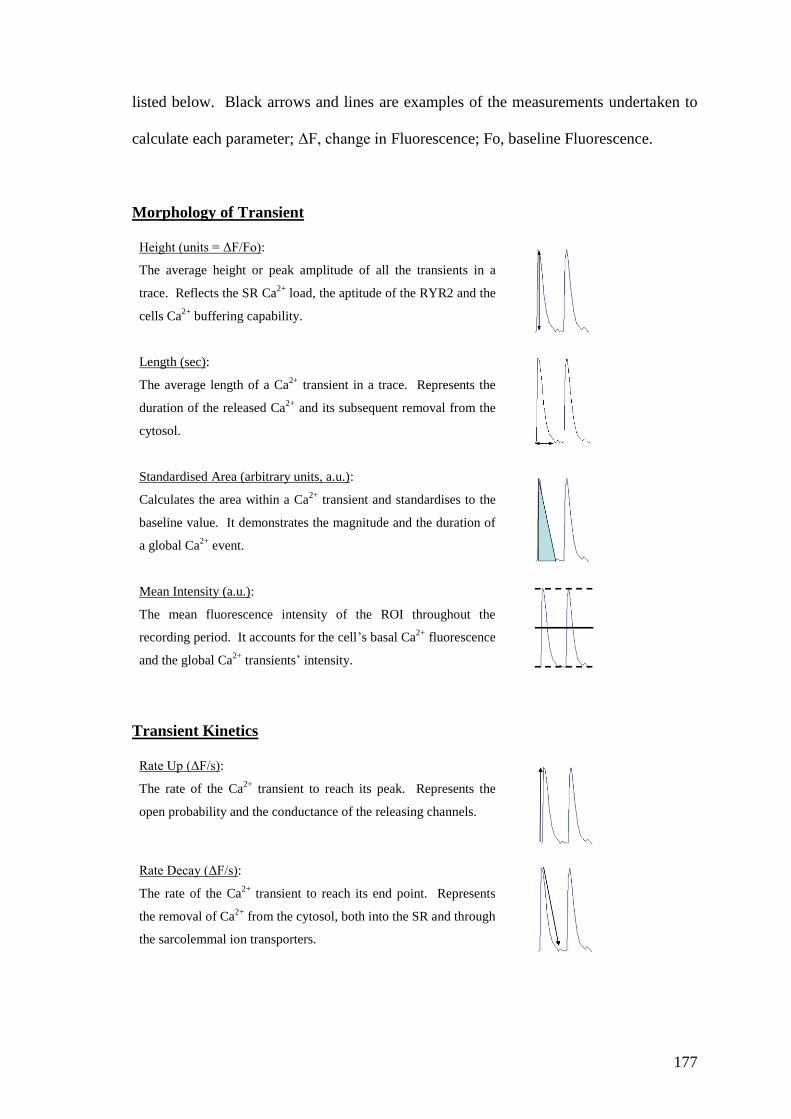
177
listed below. Black arrows and lines are examples of the measurements undertaken to
calculate each parameter; ΔF, change in Fluorescence; Fo, baseline Fluorescence.
Morphology of Transient
Height (units = ΔF/Fo):
The average height or peak amplitude of all the transients in a
trace. Reflects the SR Ca2+
load, the aptitude of the RYR2 and the
cells Ca2+
buffering capability.
Length (sec):
The average length of a Ca2+
transient in a trace. Represents the
duration of the released Ca2+
and its subsequent removal from the
cytosol.
Standardised Area (arbitrary units, a.u.):
Calculates the area within a Ca2+
transient and standardises to the
baseline value. It demonstrates the magnitude and the duration of
a global Ca2+
event.
Mean Intensity (a.u.):
The mean fluorescence intensity of the ROI throughout the
recording period. It accounts for the cell’s basal Ca2+
fluorescence
and the global Ca2+
transients’ intensity.
Transient Kinetics
Rate Up (ΔF/s):
The rate of the Ca2+
transient to reach its peak. Represents the
open probability and the conductance of the releasing channels.
Rate Decay (ΔF/s):
The rate of the Ca2+
transient to reach its end point. Represents
the removal of Ca2+
from the cytosol, both into the SR and through
the sarcolemmal ion transporters.

178
Inter-Transient Noise (ITN)
The ITN is the basal parameter that measures the activity of the point-to-point
difference in the fluorescence intensity between each Ca2+
transient. ITN is associated
with localised low-amplitude Ca2+
events that occur during the resting period. The ITN
parameters include:
Average Magnitude; ITNAvMag (a.u.):
The average magnitude of the signal variability that occurs in-
between each Ca2+
transient. Represent the small diastolic Ca2+
release events or Ca2+
sparks and other Ca2+
quanta.
Average of the mean base value, ITNamb (a.u.):
The ITNAvMag normalised to the baseline fluorescence.
Length; ITNlength (a.u.):
The total length of time for the ITN. The length of time that
ITN activity is continued within a transient.
Total; ITNTotal (a.u.):
The total sum of ITN within a recording. Includes the
magnitude and the length of time that ITN continues for in a
trace.
Length
Magnitude
Diastolic period
ITN
Inter-Transient Noise
Synchrony and Conformity
Synchrony (%, where 100% is perfect synchronisation):
Calculates the juxtaposition of the transients’ peak amplitude from
all the ROI. Demonstrates synchronisation of Ca2+
release across
the cell.
Height Regularity:
The cumulative standard deviation of each transient’s peak
amplitude. Reflects Ca2+
transient control. As height regularity
tends to 0, the height of the transients becomes perfectly
consistent.

179
4.2.4.4. Incidences of Ca2+ Dysfunction and Stunning
Each recording was checked for incidences of Ca2+
dysfunction, such as Ca2+
waves, an
afterdepolarisation or stunning as these occurrences are not accounted for as a specific
parameter in the SALVO software. A cell generating a Ca2+
wave was characterised as
a non-synchronised release of Ca2+
that spread throughout the cell moving concurrently
from one ROI to another. Other Ca2+
dysfunction events were characterised as an
uncoordinated release of Ca2+
. Stunning is defined within this chapter as an event
where no Ca2+
transients were generated by the cells. Examples of these occurrences
are given in figure 4.12.
4.2.5. Statistical Analysis
All numerical data are presented as mean values ± SEM, unless otherwise stated. The
statistical software PRISM® version 5.00 (Graphpad) was used to analyse all statistical
data, with the spreadsheet Excel (Microsoft) used for the initial handling of the SALVO
data output. A one-way ANOVA followed by post hoc Newman-Keuls test) was used
to compare baseline (pretreatment) values between the treatment groups for study 1 and
study 2. A two way repeated measures ANOVA followed by the Bonferroni post hoc
test was used to analyse the cells’ baseline recordings (pre-treatment) with the post
treatment recordings in study 1. A two-way ANOVA followed by Bonferroni post hoc
test was used for all other statistical analysis. P<0.05 was considered statistically
different.

180
4.3. Results
4.3.1. Exclusion Criteria
The cardiac myocytes were selected for experimentation based on their structural
integrity and response to electric field stimulation. Further exclusion was put in place
during supplementary analysis to eliminate the cells that had unobserved defects in their
Ca2+
handling abilities. This scrutiny involved analysis during the first 10 minutes of
the stabilisation period and consisted of: a) any rise in the diastolic baseline
fluorescence; b) signs of arrhythmia; c) poor fluorophore measurements; d) any
considerable cell movement out of the original focal plane.
Using these criteria, there was a completion of 22 experiments in study 1 and 26
experiments for study 2, of which there were four exclusions in each of the studies
during further analysis. Thus, data for the normoxic study is represented by 8-15
different cells per experimental group that have come from 3-5 rat hearts. The data for
the simulated ischaemia-restoration study is represented by 5-6 cells per experimental
group, which have come from 4-5 rat hearts.

181
4.3.2. Characteristics of the Adult Rat Ventricular Myocytes
To determine whether there was homogeneity amongst the cells prior to
experimentation, the first recordings for all groups in study 1 and 2 were analysed with
an ANOVA test. The cells descriptive data, such as resting length, field-stimulated
length and their respective baseline and mean intensity fluorescence readings are
described in table 4.1. Statistical analysis determined no significant difference between
the mean values of these parameters, suggesting that each group had similar baseline
values prior to experimentation. The cells had a baseline fluorescence score of 22.5 ±
2.5 a.u. allowing a resting cell length of 100 ± 5.0 µm. Upon electrical stimulation the
cells contracted and shortened by 5.0 ± 0.5%. The cellular response to this electrical
impulse created the greatest variability between the groups as the mean intensity for
each Ca2+
transient varied between 35.2 and 53.3 a.u. Analysis of additional parameters
that describe the Ca2+
transient and inter-transient activity is given in figure 4.6. A
statistical difference was identified between the duration of a Ca2+
transient in the time
controls (0.67 ± 0.01 s) of study 2 and the AIP group (0.79 ± 0.02 s) of study 2 (figure
4.6). The pacing rate on the field stimulator could have caused this as it was set with a
changeable dial and not a definitive setting of 1 Hz. However, the pacing rates
described in table 4.1 (measured by the frequency in peak transients) were not
significantly different. The most likely cause for this discrepancy is that the higher
Fluo4 concentration (5 µM) originally loaded in some of the cells within the time
control group, created a larger signal-to-noise fluorescence. This was automatically
detected by the SALVO programme as an earlier formation of a ‘valley’ and thus an
earlier endpoint to the Ca2+
transient. A non-significant trend can be detected in the
transients length of time controls in study 1 (0.69 ± 0.01 s), which also included cells
subjected to a higher fluorophore concentration.

Table 4.1 – Descriptive data (Mean ±SEM) of the cells first recordings prior to the normoxic (study 1) or
simulated ischaemia (study 2) experiments.
Experimental
Groups
n
(cells/hearts)
Cell Length
(µm)
Rate
(Hz)
Cell Shortening
(%)
Baseline
(a.u)
Mean Intensity
(a.u)
Study 1
Control 14/5 98.8 ± 4.4 1.10 ± 0.02 6.4 ± 0.3 26.6 ± 3.9 53.3 ± 8.1
KN93 (2 µM) 12/4 103.2 ± 3.1 1.03 ± 0.04 7.8 ± 0.7 22.8 ± 3.2 51.4 ± 8.3
KN92 (2 µM) 8/3 105.6 ± 5.6 1.04 ± 0.04 6.7 ± 0.8 17.0 ± 1.0 35.2 ± 1.8
AIP (10 nM) 8/3 103.0 ± 5.8 1.03 ± 0.05 6.6 ± 0.6 19.3 ± 1.6 35.2 ± 2.2
AIP (40 nM) 7/3 94.1 ± 2.2 1.02 ± 0.02 4.5 ± 0.6 24.3 ± 1.6 45.3 ± 5.9
Study 2
Time Control 6/4 102.3 ± 3.1 1.04 ± 0.05 6.1 ± 0.9 26.7 ± 2.3 47.3 ± 3.8
Ischaemic Control 6/5 96.0 ± 3.4 1.06 ± 0.03 6.8 ± 1.2 23.1 ± 3.0 45.3 ± 6.0
KN93 (2 µM) 5/5 105.6 ± 3.9 1.03 ± 0.03 6.3 ± 0.8 19.8 ± 3.5 38.0 ± 6.3
KN92 (2 µM) 5/5 100.2 ± 4.8 1.03 ± 0.04 6.2 ± 0.9 22.8 ± 2.1 44.0 ± 2.5
AIP (40 nM) 5/5 100.2 ± 6.9 1.00 ± 0.03 5.0 ± 0.5 23.6 ± 2.5 41.7 ± 4.6

183
Stu
dy1 C
ontrol
M)
KN-9
3 (2
M)
KN-9
2 (2
AIP
(10n
M)
AIP
(40n
M)
Stu
dy2 C
ontrol
I-R a
lone
I-R &
KN-9
3
I-R &
KN-9
2
I-R &
AIP
0
20
40
60
80
100
Syn
ch
ron
y (
%)
Stufy
1 Contr
olM
)
KN-9
3 (2
M)
KN-9
2 (2
AIP
(10n
M)
AIP
(40n
M)
Study2
Contr
ol
I-R a
lone
I-R &
KN-9
3
I-R &
KN-9
2
I-R &
AIP
0.0
0.2
0.4
0.6
Heig
ht
Reg
ula
rity
(S
D)
Stu
dy1 C
ontrol
M)
KN-9
3 (2
M)
KN-9
2 (2
AIP
(10n
M)
AIP
(40n
M)
Stu
dy2 C
ontrol
I-R a
lone
I-R &
KN-9
3
I-R &
KN-9
2
I-R &
AIP
0
2
4
6
8
Heig
ht
( F
/Fo)
Stu
dy1 C
ontrol
M)
KN-9
3 (2
M)
KN-9
2 (2
AIP
(10n
M)
AIP
(40n
M)
Stu
dy2 C
ontrol
I-R a
lone
I-R &
KN-9
3
I-R &
KN-9
2
I-R &
AIP
0.0
0.2
0.4
0.6
0.8
1.0 *
Len
gth
(seco
nd
s)
Study1
Contr
olM
)
KN-9
3 (2
M)
KN-9
2 (2
AIP
(10n
M)
AIP
(40n
M)
Study2
Contr
ol
I-R a
lone
I-R &
KN-9
3
I-R &
KN-9
2
I-R &
AIP
0.0
0.5
1.0
1.5
Sta
nd
ard
ised
Are
a (
a.u
)
Study1
Contr
olM
)
KN-9
3 (2
M)
KN-9
2 (2
AIP
(10n
M)
AIP
(40n
M)
Study2
Contr
ol
I-R a
lone
I-R &
KN-9
3
I-R &
KN-9
2
I-R &
AIP
0
500
1000
1500
Rate
Up
(
F/s
)
Study1
Contr
olM
)
KN-9
3 (2
M)
KN-9
2 (2
AIP
(10n
M)
AIP
(40n
M)
Study2
Contr
ol
I-R a
lone
I-R &
KN-9
3
I-R &
KN-9
2
I-R &
AIP
-250
-200
-150
-100
-50
0
Rate
Decay (
F/s
)
Study1
Contr
olM
)
KN-9
3 (2
M)
KN-9
2 (2
AIP
(10n
M)
AIP
(40n
M)
Study2
Contr
ol
I-R a
lone
I-R &
KN-9
3
I-R &
KN-9
2
I-R &
AIP
0.00
0.02
0.04
0.06
0.08
0.10
ITN
am
b (
a.u
)
Figure 4.6: Mean data (±SEM) from all the cells first recordings of the Ca2+
transients’ parameters identified by SALVO. White bars indicate the one minute
recordings from the normoxic experiments in study 1. Shaded bars indicate the first 10 s
recordings from the simulated ischaemia-reoxygenation protocol in study 2. Dashed
lines specify mean score between the groups. (*p<0.05 by One-way ANOVA). N number
for each experimental group is given in table 4.1.

184
The SALVO measurements in the inter-transient noise activity (ITNamb) also
suggest a higher amount of signal-to-noise fluorescence was recorded within the time
controls of study 2. Other parameters of the Ca2+
transients, such as height,
standardised area and the rate of Ca2+
release, follow a similar outline of intensity
between the groups. A quicker rate of Ca2+
release is in concert with the height of the
Ca2+
transient and its standardised area. The KN-93 group in study 1 for example, has a
Ca2+
transient with a peak height (5.7 ± 0.35 a.u.), rate up (1377 ± 238 ∆F) and
standardised area (1.3 ± 0.16 a.u.) greater than any other group. Interestingly, the rates
of Ca2+
transients decay (or Ca2+
removal) are ~10-20% slower than the Ca2+
rate up (or
Ca2+
release); demonstrating the difference between the passive transport of Ca2+
through ion channels to its uptake against a concentration gradient with ion transporters
such as SERCA2a. Synchronicity between the Ca2+
transients’ recorded in five ROI,
average 84.8 ± 4.6% homology. The shorter 10 second recordings in study 2 have a
trend in maintaining a lower deviation in height regularity than the longer recordings.
To summarise, the first recordings in all experimental groups are not
significantly different to one another, indicating that the experiments to start with are
using functionally similar cells. The cells that underwent the longer period of laser
scanning were not different to the shorter period indicating the shorter 10 second period
was sufficient to capture enough data. Data for some of the parameters in further
analysis is normalised to these first recordings in order to standardise the effects of
treatments.

185
4.3.3. Effect of the CaMKII Inhibitors Under Normoxic Conditions
Study 1 investigated the response of the field stimulated ventricular myocytes to short
term normoxic drug perfusion or an equivalent time period in the controls. Thus, each
experimental group had their pre-treatment recordings (first recordings) compared to
their respective post-treatment recordings. A two-way ANOVA also tested whether
there was any interaction between the treatment groups and time course.
Cell size measurements
The cell length measurements during the resting diastolic phase (figure 4.7A) and
during cell shortening (figure 4.7B) showed no significant interaction effects (i.e. where
one of the variables is affected by the other) between the treatment groups and the two
time recordings. A post-hoc test of the mean myocyte length and their subsequent
shortening capability before and after the respected drug treatment, also detected no
significant difference had occurred to these cell dimensions. Of note was that the cells
treated with KN-93 or KN-92 had a minor reduction in their cell shortening as they
were measured at 88.5 ± 6.4% and 91.0 ± 11.9% respectively, of their basal recordings.
This was not demonstrated in the time-matched controls. The cells treated with AIP (40
nM) had also reduced to 87.0 ± 2.8 µm (or 92.4 ± 2.9% of its basal length) and had a
non significant weaker reduction of 3.3 ± 0.3% of its cell length. When the cells were
subjected to a lower concentration of AIP (10 nM), the post-treatment cell length was
similar to basal measurements (101.0 ± 6.1 µm or 98.1 ± 5.9% of basal) and the
contractile activity had also been maintained to 6.8 ± 1.1% of the resting cell length.

186
Contr
ol
KN-9
3
KN-9
2
AIP
(10n
M)
AIP
(40n
M)
0
2
4
6
8
10
Post-treatment Recording
Cell S
ho
rten
ing
(% C
ell L
en
gth
)
Contr
ol
KN-9
3
KN-9
2
AIP
(10n
M)
AIP
(40n
M)
0
50
100
Pre-treatment Recording
Cell L
en
gth
(
m)
Figure 4.7: Cardiac myocytes length measurements at rest (A) and after electrical
stimulation (B), before and after the treatments of study 1. Two-way repeated
measures ANOVA detected no significant interaction between the treatment groups and
the time periods. Further comparisons of the treatment groups’ individual mean
measurements detected no significance in the cells post-treatment measurements. n = 7-
14 cells from 3-5 hearts.
Incidences of Ca2+
dysfunction
Most of the Ca2+
transients responded to the post-treatment recording without any
observable changes. However, there were incidences of Ca2+
dysfunction. There was a
noticeable increase in the frequency of contractile defects when the CaMKII inhibitor
peptide AIP (40 nM) was present. After 45 s of imaging, 4 out of 7 cells developed
irregular fibrillatory beating that had not recovered by the end of the 1 minute
recording. This was visible on the transient recordings as a chaotic event of diastolic
Ca2+
release (figure 4.8E) in three of the traces and an occasional aberrant beating in the
other.
(A) (B)

187
Time: 0 60 sec
Figure 4.8: Examples of the incidences of Ca2+
dysfunction during the one minute
post-treatment recordings. The mean intensity of each ROI is plotted against time and
overlaid on top of each other. Different colours signify each ROI although only one
colour is prominent due to the synchronicity between regions. (A) Time control (B) KN-
93 treatment (C) KN-92 treatment (D) AIP 10 nM treatment (E) AIP 40 nM treatment.
Highlighted in the rectangular boxes are the incidents of Ca2+
dysfunction.
(A) Time Control
(B) KN-93
(C) KN-92
(D) AIP (10 nM)
(E) AIP (40 nM)

188
A lower concentration of AIP at 10 nM was not as arrhythmogenic, yet there was one
similar event of non recoverable diastolic Ca2+
release (t = 38 s) and one event of
ectopic beating that responded with positive inotropy (figure 4.8D). Treatment with the
organic CaMKII inhibitor KN-93 had one incidence of Ca2+
dysfunction (figure 4.8B).
The cell had a prolonged period of removing Ca2+
that resulted in a missed contraction
before responding with a positive inotropic effect. The 14 cell recordings in the time
control and the 8 cells in the KN-92 group remained in synchrony with the field
stimulator.
Parameters selected by SALVO
Two-way repeated measures ANOVA revealed that none of the Ca2+
handling
parameters measured by the SALVO software showed any significant interaction
between time and treatment. When comparing only between the two time periods (first
recordings vs. post recordings) rate up, rate decay and height regularity were revealed to
be significant during the post treatment recording (see 4.10). This indicates that some
cells experienced alterations in their Ca2+
transients’ morphology during treatment but
there was no consistent pattern of difference between treatment groups. This is further
illustrated in figure 4.9A (height of Ca2+
transient) where a small decrease in ΔF was
observed within all post-treatment recordings (chequered bars). Although ANOVA
suggested a significant effect (F(1,18) = 8.78, p = 0.0083), post hoc testing did not
reveal where the statistical difference lay. When the means of other parameters were
further analysed within the individual treatments by post hoc analysis, some differences
were significant within groups. KN-93 and KN-92 treatment significantly limited the
rate of Ca2+
released (rate up) into the cell by 11.2% and 19.5% respectively. The rate
of Ca2+
removal (rate decay) was only significantly restricted (by 10.4%) after KN-93
treatment. The steady state of the Ca2+
transients were all affected after drug treatment,

189
but more so with AIP (40 nM) treatment. There was a 44% increase in the height
regularity of this group that reflects the significant amount of Ca2+
dysfunction that
occurred during the post-treatment recording. Similar distortion was observed with the
lower concentration of the drug but was less consistent and not significant. Despite the
amount of dysfunction that occurred after AIP treatment, there was no disruption to the
synchrony of these occurrences in the ROI, indicating they were a global cellular event.
Contr
olM
)
KN-9
3 (2
M)
KN-9
2 (2
AIP
(10n
M)
AIP
(40n
M)
Time
Contr
ol
0
2
4
6
8
Heig
ht
( F
/Fo)
Contr
olM
)
KN-9
3 (2
M)
KN-9
2 (2
AIP
(10n
M)
AIP
(40n
M)
Time
Contr
ol
0.0
0.2
0.4
0.6
0.8
1.0
Len
gth
(seco
nd
s)
Contr
olM
)
KN-9
3 (2
M)
KN-9
2 (2
AIP
(10n
M)
AIP
(40n
M)
Time
Contr
ol
0.0
0.5
1.0
1.5
Sta
nd
ard
ised
Are
a (
a.u
)
Contr
olM
)
KN-9
3 (2
M)
KN-9
2 (2
AIP
(10n
M)
AIP
(40n
M)
Time
Contr
ol
0.00
0.05
0.10
ITN
am
b (
a.u
)
Figure 4.9: Comparison of the cells Ca2+
transient recordings before and after
treatment in study 1. (A) Height (B) Length (C) Standardised Area (D) Inter-transient
activity. Two-way repeated measures ANOVA revealed no significant interaction
between the treatment groups and time periods. Although Height (A) of the Ca2+
transient was lower in all treatment groups at the end of the post-treatment period, post
hoc testing revealed no significant differences for any parameter. White bars are first
recordings, chequered bars are post-treatment recordings, and shaded bars are time
control recordings from study 2 (taken at 0 and 10 min). n = 7-14 cells from 3-5 hearts.
(A) (B)
(C) (D)

190
Contr
olM
)
KN-9
3 (2
M)
KN-9
2 (2
AIP
(10n
M)
AIP
(40n
M)
Stu
dy 2
Contr
ol
-300
-200
-100
0
*
Rate
Decay (
F/s
)
Contr
olM
)
KN-9
3 (2
M)
KN-9
2 (2
AIP
(10n
M)
AIP
(40n
M)
Stu
dy 2
Contr
ol
0
500
1000
1500
2000
*
*
Rate
Up
(
F/s
)
Contr
olM
)
KN-9
3 (2
M)
KN-9
2 (2
AIP
(10n
M)
AIP
(40n
M)
Stu
dy 2
Contr
ol
0
20
40
60
80
100
Syn
ch
ron
y (
%)
Contr
olM
)
KN-9
3 (2
M)
KN-9
2 (2
AIP
(10n
M)
AIP
(40n
M)
Time
Contr
ol
0.0
0.2
0.4
0.6
0.8
*
Heig
ht
Reg
ula
rity
(S
D)
Figure 4.10: Comparison of the cells Ca2+
transient recordings before and after
treatment in study 1. (A) Rate Up (B) Rate Decay (C) Synchrony (D) Height Regularity.
Two-way repeated measures ANOVA revealed no significant interaction between the
treatment groups and time periods. There was significance when comparing the two
time periods with respect to Rate Up (A) Rate Decay (B) and height regularity (D). A
post test of the first recordings and the post-treatment means within each group
revealed significant changes had occurred in some parameters after KN-93 (Rate Up
and Rate Decay), KN-92 (Rate Up) and AIP 40 nM (Height regularity) treatment. White
bars are first recordings, chequered bars are after treatment recordings, and shaded
bars are time control recordings from study 2 (taken at 0 and 10 min). * p<0.05 when
comparing within treatment groups. n = 7-14 cells from 3-5 hearts.
(A) (B)
(C) (D)

191
4.3.4. Response to Simulated Ischaemia and Reperfusion
Study 2 investigated the myocytes’ response to an environment that simulated acute
ischaemia (low pH, glucose deficit and hypoxia) followed by a sudden return of normal
superfusate to promote reperfusion injury. A shorter 10 s recording, for each minute of
the experiment, was designed to capture sufficient information to summarise the cells’
Ca2+
handling ability, whilst limiting their cells exposure to phototoxicity. Any rise in
[Ca2+
]i during simulated ischaemia and loss in Ca2+
handling ability was used as
markers of cell injury.
4.3.4.1. Changes in Cell Dimensions
All cells that underwent the simulated I-R protocol survived. At termination of the
experiment they had maintained their cellular structure and had some degree of
rhythmicity. In spite of this, marked changes in cell length, contraction and Ca2+
handling ability occurred during both the simulated ischaemia and the restoration
period.
The minor reduction in cell length measured in study 1 was consistent with the
first 10 min of stabilisation in study 2 (figure 4.11A). Although the osmolarity of
ischaemic buffer was matched to the Tyrode’s solution, this gradual decline in resting
length was reversed in the new environment. A two-way ANOVA revealed no
significant interaction between the time course and treatment groups. A post hoc
analysis of the means determined that the swelling in the I-R controls was significant to
the time controls at 30 and 40 min of experimentation (mean difference, 7.3% and
10.3% respectively). When the normoxic Tyrode’s buffer was restored, the cells had
returned to a length comparable to the time controls by the end of experimentation.

192
0 10 20 30 40 5080
90
100
110
**
Time (min)
Rela
tive C
ell L
en
gth
(% P
rim
ary
len
gth
)
0 10 20 30 40 500
50
100
150
200
I-R Control I-R & KN-93
I-R & KN-92I-R & AIP
Time Control
* * *
*
Time (min)
Rela
tive C
ell S
ho
rten
ing
(% B
aselin
e)
Figure 4.11: Time course of the effects of simulated I-R on resting cell length (A) and
cell shortening (B) in the presence and absence of CaMKII inhibitors. A two-way
ANOVA compared each treatment groups mean scores at specific time periods of the
experiment. A significant interaction was found in the variables of the cell shortening
data. Whilst both cell length and cell shortening data had a significant difference when
all treatment groups were compared during the two time periods. This was due to the
deviation of the cell size measurements under ischaemic conditions to the time controls.
None of the treatment drugs changed the course of the cells morphology or contractile
activity when compared to I-R controls. The data sets (±SEM) have been separated at
the x axis for clarity. Shaded area denotes period of ‘ischaemia’. * p<0.05 when
comparing time controls with the I-R controls. n = 5-6 cells from 4-5 hearts.
(A)
(B)

193
None of the drug treatments significantly altered the fluctuation in cellular dimensions
that was instigated by the ischaemic solution, although the cells treated with KN-92
incurred the greatest variability and were not deemed to be significant to the time
controls at any time point. Dimensions of the AIP treated cells were only significant to
the time-matched controls at 40 minutes of experimentation.
Cell contraction (figure 4.11B) was abolished throughout the ischaemic period
in all treatment groups and an instant recovery of mechanical function emerged in
conjunction with the return of normal superfusate. Two-way ANOVA deemed these
changes as having a significant interaction, which was also of significance when only
the treatment groups or time periods were compared. At the termination of the
experiment, recovery in contractile activity within the I-R control group (129 ± 17.6%)
and those treated with KN-93 (131 ± 7.9%) was at a significantly enhanced capacity to
the timed controls (72 ± 18%). The KN-92 (103 ± 20.9%) and AIP (120 ± 36.0%)
groups, although not statistically different to the I-R groups or time controls, were more
variable (large SEM) in their return to mechanical function.

194
4.3.4.2. The Effects of Simulated I-R on Cellular Ca2+ Handling
Cellular Ca2+
transients were evoked during the ischaemic period even though there was
an absence of contractile activity (see next section for SALVO analysis). Only when
the cells were ‘stunned’, which occurred in some cells at later stages of ischaemia was
there a lack of Ca2+
cycling activity. In the presence of normoxic Tyrode’s solution, the
combination of 50 min electrical stimulation and intermittent laser scanning admitted a
minor and progressive depression of the amplitude of the Ca2+
transients (figure 4.12A).
Each oscillation was characterised by a sharp release of Ca2+
, followed by a
characteristic decay phase prior to the subsequent oscillation. At the onset of the
simulated ischaemia, a significant transformation occurred to the Ca2+
handling ability
(figure 4.12B). This included an abrupt decline in transient amplitude, and a moderate
rise in diastolic [Ca2+
]i within some cells. The return of normoxic superfusate to the
cells, reinstated the magnitude of each Ca2+
transient and returned the diastolic [Ca2+
]i
towards the baseline levels.
As noted in figure 4.12 C-D and quantified in figure 4.13 the cells had episodes
of mishandling Ca2+
. These were either aberrant Ca2+
dysfunction amongst the Ca2+
transients, large propagation of Ca2+
waves, or no Ca2+
activity at all (‘stunning’). To
summarise the figures:
- In the time controls two cells had an episode of Ca2+
dysfunction after 35, 40 or 45
minutes of experimentation. There were no incidents of Ca2+
waves or stunning.
- Subjecting cells to 30 minutes of an ischaemic mimetic solution did not incur
much Ca2+
dysfunction in any of the treatment groups. Such contractile defects
were generated with the return of the normoxic superfusate.

Time Control 0 30 50
Stabilisation RestorationI-R Control Simulated Ischaemia10 30 40 500 Stabilisation RestorationI-R Control Simulated Ischaemia10 30 40 500
t = 0 min t = 30 min t = 50 min
t = 0 min t = 30 min t = 50 mint = 0 min t = 30 min t = 50 min t = 41 mint = 41 min
t = 14 mint = 14 min t = 24 mint = 24 min
t = 50 mint = 50 min
Figure 4.12: Example of Ca2+
transient recordings (mean intensity vs. time) at selected time points during study 2. (A) Time control
recordings at 0, 30 and 50 min of experimentation. (B) I-R control experiment at 0, 30 and 50 min of experimentation. (C) Examples of a
stunned cell responding with an episode of hypercontracture (left); and a Ca2+
wave being generated whilst maintaining Ca2+
transient
activity (right). (D) Ca2+
waves occurring during the first minute of reoxygenation (top) and arrhythmic activity at the end of the
experimentation (bottom). Each recording shows the overlaid traces of five ROI from one cell. ‘t’ denotes the time point when the
recording was taken.
(B)
(C)
(D)
(A)
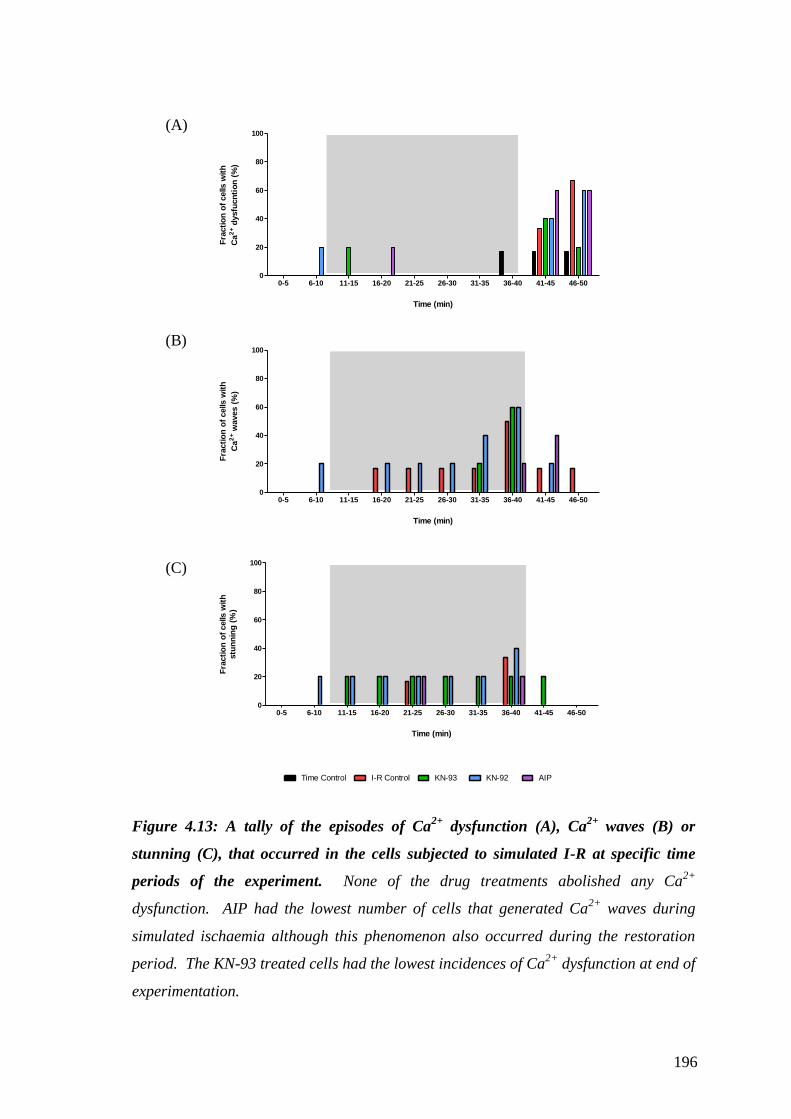
196
0-5 6-10 11-15 16-20 21-25 26-30 31-35 36-40 41-45 46-500
20
40
60
80
100
Time (min)
Fra
cti
on
of
cells w
ith
Ca
2+ d
ysfu
cn
tio
n (
%)
0-5 6-10 11-15 16-20 21-25 26-30 31-35 36-40 41-45 46-500
20
40
60
80
100
Time (min)
Fra
cti
on
of
cells w
ith
Ca
2+ w
aves (
%)
0-5 6-10 11-15 16-20 21-25 26-30 31-35 36-40 41-45 46-500
20
40
60
80
100
Time Control I-R Control KN-93 KN-92 AIP
Time (min)
Fra
cti
on
of
cells w
ith
stu
nn
ing
(%
)
Figure 4.13: A tally of the episodes of Ca2+
dysfunction (A), Ca2+
waves (B) or
stunning (C), that occurred in the cells subjected to simulated I-R at specific time
periods of the experiment. None of the drug treatments abolished any Ca2+
dysfunction. AIP had the lowest number of cells that generated Ca2+
waves during
simulated ischaemia although this phenomenon also occurred during the restoration
period. The KN-93 treated cells had the lowest incidences of Ca2+
dysfunction at end of
experimentation.
(A)
(B)
(C)

197
- None of the treatments protected the cells against episodes of Ca2+
dysfunction at
the restoration stages, but the cells treated with KN-93 incurred the fewest (one
cell) during the last 5 minutes of experimentation.
- The generation of Ca2+
waves was more apparent in the latter stages of the
ischaemic period, although treatment with KN-92 and the I-R control had one cell
propagating waves within 10 minutes of simulated ischaemia and continued to do
so until the restoration of normoxia. Over half the cells in the I-R control, KN-93,
and KN-92 treated cells generated Ca2+
waves at the end of the ischaemic period.
AIP treatment incurred the fewest incidences during the ischaemic period, but two
cells responded in this way during the restoration period.
- One cell from each of the KN treatment groups reacted instantly to the ischaemic
buffer and failed to generate Ca2+
transients. This was combined with the
generation of many Ca2+
waves in the KN-92 group. Stunning in other groups
occurred at the end of the ischaemic period but was not a universal behaviour.
During restoration one cell from the AIP treatment failed to generate any Ca2+
transients but this did recover.
198
4.3.4.3. SALVO Analysis of the Cellular Ca2+ Handling
As many aspects of the Ca2+
transients were changed in study 2, the parameters
analysed by the SALVO software are further categorised into four groups that best
describe features of the cells’ intracellular Ca2+
handling ability: (1) the shape of each
Ca2+
transient; (2) the rate at which the Ca2+
is cycled; (3) the inter-transient and
diastolic activity; (4) the synchrony and conformity of each ROI to portray the
intracellular harmony throughout the cell.
1. Transient morphology and volume of Ca2+
cycled in the cytosol
As shown in figure 4.14, when ischaemia is initiated the morphology of the Ca2+
transients changes. Error bars have been removed for clarity (and are included in the
appendices), and key time points have been selected to describe some of the parameters.
A two-way ANOVA detected significance within the drug treatments and in the time
period. These differences between the time control and the I-R control can be
summarised as follows:
- The first minute of ischaemia confines the cell’s standardised area measurements to
around half of its Ca2+
cycling proficiency (48.2 ± 9.3% of the first recording).
- This is due to the reduction in the height of each Ca2+
transient (figure 4.14C) as the
length (figure 4.14B) remains relatively constant throughout the experiment.
- The height and standardised area of the transients continue to fall (to below 25% first
recording) until normal superfusate is restored.
- Reoxygenation rapidly restores 53.0 ± 11.7% of the Ca2+
transients’ standardised area,
which by the end of experimentation reaches comparable levels to the matched time
controls (time control, 66.2 ± 12.4% vs. I-R control, 69.9 ± 11.1%).

0 1 10 11 20 21 30 31 40 41 49 500.4
0.6
0.8
1.0
1.2
# (KN-93)
Time (min)
Len
gth
(seco
nd
s)
5 10 15 20 25 30 35 40 45 50
0
50
100
150
Time Control I-R Control KN-93 KN-92 AIP
Drug treatment
* * * * * * * * * * *
Time (min)
Sta
nd
ard
ised
Are
a
(No
rmalised
)
0 1 10 11 20 21 30 31 40 41 49 500
50
100
150
* * * * * *
Time (min)
Heig
ht
(No
rmalised
)
0 1 10 11 20 21 30 31 40 41 49 5060
80
100
120
Time (min)
Mean
In
ten
sit
y
(No
rmalised
)
Figure 4.14: Time course of the SALVO parameters (Mean only) that describe the cells Ca2+
transients’ morphology, when subjected to
simulated I-R. (A) Standardised Area (B) Length of Ca2+
transient (C) Height of Ca2+
transient (D) Mean intensity of [Ca2+
]i. All data,
except for length, is normalised (%) to the first recording. (B-D) are selected time points through the time course. In all parameters, two-
way ANOVA detected no significant interaction between the treatment groups and time. The significance between the treatment groups is
described in text. Shaded area indicates period of ischaemia. * p<0.05 when comparing I-R Control vs. Time Control, # p<0.05 I-R
Control vs. the labelled drug treatment. n = 5-6 cells from 4-5 hearts.
(A)
(B) (C) (D)

200
- The mean intensity (figure 4.14D) for each recording includes the cell’s diastolic
fluorescence (see next section). This gradually rises after the onset of ischaemia to
reach peak intensity at the first minute of reoxygenation, before returning to comparable
levels as the time control by the end of experimentation.
None of the drug treatments, when statistically compared to the I-R control,
significantly altered the course of the Ca2+
transients’ morphology, standardised area or
mean intensity. However, some aspects were distorted with drug treatment and are
summarised as follows:
- The incidences of Ca2+
waves and the large discharge of Ca2+
within the cytosol are
reflected in the standardised area measurements by the divergence of the mean data for
the treatment groups KN-93 and KN-92 during ischaemia. One cell in particular from
the KN-92 group continuously propagated Ca2+
waves and forced the large error bars
within the data set (see appendices 1).
- The measurements in the Ca2+
transient length also reflect these arrhythmic
occurrences. One cell from each of the KN treated groups exhibited an episode of
hypercontracture and a large release of Ca2+
(lasting 2.5 sec in KN-93 group).
- AIP prevented any of these large releases of Ca2+
during ischaemia.
- During reoxygenation KN-93 treated cells responded with the largest measurements in
the Ca2+
transients’ standardised area (KN-93, 85.0 ±8% vs I-R control, 69.9 ±11.1%),
although this was not significant.
- The length of the Ca2+
transients peaked during the first minute of reoxygenation
possibly signifying the occurrences of arrhythmic activity.
- An interesting observation with the KN-92 group was a dip in the standardised area
measurements at 46 min when the drug was removed.

201
- AIP was more variable with its standardised area during the later stages of restoration
due to some occurrence of Ca2+
dysfunction.
- The mean intensity for the KN-92 group matched the I-R control whilst KN-93 and
AIP remained low until reoxygenation.
2. Rate of intracellular Ca2+
cycling
As the onset of ischaemia inflicted changes to the magnitude of Ca2+
cycled in the
cytosol, it also affected the rate at which this occurred (figure 4.15). A two-way
ANOVA revealed a significant interaction only in the rate of Ca2+
removal, but both
treatment and time had significant effects on the kinetics of these Ca2+
transients. These
changes are summarised as follows:
- In the I-R controls the first minute of ischaemia reduced the Ca2+
release and removal
rate to 50.8 ± 5.3% and 55.3 ± 6.0% respectively of their first ability. Both rate up and
rate decay were significantly reduced (compared to time controls) throughout the 30
min ischaemia reaching levels as low as 21.1 ± 3.5% and 40.7 ± 9.8% respectively.
Reoxygenation immediately reversed the transients’ kinetics although at 41 min the rate
of release (33.9 ± 3.4%) was slower to recover than the rate of decay (66.3 ± 11.1%).
At the end of experimentation the rate of Ca2+
release did not return to levels
comparable to those of the time control (48.7 ± 5.8% vs. time controls 70.0 ± 9.7%)
although this was not significant.
- None of the treatment groups significantly altered the Ca2+
transients’ kinetics during
the time course of I-R.
- The first 5 minutes of drug treatment during normoxic conditions did not replicate the
significant changes seen in study 1. This could either mean that the pre-treatment time
was too short, the recording time was not sufficient or that one of the analyses was
anomalous.

5 10 15 20 25 30 35 40 45 50
0
50
100
150
0
*
Drug treatment
Time Control I-R Control KN-93 KN-92 AIP
* * * * * * * * * * * * * * * * * * * * * * * * * * * *
Time (min)
Rate
Decay
(No
rmalised
)
0
50
100
150
* * * * * * * * * ** * * * * * * * * * * * * * * * * * *
*R
ate
Up
(No
rmals
ied
)
Figure 4.15: Time course of the SALVO parameters (Mean only) that describe the Ca2+
transients’ kinetics, when subjected to
simulated I-R. (A) Rate of Ca2+
released into the cell. (B) Rate of Ca2+
removed from the cytosol. Data are normalised (%) to the first
recording. A two-way ANOVA detected no significant interaction between the treatment groups and treatment time during Ca2+
release
but it was of significance during Ca2+
removal. Further significance between the treatment groups is described in text. Shaded area
indicates period of ischaemia. (* p<0.05 when comparing within the treatment groups). n = 5-6 cells from 4-5 hearts.
(B)
(A)

203
- The KN-93 treated cells recovered the highest rate of removal (75.7 ± 17.0%) after the
first minute of reoxygenation although this was variable. KN-93 recovery of height and
standardised area for each Ca2+
transients corresponds to this removal rate - The dip in
KN-92 standardised area at 46 min is also matched with its removal rate.
- AIP and KN-92 were slower to recover their rate of release and were significantly
different to the time controls at 41 min and 42 min.
3. Inter-transient and diastolic activity
Mean baseline fluorescence and inter-transient activity were categorised and quantified
into four key parameters by the SALVO software (figure 4.16): a) the average baseline
intensity of the inter-transient fluorescence readings; b) the average magnitude of the
Ca2+
released (including Ca2+
sparks) in-between the transients (ITN Av.Mag); c) the
total duration of inter-transient activity (ITN Length); d) the total sum of the absolute
difference in magnitude for the inter-transient Ca2+
activity (ITN Total). None of the
parameters when analysed by two-way ANOVA, displayed any significant interaction
between the treatment groups and time period. All treatment groups subjected to
simulated I-R expressed large SEM bars (appendices 3) and as such the data exhibited
little statistical difference when the treatment groups’ means were compared at
individual time points. This demonstrates that there was a heterogeneous response to
these I-R conditions. Generally, half the cells were vulnerable to a rise in [Ca2+
]i and
ITN activity (I-R control 3/6 cells, KN-93 3/5 cells, KN-92 3/5 cells, AIP 2/5 cells).

5 10 15 20 25 30 35 40 45 50
50
100
150
200
0
drug treatment
Time (min)
Time Control I-R Control KN-93 KN-92 AIP
No
rmalised
Baselin
e
0 1 10 11 20 21 30 31 40 41 49 500
50
100
150
Time (min)
ITN
Av.
Mag
.
(No
rmalised
)
0 1 10 11 19 20 30 31 40 41 49 500
100
200
300
400
Time (min)
*
ITN
To
tal
(No
rmalised
)
(I-R Control & KN-92)
0 1 10 11 20 21 30 31 40 41 49 500
100
200
300
Time (min)
(KN-92)*
ITN
Len
gth
(No
rmalised
)
Figure 4.16: Time course of the SALVO parameters (Mean only) that describe the baseline and inter-transient activity of the cells when
subjected to simulated I-R. (A) Baseline fluorescence (B) Average magnitude of ITN (C) Length of ITN (D) Total amount of ITN. Data are
normalised (%) to the first recording. None of the parameters had any significant interaction between the treatments and time periods.
Baseline, ITN Length and ITN Total had significant effects within the treatment and time periods, but average magnitude of ITN did not.
Further comparison between the treatment groups means at specific time periods are described in text. Shaded area indicates period of
ischaemia. (* p<0.05 when comparing within the time controls). n = 5-6 cells from 4-5 hearts.
(A)
(B) (C) (D)

205
The data in figure 4.16 can be summarised as follows:
(a) Baseline Intensity
- The rise in baseline [Ca2+
]i was more prominent in the I-R controls and the KN-92
treated cells, peaking at 160.6 ± 22.8% and 151.4 ± 25.8% respectively at 40 min. KN-
93 and AIP groups showed a moderate rise in [Ca2+
]i (114.6 ± 30.3% and 113.1 ±
11.5% respectively), with their mean values matching the time controls at this time
point (114.0 ± 13.3%). Reoxygenation returned the [Ca2+
]i towards the baseline
readings, with some cells treated with the CaMKII inhibitors displaying intensities
below the time control group and their baseline readings. This removal rate
corresponds with the Ca2+
transients’ kinetics as there is an imbalance between the rate
of Ca2+
removal and its release.
(b) ITN Average Magnitude
- The mean data for the ITN Av.Mag suggests that there was no significant difference
between the magnitudes of the localised Ca2+
events (i.e. Ca2+
sparks and other Ca2+
quanta) generated with the time controls and the I-R protocol. At 40 min, a small
consistent rise under normoxic conditions (113.1 ± 2.7%) was comparable to the
ischaemic groups; I-R controls (121.8 ± 15.0), KN-93 (125.3 ± 17.3%), KN-92 (126.8 ±
18.7%), AIP (114.4 ± 9.4%).
- At the end of reoxygenation the magnitude of the Ca2+
sparks had gradually reduced
towards baseline values, although the AIP group maintained some of this activity.
(c) ITN Length
- The total length of time for the ITN activity increased and peaked in all I-R groups at
40 minutes of experimentation; I-R controls (225.0 ± 57.0%), KN-93 (234.7 ± 61.9%),

206
KN-92 (245.9 ± 51.4%), AIP (230.4 ± 66.9%). The large variability came with the cells
that were stunned or generated little Ca2+
transients. When compared with the time
control, only KN-92 was deemed significant at 30 minutes of experimentation.
- The return of Ca2+
transients (at 41 min) reduced the time available for ITN activity
and thus the length of ITN. The Ca2+
dysfunction generated within the AIP group
during the last minutes of experimentation forced a high measurement in ITN length.
(d) ITN Total
- The total amount of ITN was predominantly shaped by the length of time for each ITN
activity. Only the cells treated with KN-92 and I-R control had a total ITN activity
significantly different to the time controls (time control, 104.4 ± 7.0% vs. KN-92, 307.8
± 102.0% and I-R control, 310.3 ± 105.8%). The KN-93 (253.3 ± 48.0%) and AIP
(247.6 ± 78.9%) contained large amount of variability and were not significantly
different to the I-R controls. Return of normoxic perfusate and Ca2+
transients reduced
the total amount of ITN, except for the AIP group.

207
4. Synchrony and conformity within the cells
The five ROI selected within each cell were analysed for the intracellular synchrony of
Ca2+
release. This harmony is critical for E-C coupling. There was no significant
interaction between the measured variables (two-way ANOVA). However, there was
significance amongst the treatment groups and between the time periods. There was a
gradual deterioration between the ROI synchronicity as time progresses through
normoxic and ischaemic conditions (figure 4.17A). The initial ischaemic decline in
Ca2+
transients shape and kinetics did not disrupt the cells global release of Ca2+
.
Nevertheless, during the latter stages of ischaemia (last 5 minutes) and at early stages of
reoxygenation there was a modest disruption when compared to the time controls.
Although all groups deviated from the time controls during the 40th
minute only the I-R
controls were significantly different (time control, 75.1 ±5.8% vs. I-R control, 42.3
±14.1%). A slow recovery in each ROI harmony was restored in all treatment groups
by the end of experimentation.
The deviation between each of the Ca2+
transients’ height was used as a
measurement of regularity and steady state. It would also signify whether there was any
mechanical alternans as any score away from 0 would indicate less regularity. A two-
way ANOVA did not detect any interaction between these variables, but there was
significance amongst the treatment groups and between the various time periods. The
Ca2+
transients did not lose their steady state during ischaemia, but the smaller height of
each transient did moderately reduce the overall deviation. The only significant
deviation (compared to all groups) was with KN-93 treated cells. The first was during
the early ischaemic period, triggered by a sole episode of hypercontracture, and the
other was during the first minute of reoxygenation. The restoration period manifested
the highest degree of mechanical alternans with all treatment groups except for KN-92

208
generating more than the time controls. At the end of experimentation KN-92
maintained this lower degree of deviation although this was not deemed significant to
the other treatment groups.
5 10 15 20 25 30 35 40 45 50
0
20
40
60
80
100
Time Control I-R Control KN-93 KN-92 AIP
drug treatment
*
Time (min)
Syn
ch
ron
y (
%)
5 10 15 20 25 30 35 40 45 50
0.0
0.2
0.4
0.6
0.8
drug treatment
##
Time (min)
Heig
ht
Reg
ula
rity
(S
D)
Figure 4.17: Time course of the SALVO parameters that describe the synchronicity
amongst the cells ROI and regularity of the Ca2+
transients. (A) Synchrony of ROI (B)
Regularity of Ca2+
transient height. A two-way ANOVA determined none of the
parameters had any significant interaction between the treatments and time periods.
Both synchrony and height regularity had significant effects within the treatment and
time periods. Further comparison between the treatment groups means at specific time
periods are described in text. Shaded area indicates period of ischaemia. (* p<0.05
when comparing the time controls with I-R controls, # p<0.05 when comparing KN-93
treated cells with all other treatment groups). n = 5-6 cells from 4-5 hearts.
(A)
(B)

209
4.4. Discussion
The studies’ major findings are summarised as follows:
- Under normoxic conditions the CaMKII inhibitor KN-93 limited the rates of Ca2+
release and removal from adult rat ventricular cells when field stimulated at 1 Hz. The
rate of Ca2+
release might be due to the non-specific activity of the KN compounds as
KN-92 also demonstrated these effects. On these grounds, the sub-hypothesis that the
non-specific activity of the KN compounds will have a comparable limitation on the
cells Ca2+
handling ability can be accepted.
- It was also hypothesised that the CaMKII inhibitor KN-93 and the peptide inhibitor
AIP will have comparable effects on the cells Ca2+
handling ability. This was not
verified during the short exposure times of study 1, or parameters selected by SALVO
measured in study 2. Only by limiting the rise in [Ca2+
]i during ischaemia, were there
any comparable effects, but these were not significantly different to the controls. On
these grounds, this sub-hypothesis can be rejected.
- Simulated I-R had a substantive effect on the cells’ Ca2+
handling, contractile
performance and cell dimensions. This adverse effect on intracellular Ca2+
homeostasis was hypothesised. The parameters measured by the SALVO software
disclosed no significant changes between the cells treated with the CaMKII inhibitors
and the controls. This indicates that CaMKII had no significant activity on these
functional characteristics.
- It was hypothesised that simulated ischaemia would lead to a rise in the diastolic Ca2+
concentration. Despite the marked intracellular changes in Ca2+
handling, only 50% of
the I-R controls had a substantial rise in [Ca2+
]i. There was only a minor rise in [Ca2+
]i
in the presence of the CaMKII inhibitors KN-93 and AIP, but with the inconsistent rise

210
in the control group and the KN-92 treated cells this meant that there were no
significant difference between the treatment groups.
- The presence of the CaMKII inhibitors did not abolish the occurrence of Ca2+
dysfunction during simulated I-R. The inhibitory peptide AIP had the lowest
occurrence of Ca2+
waves during simulated ischaemia, whereas during the last 5
minutes of experimentation KN-93 treated cells had the lowest occurrence of Ca2+
dysfunction.
4.4.1. The Similar Effects of the KN Compounds on Ca2+ Handling
Under normoxic conditions, study 1 revealed that the cells treated with KN-93 or KN-
92 had a significant reduction in their ability to release Ca2+
(figure 4.10). Gao et al.
(2006) demonstrated that both KN-93 and KN-92 can limit the ICa.L without affecting
CaMKII activity. As the [Ca2+
] outside the SR (provided by the ICa.L,) is one element
that can influence the Po of the RYR2 (Fabiato, 1983), the non-specific activity of the
KN compounds could be suggested to have been demonstrated in this study. However,
the rate of Ca2+
release from the RYR2 is also proportional to the total rise in [Ca2+
]i
(Eisner et al., 2009). There was no significant reduction in the height of the Ca2+
transient after any of the KN treatments. Comparative measurements with known
inhibitors of LTCC and K+ channels would further disclose if these occurrences are due
to the drug treatments or artefacts of the experimental design and analysis.
The significant reduction in the Ca2+
transients rate of decay after KN-93
treatment (figure 4.10) was not matched by any of the other groups in study 1 and in
particular, in the presence of KN-92. This replicates the findings of others but in
particular those of DeSantiago et al. (2002). Using rat ventricular myocytes that were
stimulated at 1 Hz (23oC), they demonstrated that 10 minutes treatment of KN-93 (1

211
µM) could significantly limit the rate at which the Ca2+
transients decline. They also
used the CaMKII inhibitory peptide AIP (20 µM) to replicate this limited uptake of Ca2+
and other measurements, such as the Ca2+
transient height to signify a CaMKII specific
role. The much lower concentration of AIP used in this study did not replicate these
findings, but another component to their experiments was the cessation of field
stimulation during drug treatment in order to de-phosphorylate CaMKII. To match
physiological conditions and those of chapter 2, this was not replicated in these studies.
The rate of contraction used in this study is arguably not physiologically
relevant for the rat cardiac myocyte, but it was intended to prevent the artificial
stimulation of CaMKII and allow the measurements in ITN activity. Any rates above 1
Hz would activate Ca2+
transients that lead to autophosphorylation CaMKII (De-
Koninck and Schulman, 1999). This limitation was avoided to ensure that the I-R
experiments were initially void of autonomic CaMKII activity. This could also explain
why only minor reductions were seen in study 1 in the presence of the CaMKII
inhibitors. Studies by Vila-Petroff et al. (2007) have also demonstrated no change in
Ca2+
transient activity when the cells were stimulated at 0.5 Hz in the presence of KN-
93 (1 µM) and AIP (1 µM). At this rate of field stimulation this was also the case with
DeSantiago et al. (2002), as 1 Hz was the minimum rate at which any detectable
changes could be seen in Ca2+
transient activity when CaMKII was inhibited. As no
other aspects of the Ca2+
transients and inter-transient activity were significantly altered,
future studies would benefit from a higher pacing frequency.

212
4.4.2. The Arrhythmic Activity of the CaMKII Inhibitory Peptide
The 40 nM concentration used for AIP was determined by its inhibitory potency (IC50 =
4 nM). At this concentration, AIP under normoxic conditions of study 1, promoted an
uncontrolled arrhythmic activity in 4/7 cells. The SALVO parameters signified these
occurrences within the regularity of the height of the Ca2+
transient (figure 4.10). The
chaotic release of Ca2+
demonstrated in figure 4.8 was absent from all other treatment
groups during study 1, with only one incidence generated at the lower AIP
concentration of 10 nM. The cells lost their Ca2+
handling ability after 45 seconds of
imaging and the observations of the surrounding cells revealed that this was a specific
event to the cells being recorded. The viability of cells can be compromised with
fluorescence imaging. Knight et al. (2003) exposed isolated chondrocytes that had been
loaded with Fluo-4 (5 µM) to 1 hour of confocal imaging (0.8 sec of exposure time
every 10 sec). The reduced viability of the cells 24 hours later was reported to be due to
the generation of ROS when the light interacted with the fluorophore. Why only the
AIP treatment stimulated such activity in study 1 is unknown, but the combination of
the peptide, field stimulation and confocal imaging forced the cells to react in a way that
has not been previously reported. When the imaging was limited to shorter durations in
study 2 (10 seconds every 1 minute), although the total duration stimulated by the
confocal laser was greater, it incurred little Ca2+
transient abnormalities in the time
control cells until later stages of the experiment. The short 10 second period was also
sufficient to capture enough data about the Ca2+
handling properties of the cells (figure
4.6) and would thus also be a suitable approach for future studies under normoxic
conditions.

213
4.4.3. Simulation of I-R conditions
The main focus of the study was to analyse the Ca2+
handling ability of field stimulated
cardiac myocytes during simulated I-R in the presence of two different CaMKII
inhibitors. The analysis of the Ca2+
transients with a multi-parametric tool was to
thoroughly define the involvement of CaMKII under such cellular conditions. To
simulate ischaemic conditions there were three key changes to the extracellular
environment. Removal of glucose and lowering the O2 content of the perfusate was
designed to challenge the metabolic activity of the cells, whilst acidification was
intended to rapidly mimick anaerobic conditions. The cells reacted instantly to the new
environment with the loss of physical contraction (figure 4.11B), a 50% reduction in the
Ca2+
transients’ morphology (figure 4.14) and an increase in length indicative of
swelling (figure 4.11A). Generation of Ca2+
waves, a rise in [Ca2+
]i and Ca2+
dysfunction were all indicative of cellular stress. With complete cessation in contractile
activity, it can be suggested that the ischaemic factors had managed to dissociate E-C
coupling. As reported by Maddaford et al. (1999), with changes in cell morphology,
Ca2+
transient morphology and cessation of contraction, it can be assumed that the cells
were enduring an ischaemic environment.
Such actions can be explained by the known inhibitory effect of acute hypoxia
on the LTCC (Hool, 2000) and the fact that acidosis can decrease the sensitivity of the
contractile apparatus to Ca2+
(Crampin et al., 2006). The latter constituent combined
with a restricted ICa.L. has also been described to lower the systolic Ca2+
transient,
restrict the opening probability of the RYR2 and thus the rate at which Ca2+
was
released globally in the cell. When acidosis alone inhibits the opening of the RYR2 it
allows further loading of Ca2+
into the SR that is subsequently released (Choi et al.,
2000). But under the conditions used in study 2, there was no noticeable recovery in the

214
peak Ca2+
transients during the ischaemic conditions. This suggests that either the
loading of Ca2+
into the SR was not sufficient to install a recovery in peak systolic Ca2+
or, the mechanisms that induce CICR were continuously subdued. Only the generation
of Ca2+
waves at later stages were indicative of an overloaded SR. The [pH]i was not
measured during the study but the onset of cell swelling and the limited contractile
activity would suggest that intracellular acidosis was attained.
It was hypothesised that the cells not exposed to the CaMKII inhibitors would
significantly increase their [Ca2+
]i. Using only hypoxic Tyrode’s solution, Budas et al.
(2004) recorded cell death with Ca2+
overload in paced (0.5 Hz) guinea-pig ventricular
cells, within 16.8 ± 2.8 minutes of experimentation. Subjecting cardiac myocytes
isolated from the rat heart to a hypoxic and ischaemic mimicking solution (high K+, low
pH and high sodium-lactate), can also compel the cells to Ca2+
overload (defined as
135% of baseline values) within a 20 minutes time frame (Chen et al., 2005). The 30
minutes ischaemic period was chosen for study 2 to emulate the index of ischaemia in
chapter 2 and to limit the exposure time of the cells to the confocal imaging. Why there
was discrepancy within these data sets is unidentified. All experimental conditions
were designed to be controllable (i.e. constituents of the solution, the perfusion flow
rate, nitrogen flow rate and temperature) and thus reproducible. Acidosis alone is
known to stimulate a rise in [Ca2+
]i (Orchard et al., 1987). This was a controllable
element of the solutions and thus had to include another condition. The only unknown
extracellular component was the pO2 of the ischaemic solution. Measuring the pO2
during the ischaemic period would have eliminated the possibility of it being a variable
condition, but this was not technically feasible. Several steps are taken to prepare the
isolated cardiac myocytes for Ca2+
imaging. Dissociating cells from the tissue, re-
introducing Ca2+
, their short term culture and loading with the fluorophore all contain

215
agents that can be predicted to enhance or deteriorate the integrity of the cells (taurine,
DMSO, penicillin etc.). But as all cells underwent similar conditions, this should not
have been a significant factor. It is known that at a cellular level there is more of a non-
deterministic nature (stochasticity) to the cells, where as tissue and organ preparations
have more of a deterministic nature (Perc et al., 2008). One possibility is that individual
cells could have reacted differently to the combination of simulated ischaemia and the
artefacts of the confocal laser such as the generation of ROS. Whilst some cells could
have an adverse effect, others might even have been preconditioned by the consistent
short laser treatments.
4.4.4. Involvement of CaMKII During Simulated Ischaemia
At the end of simulated ischaemia there is a non-significant separation in the mean
values of the baseline fluorescence between some of the treatment groups (figure 4.16).
The time controls (113.9 ± 13.3%) and the treatment by both CaMKII inhibitors (KN-
93, 114.6 ± 30.3% & AIP, 113.1 ± 11.5%) are lower than the I-R control (160.6 ±
22.8%) and the KN-92 treated cells (151.4 ± 25.8%). Despite the variability it could be
suggested that CaMKII inhibition does confine the rise in [Ca2+
]i when cells are
subjected to electrical stimulation and an ischaemic mimicking solution. However,
there is nothing in the Ca2+
transients’ morphology, kinetics or their conformity to
suggest that CaMKII inhibition had improved these aspects of the cells’ Ca2+
handling
ability.
Pedersen et al. (2009) measured a greater reduction in peak Ca2+
transients with
KN-93 when cells were stimulated at 0.5 Hz and subjected to 5 minutes of acidification.
It was also suggested that further loading of the Ca2+
into the SR and the incidence of
Ca2+
waves were CaMKII dependent. But the Ca2+
waves that were generated in study

216
2 were frequent after 25 minutes of simulated ischaemia and were not prevented with
KN-93 treatment. Only the inhibitory peptide AIP showed signs of reducing such
uncoordinated release of Ca2+
. Under ischaemic conditions the accumulation of Ca2+
in
the SR would have also been determined by other factors that prevent the release of
Ca2+
from the RYR2 (Yang and Steele, 2001; Valverde et al., 2010). These conditions
would have been suited to propagate further Ca2+
waves. However, as these
occurrences were subdued until the latter stages it can only be suggested that the same
conditions would have limited the activity of CaMKII. Whether this was associated
with the continued suppression of the Ca2+
transients or the change in metabolic
conditions is unknown, but further studies looking at each individual component are
needed. As the CaMKII inhibitors did not prevent the increase in cell size that occurred
in the presence of the ischaemic solutions, it can be suggested that the prevention of
intracellular acidosis and a rising [Na+]i that would have triggered oncotic swelling, are
not within the capacity of the CaMKII inhibitors. Whether or not the reverse mode of
the NCX was triggered is unknown, and would have been dependent on other factors
including the extent of the diminishing ATP pool in maintaining a functional Na+/K
+-
ATPase. It could be that these variables would have been a better predictor of cellular
stress than the rising [Ca2+
]i and possibly have further explained the discrepancies that
occurred between the treatment groups.
4.4.5. Involvement of CaMKII During Restoration of Metabolism
The return of the normoxic Tyrode’s solution reversed the increase in cell length and
restored many components of the E-C coupling that were comparable with the time
controls. These included: contractile activity; the height of Ca2+
transients; the rate of
Ca2+
removal; their synchronisation amongst ROI and the lowering of [Ca2+
]i to pre-

217
ischaemic values. There were signs of cell injury in the parameters that did not match
the time controls (i.e. rate of Ca2+
release, height regularity) and the occurrence of Ca2+
dysfunction. There were no signs of hypercontracture (defined by Dworschank et al.,
2005, as a cell contraction beyond 55% of the resting cell length) and no cell membrane
rupture that would have resulted in cell death. Reperfusion injury is also characterised
by Ca2+
overload (Vila-Petroff et al., 2007), but this was not present in this model.
The mean baseline fluorescence for all treatment groups was maintained for one
minute post reperfusion (figure 4.16), before returning to an equivalent value to the time
controls by the 45th
minute of experimentation. All cells had a similar rate in reducing
their baseline fluorescence allowing the cells treated with CaMKII inhibitors to have an
overall mean value lower than the time control. This suggests that the exchanges in
extracellular environment had stimulated the cells to an enhanced capacity for removal
of Ca2+
from the cells. Other investigations have shown a rapid decline in Ca2+
after
short duration of ischaemia (Marban et al., 1990). But when ischaemic duration lasts
for more than 20 minutes in the ex vivo heart (Miklos et al., 2003) or 45 minutes in a
cellular model (Vila-Petroff et al., 2007) cellular injury is associated with a high [Ca2+
]i.
The rate of Ca2+
removal in all treatment groups was matched to the time
controls within two minutes of reperfusion (figure 4.15). This is interesting as CaMKII
activity was not needed for such recovery. Rat derived cardiac myocytes cycle 92% of
the [Ca2+
]i through the SR (Bers, 2000). As such these cells would have been an ideal
model to disclose if CaMKII inhibition had any ability in reducing the cells capacity to
remove Ca2+
. Surprisingly, KN-93 treated cells had a much improved rate of Ca2+
decay compared to the other treatment groups at 1 minute of reperfusion. Whether this
was due to an increased rate constant as they were also the first to react with greater
peak of Ca2+
transients is unknown.
218
The rate of Ca2+
release was not maintained to the same degree as the time
controls or the pre-ischemic values (figure 4.15). This was in conjunction with a
normal return of the peak Ca2+
transients, indicating that the amount of Ca2+
released
had been maintained. This is a sign of cellular injury and has been noted in ex vivo
models of I-R injury (Miklos et al., 2003). The ROS generated during the restoration of
metabolism may target the large number of sulfhydryls groups on the RYR2 (Eu et al.,
1999). How the RYR2 react to the ROS is thought to depend on their concentration as
small amounts have been shown to increase Po of the RYR2, whilst larger quantities
could produce irreversible damage to the ion channel (Zima and Blatter, 2006).
However, such cellular injury was not reduced by the CaMKII inhibitors.
The cells treated with KN-93 produced the highest recovery in height of each
Ca2+
transient (figure 4.14). This was also evident in the standardised area of the Ca2+
transient. This had occurred by the first minute of restoration and was maintained at a
higher mean value than all groups including the time controls throughout the
reperfusion period. The height of a Ca2+
transient is indicative of a greater load of Ca2+
within the SR (Eisner et al., 2009). This could lead to KN-93 increasing the SR Ca2+
load and explain why there were incidences of Ca2+
waves during the later stages of
ischaemia. But the KN-93 treated cells that had recorded incidences of Ca2+
waves
during ischaemia had no arrhythmic activity during the restoration period. Possibly in
these cells the release of Ca2+
from the SR had succeeded in relieving some of the
demands that were placed on the cells.
If signs of Ca2+
dysfunction during the latter stages of the experiment were to be
used as a marker of injury, the KN-93 treated cells showed better signs of recovery than
any other treatment group (figure 4.13). However, the height regularity and thus the
steady state of the Ca2+
transients were more variable with the CaMKII inhibitors

219
(figure 4.17). KN-93 in particular had incidences in the first minute of reperfusion,
whilst treatment with AIP triggered such activity after three minutes of reperfusion. An
interesting observation is that the KN-92 treated cells had matched the time controls
variability in height of the Ca2+
transients. Thus, although some aspects of Ca2+
handling were improved by CaMKII inhibition not all were beneficial.
4.5. Conclusion
The study was to determine whether CaMKII inhibition would improve the cells’ Ca2+
handling ability during an episode of simulated ischaemia. As Ca2+
overload is a
known marker of cell injury and both CaMKII inhibitors limited the rise in [Ca2+
]i, it
can be suggested that CaMKII inhibition during simulated ischaemia had improved
some aspects of the cells’ Ca2+
handling ability. However, the evidence presented is not
conclusive, due to the variability that occurred with [Ca2+
]i in a number of cells that
were not treated with a CaMKII inhibitor. Also, other global Ca2+
events and
parameters were shown not to have a significant amount of CaMKII activity. Thus,
how two different CaMKII inhibitors can limit a rise in [Ca2+
]i during simulated
ischaemia, without interfering with the cells’ global Ca2+
events warrants further
investigation. It could be that measuring other artefacts of ischaemia, such as [Na+]i or
ROS, would associate better with the effects of the CaMKII inhibitors. Other aspects of
the cells’ Ca2+
handling ability, such as Ca2+
dysfunction in the presence of KN-93,
were improved with CaMKII inhibition. But which parameter is chosen as a marker of
cellular health can also determine the outcome. KN-92 also showed an ability to
improve the steady state of Ca2+
transients that were better than the CaMKII inhibitors.
220
4.6. Study Limitations
There are some limitations that need to be considered with this study. The first is the
constraints placed on the isolated cells due to the nature of the experiments. The
temperature and the rate of stimulation were much lower than those expected for a
cardiac myocyte from a rat heart. The limited activity of CaMKII at 1 Hz has
previously been mentioned, but the lower temperature could also have been a key factor
and can be seen in two ways. Either it would have promoted a quicker rate of CaMKII
autoinactivation (Jama et al., 2009), thus limiting CaMKII activity, or it could have
restricted the phosphatase activity (Valverede et al., 2005), thus promoting the activity
of the CaMKII substrates. The simulation of ischaemic conditions could also not have
truly emulated the pathological condition. Hyperkalemia was intentionally left out of
the ischaemic solution, whilst the build up of the metabolites that is common to
ischaemia, could not have been reproduced within a model that uses a high flow rate.
Although minimal photobleaching is predicted with the use of Fluo4 (Knight et
al., 2003) there are other limitations in using an ion sensitive fluorophore. These
include compartmentalisation, phototoxicity and sensitivity to acidosis. All of these
factors could have distorted aspects of the cells’ Ca2+
handling ability. The 2D confocal
imaging could not have captured the true spatial distribution of Ca2+
, whilst the data
acquisition was only set to record 1/6th
of the whole experiment time. Despite such
limitations, with time permitting the model would be a useful tool to answer further
questions about the ability of pharmacological inhibitors to offset the injury instigated
by simulated ischaemia and reperfusion.

221
CHAPTER 5:
General Discussion

222
5.1. Principal Findings
The principal findings of the thesis are:
(1) In an ex vivo model of regional I-R injury, CaMKII promotes
irreversible injury. Chapter 2 demonstrated that a pharmacological inhibitor of
CaMKII, KN-93, can limit infarct size if it is used prior to index ischaemia. Treatment
of the drug only during reperfusion had no effect on limiting irreversible injury. This
would indicate that CaMKII activity at reperfusion does not promote irreversible injury.
However, it cannot be ruled out that activity of CaMKII at reperfusion may still
promote irreversible injury and that the KN-93 inhibitor is ineffective within this short
time frame.
(2) The mechanical intervention of IPC does not require functional
CaMKII for cardioprotection. In chapter 2 the presence of a CaMKII inhibitor KN-
93, either during the trigger phase of IPC or during the mediator phase of reperfusion
did not abrogate the protection of the intervention. The combined treatments of IPC and
KN-93 had an additive protective effect against myocardial infarction. This could
indicate that two distinct cardioprotective signalling pathways were instigated or that
there was an accumulative regulation of CaMKII activity.
(3) Models of cellular injury in the H9c2 cells do not involve CaMKII
activity. In chapter 3, the two models of cellular injury, simulated I-R and oxidative
stress, subjected to the embryonic cell line H9c2 did not involve CaMKII. The
inhibition of CaMKII by two different pharmacological inhibitors was used to confirm
this. Although there were some minor differences between the cells treated with the
CaMKII inhibitory peptide AIP, it would suggest that the pathway to cell injury in H9c2
cells was independent of CaMKII activity.
223
(4) Cardiac myocytes paced at 1Hz and subjected to simulated I-R do not
involve a significant amount of CaMKII activity in relation to Ca2+
handling.
Chapter 4 disclosed that there was no significant involvement of CaMKII in the cellular
Ca2+
signals analysed by the SALVO software, when the cells had been subjected to 30
minutes of simulated ischaemia and 10 minutes of restoration. Under normoxic
conditions KN-93 treatment had some capacity to limit the cells’ rate of Ca2+
release
and Ca2+
removal. This was not replicated by either of the two CaMKII inhibitors,
during conditions of simulated ischaemia when a substantial decline in Ca2+
regulation
had been instigated in the cells, or after the Ca2+
transients were restored to the cells.
There was a trend in the cells treated with the two CaMKII inhibitors not to raise their
diastolic Ca2+
, as occurred within some of the control cells and the KN-92 treated cells.
For the non-SALVO analysis of Ca2+
abnormalities, treatment of cells with the inhibitor
AIP had the lower incidence of Ca2+
waves by the end of simulated ischaemia, whilst
the KN-93 treated cells had a lower incidence of Ca2+
dysfunction at the end of
restoration period. The rate of Ca2+
release was also altered in cells treated with an
inactive analog of KN-93, KN-92, during the normoxic studies and indicates some
unspecific characteristics of these compounds.

224
5.2. The Work in Context
The multifunctional CaMKII is widely thought of as a key mediator of several
cardiovascular diseases as it has been shown to be pro-hypertrophic and pro-arrhythmic.
However, its involvement in AMI is less clear. Previous experimental data, primarily
from the laboratory of Mattiazzi, suggest that pharmacological inhibition of CaMKII
during long ischaemic periods and at early reperfusion can prevent cell death by
necrosis and apoptosis. Several more studies using in vitro models of chronic cellular
stress support this notion, as cell death can be limited if the mishandling of Ca2+
by
CaMKII is abrogated. Yet, shorter durations of ischaemia and models of myocardial
stunning are believed to require CaMKII to maintain contractile activity. With
interventions such as IHA and volatile anaesthetics also reported to require an active
CaMKII to instigate cardioprotection from I-R injury, the role of CaMKII remained to
be determined.
The data presented in chapter 2 support the concept that CaMKII has a pro-
injury role during I-R. When a pharmacological inhibitor of CaMKII was present
during index ischaemia the extent of myocardial infarction was limited. This replicates
the findings of Vila-Petroff et al. (2007) and Salas et al. (2010). Chapter 2 dissociates
from these two studies however, as it also questions the timing of the intervention. This
disclosed that CaMKII inhibition is only effective against irreversible injury when it is
used as a pre-ischaemic treatment. Consequently, as AMI is in the majority of cases an
unpredictable occurrence, it seems that CaMKII inhibition may not be an appropriate
strategy during reperfusion therapy. But operations such as organ transplant and CABG
do have a scheduled period of I-R and could thus benefit from pharmacological
inhibition of CaMKII. The data in chapter 2 also support a strategy where a prior
intervention such as IPC can be further enhanced if it is combined with a CaMKII

225
inhibitor. This confirms what was seen with the hearts of mice by Li et al. (2007) in
their model of a GM CaMKII. The previous studies in the rat heart suggested that
CaMKII is a mediator for the IPC improvements in contractile activity (Osada et al.,
2000; Benter et al., 2005). Chapter 2 is the first to propose that within these species
CaMKII activity is not a pre-requisite for cardioprotection by IPC, if infarct is used as a
final end point of injury. Thus it can be concluded that CaMKII is a mechanism that
supports irreversible injury.
Interventions that target early reperfusion are used to disclose the signalling
pathways that mediate their effects during this critical period. Although the model used
by Vila-Petroff et al. (2007) and Salas et al. (2010) had pre-treated hearts with KN-93, it
is believed that CaMKII activity during reperfusion (via the NCX and the SR) promotes
necrosis and apoptosis. The data from chapter 2 questions this assumption. Chapter 3
and 4 were designed to recreate the findings of chapter 2 in cell model in order to
interrogate these hypotheses further by using methods that are unavailable in the
Langendorff model. Chapter 3 revealed that the H9c2 cell line subjected to injury by
simulated ischaemia or oxidative stress does not involve CaMKII activity. This study
was the first to interrogate CaMKII within this cell line using such models, as previous
studies have tended to use primary cells. Whether the lack of reversible injury was due
to different mechanism of injury or a deficient CaMKII expression was not further
pursued.
Consequently, chapter 4 used field stimulated primary ventricular myocytes
from the rat heart in order to analyse their Ca2+
handling properties with and without the
CaMKII inhibitors. Although the model followed similar conditions used in previous
studies, this study was distinctive in its characterisation of Ca2+
activity during the
simulated ischaemic period. A detailed analysis of these variables by the SALVO

226
software revealed no significant involvement of CaMKII. Under normoxic conditions,
the CaMKII inhibitors had minimal influence on the Ca2+
transients suggesting that
there was negligible CaMKII activity when the cells were paced at 1Hz. This confirms
the findings by DeSantiago et al. (2002) and Vila-Petroff et al. (2007). The decision to
analyse inter-transient activity for low-amplitude Ca2+
events constrained the use of a
higher pacing rate. With a significant depression also occurring to the cells Ca2+
handling properties during simulated ischaemia, it could be speculated that within this
model CaMKII activity would have been continually suppressed. This would imply that
ischaemia does not promote the kinase’s activity. Such conclusions were made by
Netticadan et al. (1999) and Osada et al. (2000) who measured alterations in CaMKII
activity contained within the SR vesicles during I-R.
With these findings in mind, why do the studies in chapter 2 and those within
the literature need pre-treatment of a pharmacological inhibitor of CaMKII (or a GM
CaMKII) for cardioprotection? In chapter 4 there was no rise in [Ca2+
]i when cells were
treated with the CaMKII inhibitors. Was this a favourable condition instigated by the
CaMKII inhibitors? As not all cells within the two control groups responded with a
rising [Ca2+
]i it can not be concluded that this was a CaMKII-mediated event. Also,
CaMKII is regulated by ATP, Ca2+
/CaM, and oxidative stress; these are all present
during the reperfusion period. Thus the only conclusion that can be drawn is that the
inhibitors are ineffective within the short time period of early reperfusion, to effect the
favourable changes needed to salvage reperfused myocardium.
There was also a trend for some protection in chapter 2 when the inactive analog
KN-92 was used as a pre-treatment. This indicated that the non-specific activity of the
compound could be at work with KN-93. Chapter 4 indicated that this could be the rate
that Ca2+
is released in the cell, which would correlate with what is already known about

227
their activity on specific ion channels. Where the two KN compounds differed, was that
KN-92 showed similar signs to the I-R control group in subjecting some cells to a rise
in intracellular Ca2+
during ischaemia.
CaMKII is up-regulated during pathological hypertrophy and has recently been
described as having therapeutic potential (Sossalla et al., 2010). It is plausible that in
the future patients will be treated chronically to suppress CaMKII activity. On the basis
of the data in this thesis such pre-treatment could also be beneficial to conditions of
acute coronary syndromes and justify further research in the field.
5.3. Limitations of the Thesis and Future Outlook
Whether pre-ischaemic treatment of KN-93 abrogates the activity of CaMKII at
reperfusion, would have answered some key questions in this thesis and in the literature.
A detailed western analysis on CaMKII activity during such conditions was attempted,
but the inability to find suitable conditions for the antibodies limited the data that was
able to be presented.
With time permitting the data from chapter 4 could be expanded with some
modifications of the model. The rate at which the cardiac myocytes were paced,
physiological temperature and prolonging the duration of simulated ischaemia could all
be further investigated. The aim was to have additional treatment groups of
pharmacological inhibitors during simulated ischaemia and at the beginning of the
restoration period. Such interventions can not be performed within whole hearts and
this justifies the use of in vitro analysis to interrogate CaMKII activity during
ischaemia. With hindsight, a detailed analysis of the Ca2+
handling parameters with the
SALVO software should be implemented once a successful strategy is determined. This
would also enable several methods (such as other ion fluorescent indicators) to be
228
instigated at a key time point rather than throughout the protocol. As CaMKII is a
multifunctional kinase, understanding its role holds great potential within an
environment such as I-R. The use of healthy hearts within these studies also fails to
capture the progression of CaMKII that occurs with CVD, which would add further
complexity (or even normality) to such future investigations. Indeed, the absence of
common comorbidities, such as hypertension in most I-R models is now recognised as a
major general limitation (Ferdinandy et al., 2007).
And a major limitation is the reliance on pharmacological inhibitors. Ideally, a
fuller approach would complement the pharmacology with molecular genetic
approaches e.g. siRNA, knock out, dominant negative mutants etc.

229
5.4. Concluding Remarks
The research in this thesis confirms the notion that pharmacological inhibition of
CaMKII during AMI can prevent irreversible injury. It also confirms that an early
intervention such as IPC does not require a functional CaMKII to mediate its
cardioprotection. Thus, the potential for salvageable tissue during AMI will be
enhanced in the absence of CaMKII activity. It raises questions on whether an
intervention targeting CaMKII during reperfusion therapy can be successful; and the
nature of the cells or the conditions required for CaMKII to mediate cellular injury. As
stated in chapter one the thesis sought to provide answers to the following questions:
i) Is CaMKII involved in promoting irreversible injury caused by acute myocardial
infarction?
ii) Does the phenomenon of IPC and postconditioning involve CaMKII?
iii) Under conditions of simulated I-R, what effect does pharmacological blockade
of CaMKII have on the Ca2+
handling properties of the cells?
The net result of the thesis is that it establishes CaMKII as having deleterious
consequences during I-R and that a natural phenomenon such as IPC does not recruit
CaMKII activity. Thus it answers the first two proposed questions of the thesis. Only
some conclusions can be drawn about the effects of the pharmacological inhibitors on
Ca2+
handling, but the information provided gives further details about the
characteristics of the kinase within the current in vitro and ex vivo models of I-R. I
conclude that CaMKII is an intricate regulator of cellular signalling, that promotes
injury under conditions of I-R injury. As such, understanding its role in I-R may
underpin the development of future therapeutic strategies for the management of AMI.

230
Appendices Appendix 1.1: Components of High Glucose DMEM, Invitrogen

231
Appendix 1.2: Components of PBS, Invitrogen
Appendix 1.3: Components of M199 medium, Sigma-Aldrich
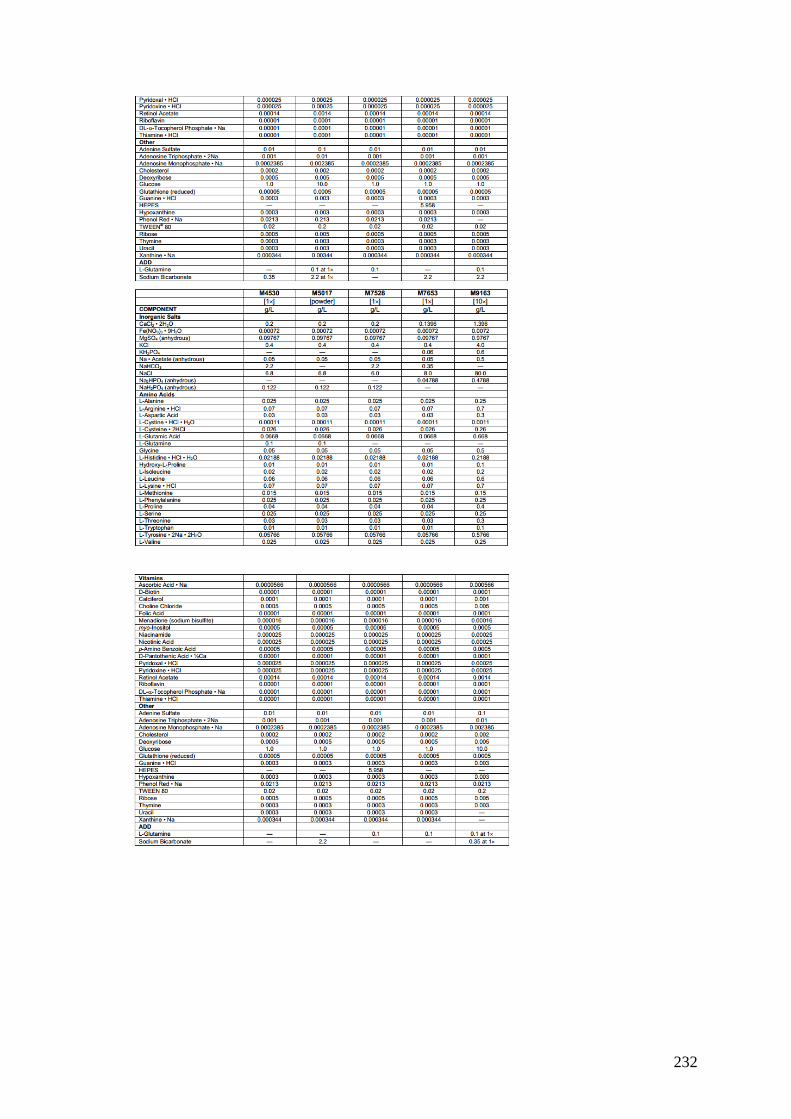
232

Appendix 2.1
5 10 15 20 25 30 35 40 45 50
0
50
100
150
Time Control I-R Control KN-93 KN-92 AIP
Drug treatment
* * * * * * * * * * *
Time (min)S
tan
dard
ised
Are
a
(No
rmalised
)
0 1 10 11 20 21 30 31 40 41 49 500.0
0.5
1.0
1.5# (KN-93)
Time (min)
Len
gth
(seco
nd
s)
0 1 10 11 20 21 30 31 40 41 49 500
50
100
150
* * * * * *
Time (min)
Heig
ht
(No
rmalised
)
0 1 10 11 20 21 30 31 40 41 49 500
50
100
150
Time (min)
Mean
In
ten
sit
y
(No
rmalised
)
Replica of Figure 4.14: Time course of the SALVO parameters (Mean ± SEM) that describe the cells Ca2+
transients’ morphology, when
subjected to simulated I-R. (A) Standardised Area (B) Length of Ca2+
transient (C) Height of Ca2+
transient (D) Mean intensity of [Ca2+
]i. All
data, except for length, is normalised (%) to the first recording. (B-D) are selected time points through the time course. In all parameters, two-
way ANOVA detected no significant interaction between the treatment groups and time. There was a significance detected with treatment and
with time. The significance between the groups is described in text. Shaded area indicates period of ischaemia. * p<0.05 when comparing I-R
Control vs. Time Control, # p<0.05 I-R Control vs. the labelled drug treatment. n = 5-6 cells from 4-5 hearts.
(A)
(B) (C) (D)
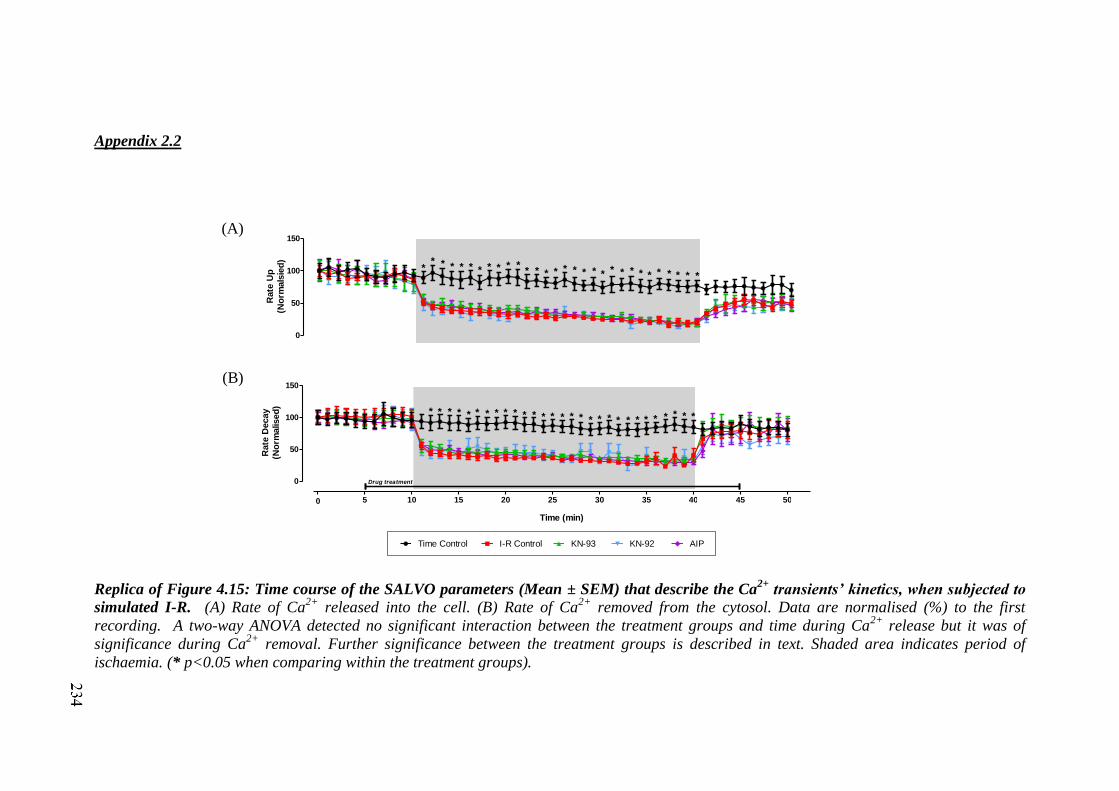
Appendix 2.2
0
50
100
150
* * * * * * * * * ** * * * * * * * * * * * * * * * * * *
*R
ate
Up
(No
rmals
ied
)
5 10 15 20 25 30 35 40 45 50
0
50
100
150
0
*
Drug treatment
Time Control I-R Control KN-93 KN-92 AIP
* * * * * * * * * * * * * * * * * * * * * * * * * * * *
Time (min)
Rate
Decay
(No
rmalised
)
Replica of Figure 4.15: Time course of the SALVO parameters (Mean ± SEM) that describe the Ca2+
transients’ kinetics, when subjected to
simulated I-R. (A) Rate of Ca2+
released into the cell. (B) Rate of Ca2+
removed from the cytosol. Data are normalised (%) to the first
recording. A two-way ANOVA detected no significant interaction between the treatment groups and time during Ca2+
release but it was of
significance during Ca2+
removal. Further significance between the treatment groups is described in text. Shaded area indicates period of
ischaemia. (* p<0.05 when comparing within the treatment groups).
(A)
(B)

Appendix 2.3
5 10 15 20 25 30 35 40 45 50
50
100
150
200
0
drug treatment
Time (min)
Time Control I-R Control KN-93 KN-92 AIP
No
rmalised
Baselin
e
0 1 10 11 20 21 30 31 40 41 49 500
50
100
150
200
Time (min)
ITN
Av.
Mag
.
(No
rmalised
)
0 1 10 11 20 21 30 31 40 41 49 500
100
200
300
400
Time (min)
(KN-92)
*
ITN
Len
gth
(No
rmalised
)
0 1 10 11 19 20 30 31 40 41 49 500
100
200
300
400
500
Time (min)
*
ITN
To
tal
(No
rmalised
)
Replica of Figure 4.16: Time course of the SALVO parameters (Mean ± SEM) that describe the baseline and inter-transient activity of the
cells when subjected to simulated I-R. (A) Baseline fluorescence (B) Average magnitude of ITN (C) Length of ITN (D) Total amount of ITN.
Data are normalised (%) to the first recording. None of the parameters had any significant interaction between the treatments and time periods.
Baseline, ITN Length and ITN Total had significant effects within the treatment and time periods, but average magnitude of ITN did not. Further
comparison between the treatment groups means at specific time periods are described in text. Shaded area indicates period of ischaemia. (*
p<0.05 when comparing within the time controls).
(A)
(B) (C) (D)

Appendix 2.4
5 10 15 20 25 30 35 40 45 50
0
20
40
60
80
100
Time Control I-R Control KN-93 KN-92 AIP
drug treatment
*
Time (min)
Syn
ch
ron
y (
%)
5 10 15 20 25 30 35 40 45 50
0.0
0.2
0.4
0.6
0.8
1.0
drug treatment
#
#
Time (min)
Heig
ht
Reg
ula
rity
(S
D)
Replica of Figure 4.17: Time course of the SALVO parameters (Mean ± SEM) that describe the synchronicity amongst the cells ROI and
regularity of the Ca2+
transients. (A) Synchrony of ROI (B) Regularity of Ca2+
transient height. A two-way ANOVA determined none of the
parameters had any significant interaction between the treatments and time periods. Both synchrony and height regularity had significant effects
within the treatment and time periods. Further comparison between the treatment groups means at specific time periods are described in text.
Shaded area indicates period of ischaemia. (* p<0.05 when comparing the time controls with I-R controls, # p<0.05 when comparing KN-93
treated cells with all other treatment groups).
(A)
(B)

237
References
Abraham ST, Benscoter HA, Schworer CM, Singer HA. (1997). A role for
Ca2+
/calmodulin-dependent protein kinase II in the mitogen-activated protein
kinase signaling cascade of cultured rat aortic vascular smooth muscle cells. Circ
Res.;81(4):575-84.
Agnetti G, Maraldi T, Fiorentini D, Giordano E, Prata C, Hakim G, Muscari C,
Guarnieri C, Caldarera CM. (2005). Activation of glucose transport during
simulated ischemia in H9c2 cardiac myoblasts is mediated by protein kinase C
isoforms. Life Sci. 5; 78(3):264-70.
Ai X, Curran JW, Shannon TR, Bers DM, Pogwizd SM. (2005). Ca2+
/calmodulin-
dependent protein kinase modulates cardiac ryanodine receptor phosphorylation
and sarcoplasmic reticulum Ca2+
leak in heart failure. Circ Res.; 97(12):1314-22.
Aiba T, Hesketh GG, Liu T, Carlisle R, Villa-Abrille MC, O'Rourke B, Akar FG,
Tomaselli GF. (2010). Na+ channel regulation by Ca
2+/calmodulin and
Ca2+
/calmodulin-dependent protein kinase II in guinea-pig ventricular myocytes.
Cardiovasc Res.; 85(3):454-63.
Akaishi M, Ikegawa T, Nishikawa Y, Yokozuka H, Handa S, Nakamura Y.
(1991).Variations in myocardial contraction sequence under various hypoxic cond
itions. Basic Res Cardiol.; 86(4):363-77.
Akatsuka Y, Egashira K, Katsuda Y, Narishige T, Ueno H, Shimokawa H, Takeshita A.
(1994). ATP sensitive potassium channels are involved in adenosine A2 receptor
mediated coronary vasodilatation in the dog. Cardiovasc Res.; 28(6):906-11.
Aki T, Mizukami Y, Oka Y, Yamaguchi K, Uemura K, Fujimiya T, Yoshida K. (2001).
Phosphoinositide 3-kinase accelerates necrotic cell death during hypoxia.
Biochem J.; 358(Pt 2):481-7.
Allen DG, Cairns SP, Turvey SE, Lee JA. (1993). Intracellular calcium and myocardial
function during ischemia. Adv Exp Med Biol. ; 346:19-.29.
Anderson ME, Braun AP, Schulman H, Premack BA. (1994). Multifunctional
Ca2+
/calmodulin-dependent protein kinase mediates Ca2+
-induced enhancement of
the L-type Ca2+
current in rabbit ventricular myocytes. Circ Res.; 75(5):854-61.

238
Anderson ME. (2007). Multiple downstream proarrhythmic targets for calmodulin
kinase II: moving beyond an ion channel-centric focus. Cardiovasc Res. ;
73(4):657-66.
Anderson ME. (2009). Sticky fingers: CaMKII finds a home on another ion channel.
Annu Rev Med.; 42:225-46.
Argaud L, Gateau-Roesch O, Augeul L, Couture-Lepetit E, Loufouat J, Gomez
L, Robert D, Ovize M. (2008). Increased mitochondrial calcium coexists with
decreased reperfusion injury in postconditioned (but not preconditioned) hearts.
Am J Physiol Heart Circ Physiol.; 294(1):H386-91.
Argaud L, Gateau-Roesch O, Chalabreysse L, Gomez L, Loufouat J, Thivolet-Béjui F,
Robert D, Ovize M. (2004). Preconditioning delays Ca2+
-induced mitochondrial
permeability transition. Cardiovasc Res.; 61(1):115-22.
Argaud L, Gateau-Roesch O, Raisky O, Loufouat J, Robert D, Ovize M. (2005).
Postconditioning inhibits mitochondrial permeability transition. Circulation;
111(2):194-7.
Backs J, Song K, Bezprozvannaya S, Chang S, Olson EN. (2006). CaM kinase II
selectively signals to histone deacetylase 4 during cardiomyocyte hypertrophy. J
Clin Invest.; 116(7):1853-64.
Bahi N, Zhang J, Llovera M, Ballester M, Comella JX, Sanchis D. (2006). Switch from
caspase-dependent to caspase-independent death during heart development:
essential role of endonuclease G in ischemia-induced DNA processing of
differentiated cardiomyocytes. J Biol Chem.; 281(32):22943-52.
Baines CP, Goto M, Downey JM. (1997). Oxygen radicals released during ischemic
preconditioning contribute to cardioprotection in the rabbit myocardium. J Mol
Cell Cardiol.; 29(1):207-16.
Baker JE, Holman P, Gross GJ. (1999). Preconditioning in immature rabbit hearts: role
of KATP channels. Circulation.; 99(9):1249-54.
Banerjee A, Locke-Winter C, Rogers KB, Mitchell MB, Brew EC, Cairns CB, Bensard
DD, Harken AH. (1993). Preconditioning against myocardial dysfunction after
ischemia and reperfusion by an alpha 1-adrenergic mechanism. Circ Res.;
73(4):656-70.

239
Bär FW, Tzivoni D, Dirksen MT, Fernández-Ortiz A, Heyndrickx GR, Brachmann
J, Reiber JH, Avasthy N, Tatsuno J, Davies M, Hibberd MG, Krucoff
MW; CASTEMI Study Group. (2007). Results of the first clinical study of
adjunctive CAldaret (MCC-135) in patients undergoing primary percutaneous
coronary intervention for ST-Elevation Myocardial Infarction: the randomized
multicentre CASTEMI study. Eur Heart J.; 27(21):2516-23.
Bare DJ, Kettlun CS, Liang M, Bers DM, Mignery GA. (2005). Cardiac type 2 inositol
1,4,5-trisphosphate receptor: interaction and modulation by calcium/calmodulin-
dependent protein kinase II. J Biol Chem.; 280(16):15912-20.
Barry DM, Nerbonne JM. (1996). Myocardial potassium channels: electrophysiological
and molecular diversity. Annu Rev Physiol. ;58:363-94.
Barry WH, Peeters GA, Rasmussen CA Jr, Cunningham MJ. (1987). Role of changes in
[Ca2+
]i in energy deprivation contracture. Circ Res; 61(5):726-34.
Baxter GF, Mocanu MM, Yellon DM. (1997). Attenuation of myocardial ischaemic
injury 24 h after diacylglycerol treatment in vivo. J Mol Cell Cardiol.;
29(7):1967-75.
Baxter GF, Yellon DM. (1993). Attenuation of reperfusion-induced ventricular
fibrillation in the rat isolated hypertrophied heart by preischemic diltiazem
treatment. Cardiovasc Drugs Ther.;7(2):225-31.
Beard NA, Laver DR, Dulhunty AF. (2004 ). Calsequestrin and the calcium release
channel of skeletal and cardiac muscle. Prog Biophys Mol Biol.; 85(1):33-69.
Bell RM, Mocanu MM, Yellon DM. (2011). Retrograde heart perfusion:
the Langendorff technique of isolated heart perfusion. J Mol Cell
Cardiol.;50(6):940-50.
Benter IF, Juggi JS, Khan I, Akhtar S. (2004). Inhibition of Ras-GTPase, but not
tyrosine kinases or Ca2+
/calmodulin-dependent protein kinase II, improves
recovery of cardiac function in the globally ischemic heart. Mol Cell Biochem.;
259(1-2):35-42.
Benter IF, Juggi JS, Khan I, Yousif MH, Canatan H, Akhtar S. (2005). Signal
transduction mechanisms involved in cardiac preconditioning: role of Ras-
GTPase, Ca2+
/calmodulin-dependent protein kinase II and epidermal growth
factor receptor. Mol Cell Biochem.; 268(1-2):175-83.
Berridge MJ. (2009). Inositol trisphosphate and calcium signalling mechanisms.
Biochim Biophys Acta.; 1793(6):933-40.
240
Bers DM. (2000). Calcium fluxes involved in control of cardiac myocyte contraction.
Circ Res.; 87(4):275-81.
Bers DM. (2002). Cardiac excitation-contraction coupling. Nature. 10; 415(6868):198-
205.
Billman GE. (2008). The cardiac sarcolemmal ATP-sensitive potassium channel as a
novel target for anti-arrhythmic therapy. Pharmacol Ther.; 120(1):54-70.
Birnbaum Y, Leor J, Kloner RA. (1997). Pathobiology and Clinical Impact of
Reperfusion Injury. J Thromb Thrombolysis.; 4(2):185-195.
Bonavita F, Stefanelli C, Giordano E, Columbaro M, Facchini A, Bonafè F, Caldarera
CM, Guarnieri C. (2003). H9c2 cardiac myoblasts undergo apoptosis in a model
of ischemia consisting of serum deprivation and hypoxia: inhibition by PMA.
FEBS Lett.;536(1-3):85-91.
Bootman MD, Fearnley C, Smyrnias I, MacDonald F, Roderick HL. (2009). An update
on nuclear calcium signalling. J Cell Sci.; 122(Pt 14):2337-50.
Bootman MD, Lipp P, Berridge MJ. (2001). The organisation and functions of local
Ca2+
signals. J Cell Sci.; 114(Pt 12):2213-22.
Bossuyt J, Helmstadter K, Wu X, Clements-Jewery H, Haworth RS, Avkiran M, Martin
JL, Pogwizd SM, Bers DM. (2008). Ca2+
/calmodulin-dependent protein kinase
IIdelta and protein kinase D overexpression reinforce the histone deacetylase 5
redistribution in heart failure. Circ Res.; 102(6):695-702.
Bøtker HE, Kharbanda R, Schmidt MR, Bøttcher M, Kaltoft AK, Terkelsen CJ, Munk
K, Andersen NH, Hansen TM, Trautner S, Lassen JF, Christiansen EH, Krusell
LR, Kristensen SD, Thuesen L, Nielsen SS, Rehling M, Sørensen HT, Redington
AN, Nielsen TT. (2010). Remote ischaemic conditioning before hospital
admission, as a complement to angioplasty, and effect on myocardial salvage in
patients with acute myocardial infarction: a randomised trial. Lancet.;
375(9716):727-34.
Brar BK, Jonassen AK, Stephanou A, Santilli G, Railson J, Knight RA, Yellon DM,
Latchman DS. (2000). Urocortin protects against ischemic and reperfusion injury
via a MAPK-dependent pathway. J Biol Chem. 24; 275(12):8508-14.
Braun AP, Schulman H. (1995). The multifunctional calcium/calmodulin-dependent
protein kinase: from form to function. Annu Rev Physiol.;57:417-45.
Bridge JH, Ershler PR, Cannell MB. (1999). Properties of Ca2+
sparks evoked by action
potentials in mouse ventricular myocytes. Journal of Physiology; 518:469–478.
241
Bridge JH, Smolley JR, Spitzer KW. (1990 ). The relationship between charge
movements associated with ICa and INa-Ca in cardiac myocytes. Science;
248(4953):376-8.
British Heart Foundation (2010) Coronary heart Disease Statistics, 7th Edition.
Peter Scarborough, Prachi Bhatnagar, Kremlin Wickramasinghe, Kate Smolina,
Colin Mitchell and Mike Raymer. Department of Public health, University of
Oxford.
British Heart Foundation (2011) Trends in coronary heart disease, 1961-2011.
Peter Scarborough , Prachi Bhatnagar, Kremlin Wickramasinghe, Mike Raymer.
Department of Public health, University of Oxford.
Brookes PS, Yoon Y, Robotham JL, Anders MW, Sheu SS. (2004). Calcium, ATP, and
ROS: a mitochondrial love-hate triangle. Am J Physiol Cell Physiol.;
287(4):C817-33.
Buck J, Sinclair ML, Schapal L, Cann MJ, Levin LR. (1999). Cytosolic adenylyl
cyclase defines a unique signaling molecule in mammals. Proc Natl Acad Sci U S
A.; 96(1):79-84.
Budas GR, Jovanovic S, Crawford RM, Jovanovic A. (2004). Hypoxia-induced
preconditioning in adult stimulated cardiomyocytes is mediated by the opening
and trafficking of sarcolemmal KATP channels. FASEB J.; 18(9):1046-8.
Buja LM. (2005). Myocardial ischemia and reperfusion injury. Cardiovasc
Pathol.;14(4):170-5.
Buja LM, Weerasinghe P. (2010). Unresolved issues in myocardial reperfusion injury.
Cardiovasc Pathol.; 19(1):29-35.
Burley DS, Baxter GF. (2007). B-type natriuretic peptide at early reperfusion limits
infarct size in the rat isolated heart. Basic Res Cardiol. 2007 Nov;102(6):529-41.
Burley DS, Baxter GF. (2009). Pharmacological targets revealed by myocardial
postconditioning. Curr Opin Pharmacol.; 9(2):177-88.
Carmeliet E. (1999). Cardiac ionic currents and acute ischemia: from channels to
arrhythmias. Physiol Rev.; 79(3):917-1017.
Cartwright EJ, Schuh K, Neyses L. (2005). Calcium transport in cardiovascular health
and disease--the sarcolemmal calcium pump enters the stage. J Mol Cell Cardiol.;
39(3):403-6.

242
Chai Y, Zhang DM, Lin YF. (2011). Activation of cGMP-dependent protein kinase
stimulates cardiac ATP-sensitive potassium channels via a
ROS/calmodulin/CaMKII signaling cascade. PLoS One. 29; 6(3):e18191.
Chaitman BR, Laddu AA. (2011). Stable angina pectoris: antianginal therapies and
future directions. Nat Rev Cardiol.; 9(1):40-52.
Chang BH, Mukherji S, Soderling TR. (1998). Characterization of a calmodulin
kinase II inhibitor protein in brain. Proc Natl Acad Sci U S A ; 95(18):10890-5.
Chao LH, Stratton MM, Lee IH, Rosenberg OS, Levitz J, Mandell DJ, Kortemme T,
Groves JT, Schulman H, Kuriyan J. (2011). A mechanism for tunable
autoinhibition in the structure of a human Ca2+
/calmodulin- dependent kinase II
holoenzyme. Cell.; 146(5):732-45.
Chelu MG, Sarma S, Sood S, Wang S, van Oort RJ, Skapura DG, Li N, Santonastasi M,
Müller FU, Schmitz W, Schotten U, Anderson ME, Valderrábano M, Dobrev D,
Wehrens XH. (2009). Calmodulin kinase II-mediated sarcoplasmic reticulum Ca2+
leak promotes atrial fibrillation in mice. J Clin Invest.; 119(7):1940-51.
Chen X, Zhang X, Kubo H, Harris DM, Mills GD, Moyer J, Berretta R, Potts ST, Marsh
JD, Houser SR. (2005). Ca2+
influx-induced sarcoplasmic reticulum Ca2+
overload
causes mitochondrial-dependent apoptosis in ventricular myocytes. Circ Res. ;
97(10):1009-17.
Chen ZC, Yu BC, Chen LJ, Cheng KC, Lin HJ, Cheng JT. (2011). Characterization of
the mechanisms of the increase in PPARδ expression induced by digoxin in the
heart using the H9c2 cell line. Br J Pharmacol.; 163(2):390-8.
Cheng H, Lederer WJ. (2008). Calcium sparks. Physiol Rev.; 88(4):1491-545.
Choi HS, Trafford AW, Orchard CH, Eisner DA. (2000). The effect of acidosis on
systolic Ca2+
and sarcoplasmic reticulum calcium content in isolated rat
ventricular myocytes. J Physiol.; 529 Pt 3:661-8.
Chu CH, Tzang BS, Chen LM, Kuo CH, Cheng YC, Chen LY, Tsai FJ, Tsai CH, Kuo
WW, Huang CY. (2008). IGF-II/mannose-6-phosphate receptor signaling induced
cell hypertrophy and atrial natriuretic peptide/BNP expression via Galphaq
interaction and protein kinase C-alpha/CaMKII activation in H9c2 cardiomyoblast
cells. J Endocrinol.; 197(2):381-90.
Cleland J.G., McDonagh T., Rigby A.S., Yassin A., Whittaker T., Dargie H.J. (2010)
The national heart failure audit for England and Wales 2008-2009. Heart
97(11):876-86.

243
Cohen MV, Downey JM. (2011). Is it time to translate ischemic preconditioning's
mechanism of cardioprotection into clinical practice? J Cardiovasc Pharmacol
Ther.; 16(3-4):273-80.
Cohen MV, Yang XM, Downey JM. (2007). The pH hypothesis of postconditioning:
staccato reperfusion reintroduces oxygen and perpetuates myocardial acidosis.
Circulation.; 115(14):1895-903.
Colbran RJ. (1993). Inactivation of Ca2+
/calmodulin-dependent protein kinase II by
basal autophosphorylation. J Biol Chem.; 268(10):7163-70.
Colinas O, Gallego M, Setién R, López-López JR, Pérez-García MT, Casis O. (2006).
Differential modulation of Kv4.2 and Kv4.3 channels by calmodulin-dependent
protein kinase II in rat cardiac myocytes. Am J Physiol Heart Circ Physiol.;
291(4):H1978-87.
Colomer JM, Mao L, Rockman HA, Means AR. (2003). Pressure overload selectively
up-regulates Ca2+
/calmodulin-dependent protein kinase II in vivo. Mol
Endocrinol.; 17(2):183-92.
Costa AD, Garlid KD, West IC, Lincoln TM, Downey JM, Cohen MV, Critz SD.
(2005). Protein kinase G transmits the cardioprotective signal from cytosol to
mitochondria. Circ Res.; 97(4):329-36.
Crampin EJ, Smith NP, Langham AE, Clayton RH, Orchard CH. (2006). Acidosis in
models of cardiac ventricular myocytes. Philos Transact A Math Phys Eng Sci.;
364(1842):1171-86.
Crisostomo PR, Wairiuko GM, Wang M, Tsai BM, Morrell ED, Meldrum DR. (2006).
Preconditioning versus postconditioning: mechanisms and therapeutic potentials.
J Am Coll Surg.; 202(5):797-812.
Currie S, Loughrey CM, Craig MA, Smith GL. (2004). Calcium/calmodulin-dependent
protein kinase IIdelta associates with the ryanodine receptor complex and
regulates channel function in rabbit heart. Biochem J.; 377(Pt 2):357-66.
De-Koninck P, Schulman H. (1998) Sensitivity of CaM kinase II to the frequency of
Ca2+ oscillations. Science. 279: 227-30.
Demaurex N, Distelhorst C. (2003). Cell biology. Apoptosis--the calcium connection.
Science.; 300(5616):65-7.
Demchenko, Alexander P. (2009). Introduction to Fluorescence Sensing. Springer
Science+Business Media B.V.

244
Derwall M, Coburn M, Rex S, Hein M, Rossaint R, Fries M. (2009). Xenon: recent
developments and future perspectives. Minerva Anestesiol.; 75(1-2):37-45.
DeSantiago J, Maier LS, Bers DM. (2002). Frequency-dependent acceleration of
relaxation in the heart depends on CaMKII, but not phospholamban. J Mol Cell
Cardiol.; 34(8):975-84.
Di Lisa F, Bernardi P. (2006). Mitochondria and ischemia-reperfusion injury of the
heart: fixing a hole. Cardiovasc Res.; 70(2):191-9.
Di Lisa F, Menabò R, Canton M, Barile M, Bernardi P. (2001). Opening of the
mitochondrial permeability transition pore causes depletion of mitochondrial and
cytosolic NAD+ and is a causative event in the death of myocytes in postischemic
reperfusion of the heart. J Biol Chem.; 26;276(4):2571-5.
Diaz RJ, Wilson GJ. (2006). Studying ischemic preconditioning in isolated
cardiomyocyte models. Cardiovasc Res.; 70(2):286-96.
Dong Z, Saikumar P, Weinberg JM, Venkatachalam MA. (2006). Calcium in cell injury
and death. Annu Rev Pathol.; 1:405-34.
Doring HJ, Dehnert H. (1987). The isolated perfused heart according to Langendorff.
BVM-Biomesstechnic Verlag.
Dorn GW, Scorrano L. (2010). Two close, too close: sarcoplasmic reticulum-
mitochondrial crosstalk and cardiomyocyte fate. Circ Res.; 107(6):689-99.
Dow J, Kloner RA. (2007). Postconditioning does not reduce myocardial infarct size in
an in vivo regional ischemia rodent model. J Cardiovasc Pharmacol Ther.;
12(2):153-63.
Downey JM, Davis AM, Cohen MV. (2007). Signaling pathways in ischemic
preconditioning. Heart Fail Rev.; 12(3-4):181-8..
Duncker DJ, Bache RJ. (2008). Regulation of coronary blood flow during exercise.
Physiol Rev.; 88(3):1009-86.
Dworschak M, d'Uscio LV, Breukelmann D, Hannon JD. (2005). Increased tolerance to
hypoxic metabolic inhibition and reoxygenation of cardiomyocytes from
apolipoprotein E-deficient mice. Am J Physiol Heart Circ Physiol.; 289(1):H160-
7.
Dzau V, Braunwald E. (1991). Resolved and unresolved issues in the prevention and
treatment of coronary artery disease: a workshop consensus statement. Am Heart
J. 121(4 Pt 1):1244-63.

245
Dzau VJ, Antman EM, Black HR, Hayes DL, Manson JE, Plutzky J, Popma JJ,
Stevenson W. (2006). The cardiovascular disease continuum validated: clinical
evidence of improved patient outcomes: part II: Clinical trial evidence (acute
coronary syndromes through renal disease) and future directions. Circulation.;
114(25):2871-91.
Eberli FR. (2004). Stunned myocardium--an unfinished puzzle. Cardiovasc
Res. 63(2):189-91.
Eisner DA, Kashimura T, O'Neill SC, Venetucci LA, Trafford AW. (2009). What role
does modulation of the ryanodine receptor play in cardiac inotropy and
arrhythmogenesis? J Mol Cell Cardiol.; 46(4):474-81.
Eisner DA, Nichols CG, O'Neill SC, Smith GL, Valdeolmillos M. (1989). The effects of
metabolic inhibition on intracellular calcium and pH in isolated rat ventricular
cells. J Physiol; 411:393-418.
El-Haou S, Balse E, Neyroud N, Dilanian G, Gavillet B, Abriel H, Coulombe A,
Jeromin A, Hatem SN. (2009). Kv4 potassium channels form a tripartite complex
with the anchoring protein SAP97 and CaMKII in cardiac myocytes. Circ Res.
27; 104(6):758-69.
Entman ML, Smith CW. (1994). Postreperfusion inflammation: a model for reaction to
injury in cardiovascular disease. Cardiovasc Res.; 28(9):1301-11.
Erickson JR, Joiner ML, Guan X, Kutschke W, Yang J, Oddis CV, Bartlett RK, Lowe
JS, O'Donnell SE, Aykin-Burns N, Zimmerman MC, Zimmerman K, Ham AJ,
Weiss RM, Spitz DR, Shea MA, Colbran RJ, Mohler PJ, Anderson ME. (2008).
A dynamic pathway for calcium-independent activation of CaMKII by methionine
oxidation. Cell. 2; 133(3):462-74.
Esumi K, Nishida M, Shaw D, Smith TW, Marsh JD. (1991). NADH measurements in
adult rat myocytes during simulated ischemia. Am J Physiol.; 260:H1743-52.
Eu JP, Xu L, Stamler JS, Meissner G. (1999). Regulation of ryanodine receptors by
reactive nitrogen species. Biochem Pharmacol.; 57(10):1079-84.
Fabiato A. (1983). Calcium-induced release of calcium from the cardiac sarcoplasmic
reticulum. Am J Physiol.; 245(1):C1-14.
Fearnley CJ, Roderick HL, Bootman MD. (2011). Calcium signaling in cardiac
myocytes. Cold Spring Harb Perspect Biol.; 1; 3(11)

246
Ferdinandy P, Schulz R, Baxter GF. (2007). Interaction of cardiovascular risk factors
with myocardial ischemia/reperfusion injury, preconditioning, and
postconditioning. Pharmacol Rev.; 59(4):418-58.
Fiolet JW, Schumacher CA, Baartscheer A, Coronel R. (1993). Osmotic changes and
transsarcolemmal ion transport during total ischaemia of isolated rat ventricular
myocytes. Basic Res Cardiol.; 88(5):396-410.
Fleet WF, Johnson TA, Graebner CA, Gettes LS. (1985). Effect of serial brief ischemic
episodes on extracellular K+, pH, and activation in the pig. Circulation.;
72(4):922-32.
Fliegel L, Walsh MP, Singh D, Wong C, Barr A. (1992). Phosphorylation of the C-
terminal domain of the Na+/H
+ exchanger by Ca
2+/calmodulin-dependent protein
kinase II. Biochem J. 15; 282 :139-45.
Forbes RA, Steenbergen C, Murphy E. (2001). Diazoxide-induced cardioprotection
requires signalling through a redox-sensitive mechanism. Circ Res.; 88(8):802-9.
Gao L, Blair LA, Marshall J. (2006). CaMKII-independent effects of KN93 and its
inactive analog KN92: reversible inhibition of L-type calcium channels. Biochem
Biophys Res Commun. 14; 345(4):1606-10.
Garcia-Dorado D, Ruiz-Meana M, Inserte J, Rodriguez-Sinovas A, Piper HM. (2012).
Calcium-mediated cell death during myocardial reperfusion. Cardiovasc
Res. 1;94(2):168-80.
Garcia-Dorado D, Rodriguez-Sinovas A, Ruiz-Meana M, Inserte J, Agulló L,
Cabestrero A. (2006a). The end-effectors of preconditioning protection against
myocardial cell death secondary to ischemia-reperfusion. Cardiovasc Res.;
70(2):274-85.
Garcia-Dorado D, Vinten-Johansen J, Piper HM. (2006b). Bringing preconditioning and
postconditioning into focus. Cardiovasc Res.; 70(2):167-9.
Genka C, Ishida H, Ichimori K, Hirota Y, Tanaami T, Nakazawa H. (1999).
Visualization of biphasic Ca2+ diffusion from cytosol to nucleus in contracting
adult rat cardiac myocytes with an ultra-fast confocal imaging system. Cell
Calcium.; 25(3):199-208.
Gho BCG, Schoemaker RV, van den Doel MA, Duncker DJ, Verdouw PD. (1996).
Myocardial protection by brief ischemia in non-cardiac
tissue. Circulation.; 94: 2193–2200.

247
Goto M, Liu Y, Yang XM, Ardell JL, Cohen MV, Downey JM. (1995). Role
of bradykinin in protection of ischemic preconditioning in rabbit hearts. Circ Res.;
77(3):611-21.
Gottlieb RA. (2011). Cell death pathways in acute ischemia/reperfusion injury. J
Cardiovascular Pharmacol Ther. 16(3-4):233-8.
Griffiths EJ, Rutter GA. (2009). Mitochondrial calcium as a key regulator of
mitochondrial ATP production in mammalian cells. Biochim Biophys Acta.;
1787(11):1324-33.
Grimm M, Brown JH. (2010). Beta-adrenergic receptor signaling in the heart: role of
CaMKII. J Mol Cell Cardiol.; 48(2):322-30.
Gross GJ, Fryer RM. (1999). Sarcolemmal versus mitochondrial ATP-sensitive K+
channels and myocardial preconditioning. Circ. Res. 14; 84(9):973-9.
Grueter CE, Abiria SA, Wu Y, Anderson ME, Colbran RJ. (2008). Differential
regulated interactions of calcium/calmodulin-dependent protein kinase II with
isoforms of voltage-gated calcium channel beta subunits. Biochemistry. 12;
47(6):1760-7.
Hagemann D, Kuschel M, Kuramochi T, Zhu W, Cheng H, Xiao RP. (2000).
Frequency-encoding Thr17
phospholamban phosphorylation is independent of
Ser16 phosphorylation in cardiac myocytes. J Biol Chem.; 275(29):22532-6.
Hale SL, Mehra A, Leeka J, Kloner RA. (2008). Postconditioning fails to improve no
reflow or alter infarct size in an open-chest rabbit model of myocardial ischemia-
reperfusion. Am J Physiol Heart Circ Physiol; 294(1):H421-5.
Halestrap AP. (2009). Mitochondrial calcium in health and disease. Biochim Biophys
Acta.; 1787(11):1289-90.
Halestrap AP, Clarke SJ, Javadov SA. (2004). Mitochondrial permeability transition
pore opening during myocardial reperfusion--a target for cardioprotection.
Cardiovasc Res.; 61(3):372-85.
Harary I. and Farley B. (1960). In vitro studies of single isolated beating heart cells.
Science.; 131(3414):1674-5.
Harr MW, Distelhorst CW. (2010). Apoptosis and autophagy: decoding calcium
signals that mediate life or death. Cold Spring Harb Perspect Biol.;
2(10):a005579.

248
Hashambhoy YL, Winslow RL, Greenstein JL. (2009). CaMKII-induced shift in modal
gating explains L-type Ca2+
current facilitation: a modeling study. Biophys J.;
96(5):1770-85.
Hausenloy DJ, Mocanu MM, Yellon DM. (2004). Cross-talk between the survival
kinases during early reperfusion: its contribution to ischemic preconditioning.
Cardiovasc Res.; 63(2):305-12.
Hausenloy DJ, Yellon DM. (2004). New directions for protecting the heart against
ischaemia-reperfusion injury: targeting the Reperfusion Injury Salvage Kinase
(RISK)-pathway. Cardiovasc Res.15; 61(3):448-60.
Hausenloy DJ, Tsang A, Mocanu MM, Yellon DM. (2005). Ischemic preconditioning
protects by activating prosurvival kinases at reperfusion. Am J Physiol Heart Circ
Physiol.; 288(2):H971-6.
Hausenloy DJ, Yellon DM. (2006). Survival kinases in ischemic preconditioning and
postconditioning. Cardiovasc Res.; 70(2):240-53.
Hausenloy DJ, Yellon DM. (2007). Preconditioning and postconditioning: united at
reperfusion. Pharmacol Ther.; 116(2):173-91.
Heller LJ, Mohrman DE, Smith JA, Wallace KB. (2003). Multitrack system for
superfusing isolated cardiac myocytes. Am J Physiol Heart Circ Physiol.;
284(5):H1872-8.
Hescheler J, Meyer R, Plant S, Krautwurst D, Rosenthal W, Schultz G. (1991).
Morphological, biochemical, and electrophysiological characterization of a clonal
cell (H9c2) line from rat heart. Circ Res.; 69(6):1476-86.
Heusch G. (2004). Postconditioning: old wine in a new bottle? J Am Coll Cardiol.;
44(5):1111-2.
Hilgemann DW, Yaradanakul A, Wang Y, Fuster D. (2006). Molecular control of
cardiac sodium homeostasis in health and disease. J Cardiovasc Electrophysiol.;
17 Suppl 1:S47-S56.
Hoch B, Haase H, Schulze W, Hagemann D, Morano I, Krause EG, Karczewski P.
(1998). Differentiation-dependent expression of cardiac delta-CaMKII isoforms.
J Cell Biochem.; 68(2):259-68.
Hoch B, Meyer R, Hetzer R, Krause EG, Karczewski P. (1999). Identification and
expression of delta-isoforms of the multifunctional Ca2+
/calmodulin-dependent
protein kinase in failing and nonfailing human myocardium. Circ Res.; 84(6):713-
21.

249
Hoch B, Wobus AM, Krause EG, Karczewski P. (2000). delta-Ca2+
/calmodulin-
dependent protein kinase II expression pattern in adult mouse heart and
cardiogenic differentiation of embryonic stem cells. J Cell Biochem.; 79(2):293-
300.
Hoffman L, Stein RA, Colbran RJ, Mchaourab HS. (2011). Conformational changes
underlying calcium/calmodulin-dependent protein kinase II activation. EMBO J.;
30(7):1251-62.
Holly TA, Drincic A, Byun Y, Nakamura S, Harris K, Klocke FJ, Cryns VL. (1999).
Caspase inhibition reduces myocyte cell death induced by myocardial ischemia
and reperfusion in vivo. J Mol Cell Cardiol.; 31(9):1709-15.
Hool LC. (2000). Hypoxia increases the sensitivity of the L-type Ca2+
current to beta-
adrenergic receptor stimulation via a C2 region-containing protein kinase C
isoform. Circ Res.; 87(12):1164-71.
Horton RW, Meldrum BS, Bachelard HS. (1973). Enzymic and cerebral metabolic
effects of 2-deoxy-D-glucose. J Neurochem.; 21(3):507-20
Hou Q, Hsu YT. (2005). Bax translocates from cytosol to mitochondria in cardiac cells
during apoptosis: development of a GFP-Bax-stable H9c2 cell line for apoptosis
analysis. Am J Physiol Heart Circ Physiol.; 289(1):H477-87.
House SJ, Singer HA. (2008). CaMKII-delta isoform regulation of neointima formation
after vascular injury. Arterioscler Thromb Vasc Biol.; 28(3):441-7.
Høyer-Hansen M, Jäättelä M. (2007). Connecting endoplasmic reticulum stress to
autophagy by unfolded protein response and calcium. Cell Death Differ.
14(9):1576-82.
Hudmon A, Schulman H. (2002). Structure-function of the multifunctional
Ca2+
/calmodulin-dependent protein kinase II. Biochem J.; 364(Pt 3):593-611.
Hudmon A, Schulman H, Kim J, Maltez JM, Tsien RW, Pitt GS. (2005). CaMKII
tethers to L-type Ca2+
channels, establishing a local and dedicated integrator of
Ca2+
signals for facilitation. J Cell Biol.; 171(3):537-47.
Hwang JM, Weng YJ, Lin JA, Bau DT, Ko FY, Tsai FJ, Tsai CH, Wu CH, Lin PC,
Huang CY, Kuo WW. (2008). Hypoxia-induced compensatory effect as related to
Shh and HIF-1alpha in ischemia embryo rat heart. Mol Cell Biochem; 311(1-
2):179-87.
250
Inserte J, Barba I, Hernando V, Garcia-Dorado D. (2009). Delayed recovery of
intracellular acidosis during reperfusion prevents calpain activation and
determines protection in postconditioned myocardium. Cardiovasc Res.;
81(1):116-22.
Ishida A, Kameshita I, Okuno S, Kitani T, Fujisawa H. (1995). A novel highly specific
and potent inhibitor of calmodulin-dependent protein kinase II. Biochem Biophys
Res Commun. 26; 212(3):806-12.
Ishida A, Sueyoshi N, Shigeri Y, Kameshita I. (2008). Negative regulation of
multifunctional Ca2+
/calmodulin-dependent protein kinases: physiological and
pharmacological significance of protein phosphatases. Br J Pharmacol.;
154(4):729-40.
Jama AM, Fenton J, Robertson SD, Török K. (2009). Time-dependent autoinactivation
of phospho-Thr286
-alphaCa2+
/calmodulin-dependent proteinkinase II. J Biol
Chem.; 284(41):28146-55.
Javadov SA, Clarke S, Das M, Griffiths EJ, Lim KH, Halestrap AP. (2003). Ischaemic
preconditioning inhibits opening of mitochondrial permeability transition pores in
the reperfused rat heart. J Physiol.; 549(Pt 2):513-24.
Jennings RB. (2011). Commentary on selected aspects of cardioprotection. J
Cardiovasc Pharmacol Ther.; 16(3-4):340-8.
Jennings RB, Hawkins HK, Lowe JE, Hill ML, Klotman S, Reimer KA. (1978).
Relation between high energy phosphate and lethal injury in myocardial ischemia
in the dog. Am J Pathol.; 92(1):187-214.
Jennings RB, Murry CE, Steenbergen C Jr, Reimer KA. (1990). Development of cell
injury in sustained acute ischemia. Circulation.; 82(3 Suppl):II2-12.
Jennings RB, Reimer KA. (1991). The cell biology of acute myocardial ischemia. Annu
Rev Med.; 42:225-46
Jiang D, Xiao B, Yang D, Wang R, Choi P, Zhang L, Cheng H, Chen SR. (2004).
RyR2 mutations linked to ventricular tachycardia and sudden death reduce the
threshold for store-overload-induced Ca2+
release (SOICR). Proc Natl Acad Sci U
S A.; 101(35):13062-7.
Jiao JD, Garg V, Yang B, Hu K. (2008). Novel functional role of heat shock protein 90
in ATP-sensitive K+ channel-mediated hypoxic preconditioning. Cardiovasc
Res.; 77(1):126-33.

251
Jones SM, Hunt NA, Del Monte F, Harding SE. (1990). Contraction of cardiac
myocytes from noradrenaline-treated rats in response to isoprenaline, forskolin
and dibutyryl cAMP. Eur J Pharmacol.; 191(2):129-40.
Juhaszova M, Zorov DB, Kim SH, Pepe S, Fu Q, Fishbein KW, Ziman BD, Wang S,
Ytrehus K, Antos CL, Olson EN, Sollott SJ. (2004). Glycogen synthase kinase-
3beta mediates convergence of protection signaling to inhibit the mitochondrial
permeability transition pore. J Clin Invest.; 113(11):1535-49.
Jung YS, Kim MY, Kim MJ, Oh KS, Yi KY, Lee S, Yoo SE, Lee BH. (2006).
Pharmacological profile of KR-33028, a highly selective inhibitor of Na+/H
+
exchanger. Eur J Pharmacol. 27;535(1-3):220-7.
Kabakov AE, Budagova KR, Latchman DS, Kampinga HH. (2002). Stressful
preconditioning and HSP70 overexpression attenuate proteotoxicity of cellular
ATP depletion. Am J Physiol Cell Physiol.; 283(2):C521-34.
Kashiwase K, Higuchi Y, Hirotani S, Yamaguchi O, Hikoso S, Takeda T, Watanabe T,
Taniike M, Nakai A, Tsujimoto I, Matsumura Y, Ueno H, Nishida K, Hori M,
Otsu K. (2005). CaMKII activates ASK1 and NF-kappaB to induce
cardiomyocyte hypertrophy. Biochem Biophys Res Commun; 327(1):136-42.
Keeley EC, Boura JA, Grines CL. (2003). Primary angioplasty versus intravenous
thrombolytic therapy for acute myocardial infarction: a quantitative review of 23
randomised trials. Lancet.; 361(9351):13-20.
Kemi OJ, Ellingsen O, Ceci M, Grimaldi S, Smith GL, Condorelli G, Wisløff U. (2007).
Aerobic interval training enhances cardiomyocyte contractility and Ca2+
cycling
by phosphorylation of CaMKII and Thr17
of phospholamban. J Mol Cell Cardiol.;
43(3):354-61.
Kimes BW, Brandt BL. (1976). Properties of a clonal muscle cell line from rat heart.
Exp Cell Res.;98(2):367-81.
Kirchhefer U, Schmitz W, Scholz H, Neumann J. (1999). Activity of cAMP-dependent
protein kinase and Ca2+
/calmodulin-dependent protein kinase in failing and
nonfailing human hearts. Cardiovasc Res.; 42(1):254-61.
Kitakaze M, Asakura M, Kim J, Shintani Y, Asanuma H, Hamasaki T, Seguchi O,
Myoishi M, Minamino T, Ohara T, Nagai Y, Nanto S, Watanabe K, Fukuzawa S,
Hirayama A, Nakamura N, Kimura K, Fujii K, Ishihara M, Saito Y, Tomoike H,
Kitamura S; J-WIND investigators. (2007). Human atrial natriuretic peptide and
nicorandil as adjuncts to reperfusion treatment for acute myocardial infarction (J-

252
WIND): two randomised trials. Lancet.; 370(9597):1483-93. Erratum in: Lancet.;
370(9605):2102.
Klabunde, (2011). Cardiovascular Physiology Concepts. Second Edition. Lippincott
Williams & Wilkins.
Kloner RA, Jennings RB. (2001). Consequences of brief ischemia: stunning,
preconditioning, and their clinical implications: part 1. Circulation. 11;
104(24):2981-9.
Knight MM, Roberts SR, Lee DA, Bader DL. (2003). Live cell imaging using confocal
microscopy induces intracellular calcium transients and cell death. Am J Physiol
Cell Physiol.; 284(4):C1083-9.
Kohlhaas M, Zhang T, Seidler T, Zibrova D, Dybkova N, Steen A, Wagner S, Chen L,
Brown JH, Bers DM, Maier LS. (2006). Increased sarcoplasmic
reticulum calcium leak but unaltered contractility by acute CaMKII
overexpression in isolated rabbit cardiac myocytes. Circ Res.; 98(2):235-44.
Kushnir A, Shan J, Betzenhauser MJ, Reiken S, Marks AR. (2010). Role of
CaMKIIdelta phosphorylation of the cardiac ryanodine receptor in the force
frequency relationship and heart failure. Proc Natl Acad Sci USA.;
107(22):10274-9.
Lakatta EG. (1992). Functional implications of spontaneous sarcoplasmic reticulum
Ca2+
release in the heart. Cardiovasc Res.; 26(3):193-214.
Lange M, Redel A, Lotz C, Smul TM, Blomeyer C, Frank A, Stumpner J, Roewer N,
Kehl F. (2009). Desflurane-induced postconditioning is mediated by beta-
adrenergic signaling: role of beta 1- and beta 2-adrenergic receptors, protein
kinase A, and calcium/calmodulin-dependent protein kinase II. Anesthesiology.;
110(3):516-28.
Lange M, Smul TM, Redel A, Lotz C, Jazbutyte V, Schnupp V, Roewer N, Kehl F.
(2008). Differential role of calcium/calmodulin-dependent protein kinase II in
desflurane-induced preconditioning and cardioprotection by metoprolol:
metoprolol blocks desflurane-induced preconditioning. Anesthesiology.
109(1):72-80.
Laskey WK. (2005). Brief repetitive balloon occlusions enhance reperfsuion during
percutaneous coronary intervention for acute myocardial infarction: a pilot study.
Catheter Cardiovasc Interv.; 65(3):361-7.

253
Laude AJ, Simpson AW. (2009). Compartmentalized signalling: Ca2+
compartments,
microdomains and the many facets of Ca2+
signalling. FEBS J.; 276(7):1800-16.
Lax A, Soler F, Fernández-Belda F. (2005). Intracellular Ca2+
pools and fluxes in
cardiac muscle-derived h9c2 cells. J Bioenerg Biomembr.;37(4):249-59.
Lax A, Soler F, Fernández-Belda F. (2006). Cytoplasmic Ca2+
signals and cellular death
by apoptosis in myocardiac H9c2 cells. Biochim Biophys Acta.; 1763(9):937-47.
Layland J, Grieve DJ, Cave AC, Sparks E, Solaro RJ, Shah AM. (2004). Essential role
of troponin I in the positive inotropic response to isoprenaline in mouse hearts
contracting auxotonically. J Physiol.; 556(Pt 3):835-47.
Lecour S. (2006). Activation of the protective Survivor Activating Factor Enhancement
(SAFE) pathway against reperfusion injury: Does it go beyond the RISK
pathway? J Mol Cell Cardiol.;47(1):32-40.
Ledoux J, Chartier D, Leblanc N. (1999). Inhibitors of calmodulin-dependent protein
kinase are nonspecific blockers of voltage-dependent K+ channels in vascular
myocytes. J Pharmacol Exp Ther.; 290(3):1165-74.
Lee JW, Lee HK, Kim HW, Kim YH. (2007). Effects of pH, Buffer System and Lactate
on the Simulated Ischaemia-Reperfusion Injury of H9c2 Cardiac Myocytes.
Korean J Physiol pharmacol.; 11: 45-55.
Lee AG, East JM. (2001). What the structure of a calcium pump tells us about its
mechanism. Biochem J.; 356(Pt 3):665-83.
Lee KS. (1987). Potentiation of the calcium-channel currents of internally perfused
mammalian heart cells by repetitive depolarization. Proc Natl Acad Sci U S A.;
84(11):3941-5.
Lee KW, Ladinsky H, Stuckey JH. (1967). Decreased Ca2+
uptake by sarcoplasmic
reticulum after coronary artery occlusion for 60 and 90 minutes. Circ Res.;
21(4):439-44.
Levine B, Klionsky DJ. (2004). Development by self-digestion: molecular mechanisms
and biological functions of autophagy. Dev Cell.; 6(4):463-77.
Li H, Li W, Gupta AK, Mohler PJ, Anderson ME, Grumbach IM. (2010). Calmodulin
kinase II is required for angiotensin II-mediated vascular smooth muscle
hypertrophy. Am J Physiol Heart Circ Physiol.; 298(2):H688-98.
Li J, Marionneau C, Koval O, Zingman L, Mohler PJ, Nerbonne JM, Anderson ME.
(2007). Calmodulin kinase II inhibition enhances ischemic preconditioning by
augmenting ATP-sensitive K+ current. Channels (Austin). 1(5):387-94.

254
Li J, Marionneau C, Zhang R, Shah V, Hell JW, Nerbonne JM, Anderson ME. (2006).
Calmodulin kinase II inhibition shortens action potential duration by upregulation
of K+ currents. Circ Res. 10; 99(10):1092-9.
Li L, Chu G, Kranias EG, Bers DM. (1998). Cardiac myocyte calcium transport in
phospholamban knockout mouse: relaxation and endogenous CaMKII effects. Am
J Physiol.; 274(4 Pt 2):H1335-47.
Li L, Satoh H, Ginsburg KS, Bers DM. (1997). The effect of Ca2+
-calmodulin-
dependent protein kinase II on cardiac excitation-contraction coupling in ferret
ventricular myocytes. J Physiol. 15; 501 (Pt 1):17-31.
Ling H, Zhang T, Pereira L, Means CK, Cheng H, Gu Y, Dalton ND, Peterson KL,Chen
J, Bers D, Heller Brown J. (2009). Requirement for Ca2+
/calmodulin-dependent
kinase II in the transition from pressure overload-induced cardiac hypertrophy to
heart failure in mice. J Clin Invest.; 119(5):1230-40.
Liu Y, Downey JM. (1992). Ischemic preconditioning protects against infarction in rat
heart. Am J Physiol Heart Circ Physiol.; 263:H1107-H1112
Liu GS, Thornton J, Van Winkle DM, Stanley AW, Olsson RA, Downey JM. (1991).
Protection against infarction afforded by preconditioning is mediated by
A1 adenosine receptors in rabbit heart. Circulation.; 84(1):350-6.
Ljubojević S, Walther S, Asgarzoei M, Sedej S, Pieske B, Kockskämper J. (2011)
In situ calibration of nucleoplasmic versus cytoplasmic Ca²+ concentration in
adultcardiomyocytes. Biophys J.;100(10):2356-66.
Lochner A, Marais E, Genade S, Moolman JA. (2000). Nitric oxide: a trigger for classic
preconditioning? Am J Physiol Heart Circ Physiol. ;279(6):H2752-65.
Lu YM, Shioda N, Yamamoto Y, Han F, Fukunaga K. (2010). Transcriptional
upregulation of calcineurin Abeta by endothelin-1 is partially mediated by
calcium/calmodulin-dependent protein kinase IIdelta3 in rat cardiomyocytes.
Biochim Biophys Acta.; 1799(5-6):429-41.
Luqman N, Sung RJ, Wang C, Kuo C. Myocardial ischemia and ventricular fibrillation:
Pathophysiology and clinical implications. Int J Cardiol.; 119:283–290.
Lynn EG, McLeod CJ, Gordon JP, Bao J, Sack MN. (2008). SIRT2 is a negative
regulator of anoxia-reoxygenation tolerance via regulation of 14-3-3 zeta and
BAD in H9c2 cells. FEBS Lett.; 582(19):2857-62.

255
Maddaford TG, Hurtado C, Sobrattee S, Czubryt MP, Pierce GN. (1999). A model of
low-flow ischemia and reperfusion in single, beating adult cardiomyocytes. Am J
Physiol.; 277(2 Pt 2):H788-98.
Maier LS, Bers DM. (2007). Role of Ca2+/calmodulin-dependant protein kinase
(CaMK) in excitation-contraction coupling in the heart. Cardiovasc Res.; 73:
631-640.
Maier LS, Zhang T, Chen L, DeSantiago J, Brown JH, Bers DM. (2003). Transgenic
CaMKIIdeltaC overexpression uniquely alters cardiac myocyte Ca2+
handling:
reduced SR Ca2+
load and activated SR Ca2+
release. Circ Res.; 92(8):904-11.
Mani SK, Egan EA, Addy BK, Grimm M, Kasiganesan H, Thiyagarajan T, Renaud L,
Brown JH, Kern CB, Menick DR. (2010). beta-Adrenergic receptor stimulated
Ncx1 upregulation is mediated via a CaMKII/AP-1 signaling pathway in adult
cardiomyocytes. J Mol Cell Cardiol.; 48(2):342-51.
Manintveld OC, Te Lintel Hekkert M, van den Bos EJ, Suurenbroek GM, Dekkers DH,
Verdouw PD, Lamers JM, Duncker DJ. (2007). Cardiac effects of
postconditioning depend critically on the duration of index ischemia. Am J
Physiol Heart Circ Physiol.; 292(3):H1551-60.
Marban E, Kitakaze M, Koretsune Y, Yue DT, Chacko VP, Pike MM. (1990).
Quantification of [Ca2+
]i in perfused hearts. Critical evaluation of the 5F-BAPTA
and nuclear magnetic resonance method as applied to the study of ischemia and
reperfusion. Circ Res.; 66(5):1255-67.
Marber MS. (2000). Ischemic preconditioning in isolated cells. Circ Res.; 86(9):926-31.
Review.
Maroko PR, Kjekshus JK, Sobel BE, Watanabe T, Covell JW, Ross J Jr, Braunwald E.
(1971). Factors influencing infarct size following experimental coronary artery
occlusions. Circulation.; 43(1):67-82.
Marx SO, Gaburjakova J, Gaburjakova M, Henrikson C, Ondrias K, Marks AR.
(2001).Coupled gating between cardiac calcium release channels (ryanodine recep
tors). Circ Res.; 88(11):1151-8.
Marzilli M, Huqi A. (2010) Cardioprotective Therapy in Reperfusion Theray: Lessons
from the European Myocardial Infarction Project – Free Radicals (EMIP-FR).
Heart Metabolism; 46: 35-37.

256
Matsui Y, Takagi H, Qu X, Abdellatif M, Sakoda H, Asano T, Levine B, Sadoshima J.
(2007). Distinct roles of autophagy in the heart during ischemia and reperfusion:
roles of AMP-activated protein kinase and Beclin 1 in mediating autophagy. Circ
Res. 30; 100(6):914-22.
Mattiazzi A, Mundiña-Weilenmann C, Guoxiang C, Vittone L, Kranias E. (2005). Role
of phospholamban phosphorylation on Thr17
in cardiac physiological and
pathological conditions. Cardiovasc Res.; 68(3):366-75.
Mattiazzi A, Vittone L, Mundiña-Weilenmann C. (2007). Ca2+
/calmodulin-dependent
protein kinase: a key component in the contractile recovery from acidosis.
Cardiovasc Res.; 73(4):648-56.
Ménard C, Pupier S, Mornet D, Kitzmann M, Nargeot J, Lory P. (1999). Modulation of
L-type calcium channel expression during retinoic acid-induced differentiation of
H9C2 cardiac cells. J Biol Chem.; 274(41):29063-70.
Meyer T, Hanson PI, Stryer L, Schulman H. (1992). Calmodulin trapping by calcium-
calmodulin-dependent protein kinase. Science.; 256(5060):1199-202.
Miki T, Cohen MV, Downey JM. (1998). Opioid receptor contributes to ischemic
preconditioning through protein kinase C activation in rabbits. Mol Cell Biochem.;
186(1-2):3-12.
Miklós Z, Ivanics T, Roemen TH, van der Vusse GJ, Dézsi L, Szekeres M, Kemecsei P,
Tóth A, Kollai M, Ligeti L. (2003). Time related changes in calcium handling in
the isolated ischemic and reperfused rat heart. Mol Cell Biochem.; 250(1-2):115-
24.
Mishra S, Gray CB, Miyamoto S, Bers DM, Brown JH. (2011). Location matters:
clarifying the concept of nuclear and cytosolic CaMKII subtypes. Circ Res.;
109(12):1354-62.
Mocanu MM, Baxter GF, Yellon DM. (2000). Caspase inhibition and limitation of
myocardial infarct size: protection against lethal reperfusion injury. Br J
Pharmacol.; 130(2):197-200.
Murphy E, Steenbergen C. (2008). Mechanisms underlying acute protection from
cardiac ischemia-reperfusion injury. Physiol Rev.; 88(2):581-609.
Murry CE, Jennings RB, Reimer KA. (1986). Preconditioning with ischemia: a delay of
lethal cell injury in ischemic myocardium. Circulation.; 74(5):1124-36.

257
Murry CE, Richard VJ, Reimer KA, Jennings RB. (1990). Ischemic preconditioning
slows energy metabolism and delays ultrastructural damage during a sustained
ischemic episode. Circ Res.; 66(4):913-31.
Mykytenko J, Reeves JG, Kin H, Wang NP, Zatta AJ, Jiang R, Guyton RA, Vinten-
Johansen J, Zhao ZQ. (2008). Persistent beneficial effect of postconditioning
against infarct size: role of mitochondrial KATP channels during reperfusion. Basic
Res Cardiol.; 103(5):472-84.
Narayanan N, Xu A. (1997). Phosphorylation and regulation of the Ca2+
-pumping
ATPase in cardiac sarcoplasmic reticulum by calcium/calmodulin-dependent
protein kinase. Basic Res Cardiol.; 92 Suppl 1:25-35.
Netticadan T, Temsah R, Osada M, Dhalla NS. (1999). Status of Ca2+
/calmodulin
protein kinase phosphorylation of cardiac SR proteins in ischemia-reperfusion.
Am J Physiol.; 277:C384-91.
Odagiri K, Katoh H, Kawashima H, Tanaka T, Ohtani H, Saotome M, Urushida T,
Satoh H, Hayashi H. (2009). Local control of mitochondrial membrane potential,
permeability transition pore and reactive oxygen species by calcium and
calmodulin in rat ventricular myocytes. J Mol Cell Cardiol.; 46(6):989-97.
Odermatt A, Kurzydlowski K, MacLennan DH. (1996). The vmax of the Ca2+
-ATPase
of cardiac sarcoplasmic reticulum (SERCA2a) is not altered by Ca2+
/calmodulin-
dependent phosphorylation or by interaction with phospholamban. J Biol Chem.;
271(24):14206-13.
Office for National Statistics (2010). Population estimates for UK, England and Wales,
Scotland and Northern Ireland, Mid-2010.
Okamoto F, Allen BS, Buckberg GD, Bugyi H, Leaf J. (1986). Reperfusion conditions:
importance of ensuring gentle versus sudden reperfusion during relief
ofcoronary occlusion. J Thorac Cardiovasc Surg.; 92 (3 Pt 2):613-20.
Orchard C, Brette F. (2008). t-Tubules and sarcoplasmic reticulum function in cardiac
ventricular myocytes. Cardiovasc Res.; 77(2):237-44.
Orchard CH, Houser SR, Kort AA, Bahinski A, Capogrossi MC, Lakatta EG. (1987).
Acidosis facilitates spontaneous sarcoplasmic reticulum Ca2+
release in rat
myocardium. J Gen Physiol.; 90(1):145-65.
Osada M, Netticadan T, Kawabata K, Tamura K, Dhalla NS. (2000). Ischemic
preconditioning prevents I/R-induced alterations in SR calcium-calmodulin
protein kinase II. Am J Physiol Heart Circ Physiol.; 278(6):H1791-8.

258
Overbaugh KJ. (2009). Acute coronary syndrome. Am J Nurs.; 109(5):42-52.
Overend CL, Eisner DA, O'Neill SC. (2001). Altered cardiac sarcoplasmic reticulum
function of intact myocytes of rat ventricle during metabolic inhibition. Circ Res;
88(2):181-7.
Ovize M, Baxter GF, Di Lisa F, Ferdinandy P, Garcia-Dorado D, Hausenloy DJ,
Heusch G, Vinten-Johansen J, Yellon DM, Schulz R. (2010). Postconditioning
and protection from reperfusion injury: where do we stand? Position paper from
the Working Group of Cellular Biology of the Heart of the European Society of
Cardiology. Cardiovasc Res.; 87(3):406-23.
Palomeque J, Rueda OV, Sapia L, Valverde CA, Salas M, Petroff MV, Mattiazzi A.
(2009). Angiotensin II-induced oxidative stress resets the Ca2+
dependence of
Ca2+
-calmodulin protein kinase II and promotes a death pathway conserved across
different species. Circ Res.; 105(12):1204-12.
Parsons M, Young L, Lee JE, Jacobson KA, Liang BT. (2000). Distinct cardioprotective
effects of adenosine mediated by differential coupling of receptor subtypes to
phospholipases C and D. FASEB J.;14(10):1423-31.
Pedersen TH, Gurung IS, Grace A, Huang CL. (2009). Calmodulin kinase II initiates
arrhythmogenicity during metabolic acidification in murine hearts. Acta Physiol
(Oxf); 197(1):13-25.
Peng W, Zhang Y, Zheng M, Cheng H, Zhu W, Cao CM, Xiao RP. (2010).
Cardioprotection by CaMKII-deltaB is mediated by phosphorylation of heat shock
factor 1 and subsequent expression of inducible heat shock protein 70. Circ Res.;
106(1):102-10.
Perc M, Green AK, Dixon CJ, Marhl M. (2008). Establishing the stochastic nature of
intracellular calcium oscillations from experimental data. Biophys Chem.;
132(1):33-8.
Piper HM, Abdallah Y, Schäfer C. (2004). The first minutes of reperfusion: a window
of opportunity for cardioprotection. Cardiovasc Res. 15; 61(3):365-71.
Piper HM, García-Dorado D. (1999). Prime causes of rapid cardiomyocyte death
during reperfusion. Ann Thorac Surg. ;68(5):1913-9.
Piper HM, García-Dorado D, Ovize M. (1998). A fresh look at reperfusion injury.
Cardiovasc Res.;38(2):291-300.
Piper HM, Kasseckert S, Abdallah Y. (2006). The sarcoplasmic reticulum as the
primary target of reperfusion protection. Cardiovasc Res.; 70(2):170-3.

259
Powell T, Twist V. (1976). A rapid technique for the isolation and purification of adult
cardiac muscle cells having respiratory control and a tolerance to calcium.
Biochem Biophys Res Commun; 72:327-33.
Prasad A, Stone GW, Holmes DR, Gersh B. (2009). Reperfusion injury, microvascular
dysfunction, and cardioprotection: the "dark side" ofreperfusion. Circulation.
24;120(21):2105-12. Review.
Qin Q, Downey JM, Cohen MV. (2003). Acetylcholine but not adenosine triggers
preconditioning through PI3-kinase and a tyrosine kinase. Am J. Physiol Heart
Circ Physiol.; 284(2):H727-34.
Ramirez S, Ait-Si-Ali S, Robin P, Trouche D, Harel-Bellan A. (1997). The CREB-
binding protein (CBP) cooperates with the serum response factor for
transactivation of the c-fos serum response element. J Biol Chem.; 272(49):31016-
21. Erratum in: J Biol Chem; 274(25):18140.
Reimer KA. (1996). The slowing of ischemic energy demand in preconditioned
myocardium. Ann N Y Acad Sci.; 793:13-26.
Reimer KA, Murry CE, Yamasawa I, Hill ML, Jennings RB. (1986). Four brief periods
of myocardial ischemia cause no cumulative ATP loss of necrosis. Am J. Physiol.;
251(6 Pt 2):H1306-15.
Rellos P, Pike AC, Niesen FH, Salah E, Lee WH, von Delft F, Knapp S. (2010).
Structure of the CaMKIIdelta/calmodulin complex reveals the molecular
mechanism of CaMKII kinase activation. PLoS Biol.; 8(7):e1000426.
Rezazadeh S, Claydon TW, Fedida D. (2006) KN-93 (2-[N-(2-hydroxyethyl)]-N-(4-
methoxybenzenesulfonyl)]amino-N-(4-chlorocinnamyl)-N-methylbenzylamine), a
calcium/calmodulin-dependent protein kinase II inhibitor, is a direct extracellular
blocker of voltage-gated potassium channels. J. Pharmacol Exp Ther.;317(1):292-
9.
Rodrigues MA, Gomes DA, Nathanson MH, Leite MF. (2009).
Nuclear calcium signaling: a cell within a cell. Braz J Med Biol Res.; 42(1):17-20.
Rodríguez-Sinovas A, Cabestrero A, García del Blanco B, Inserte J, García A, García-
Dorado D. (2009). Intracoronary acid infusion as an alternative to ischemic
postconditioning in pigs. Basic Res Cardiol.; 104(6):761-71.
Rosenberg OS, Deindl S, Comolli LR, Hoelz A, Downing KH, Nairn AC, Kuriyan J.
(2006). Oligomerization states of the association domain and the holoenyzme of
Ca2+
/CaM kinase II. FEBS J.; 273(4):682-94.

260
Ruiz-Meana M, Fernandez-Sanz C, Garcia-Dorado D. (2010). The SR-mitochondria
interaction: a new player in cardiac pathophysiology. Cardiovasc Res.; 88(1):30-
9.
Sag CM, Wadsack DP, Khabbazzadeh S, Abesser M, Grefe C, Neumann K, Opiela MK,
Backs J, Olson EN, Brown JH, Neef S, Maier SK, Maier LS. (2009).
Calcium/calmodulin-dependent protein kinase II contributes to cardiac
arrhythmogenesis in heart failure. Circ Heart Fail.; 2(6):664-75.
Said M, Becerra R, Palomeque J, Rinaldi G, Kaetzel MA, Diaz-Sylvester PL, Copello
JA, Dedman JR, Mundiña-Weilenmann C, Vittone L, Mattiazzi A. (2008).
Increased intracellular Ca2+
and SR Ca2+
load contribute to arrhythmias after
acidosis in rat heart. Role of Ca2+
/calmodulin-dependent protein kinase II. Am J
Physiol Heart Circ Physiol.; 295(4):H1669-83.
Sakamoto J, Miura T, Goto M, Iimura O. (1995). Limitation of myocardial infarct size
by adenosine A1 receptor activation is abolished by protein kinase C inhibitors in
the rabbit. Cardiovasc Res.; 29(5):682-8.
Sakamoto K, Urushidani T, Nagao T. (1998). Translocation of HSP27 to cytoskeleton
by repetitive hypoxia-reoxygenation in the rat myoblast cell line, H9c2. Biochem
Biophys Res Commun.; 251(2):576-9.
Salas MA, Valverde CA, Sánchez G, Said M, Rodriguez JS, Portiansky EL, Kaetzel
MA, Dedman JR, Donoso P, Kranias EG, Mattiazzi A. (2010). The signalling
pathway of CaMKII-mediated apoptosis and necrosis in the ischemia/reperfusion
injury. J Mol Cell Cardiol.; 48(6):1298-306.
Sandhu R, Diaz RJ, Mao GD, Wilson GJ. (1997). Ischemic preconditioning: differences
in protection and susceptibility to blockade with single-cycle versus multicycle
transient ischemia. Circulation.; 96(3):984-95.
Sandow A. (1952). Excitation-contraction coupling in muscular response. Yale J Biol
Med.; 25(3):176-201.
Sapia L, Palomeque J, Mattiazzi A, Petroff MV. (2010). Na+/K
+-ATPase inhibition by
ouabain induces CaMKII-dependent apoptosis in adult rat cardiac myocytes. J
Mol Cell Cardiol.; 49(3):459-68.
Sardão VA, Oliveira PJ, Holy J, Oliveira CR, Wallace KB. (2007). Vital imaging
of H9c2 myoblasts exposed to tert-butylhydroperoxide--characterization of
morphological features of cell death. BMC Cell Biol.16; 8:11.

261
Satoh N, Kitada Y. (2004). Cardioprotective effect of MCC-135 is associated with
inhibition of Ca2+
overload in ischemic/reperfused hearts. Eur J Pharmacol.
19;499(1-2):179-87.
Satoh N, Sato T, Shimada M, Yamada K, Kitada Y. (2001).
Lusitropic effect of MCC135 is associated with improvement of sarcoplasmic reti
culum function inventricular muscles of rats with diabetic cardiomyopathy. J
Pharmacol Exp Ther.;298(3):1161-6.
Saucerman JJ, Bers DM. (2012). Calmodulin binding proteins provide domains of local
Ca2+
signaling in cardiac myocytes. J Mol Cell Cardiol.; 52(2):312-6.
Schmidt MR, Smerup M, Konstantinov IE, Shimizu M, Li J, Cheung M, White PA,
Kristiansen SB, Sorensen K, Dzavik V, Redington AN, Kharbanda RK. (2007).
Intermittent peripheral tissue ischemia during coronary ischemia reduces
myocardial infarction through a KATP-dependent mechanism: first demonstration
of remote ischemic perconditioning. Am J Physiol Heart Circ Physiol.;
292(4):H1883-90.
Schwartz LM, Lagranha CJ. (2006). Ischemic postconditioning during reperfusion
activates Akt and ERK without protecting against lethal myocardial ischemia-
reperfusion injury in pigs. Am J Physiol Heart Circ Physiol. ; 290(3):H1011-8.
Schworer CM, Rothblum LI, Thekkumkara TJ, Singer HA. (1993). Identification of
novel isoforms of the delta subunit of Ca2+
/calmodulin-dependent protein kinase
II. Differential expression in rat brain and aorta. J Biol Chem.; 268(19):14443-9.
Sebbag L, Katsuragawa M, Verbinski S, Jennings RB, Reimer KA. (1996).
Intracoronary administration of the alpha 1-receptor agonist, methoxamine, does
not reproduce the infarct-limiting effect of ischemic preconditioning in dogs.
Cardiovasc Res.; 32(5):830-8.
Shan J, Kushnir A, Betzenhauser MJ, Reiken S, Li J, Lehnart SE, Lindegger N,
Mongillo M, Mohler PJ, Marks AR. (2010). Phosphorylation of the ryanodine
receptor mediates the cardiac fight or flight response in mice. J Clin Invest.;
120(12):4388-98.
Sharma A, Singh M. (2001). Protein kinase C activation and cardioprotective effect
of preconditioning with oxidative stress in isolated rat heart. Mol Cell Biochem.;
219(1-2):1-6.

262
Sheu SS, Fozzard HA. (1982). Transmembrane Na+ and Ca
2+ electrochemical gradients
in cardiac muscle and their relationship to force development. J Gen Physiol.;
80(3):325-51.
Shintani-Ishida K, Yoshida K. (2011). Ischemia induces phospholamban
dephosphorylation via activation of calcineurin, PKC-α, and protein phosphatase
1, thereby inducing calcium overload in reperfusion. Biochim Biophys Acta.;
1812(7):743-51.
Singla SI, Hudmon A, Goldberg JM, Smith JL, Schulman H. (2001).
Molecular characterization of calmodulin trapping by calcium/calmodulin-
dependent protein kinase II. J Biol Chem.; 276(31):29353-60.
Sipido KR, Marban E. (1991). L-type calcium channels, potassium channels, and
novel nonspecific cation channels in a clonal muscle cell line derived from
embryonic rat ventricle. Circ Res.; 69(6):1487-99.
Skrzypiec-Spring M, Grotthus B, Szelag A, Schulz R. (2007). Isolated heart perfusion
according to Langendorff- still viable in the new millennium. J Pharmacol
Toxicol Methods.; 55(2):113-26.
Song Q, Saucerman JJ, Bossuyt J, Bers DM. (2008). Differential integration of Ca2+
-
calmodulin signal in intact ventricular myocytes at low and high affinity Ca2+
-
calmodulin targets. J Biol Chem.; 283(46):31531-40.
Sossalla S, Fluschnik N, Schotola H, Ort KR, Neef S, Schulte T, Wittköpper K, Renner
A, Schmitto JD, Gummert J, El-Armouche A, Hasenfuss G, Maier LS. (2010).
Inhibition of Elevated Ca2+
/Calmodulin-Dependent Protein Kinase II Improves
Contractility in Human Failing Myocardium. Circ Res. 29;107(9):1150-61.
Srinivasan M, Edman CF, Schulman H. (1994). Alternative splicing introduces a
nuclear localization signal that targets multifunctional CaM kinase to the nucleus.
J Cell Biol.; 126(4):839-52.
Staat P, Rioufol G, Piot C, Cottin Y, Cung TT, L'Huillier I, Aupetit JF, Bonnefoy E,
Finet G, André-Fouët X, Ovize M. (2005). Postconditioning the human heart.
Circulation; 112(14):2143-8.
Stephanou A, Brar B, Liao Z, Scarabelli T, Knight RA, Latchman DS. (2001). Distinct
initiator caspases are required for the induction of apoptosis in cardiac myocytes
during ischaemia versus reperfusion injury. Cell Death Differ.; 8(4):434-5.
263
Sumi M, Kiuchi K, Ishikawa T, Ishii A, Hagiwara M, Nagatsu T, Hidaka H. (1991). The
newly synthesized selective Ca2+
/calmodulin dependent protein kinase II inhibitor
KN-93 reduces dopamine contents in PC12h cells. Biochem Biophys Res
Commun.;181(3):968-75.
Sun HY, Wang NP, Kerendi F, Halkos M, Kin H, Guyton RA, Vinten-Johansen J, Zhao
ZQ. (2005). Hypoxic postconditioning reduces cardiomyocyte loss by
inhibiting ROS generation and intracellular Ca2+
overload. Am J Physiol Heart
Circ Physiol.; 288(4):H1900-8.
Sutherland FJ, Hearse DJ. (2000). The isolated blood and perfusion fluid perfused heart.
Pharmacol Res.; 41(6):613-27.
Tada M, Katz AM. (1982). Phosphorylation of the sarcoplasmic reticulum and
sarcolemma. Annu Rev Physiol.; 44:401-23.
Takano H, Fukushi H, Morishima Y, Shirasaki Y. (2003). Calmodulin and calmodulin-
dependent kinase II mediate neuronal cell death induced by depolarization. Brain
Res.; 962(1-2):41-7.
Talukder MA, Zweier JL, Periasamy M. (2009). Targeting calcium transport in
ischaemic heart disease. Cardiovasc Res.; 84(3):345-52.
Tan HL, Kupershmidt S, Zhang R, Stepanovic S, Roden DM, Wilde AAM, Anderson
ME, Balser JR. (2002). A calcium sensor in the sodium channel modulates cardiac
excitability. Nature; 415(6870):442.
Tanaka M, Fujiwara H, Yamasaki K, Sasayama S. (1994). Superoxide dismutase and N-
2-mercaptopropionyl glycine attenuate infarct size limitation effect of ischaemic
preconditioning in the rabbit. Cardiovasc Res.; 28(7):980-6.
Tandon N, Cannizzaro C, Chao PH, Maidhof R, Marsano A, Au HT, Radisic M,
Vunjak-Novakovic G. (2009). Electrical stimulation systems for cardiac tissue
engineering. Nat Protoc.; 4(2):155-73.
Tani M, Neely JR. (1989). Role of intracellular Na+ in Ca
2+ overload and depressed
recovery of ventricular function of reperfused ischemic rat hearts. Possible
involvement of H+-Na
+ and Na
+-Ca
2+ exchange. Circ Res.; 65(4):1045-56.
Temsah RM, Netticadan T, Chapman D, Takeda S, Mochizuki S, Dhalla NS. (1999).
Alterations in sarcoplasmic reticulum function and gene expression in ischemic-
reperfused rat heart. Am J Physiol.; 277(2 Pt 2):H584-94.

264
Temsah RM, Netticadan T, Kawabata K, Dhalla NS. (2002). Lack of both oxygen and
glucose contributes to I/R-induced changes in cardiac SR function. Am J Physiol
Cell Physiol; 283(4):C1306-12.
Tessier S, Karczewski P, Krause EG, Pansard Y, Acar C, Lang-Lazdunski M,
Mercadier JJ, Hatem SN. (1999). Regulation of the transient outward K+ current
by Ca2+
/calmodulin-dependent protein kinases II in human atrial myocytes. Circ
Res.; 85(9):810-9.
Thibault H, Piot C, Staat P, Bontemps L, Sportouch C, Rioufol G, Cung TT, Bonnefoy
E, Angoulvant D, Aupetit JF, Finet G, André-Fouët X, Macia JC, Raczka F, Rossi
R, Itti R, Kirkorian G, Derumeaux G, Ovize M. (2008). Long-term benefit
of postconditioning. Circulation; 117(8):1037-44.
Toba K, Katagiri T, Takeyama Y. (1978). Studies of the cardiac sarcoplasmic reticulum
in myocardial infarction. Jpn Circ J.; 42(4):447-53.
Tobimatsu T, Fujisawa H. (1989). Tissue-specific expression of four types of rat
calmodulin-dependent protein kinase II mRNAs. J Biol Chem.; 264(30):17907-
12.
Toischer K, Rokita AG, Unsöld B, Zhu W, Kararigas G, Sossalla S, Reuter SP, Becker
A, Teucher N, Seidler T, Grebe C, Preuss L, Gupta SN, Schmidt K, Lehnart SE,
Krüger M, Linke WA, Backs J, Regitz-Zagrosek V, Schäfer K, Field LJ, Maier
LS, Hasenfuss G. (2010). Differential cardiac remodeling in preload versus
afterload. Circulation; 122(10):993-1003.
Tomai F, Crea F, Chiariello L, Gioffrè PA. (1999). Ischemic preconditioning in
humans: models, mediators, and clinical relevance. Circulation.; 100(5):559-63.
Tombes RM, Faison MO, Turbeville JM. (2003). Organization and evolution of
multifunctional Ca2+
/CaM-dependent protein kinase genes. Gene.; 322:17-31.
Towbin H, Staehelin T, Gordon J. (1979). Electrophoretic transfer of proteins from
polyacrylamide gels to nitrocellulose sheets: procedure and some applications.
Proc Natl Acad Sci U S A.; 76(9):4350-4.
Trafford AW, Díaz ME, Eisner DA. (2001). Coordinated control of cell Ca2+
loading
and triggered release from the sarcoplasmic reticulum underlies the rapid
inotropic response to increased L-type Ca2+
current. Circ Res.; 88(2):195-201.
Tsang A, Hausenloy DJ, Mocanu MM, Yellon DM. (2004). Postconditioning: a form of
"modified reperfusion" protects the myocardium by activating the
phosphatidylinositol 3-kinase-Akt pathway. Circ Res.; 95(3):230-2.

265
Tsuji Y, Hojo M, Voigt N, El-Armouche A, Inden Y, Murohara T, Dobrev D, Nattel S,
Kodama I, Kamiya K. (2011). Ca2+
-related signaling and protein
phosphorylation abnormalities play central roles in a new experimental model of
electrical storm. Circulation.; 123(20):2192-203.
Tsung A, Klune JR, Zhang X, Jeyabalan G, Cao Z, Peng X, Stolz DB, Geller DA,
Rosengart MR, Billiar TR. (2007). HMGB1 release induced by liver ischemia
involves Toll-like receptor 4 dependent reactive oxygen species production and
calcium-mediated signaling. J Exp Med. 26; 204(12):2913-23.
Tunwell RE, Wickenden C, Bertrand BM, Shevchenko VI, Walsh MB, Allen PD, Lai
FA. (1996). The human cardiac muscle ryanodine receptor-calcium release
channel: identification, primary structure and topological analysis. Biochem J.;
318 (Pt 2):477-87.
Tyers GF, Williams EH, Hughes HC, Todd GJ. (1977). Effect of perfusate temperature
on myocardial protection from ischemia. J Thorac Cardiovasc Surg.; 73(5):766-
71.
Tzivoni D, Balkin J, Bär FW, Hibberd M, Reiber JH, Cowing G. (2009). Effect
of caldaret on the incidence of severe left ventricular dysfunction in patients with
ST-elevation myocardial infarction undergoing primary coronary intervention. Am
J Cardiol.; 103(1):1-4.
Uchiyama T, Engelman RM, Maulik N, Das DK. (2004). Role of Akt signaling in
mitochondrial survival pathway triggered by hypoxic preconditioning.
Circulation.; 109(24):3042-9.
Uemura A, Naito Y, Matsubara T. (2002). Dynamics of Ca2+
/calmodulin-dependent
protein kinase II following acute myocardial ischemia-translocation and
autophosphorylation. Biochem Biophys Res Commun.; 297(4):997-1002.
Uetani T, Nakayama H, Okayama H, Okura T, Higaki J, Inoue H, Higashiyama S.
(2009). Insufficiency of pro-heparin-binding epidermal growth factor-like growth
factor shedding enhances hypoxic cell death in H9c2 cardiomyoblasts via the
activation of caspase-3 and c-Jun N-terminal kinase. J Biol Chem.;
284(18):12399-409.
Unal B., Critchley J.A., Capewell S. (2004) Explaining the decline in coronary heart
disease mortality in England and Wales between 1981 and 2000. Circulation; 109
(9): 1101-7.
266
Valverde CA, Kornyeyev D, Ferreiro M, Petrosky AD, Mattiazzi A, Escobar AL.
(2010). Transient Ca2+
depletion of the sarcoplasmic reticulum at the onset of
reperfusion. Cardiovasc Res.; 85(4):671-80.
Valverde CA, Mundiña-Weilenmann C, Reyes M, Kranias EG, Escobar AL, Mattiazzi
A. (2006). Phospholamban phosphorylation sites enhance the recovery of
intracellular Ca2+
after perfusion arrest in isolated, perfused mouse heart.
Cardiovasc Res.; 70(2):335-45.
Valverde CA, Mundiña-Weilenmann C, Said M, Ferrero P, Vittone L, Salas M,
Palomeque J, Petroff MV, Mattiazzi A. (2005). Frequency-dependent acceleration
of relaxation in mammalian heart: a property not relying on phospholamban and
SERCA2a phosphorylation. J Physiol.; 562(Pt 3):801-13.
Verdouw PD, van den Doel MA, de Zeeuw S, Duncker DJ. (1998). Animal models in
the study of myocardial ischaemia and ischaemic syndromes. Cardiovasc Res.;
39(1):121-35.
Vest RS, Davies KD, O'Leary H, Port JD, Bayer KU. (2007). Dual mechanism of a
natural CaMKII inhibitor. Mol Biol Cell.; 18(12):5024-33.
Vila-Petroff M, Mundiña-Weilenmann C, Lezcano N, Snabaitis AK, Huergo MA,
Valverde CA, Avkiran M, Mattiazzi A. (2010). Ca2+
/calmodulin-dependent
protein kinase II contributes to intracellular pH recovery from acidosisvia Na+/H
+
exchanger activation. J Mol Cell Cardiol.; 49(1):106-12.
Vila-Petroff M, Salas MA, Said M, Valverde CA, Sapia L, Portiansky E, Hajjar RJ,
Kranias EG, Mundiña-Weilenmann C, Mattiazzi A. (2007). CaMKII inhibition
protects against necrosis and apoptosis in irreversible ischemia-reperfusion injury.
Cardiovasc Res.; 73(4):689-98.
Vinten-Johansen J, Shi W. (2011). Perconditioning and postconditioning: current
knowledge, knowledge gaps, barriers to adoption, and future directions. J
Cardiovasc Pharmacol Ther.; 16(3-4):260-6.
Vittone L, Mundiña-Weilenmann C, Said M, Ferrero P, Mattiazzi A. (2002). Time
course and mechanisms of phosphorylation of phospholamban residues in
ischemia-reperfused rat hearts. Dissociation of phospholamban phosphorylation
pathways. J Mol Cell Cardiol.; 34(1):39-50.
267
Wagner S, Dybkova N, Rasenack EC, Jacobshagen C, Fabritz L, Kirchhof P, Maier SK,
Zhang T, Hasenfuss G, Brown JH, Bers DM, Maier LS. (2006). Ca2+
/calmodulin-
dependent protein kinase II regulates cardiac Na+ channels. J Clin Invest;
116(12):3127-38.
Wayman GA, Tokumitsu H, Davare MA, Soderling TR. (2011). Analysis of CaM-
kinase signaling in cells. Cell Calcium.; 50(1):1-8.
Weber CR, Ginsburg KS, Bers DM. (2003). Cardiac submembrane [Na+] transients
sensed by Na+-Ca
2+ exchange current. Circ Res.; 92(9):950-2.
Wehrens XH, Lehnart SE, Reiken SR, Marks AR. (2004). Ca2+
/calmodulin-dependent
protein kinase II phosphorylation regulates the cardiac ryanodine receptor. Circ
Res.; 94(6):e61-70.
WHO (2011). Global Atlas on cardiovascular disease prevention and control. Mendis S,
Puska P, Norrving B editors. World Health organization, Geneva 2011.
Witcher DR, Kovacs RJ, Schulman H, Cefali DC, Jones LR. (1991). Unique
phosphorylation site on the cardiac ryanodine receptor regulates calcium channel
activity. J Biol Chem.; 266(17):11144-52.
Woischwill C, Karczewski P, Bartsch H, Luther HP, Kott M, Haase H, Morano I.
(2005). Regulation of the human atrial myosin light chain 1 promoter by Ca2+
-
calmodulin-dependent signaling pathways. FASEB J; 19(6):503-11.
Wu X, Zhang T, Bossuyt J, Li X, McKinsey TA, Dedman JR, Olson EN, Chen J,
Brown JH, Bers DM. (2006). Local InsP3-dependent perinuclear Ca2+
signaling in
cardiac myocyte excitation-transcription coupling. J Clin Invest.; 116(3):675-82.
Wu Y, MacMillan LB, McNeill RB, Colbran RJ, Anderson ME. (1999). CaM kinase
augments cardiac L-type Ca2+
current: a cellular mechanism for long Q-T
arrhythmias. Am J Physiol.; 276(6 Pt 2):H2168-78.
Xie F, Qu Z, Garfinkel A, Weiss JN. (2001). Effects of simulated ischemia on spiral
wave stability. Am J Physiol Heart Circ Physiol.; 280(4):H1667-73.
Xie Y, Zhu WZ, Zhu Y, Chen L, Zhou ZN, Yang HT. (2004). Intermittent high altitude
hypoxia protects the heart against lethal Ca2+
overload injury. Life Sci.; 76(5):559-
72.
Xu L, Mann G, Meissner G. (1996). Regulation of cardiac Ca2+
release channel
(ryanodine receptor) by Ca2+
, H+, Mg
2+, and adenine nucleotides under normal
and simulated ischemic conditions. Circ Res.; 79(6):1100-9.
268
Yaglom JA, Ekhterae D, Gabai VL, Sherman MY. (2003). Regulation of necrosis
of H9c2 myogenic cells upon transient energy deprivation. Rapid deenergization
of mitochondria precedes necrosis and is controlled by reactive oxygen species,
stress kinase JNK, HSP72 and ARC. J Biol Chem.; 278(50):50483-96.
Yan X, Gao S, Tang M, Xi J, Gao L, Zhu M, Luo H, Hu X, Zheng Y, Hescheler J,
Liang H. (2011). Adenylyl cyclase/cAMP-PKA-mediated phosphorylation of
basal L-type Ca2+
channels in mouse embryonic ventricular myocytes.
Cell Calcium.; 50(5):433-43.
Yan XS, Ma JH, Zhang PH. (2009). Modulation of KATP currents in rat ventricular
myocytes by hypoxia and a redox reaction. Acta Pharmacol Sin.; 30(10):1399-
414.
Yang D, Zhu WZ, Xiao B, Brochet DX, Chen SR, Lakatta EG, Xiao RP, Cheng H.
(2007). Ca2+
/calmodulin kinase II-dependent phosphorylation of ryanodine
receptors suppresses Ca2+
sparks and Ca2+
waves in cardiac myocytes. Circ Res.;
100(3):399-407.
Yang X, Cohen MV, Downey JM. (2010). Mechanism of cardioprotection by early
ischemic preconditioning. Cardiovasc Drugs Ther.; 24(3):225-34.
Yang XM, Proctor JB, Cui L, Krieg T, Downey JM, Cohen MV. (2004). Multiple, brief
coronary occlusions during early reperfusion protect rabbit hearts by targeting cell
signalling pathways. J Am Coll Cardiol.; 44(5):1103-10.
Yang Z, Steele DS. (2001). Effects of cytosolic ATP on Ca2+
sparks and SR Ca2+
content in permeabilized cardiac myocytes. Circ Res.; 89(6):526-33.
Yellon DM, Alkhulaifi AM, Pugsley WB. (1993). Preconditioning the human
myocardium. Lancet.; 342(8866):276-7.
Yellon DM, Downey JM. (2003). Preconditioning the myocardium: from cellular
physiology to clinical cardiology. Physiol Rev. ;83(4):1113-51.
Yetgin T, Manintveld OC, Duncker DJ, van der Giessen WJ. (2010). Postconditioning
against ischaemia-reperfusion injury: ready for wide application in patients? Neth
Heart J.; 18(7-8):389-92.
Youn HJ, Kim HS, Jeon MH, Lee JH, Seo YJ, Lee YJ, Lee JH. (2005). Induction
of caspase-independent apoptosis in H9c2 cardiomyocytes by adriamycin
treatment. Mol Cell Biochem.; 270(1-2):13-9.
269
Yu Z, Wang ZH, Yang HT. (2009). Calcium/calmodulin-dependent protein kinase II
mediates cardioprotection of intermittent hypoxia against ischemic-reperfusion-
induced cardiac dysfunction. Am J Physiol Heart Circ Physiol.; 297(2):H735-42.
Yurukova S, Kilić A, Völker K, Leineweber K, Dybkova N, Maier LS, Brodde OE,
Kuhn M. (2007). CaMKII-mediated increased lusitropic responses to beta-
adrenoreceptor stimulation in ANP-receptor deficient mice. Cardiovasc Res.;
73(4):678-88.
Zalewska T, Zabłocka B, Domańska-Janik K. (1996). Changes of Ca2+
/calmodulin-
dependent protein kinase-II after transient ischemia in gerbil hippocampus. Acta
Neurobiol Exp (Wars).; 56(1):41-8.
Zaza and Rosen, (2000). An introduction to cardiac electrophysiology. Informa
Healthcare
Zhang R, Khoo MS, Wu Y, Yang Y, Grueter CE, Ni G, Price EE Jr, Thiel W,
Guatimosim S, Song LS, Madu EC, Shah AN, Vishnivetskaya TA, Atkinson JB,
Gurevich VV, Salama G, Lederer WJ, Colbran RJ, Anderson ME. (2005).
Calmodulin kinase II inhibition protects against structural heart disease. Nat Med.;
11(4):409-17.
Zhang T, Johnson EN, Gu Y, Morissette MR, Sah VP, Gigena MS, Belke DD, Dillmann
WH, Rogers TB, Schulman H, Ross J Jr, Brown JH. (2002). The cardiac-specific
nuclear deltaB isoform of Ca2+
/calmodulin-dependent protein kinase II induces
hypertrophy and dilated cardiomyopathy associated with increased protein
phosphatase 2A activity. J Biol Chem.; 277(2):1261-7.
Zhang T, Kohlhaas M, Backs J, Mishra S, Phillips W, Dybkova N, Chang S, Ling H,
Bers DM, Maier LS, Olson EN, Brown JH. (2007). CaMKIIdelta isoforms
differentially affect calcium handling but similarly regulate HDAC/MEF2
transcriptional responses. J Biol Chem.; 282(48):35078-87.
Zhang T, Maier LS, Dalton ND, Miyamoto S, Ross J Jr, Bers DM, Brown JH. (2003).
The deltaC isoform of CaMKII is activated in cardiac hypertrophy and induces
dilated cardiomyopathy and heart failure. Circ Res.; 92(8):912-9.
Zhao ZQ, Corvera JS, Halkos ME, Kerendi F, Wang NP, Guyton RA, Vinten-Johansen
J. (2003). Inhibition of myocardial injury by ischemic postconditioning during
reperfusion: comparison with ischemic preconditioning. Am J Physiol Heart Circ
Physiol.; 285(2):H579-88.

270
Zheng M, Reynolds C, Jo SH, Wersto R, Han Q, Xiao RP. (2005).
Intracellular acidosis-activated p38 MAPK signaling and its essential role in
cardiomyocyte hypoxic injury. FASEB J.; 19(1):109-11.
Zhu HL, Wei X, Qu SL, Zhang C, Zuo XX, Feng YS, Luo Q, Chen GW, Liu MD, Jiang
L, Xiao XZ, Wang KK. (2011). Ischemic postconditioning protects
cardiomyocytes against ischemia/reperfusion injury by inducing MIP2. Exp Mol
Med.; 43(8):437-45.
Zhu W, Woo AY, Yang D, Cheng H, Crow MT, Xiao RP. (2007). Activation of
CaMKIIdeltaC is a common intermediate of diverse death stimuli-induced heart
muscle cell apoptosis. J Biol Chem. ; 282(14):10833-9.
Zhu W, Zou Y, Shiojima I, Kudoh S, Aikawa R, Hayashi D, Mizukami M, Toko H,
Shibasaki F, Yazaki Y, Nagai R, Komuro I. (2000). Ca2+
/calmodulin-dependent
kinase II and calcineurin play critical roles in endothelin-1-induced cardiomyocyte
hypertrophy. J Biol Chem.; 275(20):15239-45.
Zhu WZ, Wang SQ, Chakir K, Yang D, Zhang T, Brown JH, Devic E, Kobilka BK,
Cheng H, Xiao RP. (2003). Linkage of beta1-adrenergic stimulation to apoptotic
heart cell death through protein kinase A-independent activation of
Ca2+
/calmodulin kinase II. J Clin Invest; 111(5):617-25.
Zima AV, Blatter LA. (2006). Redox regulation of cardiac calcium channels and
transporters. Cardiovasc Res.;71(2):310-21.
Zimmer HG (1998). The Isolated Perfused Heart and Its Pioneers. News Physiol Sci.;
13:203-210.
Zou Y, Yao A, Zhu W, Kudoh S, Hiroi Y, Shimoyama M, Uozumi H, Kohmoto O,
Takahashi T, Shibasaki F, Nagai R, Yazaki Y, Komuro I. (2001). Isoproterenol
activates extracellular signal-regulated protein kinases in cardiomyocytes through
calcineurin. Circulation.; 104(1):102-8.