Oscillations Damping Analysis and Control Studies of the ... · jurandir a. cavalcanti (chesf)...
32
V SEPOPE Conference, Recife, Brazil, May 1996 Oscillations Damping Analysis and Control Studies of the Future Interconnection Between the North-Northeast and South-Southeast Systems Nelson Martins (CEPEL) Hermínio J. C. P. Pinto (CEPEL) Carlos A. Gama (ELETRONORTE) Jurandir A. Cavalcanti (CHESF) Roberto L Leoni (ELETROBRÁS) Ronaldo V. Souto (ELETROBRÁS) Nilo J. P. Macedo (FURNAS) Maria José X. Eiras (FURNAS)
Transcript of Oscillations Damping Analysis and Control Studies of the ... · jurandir a. cavalcanti (chesf)...
V SEPOPE Conference, Recife, Brazil, May 1996
Oscillations Damping Analysis and Control Studies of the Future Interconnection Between
the North-Northeast and South-Southeast Systems
Nelson Martins (CEPEL)Hermínio J. C. P. Pinto (CEPEL)
Carlos A. Gama (ELETRONORTE)Jurandir A. Cavalcanti (CHESF)
Roberto L Leoni (ELETROBRÁS)Ronaldo V. Souto (ELETROBRÁS)
Nilo J. P. Macedo (FURNAS)Maria José X. Eiras (FURNAS)

Procedures for Stabilization of Electromechanical Oscillations in Interconnected Power Systems
n Application of Damping ControllersProblem IdentificationSitingInput Signal Selection and FilteringClosed Loop Control DesignPerformance EvaluationAdverse Side Effects

Software PacDynSmall Signal Stability Analysis and Control
n 8 Generator Models (Salient and Round Rotors, with saturation)n Excitation Control Systems (any kind)n Stabilizing Signals (any kind)n Governors (any kind)n 2 Induction Motor Modelsn HVDC Links and HVDC/CCC Schemesn FACTS Devices
Static Var CompensatorsThyristor Controlled Series CompensatorsSTATCOM
n User Defined Controllers (UDC)n Dynamic Loads

Software PacDynSmall Signal Stability Analysis and Control
n Eigenvalue Computation AlgorithmsFull eigensolution (QR and QZ)Partial eigensolution (Simult. Iteration; Dominant Pole Alg.)
n Transfer Function Zerosn Modal Sensitivities
Transfer Function ResiduesControlability FactorsObservability Factors (Mode Shapes)Participation Factors
n Frequency and Linear Time Response Plotsn Coordinated Controller Design

Geographic Map of the Proposed North-South Interconnection
RI O
XINGU
RI O
DAS
A LMA
S
RI O
AR
AGU
AIA
RI O
TO
CA
NT
I NS
R IOPA
RANAO ANT I NZI NH
RI O
S. F
R
ANC
I SCO
R IO
F ORM
OSO
R I OCOR R E N T E
R I O P AR AGU A C U
O JE Q
U I T I N H ONH
A
RI O
ARA
A I
R I OP R E T O
RIO
TO
CANT
IN
S
AGUA
S.SIMAOITUMBIARA
S.GOTARDO 2
JAGUARAPORTOMARIMBONDO
IRAPE
PIRAPORA
FSA
MOCAMBINHO
JEQUITINHONHA
ALMEN
S. ANTONIO DE JESUS
ITABAIANINHA
JARDIM
PENEDO
SOBRADINHO
P.BR
BOA ESPERANCA
EUNAPOLIS
ELISEU
PICOS
BOM NOME
COREMAS
ACU
TAP/XIN1
F.3
M.A.GRANDE
MIRADOR
BELEM
S.DIVISA
SALVADOR
SME/TMA
GOV
MASCARENHAS
ALTAMIRA
BELO MONTE
TUCURUI
REP
V. CONDE
IPI/MAR
ESTREITO
MARABA
SERRA QUEBRADA
IMPERATRIZ
FRAGOSO
LAJ/SOB
LAJ/IRE
BARREIRAS
IRECE SOB/SLV
IRE/SLV
MUSSURE
S. LUIS
FORTALEZA
PIRIPIRI
CRATEUSTERESINA
QUIXADA
MILAGRES
RUSSAS
MOSSORO
SOBRAL PENTECOSTES
B. ESP/MIL
SJP/MIL
MIRANDA
PRES. DUTRA
SEC.T/P
SERRA da
S. ROMAO
SME/BJLBOM JESUS
GOV
FUNIL
TRES MARIAS
XAVANTES
BANDEIRANTES
CORUMBA
NOVA PONTE
CAPIM BRANCO
CAMACARI
NIQUELANDIA
LAJ/SJP
SAM/BJL
IR
V.GRANDE
VALADARES
MANGABEIRA
VERMELHA
COLOMBIA
MARTINS
MESA
S.G.PARA TAQUARIL
VARZEADA PALMA
IPATINGA
T.OESTES.LUZIA
MACEIOJAGUARI
NATAL
NATAL II
DA LAPA
S. JOAO DO PIAUI
ICO
BJL/GMB
PERISES
C. PENA
BANABUIU
QUI/REC
RECIFE
MIL/REC
XINGO
ANGELIM
AFONSO
ITABAIANACICERODANTAS
OLINDINA
SENHOR DOBONFIM
JUAZEIRO
ANHANGUERA
EMBORCACAO
M.CLAROS
NEVES MESQUITA
DOURADACACHOEIRA
ITAPEBI
SAMAMBAIA
POMPEU
GU
PERITORO
ITAPARICA
PAULOMOXOTO MESSIAS
RIBEIRAO
BRASILIA GERAL
BARRO ALTO
CATU
DERIVACAO
S. ISABEL
RT.
C
C. GRANDE
TACAIMBOGOIANINHA
PAU FERRO
PAPAGAIO
S.3BLAJEADO
IPUEIRAS
PEIXE
CANA BRAVA
TUPIRATINS
500 kV AC TRANSMISSION REINFORCEMENT ALTERNATIVENORTH-SOUTH INTERCONNECTION
ALTERNATIVES
DCIMPERATRIZ
ACIMPERATRIZ
S. DA MESA S. DA MESA
PEIXE
TUPIRATINS
LEGEND
HYDROELECTRIC PLANT
SUBSTATION
LT 230 kV
LT 500 kV
EletrobrásGRUPO COORDENADOR DE PLANEJAMENTO
DO S S ISTEM AS ELÉ TR ICO S - GCPSLT 345 kV
SOUTHEAST
NORTHEAST
NORTH
CENTRAL WEST
Courtesy of Eletrobrás/GTOT

Small-Signal Time Responses of Major System Generators
-0,02
-0,01
0,01
0,02
0 5 10 15 20 25
Time (s)
Term
inal M
W D
eviat
ion (p
u)
-0,02
-0,01
0,00
0,01
0,02
0 5 10 15 20 25
Time (s)
Term
inal
MW
Dev
iatio
n (p
u)
South Exporting 1,000 MW to Northλ = −0.172+j0.98
North Exporting 1,000 MW to Southλ = −0.011+j 0.802
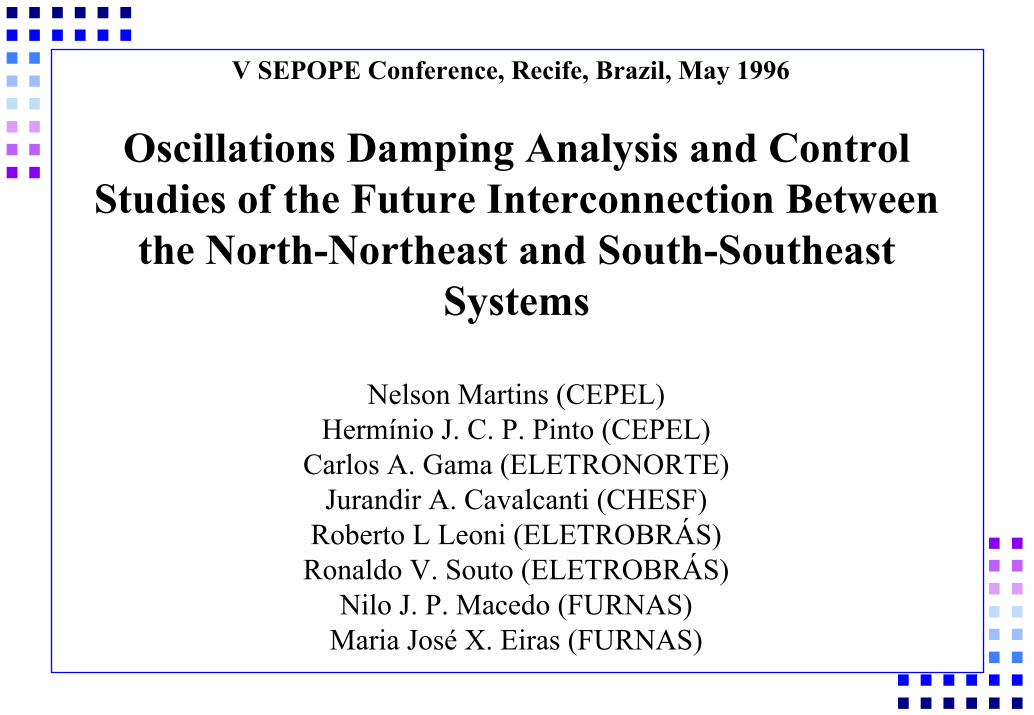
Small-Signal Power Oscillations in the North-South Intertie
South Exporting 1,000 MW to North
North Exporting 1,000 MW to South-0 ,1 2
-0 ,1 0
-0 ,0 8
-0 ,0 6
-0 ,0 4
-0 ,0 2
0 ,0 0
0 ,0 2
0 5 1 0 1 5 2 0 2 5
T im e (s )
Po
we
r F
low
De
via
tio

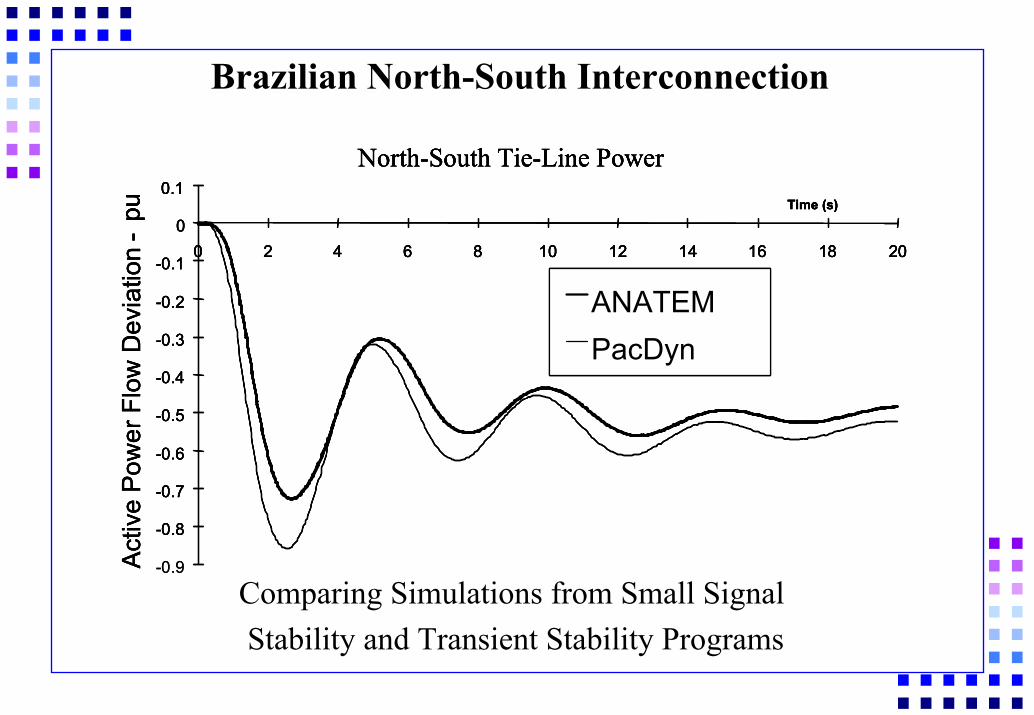
Brazilian North-South Interconnection
North-South Tie-Line Power
-3.5
-3
-2.5
-2
-1.5
-1
-0.5
0
0.5
1
1.5
2
0 2 4 6 8 10 12 14 16 18 20
Time (s)
Activ
e Po
wer
Flo
w D
evia
tion
-pu
ANATEM PacDyn
North-South Tie-Line Power
-3.5
-3
-2.5
-2
-1.5
-1
-0.5
0
0.5
1
1.5
2
0 2 4 6 8 10 12 14 16 18 20
Time (s)
Activ
e Po
wer
Flo
w D
evia
tion
-pu
ANATEM PacDyn
Comparing Simulations from Small Signal Stability and Transient Stability Programs

Brazilian North-South Interconnection
Active power flow in the North-South tie-line
Comparing step responses from the full-order linear model and a 4th order modal equivalent

Brazilian North-South Interconnection
Step response equation and constants for the 4th order modal equivalent
∑=
⋅ −≅4
1)1()(
i
t
i
i ieRty λ
λ
0044.0275.0802.0011.0
34
12
jj
±−=±−=
λλ
007.0039.0251.0006.0
34
12
jRjR
±−=±−=

Rotor Speed Mode Shape for North-South Mode)802.0011.0( 12 j±−=λ
South and Southeast Generators
North and Northeast Generators

Phasor Diagram Representation of Transfer Function Residues (Pij
k/Bijk, k = 1,nl)
-1
-0.8
-0.6
-0.4
-0.2
0
0.2
0.4
-0.6 -0.4 -0.2 0 0.2 0.4
Imperatriz - Tupiratins
Tupiratins - Peixe
B. Esperança - S.J. Piaui
Determining the Most Effective System Branches for InstallingTCSCs with PODs for Damping the N-S mode
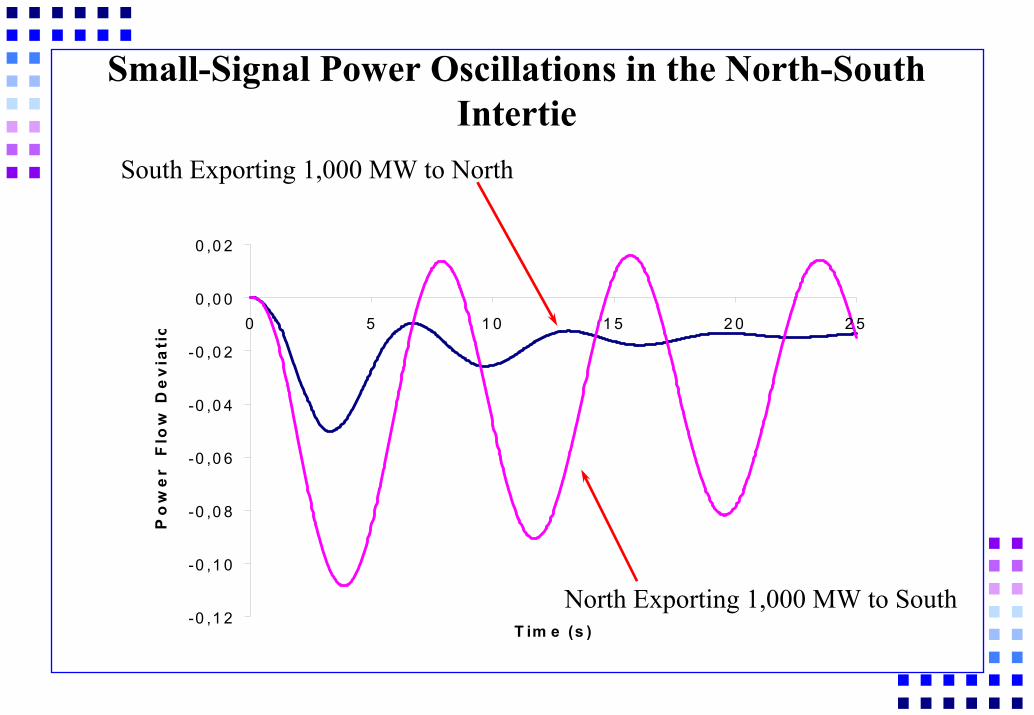
Single TCSC with POD Controller
CompleteCompleteSystemSystem
Linear ModelLinear Model
∆Bij ∆Pij
TCSC DampingTCSC DampingController TransferController Transfer
FunctionFunction

Frequency Response of ∆|Pij|(s) / ∆Bij(s)
North Exporting 1,000 MW to South
0.8 rad/s
4.5 rad/s

Frequency Response of ∆|Pij|(s) / ∆Bij(s) . TCSC(s)
North Exporting 1,000 MW to South
0.8 rad/s

Block Diagram for POD Controller of Single TCSC
∆Pij 428 42s s+ +.
1 0 61 25
2++
ss
.
.
Quadratic Filter
16ss5
1 5+
Washout Double -Lag Gain∆Bij

Linear Time Response of Tie-Line MW Flow as a Function of the TCSC POD Controller Gain
North Exporting 1,000 MW to South
-0 ,12
-0 ,10
-0 ,08
-0 ,06
-0 ,04
-0 ,02
0 ,00
0 ,02
0 5 1 0 15 20 25
T im e (s )
Po
wer
Flo
w D
evia
tio
n
K = 4 0
K = 1 6
K = 0
K = 8

Linear Time Response of Tie-Line MW Flow as a Function of the TCSC POD Controller Gain
South Exporting 1,000 MW to North
-0.06
-0.05
-0.04
-0.03
-0.02
-0.01
0.000 5 10 15 20 25
Time (s)
Pow
er F
low
Dev
iatio
n (p
u)
K = 40
K = 8
K = 16
K = 0

Linear Time Responses of Major System Generators in the Presence of a Single TCSC with POD Controller
-0.02
-0.01
0
0.01
0.02
0 5 10 15 20 25
Time (s)
Term
inal
MW
Dev
iatio
n (p
u)
North Exporting 1,000 MW to Southλ = −0.251+j0.823
-0.02
-0.01
0.00
0.01
0.02
0 5 10 15 20 25
Time (s)Te
rmin
al M
W D
evia
tion
(pu)
South Exporting 1,000 MW to Northλ = −0.286+j1.022

Inter-Area Eigenvalue Locus as a Function of the Gain of a Single TCSC POD Controller
(0)(5) (8) (16)
(16) (8) (5) (0)
Notation: Symbol ‘a’ relates to South to North, 1,000 MW FlowSymbol ‘r’ relates to North to South, 1,000 MW Flow
Brazilian North-South Interconnection
Comparing Simulations from Small Signal Stability and Transient Stability Programs
-0.9Activ
e Po
wer
Flo
w D
evia
tion
-
-0.8
-0.7
-0.6
-0.5
-0.4
-0.3
-0.2
-0.1
0
0.1
0 2 4 6 8 10 12 14 16 18 20
Time (s)puNorth-South Tie-Line Power
ANATEMPacDyn
-0.9Activ
e Po
wer
Flo
w D
evia
tion
-
-0.8
-0.7
-0.6
-0.5
-0.4
-0.3
-0.2
-0.1
0
0.1
0 2 4 6 8 10 12 14 16 18 20
Time (s)puNorth-South Tie-Line Power
ANATEMPacDyn
Activ
e Po
wer
Flo
w D
evia
tion
-
-0.8
-0.7
-0.6
-0.5
-0.4
-0.3
-0.2
-0.1
0
0.1
0 2 4 6 8 10 12 14 16 18 20
Time (s)puNorth-South Tie-Line Power
ANATEMPacDyn
-0.8
-0.7
-0.6
-0.5
-0.4
-0.3
-0.2
-0.1
0
0.1
0 2 4 6 8 10 12 14 16 18 20
Time (s)puNorth-South Tie-Line Power
ANATEMPacDyn

Eigenvalue Spectrum of the 50,000 MW, Brazilian North-South Interconnection
(with just one TCSC POD Controller)
North Exporting 1,000 to South

Root-Loci Varying the TCSC POD Controller Gain
North Exporting 1,000 MW to South
K = 0K = 20

Phasor Diagram Representation of Transfer Function Residues (ωi/Vref
i, i = 1, ng)
0
-1 -0.5 0
Paulo Afonso 4
Xingó
Paulo Afonso 3
ItaipuSobradinho
Itaparica
Determining the Most Effective Generators forInstalling Enhanced Stabilizers

Dominant Pole Spectrum for ∆ω(s) / ∆Vref(s)
Xingó Power Plant
0,0
2,0
4,0
6,0
8,0
10,0
-4,00 -3,00 -2,00 -1,00 0,00 1,00
Real
Imag.(rad/s)
Pole Residues are also depicted

Initial Displacements of Dominant Poles Due to Incremental Gain Stabilizer
Xingó Power Plant
0,0
2,0
4,0
6,0
8,0
10,0
-4,00 -3,00 -2,00 -1,00 0,00 1,00Real
Imag.(rad/s)
PSS s ss
ss
ss
( ) ..
..
=+
++
++
ε 31 3
1 0 41 0 04
1 0 271 2 7
2

Tie-Line Small-Signal Power Oscillations for Original and Enhanced PSSs in Xingó and P. Afonso IV
-0.12
-0.10
-0.08
-0.06
-0.04
-0.02
0.00
0.02
0 5 10 15 20 25
Time (s)
Pow
er F
low
Dev
iatio
n (p
u)
Original
Modified
North Exporting 1,000 MW to SouthOriginal PSS
Enhanced PSSs

Small-Signal Power Oscillations at North-South Intertie
North Exporting 1,000 MW to South
Original System
Enhanced PSSs
Enhanced PSSs in Xingó, P. Afonso IV, Itaparica and Sobradinho

Brazilian North-South InterconnectionTransient Stability Simulation of a Fault with Line Clearance
and Subsequent Reclosure
600
700
800
900
1000
1100
1200
1300
0 5 10 15 20 25Time (s)
Pow
er F
low
(MW
)
Existing PSS's
Proposed PSS's in Xingó,Paulo Afonso IV & Itaparica
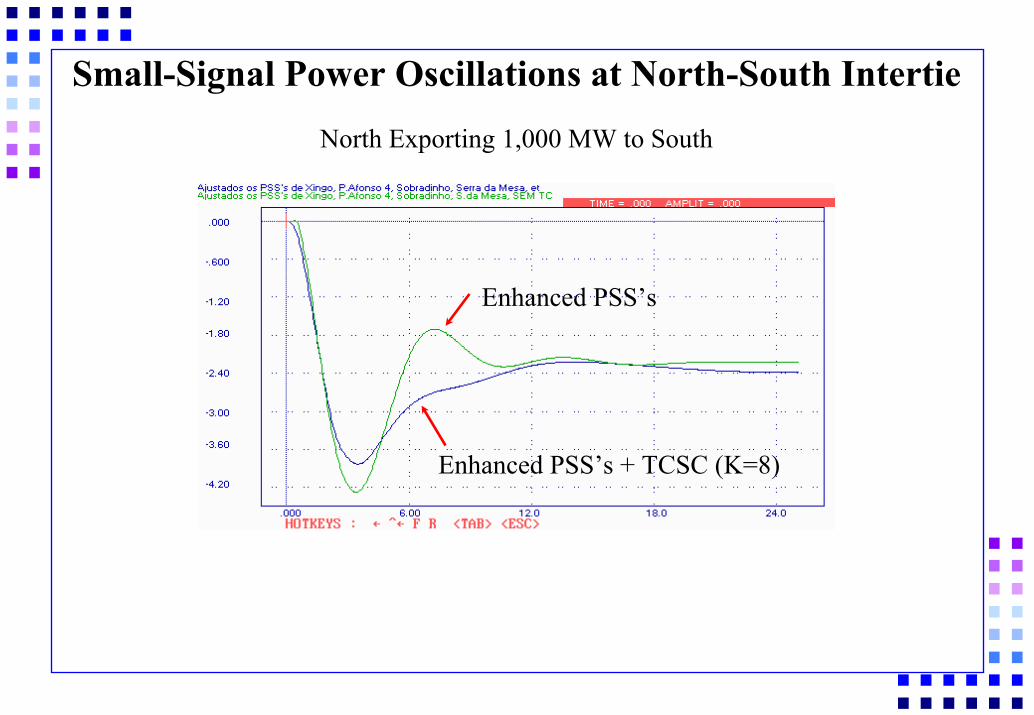
Small-Signal Power Oscillations at North-South Intertie
North Exporting 1,000 MW to South
Enhanced PSS’s + TCSC (K=8)
Enhanced PSS’s

Small-Signal Power Oscillations at North-South IntertieNorth Exporting 1,000 MW to South
Enhanced PSS’s + TCSC (K=8)TCSC (K=16)
Original System
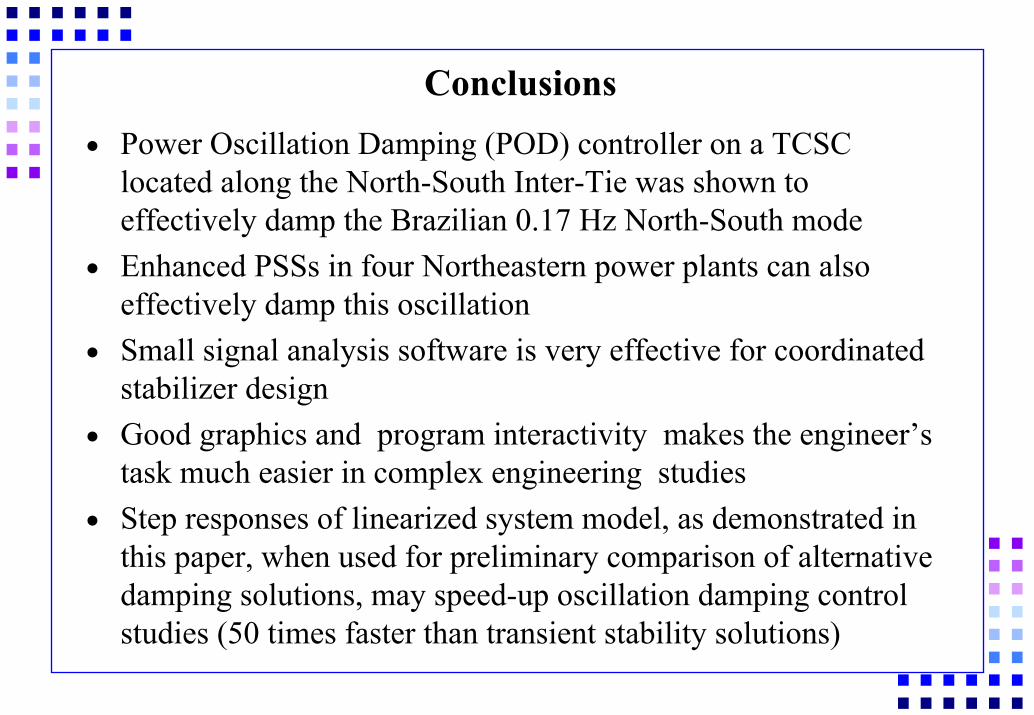
Conclusionsn Power Oscillation Damping (POD) controller on a TCSC
located along the North-South Inter-Tie was shown to effectively damp the Brazilian 0.17 Hz North-South mode
n Enhanced PSSs in four Northeastern power plants can also effectively damp this oscillation
n Small signal analysis software is very effective for coordinatedstabilizer design
n Good graphics and program interactivity makes the engineer’s task much easier in complex engineering studies
n Step responses of linearized system model, as demonstrated in this paper, when used for preliminary comparison of alternative damping solutions, may speed-up oscillation damping control studies (50 times faster than transient stability solutions)