OSBIE AUDIT COMMITTEE MEETING AGENDA Thursday February …
168
OSBIE AUDIT COMMITTEE MEETING AGENDA Thursday February 11, 2021 9:00am Virtual ITEM LEADER 1. Welcome & Attendance a) Confirmation of Agenda b) Declaration of Pecuniary Interest MOTION: To confirm the agenda Chair 2. Approval of previous meeting minutes MOTION: To approve the minutes of the December 11, 2020 Audit Committee meeting Chair 3. Report from the Appointed Actuary Report of the Appointed Actuary MOTION: To recommend to the Board to receive the Appointed Actuary’s report for year end 2020. Raul Martin, JSCP 4. Report of the Auditor Audited Financial Statements MOTION: To recommend to the Board to receive the Audit Findings report from KPMG for the audit of 2020 OSBIE financial statements. MOTION: To recommend to the Board the approval of the audited financial statements for the Ontario School Boards’ Insurance Exchange, for the year ended December 31, 2020. Kim Haley, KPMG 5. P&C-1 MOTION: To recommend approval of the 2020 annual P&C-1 form as presented. CFO 6. Audit Services Contract Discussion Contract renewal date July 01, 2021 Chair 7. In Camera Session The Audit Committee will meet with KPMG and JSCP. Chair 8. Future Meeting Dates • June 25, 2021 • Dec 10, 2021 9. Adjournment MOTION: To adjourn the Audit Committee meeting Chair
Transcript of OSBIE AUDIT COMMITTEE MEETING AGENDA Thursday February …

OSBIE AUDIT COMMITTEE MEETING AGENDA Thursday February 11, 2021 9:00am
Virtual
ITEM LEADER
1. Welcome & Attendance a) Confirmation of Agenda
b) Declaration of Pecuniary Interest
MOTION: To confirm the agenda
Chair
2. Approval of previous meeting minutes
MOTION: To approve the minutes of the December 11, 2020 Audit Committee meeting
Chair
3. Report from the Appointed Actuary
Report of the Appointed Actuary
MOTION: To recommend to the Board to receive the Appointed Actuary’s report for year end 2020.
Raul Martin, JSCP
4. Report of the Auditor
Audited Financial Statements
MOTION: To recommend to the Board to receive the Audit Findings report from KPMG for the audit of 2020 OSBIE financial statements.
MOTION: To recommend to the Board the approval of the audited financial statements for the Ontario School Boards’ Insurance Exchange, for the year ended December 31, 2020.
Kim Haley, KPMG
5. P&C-1
MOTION: To recommend approval of the 2020 annual P&C-1 form as presented.
CFO
6. Audit Services Contract Discussion
Contract renewal date July 01, 2021
Chair
7. In Camera Session
The Audit Committee will meet with KPMG and JSCP.
Chair
8. Future Meeting Dates
• June 25, 2021
• Dec 10, 2021
9. Adjournment
MOTION: To adjourn the Audit Committee meeting
Chair

Agenda 2
MOTION
TO: Audit Committee
FROM: CEO
RE: Previous Meeting Minutes
MOVED: SECONDED:
BE IT RESOLVED,
MOTION: To approve the minutes of the December 11, 2020 Audit Committee meeting.

OSBIE Audit Committee Meeting Minutes Virtual Meeting
Friday December 11, 2020
Present: Jeff Pratt Marc Cantin Isabel Grace Chris Arnew Amy Janssens Pearl Fong-West Craig Young Kirsti Alaksa Brian Coburn Cathy Modesto Chris Spina Peter Marshall Jaspal Gill
Regrets: Lynn Schaule
Resources: Jim Sami, CEO Sandra Taylor, CFO, Mark Anderson, Director of Claims Tammy Hicks, Director of Risk Management and Member Services Traci Decaro, Claims Manager Harjit Douglas, Recording Secretary
1. Call to Order
The Chair called the meeting to order at 9:02am. He called for any Declarations of PecuniaryInterest. There were none declared. He asked for a motion to confirm the agenda.
Motion: Moved by Marc Cantin, seconded by Peter Marshall to confirm the agenda. Carried.
2. Approval of previous meeting minutes
The Chair asked for a motion to approve the Audit Committee’s minutes of the June 26, 2020meeting.
Motion: Moved by Brian Coburn, seconded by Craig Young to approve the minutes of the June 26, 2020 Audit Committee meeting. Carried.
3. Electronic Business Between Meetings
Motion: Moved by Brian Coburn, seconded by Pearl Fong-West to confirm the motion torecommend the approval of the September 30, 2020 P&C1. Carried.
4. Report of the Auditor
The Chair invited Kim Haley and Dale Percival of KPMG to make their presentation.
MOTION: Moved by Brian Coburn, seconded by Isabel Grace to recommend the approval of the
audit plan for OSBIE’s 2020-year end as presented by KPMG. Carried.

5. In camera session
It was agreed amongst the directors that an In Camera session was not required for this meeting.
6. Future Meeting Dates
The Board Chair asked that the February 12,2021 date be amended as that date is tied to theFamily Day long weekend and some directors may want to use the February 12th date to extend the weekend. A suggestion was made to alter the date to Thursday February 11,2021 which was acceptable to the directors.
• February 11, 2021
• June 25, 2021
• December 10, 2021
MOTION: Moved by Brian Coburn, seconded by Pearl Fong-West to recommend the approval of the proposed meeting dates for 2021. Carried.
7. Adjournment
Motion: Moved by Brian Coburn, seconded by Jeff Pratt to adjourn the Audit Committeemeeting at 9:37am. Carried
Chair ____________________________________________________________
Secretary _________________________________________________________
MOTION: To approve the minutes of the December 11, 2020 Audit Committee meeting.

Agenda 3
MOTION
TO: Audit Committee
FROM: CEO
RE: Year end Report from the Appointed Actuary
MOVED: SECONDED:
BE IT RESOLVED,
MOTION: To recommend to the Board to receive the Appointed Actuary’s report for year end 2020.
Agenda 3a -Appointed Actuary’s Report
OSBIE’s Appointed Actuary, Raul Martin of JSCP will present his findings and opinion regarding
OSBIE’s year end IBNR and claims reserves valuation.
This opinion and report form part of our submission to FSRA, as well as our Annual Report to
Subscribers. The actuary’s role in performing this review is to certify to the regulator, as well
as the Members, that OSBIE is adequately reserved, by adjusting and re-setting our IBNR based
on the claims experience in 2020.
Asset/Liability Duration Matching
JSCP will comment on the Asset/Liability duration matching as per the requirements of the
OSBIE Governance policy ELP 7. This year he will talk about OSBIE’s short term cash
management review that he undertakes, along with the bond duration matching, in order to
confirm that OSBIE can meet our obligations. While our asset duration is increasing to
maximize the income opportunities, the liabilities are getting shorter, which means we are
settling claims faster.
IBNR valuation
To summarize:
• Case reserves have increased year over year from $45 Million to $60 Million -$13 million
is Property
• IBNR valuation is $39.7 million, virtually no change from $39.5 million at year end 2019.
• Liability case reserves and Liability IBNR form 92% of OSBIE’s total claim reserves.
The chart below summarizes Case Reserves and IBNR by Line and illustrates the significant
impact of Liability changes on our results.
Liab Cyber Prop Crime Boiler Auto Legal Expense Total
CASE Reserves
41,564,940
50,000
17,546,982 -
368,200
200,450
767,603
60,498,175
as a percent of Total case 68.70% 0.08% 29.00% 0.00% 0.61% 0.33% 1.27%
1.0
IBNR
38,158,000 -
495,000
141,000
15,000
706,000
215,000
39,730,000
as a percent of IBNR 96.04% 0.00% 1.25% 0.35% 0.04% 1.78% 0.54%
1
IBNR as a % of CASE 92% 3% 4% 352%

Large Loss Fund
JSCP will also speak to the treatment of the large loss fund for 2021 and beyond. Until we
experience a large loss, there are no offsetting claims liabilities, so the fund will continue to
build as a part of our surplus. The fund closed 2020 with a balance of $8,091,000.
Presentation slides from JSCP follow this summary.
MOTION: To recommend to the Board to receive the Appointed Actuary’s report for year end 2020.
To the Audit Committee of
Ontario School Boards’ Insurance Exchangeon
11 February 2021
PRESENTATION OF APPOINTED ACTUARY’S REPORT

1. Expression of Opinion2. Comparison of 2019 and 2020 Actuarial Present Value
(APV) Net Claims Liabilities3. List of important changes in 20204. Effect of Actuarial Present Value (APV) Calculation5. Duration Matching6. Loss Ratio by Segment7. Loss Ratio by Year 8. Claims Run-off by Segment9. Reinsurance/Retention
TABLE OF CONTENTS
OSBIE Presentation to Audit Committee February 2021 2

I have valued the policy liabilities and reinsurance recoverables of Ontario School Boards’Insurance Exchange for its statement of financial position at December 31, 2020 and their changesin the statement of income for the year then ended in accordance with the accepted actuarialpractice in Canada including selection of appropriate assumptions and methods.
In my opinion, the amount of policy liabilities net of reinsurance recoverables makes appropriateprovision for all policy obligations and the financial statements fairly present the results of thevaluation.
The results of my valuation together with the amounts carried in the Annual Return are thefollowing:
EXPRESSION OF OPINION
OSBIE Presentation to Audit Committee February 2021 3
AppointedCarried in Actuary's
Annual Return Estimate($'000) ($'000)
(1) Direct unpaid claims and adjustment expenses: 108,857 108,857
(2) Assumed unpaid claims and adjustment expenses: 0 0
(3) Gross unpaid claims and adjustment expenses: 108,857 108,857
(4) Ceded unpaid claims and adjustment expenses: 2,943 2,943
(5) Other amounts to recover: 5,863 5,863
(6) Other net liabilities: 0 0
(7) Net unpaid claims and adjustment expenses(3)-(4)-(5)+(6): 100,051 100,051
Claim Liabilities

EXPRESSION OF OPINION (Cont’d)
OSBIE Presentation to Audit Committee February 2021 4
AppointedPremium Liabilities Carried in Actuary's
Annual Return Estimate($'000) ($'000)(Col.1) (Col.2)
(1) Gross policy liabilities in connection with unearned premiums: 0 (2) Net policy liabilities in connection with unearned premiums: 0 (3) Gross unearned premiums: 0 (4) Net unearned premiums: 0 (5) Premium deficiency: 0 0 (6) Other net liabilities: 0 0 (7) Deferred policy acquisition expenses: 0 (8) Maximum policy acquisition expenses deferrable: [(4)+(5)+(9)]Col.1 - (2) Col.2
(9) Unearned Commissions + Ceded Deferred Premium Taxes + Ceded Deferred Insurance Operations Expenses:
0
0
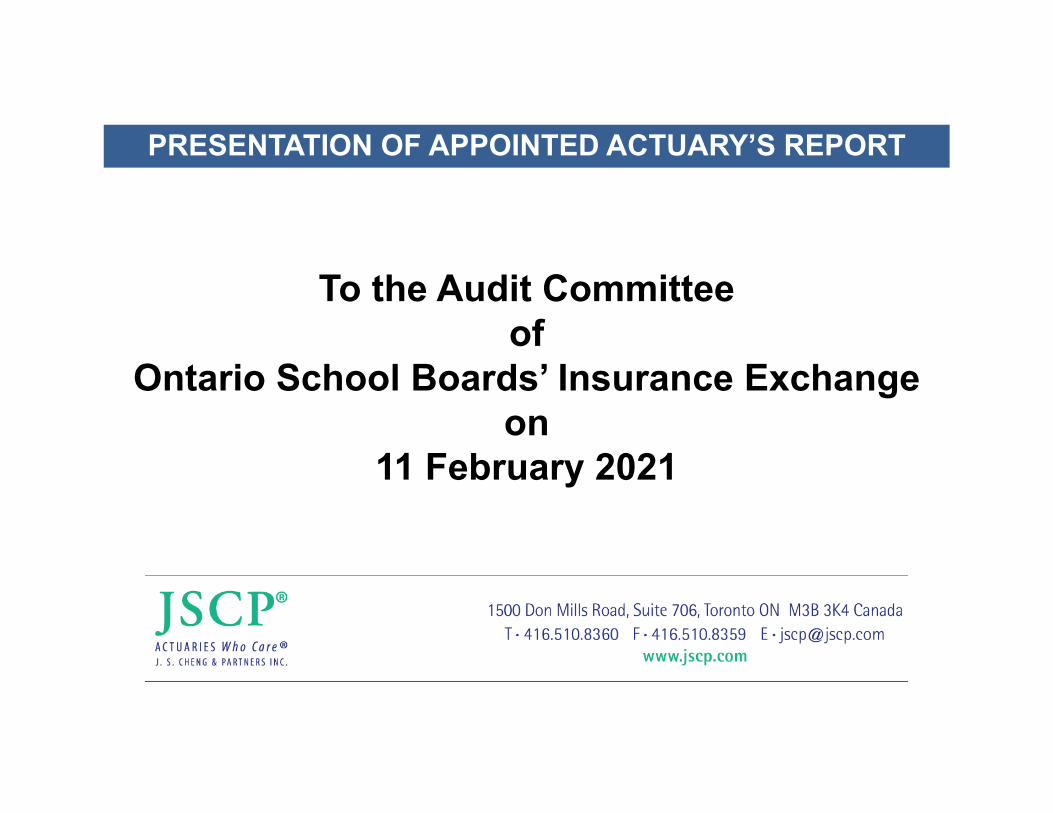
COMPARISON OF 2019 & 2020 ACTUARIAL PRESENT VALUE NET CLAIMS LIABILITIES
OSBIE Presentation to Audit Committee February 2021 5
2019 2020Net Net
Undiscounted 86,936 93,625Discounted claims 77,887 85,932PFAD - claims dev. 9,915 10,240PFAD - reinsurance 1 14PFAD - reinvestment 3,510 3,867Rounding 0 (2)APV 91,313 100,051

LIST OF IMPORTANT CHANGES IN 2020
OSBIE Presentation to Audit Committee February 2021 5
1. Impact of COVID-19 on Liability losses
2. Impact of COVID-19 on the discount rate
3. Large Property Loss

EFFECT OF APV CALCULATION
OSBIE Presentation to Audit Committee February 2021 6
Impact($000)
Net discount rate before MFAD 3.48% 2.93%Net discount rate after MFAD 2.03% 1.38%
MFAD for discount rate 1.45% 1.55%
Margin for claims development- SA/Environmental Liability 15.00% 15.00%
- Other Liability 12.50% 12.50%- Property, B&M, Crime 2.50% 2.50%- Automobile 10.00% 10.00%- Legal Expense 5.00% 5.00%- ILAE 15.00% 15.00%
2019 2020
(1,829)
0
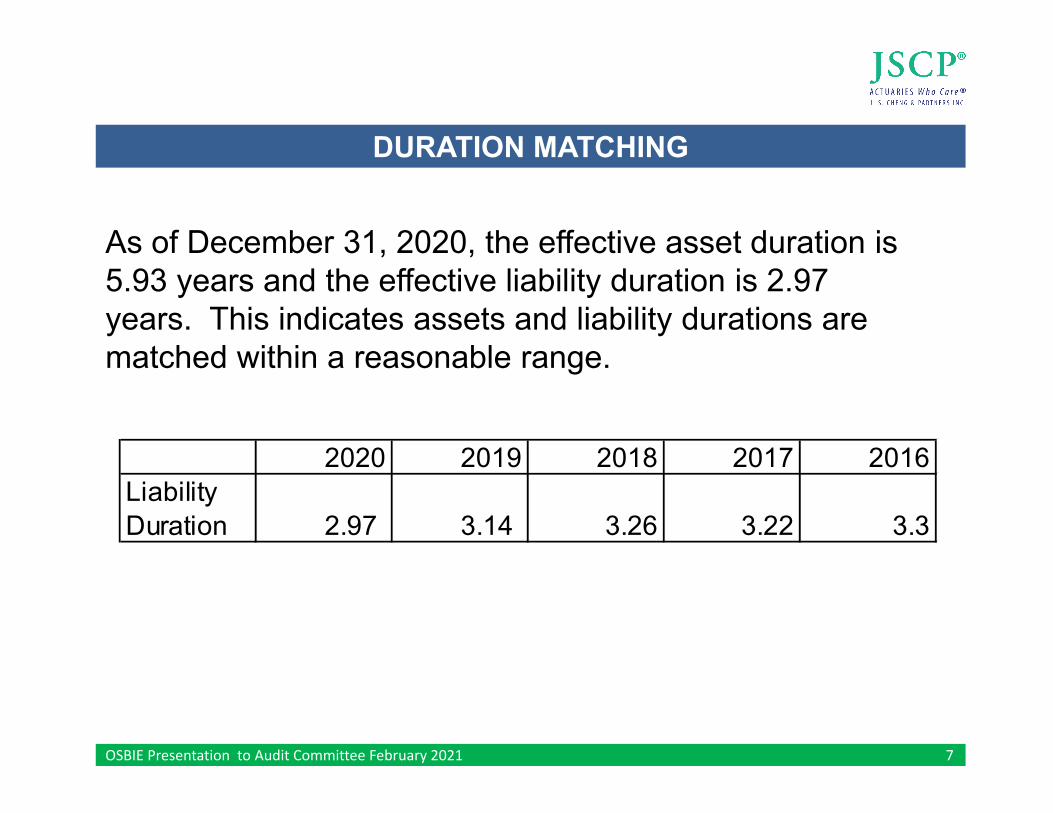
DURATION MATCHING
OSBIE Presentation to Audit Committee February 2021 7
As of December 31, 2020, the effective asset duration is 5.93 years and the effective liability duration is 2.97 years. This indicates assets and liability durations are matched within a reasonable range.
2020 2019 2018 2017 2016Liability Duration 2.97 3.14 3.26 3.22 3.3

CURRENT POLICY YEAR UNDISCOUNTED LOSS RATIO
OSBIE Presentation to Audit Committee February 2021 8
(Before ILAE)
Gross Gross Gross GrossEarned Loss Earned Loss
Segment Premium Ratio Premium Ratio($000's) ($000's)
Liability 17,853 80.42% 19,732 54.18%Property 10,360 32.99% 10,914 164.35%Boiler & Machinery 354 97.74% 794 55.16%Crime 881 77.07% 905 15.47%Automobile 1,100 50.00% 1,040 49.90%Legal Expense 531 88.51% 1,013 67.62%
OSBIE Total 31,079 63.78% 34,398 88.41%
2019 Appointed Actuary Report
2020 Appointed Actuary Report

GROSS UNDISCOUNTED LOSS RATIO BY YEAR(Excluding ILAE)
OSBIE Presentation to Audit Committee February 2021 9
0%
20%
40%
60%
80%
100%
120%
140%
2000
2001
2002
2003
2004
2005
2006
2007
2008
2009
2010
2011
2012
2013
2014
2015
2016
2017
2018
2019
2020
Gross Loss Ratio: Policy Year 2000-2020
2019
2020

ONE-YEAR CLAIMS RUN-OFF BY SEGMENT(Undiscounted Basis Excluding ILAE)
OSBIE Presentation to Audit Committee February 2021 10
Gross Basis Redundancy (Deficiency)($000's)
Liability (6,906)
Property 490
Boiler & Machinery (46)
Crime (347)
Automobile 330
Total OSBIE (6,528)
* Net Runoff (6,457)

Reinsurance Coverage
2019 2020
Liability $22M xs $5M No Reinsurance
Property $5M xs Board deductible
$5M xs Board deductible
Crime No Reinsurance No ReinsuranceBoiler & Machinery 50% co-insured No Reinsurance
Automobile $17M xs $3M No ReinsuranceLegalExpense No Reinsurance No Reinsurance
REINSURANCE / RETENTION
OSBIE Presentation to Audit Committee February 2021 12

Agenda 4a
MOTION
TO: Audit Committee FROM: CEO RE: KPMG year end reports: Audit Findings Report
Presentation of Audited Financial Statements
MOVED: SECONDED:
BE IT RESOLVED, MOTION: To recommend to the Board to receive the Audit Findings report from KPMG for the audit of 2020 OSBIE financial statements. MOTION: To recommend to the Board the approval of the audited financial statements for the Ontario School Boards’ Insurance Exchange for the year ended December 31, 2020.

Ontario School Boards Insurance Exchange (OSBIE)
Audit Findings Report for the year ended December 31, 2020
Licensed Public Accountants
Prepared as of February 2, 2021 for
the Audi t Commit tee meet ing on
February 11, 2021
kpmg.ca/audi t

Table of contents Changes from the audit plan 1
What’s new in 2020 2
Audit risks and results 5
Significant accounting policies and practices 11
Financial statement presentation and disclosure 12
Uncorrected differences and corrected adjustments 13
Appendices 14
Appendix 1: Other Required Communications 15
Appendix 2: Management Representation Letter 16
Appendix 3: Independence Letter 23
Appendix 4: Draft Auditors’ Report 25
Appendix 5: KPMG’s System of Quality Control 30
Appendix 6: Technology in the audit 31
Appendix 7: Audit and Assurance Insights 32

Audit Findings Report P a g e | 1
Executive summary Purpose of this report1
The purpose of this Audit Findings Report is to assist you, as a member of the Audit Committee, in your review of the results of our audit of the financial
statements as at and for the period ended December 31, 2020. This Audit Findings Report builds on the Audit Plan we presented to the Audit Committee.
What’s new in 2020
There have been significant changes in 2020 which impacted financial reporting,
the Entity’s internal control over financial reporting and our audit:
• COVID-19 pandemic – See pages 2 - 3
• New CAS auditing standards – See page 4
Changes from the audit plan
There have been no significant changes regarding our audit from the Audit
Planning Report previously presented to you.
Independence
We have included a copy of our annual independence letter dated as of the date of
this report, which notes that we are independent of the Entity in accordance with
the ethical requirements that are relevant to our audit of the financial statements in
Canada.
Uncorrected differences
We did not identify differences that remain uncorrected.
1 This Audit Findings Report is intended solely for the information and use of Management, the Audit Committee, and the Board of Directors and should not be used for any other purpose or any other
party. KPMG shall have no responsibility or liability for loss or damages or claims, if any, to or by any third party as this Audit Findings Report has not been prepared for, and is not intended for, and
should not be used by, any third party or for any other purpose.
Finalizing the audit
As of February 4, 2021, we have completed the audit of the financial statements,
with the exception of certain remaining procedures, which include amongst others:
– Receipt of the legal letter
– Completing our final tie in of the financial statement and note disclosures
– Review of the French translation and Annual Reports
– Obtaining the signed management representation letter
– Completing our discussions with the Audit Committee
– Obtaining evidence of the Board’s approval of the financial statements
We will update the Audit Committee, and not solely the Chair, on significant
matters, if any, arising from the completion of the audit, including the completion of
the above procedures.
Our auditors’ report, a draft of which is provided in Appendix 4, will be dated upon
the completion of any remaining procedures.
Control deficiencies
We did not identify any control deficiencies that we determined to be significant
deficiencies in internal control over financial reporting.

Audit Findings Report P a g e | 2
What’s new in 2020 COVID-19 pandemic
On December 11, 2020, our audit plan highlighted potential impacts of the COVID-19 pandemic. We adapted our audit to respond to the continued changes
in your business, including the impacts on financial reporting and internal control over financial reporting.
Area of Impact Key Observations
Company’s financial reporting impacts
- We considered impacts to financial reporting due to COVID-19 pandemic and the increased disclosures needed in the financial statements
as a result of the significant judgements.
- In areas of the financial statements where estimates involved significant judgements, we evaluated whether the method, assumptions and
data used by management to derive the accounting estimates, and their related financial statement disclosures were still appropriate per the
relevant financial reporting framework given the changed economic conditions and increased estimation uncertainty
- The areas of the financial statements most affected included:
o Disclosures – See Note 16 to the financial statements
Company’s internal control over financial reporting
- As part of our risk assessment we examined the financial reporting risks, including fraud risks, given possible new pressures on
management or new opportunities to commit fraud given changes in the Entity’s internal controls over financial reporting.
- As a result of the Entity’s remote working environment, it was necessary to assess the impact to the Entity’s internal controls.
o In areas of the audit where we are evaluating controls, we obtained an understanding of any changes to processes and controls during
the year to assess if there was a need to change the extent of testing. No changes were noted that had a significant impact on the
scope of audit work.
Materiality
- We considered impacts to financial reporting on both the determination and the re-assessment of materiality for the audit of the financial
statements.
- No adjustment to materiality was considered necessary.
Risk Assessment
- We performed a more thorough risk assessment specifically targeted at the impacts of the COVID-19 pandemic, including an assessment of
fraud risk factors (i.e., conditions or events that may be indicative of an incentive/pressure to commit fraud, opportunities to commit fraud,
rationalizations of committing fraud).

Audit Findings Report P a g e | 3
COVID-19 pandemic (continued)
Area of Impact Key Observations
Working remotely
- We used virtual work rooms, video conferencing, and internally shared team sites to collaborate in real-time, both amongst the audit team
as well as with management.
- We increased our professional skepticism when evaluating electronic evidence received and performed additional procedures to validate the
authenticity and reliability of electronic information used as audit evidence.
Direction and Supervision of the audit
- The manager and partner were actively involved in determining the impact that the COVID-19 pandemic had on the audit (as discussed
above), including the impact on the Entity’s financial reporting and changes in the Entity’s internal control over financial reporting.
- Managers and partners implemented new supervision processes to deal with working in a remote environment, and our audit approach
allowed us to manage the audit using meaningful milestones and frequent touch points.
Substantive Testing - Response
- Our evaluation of management’s assessment of going concern was enhanced to respond to the uncertainties relating to prospective
financial information and judgements about appropriate financial statement disclosures in the rapidly changing environment.

Audit Findings Report P a g e | 4
New auditing standards
The following new auditing standards that are effective for the current year had an impact on our audit.
Standard Key observations
CAS 540, Auditing
Accounting Estimates
and Related Disclosures
— The new standard was applied on all estimates within the financial statements that had a risk of material misstatement due to estimation
uncertainty and not just “key estimates”, “critical accounting estimates”, or “estimates with significant risk”.
— The granularity and complexity of the new standard along with our interpretation of the application of that standard necessitated more
planning and discussion and increased involvement of more senior members of the engagement team.
— We performed more granular risk assessments based on the elements making up each accounting estimate such as the method, the
assumptions used, the data used and the application of the method.
— We considered the potential for management bias.
— We assessed the degree of uncertainty, complexity, and subjectivity involved in making each accounting estimate to determine the level of
audit response; the higher the level of response, the more persuasive the audit evidence was needed.
— We involved professionals with appropriate skills and knowledge to assist us in auditing certain estimates as appropriate.
— See pages 5 and 7 under Audit Risk and Results for estimates that related to significant risk or other areas of focus, which are a subset of
all the estimates subject to the new standard.
Audit Findings Report P a g e | 5
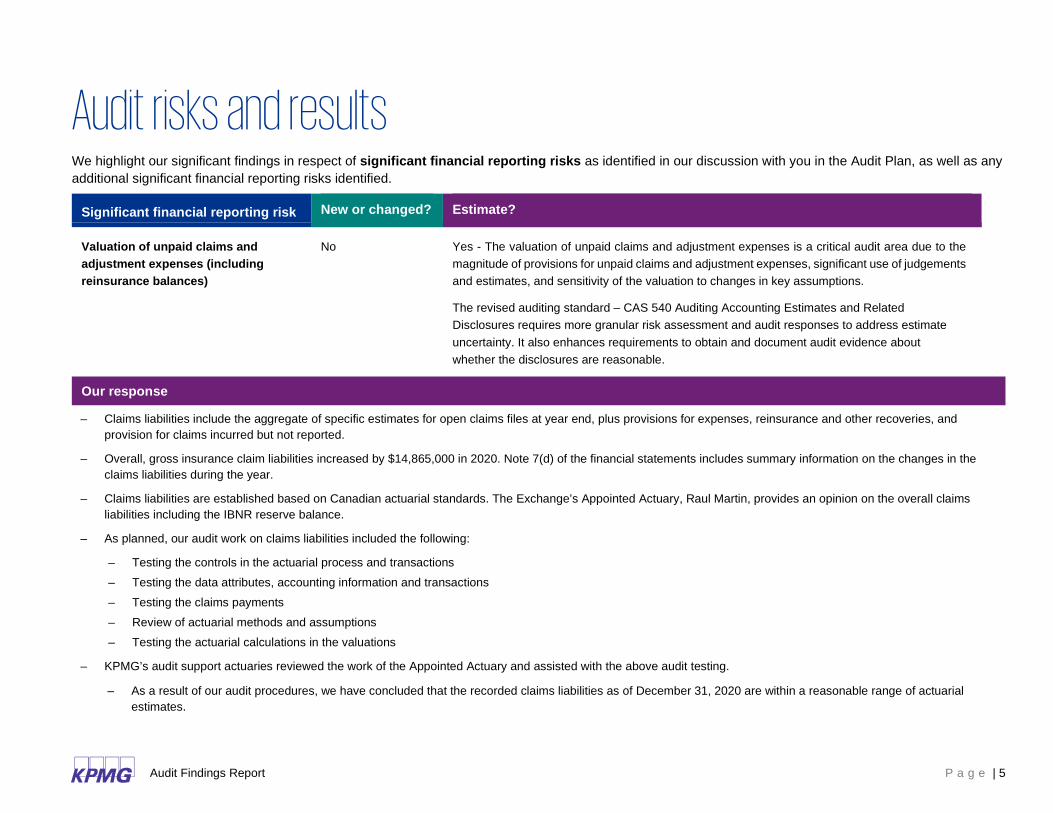
Audit risks and results We highlight our significant findings in respect of significant financial reporting risks as identified in our discussion with you in the Audit Plan, as well as any
additional significant financial reporting risks identified.
Significant financial reporting risk New or changed? Estimate?
Valuation of unpaid claims and
adjustment expenses (including
reinsurance balances)
No Yes - The valuation of unpaid claims and adjustment expenses is a critical audit area due to the
magnitude of provisions for unpaid claims and adjustment expenses, significant use of judgements
and estimates, and sensitivity of the valuation to changes in key assumptions.
The revised auditing standard – CAS 540 Auditing Accounting Estimates and Related
Disclosures requires more granular risk assessment and audit responses to address estimate
uncertainty. It also enhances requirements to obtain and document audit evidence about
whether the disclosures are reasonable.
Our response
– Claims liabilities include the aggregate of specific estimates for open claims files at year end, plus provisions for expenses, reinsurance and other recoveries, and
provision for claims incurred but not reported.
– Overall, gross insurance claim liabilities increased by $14,865,000 in 2020. Note 7(d) of the financial statements includes summary information on the changes in the
claims liabilities during the year.
– Claims liabilities are established based on Canadian actuarial standards. The Exchange’s Appointed Actuary, Raul Martin, provides an opinion on the overall claims
liabilities including the IBNR reserve balance.
– As planned, our audit work on claims liabilities included the following:
– Testing the controls in the actuarial process and transactions
– Testing the data attributes, accounting information and transactions
– Testing the claims payments
– Review of actuarial methods and assumptions
– Testing the actuarial calculations in the valuations
– KPMG’s audit support actuaries reviewed the work of the Appointed Actuary and assisted with the above audit testing.
– As a result of our audit procedures, we have concluded that the recorded claims liabilities as of December 31, 2020 are within a reasonable range of actuarial
estimates.

Audit Findings Report P a g e | 6
Audit risks and results We highlight our significant findings in respect of areas of focus as identified in our discussion with you in the Audit Plan, as well as any additional areas of
focus identified.
Area of focus Why is it significant?
Fraud risk from management override of controls This is a presumed fraud risk under Canadian auditing standards.
We have not identified any specific additional risks of management override relating to this audit.
Our response and Significant findings
– Our procedures included:
- We tested the design and implementation of controls surrounding the recording of journal entries, and the business rationale for significant entries.
- We tested the process for critical accounting estimates, including performing a retrospective review of prior period estimates.
– No issues were noted in the performance of the above procedures.

Audit Findings Report P a g e | 7
Audit risks and results Area of focus Why are we focusing here?
Valuation of investments All of OSBIE’s invested assets continue to be carried on the statement of financial position at fair value
determined from publicly available sources of market data.
Available-for-sale (AFS) assets are carried at market value; unrealized gains and losses on AFS assets are
held in accumulated other comprehensive income until realized through sale or through recognition of
impairment losses. For these assets it is necessary to consider whether an impairment in value has occurred.
Our response and Significant findings
− Management has established valuation procedures for the majority of the portfolio based on the use of a third party pricing source. Fair values are categorized and
disclosed as Levels 1, 2 and 3, with Level 1 and Level 2 being based on market quotes and market-observable inputs, respectively, and Level 3 being based on other
valuation and appraisal techniques.
− As disclosed in note 4(c) of the financial statements, at December 31, 2020, management has categorized assets as $55.4 million in Level 1, $157.6 million in Level 2,
and $nil in Level 3. KPMG tested the allocation of investments between categories of the fair value hierarchy.
− Management has a process to review the valuation of investments and evaluates investment impairment on a regular basis. Management’s assessment as at
December 31, 2020 was that no provision was required for any impairment in value of AFS securities, which consist of $157.6 million of bonds and debentures and
$55.4 million of equities.
− KPMG tested management’s valuation of investments and performed an assessment of possible impairments in AFS securities. We identified an equity position in
Bank of Nova Scotia that has had a market value below book value for a prolonged period and proposed an adjustment to record an impairment write-down of
$287,000. Management has recorded this adjustment in the financial statements.
− In completing our review of service organization auditor’s reports over controls at investment custodians, we noted that there are no reports available for TD Direct
Investing or National Bank. We performed alternative procedures to gain comfort over the custodians.
− We performed Data & Analytics procedures on investments using KPMG proprietary software, iRADAR. We performed independent price testing of management’s
pricing for bonds and debentures, and equities:
− Bonds with a market value of $127.8 million, and equities with a market value of $51.3 million were tested by iRADAR.
− For bonds and debentures, KPMG’s iRADAR team analyzes the security’s market to determine whether there is an active market for the security.
− We independently priced the market value of the remaining bonds and equities excluded from iRADAR testing.
− Based on our testing, the aggregate difference where market values were out of the range amounted to $59,000.
− As a result of our audit procedures, no other issues were identified.

Audit Findings Report P a g e | 8
Data & Analytics: valuation of investments
The market value of all bonds and pooled funds tested amounts to $179.1 million. For bonds and debentures, KPMG’s iRADAR team analyses the security’s market to determine whether there is an active market for the security. For those investments that are determined to not have an active market, further pricing analysis is done to develop an internal valuation of the security to better reflect a true fair value as at December 31, 2020. After applying investment specific ranges of acceptable prices, the netted deviation out of range of acceptable prices for equites is $nil, and for bonds is $59,000, which is less than our audit misstatement posting threshold of $210,000. From this graph, one can observe that the higher pricing deviations have small monetary impact and that the positions with high notional value have deviations close to zero.
-400
-300
-200
-100
0
100
200
300
400
500
0 1 2 3 4 5 6 7
Price D
iffe
rence (
bps)
Notional (CAD) in millions
Price Dispersion
Corp
Govt / Municipals
Preferreds / Perpetuals
Structured Notes

Audit Findings Report P a g e | 9
Data & Analytics: benchmarking prices – fixed income securities For the fixed income securities held by OSBIE, we have summarized our findings to compare the Exchange’s portfolio to other KPMG client portfolios where there are prices
from at least two clients other than OSBIE. The average standard deviation per security measured for the various price contributions is also presented below.
Overall, the difference between OSBIE’s average price of 104.60 and the average price of its industry group of 104.58 falls within one standard deviation and is well within the
range we would find acceptable for any variations noted in the pricing of your portfolio
0
20
40
60
80
100
120
140
160
0 20 40 60 80 100 120 140 160
Clie
nt
Price
Industry Average Price
Industry Average Price vs. Client Price
Corp
Govt / Municipals
Client's AverageIndustry's Average
Industry +/-1 Standard Deviation
104.3 104.35 104.4 104.45 104.5 104.55 104.6 104.65 104.7 104.75 104.8 104.85
Industry Benchmarking Results

Audit Findings Report P a g e | 10
Audit risks and results Area of focus Why are we focusing here?
Claims expense (including related reinsurance) Claims payments require a degree of judgment in ascertaining whether coverage is adequate and the
payment is within authorized limits.
Our response and Significant findings
– We tested the controls over the approval of claim payments and the review of claims files by the claims manager. No control deficiencies were noted.
– We tested a sample of claim payments, tracing the pay out to the supporting source documentation.
– As a result of our audit procedures, no issues or audit misstatements were identified.
Area of focus Why are we focusing here?
Written premiums and premiums paid in advance
(including related reinsurance balances)
Written premiums represent the largest balance on the statement of comprehensive income.
Our response and Significant findings
– We substantively tested gross written premiums and premiums received in advance by agreeing a sample of premium amounts through to the general ledger and
receipt of payment.
– We tested the accuracy of the reinsurance ceded balance.
– As a result of our audit procedures, no issues or audit misstatements were identified.

Audit Findings Report P a g e | 11
Significant accounting policies and practices
Changes
There have been no changes to significant accounting policies and practices during the year.
Future Implementation
Accounting pronouncements issued but not yet effective are disclosed in Note 2(l) to the financial statements.
IFRS 17, Insurance Contracts
- On May 18, 2017 the IASB issued IFRS 17 Insurance Contracts. On June 25, 2020, the IASB issued amendments to IFRS 17 aimed at helping companies implement the Standard and to defer the effective date. The new standard is effective for annual periods beginning on or after January 1, 2023. IFRS 17 will replace IFRS 4 Insurance Contracts.
- The IASB has deferred the effective date of IFRS 17 to January 1, 2023. The fixed expiry date for the optional temporary exemption from applying IFRS 9 Financial Instruments, granted to insurers meeting certain criteria, would also be deferred to 2023. This means that all companies preparing financial statements under IFRS would be required to apply both IFRS 9 and IFRS 17 for annual periods beginning on or after January 1, 2023.
IFRS 9, Financial Instruments
- On July 24, 2014 the IASB issued the complete amended IFRS 9. The mandatory effective date of IFRS 9 is for annual periods beginning on or after January 1, 2018.
- As at January 1, 2018, the Entity has elected to apply the optional transitional relief under IFRS 4 that permits the deferral of the adoption of IFRS 9 for eligible insurers. The Entity will continue to apply IAS 39 until January 1, 2023.

Audit Findings Report P a g e | 12
Financial statement presentation and disclosure Misstatements, including omissions, if any, related to financial statement presentation and disclosure items are in the management representation letter.
We also highlight the following:
Form, arrangement, and
content of the financial
statements
Adequate
Significant accounting policies or practices are disclosed in note 2 to the financial statements. There are no changes in accounting policies
during the current year.
Significant qualitative
aspects of financial
statement presentation
and disclosure
COVID-19 pandemic disclosures
The COVID-19 pandemic has resulted in significant financial, market and societal impacts in Canada and around the world. Management has
added Note 16 to the financial statements to highlight this impact.

Audit Findings Report P a g e | 13
Uncorrected differences and corrected adjustments Differences and adjustments include disclosure and presentation differences and adjustments.
Professional standards require that we request of management and the Audit Committee that all identified differences be corrected. We have already made
this request of management.
Uncorrected differences
We did not identify differences that remain uncorrected.
Corrected adjustments
The management representation letter includes all adjustments identified as a result of the audit, communicated to management and subsequently corrected in the financial
statements.
As at and year ended December 31, 2020 Income effect Financial position
Description of differences greater than $210,000 individually
(Decrease) Increase Assets
(Decrease) Increase Liabilities
(Decrease) Increase Equity
(Decrease) Increase
To record the investment impairment provision on the Bank of
Nova Scotia equity holdings with prolonged decline in value.
Investment Income
Other comprehensive income
($286,574)
$286,574
– –
($286,574)
$286,574
Total differences – – – –

Appendices Content
Appendix 1: Other Required communications
Appendix 2: Management Representation Letter
Appendix 3: Independence Letter
Appendix 4: Draft Auditors’ Report
Appendix 5: KPMG’s System of Quality Control
Appendix 6: Technology in the Audit
Appendix 7: Audit and Assurance Insights
Audit Findings Report P a g e | 15
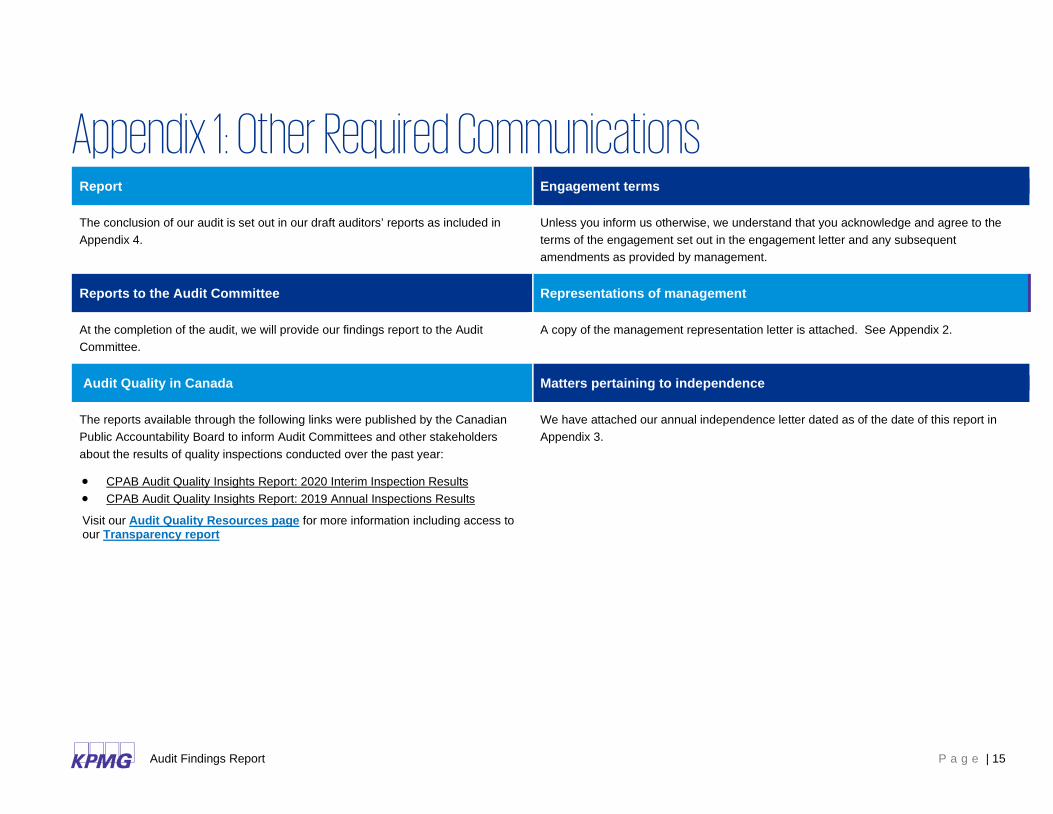
Appendix 1: Other Required Communications Report Engagement terms
The conclusion of our audit is set out in our draft auditors’ reports as included in
Appendix 4.
Unless you inform us otherwise, we understand that you acknowledge and agree to the
terms of the engagement set out in the engagement letter and any subsequent
amendments as provided by management.
Reports to the Audit Committee Representations of management
At the completion of the audit, we will provide our findings report to the Audit
Committee.
A copy of the management representation letter is attached. See Appendix 2.
Audit Quality in Canada Matters pertaining to independence
The reports available through the following links were published by the Canadian
Public Accountability Board to inform Audit Committees and other stakeholders
about the results of quality inspections conducted over the past year:
• CPAB Audit Quality Insights Report: 2020 Interim Inspection Results
• CPAB Audit Quality Insights Report: 2019 Annual Inspections Results
Visit our Audit Quality Resources page for more information including access to our Transparency report
We have attached our annual independence letter dated as of the date of this report in
Appendix 3.

Audit Findings Report P a g e | 16
Appendix 2: Management Representation Letter KPMG LLP Chartered Professional Accountants 115 King Street South 2nd Floor Waterloo, ON N2J 5A3
February 11, 2021
Ladies and Gentlemen:
We are writing at your request to confirm our understanding that your audit was for the purpose of expressing an opinion on the financial statements (hereinafter referred to as “financial statements”) of Ontario School Boards’ Insurance Exchange (“the Entity”) as at and for the period ended December 31, 2020.
General:
We confirm that the representations we make in this letter are in accordance with the definitions as set out in Attachment I to this letter.
We also confirm that, to the best of our knowledge and belief, having made such inquiries as we considered necessary for the purpose of appropriately informing ourselves:
Responsibilities:
1) We have fulfilled our responsibilities, as set out in the terms of the engagement letter dated December 11, 2020, including for:
a) the preparation and fair presentation of the financial statements and believe that these financial statements have been prepared and present fairly in accordance with the relevant financial reporting framework.
b) providing you with all information of which we are aware that is relevant to the preparation of the financial statements (“relevant information”), such as financial records, documentation and other matters, including:
— the names of all related parties and information regarding all relationships and transactions with related parties;
— the complete minutes of meetings, or summaries of actions of recent meetings for which minutes have not yet been prepared, of shareholders, board of directors and committees of the board of directors that may affect the financial statements. All significant actions are included in such summaries.
c) providing you with unrestricted access to such relevant information.
d) providing you with complete responses to all enquiries made by you during the engagement.
e) providing you with additional information that you may request from us for the purpose of the engagement.

Audit Findings Report P a g e | 17
f) providing you with unrestricted access to persons within the Entity from whom you determined it necessary to obtain audit evidence.
g) such internal control as we determined is necessary to enable the preparation of financial statements that are free from material misstatement, whether due to fraud or error. We also acknowledge and understand that we are responsible for the design, implementation and maintenance of internal control to prevent and detect fraud.
h) ensuring that all transactions have been recorded in the accounting records and are reflected in the financial statements.
i) ensuring that internal auditors providing direct assistance to you, if any, were instructed to follow your instructions and that we, and others within the entity, did not intervene in the work the internal auditors performed for you.
Internal control over financial reporting:
2) We have communicated to you all deficiencies in the design and implementation or maintenance of internal control over financial reporting of which we are aware.
Fraud & non-compliance with laws and regulations:
3) We have disclosed to you:
a) the results of our assessment of the risk that the financial statements may be materially misstated as a result of fraud.
b) all information in relation to fraud or suspected fraud that we are aware of that involves:
— management;
— employees who have significant roles in internal control over financial reporting; or
— others
where such fraud or suspected fraud could have a material effect on the financial statements.
c) all information in relation to allegations of fraud, or suspected fraud, affecting the financial statements, communicated by employees, former employees, analysts, regulators, or others.
d) all known instances of non-compliance or suspected non-compliance with laws and regulations, including all aspects of contractual agreements, whose effects should be considered when preparing financial statements.
e) all known actual or possible litigation and claims whose effects should be considered when preparing the financial statements.
Subsequent events:
4) All events subsequent to the date of the financial statements and for which the relevant financial reporting framework requires adjustment or disclosure in the financial statements have been adjusted or disclosed.
Related parties:
5) We have disclosed to you the identity of the Entity’s related parties.
6) We have disclosed to you all the related party relationships and transactions/balances of which we are aware.

Audit Findings Report P a g e | 18
7) All related party relationships and transactions/balances have been appropriately accounted for and disclosed in accordance with the relevant financial reporting framework.
Estimates:
8) The methods, the data and the significant assumptions used in making accounting estimates, and their related disclosures are appropriate to achieve recognition, measurement or disclosure that is reasonable in the context of the applicable financial reporting framework
Going concern:
9) We have provided you with all information relevant to the use of the going concern assumption in the financial statements.
10) We confirm that we are not aware of material uncertainties related to events or conditions that may cast significant doubt upon the Entity’s ability to continue as a going concern.
Misstatements:
11) We approve the corrected misstatements identified by you during the audit described in Attachment II.
Other information:
12) We confirm that the final version of Annual Report and French Annual Report will be provided to you when available, and prior to issuance by the Entity, to enable you to complete your audit procedures in accordance with professional standards.
Non-SEC registrants or non-reporting issuers:
13) We confirm that the Entity is not a Canadian reporting issuer (as defined under any applicable Canadian securities act) and is not a United States Securities and Exchange Commission (“SEC”) Issuer (as defined by the Sarbanes-Oxley Act of 2002).
14) We also confirm that the financial statements of the Entity will not be included in the group financial statements of a Canadian reporting issuer audited by KPMG or an SEC Issuer audited by any member of the KPMG organization.
Accounting Policies:
15) There have been no changes in, or newly adopted, accounting policies that have not been disclosed to you and appropriately reflected in the financial statements.
Assets & Liabilities – General:
16) There are no formal or informal compensating balance arrangements with any of our cash accounts.
17) The Entity has satisfactory title to all assets.
18) We have no knowledge of arrangements with financial institutions involving restrictions on cash balances and lines of credit or similar arrangements and not disclosed to you.
19) We confirm that during the period we complied with the externally imposed capital requirements.
Comparative Figures/Financial Statements:
20) We have no knowledge of any significant matters that may have arisen that would require a restatement of the comparative financial statements.

Audit Findings Report P a g e | 19
Representations Regarding Management Intent and Plans, and Other Information that is Known Only to Management:
21) We confirm that we have disclosed to you all information in relation to the following matters:
onerous contracts, i.e. those contracts under which the unavoidable costs of meeting the obligation exceed the economic benefits to be received under it, including losses arising from sale and purchase commitments that are onerous contracts under IAS 37 Provisions, Contingent Liabilities and Contingent Assets;
losses from transactions not recognised in the statement of financial position;
assets pledged as collateral;
arrangements with financial institutions involving restrictions on cash balances and lines of credit or similar arrangements;
22) The Entity has complied with all aspects of contractual agreements that could have a material effect on the financial statements in the event of non-compliance, for example debt covenants.
23) We have no plans or intentions that may affect the carrying amount or classification of assets and liabilities.
Representations Regarding Title to Assets, Classification and Carrying Amount of Assets, and Impairment of Assets:
24) The Entity has satisfactory title to all assets.
Financial Assets:
25) We have assessed all financial assets, except those measured at fair value through profit or loss, to determine whether there is any objective evidence of impairment as a result of one or more loss events that occurred subsequent to their initial recognition, and any impairments identified have been recognised in the financial statements, as appropriate. In respect of investments in equity instruments, we have recognised an impairment loss when there has been a significant or prolonged decline in the fair value of the instrument below cost, or other objective evidence of impairment. We have determined whether a decline in fair value below cost is ‘significant’ or ‘prolonged’ in accordance with criteria as represented to you.
Representations regarding the Entity’s appointed actuary:
26) We agree with the findings of the Appointed Actuary as the Entity’s specialist in evaluating the policy liabilities. In connection with the specialist’s valuation, we provided the specialist with all significant and relevant information of which we are aware. We did not give or cause any instructions to be given to the specialist with respect to the values or amounts derived in an attempt to bias their work, and we are not otherwise aware of any matters that have had an impact on the independence or objectivity of the specialists.
Representation Regarding Compliance with Externally Imposed Capital Requirements:
27) The Entity has complied with all externally imposed capital requirements.
Representations Regarding Exposures to Risks Arising from Financial Instruments:
28) We confirm that we have disclosed information relating to the Entity’s exposures to risks arising from financial instruments that is adequate to enable users to evaluate the nature and extent of those risks to which the Entity is exposed at the end of the reporting period, in accordance with IFRS 7, including the exposures to risks and how they arise, our objectives, policies and procedures for managing the risks, the methods used to measure risks, and a summary of quantitative data about our exposure to risks.

Audit Findings Report P a g e | 20
Representations Regarding Fair Values of Financial Assets and Financial Liabilities:
29) We believe the assumptions and techniques used by us are appropriate and that all fair value measurements are determined in accordance with IFRS 13.
30) We have appropriately disclosed fair values of financial assets and financial liabilities in the financial statements in accordance with IFRS 13. We believe the disclosures appropriately categorise those fair value measurements in the fair value hierarchy.
31) We have disclosed the methods and assumptions applied in determining the fair values of each class of financial instrument.
Other:
32) All reinsurance transactions entered into by the Entity are final and there are no side agreements with re-insurers, or other terms in effect, which allow for the modification of terms under existing reinsurance arrangements. Furthermore, the Entity’s reinsurance arrangements meet the risk transfer provisions under IFRS or are accounted for as deposits.
33) We have complied with OSFI guidelines in preparing the P&C Annual Return, specifically those financial statements contained on pages 20.010 to 20.060 of the P&C Annual Return.
34) We have complied with the provisions of the Insurance Companies Act, Canada.
Communications between actuaries involved in the preparation of financial statements and auditors:
35) We acknowledge that, in addition to your report on the financial statements of the Entity, you will also communicate on procedures and findings on data used in making accounting estimates relating to the valuation of actuarial liabilities as a result of the Joint Policy Statement Concerning Communications between Actuaries Involved in the Preparation of Financial Statements and Auditors (the “Joint Policy Statement”), at the request of the Appointed Actuary.
36) We consent to you providing the information resulting from your work as required by the Joint Policy Statement to the Chief Financial Officer and the Appointed Actuary.
37) We confirm that, to the best of our knowledge and belief, having made such inquiries as we considered necessary for the purposes of appropriately informing ourselves and understand that we are responsible for, and have fulfilled such responsibilities that the data used in making accounting estimates relating to the valuation of actuarial liabilities, and their related disclosures is complete and accurate to achieve recognition, measurement or disclosure that is reasonable in the context of the applicable financial reporting framework.
38) We acknowledge that the communication does not constitute an audit or review of data used in making accounting estimates relating to the valuation of actuarial liabilities and their related disclosures and therefore, you are not expressing an opinion on the completeness or accuracy of the data. Rather, the matters addressed in the communication with the Appointed Actuary are a by-product of your audit process in respect of the Entity’s financial statements.
39) We acknowledge that the communication is intended solely for the Chief Financial Officer and the Appointed Actuary and should not be used by, or distributed to, other parties.

Audit Findings Report P a g e | 21
Yours very truly,
______________________________________ Jim Sami, Chief Executive Officer and Attorney in Fact
_______________________________________ Sandra Taylor, Chief Financial Officer I have the recognized authority to take, and assert that I have taken, responsibility for the financial statements
cc: Audit Committee

Audit Findings Report P a g e | 22
Attachment I – Definitions
Materiality
Certain representations in this letter are described as being limited to matters that are material. Misstatements, including omissions, are considered to be material if they, individually or in the aggregate, could reasonably be expected to influence the economic decisions of users taken on the basis of the financial statements. Judgments about materiality are made in light of surrounding circumstances, and are affected by the size or nature of a misstatement, or a combination of both.
Fraud & error
Fraudulent financial reporting involves intentional misstatements including omissions of amounts or disclosures in financial statements to deceive financial statement users.
Misappropriation of assets involves the theft of an entity’s assets. It is often accompanied by false or misleading records or documents in order to conceal the fact that the assets are missing or have been pledged without proper authorization.
An error is an unintentional misstatement in financial statements, including the omission of an amount or a disclosure.
Attachment II – Summary of Audit Misstatements Schedule
Corrected Audit Misstatements
Income effect Financial position
Description F/J/P (Decrease) Increase
Assets (Decrease) Increase
Liabilities (Decrease) Increase
Equity (Decrease) Increase
To record the investment impairment provision on the Bank of Nova Scotia equity holdings with prolonged decline in value.
F ($286,574)
$286,574 $ - $ -
($286,574)
$286,574
Total misstatements $ - $ - $ - $ -

Audit Findings Report P a g e | 23
Appendix 3: Independence Letter
KPMG LLP 115 King Street South 2nd Floor Waterloo ON N2J 5A3 Tel 519-747-8800 Fax 519-747-8830 The Audit Committee of the Board of Directors Ontario School Boards’ Insurance Exchange 91 Westmount Road Guelph, ON N1H 5J2
February 2, 2020
Ladies and Gentlemen:
We have been engaged to express an opinion on the financial statements of Ontario School Boards’ Insurance Exchange (“the Exchange”) as at and for the year ended December 31, 2020.
In determining which relationships to report, we consider relevant rules and related interpretations prescribed by the relevant professional bodies and any applicable legislation or regulation, covering such matters as:
a) provision of services in addition to the audit engagement
b) other relationships such as:
- holding a financial interest, either directly or indirectly, in a client
- holding a position, either directly or indirectly, that gives the right or responsibility to exert significant influence over the financial or accounting policies
of a client
- personal or business relationships of immediate family, close relatives, partners or retired partners, either directly or indirectly, with a client
- economic dependence on a client

Audit Findings Report P a g e | 24
Provision of services
Except for pre-approved audit services, there are no other professional services rendered by us to the Companies from January 1, 2020, up to the date of this letter.
Professional standards require that we communicate the related safeguards that have been applied to eliminate identified threats to independence or to reduce them to an acceptable level. We have not provided any prohibited services. We have applied the following safeguards regarding threats to independence created by the services listed above:
- We instituted policies and procedures to prohibit us from making management decisions or assuming responsibility for such decisions.
- We obtained pre-approval of non-audit services and during this pre-approval process we discussed the nature of the engagement and other
independence issues related to the services.
- We obtained management’s acknowledgement of responsibility for the results of the work performed by us regarding non-audit services and we have
not made any management decisions or assumed responsibility for such decisions.
Other relationships
We are not aware of any other relationships between our firm and the Exchange that, in our professional judgement, may reasonably be thought to bear on our independence.
Confirmation of independence
We confirm that, as of the date of this letter, we are independent of the Exchange in accordance with the ethical requirements that are relevant to our audit of the financial statements in Canada.
Other matters
This letter is confidential and intended solely for use by those charged with governance in carrying out and discharging their responsibilities and should not be used for any other purposes.
KPMG shall have no responsibility for loss or damages or claims, if any, to or by any third party as this letter has not been prepared for, and is not intended for, and should not be used by, any third party or for any other purpose.
Yours very truly,
Licensed Public Accountants
Audit Findings Report P a g e | 25
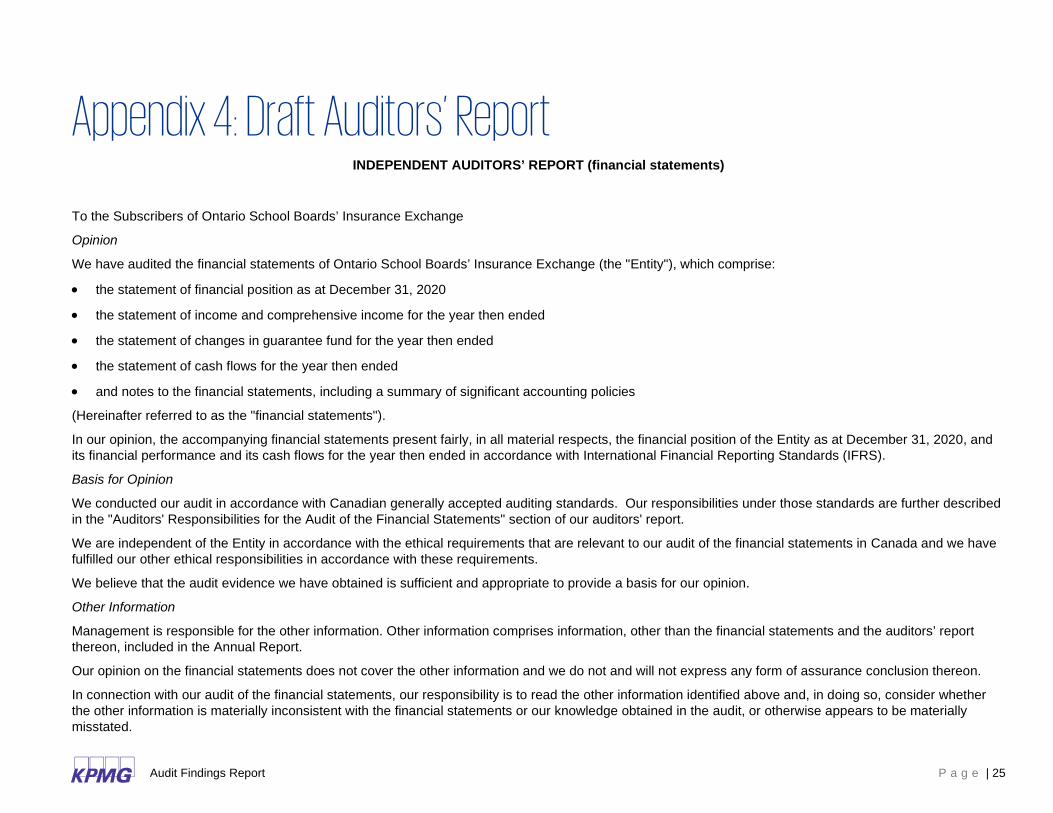
Appendix 4: Draft Auditors’ Report INDEPENDENT AUDITORS’ REPORT (financial statements)
To the Subscribers of Ontario School Boards’ Insurance Exchange
Opinion
We have audited the financial statements of Ontario School Boards’ Insurance Exchange (the "Entity"), which comprise:
• the statement of financial position as at December 31, 2020
• the statement of income and comprehensive income for the year then ended
• the statement of changes in guarantee fund for the year then ended
• the statement of cash flows for the year then ended
• and notes to the financial statements, including a summary of significant accounting policies
(Hereinafter referred to as the "financial statements").
In our opinion, the accompanying financial statements present fairly, in all material respects, the financial position of the Entity as at December 31, 2020, and
its financial performance and its cash flows for the year then ended in accordance with International Financial Reporting Standards (IFRS).
Basis for Opinion
We conducted our audit in accordance with Canadian generally accepted auditing standards. Our responsibilities under those standards are further described
in the "Auditors' Responsibilities for the Audit of the Financial Statements" section of our auditors' report.
We are independent of the Entity in accordance with the ethical requirements that are relevant to our audit of the financial statements in Canada and we have
fulfilled our other ethical responsibilities in accordance with these requirements.
We believe that the audit evidence we have obtained is sufficient and appropriate to provide a basis for our opinion.
Other Information
Management is responsible for the other information. Other information comprises information, other than the financial statements and the auditors’ report
thereon, included in the Annual Report.
Our opinion on the financial statements does not cover the other information and we do not and will not express any form of assurance conclusion thereon.
In connection with our audit of the financial statements, our responsibility is to read the other information identified above and, in doing so, consider whether
the other information is materially inconsistent with the financial statements or our knowledge obtained in the audit, or otherwise appears to be materially
misstated.
Audit Findings Report P a g e | 26
We obtained the Information, other than the financial statements and the auditors’ report thereon, included in Annual Report at the date of this auditors’ report.
If, based on the work we have performed on this other information, we conclude that there is a material misstatement of this other information, we are required
to report that fact in the auditors’ report. We have nothing to report in this regard.
Responsibilities of Management and Those Charged with Governance for the Financial Statements
Management is responsible for the preparation and fair presentation of the financial statements in accordance with IFRS, and for such internal control as
management determines is necessary to enable the preparation of financial statements that are free from material misstatement, whether due to fraud or error.
In preparing the financial statements, management is responsible for assessing the Entity's ability to continue as a going concern, disclosing as applicable,
matters related to going concern and using the going concern basis of accounting unless management either intends to liquidate the Entity or to cease
operations, or has no realistic alternative but to do so.
Those charged with governance are responsible for overseeing the Entity's financial reporting process.
Auditors' Responsibilities for the Audit of the Financial Statements
Our objectives are to obtain reasonable assurance about whether the financial statements as a whole are free from material misstatement, whether due to
fraud or error, and to issue an auditors' report that includes our opinion.
Reasonable assurance is a high level of assurance, but is not a guarantee that an audit conducted in accordance with Canadian generally accepted auditing
standards will always detect a material misstatement when it exists.
Misstatements can arise from fraud or error and are considered material if, individually or in the aggregate, they could reasonably be expected to influence the
economic decisions of users taken on the basis of the financial statements.
As part of an audit in accordance with Canadian generally accepted auditing standards, we exercise professional judgment and maintain professional
skepticism throughout the audit.
We also:
• Identify and assess the risks of material misstatement of the financial statements, whether due to fraud or error, design and perform audit procedures
responsive to those risks, and obtain audit evidence that is sufficient and appropriate to provide a basis for our opinion.
The risk of not detecting a material misstatement resulting from fraud is higher than for one resulting from error, as fraud may involve collusion, forgery,
intentional omissions, misrepresentations, or the override of internal control.
• Obtain an understanding of internal control relevant to the audit in order to design audit procedures that are appropriate in the circumstances, but not for the
purpose of expressing an opinion on the effectiveness of the Entity's internal control.
• Evaluate the appropriateness of accounting policies used and the reasonableness of accounting estimates and related disclosures made by management.
• Conclude on the appropriateness of management's use of the going concern basis of accounting and, based on the audit evidence obtained, whether a
material uncertainty exists related to events or conditions that may cast significant doubt on the Entity's ability to continue as a going concern. If we conclude
that a material uncertainty exists, we are required to draw attention in our auditors' report to the related disclosures in the financial statements or, if such
disclosures are inadequate, to modify our opinion. Our conclusions are based on the audit evidence obtained up to the date of our auditors' report. However,
future events or conditions may cause the Entity to cease to continue as a going concern.

Audit Findings Report P a g e | 27
• Evaluate the overall presentation, structure and content of the financial statements, including the disclosures, and whether the financial statements represent
the underlying transactions and events in a manner that achieves fair presentation.
• Communicate with those charged with governance regarding, among other matters, the planned scope and timing of the audit and significant audit findings,
including any significant deficiencies in internal control that we identify during our audit.

Audit Findings Report P a g e | 28
INDEPENDENT AUDITORS’ REPORT (OSFI regulatory format financial statements)
To the Provincial Superintendents of Financial Institutions/Insurance
Opinion
We have audited the financial statements of Ontario School Boards’ Insurance Exchange (the "Entity"), which comprise:
• the statement of assets as at December 31, 2020
• the statement of liabilities, equity, head office account, reserves and AOCI as at December 31, 2020
• the statement of income for the year then ended
• the statement of comprehensive income (loss) and accumulated other comprehensive income (loss) for the year then ended
• the statement of reserves for the year then ended
• the statement of cash flows for the year then ended
• the statement of changes in equity for the year then ended
on pages 20.10 through 20.54 of the Entity’s P&C Quarterly Return and pages 20.52 and 20.60 of the Entity’s P&C Annual Supplement which includes the notes
to the financial statements, including a summary of significant accounting policies (collectively referred to as the "financial statements").
In our opinion, the accompanying financial statements present fairly, in all material respects, the financial position of the Entity as at December 31, 2020, and
its financial performance and its cash flows for the year then ended in accordance with International Financial Reporting Standards (IFRS).
Basis for Opinion
We conducted our audit in accordance with Canadian generally accepted auditing standards. Our responsibilities under those standards are further described
in the "Auditors' Responsibilities for the Audit of the Financial Statements" section of our auditors' report.
We are independent of the Entity in accordance with the ethical requirements that are relevant to our audit of the financial statements in Canada and we have
fulfilled our other ethical responsibilities in accordance with these requirements.
We believe that the audit evidence we have obtained is sufficient and appropriate to provide a basis for our opinion.
Other Matter – Unaudited Information
We have not audited or reviewed the schedules and exhibits except for those on pages 20.10 through 20.54 of the Entity’s P&C Quarterly Return and those on
pages 20.52 and 20.60 of the Entity’s P&C Annual Supplement. Accordingly, this auditors’ report and our opinion do not cover the schedules and exhibits on
other pages of the Entity’s P&C Quarterly Return and P&C Annual Supplement.

Audit Findings Report P a g e | 29
Responsibilities of Management and Those Charged with Governance for the Financial Statements
Management is responsible for the preparation and fair presentation of the financial statements in accordance with IFRS, and for such internal control as
management determines is necessary to enable the preparation of financial statements that are free from material misstatement, whether due to fraud or error.
In preparing the financial statements, management is responsible for assessing the Entity's ability to continue as a going concern, disclosing as applicable,
matters related to going concern and using the going concern basis of accounting unless management either intends to liquidate the Entity or to cease
operations, or has no realistic alternative but to do so.
Those charged with governance are responsible for overseeing the Entity's financial reporting process.
Auditors' Responsibilities for the Audit of the Financial Statements
Our objectives are to obtain reasonable assurance about whether the financial statements as a whole are free from material misstatement, whether due to
fraud or error, and to issue an auditors' report that includes our opinion.
Reasonable assurance is a high level of assurance, but is not a guarantee that an audit conducted in accordance with Canadian generally accepted auditing
standards will always detect a material misstatement when it exists.
Misstatements can arise from fraud or error and are considered material if, individually or in the aggregate, they could reasonably be expected to influence the
economic decisions of users taken on the basis of the financial statements.
As part of an audit in accordance with Canadian generally accepted auditing standards, we exercise professional judgment and maintain professional
skepticism throughout the audit.
We also:
• Identify and assess the risks of material misstatement of the financial statements, whether due to fraud or error, design and perform audit procedures
responsive to those risks, and obtain audit evidence that is sufficient and appropriate to provide a basis for our opinion.
The risk of not detecting a material misstatement resulting from fraud is higher than for one resulting from error, as fraud may involve collusion, forgery,
intentional omissions, misrepresentations, or the override of internal control.
• Obtain an understanding of internal control relevant to the audit in order to design audit procedures that are appropriate in the circumstances, but not for the
purpose of expressing an opinion on the effectiveness of the Entity's internal control.
• Evaluate the appropriateness of accounting policies used and the reasonableness of accounting estimates and related disclosures made by management.
• Conclude on the appropriateness of management's use of the going concern basis of accounting and, based on the audit evidence obtained, whether a
material uncertainty exists related to events or conditions that may cast significant doubt on the Entity's ability to continue as a going concern. If we conclude
that a material uncertainty exists, we are required to draw attention in our auditors' report to the related disclosures in the financial statements or, if such
disclosures are inadequate, to modify our opinion. Our conclusions are based on the audit evidence obtained up to the date of our auditors' report. However,
future events or conditions may cause the Entity to cease to continue as a going concern.
• Evaluate the overall presentation, structure and content of the financial statements, including the disclosures, and whether the financial statements represent
the underlying transactions and events in a manner that achieves fair presentation.
Communicate with those charged with governance regarding, among other matters, the planned scope and timing of the audit and significant audit findings,
including any significant deficiencies in internal control that we identify during our audit.

Audit Findings Report P a g e | 30
Appendix 5: KPMG’s System of Quality Control Quality control is fundamental to our business and is the responsibility of every partner and employee. To help all audit professionals concentrate on the
fundamental skills and behaviors required to deliver a quality audit, KPMG has developed the Audit Quality Framework shown below. These are the
cornerstones of how we execute our responsibilities
What do we mean by audit quality?
Audit Quality (AQ) is at the core of everything we do at KPMG.
We believe that it is not just about reaching the right opinion,
but how we reach that opinion.
We define ‘audit quality’ as being the outcome when audits are
executed consistently, in line with the requirements and intent
of applicable professional standards within a strong system of
quality controls.
All of our related activities are undertaken in an environment of
the utmost level of objectivity, independence, ethics, and
integrity.
Visit our Audit Quality Resources page for more information
including access to our Transparency report.

Audit Findings Report P a g e | 31
Appendix 6: Technology in the audit As previously communicated in our Audit Planning Report, we have utilized technology to enhance the quality and effectiveness of the audit.
Technology Our results and insights
KPMG iRADAR Our derivatives and securities valuation tool brings advanced valuation capability to independently re-price 100% of
your level 1, 2 investment securities and derivative instruments. Our detailed reporting provides you greater insight,
revealing instances where your pricing vendors may value sub-asset classes more conservatively or aggressively
than others.
Journal Entry Analysis Our journal entry tool assists in the performance of detailed journal entry testing based on engagement-specific risk
identification and circumstances. Our tool provides auto-generated journal entry population statistics and focusses
our audit effort on journal entries that are riskier in nature.
We use KPMG’s application software (IDEA) to evaluate the completeness of the journal entry population through a
roll-forward of all accounts.
We use computer-assisted audit techniques (CAATs) to assess journal entries and apply certain criteria to identify
potential high-risk journal entries for further testing.

Audit Findings Report P a g e | 32
Appendix 7: Audit and Assurance Insights Our latest thinking on the issues that matter most to audit committees, Boards and Management.
Featured insight Summary Reference
Audit & Assurance Insights Curated thought leadership, research and insights from subject matter experts across KPMG in Canada Learn more
The business implications of
coronavirus (COVID 19)
Resources to help you understand your exposure to COVID-19, and more importantly, position your
business to be resilient in the face of this and the next global threat. Learn more
Financial reporting and audit considerations: The impact of COVID-19 on financial reporting and audit
processes. Learn more
KPMG Global IFRS Institute - COVID-19 financial reporting resource center Learn more
Accelerate 2020 Perspective on the key issues driving the audit committee agenda Learn more
IFRS Breaking News A monthly Canadian newsletter that provides the latest insights on international financial reporting standards and IASB activities.
Learn more
Momentum
A quarterly Canadian newsletter which provides a snapshot of KPMG's latest thought leadership, audit
and assurance insights and information on upcoming and past audit events – keeping management and
board members abreast on current issues and emerging challenges within audit. Sign-up now
Current Developments Series of quarterly publications for Canadian businesses including Spotlight on IFRS, Canadian
Securities & Auditing Matters and US Learn more
Board Leadership Centre Leading insights to help board members maximize boardroom opportunities. Learn more

kpmg.ca/audit
© 2021 KPMG LLP, an Ontario limited liability partnership and a member firm of the KPMG global organization of independent member firms affiliated with KPMG International Limited, a private English company limited by guarantee. All rights reserved. The KPMG name and logo are trademarks used under license by the independent member firms of the KPMG global organization.
KPMG member firms around the world have 227,000 professionals, in 146 countries.

Financial Statements of
ONTARIO SCHOOL BOARDS' INSURANCE EXCHANGE
And Independent Auditors’ Report thereon
Year ended December 31, 2020

INDEPENDENT AUDITORS' REPORT
To the Subscribers of Ontario School Boards' Insurance Exchange
Opinion
We have audited the financial statements of Ontario School Boards’ Insurance
Exchange (the “Entity”), which comprise:
• the statement of financial position as at December 31, 2020
• the statement of comprehensive income for the year then ended
• the statement of changes in guarantee fund for the year then ended
• the statement of cash flows for the year then ended
• and notes to the financial statements, including a summary of significant
accounting policies
(Hereinafter referred to as the “financial statements”).
In our opinion, the accompanying financial statements present fairly, in all material
respects, the financial position of Ontario School Boards’ Insurance Exchange as at
December 31, 2020, and its financial performance, and its cash flows for the year then
ended in accordance with International Financial Reporting Standards.
Basis for Opinion
We conducted our audit in accordance with Canadian generally accepted auditing
standards. Our responsibilities under those standards are further described in the
“Auditors’ Responsibilities for the Audit of the Financial Statements” section of our
auditors’ report.
We are independent of the Entity in accordance with the ethical requirements that are
relevant to our audit of the financial statements in Canada and we have fulfilled our
other ethical responsibilities in accordance with these requirements.
We believe that the audit evidence we have obtained is sufficient and appropriate to
provide a basis for our opinion.

Page 2
Other Information
Management is responsible for the other information. Other information comprises
information, other than the financial statements and the auditors’ report thereon, included in
the Annual Report.
Our opinion on the financial statements does not cover the other information and we do not
and will not express any form of assurance conclusion thereon.
In connection with our audit of the financial statements, our responsibility is to read the other
information identified above and, in doing so, consider whether the other information is
materially inconsistent with the financial statements or our knowledge obtained in the audit,
or otherwise appears to be materially misstated.
We obtained the Information, other than the financial statements and the auditors’ report
thereon, included in Annual Report at the date of this auditors’ report. If, based on the work
we have performed on this other information, we conclude that there is a material
misstatement of this other information, we are required to report that fact in the auditors’
report. We have nothing to report in this regard.
Responsibilities of Management and Those Charged with Governance for the
Financial Statements
Management is responsible for the preparation and fair presentation of the financial
statements in accordance with International Financial Reporting Standards, and for such
internal control as management determines is necessary to enable the preparation of
financial statements that are free from material misstatement, whether due to fraud or error.
In preparing the financial statements, management is responsible for assessing the Entity’s
ability to continue as a going concern, disclosing as applicable, matters related to going
concern and using the going concern basis of accounting unless management either intends
to liquidate the Entity or to cease operations, or has no realistic alternative but to do so.
Those charged with governance are responsible for overseeing the Entity‘s financial
reporting process.
Auditors’ Responsibilities for the Audit of the Financial Statements
Our objectives are to obtain reasonable assurance about whether the financial statements
as a whole are free from material misstatement, whether due to fraud or error, and to issue
an auditors’ report that includes our opinion.
Reasonable assurance is a high level of assurance, but is not a guarantee that an audit
conducted in accordance with Canadian generally accepted auditing standards will always
detect a material misstatement when it exists.
Misstatements can arise from fraud or error and are considered material if, individually or in
the aggregate, they could reasonably be expected to influence the economic decisions of
users taken on the basis of the financial statements.
As part of an audit in accordance with Canadian generally accepted auditing standards, we
exercise professional judgment and maintain professional skepticism throughout the audit.

Page 3
We also:
• Identify and assess the risks of material misstatement of the financial statements,
whether due to fraud or error, design and perform audit procedures responsive to those
risks, and obtain audit evidence that is sufficient and appropriate to provide a basis for
our opinion.
The risk of not detecting a material misstatement resulting from fraud is higher than for
one resulting from error, as fraud may involve collusion, forgery, intentional omissions,
misrepresentations, or the override of internal control.
• Obtain an understanding of internal control relevant to the audit in order to design audit
procedures that are appropriate in the circumstances, but not for the purpose of
expressing an opinion on the effectiveness of the Entity's internal control.
• Evaluate the appropriateness of accounting policies used and the reasonableness of
accounting estimates and related disclosures made by management.
• Conclude on the appropriateness of management's use of the going concern basis of
accounting and, based on the audit evidence obtained, whether a material uncertainty
exists related to events or conditions that may cast significant doubt on the Entity's
ability to continue as a going concern. If we conclude that a material uncertainty exists,
we are required to draw attention in our auditors’ report to the related disclosures in the
financial statements or, if such disclosures are inadequate, to modify our opinion. Our
conclusions are based on the audit evidence obtained up to the date of our auditors’
report. However, future events or conditions may cause the Entity to cease to continue
as a going concern.
• Evaluate the overall presentation, structure and content of the financial statements,
including the disclosures, and whether the financial statements represent the underlying
transactions and events in a manner that achieves fair presentation.
• Communicate with those charged with governance regarding, among other matters, the
planned scope and timing of the audit and significant audit findings, including any
significant deficiencies in internal control that we identify during our audit.
Chartered Professional Accountants, Licensed Public Accountants
Waterloo, Canada February 11, 2021

1
ONTARIO SCHOOL BOARDS' INSURANCE EXCHANGE Statement of Financial Position December 31, 2020, with comparative information for 2019
2020 2019
Assets Cash and cash equivalents $ 41,635,446 $ 38,135,098 Investments (note 4) 212,984,881 200,215,323 Accrued investment income 1,052,975 1,242,250 Premiums and accounts receivable 50,452 624,662 Due from reinsurers 138,471 230,839 Prepaid reinsurance ceded – 504,943 Prepaid expenses 129,234 131,936 Reinsurance recoverable (note 7) 2,943,482 153,500 Salvage and subrogation recoverable 5,863,125 2,525,687 Loan receivable 469,119 481,664 Property and equipment (note 5) 847,811 855,671
$ 266,114,996 $ 245,101,573
Liabilities and Guarantee Fund Liabilities:
Accounts payable and accrued liabilities $ 2,385,682 $ 4,562,174 Premiums received in advance 25,221,207 18,783,109 Sales tax payable 1,300,032 765,648 Claims liabilities (note 7) 108,857,206 93,991,941 Premiums in trust 3,414 1,647
137,767,541 118,104,519 Guarantee Fund: (note 11)
Reserves required by the Financial Services Regulatory Authority of Ontario 50,000 50,000
Additional guarantee funds 117,955,127 121,749,756 Accumulated other comprehensive income 10,342,328 5,197,298
128,347,455 126,997,054
$ 266,114,996 $ 245,101,573
See accompanying notes to financial statements.
On behalf of the Board of Directors:
Chair
Vice-Chair
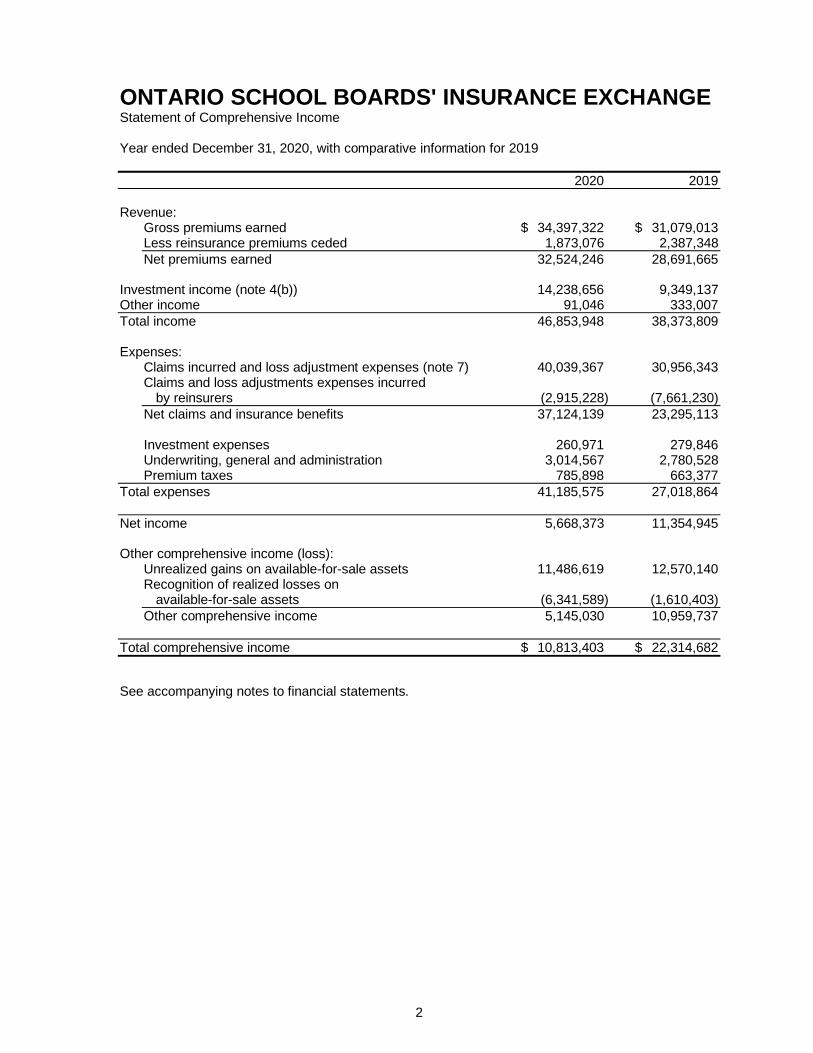
2
ONTARIO SCHOOL BOARDS' INSURANCE EXCHANGE Statement of Comprehensive Income Year ended December 31, 2020, with comparative information for 2019
2020 2019
Revenue:
Gross premiums earned $ 34,397,322 $ 31,079,013 Less reinsurance premiums ceded 1,873,076 2,387,348
Net premiums earned 32,524,246 28,691,665 Investment income (note 4(b)) 14,238,656 9,349,137 Other income 91,046 333,007
Total income 46,853,948 38,373,809 Expenses:
Claims incurred and loss adjustment expenses (note 7) 40,039,367 30,956,343 Claims and loss adjustments expenses incurred by reinsurers (2,915,228) (7,661,230)
Net claims and insurance benefits 37,124,139 23,295,113
Investment expenses 260,971 279,846 Underwriting, general and administration 3,014,567 2,780,528 Premium taxes 785,898 663,377
Total expenses 41,185,575 27,018,864
Net income 5,668,373 11,354,945 Other comprehensive income (loss):
Unrealized gains on available-for-sale assets 11,486,619 12,570,140 Recognition of realized losses on
available-for-sale assets (6,341,589) (1,610,403)
Other comprehensive income 5,145,030 10,959,737
Total comprehensive income $ 10,813,403 $ 22,314,682
See accompanying notes to financial statements.
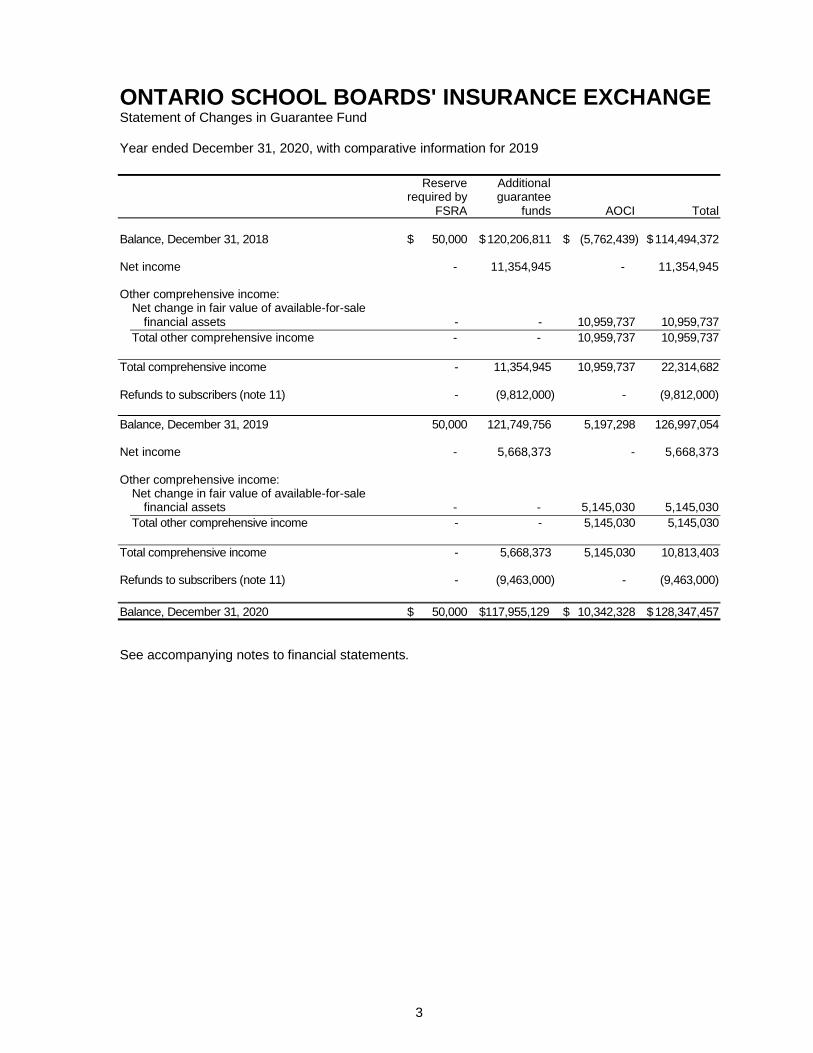
3
ONTARIO SCHOOL BOARDS' INSURANCE EXCHANGE Statement of Changes in Guarantee Fund Year ended December 31, 2020, with comparative information for 2019
Reserve Additional required by guarantee FSRA funds AOCI Total
Balance, December 31, 2018 $ 50,000 $ 120,206,811 $ (5,762,439) $ 114,494,372 Net income - 11,354,945 - 11,354,945 Other comprehensive income:
Net change in fair value of available-for-sale financial assets - - 10,959,737 10,959,737
Total other comprehensive income - - 10,959,737 10,959,737
Total comprehensive income - 11,354,945 10,959,737 22,314,682 Refunds to subscribers (note 11) - (9,812,000) - (9,812,000)
Balance, December 31, 2019 50,000 121,749,756 5,197,298 126,997,054 Net income - 5,668,373 - 5,668,373 Other comprehensive income:
Net change in fair value of available-for-sale financial assets - - 5,145,030 5,145,030
Total other comprehensive income - - 5,145,030 5,145,030
Total comprehensive income - 5,668,373 5,145,030 10,813,403 Refunds to subscribers (note 11) - (9,463,000) - (9,463,000)
Balance, December 31, 2020 $ 50,000 $117,955,129 $ 10,342,328 $ 128,347,457
See accompanying notes to financial statements.

4
ONTARIO SCHOOL BOARDS' INSURANCE EXCHANGE Statement of Cash Flows Year ended December 31, 2020, with comparative information for 2019
2020 2019
Cash provided by (used in): Operations:
Net income $ 5,668,373 $ 11,354,945 Items not involving cash:
Accrued investment income 189,275 (183,124) Gain on sale of investments (5,041,948) (669,946) Loss on disposal of property and equipment – – Unrealized foreign exchange (gain) loss (6,672) 40,900 Amortization of property and equipment 138,740 136,676 Bond amortization 155,347 21
Change in non-cash operating items (453,573) 1,615,881 Claims liabilities, net 8,737,845 1,466,518 Premiums received in advance 6,438,098 (3,067,444)
15,825,485 10,694,427 Financing:
Refund to subscribers (9,463,000) (9,812,000) Investments:
Bonds purchased (46,275,991) (101,198,772) Equities purchased (7,877,818) (11,000,000) Money market purchased (23,167,790) (6,000,000) Proceeds from investment disposals:
Bonds 49,078,920 112,290,179 Equities 4,511,422 7,321,044 Money market 21,000,000 13,828,000
Additions to property and equipment (130,880) (201,130)
(2,862,137) 15,039,321
Increase in cash and cash equivalents 3,500,348 15,921,748 Cash and cash equivalents, beginning of year 38,135,098 22,213,350
Cash and cash equivalents, end of year $ 41,635,446 $ 38,135,098
See accompanying notes to financial statements.

ONTARIO SCHOOL BOARDS' INSURANCE EXCHANGE Notes to Financial Statements (continued) Year ended December 31, 2020
5
Ontario School Boards' Insurance Exchange (the "Exchange") was formed under the Reciprocal
Insurance Exchange Agreement for School Boards in the Province of Ontario (the "Agreement") dated
August 15, 1986 and amended on January 1, 2002, and January 1, 2017 among various school boards
subscribing to the Agreement. The Exchange is licensed by the Financial Services Regulatory Authority
of Ontario (“FSRA”), formerly the Financial Services Commission of Ontario (“FSCO”), to provide aircraft,
non-owned automobile, owned automobile, fidelity, legal expense, liability, marine, property and boiler
and machinery insurance to its subscribers in accordance with Part XIII of the Insurance Act, Ontario,
R.S.O. 1990. The Exchange’s registered office is located at 91 Westmount Road, Guelph, Ontario,
Canada. The Exchange commenced operations on January 1, 1987 and has 79 (2019 - 78) subscribers.
Subscriptions to the Exchange come up for renewal at the end of a five-year subscription period. The
next date for the renewal of policies is January 1, 2022.
1. Basis of presentation:
(a) Statement of compliance:
The financial statements have been prepared in accordance with International Financial
Reporting Standards (“IFRS”) and its interpretations adopted by the International Accounting
Standards Board (“IASB”).
The financial statements were authorized for issue by the Board of Directors on February 11,
2021.
(b) Basis of measurement:
The financial statements have been prepared on a historical cost basis, except for available-
for-sale financial assets which are measured at fair value and insurance contract assets and
liabilities which are measured using acceptable actuarial practices.
(c) Functional and presentation currency:
These financial statements are presented in Canadian dollars, which is the Exchange’s
functional currency. All financial information presented in Canadian dollars.
(d) Use of estimates and judgments:
The preparation of the financial statements in conformity with IFRS requires management to
make judgments, estimates and assumptions that affect the application of accounting policies
and the reported amounts of assets, liabilities, income and expenses. Actual results may differ
from these estimates.
Estimates and underlying assumptions are reviewed on an ongoing basis. Revisions to
accounting estimates are recognized in the period in which the estimates are revised and in
any future periods affected. Information about critical judgments in applying accounting
policies that have the most significant effect on the amounts recognized in the financial
statements is discussed in note 3.

ONTARIO SCHOOL BOARDS' INSURANCE EXCHANGE Notes to Financial Statements (continued) Year ended December 31, 2020
6
1. Basis of presentation (continued):
(e) Statement of financial position:
The Exchange presents its statement of financial position in order of liquidity. Assets and
liabilities that are expected to be recovered or settled in more than 12 months after the
reporting date are summarized in note 14.
2. Significant accounting policies:
(a) Premiums:
Premiums are earned over the term of the related policy period. As the Exchange's policy
year ends December 31, there are no unearned premiums at December 31. Premiums
received in advance relate to premiums received in the current year for the policy period
commencing January 1 of the following year.
Premiums on reinsurance assumed are included in gross written premiums and accounted for
as if the reinsurance was considered direct business, taking into account the product
classification of the reinsured business. Outward reinsurance premiums are accounted for in
the same accounting period as the premiums for the related direct insurance or reinsurance
business assumed.
(b) Financial instruments:
Financial assets are classified as fair value through profit or loss (“FVTPL”), available for sale
(“AFS”), held to maturity (“HTM”), or loans and receivables based on their characteristics and
purpose of their acquisition. Financial liabilities are required to be classified as FVTPL or other
liabilities.
(i) Financial assets:
Financial assets at fair value through profit or loss:
A financial asset is classified at fair value through profit or loss (“FVTPL”) if it was classified
as held-for-trading or is designated as such upon initial recognition. Upon initial
recognition, attributable transactions costs are recognized in profit or loss when incurred.
Financial assets at FVTPL are measured at fair value, and changes therein are
recognized in profit or loss.

ONTARIO SCHOOL BOARDS' INSURANCE EXCHANGE Notes to Financial Statements (continued) Year ended December 31, 2020
7
2. Significant accounting policies (continued):
(b) Financial instruments (continued):
(i) Financial assets (continued):
Available-for-sale financial assets:
Financial assets classified as available-for-sale (“AFS”) are carried at fair value whereby
the unrealized gains and losses are included in accumulated other comprehensive income
("AOCI") until sale or an impairment loss is recognized, at which point cumulative
unrealized gains or losses are included in investment income. When an investment is
derecognized, the cumulative gain or loss in other comprehensive income is transferred
to profit or loss.
The Exchange accounts for all financial instruments using trade date accounting.
Transaction costs related to the purchase of financial instruments are recorded as part of
the carrying value.
Cash and cash equivalents include cash on account and investments in money market
instruments.
Loans and receivables, and other financial liabilities (liabilities other than insurance policy
liabilities) are accounted for at amortized cost.
(ii) Financial liabilities:
Financial liabilities are recognized initially on the trade date at which the Exchange
becomes a party to the contractual provisions of the instrument. The Exchange
derecognizes a financial liability when its contractual obligations are discharged or
cancelled or expire. The Exchange has the following non-derivative financial liabilities:
accounts payable and accrued liabilities and sales tax payable.
(iii) Investment income:
Dividends and interest income from these securities are included in investment income
and are recorded as they accrue. Income distributions from Canadian income trusts are
recorded as income when received. Dividend income on equity investments is recorded
on the ex-dividend date.
(iv) General investment expenses:
General investment expenses are recognized as incurred.

ONTARIO SCHOOL BOARDS' INSURANCE EXCHANGE Notes to Financial Statements (continued) Year ended December 31, 2020
8
2. Significant accounting policies (continued):
(c) Property and equipment:
Items of property and equipment are measured at cost less accumulated depreciation and
accumulated impairment losses.
Cost includes expenditure that is directly attributable to the acquisition of the asset.
Gains and losses on disposal of an item of property and equipment are determined by
comparing the proceeds from disposal with the carrying amount of property and equipment,
and are recognized net within other income in profit or loss.
Amortization is provided using the straight-line basis at the following annual rates:
Building 3.33% Equipment and furnishings 20% Computer equipment 33% Building improvements 20% Automobile 25%
(d) Claims liabilities:
Provision has been made for the estimated liability for all reported and outstanding claims
using a case-basis evaluation plus an amount for adverse development and for claims
incurred to December 31, which have not yet been reported to the Exchange. Expected
reinsurance recoveries on claims liabilities are recognized as assets on the same basis. The
computation of these provisions takes into account the time value of money using discount
rates based on projected investment income from the assets supporting these provisions.
Since the amounts are necessarily based on estimates of future trends in claim severity and
other factors which could vary as the claims are settled, the ultimate liability may be more or
less than the estimated amounts. Although it is not possible to measure the degree of
variability inherent in such estimates, management believes that the unpaid claims amounts
and related adjustment expenses are adequate. The estimates are periodically reviewed by
an actuary and, as adjustments to these liabilities become necessary, they are reflected in
current operations.
(e) Reinsurance:
The Exchange records reinsurance balances on the statement of financial position on a gross
basis to indicate the extent of credit related to reinsurance, and records its obligations to
subscribers on a net basis in the statement of comprehensive income to indicate the results
of its retention of premiums written. Amounts recoverable from reinsurers are estimated in a
manner consistent with the related claims liabilities.

ONTARIO SCHOOL BOARDS' INSURANCE EXCHANGE Notes to Financial Statements (continued) Year ended December 31, 2020
9
2. Significant accounting policies (continued):
(f) Salvage and subrogation recoverable:
In certain circumstances, the Exchange acquires the right to pursue third parties for losses
paid to policyholders under insurance contracts or to dispose of the damaged goods. The
Exchange has recognized and disclosed all identifiable and measurable amounts it expects
to recover in the future, from past loss events, as a separate asset on the statement of financial
position.
(g) Insurance contracts:
Insurance contracts are those contracts that have significant insurance risk at the inception of
the contract. Insurance risk arises when the Exchange agrees to compensate a policyholder
if a specified uncertain future event adversely affects the policyholder. It is defined as the
possibility of paying significantly more in a scenario where the insured event occurs than when
it does not occur.
(h) Leases:
At inception of a contract, the Exchange assesses whether a contract is, or contains, a lease.
A contract is, or contains, a lease if the contract conveys the right to control the use of an
identified asset for a period of time in exchange for consideration. To assess whether a
contract conveys the right to control the use of an identified asset, the Exchange assesses
whether:
i. The contract involves the use of an identified asset;
ii. The Exchange has the right to obtain substantially all of the economic benefits from use
of the asset throughout the period of use; and
iii. The Exchange has the right to direct the use of the asset. The Exchange has this right
when it has the decision-making rights that are most relevant to changing how and for
what purpose the asset is used is predetermined, the Exchange has the right to direct the
use of the asset if either:
a) The Exchange has the right to operate the asset; or
b) The Exchange designed the asset in a way that predetermines how and for what
purposes it will be used.

ONTARIO SCHOOL BOARDS' INSURANCE EXCHANGE Notes to Financial Statements (continued) Year ended December 31, 2020
10
2. Significant accounting policies (continued):
(h) Leases (continued):
This policy is applied to contracts entered into, or changed, on or after January 1, 2019.
Short-term leases and low value assets
The Exchange has elected not to recognize right-of-use assets and lease liabilities for short-
term leases that have a lease term of 12 months or less and leases of low-value assets. The
Exchange recognizes the lease payments associated with these leases as an expense on a
straight-line basis over the lease term.
(i) Income taxes:
As an exchange under the Insurance Act of Ontario, the Exchange is not subject to income
taxes and, accordingly, no provision for income taxes has been made in these financial
statements.
(j) Impairment:
(i) Financial assets:
A financial asset not carried at fair value through profit or loss is assessed at each
reporting date to determine whether there is objective evidence that it is impaired. A
financial asset is impaired if objective evidence indicates that a loss event has occurred
after the initial recognition of the asset, and that the loss event had a negative effect on
the estimated future cash flows of that asset that can be estimated reliably.
Objective evidence that financial assets are impaired can include default or delinquency
by a debtor, restructuring of an amount due to the Exchange on terms that the Exchange
would not consider otherwise, indications that a debtor or issuer will enter bankruptcy, or
the disappearance of an active market for a security. In addition, for an investment in an
equity security, a significant or prolonged decline in its fair value below its cost is objective
evidence of impairment.

ONTARIO SCHOOL BOARDS' INSURANCE EXCHANGE Notes to Financial Statements (continued) Year ended December 31, 2020
11
2. Significant accounting policies (continued):
(i) Impairment (continued):
(i) Financial assets (continued):
Impairment losses on AFS investment securities are recognized by transferring the
cumulative loss that has been recognized in other comprehensive income, and presented
in unrealized gains/losses on AFS financial assets in the guarantee fund, to profit or loss.
The cumulative loss that is removed from other comprehensive income and recognized in
profit or loss is the difference between the acquisition cost, net of any principal repayment
and amortization, and the current fair value, less any impairment loss previously
recognized in profit or loss. Changes in impairment provisions attributable to time value
are reflected as a component of interest income.
If, in a subsequent period, the fair value of an impaired AFS debt security increases and
the increase can be related objectively to an event occurring after the impairment loss
was recognized in profit or loss, then the impairment loss is reversed, with the amount of
the reversal recognized in profit or loss. However, any subsequent recovery in the fair
value of an impaired AFS equity security is recognized in other comprehensive income.
(ii) Non-financial assets:
The carrying amounts of the Exchange’s non-financial assets are reviewed at each
reporting date to determine whether there is any indication of impairment. If any such
indication exists, then the asset’s recoverable amount is estimated. An impairment loss is
recognized if the carrying amount of an asset exceeds its estimated recoverable amount.
The recoverable amount of an asset is the greater of its value in use and its fair value less
expected selling costs. In assessing value in use, the estimated future cash flows are
discounted to their present value using a discount rate that reflects current market
assessments of the time value of money and the risks specific to the asset. Impairment
losses are recognized in income in the period in which the impairment is determined.
(k) Foreign currency translation:
The Canadian dollar is the functional and presentation currency of the Exchange.
Transactions in foreign currencies are translated into Canadian dollars at rates of exchange
at the time of such transactions. Monetary assets and liabilities are translated at current rates
of exchange. Translation differences on AFS investments are classified as other changes in
the carrying value of the investment and are recognized in other comprehensive income.

ONTARIO SCHOOL BOARDS' INSURANCE EXCHANGE Notes to Financial Statements (continued) Year ended December 31, 2020
12
2. Significant accounting policies (continued):
(l) Accounting standards issued but not yet applied:
(i) IFRS 17, Insurance Contracts:
On May 18, 2017 the IASB issued IFRS 17, Insurance Contracts (“IFRS 17”). On June
25, 2020, the IASB issued amendments to IFRS 17 aimed at helping companies
implement the Standard and to defer the effective date. The new standard is effective for
annual periods beginning on or after January 1, 2023. IFRS 17 will replace IFRS 4,
Insurance Contracts. This standard introduces consistent accounting for all insurance
contracts. The standard requires a company to measure insurance contracts using
updated estimates and assumptions that reflect the timing of cash flows and any
uncertainty relating to insurance contracts. Additionally, IFRS 17 requires a company to
recognize profits as it delivers insurance services, rather than when it receives premiums.
The Exchange intends to adopt IFRS 17 in its financial statements for the annual period
beginning on January 1, 2023. The extent of the impact of adoption of the standard has
not yet been determined.
(ii) IFRS 9, Financial Instruments:
In July 2014, the IASB issued the complete amended IFRS 9, Financial Instruments
(“IFRS 9”). The mandatory effective date of IFRS 9 is for annual periods beginning on or
after January 1, 2018 and must be applied retrospectively with some exemptions. The
restatement of prior periods is not required and is only permitted if information is available
without the use of hindsight.
IFRS 9 introduces new requirements for the classification and measurement of financial
assets based on the business model in which they are held and the characteristics of their
contractual cash flows. It also amends the impairment model by introducing a new
‘expected credit loss’ model for calculating impairment.
The standard also introduces additional changes relating to financial liabilities.
IFRS 9 also includes a new general hedge accounting standard which aligns hedge
accounting more closely with risk management. This new standard does not
fundamentally change the types of hedging relationships or the requirement to measure
and recognize ineffectiveness, however it will provide more hedging strategies that are
used for risk management to qualify for hedge accounting and introduce more judgment
to assess the effectiveness of a hedging relationship. Special transitional requirements
have been set for the application of the new general hedging model.

ONTARIO SCHOOL BOARDS' INSURANCE EXCHANGE Notes to Financial Statements (continued) Year ended December 31, 2020
13
2. Significant accounting policies (continued):
(l) Accounting standards issued but not yet applied (continued):
(ii) IFRS 9, Financial Instruments (continued):
In September 2016, the IASB issued amendments to IFRS 4, Insurance Contracts to
address accounting mismatches and volatility that may arise in profit or loss in the period
between the effective date of IFRS 9 and the new insurance contracts standard, IFRS 17
issued in May 2017.
The amendments introduce two approaches that may be adopted by insurers in the period
between the effective date of IFRS 9, January 1, 2019, and IFRS 17, effective January 1,
2023:
• overlay approach – an option for all issuers of insurance contracts to reclassify
amounts between profit or loss and other comprehensive income for eligible financial
assets by removing any additional accounting volatility that may arise from applying
IFRS 9; and
• temporary exemption – an optional temporary exemption from IFRS 9 for companies
whose activities are predominately connected with insurance. This exemption allows
an entity to continue to apply existing financial instrument requirements in IAS 39 to
all financial assets until the earlier of the application of IFRS 17 or January 1, 2023.
The Exchange evaluated its liabilities at December 31, 2015, the prescribed date of
assessment under the temporary exemption provisions and concluded that all of the
liabilities were predominantly connected with insurance. Approximately 99% of the
Exchange’s liabilities at December 31, 2015 are liabilities that arise from contracts within
the scope of IFRS 17 and approximately 99% of the Exchange’s liabilities at December
31, 2015 are liabilities that arise because the Company issues insurance contracts and
fulfils obligations arising from insurance contracts. Additionally, the Exchange has not
previously applied any version of IFRS 9. Therefore, the Exchange is an eligible insurer
that qualifies for optional relief from the application of IFRS 9.
As at January 1, 2018, the Exchange has elected to apply the optional transitional relief
under IFRS 4 that permits the deferral of the adoption of IFRS 9 for eligible insurers. The
Exchange will continue to evaluate the impact of IFRS 9. See note 4(d) for additional
disclosures which enable comparison between the Exchange and entities that applied
IFRS 9 at January 1, 2019.

ONTARIO SCHOOL BOARDS' INSURANCE EXCHANGE Notes to Financial Statements (continued) Year ended December 31, 2020
14
3. Significant judgments and estimates:
The Exchange makes estimates and assumptions that affect the reported amounts of assets and
liabilities within the next financial year. Estimates and judgments are continually evaluated and
based on historical experience and other factors, including expectations of future events that are
believed to be reasonable under the circumstances.
(a) Significant judgments:
Significant judgments made in applying accounting policies relate to impairments on AFS
financial assets. As of each reporting date, the Exchange evaluates AFS financial assets in
an unrealized loss position for impairment on the basis described in note 2.
For investments in bonds and debentures, evaluation of whether impairment has occurred is
based on the Exchange's best estimate of the cash flows expected to be collected at the
individual investment level. The Exchange considers all available information relevant to the
collectability of the investment, including information about past events, current conditions,
and reasonable and supportable forecasts. Estimating such cash flows is a quantitative and
qualitative process that incorporates information received from third party sources along with
certain internal assumptions and judgments. Where possible, this data is benchmarked
against third party sources. Impairments for bonds and debentures in an unrealized loss
position are deemed to exist when the Exchange does not expect full recovery of the
amortized cost of the investment based on the estimate of cash flows expected to be collected
or when the Exchange intends to sell the investment prior to recovery from its unrealized loss
position.
For equity investments, the Exchange recognizes an impairment loss in the period in which it
is determined that an investment has experienced significant or prolonged declines in value.
(b) Estimates:
Information about assumptions and estimation uncertainties that have a risk of resulting in
material adjustment within the next twelve months relate to claims liabilities.
Provisions for claims liabilities are valued based on Canadian accepted actuarial practice,
which are designed to ensure the Exchange establishes an appropriate reserve on the
statement of financial position to cover insured losses with respect to the reported and
unreported claims incurred as of the end of each accounting period and claims expenses. The
policy liabilities include a provision for unpaid claims and adjustment expenses on the expired
portion of policies and of future obligations on the unexpired portion of policies. In performing
the valuation of the liabilities for these contingent future events, the Appointed Actuary makes
assumptions as to future loss ratios, trends, reinsurance recoveries, investment rates of
return, expenses and other contingencies, taking into consideration the circumstances of the
Exchange and the nature of the insurance policies. The assumptions underlying the valuation
of provisions for unpaid claims and adjustment expenses are reviewed and updated by the
Exchange on an ongoing basis to reflect recent and emerging trends in experience and
changes in risk profile of the business.

ONTARIO SCHOOL BOARDS' INSURANCE EXCHANGE Notes to Financial Statements (continued) Year ended December 31, 2020
15
4. Investments:
2020 2019
Fixed income:
Structured notes $ 41,236,440 $ 29,462,850 Government bonds 11,112,653 12,619,400 Corporate bonds 105,272,987 107,365,242
Equities: Preferred shares 40,038,702 38,572,338 Common shares 8,610,474 12,195,493 Exchange Traded Funds 6,713,625 -
$ 212,984,881 $ 200,215,323
The fair values of securities are based on quoted market values.
Fair values of cash and cash equivalents and accrued investment income approximate their
carrying values due to the short-term maturity of these items.
On an on-going basis, the Exchange assesses the value of its equity and fixed income portfolios
to determine if there is objective evidence of impairment. During the year, the Exchange wrote
down $286,574 (2019 - $nil) investments that were deemed to be impaired.
(a) Liquidity:
Maturity profile of fixed income investments as at December 31, 2020:
Within Over 1 year 1 - 3 years 3 - 5 years 5 - 10 years 10 years
$ – $ 26,444,867 $ 49,276,055 $ 54,237,783 $ 27,663,375
Maturity profile of fixed income investments as at December 31, 2019:
Within Over 1 year 1 - 3 years 3 - 5 years 5 - 10 years 10 years
$ 24,639,790 $ 4,173,200 $ 36,247,267 $ 50,265,057 $ 34,122,178
The weighted average yield for debt securities based on market value at December 31, 2020
is 3.05% (2019 – 3.59%).

ONTARIO SCHOOL BOARDS' INSURANCE EXCHANGE Notes to Financial Statements (continued) Year ended December 31, 2020
16
4. Investments (continued):
(b) Investment and other income:
2020 2019
Interest $ 7,071,769 $ 5,832,932 Dividends 3,049,696 2,846,259 Gain on sale of investments 4,117,191 669,946
$ 14,238,656 $ 9,349,137
(c) Fair values:
The Exchange uses a fair value hierarchy to categorize the inputs used in valuation
techniques to measure fair value. The extent of the Exchange’s use of quoted market prices
(Level 1), internal models using observable market information as inputs (Level 2) and internal
models without observable market information as inputs (Level 3) in the valuation of bond and
equity investments, as well as derivatives were as follows:
2020
Level 1 Level 2 Level 3 Total
Equities and exchange traded funds $ 55,362,801 $ – $ – $ 55,362,801 Bonds – 116,385,640 – 116,385,640 Structured notes – 41,236,440 – 41,236,440
Total $ 55,362,801 $ 157,622,080 $ – $ 212,984,881
2019
Level 1 Level 2 Level 3 Total
Equities $ 50,767,831 $ – $ – $ 50,767,831 Bonds – 119,984,642 – 119,984,642 Structured notes – 29,462,850 – 29,462,850
Total $ 50,767,831 $ 149,447,492 $ – $ 200,215,323
The Exchange did not have any significant transfers between Level 1 and Level 2 included in
the fair value hierarchy. The Exchange has no holdings in the Level 3 category.

ONTARIO SCHOOL BOARDS' INSURANCE EXCHANGE Notes to Financial Statements (continued) Year ended December 31, 2020
17
4. Investments (continued):
(d) Additional disclosures:
The following additional disclosure, required by IFRS 9 for eligible insurers, presents the fair
value and the amount of change in the fair value of the Exchange’s financial assets as at and
for the year ending December 31, 2020, showing separately the fair value of financial assets
with contractual terms that give rise to cash flows that are solely payments of principal and
interest on the principal amount outstanding (“SPPI”) and the fair value of financial assets that
do not give rise to cash flows that are solely payments of principal and interest on the principal
amount outstanding (“Non-SPPI”):
SPPI Non-SPPI
Fair Change in Fair Change in Value fair value value fair value
Structured notes $ – $ – $ 41,236,440 $ 11,773,590 Bonds 116,385,640 (3,599,002) – – Preferred shares – – 40,038,702 1,466,364 Common shares – – 8,610,474 (3,584,669) Exchange traded funds – – 6,713,625 6,713,625
$ 116,385,640 $ (3,599,002) $ 96,599,241 $ 16,368,910
The following additional disclosure, required by IFRS 9 for eligible insurers, presents the credit
risk ratings of SPPI financial assets at December 31, 2020:
Carrying amount Credit rating Credit risk (fair value) % of total
AAA Low $ 2,182,000 2 AA Low 10,096,003 9 A Low 17,002,703 15 BBB Low 82,026,834 70 BB Other 5,078,100 4
$ 116,385,640 100

ONTARIO SCHOOL BOARDS' INSURANCE EXCHANGE Notes to Financial Statements (continued) Year ended December 31, 2020
18
5. Property and equipment:
Equipment Land and and buildings furnishings Automobile Total
Cost: Balance, December 31, 2019 $ 817,834 $ 1,238,057 $ 101,317 $ 2,157,208 Additions – 130,880 – 130,880 Disposals – (14,123) – (14,123)
Balance, December 31, 2020 817,834 1,354,814 101,317 2,273,965 Accumulated depreciation: Balance, December 31, 2019 230,604 1,068,822 2,111 1,301,537 Depreciation for the year 20,428 92,983 25,329 138,740 Disposals – (14,123) – (14,123)
Balance, December 31, 2020 251,032 1,147,341 27,440 1,425,813 Carrying amounts: Balance, December 31, 2019 587,230 169,235 99,206 855,671
Balance, December 31, 2020 $ 566,802 $ 207,130 $ 73,879 $ 847,811
6. Limits of liability:
(a) Liability insurance:
The limit of liability for liability insurance is a maximum amount on any one loss of $27,000,000
(2019 - $27,000,000) in the event of a liability claim and to a maximum amount of $27,000,000
(2019 - $27,000,000) in the event of a series of claims arising out of a single occurrence. In
July 2020, the Exchange ceased to purchase reinsurance on this policy and instead
established a Large Loss Fund as described in note 6(e). In 2019, the Exchange obtained
reinsurance protection on these policies to an amount not exceeding $22,000,000 on each
and every occurrence or a series of claims arising out of a single occurrence in excess of
$5,000,000, and an annual aggregate of $44,000,000.
(b) Property insurance:
The property insurance policy provides for payment in the event of any one loss or a series of
losses arising out of a single occurrence in excess of the individual subscriber's deductible
without limit. The Exchange has obtained reinsurance protection on these policies to a limit
of $250,000,000 subject to a retention of $5,000,000 (2019 - $5,000,000) on each claim on
property damages and $500,000 (2019 - $500,000) per claim for extra expenses, subject to
an annual aggregate retention in the amount of $15,000,000 (2019 - $15,000,000) beyond
which the retention reduces to the subscriber's deductible.

ONTARIO SCHOOL BOARDS' INSURANCE EXCHANGE Notes to Financial Statements (continued) Year ended December 31, 2020
19
6. Limits of liability (continued):
(b) Property insurance (continued):
The Exchange has obtained reinsurance, whereby they share in the losses at a rate of 25%
for losses between $6,000,000 and $11,000,000 and at 75% for losses between $11,000,000
and $21,000,000.
(c) Boiler and machinery insurance:
The boiler and machinery insurance policy provides for payment in the event of any one loss
or a series of losses arising out a single occurrence in excess of the individual subscriber’s
deductible. From 1992 to 2008 the Exchange boiler and machinery program was 100%
reinsured. From 2008 to 2019, the Exchange insured this program through a subscription
policy with another boiler insurer and shared in the losses at a rate of 25% from 2008 to 2011
and 50% share from 2011 to 2019. In 2020, the Exchange ceased this arrangement and now
insures the program 100%, with a policy limit of $5,000,000.
(d) Owned automobile insurance:
The insurance policy for subscriber-owned automobiles provides for payment in the event of
any one loss or series of losses arising out of a single occurrence to a maximum for liability
claims of $20,000,000 (2019 - $20,000,000) subject to recoverability of the individual
subscriber's deductible. In July 2020, the Exchange ceased to purchase reinsurance for this
line of business and established a Large Loss Fund to build capacity to insure these losses
see note 6(e). In 2019, the Exchange obtained reinsurance coverage for third party liability
claims on these policies to an amount not exceeding $17,000,000 subject to retention of
$3,000,000 per claim, and an annual aggregate of $34,000,000.
(e) Large Loss Fund for liability and automobile insurance losses
In 2020, OSBIE established the Large Loss Fund for liability and automobile insurance losses
to replicate the retention levels of reinsurance available in the marketplace and to ensure
OSBIE will have funds available to pay large losses into the future (those losses exceeding
$10 million). Through the collection of premiums, the Fund will grow over the next several
years to achieve a target of $34 million, which replicates the aggregate reinsurance policy
limits.

ONTARIO SCHOOL BOARDS' INSURANCE EXCHANGE Notes to Financial Statements (continued) Year ended December 31, 2020
20
7. Claims liabilities:
(a) Nature of claims liabilities:
Claims liabilities and related reinsurance recoverable are estimates subject to variability and
the variability could be material in the near term. The variability arises because all events
affecting the ultimate settlement of claims have not taken place and may not take place for
some time. Variability can be caused by receipt of additional claim information, or significant
change in severity or frequency of claims from historical trends. The estimates are principally
based on the Exchange's historical experience. Methods of estimation have been used which
the Exchange believes produce reasonable results given current information.
The Exchange strives to establish adequate claim liabilities at the original valuation date.
However, as time passes, the ultimate cost of claims becomes more certain. During 2020,
the Exchange experienced unfavourable claims development of $6,528,000 (2019 -
unfavourable claims development of $8,194,000).
The table below details the claim liabilities by risk categories:
2020 2019
Gross Ceded Gross Ceded
General liability $ 87,531,582 $ – $ 86,766,973 $ – Property, boiler and
machinery and crime 19,376,997 2,943,482 5,745,356 153,500 Automobile 944,024 – 1,002,019 – Legal Expense 1,004,603 – 477,593 –
$ 108,857,206 $ 2,943,482 $ 93,991,941 $ 153,500
Management has concluded that the best estimate of the fair value of claims liabilities currently
available is the amount calculated by the Appointed Actuary. The Actuary's calculated value
as at December 31, 2020 amounted to $108,857,206 (2019 - $93,991,941) and is gross of
estimated reinsurance recoverable of $2,943,482 (2019 - $153,500).
The reinsurance recoveries and reinsurance reserve changes included in claims incurred
were $3,112,595 (2019 - $7,430,392).
Insurance ceded under reinsurance arrangements does not relieve the Exchange of its
primary liability to the subscriber. No information has come to the Exchange's attention
indicating that any of its current reinsurers will not be able to honour their liabilities under these
reinsurance contracts.

ONTARIO SCHOOL BOARDS' INSURANCE EXCHANGE Notes to Financial Statements (continued) Year ended December 31, 2020
21
7. Claims liabilities (continued):
(b) Discounting of the claims liabilities and related reinsurance recoveries:
The provision for claims liabilities and related reinsurance recoveries is discounted using rates
based on the projected investment income from the assets supporting the provisions, and
reflecting the estimated timing of payments and recoveries. The discount rate used in the
valuation was 2.93% (2019 - 3.48%).
The gross provision and reinsurance recoverable estimates are as follows:
2020 2019
Discounted Undiscounted Discounted Undiscounted
Gross provision $ 108,857,206 $ 94,273,000 $ 93,991,941 $ 89,612,941 Reinsurance ceded 2,943,482 2,990,482 153,500 151,500
(c) Insurance contract provision and reinsurance assets:
2020
Gross Reinsurance Net
Notified claims $ 66,670,206 $ 2,885,482 $ 63,784,724 Claims incurred but not reported 42,187,000 58,000 42,129,000
$ 108,857,206 $ 2,943,482 $ 105,913,724
2019
Gross Reinsurance Net
Notified claims $ 50,132,941 $ 146,500 $ 49,986,441 Claims incurred but not reported 43,859,000 7,000 43,852,000
$ 93,991,941 $ 153,500 $ 93,838,441
(d) Analysis of movements in insurance contract provisions
2020 2019
Balance, beginning of year $ 93,991,941 $ 92,110,326 Current year claims 32,418,470 20,845,638 Prior year unfavourable (favourable) claims development 6,528,000 8,194,000
Total claims incurred 132,938,411 121,149,964 Decrease due to changes in discount rate 1,502,000 1,917,000 Increase due to changes in salvage and subrogation recovery 3,337,438 353,597 Claims paid (28,920,643) (29,428,620)
Balance, end of year $ 108,857,206 $ 93,991,941

ONTARIO SCHOOL BOARDS' INSURANCE EXCHANGE Notes to Financial Statements (continued) Year ended December 31, 2020
22
7. Claims liabilities (continued):
(e) Change in reinsurance ceded reserves:
2020 2019
Balance, beginning of year $ 153,500 $ 92,000 Reinsurers’ share in total claims incurred 3,007,595 7,430,392 Reinsurers’ share in total claims payments (217,613) (7,368,892)
Balance, end of year $ 2,943,482 $ 153,500
(f) Methodologies and assumptions:
The provision for claims liabilities is an estimate that is determined using a range of accepted
actuarial claims projection techniques determined based on the line of business. The reported
amount is based on studies of past experience. The key assumption of the incurred loss/paid
loss claims development method is that claims recorded to date will continue to develop in a
similar manner in the future. These techniques use the Exchange’s historical claims
development patterns to predict future claims development. In situations where there has
been a significant change in the environment or underlying risks, the historical data is adjusted
to account for expected differences. The historical studies are regularly compared to current
emerging experience so that adjustments may be made as necessary.
In order to calculate the carrying value of the unpaid claims, the Exchange uses an actuarial
approach recognizing the time value of money which incorporates assumptions concerning
projected cash flows and appropriate provisions for adverse deviations. The actuarially
determined carrying value of claims liabilities is considered an indicator of fair value, as there
is no ready market for the trading of insurance policy liabilities.
(g) Changes in assumptions:
Consideration is given to the characteristics of the risks, historical trends, the amount of data
available on individual claims, inflation and any other pertinent factors. Some assumptions
require a significant amount of judgment such as the expected future impacts of future judicial
decisions and government legislation. The diversity of these considerations result in it not
being practicable to identify and quantify all individual assumptions that are more likely than
others to have a significant impact on the measurement of the Exchange’s insurance
contracts. There were no assumptions identified in the year or the preceding year as having
a potential or identifiable material impact on the overall claims estimate.

ONTARIO SCHOOL BOARDS' INSURANCE EXCHANGE Notes to Financial Statements (continued) Year ended December 31, 2020
23
7. Claims liabilities (continued):
(h) Sensitivity analysis:
There is uncertainty inherent in the estimation process. The actual amount of ultimate claims
can only be ascertained once all claims are closed. Among all the lines of business, general
liability line of business has the largest unpaid claims liabilities. Given the nature of this line of
business and the fact that it has a very long tail, this line's estimate is the most critical to the
assumptions used. If the tail factor selection on this line of business was 5% higher, the
undiscounted net claims liabilities would be $15,381,000 (2019 - $15,129,000) higher. The
effect on net income would be a reduction of $15,847,000 (2019 - $15,994,000). If the
expected loss ratios used were 5% higher in all loss years, the undiscounted net claims
liabilities would be $1,146,000 (2019 - $1,424,000) higher, generating a reduction of
$1,121,000 (2019 - $1,489,000) in net income. Changes in assumptions on other lines of
business are considered to be less material.
(i) Claims development tables:
The following table shows the estimates of cumulative incurred claims, including both claims
notified and IBNR for each successive loss year at each reporting date, together with
cumulative payments to date.

ONTARIO SCHOOL BOARDS' INSURANCE EXCHANGE Notes to Financial Statements (continued) Year ended December 31, 2020
24
7. Claims liabilities (continued):
(i) Claims development tables (continued):
Gross basis:
Total all Insurance risks Year of loss 2011 2012 2013 2014 2015 2016 2017 2018 2019 2020
$’000 $’000 $’000 $’000 $’000 $’000 $’000 $’000 $’000 $’000 Estimate of ultimate claims costs: at end of the year of loss 25,708 39,261 40,102 32,206 33,320 31,327 25,609 20,381 19,821 30,410 one year later 23,225 34,789 35,413 26,502 24,816 25,467 24,074 18,814 19,466 two years later 20,515 31,386 30,998 23,642 23,228 22,647 25,457 17,397 three years later 19,554 31,639 28,861 23,553 23,729 21,598 28,275 - four years later 20,287 31,084 29,309 22,659 22,976 22,433 - - five years later 20,095 30,665 28,759 22,204 22,380 - - - six years later 19,723 31,264 28,630 23,342 - - - - seven years later 19,943 29,531 30,024 - - - - - eight years later 19,950 29,944 - - - - - - nine years later 20,932 - - - - - - -
Current estimate of cumulative claims 20,392 29,944 30,024 23,342 22,380 22,433 28,275 17,397 19,466 30,410
Cumulative payments to date 19,617 26,783 27,290 19,377 16,673 15,270 14,151 8,338 7,488 6,059

ONTARIO SCHOOL BOARDS' INSURANCE EXCHANGE Notes to Financial Statements (continued) Year ended December 31, 2020
25
7. Claims liabilities (continued):
(i) Claims development tables (continued):
Net basis:
Total all Insurance risks Year of loss 2011 2012 2013 2014 2015 2016 2017 2018 2019 2020
$’000 $’000 $’000 $’000 $’000 $’000 $’000 $’000 $’000 $’000 Estimate of ultimate claims costs: at end of the year of loss 25,609 35,386 39,420 32,152 33,052 31,194 25,461 20,498 19,660 30,413 one year later 23,150 33,909 35,256 26,445 24,619 25,279 23,924 18,595 19,739 two years later 20,439 31,214 30,548 23,585 23,029 22,129 25,307 17,255 three years later 19,478 30,752 28,385 23,554 23,531 21,410 28,126 - four years later 20,209 30,198 28,774 22,661 22,778 21,892 - - five years later 20,017 29,780 28,224 22,205 22,180 - - - six years later 19,646 30,378 28,096 23,344 - - - - seven years later 19,865 28,645 29,940 - - - - eight years later 19,872 29,055 - - - - - - nine years later 20,314 - - - - - - -
Current estimate of cumulative claims 20,314 29,055 29,490 23,344 22,180 21,892 28,126 17,255 19,739 30,413
Cumulative payments to date 19,539 25,902 26,817 19,330 16,474 15,082 14,001 8,147 7,432 6,059

ONTARIO SCHOOL BOARDS' INSURANCE EXCHANGE Notes to Financial Statements (continued) Year ended December 31, 2020
26
8. Financial risk management:
The primary goals of the Exchange’s financial risk management policies are to ensure that the
outcomes of activities involving elements of risk are consistent with the Exchange’s objectives
and risk tolerance, and to maintain an appropriate risk/reward balance while protecting the
Exchange’s statement of financial position from events that have the potential to materially impair
its financial strength. Balancing risk and reward is achieved through aligning risk appetite with
business strategy, diversifying risk, pricing appropriately for risk, mitigating risk through
preventive controls and transferring risk to third parties.
The Exchange’s exposure to potential loss from financial risks is primarily due to underwriting
risk along with various market risks, including interest rate risk and equity market fluctuation risk,
foreign currency risk, liquidity risk, as well as credit risk.
(a) Underwriting risk:
Underwriting risk is the risk that the total cost of claims and acquisition expenses will exceed
premiums received and can arise from numerous factors, including pricing risk, reserving
risk, catastrophic loss risk and reinsurance coverage risk.
Our underwriting objective is to develop business within our target market on a prudent and
diversified basis and to achieve underwriting results of up to a 112.9% combined ratio.
(i) Pricing risk:
Pricing risk arises when actual claims experience differs from the assumptions included
in pricing calculations. Historically, the underwriting results of the property and casualty
industry have fluctuated significantly due to the cyclicality of the insurance market. The
market cycle is affected by the frequency and severity of losses, levels of capacity and
demand, general economic conditions and price competition. We price our products
taking into account numerous factors including claims frequency and severity trends,
product line expense ratios, special risk factors, the capital required to support the
product line, and the investment income earned on that capital. These factors are set in
conjunction with our actuary, and are reviewed and adjusted periodically to ensure they
reflect the current environment.
(ii) Reserving risk:
Reserving risk arises due to the length of time between the occurrence of a loss, the
reporting of the loss to the insurer and ultimate resolution of the claim. Claim provisions
are expectations of the ultimate cost of resolution and administration of claims based on
an assessment of facts and circumstances then known, a review of historical settlement
patterns, estimates of trends in claims severity and frequency, legal theories of liability
and other factors.

ONTARIO SCHOOL BOARDS' INSURANCE EXCHANGE Notes to Financial Statements (continued) Year ended December 31, 2020
27
8. Financial risk management (continued):
(a) Underwriting risk (continued):
(ii) Reserving risk (continued):
Variables in the reserve estimation process can be affected by receipt of additional claim
information and other internal and external factors, such as changes in claims handling
procedures, economic inflation, legal and judicial trends, legislative changes, inclusion
of exposures not contemplated at the time of policy inception and significant changes in
severity or frequency of claims relative to historical trends. Due to the amount of time
between the occurrence of a loss, the actual reporting of the loss and the ultimate
payment, provisions may ultimately develop differently from the actuarial assumptions
made when initially estimating the provision for claims. The Exchange’s provision for
claims are reviewed separately by, and must be acceptable to, the independent
appointed actuary, and an external valuation actuary.
(iii) Catastrophic loss risk:
Catastrophic loss risk is the exposure to losses resulting from multiple claims arising out
of a single catastrophic event. Property and casualty insurance companies experience
large losses arising from manmade or natural catastrophes that can result in significant
underwriting losses. Catastrophes can cause losses in a variety of property and casualty
lines and may have continuing effects which could delay or hamper efforts to timely and
accurately assess the full extent of the damage they cause. The incidence and severity
of catastrophes are inherently unpredictable. The Exchange’s exposure to insured risks
is managed through the use of reinsurance. The Exchange reinsures claims from a
single catastrophe over $5,000,000 to a maximum of $250,000,000. The net retained
amount of $5,000,000 represents less than 10% of the Exchange’s Guarantee Fund.
Reinsurance coverage risk arises because reinsurance terms, conditions and/or pricing
may change on renewal, particularly following catastrophes.
(iv) Reinsurance risk:
The Exchange relies on reinsurance to manage the underwriting risk, however,
reinsurance does not release the Exchange from its primary commitments to its
policyholders. Therefore, the Exchange is exposed to the credit risk associated with the
amounts ceded to reinsurers. The Exchange assesses the financial soundness of the
reinsurers before signing any reinsurance treaties and monitors their situation on a
regular basis. In addition, the Exchange has minimum rating requirements for its
reinsurers. The Exchange tenders reinsurance requirements on a regular basis to
ensure that the best price possible is obtained. The Exchange works with well
established reinsurers that have expertise in their field as well as an understanding of
the business. Management reviews reinsurance programs to manage cost-efficiency
and reduce the likelihood of coverage gaps.

ONTARIO SCHOOL BOARDS' INSURANCE EXCHANGE Notes to Financial Statements (continued) Year ended December 31, 2020
28
8. Financial risk management (continued):
(b) Credit risk:
(i) Invested assets:
The Exchange’s risk management strategy is to invest primarily in debt instruments of
high credit quality issuers and to limit the amount of credit exposure with respect to any
one issuer. The Exchange attempts to limit credit exposure by imposing portfolio limits
on individual corporate issuers as well as limits based on credit quality. The breakdown
of the Exchange’s fixed income portfolio, by Standard and Poor’s or Moody’s rating is
presented below:
2020 2019
Fair value % of total Fair value % of total
AAA $ 2,182,200 1 $ 2,122,420 1 AA 51,332,443 33 39,959,830 27 A 17,002,703 11 26,243,038 18 BBB 82,026,634 52 80,110,064 53 BB 5,078,100 3 1,012,140 1
$ 157,622,080 100 $ 149,447,492 100
(ii) Reinsurance recoverable and receivable:
Credit exposure on the Exchange’s reinsurance recoverable and receivable balances
exists at December 31, 2020 to the extent that any reinsurer may not be able or willing
to reimburse the Exchange under the terms of the relevant reinsurance arrangements.
The Exchange has policies which limit its exposure to individual reinsurers and a regular
review process to assess the creditworthiness of reinsurers with whom it transacts
business. Internal guidelines generally require reinsurers to have A ratings. Any
exceptions are subject to CEO approval.
In 2020, the Exchange has reinsurance recoverable balances of $2,943,482 (2019 -
$153,500). The receivable balance at December 31, 2020 is $ 138,471 (2019 -
$230,839).
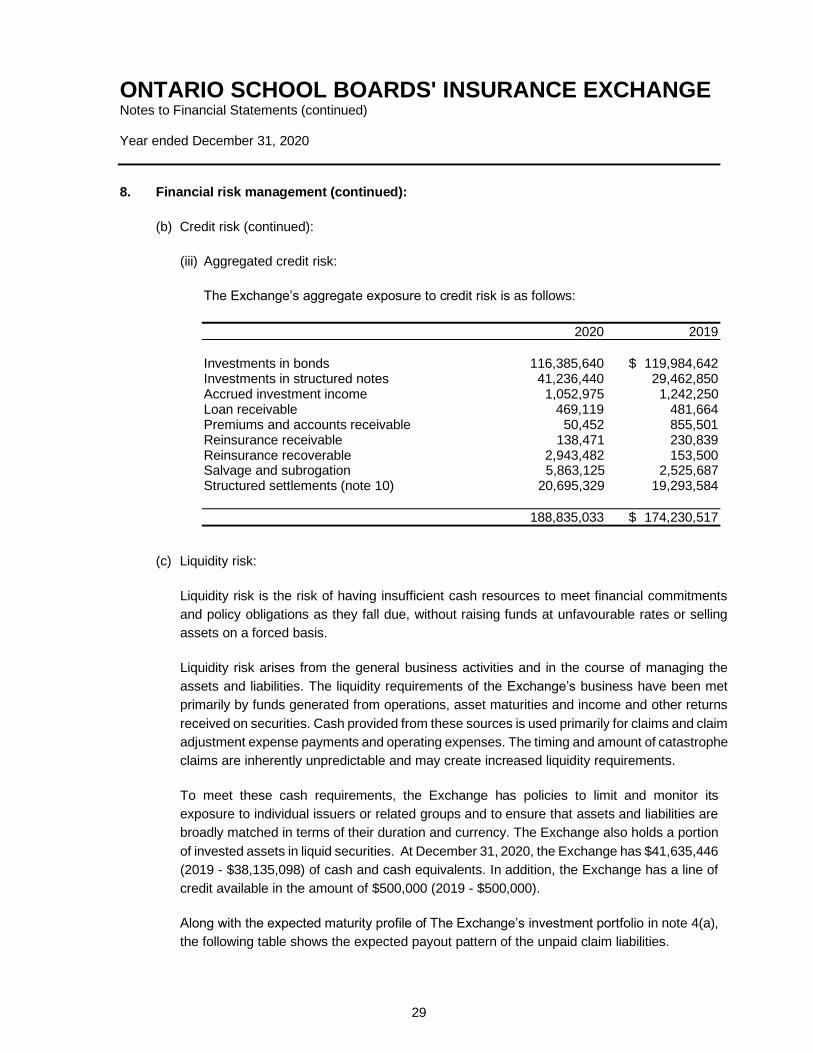
ONTARIO SCHOOL BOARDS' INSURANCE EXCHANGE Notes to Financial Statements (continued) Year ended December 31, 2020
29
8. Financial risk management (continued):
(b) Credit risk (continued):
(iii) Aggregated credit risk:
The Exchange’s aggregate exposure to credit risk is as follows:
2020 2019
Investments in bonds 116,385,640 $ 119,984,642 Investments in structured notes 41,236,440 29,462,850 Accrued investment income 1,052,975 1,242,250 Loan receivable 469,119 481,664 Premiums and accounts receivable 50,452 855,501 Reinsurance receivable 138,471 230,839 Reinsurance recoverable 2,943,482 153,500 Salvage and subrogation 5,863,125 2,525,687 Structured settlements (note 10) 20,695,329 19,293,584
188,835,033 $ 174,230,517
(c) Liquidity risk:
Liquidity risk is the risk of having insufficient cash resources to meet financial commitments
and policy obligations as they fall due, without raising funds at unfavourable rates or selling
assets on a forced basis.
Liquidity risk arises from the general business activities and in the course of managing the
assets and liabilities. The liquidity requirements of the Exchange’s business have been met
primarily by funds generated from operations, asset maturities and income and other returns
received on securities. Cash provided from these sources is used primarily for claims and claim
adjustment expense payments and operating expenses. The timing and amount of catastrophe
claims are inherently unpredictable and may create increased liquidity requirements.
To meet these cash requirements, the Exchange has policies to limit and monitor its
exposure to individual issuers or related groups and to ensure that assets and liabilities are
broadly matched in terms of their duration and currency. The Exchange also holds a portion
of invested assets in liquid securities. At December 31, 2020, the Exchange has $41,635,446
(2019 - $38,135,098) of cash and cash equivalents. In addition, the Exchange has a line of
credit available in the amount of $500,000 (2019 - $500,000).
Along with the expected maturity profile of The Exchange’s investment portfolio in note 4(a),
the following table shows the expected payout pattern of the unpaid claim liabilities.

ONTARIO SCHOOL BOARDS' INSURANCE EXCHANGE Notes to Financial Statements (continued) Year ended December 31, 2020
30
8. Financial risk management (continued):
(c) Liquidity risk (continued):
Expected payout pattern of unpaid claims as at December 31, 2020:
Within 1 year 1 - 5 years 5 - 10 years Over 10 years Total
$ 29,373,000 $ 46,237,000 $ 13,409,000 $ 4,608,000 $ 93,627,000
Expected payout pattern of unpaid claims as at December 31, 2019:
Within 1 year 1 - 5 years 5 - 10 years Over 10 years Total
$ 21,000,000 $ 46,976,000 $ 14,827,000 $ 4,133,000 $ 86,936,000
(d) Market risk:
Market risk is the risk of loss arising from adverse changes in market rates and prices, such
as interest rates, equity market fluctuations, foreign currency exchange rates, and other
relevant market rate or price changes. Market risk is directly influenced by the volatility and
liquidity in the markets in which the related underlying assets are traded. Below is a
discussion of the Exchange’s primary market risk exposures and how those exposures are
currently managed.
(i) Interest rate risk:
Fluctuations in interest rates have a direct impact on the market valuation of the
Exchange’s fixed income securities portfolio and liability values. Historical data and
current information is used to profile the ultimate claims settlement pattern by class of
insurance, which is then used in a broad sense to develop an investment policy and
strategy. Generally, our investment income will move with interest rates over the long-
term. Short-term interest rate fluctuations will generally create unrealized gains or losses.
Generally, the Exchange’s interest and dividend investment income will be reduced
during sustained periods of lower interest rates as higher yielding fixed income securities
are called, mature, or are sold and the proceeds are reinvested at lower rates, and will
likely result in unrealized gains in the value of fixed income securities the Exchange
continues to hold, as well as realized gains to the extent the relevant securities are sold.
During periods of rising interest rates, the market value of the Exchange’s existing fixed
income securities will generally decrease and gains on fixed income securities will likely
be reduced or result in realized losses.
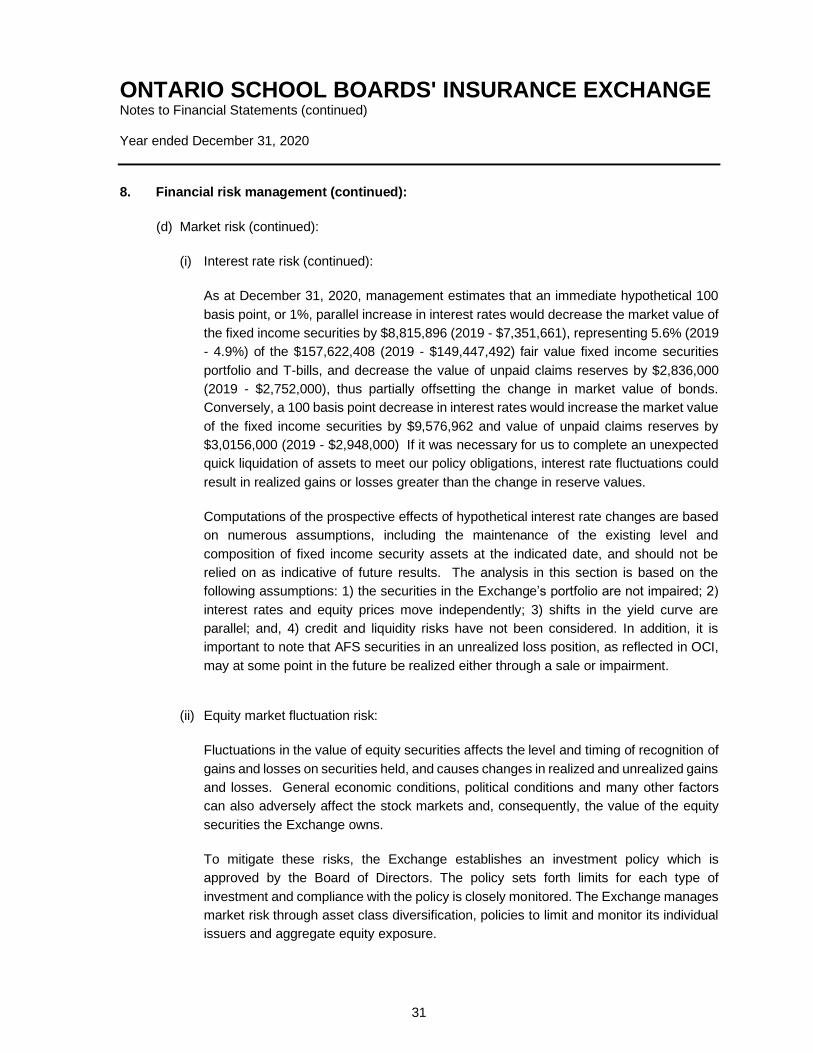
ONTARIO SCHOOL BOARDS' INSURANCE EXCHANGE Notes to Financial Statements (continued) Year ended December 31, 2020
31
8. Financial risk management (continued):
(d) Market risk (continued):
(i) Interest rate risk (continued):
As at December 31, 2020, management estimates that an immediate hypothetical 100
basis point, or 1%, parallel increase in interest rates would decrease the market value of
the fixed income securities by $8,815,896 (2019 - $7,351,661), representing 5.6% (2019
- 4.9%) of the $157,622,408 (2019 - $149,447,492) fair value fixed income securities
portfolio and T-bills, and decrease the value of unpaid claims reserves by $2,836,000
(2019 - $2,752,000), thus partially offsetting the change in market value of bonds.
Conversely, a 100 basis point decrease in interest rates would increase the market value
of the fixed income securities by $9,576,962 and value of unpaid claims reserves by
$3,0156,000 (2019 - $2,948,000) If it was necessary for us to complete an unexpected
quick liquidation of assets to meet our policy obligations, interest rate fluctuations could
result in realized gains or losses greater than the change in reserve values.
Computations of the prospective effects of hypothetical interest rate changes are based
on numerous assumptions, including the maintenance of the existing level and
composition of fixed income security assets at the indicated date, and should not be
relied on as indicative of future results. The analysis in this section is based on the
following assumptions: 1) the securities in the Exchange’s portfolio are not impaired; 2)
interest rates and equity prices move independently; 3) shifts in the yield curve are
parallel; and, 4) credit and liquidity risks have not been considered. In addition, it is
important to note that AFS securities in an unrealized loss position, as reflected in OCI,
may at some point in the future be realized either through a sale or impairment.
(ii) Equity market fluctuation risk:
Fluctuations in the value of equity securities affects the level and timing of recognition of
gains and losses on securities held, and causes changes in realized and unrealized gains
and losses. General economic conditions, political conditions and many other factors
can also adversely affect the stock markets and, consequently, the value of the equity
securities the Exchange owns.
To mitigate these risks, the Exchange establishes an investment policy which is
approved by the Board of Directors. The policy sets forth limits for each type of
investment and compliance with the policy is closely monitored. The Exchange manages
market risk through asset class diversification, policies to limit and monitor its individual
issuers and aggregate equity exposure.

ONTARIO SCHOOL BOARDS' INSURANCE EXCHANGE Notes to Financial Statements (continued) Year ended December 31, 2020
32
8. Financial risk management (continued):
(d) Market risk (continued):
(ii) Equity market fluctuation risk (continued):
As at December 31, 2020, management estimates that a 10% increase in equity markets,
with all other variables held constant, would impact OCI by approximately $5,536,280
(2019 - $5,076,783). A 10% decrease in equity prices would have the corresponding
opposite effect, impacting OCI by the same amounts. Equities comprise 25% (2019 -
25%) of the fair value of the Exchange’s total investments.
(iii) Foreign exchange risk:
Foreign exchange risk is the possibility that changes in exchange rates produce an
unintended effect on earnings and equity when measured in domestic currency. This
risk is larger when assets backing liabilities are payable in one currency and are invested
in financial instruments of another currency. The Exchange monitors the exposure of
invested assets to foreign exchange and limits these amounts when deemed necessary
and mitigates foreign exchange rate risk. The Exchange may nevertheless, from time to
time, experience losses resulting from fluctuations in the values of these foreign
currencies, which could adversely affect operating results.
At December 31, 2020, the Exchange held $995,664 in US bonds (2019 - $1,255,810).
As at December 31, 2020, management estimates that a 10% increase in the value of
the Canadian dollar compared to the US dollar with all other variables held constant,
would impact OCI by $99,566 (2019 - $125,581). A 10% decrease in the value of
Canadian dollar compared to US dollars would have the corresponding opposite effect,
impacting OCI by the same amounts.
9. Pension plan:
All employees of the Exchange are eligible to be members of the Ontario Municipal Employees
Retirement System ("OMERS"), a multi-employer pension plan. The plan provides defined
pension benefits to employees based on their length of service and rates of pay. From the
inception date of September 1, 2004 to December 31, 2020, eligible employees contributed at
rates between 9% and 14% of earnings. The Exchange contributions equal the employee
contributions to the plan. During the year ended December 31, 2020, the Exchange contributed
$263,812 (2019 - $263,969) to the plan. As this is a multi-employer pension plan, these
contributions are the Exchange's pension benefit expenses. No pension liability for this type of
plan is included in the Exchange's financial statements. The Exchange has a letter of guarantee
with an OMERS member as per the requirements of membership.

ONTARIO SCHOOL BOARDS' INSURANCE EXCHANGE Notes to Financial Statements (continued) Year ended December 31, 2020
33
10. Structured settlements:
The Exchange, in the normal course of settling certain insurance claims, purchases annuities
from unrelated life insurance companies who are licensed in Canada and regulated by the
Superintendent of Financial Institutions Canada. These life insurance companies then make
periodic payments to the Exchange's claimants. The Exchange is exposed to credit risk to the
extent that any of the life insurance companies are unable to continue making these annuity
claims payments. The Exchange's maximum exposure to credit risk for these types of
arrangements is approximately $20,695,329 as at December 31, 2020 (2019 - $19,293,584).
This exposure is reduced to the extent of coverage provided by the life insurance industry Assuris
insurance plan. The Exchange has determined that no credit risk provision is required at
December 31, 2020.
11. Guarantee Fund:
(a) In accordance with the Agreement, subscribers were not obliged to contribute any amounts
to the Exchange in the form of a capital contribution in 2020. The Guarantee Fund, therefore,
represents the cumulative excess of income over expenses, including investment income,
and may be used to cover potential future catastrophe claims or reduce future premiums as
appropriate. The Agreement provides that additional assessments may be made to the
subscribers to the extent that premiums collected are insufficient to cover the claims and
expenses experienced by the Exchange. Similarly, where accumulated funds are in excess
of funds required to meet the obligations in respect of claims arising, the Agreement provides
for the issue of premium credits.
The Board of Directors approved the refund of $5,718,000 (2019 - $5,149,000) to liability
subscribers, $3,340,000 (2019 - $4,235,000) to property subscribers and $405,000 (2019 -
$428,000) to automobile subscribers.
The Insurance Act of Ontario requires the Exchange to maintain a Guarantee Fund of at least
$50,000.
(b) The additional guarantee funds relate to the following underwriting groups:
2020 2019
General liability $ 53,847,466 $ 58,518,112 Property, boiler and machinery and crime 42,582,433 49,710,137 Automobile 13,746,686 13,501,752 Legal expense 252,469 19,755 Large Loss Fund 7,526,075 -
$ 117,955,129 $ 121,749,756
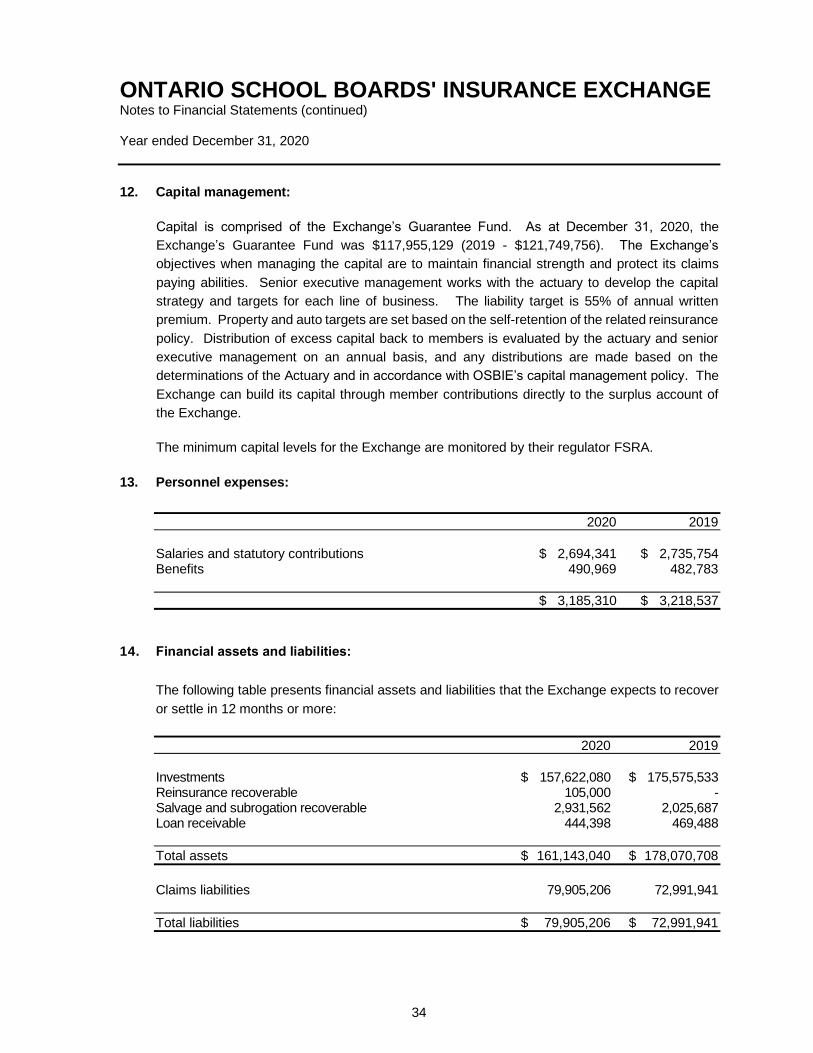
ONTARIO SCHOOL BOARDS' INSURANCE EXCHANGE Notes to Financial Statements (continued) Year ended December 31, 2020
34
12. Capital management:
Capital is comprised of the Exchange’s Guarantee Fund. As at December 31, 2020, the
Exchange’s Guarantee Fund was $117,955,129 (2019 - $121,749,756). The Exchange’s
objectives when managing the capital are to maintain financial strength and protect its claims
paying abilities. Senior executive management works with the actuary to develop the capital
strategy and targets for each line of business. The liability target is 55% of annual written
premium. Property and auto targets are set based on the self-retention of the related reinsurance
policy. Distribution of excess capital back to members is evaluated by the actuary and senior
executive management on an annual basis, and any distributions are made based on the
determinations of the Actuary and in accordance with OSBIE’s capital management policy. The
Exchange can build its capital through member contributions directly to the surplus account of
the Exchange.
The minimum capital levels for the Exchange are monitored by their regulator FSRA.
13. Personnel expenses:
2020 2019
Salaries and statutory contributions $ 2,694,341 $ 2,735,754 Benefits 490,969 482,783
$ 3,185,310 $ 3,218,537
14. Financial assets and liabilities:
The following table presents financial assets and liabilities that the Exchange expects to recover
or settle in 12 months or more:
2020 2019
Investments $ 157,622,080 $ 175,575,533 Reinsurance recoverable 105,000 - Salvage and subrogation recoverable 2,931,562 2,025,687 Loan receivable 444,398 469,488
Total assets $ 161,143,040 $ 178,070,708
Claims liabilities 79,905,206 72,991,941
Total liabilities $ 79,905,206 $ 72,991,941

ONTARIO SCHOOL BOARDS' INSURANCE EXCHANGE Notes to Financial Statements (continued) Year ended December 31, 2020
35
15. Related parties:
Key management personnel are those persons having authority and responsibility for planning,
directing and controlling the activities of the Exchange, directly or indirectly, including the Board
of Directors of the Exchange. The Board of Directors are not paid for their work with the
Exchange.
Compensation expenses related to key management personnel consisted of $1,394,365 (2019 -
$1,460,895) related to salaries and other short-term employee benefits. No other benefits were
paid.
16. Impact of COVID-19 pandemic:
On March 11, 2020, the World Health Organization declared the Coronavirus (COVID-19)
outbreak a pandemic. This has resulted in significant financial, market and societal impacts in
Canada and around the world.
During the year, the Entity has experienced the following in relation to the pandemic:
• Volatility in equity markets resulting in temporary declines in the fair value of investments
and investment income
• Declines in interest rates which have impacted the value of investment holdings and the
valuation of actuarial liabilities
• Mandatory working from home requirements for those able to do so
The ultimate duration and magnitude of the COVID-19 pandemic's impact on the Entity’s
operations and financial position is not known at this time and can cause additional uncertainty
around estimates and judgements used in preparing these financial statements.
If applicable, financial statements are required to be adjusted for events occurring between the
date of the financial statements and the date of the auditors’ report to provide additional evidence
relating to conditions that existed as at year end. No adjustments were necessary.

Agenda 5
MOTION
TO: Audit Committee FROM: CEO RE: P&C1 review MOVED: SECONDED:
BE IT RESOLVED, MOTION: To recommend to the Board the approval of the 2020 annual P&C-1 form as presented.

Agenda 5 i) P&C-1 Annual Submission The Property & Casualty -1 form (P&C-1) is submitted to the regulator on a quarterly basis. The annual form has several more exhibits and provides greater detail pertaining to claims expenses, equity investment holdings and reinsurance carriers. The auditors have reviewed pages 20.10, 20.20 and 20.30, to ensure they reflect the Assets, Liabilities, Surplus, and Comprehensive Income of OSBIE as reported in our Audited financial statements. The actuary has reviewed pages 10.60, 20.10, 20.20, 20.30, 30.61, 30.62, 30.64, 30.66 and 60.30 which are all pages pertaining to our claims liabilities and MCT calculations. MCT Results As shown on page 30.61 in the PC1, our MCT result at December 31st is 429.9% which is down from the year end 2019 score of 472.85%. Our underwriting results, which have impacted the available capital are the main contributing factor to the decrease. OSBIE continues to exceed our capital requirements as outlined in the Capital Management Guidelines:
• Internal minimum MCT score 180%
• Optimal MCT score target: 300%
General Statement Comments Pages 10.15 and 10.17 – the list of current directors, Chair of the Board, members of the Governance committee (will be updated following the meeting). Page 10.60 provides a good 5 year summary of key financial data. The annual P&C-1 is split into the following sections
▪ 10.10 – 10.60 – General information ▪ 20.10 to 20.80 - Financial statements ▪ 30.61 to 30.79 – Statutory Compliance (MCT calculations and supporting exhibits) ▪ 40.07 to 40.80 –Investments ▪ 50.20 to 50.40 - Misc. Assets and Liabilities ▪ 60.10 to 60.50 – Claims and Adjustment expenses ▪ 67.10 to 67.31 – Claims and premiums by line of business ▪ 70.10 to 70.60 –Reinsurance Ceded and related claims ▪ 80.10 & 80.20 – Commissions and Expenses
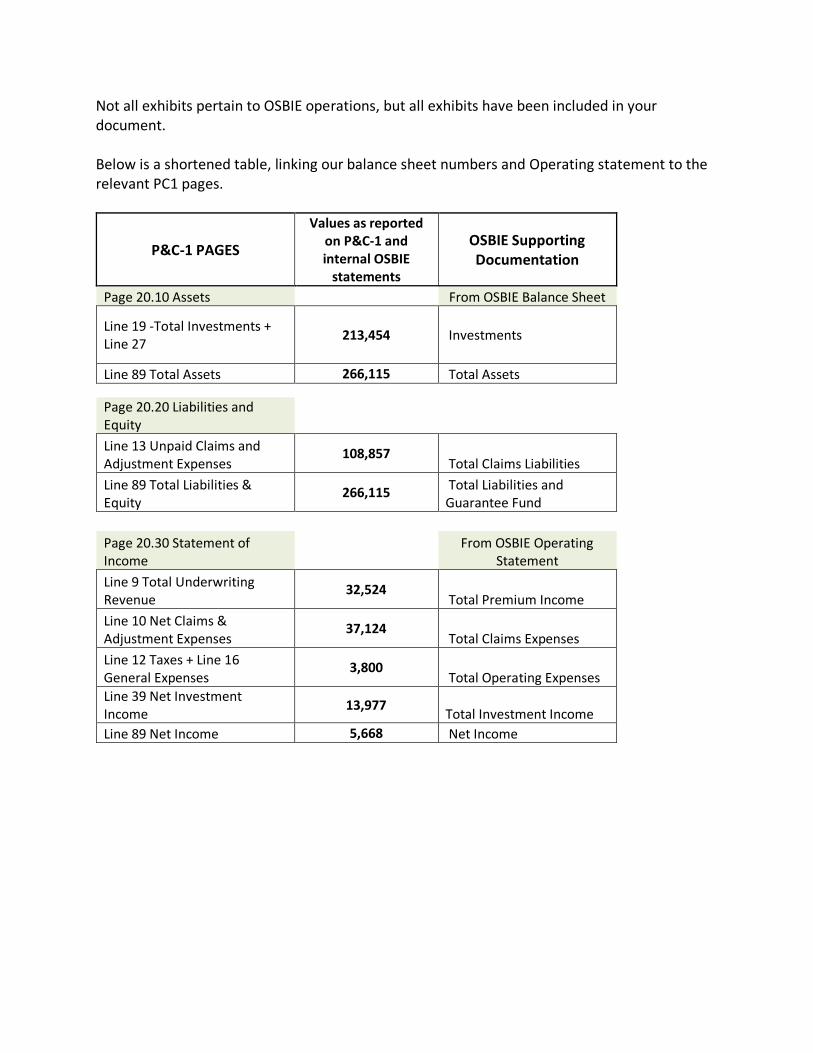
Not all exhibits pertain to OSBIE operations, but all exhibits have been included in your document. Below is a shortened table, linking our balance sheet numbers and Operating statement to the relevant PC1 pages.
P&C-1 PAGES
Values as reported on P&C-1 and internal OSBIE
statements
OSBIE Supporting Documentation
Page 20.10 Assets From OSBIE Balance Sheet
Line 19 -Total Investments + Line 27
213,454 Investments
Line 89 Total Assets 266,115 Total Assets
Page 20.20 Liabilities and Equity
Line 13 Unpaid Claims and Adjustment Expenses
108,857 Total Claims Liabilities
Line 89 Total Liabilities & Equity
266,115 Total Liabilities and Guarantee Fund
Page 20.30 Statement of Income
From OSBIE Operating Statement
Line 9 Total Underwriting Revenue
32,524 Total Premium Income
Line 10 Net Claims & Adjustment Expenses
37,124 Total Claims Expenses
Line 12 Taxes + Line 16 General Expenses
3,800 Total Operating Expenses
Line 39 Net Investment Income
13,977 Total Investment Income
Line 89 Net Income 5,668 Net Income

Ontario School Boards' Insurance Exchange 31/12/2020
Canadian/Foreign Insurer Date
01
(03)
02 Insurer Ontario School Boards' Insurance Exchange
03 Head Office Address 91 Westmount Rd.
04 GUELPH, ON N1H 5J2
05 Business Mailing Address (if different)/
06 (Chief Agency in Canada Address)
07 Telephone 519 767-2182
08 Fax 519 767 -0281
09 Website www.osbie.on.ca
10 Email Address [email protected]
20 Contact/Contact in Canada JIM H. SAMI
(other than Chief Agent)
21 Title CEO
22 Telephone 519-767-2182
23 Fax 519-767-0281
24 Email Address [email protected]
30 Officers as at (date of filing return) 2021-02-16
31 Chief Agent in Canada (branches only)
32 Citizenship
33 Address
34
36 President/Chief Executive Officer JIM H. SAMI
37 Citizenship CANADIAN
38 Address 50 Arkendo Dr.
39 OAKVILLE, ON L6J 5T9
41 Chief Financial Officer SANDRA TAYLOR
42 Citizenship CANADIAN
43 Address 136 TREMAINE RD
44 MILTON, ON L9T 2X3
51 Secretary
52 Citizenship
53 Address
54
61 External Auditor* KPMG LLP
62 Partner KIM HALEY
63 Address 115 KING ST. SOUTH, 2ND FLOOR
64 WATERLOO, ON N2J 5A3
65 Telephone 519-747-8856
66 Fax 519-747-8268
67 Email Address [email protected]
72 Actuary** RAUL MARTIN
77 Firm JSCP
73 Address 1500 DON MILLS RD
74 DON MILLS, ON M3B 3K4
75 Telephone 416-510-8360
76 Fax
78 Email Address [email protected]
** An Actuary's Report is required to be filed with the Annual Return.
10.10
*The Auditor Reports are required to be filed with the Annual Return. For Foreign Branches, the Auditor Reports are to be filed no later than May 31.
31/12/2020
ANNUAL SUPPLEMENT
for the year ended
(01)
P&C (2020)
Next page is 10.15

Ontario School Boards' Insurance Exchange 31/12/2020
Canadian Insurer Date
(01)
01 DIRECTORS as at 16/02/2021
(Date of filing return)
(03)
Chairperson of the Board
10 Name
11 Citizenship
12 Address
13
Chairperson of the Audit Committee
15 Name
16 Citizenship
17 Address
18
Chairperson of the Conduct Review Committee
20 Name
21 Citizenship
22 Address
23
25 Name Brian M. Coburn
26 Citizenship CANADIAN
27 Address 175 Woodbine Pl. Unit 104
28 OTTAWA, ON K1S 5M8
30 Name Cathy Modesto
31 Citizenship CANADIAN
32 Address 5111 Tilton Lake Rd.
33 SUDBURY, ON P3G 1P1
35 Name Craig Allan Young
36 Citizenship CANADIAN
37 Address 464 Aragon Rd.
38 Glenburnie, ON K0H 1S0
40 Name Amy Elizabeth Ann Janssens
41 Citizenship Canadian
42 Address 29300 Uncle Toms Rd
43 Dresden, ON N0P 1M0
45 Name James Peter Marshall
46 Citizenship CANADIAN
47 Address 22 Sandy Beach Mews
48 Dryden ON P8N 3J6
50 Name Lynn Schaule
51 Citizenship CANADIAN
52 Address 4087 Conc. 5, Adjala
53 Loretto, Ontario L0G 1L0
55 Name Isabel Teresa Grace
56 Citizenship Canadian
57 Address 1517 Westbrook Drive
58 Peterborough ON K9J 6R5
60 Name Jaspal Singh Gill
61 Citizenship Canadian
62 Address 58 Grouse Lane
63 Brampton, Ontario L6Y 5K9
64 Name
65 Citizenship
66 Address
67
10.15
* INSURERS PROVINCIALLY INCORPORATED
* Insurers incorporated in a provincial jurisdiction must file this page on a quarterly basis. Federally regulated insurers are required to
file this page with their 4th quarter filing.
10.15 Directors
(continued).docx
P&C (2020)
Next page is 10.17

Ontario School Boards' Insurance Exchange 31/12/2020
Canadian Insurer Date
RETURN AS AT:
01 31/12/2020
(Day, Month, Year)
List of different committees and of their members:
Please embed the most recent list of the various committees and their members and identify the person
acting as President (Chair) of each committee.
Committee Members Members Members
02 Audit Chris Arnew Lynn Schaule Jeff Pratt
Peter Marshall Cathy Modesto Brian Coburn
03 Marc Cantin Pearl Fong West Isabel Grace
Jaspal Gill Amy Janssens Craig Young
04 Kirsti Alaksa Peter Marshall
05 Governance
* Insurers incorporated in a provincial jurisdiction must file this page.
10.17
CORPORATE INFORMATION
* INSURERS PROVINCIALLY INCORPORATED
For professional orders, please provide information regarding directors and officers of the insurance fund, not of the professional order.
P&C (2020)
Next page is 10.20
10.20
Ontario School Boards' Insurance Exchange 31/12/2020
Canadian Insurer Year
Have there been any substantial changes in ownership since the date of (01)
filing the last Annual Return? 40 N Y/N
If yes, provide details:
Location Number of % of Voting Amount
(City) Shares Held Rights Paid
(02) (03) (04) (05)
61 0 0.00% 0
62 0 0.00% 0
63 0 0.00% 0
64 0 0.00% 0
65 0 0.00% 0
66 0 0.00% 0
67 0 0.00% 0
68 0 0.00% 0
69 0 0.00% 0
70 0 0.00% 0
71 0 0.00% 0
72 0 0.00% 0
73 0 0.00% 0
74 0 0.00% 0
75 0 0.00% 0
76 0 0.00% 0
77 0 0.00% 0
Total 89 0 0.00% 0
($'000)
Name
(01)
CONSOLIDATED
SHAREHOLDERS
Shareholders
10.20.docx
P&C (2020)
Next page is 10.30

10.30
Ontario School Boards' Insurance Exchange 31/12/2020
Canadian/Foreign Insurer Date
CORPORATE ORGANIZATION CHART*
* Insurers must embed their corporate organization chart on this tab.
Embed a chart showing the interrelationships between the insurer, its immediate and ultimate parent, and all other affiliated corporations (upstream
and downstream), identifying the percentage of beneficial ownership of each (see Section VI of the Annual Return Instructions).
Org. chart Dec
2020.pdf
P&C (2020)
Next page is 10.40

10.40
Ontario School Boards' Insurance Exchange 31/12/2020
Canadian/Foreign Insurer Date
OTHER INFORMATION
(01)
07 In which jurisdiction is your ultimate parent (companies) or Home Office (branches) domiciled? CA
10 Have there been any amendments to the instrument of incorporation/by-laws (04)
since the date of filing the last Annual Return? 10 N Y / N
If yes, please summarize: (01)
11
30 Indicate the name and percentage of ownership of each corporation in which the insurer held 10%
or more of the voting rights as at year-end.
If necessary, embed details on an additional page.
Percentage
(02) (03)
31 N Y / N
32 N Y / N
33 N Y / N
(04)
36 Are any of the insurer's licences / orders subject to any limitation? Y Y / N
If yes, please embed details.
Consolidated
NON CONSOLIDATED
(01)
Name
P&C (2020)
Next page is 10.41

Ontario School Boards' Insurance Exchange 31/12/2020
Canadian/Foreign Insurer Date
Net retention
Class of Insurance Policy limit Current Year Prior Year
(05) (01) (02) (03)
Property - Personal excluding Home and Product Warranty 03 0
- Home Warranty 04 0
- Product Warranty 05 0
- Commercial 07 53,960,000 200,000 5,000 5,000
Aircraft 10 0
Automobile:
Private Passenger - Liability 11 0
- Personal Accident 12 0
- Other 13 0
Other than Private Passenger - Liability 15 20,000 0 3,000
- Personal Accident 16 0
- Other 17 0 3,000
Boiler and Machinery excluding Equipment Warranty 32 5,000 5,000 0
- Equipment Warranty 33 0
Credit 34 0
Credit Protection 35 0
Fidelity 36 1,000 0
Hail 38 0
Legal Expense 40 500 50 50
Liability
- Comprehensive General Liability (with products) 50 27,000 0 5,000
- Comprehensive General Liability (without products) 51 0
- Cyber Liability 52 10,000 1,000 1,000
- Directors and Officers Liability 53 0
- Excess Liability 54 0
- Professional Liability 55 0
- Umbrella Liability 56 0
- Pollution Liability 57 0
- All other 58 0
Mortgage 62 0
Other Approved Products 63 0
Surety
- Contract Surety 60 0
- All Other Surety 61 0
Title 66 0
Marine 68 0
Accident and Sickness 70 0
Does the reporting on the liability class of insurance include information from other lines?
(01)
88 Property N Y / N
89 Auto Insurance N Y / N
Current Year
(02) (03)
What is the average rate used for discounting policyholder liabilities (%)? 90 2.9% 3.5%
What is the average duration of interest rate sensitive assets? 91 5.9 5.6
What is the average duration of policy liabilities 92 3.0 3.1
Number of automobiles insured under automobile insurance policies, as at year end: 79 1,948 1,791
Assessable Income information ($'000):
Accident and Sickness net premiums written in Ontario 85 0
Prior Year
CONSOLIDATED
10.41
OTHER INFORMATION (continued)
Total Insured Value
P&C (2020)
Next page is 10.42

Ontario School Boards' Insurance Exchange 31/12/2020
Canadian/Foreign Insurer Date
Counterparty Domicile Pledged/Lodged
as Collateral
Asset Type To Affiliates To
Unaffiliated
Entities
Brief Description of
the Encumbrance
(02) (03) (04) (05) (06)
Total 19 0 0
Market value of securities on loan 40
Market value of total collateral of securities on loan 45
20 Does the insurer have any significant dependencies not already disclosed in answer(s) (04)
to previous questions or in the Notes to Financial Statements? N Y / N
If yes, provide details (see Section VI of the Annual Return Instructions).
21
Counterparty Legal
Name
(01)
($'000)
10.42
CONSOLIDATED
ENCUMBERED ASSETS
Market Value ($'000)
($'000)
(03)
Current Period Prior Period
(02)
0
0
P&C (2020)
Next page is 10.43

10.43
Ontario School Boards' Insurance Exchange 31/12/2020
Canadian/Foreign Insurer Date
Provider Name Provider Head Office
Address
Location Where Services
Provided
Affiliated Providers Unaffiliated Provider Brief description of the
Service
(02) (03) (04) (05) (06) (07)
Total 09 0 0
(01)
CONSOLIDATED
OUTSOURCING AND SERVICE AGREEMENTS
Annual Fee/Cost of Service
Service Outsourced
P&C (2020)
Next page is 10.60

10.60
Ontario School Boards' Insurance Exchange 31/12/2020
Canadian/Foreign Insurer Date
SUMMARY OF SELECTED FINANCIAL DATA FOR FIVE YEARS
($'000)
2016 2017 2018 2019 2020
(Current)
(01) (02) (03) (04) (05)
OPERATIONS
Assets/Assets Vested in Trust 01 255,605 239,972 231,225 245,101 266,115
Liabilities 02 138,317 116,903 116,730 118,104 137,768
Adjusted Equity 04 117,288 123,069 114,495 126,997 128,347
Gross premiums written 05 42,837 31,585 30,911 31,079 34,397
Net premiums written 06 39,624 28,566 27,892 28,187 32,524
Net premiums earned 07 40,093 29,021 28,347 28,692 32,524
Gross claims incurred 08 29,302 14,727 21,439 30,956 40,039
PROFITABILITY
Claims ratio
- by year of account 30 51.65% 52.71% 74.87% 81.99% 114.14%
- by year of accident 31 56.49% 95.20% 67.65% 72.60% 88.63%
Expense ratio 33 9.32% 11.66% 12.16% 12.00% 11.68%
Underwriting income (loss) 35 15,647 10,340 3,678 1,953 -8,400
- as a % of net premiums earned 36 39.03% 35.63% 12.97% 6.81% -25.83%
Net investment income 42 13,078 6,438 8,482 9,069 13,977
43 0 0
45 32.62% 22.18% 29.92% 31.61% 42.97%
Investment yield 46 5.52% 2.74% 3.73% 3.96% 5.81%
Net income (loss) 47 29,076 16,990 12,413 11,355 5,668
Return on equity 48 26.88% 14.14% 10.45% 9.40% 4.44%
70 94,380 96,701 86,613 100,017 98,374
72 514.11% 468.88% 412.36% 472.85% 429.93%
74 300.00% 300.00% 300.00% 300.00%
CANADIAN INSURERS ONLY:
EQUITY
Dividends to shareholders 50 12,459 12,063 8,828 9,812 9,463
52 0 0 0 0
54 0 0 0 0
OTHER RATIOS
Adjusted Equity as a % of liabilities 60 84.80% 105.27% 98.09% 107.53% 93.16%
Gross risk ratio (line 05/line 04) 62 36.52% 25.66% 27.00% 24.47% 26.80%
Net risk ratio (line 06/line 04) 64 33.78% 23.21% 24.36% 22.20% 25.34%
66 0.00% 0.00% 0.00% 0.00% 0.00%
68 15.81% 11.18% 3.99% 1.22% -2.57%
FOREIGN INSURERS ONLY:
TOTAL WORLDWIDE BUSINESS
Currency: 19
Assets 20
Liabilities 21
Capital and surplus 22
Gross premiums written 23
Net premiums written 24
Underwriting income 25
Investment income (including realized capital gains) 26
Net Income after tax 27
(in the currency of the home jurisdiction, rounded to the nearest
thousand)
Share Capital and Contributed Surplus paid in during the year
Share Capital and Contributed Surplus redeemed during the year
Agents and brokers balances and amounts due from subsidiaries
and associates as a % of Adjusted Equity
Claims development as a % of Adjusted Equity
Net investment income (total) as a % of net premiums earned
[(line 42)/07] x 100
CONSOLIDATED
MINIMUM CAPITAL TEST/BRANCH ASSET ADEQUACY TESTExcess of Capital/Margin Available over Capital/Margin
Required
What is the company's/branch's internal target capital ratio (%)?
Capital/Margin Available as % of Capital/Margin Required
Overlay approach adjustment for financial instruments (Reclass
from P&L to OCI)
P&C (2020)
Next page is 20.10

20.10
Ontario School Boards' Insurance Exchange 31/12/2020
Canadian/Foreign Insurer Date
Reference
Page
FS Notes
Reference
Total Vested in
Trust*
Total Vested in
Trust*
Total Vested in
Trust*
(01) (02) (03) (04) (05) (06)
Cash and Cash Equivalents 01 41,635 38,135
Investment Income due and accrued 02 1,053 1,242
Assets held for sale 50 0
Investments:
40.12 Short Term Investments 04 11,000
40.22 Bonds and Debentures 05 157,622 138,448
40.32 Mortgage Loans 06 0
40.42 Preferred Shares 07 40,039 38,572
40.52 Common Shares 08 15,324 12,195
40.70 Investment Properties 09 0
40.80 Other Loans and Invested Assets 10 0
40.07 Total Investments (lines 04 to 10) 19 212,985 200,215 0
Receivables:
50.20 Unaffiliated Agents and Brokers 20 0 0
Policyholders 21 50 625
Instalment Premiums 22 0
Other Insurers 23 139 231
Facility Association and the "P.R.R." 24 0
50.40 Subsidiaries, Associates & Joint Ventures 25 0 0
50.20 Other Receivables 27 469 482
Recoverable from Reinsurers:
60.10 Unearned Premiums 30 0 505
60.30 Unpaid Claims and Adjustment Expenses 31 2,943 153
Other Recoverables on Unpaid Claims 37 5,863 2,526
Investments Accounted for Using the Equity Method:
50.32 40 0 0
Pooled Funds 45 0
40.70 Property and Equipment 41 567 587
Deferred Policy Acquisition Expenses 43 0
Current Tax Assets ` 52 0
Deferred Tax Assets 44 0
Goodwill 54 0
Intangible Assets 56 156 155
Defined Benefit Pension Plan 58 0
Other Assets 88 255 245
TOTAL ASSETS 89 266,115 245,101 0
* Foreign insurers: Excludes deposits of reinsurers held in special trust accounts.
Interests in Subsidiaries, Associates & Joint Ventures
CONSOLIDATED FINANCIAL STATEMENTS
ASSETS
($'000)
Opening Prior Period RestatedPrior PeriodCurrent Period
P&C (2020)
Next page is 20.20

20.20
Ontario School Boards' Insurance Exchange 31/12/2020
Canadian/Foreign Insurer Date
($'000)
(01) (03) (05)
LIABILITIES
Overdrafts 01 0
Borrowed Money and Accrued Interest 02 0
Payables:
50.20 Agents and Brokers 03 0 0
Policyholders 04 0
50.30 Other Insurers 05 3 2
50.40 Subsidiaries, Associates & Joint Ventures/Affiliates 06 0 0
Expenses due and accrued 07 1,600 3,899
Other Taxes due and accrued 09 2,086 1,429
Policyholder Dividends and Rating Adjustments 10 0
40.70 Encumbrances on Real Estate 11 0 0
60.10 Unearned Premiums 12 0 0
60.30 Unpaid Claims and Adjustment Expenses 13 108,857 93,992
80.10 Unearned Commissions 14 0 0
Ceded Deferred Premium Taxes 20 0
Ceded Deferred Insurance Operations Expenses 34 0
Premium Deficiency 15 0 0
Liabilities held for sale 17 0
Current Tax Liabilities 18 0
Deferred Tax Liabilities 21 0
Self-Insured Retention (SIR) portion of unpaid claims 22 0
Defined Benefit Pension Plan 23 0
Employment Benefits (not including amounts on line 23 above) 24 0
Subordinated Debt 25 0
Preferred Shares - Debt 26 0
Provisions and Other Liabilities 28 25,222 18,782
Total Liabilities 29 137,768 118,104 0
CANADIAN INSURERS ONLY:
EQUITY
Shares issued and paid
Common 41 0
Preferred 33 0
Contributed Surplus 42 50 50
(Specify) 43 0
20.54 Retained Earnings 44 117,955 121,750
20.45 Reserves 45 0 0
20.42 Accumulated Other Comprehensive Income (Loss) 47 10,342 5,197
Total Policyholders/Shareholders' Equity 59 128,347 126,997 0
Non-controlling Interests 48 0 0
Total Equity 49 128,347 126,997 0
TOTAL LIABILITIES AND EQUITY 89 266,115 245,101 0
FOREIGN INSURERS ONLY:
HEAD OFFICE ACCOUNT, RESERVES & AOCI
20.45 Head Office Account 51
(Specify) 53
20.45 Reserves 55
20.42 Accumulated Other Comprehensive Income (Loss) 56
69
79 TOTAL LIABILITIES, HEAD OFFICE ACCOUNT, RESERVES & AOCI
Reference
Page
LIABILITIES, EQUITY, HEAD OFFICE ACCOUNT, RESERVES & AOCI
CONSOLIDATED FINANCIAL STATEMENTS
FS Notes
Reference
Opening Prior
Period Restated
Current Period Prior Period
(55)
Total Head Office Account, Reserves & AOCI
P&C (2020)
Next page is 20.30

20.30
Ontario School Boards' Insurance Exchange 31/12/2020
Canadian/Foreign Insurer Date
STATEMENT OF INCOME
($'000)
Reference Page FS Notes
Reference
(01) (03)
UNDERWRITING OPERATIONS
Premiums Written
Direct 01 34,397 31,079
70.21 Reinsurance Assumed 02 0 0
70.21 Reinsurance Ceded 03 1,873 2,892
60.20 Net Premiums Written 04 32,524 28,187
Decrease (increase) in Net Unearned Premiums 05 0 505
60.20 Net Premiums Earned 06 32,524 28,692
Service Charges 07 0
Other 08 0
Total Underwriting Revenue 09 32,524 28,692
Gross Claims and Adjustment Expenses 62 40,039 30,956
Reinsurers' share of claims and adjustment expenses 64 2,915 7,661
60.20 Net Claims and Adjustment Expenses 10 37,124 23,295
Acquisition Expenses
80.10 Gross Commissions 66 0 0
80.10 Ceded Commissions 68 0 0
Taxes 12 786 663
80.20 Other 14 0 0
80.20 General Expenses 16 3,014 2,781
Total Claims and Expenses 19 40,924 26,739
Premium Deficiency Adjustments 20 0
Underwriting Income (Loss) 29 -8,400 1,953
40.07 INVESTMENT OPERATIONS
Income 32 10,121 8,679
35 0 0
Realized Gains (Losses) 33 4,117 670
Expenses 34 261 280
Net Investment Income 39 13,977 9,069
OTHER REVENUE AND EXPENSES (04)
Income (Loss) from Ancillary Operations
(net of Expenses of $'000 ) 40 0
41 0
48 0
47 0
42 0
Other Revenues 44 91 333
Finance costs 45 0
Other Expenses 46 0
Net Income (Loss) before Income Taxes 49 5,668 11,355
INCOME TAXES
Current 50 0
Deferred 51 0
Total Income Taxes 59 0 0
NET INCOME (LOSS) FOR THE YEAR 89 5,668 11,355
ATTRIBUTABLE TO:
Non-controlling Interests 80 0
Equity Holders 82 5,668 11,355
Gain (Losses) from fluctuations in Foreign Exchange Rates
CONSOLIDATED FINANCIAL STATEMENTS
Current Period Prior Period
Gains (Losses) from FVO or FVTPL
Share of Net Income (Loss) of Pooled Funds using Equity Method
Share of Net Income (Loss) of Subsidiaries, Associates & Joint Ventures
Overlay approach adjustment for financial instruments (Reclass from P&L to OCI)
P&C (2020)
Next page is 20.42

20.42
Ontario School Boards' Insurance Exchange 31/12/2020
Canadian/Foreign Insurer Date
COMPREHENSIVE INCOME (LOSS)
and
ACCUMULATED OTHER COMPREHENSIVE INCOME (LOSS)
($'000)
(01) (03)
Comprehensive Income (Loss)
20.30 Net Income 01 5,668 11,355
Other Comprehensive Income (Loss):
Items that may be reclassified subsequently to Net Income:
FVOCI:
Change in Unrealized Gains and Losses:
- Loans 02 0
- Bonds and Debentures 03 9,714 10,009
- Equities (IAS 39) 04 1,773 2,561
Reclassification of (Gains) Losses to Net Income 05 -6,342 -1,610
Overlay approach
Unrealized Gains and Losses 15 0
Reclassification of (Gains) Losses from Net Income 16 0
Change in Unrealized Gains and Losses 06 0
Reclassification of (Gains) Losses to Net Income 07 0
Foreign Currency Translation
Change in Unrealized Gains and Losses 08 0
Impact of Hedging 09 0
14 0
18 0
Subtotal of items that may be reclassified subsequently to Net Income 19 5,145 10,960
Items that will not be reclassified subsequently to Net Income:
FVOCI:
Change in Unrealized Gains and Losses:
- Equities (IFRS 9) 25 0
31 0
Share of Other Comprehensive Income of Subsidiaries,
Associates & Joint Ventures 11 0
Remeasurements of Defined Benefit Plans 34 0
Other 12 0
Subtotal of items that will not be reclassified subsequently to Net Income 29 0 0
Total Other Comprehensive Income (Loss) 21 5,145 10,960
Total Comprehensive Income (Loss) 39 10,813 22,315
Attributable to:
Non-controlling Interests 60 0
Equity Holders 62 10,813 22,315
(01) (03)
Accumulated Other Comprehensive Income (Loss)
Accumulated Gains (Losses) on:
Items that may be reclassified subsequently to Net Income:
FVOCI:
- Loans 42 0
- Bonds and Debentures 43 11,257 8,171
- Equities (IAS 39) 44 -915 -2,974
Overlay approach 55 0
45 0
Foreign Currency (net of hedging activities) 46 0
52 0
Other 68 0
Subtotal of items that may be reclassified subsequently to Net Income 69 10,342 5,197
Items that will not be reclassified subsequently to Net Income:
FVOCI:
- Equities (IFRS 9) 65 0
Revaluation Surplus 71 0
Share of Other Comprehensive Income of Subsidiaries,
Associates & Joint Ventures 51 0
Remeasurements of Defined Benefit Plans 74 0
Other 49 0
79 0 0
20.20 Balance at end of Year 59 10,342 5,197
Subtotal of items that will not be reclassified subsequently to Net Income
CONSOLIDATED FINANCIAL STATEMENTS
Revaluation Surplus
FS Notes
Reference
Reference
Page
Current Period Prior Period
Current Period Prior Period
Share of Other Comprehensive Income of Subsidiaries, Associates & Joint
Ventures (may be reclassified)
Share of Other Comprehensive Income of Subsidiaries, Associates & Joint
Ventures (may be reclassified)
Other
Change in Unrealized Gains and Losses related to overlay approach for financial
instruments
Derivatives Designated as Cash Flow Hedges
Derivatives Designated as Cash Flow Hedges
P&C (2020)
Next page is 20.45

Ontario School Boards' Insurance Exchange 31/12/2020
Canadian/Foreign Insurer Date
(01) (02)
Balance at beginning of year 01
Prior period adjustments: 02
(Specify) 04
Adjusted balance at beginning of year 09
20.30 Net income (loss) for the year 10
Transfers from (to) Head Office
Advances (Returns) 20
Expenses 21
Premiums/Claims 22
Other 23
Subtotal 11
Decrease (increase) in Reserves 12
Net increase (decrease) in Head Office Account 15
Balance at end of Year 89
(01) (02)
Earthquake Reserves
Reserve Complement 90 0
Premium Reserve 91 0
Mortgage Reserve 95 0
Nuclear Reserve 96 0
General and Contingency Reserves 98 0
Total Reserves 99 0 0
20.45
HEAD OFFICE ACCOUNT (Foreign Insurers)
FS Notes
Reference
Reference Page
Reference Page FS Notes
Reference
CONSOLIDATED FINANCIAL STATEMENTS
RESERVES
($'000)
Current Period Prior Period
Current Period Prior Period
($'000)
P&C (2020)
Next page is 20.52
Ontario School Boards' Insurance Exchange 31/12/2020
Canadian/Foreign Insurer Date
STATEMENT OF CASH FLOWS *
($'000)
* Insurers must embed a Statement of Cash Flows as prepared for the insurer's Annual Return
financial statements on this tab.
20.52
CONSOLIDATED FINANCIAL STATEMENTS
P&C (2020)
Next page is 20.54

Ontario School Boards' Insurance Exchange 31/12/2020
Canadian Insurer Date
Share Capital Other Capital Contributed
Surplus
Retained
Earnings
Reserves Revaluation Surplus Total Equity
(01) (13) (21) (03) (23) (07) (09) (05) (11) (25) (27) (31) (15) (17) (19)
Balance at Beginning of Prior Year 01 0 0 50 120,207 0 -5,762 0 0 0 0 0 0 114,495 0 114,495
Total Comprehensive Income for the year 09 0 0 0 11,355 0 10,959 0 0 0 0 0 0 22,314 0 22,314
Issue of Share Capital 02 0 0 0 0 0 0 0 0 0 0 0 0 0 0 0
15 0 0 0 0 0 0 0 0 0 0 0 0 0 0 0
Decrease/increase in Reserves 13 0 0 0 0 0 0 0 0 0 0 0 0 0 0 0
Dividends
Preferred 17 0 0 0 0 0 0 0 0 0 0 0 0 0 0 0
Common 18 0 0 0 9,812 0 0 0 0 0 0 0 0 9,812 0 9,812
Other 16 0 0 0 0 0 0 0 0 0 0 0 0 0 0 0
Balance at End of Prior Year 19 0 0 50 121,750 0 5,197 0 0 0 0 0 0 126,997 0 126,997
Changes in Equity for Current Year
Total Comprehensive Income for the year 29 5,668 5,145 10,813 10,813
Issue of Share Capital 22 0 0
35 0 0
Decrease/increase in Reserves 33 0 0
Dividends
Preferred 37 0 0
Common 38 9,463 9,463 9,463
Other 36 0 0
Balance at End of Current Year 39 0 0 50 117,955 0 10,342 0 0 0 0 0 0 128,347 0 128,347
FVOCI Financial
Assets
Transfer from/to Retained Earnings
Transfer from/to Retained Earnings
Other AOCI
20.54
CONSOLIDATED FINANCIAL STATEMENTS
STATEMENT OF CHANGES IN EQUITY
($'000)
Accumulated Other Comprehensive Income (Loss)
Share of OCI of
Associates & Joint
Ventures
Remeasurements
of Defined Benefit
Plans
Total
Policyholders/
Shareholder's
Equity
Translation of
Foreign Operations
Non-controlling
Interests
Cash Flow
Hedges
P&C (2020)
Next page is 20.60

20.60
Ontario School Boards' Insurance Exchange 31/12/2020
Canadian/Foreign Insurer Date
NOTES TO FINANCIAL STATEMENTS
See Section VI of the Annual Return Instructions
Insurers must embed their notes to the financial statements on this tab.
CONSOLIDATED
P&C (2020)
Next page is 20.70
20.70
Ontario School Boards' Insurance Exchange 31/12/2020
Canadian/Foreign Insurer Date
CONSOLIDATED
All provincially incorporated insurers and insurers licensed in a provincial jurisdiction requiring a copy of
the Auditor's Report must embed the Auditor's Report on this tab.
For OSFI purposes, federally regulated insurers must file their Auditor Reports as a separate documents as
defined in the Regulatory Reporting System (RRS) User Guide.
AUDITOR'S REPORT
P&C (2020)
Next page is 20.80
20.80
Ontario School Boards' Insurance Exchange 31/12/2020
Canadian/Foreign Insurer Date
APPOINTED ACTUARY'S REPORT
CONSOLIDATED
For the exact wording for the Expression of Opinion, please refer to the Memorandum to the
Appointed Actuary (P&C Insurance).
All provincially incorporated insurers and insurers licensed in a provincial jurisdiction requiring a copy of
the Appointed Actuary's Report must embed the Appointed Actuary's Report on this tab.
For OSFI purposes, federally regulated insurers are required to file the Appointed Actuary's Report as a
separate document as defined in the Regulatory Reporting System (RRS) User Guide.
P&C (2020)
Next page is 30.61

Ontario School Boards' Insurance Exchange 31/12/2020
Canadian/Foreign Insurer Date1
(01)
Capital Available:
Capital available (from page 30.62 - capital available) 01 128,191
(Specify) 08
Total Capital Available 09 128,191
Assets Available:
Net Assets Available (from page 30.92 - net assets available) 11
(Specify) 18
Total Net Assets Available 19
Capital (Margin) Required at Target:
Insurance Risk:
Premium liabilities 20 2,557
Unpaid claims 22 19,844
Catastrophes 24 0
Margin required for reinsurance ceded to unregistered insurers 26 0
Subtotal: Insurance risk margin 29 22,401
Market Risk:
Interest rate risk 30 9,339
Foreign exchange risk 32 100
Equity risk 34 4,597
Real estate risk 36 82
Other market risk exposures 38 0
Subtotal: Market risk margin 39 14,118
Credit Risk:
Counterparty default risk for balance sheet assets 40 9,550
Counterparty default risk for off-balance sheet exposures 42 0
Counterparty default risk for unregistered reinsurance collateral and SIRs 44 0
Subtotal: Credit risk margin 49 9,550
Operational risk margin 50 4,823
Less: Diversification credit 52 6,167
Total Capital (Margin) Required at Target 59 44,725
Minimum Capital (Margin) Required (line 59 / 1.5) 60 29,817
(Specify) 68
Total Minimum Capital (Margin) Required 69 29,817
Excess Capital (Net Assets Available) over Minimum Capital (Margin) Required 79 98,374
MCT (BAAT) Ratio (Line 09 or line 19 as a % of line 69) 90 429.93%
Note: See Section VI of the P&C instructions and the MCT Guideline.
(55)
30.61
CONSOLIDATED
MINIMUM CAPITAL TEST/BRANCH ADEQUACY OF ASSETS TEST: CAPITAL (MARGIN) REQUIRED AND MCT (BAAT) RATIO
($'000)
Current Period
P&C (2020)
Next page is 30.62
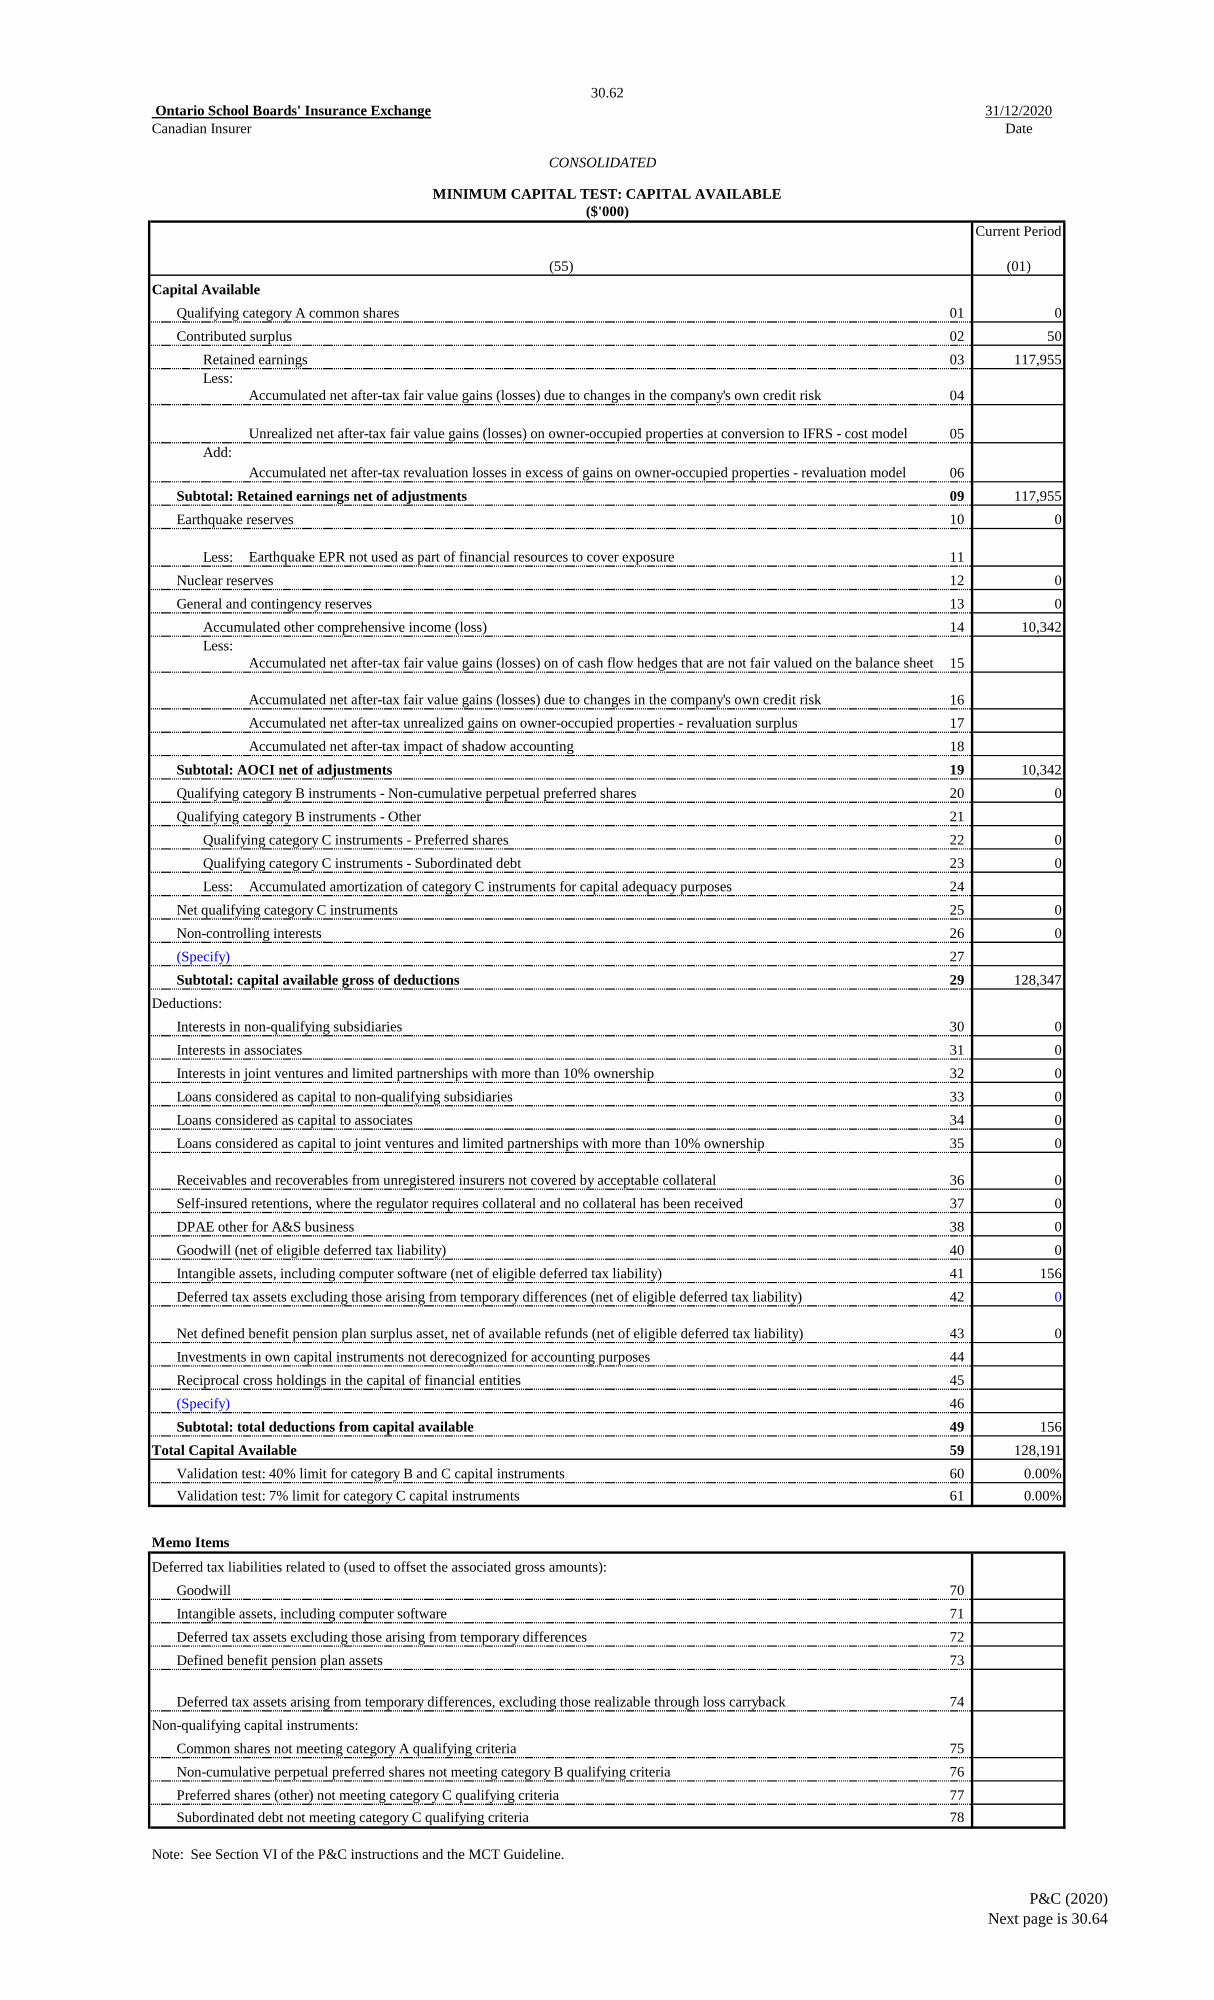
Ontario School Boards' Insurance Exchange 31/12/2020
Canadian Insurer Date1
MINIMUM CAPITAL TEST: CAPITAL AVAILABLE
($'000)
(01)
Capital Available
Qualifying category A common shares 01 0
Contributed surplus 02 50
Retained earnings 03 117,955
Less:
Accumulated net after-tax fair value gains (losses) due to changes in the company's own credit risk 04
Unrealized net after-tax fair value gains (losses) on owner-occupied properties at conversion to IFRS - cost model 05
Add:
Accumulated net after-tax revaluation losses in excess of gains on owner-occupied properties - revaluation model 06
Subtotal: Retained earnings net of adjustments 09 117,955
Earthquake reserves 10 0
Less: Earthquake EPR not used as part of financial resources to cover exposure 11
Nuclear reserves 12 0
General and contingency reserves 13 0
Accumulated other comprehensive income (loss) 14 10,342
Less:
Accumulated net after-tax fair value gains (losses) on of cash flow hedges that are not fair valued on the balance sheet 15
Accumulated net after-tax fair value gains (losses) due to changes in the company's own credit risk 16
Accumulated net after-tax unrealized gains on owner-occupied properties - revaluation surplus 17
Accumulated net after-tax impact of shadow accounting 18
Subtotal: AOCI net of adjustments 19 10,342
Qualifying category B instruments - Non-cumulative perpetual preferred shares 20 0
Qualifying category B instruments - Other 21
Qualifying category C instruments - Preferred shares 22 0
Qualifying category C instruments - Subordinated debt 23 0
Less: Accumulated amortization of category C instruments for capital adequacy purposes 24
Net qualifying category C instruments 25 0
Non-controlling interests 26 0
(Specify) 27
Subtotal: capital available gross of deductions 29 128,347
Deductions:
Interests in non-qualifying subsidiaries 30 0
Interests in associates 31 0
Interests in joint ventures and limited partnerships with more than 10% ownership 32 0
Loans considered as capital to non-qualifying subsidiaries 33 0
Loans considered as capital to associates 34 0
Loans considered as capital to joint ventures and limited partnerships with more than 10% ownership 35 0
36 0
Self-insured retentions, where the regulator requires collateral and no collateral has been received 37 0
DPAE other for A&S business 38 0
Goodwill (net of eligible deferred tax liability) 40 0
Intangible assets, including computer software (net of eligible deferred tax liability) 41 156
Deferred tax assets excluding those arising from temporary differences (net of eligible deferred tax liability) 42 0
43 0
Investments in own capital instruments not derecognized for accounting purposes 44
Reciprocal cross holdings in the capital of financial entities 45
(Specify) 46
Subtotal: total deductions from capital available 49 156
Total Capital Available 59 128,191
Validation test: 40% limit for category B and C capital instruments 60 0.00%
Validation test: 7% limit for category C capital instruments 61 0.00%
Memo Items
Deferred tax liabilities related to (used to offset the associated gross amounts):
Goodwill 70
Intangible assets, including computer software 71
Deferred tax assets excluding those arising from temporary differences 72
Defined benefit pension plan assets 73
74
Non-qualifying capital instruments:
Common shares not meeting category A qualifying criteria 75
Non-cumulative perpetual preferred shares not meeting category B qualifying criteria 76
Preferred shares (other) not meeting category C qualifying criteria 77
Subordinated debt not meeting category C qualifying criteria 78
Note: See Section VI of the P&C instructions and the MCT Guideline.
Net defined benefit pension plan surplus asset, net of available refunds (net of eligible deferred tax liability)
Deferred tax assets arising from temporary differences, excluding those realizable through loss carryback
30.62
CONSOLIDATED
Current Period
(55)
Receivables and recoverables from unregistered insurers not covered by acceptable collateral
P&C (2020)
Next page is 30.64

Ontario School Boards' Insurance Exchange 31/12/2020
Canadian/Foreign Insurer Date
1
(02) (04) (06) (08) (10) (12) (14) (16) (18) (20) (22) (29)
Personal Property, excluding Home and Product Warranty 03 0 0 15.00% 0 0 0 0 20.00% 0
- Home Warranty 04 0 0 15.00% 0 0 0 0 20.00% 0
- Product Warranty 05 0 0 15.00% 0 0 0 0 20.00% 0
Subtotal - Personal 06 0 0 0 0 0 0 0 0 0 0
Commercial Property 07 10,447 382 10,065 10.00% 1,007 0 9,901 2,970 20.00% 594
Aircraft 10 0 0 20.00% 0 0 0 0 25.00% 0
Automobile - Liability 19 921 111 810 10.00% 81 0 404 121 15.00% 18
Automobile - Personal Accident 20 0 0 10.00% 0 0 149 45 15.00% 7
Automobile - Other 21 23 23 15.00% 3 0 396 119 20.00% 24
32 -18 3 -21 15.00% -3 0 793 238 20.00% 48
- Equipment Warranty 33 0 0 15.00% 0 0 0 0 20.00% 0
Credit 34 0 0 20.00% 0 0 0 0 25.00% 0
Credit Protection 35 0 0 20.00% 0 0 0 0 25.00% 0
Fidelity 36 145 5 140 20.00% 28 0 905 272 25.00% 68
Hail 38 0 0 20.00% 0 0 0 0 25.00% 0
Legal Expense 40 1,004 75 929 25.00% 232 0 1,013 304 30.00% 91
Liability
- Comprehensive General Liability (with products) 50 87,479 13,546 73,933 25.00% 18,483 0 18,695 5,609 30.00% 1,683
- Comprehensive General Liability (without products) 51 0 0 25.00% 0 0 0 0 30.00% 0
- Cyber Liability 52 50 50 25.00% 13 0 268 80 30.00% 24
- Directors and Officers Liability 53 0 0 25.00% 0 0 0 0 30.00% 0
- Excess Liability 54 0 0 25.00% 0 0 0 0 30.00% 0
- Professional Liability 55 0 0 25.00% 0 0 0 0 30.00% 0
- Umbrella Liability 56 0 0 25.00% 0 0 0 0 30.00% 0
- Pollution Liability 57 0 0 25.00% 0 0 0 0 30.00% 0
- All other 58 0 0 25.00% 0 0 0 0 30.00% 0
Liability - total 59 87,529 13,546 73,983 18,496 0 0 0 18,963 5,689 1,707
Other Approved Products 63 0 0 20.00% 0 0 0 0 25.00% 0
Surety
- Contract Surety 60 0 0 20.00% 0 0 0 0 25.00% 0
- All Other Surety 61 0 0 20.00% 0 0 0 0 25.00% 0
Surety - total 64 0 0 0 0 0 0 0 0 0 0
Title 66 0 0 15.00% 0 0 0 0 20.00% 0
Marine 68 0 0 20.00% 0 0 0 0 25.00% 0
Accident and Sickness 70 0 0
Total 89 100,051 14,122 85,929 19,844 0 0 0 32,524 2,557
Note: See Section VI of the P&C instructions and the MCT Guideline.
30.64
CONSOLIDATED
MCT (BAAT) INSURANCE RISK: CAPITAL (MARGIN) REQUIRED FOR UNPAID CLAIMS AND PREMIUM LIABILITIES
($'000)
Class of insurance
Unpaid Claims Margin Premium Liabilities Margin
Capital (margin)
required for
premium liabilities
Greater of net premium
liabilities net of PfADs
and 30% net written
premiums
Net written
premiums
(past 12 m)
Risk
factor
Net premium
liabilities net of
PfADs
PfADs
(premium
liabilities)
Net premium
liabilities
Capital (margin)
required for
unpaid claims
Boiler & Machinery, excluding Equipment Warranty
Risk
factor
Net unpaid claims
discounted, net of
PfADs
PfADs (claims)Net unpaid claims
discounted
P&C (2020)
Next page is 30.65

30.65
Ontario School Boards' Insurance Exchange 31/12/2020
Canadian/Foreign Insurer Date
CONSOLIDATED
MCT (BAAT) INSURANCE RISK: CAPITAL (MARGIN) REQUIRED FOR ACCIDENT AND SICKNESS BUSINESS
($000)
Annual Earned
premiums
Risk factor Capital
(margin)
required for
premiums
PfADs
(premium
liabilities)
Expected
Claims Loss
Ratio
(%)
(01) (03) (05) (07) (09)
Disability Income Insurance
- Individually underwritten - length of premium guarantee remaining:
< 1 year 01 15.00% 0
1 - 5 years 02 25.00% 0
> 5 years 03 37.50% 0
- Other - length of premium guarantee remaining:
< 1 year 04 15.00% 0
1 - 5 years 05 31.25% 0
> 5 years 06 50.00% 0
Accidental Death and Dismemberment
- Participating 10 Note
- Non-Participating - Individual 11 Note
- Non-Participating - Group 12 Note
Other Accident and Sickness Benefits
- Individual travel insurance 20 15.00% 0
- Group travel insurance 21 15.00% 0
- Group medical 22 15.00% 0
- Group dental 23 15.00% 0
- Long-term care insurance 24 15.00% 0
- Critical illness insurance 25 15.00% 0
- Waiver of premium 26 15.00% 0
- Credit insurance 27 15.00% 0
- Other A&S 28 15.00% 0
Deferred Policy Acquisition Expenses Commissions (balance sheet value) 29 45.00% 0
Total Premiums Margin 39 0
Unpaid Claims
Relating to
Prior Years Risk factor
Capital
(Margin)
Required for
unpaid claims PfADs (claims)
(21) (23) (25) (27)
Disability Income Insurance
- Duration of Disability < 2 years - Length of benefit period remaining:
< 1 year 50 5.000% 0
1 - 2 years 51 7.500% 0
> 2 years 52 10.000% 0
- Duration of Disability 2 - 5 years - Length of benefit period remaining:
< 1 year 53 3.750% 0
1 - 2 years 54 5.625% 0
> 2 years 55 7.500% 0
- Duration of Disability > 5 years - Length of benefit period remaining:
< 1 year 56 2.500% 0
1 - 2 years 57 3.750% 0
> 2 years 58 5.000% 0
Accidental Death and Dismemberment
- Participating 60 Note
- Non-Participating - Individual 61 Note
- Non-Participating - Group 62 Note
Other Accident and Sickness Benefits
- Individual travel insurance 70 12.500% 0
- Group travel insurance 71 12.500% 0
- Group medical 72 12.500% 0
- Group dental 73 12.500% 0
- Long-term care insurance 74 12.500% 0
- Critical illness insurance 75 12.500% 0
- Waiver of premium 76 12.500% 0
- Credit insurance 77 12.500% 0
- Other A&S 78 12.500% 0
Other adjustments 79
Total Unpaid Claims Margin 89 0
Note: See Section VI of the P&C instructions and the MCT Guideline.
Unpaid Claims Margin
Premiums Margin
P&C (2020)
Next page is 30.66

Ontario School Boards' Insurance Exchange 31/12/2020
Canadian/Foreign Insurer Date
1
Fair value
(55) (01) (02) (03) (04)
Interest rate sensitive assets:
Term deposits 01 0 0
Bonds and debentures 02 156,457 5.93 11,597 -11,597
Commercial paper 03 0 0
Loans 04 0 0
Mortgages 05 0 0
MBS and ABS 06 0 0
Preferred shares 07 40,039 2.91 1,456 -1,456
Other (specify) 08 0 0
Total interest rate sensitive assets 09 196,496 13,053 -13,053
Interest rate sensitive liabilities:
Net unpaid claims and adjustment expenses 10 100,051 2.97 3,714 -3,714
Net premium liabilities 11 0 0
Other as approved by the regulator 12 0 0
Total interest rate sensitive liabilities 19 100,051 3,714 -3,714
Notional value Dollar fair value Δy Dollar fair value -Δy
Allowable interest rate derivatives: (05) (06) (07)
Long positions 20
Short positions 21
Total allowable interest rate derivatives 29 0 0
Capital required for Δy shock increase 30 9,339
Capital required for Δy shock decrease 31 0
Total interest rate risk margin 39 9,339
Note: Δy = 1.25%
(55) (10) (12) (14) (16)
U.S. Dollar 40 995 995
Euro 41 0
U.K. Pound 42 0
Swiss Franc 43 0
Danish Krone 44 0
Swedish Krona 45 0
Australian Dollar 46 0
Hong Kong Dollar 47 0
Singapore Dollar 48 0
Japanese Yen 50 0
China Yuan Renminbi 51 0
Chilian Peso 52 0
Indian Rupee 53 0
Other (specify) 54 0
Total net position 59 995 0 995 0
Net exposure = MAX (Total net open long positions, Absolute value of total net open short positions) 60 995
Total foreign exchange risk margin 69 100
Notes:
1 Enter long positions as positive.
2 A carve-out short position of 25% of liabilities denominated in each currency, converted in CAD.
3 Enter short positions as negative (no carve-out on short positions).
Exposure amount
Instruments NOT used as part of an equity hedging strategy: (21) (22) (29)
Long common shares 70 15,324 30.00% 4,597
Long equity derivatives 72 0 30.00% 0
Joint ventures and limited partnerships with less than or equal to 10%
ownership interest 71 0 30.00% 0
Short common shares and equity derivatives 73 30.00% 0
Total of instruments NOT used as part of an equity hedging strategy 74 4,597
Exposure amount Exposure amount of
the portfolio of
hedging instruments
Net exposure amount:
Absolute value of ((21)-
(23))
Risk factor Correlation
factor
Capital (Margin) Required
(22)×(25) + MIN((21), (23))
× (1-(27)) × 1.5
Instruments used as part of an equity hedging strategy: (21) (23) (25) (22) (27) (29)Portfolio of instruments being hedged - active management and hedging
strategy #1 75 0 30.00% 0
Portfolio of instruments being hedged - active management and hedging
strategy #2 76 0 30.00% 0
Portfolio of instruments being hedged - active management and hedging
strategy #3 77 0 30.00% 0
Total of instruments used as part of an equity hedging strategy 78 0
Total equity risk margin 79 4,597
Balance Sheet Value Risk factor
(20) (22) (29)
Investment properties 80 0 20.00% 0
Owner-occupied properties (valued using cost model) 81 818 10.00% 82
Total real estate risk margin 89 818 82
Balance Sheet Value Risk factor
(20) (22) (29)
Equipment 90 0 10.00% 0
Other (specify) 91 0 10.00% 0
Total other market risk exposures margin 99 0 0
Note: See Section VI of the P&C instructions and the MCT Guideline.
30.66
CONSOLIDATED
MCT (BAAT) MARKET RISK CAPITAL (MARGIN) REQUIREMENTS
($'000)
Net open long position in
CAD, less carve-out
Net open short position ³
in CAD
Net open long position ¹ in
CAD, before carve-out
Carve-out ² in CAD
Capital (Margin) Required for Foreign Exchange Risk
Modified or effective
duration
Dollar fair value change
(01)x(02)xΔy
Dollar fair value change
(01)x(02)x(-Δy)
Capital (Margin) Required for Interest Rate Risk
(55)
Capital (Margin) Required for Equity Risk
Capital (Margin) Required
(21)x(22)
Risk factor
Capital (Margin)
Required
(21)x(22)
Capital (Margin)
Required
(21)x(22)
Capital (Margin) Required for Real Estate
Capital (Margin) Required for Other Market Risk Exposures
P&C (2020)
Next page is 30.71

Ontario School Boards' Insurance Exchange 31/12/2020
Canadian Insurer
1
(01) (02) (04) (05) (03)
Cash held on premises 01 0.00% 0 0
Cash other 08 0.25% 41,635 41,635 104
Investment Income Due and Accrued 02 2.50% 1,053 1,053 26
Investments:
06 157,622 0 157,622 5,016
Short-Term Obligations including Commercial Paper 07 0 0 0 0
Asset-Backed Securities 09 0 0 0 0
Loans (at amortized cost):
First mortgages on one- to four-unit residential dwellings 14 4.00% 0 0 0
15 10.00% 0 0 0
Mortgages secured by undeveloped land 16 15.00% 0 0 0
23 45.00% 0 0 0
Other Loans 17 0
19 0 0
Preferred Shares 25 40,039 0 40,039 3,104
Other Investments 35 10.00% 0 0 0
Receivables:
Government Grade 50 0.00% 0 0
Facility Association and the "P.R.R." 51 0.70% 0 0 0
- Instalment Premiums (not yet due) 54 0.00% 0 0
- Outstanding less than 60 days 55 5.00% 519 519 26
- Outstanding 60 days or more 56 10.00% 0 0 0
Insurers
43 0.00% 0 0
44 0.70% 0 0 0
- Registered Non-associated 57 0.70% 139 139 1
- Unregistered 58 0 0
Recoverable from Reinsurers:
- Registered Associated
- Unearned Premiums under Intra-group pooling
arrangements approved by OSFI 71 0.00% 0 0
- Unearned Premiums excluding Intra-group pooling
arrangements approved by OSFI 72 2.50% 0 0 0
- Unpaid Claims under Intra-group pooling
arrangements approved by OSFI 73 0.00% 0 0
- Unpaid Claims excluding Intra-group pooling
arrangements approved by OSFI 74 2.50% 0 0 0
- Registered Non-associated - Unearned Premiums 60 2.50% 0 0 0
- Unpaid Claims 61 2.50% 2,943 2,943 74
- Unregistered 63 0 0
65 20.00% 5,863 5,863 1,173
66 10.00% 0 0 0
Assets held for sale 67 20.00% 0 0 0
Other Assets 86 10.00% 255 255 26
(Specify) 87 0 0
TOTAL 89 250,068 0 250,068 9,550
Note: See Section VI of the P&C instructions and the MCT Guideline.
Adjustment to reflect difference between amortized cost and Balance Sheet value of loans
Agents, Brokers, Policyholders, Associates, Joint Ventures, Limited Partnerships, Non-qualifying
Subsidiaries and Other Receivables:
Other Recoverables on Unpaid Claims including SIRs not deducted from capital
(55)
Deferred Tax Assets arising from temporary differences, that can be applied to recoverable income taxes
paid in the preceding 3 years
Long-term obligations including term deposits, bonds, debentures and loans
Subsidiaries, Associates & Joint Ventures (not considered capital)
Commercial mortgages and residental mortgages that are not first mortgages on one- to four-
unit residential dwellings
- Registered Associated under Intra-group pooling arrangements approved by OSFI
- Registered Associated excluding Intra-group pooling arrangements approved by OSFI
30.71
Date
CONSOLIDATED
MCT CREDIT RISK: CAPITAL REQUIRED FOR BALANCE SHEET ASSETS
($'000)
Risk Factor
(%)
Balance
Sheet Value
Redistribution of
Exposure for
Collateral/
Guarantees
Net
Exposure
Capital
Required
(01)x(05)
P&C (2020)
Next page is 30.73

Ontario School Boards' Insurance Exchange 31/12/2020
Canadian/Foreign Insurer Date
Net Exposure Net Exposure Net Exposure
(01) (10) (11) (02) (03) (12) (13) (04) (05) (14) (15) (06) (09)
Government Grade 01 0 0.00% 9,919 9,919 0.00% 1,193 1,193 0.00% 0
AAA 02 0 0.25% 0 0.50% 0 1.25% 0
AA+ to AA- 03 0 0.25% 32,564 32,564 1.00% 8,673 8,673 1.75% 477
A+ to A- 04 0 0.75% 5,647 5,647 1.75% 12,521 12,521 3.00% 474
BBB+ to BBB- 05 0 1.50% 22,513 22,513 3.75% 59,514 59,514 4.75% 3,671
BB+ to BB- 06 0 3.75% 5,078 5,078 7.75% 0 8.00% 394
B+ to B- 07 0 7.50% 0 10.50% 0 10.50% 0
Unrated 10 0 6.00% 0 8.00% 0 10.00% 0
Other 08 0 15.50% 0 18.00% 0 18.00% 0
Sub-total 09 0 0 0 75,721 0 75,721 81,901 0 81,901 5,016
Government Grade 18 0 0.00% 0
A-1, F1, P-1, R-1 or equivalent 20 0 0.25% 0
A-2, F2, P-2, R-2 or equivalent 21 0 0.50% 0
A-3, F3, P-3, R-3 or equivalent 22 0 2.00% 0
Unrated 11 0 6.00% 0
All other ratings, including non-prime and B or C ratings 23 0 8.00% 0
Sub-total 29 0 0 0 0
AAA, AA+ to AA-, Pfd-1, P-1 or equivalent 40 0 3.00% 0
A+ to A-, Pfd-2, P-2 or equivalent 41 17,988 17,988 5.00% 899
BBB+ to BBB-, Pfd-3, P-3 or equivalent 42 22,051 22,051 10.00% 2,205
BB+ to BB-, Pfd-4, P-4 or equivalent 43 0 20.00% 0
B+ or lower, Pfd-5, P-5 or equivalent or unrated 44 0 30.00% 0
Sub-total 49 40,039 0 40,039 3,104
Total 89 8,120
Note: See Section VI of the P&C instructions and the MCT Guideline.
Redistribution of
Exposure for
Collateral/
Guarantees
Balance Sheet
Value
1 year or less, or perpetual Greater than 5 years
Risk
Factor
Balance Sheet
Value
Redistribution of
Exposure for
Collateral/
Guarantees
Risk
Factor
Redistribution of
Exposure for
Collateral/
Guarantees
Preferred shares
Long-term
obligations
including term
deposits, bonds,
debentures and
loans
Short-term
obligations
including
commercial paper
30.73
CONSOLIDATED
MCT (BAAT) CREDIT RISK: CAPITAL (MARGIN) REQUIRED FOR BALANCE SHEET (VESTED) ASSETS BASED ON EXTERNAL CREDIT RATINGS
($'000)
Category Rating
Remaining Term to Maturity/ Other Maturity
Capital (Margin)
Required
(11x02)+(13x04)+
(15x06)
Greater than 1 year,
up to and including 5 years
Risk
Factor
Balance Sheet
Value
P&C (2020)
Next page is 30.75

Ontario School Boards' Insurance Exchange 31/12/2020
Canadian/Foreign Insurer Date
Exposure Amonts for OTC Derivatives
Interest Rate
Contracts
Foreign Exchange
and Gold
Contracts
Equity-linked
Contracts
Precious Metals
(Other than Gold
Contracts)
Other
Instruments
Total Contracts
(01) (02) (03) (04) (05) (09)
Notional principal amount 01 0
Replacement Cost (Market Value)
Gross positive replacement cost 02 0
Gross negative replacement cost 03 0
Add-on for Potential Future Exposure 04 0
Credit Equivalent Amount 09 0 0 0 0 0 0
Net Exposure Risk Factor Net Exposure Net Exposure
(10) (11) (12) (13) (14) (20) (21) (22) (23) (24) (30) (31) (32) (33) (34) (39)
Government Grade 10 0 0.00% 0 0.00% 0 0.00% 0
AAA 11 0 0.25% 0 0.50% 0 1.25% 0
AA+ to AA- 12 0 0.25% 0 1.00% 0 1.75% 0
A+ to A- 13 0 0.75% 0 1.75% 0 3.00% 0
BBB+ to BBB- 14 0 1.50% 0 3.75% 0 4.75% 0
BB+ to BB- 15 0 3.75% 0 7.75% 0 8.00% 0
B+ to B- 16 0 7.50% 0 10.50% 0 10.50% 0
Unrated 17 0 6.00% 0 8.00% 0 10.00% 0
Other 18 0 15.50% 0 18.00% 0 18.00% 0
Sub-total 19 0 0 0 0 0 0 0 0 0 0
Rated A- and higher 20 0 50% 2.00% 0
Rated BBB+ and lower 21 0 50% 8.00% 0
Unrated 22 0 50% 10.00% 0
Other (excluding unrated) 23 0 50% 18.00% 0
Sub-total 29 0 0 0 0
Government Grade 30 0 0.00% 0 0.00% 0 0.00% 0
AAA 31 0 0.25% 0 0.50% 0 1.25% 0
AA+ to AA- 32 0 0.25% 0 1.00% 0 1.75% 0
A+ to A- 33 0 0.75% 0 1.75% 0 3.00% 0
BBB+ to BBB- 34 0 1.50% 0 3.75% 0 4.75% 0
BB+ to BB- 35 0 3.75% 0 7.75% 0 8.00% 0
B+ to B- 36 0 7.50% 0 10.50% 0 10.50% 0
Unrated 37 0 6.00% 0 8.00% 0 10.00% 0
Other 38 0 15.50% 0 18.00% 0 18.00% 0
Sub-total 39 0 0 0 0 0 0 0 0 0 0
Total 89 0 0 0 0 0 0 0 0 0 0
Note: See Section VI of the P&C instructions and the MCT Guideline.
OTC derivatives
Type 1 structured
settlements
Other off-balance sheet
exposures
Risk
Factor
Credit
Conversion
Factor
Credit
Equivalent
Amount
Redistribution of
Exposure for
Collateral/
Guarantees
Credit Conversion
FactorRating of the counterparty
Redistribution of
Exposure for
Collateral/
Guarantees
30.75
CONSOLIDATED
MCT (BAAT) CREDIT RISK: CAPITAL (MARGIN) REQUIRED FOR OFF-BALANCE SHEET EXPOSURES
($'000)
Category
Remaining Term to Maturity/ Other Maturity
Capital (Margin)
Required
(12x13x14)+(22x23
x24)+(32x33x34)
1 year or less, or indeterminate Greater than 1 year, up to and including 5 years Greater than 5 years
Credit Equivalent
Amount
Risk FactorCredit Equivalent
Amount
Credit
Conversion
Factor
Redistribution of
Exposure for
Collateral/
Guarantees
P&C (2020)
Next page is 30.77

Ontario School Boards' Insurance Exchange 31/12/2020
Canadian/Foreign Insurer Date
1
Total Capital (Margin) Required for Non-Owned Deposits and Letters of Credit
(01)
Total capital (margin) required for acceptable non-owned deposits 01 0
Total capital (margin) required for letters of credit 02 0
Ratio for proportional allocation of excess collateral 03 0.00%
Capital (margin) required for excess collateral portion 04 0
05 0
(02) (04) (06) (08) (10) (12) (19)
Government grade 10 0.00% 0.00% 0.00% 0
AAA 11 0.25% 0.50% 1.25% 0
AA+ to AA- 12 0.25% 1.00% 1.75% 0
A+ to A- 13 0.75% 1.75% 3.00% 0
BBB+ to BBB- 14 1.50% 3.75% 4.75% 0
BB+ to BB- 15 3.75% 7.75% 8.00% 0
B+ to B- 16 7.50% 10.50% 10.50% 0
Unrated 17 6.00% 8.00% 10.00% 0
Other 18 15.50% 18.00% 18.00% 0
Sub-total 19 0 0 0 0
Government grade 20 0.00% 0
A-1, F1, P-1, R-1 or equivalent 21 0.25% 0
A-2, F2, P-2, R-2 or equivalent 22 0.50% 0
A-3, F3, P-3, R-3 or equivalent 23 2.00% 0
Unrated 24 6.00% 0
All other ratings, including non-prime and B or C ratings 25 8.00% 0
Sub-total 29 0 0
AAA, AA+ to AA-, Pfd-1, P-1 or equivalent 30 3.00% 0
A+ to A-, Pfd-2, P-2 or equivalent 31 5.00% 0
BBB+ to BBB-, Pfd-3, P-3 or equivalent 32 10.00% 0
BB+ to BB-, Pfd-4, P-4 or equivalent 33 20.00% 0
B+ or lower, Pfd-5, P-5 or equivalent or unrated or common shares 34 30.00% 0
Sub-total 39 0 0
Cash held on premises 40 0.00% 0
Cash other 41 0.25% 0
Investment income due and accrued 42 2.50% 0
Sub-total 49 0 0
Government grade 50 0.00% 0.00% 0.00% 0
AAA 51 0.25% 0.50% 1.25% 0
AA+ to AA- 52 0.25% 1.00% 1.75% 0
A+ to A- 53 0.75% 1.75% 3.00% 0
BBB+ to BBB- 54 1.50% 3.75% 4.75% 0
BB+ to BB- 55 3.75% 7.75% 8.00% 0
B+ to B- 56 7.50% 10.50% 10.50% 0
Sub-total 59 0 0 0 0
Total 89 0 0 0 0
¹ For letters of credit, use rating of the issuing/confirming bank and term of ceded liabilities
Note: See Section VI of the P&C instructions and the MCT Guideline.
Capital (margin) required for acceptable non-owned deposits and letters of credit less excess
Other deposits
Letters of credit ¹
Long-term obligations
including term deposits,
bonds, debentures and
loans
Short-term obligations
including commercial
paper
Preferred shares
Risk factor
Capital (margin) required
(02x04)+(06x08)+(10x12)
30.77
MCT (BAAT) CREDIT RISK: CAPITAL (MARGIN) REQUIRED FOR COLLATERAL HELD FOR UNREGISTERED REINSURANCE EXPOSURES
AND SELF-INSURED RETENTION
($'000)
Category Rating
Remaining Term to Maturity/ Other Maturity
1 year or less, or perpetual Greater than 5 years
CONSOLIDATED
Greater than 1 year, up to and including
5 years
Exposure amount Risk factor Exposure amount Risk factor Exposure amount
P&C (2020)
Next page is 30.79

Ontario School Boards' Insurance Exchange 31/12/2020
Canadian/Foreign Insurer Date
1
(01) (02) (03) (09)
Direct premiums written in the past 12 m 01 31,079 34,397 2.50% 860
Reinsurance assumed in the past 12 m - Not Intra Pool 02 0 1.75% 0
Reinsurance assumed in the past 12 m - Intra Pool (MCT
only) 03 0 0.75% 0
Subtotal: Gross premiums 09 31,079 34,397
Reinsurance ceded in the past 12 m - Not Intra Pool 10 1,873 2.50% 47
Reinsurance ceded in the past 12 m - Intra Pool (MCT only) 11 0.75% 0
Greater of 0.75% on ceded and 0.75% on assumed - Intra Pool
(MCT only) 12 0
Premium growth above 20% threshold 13 0 2.50% 0
Subtotal: premium operational risk requirement component 19 907
Capital/margin required component ¹ (balance sheet value) 30 46,069 8.50% 3,916
Total operational risk uncapped 39 4,823
Cap 50 30% 13,821
Total operational risk margin 89 4,823
Notes:
¹ Capital (margin) required component equals to total capital (margin) required excluding operational risk and diversification credit.
See Section VI of the P&C instructions and the MCT Guideline.
30.79
CONSOLIDATED
MCT (BAAT) OPERATIONAL RISK CAPITAL (MARGIN) REQUIRED
($'000)
Income Statement
Value 12 m (previous
year)
Income Statement
Value 12 m
(current year)
Risk
Factor
Capital (Margin)
Required
(02)x(03)
P&C (2020)
Next page is 40.07

Ontario School Boards' Insurance Exchange 31/12/2020
Canadian/Foreign Insurer Date
Balance Pooled Funds Realized Income Gain/(Loss)
Hedges FV Option/ Sheet Gains(Losses) From
Investment (01+03+05+ FV Option
Properties 07+09)
Fair Value
(01) (03) (05) (07) (09) (12) (13) (15) (16) (19)
Aggregate Holdings:
Short Term Investments (1 year or less) 01 0
Bonds and Debentures (1 year or less) 06 0
Bonds and Debentures > 1 year and ≤ 5 years 02 75,721 75,721 2,818 3,397
Bonds and Debentures > 5 years 05 81,901 81,901 3,048 3,674
Mortgage Loans - ≤ 80% Loan to Value Ratio 03 0
- Other 04 0
Preferred Shares - Debt 10 0
- Equity 11 40,039 40,039 -1,265 2,206
Common Shares 15 0 15,324 0 0 15,324 -272 474
Investment Properties 20 0
Other Loans and Invested Assets 30 0
Pooled Funds - items not captured in above rows 32 0 6,714 -212 370
Deduct: Pooled Funds accounted using the Equity Method 34 0
Total Investments 39 0 212,985 0 0 0 212,985 6,714 4,117 10,121 0
Out of Canada 40
Foreign Pay Securities 41
Individual Holdings:
Largest Exposure to an Entity or Connected Group 50 15,959
2nd Largest Exposure to an Entity or Connected Group 51 13,551
Largest Pooled Holding 60 3,490
2nd Largest Pooled Holding 61 1,925
** Investments are vested in trust for foreign insurers.
40.07
Fair Value
CONSOLIDATED
SUMMARY OF INVESTMENTS
($'000)
Amortized Cost
Fair Value
Through Other
Comprehensive
Income (FVOCI)
Fair Value
Through Profit or
Loss (FVTPL)
(Vested in Trust**)
P&C (2020)
Next page is 40.12

40.12
Ontario School Boards' Insurance Exchange 31/12/2020
Canadian Insurer Date
CONSOLIDATED
SHORT TERM INVESTMENTS (excluding bonds and debentures)
Interest
Rate Due Dates Date of Date of Par Value Hedges Fair Value
Where/By whom kept Description % Issue Maturity Option
(10+12+14+
16+18)
(01) (02) (03) (04) (05) (06) (07) (10) (12) (14) (16) (18) (29)00
Total Short Term Investments Foreign Government 35 000
Total Short Term Investments - Rating of A 1, R 1 40 0000
Total Short Term Investments - Rating of A 2, R 2 45 0000
Total Short Term Investments - Rating of A 3, R 3 49 0000
Total Short Term Investments - Rating of B, R 4 60 0000
Total Short Term Investments - Rating of B 1, R 5 65 000
Total Short Term Investments - Rating of B 2, D 69 000
Total Short Term Investments - Other 89 0Total Short Term Investments 99 0 0 0 0 0 0 0
Fair Value
Balance Sheet
Value
($'000)
Amortized CostFair Value
Through Profit
or Loss
(FVTPL)
Fair Value
Through Other
Comprehensive
Income
(FVOCI)
P&C (2020)
Next page is 40.22
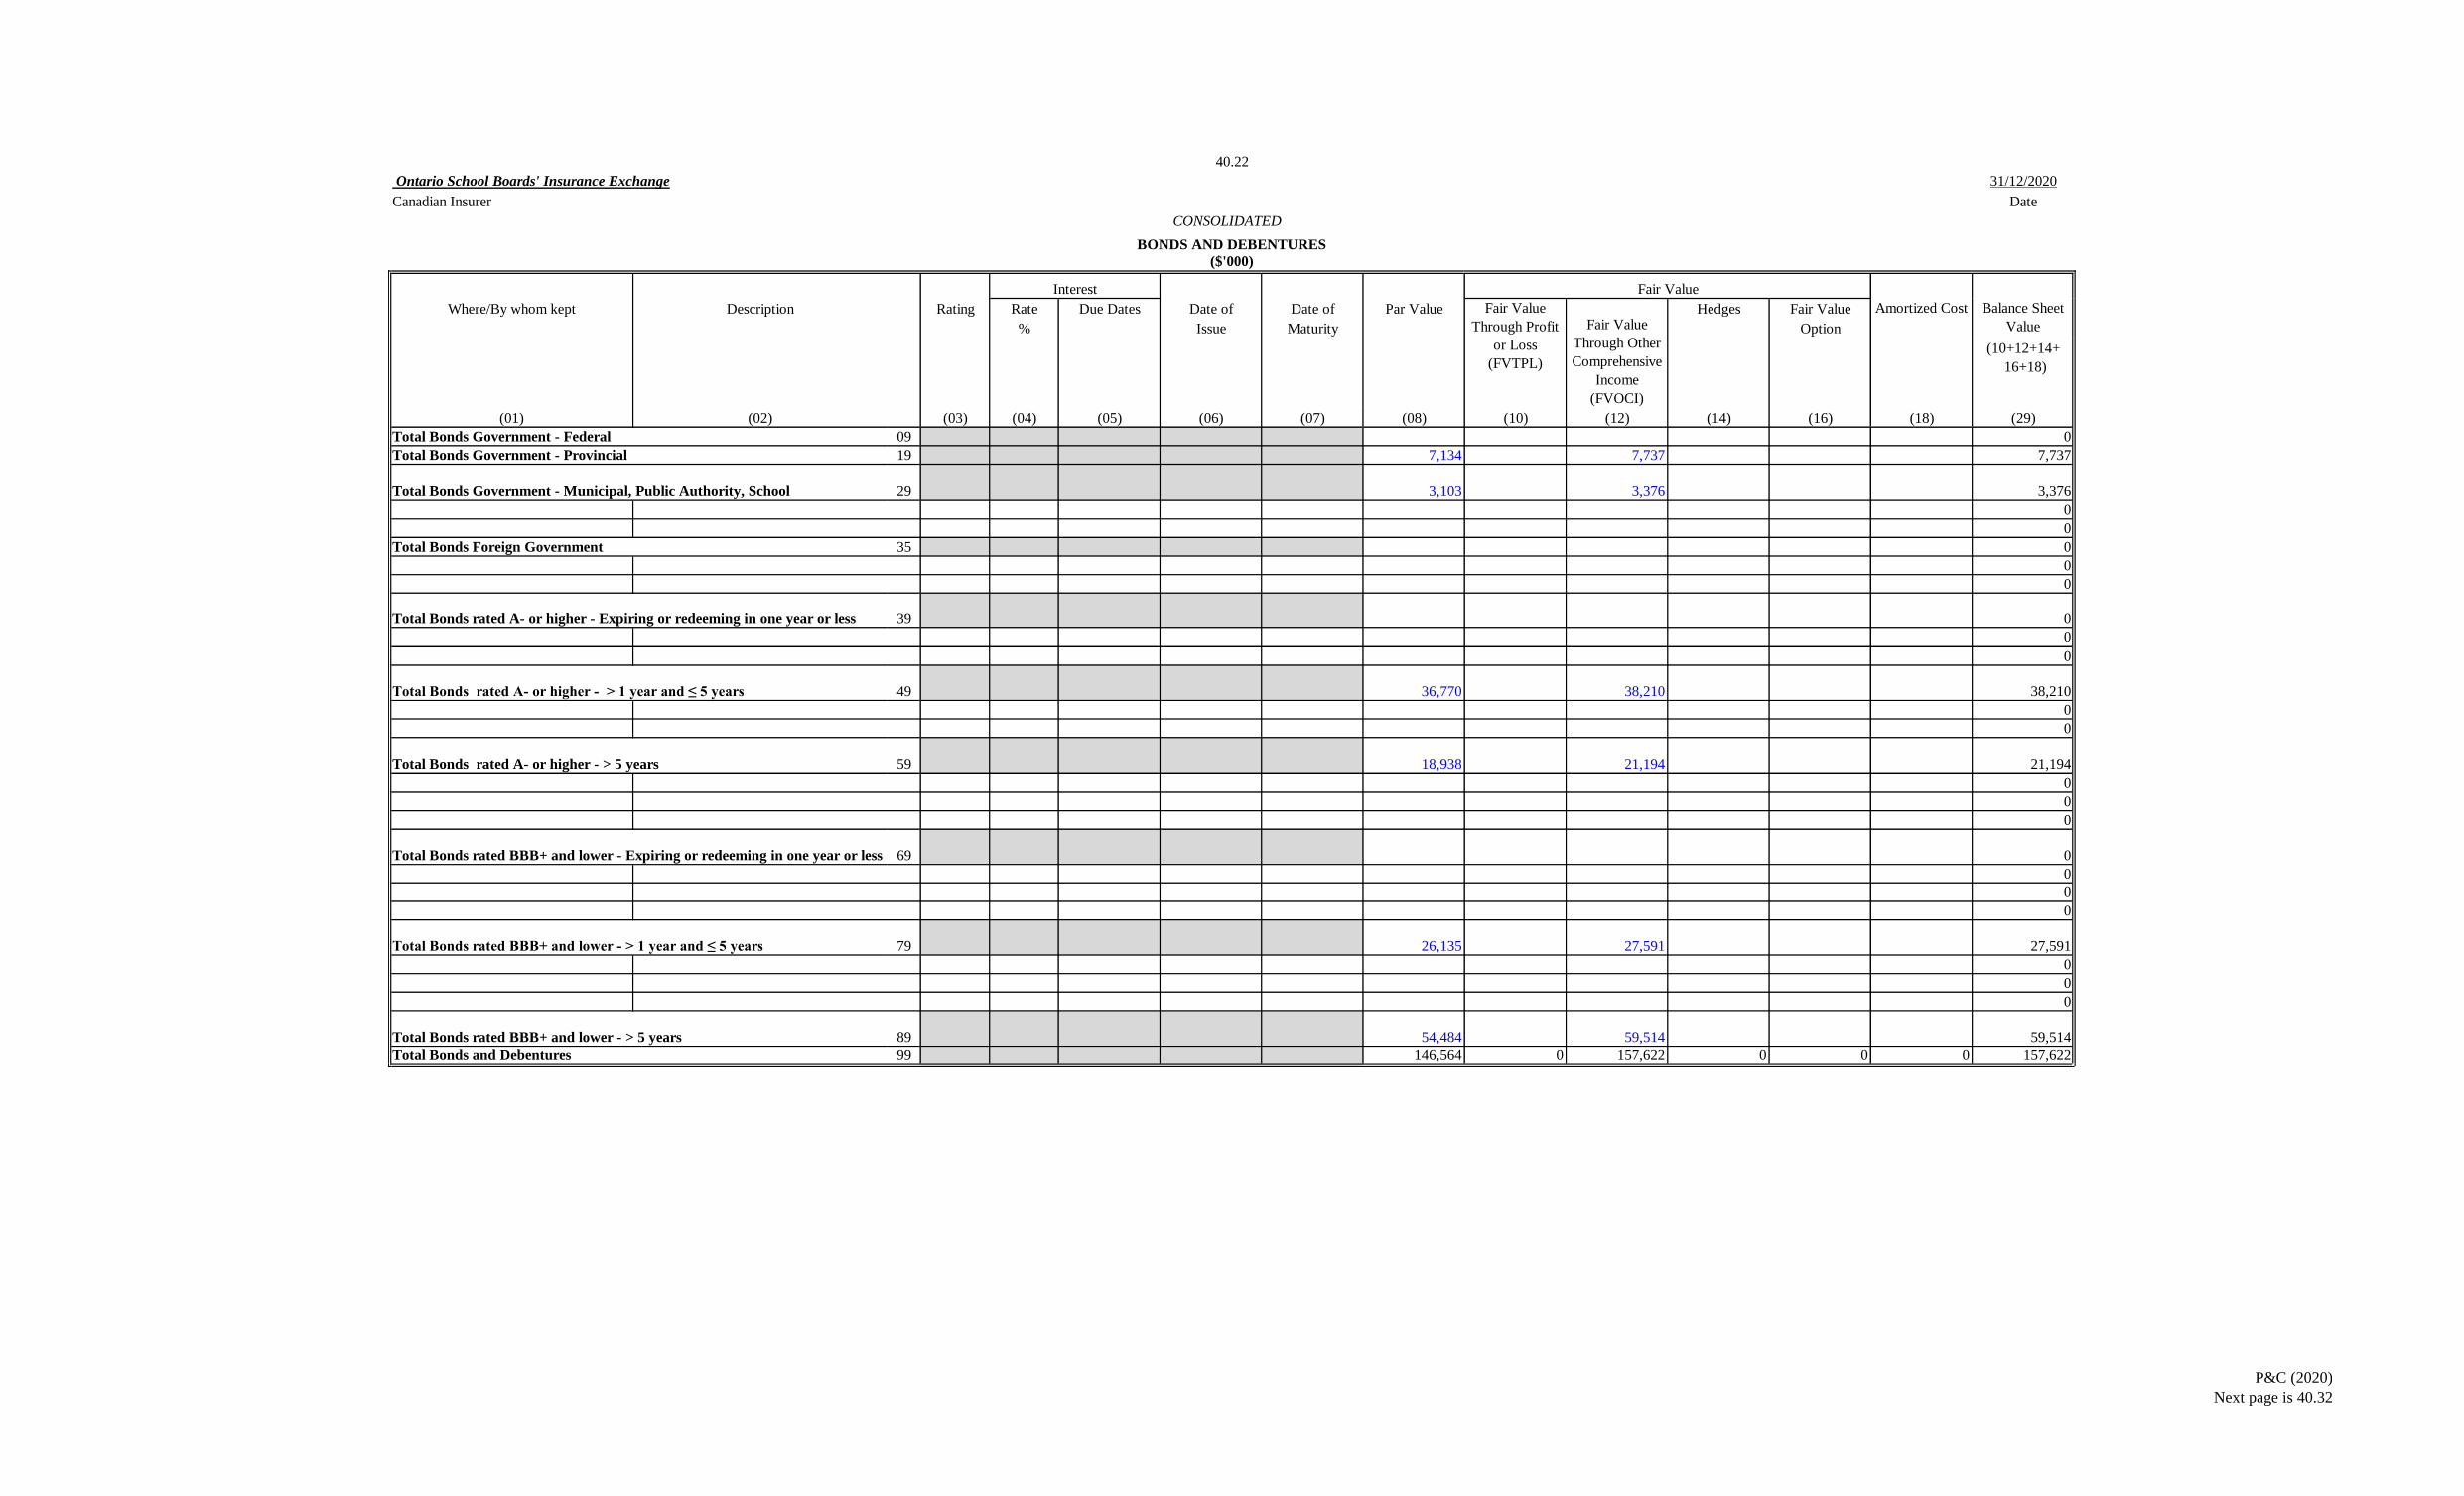
40.22
Ontario School Boards' Insurance Exchange 31/12/2020
Canadian Insurer Date
CONSOLIDATED
Interest
Where/By whom kept Description Rating Rate Due Dates Date of Date of Par Value Hedges Fair Value
% Issue Maturity Option
(10+12+14+
16+18)
(01) (02) (03) (04) (05) (06) (07) (08) (10) (12) (14) (16) (18) (29)
Total Bonds Government - Federal 09 0
Total Bonds Government - Provincial 19 7,134 7,737 7,737
29 3,103 3,376 3,376
0
0
Total Bonds Foreign Government 35 0
0
0
39 0
0
0
49 36,770 38,210 38,210
0
0
59 18,938 21,194 21,194
0
0
0
69 0
0
0
0
79 26,135 27,591 27,591
0
0
0
89 54,484 59,514 59,514
Total Bonds and Debentures 99 146,564 0 157,622 0 0 0 157,622
BONDS AND DEBENTURES
Fair Value
($'000)
Total Bonds rated A- or higher - Expiring or redeeming in one year or less
Total Bonds Government - Municipal, Public Authority, School
Balance Sheet
Value
Amortized CostFair Value
Through Profit
or Loss
(FVTPL)
Fair Value
Through Other
Comprehensive
Income
(FVOCI)
Total Bonds rated BBB+ and lower - > 5 years
Total Bonds rated A- or higher - > 5 years
Total Bonds rated A- or higher - > 1 year and ≤ 5 years
Total Bonds rated BBB+ and lower - Expiring or redeeming in one year or less
Total Bonds rated BBB+ and lower - > 1 year and ≤ 5 years
P&C (2020)
Next page is 40.32

40.32
Ontario School Boards' Insurance Exchange 31/12/2020
Canadian Insurer Date
CONSOLIDATED
MORTGAGE LOANS
Where/By whom kept Description Identification Interest Rate Original Original
Loan Value of
Amount Property
(01) (02) (03) (04) (05) (06) (07) (08) (09)
29 0 0 0 0
39 0 0 0 0
Total Commercial Mortgage Loans 49 0 0 0 0
Total Other Mortgages 59 0 0 0 0
Total Mortgage Loans 89 0 0 0 0
Total Government Grade Guarantor Mortgage Loans
Total Residential Mortgages
Balance Sheet Value
($'000)
Number
Date of Issue Current Market
Value of Property
P&C (2020)
Next page is 40.42

40.42
Ontario School Boards' Insurance Exchange 31/12/2020
Canadian Insurer Date
Where/By whom kept Description Number of Hedges Fair Value Original Cost
Shares Option
(10+12+14+
16+18)
(01) (02) (03) (10) (12) (14) (16) (18) (29) (39)
0
0
0
0
0
Total AAA, AA, Pfd-1, P-1 29 0 0 0 0 0 0 0
OSBIE-National Bank Financial BANK OF MONTREAL 40 975 975 1,000.00
OSBIE-National Bank Financial GREAT-WEST LIFECO INC 20 508 508 500.00
OSBIE-National Bank Financial INTACT FINANCIAL CORP 50 1,270 1,270 1,250.00
OSBIE-National Bank Financial INTACT FINANCIAL CORP 9 228 228 225.00
OSBIE-National Bank Financial BANK OF MONTREAL 10 248 248 250.00
OSBIE-National Bank Financial BANK OF MONTREAL 80 1,792 1,792 2,000.00
OSBIE-National Bank Financial CANADIAN IMPERIAL BANK OF COMMERCE 60 1,497 1,497 1,500.00
OSBIE-National Bank Financial TORONTO-DOMINION BANK 80 2,011 2,011 2,000.00
OSBIE-National Bank Financial CANADIAN IMPERIAL BANK OF COMMERCE 80 2,031 2,031 2,000.00
OSBIE-National Bank Financial INTACT Financial Corp 155 4,036 4,036 3,875.00
OSBIE-National Bank Financial EMERA INC 40 1,027 1,027 1,000.00
OSBIE-TD Waterhouse TORONTO-DOMINION BANK 55 1,338 1,338 1,375.00
OSBIE-TD Waterhouse EMERA INC 40 1,027 1,027 1,000.00
Total A, Pfd-2, P-2 39 0 17,988 0 0 0 17,988 17,975
OSBIE-National Bank Financial ENBRIDGE INC 80.00 1,834 1,834 2,000
OSBIE-National Bank Financial ECN CAPITAL CORP 40.00 890 890 1,000
OSBIE-National Bank Financial PEMBINA PIPELINE CORP 50.00 1,140 1,140 1,250
OSBIE-National Bank Financial ALTAGAS LTD 60.00 1,468 1,468 1,500
OSBIE-National Bank Financial MANULIFE FINANCIAL CORP 120.00 2,508 2,508 3,000
OSBIE-National Bank Financial CANADIAN BANC CORP 123.00 1,282 1,282 1,232
OSBIE-National Bank Financial CANADIAN WESTERN BANK 120.00 3,062 3,062 3,000
OSBIE-National Bank Financial BROOKFIELD RENEWABLE POWER PREFERRED EQUITY INC 80.00 2,024 2,024 2,000
OSBIE-National Bank Financial BROOKFIELD INFRASTRUCTURE PARTNERS LP 120.00 2,862 2,862 3,000
OSBIE-National Bank Financial BROMPTON SPLIT BANC CORP. 200.00 2,070 2,070 2,016
OSBIE-TD Waterhouse ENBRIDGE INC 54.00 1,238 1,238 1,350
OSBIE-TD Waterhouse MANULIFE FINANCIAL CORP 80.00 1,673 1,673 2,000
CONSOLIDATED
Fair Value
Balance Sheet Value
($'000)
PREFERRED SHARES
Amortized CostFair Value Through
Profit or Loss
(FVTPL)
Fair Value Through
Other Comprehensive
Income (FVOCI)
P&C (2020)
Next page is 40.52

40.42
Ontario School Boards' Insurance Exchange 31/12/2020
Canadian Insurer Date
CONSOLIDATED
Fair Value
($'000)
PREFERRED SHARES
Total BBB, Pfd-3, P-3 49 0 22,051 0 0 0 22,051 23,348
0
0
0
0
0
Total BB, Pfd-4, P-4 59 0 0 0 0 0 0 0
0
0
0
0
0
Total B, Pfd-5, P-5 or unrated 79 0 0 0 0 0 0 0
Total Preferred Shares 89 0 40,039 0 0 0 40,039 41,323
P&C (2020)
Next page is 40.52

40.52
Ontario School Boards' Insurance Exchange 31/12/2020
Canadian Insurer Date
Where/By whom kept Description Number of Hedges Fair Value Original Cost
Shares Option
(10+12+14+16)
(01) (02) (03) (10) (12) (14) (16) (29) (39)
OSBIE-RBCDS TIMBERCREEK FINANCIAL ORD 156 1,352 1,352 1,446OSBIE-RBCDS TIMBERCREEK FINANCIAL ORD 20 173 173 185OSBIE-RBCDS TIMBERCREEK FINANCIAL ORD 21 184 184 196OSBIE-RBCDS TIMBERCREEK FINANCIAL ORD 20 173 173 185OSBIE-RBCDS TIMBERCREEK FINANCIAL ORD 2 12 12 13OSBIE-TD Waterhouse CANADIAN TIRE CL A ORD 6 1,004 1,004 986OSBIE-TD Waterhouse BANK NOVA SCOTIA ORD 26 1,789 1,789 1,988OSBIE-TD Waterhouse BANK NOVA SCOTIA ORD 13 915 915 1,002OSBIE-TD Waterhouse POWER CORPORATION OF CANADA ORD 61 1,789 1,789 1,998OSBIE-TD Waterhouse BANK OF MONTREAL ORD 13 1,219 1,219 1,220OSBIE-National Bank FinancialISHARES S&P/TSX CAPPED ENERGY INDEX ETF 221 1,299 1,299 1,000OSBIE-National Bank FinancialBMO EW OIL & GAS IDX ETF 38 1,127 1,127 1,000OSBIE-National Bank FinancialBMO LAD PREF SHARE IDX ETF 241 2,363 2,363 2,002OSBIE-RBCDS RBC QUANT EAFE DIV LDS HGD ETF 88 1,925 1,925 2,020
000000000000000
Total common shares 89 0 15,324 0 0 15,324 15,241
CONSOLIDATED
Fair Value
Balance Sheet Value
($'000)
COMMON SHARES
Fair Value Through
Profit or Loss
(FVTPL)
Fair Value Through
Other Comprehensive
Income (FVOCI)
P&C (2020)
Next page is 40.70A

Ontario School Boards' Insurance Exchange 31/12/2020
Canadian/Foreign Insurer Date
Description of Property Year Amount of
Acquired Encumbrances
(01) (02) (03) (04) (05) (06) (07)
Investment Properties
Total Investment Properties 49 0 0 0 0
40.70 A
TotalMarket Value
CONSOLIDATED
INVESTMENT PROPERTIES
($'000)
Value Using
Cost Model
Balance Sheet Value
Vested in Trust
P&C (2020)
Next page is 40.70B

40.70 B
Ontario School Boards' Insurance Exchange 31/12/2020
Canadian/Foreign Insurer Date
OWN USE PROPERTY AND EQUIPMENT
($'000)
Description of Property Year Amount of
Acquired Encumbrances
(01) (02) (03) (04) (05) (06) (07)
Own use property
Head Office building 91 Westmount Road, Guelph, ON 2000 205 1,023 63
Head Office land 91 Westmount Road, Guelph, ON 2000 205 205 205
Toronto Office 120 Carlton St., Suite 309, Toronto,ON 2012 408 723 299
Total Own Use Properties 79 0 818 1,951 567
Equipment 80
Total Own Use Property and Equipment 69 567
Total
CONSOLIDATED
Market ValueValue Using
Cost Model
Balance Sheet Value
Vested in Trust
P&C (2020)
Next page is 40.80

Ontario School Boards' Insurance Exchange 31/12/2020
Canadian/Foreign Insurer Date
Where/By whom kept Description Fair Value Total
(01) (02) (03) (04) (05)
Total Loans not considered as capital
(5032.2920 + 5032.3920)
Refer to page 50.32 for a detailed listing
0
Loans considered as capital and
included as part of page 5032.2916 and
5032.3916
Total Other Loans and Invested Assets 89 0 0
Basket clause items 99
40.80
* Entities whose primary regulator is Alberta are required to submit this page on a quarterly basis; Canadian insurers licensed
in Quebec are required to submit this page with their 2nd and 4th quarter filings. All other insurers are only required to submit
this page with their 4th quarter filing.
Balance Sheet Value
Vested in Trust
CONSOLIDATED
OTHER LOANS AND INVESTED ASSETS*
($'000)
P&C (2020)
Next page is 50.20A

50.20 A
Ontario School Boards' Insurance Exchange 31/12/2020
Canadian/Foreign Insurer Date
RECEIVABLE FROM/PAYABLE TO NON-ASSOCIATED AGENTS & BROKERS
($'000)
Receivable Payable
Name of Agent or Broker In Arrears Total Total
(02) (03) (04)
See Section VI of the Annual Return Instructions
All others
Sub-Total 39 0 0 0
Less: Allowance for Doubtful Accounts 40
Total 49 0 0 0
Number of Agents and Brokers 59
(01)
CONSOLIDATED
P&C (2020)
Next page is 50.20B

50.20 B
Ontario School Boards' Insurance Exchange 31/12/2020
Canadian/Foreign Insurer Date
OTHER RECEIVABLES
($'000)
Description
(02)
See Section VI of the Annual Return Instructions
Loan on 13 Brock St. E, Uxbridge 469
All others
Total 89 469
CONSOLIDATED
(01)
P&C (2020)
Next page is 50.32

Ontario School Boards' Insurance Exchange 31/12/2020
Canadian/Foreign Insurer Date
SECTION I: INTEREST IN REGULATED SUBSIDIARY ENTITIES OF THE INSURANCE GROUP CONSOLIDATED IN MCT - CANADAName of Entity
Number of % % of Voting Acquisition
Shares Owned Rights Cost
(01) (02) (04) (06) (08) (10) (12) (14)
Total 09 0 0
SECTION II: INTEREST IN REGULATED SUBSIDIARY ENTITIES OF THE INSURANCE GROUP CONSOLIDATED IN MCT - INTERNATIONAL
Name of EntityNumber of % % of Voting Acquisition
Shares Owned Rights Cost
(01) (02) (04) (06) (08) (10) (12) (14)
Total 19 0 0
SECTION III: INTEREST IN NON-CONSOLIDATED CONTROLLED ENTITIES OF THE CORPORATE GROUP
Name of EntityLoans not considered
as capital
Number of % % of Voting Acquisition
Shares Owned Rights Cost
(01) (02) (04) (06) (08) (10) (12) (14) (16) (18) (20)
Total 29 0 0 0 0 0
Balance Sheet Value
Name of Canadian
Regulatory Authority
Description of Shares Interests/Loans considered as capital
Name of Canadian
Regulatory Authority
Description of Shares Interests/Loans considered as capital
Balance Sheet
Value
Increase
(Decrease) in
Balance Sheet
Value
Market Value
Market Value
CONSOLIDATED
50.32
INTRA-GROUP TRANSACTIONS
Name of Canadian
Regulatory Authority
Description of Shares Interests/Loans considered as capital
Market Value
P&C (2020)
Next page is 50.40A

Ontario School Boards' Insurance Exchange 31/12/2020
Canadian/Foreign Insurer Date
CONSOLIDATED
50.32
INTRA-GROUP TRANSACTIONS
SECTION IV: INTERESTS IN ASSOCIATES & JOINT VENTURES
Loans not
considered as
capital
Name of Entity and Description of Shares Number of % % of Voting Acquisition
Shares Owned Rights Cost
(01) (06) (08) (10) (12) (14) (16) (18) (20)
Total 39 0 0 0 0 0
SECTION V: INTRA-GROUP REINSURANCE TRANSACTIONS (see pages 70.50, 70.60/70.61 for transaction details)
Total Collateral
(23) (25) (27) (29) (31) (33)Registered 42 0 0 0 0 0Unregistered 44 0 0 0 0 0
SECTION VI: INTRA-GROUP OUTSOURCING (see page 10.43 for transaction details)
(35)Year to Date Fee/Cost of Service 52
SECTION VII: OTHER INTRA-GROUP TRANSACTIONS RESULTING IN ASSET ENCUMBRANCE (see page 10.42 for transaction details)
Asset Type
(40) (42)
Total 69 0
Market Value of
Encumbered Asset
Interests/Loans considered as capital
Balance Sheet
Value
Increase
(Decrease) in
Balance Sheet
Value
Balance Sheet
Value
Premiums Ceded Reinsurance
Recoverable
Reinsurance
Receivable
Reinsurance
Payable
Net Receivable
Market Value
P&C (2020)
Next page is 50.40A
Ontario School Boards' Insurance Exchange 31/12/2020
Canadian/Foreign Insurer Date
Receivable
Name of Entity In Arrears Total Payable
(01) (09) (10) (11)
($000) ($000) ($000)
Registered
Total Registered 49 0 0 0
50.40 A
RECEIVABLE FROM/PAYABLE TO SUBSIDIARIES, ASSOCIATES & JOINT VENTURES
($'000)
P&C (2020)
Next page is 50.40B

Ontario School Boards' Insurance Exchange 31/12/2020
Canadian/Foreign Insurer Date
Receivable
Name of Entity In Arrears Total Payable
(01) (09) (10) (11)
($000) ($000) ($000)
Unregistered
Total Unregistered 79 0 0 0
Total 89 0 0 0
50.40 B
RECEIVABLE FROM/PAYABLE TO SUBSIDIARIES, ASSOCIATES & JOINT VENTURES
($'000)
P&C (2020)
Next page is 60.10

60.10
Ontario School Boards' Insurance Exchange 31/12/2020
Canadian/Foreign Insurer Date
Unearned Premiums
Direct Reinsurance Reinsurance Net
assumed ceded (01+02-03)
(01) (02) (03) (04)
Property - Personal excluding Home and Product Warranty 03 0
- Home Warranty 04 0
- Product Warranty 05 0
Subtotal - Personal 06 0 0 0 0
- Commercial 07 0
Property - total 09 0 0 0 0
Aircraft 10 0
Automobile:
Private Passenger - Liability 11 0
- Personal Accident 12 0
- Other 13 0
Subtotal - Private Passenger 14 0 0 0 0
Other than Private Passenger - Liability 15 0
- Personal Accident 16 0
- Other 17 0
Subtotal - Other than Private Passenger 18 0 0 0 0
Facility Assoc. Residual Market - Liability 22 0
- Personal Accident 23 0
- Other 24 0
Subtotal - Facility Assoc. Residual Market 25 0 0 0 0
Automobile - Subtotal - Liability 19 0 0 0 0
- Personal Accident 20 0 0 0 0
- Other 21 0 0 0 0
Automobile - total 29 0 0 0 0
Boiler and Machinery excluding Equipment Warranty 32 0
- Equipment Warranty 33 0
Credit 34 0
Credit Protection 35 0
Fidelity 36 0
Hail 38 0
Legal Expense 40 0
Liability
- Comprehensive General Liability (with products) 50 0
- Comprehensive General Liability (without products) 51 0
- Cyber Liability 52 0
- Directors and Officers Liability 53 0
- Excess Liability 54 0
- Professional Liability 55 0
- Umbrella Liability 56 0
- Pollution Liability 57 0
- All other 58 0
Liability - total 59 0 0 0 0
Mortgage 62 0
Other Approved Products 63 0
Surety
- Contract Surety 60 0
- All Other Surety 61 0
Surety - total 64 0 0 0 0
Title 66 0
Marine 68 0
Accident and Sickness 70 0
TOTAL 89 0 0 0 0
Out of Canada Liabilities 80 0
CONSOLIDATED
UNEARNED PREMIUMS
($'000)
Class of Insurance
INSURERS LICENSED IN QUEBEC OR ALBERTA
P&C (2020)
Next page is 60.20
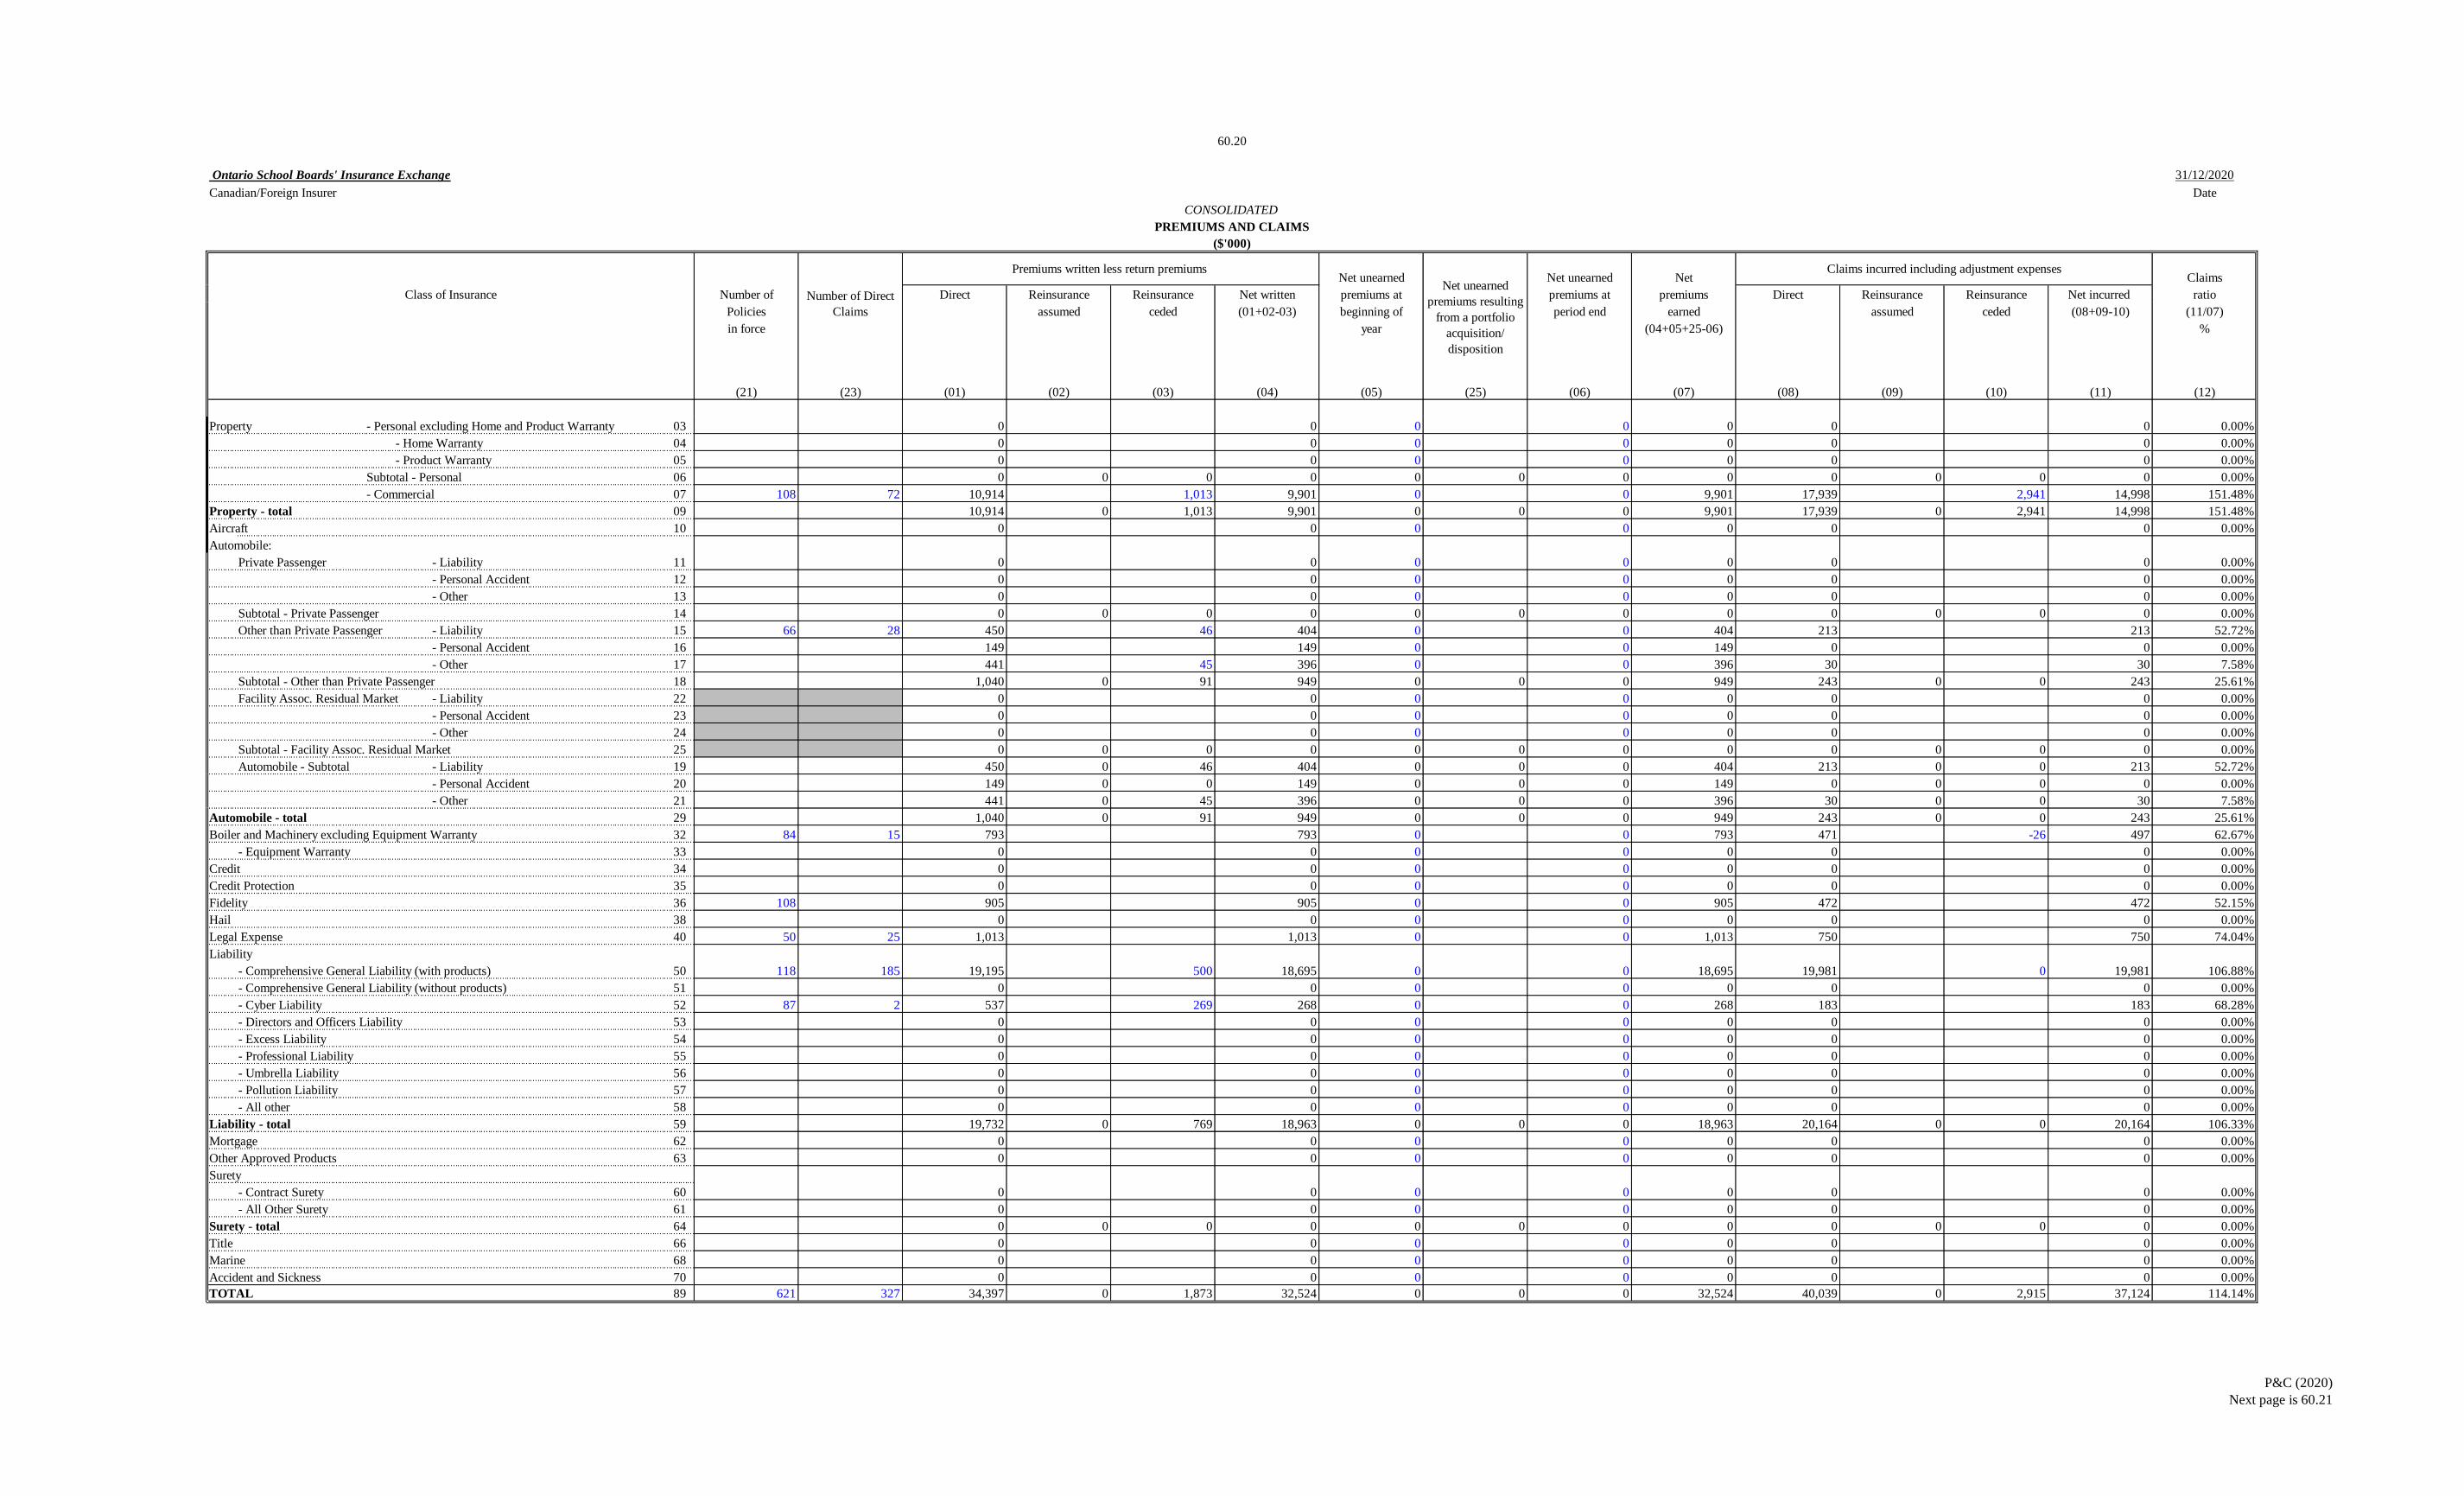
Ontario School Boards' Insurance Exchange 31/12/2020
Canadian/Foreign Insurer Date
PREMIUMS AND CLAIMS
Premiums written less return premiums Net unearned Net unearned Net
Claims incurred including adjustment expensesClaims
Number of Direct Reinsurance Reinsurance Net written premiums at premiums at premiums Direct Reinsurance Reinsurance Net incurred ratio
Policies assumed ceded (01+02-03) beginning of period end earned assumed ceded (08+09-10) (11/07)
in force year (04+05+25-06) %
(21) (23) (01) (02) (03) (04) (05) (25) (06) (07) (08) (09) (10) (11) (12)
Property - Personal excluding Home and Product Warranty 03 0 0 0 0 0 0 0 0.00%
- Home Warranty 04 0 0 0 0 0 0 0 0.00%
- Product Warranty 05 0 0 0 0 0 0 0 0.00%
Subtotal - Personal 06 0 0 0 0 0 0 0 0 0 0 0 0 0.00%
- Commercial 07 108 72 10,914 1,013 9,901 0 0 9,901 17,939 2,941 14,998 151.48%
Property - total 09 10,914 0 1,013 9,901 0 0 0 9,901 17,939 0 2,941 14,998 151.48%
Aircraft 10 0 0 0 0 0 0 0 0.00%
Automobile:
Private Passenger - Liability 11 0 0 0 0 0 0 0 0.00%
- Personal Accident 12 0 0 0 0 0 0 0 0.00%
- Other 13 0 0 0 0 0 0 0 0.00%
Subtotal - Private Passenger 14 0 0 0 0 0 0 0 0 0 0 0 0 0.00%
Other than Private Passenger - Liability 15 66 28 450 46 404 0 0 404 213 213 52.72%
- Personal Accident 16 149 149 0 0 149 0 0 0.00%
- Other 17 441 45 396 0 0 396 30 30 7.58%
Subtotal - Other than Private Passenger 18 1,040 0 91 949 0 0 0 949 243 0 0 243 25.61%
Facility Assoc. Residual Market - Liability 22 0 0 0 0 0 0 0 0.00%
- Personal Accident 23 0 0 0 0 0 0 0 0.00%
- Other 24 0 0 0 0 0 0 0 0.00%
Subtotal - Facility Assoc. Residual Market 25 0 0 0 0 0 0 0 0 0 0 0 0 0.00%
Automobile - Subtotal - Liability 19 450 0 46 404 0 0 0 404 213 0 0 213 52.72%
- Personal Accident 20 149 0 0 149 0 0 0 149 0 0 0 0 0.00%
- Other 21 441 0 45 396 0 0 0 396 30 0 0 30 7.58%
Automobile - total 29 1,040 0 91 949 0 0 0 949 243 0 0 243 25.61%
Boiler and Machinery excluding Equipment Warranty 32 84 15 793 793 0 0 793 471 -26 497 62.67%
- Equipment Warranty 33 0 0 0 0 0 0 0 0.00%
Credit 34 0 0 0 0 0 0 0 0.00%
Credit Protection 35 0 0 0 0 0 0 0 0.00%
Fidelity 36 108 905 905 0 0 905 472 472 52.15%
Hail 38 0 0 0 0 0 0 0 0.00%
Legal Expense 40 50 25 1,013 1,013 0 0 1,013 750 750 74.04%
Liability
- Comprehensive General Liability (with products) 50 118 185 19,195 500 18,695 0 0 18,695 19,981 0 19,981 106.88%
- Comprehensive General Liability (without products) 51 0 0 0 0 0 0 0 0.00%
- Cyber Liability 52 87 2 537 269 268 0 0 268 183 183 68.28%
- Directors and Officers Liability 53 0 0 0 0 0 0 0 0.00%
- Excess Liability 54 0 0 0 0 0 0 0 0.00%
- Professional Liability 55 0 0 0 0 0 0 0 0.00%
- Umbrella Liability 56 0 0 0 0 0 0 0 0.00%
- Pollution Liability 57 0 0 0 0 0 0 0 0.00%
- All other 58 0 0 0 0 0 0 0 0.00%
Liability - total 59 19,732 0 769 18,963 0 0 0 18,963 20,164 0 0 20,164 106.33%
Mortgage 62 0 0 0 0 0 0 0 0.00%
Other Approved Products 63 0 0 0 0 0 0 0 0.00%
Surety
- Contract Surety 60 0 0 0 0 0 0 0 0.00%
- All Other Surety 61 0 0 0 0 0 0 0 0.00%
Surety - total 64 0 0 0 0 0 0 0 0 0 0 0 0 0.00%
Title 66 0 0 0 0 0 0 0 0.00%
Marine 68 0 0 0 0 0 0 0 0.00%
Accident and Sickness 70 0 0 0 0 0 0 0 0.00%
TOTAL 89 621 327 34,397 0 1,873 32,524 0 0 0 32,524 40,039 0 2,915 37,124 114.14%
60.20
Number of Direct
Claims
CONSOLIDATED
Class of Insurance
($'000)
Net unearned
premiums resulting
from a portfolio
acquisition/
disposition
P&C (2020)
Next page is 60.21
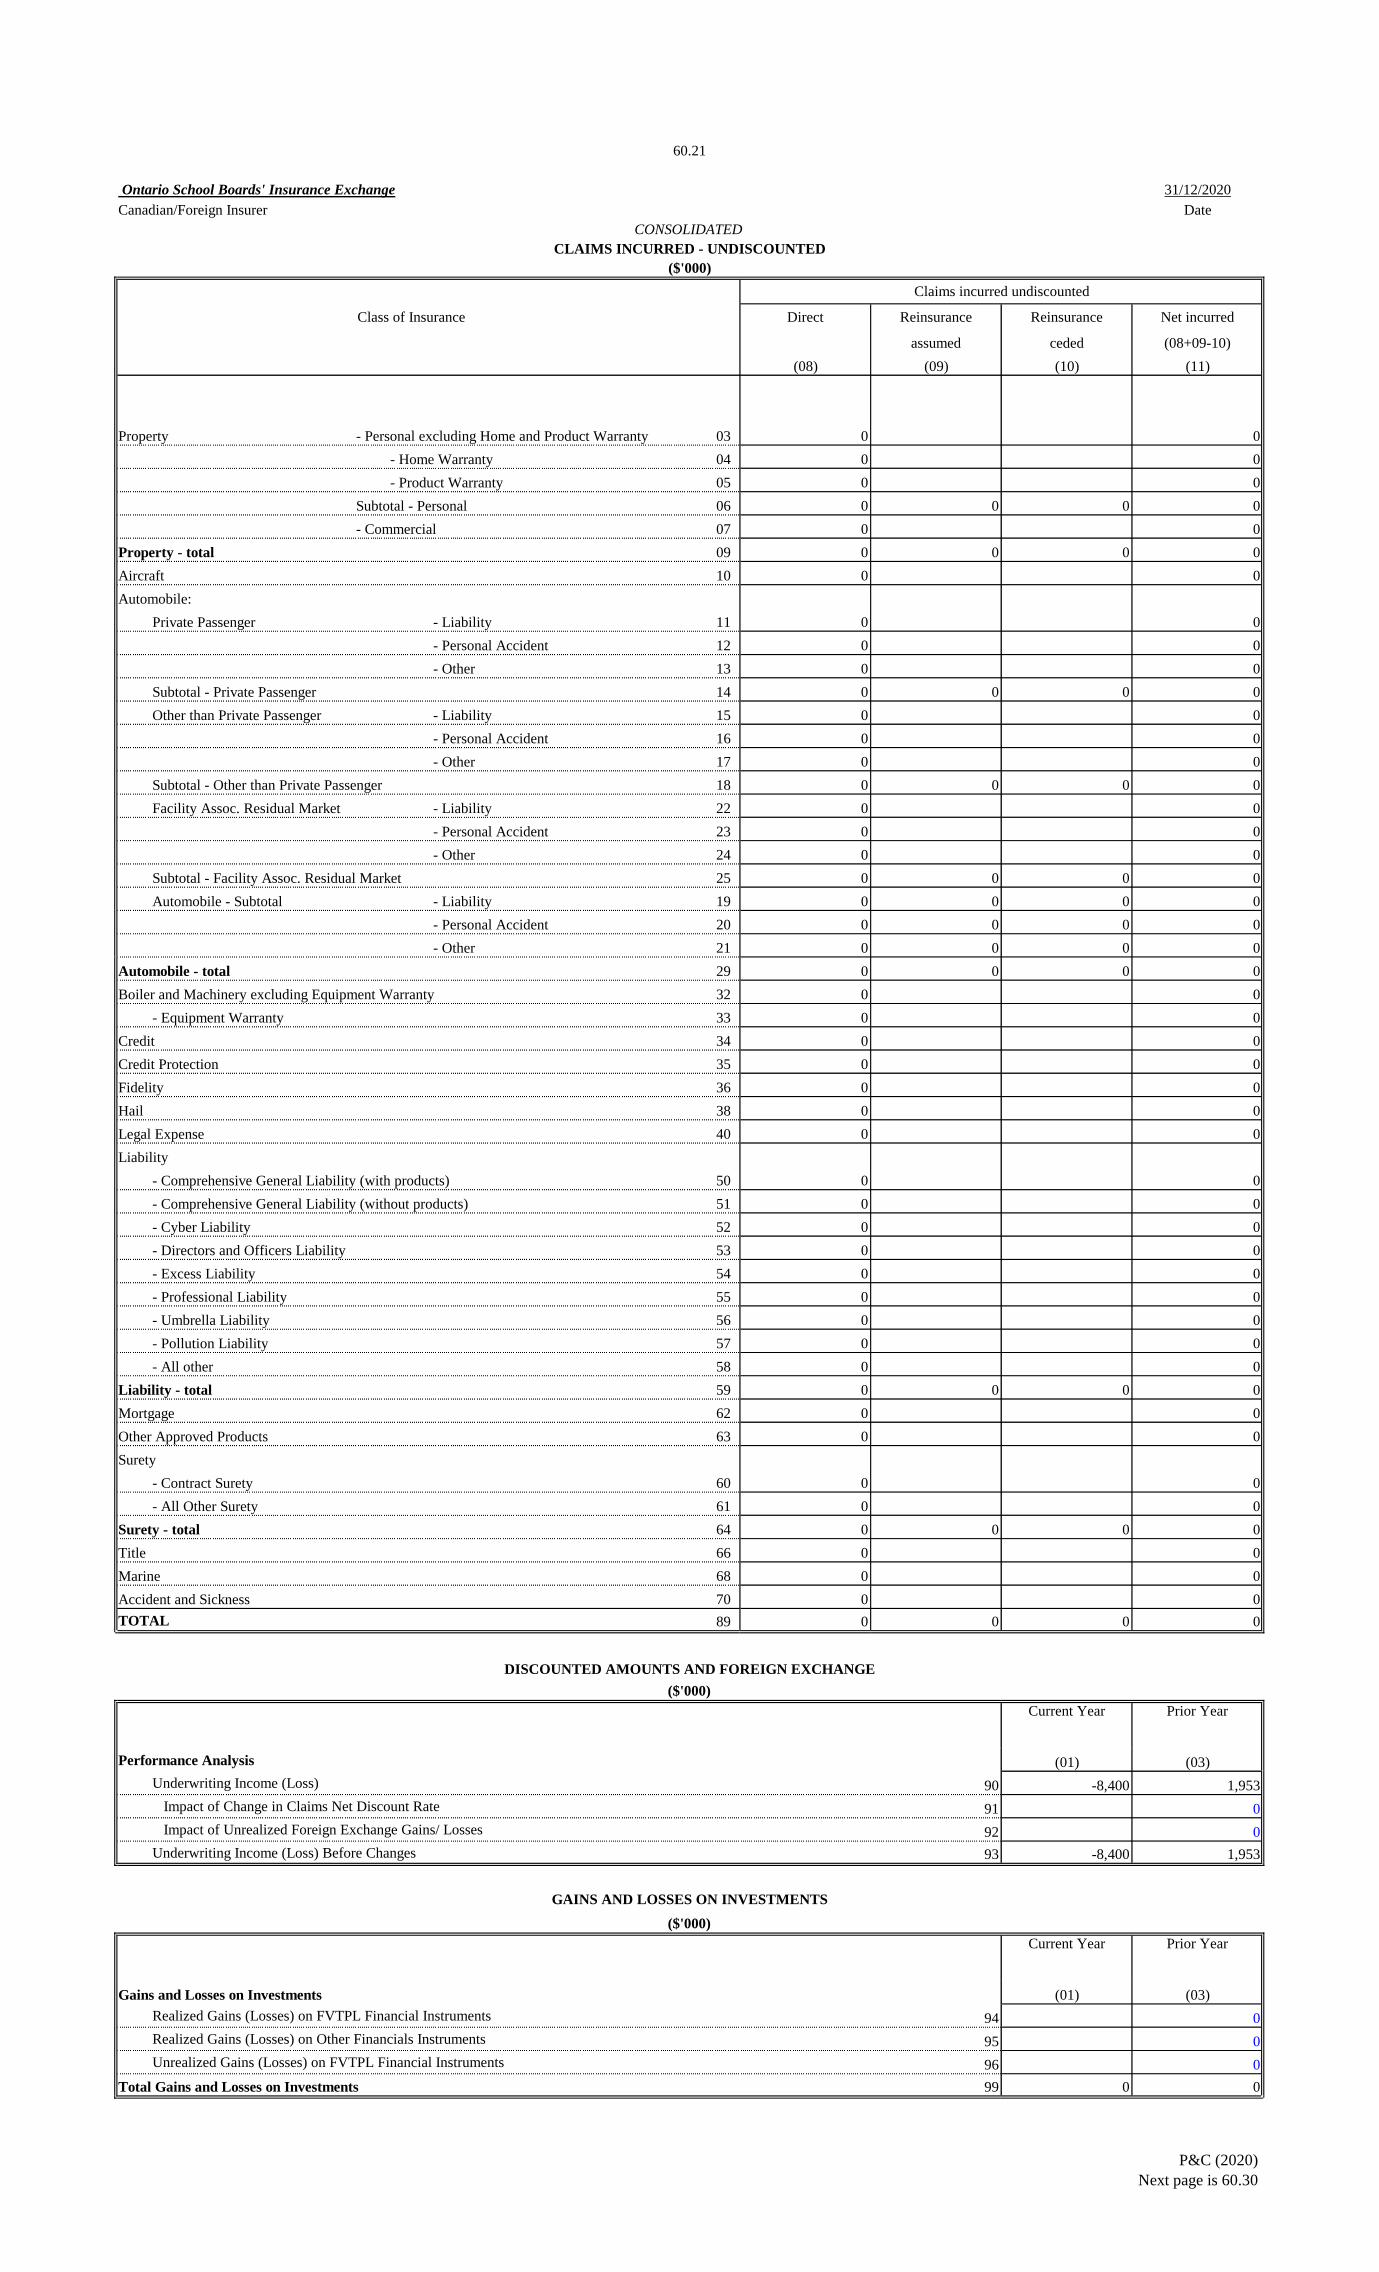
60.21
Ontario School Boards' Insurance Exchange 31/12/2020
Canadian/Foreign Insurer Date
CLAIMS INCURRED - UNDISCOUNTED
Claims incurred undiscounted
Class of Insurance Direct Reinsurance Reinsurance Net incurred
assumed ceded (08+09-10)
(08) (09) (10) (11)
Property - Personal excluding Home and Product Warranty 03 0 0
- Home Warranty 04 0 0
- Product Warranty 05 0 0
Subtotal - Personal 06 0 0 0 0
- Commercial 07 0 0
Property - total 09 0 0 0 0
Aircraft 10 0 0
Automobile:
Private Passenger - Liability 11 0 0
- Personal Accident 12 0 0
- Other 13 0 0
Subtotal - Private Passenger 14 0 0 0 0
Other than Private Passenger - Liability 15 0 0
- Personal Accident 16 0 0
- Other 17 0 0
Subtotal - Other than Private Passenger 18 0 0 0 0
Facility Assoc. Residual Market - Liability 22 0 0
- Personal Accident 23 0 0
- Other 24 0 0
Subtotal - Facility Assoc. Residual Market 25 0 0 0 0
Automobile - Subtotal - Liability 19 0 0 0 0
- Personal Accident 20 0 0 0 0
- Other 21 0 0 0 0
Automobile - total 29 0 0 0 0
Boiler and Machinery excluding Equipment Warranty 32 0 0
- Equipment Warranty 33 0 0
Credit 34 0 0
Credit Protection 35 0 0
Fidelity 36 0 0
Hail 38 0 0
Legal Expense 40 0 0
Liability
- Comprehensive General Liability (with products) 50 0 0
- Comprehensive General Liability (without products) 51 0 0
- Cyber Liability 52 0 0
- Directors and Officers Liability 53 0 0
- Excess Liability 54 0 0
- Professional Liability 55 0 0
- Umbrella Liability 56 0 0
- Pollution Liability 57 0 0
- All other 58 0 0
Liability - total 59 0 0 0 0
Mortgage 62 0 0
Other Approved Products 63 0 0
Surety
- Contract Surety 60 0 0
- All Other Surety 61 0 0
Surety - total 64 0 0 0 0
Title 66 0 0
Marine 68 0 0
Accident and Sickness 70 0 0
TOTAL 89 0 0 0 0
DISCOUNTED AMOUNTS AND FOREIGN EXCHANGE
Performance Analysis (01) (03)
Underwriting Income (Loss) 90 -8,400 1,953
Impact of Change in Claims Net Discount Rate 91 0
Impact of Unrealized Foreign Exchange Gains/ Losses 92 0
Underwriting Income (Loss) Before Changes 93 -8,400 1,953
Gains and Losses on Investments (01) (03)
Realized Gains (Losses) on FVTPL Financial Instruments 94 0
Realized Gains (Losses) on Other Financials Instruments 95 0
Unrealized Gains (Losses) on FVTPL Financial Instruments 96 0
Total Gains and Losses on Investments 99 0 0
Current Year Prior Year
GAINS AND LOSSES ON INVESTMENTS
CONSOLIDATED
($'000)
($'000)
($'000)
Current Year Prior Year
P&C (2020)
Next page is 60.30

60.30
Ontario School Boards' Insurance Exchange 31/12/2020
Canadian/Foreign Insurer Date
CLAIMS AND ADJUSTMENT EXPENSES - PAID, CURRENT YEAR AND UNPAID, CURRENT AND PRIOR YEAR
Claims and adjustment expenses paid - current year Provision for unpaid claims (including unreported) Margin or deficiency for unpaid claims at prior year
and adjustment expenses - current year 3.9600%
Class of Insurance Direct Reinsurance Reinsurance Net Direct Reinsurance Reinsurance Net Net provision Net amount Investment Net provision Margin or
assumed ceded (01+02-03) assumed ceded (05+06-07) at prior paid during income on for claims of (Deficiency)
year end the year for unpaid claims prior years
claims of of prior years
prior years
(01) (02) (03) (04) (05) (06) (07) (08) (09) (11) (10) (13) (15) (19)
Property - Personal excluding Home and Product Warranty 03 0 0 0 0 0
- Home Warranty 04 0 0 0 0 0
- Product Warranty 05 0 0 0 0 0
Subtotal - Personal 06 0 0 0 0 0 0 0 0 0 0 0 0 0 0
- Commercial 07 7,461 7,461 13,388 2,941 10,447 2,910 2,730 73 -386 639
Property - total 09 7,461 0 0 7,461 13,388 0 2,941 10,447 2,910 0 2,730 73 -386 639
Aircraft 10 0 0 0 0 0
Automobile:
Private Passenger - Liability 11 0 0 0 0 0
- Personal Accident 12 0 0 0 0 0
- Other 13 0 0 0 0 0
Subtotal - Private Passenger 14 0 0 0 0 0 0 0 0 0 0 0 0 0 0
Other than Private Passenger - Liability 15 301 301 921 921 919 157 41 493 310
- Personal Accident 16 0 0 0 0 0
- Other 17 0 23 23 83 15 2 70
Subtotal - Other than Private Passenger 18 301 0 0 301 944 0 0 944 1,002 0 172 43 493 380
Facility Assoc. Residual Market - Liability 22 0 0 0 0 0
- Personal Accident 23 0 0 0 0 0
- Other 24 0 0 0 0 0
Subtotal - Facility Assoc. Residual Market 25 0 0 0 0 0 0 0 0 0 0 0 0 0 0
Automobile - Subtotal - Liability 19 301 0 0 301 921 0 0 921 919 0 157 41 493 310
- Personal Accident 20 0 0 0 0 0 0 0 0 0 0 0 0 0 0
- Other 21 0 0 0 0 23 0 0 23 83 0 15 2 0 70
Automobile - total 29 301 0 0 301 944 0 0 944 1,002 0 172 43 493 380
Boiler and Machinery excluding Equipment Warranty 32 280 20 260 -16 2 -18 -452 126 -25 -409 -194
- Equipment Warranty 33 0 0 0 0 0
Credit 34 0 0 0 0 0
Credit Protection 35 0 0 0 0 0
Fidelity 36 996 996 145 145 670 997 19 -1 -307
Hail 38 0 0 0 0 0
Legal Expense 40 223 223 1,004 1,004 469 119 25 400 -25
Liability
- Comprehensive General Liability (with products) 50 18,549 197 18,352 87,479 87,479 86,154 17,506 4,740 77,021 -3,633
- Comprehensive General Liability (without products) 51 0 0 0 0 0
- Cyber Liability 52 793 793 50 50 660 793 21 50 -162
- Directors and Officers Liability 53 0 0 0 0 0
- Excess Liability 54 0 0 0 0 0
- Professional Liability 55 0 0 0 0 0
- Umbrella Liability 56 0 0 0 0 0
- Pollution Liability 57 0 0 0 0 0
- All other 58 0 0 0 0 0
Liability - total 59 19,342 0 197 19,145 87,529 0 0 87,529 86,814 0 18,299 4,761 77,071 -3,795
Mortgage 62 0 0 0 0 0
Other Approved Products 63 0 0 0 0 0
Surety
- Contract Surety 60 0 0 0 0 0
- All Other Surety 61 0 0 0 0 0
Surety - total 64 0 0 0 0 0 0 0 0 0 0 0 0 0 0
Title 66 0 0 0 0 0
Marine 68 0 0 0 0 0
Accident and Sickness 70 0 0 0 0 0
TOTAL 89 28,603 0 217 28,386 102,994 0 2,943 100,051 91,413 0 22,443 4,896 77,168 -3,302
Out of Canada Liabilities 80 0 0 0 0 0
CONSOLIDATED
($'000)
Net provision for
portfolio acquisition/
disposition at
transaction date (09+11-10+13-15)
P&C (2020)
Next page is 60.40

Ontario School Boards' Insurance Exchange 31/12/2020
Canadian/Foreign Insurer 2,020 Date
2015 2016 2016 2017 2017 2018 2018 2019 2019 2020 2020
and and prior and prior and prior and prior and prior
prior years (02)+(03) (04)+(05) (06)+(07) (08)+(09) (10)+(11)
(02) (03) (04) (05) (06) (07) (08) (09) (10) (11) (12)
2015 * UCAE, end of year 01 0
IBNR, end of year 02 0
2016 Portfolio Acquisition/Disposition 05 0 0 0
Paid during year 10 0 0 0
UCAE, end of year 11 0 0 0
IBNR, end of year 12 0 0 0
Ratio: excess (deficiency) 19 0.00%
2017 Portfolio Acquisition/Disposition 15 0 0 0 0 0
Paid during year 20 0 0 0 0 0
UCAE, end of year 21 0 0 0 0 0
IBNR, end of year 22 0 0 0 0 0
Ratio: excess (deficiency) 29 0.00% 0.00%
2018 Portfolio Acquisition/Disposition 25 0 0 0 0 0 0 0
Paid during year 30 0 0 0 0 0 0 0
UCAE, end of year 31 0 0 0 0 0 0 0
IBNR, end of year 32 0 0 0 0 0 0 0
Ratio: excess (deficiency) 39 0.00% 0.00% 0.00%
2019 Portfolio Acquisition/Disposition 35 0 0 0 0 0 0 0 0 0
Paid during year 40 0 0 0 0 0 0 0 0 0
UCAE, end of year 41 0 0 0 0 0 0 0 0 0
IBNR, end of year 42 0 0 0 0 0 0 0 0 0
Ratio: excess (deficiency) 49 0.00% 0.00% 0.00% 0.00%
2020 Portfolio Acquisition/Disposition 45 0 0 0 0 0
Paid during year 50 0 0 0 0 0
UCAE, end of year 51 0 0 0 0 0
IBNR, end of year 52 0 0 0 0 0
Ratio: excess (deficiency) 59 0.00% 0.00% 0.00% 0.00% 0.00% 0.00% 0.00% 0.00% 0.00%
*UCAE = Unpaid Claims and Adjustment Expenses (excluding IBNR).
CONSOLIDATED
($'000)
NET CLAIMS AND ADJUSTMENT EXPENSES RUN-OFF
60.40
P&C (2020)
Next page is 60.41
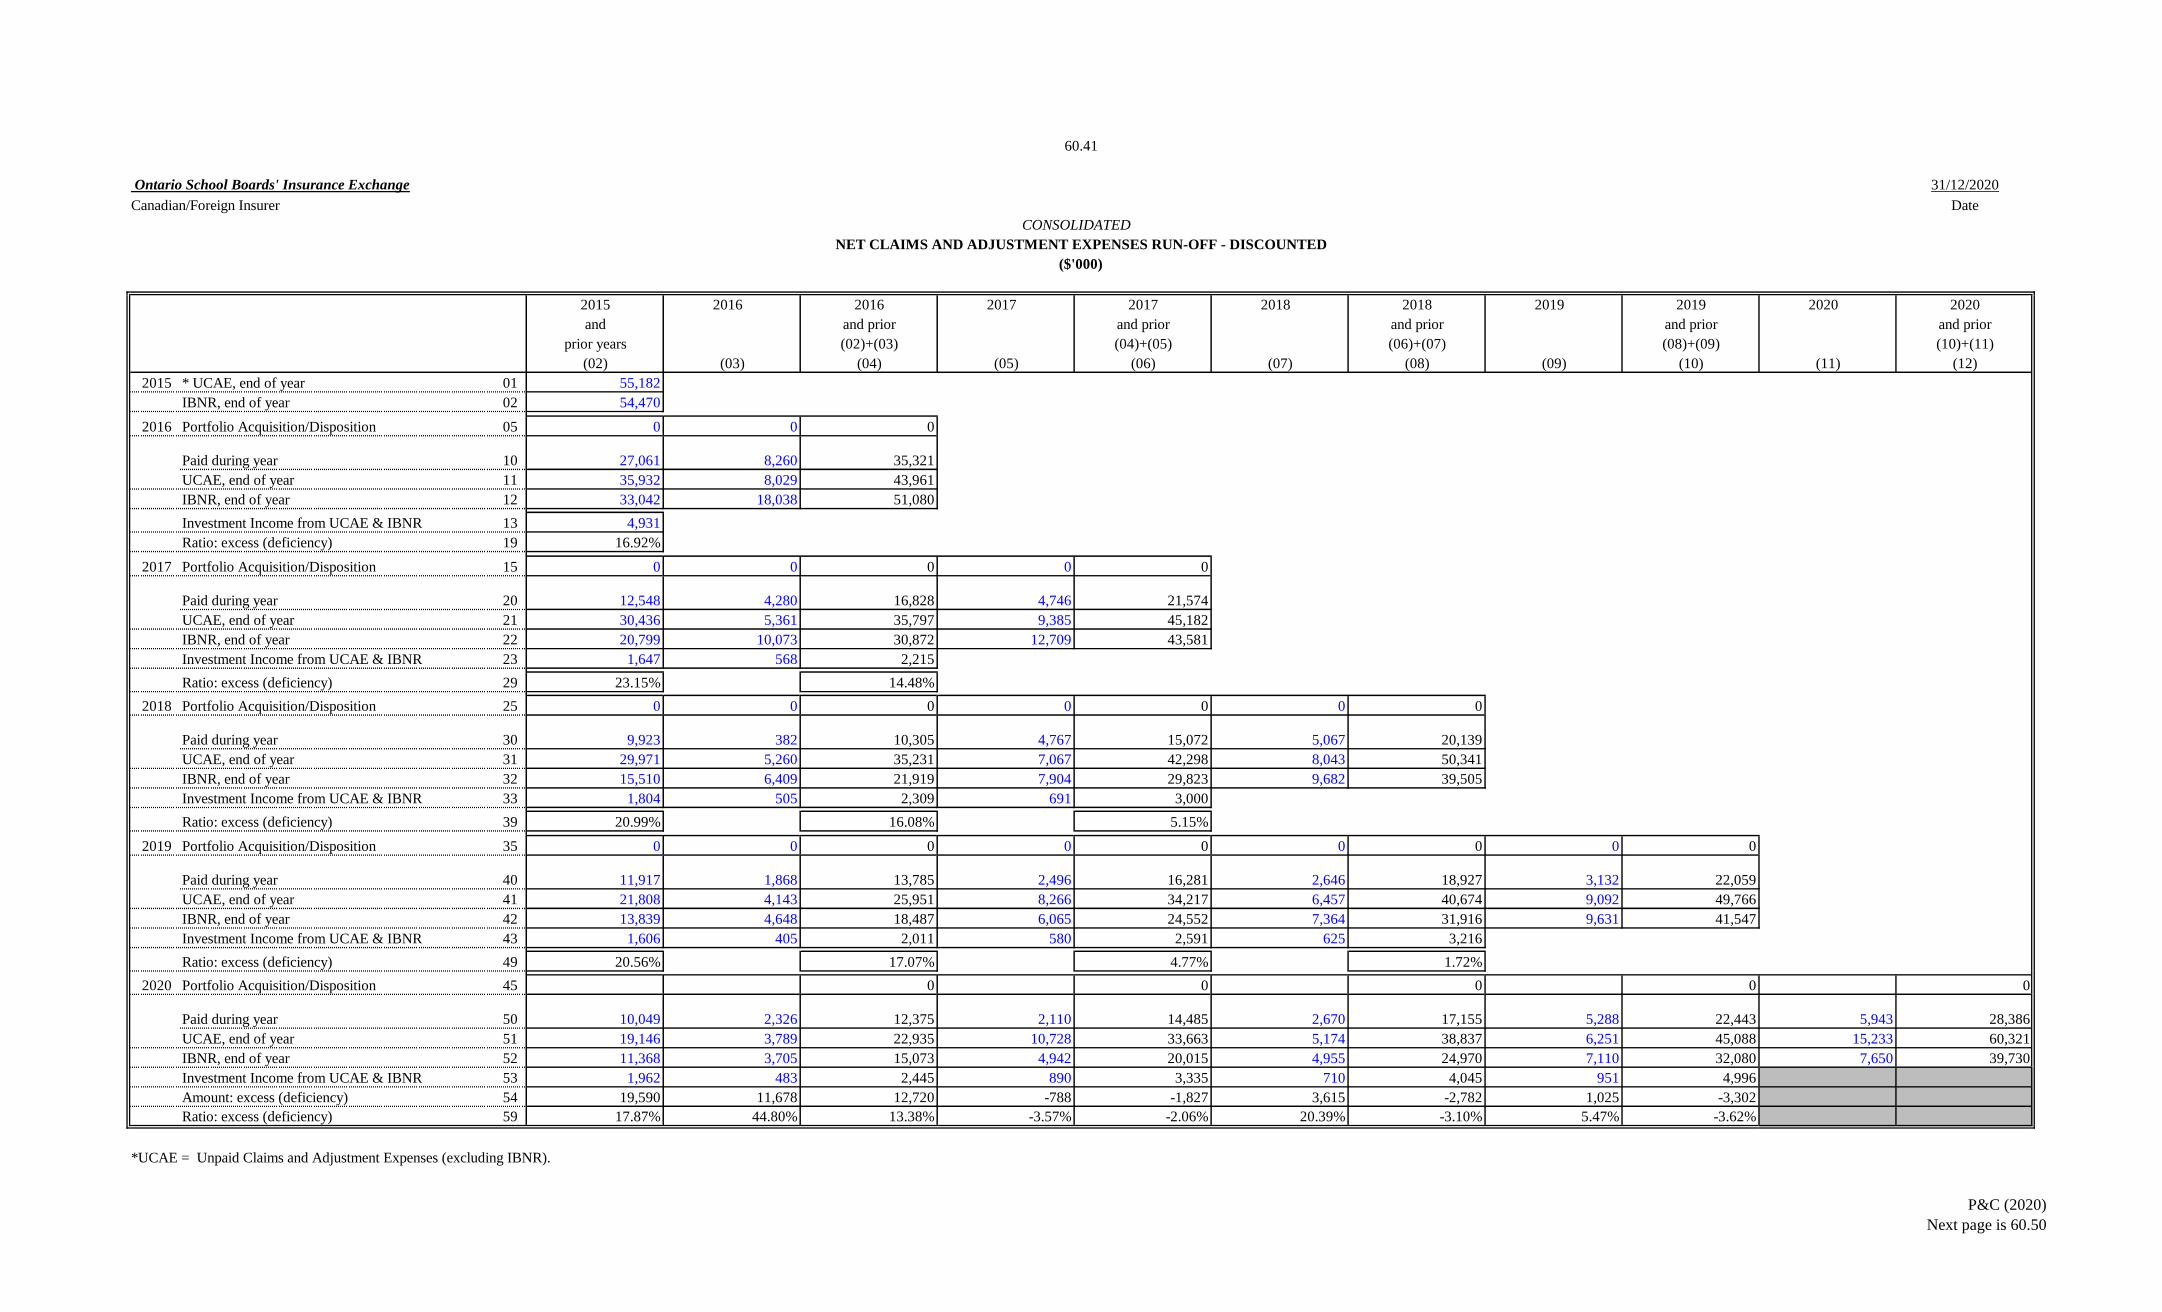
Ontario School Boards' Insurance Exchange 31/12/2020
Canadian/Foreign Insurer 2,020 Date
2015 2016 2016 2017 2017 2018 2018 2019 2019 2020 2020
and and prior and prior and prior and prior and prior
prior years (02)+(03) (04)+(05) (06)+(07) (08)+(09) (10)+(11)
(02) (03) (04) (05) (06) (07) (08) (09) (10) (11) (12)
2015 * UCAE, end of year 01 55,182
IBNR, end of year 02 54,470
2016 Portfolio Acquisition/Disposition 05 0 0 0
Paid during year 10 27,061 8,260 35,321
UCAE, end of year 11 35,932 8,029 43,961
IBNR, end of year 12 33,042 18,038 51,080
Investment Income from UCAE & IBNR 13 4,931
Ratio: excess (deficiency) 19 16.92%
2017 Portfolio Acquisition/Disposition 15 0 0 0 0 0
Paid during year 20 12,548 4,280 16,828 4,746 21,574
UCAE, end of year 21 30,436 5,361 35,797 9,385 45,182
IBNR, end of year 22 20,799 10,073 30,872 12,709 43,581
Investment Income from UCAE & IBNR 23 1,647 568 2,215
Ratio: excess (deficiency) 29 23.15% 14.48%
2018 Portfolio Acquisition/Disposition 25 0 0 0 0 0 0 0
Paid during year 30 9,923 382 10,305 4,767 15,072 5,067 20,139
UCAE, end of year 31 29,971 5,260 35,231 7,067 42,298 8,043 50,341
IBNR, end of year 32 15,510 6,409 21,919 7,904 29,823 9,682 39,505
Investment Income from UCAE & IBNR 33 1,804 505 2,309 691 3,000
Ratio: excess (deficiency) 39 20.99% 16.08% 5.15%
2019 Portfolio Acquisition/Disposition 35 0 0 0 0 0 0 0 0 0
Paid during year 40 11,917 1,868 13,785 2,496 16,281 2,646 18,927 3,132 22,059
UCAE, end of year 41 21,808 4,143 25,951 8,266 34,217 6,457 40,674 9,092 49,766
IBNR, end of year 42 13,839 4,648 18,487 6,065 24,552 7,364 31,916 9,631 41,547
Investment Income from UCAE & IBNR 43 1,606 405 2,011 580 2,591 625 3,216
Ratio: excess (deficiency) 49 20.56% 17.07% 4.77% 1.72%
2020 Portfolio Acquisition/Disposition 45 0 0 0 0 0
Paid during year 50 10,049 2,326 12,375 2,110 14,485 2,670 17,155 5,288 22,443 5,943 28,386
UCAE, end of year 51 19,146 3,789 22,935 10,728 33,663 5,174 38,837 6,251 45,088 15,233 60,321
IBNR, end of year 52 11,368 3,705 15,073 4,942 20,015 4,955 24,970 7,110 32,080 7,650 39,730
Investment Income from UCAE & IBNR 53 1,962 483 2,445 890 3,335 710 4,045 951 4,996
Amount: excess (deficiency) 54 19,590 11,678 12,720 -788 -1,827 3,615 -2,782 1,025 -3,302
Ratio: excess (deficiency) 59 17.87% 44.80% 13.38% -3.57% -2.06% 20.39% -3.10% 5.47% -3.62%
*UCAE = Unpaid Claims and Adjustment Expenses (excluding IBNR).
CONSOLIDATED
NET CLAIMS AND ADJUSTMENT EXPENSES RUN-OFF - DISCOUNTED
60.41
($'000)
P&C (2020)
Next page is 60.50

Ontario School Boards' Insurance Exchange 31/12/2020
Canadian/Foreign Insurer Date
(01)
Paid Adjustment Expenses
Internal adjustment expenses 01 1,659
External adjustment expenses
a. Adjusters and Appraisers 10 1,385
b. Legal 11 2,645
c. Other 12
Total (lines 10+11+12) 19 4,030
Total Paid Adjustment Expenses (lines 01+19) 39 5,689
Unpaid Adjustment Expenses
Provision for internal adjustment expenses - end of year 40 2,457
Provision for external adjustment expenses - end of year 41 753
42 2,312
43 852
Total (lines 40+41-42-43) 49 46
TOTAL ADJUSTMENT EXPENSES INCURRED (Line 39+49) 59 5,735
Internal adjustment expenses incurred (lines 01+40-42) 69 1,804
External adjustment expenses incurred (lines 19+41-43) 79 3,931
60.50
CONSOLIDATED
Provision for internal adjustment expenses - beginning of year
Provision for external adjustment expenses - beginning of year
DIRECT ADJUSTMENT EXPENSES
($'000)
P&C (2020)
Next page is 67.10

67.10
Ontario School Boards' Insurance Exchange 31/12/2020
Canadian/Foreign Insurer Date
PROVINCIAL AND TERRITORIAL EXHIBIT OF PREMIUMS WRITTEN
Ontario Manitoba Saskatchewan Alberta Yukon Nunavut Total
Class of Insurance
(01) (02) (03) (04) (05) (06) (07) (08) (09) (10) (11) (12) (14) (18) (19)
LICENSED (Y/N) 01 N N N N N Y N N N N N N N N
Property - Personal excluding Home and Product Warranty 03 0
- Home Warranty 04 0
- Product Warranty 05 0
Subtotal - Personal 06 0 0 0 0 0 0 0 0 0 0 0 0 0 0
- Commercial 07 10,914 10,914
Property - total 09 0 0 0 0 0 10,914 0 0 0 0 0 0 0 0 10,914
Aircraft 10 0
Automobile:
Private Passenger - Liability 11 0
- Personal Accident 12 0
- Other 13 0
Subtotal - Private Passenger 14 0 0 0 0 0 0 0 0 0 0 0 0 0 0 0
Other than Private Passenger - Liability 15 450 450
- Personal Accident 16 149 149
- Other 17 441 441
Subtotal - Other than Private Passenger 18 0 0 0 0 0 1,040 0 0 0 0 0 0 0 0 1,040
Facility Assoc. Residual Market - Liability 22 0
- Personal Accident 23 0
- Other 24 0
Subtotal - Facility Assoc. Residual Market 25 0 0 0 0 0 0 0 0 0 0 0 0 0
Automobile - Subtotal - Liability 19 0 0 0 0 0 450 0 0 0 0 0 0 0 0 450
- Personal Accident 20 0 0 0 0 0 149 0 0 0 0 0 0 0 0 149
- Other 21 0 0 0 0 0 441 0 0 0 0 0 0 0 0 441
Automobile - total 29 0 0 0 0 0 1,040 0 0 0 0 0 0 0 0 1,040
Boiler and Machinery excluding Equipment Warranty 32 793 793
- Equipment Warranty 33 0
Credit 34 0
Credit Protection 35 0
Fidelity 36 905 905
Hail 38 0
Legal Expense 40 1,013 1,013
Liability
- Comprehensive General Liability (with products) 50 19,195 19,195
- Comprehensive General Liability (without products) 51 0
- Cyber Liability 52 537 537
- Directors and Officers Liability 53 0
- Excess Liability 54 0
- Professional Liability 55 0
- Umbrella Liability 56 0
- Pollution Liability 57 0
- All other 58 0
Liability - total 59 0 0 0 0 0 19,732 0 0 0 0 0 0 0 0 19,732
Mortgage 62 0
Other Approved Products 63 0
Surety
- Contract Surety 60 0
- All Other Surety 61 0
Surety - total 64 0 0 0 0 0 0 0 0 0 0 0 0 0 0 0
Title 66 0
Marine 68 0
Accident and Sickness 70 0
Total - direct 79 0 0 0 0 0 34,397 0 0 0 0 0 0 0 0 34,397
Reinsurance assumed 87 0
Reinsurance ceded 88 1,873 1,873
TOTAL - NET 89 0 0 0 0 0 32,524 0 0 0 0 0 0 0 0 32,524
Dividends - direct 99 0
CONSOLIDATED
($'000)
Newfoundland &
Labrador
Prince Edward Island Nova Scotia New Brunswick Quebec British Columbia Northwest Territories Out of Canada
P&C (2020)
Next page is 67.20

67.20
Ontario School Boards' Insurance Exchange 31/12/2020
Canadian/Foreign Insurer Date
PROVINCIAL AND TERRITORIAL EXHIBIT OF PREMIUMS EARNED
Ontario Manitoba Saskatchewan Alberta Yukon Nunavut Total
Class of Insurance
(01) (02) (03) (04) (05) (06) (07) (08) (09) (10) (11) (12) (14) (18) (19)
Property - Personal excluding Home and Product Warranty 03 0
- Home Warranty 04 0
- Product Warranty 05 0
Subtotal - Personal 06 0 0 0 0 0 0 0 0 0 0 0 0 0 0
- Commercial 07 10,914 10,914
Property - total 09 0 0 0 0 0 10,914 0 0 0 0 0 0 0 0 10,914
Aircraft 10 0
Automobile:
Private Passenger - Liability 11 0
- Personal Accident 12 0
- Other 13 0
Subtotal - Private Passenger 14 0 0 0 0 0 0 0 0 0 0 0 0 0 0 0
Other than Private Passenger - Liability 15 450 450
- Personal Accident 16 149 149
- Other 17 441 441
Subtotal - Other than Private Passenger 18 0 0 0 0 0 1,040 0 0 0 0 0 0 0 0 1,040
Facility Assoc. Residual Market - Liability 22 0
- Personal Accident 23 0
- Other 24 0
Subtotal - Facility Assoc. Residual Market 25 0 0 0 0 0 0 0 0 0 0 0 0 0
Automobile - Subtotal - Liability 19 0 0 0 0 0 450 0 0 0 0 0 0 0 0 450
- Personal Accident 20 0 0 0 0 0 149 0 0 0 0 0 0 0 0 149
- Other 21 0 0 0 0 0 441 0 0 0 0 0 0 0 0 441
Automobile - total 29 0 0 0 0 0 1,040 0 0 0 0 0 0 0 0 1,040
Boiler and Machinery excluding Equipment Warranty 32 793 793
- Equipment Warranty 33 0
Credit 34 0
Credit Protection 35 0
Fidelity 36 905 905
Hail 38 0
Legal Expense 40 1,013 1,013
Liability
- Comprehensive General Liability (with products) 50 19,195 19,195
- Comprehensive General Liability (without products) 51 0
- Cyber Liability 52 537 537
- Directors and Officers Liability 53 0
- Excess Liability 54 0
- Professional Liability 55 0
- Umbrella Liability 56 0
- Pollution Liability 57 0
- All other 58 0
Liability - total 59 0 0 0 0 0 19,732 0 0 0 0 0 0 0 0 19,732
Mortgage 62 0
Other Approved Products 63 0
Surety
- Contract Surety 60 0
- All Other Surety 61 0
Surety - total 64 0 0 0 0 0 0 0 0 0 0 0 0 0 0 0
Title 66 0
Marine 68 0
Accident and Sickness 70 0
Total - direct 79 0 0 0 0 0 34,397 0 0 0 0 0 0 0 0 34,397
Reinsurance assumed 87 0
Reinsurance ceded 88 1,873 1,873
TOTAL - NET 89 0 0 0 0 0 32,524 0 0 0 0 0 0 0 0 32,524
CONSOLIDATED
($'000)
Newfoundland & Labrador Prince Edward Island Nova Scotia New Brunswick Quebec British Columbia Northwest Territories Out of Canada
P&C (2020)
Next page is 67.30

67.30
Ontario School Boards' Insurance Exchange 31/12/2020
Canadian/Foreign Insurer Date
PROVINCIAL AND TERRITORIAL EXHIBIT OF CLAIMS INCURRED INCLUDING ADJUSTMENT EXPENSES
Ontario Manitoba Saskatchewan Alberta Yukon Nunavut Total
(01) (02) (03) (04) (05) (06) (07) (08) (09) (10) (11) (12) (14) (18) (19)
Property - Personal excluding Home and Product Warranty 03 0
- Home Warranty 04 0
- Product Warranty 05 0
Subtotal - Personal 06 0 0 0 0 0 0 0 0 0 0 0 0 0 0
- Commercial 07 17,939 17,939
Property - total 09 0 0 0 0 0 17,939 0 0 0 0 0 0 0 0 17,939
Aircraft 10 0
Automobile:
Private Passenger - Liability 11 0
- Personal Accident 12 0
- Other 13 0
Subtotal - Private Passenger 14 0 0 0 0 0 0 0 0 0 0 0 0 0 0 0
Other than Private Passenger - Liability 15 213 213
- Personal Accident 16 0
- Other 17 30 30
Subtotal - Other than Private Passenger 18 0 0 0 0 0 243 0 0 0 0 0 0 0 0 243
Facility Assoc. Residual Market - Liability 22 0
- Personal Accident 23 0
- Other 24 0
Subtotal - Facility Assoc. Residual Market 25 0 0 0 0 0 0 0 0 0 0 0 0 0
Automobile - Subtotal - Liability 19 0 0 0 0 0 213 0 0 0 0 0 0 0 0 213
- Personal Accident 20 0 0 0 0 0 0 0 0 0 0 0 0 0 0 0
- Other 21 0 0 0 0 0 30 0 0 0 0 0 0 0 0 30
Automobile - total 29 0 0 0 0 0 243 0 0 0 0 0 0 0 0 243
Boiler and Machinery excluding Equipment Warranty 32 471 471
- Equipment Warranty 33 0
Credit 34 0
Credit Protection 35 0
Fidelity 36 472 472
Hail 38 0
Legal Expense 40 750 750
Liability
- Comprehensive General Liability (with products) 50 19,981 19,981
- Comprehensive General Liability (without products) 51 0
- Cyber Liability 52 183 183
- Directors and Officers Liability 53 0
- Excess Liability 54 0
- Professional Liability 55 0
- Umbrella Liability 56 0
- Pollution Liability 57 0
- All other 58 0
Liability - total 59 0 0 0 0 0 20,164 0 0 0 0 0 0 0 0 20,164
Mortgage 62 0
Other Approved Products 63 0
Surety
- Contract Surety 60 0
- All Other Surety 61 0
Surety - total 64 0 0 0 0 0 0 0 0 0 0 0 0 0 0 0
Title 66 0
Marine 68 0
Accident and Sickness 70 0
Total - direct 79 0 0 0 0 0 40,039 0 0 0 0 0 0 0 0 40,039
Reinsurance assumed 87 0
Reinsurance ceded 88 2,915 2,915
TOTAL - NET 89 0 0 0 0 0 37,124 0 0 0 0 0 0 0 0 37,124
CONSOLIDATED
($'000)
Newfoundland & Labrador Prince Edward Island Nova Scotia New Brunswick Quebec British Columbia Northwest Territories Out of Canada
Class of Insurance
P&C (2020)
Next page is 67.31

Ontario School Boards' Insurance Exchange 31/12/2020
Canadian/Foreign Insurer Date
Ontario Manitoba Saskatchewan Alberta Yukon Nunavut Total
(01) (02) (03) (04) (05) (06) (07) (08) (09) (10) (11) (12) (14) (18) (19)
Property - Personal excluding Home and Product Warranty 03 0
- Home Warranty 04 0
- Product Warranty 05 0
Subtotal - Personal 06 0 0 0 0 0 0 0 0 0 0 0 0 0 0
- Commercial 07 0
Property - total 09 0 0 0 0 0 0 0 0 0 0 0 0 0 0 0
Aircraft 10 0
Automobile:
Private Passenger - Liability 11 0
- Personal Accident 12 0
- Other 13 0
Subtotal - Private Passenger 14 0 0 0 0 0 0 0 0 0 0 0 0 0 0 0
Other than Private Passenger - Liability 15 0
- Personal Accident 16 0
- Other 17 0
Subtotal - Other than Private Passenger 18 0 0 0 0 0 0 0 0 0 0 0 0 0 0 0
Facility Assoc. Residual Market - Liability 22 0
- Personal Accident 23 0
- Other 24 0
Subtotal - Facility Assoc. Residual Market 25 0 0 0 0 0 0 0 0 0 0 0 0 0
Automobile - Subtotal - Liability 19 0 0 0 0 0 0 0 0 0 0 0 0 0 0 0
- Personal Accident 20 0 0 0 0 0 0 0 0 0 0 0 0 0 0 0
- Other 21 0 0 0 0 0 0 0 0 0 0 0 0 0 0 0
Automobile - total 29 0 0 0 0 0 0 0 0 0 0 0 0 0 0 0
Boiler and Machinery excluding Equipment Warranty 32 0
- Equipment Warranty 33 0
Credit 34 0
Credit Protection 35 0
Fidelity 36 0
Hail 38 0
Legal Expense 40 0
Liability
- Comprehensive General Liability (with products) 50 0
- Comprehensive General Liability (without products) 51 0
- Cyber Liability 52 0
- Directors and Officers Liability 53 0
- Excess Liability 54 0
- Professional Liability 55 0
- Umbrella Liability 56 0
- Pollution Liability 57 0
- All other 58 0
Liability - total 59 0 0 0 0 0 0 0 0 0 0 0 0 0 0 0
Mortgage 62 0
Other Approved Products 63 0
Surety
- Contract Surety 60 0
- All Other Surety 61 0
Surety - total 64 0 0 0 0 0 0 0 0 0 0 0 0 0 0 0
Title 66 0
Marine 68 0
Accident and Sickness 70 0
Total - direct 79 0 0 0 0 0 0 0 0 0 0 0 0 0 0 0
Reinsurance assumed 87 0
Reinsurance ceded 88 0
TOTAL - NET 89 0 0 0 0 0 0 0 0 0 0 0 0 0 0 0
67.31
CONSOLIDATED
($'000)
Newfoundland & Labrador Prince Edward Island Nova Scotia New Brunswick Quebec British Columbia Northwest Territories Out of Canada
PROVINCIAL AND TERRITORIAL EXHIBIT OF CLAIMS INCURRED INCLUDING ADJUSTMENT EXPENSES - UNDISCOUNTED
Class of Insurance
P&C (2020)
Next page is 70.10

70.10
Ontario School Boards' Insurance Exchange 31/12/2020
Canadian/Foreign Insurer Date
PREMIUMS AND CLAIMS - REINSURANCE CEDED
($'000)
Premiums earned Claims incurred
Line of Business Quota Share Surplus Excess of Facultative Total Quota Share Surplus Excess of Facultative Total
(01) (02) (03) (04) (05) (06) (07) (08) (09) (10) (11)
0 0
Property 1,013 1,013 2,941 2,941
Cyber 269 269 0
Boiler 0 -26 -26
Liability 500 500 0 0
Auto 91 91 0
0 0
0 0
0 0
0 0
0 0
0 0
0 0
TOTAL 89 269 0 1,604 0 1,873 -26 0 2,941 0 2,915
CONSOLIDATED
P&C (2020)
Next page is 70.21A

70.21 A
Ontario School Boards' Insurance Exchange 31/12/2020
Canadian/Foreign Insurer Date
SUMMARY OF INTRAGROUP REINSURANCE
($'000)
Premiums Claims Unearned Outstanding Premiums Claims Unearned Outstanding
ceded to incurred by premiums losses assumed incurred by premiums losses
assuming assuming ceded to recoverable from other by ceding assumed payable
insurer insurer assuming from assuming insurer insurer from other to ceding
insurer insurer insurer insurer
(20) (21) (22) (23) (02) (03) (04) (05) (06) (07) (08) (09)
Registered
Total Registered 29 0 0 0 0 0 0 0 0
(01)
Reinsurance Ceded Reinsurance Assumed
CONSOLIDATED
Rating Agency Identifier Code
A.M.
Best
Code
S&P
Code
Other
Code
UnratedName of insurer
P&C (2020)
Next page is 70.21B

70.21 B
Ontario School Boards' Insurance Exchange 31/12/2020
Canadian/Foreign Insurer Date
SUMMARY OF INTRAGROUP REINSURANCE
($'000)
Name of insurer Premiums Claims Unearned Outstanding Premiums Claims Unearned Outstanding
ceded to incurred by premiums losses assumed incurred by premiums losses
assuming assuming ceded to recoverable from other by ceding assumed payable
insurer insurer assuming from assuming insurer insurer from other to ceding
insurer insurer insurer insurer
(01) (20) (21) (22) (23) (02) (03) (04) (05) (06) (07) (08) (09)
Unregistered
Total Unregistered 39 0 0 0 0 0 0 0 0
Total 79 0 0 0 0 0 0 0 0
Reinsurance Ceded Reinsurance Assumed
CONSOLIDATED
Rating Agency Identifier Code
A.M.
Best
Code
S&P
Code
Other
Code
Unrated
P&C (2020)
Next page is 70.50A

Ontario School Boards' Insurance Exchange 31/12/2020
Canadian/Foreign Insurer Date
Name of Assuming Insurer A.M.
Best
Code
S&P
Code
Other
Code
Unrated Reinsurer
Domiciliary
Jurisdiction
Reinsurer
Group
Domiciliary
Jurisdiction
Business
Covered
Type of
contract
Reinsurance
Premiums
Ceded
Unearned
Premiums
ceded to
assuming
insurer
Outstanding
losses
recoverable
from assuming
insurer
Reinsurance
Receivable
Reinsurance
Payable
Net
Receivable
Aging of
Reinsurance
Asset
(01) (02) (04) (06) (08) (10) (12) (14) (16) (18) (20) (22) (24) (26) (28) (30)
Associated and Non-qualifying subsidiary
Total Associated and Non-qualifying subsidiary 09 0 0 0 0 0 0 0
70.50 A
REINSURANCE CEDED SUMMARY
REGISTERED REINSURANCE
Rating Agency Identifier Code Receivables
P&C (2020)
Next page is 70.50B

Ontario School Boards' Insurance Exchange 31/12/2020
Canadian/Foreign Insurer Date
Name of Assuming Insurer A.M.
Best
Code
S&P
Code
Other
Code
Unrated Reinsurer
Domiciliary
Jurisdiction
Reinsurer
Group
Domiciliary
Jurisdiction
Business
Covered
Type of
contract
Reinsurance
Premiums
Ceded
Unearned
Premiums
ceded to
assuming
insurer
Outstanding
losses
recoverable
from assuming
insurer
Reinsurance
Receivable
Reinsurance
Payable
Net
Receivable
Aging of
Reinsurance
Asset
(01) (02) (04) (06) (08) (10) (12) (14) (16) (18) (20) (22) (24) (26) (28) (30)
Non-associated and Non-subsidiary
RSA A CA UK PROPERTY EXCESS 1,013 2,941
AIG A CA US CYBER QS 269
AVIVA A CA UK BOILER QS 2 105 105
Catlin A+ CA UK LIAB/AUTO EXCESS 12
RSA A CA UK LIAB/AUTO EXCESS 30
CV Starr (LIoyd's) A CA UK LIAB/AUTO EXCESS 89
AXIS A+ CA UK AUTO EXCESS 16
QBE (LIoyd's) A CA UK LIAB/AUTO EXCESS 179
Amlin (LIoyd's) A CA UK LIAB/AUTO EXCESS 107
XL Catlin A+ CA UK LIAB/AUTO EXCESS 62
Aegis (Lloyd's) A- CA UK LIAB/AUTO EXCESS 96
Lioyds A CA UK LIAB EXCESS 0
Everest Re A+ CA BERMUDA LIAB EXCESS 33 33
Scor Re A CA UK LIAB EXCESS 0
GCAN A CA UK LIAB EXCESS 0
Berkley A+ CA UK LIAB EXCESS 0
Swiss Re A+ CA UK LIAB EXCESS 0
Transatlantic A+ CA UK LIAB EXCESS 0
Total Non-associated and Non-subsidiary 19 1,873 0 2,943 138 0 138 0
Total Business 29 1,873 0 2,943 138 0 138 0
70.50 B
REINSURANCE CEDED SUMMARY
REGISTERED REINSURANCE
Rating Agency Identifier Code Receivables
P&C (2020)
Next page is 70.60A

Ontario School Boards' Insurance Exchange 31/12/2020
Canadian Insurer Date
Name of Assuming Insurer
(01) (02) (04) (06) (08) (10) (12) (14) (16) (18) (20) (22) (24) (26) (28) (30) (32) (34) (36) (38) (39) (40) (42) (44) (46) (48)
Associated and Non-qualifying subsidiary
0 0 0 0 0 0
0 0 0 0 0 0
0 0 0 0 0 0
0 0 0 0 0 0
0 0 0 0 0 0
0 0 0 0 0 0
0 0 0 0 0 0
0 0 0 0 0 0
0 0 0 0 0 0
0 0 0 0 0 0
0 0 0 0 0 0
0 0 0 0 0 0
0 0 0 0 0 0
0 0 0 0 0 0
Total Associated and Non-qualifying
subsidiary 09 0 0 0 0 0 0 0 0 0 0 0 0 0 0 0 0 0
($'000)
Reinsurance
Payable
Net
Receivable
Aging of
Reinsurance
Asset
Non-owned
deposits -
RSA
Other
acceptable non-
owned
deposits
Reinsurance
Collateral -
Funds Held
A.M.
Best
Code
S&P
Code
Other
Code
Unrated Reinsurer
Domiciliary
Jurisdiction
Reinsurer
Group
Domiciliary
Jurisdiction
Letters of
Credit
Total
(32)+(34)+
(36)+(38)
Business
Covered
Type of
contract
Rating Agency Identifier Code Receivables Reinsurance Collateral
Margin
Required
(40-44) where
positive
Excess
Collateral
(44-40) where
positive
70.60A
REINSURANCE CEDED SUMMARY
UNREGISTERED REINSURANCE (CANADIAN INSURERS)
Calculations for MCT purposes
CONSOLIDATED
20% Margin on
unearned
premiums and
outstanding
losses
recoverable
Recoverables in
excess of
acceptable
collateral
(20+22+24-26-
39) where
positive
Acceptable
collateral in
excess of
recoverables (39-
20-22-24+26)
where positive
Reinsurance
Premiums
Ceded
Unearned
Premiums
ceded to
assuming
insurer
Outstanding
losses
recoverable
from assuming
insurer
Reinsurance
Receivable
P&C (2020)
Next page is 70.60B

Ontario School Boards' Insurance Exchange 31/12/2020
Canadian Insurer Date
Name of Assuming Insurer
(01) (02) (04) (06) (08) (10) (12) (14) (16) (18) (20) (22) (24) (26) (28) (30) (32) (34) (36) (38) (39) (40) (42) (44) (46) (48)
Non-associated and Non-subsidiary
0 0 0 0 0 0
0 0 0 0 0 0
0 0 0 0 0 0
0 0 0 0 0 0
0 0 0 0 0 0
0 0 0 0 0 0
0 0 0 0 0 0
0 0 0 0 0 0
0 0 0 0 0 0
0 0 0 0 0 0
0 0 0 0 0 0
0 0 0 0 0 0
0 0 0 0 0 0
0 0 0 0 0 0
0 0 0 0 0 0
0 0 0 0 0 0
Total Non-associated and Non-subsidiary 19 0 0 0 0 0 0 0 0 0 0 0 0 0 0 0 0 0
TOTAL BUSINESS 29 0 0 0 0 0 0 0 0 0 0 0 0 0 0 0 0 0
($'000)
Calculations for MCT purposes
70.60B
CONSOLIDATED
REINSURANCE CEDED SUMMARY
UNREGISTERED REINSURANCE (CANADIAN INSURERS)
Reinsurer
Group
Domiciliary
Jurisdiction
Business
Covered
Type of
contract
Rating Agency Identifier Code Receivables
Reinsurance
Premiums
Ceded
Unearned
Premiums
ceded to
assuming
insurer
Outstanding
losses
recoverable
from assuming
insurer
Reinsurance
Receivable
A.M.
Best
Code
S&P
Code
Other
Code
Unrated Reinsurer
Domiciliary
Jurisdiction
Excess
Collateral
(44-40) where
positive
Letters of
Credit
Total
(32)+(34)+
(36)+(38)
Acceptable
collateral in
excess of
recoverables (39-
20-22-24+26)
where positive
Reinsurance
Payable
Net
Receivable
Aging of
Reinsurance
Asset
Non-owned
deposits -
RSA
Other
acceptable
non-owned
deposits
Reinsurance
Collateral -
Funds Held
Reinsurance Collateral
20% Margin on
unearned
premiums and
outstanding
losses
recoverable
Recoverables in
excess of
acceptable
collateral
(20+22+24-26-
39) where
positive
Margin
Required
(40-44) where
positive
P&C (2020)
Next page is 70.62A

Ontario School Boards' Insurance Exchange 31/12/2020
Canadian Insurer Date
Name of Assuming Insurer
(01) (02) (04) (06) (08) (10) (12) (14) (16) (18) (20) (22) (24) (26) (28) (30) (32) (34) (36) (38) (39) (40) (42) (44) (46) (48)
Associated and Non-qualifying subsidiary
0 0 0 0 0 0
0 0 0 0 0 0
0 0 0 0 0 0
0 0 0 0 0 0
0 0 0 0 0 0
0 0 0 0 0 0
0 0 0 0 0 0
0 0 0 0 0 0
0 0 0 0 0 0
0 0 0 0 0 0
0 0 0 0 0 0
0 0 0 0 0 0
0 0 0 0 0 0
Total Associated and Non-qualifying
subsidiary 09 0 0 0 0 0 0 0 0 0 0 0 0 0 0 0 0 0
Total
(32)+(34)+
(36)+(38)
Reinsurance
Payable
Net
Receivable
Aging of
Reinsurance
Asset
Non-owned
deposits -
RSA
Other
acceptable
non-owned
deposits
Reinsurance
Collateral -
Funds Held
Business
Covered
Type of
contract
Reinsurance
Premiums
Ceded
Unearned
Premiums
ceded to
assuming
insurer
Outstanding
losses
recoverable
from assuming
insurer
Reinsurance
Receivable
A.M.
Best
Code
Calculations for MCT purposes
Rating Agency Identifier Code Receivables Reinsurance Collateral15% Margin on
unearned
premiums and
outstanding
losses
recoverable
Recoverables in
excess of
acceptable
collateral
(20+22+24-26-
39) where
positive
Acceptable
collateral in
excess of
recoverables (39-
20-22-24+26)
where positive
Margin
Required
(40-44) where
positive
Excess
Collateral
(44-40) where
positive
S&P
Code
Other
Code
Unrated Reinsurer
Domiciliary
Jurisdiction
Reinsurer
Group
Domiciliary
Jurisdiction
Letters of
Credit
($'000)
70.62A
REINSURANCE CEDED SUMMARY
UNREGISTERED REINSURANCE (CANADIAN INSURERS)
TRANSITION PERIOD UNTIL DECEMBER 31, 2022 FOR POLICY LIABILTIES CEDED ON OR BEFORE DECEMBER 31, 2019
P&C (2020)
Next page is 70.62B

Ontario School Boards' Insurance Exchange 31/12/2020
Canadian Insurer Date
Name of Assuming Insurer
(01) (02) (04) (06) (08) (10) (12) (14) (16) (18) (20) (22) (24) (26) (28) (30) (32) (34) (36) (38) (39) (40) (42) (44) (46) (48)
Non-associated and Non-subsidiary
0 0 0 0 0 0
0 0 0 0 0 0
0 0 0 0 0 0
0 0 0 0 0 0
0 0 0 0 0 0
0 0 0 0 0 0
0 0 0 0 0 0
0 0 0 0 0 0
0 0 0 0 0 0
0 0 0 0 0 0
0 0 0 0 0 0
0 0 0 0 0 0
Total Non-associated and Non-subsidiary 19 0 0 0 0 0 0 0 0 0 0 0 0 0 0 0 0 0
TOTAL BUSINESS 29 0 0 0 0 0 0 0 0 0 0 0 0 0 0 0 0 0
Outstanding
losses
recoverable
from assuming
insurer
Letters of
Credit
Total
(32)+(34)+
(36)+(38)
Reinsurance
Payable
Net
Receivable
Aging of
Reinsurance
Asset
Non-owned
deposits -
RSA
Other
acceptable
non-owned
deposits
Reinsurance
Collateral -
Funds Held
Reinsurer
Group
Domiciliary
Jurisdiction
Business
Covered
Type of
contract
Reinsurance
Premiums
Ceded
Unearned
Premiums
ceded to
assuming
insurer
Calculations for MCT purposes
Rating Agency Identifier Code Receivables Reinsurance Collateral15% Margin on
unearned
premiums and
outstanding
losses
recoverable
Recoverables in
excess of
acceptable
collateral
(20+22+24-26-
39) where
positive
Acceptable
collateral in
excess of
recoverables (39-
20-22-24+26)
where positive
Margin
Required
(40-44) where
positive
Excess
Collateral
(44-40) where
positive
Reinsurance
Receivable
A.M.
Best
Code
S&P
Code
Other
Code
Unrated Reinsurer
Domiciliary
Jurisdiction
($'000)
70.62B
REINSURANCE CEDED SUMMARY
UNREGISTERED REINSURANCE (CANADIAN INSURERS)
TRANSITION PERIOD UNTIL DECEMBER 31, 2022 FOR POLICY LIABILTIES CEDED ON OR BEFORE DECEMBER 31, 2019
P&C (2020)
Next page is 70.90

Ontario School Boards' Insurance Exchange 31/12/2020
Canadian/Foreign Insurer Date
(01)
01Y / N Y
02
Y / N N
03 200,000
04 5,000
05
06
075,000
08
09 Y / N Y
Premium Aggregate Limit
Provided
Premium Aggregate Limit
Provided
($'000) ($'000) ($'000) ($'000)
(03) (05) (07) (09)
Catastrophic Bonds 20
Industry loss warranty contracts 21
Catastrophe swaps 22
23
Total 29 0 0 0 0
Is the catastrophe program specific to the Canadian operations only?
Summary of non-traditional methods of risk mitigation issued or purchased by insurer or parent/home office for in Canada risk
Insurer Parent/Home Office
Other contracts and non-traditional methods of risk
mitigation/assumption
70.90
REINSURANCE INTERROGATORIES
Has the insurer made any significant changes regarding reinsurance arrangements during
the year?
Has the insurer made any portfolio transfer, and/or commutation of reinsurance treaties
during the year?
Based on the gross estimated catastrophe exposure above, what would be the net retained
loss (after all reinsurance)? ($'000)
Based on the gross estimated catastrophe exposure above, what would be the catastrophe
coverage(s) reinstatement cost for a full period? ($'000)
If yes, embed details (see Section VI of the Annual Return Instructions).
If yes, embed details (see Section VI of the Annual Return Instructions).
What is the upper limit of the catastrophe program? ($'000)
What is the attachment point for catastrophe coverage? ($'000)
What is the amount of retention (if any) within the catastrophe coverage layers? ($'000)
What is the gross estimated catastrophe exposure? ($'000)
P&C (2020)
Next page is 80.10

80.10
Ontario School Boards' Insurance Exchange 31/12/2020
Canadian/Foreign Insurer Date
COMMISSIONS
Commissions in respect of premiums written Net
Deferred Unearned Deferred Unearned Commissions
Class of Insurance Commissions Commissions Direct Reinsurance Reinsurance Net Commissions Commissions attributable
at beginning at beginning assumed ceded end of year end of year to the period
of year of year (02+07+09)
-(03+08)
(01) (02) (03) (04) (05) (06) (07) (08) (09) (10)
Property - total 09 0 0 0 0
Automobile - total 29 0 0 0 0
Liability 59 0 0 0 0
Marine 68 0 0 0 0
Other 75 0 0 0 0
TOTAL 79 0 0 0 0 0 0 0 0 0
Summary of Commissions
Gross:
Commission Expense (line 79, column 02+04+05-08) 30 0
Contingent Commissions 33
Other Non-Deferrable Commissions 35
Total Gross (line 30+33+35) 39 0
Ceded:
Commission Income (line 79, column 03+06-09) 40 0
Contingent Commissions 43
Other Non-Deferrable Commissions 45
Total Ceded (line 40+43+45) 49 0
TOTAL NET COMMISSIONS (line 39-49) 89 0
CONSOLIDATED
($'000)
P&C (2020)
Next page is 80.20

80.20
Ontario School Boards' Insurance Exchange 31/12/2020
Canadian/Foreign Insurer Date
EXPENSES - INSURANCE OPERATIONS
($'000)
Expense Classification Deferred at Attributable General Internal
End of Year to the Year Expenses Adjustment
Expenses
(01) (02) (04) (06)
Salaries and employee benefits 50 1,839 1,347
Defined Benefit Pension Plan Expense 56
Directors remuneration 52
Agency (excluding commissions) 54
Management fees 60
Professional fees 62 301 58
Occupancy 70 118 53
Information technology 72 182 49
Inspections and Investigations 74 303
Bureaus and Associations 76 66 7
Home Office overhead 78 90 20
Allowance 80
Regulatory assessments 82
Other expenses 88 115 4
TOTAL 89 0 0 3,014 1,538
CONSOLIDATED
Acquisition Expenses
P&C (2020)
Next page is 90.15

Agenda Item 6 RFP for Audit Services
The current five-year service contract with KPMG expires on July 1, 2021.
Process:
Management will approach 3-4 service providers, including the current service provider with a
request for proposals due by mid May.
We will evaluate the proposals against our criteria and bring a recommendation to the Audit
Committee at their June 2021 meeting.
The new engagement will start July 1, 2021 for a five-year period ending July 1, 2026.
Evaluation Criteria:
1. Experience auditing other Canadian reciprocals
2. Depth of insurance knowledge and experience of managing partner
3. Reciprocal/Industry knowledge of team
4. Fees

Agenda 7 In Camera Session The Audit Committee will meet in camera with KPMG & JSCP. Agenda 8 Future Meeting Dates The next Audit Committee meeting is June 25, 2021. Location TBA Agenda 9 Adjournment MOTION: To adjourn the Audit Committee meeting.