Ortel Communications Ltd. Q4 & FY2015 Earnings Presentation – April 20, 2015.
21
Ortel Communications Ltd. Q4 & FY2015 Earnings Presentation – April 20, 2015 ‘BRINGING CONVERGENCE TO INDIA’
-
Upload
griffin-mathews -
Category
Documents
-
view
215 -
download
0
Transcript of Ortel Communications Ltd. Q4 & FY2015 Earnings Presentation – April 20, 2015.
Ortel Communications Ltd.Q4 & FY2015 Earnings Presentation – April 20, 2015
‘BRINGING CONVERGENCE TO INDIA’
2Ortel – Q4 & FY2015 Earnings Presentation
Disclaimer
Certain statements made in this presentation may not be based on historical information
or facts and may be “forward looking statements”, including those relating to the
business, financial performance, strategy and results of the Company and/or the industry
in which it operates. The forward-looking statements contained in this presentation are
based on numerous assumptions and are uncertain and subject to risks. A multitude of
factors including, but not limited to, changes in demand and competition, can cause
actual events, performance or results to differ significantly from any anticipated
development. The Company does not guarantee that the assumptions underlying such
forward-looking statements are free from errors and do not accept any responsibility for
the future accuracy of the forward-looking statements contained in this presentation or
the actual occurrence of the forecasted developments. Forward-looking statements
speak only as of the date of this presentation. The Company does not undertake to
update any forward-looking statement that may be made from time to time by or on
behalf of the Company.

Ortel – Q4 & FY2015 Earnings Presentation
Table of Contents
3
Introduction
Q4 & FY15 Performance Highlights
Region-wise Performance Overview
Segment-wise Performance Overview
Annexures
Ortel – Q4 & FY2015 Earnings Presentation
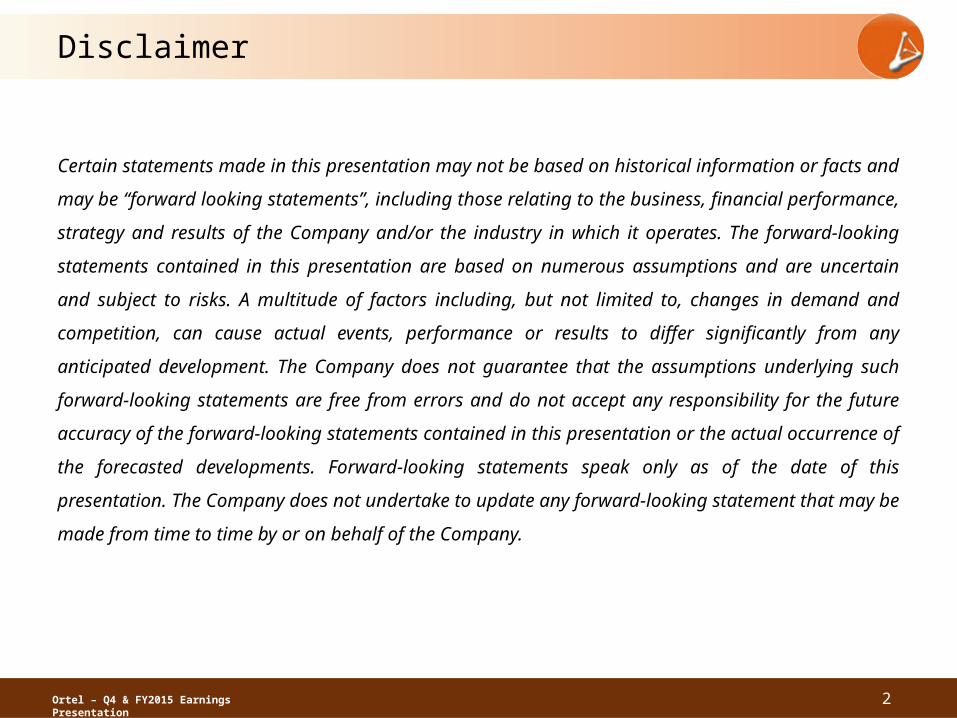
At a Glance
4
88%Subscriber base
on ‘last mile’ network
11%Total broadband
subscribers
22,629Kilometers of cable network
LAST MILEOwns & operates
its network
37%EBITDA margin
810,414Estimated homes
reached
530,111Revenue Generating
Units (RGUs)
TWO-WAYNetwork enabled for ‘Triple Play’ (video,
data and voice)
B2CDirect customer access
leads to greater control
Note: Figures highlighted above are as on March 31, 2015
RIGHT OF WAY
Legal ‘rights of way’ for entire network
23%Digital cable TV
penetration
18%Revenue contribution
from broadband

Ortel – Q4 & FY2015 Earnings Presentation
Ortel: Dominant Regional Player with Direct to Consumer Offering
Growth through increased penetration, digitization, inorganic acquisition and increased broadband penetration
Note: Data above is as on March 31, 2015
• Regional cable television and broadband provider focused in the Indian states of Odisha, Chhattisgarh, Andhra Pradesh and West Bengal
– Addressable market of ~5 mn homes; 530k RGUs covered
– Rapidly growing markets with maximum headroom for growth in the cable TV and broadband industry
• Direct to consumer business model with full control over the ‘last mile’
– 88% of the subscriber base under own network
• Two-way communication network for ‘Triple Play’ service delivery (video/ TV, data/ broadband and voice capabilities)
– HFC network (combination of optic fibre in the backbone and coaxial cable in the downstream) with legal ‘rights of way’ for laying network
– Capable of providing broadband at speed of up to 42.88 mbps through use of cable modem with DOCSIS technology
• Grown both organically and inorganically – through buyout of network equipment, infrastructure and subscribers of other MSOs and LCOs
Estimated Homes Reached 810,414
RGUs 530,111
Cable television subscribers 471,592
Digital subscribers as a % of cable TV subscribers 22.7%
Broadband subscribers 58,519
Broadband subscribers as a % of total RGUs 11.0%
5
Dominant Position
Emerging Market
Planned Expansion
West BengalOrissa
Andhra Pradesh
Telangana
Madhya Pradesh
Chhattisgarh

6Ortel – Q4 & FY2015 Earnings Presentation
• Current business model of most MSOs in India besides Ortel, is largely based on the B2B platform whereby they operate through franchisees / LCOs and they do not deal with customers directly
• Dependence on LCOs makes MSOs vulnerable to large scale customer churn (essentially LCO churn)
• MSOs and broadcasters get less than their fair share of revenues due to under-reporting by LCOs
• With no access to end-customers, no possibilities of offering additional higher-margin services like broadband
• Over-dependence on placement fees is one of the biggest risks in the B2B business model
• Even in a digitized market (Phase I and II), B2B players continue to face challenges on billing, collections and recoveries on investment made in placing STBs in LCO networks and head ends since the point of contact with consumers continues to be the LCO
• Ortel owns / operates its own network and owns 88% of its subscribers
• Ensures legally approved rights of way, superior service, minimal leakages and that the quality of network is uniformly maintained
• Control on billing of subscribers and collections
• Direct collections from customers help in controlling trade receivables and reduce bad debts resulting in better margins and cash flows
• Direct access to consumers limits large scale subscriber churn
• Tripe play network allows the Company to offer full range of services across video, data, voice and network infrastructure leasing for customer’s benefit
• Ensure 100% of economics on above services accrues to the Company, thereby enabling efficient capital deployment and maximising the ROI objective
Differentiated Play As Compared To PeersOperating model in-line with Global Players i.e. B2C, unlike the more prevalent B2B business model in India
B2B business model faces
several challenges
Ortel owns & controls the ‘last
mile’
7Ortel – Q4 & FY2015 Earnings Presentation
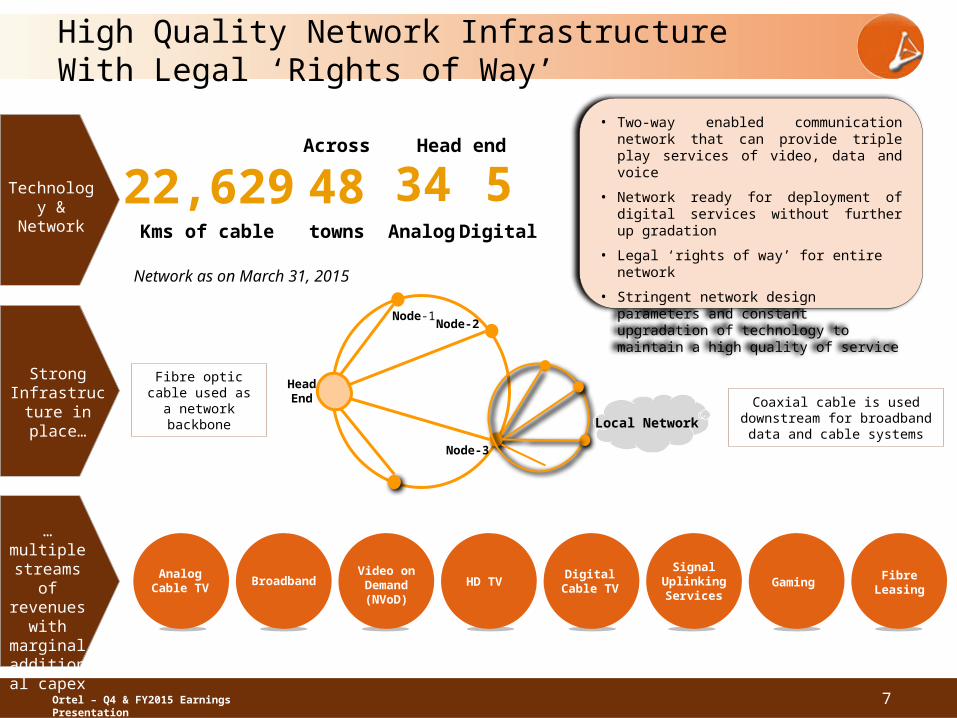
High Quality Network Infrastructure With Legal ‘Rights of Way’
Network as on March 31, 2015
HeadEnd
Node-1Node-2
Node-3
Local Network
Fibre optic cable used as a network
backbone
Coaxial cable is used downstream for broadband
data and cable systems
22,629Kms of cable
Technology &
Network
Strong Infrastructu
re in place…
…multiple streams
of revenues
with marginal additional
capex
34Analog
5Digital
Head end
48towns
Across
Analog Cable TV
BroadbandVideo on Demand(NVoD)
HD TVDigital
Cable TV
Signal Uplinking Services
Gaming Fibre Leasing
• Two-way enabled communication network that can provide triple play services of video, data and voice
• Network ready for deployment of digital services without further up gradation
• Legal ‘rights of way’ for entire network
• Stringent network design parameters and constant upgradation of technology to maintain a high quality of service

8Ortel – Q4 & FY2015 Earnings Presentation
Growth Strategy
Deeper penetration in existing
geographies and entry into new
geographies
Increased penetration
of digital television services
Increase broadband subscriber
base
Expansion through
buyout of network
equipments, infrastructur
e and subscribers
of other MSOs and
LCOs
Leasing of fibre
infrastructure to
corporates
Ortel – Q4 & FY2015 Earnings Presentation
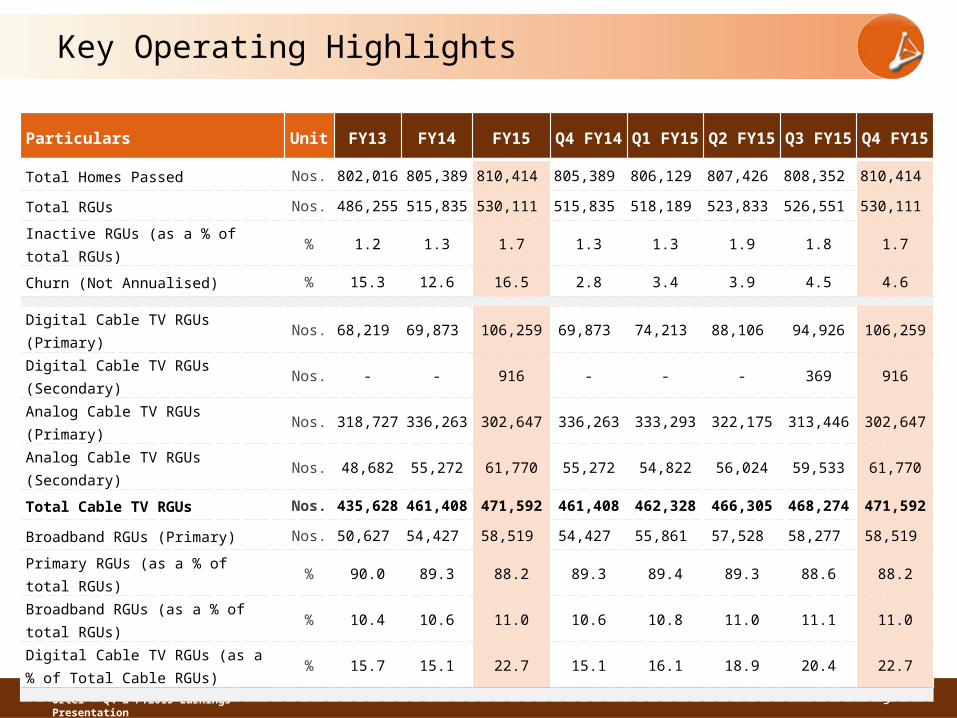
Key Operating Highlights
9
Particulars Unit FY13 FY14 FY15Q4
FY14Q1
FY15Q2
FY15Q3
FY15Q4
FY15
Total Homes Passed Nos. 802,016 805,389 810,414 805,389 806,129 807,426 808,352 810,414
Total RGUs Nos. 486,255 515,835 530,111 515,835 518,189 523,833 526,551 530,111
Inactive RGUs (as a % of total RGUs)
% 1.2 1.3 1.7 1.3 1.3 1.9 1.8 1.7
Churn (Not Annualised) % 15.3 12.6 16.5 2.8 3.4 3.9 4.5 4.6
Digital Cable TV RGUs (Primary) Nos. 68,219 69,873 106,259 69,873 74,213 88,106 94,926 106,259
Digital Cable TV RGUs (Secondary)
Nos. - - 916 - - - 369 916
Analog Cable TV RGUs (Primary) Nos. 318,727 336,263 302,647 336,263 333,293 322,175 313,446 302,647
Analog Cable TV RGUs (Secondary)
Nos. 48,682 55,272 61,770 55,272 54,822 56,024 59,533 61,770
Total Cable TV RGUs Nos.435,62
8461,408 471,592 461,408 462,328 466,305 468,274 471,592
Broadband RGUs (Primary) Nos. 50,627 54,427 58,519 54,427 55,861 57,528 58,277 58,519
Primary RGUs (as a % of total RGUs)
% 90.0 89.3 88.2 89.3 89.4 89.3 88.6 88.2
Broadband RGUs (as a % of total RGUs)
% 10.4 10.6 11.0 10.6 10.8 11.0 11.1 11.0
Digital Cable TV RGUs (as a % of Total Cable RGUs)
% 15.7 15.1 22.7 15.1 16.1 18.9 20.4 22.7
Ortel – Q4 & FY2015 Earnings Presentation
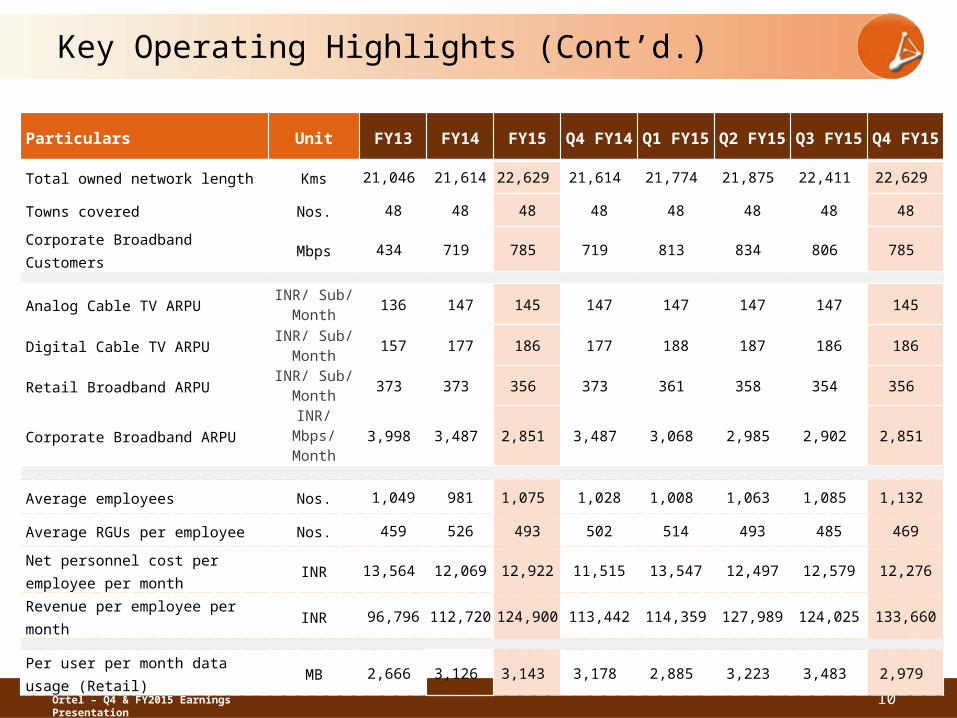
Key Operating Highlights (Cont’d.)
10
Particulars Unit FY13 FY14 FY15Q4
FY14Q1
FY15Q2
FY15Q3
FY15Q4
FY15
Total owned network length Kms 21,046 21,614 22,629 21,614 21,774 21,875 22,411 22,629
Towns covered Nos. 48 48 48 48 48 48 48 48
Corporate Broadband Customers
Mbps 434 719 785 719 813 834 806 785
Analog Cable TV ARPUINR/ Sub/
Month136 147 145 147 147 147 147 145
Digital Cable TV ARPUINR/ Sub/
Month157 177 186 177 188 187 186 186
Retail Broadband ARPUINR/ Sub/
Month 373 373 356 373 361 358 354 356
Corporate Broadband ARPUINR/ Mbps/
Month 3,998 3,487 2,851 3,487 3,068 2,985 2,902 2,851
Average employees Nos. 1,049 981 1,075 1,028 1,008 1,063 1,085 1,132
Average RGUs per employee Nos. 459 526 493 502 514 493 485 469
Net personnel cost per employee per month
INR 13,564 12,069 12,922 11,515 13,547 12,497 12,579 12,276
Revenue per employee per month
INR 96,796 112,720 124,900 113,442 114,359 127,989 124,025 133,660
Per user per month data usage (Retail)
MB 2,666 3,126 3,143 3,178 2,885 3,223 3,483 2,979

11Ortel – Q4 & FY2015 Earnings Presentation
Consolidated Summarized Profit & Loss Statement
Particulars (Rs. million) FY15 FY14Y-o-Y
GrowthQ4 FY15 Q4 FY14
Y-o-Y Growth
Revenues from operations 1,548 1,285 20% 449 334 34%
Other Income 63 41 53% 5 16 (71%)
Total Revenue 1,611 1,326 21% 454 350 30%
Total Expenditure 1,014 911 11% 245 223 10%
- Programming Cost 342 317 8% 85 80 6%
- Bandwidth Cost 67 61 9% 17 16 12%
- Employee Benefit Expenses 167 142 17% 44 31 44%
- Other Expenses 439 391 12% 99 97 2%
EBITDA (Excluding Other Income) 533 374 43% 204 111 83%
EBITDA (Including Other Income) 597 415 44% 208 127 64%
EBITDA margin (Excluding Other Income) 34.5% 29.1% 540 bps 45.4% 33.2% 1,220 bps
EBITDA margin (Including Other Income) 37.0% 31.3% 570 bps 45.9% 36.2% 970 bps
Finance Costs 226 234 (4%) 56 56 1%
Depreciation and Amortization Expense 195 206 (5%) 55 49 12%
Fixed Assets written off 105 72 47% 37 4 759%
Extraordinary/ Exceptional items - 42 - - 42 NM
PBT 71 -138 NM 60 -24 NM
PAT 56 -138 NM 50 -24 NM
PAT Margin 3.5% NM NM 11.0% - NM
12Ortel – Q4 & FY2015 Earnings Presentation
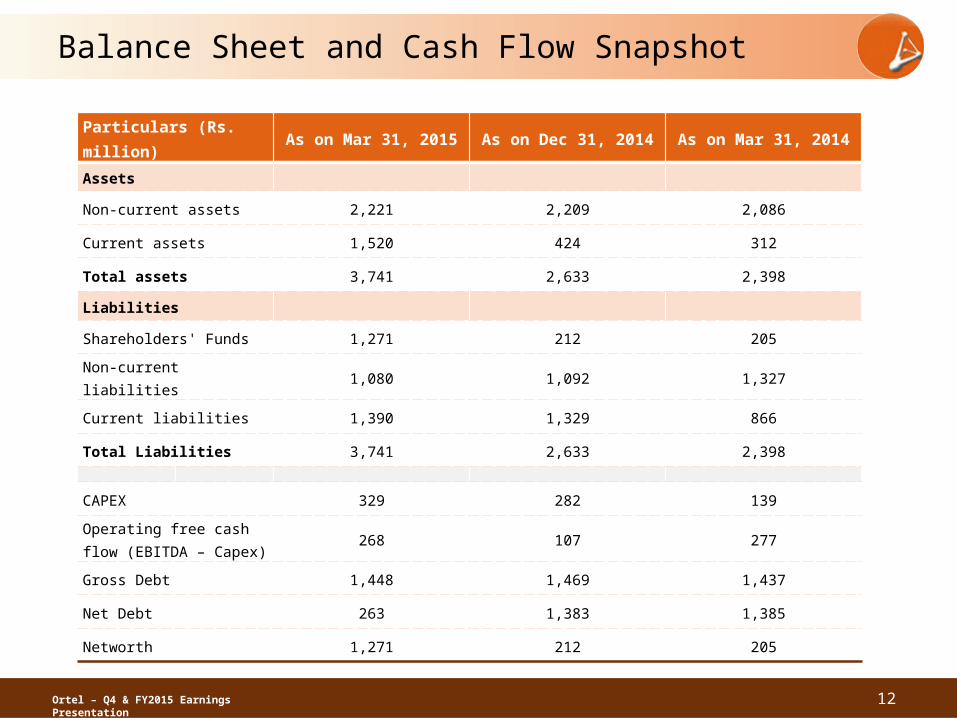
Balance Sheet and Cash Flow Snapshot
Particulars (Rs. million)
As on Mar 31, 2015 As on Dec 31, 2014 As on Mar 31, 2014
Assets
Non-current assets 2,221 2,209 2,086
Current assets 1,520 424 312
Total assets 3,741 2,633 2,398
Liabilities
Shareholders' Funds 1,271 212 205
Non-current liabilities 1,080 1,092 1,327
Current liabilities 1,390 1,329 866
Total Liabilities 3,741 2,633 2,398
CAPEX 329 282 139
Operating free cash flow (EBITDA – Capex)
268 107 277
Gross Debt 1,448 1,469 1,437
Net Debt 263 1,383 1,385
Networth 1,271 212 205
Ortel – Q4 & FY2015 Earnings Presentation
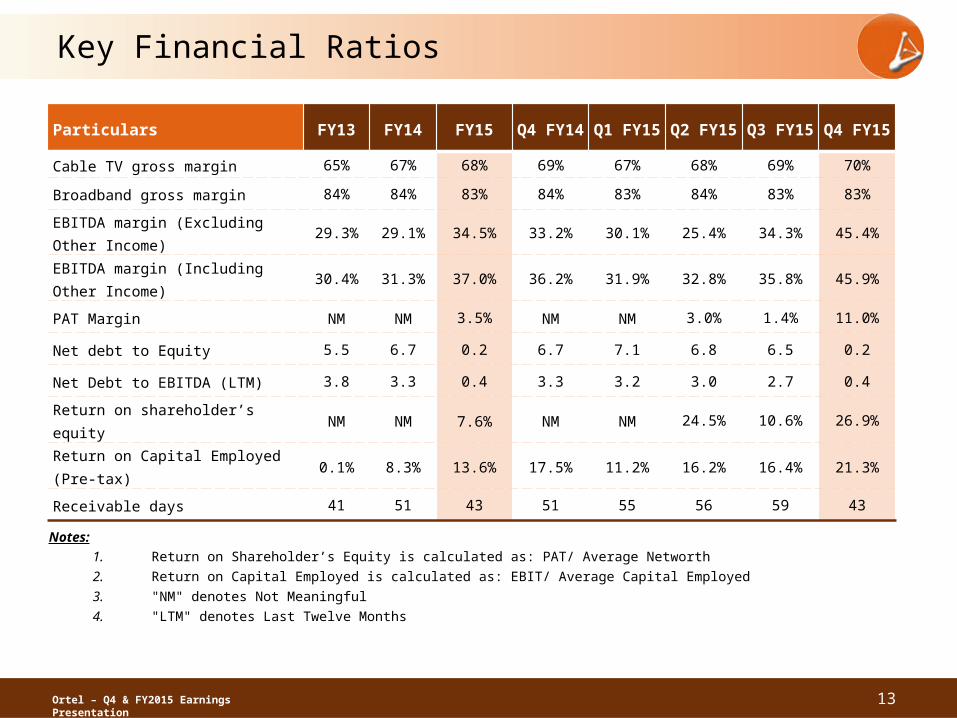
Key Financial Ratios
13
Particulars FY13 FY14 FY15Q4
FY14Q1
FY15Q2
FY15Q3
FY15Q4
FY15
Cable TV gross margin 65% 67% 68% 69% 67% 68% 69% 70%
Broadband gross margin 84% 84% 83% 84% 83% 84% 83% 83%
EBITDA margin (Excluding Other Income)
29.3% 29.1% 34.5% 33.2% 30.1% 25.4% 34.3% 45.4%
EBITDA margin (Including Other Income)
30.4% 31.3% 37.0% 36.2% 31.9% 32.8% 35.8% 45.9%
PAT Margin NM NM 3.5% NM NM 3.0% 1.4% 11.0%
Net debt to Equity 5.5 6.7 0.2 6.7 7.1 6.8 6.5 0.2
Net Debt to EBITDA (LTM) 3.8 3.3 0.4 3.3 3.2 3.0 2.7 0.4
Return on shareholder’s equity NM NM 7.6% NM NM 24.5% 10.6% 26.9%
Return on Capital Employed (Pre-tax)
0.1% 8.3% 13.6% 17.5% 11.2% 16.2% 16.4% 21.3%
Receivable days 41 51 43 51 55 56 59 43
Notes:1. Return on Shareholder’s Equity is calculated as: PAT/ Average Networth
2. Return on Capital Employed is calculated as: EBIT/ Average Capital Employed
3. "NM" denotes Not Meaningful
4. "LTM" denotes Last Twelve Months
14Ortel – Q4 & FY2015 Earnings Presentation
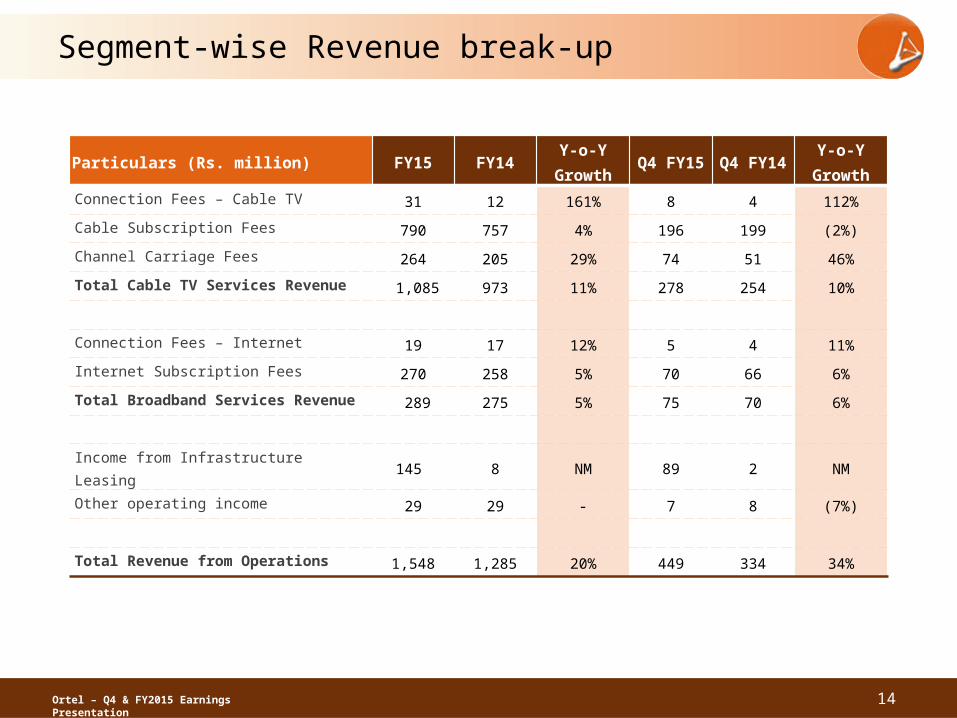
Segment-wise Revenue break-up
Particulars (Rs. million) FY15 FY14Y-o-Y
GrowthQ4 FY15 Q4 FY14
Y-o-Y Growth
Connection Fees – Cable TV 31 12 161% 8 4 112%
Cable Subscription Fees 790 757 4% 196 199 (2%)
Channel Carriage Fees 264 205 29% 74 51 46%
Total Cable TV Services Revenue 1,085 973 11% 278 254 10%
Connection Fees – Internet 19 17 12% 5 4 11%
Internet Subscription Fees 270 258 5% 70 66 6%
Total Broadband Services Revenue 289 275 5% 75 70 6%
Income from Infrastructure Leasing 145 8 NM 89 2 NM
Other operating income 29 29 - 7 8 (7%)
Total Revenue from Operations 1,548 1,285 20% 449 334 34%
15Ortel – Q4 & FY2015 Earnings Presentation
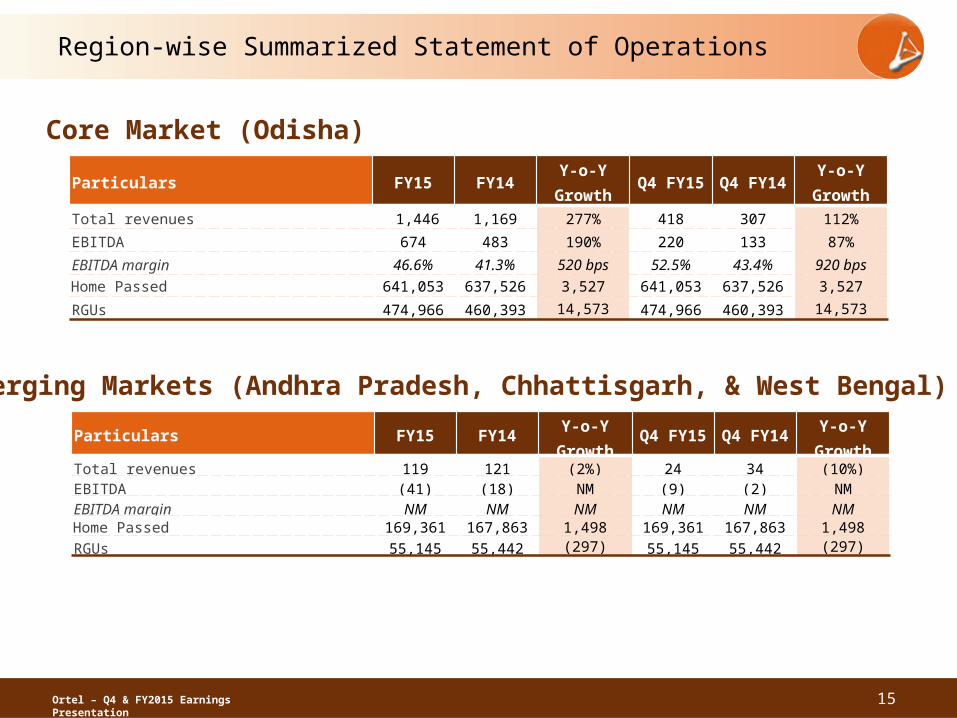
Region-wise Summarized Statement of Operations
Particulars FY15 FY14Y-o-Y
GrowthQ4 FY15 Q4 FY14
Y-o-Y Growth
Total revenues 1,446 1,169 277% 418 307 112%EBITDA 674 483 190% 220 133 87%EBITDA margin 46.6% 41.3% 520 bps 52.5% 43.4% 920 bpsHome Passed 641,053 637,526 3,527 641,053 637,526 3,527
RGUs 474,966 460,393 14,573 474,966 460,393 14,573
Core Market (Odisha)
Particulars FY15 FY14Y-o-Y
GrowthQ4 FY15 Q4 FY14
Y-o-Y Growth
Total revenues 119 121 (2%) 24 34 (10%)EBITDA (41) (18) NM (9) (2) NMEBITDA margin NM NM NM NM NM NMHome Passed 169,361 167,863 1,498 169,361 167,863 1,498RGUs 55,145 55,442 (297) 55,145 55,442 (297)
Emerging Markets (Andhra Pradesh, Chhattisgarh, & West Bengal)

Ortel – Q4 & FY2015 Earnings Presentation
FY2015 Financial and Operational Discussions
• In FY2015, Total Income registered healthy growth of 21% due to increase in RGUs (Revenue Generating Units)– Increase in Channel Carriage fees and Infrastructure Leasing also contributed to
the performance during the year. The Company expects these businesses to report strong growth in the coming quarters
• Programming cost stood at Rs. 342 million, up by 8% Y-o-Y on the back of annual increase as per the terms of agreements with broadcasters and/or content providers
• EBITDA (including other income) grew by 44% to Rs. 597 million owing to robust growth in operating margin– Margins enhanced by 580 bps to 37.1% driven by increase in Channel Carriage
fees and Income from Infrastructure Leasing along with growth in Cable & Broadband segments
– Cable and Broadband segment’s gross margins stood at 68% & 83% respectively – RGUs as a % of home passed improved to 65% further supporting EBITDA margin
• Profit After Tax stood at Rs. 56 million in FY15 driven by overall growth in operating profits
16
Ortel – Q4 & FY2015 Earnings Presentation
Key Developments
• Successful IPO: Raised Rs. 1,086 million through Initial Public Offering (IPO) of 60,00,000 equity shares of face value of Rs. 10 each at a price of Rs. 181 per equity share
• PAT Positive: Reported annual profit of Rs. 56 million during FY15
• LCO Buyout: Signed network buy out agreements in the month of April 2015 with 40 LCOs with total estimated RGUs of 17,500– These customers will be reported under Company's last mile subscribers in the
forthcoming months
• HD Launch: Started offering HD services in its core markets of Bhubaneshwar and Cuttack. Currently, the Company is providing 14 HD channels and plans to increase it to 25 channels going forward
• High Speed Broadband Packs: Recently launched High Speed Broadband packs with data speed of upto 5 Mbps in Bhubaneshwar and intends to expand it to other markets
• DOCSIS 3.0 Roll Out: Completed trial of DOCSIS 3.0 Technology and intends to roll out the services soon– DOCSIS 3.0 is capable of providing Broadband services with much higher speed
• Improvement in Debt rating: ICRA has upgraded the debt rating of Ortel Communications to BB- from C+ – Gross debt stood at Rs. 1,448 million as on 31st March 2015 17
Ortel – Q4 & FY2015 Earnings Presentation
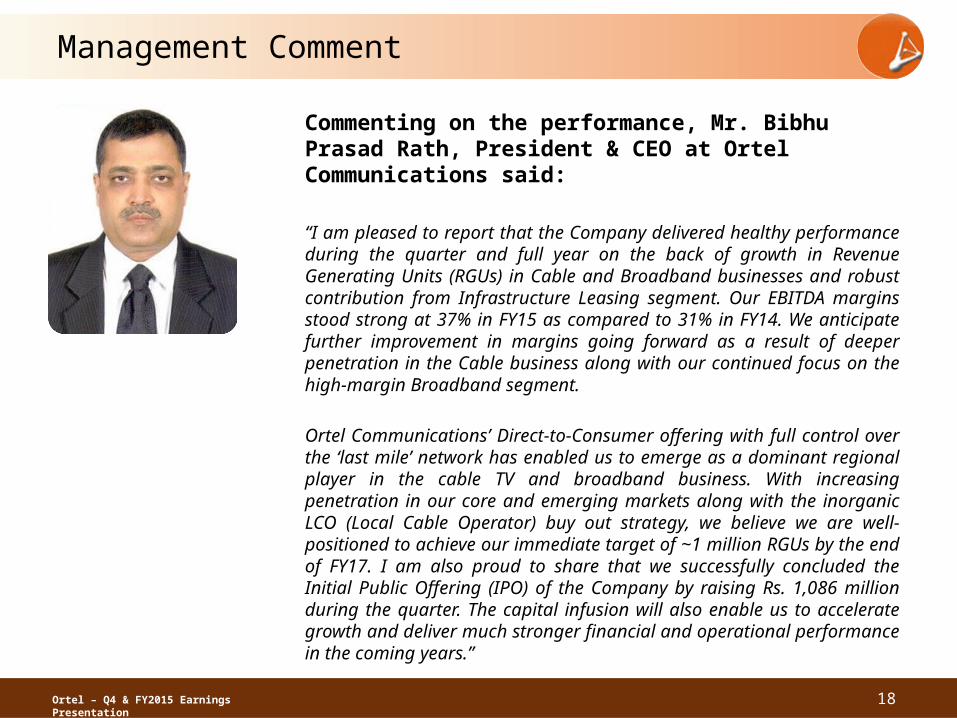
Management Comment
Commenting on the performance, Mr. Bibhu Prasad Rath, President & CEO at Ortel Communications said:
“I am pleased to report that the Company delivered healthy performance during the quarter and full year on the back of growth in Revenue Generating Units (RGUs) in Cable and Broadband businesses and robust contribution from Infrastructure Leasing segment. Our EBITDA margins stood strong at 37% in FY15 as compared to 31% in FY14. We anticipate further improvement in margins going forward as a result of deeper penetration in the Cable business along with our continued focus on the high-margin Broadband segment.
Ortel Communications’ Direct-to-Consumer offering with full control over the ‘last mile’ network has enabled us to emerge as a dominant regional player in the cable TV and broadband business. With increasing penetration in our core and emerging markets along with the inorganic LCO (Local Cable Operator) buy out strategy, we believe we are well-positioned to achieve our immediate target of ~1 million RGUs by the end of FY17. I am also proud to share that we successfully concluded the Initial Public Offering (IPO) of the Company by raising Rs. 1,086 million during the quarter. The capital infusion will also enable us to accelerate growth and deliver much stronger financial and operational performance in the coming years.”
18
19Ortel – Q4 & FY2015 Earnings Presentation
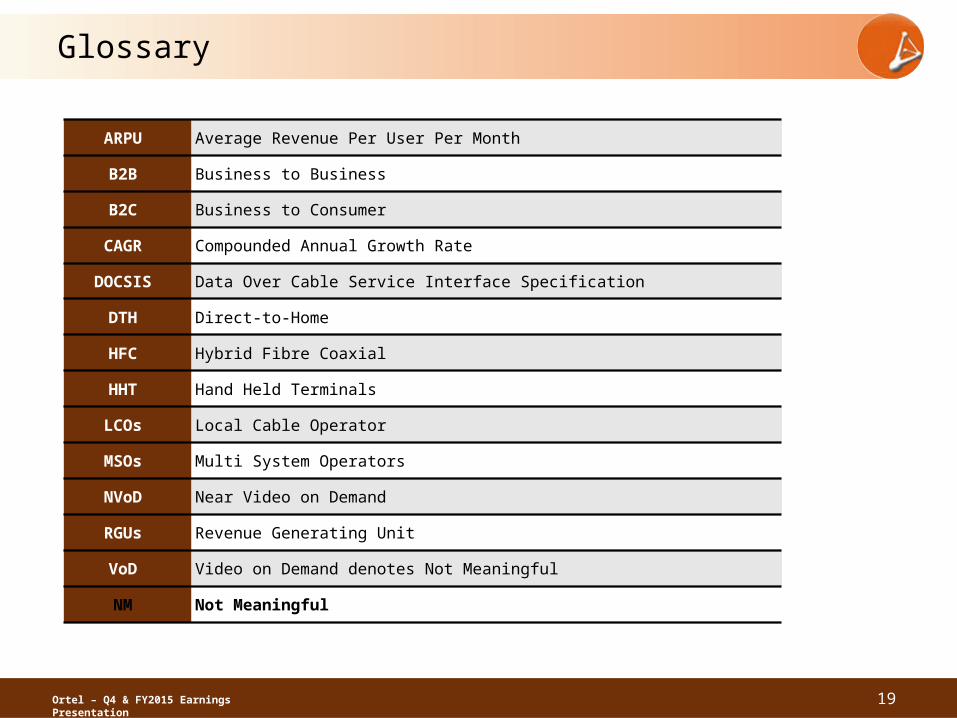
Glossary
ARPU Average Revenue Per User Per Month
B2B Business to Business
B2C Business to Consumer
CAGR Compounded Annual Growth Rate
DOCSIS Data Over Cable Service Interface Specification
DTH Direct-to-Home
HFC Hybrid Fibre Coaxial
HHT Hand Held Terminals
LCOs Local Cable Operator
MSOs Multi System Operators
NVoD Near Video on Demand
RGUs Revenue Generating Unit
VoD Video on Demand denotes Not Meaningful
NM Not Meaningful
20Ortel – Q4 & FY2015 Earnings Presentation
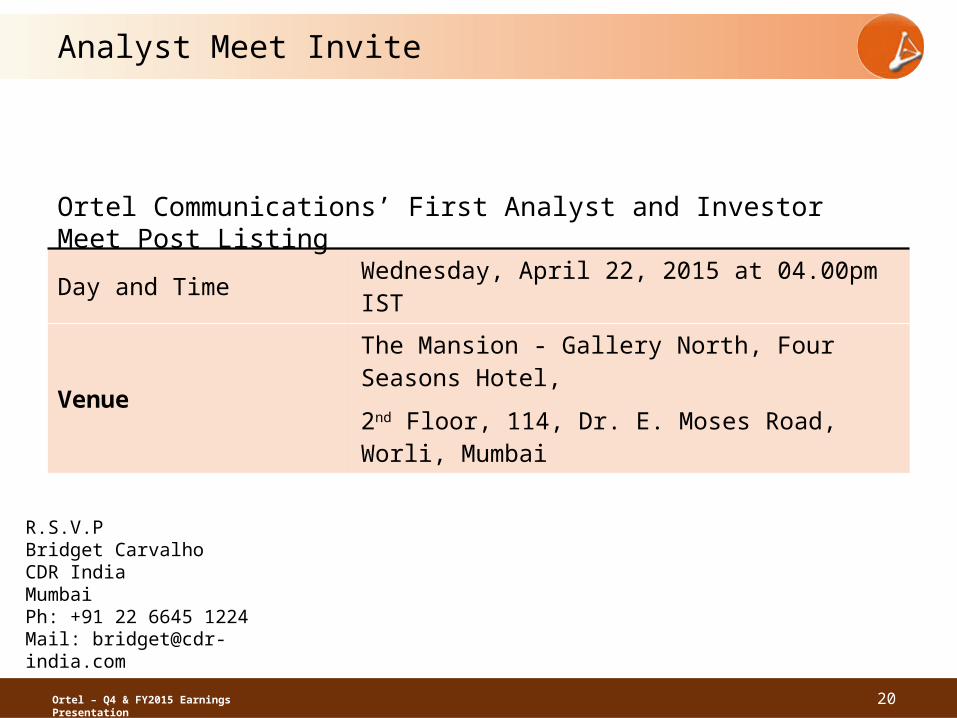
Analyst Meet Invite
Day and Time Wednesday, April 22, 2015 at 04.00pm IST
Venue
The Mansion - Gallery North, Four Seasons Hotel,
2nd Floor, 114, Dr. E. Moses Road, Worli, Mumbai
Ortel Communications’ First Analyst and Investor Meet Post Listing
R.S.V.P Bridget Carvalho CDR India Mumbai Ph: +91 22 6645 1224 Mail: [email protected]
Ortel – Q4 & FY2015 Earnings Presentation
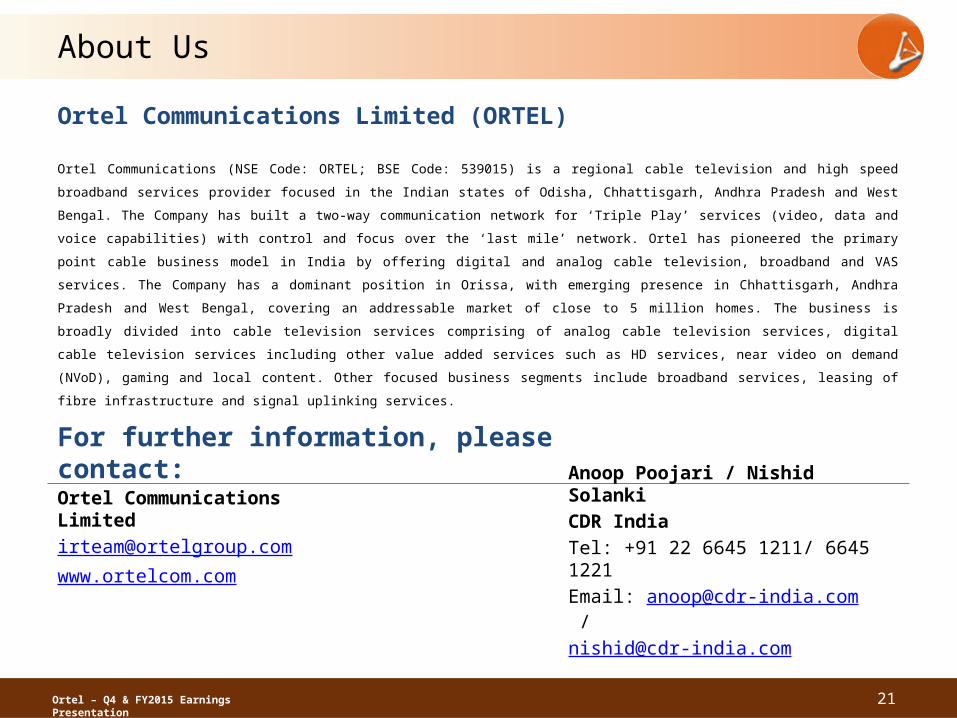
About Us
Ortel Communications Limited (ORTEL)
Ortel Communications (NSE Code: ORTEL; BSE Code: 539015) is a regional cable television and high speed
broadband services provider focused in the Indian states of Odisha, Chhattisgarh, Andhra Pradesh and West Bengal.
The Company has built a two-way communication network for ‘Triple Play’ services (video, data and voice
capabilities) with control and focus over the ‘last mile’ network. Ortel has pioneered the primary point cable
business model in India by offering digital and analog cable television, broadband and VAS services. The Company
has a dominant position in Orissa, with emerging presence in Chhattisgarh, Andhra Pradesh and West Bengal,
covering an addressable market of close to 5 million homes. The business is broadly divided into cable television
services comprising of analog cable television services, digital cable television services including other value added
services such as HD services, near video on demand (NVoD), gaming and local content. Other focused business
segments include broadband services, leasing of fibre infrastructure and signal uplinking services.
21
For further information, please contact:
Anoop Poojari / Nishid Solanki CDR IndiaTel: +91 22 6645 1211/ 6645 1221Email: [email protected] / [email protected]
Ortel Communications [email protected]