ORP Improves Operational Efficiency - ORP Presentation.pdfREDUCTION (CHEMICAL) ORP Definition Bing...
36
ORP Improves Operational Efficiency Mark Prein, P.E. MWEA Annual Conference June 26, 2012
Transcript of ORP Improves Operational Efficiency - ORP Presentation.pdfREDUCTION (CHEMICAL) ORP Definition Bing...

ORP Improves Operational Efficiency
Mark Prein, P.E.
MWEA Annual Conference
June 26, 2012

What is ORP

Oxidation
Reduction
Potential
ORP Definition
What
Is
ORP?

OXIDATION
(CHEMICAL)
ORP Definition
Bing says 8,650,000 definitions 1. A chemical reaction in which oxygen is
added to an element or compound
2. The process of losing electrons from a chemical element or compound
Example: Nitrification 2NH4
+ + 3O2 -> 2H+ + 2H2O + 2NO2-
2NO2- + O2 -> 2NO3
-

REDUCTION
(CHEMICAL)
ORP Definition
Bing says 50,300,000 definitions Any chemical reaction in which the atoms in a material take on electrons. Note: Reduction is the opposite of oxidation. Example: Denitrification 2NO3
- + organic matter -> N2(Gas) + CO2 + H2O

POTENTIAL
ORP Definition
Bing says 204,000,000 definitions 1.Possible but as yet not actual: having a latent possibility or likelihood of occurring, or of doing or becoming something
2.Capacity for development: a capacity to develop, succeed, or become something
How steep is the hill you are standing on?
ORP Definition
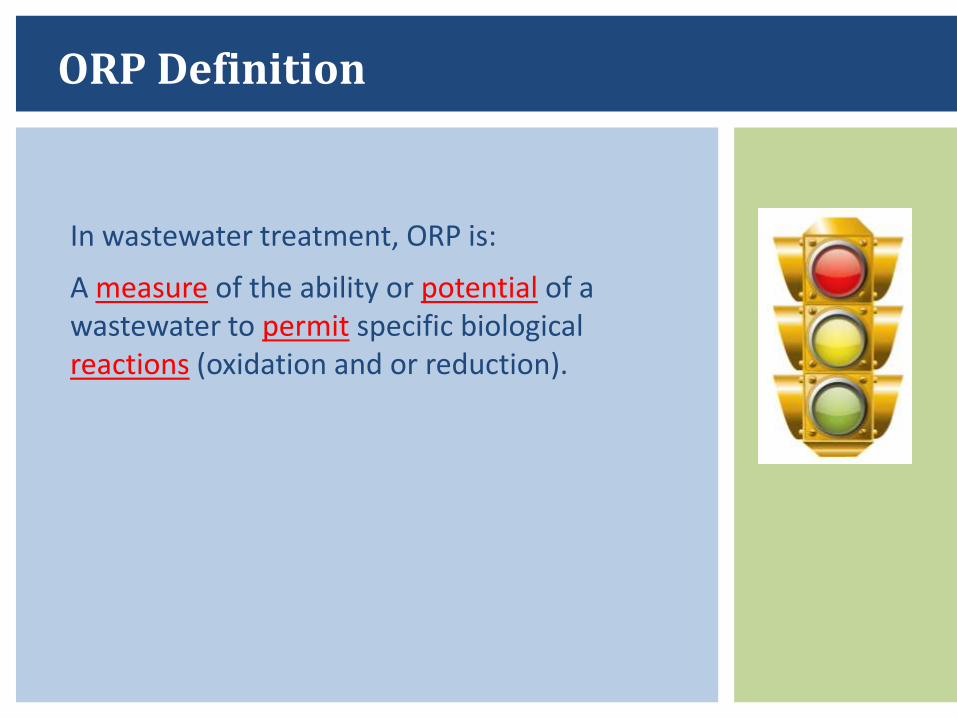
In wastewater treatment, ORP is:
A measure of the ability or potential of a wastewater to permit specific biological reactions (oxidation and or reduction).

YSI Environmental
–Application Note
ORP Biological Values
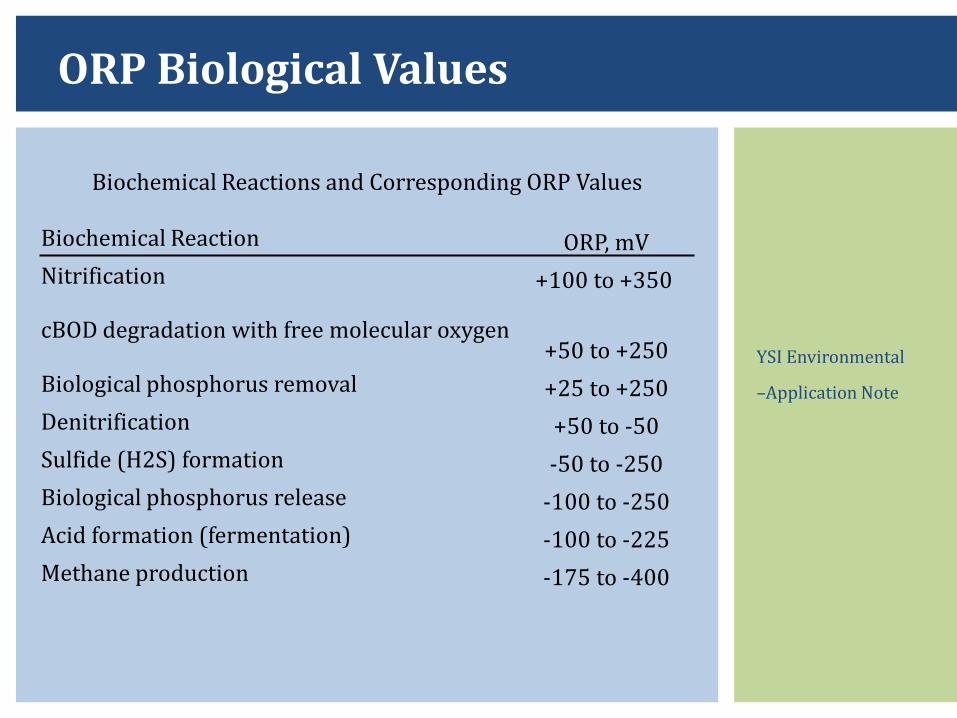
Biochemical Reactions and Corresponding ORP Values
Biochemical Reaction ORP, mV
Nitrification +100 to +350
cBOD degradation with free molecular oxygen +50 to +250
Biological phosphorus removal +25 to +250
Denitrification +50 to -50
Sulfide (H2S) formation -50 to -250
Biological phosphorus release -100 to -250
Acid formation (fermentation) -100 to -225
Methane production -175 to -400

ORP Equipment

Where Might You Use ORP
• Collection System
• Lift Stations
• Sewers
• Treatment Plant
• Activated Sludge
• Anaerobic
• Anoxic
• Aerobic
• Digesters
• Fermenters
• Final Clarifiers

How Use ORP
• Collection System
• Hydrogen Sulfide Control
• Treatment Plant
• CBOD removal
• Nitrification
• Denitrification
• Biological Phosphorous Removal
• Fermentation
• Methane production
YSI Environmental
–Application Note
ORP Biological Values
Biochemical Reactions and Corresponding ORP Values
Biochemical Reaction ORP, mV
Nitrification +100 to +350
cBOD degradation with free molecular oxygen +50 to +250
Biological phosphorus removal +25 to +250
Denitrification +50 to -50
Sulfide (H2S) formation -50 to -250
Biological phosphorus release -100 to -250
Acid formation (fermentation) -100 to -225
Methane production -175 to -400
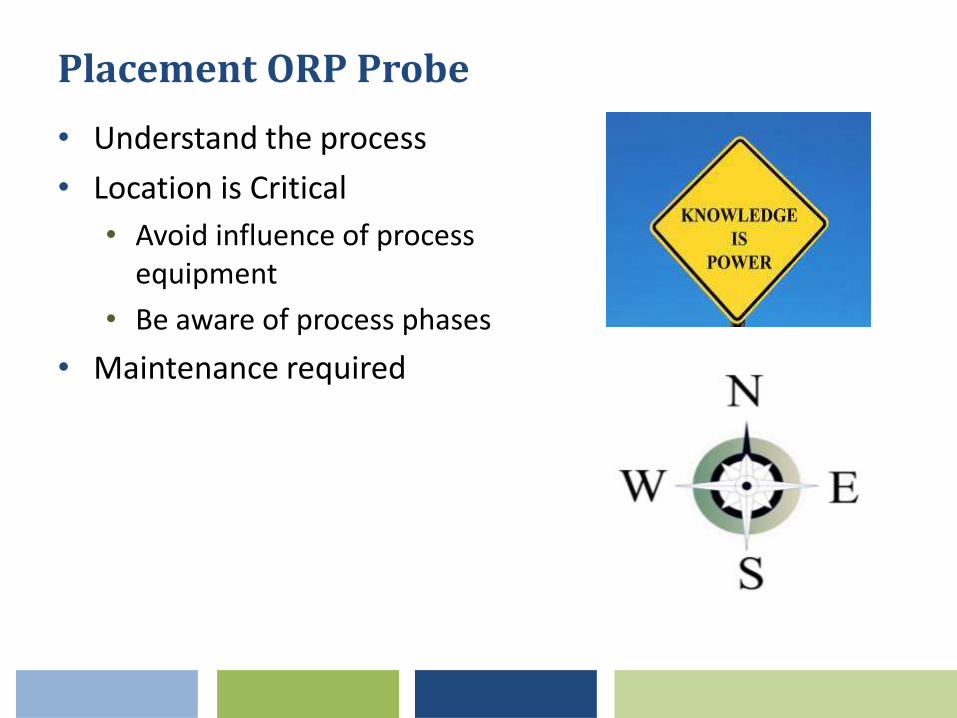
Placement ORP Probe
• Understand the process
• Location is Critical
• Avoid influence of process equipment
• Be aware of process phases
• Maintenance required

Examples

Please: Ask Questions As We Go

Large Community
Random Odor complaints
• Could not be tied to operational changes
• Could not be tied to wet/dry weather events
Sewer Collapse in Area
Have high H2S levels but why?
Collection System

OdaLogger
Results
Collection System
Red Arrow Odalogger

Sample
Event
Results
Collection System
Units 8/28/2010 8/29/2010 8/30/2010
Lab
BOD5 mg/l 380 89 285
Sulfate mg/l 4.21 21.7 10.6
Total Sulfide mg/l 5.4 3 3.9
TSS mg/l 568 46 307
Field
pH s.u. 7.75 7.63 7.99
Temp °C 21 22.95 25.02
D.O. mg/l 3.93 2.62 3.01
Dis Sulfide mg/l 4.55 5.35 3.25
H2S, Air ppm 37 66 27
% O2 % 20.9 20.9 20.9
LEL s.u. 0 0 0

The
Rest
Of
The Story
Collection System
Units 8/28/2010 8/29/2010 8/30/2010
Lab
BOD5 mg/l 380 89 285
Sulfate mg/l 4.21 21.7 10.6
Total Sulfide mg/l 5.4 3 3.9
TSS mg/l 568 46 307
Field
pH s.u. 7.75 7.63 7.99
Temp °C 21 22.95 25.02
D.O. mg/l 3.93 2.62 3.01
Dis Sulfide mg/l 4.55 5.35 3.25
H2S, Air ppm 37 66 27
% O2 % 20.9 20.9 20.9
LEL s.u. 0 0 0
ORP mv -68.6 -89.3 -61.4

Re-aeration
Example
ORP Conversion

Treatment
and
Odor
Event
WWTP Upset

WWTP Upset Background
• Plant 1. Aerated Lagoon System 2. Settling Ponds 3. Storage Ponds
• Operations 1. Monitor Influent and Effluent
for standard parameters 2. DO measured at effluent 3. As Effluent DO varies, adjust air
feeds • Event
1. Over very short period went anaerobic
2. With all aeration on, could not meet demand

hjg
WWTP Upset - Investigation
0
2
4
6
8
10
12
14
0.0
1.0
2.0
3.0
4.0
5.0
6.0
7.0
Nu
mb
er
of
Aera
tors
Av
era
ge D
O, m
g/l
Date
Effluent Dissolved Oxygen vs. Aerators
Aerators

WWTP Upset - Investigation
• Mixers turned off to save energy when DO demand low
• When mixers turned on: 1. Re-suspend solids
2. Initial increase in DO demand
3. Some Odor
• During spring warm-up 1. Increasing biological activity
2. Influent Loading
3. Stored Loading • Mixer selection based on effluent
DO, which indicated wastewater carrying a positive DO

hjg
WWTP Upset Background
Temperature
DO

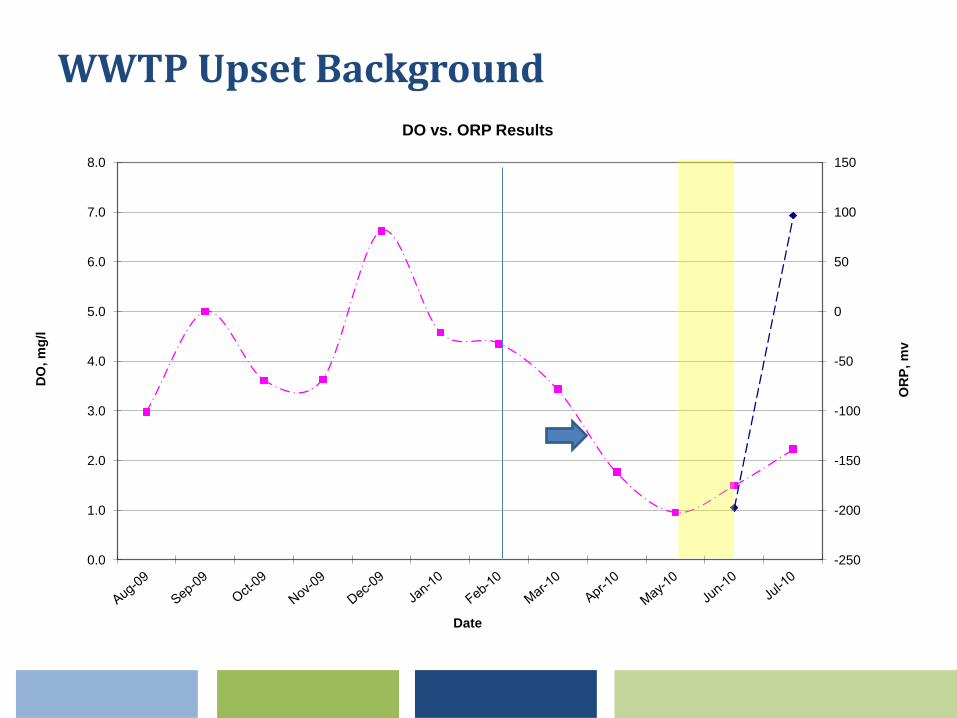
WWTP Upset Background
0
3
6
9
12
15
18
21
24
0
2
4
6
8
10
12
14
16
Tem
pera
ture
, D
eg
ree
C
Aera
tors
Date
Aerators vs. Temperture
Temperature
Aerators
hjg
WWTP Upset Background
-250
-200
-150
-100
-50
0
50
100
150
0.0
1.0
2.0
3.0
4.0
5.0
6.0
7.0
8.0
OR
P, m
v
DO
, m
g/l
Date
DO vs. ORP Results
WWTP Upset - Findings
• Operator placed in a no win situation by positive DO probe results
• Actual events 1. Spring with warm
temperatures 2. Entire volume went
anaerobic 3. Turned on mixers for more
air, which in turn added more demand
• DO probe under influence of point of re-aeration
• Mixers must be turned on before demand

Biosolids
Holding
Tank
Aerobic Digestion/Holding
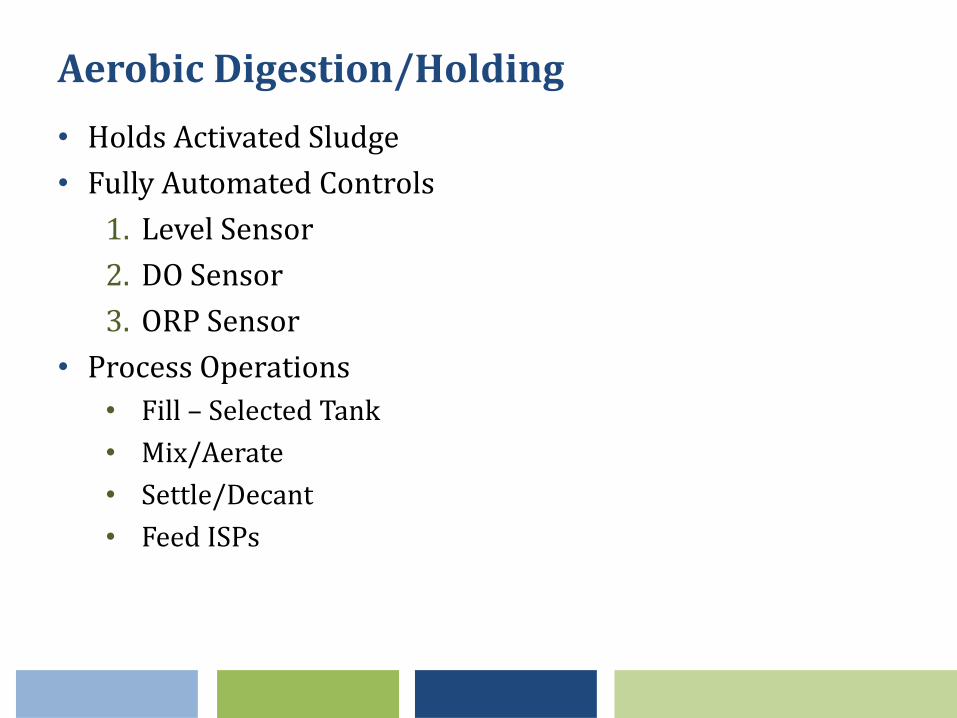
Aerobic Digestion/Holding
• Holds Activated Sludge
• Fully Automated Controls
1. Level Sensor
2. DO Sensor
3. ORP Sensor
• Process Operations
• Fill – Selected Tank
• Mix/Aerate
• Settle/Decant
• Feed ISPs

SCADA CONTROL

Typical Operation

A Little Easier to Read

What Is Really Happening?
1
2
Energy Savings

Its Only A Tool
1 - Air Off, Start Press
3-Decant
2-Settled

Thank You