
ORNL/NRC/LTR- Heavy-Section Steel Technology (HSST) Program · DRAFT NOT FOR ATTRIBUTION 0t/04/02...
44
DRAFT NOT FOR ATTRIBUTION 8/04/2002 ORNL/NRC/LTR- Contract Program or Project Title: Subject of this Document: Type of Document: Authors: Date of Document: Heavy-Section Steel Technology (HSST) Program Stochastic Failure Model for the Davis-Besse RPV Head Letter Report P. T. Williams B. R. Bass August 2002 Responsible NRC Individual and NRC Office or Division M. T. Kirk Division of Engineering Technology Office of Nuclear Regulatory Research Prepared for the U. S. Nuclear Regulatory Commission Washington, D.C. 20555-0001 Under Interagency Agreement DOE I 886-N653-3Y NRC JCN No. Y6533 OAK RIDGE NATIONAL LABORATORY Oak Ridge, Tennessee 37831-8056 managed and operated by UT-Battelle, LLC for the U. S. DEPARTMENT OF ENERGY under Contract No. DE-AC05-00OR22725 Inform;' an i Cins rScord was de!eted ;?c. ac-: ., o Freedom of Information Act, ee.uioD.s 7 FOIA- -OO3-OOi
Transcript of ORNL/NRC/LTR- Heavy-Section Steel Technology (HSST) Program · DRAFT NOT FOR ATTRIBUTION 0t/04/02...

DRAFT NOT FOR ATTRIBUTION 8/04/2002
ORNL/NRC/LTR-
Contract Program orProject Title:
Subject of this Document:
Type of Document:
Authors:
Date of Document:
Heavy-Section Steel Technology (HSST) Program
Stochastic Failure Model for the Davis-Besse RPV Head
Letter Report
P. T. WilliamsB. R. Bass
August 2002
Responsible NRC Individualand NRC Office or Division
M. T. KirkDivision of Engineering TechnologyOffice of Nuclear Regulatory Research
Prepared for theU. S. Nuclear Regulatory Commission
Washington, D.C. 20555-0001Under Interagency Agreement DOE I 886-N653-3Y
NRC JCN No. Y6533
OAK RIDGE NATIONAL LABORATORYOak Ridge, Tennessee 37831-8056
managed and operated byUT-Battelle, LLC for the
U. S. DEPARTMENT OF ENERGYunder Contract No. DE-AC05-00OR22725
Inform;' an i Cins rScord was de!eted;?c. ac-: ., o Freedom of InformationAct, ee.uioD.s 7FOIA- -OO3-OOi

DRAFT NOT FOR ATTRIBUTION 0tJ04/02
ORNLINRCILTR-
Stochastic Failure Model
for the Davis-Besse RPV Head
P. T. WilliamsB. R. Bass
Oak Ridge National LaboratoryOak Ridge, Tennessee
Manuscript Completed - August 2002Date Published-
Prepared for theU.S. Nuclear Regulatory Commission
Office of Nuclear Regulatory ResearchUnder Interagency Agreement DOE 1886-N653-3Y
NRC JCN No. Y6533
OAK RIDGE NATIONAL LABORATORYOak Ridge, Tennessee 37831-8063
managed and operated byUT-Battelle, LLC for the
U. S. DEPARTMENT OF ENERGYunder Contract No. DE-ACO5-00OR22725
2

DRAFT NOT FOR ATTRIBUTION 0t/04/02
CAUTION
This document has not been given final patentclearance and Is for Internal use only. If thisdocument is to be given public release, It must becleared through the site Technical InformationOffice, which will see that the proper patent andtechnical information reviews are completed Inaccordance with the policies of Oak RidgeNational Laboratory and UT43attelle, LLC.
This report was prepared as an account of work sponsored by anagency of the United States government. Neither the United Statesgovernment nor any agency thereof, nor any of their employees,makes any warranty, express or Imnpied, or assumes any legallability or responsibility for the accuracy, completeness, orusefulness of any information, apparatus, product, or processdisclosed, or represents that its use would not Infringe privatelyowned rights. Reference herein to any specific commercial product,process, or service by tade name, trademark, manufacturer, orotherwise, does not necessarily constitute or imnply Its endorserent.recommendation, or favoring by the United States government orany agency thereof. The views and opinions of authors expressedherein do not necessarily state or reflect those of the United Statesgovernment or any agency thereof.
3

DRAFT NOT FOR ATTRIBUTION 08/04/02
Stochastic Failure Modelfor the Davis-Besse RPV Head
P. T. Williams and B. R. BassOak Ridge National Laboratory
P. O. Box 2009Oak Ridge, TN, 37831-8056
Abstract
The development of a stochastic model is described in this report in which the uncertainty associated withpredictions of burst pressure for circular diaphragms using computational or analytical methods isestimated. It is postulated that the trends seen in predicting the burst pressure with nine experimental disk-burst tests (using materials, geometries, and pressure loadings relevant to the Davis-Besse analysis) willbe representative of the computational predictions of the burst pressure in the Davis-Besse wastage areaproblem. Given a computational prediction of burst pressure for a specific configuration of the wastagearea, the scaled model will provide an estimate of the cumulative probability that the true burst pressurewill be less than any given service pressure.
The stochastic model was developed from the following technical bases:
(1) experimental data obtained during disk-burst tests with loadings, geometries, and materialsrelevant to the Davis-Besse pressure loading, wastage-area footprint, and cladding,
(2) nonlinear, large-deformation, elastic-plastic discrete-element analyses of the disk-burst tests,(3) nonlinear, finite-strain, elastic-plasticflnite-element analyses performed for the current study,
and(4) a theoretical criterion for plastic instability in a circular diaphragm under pressure loading,
applied to the disk-burst tests.
The resulting Log-Laplace model has the scaled form of
( -JAS4Pr(^f S9SP) = Fl(SP IPop = 2 1l.1057xPp, (SP115x
2(l.1057x ;(SPZ:l.I057xP,,)
Given a computationally-predicted burst pressure, P., the model gives an estimate of the cumulativeprobability, FL^ that the true (but unknown) burst pressure P,,,,,,) is less than a specified servicepressure, SP.
As an example application, estimates are provided for a bounding calculation of the "as-found" Davis-Besse wastage area. The bounding calculation predicted a burst pressure of 6.65 ksi which has acumulative probability of failure of (1158. The stochastic model estimates a cumulative probability offailure of 4.14x1077 at the operating pressure of 2.165 ksi and 2.15x10⁶ at the set-point pressure of2.5 ksi.
4

DRAFT NOT FOR ATTRIBUTION 09/04/02
1. Introduction
1.1. Objective
This report presents a stochastic model of failure for the stainless steel cladding in the wastage area of theDavis-Besse Nuclear Power Station reactor pressure vessel (RPV) head. For a given internal pressure, the
statistical model provides an estimate of the cumulative probability (probability of nonexceedance) thatthe exposed cladding will have failed at a lower pressure. The failure mode addressed by this model isincipient tensile plastic instability (i.e., plastic collapse) of the cladding.
1.2. Background
The following was taken from ref. [1].
On February 16, 2002, the Davis-Besse facility began a refueling outage that includedinspection of the vessel head penetration (VHP) nozzles, which focused on the inspection ofcontrol rod drive mechanism (CRDM) nozzles, in accordance with the licensee'scommitments to NRC Bulletin 2001-01, "Circumferential Cracking of Reactor PressureVessel Head Penetration Nozzles," which was issued on August 3, 2001. These inspectionsidentified axial indications in three CRDM nozzles, which had resulted in pressure boundaryleakage. Specifically, these indications were identified in CRDM nozzles 1, 2, and 3, whichare located near the center of the RPV head. ... Upon completing the boric acid removal onMarch 7, 2002, the licensee conducted a visual examination of the area, which identified alarge cavity in the RPV head on the downhill side of CRDM nozzle 3. Followupcharacterization by the ultrasonic testing indicated wastage of the low alloy steel RPV headmaterial adjacent to the nozzle. The wastage area was found to extend approximately 5 inchesdownhill on the RPV head from the penetration for CRDM nozzle 3, with a width ofapproximately 4 to 5 inches at its widest part.
See Fig. 1. for a photograph of the Davis-Besse RPV, a schematic of a typical nuclear power reactor, anda sketch and photographs of the wastage area.
1.3. Scope
In support of the investigation by the United States Nuclear Regulatory Commission's (NRC) Office ofNuclear Regulatory Research, the Heavy-Section Steel Technology Program at Oak Ridge National
Laboratory has developed a statistical model of a specific failure mode for the exposed stainless steelcladding in the cavity of the Davis-Besse RPV head. Section 2 reviews the technical bases employed inthe development of the model; Section 3 presents the details of the stochastic model; Section 4demonstrates an application of the model to the results of a bounding calculation for the "as found"condition of the wastage area; and Section 5 provides a summary and conclusions.
S

DRAFTY NOT FOR ATTRIBUTION 08/04/02
Davis Besse Reactor~esel Head Degradaion Head Cutaway View
czxyNo uIozie gi. Nedo h Wu prtood onrs onP by #W Liceme.
Fig. 1. (a) Davis-Besse Nuclear Power Station RPV and (b) sketch of RIPV head degradation.
6

DRAFT NOT FOR ATTRIBUTION 08/04/02
Typical Pressurized Water Reactor
Corol RodDrive Mchanbs
Rea"o %Vnet HeadA" dota&U Imap)
FILg. 1 (continued) (c) schematic of a typical nuclear power reactor showing the relationship of theCRDM nozzles to the RPV head.
7

DRAFT NOT FOR ALTRIBUTION 08/04/02
Fig. 1. (continued) (d) photographs of the wastage area with Nozzle 3 removed.
8

DRAFT NOT FOR ATTRIBUION 08/04/02
2. Technical Bases
The technical bases employed in the construction of the stochastic model are:
(1) experimental data obtained during disk-burst tests reported by Riccardella [2] with loadings,
geometries, and materials relevant to the Davis-Besse pressure loading, wastage-area footprint, and
cladding,
(2) nonlinear, large-deformation, elastic-plastic discrete-element analyses of the disk-burst tests also
reported in [2J (GAPL-3 discrete-element code[3]),
(3) nonlinear, finite-strain, elastic-plastic finite-element analyses performed for the current study
(ABAQUS finite-element code[4]) of the nine disk-burst test specimens reported in [2], and
(4) a theoretical criterion for plastic instability in a circular diaphragm under pressure loading, due to
Hill [5] (as cited in [6]), applied to the disk-burst tests.
2.1. Experimental - Disk-Burst Tests
In the early 1970s, constrained disk-burst tests were carried out under the sponsorship of the PVRC
Subcommittee on Effective Utilization of Yield Strength [7]. This test program employed a range of
materials and specimen geometries that were relevant to components in a nuclear power plant steam
supply system'. The geometries of the three test specimens analyzed in [2] are shown in Fig. 2, the test
matrix is shown in Table 1, and the properties of the three materials are presented in Table 2. The nine
disk-burst tests produced three center failures and six edge failures over a range of burst pressures from
3.75 to 15 ksi as shown in Table 1.
Table 1. Test Matrix for Disk-burst Tests 121
I SS 304 A 0.375 0.250 2.625 15 Edge2 B 0.125 0.125 2.375 6.3 Center3 C 0.375 0.125 2.625 7.7 Center4 A533B A 0.375 0.250 2.625 11 EdgeS B 0.125 0.125 2.375 5.3 Edge6 C 0.375 0.125 2.625 6.7 Center7 ABS-C A 0.375 0.250 2.625 9.3 Edges B 0.125 0.125 2.875 3.75 Edge
9 C 0.375 0.125 2.625 4.94 Edge
t The three materials are representative of reactor core support structures and piping, the reactor pressure vessel, andplant component support structures [2].
9

DRAFT NOT FOR ATTRIUTION 0e/04/02
Table 2. Property Data for Materials in Disk-burst Tests 121
SS304 34 84 054 34.07 129.36 0432 162.41 0.27A-533B 74 96 0.17 74.15 112.32 0.157 139.41 0.12ABS-C 39 64 0.31 39.08 83.84 0.270 105.20 0.17
The power-law parameters in Table 2 were fitted for the current study where a = KE and a, E are theeffective true stress and effective total true strain, respectively.
Geometry A
Geometry B,U r .125R
Fig. 2. Geometric descriptions of the three disk-burst specimens used In Ill (all dimensions areInches). Images on the right are Photoworks®-rendered views of VS-symmetry solid modelsof the three specimens.
10

NOT FOR ATTIBTIOB N0 08/04/02
2.2. Computational - Axisymmetric Discrete-Element and Finite-Element Models
The results of a computational study were presented in [2] in which the nine tests were simulated using
the GAPL-3 computer code [3]. GAPL-3 applied the discrete-element method using a two-layered system
of elements: one layer for the strain-displacement field and a second layer for the stress field to perform
an elasto-plastic large-deformation analysis of stresses, strains, loads, and displacements of thin plates or
axisymmetric shells with pressure loading. At each incremental load step, the code iterated to resolve both
geometric and material nonlinearities, thus establishing a condition of static equilibrium. The GAPL-3
code did not account for the reduction in thickness of the diaphragm with increasing load, and, therefore,
was unable to demonstrate the "tailing up" of the experimental center-deflection histories. As discussed in
[2], the thin-shell approximation of the GAPL-3 code is not strictly valid in the fillet region. The GAPL-3
model did include a plastic-hinge type of strain redistribution, but the strain concentration effect due to
the fillet radius was not accounted for, since the predicted strain distribution in the cross-section of the
fillet was linear by assumption. These approximations in the analysis were driven by the limitations of the
computer resources available at the time of the study in 1972.
The current study reanalyzed all nine disk-burst tests using the ABAQUS [4] finite-element code. With
current computing power, many of the simplifying assumptions required in 1972 could be removed to
provide a more detailed analysis. The fundamental assumptions made in the current study are:
(1) the material is assumed to be homogenous and isotropic before and throughout plastic defor-mation;
(2) the material is assumed to be free of pre-existing defects;
(3) the volume of the material undergoing plastic deformation is assumed to be constant (i.e., incorn-pressible with a Poisson's ratio of 0.5);
(4) the hydrostatic component of the stress tensor has no effect on yielding; and
(5) the plastic deformation follows incremental .2 flow theory (Mises yield criterion) with itsassociated flow rule (Levy-Mises) and isotropic strain hardening.
The finite-element meshes shown in Fig. 3 were developed using 8-node quadratic, axisymmetric, solid
elements with reduced integration (ABAQUS element type CAX8M). The material property data given in
Table 2 were used to fit power-law constitutive models for the plastic region of the three materials (see
Fig. 4). The analyses applied a nonlinear finite-strain procedure with an incrementally increasing pressure
load applied from zero up to the load at which numerical instabilities caused ABAQUS to abort the
execution.
11

DRAFT NOT FOR ATTRIBUTION 08/04/02
I
II
I
J Gcoinctry A
0.25 in. r= 0.375 in.
I Gcometry B,!n . r. - . .0 ....
II-0. 125 in. r =0. 125 in.'
/ 1.0 in.
1.0 in... I/
I1 1 Geometry C
I 1=0.125 in. /r 0.375 in.
1 ~ ~~~~ 3in. j^~-~~~
T1.0 in.
I5 in. I
I I
Fig. 3. Asisymmetric finite-element meshes used in the analyses of disk-burst tests reported in 12].Quadratic 8-node axisymmetric (CAX8R) elements with reduced integration were used In anonlinear finite-strain elastic-plastic analysis of the three disk-burst geometries with threematerials.
140 *
12D. .. _
ED --
t .
E 60 _30S^^00_
40
0 0.1 02 0.3 0.4 0.5
Tme Strain (-1 OW11 r"2V1O P
Fig. 4. True stress vs true strain curves of the three materials used in the disk-burst tests comparedto SS308 at 600 "F. These three test material curves were developed using a power-lawstrain-hardening model fitted to yield and ultimate strength/strain data for each materialgiven In 121. (See Table 2).
12

DRAFT NOT FOR ATTRIBUTION 08/04/02
2.3. Theory - Hill's Plastic Instability Theory
A plastic instability theory due to Hill [5] for a pressurized circular diaphragm constrained at the edges is
presented in [6]. Figure 5 shows the geometry of the diaphragm, both undeformed and deformed, alongwith the nomenclature used in the development of the theory.
The geometry of deformation is assumed to be a spherical dome or bulge of radius, R. The undeformed
ring element defined by its position, width, and thickness, (ro,Or,,h), respectively, is assumed to deform
to an axisymmetric shell element with surface length, 8L, deformed thickness, h, radial position, r, and
angle . The nonuniform thickness of the dome reaches its minimum at the pole with polar height H. Fora spherical coordinate system with its origin at the center of the dome, the principal strains for the thin-
shell (i.e., the strains are assumed constant through the thickness) clement are
o =In -) e =In = (i;6 EA =In ((1)
A geometric relationship exists between the radius and chord of a circle such that
RH +a 2 (22H a)
where a is the effective radius of the undeformed diaphragm. Using Eqs. (1) - (2) and the geometry shown
in Fig. 5, ref [6] derives the following relations for the meridional, E., and hoop, E,, strains at any pointon the spherical bulge
e,(zjH,a)=e,(zjH,a)= In1+ (z H )])
where he geometric parameter z is shown in Fig. 5. Applying the constant volume assumption, ie.,CO + e, + EA = 0, produces the following equation for the radial ("thickness") strain
Eh(z IH,a) = -2e,(z IHa) = In [ ( 2 (4)
13

DRAFT NOT FOR ATTRIEUTION 08/04/02
FIg. 5. Spherical geometry of deformation assumed In mill's 151 plastic Instability theory.
14

DRY~ DNo FOR ATRIBUTION 08/04/02
The effective strain then becomes
E.e -E. Y^=gE-e + (E,_E,)I +(E, _E,)2 =-E,,(zjH,a)=2ln 1+( 2 )] (5)
The maximum radial strain, therefore, occurs at the pole of the spherical bulge. Applying the thin-walled
assumption (which is not made in the computational finite-element model) for an axisymmetric shell
element, the equilibrium relation between the meridional, at,. and hoop, a,, membrane stresses and the
internal pressure, pi, loading is
Pi +(6)
For a spherical dome, R = = R, and a state of equibiaxial stress is assumed to prevail near the pole of
the dome with the principal stresses being
or, = ,C = R; a =° (7)2h'
and the effective stress , =4(-as) +(C.- ,)' + (a-a, is
a=a, =,, = p0 (8)
To establish an instability criterion, a surface can be constructed in pressure, effective stress, and
deformation/strain space by expressing Eq. (8) as a total differential of the form
Bpi =2ha'Rdp,+ pdR =2hda+26dh (9)
dpf d=d dh dRpi 67 hR
An unstable condition exists at a point of maximum pressure on the surface where dp = 0. The condition
is unstable because any perturbation from this position always involves a reduction in load (pressure),
even in a rising stress field. The instability criterion for a deformed bulge of radius R is, therefore,
established by the following relation between stress and the deformed geometry for any point on the dome
15

DRAFT NOT FOR ATTRIBUTION 08/04/02
d6' dR dh= _ _
a~ R h
or in terms of effective strain
(10)
(11)I da lI dRF-F=1+ RdE
If the instability condition is attained, it will first occur at the point of maximum effective strain at the topof the dome (at z = H) such that Eq. (11) can be stated as
I dU 3 1( 2 E)
0 di' 2 4 E t 2 (12)
Applying a power-law constitutive form to relate effective stress to effective strain in the plastic region,
?F=Ki, 9(13)
the effective strain at instability is, after a great deal of algebraic manipulation,
!,,, = 4 (2n +1)11
(14)
where n is the power-law exponent in the constitutive equation, Eq. (13).
16

DRAFT NOT FOR ATRXBUTION 08/04/02
For a given material and diaphragm geometry (n, a, ho), the pressure at the instability condition (i.e., the
burst pressure) can be determined by the following procedure:
* Calculate the effective critical strain.
* Calculate the corresponding effective critical stress.
* Calculate the critical thickness.
eF,, = 4l (2n+l)11
C,,,, = K E
h.e, = So exp(-E.,,,,)
* Calculate the polar height at the critical condition.
* Calculate the corresponding bulge curvature radius.
* Finally, calculate the predicted burst pressure.
H.*=a E.IHS = exp( 2)-l
=H2 + a2
2H.,
R,2hPR.,
An alternative instability criterion was developed by Chakrabarty[8] which was based on a Tresca yield
surface. The critical effective strain was found to be
'2(2 - nX + 2n)11-4n (15)
17

DRAFT NOT FOR ATTRIBUTION 08/04/02
3. Stochastic Model Development
3.1. Computational and Theoretical Model Results
Computational results using the GAPL-3 code were presented in (2]. Converged solutions were obtained
for eight of the nine tests. Comparison of experimental and computational centerline deflections showed
good agreement for the eight converged cases. In the nonconverged case (ABS-C, geometry C), some
difficulty was reported in getting convergence at high pressures. In all cases the experimental data showed
a "tailing up" as the pressure approached burst pressure, which the computational model was unable to
capture. In general, the prediction of the burst pressure for the eight converged cases showed good
agreement with the experimentally-determined burst pressures. Defining a as the ratio of the
experimental burst pressure to the computationally-predicted burst pressure, the mean for a was 1.19
with a standard error for the mean of ±0.0484 and a standard deviation for the sample of 0.137.
The finite-element models using ABAQUS were able to obtain burst pressures for all nine tests, where the
predicted burst pressure is defined as the pressure at which a breakdown occurs in the numerical
procedure, causing the run to abort. For a nonlinear, finite-strain, static load step, ABAQUS uses
automatic sizing of the load increment to maintain numerical stability. The number of iterations needed to
find a converged solution for a load increment varies depending on the degree of nonlinearity in the
system. If the solution has not converged within 16 iterations or if the solution appears to diverge,
ABAQUS abandons the increment and starts again with the increment size set to 25% of its previous
value. An attempt is then made at finding a converged solution with this smaller load increment. If the
increment still fails to converge, ABAQUS reduces the increment size again. ABAQUS allows a
maximum of five cutbacks in an increment before aborting the analysis. Therefore, ABAQUS will
attempt a total of 96 iterations with six increments sizes before abandoning the solution. The initial load
size for the failing increment was typically already very small due to difficulties in convergence with the
previous and final successfully-converged load increment.
Equivalent plastic strain contours are shown in Fig. 4 for the geometry A (ABS-Ccarbon steel) specimen
(Test No. 7) at the point of numerical instability. The experimental burst pressure for this specimen was
9.8 ksi and numerical instability of the solution occurred at approximately 9.05 ksi, for an a= 1.083.
Highly localized plastic staining can be observed near the fillet, thus predicting an edge failure for this
specimen which did in fact fail at its edge.
I8

DRAFT NOT FOR ATTRIBUTION 08/04/02
INE2lw OII. lsq
.47. 17.- I
74..I
Geometry AABSC
Predicted BP = 9.05 ksiExperimental BP = 9.8 ksi
2 &KIs Oak bOPut, VACM: ^_AISCUc ABAQAIS ozd6.2.-4 Sue Juni It 51:00.:4 ImElrn DWI Iv Tos m32
uamna 42: Stp TIem - 0.9062" Iteis V a U a mEE c d Qt
Ref. P. C. Riccardella, Elasto-Plastic Analysis of Constrained Disk Burst Tests.'ASME Paper No. 72-PVP-I2, ASME Pressure Vessels end Piping Conference, NewOrleans, LA, September 17-21, 1972.(a)
GeometryAABSC
Predicted BP = 9.05 ksiExperimental BP = 9.8 ksi
aaSO 0 St baM ?SY A I0m: Cwel.AIIIC C~ MAIWIISI, -yd&.g.4 Tue j,
I oww 42: S$1 h0 im -a 0.902PINImty Vas PESODof of V. : U OK aout Ian Seeda Sew- .s Mr.m
(b) -. ,
Fig. 4. Equivalent plastic strain contours for the Geometry A (ABS-C carbon steel) specimen at thepoint of numerical instability. Highly localized plastic straining provides a precondition forplastic collapse at the edge of the specimen. (ABAQUS analysis results)
19
DRAFT NOT FOR A1TRZBUTION 08/04/02
Figure 5 compares the predicted centerline deflection load histories with the experimentally-observed
deflections at failure (estimated from Figs. 3 and 4 in [2]). The "tailing up" of the experimental deflectioncurves near the point of failure is predicted by the model, indicating that the computational simulationsare capturing the final localized "necking" of the diaphragm. For the nine ABAQUS predictions, themean for a was 1.055 with a standard error for the mean of ±0.0331 and a standard deviation for thesample of 0.0993.
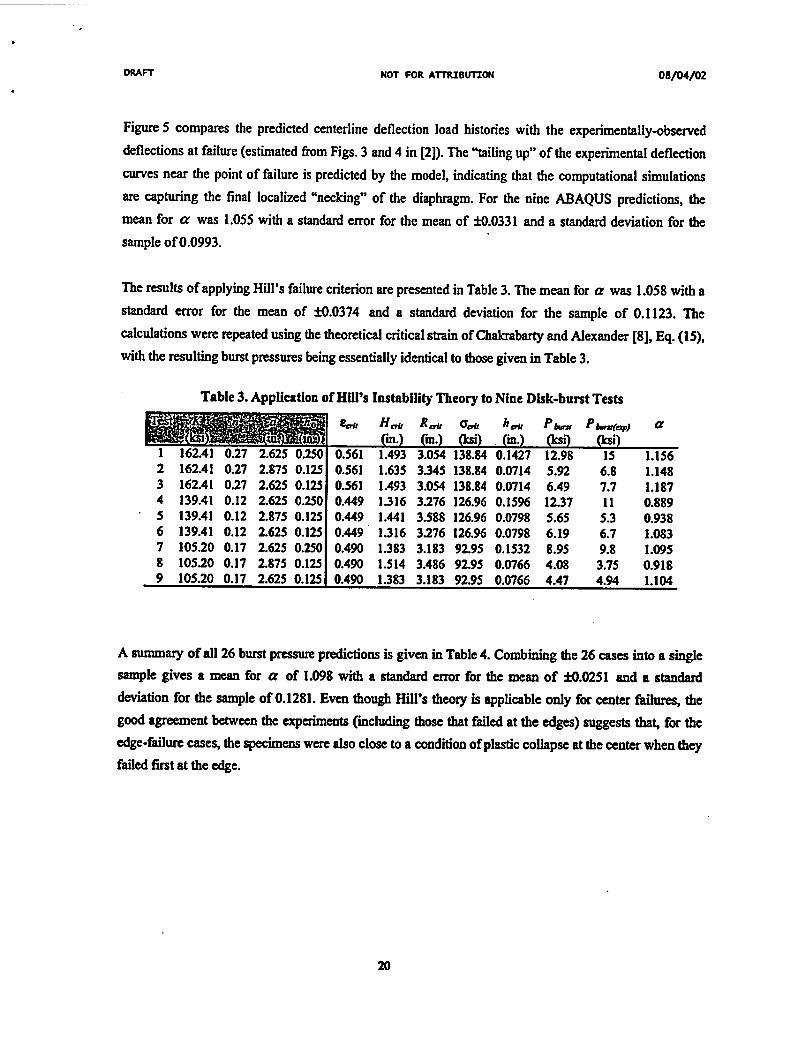
The results of applying Hill's failure criterion are presented in Table 3. The mean for a was 1.058 with astandard error for the mean of ±0.0374 and a standard deviation for the sample of 0.1123. Thecalculations were repeated using the theoretical critical strain of Chakrabarty and Alexander (8], Eq. (15),with the resulting burst pressures being essentially identical to those given in Table 3.
Table 3. Application of Hill's Instability Theory to Nine Disk-burst Tests
_ Ea, H,* R.* CF.* he P,, PI,,W) aCm.) (n.) Orsi) (in.) (ksi) (ksi)
1 162.41 0.27 2.625 0.250 0.561 1.493 3.054 138.84 0.1427 12.98 15 1.1562 162.41 0.27 2.875 0.125 0.561 1.635 3345 138.84 0.0714 5.92 6.8 1.1483 162.41 0.27 2.625 0.125 0.561 1.493 3.054 138.84 0.0714 6.49 7.7 1.1874 139.41 0.12 2.625 0.250 0.449 1.316 3.276 126.96 0.1596 12.37 11 0.8895 139.41 0.12 2.875 0.125 0.449 1.441 3.588 126.96 0.0798 5.65 5.3 0.9386 139.41 0.12 2.625 0.125 0.449 1.316 3.276 126.96 0.0798 6.19 6.7 1.0837 105.20 0.17 2.625 0.250 0.490 1.383 3.183 92.95 0.1532 8.95 9.8 1.0958 105.20 0.17 2.875 0.125 0.490 1.514 3.486 92.95 0.0766 4.08 3.75 0.9189 105.20 0.17 2.625 0.125 0.490 1.383 3.183 92.95 0.0766 4.47 4.94 1.104
A summary of all 26 burst pressure predictions is given in Table 4. Combining the 26 cases into a singlesample gives a mean for a of 1.098 with a standard error for the mean of i0.0251 and a standarddeviation for the sample of 0.1281. Even though Hill's theory is applicable only for center failures, thegood agreement between the experiments (including those that failed at the edges) suggests that, for theedge-failure cases, the specimens were also close to a condition of plastic collapse at the center when theyfailed first at the edge.
20

DRAFT NOT FOR ATTRIBUTION 08/04/02
0
1I
i
i0
E t
(a)
SS304
2 . * '
Geometry B.
*1 -' " '"
. . . .. .. ..... . .. ..,. .. .. ... ... .... .. . . .. . . .- .... ... .- ... .. ..
002 4 6 I 10 12 14
Pressure (ksI MW122002. Vtw
1.5 -A533B
1 ,,.*- -- /- Iti ;tt'' ;.*....... ......... .....
.. .. .... .. .... .G ............ ... . ../ . .. .......
1 _ . I t
l... .E /.. ....... _ ._ .. .. .. .
.... ... .. i .. ..., ... ..0.!-
4 .. 1 4......... .0 2 4 a 10 12 14
ne
A
III
(b) Pressure (ksQ Irw1120020 -wABS.C
iII
'... .1-- -' -.. ..
Om A Y .... .. ..... ...'' ''
_ I',
,.1- I. . _ 1 -
0.1
^ i--d _.- _
...'' '' ' ' ' '' ' .. A .. 't ' ''. -'-' . ...................... .I...: 1 L 1.. ... L ..
. . . . .-0 2 4 6 a 10 12 14
(C) Pressure (ksQ) SWt2J0mpw
Fig. 5. Comparison of experimental centerline vertical deflections at failure to ABAQUS FEMvertical deflection histories at the center of the Geometry A and B specimens for (a) SS 304,(b) A533-B, and (c) ABS-C materials, and
21

DRAFT NOT FOR ATTRIBUTION 08/04/02
ABS-CSpecimen
Failure
SS304Specimen
Failure Geometry C2
on0
M
0C:U:C
CD0-4ai!
CD0
1.5
0
0.5
-~...i ~. . -----.. ....... ...... .... .... ..... .... .S34 .... ..... .... ..... ......... , .......... ........... ..... ,........ ,..... ... . ....
....... ... . ..... ..... . . .1. .... . t...... ........... ..............
M S:.... .. .... ......... .... Aallu C. - ^i ..... ......... .....
*..... ........... .....
_ ..... .. ; '. . -A533Be - ....................... ....._............ . , .. , . ..... ,............ ........... .....
............... - ;........33B-- ........... .. ...... ............ . . . . . ----- ..... t.;. /... ..... ..... ..... ..... ...... ........... .......... .......
...... .. .. . ... {.j # ....- ..... ......... . ........... .....
;R; . ....... .. ... .. .... ....... .... ........ ..... ........... ...... ..... .......... ..... .. . ..... .. . ..... .. . ..... .. . ..... ,..... ,....._
A^ ........... . ...... ..... ........... I.. ......... .... . ............ .........0. 0 2 4 .. 6 8 10 12 14
(d) Pressure (ksi) 06/12/2002.K4 ptwFig. 5. (continued) (d) ABAQUS FEM vertical deflection histories at the center of Geometry C, all
three materials compared to specimen failure.
22

DRAFT' NOT FOR ATTRIBUTION 08/04/02
Table 4. Comparison of Experimental Burst Pressures to Three Predictions
I SS 304 A is MEe 12.3 Edge 12 12.98 Center 1.16 13.29 Edge 1.132 B 6.8 Cee 4.3 Edg 1.42 5.92 Center 1.15 6.22 Edge 1.093 C 7.7 Center 7.4 Center 1.04 6.49 C 1.19 6.59 Center 1.174 A5333 A it Edge 9.1 Edge 1.12 12.37 Center 0.89 12.26 Edge 0.905 B 5.3 Edg 4.2 Edge 1.26 5.65 Center 0.94 5.24 Edge 1.016 C 6.7 Cene 6. Center 0.99 6.19 Center 1.08 6.03 Ed 1.117 ABS-C A 9.8 Edge 8 Edge 1.23 8.95 Center 1.10 9.05 Edge 1.08I B 3.75 Edge 3 Edge 1.25 4.03 Center 0.92 4.19 Edge 0.S99 C 4.94 Edp I 4.47 Center 1.10 4.46 Edge/Center 1.11
23

DRAFT NOT FOR ATrRIBUTION 08/04/02
3.2. Development of Stochastic Model of Failure
The development of a stochastic model is described in this section in which the uncertainty associated
with predictions of burst pressure for circular diaphragms using computational or analytical methods is
estimated. It is postulated that the trends observed in estimating the burst pressure with the nine disk-burst
tests in [2] will be representative of the predictive accuracy of computational estimates of the burst
pressure in the Davis-Besse wastage-area problem. Given a prediction of burst pressure for a specific
configuration of the wastage area, the scaled stochastic model will provide an estimate of the cumulative
probability that the true burst pressure will be less than a given service pressure. This postulated linkage
of the test specimens to the Davis-Besse problem is obviously an approximation, since the wastage area
footprints are not identical to the circular diaphragms used in the tests. The appropriateness of this linkage
is in part, therefore, dependent on the ability of the finite-element models to capture, as accurately as is
feasible and based on the best current knowledge, the actual geometry of the wastage area footprint.
Table 5 summarizes some descriptive statisticsifor the ratio of experimental burst pressure to predicted
burst pressure, a, for the three predictive methods discussed in the previous section. Also shown in the
table are the results of combining the three samples into one larger sample of 26 data points. This
combined sample was used to develop a stochastic model with at treated as a random variate. Combining
the three sets into a single sample produced a sample size large enough for the application of the
computer program Expert File [9]. Also given in Table 6 is a ranking of the 26 data points where the
median rank order statistic is
i-0.3p-- ) II * (16)
The Expert Fite [9] computer program was used to develop a stochastic model of the sample data
presented in Table 6. Using a combination of heuristic criteria and Goodness of Fit statistics, twenty six
nonnegative continuous distributions were tested with the results shown in ranked order in Table 7. The
point-estimation procedures noted in Table 7 include Maximum Likelihood (ML), Method of Moments
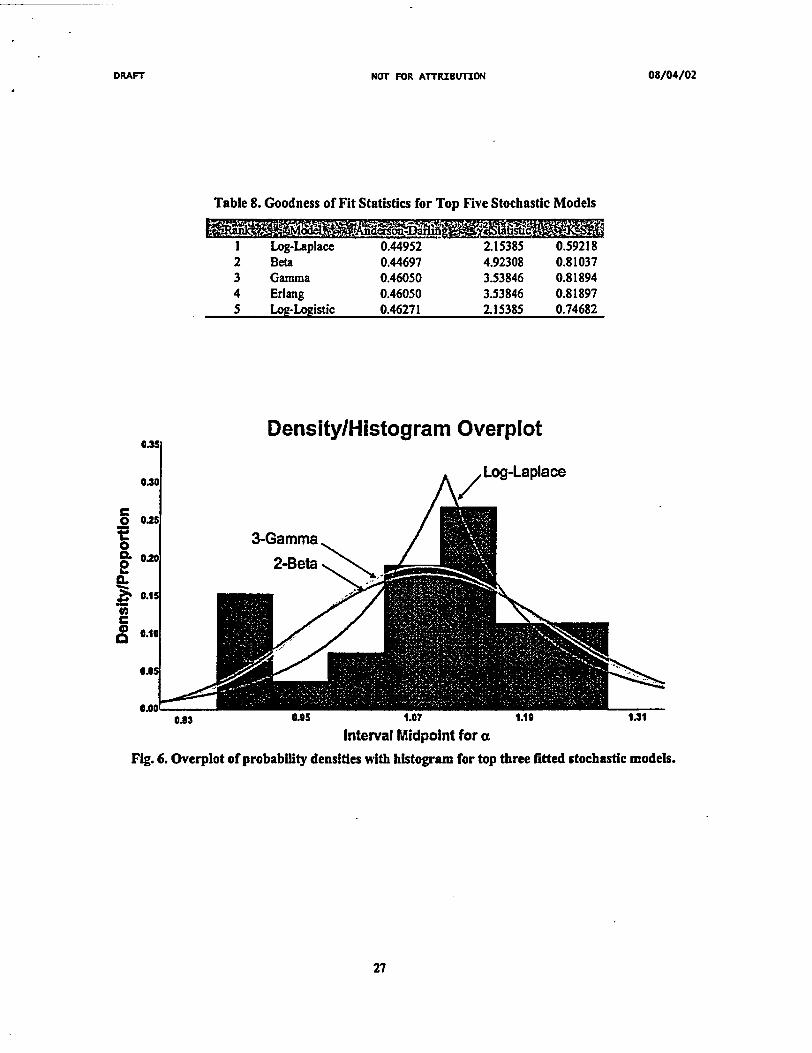
(MM), and Quantile Estimates. Table 8 compares three Goodness of Fit statistics (Anderson-Darling, X,
and Kolmogorov-Smirnoff (K-S)) for the top five distributions. None of these distributions were rejected
by the tests. Figure 6 shows a density/histogram overplot of the top three distributions.
24

DRAFrb NOT FOR ATTRIBUTION 08/04/02
Table 5. Descriptive Statistics for the Ratio of Experimental Burst Pressureto Predicted Burst Pressures
.......zr.. a k'1¶ .- a,,-..f n- -, ~ lf*nns-f,,na.n~rtr...et~.t2.f
.wuA.Aam;.' c ; AA
Sample SizeMeanStandard ErrorMedianStandard DeviationSample VarianceKurtosisSkewnessRangeMinimumMaximumConfidence Level(95.0O%)
81.19020.04841.22230.13680.0187-0.05060.00070.43140.98531A1670.1144
91.05760.03741.09530.11230.0126-1.4799-0.58920.29790.88891.18680.0863
91.05490.03311.09390.09930.0099-0.4349-0.96830.27390.89431.16820.0764
261.09750.02511.10570.12810.01640.25930.17140.52770.88891.41670.0517
Table 6. Combined Sample Used in Development of Stochastic Model
00 31I Hills hy A533B2 ABAQUS Soln. ABS-C3 ABAQUIS Soln. A533B4 Hil's Theoy ABS-C5 Iiilrs They A533B6 Riaurrdella (1972) A533B7 ABAQIS Sdn. A533B8 Ricala (1972) SS 3049 ABAQI.E San. ABS-C10 Hill's Thbay A533B11 ABAQLS Soln. SS 30412 Hill's Theary ABS-C13 HilrsThey ABS-C14 ABAQT.S Sdn. ABS-C15 ABAQUS Soiln. A533B16 Ricardella (1972) A533B17 ABAQLlS Socn. SS 30418 Hif's hory SS 30419 HllrsTheory SS30420 ABAJQUS Soln. SS 30421 iil'sfheory SS30422 Riarrdeda (1972) SS 30423 Riorrdella (1972) ABS-C24 Rikandela (1972) ABS-C25 Ricardella (1972) A533B26 Ricammrdla (1972) SS 304
A 0.8889B 0.8943A 0.8972B 0.9180B 0.9382C 0.9853B 1.0119C 1.0405A 1.0827C 1.0829B 1.0939A 1.0953C 1.1042C 1.1072C 1.1104A 1.1224A 1.1288B 1.1479A 1.1560C 1.1682C 1.1868A 1.2195A 1.220B 1.2500B 1.2619B 1A167
0.02650.06440.10230.14020.17800.21590.25380.29170.32950.36740.40530.44320.48110.51890.55680.59470.63260.67050.70830.74620.78410.82200.85980.89770.93560.9735
ca = ExperixmM Burst Pressurd~redicted Bus Pressure
25

DRAFT NOT FOR ATrRIBUTION 08/04/02
Table 7. Non-negative Bounded Continuous Distributions Investigated -Ranke odness of Fit
I -Lag-Laplace Locatian Deiault 0Scale ML estimate 1.1057Shape MLestimate 11.45441
2-Beua Lower endpoint MOM estimntae 0.61449Upper endpoint MOM estimate 1.73866Shape oI MOM estimate 7.95564Shape #2 MOM estimate 11.33552
3-Gamma Locatien Defult 0Scale ML esimate 0.01444Shape ML estimate 76.01293
4. Eflang Location Defiult 0Scale ML estimate 0.01444Shape ML estimate 76
5. Log-Loistic Location Deliaut 0Scale MLestimate 1.095S6Shtape ML estimate 15.21867
6 -Wetbull Locatien Delmult 0Scale MLestimate 1.15333Shape ML estimate 9.03948
7.-Lognormal Location Default 0Scale MLestimate 0.08641Shape ML wtimate 0.11516
* RaIndom Walk Location Default 0Scale ML estiae 0.92335Shape MLestitate 69.1St
9.11sent Gausn Location DeAu 0Scale ML estimate 1.09747Shape MLestimate 3-23451
10. n Pason Tpe V Lacation Default 0Scale ML estimate SIA2582Shape MLudimate 75.1346
II. I-swrted Weibull Loatoln Default 0Scale ML estmate l.02327Shape MLortimatc S38335
12- Weibul(E) Location Quandle estimate 0.33S4Scale MLestimate 0.21562Shape MLe te 1.15S68
13 -ayeiggh(E) Location Quantleestimate 0.33wScale ML estimate 0.24352
14- Ekng(E) Location Qun1ti etimate 0.3tUScale MLutiemte 0.2062Shape NL tlmate I
15-G3amaE Location uantileestinate .38334Scale ULimate 0.21819Shape MLW&mte 095616
16 -. aponncial(E) Location ML eim-e 0.8Q39Scale ML imate 0Q2057
17 -rearacn Type V(E) Location Qtlemtinate 0.33834Scale Dsth IShape4l MLstimate 1.00117Shpe #2 MLestimate 5.43892
isL-ogneM=aE) Location Quantle etimate 0.38834Scale MLtimat 4.17414Shape ML estimate 1.6365
19 -Rando WdkE) Location Quanic estimate 0.33334Scale ML temate 699.32509Shape MLetmate 4.32644
2 --Pardo(E) Location MLestimate UQS9Shape ML etimate 4.976
21 .atSquam Location Qissa estimate 0.Q3S44C l. tate 0.72313
22 -Wald Location Deftult aShape ML Climate 48.03951
23-Raleigh Location DW t 0Scale MLostimate 1.10463
24- Exponential Location Ddauh 0Scale ML stimate 1.09747
25-WWdd Lcation Quntile estimate QSSSUShape ML simte 1.43E-03
26. lInerse GaussianE) Location Qatie timate 0.89E.04Scale MLestimate 0e20EShape ML estimate 1.44E-03
26
DRAFT NOT FOR AfTRIBUTION 08/04/02
Table 8. Goodness of Fit Statistics for Top Five Stochastic Models
1 Log-Laplace 0.44952 2.15385 0.592182 Beta 0.44697 4.92308 0.810373 Gamma 0.46050 3.53846 0.818944 Erlang 0.46050 3.53846 0.818975 Log-Logistic 0.46271 2.15385 0.74682
Density/Histogram Overplot
0.3C
C eme:
o 0.2
2 @% 0.11
Co 0.10 I
6.05
1.31
Interval Midpoint for aFig. 6. Overplot of probability densities with histogram for top three fitted stochastic models.
27
DRAFT NOT FOR ATTRIBUTION 08/04/02
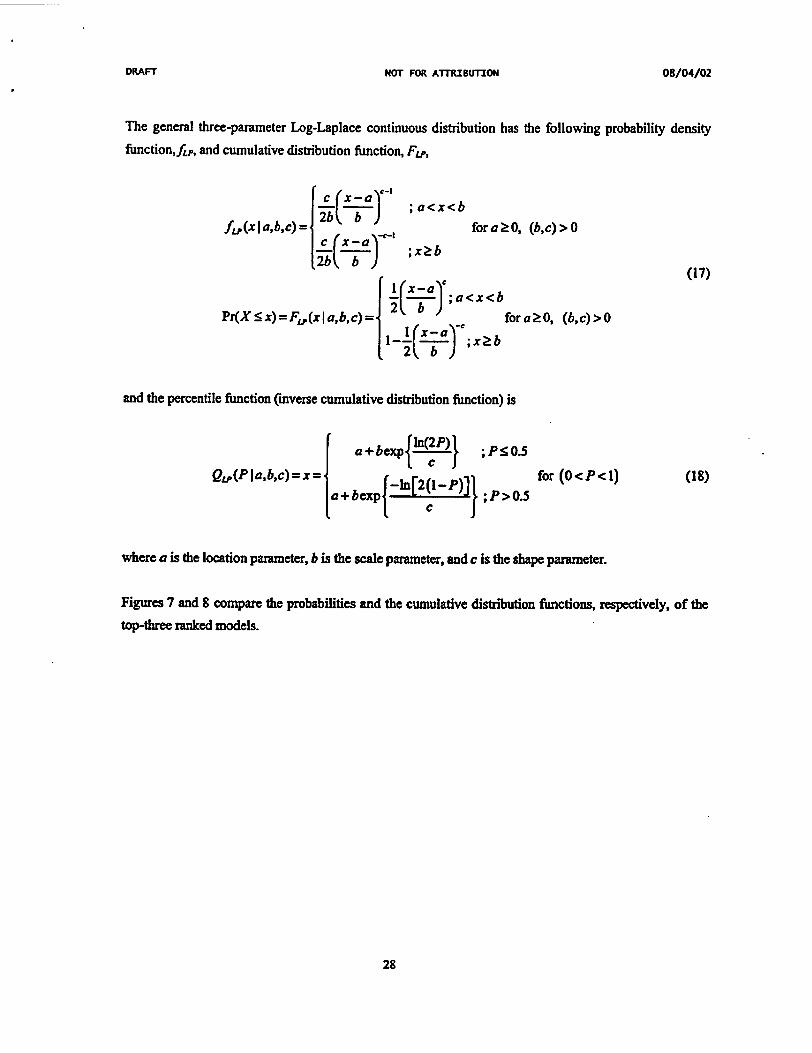
The general three-parameter Log-Laplace continuous distribution has the following probability density
function,fi,, and cumulative distribution function, Fu,
I r (Y-oA-- ;a<x<b
fxp(xlasb~c)= 2b( b fora) ;ax
c x-a) ;x2tb
Pr(X < x) = FP (x I a,b,c)=j for a
and the percentile function (inverse cumulative distribution function) is
a+bexp {In(2P) ;P O.5
QJp(P lab,c) =x= x-(n[2(1-P)]1a+bexp | ;P>0.5
b,c) > O
(17)
20, (b,c)>0
for (O<P<I) (18)
where a is the location parameter, b is the scale parameter, and c is the shape parameter.
Figures 7 and 8 compare the probabilities and the cumulative distribution fiunctions, respectively, of thetop-three ranked models.
28

DRAFT NOT FOR ATTRIBUTION 08/04/02
Probability-Probability Plot
1.01 1 - . .____ 1ii*
0.7
0.21 [ , / ______.,
Samiple Who
PA0 Ofg .tmyI. El.L~q.La~g&-aw" d-wspc".uu al-w1 denp.q.-aS1Ol O3S- ts~w~psa4AflTW
Fig. 7. Probability-probability plot comparing top three fitted distributions.A1
,2
if
0
co
.02
E0
0.8
0.6
OA
0.2
..* .. .......
............... S...., ..... . .. . . . .. .. ._
. . . . . . , . .. ..y . . . . . .
_.. ... ....... ..........
, . . . , . . . . .a . . .. . . . .
.. . . . . . . . .
. . . .. ... . .. . .. . ._
. . . . . . . . . .
,~ . __. .L. , . ,
.. . .. .. . .. . . . . . . . . .
Gc :lr! : :. : : > : : 9@@~@fi*twog-Lpae
. .. . . . . . . . .
......... . . . . . . :.. . ...... . t e 0.13 9__...... .. ..... _R Nl __
. .. . . s . . . . . . ... . . . . .... . .....
...................... ........... ,.. , I #... ')u .,
_ _... _.w ......... .. . ...........
n0.8 1 1.2 1.4 1.6
Experimental BPlPredicted BP, a 08104/2002.K2 ptwFig. 8. Log-Laplace statistical failure model (n - 26) compared to a beta and gamma cumulative
distribution functions.
29

DRAFr NOT FOR ATTRIBUTION 08/04/02
From the Expert Fito [9] analysis, the optimal (Log-Laplace) stochastic model of failure has the followingform
10 .4544 1
5.17971 afLp(a 10,1.1057,11A5441)= 5 (1.710-) 7
9710 -1.1057)
; 0<a<1.1057
; a21.1057
(19)1 a 4
2 1.1057)
,-I a -1'452 1.1057)
; 0<a<1.1057
441; a21.1057
where a is the ratio of the true (but unknown) burst pressure to the calculated burst pressure. Thepercentile function is given by
QL,(P10,1.1057,11.A5441)=a= Ie05 In(2p) ;1P0.5
1. 1057exp {l[2( -P)]. ;P>0.5for (O<P<1) (20)
This stochastic model will be used to provide statistical estimates of the expected predictive accuracy ofcomputational methods applied to burst pressure calculations for constrained diaphragms.
30

DRAFT NOr FOR ATTRIBUTION 08/04/02
4. Application of Stochastic Model to Bounding Calculation
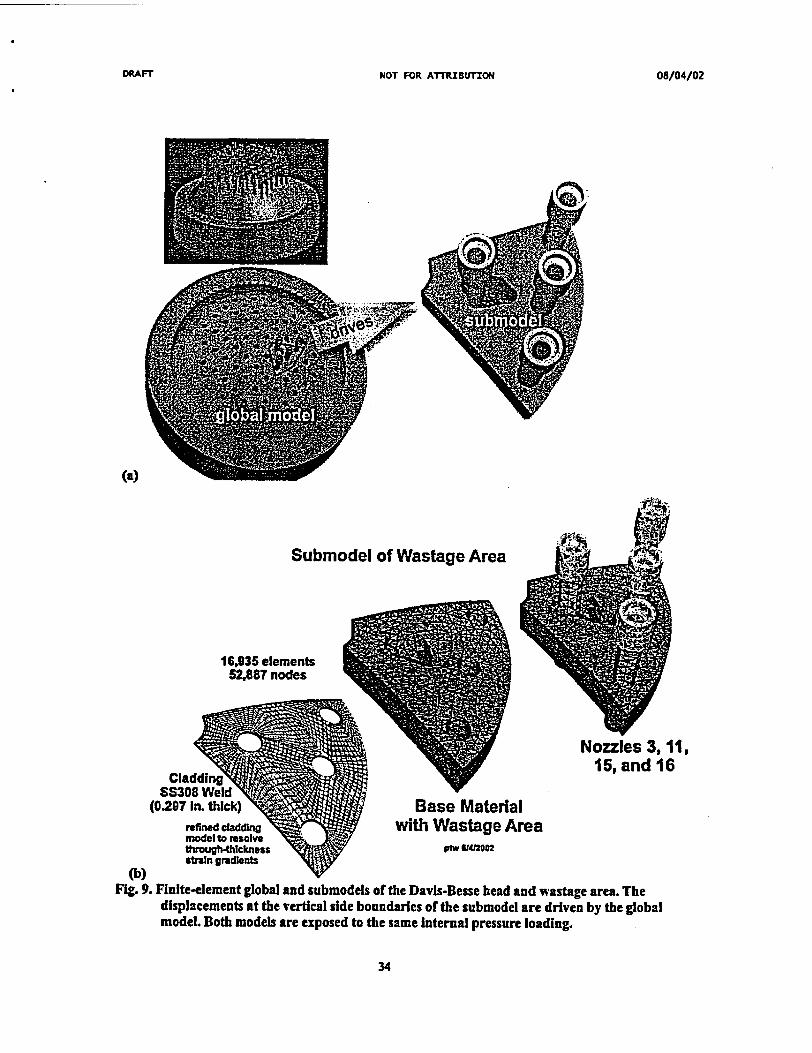
A bounding calculation was carried out for the "as-found" condition of the wastage area in theDavis-Besse head. The finite-element model used in the analysis is shown in Fig. 9. An adjusted stress-strain curve (see Fig. 10) was constructed to lower-bound the available data for the cladding material. Thegeometry of the wastage area footprint was taken from Fig. 13 in the Root Cause Analysis Report [10]. As
an estimate of the uncertainty in the current wastage area measurements, the footprint was extended byapproximately 0.25 inches (see Table 9 and Fig. 11 for a geometric description of the adjusted footprint).A uniform cladding thickness of 0.24 inches (the minimum cladding thickness value shown in Fig. 14 ofref. [10]) was assumed in the model. The finite-element model was then loaded with increasing pressureuntil the point of numerical instability at an internal pressure of 6.65 ksi (see Fig. 12).
For the predicted burst pressure of 6.65 ksi, the Log-Laplace statistical failure model can be scaled toprovided estimates of cumulative probability of failure (or probability of nonexceedance) as a function ofinternal service pressure for the specific condition of the wastage area simulated by the finite-elementanalysis. An example of the scaled Log-Laplace model is shown in Fig. 13. The scaled Log-Laplacemodel has the following form
5 .17971( Sp 10.45441
S.791057 P r.24S
5.1797.1057xPI_ _
; O<SP<1.1057xP,.
; SP21.1057xP,,
(21)
i(1.057xPJ,) ; 0<SP<1.1057xPpPrP,()gSP) =FL.p(SP I PP) =I SP IllAM41
where, SP, is the service pressure under consideration, Psp is the predicted burst, and Ppf(Q,.,) is theunknown true burst pressure. The scaled percentile function is
Qp(PI0Jl.I057xpb, 11.45441) =SP= I°.057xPpexp {f ln(2P)1} ; P < 0.5
P-ln[2(1-P)] for (O|P<1)(22)1.1057xP,,exp 11.45441 ;P>O35
31

DRAFT NOT FOR ATTRIBUTION 08/04/02
Table 9. Wastage-Area-Footprint Geometry Data
~~~Jm MUNI- r > 1
As-Found Footpqnt I 3536 3036 16A122 4.1194 98J9 969933 -117.16 75.26 197.41 cO.904.O,43S> cO.4351.0.9004>
AdjustedFootprint 0.25i. 40.06 31.78 16.4301 4.1255 129.02 11031J1 -14135 99.O0 245.71 <0.943.4.4476> <0.4476.0.94P3f1r Bounding Calculation
Fooqprint enraid is in global eordinates.Global coordinat aysteq his its zas aligned with die vetical centerline ofahe vessel.The x-y plane ofthe global coordinate systeau is a boz aal phsoewidt hie x-s dalong tbelebtween die enerlines oNozzsle 3 nd I.
,'Adjusted" Footprinta - 25 In.
Area - 40.06 In'Perimeter- 31.78 In.
Centroid ofI /Footprint EM
E~,
"As Found" Footprint /Area - 35.36 In'
Perimeter - 3036 in.
r,=ra + ax;= -r, cos(4,)
Y, = r, sin(C,)
32

D5 A,1r DNOT FOR ATTRIBUTION 08/04/02
Table 9 (continued) Details of Wastage Area Footprint Before Adjustment for BoundingCalculation (Figure taken from Fig. 13 ref. 1101)
Amn ofA1 to critm 1hg,Vi Pans -1 lCycle
t'' 2 fIPOAM D ' , ns
i.,Ii . I
0 -0.639 -1.8951 -0.334 -2.2802 0.000 -2.2353 0.500 -2A924 1.000 -2.5225 1.500 -2.4826 2.000 -2.5817 2.500 -2.7308 3.000 -2.7699 3.500 -2.75910 4.000 -2.78911 4.500 -2.81912 5.000 -2.81913 5.500 -2.75914 6.000 -2.70015 6.500 -2.62116 7.000 -2.51217 7.500 -2.36418 8.000 -2.21619 8.500 -2.08720 9.000 -1.71221 9.135 -1.00022 9.000 -0.55523 8.500 0.137
2425
*262728293031323334353637383940414243
8.000 0.3347.500 0.4837.000 0.5826.500 0.8296.000 1.0465.500 1.3035.000 1.7784.500 2.4604.000 3.0233.500 3.3003.000 3.2212.500 3.2502.000 3.3001.500 3.3491.000 3.2400.500 3.1220.000 3.000-0.210 2.578-0.364 2.000-0.242 1.985
Origin of local coordinate system located at centerline of Nozzle 3. (inches)
33
DRAFr NOT FOR ATTRIBUTON 0S/04/02
(a)
Submodel of Wastage Area
16,935 elements52,887 nodes
Nozzles 3, 11,15, and 16
Base Materialwith Wastage Area
pWw W4WZ2
(b) VFig. 9. Finite-element global and submodels of the Davis-Besse head and wastage area. The
displacements at the vertical side boundaries of the submodel are driven by the globalmodel. Both models are exposed to the same Internal pressure loading.
34

DRAFT NOT FOR ATTRIBUTION 08/04/02
. I_. _-.; . ;;.. -_ . . .. . I- ...-... . ... ___.,
_L ,
Global Model of Davis-BesseRPV Head and Closure Flange
L4SECTMoNA
(c) l . . .
Oak Endge Hatonal Laboaty
___~~ S_ B
. O __ __
G us|_ % r _ __ ._ _ OM __ S -
Davis-Besse RPV Headand Cosmre Flange
in_ --- - 1_-- -- i
Fig 9. (continued) (c) geometry of RPV head and closure flange used In global model,
35
DRAFT NOT FOR ATTRIBUTION 08/04/02
©
0
3
N
4
©
©
kIII
III
4-
ALLOW.NSIOdS sJ ICKs
III
I
/ I
/ //
L, a
Snes Oak Ridge National Laboratory"nd Enineeg Drsion
Moweging VW nSIa aGm Heavy-Secdon Steel Technology ProgramUT-Battelle, LUC
ORaY PLr tU seWGNO. s I RCa( II. SCALE AI 21=2 APIL
(d)
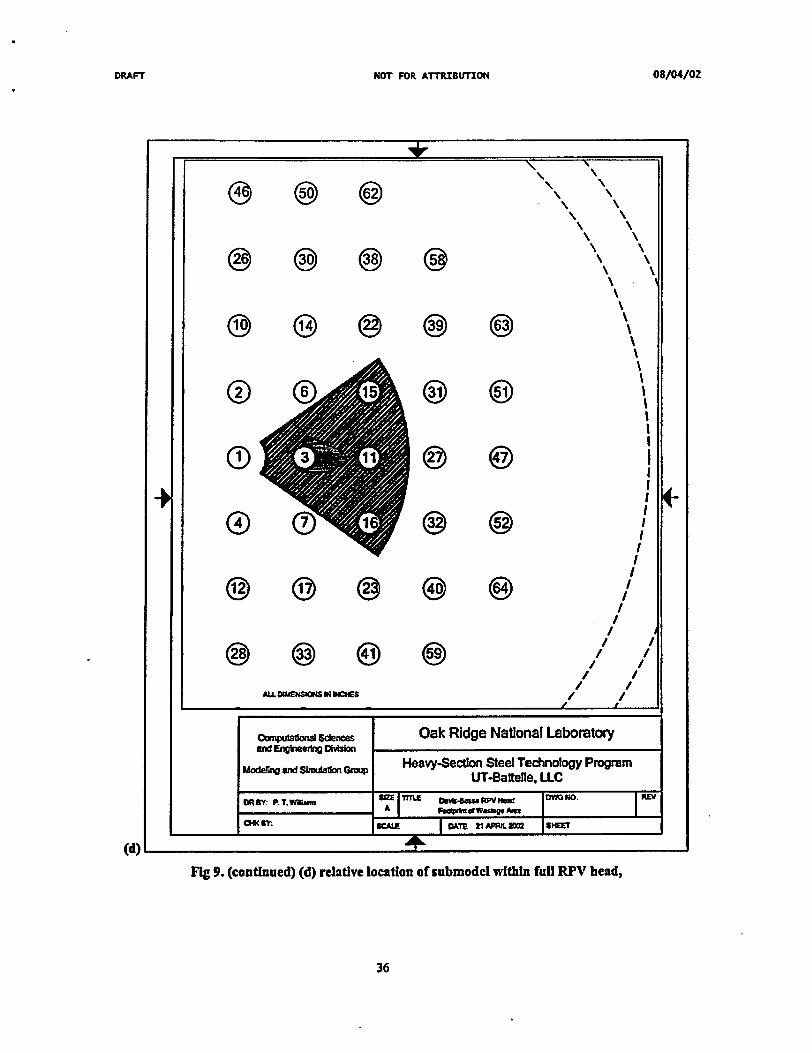
Fig 9. (continued) (d) relative location of submodel within full RPV head,
36

DRAFT NOT FOR ATTRIBUTION 08/04/02
Fig 9. (continued) (e) geometry of submodel relative to Nozzles 3, 11, 15, and 16.
37

DRAFT NOT FOR ATTRIBUTION 0/
- T' -' '' ''j ..-.. t - -''' ' ' ' '' 't' ' - ' 1 ' ' -J.- -- I - - ! - *! -- ! --
D8/04/02
80 V Framatome a = 114.992 C0-21sce'nR gsV true 61z"
600 OF
7
X
a,()
2
601--
2,, = 69.65 ksi
- ~c- ,, 61.64 ksi
Adjusted SS308 Curvefor Bounding Calculation
DScurves q,, = 94.359 ELX940 For both SS3(
uniformelongat 3(uniform elongati
).96 ksion= 1.15% - SS 308
a ~ q AnlR itj i
20
0j0
-At 600 OFE - 25,571 kslv- 0.295
*-. - A8W-101-- , - A8W-102
* -- - A8W-103-0 - A8W-104
.-- *- A8W-105- -- - ABW-106
ASW data at 550 IF
LA
- - - I II . . I I - . I I I. . .
0.05 0.1
True Strain (-)0.15 0.2
06/10/2002.K1 ptw
Flg. 10. Adjusted SS308 stress vs. strain curve used In the bounding-case calculations compared tocurves from a range of ASW heats. Strain hardening In the adjusted curve was reduced tolower-bound all of the data. The offset yield strength and strain at ultimate strength wereretained from the unadjusted SS308 curve received from Framatome.
38

DRAFTNOT FOR ATrRIBVTION 08/04/02
Fig. 11. Geometry of adjusted wastage area footprint. Lower figure Is a Photoworks®-renderedImage of the submodel with the adjusted "as-found' footprint.
39

DRAFT NOT FOR ATTRIBUTION 08/04/02
12.
IIo
(a)
*AO add- A
'm
120
l 1
b) fs e
Fig. 12. Effective plastic-strain histories at two high-strain locations In the wastage area: (a) nearthe center and (b) near Nozzle 3.
40
DRAFT NOT FOR ATTRIBUTION 08/04/02
Internal Pressure (ksi)5 6 7 8 9 10 11
, .:, , , , ... ... .... ...... .. . . ... .. ..... ;-- r -,:-:-... .. -
0.9 _ PredictedBurst ..i--.f........... .
a 0.8 Pressure= . :.' . 6.65 ksiLL0.7 . .7 . . . ..... . .. .. . .... . . . . . . . . . . ... ..
L0.6 . . . .3 ..
. . . . . . . . . Log-Laplace.0 0.6 5 .. .2 . ......................... ..... .. Median = 1.1057
Mean = 1.1142Variance = 0.01959
0.3 . . j. . St0.13998-
0.2
0.1. . .. .... ... .1
0 . . .
0.8 1 1.2 1.4 1.6Experimental BP/Predicted BR, a0O8/04/2002.K3 Ptw
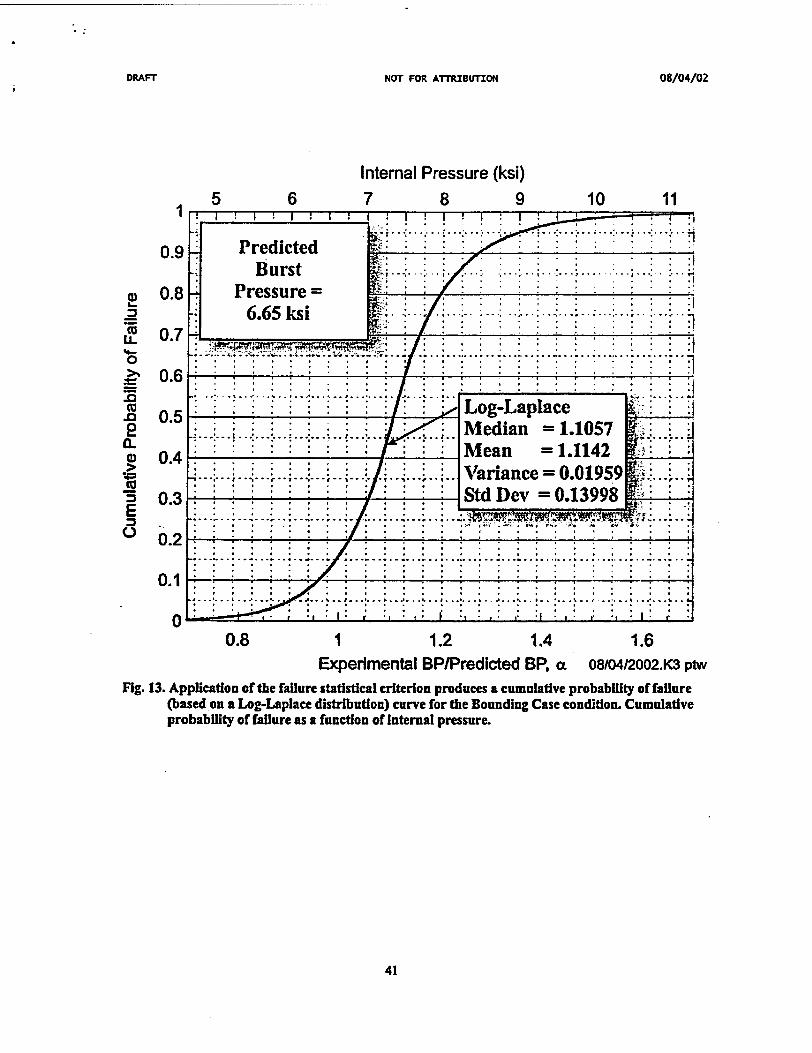
Fig. 13. Application of the failure statistical criterion produces a cumulative probability of failure(based on a Log-Laplace distribution) curve for the Bounding Case condition. Cumulativeprobability of failure as a function of Internal pressure.
41

DRAFT NOT FOR ATTRIBUTION 08/04/02
As discussed above, the bounding calculation predicted a burst pressure of 6.65 ksi which has acumulative probability of failure of 0.158. The stochastic model estimates a cumulative probability offailure of 4.14x10⁻⁷ at the operating pressure of 2.165 ksi and 2.15x10 4 at the set-point pressure of2.5 ksi. See Table 10 for additional estimates.
Table 10. Estimated Cumulative Probability of Failures for the Bounding Calculation
2.155 3.92E-072.165 4.14E-072.175 4.36E-072.185 4.60E-072.195 4.84E-072.205 5.10E-072.215 5.37E-072.225 5.66E-072.235 5.96E-072.245 6.27E-072.255 6.60E-072.265 6.94E-072.275 7.30E-072.285 7.67E-072.295 8.07E-072.305 8.48E-072.315 8.91E-072.325 9.36E-072.335 9.83E-072.345 1.031E-062.355 L.08E-062.365 1.14E-062375 1.19E4062.385 1.25E-062.395 1.31E-062.405 1.38E-062.415 1.45E-062.425 1.52E-062.435 1.59E-062.445 1.67E-062.455 1.75E-062.465 1.83E-062.475 1.92E-062.485 2.01E-062.495 2.10E-062.500 2.15E-06
42

ADA CTNOT FOR ATTRIBUTION 08/04/02
5. Summary and Conclusions
A stochastic model of the probability of failure associated with a computational prediction of the plasticcollapse of the exposed cladding in the wastage area of the Davis-Besse RPV head has been developedfrom the following technical bases:
(5) experimental data obtained during disk-burst tests reported by Riccardella [2] with loadings,geometries, and materials relevant to the Davis-Besse pressure loading, wastage-areafootprint, and cladding,
(6) nonlinear, large-deformation, elastic-plastic discrete-element analyses of the disk-burst testsalso reported in [2] (GAPL-3 discrete-element code[3]),
(7) nonlinear, finite-strain, elastic-plasticflnite-element analyses performed for the current study(ABAQUS finite-element code[4]) of the nine disk-burst test specimens reported in [2], and
(8) a theoretical criterion for plastic instability in a circular diaphragm under pressure loading,due to Hill (5] (as cited in (6]), applied to the disk-burst tests.
The resulting Log-Laplace model has the scaled form of
2 l.lO57xP,, ) ; 0<SP<1.1057xprPrLPpp , S SP]=F,,(SPIP,,)= I1 SP 4 (23)
1. ; 1SP2l.057xP,,
Given a computationally predicted burst pressure, Pap, and service pressure, SP, the model gives anestimate of the cumulative probability of nonexceedance of the true but unknown burst pressure, P,,..),i.e., Pr[P,,(-) S SP].
As an example application, estimates are provided for a bounding calculation of the 'as-found" Davis-Besse wastage area. The bounding calculation predicted a burst pressure of 6.65 ksi which has acumulative probability of failure of 0.158. The stochastic model estimates a cumulative probability offailure of 4.14xl0 7 at the operating pressure of 2.165 ksi and 2.15x04V at the set-point pressure of2.5 ksi.
43

DRAFT NOT FOR ATTRIBUrION 08/04/02
References
1. Recent Experience with Degradation of Reactor Pressure Vessel Head, NRC Information Notice2002-11, United States Nuclear Regulatory Commission, Office of Nuclear Reactor Regulation,Washington, DC, March 12, 2002.2. P. C. Riccardella, "Elasto-Plastic Analysis of Constrained Disk Burst Tests," Paper No. 72-PVP-12,presented at the ASME Pressure Vessels and Piping Conference, September 17-21, 1972, NewOrleans, LA.
3. A. L. Thurman, GAPL-3-A Computer Program for the Inelastic Large Deflection Stress Analysis of aThin Plate or Axially Symmetric Shell with Pressure Loading and Deflection Restraints,WAPD-TM-791, Bettis Atomic Power Laboratory, Pittsburgh, PA, June 1969.4. ABAQUS/Standard User's Manual, v. 6.2, Hibbit, Karlsson, and Sorensen, Inc., Pawtucket, RI, 2001.5. R. Hill, "A Theory of the Plastic Bulging of a Metal Diaphragm by Lateral Pressure," Philos. Mag.(Ser. 7) 41, (1950) 1133.6. A. R. Ragab and S. E. Bayoumi, Engineering Solid Mechanics, Fundamentals and Applications, CRCPress LLC, Boca Raton, FL, 1999.7. W. E. Cooper, E. H. Kotteamp, and G. A. Spiering, "Experimental Effort on Bursting of ConstrainedDisks as Related to the Effective Utilization of Yield Strength," Paper No. 71-PVP-49, ASMEPressure Vessels and Piping Conference, May 1971.B. J. Chakrabarty and J. M. Alexander, "Hydrostatic Bulging of Circular Diaphragms," J. Strain Anal.5(3), (1970) 155-161.9. A. M. Law, Expert Fite User's Guide, Averill M. Law & Associates, Tuscon, Arizona, May 2002.10. S. A. Looeheicn, Root Cause Analysi Report, Significant Degradation of Reactor Pressure VesselHead, CR 2002-089 1, Davis-Besse Power Station, April 15, 2002.


![]0t SODA MIDGETS](https://static.fdocuments.us/doc/165x107/618cc47cfdb08b5224739c6b/0t-soda-midgets.jpg)


