Origins of medial geniculate body projections to...
20
Origins of medial geniculate body projections to physiologically de¢ned zones of rat primary auditory cortex Je¡ery A. Winer a ; *, Sharon L. Sally b , David T. Larue a , Jack B. Kelly b a Division of Neurobiology, Department of Molecular and Cell Biology, University of California at Berkeley, Berkeley, CA 94720-3200, USA b Laboratory of Sensory Neuroscience, Carleton University, Ottawa, Ont. K1S 5B6, Canada Received 26 March 1998; received in revised form 3 November 1998; accepted 8 November 1998 Abstract Medial geniculate body neurons projecting to physiologically identified subregions of rat primary auditory cortex (area 41, Te1) were labeled with horseradish peroxidase in adult rats. The goals were to determine the type(s) of projection neuron and the spatial arrangement of these cells with respect to thalamic subdivisions. Maps of best frequency were made with single neuron or unit cluster extracellular recording at depths of 500^800 Wm, which correspond to layers III^IV in Nissl preparations. Tracer injections were made in different cortical isofrequency regions (2, 11, 22, or 38 kHz, respectively). Labeled neurons were plotted on representative sections upon which the architectonic subdivisions were drawn independently. Most of the cells of origin lay in the ventral division in every experiment. Injections at low frequencies labeled bands of neurons laterally in the ventral division ; progressively more rostral deposits at higher frequencies labeled bands or clusters more medially in the ventral division, and through most of its caudo-rostral extent. Medial division labeling was variable. Labeled cells were always in the lateral half of the nucleus and were often scattered. There were few labeled cells in the dorsal division. Seven types of thalamocortical neuron were identified : ventral division cells had a tufted branching pattern, while medial division neurons have heterogeneous shapes and sizes and were larger. Dorsal division neurons had a radiate branching pattern. The size range of labeled neurons spanned that of Nissl stained neuronal somata. Area 41 may receive two types of thalamic projection : ventral division input is strongly convergent, highly topographic, spatially focal, and restricted to one type of neuron only, while the medial division projection is more divergent, coarsely topographical, involves multiple cortical areas, and has several varieties of projection neuron. Despite species differences in local circuitry, many facets of thalamocortical organization are conserved in phylogeny. z 1999 Elsevier Science B.V. All rights reserved. Key words: Primary auditory cortex ; Cerebral cortex ; Auditory thalamus ; Thalamocortical projection 1. Introduction The auditory thalamus is responsible for integrating ascending streams of information and propagating these in£uences onto cortical (Romanski and LeDoux, 1993b [rat]) and subcortical (LeDoux et al., 1985 [rat]) structures. This task entails at least three processes. The ¢rst pertains to how thalamic principal cells and inter- 0378-5955 / 99 / $ ^ see front matter ß 1999 Elsevier Science B.V. All rights reserved. PII:S0378-5955(98)00217-2 * Corresponding author. Tel.: +1 (510) 642-8227; Fax: +1 (510) 643-6791; E-mail: [email protected] Abbreviations: Aq, cerebral aqueduct ; APt, anterior pretectum ; BIC, brachium of the inferior colliculus ; BV, blood vessel ; CC, cerebral cortex ; CG, central grey; CP, cerebral peduncle; CSC, commissure of the superior colliculus; D, dorsal nucleus or dorsal division; DD, deep dorsal nucleus; DS, dorsal superficial nucleus; Hip, hippocampus ; HRP, horseradish peroxidase; IpN, interpeduncular nucleus; LGB, lateral geniculate body, dorsal nucleus; LGBd, lateral geniculate body, dorsal nucleus; LGBv, lateral geniculate body, ventral nucleus; LMN, lateral mesencephalic nucleus; LP, lateral posterior nucleus; LPc, lateral posterior nucleus, caudal part; LV, lateral ventricle; M, medial division; MGB, medial geniculate body; MB, mamillary body; MZ, marginal zone; NR, no response; Ov, pars ovoidea of the ventral division; PC, posterior commissure; Pt, pretectum; PL, posterior limitans nucleus; RN, red nucleus; SC, superior colliculus; Sg, suprageniculate nucleus; SN, substantia nigra; Spf, subparafascicular nucleus; SpN, suprapeduncular nucleus; Te1^3, see areas 41, 36, 20 below; V, pars lateralis of the ventral division; Vb, ventrobasal complex; wm, white matter ; ZI, zona incerta ; IIIv, third ventricle ; 41, area 41/area Te1 ; 20, area 20/area Te2 ; 36, area 36/area Te3 ; Planes of section : C, caudal ; R, rostral; V, ventral; M, medial; D, dorsal; L, lateral Hearing Research 130 (1999) 42^61
Transcript of Origins of medial geniculate body projections to...

Origins of medial geniculate body projections to physiologically de¢nedzones of rat primary auditory cortex
Je¡ery A. Winer a;*, Sharon L. Sally b, David T. Larue a, Jack B. Kelly b
a Division of Neurobiology, Department of Molecular and Cell Biology, University of California at Berkeley, Berkeley, CA 94720-3200, USAb Laboratory of Sensory Neuroscience, Carleton University, Ottawa, Ont. K1S 5B6, Canada
Received 26 March 1998; received in revised form 3 November 1998; accepted 8 November 1998
Abstract
Medial geniculate body neurons projecting to physiologically identified subregions of rat primary auditory cortex (area 41, Te1)were labeled with horseradish peroxidase in adult rats. The goals were to determine the type(s) of projection neuron and the spatialarrangement of these cells with respect to thalamic subdivisions. Maps of best frequency were made with single neuron or unit clusterextracellular recording at depths of 500^800 Wm, which correspond to layers III^IV in Nissl preparations. Tracer injections weremade in different cortical isofrequency regions (2, 11, 22, or 38 kHz, respectively). Labeled neurons were plotted on representativesections upon which the architectonic subdivisions were drawn independently. Most of the cells of origin lay in the ventral division inevery experiment. Injections at low frequencies labeled bands of neurons laterally in the ventral division; progressively more rostraldeposits at higher frequencies labeled bands or clusters more medially in the ventral division, and through most of its caudo-rostralextent. Medial division labeling was variable. Labeled cells were always in the lateral half of the nucleus and were often scattered.There were few labeled cells in the dorsal division. Seven types of thalamocortical neuron were identified: ventral division cells had atufted branching pattern, while medial division neurons have heterogeneous shapes and sizes and were larger. Dorsal divisionneurons had a radiate branching pattern. The size range of labeled neurons spanned that of Nissl stained neuronal somata. Area 41may receive two types of thalamic projection: ventral division input is strongly convergent, highly topographic, spatially focal, andrestricted to one type of neuron only, while the medial division projection is more divergent, coarsely topographical, involvesmultiple cortical areas, and has several varieties of projection neuron. Despite species differences in local circuitry, many facets ofthalamocortical organization are conserved in phylogeny. z 1999 Elsevier Science B.V. All rights reserved.
Key words: Primary auditory cortex; Cerebral cortex; Auditory thalamus; Thalamocortical projection
1. Introduction
The auditory thalamus is responsible for integratingascending streams of information and propagating
these in£uences onto cortical (Romanski and LeDoux,1993b [rat]) and subcortical (LeDoux et al., 1985 [rat])structures. This task entails at least three processes. The¢rst pertains to how thalamic principal cells and inter-
0378-5955 / 99 / $ ^ see front matter ß 1999 Elsevier Science B.V. All rights reserved.PII: S 0 3 7 8 - 5 9 5 5 ( 9 8 ) 0 0 2 1 7 - 2
HEARES 3173 29-3-99
* Corresponding author. Tel. : +1 (510) 642-8227; Fax: +1 (510) 643-6791; E-mail: [email protected]
Abbreviations: Aq, cerebral aqueduct; APt, anterior pretectum; BIC, brachium of the inferior colliculus; BV, blood vessel; CC, cerebral cortex; CG,central grey; CP, cerebral peduncle; CSC, commissure of the superior colliculus; D, dorsal nucleus or dorsal division; DD, deep dorsal nucleus; DS,dorsal superficial nucleus; Hip, hippocampus; HRP, horseradish peroxidase; IpN, interpeduncular nucleus; LGB, lateral geniculate body, dorsalnucleus; LGBd, lateral geniculate body, dorsal nucleus; LGBv, lateral geniculate body, ventral nucleus; LMN, lateral mesencephalic nucleus; LP,lateral posterior nucleus; LPc, lateral posterior nucleus, caudal part; LV, lateral ventricle; M, medial division; MGB, medial geniculate body; MB,mamillary body; MZ, marginal zone; NR, no response; Ov, pars ovoidea of the ventral division; PC, posterior commissure; Pt, pretectum; PL,posterior limitans nucleus; RN, red nucleus; SC, superior colliculus; Sg, suprageniculate nucleus; SN, substantia nigra; Spf, subparafascicularnucleus; SpN, suprapeduncular nucleus; Te1^3, see areas 41, 36, 20 below; V, pars lateralis of the ventral division; Vb, ventrobasal complex; wm,white matter; ZI, zona incerta; IIIv, third ventricle; 41, area 41/area Te1; 20, area 20/area Te2; 36, area 36/area Te3; Planes of section: C, caudal; R,rostral; V, ventral; M, medial; D, dorsal; L, lateral
Hearing Research 130 (1999) 42^61

neurons perform their computational role in analyzinga¡erent signals (Hindmarsh and Rose, 1994). A secondrole is redistributive and involves many telencephaliccortical and subcortical structures which may be impli-cated in higher-order processing (Romanski and Le-Doux, 1993a [rat]). Finally, corticofugal input to thethalamus could be decisive in gating subcortical sensorysignals, providing descending control of neurotransmis-sion (Diamond et al., 1992 [rat]), or in mediating otherfacets of receptive ¢eld organization (Sun et al., 1996[bat]), to name just a few of the many possible dimen-sions (McCormick and von Krosigk, 1992 [guinea pig]).
The present study addresses the organization of tha-lamocortical neurons in the rat medial geniculate bodyand auditory cortex. Extracellular electrophysiologicalmethods were used to identify frequency-speci¢c corti-cal subregions, followed by tracer deposits within theseregions and axoplasmic transport to label retrogradelythe thalamic cells projecting to the auditory neocortex.We had four goals. First, we sought to identify all ofthe thalamic nuclei whose projections converge onto asubregion of auditory cortex as de¢ned physiologically.Our second objective was to relate the types of relayneurons to their Golgi impregnated counterparts(Winer et al., 1999), and thus con¢rm whether thereare varieties of thalamocortical neurons. This informa-tion would be useful for understanding parallels anddi¡erences among thalamic subdivisions and determin-ing how many type(s) of neuron project to cortex.Third, these results support inferences about the ar-rangement of tonotopic representation in the nuclei ofthe auditory thalamus. Given the virtual absence ofphysiological studies of the thalamic distribution ofbest frequency in the rat (Kelly, 1990), the pattern ofretrograde thalamic labeling might provide insight intothe spatial topography of tonotopic representation. Fi-nally, we wanted to obtain data that would form anatural basis for comparative studies in the cat andother species. This information might permit a morecomplete and balanced treatment of the principles ofmammalian thalamocortical organization and encour-age more explicit inferences about species di¡erences.
2. Methods
All experimental and veterinary procedures were ap-proved by the appropriate local institutional animalcare and use committee. Electrophysiological mappingand connectional experiments were carried out in eightmale Wistar albino rats (Charles River Laboratories,St. Constant, Queèbec), four of which provided thedata for the subsequent anatomical analysis. For map-ping, the rats were deeply anesthetized with Equithesin(3 ml/kg, i.p.), a mixture of chloral hydrate and pento-barbital sodium (see Sally and Kelly, 1988, for details
[rat]). Are£exia was maintained for the several hours'duration of the experiment by supplemental injectionsof Equithesin (0.5 ml/kg, i.p., as required). The headwas ¢xed in a customized holder that left the externalmeatus free. An incision was made in the scalp, thetemporal muscle was retracted and a wide craniotomyexposed the lateral neocortex. The dura mater was re-moved and the surface of the cortex was coated withwarm (37³C) dimethylpolysiloxane oil to prevent desic-cation.
Multiple electrode penetrations were made into theauditory cortex to establish the pattern of tonotopicorganization based on the frequency response of singleneurons or the responses of small groups of neurons.Pargylene-insulated tungsten microelectrodes (1.3^2.1M6) were inserted into the brain perpendicular to thecortical surface. Single unit action potentials and multi-ple spike recordings were recorded with a preampli¢er(BAK model MDA-4) and window discriminator (BAKmodel DIS-1). Time locked action potentials were dis-played as a poststimulus histogram on a signal averager(Tracor Northern). The responses were also displayedon an oscilloscope and monitored acoustically througha loudspeaker. A detailed drawing of the cortical sur-face representing blood vessels and surface landmarksserved as a guide for subsequent microinjection ofhorseradish peroxidase (HRP) with regard to speci¢cfrequencies (see Sally and Kelly, 1988).
Physiological responses were evoked by 110 ms longtone pulses gated with 10 ms onset and o¡set times.Tones were presented through a high frequency tweeter(KEF model SP 1032) and a midrange loudspeaker(KEF model AD 5060) connected by a crossover net-work. The loudspeakers were mounted in a commonenclosure 16 in from the animal's head and werealigned with the pinna axis (30³ azimuth) in the sound¢eld contralateral to the hemisphere from which record-ings were made (usually the right hemisphere). Thesound pressure level was calibrated by free ¢eld meas-urements with a 0.5 inch condenser microphone (Bruëeland Kjaer type 4133) and a measuring ampli¢er. Thesound system was capable of e¡ectively deliveringsounds from 500 Hz to 32 kHz with a roll-o¡ in e¤-ciency for higher and lower frequencies. The system was£at within þ 6 dB between 2 and 38 kHz.
Best frequency (BF) was determined for each neuronor group of neurons by sweeping sound frequencyacross the rat's audible range at progressively lowersound pressure levels until the point of lowest thresholdwas determined. The BF was de¢ned by the frequencythat elicited a response at the lowest sound pressurelevel. Electrode penetrations were guided by our pre-vious mapping experiments (Sally and Kelly, 1988)and were deliberately focused on a limited range ofthe frequency spectrum to avoid excessive damage tocortex or prolonged periods of deep anesthesia. Because
HEARES 3173 29-3-99
J.A. Winer et al. / Hearing Research 130 (1999) 42^61 43
the purpose of the experiment required that the animalsrecover from the anesthetic, it was considered impor-tant to limit the duration of the recording session to 2^3h rather than sampling many more neurons over muchlonger periods. Nevertheless, the samples includedenough points to reveal a frequency gradient consistentwith our ¢ndings in cases with much more extensivemaps.
After a cortical region had been mapped for BF, therecording electrode was removed and replaced by a mi-cropipette containing 30% HRP. The pipette tip wasinserted into the auditory cortex and a small amountof enzyme was injected by pressure into a speci¢c fre-quency region as de¢ned by physiological mapping. Thepipette was connected to a 1 Wl Hamilton syringe bypolyethylene tubing ¢lled with distilled water. Injectionswere made slowly over a period of several minutes by amotorized drive connected to the Hamilton syringe. Thevolume of the injection was calibrated by movement ofan air bubble along the length of tubing between thesyringe and the micropipette. A typical injection wasbetween 0.05 and 0.1 Wl. Following an HRP injectionthe pipette was left in place for at least 5 min to allowfor di¡usion of the enzyme into the surrounding cort-ical tissue before being removed.
For connectional studies without physiological map-ping, 30% HRP in sterile saline was pressure injectedinto auditory cortex through either a 1 Wl Hamiltonsyringe or a glass micropipette (25 Wm diameter tip)for smaller deposits. About 15 other experiments inwhich no physiological analysis was performed wereavailable (Winer and Larue, 1987 [rat]). These largedeposits were intended to de¢ne the borders of auditorycortex and to label extensive populations of cells in themedial geniculate body and posterior thalamus (Fig.8A). In other experiments, more restricted injectionswere made within speci¢c architectonic ¢elds in audi-tory cortex (Fig. 8B).
Animals survived 2^3 days after injection. They werethen anesthetized with pentobarbital sodium (60 mg/kg)and perfused through the heart with washout (physio-logical saline) followed by ¢xative (1% paraformalde-hyde/1.5% glutaraldehyde in phosphate bu¡ered saline[PBS]). The brains were removed and stored overnight
in 30% sucrose/PBS. Frozen sections, 60 Wm thick, werecut in the frontal plane and 3:4 were processed forHRP using tetramethylbenzidine as the chromogen(Mesulam, 1978). The remaining 1:4 series was proc-essed with diaminobenzidine and counterstained withcresyl violet acetate to demonstrate cytoarchitectureand assess critically the boundaries of the depositsites.
The measurements of Nissl stained or horseradishperoxidase labeled neural somata were made on exper-imental material. A total of 100 of each type of neuronwere drawn with a 40U objective with a high numericalaperture and through a drawing tube. The somatic pe-rimeters were smoothed to remove dendritic pro¢lesand the areas were measured on a graphics tablet andcomputed using standard software (Sigma Scan1 ; Jan-del Scienti¢c, Sausalito, CA).
3. Results
3.1. Identi¢cation of the medial geniculate body
As a prelude to the integrated physiological-connec-tional experiments, we injected large amounts of eitherHRP or HRP conjugated to wheat germ agglutinin(WGA) to explore the thalamic boundaries of the me-dial geniculate complex. The injection itself (not shown)¢lled most or all of areas 41, 36, and 20 (Fig. 9A), anddi¡used into the rostral visual cortex as well. The tem-poral lobe regions involved correspond to primary andnonprimary auditory cortex as de¢ned by architectoniccriteria (Zilles et al., 1990; see also Burwell et al., 1995[rat]). The ensuing mass of retrogradely labeled neuronsextended from the extreme caudal tip of the auditorythalamus to its rostral pole (Winer et al., 1999, Figs. 9^12 [rat]). A section midway through the auditory thala-mus showed the characteristic pattern in which eachdivision had many retrogradely labeled neurons, whilethe adjoining, non-auditory nuclei had far fewer (Fig.1). Even the medial division, whose thalamocorticalprojection is considered to be di¡use and divergent(Winer and Larue, 1987 [rat]), was ¢lled with labeledneurons (Figs. 1 and 8A). In another experiment with a
HEARES 3173 29-3-99
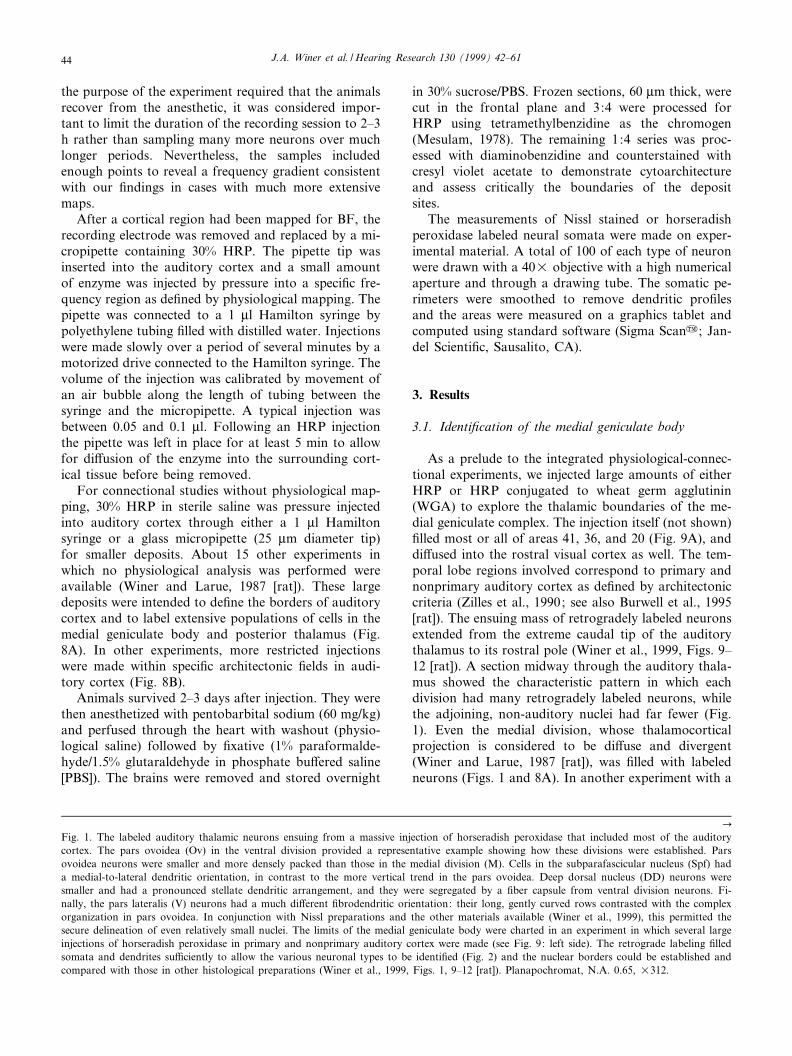
CFig. 1. The labeled auditory thalamic neurons ensuing from a massive injection of horseradish peroxidase that included most of the auditorycortex. The pars ovoidea (Ov) in the ventral division provided a representative example showing how these divisions were established. Parsovoidea neurons were smaller and more densely packed than those in the medial division (M). Cells in the subparafascicular nucleus (Spf) hada medial-to-lateral dendritic orientation, in contrast to the more vertical trend in the pars ovoidea. Deep dorsal nucleus (DD) neurons weresmaller and had a pronounced stellate dendritic arrangement, and they were segregated by a ¢ber capsule from ventral division neurons. Fi-nally, the pars lateralis (V) neurons had a much di¡erent ¢brodendritic orientation: their long, gently curved rows contrasted with the complexorganization in pars ovoidea. In conjunction with Nissl preparations and the other materials available (Winer et al., 1999), this permitted thesecure delineation of even relatively small nuclei. The limits of the medial geniculate body were charted in an experiment in which several largeinjections of horseradish peroxidase in primary and nonprimary auditory cortex were made (see Fig. 9: left side). The retrograde labeling ¢lledsomata and dendrites su¤ciently to allow the various neuronal types to be identi¢ed (Fig. 2) and the nuclear borders could be established andcompared with those in other histological preparations (Winer et al., 1999, Figs. 1, 9^12 [rat]). Planapochromat, N.A. 0.65, U312.
J.A. Winer et al. / Hearing Research 130 (1999) 42^6144

large injection, the thalamus was sectioned horizontally.The caudo-rostral extent of the medial division wasV1200 Wm, a value in close correspondence with theestimates from cytoarchitectonic studies. Scattered neu-rons were labeled in the region between the rostral face
of the medial geniculate body and unlabeled neurons inthe ventrobasal complex (Fig. 8C); this area might cor-respond to parts of the posterior group of thalamicnuclei. Finally, in other experiments in which only thenonprimary auditory cortex was injected, the medial
HEARES 3173 29-3-99
J.A. Winer et al. / Hearing Research 130 (1999) 42^61 45

geniculate body retrograde labeling was con¢ned todorsal division nuclei almost entirely (Fig. 8B).
3.2. Types of thalamocortical neuron
In the accompanying study of neuronal architecture,ten varieties of cells were identi¢ed in the three divisionsof the medial geniculate body (Winer et al., 1999, Fig. 2and Table 1 [rat]). Among the retrogradely labeled tha-lamic neurons in the present experiments, the dendriteswere ¢lled su¤ciently in many specimens to allow thepreliminary identi¢cation of some (if not the classi¢ca-tion of all) of the types of cells projecting to auditorycortex. In the ventral division, the neurons had a bipo-lar or multipolar form resembling that of bushy tuftedcells (Fig. 2E: 1). The dorsal nuclei contained manyexamples of tufted (Fig. 2D: 3) and radiate (Fig.2A,C: 4) neurons interspersed. The medial division,whose neuronal architecture was the most diverse, hadalso the most varied population of retrogradely labeledneurons, including magnocellular (Fig. 2B: 6), wide¢eld (Fig. 2B: 7), tufted spindle (Fig. 2B: 8), and hor-izontal (Fig. 2B: 9) neurons. While this classi¢cationrested primarily on the dendritic con¢guration of theretrogradely labeled neurons, factors such axosomaticsize, shape and orientation produced additional evi-dence. No examples of smaller neurons correspondingto putative Golgi type II cells (Winer et al., 1999, Table1, types 2, 5, 10) were seen, and the pro¢les of neuronswith appreciable somatodendritic ¢lling were readilyrelated to their Golgi impregnated counterparts.
3.3. Thalamic projections to physiologically de¢nedprimary auditory cortex
In the ¢rst mapping and connectional experiment,four small tracer deposits were made in the caudodorsalpart of area 41 (Fig. 3A: left side), as de¢ned on thebasis of its physiological organization (Fig. 3A: center)and its appearance in Nissl preparations (see Gamesand Winer, 1988, for architectonic details [rat]). Theinjections were targeted at V2 kHz, though the tracerdi¡used caudally (towards lower frequency regions inthis ¢eld) as well as dorsally (into adjoining nonprimarycortex) above area 41 (Fig. 3A: center). It appears un-likely that extracellular tracer di¡usion could have con-tributed materially to the pattern of thalamic labelingfor three reasons. First, there were no retrogradely la-beled somata in thalamic nonprimary visual nuclei (Fig.3B^E), as would be expected if the spread were a sig-ni¢cant factor in retrograde transport. Second, the in-dividual injections never invaded the white matter (Fig.3A: right side, wm); had they done so, thalamofugalaxons passing more rostrally might have been inter-rupted, resulting in retrogradely ¢lled neurons scatteredthrough large expanses of the auditory thalamus. Third,
the thalamic cells labeled by the injections were distrib-uted predictably and topographically. This pattern wasin close alignment with the results from other studies inwhich the locus of retrogradely labeled neurons couldbe related systematically to the site of injection (Deaconet al., 1983; Winer and Larue, 1987; Clerici and Cole-man, 1990 [rat]). Subsequent experiments (Figs. 4^6)followed the same patterns with regard to injectionsites, and those chosen as representative of the injectionsite in this and the following cases show the maximalextent of the individual deposits. All deposits do notappear in one section since they were not aligned per-fectly with the blocking and sectioning plane.
In each experiment, four or ¢ve representative thala-mic sections were chosen to illustrate the chief results ;intervening sections had a comparable distribution anddensity of labeling. The main focus of retrograde label-ing in this case was a band of neurons about 300 Wmwide and 800 Wm tall that ¢lled much of the lateralquarter of the ventral division (Fig. 3C: V). Therewere virtually no labeled neurons in the medial division,a result that distinguished this experiment from theothers. The few such cells in or near the medial divisionwere at its border with the ventral division and couldnot be assigned to either division with con¢dence. Thedorsal division likewise was virtually devoid of labeling(Fig. 3C: D). More rostrally, the ventral division neu-rons formed a circumscribed ring along the ventrolat-eral border with the dorsal division (Fig. 3D), with afew scattered neurons extending medially. The mostrostral labeling was a continuation and subset of theband in the ventral division.
While it is valid to infer from this experiment (andthe others) that a cortical volume is represented by acorresponding thalamic territory, sections limited totwo planes provide little evidence about the three-di-mensional organization of such a territory. To addressthis issue, we reconstructed the borders of the labelingand represented them as a polygon from transversesections and projected these onto horizontal sections.The matching borders from Nissl stained sections(Fig. 7) are likewise aligned with the reconstructionand the architectonic subdivisions, and the resultsfrom the intervening sections were interpolated (not il-lustrated). The resulting projection shows that aboutone-third of the auditory thalamus was devoted to acomparatively modest cortical sector, particularly sincethe e¡ective injection sites (Figs. 3^6: right inset, whiteregions) were usually V200 Wm in diameter. This im-plies appreciable branching, and possible convergence,of thalamocortical a¡erents.
In a second experiment the injection sites were situ-ated V300 Wm rostrally within area 41; despite a 900Wm long trail of di¡usion extending toward area 19(Fig. 4A: left side), there was no retrograde labelingin the visual thalamus (Fig. 4D^F). There were three
HEARES 3173 29-3-99
J.A. Winer et al. / Hearing Research 130 (1999) 42^6146

HEARES 3173 29-3-99
Fig. 2. Types of neurons retrogradely labeled in medial geniculate body subdivisions compared with their presumptive counterparts as seen inGolgi preparations (Winer et al., 1999, Figs. 2^5). A: Suprageniculate nucleus neurons were large multipolar cells (4) with radiating dendrites(for details, see Winer et al., 1999: Table 1). They were more clustered than nearby cells in the dorsal super¢cial nucleus (C) and smaller thanthose in the medial division (B). Protocol for all panels: Planachromat, N.A. 0.65, U500. B: Medial division neurons were unusual for theirheterogeneous shapes and sizes and the wide range of their orientations. The varieties labeled included magnocellular (6), wide ¢eld (7), tuftedspindle (8) and horizontal (9) neurons. A more detailed analysis of the features distinguishing them is available (Winer et al., 1999). These neu-rons were distinct from suprageniculate neurons (A) because of their more vertical orientation. Their variety set them apart from dorsal super¢-cial nucleus cells (C) and from neurons in the dorsal nucleus (D), both of which were more clearly stellate or radiate, and from ventral divisionneurons (E), whose dendritic arrangement was orthogonal to that of medial division cells. Marginal zone neurons (F, G) were sparse and hada far more vertical orientation. C: Dorsal super¢cial nucleus neurons corresponded closely to the pro¢les of two of the three cell types de¢nedin Golgi preparations (Winer et al., 1999, Figs. 1, 4). Tufted neurons (3) were strongly oriented along the medio-lateral axis and their dendritesarose at the somatic poles, while radiate cell (4) primary dendrites arose from the somatic perimeter without any preference. D: Both tufted (3)and radiate (4) neurons were labeled in the dorsal nucleus (D). E: In the ventral division (V) only tufted neurons were labeled retrogradely,and they formed clearly oriented laminae. F, G: The a¤liations of the marginal zone, both functional and anatomical, are obscure (see Winerand Morest, 1983b, 1984 [cat]). The retrogradely labeled neurons were unexpectedly numerous, appear to be predominantly tufted, and werelarger than those in the ventral division (E).
J.A. Winer et al. / Hearing Research 130 (1999) 42^61 47

important di¡erences between this and the ¢rst experi-ment. First, the labeling in the ventral division was farmore clustered rostrally than it was in more caudalsections. Second, there were a few cells in the dorsaldivision, which was unexpected, since the injectionwas remote from the ¢elds that are thought to be dorsaldivision targets (Winer and Larue, 1987; Arnault andRoger, 1990 [rat]). Third, the medial division had anappreciable number of labeled neurons.
As might be expected from the ¢rst experiment (Fig.3C), a band of retrogradely labeled neurons was presentin the ventral division (Fig. 4E) after cortical depositscentered at 11^12 kHz (Fig. 4A: center inset). Thissuggests that progressively more anterior injectionswill be represented at successively more medial foci inthe ventral division. While this is correct as a ¢rst ap-proximation, it cannot explain the complete distributionof ventral division neurons in this experiment. For ex-ample, there are a few labeled neurons near the borderof the ventral and medial divisions (Fig. 4C), whichwould correspond to the putative high frequency repre-sentation and therefore violate a strict tonotopic/topo-graphic principle as described above. Alternatively, theinjection might have encroached slightly into the whitematter (Fig. 4A: right side). The counterargument tothe transected ¢bers interpretation is the possibility thatthe 2 kHz injections, which never entered the whitematter (Fig. 3A: right side), nevertheless labeled somecells in the medial part of the ventral division (Fig. 3C:V), whereas the 22 kHz experiment (Fig. 5A) had anunexpectedly wide thalamic representation (Fig. 5:black inset) that appeared to violate an absolute thala-mic lamina-to-cortical column transformation implicitin a simple topographic model. These issues will beexamined further in Section 4.
A few neurons in the dorsal nucleus were labeled(Fig. 4C: D), as in the 2 kHz experiment (Fig. 3C:
D). As noted above, we considered these as evidenceof involvement of extra-auditory cortex (Fig. 3A, Fig.4A: left side and center). However, a similar small clus-ter was found in the 22 kHz case (Fig. 5B), whoseinjections were con¢ned entirely to area 41 (Fig. 5A:center). Interestingly, the 38 kHz deposits (Fig. 6A:center), which also were con¢ned to area 41, had nolabeled dorsal division neurons (but see Fig. 6D).
The labeling in the medial division (Fig. 4B^E) wassurprisingly heavy, in contrast to the ¢rst (2 kHz) ex-periment (Fig. 3B^E), in which there was essentially nomedial division projection. There was no regular spatialdistribution of the labeling within the medial division.In some sections it was in the central part of the medialdivision (Fig. 4B: M), in others it lay in the ventralmostpart (Fig. 4D: M) or it was scattered (Fig. 4E: M) orsometimes absent (Fig. 4F: M). Considered across ex-periments, the medial division had the most variabledistribution, while the ventral division had the mostpredictable pattern; in the dorsal division, so few neu-rons were labeled that no certain conclusions about itsprojection to area 41 were possible.
The global regions of retrograde labeling (Fig. 4:black inset) in the medial (M) and ventral (V) divisionslargely overlap in the caudo-rostral axis. This had twointeresting implications for the frequency-speci¢c or-ganization within the medial geniculate body. First, itsuggests a basic di¡erence between the ventral and themedial divisions: in the former, this arrangement wasevident in every experiment, and it is consistent with theinterpretation that best frequency has a caudal-to-ros-tral representation whose structural counterpart is ¢-brodendritic lamination. Second, the amount of retro-grade labeling in the medial division was far morevariable, ranging from no cells (Fig. 3: M) to a fewneurons (Fig. 6A: M) or to many (Fig. 4B: M, Fig.5C: M).
HEARES 3173 29-3-99
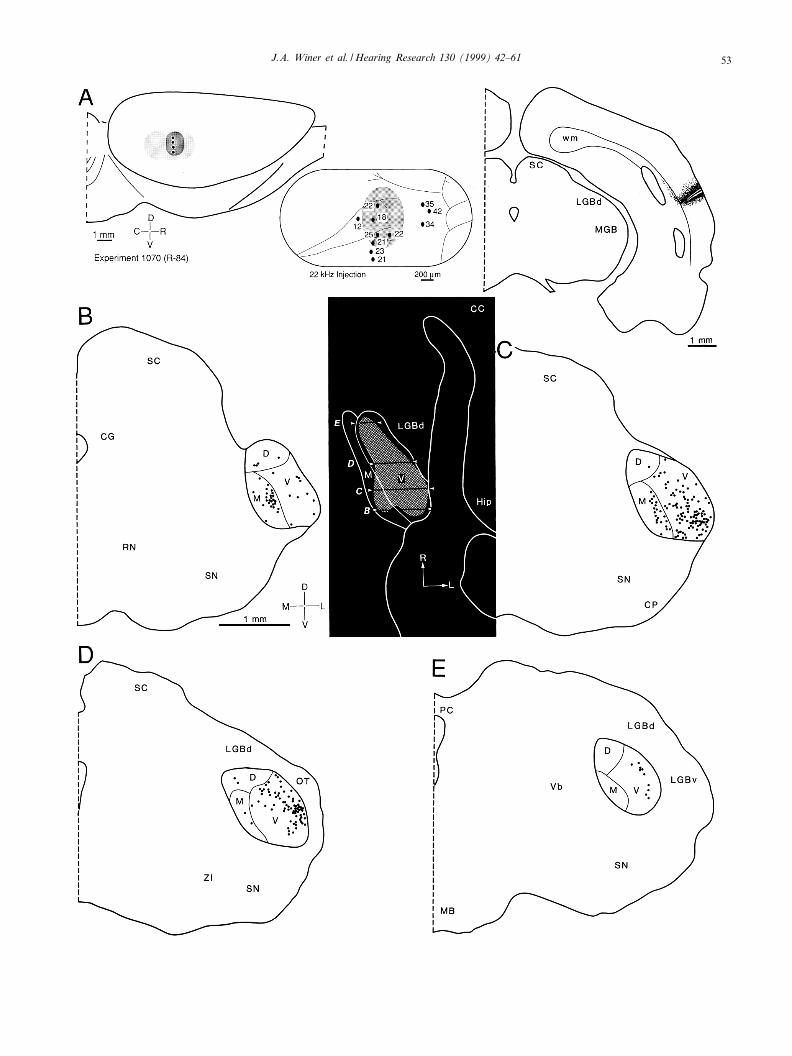
CFig. 3. Results from injections at 2 kHz. A: Lateral views (left side) show the location of primary auditory cortex (area 41; light stippling) pro-jected onto the hemisphere, with the accompanying injection sites (black dots) and the zone of tracer di¡usion (dark stippling). A more detailedreconstruction (center) with the physiological recording sites (dots) and best frequencies (numbers) superimposed upon the blood vessels (¢nelines). The architectonic boundaries of area 41 were determined independently from Nissl preparations, as were those of the medial geniculatebody subdivisions (see below). View (right side) of the largest of the four injections in a transverse section through the center of the track (thinblack line), the estimated e¡ective site of the injection (white perimeter), and the di¡usion; the latter region was not considered to have contrib-uted to thalamic retrograde labeling. B^E: Caudal-to-rostral sequence of representative sections that demonstrated the auditory thalamic inputto the 2 kHz region; each dot corresponds to one labeled neuron. Black inset, horizontal reconstruction in which the perimeter demarcatingthe retrogradely labeled neurons was drawn as a convex polygon (stippled); this represented a two-dimensional reconstruction of the medio-lat-eral and caudo-rostral distribution of thalamic labeling. The thin black horizontal lines (arrowheads) match the transverse position of the sec-tions in panels B^E. B: A few labeled neurons lay along the medial wall of the central division (V), in the presumptive high-frequency sector(see Fig. 6D: V). C: Labeling was concentrated in the lateral one-quarter of the ventral division, in the pars lateralis. Smaller clusters of label-ing persisted medially, however, and a new focus occurred ventromedially. These foci lay medially in this section, suggesting that the analogousneurons in the preceding section (B) were properly included in the ventral, and not in the medial, division. In this and the following experi-ments (Figs. 4^6), all the medial division transport was con¢ned to the lateral one-half. If there is any systematic representation of best fre-quency, then more than V4 octaves are compressed in a medio-lateral span of V300 Wm, while the medial one-half would represent frequen-cies s 38 kHz. D: This section contained the most focal concentration of labeled neurons. The gaps at the inferior part of the column mayre£ect that the injections were concentrated in the uppermost half of the 2 kHz representation. E. The labeling pattern here was consistent withthe view that isofrequency representations are arranged dorso-ventrally in the ventral division (see Fig. 9 and Section 4).
J.A. Winer et al. / Hearing Research 130 (1999) 42^6148

HEARES 3173 29-3-99
J.A. Winer et al. / Hearing Research 130 (1999) 42^61 49

The next experiment studied the projections to the 22kHz cortical representation (Fig. 5). The usual row offour deposits was made; di¡usion may have involvedsome frequencies remote from 12^22 kHz (Fig. 5A:center). The deposits did not enter the white matter(Fig. 5A: right side), and the area of the injectionswas approximately the same as in the prior experi-ments, suggesting that its projections might be area-speci¢c.
Three features distinguished this experiment. Theventral division labeling was the most di¡use seen inany of the cases. There were a few neurons labeled inthe dorsal division. Finally, the medial division projec-tion arose almost entirely from the caudal half of theauditory thalamus.
The most unexpected result was the broad distribu-tion of retrograde labeling in the ventral division (Fig.5C: V), which encompassed most of its medio-lateralaxis (Fig. 5: black inset). An equally surprising ¢ndingwas that the most rostral focus of labeling was morelateral in the ventral division (Fig. 5D: V) than wouldhave been predicted on the basis of the 2 kHz (Fig. 3D:V) or 11^12 kHz (Fig. 4D: V) deposits. The lateralmosttransport cannot be attributed to severing axons in thewhite matter, since the low frequency (6 12 kHz)region is caudal to this, and because tracer di¡usionalone is unlikely to produce signi¢cant retrograde label-ing.
The sparse labeling in the dorsal division (Fig. 5B)may represent a small projection since the injections,including their di¡usion, were con¢ned to area 41. Dor-sal division involvement was limited to the caudal two-thirds of the medial geniculate body.
The projection of the medial division was restrictedessentially to the caudal half of the auditory thalamus(Fig. 5: black inset). However, this experiment labeledby far the largest number of medial division neurons inany experiment, and they formed a conspicuous bandnear the border with the ventral division. These neuronswere clustered in a sharply de¢ned region 200 Wm wideand 500 Wm high; there were few neurons labeled moremedially.
The ¢nal experiment di¡ered from its predecessors in
several ways (Fig. 6). As expected, the ventral divisionlabeling formed a discrete band; however, the con¢gu-ration of the mass of labeled cells was highly variablealong the caudo-rostral axis. A second ¢nding was thatno dorsal division neurons were involved in this projec-tion. Finally, only the most caudal part of the medialdivision had any labeled neurons.
The four deposits were con¢ned to area 41 and theywere targeted at V38 kHz. The injections formed theirusual columns V300 Wm wide, and their orientationwas inclined slightly (Fig. 6A: right side) from the al-most perpendicular registration in the preceding experi-ments (Fig. 3A, Fig. 4A, Fig. 5A: right side). The shapeof the ensemble of labeled neurons was remarkablyvaried in the caudo-rostral axis, ranging from a hori-zontally arranged sheet 500 Wm wide by V100 Wm thickat the caudal part (Fig. 6C: V) to a more oblate con-¢guration in the pars ovoidea more rostrally (Fig. 6D:at the border of M and V). The labeling ended as avertically arranged group of cells in the most lateraland anterior part of the pars lateralis. This impliesthat an isofrequency lamina, insofar as it can be repre-sented by such injections, has a complex, three-dimen-sional spatial geometry that cannot be represented as asimple linear projection of thalamic axons onto the cer-ebral cortex.
Medial division projections, in contrast, were limitedto a few neurons concentrated in the most caudal partof the auditory thalamus (Fig. 6B: M). Lower fre-quency (2 kHz; Fig. 3) deposits produced little suchlabeling, while middle (11^12 kHz; Fig. 4) and higher(22 kHz; Fig. 5) frequency injections labeled manymore neurons at several medial division loci.
4. Discussion
Placing the present results within a functional con-text entails both practical and conceptual problems.The practical constraint is that the limited amount ofphysiological work presently available on the rat medialgeniculate body makes it di¤cult to summarize therules governing tonotopic, binaural, or other forms of
HEARES 3173 29-3-99
CFig. 4. Results from 11^12 kHz injections; for details of format, see the legend to Fig. 3. A: While the injections were centered in area 41,there was appreciable di¡usion into caudodorsal Te2D?/Oc2L (nomenclature after Zilles et al., 1990). The ensuing pattern of retrograde trans-port (panels B^F) suggests that the di¡usion did not confound the experiment, since there was no labeling in the visual thalamus, and becausethe auditory thalamic transport was consistent with that in other experiments (Figs. 3, 5 and 6). The black inset shows the independence of thefoci of labeling in the ventral (V) and medial (M) divisions, and their antero-posterior discontinuity, and their congruence medio-laterally. B:This was the most caudal section in these experiments with appreciable medial division labeling. C: The dorsal division labeling was signi¢cantonly in this section and in a few others (Fig. 5B,D). With regard to the dorsal and ventral divisions, this suggests strong nucleus-to-area a¤lia-tions. D: The medial division had a characteristic distribution of neurons in the lateralmost half, while the ventral division labeling was unex-pectedly broad along the medio-lateral dimension. E: This distribution resembled that in the preceding, 2 kHz, experiment (Fig. 3D,E: V), andit supports a relation predicted between a thalamic lamina and a cortical isofrequency contour (Fig. 9). F: A few neurons near the rostral poleof the auditory thalamus lay far more laterally than expected, and thus violated the simple prediction of a lamina-to-a-contour relationship, orperhaps represented a shift toward higher frequencies more rostrally.
J.A. Winer et al. / Hearing Research 130 (1999) 42^6150

HEARES 3173 29-3-99
J.A. Winer et al. / Hearing Research 130 (1999) 42^61 51
organization. It might be argued that this issue is notcritical since a considerable body of data is available inthe cat (Clarey et al., 1992), and that the basic princi-ples in the feline auditory thalamus ought to be ex-tended to the rat, at least provisionally. However, thereis evidence of fundamental interspeci¢c di¡erences inmedial geniculate body organization. For example,there are few GABAergic neurons in the rat auditorythalamus (6 1%; Winer and Larue, 1988, 1996), andmany more in other species (s 25%; Smith et al.,1987 [monkey] ; Winer and Larue, 1996 [cat, monkey]).This implies that some as yet unspeci¢ed, GABA-de-pendent processing is expressed robustly in the cat,while in the rat such processing must be attenuated ororganized along fundamentally di¡erent principles. Asecond, conceptual consideration is ecological, andmay be related to species speci¢c di¡erences in circuitry.Cats are nocturnal predators adept at localizing andtracking their prey in acoustically challenging environ-ments, while rats scavenge and avoid detection bystealth. It would seem implausible to regard the ratmedial geniculate body simply as a miniaturized versionof the cat's, in terms of either size or function. By thesame token, more than 10 feline cortical auditory areashave been distinguished (Aitkin, 1990), while in the ratonly a few such regions have been identi¢ed (Kelly,1990; Burwell et al., 1995). If such di¡erences are gen-uine, then their implications for the thalamus remain tobe articulated.
4.1. Thalamic projections to cortex
To what degree can the present ¢ndings in the rat begeneralized to other species? At least for area 41/Te1,two auditory thalamic nuclei ^ the ventral and the me-dial divisions ^ are the primary sources of input, apattern much like that in the cat with regard to primaryauditory cortex (AI) (Niimi and Naito, 1974). A secondparallel is the common structure of thalamocorticalneurons in both the ventral division and the medial
division in the rat and cat (Table 1). The cat ventraldivision contains bushy tufted principal cells (Morest,1964) that project to AI (and to its more rostral part-ner, the anterior auditory ¢eld), while rat ventral divi-sion neurons have a comparable structure (Clerici et al.,1990; Winer et al., 1999) and an analogous projection(Clerici and Coleman, 1990) with regard to area 41/Te1.A further correspondence is that the laminar target ofthe ventral division is chie£y in layers III and IV(Vaughan, 1983 [rat] ; Sousa-Pinto, 1973 [cat] ; Jonesand Burton, 1976 [monkey]; Hashikawa et al., 1995[monkey]). The concordance among these di¡erent di-mensions is strong circumstantial evidence that com-mon patterns of organization can be derived, at leastto a ¢rst approximation, for this segment of the audi-tory forebrain. Much the same argument can be madewith regard to the neuronal structure of the medialdivision (Winer and Morest, 1983a [cat] ; Winer et al.,1999 [rat]) and with respect to its ascending projections(Niimi and Naito, 1974 [cat] ; Ryugo and Killackey,1974 [rat]). Such parallels cannot be extended to everyaspect of auditory thalamic organization since (as notedabove) there are substantial qualitative and quantitativespecies di¡erences in the proportion of GABAergic neu-rons.
4.2. Representation in the isofrequency domain
The systematic representation of best frequency is acardinal feature of auditory cortical organization(Schreiner, 1992) and, by extension, in the correspond-ing thalamic nuclei as well. In other species, the relationbetween the ¢ne-grained tonotopic map in the ventraldivision (Imig and Morel, 1985 [cat]) and the corre-sponding representation in auditory cortex (Reale andImig, 1980 [cat]) is relatively well established (Middle-brooks and Zook, 1983 [cat]). The structural basis forthe ordered map of frequency is believed to be the ¢-brodendritic laminae, which consist of principal tuftedcell dendritic arbors and the terminal plexus of a¡erent
HEARES 3173 29-3-99
CFig. 5. Results from 22 kHz injections. A: The four deposits were restricted to area 41 (left side). The physiological range of best frequencyspanned V12^25 kHz (center), with the injections centered in the 18^22 kHz region. The sparse white matter labeling below the deposit wastransport, not di¡usion; the dorsal disposition of these axons suggests possible commissural labeling. This experiment had the most widely dis-tributed labeling in our series (compare with Figs. 3, 4 and 6), involving most of the caudo-rostral, and much of the medio-lateral, axes of theventral division (black inset). The medial division labeling was concentrated caudally and laterally, as in the other experiments. B: The labelinginvolved, to varying degrees, each of the three primary divisions. Most labeled neurons in each division were near the lateral or ventral nuclearborder. C: Since the deposit ¢lled only V20% of area 41 (panel A, center), the retrograde transport occupied a disproportionately large partof the ventral division (V), and suggested considerable thalamocortical convergence. Indirect evidence that the isofrequency plane's main axiswas dorso-ventral comes from the label-free ventral division subregions above and below the foci of transport. In contrast, injections thatcrossed a cortical architectonic border (Fig. 3A: center) labeled cells that extended to the thalamic border in at least some sections (Fig. 3D:V). D: A progressive, caudal-to-rostral decline of medial (M) and dorsal (D) division labeling occurred. Ventral division projection neuronswere concentrated predominantly in the pars lateralis (see also panel C). This suggests that frequencies 6 22 kHz were underrepresented spa-tially, or that there was an antero-posterior (as well as a dorso-ventral) counterpart to the representation of best frequency; these possibilitiesare not mutually exclusive. E: Near the rostral pole, ventral division neurons were more central than those in more caudal sections (panels C,D), consistent with the dorso-ventral hypothesis of representation. Here as well, the label-free zones above and below the focus were in accordwith the dorsal and ventral, uninjected regions above and below the deposits (panel A, center).
J.A. Winer et al. / Hearing Research 130 (1999) 42^6152
HEARES 3173 29-3-99
J.A. Winer et al. / Hearing Research 130 (1999) 42^61 53
axons of midbrain origin, both of which are polarizedand form ¢brodendritic laminae oriented dorso-ven-trally (Morest, 1964, 1965 [cat]). While the frequencyrepresentation must be continuous, each lamina is be-lieved to constitute a more or less discrete sector with aperiodicity of V50 Wm/lamina; this estimate is basedprimarily on neurons in the pars lateralis and it suggeststhat there is a topographic pattern of thalamocorticalprojection in the rat which resembles the arrangementin the cat, at least to a ¢rst approximation. Four fea-tures constrain any more re¢ned estimate of tonotopyin the rat. The ¢rst is that the dendritic arbors of prin-cipal tufted neurons are often much wider than those ofsimilar neurons in the cat, up to 80 Wm. Since a range ofabout eight octaves is represented physiologically acrossthe V3500 Wm caudo-rostral span of area 41, thisyields a value of approximately 450 Wm/octave, assum-
ing a linear thalamic-place to cortical-areal projectionfor an isofrequency contour. However, high best fre-quencies may be overrepresented (Sally and Kelly,1988). A second limitation is that the ventral divisionitself is never more than V800 Wm wide, and oftenmuch narrower. If the thalamic representation preservesthe ratio of frequency-to-area found in primary cortex,then a value of 100 Wm/octave might approximate thecase. This could account for the apparent overrepresen-tation from deposits that are limited to V1 octave inthe cortex, yet span more than half the width of theventral division (Fig. 5C).
A third issue that could distort the frequency-speci¢crepresentation in the rat ventral division is the paucityof Golgi type II neurons (Winer and Larue, 1988).Their axons and dendrites are, in the cat, importantcontributors to the laminar ¢brodendritic plexus (Mor-
HEARES 3173 29-3-99
CFig. 6. Results from a 38 kHz injection. A: Each deposit was limited to area 41 (left side) and probably included frequencies from V36^40kHz (center). The deposit shown did not reach the white matter (right side) and was slightly oblique to the cortical surface. The retrograde la-beling (black inset) extended from the posterior one-third of the ventral division (V) to its anterior extremity, with minimal involvement of themedial division (M) except caudally, where the lateral half of the nucleus was labeled. B: The heaviest concentration of medial division labelingwas slightly rostral to that from the 11 kHz injection (Fig. 4B: M) and caudal to that from 22 kHz (Fig. 5B: M) deposits, suggesting that anytopographic cortical projection was irregular or complex. C: In the pars ovoidea, a thin sheet of retrogradely labeled neurons was oriented me-dio-laterally. The transport de¢ned almost exactly the border between the ventral and medial divisions, suggesting that still higher frequenciesare displaced ventromedially within the dorsal division. D: As the laminae in panel C extended rostrally, they began to turn, and the neuronsformed a more circular cluster that extended dorsally in more anterior sections. A few labeled cells lay in the medial division and along thedorso-lateral perimeter of the dorsal division. E: The retrogradely labeled neurons in the rostral pole were far lateral to those from the 22 kHzinjection at the matching thalamic level (Fig. 5E). This implies, at least for higher frequencies, there is not a simple thalamic-laminar to corti-cal-isofrequency contour transformation. The horizontal sheet of neurons (panel C) and the cluster (panel D) have now rotated 90³ to form avertical ensemble. The dorsal and central extremities of this column were devoid of labeling, and the injection (panel A, center) was far fromthe dorsal and ventral borders of area 41.
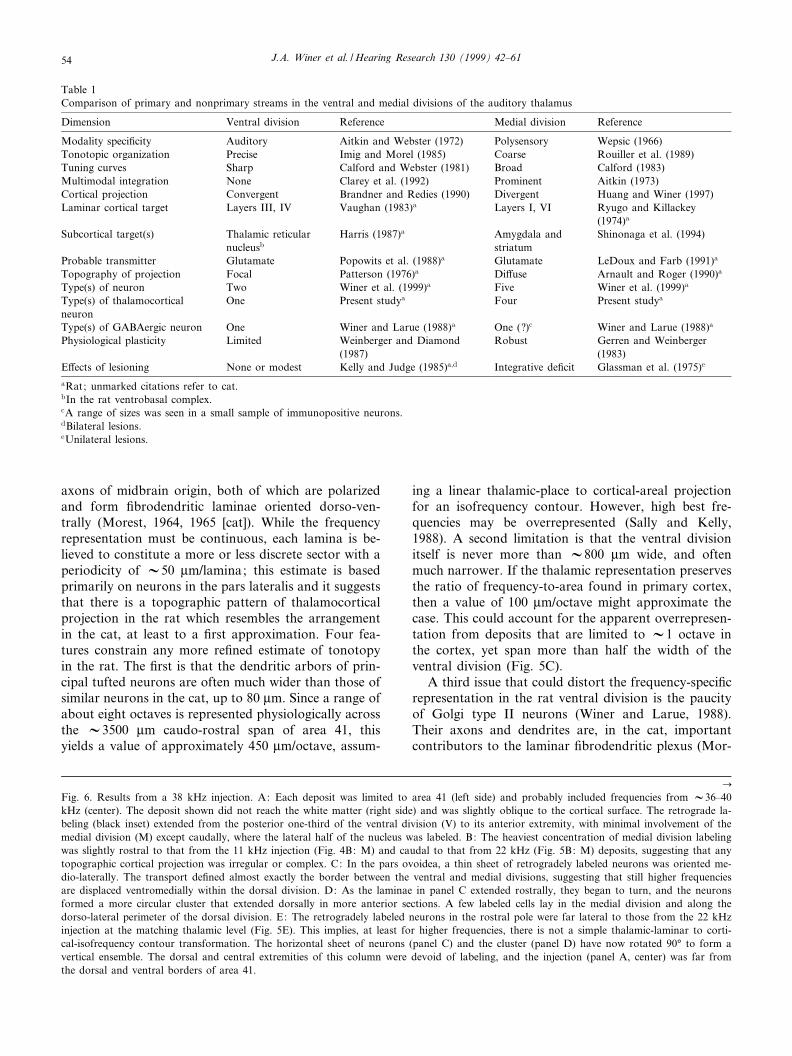
Table 1Comparison of primary and nonprimary streams in the ventral and medial divisions of the auditory thalamus
Dimension Ventral division Reference Medial division Reference
Modality speci¢city Auditory Aitkin and Webster (1972) Polysensory Wepsic (1966)Tonotopic organization Precise Imig and Morel (1985) Coarse Rouiller et al. (1989)Tuning curves Sharp Calford and Webster (1981) Broad Calford (1983)Multimodal integration None Clarey et al. (1992) Prominent Aitkin (1973)Cortical projection Convergent Brandner and Redies (1990) Divergent Huang and Winer (1997)Laminar cortical target Layers III, IV Vaughan (1983)a Layers I, VI Ryugo and Killackey
(1974)a
Subcortical target(s) Thalamic reticularnucleusb
Harris (1987)a Amygdala andstriatum
Shinonaga et al. (1994)
Probable transmitter Glutamate Popowits et al. (1988)a Glutamate LeDoux and Farb (1991)a
Topography of projection Focal Patterson (1976)a Di¡use Arnault and Roger (1990)a
Type(s) of neuron Two Winer et al. (1999)a Five Winer et al. (1999)a
Type(s) of thalamocorticalneuron
One Present studya Four Present studya
Type(s) of GABAergic neuron One Winer and Larue (1988)a One (?)c Winer and Larue (1988)a
Physiological plasticity Limited Weinberger and Diamond(1987)
Robust Gerren and Weinberger(1983)
E¡ects of lesioning None or modest Kelly and Judge (1985)a;d Integrative de¢cit Glassman et al. (1975)e
aRat; unmarked citations refer to cat.bIn the rat ventrobasal complex.cA range of sizes was seen in a small sample of immunopositive neurons.dBilateral lesions.eUnilateral lesions.
J.A. Winer et al. / Hearing Research 130 (1999) 42^6154

HEARES 3173 29-3-99
J.A. Winer et al. / Hearing Research 130 (1999) 42^61 55

est, 1964, 1965, 1971, 1975), which is reduced concom-itantly in the rat.
The last constraint is the spatial distribution andstructure of thalamocortical axons. Retrograde meth-ods can provide only indirect estimates of the totaldorso-ventral limits of any isofrequency band, andthey are even less informative about precise values forthe terminal distribution of single axons. In the cat,small injections of di¡erent tracers into discrete por-tions of a physiologically de¢ned cortical isofrequencycontour tend to single-label adjoining or segregatedclusters of auditory thalamic cells of origin (Brandnerand Redies, 1990). The study referred to noted that theexceptions to a point-to-point representation were mostpronounced in more rostral sections, an observationconsistent with the present outcome and which suggeststhat even topographies which may in principle seemsimple are, in fact, marked by local discontinuities.This suggests that gradients or complexities in the in-ternal con¢guration of thalamic isofrequency laminaeexist whose signi¢cance remains to be explored in ex-perimental work.
4.3. Revisiting the idea of parallel thalamocorticalpathways
Since about 1970, one of the most in£uential con-cepts in central sensory processing has been that theoutput from single receptors is represented centrallythrough progressive connectional divergence, whichleads to many topographic maps of the periphery in avariety of species (Woolsey, 1982; Dykes, 1983; Stone,1983). The anatomical substrate for this process at thelevel of the auditory thalamus and cortex was the resultfrom experimental tract tracing studies in which lesionsto di¡erent thalamic nuclei resulted in lamina-speci¢cdegeneration, with the ventral division projecting tolayers III and IV and the medial division to layers Iand VI (Killackey and Ebner, 1972 [opossum andhedgehog]).
Subsequent work has enlarged the concept of parallelrepresentation to the point where it is now possible tocompare and contrast the di¡erent streams of a¡erentinformation across dimensions other than connectivityalone. The ensuing, contemporary picture (Table 1) en-larges and clari¢es the earlier view, as some examplesshow, and it can suggest new levels of complexity that
HEARES 3173 29-3-99
CFig. 8. Photomicrographs of three characteristic patterns of retrograde labeling in the auditory thalamus after tracer injections in primary andnonprimary auditory cortex. A: After an injection that saturated areas 41, 20, and 36, every auditory thalamic divisions had many labeled neu-rons (see Fig. 9, and Winer and Larue, 1987 [rat]). Protocol for all panels: wheat germ agglutinin conjugated to horseradish peroxidase and re-acted with diaminobenzidine as the chromogen; 60 Wm thick frozen sections. Planapochromat, N.A. 0.16, U62. B: Labeling after deposits cau-dal to area 41. Retrograde labeling was concentrated in the dorsal division nuclei and the marginal zone. C: In a third experiment, an auditorycortex injection labeled medial division neurons through its caudo-rostral extent. Other neurons were labeled in the ventral (V), and dorsal (D)divisions, as well as in the nearby tegmentum (LMN).
Fig. 7. Somatic size pro¢les of neurons retrogradely labeled withhorseradish peroxidase (stippled) or Nissl stained (black line) com-pared in the three medial geniculate divisions. One hundred of eachtype of neuron were measured for each histogram. The average sizeand standard deviations within each histogram were indistinguish-able, and the neuronal populations were normally distributed andunimodal. The degree of overlap in the histograms suggests that al-most all medial geniculate body neurons project to the neocortex(Winer and Larue, 1987, 1988 [rat]). A: Ventral division. B: Dorsaldivision. C: Medial division. The range of this distribution impliesthat more than one type of projection neuron might be present.
J.A. Winer et al. / Hearing Research 130 (1999) 42^6156

HEARES 3173 29-3-99
J.A. Winer et al. / Hearing Research 130 (1999) 42^61 57

HEARES 3173 29-3-99
J.A. Winer et al. / Hearing Research 130 (1999) 42^6158

remain to be described more fully. Consider the dimen-sion of modality (Table 1), in which the so-called pri-mary pathway is exclusively auditory and the nonpri-mary pathway is construed as polymodal. In fact, theexclusively auditory cortex receives many di¡erent,chemically speci¢c and probably extra-auditory inputs,including serotoninergic (DeFelipe et al., 1991 [cat]),dopaminergic (Campbell et al., 1987 [monkey]) andcholinergic (Aoki and Kabak, 1992 [cat]) a¡erents, toname just a few. It might be argued that these arecommon denominators of sensory cortex (McCormick,1992) and hardly unique to primary auditory cortex.Since there is cholinergic (Edeline et al., 1994a,b [rat])and adrenergic (Edeline, 1995 [rat]) modulation of fore-brain auditory neurons, these chemically diverse subsys-tems may be distributed widely. Nonetheless, they actdirectly and speci¢cally on auditory neurons. One pos-sible role for the cholinergic auditory neocortical inner-vation is to facilitate rapid changes in the representa-tion of frequency, suggesting that the map of bestfrequency may be more plastic from a functional per-spective than the topography of thalamocortical con-nectivity might seem to imply (Weinberger, 1997; Kil-gard and Merzenich, 1998 [rat]). In any event, itsuggests a prospectively dynamic role in cortex for ex-trathalamic input whose roles might have once beenregarded as ancillary to the dominant thalamocorticalprojection.
The tuning curves of cat cortical neurons provideanother pertinent example of the physiological com-plexity that seems to confound simplistically dichoto-mous functional categories. Even in AI, cells havingmultipeaked tuning curves with a broad range of tonalbandwidths and elaborate inhibitory/suppressive side-bands are intermingled with single-peaked neurons(Sutter and Schreiner, 1991 [cat]). If such neurons existin the rat, they could signify a kind of spectrotemporalcombination sensitivity, which suggests either that anarea often considered as functionally homogeneous pre-viously in fact contains subregions, or that some part ofit receives speci¢c input with unique intrinsic function.It also implies that descriptors of nuclei and areas in thethalamocortical auditory system underestimate thecomputational power of tightly coupled ensembles ofneurons (Lund et al., 1995 [monkey]).
Acknowledgments
We are grateful to Ms. Pamela Worono¡ for assist-ance with Figures 7 and 9. Supported by a UnitedStates Public Health Service grant (R01 DC 02319-19;J.A.W.) and by a Natural Sciences and EngineeringResearch Council of Canada grant (J.B.K.).
References
Aitkin, L.M., 1973. Medial geniculate body of the cat: responses totonal stimuli of neurons in medial division. J. Neurophysiol. 36,275^283.
Aitkin, L.M., 1990. The Auditory Cortex: Structural and FunctionalBases of Auditory Perception. Chapman and Hall, London.
Aitkin, L.M., Webster, W.R., 1972. Medial geniculate body of thecat: organization and responses to tonal stimuli of neurons inventral division. J. Neurophysiol. 35, 365^380.
Aoki, C., Kabak, S., 1992. Cholinergic terminals in the cat visualcortex: ultrastructural basis for interaction with glutamate-immu-noreactive neurons and other cells. Vis. Neurosci. 8, 177^191.
Arnault, P., Roger, M., 1990. Ventral temporal cortex in the rat:connections of secondary auditory areas Te2 and Te3. J. Comp.Neurol. 302, 110^123.
Brandner, S., Redies, H., 1990. The projection of the medial genicu-late body to ¢eld AI: organization in the isofrequency dimension.J. Neurosci. 10, 50^61.
Burwell, R.D., Witter, M.P., Amaral, D.G., 1995. Perirhinal andpostrhinal cortices of the rat: a review of the neuroanatomicalliterature and comparison with ¢ndings from the monkey brain.Hippocampus 5, 390^408.
Calford, M.B., 1983. The parcellation of the medial geniculate bodyof the cat de¢ned by the auditory response properties of singleunits. J. Neurosci. 3, 2350^2364.
Calford, M.B., Webster, W.R., 1981. Auditory representation withinprincipal division of cat medial geniculate body: an electrophysio-logical study. J. Neurophysiol. 45, 1013^1028.
Campbell, M.J., Lewis, D.A., Foote, S.L., Morrison, J.H., 1987. Dis-tribution of choline acetyltransferase-, serotonin-, dopamine-L-hy-droxylase-, tyrosine hydroxylase-immunoreactive ¢bers in monkeyprimary auditory cortex. J. Comp. Neurol. 261, 209^220.
Clarey, J.C., Barone, P., Imig, T.J., 1992. Physiology of thalamus andcortex. In: Popper, A.N., Fay, R.R. (Eds.), Springer Handbook ofAuditory Research, Vol. 2, The Mammalian Auditory Pathway:Neurophysiology. Springer-Verlag, New York, pp. 232^334.
Clerici, W.J., Coleman, J.R., 1990. Anatomy of the rat medial genic-ulate body: I. Cytoarchitecture, myeloarchitecture, and neocorticalconnectivity. J. Comp. Neurol. 297, 14^31.
Clerici, W.J., McDonald, A.J., Thompson, R., Coleman, J.R., 1990.Anatomy of the rat medial geniculate body: II. Dendritic mor-phology. J. Comp. Neurol. 297, 32^54.
HEARES 3173 29-3-99
Fig. 9. Hypothetical representation of best frequency in the rat medial geniculate body derived from isofrequency representation in auditorycortex. A: Lateral view of cerebral hemisphere, onto which the principal auditory cytoarchitectonic ¢elds (Te1^3) derived from other investiga-tions (Zilles et al., 1990 [rat]) have been superimposed. B: Representation of unit best frequencies in albino rat primary auditory cortex in atypical experiment (for locus, see the boxed area in panel A) taken from mapping studies (Sally and Kelly, 1988 [rat]). There is a systematicrepresentation from low (left side) to high (right side) frequencies organized along the caudo-rostral axis. Solid lines, major blood vessels;dashed lines, architectonic borders. C: Estimates of predicted octave boundaries taken from panel B and proceeding from low (a) to high (g)frequency. D: Schematic view of postulated isofrequency contours in the ventral division of the rat medial geniculate body. This was con-structed by computing the area under each octave value in panel C and adjusting the shape of each isofrequency contour to match that of the¢brodendritic laminae represented in Golgi preparations (Winer et al., 1999 [rat]).6
J.A. Winer et al. / Hearing Research 130 (1999) 42^61 59

Deacon, T.W., Eichenbaum, H., Rosenberg, P., Eckmann, K.W.,1983. A¡erent connections of the perirhinal cortex in the rat.J. Comp. Neurol. 220, 168^190.
DeFelipe, J., Hendry, S.H.C., Hashikawa, T., Jones, E.G., 1991. Syn-aptic relationships of serotonin immunoreactive terminal basketson GABA neurons in the cat auditory cortex. Cereb. Cortex 1,117^133.
Diamond, M.E., Armstrong-James, M., Budway, M.J., Ebner, F.F.,1992. Somatic sensory responses in the rostral sector of the pos-terior group (POm) and in the ventral posterior medial nucleus(VPM) of the rat thalamus: dependence on the barrel ¢eld cortex.J. Comp. Neurol. 319, 66^84.
Dykes, R.W., 1983. Parallel processing of somatosensory informa-tion: a theory. Brain Res. Rev. 6, 47^115.
Edeline, J.-M., 1995. The K2-adrenergic antagonist idazoxan enhancesthe frequency selectivity and increases the threshold of auditorycortex neurons. Exp. Brain Res. 107, 221^240.
Edeline, J.-M., Hars, B., Maho, C., Hennevin, E., 1994a. Transientand prolonged facilitation of tone-evoked responses induced bybasal forebrain stimulations in the rat auditory cortex. Exp. BrainRes. 97, 373^386.
Edeline, J.-M., Maho, C., Hars, B., Hennevin, E., 1994b. Non-awak-ing basal forebrain stimulation enhances auditory cortex respon-siveness during slow-wave sleep. Brain Res. 636, 333^337.
Games, K.D., Winer, J.A., 1988. Layer V in rat auditory cortex:projections to the inferior colliculus and contralateral cortex.Hear. Res. 34, 1^26.
Gerren, R.A., Weinberger, N.M., 1983. Long term potentiation in themagnocellular medial geniculate nucleus of the anesthetized cat.Brain Res. 265, 138^142.
Glassman, R.B., Forgus, M.W., Goodman, J.E., Glassman, H.N.,1975. Somesthetic e¡ects of damage to cats' ventrobasal complex,medial lemniscus or posterior group. Exp. Neurol. 48, 460^492.
Harris, R.M., 1987. Axon collaterals in the thalamic reticular nucleusfrom thalamocortical neurons of the rat ventrobasal complex.J. Comp. Neurol. 258, 397^406.
Hashikawa, T., Molinari, M., Rausell, E., Jones, E.G., 1995. Patchyand laminar terminations of medial geniculate axons in monkeyauditory cortex. J. Comp. Neurol. 362, 195^208.
Hindmarsh, J.L., Rose, R.M., 1994. A model of intrinsic and drivenspindling in thalamocortical neurons. Phil. Trans. R. Soc. Lond. B346, 165^183.
Huang, C.L., Winer, J.A., 1997. Areal and laminar distribution of catauditory thalamocortical projections. Proc. Soc. Neurosci. 24,185.
Imig, T.J., Morel, A., 1985. Tonotopic organization in ventral nucleusof medial geniculate body in the cat. J. Neurophysiol. 53, 309^340.
Jones, E.G., Burton, H., 1976. Areal di¡erences in the laminar dis-tribution of thalamic a¡erents in cortical ¢elds of the insular,parietal, and temporal regions of primates. J. Comp. Neurol.168, 197^248.
Kelly, J.B., 1990. Rat auditory cortex. In: Kolb, B., Tees, R.C. (Eds.),The Cerebral Cortex of the Rat. MIT Press, Cambridge, MA, pp.380^405.
Kelly, J.B., Judge, P.W., 1985. E¡ects of medial geniculate lesions onsound localization by the rat. J. Neurophysiol. 53, 361^372.
Kilgard, M.P., Merzenich, M.M., 1998. Cortical map reorganizationenabled by nucleus basalis activity. Science 279, 1714^1718.
Killackey, H.P., Ebner, F.F., 1972. Two di¡erent types of thalamo-cortical projections to a single cortical area in mammals. BrainBehav. Evol. 6, 141^169.
LeDoux, J.E., Farb, C.R., 1991. Neurons of the acoustic thalamusthat project to the amygdala contain glutamate. Neurosci. Lett.134, 145^149.
LeDoux, J.E., Ruggiero, D.A., Reis, D.J., 1985. Projections to thesubcortical forebrain from anatomically de¢ned regions of themedial geniculate body in the rat. J. Comp. Neurol. 242, 182^213.
Lund, J.S., Wu, Q., Hadingham, P.T., Levitt, J.B., 1995. Cells andcircuits contributing to functional properties in area V1 of ma-caque monkey cerebral cortex: bases for neuroanatomically real-istic models. J. Anat. (Lond.) 187, 563^581.
McCormick, D.A., 1992. Neurotransmitter actions in the thalamusand cerebral cortex and their role in neuromodulation of thalamo-cortical activity. Prog. Neurobiol. 39, 337^388.
McCormick, D.A., von Krosigk, M., 1992. Corticothalamic activationmodulates thalamic ¢ring through glutamate `metabotropic' recep-tors. Proc. Natl. Acad. Sci. USA 89, 2774^2778.
Mesulam, M.-M., 1978. Tetramethyl benzidine for horseradish per-oxidase neurohistochemistry: a non-carcinogenic blue reaction-product with superior sensitivity for visualizing neural a¡erentsand e¡erents. J. Histochem. Cytochem. 26, 106^117.
Middlebrooks, J.C., Zook, J.M., 1983. Intrinsic organization of thecat's medial geniculate body identi¢ed by projections to binauralresponse-speci¢c bands in the primary auditory cortex. J. Neuro-sci. 3, 203^225.
Morest, D.K., 1964. The neuronal architecture of the medial genicu-late body of the cat. J. Anat. (Lond.) 98, 611^630.
Morest, D.K., 1965. The laminar structure of the medial geniculatebody of the cat. J. Anat. (Lond.) 99, 143^160.
Morest, D.K., 1971. Dendrodendritic synapses of cells that have ax-ons: the ¢ne structure of the Golgi type II cell in the medialgeniculate body of the cat. Z. Anat. Entwicklungsgesch. 133,216^246.
Morest, D.K., 1975. Synaptic relations of Golgi type II cells in themedial geniculate body of the cat. J. Comp. Neurol. 162, 157^194.
Niimi, K., Naito, F., 1974. Cortical projections of the medial genicu-late body in the cat. Exp. Brain Res. 19, 326^342.
Patterson, H.A., 1976. An Anterograde Degeneration and RetrogradeAxonal Transport Study of the Cortical Projections of the RatMedial Geniculate Body. Ph.D. Thesis, Department of Anatomy,Boston University Graduate School, Boston, MA.
Popowits, J.M., Larue, D.T., Winer, J.A., 1988. Glutamate is a majortransmitter in the rat medial geniculate body. Proc. Soc. Neurosci.14, 490.
Reale, R.A., Imig, T.J., 1980. Tonotopic organization in auditorycortex of the cat. J. Comp. Neurol. 182, 265^291.
Romanski, L.M., LeDoux, J.E., 1993a. Information cascade fromprimary auditory cortex to the amygdala: corticocortical and cor-ticoamygdaloid projections of temporal cortex in the rat. Cereb.Cortex 3, 515^532.
Romanski, L.M., LeDoux, J.E., 1993b. Organization of rodent audi-tory cortex: anterograde transport of PHA-L from MGv to tem-poral neocortex. Cereb. Cortex 3, 499^514.
Rouiller, E.M., Rodrigues-Dagae¡, C., Simm, G., de Ribaupierre, Y.,Villa, A., de Ribaupierre, F., 1989. Functional organization of themedial division of the medial geniculate body of the cat: tonotopicorganization, spatial distribution of response properties and cort-ical connections. Hear. Res. 39, 127^146.
Ryugo, D.K., Killackey, H.P., 1974. Di¡erential telencephalic projec-tions of the medial and ventral divisions of the medial geniculatebody of the rat. Brain Res. 82, 173^177.
Sally, S.L., Kelly, J.B., 1988. Organization of auditory cortex in thealbino rat: sound frequency. J. Neurophysiol. 59, 1627^1638.
Schreiner, C.E., 1992. Functional organization of the auditory cortex:maps and mechanisms. Curr. Opin. Neurobiol. 2, 516^521.
Shinonaga, Y., Takada, M., Mizuno, N., 1994. Direct projectionsfrom the non-laminated divisions of the medial geniculate nucleusto the temporal polar cortex and amygdala in the cat. J. Comp.Neurol. 340, 405^426.
Smith, Y., Seègueèla, P., Parent, A., 1987. Distribution of GABA-im-munoreactive neurons in the thalamus of the squirrel monkey(Saimiri sciureus). Neuroscience 22, 579^591.
Sousa-Pinto, A., 1973. Cortical projections of the medial geniculatebody in the cat. Adv. Anat. Embryol. Cell Biol. 48, 1^42.
HEARES 3173 29-3-99
J.A. Winer et al. / Hearing Research 130 (1999) 42^6160

Stone, J., 1983. Parallel Processing in the Visual System. The Classi-¢cation of Retinal Ganglion Cells and Its Impact on the Neuro-biology of Vision. Plenum Press, New York.
Sun, X., Chen, Q.C., Jen, P.H.-S., 1996. Corticofugal control of cen-tral auditory sensitivity in the big brown bat, Eptesicus fuscus.Neurosci. Lett. 212, 131^134.
Sutter, M.L., Schreiner, C.E., 1991. Physiology and topography ofneurons with multipeaked tuning curves in cat primary auditorycortex. J. Neurophysiol. 65, 1207^1226.
Vaughan, D.W., 1983. Thalamic and callosal connections of the ratauditory cortex. Brain Res. 260, 181^189.
Weinberger, N.M., 1997. Learning-induced receptive ¢eld plasticity inthe auditory cortex. Semin. Neurosci. 9, 59^67.
Weinberger, N.M., Diamond, D.M., 1987. Physiological plasticity inauditory cortex: rapid induction by learning. Prog. Neurobiol. 29,1^55.
Wepsic, J.G., 1966. Multimodal sensory activation of cells in themagnocellular medial geniculate nucleus. Exp. Neurol. 15, 299^318.
Winer, J.A., Larue, D.T., 1987. Patterns of reciprocity in auditorythalamocortical and corticothalamic connections: study withhorseradish peroxidase and autoradiographic methods in the ratmedial geniculate body. J. Comp. Neurol. 257, 282^315.
Winer, J.A., Larue, D.T., 1988. Anatomy of glutamic acid decarboxy-lase (GAD) immunoreactive neurons and axons in the rat medialgeniculate body. J. Comp. Neurol. 278, 47^68.
Winer, J.A., Larue, D.T., 1996. Evolution of GABAergic circuitry inthe mammalian medial geniculate body. Proc. Natl. Acad. Sci.USA 93, 3083^3087.
Winer, J.A., Morest, D.K., 1983a. The medial division of the medialgeniculate body of the cat: implications for thalamic organization.J. Neurosci. 3, 2629^2651.
Winer, J.A., Morest, D.K., 1983b. The neuronal architecture of thedorsal division of the medial geniculate body of the cat. A studywith the rapid Golgi method. J. Comp. Neurol. 221, 1^30.
Winer, J.A., Morest, D.K., 1984. Axons of the dorsal division of themedial geniculate body of the cat: a study with the rapid Golgimethod. J. Comp. Neurol. 224, 344^370.
Winer, J.A., Kelly, J.B., Larue, D.T. (1999) Neural architecture of therat medial geniculate body. Hear. Res. (in press).
Woolsey, C.N. (Ed.) (1982) Cortical Sensory Organization, Vol. 3,Multiple Auditory Areas. Humana Press, Clifton, NJ.
Zilles, K., Wree, A., Dausch, N.-D., 1990. Anatomy of the neocortex:neurochemical organization. In: Kolb, B., Tees, R.C. (Eds.), TheCerebral Cortex of the Rat. MIT Press, Cambridge, MA, pp. 113^150.
HEARES 3173 29-3-99
J.A. Winer et al. / Hearing Research 130 (1999) 42^61 61


![Medial septum lesions disrupt exploratory trip ... · septohippocampal involvement in dead reckoning ... cholinergic and GABAergic projections to the hippocampus [16,17]. Second,](https://static.fdocuments.us/doc/165x107/5fa6e449750b7f31bc09c35f/medial-septum-lesions-disrupt-exploratory-trip-septohippocampal-involvement.jpg)