Originally published online October 14,...
10
doi: 10.2522/ptj.20090126 Originally published online October 14, 2010 2011; 91:114-121. PHYS THER. Chun-Hwei Tai, Chin-Hsien Lin and Wen-Shian Lu Sheau-Ling Huang, Ching-Lin Hsieh, Ruey-Meei Wu, Parkinson Disease Test and the Dynamic Gait Index in People With Minimal Detectable Change of the Timed ''Up & Go'' http://ptjournal.apta.org/content/91/1/114 found online at: The online version of this article, along with updated information and services, can be Collections Tests and Measurements Parkinson Disease and Parkinsonian Disorders Gait Disorders Balance in the following collection(s): This article, along with others on similar topics, appears e-Letters "Responses" in the online version of this article. "Submit a response" in the right-hand menu under or click on here To submit an e-Letter on this article, click E-mail alerts to receive free e-mail alerts here Sign up by guest on December 18, 2012 http://ptjournal.apta.org/ Downloaded from
Transcript of Originally published online October 14,...
doi: 10.2522/ptj.20090126Originally published online October 14, 2010
2011; 91:114-121.PHYS THER. Chun-Hwei Tai, Chin-Hsien Lin and Wen-Shian LuSheau-Ling Huang, Ching-Lin Hsieh, Ruey-Meei Wu,Parkinson DiseaseTest and the Dynamic Gait Index in People With Minimal Detectable Change of the Timed ''Up & Go''
http://ptjournal.apta.org/content/91/1/114found online at: The online version of this article, along with updated information and services, can be
Collections
Tests and Measurements Parkinson Disease and Parkinsonian Disorders
Gait Disorders Balance
in the following collection(s): This article, along with others on similar topics, appears
e-Letters
"Responses" in the online version of this article. "Submit a response" in the right-hand menu under
or click onhere To submit an e-Letter on this article, click
E-mail alerts to receive free e-mail alerts hereSign up
by guest on December 18, 2012http://ptjournal.apta.org/Downloaded from

Minimal Detectable Change of theTimed “Up & Go” Test and theDynamic Gait Index in People WithParkinson DiseaseSheau-Ling Huang, Ching-Lin Hsieh, Ruey-Meei Wu, Chun-Hwei Tai,Chin-Hsien Lin, Wen-Shian Lu
Background. The minimal detectable change (MDC) is the smallest amount ofdifference in individual scores that represents true change (beyond random measure-ment error). The MDCs of the Timed “Up & Go” Test (TUG) and the Dynamic GaitIndex (DGI) in people with Parkinson disease (PD) are largely unknown, limiting theinterpretability of the change scores of both measures.
Objective. The purpose of this study was to estimate the MDCs of the TUG andthe DGI in people with PD.
Design. This investigation was a prospective cohort study.
Methods. Seventy-two participants were recruited from special clinics for move-ment disorders at a university hospital. Their mean age was 67.5 years, and 61% weremen. All participants completed the TUG and the DGI assessments twice, about 14days apart. The MDC was calculated from the standard error of measurement. Thepercentage MDC (MDC%) was calculated as the MDC divided by the mean of allscores for the sample. Furthermore, the intraclass correlation coefficient was used toexamine the reproducibility between testing sessions (test-retest reliability).
Results. The respective MDC and MDC% of the TUG were 3.5 seconds and 29.8,and those of the DGI were 2.9 points and 13.3. The test-retest reliability values for theTUG and the DGI were high; the intraclass correlation coefficients were .80 and .84,respectively.
Limitations. The study sample was a convenience sample, and the participantshad mild to moderately severe PD.
Conclusions. The results showed that the TUG and the DGI have generallyacceptable random measurement error and test-retest reliability. These findingsshould help clinicians and researchers determine whether a change in an individualpatient with PD is a true change.
S.-L. Huang, MS, is Lecturer,School of Occupational Therapy,College of Medicine, National Tai-wan University, and Senior Occu-pational Therapist, Division of Oc-cupational Therapy, Departmentof Physical Medicine and Rehabil-itation, National Taiwan UniversityHospital, Taipei, Taiwan.
C.-L. Hsieh, PhD, is Professor,School of Occupational Therapy,College of Medicine, National Tai-wan University, and Senior Occu-pational Therapist, Division of Oc-cupational Therapy, Departmentof Physical Medicine and Rehabil-itation, National Taiwan UniversityHospital.
R.-M. Wu, PhD, MD, is affiliatedwith the Department of Neurol-ogy, National Taiwan UniversityHospital, and the College of Med-icine, National Taiwan University.
C.-H. Tai, MD, is affiliated with theDepartment of Neurology, Na-tional Taiwan University Hospital.
C.-H. Lin, MD, is affiliated with theDepartment of Neurology, Na-tional Taiwan University HospitalYun-Lin Branch, Yun-Lin, Taiwan.
W.-S. Lu, MS, is Assistant Profes-sor, School of Occupational Ther-apy, Chung Shan Medical Uni-versity, and Senior OccupationalTherapist, Occupational TherapyRoom, Chung Shan Medical Uni-versity Hospital, Taichung, Taiwan.Mailing address: No. 110, Sec. 1,Jianguo N. Rd, Taichung City40201, Taiwan (Republic of China).Address all correspondence to MrLu at: [email protected].
[Huang S-L, Hsieh C-L, Wu R-M,et al. Minimal detectable changeof the Timed “Up & Go” Test andthe Dynamic Gait Index in peoplewith Parkinson disease. Phys Ther.2011;91:114–121.]
© 2011 American Physical TherapyAssociation
Research Report
Post a Rapid Response tothis article at:ptjournal.apta.org
114 f Physical Therapy Volume 91 Number 1 January 2011 by guest on December 18, 2012http://ptjournal.apta.org/Downloaded from

Gait and balance deficits arecommon in patients with Par-kinson disease (PD).1–3 Pa-
tients with PD are characterized clin-ically by movement-related symptoms,such as tremor, rigidity, slow move-ment (bradykinesia), and posturalinstability. Consequently, they expe-rience difficulties in gait and gait-related activities (eg, turning andclimbing stairs) that reduce theirquality of life.3–5 To manage andmonitor gait and balance deficits, cli-nicians need to routinely measurethese characteristics of patients withPD. Furthermore, to interpret the re-sults of the measurements, cliniciansmust determine whether changescores in gait and balance deficitsrepresent true changes or are a resultof measurement error.
Any measurement entails randommeasurement error. A measure with-out determined measurement errorhas limited score interpretability.6,7
The minimal detectable change(MDC) is the minimal amount ofchange between 2 points in time thatindicates a true statistical change.6,8
The MDC ideally is different from theminimal important change (MID),which is the minimal “important ormeaningful” change after an interven-tion from the viewpoint of a patient.9
The MDC is sometimes calculated toenhance interpretability. Differencescores that are smaller than the MDCcan be attributed to random error at acertain confidence level (usually95%).10 Clinicians and researchers canuse the MDC as a threshold to deter-mine whether a change score in ameasure for an individual patient rep-resents a true change or is within thebounds of random error.6 Thus, theMDC of a measure is crucial for theinterpretation of data in both researchand clinical settings.6,7
The Timed “Up & Go” Test (TUG)measures functional mobility and gaitspeed,11 and the Dynamic Gait Index(DGI), including 8 task-oriented items,
measures gait quality.12 The TUG andthe DGI provide a complementary andmore comprehensive understandingof the characteristics of patients’ gaitand balance control. Because of therelevance of the TUG and the DGI tothe motor characteristics of patientswith PD and their easy administration,both measures are being used increas-ingly to examine gait and balance def-icits in patients with PD.13–16 TheMDC of the TUG in patients with PDhas been reported, but the results varyextensively (2–11 seconds).14,15 Toour knowledge, however, the MDC ofthe DGI in patients with PD has notbeen examined. These shortcomingslimit the interpretation of the changescores for both measures. Thus, thepurpose of this study was to deter-mine the MDCs of the TUG and theDGI in patients with PD.
MethodParticipantsAll of the participants were recruitedfrom special clinics for movementdisorders at the Department of Neu-rology, National Taiwan UniversityHospital, from February to October2008. To minimize selection bias andthe effect of cognitive impairmenton the TUG and the DGI, the follow-ing criteria were used to determinewhether patients could be includedin this study: PD diagnosed by amovement disorder specialist, with asubsequent referral to occupationaltherapy; Hoehn-Yahr stages I to III17;a Mini-Mental State Examinationscore of greater than 20; and agree-ment to participate in this studyand to sign consent forms as ap-proved by the Medical Ethics Com-mittee at the hospital. The exclusioncriteria were: (1) a TUG score ofmore than 20 seconds in the firstsession because of safety concernsand (2) other diseases or injuries (eg,stroke, lower-extremity amputation)likely to affect balance function.
Eighty-five participants with PDwere invited to participate in the
study. Seven participants were ex-cluded because they had TUG scoresof more than 20 seconds or had hada stroke and lost balance easily(n�2). Of the remaining 78 partici-pants, 6 participants were lost tofollow-up because of loss of contactor refusal to retest. The mean base-line scores of the TUG and the DGIfor the remaining 72 participants andthe 6 participants lost to follow-upwere not statistically different (P�.30for the TUG and P�.24 for the DGI).
The demographic characteristics andmajor comorbidity data (eg, hyper-tension, cardiovascular disease, dia-betes mellitus, hyperlipidemia, hy-peruricemia, cataracts) for the 72participants were collected frommedical records (Tab. 1). The partic-ipants’ mean age was 67.5 years, and61% of the participants were men.The mean baseline scores of the TUGand the DGI were 11.8 seconds and21.6 points, respectively.
ProcedureThe participants were screened andinvited to participate by the move-ment disorder specialists. When theparticipants agreed to join the re-search, they were scheduled for ourassessments. All participants wereassessed in person during the “on”status (about 1 hour after takinganti-PD medication, includinglevodopa [Sinemet* and Madopar†]or dopamine agonists [ergot and
* Merck & Co Inc, PO Box 4 WP39–206, WestPoint, PA 19486-0004.† Roche Products Ltd, Hexagon Place, 6 Fal-con Way, Welwyn Garden City, Hertfordshire,United Kingdom AL7 1TW.
Available WithThis Article atptjournal.apta.org
• Audio Abstracts Podcast
This article was published ahead ofprint on October 14, 2010, atptjournal.apta.org.
Assessment of Gait Measures in Parkinson Disease
January 2011 Volume 91 Number 1 Physical Therapy f 115 by guest on December 18, 2012http://ptjournal.apta.org/Downloaded from

nonergot agonists]) by a single occu-pational therapist at the same placein 2 sessions about 2 weeks apart.The rater was familiar with themethod and the sequence for evalu-ating TUG and DGI scores in thisstudy. The participants used theirregular walking aids (eg, canes, walk-ers) during the assessments in bothtest sessions. Changes in anti-PDmedication were not allowed.
In the first session, half of the partic-ipants were administered the DGIbefore the TUG; the order was re-versed for the other half to controlfor possible bias of the testing se-quence. For safety, the participantswere well instructed and allowed 1practice trial before the formal TUG.
All of the participants performed theformal TUG once. Before the secondsession, the same rater confirmedthat each participant had experi-enced no significant change (eg,medication, injury, disease progres-sion) within the preceding 2 weeks.
MeasureThe TUG is a mobility test that isused to measure the basic mobilityskills of people who are elderly orhave neurological conditions.11,14 Itincludes a sit-to-stand component aswell as walking 3 m, turning, andreturning to the chair. People per-form these tasks using regular foot-wear and customary walking aids.The measured outcome is the time
in seconds to complete the entiresequence.
The DGI is a performance-basedmobility test that is used to exam-ine an individual’s ability to modifygait in response to task demands.12
It consists of 8 common gait tasks:walking on a level surface, chang-ing gait speed, walking with verti-cal and horizontal head turns, pivotturning, stepping over an obstacle,and ascending and descendingstairs. These 8 items are scored ona 4-point ordinal scale, in which 0represents severe impairment and3 represents normal movement.The range is 0 to 24 points, withhigh scores indicating the ability tomove normally.
Data AnalysisData were analyzed with the SPSS15.0 for Windows statistical pro-gram.‡ To investigate the MDC, wecalculated the intraclass correlationcoefficient (ICC) first. The ICC (2,1),applied in this study, is commonlyused to examine the extent of repro-ducibility between repeated mea-surements18 and to calculate thestandard error of measurement(SEM), which, in turn, is used to cal-culate the MDC.6,10 The ICC (2,1)was computed with a random-effects2-way analysis of variance for 2 testsessions, as follows:
ICC (2,1) � (BMS � EMS)/[BMS
� EMS � 2(JMS � EMS)/n]
In this formula, BMS is the between-participants mean square (variabilitybetween participants), EMS is the er-ror mean square (residual meansquare), JMS is the observationsmean square (variability betweentest sessions), and n is the number ofparticipants. An ICC of greater than.80 indicates high reliability.19
‡ SPSS Inc, 233 S Wacker Dr, Chicago, IL60606.
Table 1.Demographic and Clinical Characteristics of the Participantsa
Characteristic
Participants Completing2 Assessments
(N�72)
Participants Lostto Follow-up
(n�6)
Age (y), X (SD) 67.5 (11.6) 64.4 (5.6)
Sex, men/women (n) 44/28 4/2
Hoehn-Yahr stage (no. of participants)
I 17 3
II 33 2
III 22 1
Parkinson disease evolution time (range) 2 mo–15 y 6 mo–10 y
TUG baseline score (s), X (SD) 11.8 (2.9) 9.9 (1.7)
DGI baseline score (points), X (SD) 21.6 (2.6) 23.3 (1.2)
Days between 2 assessments, X (SD) 13.5 (2.5)
Comorbidity (no. of participants)
Hypertension 23 0
Cardiovascular disease 8 1
Diabetes mellitus 8 0
Hyperlipidemia 6 0
Cataract 5 0
Benign prostatic hyperplasia 4 0
Cancer 2 0
Glaucoma 2 0
Osteoporosis 2 0
Depression 2 0
Hyperuricemia 1 0
a TUG�Timed “Up & Go” Test, DGI�Dynamic Gait Index.
Assessment of Gait Measures in Parkinson Disease
116 f Physical Therapy Volume 91 Number 1 January 2011 by guest on December 18, 2012http://ptjournal.apta.org/Downloaded from

The MDC (at a confidence level of95%) was calculated from the SEMwith the following formulas6,8:
SEM � SDbaseline � �(1 � rtest-retest)
and
MDC � z scorelevel of confidence
� �2 � SEM
In these formulas, SDbaseline isthe standard deviation of the base-line, rtest-retest is the coefficient ofthe test-retest reliability estimatedfrom ICC (2,1) in this study, zscorelevel of confidence is the confi-dence interval (CI) from a normaldistribution, and multiplying by thesquare root of 2 accounts for theextra uncertainty that arises whenscores from measurements at 2 timepoints are used.
In addition, the MDC can be ex-pressed as a percentage (MDC%),which is independent of the unitsof measurement. The MDC% can beused to determine a relatively truechange after a treatment or betweenrepeated measurements over time.20
The MDC% also represents the rela-tive amount of random measurementerror. The MDC% is the MDC dividedby the mean of all scores for thesample. An MDC% of less than 30is considered acceptable, and anMDC% of less than 10 is consideredexcellent.21
Moreover, the reproducibility be-tween 2 repeated measurements canbe visualized by use of Bland-Altmanplots with 95% limits of agreement.22
In the plots, the differences (d) be-tween each pair of measurementsare plotted against the mean of eachpair of measurements. If the differ-ences follow a standard normal dis-tribution, then 95% of the differenceswill lie between ��1.96SDdifference
(ie, limits of agreement), where � is
the mean difference between the 2test sessions and SDdifference is thestandard deviation of the differences.
These plots also can be used to illus-trate heteroscedasticity, which rep-resents a tendency: the differencesbetween repeated measurementsgenerally increase as the mean valuesof the measurements increase.23 Thepossibility of heteroscedasticity canbe examined on the basis of the as-sociation (ie, Pearson r) between themean and the absolute differenceof each pair of measurements. If ris greater than .3, then the data areheteroscedastic.24
Systematic bias can be calculatedfrom the 95% CI of � on the basis ofthe standard error (SE) of � with thefollowing formulas:23
95% CI of � � � � 1.96 � SE
and
SE � SDdifference/�n
If 0 is included within the 95% CI,then it can be inferred that there isno significant systematic bias be-tween measurements.
ResultsThe test-retest reliability values forthe TUG and the DGI are shown inTable 2. The ICCs for the TUG andthe DGI were .80 and .84, respec-tively, indicating that both measureshad high test-retest reliability. Themean differences for the TUG and
the DGI were 0.0 and �0.1, respec-tively. The MDC of the TUG was 3.5seconds, and the MDC% was 29.8,representing acceptable measure-ment error. The MDC of the DGI was2.9 points, and the MDC% was 13.3,representing limited measurementerror. However, 2 participants hadTUG measurements of more than 20seconds in the retest assessment (ie,2 outliers). When we excluded datafrom both of those participants, theresults were very similar to those re-ported above. The ICCs for the TUGand the DGI were .78 and .83, re-spectively. The MDC for the TUGwas 3.4 seconds, and the MDC% was29.6. The MDC of the DGI was 2.9points, and the MDC% was 13.2.
The differences in scores are plottedagainst the mean scores of the 2 mea-surements for both the TUG and theDGI in Figure 1.22 The limits of agree-ment ranged from 3.9 to �3.9 sec-onds for the TUG and from 2.9 to�3.0 points for the DGI. The 95% CIof the mean difference for the TUGranged from �0.4 to 0.5, and thatfor the DGI ranged from �0.4 to0.3. Zero was included in the 95%CIs of the mean differences forboth the TUG and the DGI, indicat-ing that there was no significant sys-tematic bias between the successivemeasurements.
In addition, the Pearson r values forthe association between the meanand the absolute difference for theTUG and the DGI were .54 and �.41,
Table 2.Test-Retest Reliability Values for the Timed “Up & Go” Test (TUG) and the DynamicGait Index (DGI) (N�72)a
TestFirst
SessionSecondSession Difference
ICC(95% CI)
MDC(MDC%)
TUG 11.8 (2.9) 11.8 (3.4) 0.0 (2.0) .80 (.70–.87) 3.5 (29.8)
DGI 21.6 (2.6) 21.5 (2.7) �0.1 (1.5) .84 (.76–.90) 2.9 (13.3)
a Values are reported as means (standard deviations) unless otherwise indicated. ICC�intraclass correlationcoefficient, CI�confidence interval, MDC�z scorelevel of confidence � �2 � standard error of measurement,MDC%�(MDC/mean of measurements) � 100%.
Assessment of Gait Measures in Parkinson Disease
January 2011 Volume 91 Number 1 Physical Therapy f 117 by guest on December 18, 2012http://ptjournal.apta.org/Downloaded from
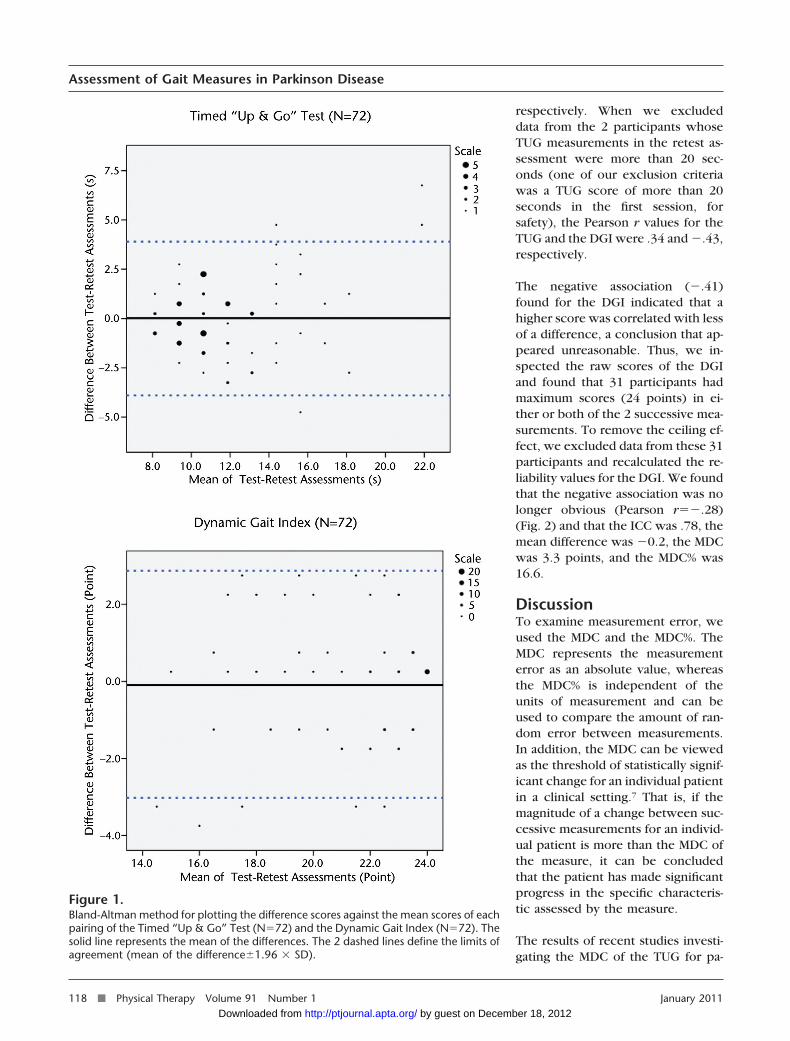
respectively. When we excludeddata from the 2 participants whoseTUG measurements in the retest as-sessment were more than 20 sec-onds (one of our exclusion criteriawas a TUG score of more than 20seconds in the first session, forsafety), the Pearson r values for theTUG and the DGI were .34 and �.43,respectively.
The negative association (�.41)found for the DGI indicated that ahigher score was correlated with lessof a difference, a conclusion that ap-peared unreasonable. Thus, we in-spected the raw scores of the DGIand found that 31 participants hadmaximum scores (24 points) in ei-ther or both of the 2 successive mea-surements. To remove the ceiling ef-fect, we excluded data from these 31participants and recalculated the re-liability values for the DGI. We foundthat the negative association was nolonger obvious (Pearson r��.28)(Fig. 2) and that the ICC was .78, themean difference was �0.2, the MDCwas 3.3 points, and the MDC% was16.6.
DiscussionTo examine measurement error, weused the MDC and the MDC%. TheMDC represents the measurementerror as an absolute value, whereasthe MDC% is independent of theunits of measurement and can beused to compare the amount of ran-dom error between measurements.In addition, the MDC can be viewedas the threshold of statistically signif-icant change for an individual patientin a clinical setting.7 That is, if themagnitude of a change between suc-cessive measurements for an individ-ual patient is more than the MDC ofthe measure, it can be concludedthat the patient has made significantprogress in the specific characteris-tic assessed by the measure.
The results of recent studies investi-gating the MDC of the TUG for pa-
Figure 1.Bland-Altman method for plotting the difference scores against the mean scores of eachpairing of the Timed “Up & Go” Test (N�72) and the Dynamic Gait Index (N�72). Thesolid line represents the mean of the differences. The 2 dashed lines define the limits ofagreement (mean of the difference�1.96 � SD).
Assessment of Gait Measures in Parkinson Disease
118 f Physical Therapy Volume 91 Number 1 January 2011 by guest on December 18, 2012http://ptjournal.apta.org/Downloaded from

tients with PD revealed wide varia-tions. One study of 26 participantswith PD, tested over a period of7 days, revealed an MDC of 2 sec-onds.14 Another study of 37community-dwelling adults with PD,tested over a period of 7 days, re-vealed an MDC of 11 seconds.15
These variations may have resultedfrom the small to moderate samplesizes in these studies. Our findingof an MDC of 3.5 seconds—a valuelying between the values reportedin the 2 earlier studies14,15—seemsmore reliable because of the largersize of our sample20,25 and the evendistribution among Hoehn-Yahr stagesI to III in our sample. In addition, noMDC% values from the earlier studieswere available for comparison. How-ever, further studies with larger sam-ple sizes or modified inclusion andexclusion criteria (eg, including pa-tients with a first TUG score of morethan 20 seconds) may be needed tovalidate our results.
The MDC% of the TUG was slightlyless than 30, representing acceptablerandom measurement error. In thepresent study, however, to preventfatigue, we measured the partici-pants’ performances on the TUGonly once per session. More trialsper session would increase the sta-bility of the measurements and re-duce the MDC and the MDC%.25
Thus, the MDC of 3.5 seconds can beviewed as a high standard of randomerror for the TUG.
To our knowledge, this is the firststudy to report the MDC and theMDC% of the DGI. The DGI was de-veloped to examine an older individ-ual’s ability to modify gait in re-sponse to task demands.12,26
Recently, the DGI was used to pre-dict the probability of falls in pa-tients with PD.13,27 However, MDCand MDC% values were not providedin previous studies. The results ofthe present study can be used as areference for the measurement error
of the DGI to help clinicians and re-searchers determine the true changebetween successive assessments forpatients with PD.
We found that the Pearson r of theTUG was more than .3, implying theexistence of heteroscedasticity. Be-cause the difference and the meanof each pair of repeated measure-ments increased simultaneously, afixed value for the MDC was not ap-propriate for all patients with variedwalking performance. In such a situ-ation, the MDC% is more appropriatethan the MDC for interpreting a truechange.20 That is, the amount of ran-dom measurement error depends onthe initial walking performance ofthe patient. According to Flansbjer etal,20 a change exceeding the MDC%(ie, 29.8 for the TUG) of the initialtest score for an individual patient
could be considered a true change.For example, the score of a patientwith an initial TUG score of 11.8seconds needs to improve by morethan 3.5 seconds (11.8 � 0.298) toindicate a true change. These re-sults should help clinicians interpretchanges between test sessions for anindividual patient.
The existence of heteroscedasticityalso was originally found for the DGI(Pearson r��.41); this result mayhave been caused by the notable ceil-ing effect for 31 participants (43%of the initial 72 participants). TheHoehn-Yahr stages for 26 of these31 participants fell in stages I and II.To remove the possible influence ofthe ceiling effect, we recalculatedthe reliability values for the DGI byexcluding data from participantswith maximum scores in either of
Figure 2.Bland-Altman method for plotting the difference scores against the mean scores of eachpairing of the Dynamic Gait Index (n�41). The solid line represents the mean of thedifferences. The 2 dashed lines define the limits of agreement (mean of the differ-ence�1.96 � SD).
Assessment of Gait Measures in Parkinson Disease
January 2011 Volume 91 Number 1 Physical Therapy f 119 by guest on December 18, 2012http://ptjournal.apta.org/Downloaded from

the 2 sessions. We found that theheteroscedasticity was no longer ob-vious (Pearson r��.28). In addi-tion, the reliability values for the re-maining 41 participants (ICC�.78,MDC�3.3 points, and MDC%�16.6)were slightly lower than those forthe initial 72 participants (ICC�.84,MDC�2.9 points, and MDC%�13.3).These observations indicated thatthe notable ceiling effect for the DGIslightly increased the reliability val-ues for the DGI. Thus, the reliabilityvalues for the 41 participants weremore conservative, but also more ap-propriate, than those for the 72 par-ticipants. On the other hand, the useof the DGI in patients with PD butwith better mobility is limited be-cause of the ceiling effect.
For group comparisons (ie, researchpurposes), an individual-level MDC(MDCindividual) can be modifiedto a group-level MDC (MDCgroup)with the formula MDCgroup�MDCindividual/�n, where n is thesize of the sample.28 For example,if the MDCindividual of the DGI is 2.9points, then the MDCgroup of theDGI will be 0.5 point (for a samplesize of 30); such an MDCgroup is sotrivial that it may be neglected. Inresearch contexts, however, the MD-Cgroup is negligible, given a substan-tial sample size, so it is seldom aconcern.
Using the MDCindividual as a thresholdto determine whether a change istrue, researchers can report the pro-portion of the sample for which achange exceeds the MDCindividual ofan outcome measure when investi-gating the effects of an intervention.6
Research reports regarding a signifi-cant change in a sample group afteran intervention have revealed littleinformation about the utility of theintervention to clinicians. The signif-icant improvement of a group doesnot mean that all people in the groupachieve real progress, and most peo-ple in the group may even fail to
improve. Thus, reporting the pro-portion of a study sample achievinga true change may help clinicianstransfer research outcomes to clini-cal contexts, an advantage that mayimprove the utility of the results of astudy.
The ICC represents the degree of re-producibility between 2 successiveassessments. We found that the ICCof the DGI was .84, indicating highreliability.19 The ICC of the TUG was.80 (somewhat lower than the ICCsof .85 to .88 reported in previousstudies14,15), also representing highreliability.19 In addition, the meandifference in the test-retest assess-ments deviated insignificantly from0, indicating that there was no sys-tematic bias between the successivemeasurements of the TUG and theDGI. These results support the re-producibility of the TUG and theDGI between successive sessions ofassessments for monitoring changesin patients’ gait and balance control.
The Bland-Altman plot (Fig. 1) forthe TUG scores showed that 2 par-ticipants took more than 20 secondsto perform this measure in the retestassessment. In addition, differencesbetween test and retest measure-ments for both of these participantsappeared to be “outliers.” Thus, wedeleted data from both participantsand recalculated the reliability valuesfor the TUG. We found slight varia-tions for the ICC (which changedfrom .80 to .78), the MDC (whichchanged from 3.5 seconds to 3.4 sec-onds), and the MDC% (whichchanged from 29.8 to 29.6). ThePearson r (which changed from .54to .34) was greater than .3, indicat-ing that the heteroscedasticity stillexisted. Although these 2 partici-pants took longer than 20 secondsto perform this measure in the retestassessment, their performance didnot substantially influence the results.
To determine whether a change istrue, in addition to the measurementerror, one must consider fluctuationsin the conditions of patients withPD resulting from the concentra-tions of anti-PD medications. Inother words, to compare the perfor-mance of a patient with PD between2 successive sessions, one must ac-curately arrange a consistent intervalbetween medication ingestion andmeasure implementation.
In the present study, we estimatedthe MDCs of the TUG and the DGI,representing the extent of randomerror and a threshold of statisticalsignificance. In clinical contexts,however, the MID,9 representing thedegree of change that is meaningfulto patients and relevant to clinicians,is equally critical for decision makingin treatment planning. To enhancethe applicability and interpretabilityof the TUG and the DGI, future in-vestigations to estimate the MIDs ofthese 2 measures are warranted.
Our sample was a convenience sam-ple, and our participants had mildto moderately severe PD (ie, Hoehn-Yahr stages I–III). In addition, weexcluded participants whose TUGscores exceeded 20 seconds in thefirst session because of safety con-cerns. These characteristics of thesample may reduce the generalizabil-ity of our findings. Moreover, theHoehn-Yahr scale provides only ageneral rating of the severity of PD.Using the Unified Parkinson DiseaseRating Scale to rate the severity ofdisability would be far more informa-tive. Future research with more pa-tients and a more even distributionof disability, from mild to severe (eg,including patients with TUG scoresof �20 seconds), may be needed tovalidate our findings.
ConclusionThe results of our research showedthat the DGI and the TUG have gen-erally acceptable random measure-
Assessment of Gait Measures in Parkinson Disease
120 f Physical Therapy Volume 91 Number 1 January 2011 by guest on December 18, 2012http://ptjournal.apta.org/Downloaded from

ment error and reliability in patientswith PD. These results should helpclinicians and researchers interpretchanges in gait and balance deficitsin patients with PD over time pre-cisely and confidently.
Ms Huang, Dr Hsieh, and Mr Lu providedconcept/idea/research design and writing.Ms Huang, Dr Wu, Dr Lin, and Mr Lu pro-vided data collection. Ms Huang and Mr Luprovided data analysis and project manage-ment. Dr Hsieh provided fund procurement.Dr Wu and Dr Tai provided participants. DrWu provided facilities/equipment and insti-tutional liaisons. Dr Hsieh and Dr Wu pro-vided consultation (including review ofmanuscript before submission). The authorsare grateful to all participants for theirparticipation.
This study was approved by the Medical Eth-ics Committee of National Taiwan UniversityHospital.
This work was supported by the NationalScience Council (NSC96-2628-B-002-034-MY3) in Taiwan.
This article was submitted April 15, 2009, andwas accepted August 13, 2010.
DOI: 10.2522/ptj.20090126
References1 Horak FB, Nutt JG, Nashner LM. Postural
inflexibility in parkinsonian subjects.J Neurol Sci. 1992;111:46–58.
2 Ashburn A, Stack E, Pickering RM, WardCD. A community-dwelling sample of peo-ple with Parkinson’s disease: characteris-tics of fallers and non-fallers. Age Ageing.2001;30:47–52.
3 Bloem BR, van Vugt JP, Beckley DJ. Pos-tural instability and falls in Parkinson’s dis-ease. Adv Neurol. 2001;87:209–223.
4 Smithson F, Morris ME, Iansek R. Perfor-mance on clinical tests of balance inParkinson’s disease. Phys Ther. 1998;78:577–592.
5 Hagiwara N, Hashimoto T, Ikeda S. Staticbalance impairment and its change afterpallidotomy in Parkinson’s disease. MovDisord. 2004;19:437–445.
6 Haley SM, Fragala-Pinkham MA. Interpret-ing change scores of tests and measuresused in physical therapy. Phys Ther. 2006;86:735–743.
7 Jette AM, Tao W, Norweg A, Haley S. In-terpreting rehabilitation outcome mea-surements. J Rehabil Med. 2007;39:585–590.
8 Stratford PW, Binkley JM, Riddle DL,Guyatt GH. Sensitivity to change of theRoland-Morris Back Pain Questionnaire:part 1. Phys Ther. 1998;78:1186–1196.
9 Schunemann HJ, Guyatt GH. Commentary:goodbye M(C)ID! Hello MID, where doyou come from? Health Serv Res. 2005;40:593–597.
10 Schreuders TA, Roebroeck ME, GoumansJ, et al. Measurement error in grip andpinch force measurements in patientswith hand injuries. Phys Ther. 2003;83:806–815.
11 Podsiadlo D, Richardson S. The Timed “Up& Go”: a test of basic functional mobilityfor frail elderly persons. J Am Geriatr Soc.1991;39:142–148.
12 Tinetti ME. Performance-oriented assess-ment of mobility problems in elderly pa-tients. J Am Geriatr Soc. 1986;34:119–126.
13 Dibble LE, Lange M. Predicting falls in in-dividuals with Parkinson disease: a recon-sideration of clinical balance measures.J Neurol Phys Ther. 2006;30:60–67.
14 Lim LI, van Wegen EE, de Goede CJ, et al.Measuring gait and gait-related activities inParkinson’s patients own home environ-ment: a reliability, responsiveness and fea-sibility study. Parkinsonism Relat Disord.2005;11:19–24.
15 Steffen T, Seney M. Test-retest reliabilityand minimal detectable change on balanceand ambulation tests, the 36-Item Short-Form Health Survey, and the Unified Par-kinson Disease Rating Scale in people withparkinsonism. Phys Ther. 2008;88:733–746.
16 Campbell CM, Rowse JL, Ciol MA,Shumway-Cook A. The effect of cognitivedemand on Timed Up and Go perfor-mance in older adults with and withoutParkinson disease. Neurol Rep. 2003;27:2–7.
17 Hoehn MM, Yahr MD. Parkinsonism: on-set, progression and mortality. Neurology.1967;17:427–442.
18 Shrout PE, Fleiss JL. Intraclass correlations:uses in assessing rater reliability. PsycholBull. 1979;86:420–428.
19 Prince B, Makrides L, Richman J. Researchmethodology and applied statistics, part 2:the literature search. Physiother Can.1980;32:201–206.
20 Flansbjer UB, Holmback AM, Downham D,et al. Reliability of gait performance testsin men and women with hemiparesis afterstroke. J Rehabil Med. 2005;37:75–82.
21 Smidt N, van der Windt DA, Assendelft WJ,et al. Interobserver reproducibility of theassessment of severity of complaints, gripstrength, and pressure pain threshold inpatients with lateral epicondylitis. ArchPhys Med Rehabil. 2002;83:1145–1150.
22 Bland JM, Altman DG. Statistical methodsfor assessing agreement between twomethods of clinical measurement. Lancet.1986;1:307–310.
23 Bland JM, Altman DG. Measuring agree-ment in method comparison studies. StatMethods Med Res. 1999;8:135–160.
24 Atkinson G, Nevill AM. Statistical methodsfor assessing measurement error (reliabil-ity) in variables relevant to sports medi-cine. Sports Med. 1998;26:217–238.
25 Hopkins WG. Measures of reliability insports medicine and science. Sports Med.2000;30:1–15.
26 Shumway-Cook A, Baldwin M, Polissar NL,Gruber W. Predicting the probability forfalls in community-dwelling older adults.Phys Ther. 1997;77:812–819.
27 Cakit BD, Saracoglu M, Genc H, et al. Theeffects of incremental speed-dependenttreadmill training on postural instabilityand fear of falling in Parkinson’s disease.Clin Rehabil. 2007;21:698–705.
28 de Vet HC, Bouter LM, Bezemer PD, Beur-skens AJ. Reproducibility and responsive-ness of evaluative outcome measures: the-oretical considerations illustrated by anempirical example. Int J Technol AssessHealth Care. 2001;17:479–487.
Assessment of Gait Measures in Parkinson Disease
January 2011 Volume 91 Number 1 Physical Therapy f 121 by guest on December 18, 2012http://ptjournal.apta.org/Downloaded from

doi: 10.2522/ptj.20090126Originally published online October 14, 2010
2011; 91:114-121.PHYS THER. Chun-Hwei Tai, Chin-Hsien Lin and Wen-Shian LuSheau-Ling Huang, Ching-Lin Hsieh, Ruey-Meei Wu,Parkinson DiseaseTest and the Dynamic Gait Index in People With Minimal Detectable Change of the Timed ''Up & Go''
References
http://ptjournal.apta.org/content/91/1/114#BIBLfor free at: This article cites 28 articles, 10 of which you can access
Information Subscription http://ptjournal.apta.org/subscriptions/
Permissions and Reprints http://ptjournal.apta.org/site/misc/terms.xhtml
Information for Authors http://ptjournal.apta.org/site/misc/ifora.xhtml
by guest on December 18, 2012http://ptjournal.apta.org/Downloaded from