Original Research Soil Grain-Size Characteristics of ...
12
Pol. J. Environ. Stud. Vol. 29, No. 5 (2020), 3703-3714 Original Research Soil Grain-Size Characteristics of Nitraria tangutorum Nebkhas with Different Degrees of Vegetation Coverage in a Desert-Oasis Ecotone Xiaoxi Liu 1, 3# , Yunhu Xie 2, 3# , Dandan Zhou 1 , Xiaojia Li 1 , Jing Ding 1, 3 , Xueqin Wu 1, 3 , Ji Wang 2 , Chunxing Hai 1* 1 Inner Mongolia Normal University, Hohhot, China 2 Inner Mongolia Agricultural University, Hohhot, China 3 Inner Mongolia Repair Engineering Laboratory of Wetland Eco-Environment System Received: 19 September 2019 Accepted: 26 December 2019 Abstract Wind erosion is an important part of environmental change research and represents a key destabilizing factor in arid and semi-arid ecosystems. The desert-oasis ecotone is an ecological barrier that protects oases from sandstorms. Nitraria tangutorum nebkhas help mitigate the impacts of wind erosion in desert-oasis ecotones. This study analyzed the relationship between vegetation coverage and soil grain size in a desert-oasis ecotone along the southeastern margin of the Tengger Desert. The results showed that the soil grain size distributions for nebkhas consisted primarily of fine, medium and very fine sand. The measured proportion of fine sand increased as vegetation coverage increased. The trailing edge of leeward slope and leading edge of windward slope positions contained higher proportions of coarse-grained material relative to other slope positions. Samples collected 0-5 cm depth contained higher proportions of fine-grained material than those collected at 5-10 cm depth. The average particle size ranges for nebkhas with low, medium, and high vegetation coverage were 1.644-2.430 φ, 1.601-2.911 φ, and 1.752-2.871 φ, respectively. Soil sorting degree was categorized as medium. Skewness values were extremely negative, negative, and positive respectively, and kurtosis levels were medium, narrow and medium, respectively. Samples collected from windward slope positions gave higher mean grain size values than those measured from samples collected along leeward slope and the top positions. Keywords: desert-oasis ecotone, grain-size distributions, vegetation coverage, nebkhas #Contributed equally to the work *e-mail: [email protected] DOI: 10.15244/pjoes/115866 ONLINE PUBLICATION DATE: 2020-04-10
Transcript of Original Research Soil Grain-Size Characteristics of ...
Pol. J. Environ. Stud. Vol. 29, No. 5 (2020), 3703-3714
Original Research
Soil Grain-Size Characteristics of Nitraria tangutorum Nebkhas with Different Degrees
of Vegetation Coverage in a Desert-Oasis Ecotone
Xiaoxi Liu1, 3#, Yunhu Xie2, 3#, Dandan Zhou1, Xiaojia Li1, Jing Ding1, 3, Xueqin Wu1, 3, Ji Wang2, Chunxing Hai1*
1Inner Mongolia Normal University, Hohhot, China2Inner Mongolia Agricultural University, Hohhot, China
3Inner Mongolia Repair Engineering Laboratory of Wetland Eco-Environment System
Received: 19 September 2019Accepted: 26 December 2019
Abstract
Wind erosion is an important part of environmental change research and represents a key destabilizing factor in arid and semi-arid ecosystems. The desert-oasis ecotone is an ecological barrier that protects oases from sandstorms. Nitraria tangutorum nebkhas help mitigate the impacts of wind erosion in desert-oasis ecotones. This study analyzed the relationship between vegetation coverage and soil grain size in a desert-oasis ecotone along the southeastern margin of the Tengger Desert. The results showed that the soil grain size distributions for nebkhas consisted primarily of fine, medium and very fine sand. The measured proportion of fine sand increased as vegetation coverage increased. The trailing edge of leeward slope and leading edge of windward slope positions contained higher proportions of coarse-grained material relative to other slope positions. Samples collected 0-5 cm depth contained higher proportions of fine-grained material than those collected at 5-10 cm depth. The average particle size ranges for nebkhas with low, medium, and high vegetation coverage were 1.644-2.430 φ, 1.601-2.911 φ, and 1.752-2.871 φ, respectively. Soil sorting degree was categorized as medium. Skewness values were extremely negative, negative, and positive respectively, and kurtosis levels were medium, narrow and medium, respectively. Samples collected from windward slope positions gave higher mean grain size values than those measured from samples collected along leeward slope and the top positions.
Keywords: desert-oasis ecotone, grain-size distributions, vegetation coverage, nebkhas
#Contributed equally to the work*e-mail: [email protected]
DOI: 10.15244/pjoes/115866 ONLINE PUBLICATION DATE: 2020-04-10
Liu X., et al.3704
Introduction
Aeolian processes are primary drivers of regional desertification and deterioration of arid environments [1-2]. These can severely restrict sustainable development of social and economic systems. Nebkhas form in arid, semi-arid, and semi-humid deserts due to sediment accumulation and the development of vegetation under the influence of aeolian processes. Nebkhas are a common aeolian biogeomorphological feature in agro-pastoral ecotones, desert steppes, along desert margins and in other types of arid environments. Nebkhas play an important role in stabilizing desert-oasis ecotones [3-5]. Nitraria tangutorum is a super-xerophyte plant tolerant of sandy, saline, and alkaline conditions. N. tangutorum (henceforth Nitraria) is also a relatively adaptive and effective vegetation type for sand fixation and restoration of sandy areas [6]. In recent years however, Nitraria nebkhas have gradually declined due to both natural and human factors. This turn of events threatens entire desert oasis areas [7-8]. At present, most research regarding this matter has focused on the formation succession, shape, and size of nebkhas [9-11]. Previous research has also considered transport processes and sand flow characteristics [12-14]. Other research has interpreted the influence of grain-size characteristics on vegetation through the lens of changing environmental conditions [15-18]. Nebkhas represent a specific form of sand dune and play an important role in stabilizing fragile arid and semi-arid ecosystems. Nebkha characteristics (vegetation
coverage, morphology, and development stage) can inform understanding of soil and wind erosion [19-20]. Sun and Anna [21-22] describe ways in which sand transport and deposition depend on the degree of local vegetation coverage. These researchers interpret Nitraria nebkhas as comprehensive wind-resistant and sand-fixing structures. Further study of nebkhas can establish basic geomorphological characteristics of these features and inform intervention strategies for stabilizing arid, aeolian-influenced environments.
Soil grain size distributions can record the intensity of aeolian transport processes as well as water and soil nutrient dynamics. Sediment characteristics can also reflect the efficacy of vegetation in sand control [22-24]. Traditional grain size analysis methods interpret average grain size and particle composition along with parameters of standard deviation, skewness, and kurtosis. Studies typically compare cumulative distribution patterns [25-26] in interpreting soil grain size. Nebkhas are typically dominated by fine-grained sand particles. The content of silt and coarse sand found in interdune areas typically exceeds that found along slope areas. From the base of windward slope to the top of nebkhas, average grain size shifts from coarse to fine as do skewness values [11, 26-27]. Soil grain size characteristics are a consistently used parameter for interpreting soil physical properties and other aspects of environmental change, including desertification [26].
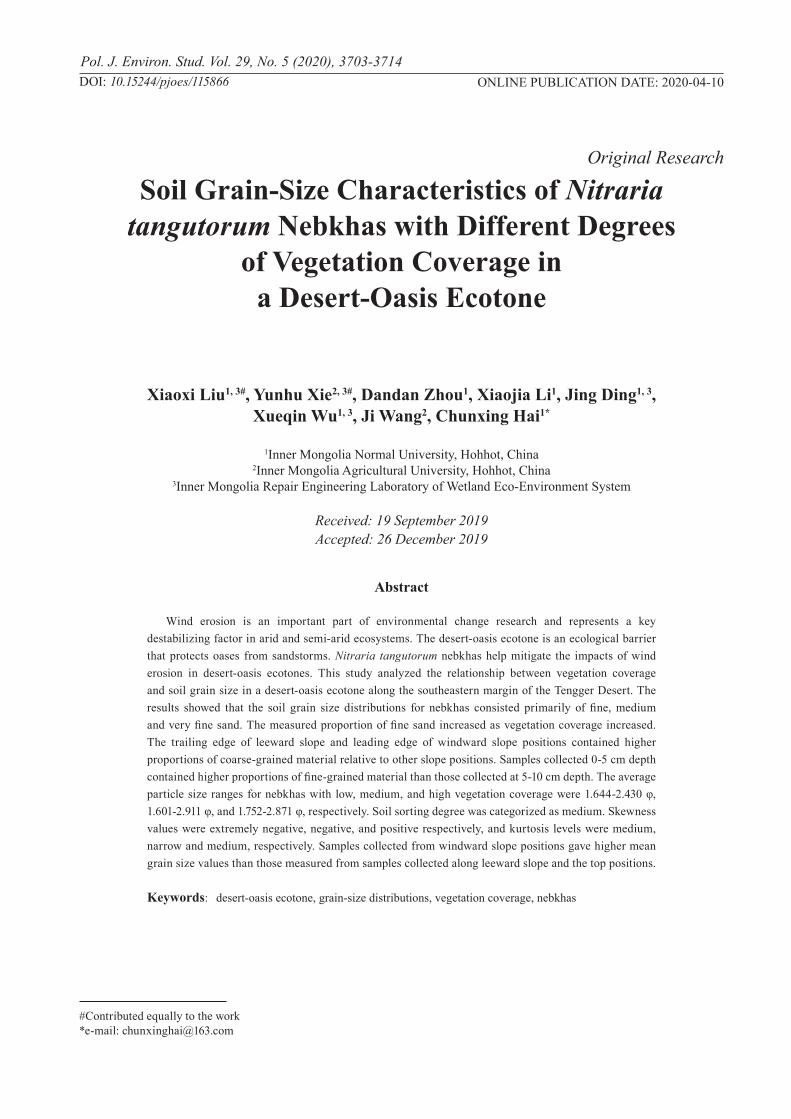
As one of the four major deserts in China, the Tengger exhibits trends of continuous expansion.
Fig. 1. Location of the study area.
Soil Grain-Size Characteristics of Nitraria tangutorum... 3705
Desertification along marginal areas is intensifying and thus poses a serious threat to communities and the environment. Preserving desert-oasis ecotones and slowing down desertification has become an urgent scientific problem [29]. Much research on Nitraria nebkhas has taken place in areas surrounding the Tengger. Very little research has considered how sediment grain size and wind erosion affect Nitraria nebkhas. Given how soil degradation can impact agricultural production and life, this research considers stabilizing factors for Nitraria nebkhas found along the southeastern margin of the Tengger. Three types of Nitraria nebkhas were analyzed in order to (1) identify patterns in soil grain size distributions among the three different types of nebkhas associated with sand transport effects and (2) compare soil grain-size distributions at different positions and depths potentially associated with sand flow patterns under different coverage scenarios. This study further aimed to inform soil and water conservation efforts in desert-oasis ecotones in China and other regions as well.
Material and Methods
Site Description
The study area is located in the Alxa Left Banner (Fig. 1), Inner Mongolia, on the southeastern margin of the Tengger Desert. It is categorized as a temperate arid desert climate type with obvious seasonal changes in temperature. January is the coldest month with a monthly average low temperature of -7.7ºC. July is the
hottest month with a monthly average temperature of 27.4ºC. The air is relatively dry, with maximum average relative humidity in October and minimum average relative humidity in April [14, 29]. Average annual precipitation is 180.2 mm, 80% of which occurs from May to September. The annual average evaporation is 2900 mm and the water table lies below 80 m – a depth that cannot be accessed by plants [30]. Soil in this area is dominated by aeolian sandy soil hosting limited vegetation. The dominant plant species are Ammopiptanthus mongolicus, Zygophyllum xanthoxylon, Caragana korshinskii, Artemisia ordosica, Nitraria tangutorum, Artemisia frigida, Cleistogenes songorica, and Convolvulus tragacanthoides [31].
Date Acquisition
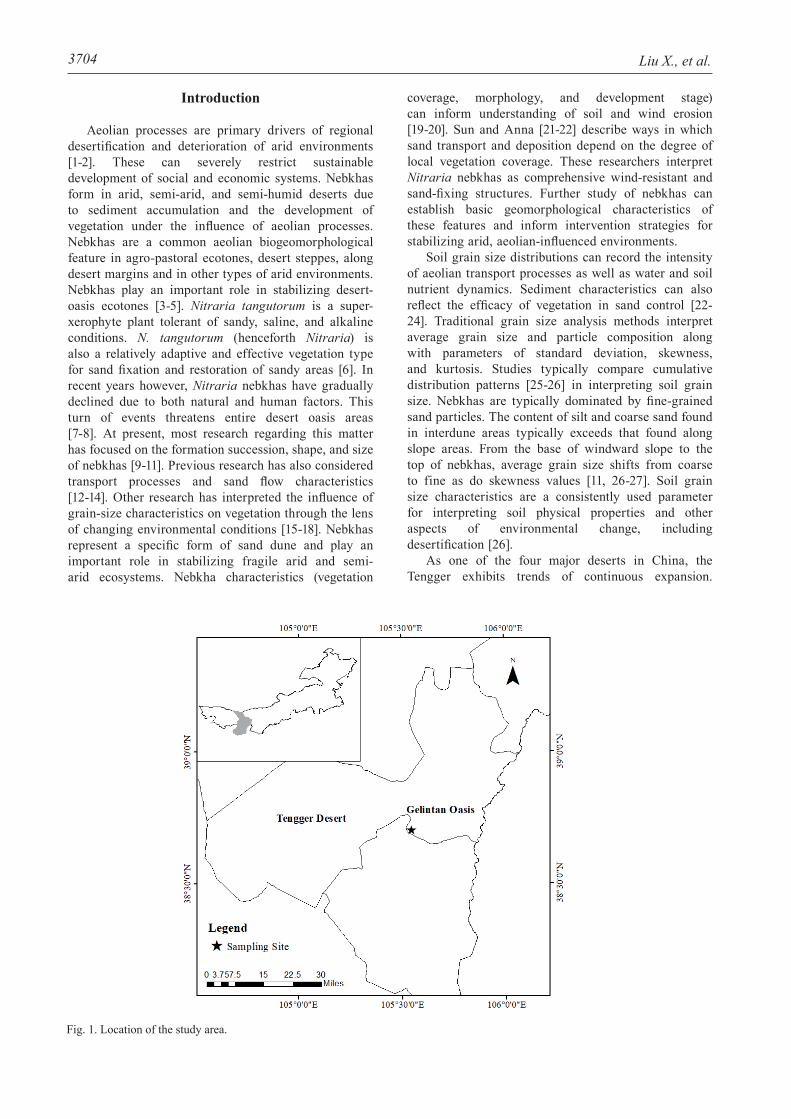
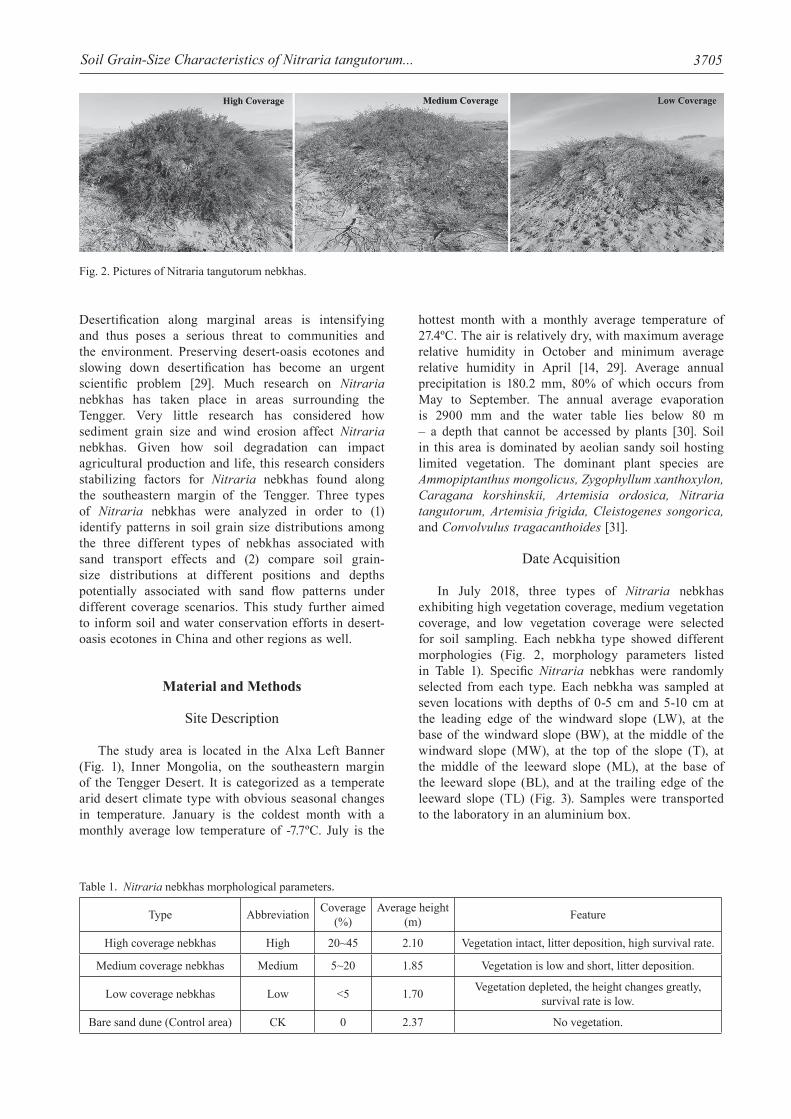
In July 2018, three types of Nitraria nebkhas exhibiting high vegetation coverage, medium vegetation coverage, and low vegetation coverage were selected for soil sampling. Each nebkha type showed different morphologies (Fig. 2, morphology parameters listed in Table 1). Specific Nitraria nebkhas were randomly selected from each type. Each nebkha was sampled at seven locations with depths of 0-5 cm and 5-10 cm at the leading edge of the windward slope (LW), at the base of the windward slope (BW), at the middle of the windward slope (MW), at the top of the slope (T), at the middle of the leeward slope (ML), at the base of the leeward slope (BL), and at the trailing edge of the leeward slope (TL) (Fig. 3). Samples were transported to the laboratory in an aluminium box.
Fig. 2. Pictures of Nitraria tangutorum nebkhas.
Type Abbreviation Coverage (%)
Average height (m) Feature
High coverage nebkhas High 20~45 2.10 Vegetation intact, litter deposition, high survival rate.
Medium coverage nebkhas Medium 5~20 1.85 Vegetation is low and short, litter deposition.
Low coverage nebkhas Low <5 1.70 Vegetation depleted, the height changes greatly, survival rate is low.
Bare sand dune (Control area) CK 0 2.37 No vegetation.
Table 1. Nitraria nebkhas morphological parameters.
Liu X., et al.3706
Data Processing
Samples were subjected to pre-acid pretreatment and analyzed with a Mastersizer 3000 laser diffraction particle size analyzer (Malvern, UK). The particle size test range was 0.01-3500 μm [32]. According to USAD soil texture classification standards, the soil particle sizes were classified as gravel (>2000 μm), very coarse sand (1000-2000 μm), coarse sand (500-1000 μm), medium sand (250-500 μm), fine sand (100-250 μm), very fine sand (50-100 μm), silt (2-50 μm), and clay (<2 μm). These categories were used to calculate grain size parameters [33].
According to the Udden-Wenworth [34-36] particle size standard and Kumdein's algorithm for logarithmic transformation, the particle diameter corresponding to the cumulative volume fraction of various soil particle sizes derived from the particle size analyzer was converted into a logarithmic value (Ф):
D-log2=φ (1)
… where D is particle diameter (mm).The particle size parameters were calculated
according to the Folk-Ward graphical method [34] using mean grain size (MZ), sorting coefficient (S), skewness (SK), and kurtosis (KG).
Mean Grain Size Calculation
The mean grain size (MZ) represents the average distribution of the particle size of the soil:
(2)
Sorting Coefficient Calculation
Sorting coefficient (or standard deviation) represents the degree of dispersion in soil particle distribution:
(3)
The smaller the standard deviation, the smaller the dispersion of soil particles, the more concentrated the distribution, and the better the sorting. Calculations based on standard deviations are generally divided into seven categories (Table 2).
Skewness Coefficient Calculation
The skewness coefficient (SK) indicates the symmetry of the soil particle size frequency curve. It is estimated as follows:
(4)
The skewness coefficient reflects the distribution characteristics of soil particle size. Based on calculation results, it is divided into five levels (Table 3).
Kurtosis Coefficient Calculation
The kurtosis coefficient (KG) is the concentration degree of soil particle size distribution on both sides of
Fig. 3. Schematic diagram of slope positions of sampling point.
S<0.35 0.35<S≤0.50 0.50<S≤0.71 0.71<S≤1.00 1.00<S≤2.00 2.00<S≤4.00 S>4.00
Excellent Very good Good Medium Bad Very bad Extremely bad
Table 2. Sorting grade classification.
Soil Grain-Size Characteristics of Nitraria tangutorum... 3707
the average particle size. The calculation formula is as follows:
(5)
The kurtosis coefficient is used to quantify the width and steepness of the peak shape of the soil particle frequency distribution curve. As such, it records the relative position of the average particle size and the median diameter. The smaller the KG value, the stronger the peak shape, indicating a concentrated particle size distribution. In general, it is divided into six levels (Table 4).
Results and Discussion
Analysis of Soil Grain-Size Characteristics Based on Nitraria Coverage
Characteristics of Soil Grain-Size Distributions for Nebkhas Having Different Degrees of Vegetative
Coverage
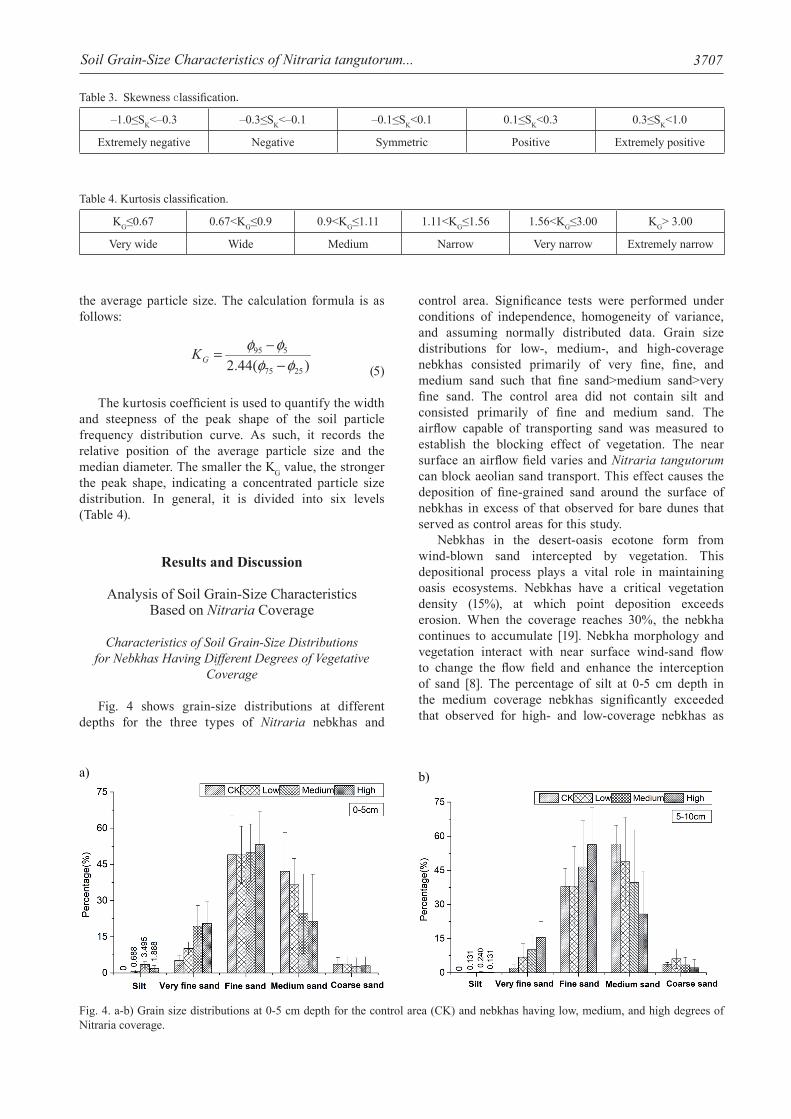
Fig. 4 shows grain-size distributions at different depths for the three types of Nitraria nebkhas and
control area. Significance tests were performed under conditions of independence, homogeneity of variance, and assuming normally distributed data. Grain size distributions for low-, medium-, and high-coverage nebkhas consisted primarily of very fine, fine, and medium sand such that fine sand>medium sand>very fine sand. The control area did not contain silt and consisted primarily of fine and medium sand. The airflow capable of transporting sand was measured to establish the blocking effect of vegetation. The near surface an airflow field varies and Nitraria tangutorum can block aeolian sand transport. This effect causes the deposition of fine-grained sand around the surface of nebkhas in excess of that observed for bare dunes that served as control areas for this study.
Nebkhas in the desert-oasis ecotone form from wind-blown sand intercepted by vegetation. This depositional process plays a vital role in maintaining oasis ecosystems. Nebkhas have a critical vegetation density (15%), at which point deposition exceeds erosion. When the coverage reaches 30%, the nebkha continues to accumulate [19]. Nebkha morphology and vegetation interact with near surface wind-sand flow to change the flow field and enhance the interception of sand [8]. The percentage of silt at 0-5 cm depth in the medium coverage nebkhas significantly exceeded that observed for high- and low-coverage nebkhas as
KG≤0.67 0.67<KG≤0.9 0.9<KG≤1.11 1.11<KG≤1.56 1.56<KG≤3.00 KG> 3.00
Very wide Wide Medium Narrow Very narrow Extremely narrow
Table 4. Kurtosis classification.
Fig. 4. a-b) Grain size distributions at 0-5 cm depth for the control area (CK) and nebkhas having low, medium, and high degrees of Nitraria coverage.
a) b)
–1.0≤SK<–0.3 –0.3≤SK<–0.1 –0.1≤SK<0.1 0.1≤SK<0.3 0.3≤SK<1.0
Extremely negative Negative Symmetric Positive Extremely positive
Table 3. Skewness classification.
Liu X., et al.3708
well as bare dunes. The differences between these were significant (P<0.05). Samples associated with greater vegetation coverage correlated to show higher percentages of very fine sand. High and medium coverage nebkhas also exhibited higher percentages of very fine sand (P<0.05). The percentage of very fine sand for the bare dune included a minimum value of 4.417%, which differed significantly from that for nebkhas (P<0.05). High-coverage nebkhas exhibited maximum observed percentages of fine sand (52.643%), which was significantly higher than that observed for the bare dune (P<0.05). The percentage of fine sand for the other three types was not significant (P<0.05). Sand percentages measured from the four plots increased with decreasing vegetation coverage, and the difference was significant (P<0.05). The percentage of coarse sand measured from the four plots was less than 5%. Sediment from 5-10 cm depth showed similar distributions to those measured from 0-5 cm depth. Percentages of silt, very fine sand, and fine sand at 0-5 cm depth, however, were significantly higher than that measured from 5-10 cm depth. The 5-10 cm soil layer also contained more medium and coarse sand than the 0-5 cm soil layer. Bare dunes and low-coverage nebkhas showed similar percentages of coarse sand (P<0.05). Otherwise, different nebkha types showed significant difference in particle size distributions (P<0.05).
Soil Grain Size Distributions for Nebkhas with Different Degrees of Vegetative Coverage
Particle size represents a critical physical property that informs soil classification. As shown in Table 5, commonly used grain size parameters include average particle size, sorting, skewness, and kurtosis [35]. The average grain size for the 0-5 cm layer of the control area was 1.970 φ, while the average grain size for the low coverage nebkhas was 2.101 φ. Average grain size was 2.409 φ for the medium-coverage nebkha and 2.471 φ for the high-coverage nebkha. The average grain size for the 5-10 cm layer was less than that for the 0-5 cm layer. Mean values for the control area, low-coverage, medium-coverage, and high-coverage nebkhas were 1.746 φ, 1.837 φ, 2.077 φ, and 2.335 φ, respectively. Average grain size data generally indicated that wind erosion leads to a decrease in the proportion of fine particles. Standard deviation for particle sizes measured at 0-5 cm depth for the three nebkha types exceeded that of control area. The sorting degree therefore was generally categorized as ‘medium’. The medium coverage nebkhas exhibited the largest (0.886) standard deviation and good sorting at 5-10 cm depth. Standard deviation increases gradually with greater vegetation coverage. The skewness grade measured for the control area and high-coverage nebkhas was negative and extremely negative for low-coverage nebkhas. For medium-coverage nebkhas, the skewness
a) b)
TypeMZ S SK KG
0-5 cm 5-1 0cm 0-5 cm 5-10 cm 0-5 cm 5-10 cm 0-5 cm 5-10 cm
CK 1.970 1.746 0.660 0.613 -0.276 -0.253 0.820 0.702
Low 2.100 1.837 0.777 0.664 -0.376 -0.399 1.127 0.821
Medium 2.408 2.064 0.886 0.668 0.113 -0.210 1.406 0.846
High 2.471 2.335 0.765 0.682 -0.269 -0.290 1.074 0.869
Table 5. Grain size parameters for the control area (CK) and nebkhas with low, medium, and high vegetative cover.
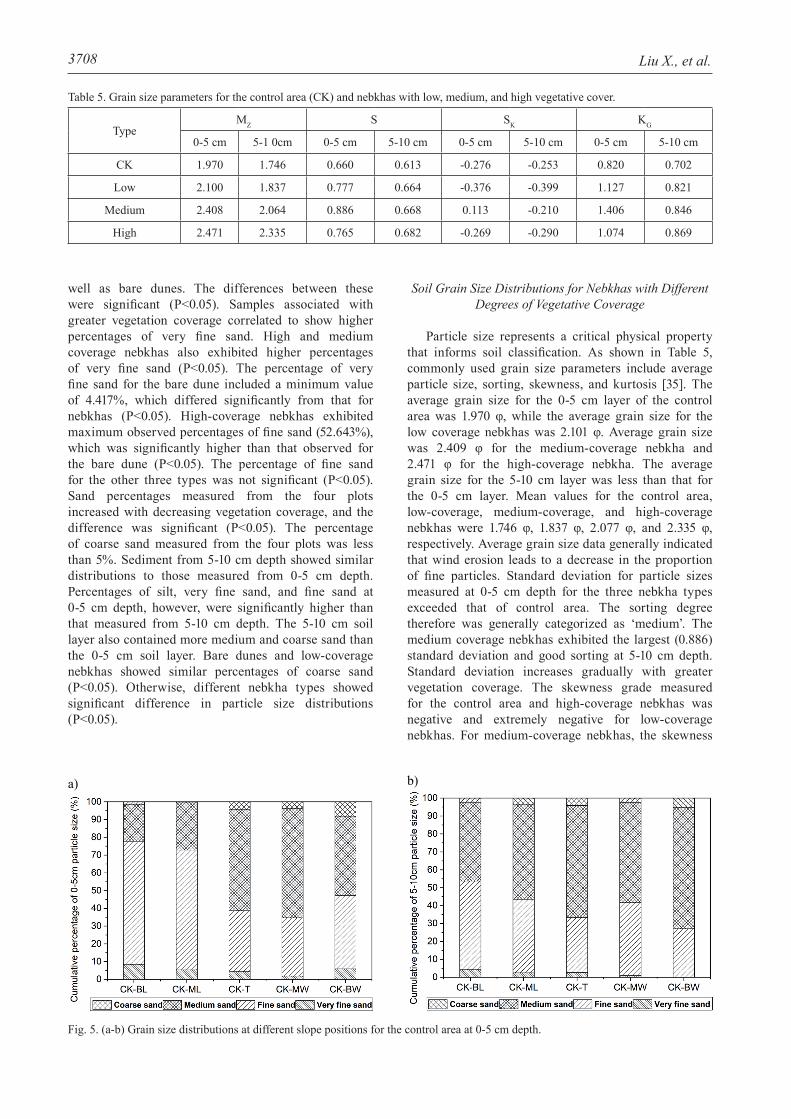
Fig. 5. (a-b) Grain size distributions at different slope positions for the control area at 0-5 cm depth.
Soil Grain-Size Characteristics of Nitraria tangutorum... 3709
grade was positive at 0-5 cm depth and negative at 5-10 cm depth. Control area samples gave wide kurtosis values and had the lowest peak value (0.820) of all areas analyzed. The kurtosis for low- and high-coverage nebkhas at 0-5 cm depth ranged from 0.9 and 1.11. The kurtosis for medium-coverage nebkhas was 1.406, categorized as narrow. The kurtosis estimated for samples at 5-10 cm depth was significantly less than that for the estimated 0-5 cm depth samples. These kurtosis grades were categorize as wide.
Interpretations hold that low-coverage nebkhas experience good wind-sand debris circulation condition. Dry surfaces, coupled with the lack of vegetative protection and high rates of soil evaporation, contribute to loosened soil and intensified wind erosion. This can enrich coarse-grained material in soil [26, 37]. High-coverage nebkhas represent more mature features with greater capacity for growth and resilience. These can withstand wind-sand flow, intercept fine particles, and thereby accumulate fine-grained materials [11].
Analysis of Soil Grain-Size Characteristics at Different Slope Positions Along Nebkhas
Soil Particle-Size Composition at Different Slope Positions
During nebkha development, wind speed and sediment dynamics depend on interaction with vegetation. This in turn can result in different sediment types at different nebkha slope positions [35]. Analysis of particle-size distributions around bare dunes for different slope positions (Fig. 5) indicated that leeward slopes hosted greater percentages of fine sand and windward slopes hosted greater percentages of coarse sand. Fine sand gradually decreased, and the percentage of medium sand increased from the foot of the slope to the top of the slope at 0-5 cm depth. The windward slope
and the top of the slope exhibited significantly higher proportions of medium sand than the leeward slope. From leeward slope to windward slope at 5-10 cm, the percentage of very fine sand and fine sand decreased. At the base of the windward slope, the percentage of fine sand was only 0.02%, but the percentage of medium and coarse sand increased.
Relative to other slope positions, the composition of particle sizes other than silt was significantly different along the trailing edge of the leeward slope and the leading edge of windward slope for the nebkhas (P<0.05). Proportions of silt, very fine, and fine sand decreased, while proportions of medium and coarse sand increased. Particle compositions were symmetrically distributed at the leading edge of windward slopes and the trailing edge of leeward slopes (P<0.05). Grain size proportions ranked as medium sand>fine sand>coarse sand>very fine sand>silt. Silt and very fine sand proportions at 0-5 cm depth were significantly higher than those measured at 5-10 cm depth (Figs 6-8). Nitraria nebkhas typically form thin and brittle crusts that allow fine particles to accumulate as part of these fixed surfaces. Material carried by wind-sand flow gradually re-erodes nebkhas and interdune areas, contributing to differences in soil particle-size composition between these two zones [38]. Re-mobilization of some fine-grained materials from the 0-5 cm layer contribute to greater silt proportion than that observed at 5-10 cm depths in interdune areas [38].
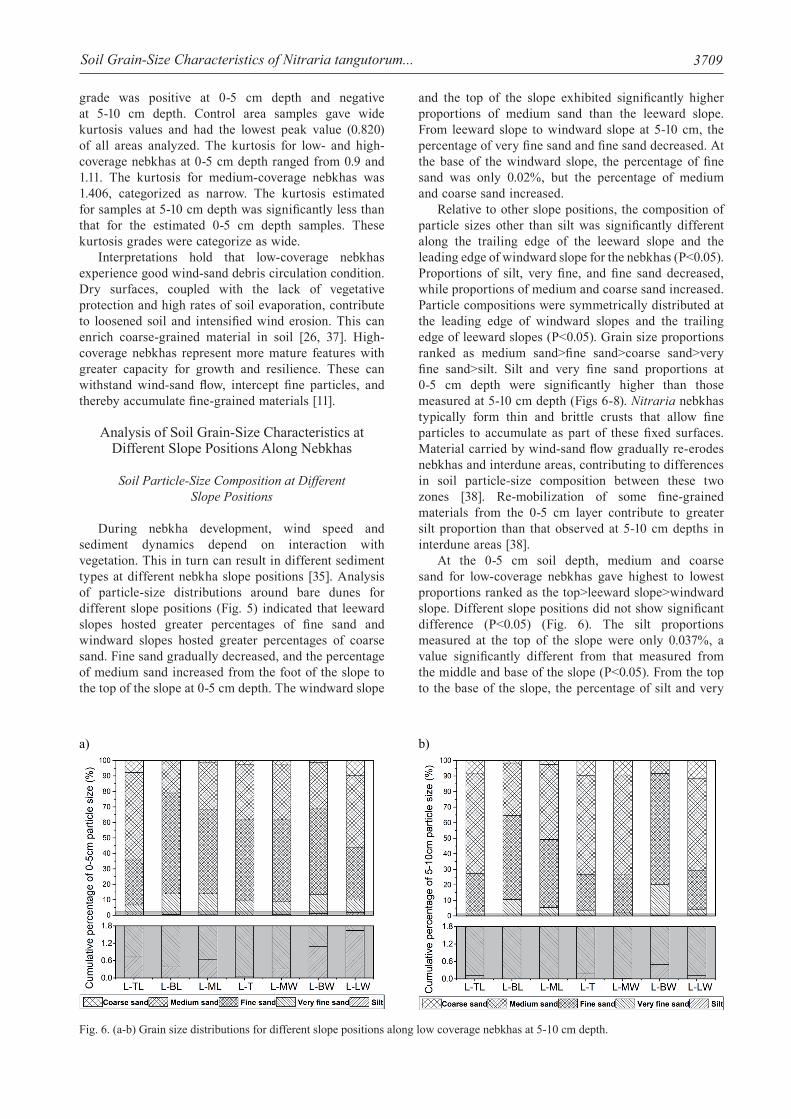
At the 0-5 cm soil depth, medium and coarse sand for low-coverage nebkhas gave highest to lowest proportions ranked as the top>leeward slope>windward slope. Different slope positions did not show significant difference (P<0.05) (Fig. 6). The silt proportions measured at the top of the slope were only 0.037%, a value significantly different from that measured from the middle and base of the slope (P<0.05). From the top to the base of the slope, the percentage of silt and very
Fig. 6. (a-b) Grain size distributions for different slope positions along low coverage nebkhas at 5-10 cm depth.
a) b)
Liu X., et al.3710
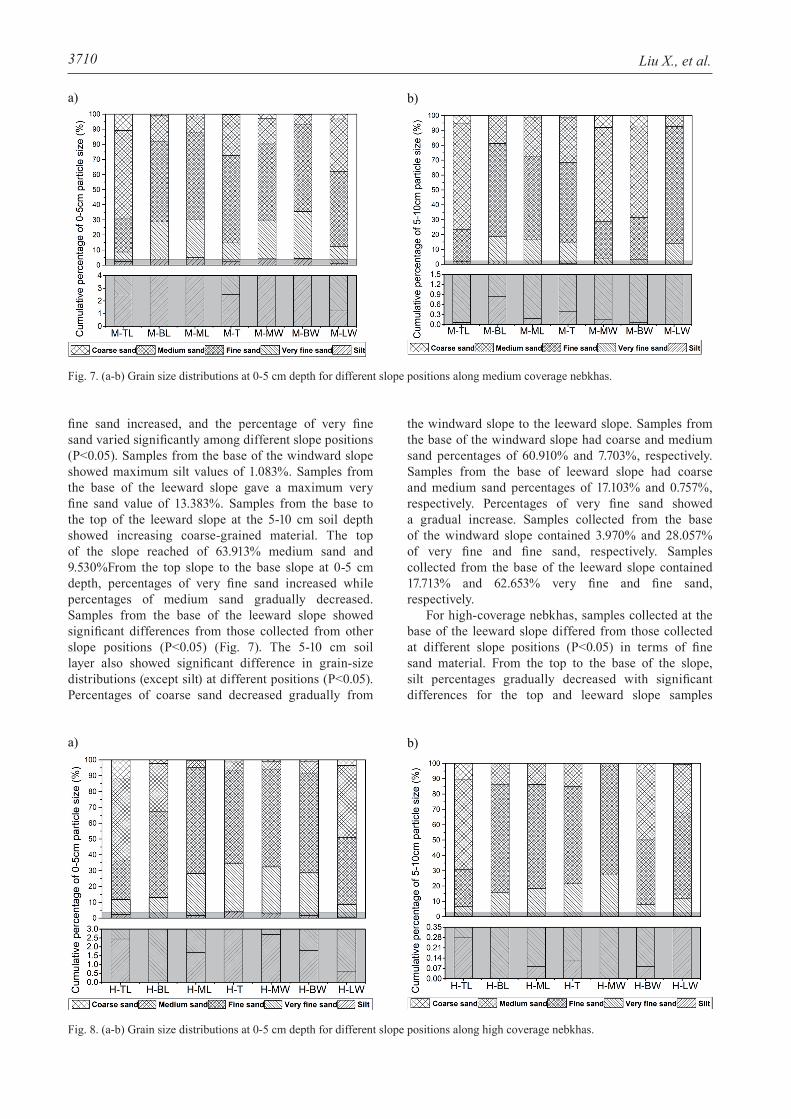
fine sand increased, and the percentage of very fine sand varied significantly among different slope positions (P<0.05). Samples from the base of the windward slope showed maximum silt values of 1.083%. Samples from the base of the leeward slope gave a maximum very fine sand value of 13.383%. Samples from the base to the top of the leeward slope at the 5-10 cm soil depth showed increasing coarse-grained material. The top of the slope reached of 63.913% medium sand and 9.530%From the top slope to the base slope at 0-5 cm depth, percentages of very fine sand increased while percentages of medium sand gradually decreased. Samples from the base of the leeward slope showed significant differences from those collected from other slope positions (P<0.05) (Fig. 7). The 5-10 cm soil layer also showed significant difference in grain-size distributions (except silt) at different positions (P<0.05). Percentages of coarse sand decreased gradually from
the windward slope to the leeward slope. Samples from the base of the windward slope had coarse and medium sand percentages of 60.910% and 7.703%, respectively. Samples from the base of leeward slope had coarse and medium sand percentages of 17.103% and 0.757%, respectively. Percentages of very fine sand showed a gradual increase. Samples collected from the base of the windward slope contained 3.970% and 28.057% of very fine and fine sand, respectively. Samples collected from the base of the leeward slope contained 17.713% and 62.653% very fine and fine sand, respectively.
For high-coverage nebkhas, samples collected at the base of the leeward slope differed from those collected at different slope positions (P<0.05) in terms of fine sand material. From the top to the base of the slope, silt percentages gradually decreased with significant differences for the top and leeward slope samples
Fig. 7. (a-b) Grain size distributions at 0-5 cm depth for different slope positions along medium coverage nebkhas.
Fig. 8. (a-b) Grain size distributions at 0-5 cm depth for different slope positions along high coverage nebkhas.
a) b)
a) b)
Soil Grain-Size Characteristics of Nitraria tangutorum... 3711
(P<0.05). Percentages of fine sand collected from the top slope exceeded those measured from the middle and base of the slope (P<0.05). Percentages of coarse and medium sand increased gradually, but samples from the top, middle, and base of the slope were not significant (P<0.05) (Fig. 8). The base of leeward slope and the middle of the windward slope did not contain silt at the 5-10 cm depth. Samples collected at the leading edge of the windward slope contained the highest silt percentages (0.353%). The middle and top of the slope did not contain coarse sand (P<0.05). Samples collected at the trailing edge of the leeward slope showed the highest percentages of coarse sand (10.757%). Samples collected from the trailing edge of the leeward slope and the base of the windward slope contained elevated sand percentages (relative to other samples; P<0.05) of 58.440% and 46.253%, respectively.
Surface wind erosion of nebkhas gradually weakens the base of the windward slope up to the top of the slope by removing coarse-grained material. Erosion weakens the leeward slope from the top to the base of slope and lowers the percentage of fine-grained material [37]. General atmospheric circulation patterns generate pronounced directional and seasonal patterns in winds affecting the southeastern margin of the Tengger Desert. These consist primarily of northwesterly, northeasterly, and southeasterly winds from regions peripheral to the desert. Northwesterly winds prevail in winter and northeasterly winds prevail in summer [39]. These
may generate the symmetrical grain-size distributions observed along different positions of the windward and leeward slopes for the three types of nebkhas.
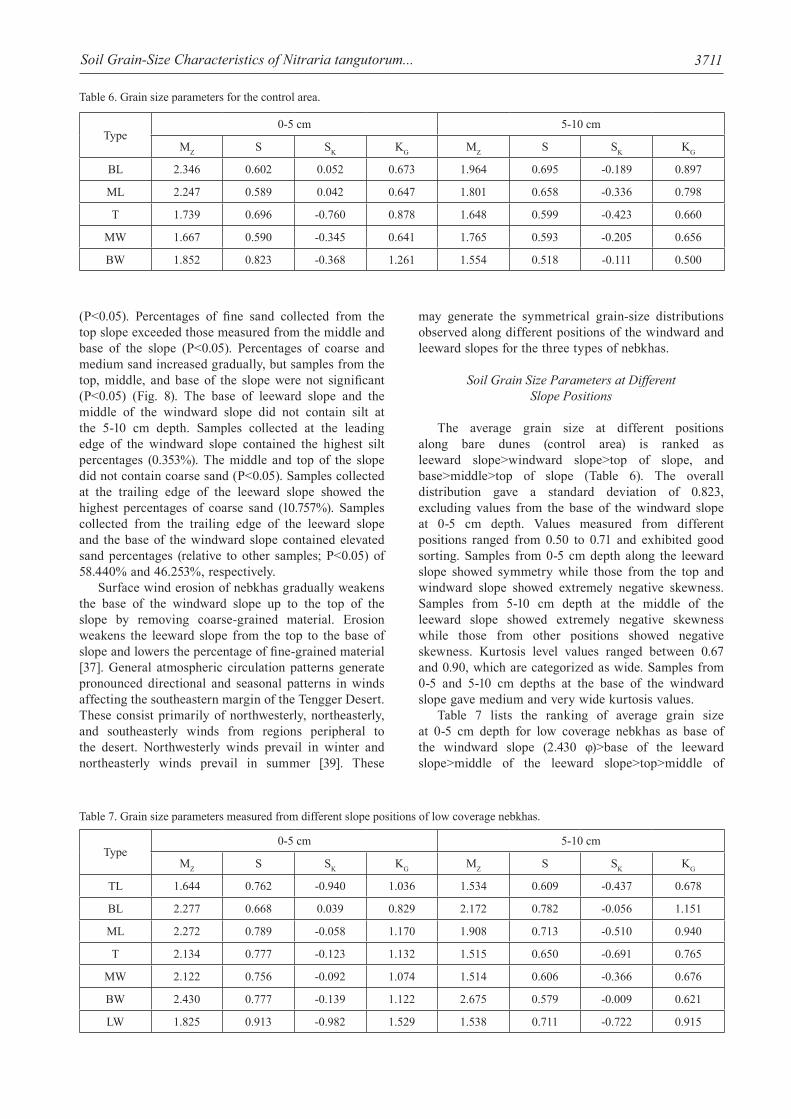
Soil Grain Size Parameters at Different Slope Positions
The average grain size at different positions along bare dunes (control area) is ranked as leeward slope>windward slope>top of slope, and base>middle>top of slope (Table 6). The overall distribution gave a standard deviation of 0.823, excluding values from the base of the windward slope at 0-5 cm depth. Values measured from different positions ranged from 0.50 to 0.71 and exhibited good sorting. Samples from 0-5 cm depth along the leeward slope showed symmetry while those from the top and windward slope showed extremely negative skewness. Samples from 5-10 cm depth at the middle of the leeward slope showed extremely negative skewness while those from other positions showed negative skewness. Kurtosis level values ranged between 0.67 and 0.90, which are categorized as wide. Samples from 0-5 and 5-10 cm depths at the base of the windward slope gave medium and very wide kurtosis values.
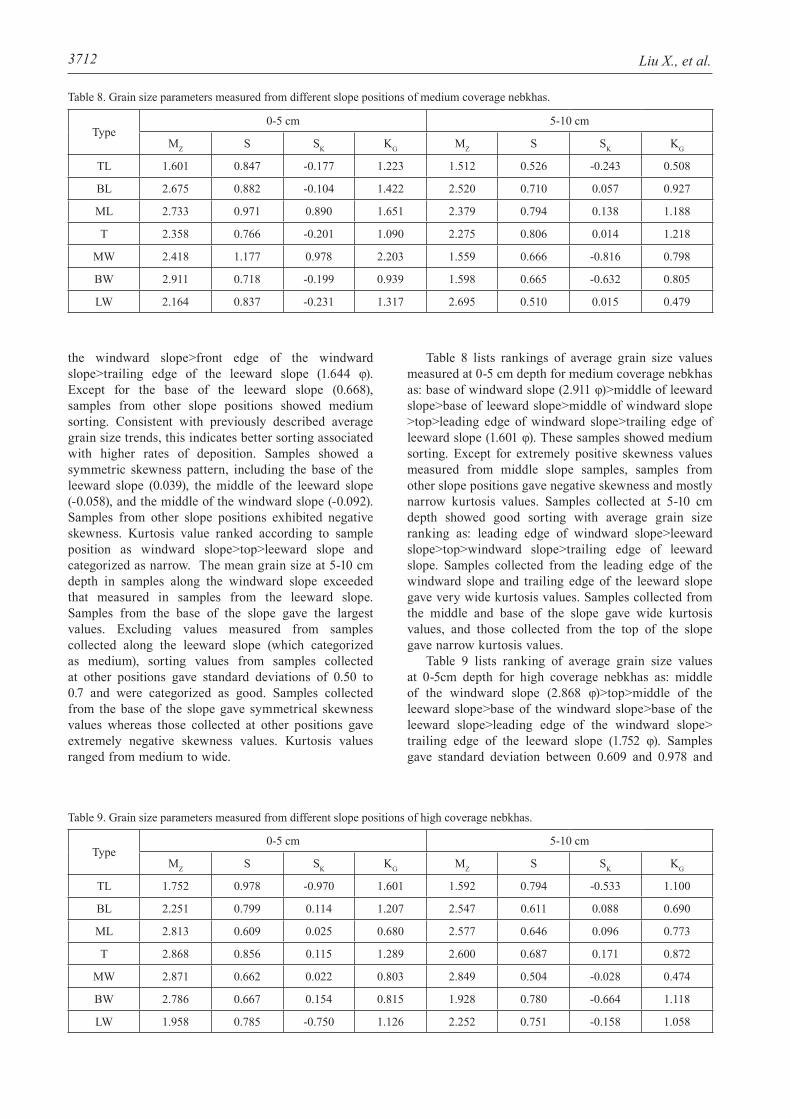
Table 7 lists the ranking of average grain size at 0-5 cm depth for low coverage nebkhas as base of the windward slope (2.430 φ)>base of the leeward slope>middle of the leeward slope>top>middle of
Type0-5 cm 5-10 cm
MZ S SK KG MZ S SK KG
BL 2.346 0.602 0.052 0.673 1.964 0.695 -0.189 0.897
ML 2.247 0.589 0.042 0.647 1.801 0.658 -0.336 0.798
T 1.739 0.696 -0.760 0.878 1.648 0.599 -0.423 0.660
MW 1.667 0.590 -0.345 0.641 1.765 0.593 -0.205 0.656
BW 1.852 0.823 -0.368 1.261 1.554 0.518 -0.111 0.500
Table 6. Grain size parameters for the control area.
Type0-5 cm 5-10 cm
MZ S SK KG MZ S SK KG
TL 1.644 0.762 -0.940 1.036 1.534 0.609 -0.437 0.678
BL 2.277 0.668 0.039 0.829 2.172 0.782 -0.056 1.151
ML 2.272 0.789 -0.058 1.170 1.908 0.713 -0.510 0.940
T 2.134 0.777 -0.123 1.132 1.515 0.650 -0.691 0.765
MW 2.122 0.756 -0.092 1.074 1.514 0.606 -0.366 0.676
BW 2.430 0.777 -0.139 1.122 2.675 0.579 -0.009 0.621
LW 1.825 0.913 -0.982 1.529 1.538 0.711 -0.722 0.915
Table 7. Grain size parameters measured from different slope positions of low coverage nebkhas.
Liu X., et al.3712
the windward slope>front edge of the windward slope>trailing edge of the leeward slope (1.644 φ). Except for the base of the leeward slope (0.668), samples from other slope positions showed medium sorting. Consistent with previously described average grain size trends, this indicates better sorting associated with higher rates of deposition. Samples showed a symmetric skewness pattern, including the base of the leeward slope (0.039), the middle of the leeward slope (-0.058), and the middle of the windward slope (-0.092). Samples from other slope positions exhibited negative skewness. Kurtosis value ranked according to sample position as windward slope>top>leeward slope and categorized as narrow. The mean grain size at 5-10 cm depth in samples along the windward slope exceeded that measured in samples from the leeward slope. Samples from the base of the slope gave the largest values. Excluding values measured from samples collected along the leeward slope (which categorized as medium), sorting values from samples collected at other positions gave standard deviations of 0.50 to 0.7 and were categorized as good. Samples collected from the base of the slope gave symmetrical skewness values whereas those collected at other positions gave extremely negative skewness values. Kurtosis values ranged from medium to wide.
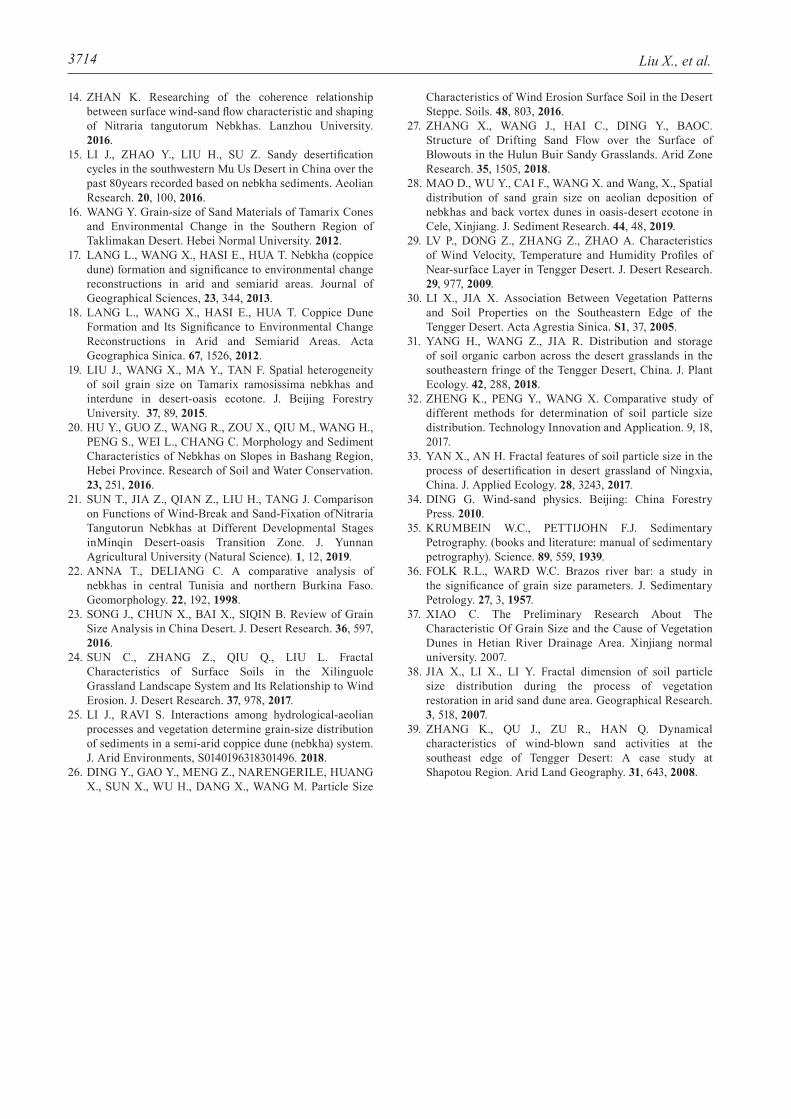
Table 8 lists rankings of average grain size values measured at 0-5 cm depth for medium coverage nebkhas as: base of windward slope (2.911 φ)>middle of leeward slope>base of leeward slope>middle of windward slope >top>leading edge of windward slope>trailing edge of leeward slope (1.601 φ). These samples showed medium sorting. Except for extremely positive skewness values measured from middle slope samples, samples from other slope positions gave negative skewness and mostly narrow kurtosis values. Samples collected at 5-10 cm depth showed good sorting with average grain size ranking as: leading edge of windward slope>leeward slope>top>windward slope>trailing edge of leeward slope. Samples collected from the leading edge of the windward slope and trailing edge of the leeward slope gave very wide kurtosis values. Samples collected from the middle and base of the slope gave wide kurtosis values, and those collected from the top of the slope gave narrow kurtosis values.
Table 9 lists ranking of average grain size values at 0-5cm depth for high coverage nebkhas as: middle of the windward slope (2.868 φ)>top>middle of the leeward slope>base of the windward slope>base of the leeward slope>leading edge of the windward slope> trailing edge of the leeward slope (1.752 φ). Samples gave standard deviation between 0.609 and 0.978 and
Type0-5 cm 5-10 cm
MZ S SK KG MZ S SK KG
TL 1.601 0.847 -0.177 1.223 1.512 0.526 -0.243 0.508
BL 2.675 0.882 -0.104 1.422 2.520 0.710 0.057 0.927
ML 2.733 0.971 0.890 1.651 2.379 0.794 0.138 1.188
T 2.358 0.766 -0.201 1.090 2.275 0.806 0.014 1.218
MW 2.418 1.177 0.978 2.203 1.559 0.666 -0.816 0.798
BW 2.911 0.718 -0.199 0.939 1.598 0.665 -0.632 0.805
LW 2.164 0.837 -0.231 1.317 2.695 0.510 0.015 0.479
Table 8. Grain size parameters measured from different slope positions of medium coverage nebkhas.
Type0-5 cm 5-10 cm
MZ S SK KG MZ S SK KG
TL 1.752 0.978 -0.970 1.601 1.592 0.794 -0.533 1.100
BL 2.251 0.799 0.114 1.207 2.547 0.611 0.088 0.690
ML 2.813 0.609 0.025 0.680 2.577 0.646 0.096 0.773
T 2.868 0.856 0.115 1.289 2.600 0.687 0.171 0.872
MW 2.871 0.662 0.022 0.803 2.849 0.504 -0.028 0.474
BW 2.786 0.667 0.154 0.815 1.928 0.780 -0.664 1.118
LW 1.958 0.785 -0.750 1.126 2.252 0.751 -0.158 1.058
Table 9. Grain size parameters measured from different slope positions of high coverage nebkhas.

Soil Grain-Size Characteristics of Nitraria tangutorum... 3713
moderate sorting values. Samples collected from the middle of the slope showed symmetrical skewness. Samples collected from the top and the base of the slope exhibited positive skewness. Samples collected from the leading edge of the windward slope and the trailing edge of the leeward slope gave extremely negative skewness and wide-to-narrow kurtosis values. Average grain size measured from 5-10 cm depth at different slope positions ranked as: top>leeward slope>windward slope>leading edge of the windward slope>trailing edge of the leeward slope. The sorting is medium. The middle of the windward slope gave very wide kurtosis values, and other positions exhibited between wide and medium. Grain size parameters showed considerable variation for different slope positions, indicating disturbance of the nebkhas surface.
Average grain size measured from windward slope positions of each type of nebkha exceeded values measured from leeward slope and top of slope. Similar previous studies have detected this pattern. Xiao et al. [16, 37] used wind tunnel tests to show that wind and sand flows through nebkhas generates a strong eddy current zone along the leeward slope. Vegetation can lift this eddy current along upper dune surfaces, resulting in interception of fine-grained particles along upper surfaces and leeward slopes of nebkhas.
Conclusions
Nitraria nebkhas found along the southeastern margin of the Tengger Desert consist primarily of very fine, fine, and medium sand. Nebkhas with greater vegetation coverage showed greater proportions of silt and very fine sand and lesser proportions of coarse and medium sand. Average grain size also increased with greater vegetation coverage, a state also associated with medium sediment sorting and low skewness grade. Medium- and high-coverage nebkhas exhibited extremely negative, negative, and positive skewness, and medium, narrow and medium kurtosis values, respectively.
Compared with other slopes, the contents of silt, very fine sand, and fine sand decreased in samples collected from the trailing edge of the leeward slope and the front edge of the windward slope for each type of nebkhas. Relative to samples collected at 5-10 cm depth, samples collected at 0-5 cm depth contained more fine-grained material. Samples collected from the top to the base of the slope showed increasing proportions of fine and very fine sand and decreasing proportions of medium and coarse sand. Samples collected from medium-coverage nebkhas showed decreasing proportions of very fine sand and gradually increasing proportions of coarse and medium sand. Average grain size of samples collected along the windward slope exceed those measured from samples collected along the leeward and the top of the slope. Samples collected at different positions around nebkhas with high coverage nebkhas showed the highest variation in grain size parameters.
Acknowledgements
This study was sponsored as a sub-project of the National Key Research and Development Program of China-Desertification Land Management and Sand Industry Technology Research and Development and Demonstration in Inner Mongolia Desertification Area, named Key Techniques and Demonstration of Sand Damage Control in Oasis and Saline-alkali Lake (2016YFC0501003).
Conflict of Interest
The authors declare no conflict of interest
References
1. WANG L., HU X., YU W., LI G., GUO J. Spatial heterogeneity of granule diameter and its relationwith shrub size and soil erosion. Arid Land Geography. 29, 688, 2006.
2. XIE Y., DANG X., MENG Z., JIANG H., LI X., ZHOU R., ZHOU D., LIU X., DING J., WU X., WANG Y., HAI C., WANG J. Wind and sand control by an oasis protective system: a case from the southeastern edge of the Tengger Desert, China. J. Mountain Science 16 (11), 2019. https://doi.org/10.1007/s11629-019-5486-8.
3. TENGBERG A., CHEN D. A comparative analysis of nebkhas in central Tunisia and northern Burkina Faso. Geomorphology. 22, 192, 1998.
4. WU S., LI Z., XIAO C., SUN Q., LIU L. Research Progress on Nabkhas and Research Significance. J. Desert Research. 26, 734, 2006.
5. SUN T., TANG J., HAN F., ZHANG J., GUO S., DUAN X., ZHANG Y., ZHANG J. Progress and Prospects of Desert Nebkhas Research in Arid Areas. Bulletin of Soil and Water Conservation. 36, 351, 2016.
6. JIA B., CI L., CAI T. Preliminary Research on Changing Soil Water Characters. Acta Phytoecologica Sininca. 26, 203-208, 2002.
7. NICKLING W.G., WOLFE S.A. The morphology and origin of Nabkhas, Region of Mopti, Mali, West Africa. J. Arid Environments. 28, 13, 1994.
8. ZOU X., LI J., ZHANG C., CHENG H., WU X., KANG L., WANG R. The protective effects of nebkhas on an oasis. Aeolian Research. 20, 71, 2016.
9. LI J., GAO J., ZOU X., KANG X The relationship between nebkha formation and development and desert environmental changes. Acta Ecologica Sinica. 34, 266, 2014.
10. GILLIES J.A., NIELD J.M., NICKLING W.G. Wind speed and sediment transport recovery in the lee of a vegetated and denuded nebkha within a nebkha dune field. Aeolian Research. 12, 135, 2014.
11. YUE X., HASI, ZHUANG Y., ZHANG J. Studies on Sandy Grassland Nebkhas – A Review. J. Desert Research. 5, 738, 2005.
12. HESP P.A., SMYTH T.A.G. Nebkha flow dynamics and shadow dune formation. Geomorphology. 282, 27, 2017.
13. ARDON K., TSOAR H., BLUMBERG D.G. Dynamics of nebkhas superimposed on a parabolic dune and their effect on the dune dynamics. J. Arid Environments. 73, 1022, 2009.
Liu X., et al.3714
14. ZHAN K. Researching of the coherence relationship between surface wind-sand flow characteristic and shaping of Nitraria tangutorum Nebkhas. Lanzhou University. 2016.
15. LI J., ZHAO Y., LIU H., SU Z. Sandy desertification cycles in the southwestern Mu Us Desert in China over the past 80years recorded based on nebkha sediments. Aeolian Research. 20, 100, 2016.
16. WANG Y. Grain-size of Sand Materials of Tamarix Cones and Environmental Change in the Southern Region of Taklimakan Desert. Hebei Normal University. 2012.
17. LANG L., WANG X., HASI E., HUA T. Nebkha (coppice dune) formation and significance to environmental change reconstructions in arid and semiarid areas. Journal of Geographical Sciences, 23, 344, 2013.
18. LANG L., WANG X., HASI E., HUA T. Coppice Dune Formation and Its Significance to Environmental Change Reconstructions in Arid and Semiarid Areas. Acta Geographica Sinica. 67, 1526, 2012.
19. LIU J., WANG X., MA Y., TAN F. Spatial heterogeneity of soil grain size on Tamarix ramosissima nebkhas and interdune in desert-oasis ecotone. J. Beijing Forestry University. 37, 89, 2015.
20. HU Y., GUO Z., WANG R., ZOU X., QIU M., WANG H., PENG S., WEI L., CHANG C. Morphology and Sediment Characteristics of Nebkhas on Slopes in Bashang Region, Hebei Province. Research of Soil and Water Conservation. 23, 251, 2016.
21. SUN T., JIA Z., QIAN Z., LIU H., TANG J. Comparison on Functions of Wind-Break and Sand-Fixation ofNitraria Tangutorun Nebkhas at Different Developmental Stages inMinqin Desert-oasis Transition Zone. J. Yunnan Agricultural University (Natural Science). 1, 12, 2019.
22. ANNA T., DELIANG C. A comparative analysis of nebkhas in central Tunisia and northern Burkina Faso. Geomorphology. 22, 192, 1998.
23. SONG J., CHUN X., BAI X., SIQIN B. Review of Grain Size Analysis in China Desert. J. Desert Research. 36, 597, 2016.
24. SUN C., ZHANG Z., QIU Q., LIU L. Fractal Characteristics of Surface Soils in the Xilinguole Grassland Landscape System and Its Relationship to Wind Erosion. J. Desert Research. 37, 978, 2017.
25. LI J., RAVI S. Interactions among hydrological-aeolian processes and vegetation determine grain-size distribution of sediments in a semi-arid coppice dune (nebkha) system. J. Arid Environments, S0140196318301496. 2018.
26. DING Y., GAO Y., MENG Z., NARENGERILE, HUANG X., SUN X., WU H., DANG X., WANG M. Particle Size
Characteristics of Wind Erosion Surface Soil in the Desert Steppe. Soils. 48, 803, 2016.
27. ZHANG X., WANG J., HAI C., DING Y., BAOC. Structure of Drifting Sand Flow over the Surface of Blowouts in the Hulun Buir Sandy Grasslands. Arid Zone Research. 35, 1505, 2018.
28. MAO D., WU Y., CAI F., WANG X. and Wang, X., Spatial distribution of sand grain size on aeolian deposition of nebkhas and back vortex dunes in oasis-desert ecotone in Cele, Xinjiang. J. Sediment Research. 44, 48, 2019.
29. LV P., DONG Z., ZHANG Z., ZHAO A. Characteristics of Wind Velocity, Temperature and Humidity Profiles of Near-surface Layer in Tengger Desert. J. Desert Research. 29, 977, 2009.
30. LI X., JIA X. Association Between Vegetation Patterns and Soil Properties on the Southeastern Edge of the Tengger Desert. Acta Agrestia Sinica. S1, 37, 2005.
31. YANG H., WANG Z., JIA R. Distribution and storage of soil organic carbon across the desert grasslands in the southeastern fringe of the Tengger Desert, China. J. Plant Ecology. 42, 288, 2018.
32. ZHENG K., PENG Y., WANG X. Comparative study of different methods for determination of soil particle size distribution. Technology Innovation and Application. 9, 18, 2017.
33. YAN X., AN H. Fractal features of soil particle size in the process of desertification in desert grassland of Ningxia, China. J. Applied Ecology. 28, 3243, 2017.
34. DING G. Wind-sand physics. Beijing: China Forestry Press. 2010.
35. KRUMBEIN W.C., PETTIJOHN F.J. Sedimentary Petrography. (books and literature: manual of sedimentary petrography). Science. 89, 559, 1939.
36. FOLK R.L., WARD W.C. Brazos river bar: a study in the significance of grain size parameters. J. Sedimentary Petrology. 27, 3, 1957.
37. XIAO C. The Preliminary Research About The Characteristic Of Grain Size and the Cause of Vegetation Dunes in Hetian River Drainage Area. Xinjiang normal university. 2007.
38. JIA X., LI X., LI Y. Fractal dimension of soil particle size distribution during the process of vegetation restoration in arid sand dune area. Geographical Research. 3, 518, 2007.
39. ZHANG K., QU J., ZU R., HAN Q. Dynamical characteristics of wind-blown sand activities at the southeast edge of Tengger Desert: A case study at Shapotou Region. Arid Land Geography. 31, 643, 2008.