Original Paper - Springer · geodetic Global Positioning System (GPS) receiver to determine the ......
14
Landslides (2014) 11:1–14 DOI 10.1007/s10346-012-0374-0 Received: 14 February 2012 Accepted: 26 November 2012 Published online: 28 December 2012 © The Author(s) 2012. This article is published with open access at Springerlink.com Giovanni Gigli I Stefano Morelli I Simone Fornera I Nicola Casagli Terrestrial laser scanner and geomechanical surveys for the rapid evaluation of rock fall susceptibility scenarios Abstract The primary objective of this paper is to present a semiautomatic procedure that, integrated with traditional meth- ods, can be useful for a rapid definition of rock fall susceptibility scenarios with the purpose of civil protection. Due to its morphol- ogy (steep slopes and narrow valleys), regional seismicity, and rock mass characteristics, the Nera Valley (Valnerina, Umbria Region, Italy) is characterized by high rock fall risk. With the aim of covering a wide range of features and investigating the main advantages and drawbacks of the proposed approach, data collection (terrestrial laser scanning (TLS) and geomechanical surveys) was carried out at three different slopes. Detailed three- dimensional (3D) models were created to reconstruct the shape and volume of the most unstable blocks, to define the position of the main rock fall source areas, and to precisely distinguish the outcropping materials and the position of the elements at risk for reliable runout analyses. The proposed approach can be useful in supporting proper maintenance and land management programs both in ordinary and in emergency circumstances. Keywords Rock mass . Landslide . Kinematic analysis . DiAna . Valnerina Introduction Rock fall is a common and widespread phenomenon that can affect long stretches of communication routes, entire villages, isolated dwellings, and other anthropic goods, where these ele- ments at risk are located on or near the base of steep rock slopes. Due to their unpredictability and high velocities, these events can cause casualties, even if the mobilized mass is very small (less than 1m 3 ) (Hungr et al. 1999). Rock fall risk is usually analyzed through performing two- dimensional (2D) (Azzoni et al. 1995; Pfeiffer and Bowen 1989; Pfeiffer et al. 1991; Piteau and Clayton 1976; Rocscience 2005) or three-dimensional (3D) (Agliardi and Crosta 2003; Crosta and Agliardi 2004; Descouedres and Zimmermann 1987; Dorren and Seijmonsbergen 2003; Guzzetti et al. 2002; Lan et al. 2007; Scioldo 1991) simulations, with the aim of evaluating runout distances, velocities (and associated kinetic energy), and bounce heights of falling blocks. Rock fall trajectory is controlled by local topography, the location of the source area, the mechanical properties of the outcropping materials (Ritchie 1963), and falling rocks and by their shape and mass (Giani 1992). However, these parameters are often difficult to evaluate and the most common approach is based on probabilistic analyses by statistically varying the input parameters that are characterized by the highest uncertainties (Azzoni et al. 1995; Giani et al. 2004; Hoek 2000). The proposed methodology aims at objectively, rapidly, and accurately defining the detailed topography of the slopes, the exact 3D position of the objects of interest (such as element at risk, possible existing protective measures, etc.), block shape and di- mension, and the main rock fall source areas (through a 3D kinematic analysis). A number of researchers have already dealt with some of these topics either from photogrammetric or LIDAR data (Abellan et al. 2006, 2010; Armesto et al. 2009; Bauer et al. 2006; Ferrero and Umili 2011; Ferrero et al. 2009, 2011; Lato and Vöge 2012; Mikos et al. 2005; Rosser et al. 2005; Strouth and Eberhardt 2005; Wickens and Barton 1971); however, in the authors' knowledge, this paper represents the first attempt to obtain all the necessary rock fall geometric input parameters through high-resolution laser scanning data processing, as explained in the flow chart of Fig. 1. The approach is composed of two main steps: in situ data collection and data processing (scenario definition). During the first phase, a terrestrial laser scanning (TLS) campaign and a traditional geomechanical survey were performed. All the acquired data are subsequently processed with the aim of creating high resolution 3D models, integrating traditional geo- mechanical surveys with TLS data, calculating the volume and shape of blocks involved in rock falls, performing kinematic anal- yses of the main mechanisms of instability affecting the rock walls, and reconstructing the trajectories followed by the blocks and their associated energy. The proposed procedure has been applied on three different test sites in order to be representative of the entire area under investigation. These are located in the central sector of Valnerina (Umbria Region, Italy) close to the Triponzo village (Fig. 2), where the Calcare Massiccio (massive limestone) and the Maiolica (micritic limestone) Formations outcrop. Investigated area Valnerina is a narrow and winding valley formed by the deepening of the Nera River. This valley is characterized by high rock fall risk because of its rough morphology, local seismic activity, and het- erogeneous rock mass fracturing. Rock falls abound near the Triponzo village; in September and October 1997, a seismic se- quence affected the investigated area (Amato et al. 1998; Carro et al. 2003; Marzorati et al. 2002) and many rock fall events seriously damaged the main roads (S.R. 209, S.R. 320) and the village itself (Guzzetti et al. 2004, 2009). All these features make the Valnerina a suitable place where the proposed procedure for the quick and complete definition of susceptibility scenarios associated with rock mass instability can be tested. Three different rock slopes with heights ranging from 150 to 350 m were analyzed (Fig. 2): the Calcare Massiccio outcrops located at Ponte di Nortosce (Fig. 3a) and Bagni di Triponzo (Fig. 3b) and the Maiolica subvertical rock wall close to the Triponzo village (Fig. 3c). The whole area is surrounded by rugged mountains which peaks reach an elevation of 1,300 m. Almost everywhere, the rock outcrops are characterized by steep slopes, vertical walls, and ledges. Landslides 11 & (2014) 1 Original Paper
Transcript of Original Paper - Springer · geodetic Global Positioning System (GPS) receiver to determine the ......

Landslides (2014) 11:1–14DOI 10.1007/s10346-012-0374-0Received: 14 February 2012Accepted: 26 November 2012Published online: 28 December 2012© The Author(s) 2012. This article ispublished with open access atSpringerlink.com
Giovanni Gigli I Stefano Morelli I Simone Fornera I Nicola Casagli
Terrestrial laser scanner and geomechanical surveysfor the rapid evaluation of rock fall susceptibilityscenarios
Abstract The primary objective of this paper is to present asemiautomatic procedure that, integrated with traditional meth-ods, can be useful for a rapid definition of rock fall susceptibilityscenarios with the purpose of civil protection. Due to its morphol-ogy (steep slopes and narrow valleys), regional seismicity, androck mass characteristics, the Nera Valley (Valnerina, UmbriaRegion, Italy) is characterized by high rock fall risk. With theaim of covering a wide range of features and investigating themain advantages and drawbacks of the proposed approach, datacollection (terrestrial laser scanning (TLS) and geomechanicalsurveys) was carried out at three different slopes. Detailed three-dimensional (3D) models were created to reconstruct the shapeand volume of the most unstable blocks, to define the position ofthe main rock fall source areas, and to precisely distinguish theoutcropping materials and the position of the elements at risk forreliable runout analyses. The proposed approach can be useful insupporting proper maintenance and land management programsboth in ordinary and in emergency circumstances.
Keywords Rockmass . Landslide . Kinematicanalysis . DiAna . Valnerina
IntroductionRock fall is a common and widespread phenomenon that canaffect long stretches of communication routes, entire villages,isolated dwellings, and other anthropic goods, where these ele-ments at risk are located on or near the base of steep rock slopes.Due to their unpredictability and high velocities, these events cancause casualties, even if the mobilized mass is very small (less than1 m3) (Hungr et al. 1999).
Rock fall risk is usually analyzed through performing two-dimensional (2D) (Azzoni et al. 1995; Pfeiffer and Bowen 1989;Pfeiffer et al. 1991; Piteau and Clayton 1976; Rocscience 2005) orthree-dimensional (3D) (Agliardi and Crosta 2003; Crosta andAgliardi 2004; Descouedres and Zimmermann 1987; Dorren andSeijmonsbergen 2003; Guzzetti et al. 2002; Lan et al. 2007; Scioldo1991) simulations, with the aim of evaluating runout distances,velocities (and associated kinetic energy), and bounce heights offalling blocks.
Rock fall trajectory is controlled by local topography, thelocation of the source area, the mechanical properties of theoutcropping materials (Ritchie 1963), and falling rocks and by theirshape and mass (Giani 1992). However, these parameters are oftendifficult to evaluate and the most common approach is based onprobabilistic analyses by statistically varying the input parametersthat are characterized by the highest uncertainties (Azzoni et al.1995; Giani et al. 2004; Hoek 2000).
The proposed methodology aims at objectively, rapidly, andaccurately defining the detailed topography of the slopes, the exact3D position of the objects of interest (such as element at risk,
possible existing protective measures, etc.), block shape and di-mension, and the main rock fall source areas (through a 3Dkinematic analysis). A number of researchers have already dealtwith some of these topics either from photogrammetric or LIDARdata (Abellan et al. 2006, 2010; Armesto et al. 2009; Bauer et al.2006; Ferrero and Umili 2011; Ferrero et al. 2009, 2011; Lato andVöge 2012; Mikos et al. 2005; Rosser et al. 2005; Strouth andEberhardt 2005; Wickens and Barton 1971); however, in theauthors' knowledge, this paper represents the first attempt toobtain all the necessary rock fall geometric input parametersthrough high-resolution laser scanning data processing, asexplained in the flow chart of Fig. 1.
The approach is composed of two main steps: in situ datacollection and data processing (scenario definition). During thefirst phase, a terrestrial laser scanning (TLS) campaign and atraditional geomechanical survey were performed.
All the acquired data are subsequently processed with the aimof creating high resolution 3D models, integrating traditional geo-mechanical surveys with TLS data, calculating the volume andshape of blocks involved in rock falls, performing kinematic anal-yses of the main mechanisms of instability affecting the rock walls,and reconstructing the trajectories followed by the blocks andtheir associated energy. The proposed procedure has been appliedon three different test sites in order to be representative of theentire area under investigation. These are located in the centralsector of Valnerina (Umbria Region, Italy) close to the Triponzovillage (Fig. 2), where the Calcare Massiccio (massive limestone)and the Maiolica (micritic limestone) Formations outcrop.
Investigated areaValnerina is a narrow and winding valley formed by the deepeningof the Nera River. This valley is characterized by high rock fall riskbecause of its rough morphology, local seismic activity, and het-erogeneous rock mass fracturing. Rock falls abound near theTriponzo village; in September and October 1997, a seismic se-quence affected the investigated area (Amato et al. 1998; Carro etal. 2003; Marzorati et al. 2002) and many rock fall events seriouslydamaged the main roads (S.R. 209, S.R. 320) and the village itself(Guzzetti et al. 2004, 2009). All these features make the Valnerina asuitable place where the proposed procedure for the quick andcomplete definition of susceptibility scenarios associated with rockmass instability can be tested.
Three different rock slopes with heights ranging from 150 to350 m were analyzed (Fig. 2): the Calcare Massiccio outcropslocated at Ponte di Nortosce (Fig. 3a) and Bagni di Triponzo(Fig. 3b) and the Maiolica subvertical rock wall close to theTriponzo village (Fig. 3c). The whole area is surrounded by ruggedmountains which peaks reach an elevation of 1,300 m. Almosteverywhere, the rock outcrops are characterized by steep slopes,vertical walls, and ledges.
Landslides 11 & (2014) 1
Original Paper

In this area, the structures of deformation are related to thetwo tertiary tectonic phases of the Umbria-Marche Apennines. Theoverall stratigraphy is typical of the Umbria-Marche region: thelower part (lower Lias) consists of massive limestones of thecarbonate platform (Calcare Massiccio) and the upper part iscomposed of stratified or thinly laminated formations, mainlymarly and cherty limestones, deposited in a pelagic environmentfrom the middle Lias to the Oligocene (Barchi et al. 1993). The
latter can be characterized by pelagic carbonate sequences(Corniola, Calcari Diasprini, Maiolica, and Scaglia Bianca), pelagicmarly-calcareous sequences (Rosso Ammonitico, Marne a Fucoidi,Scaglia Rossa, and Scaglia Cinerea), or marly-arenaceous turbiditicsequences (Bisciaro and Marnoso-Arenacea).
The local landforms are closely related to the nature of the rocktypes and to the structural setting (Guzzetti et al. 2004). In areaswhere limestones are characterized by high mechanical strengthoutcrop (e.g., Maiolica and Calcare Massiccio), the soil thickness ispoor or absent, the slopes are very steep (ranging from 40° to 90°),and the most common instability mechanism is rock fall. Most of thelandslide slip surfaces are located in areas dominated by calcareous-marly lithology, where the slopes are less steep even though thegradients are high (25°–40°). Here, the clayey elements constituteimpermeable barriers for the groundwater flow, so that the mechan-ical weakness, in conjunction with the permeability limits at struc-turally oriented surfaces, is a key factor in influencing the locationand the type of landslides (Barchi et al. 1993).
Data collectionThanks to its high accuracy, resolution, and quick data collection,the TLS technique is becoming more and more used in rock fallstudies (Abellan et al. 2006; Fanti et al. 2012; Gigli et al. 2012;Jaboyedoff et al. 2012; Lan et al. 2010; Lato et al. 2009, 2012;Lombardi et al. 2006; Rabatel et al. 2008; Tapete et al. 2012). Theselected case study is an excellent application for exploiting theadvantages of TLS, since it was impossible to directly reach therock outcrops of interest, with the exception of the lowest limit ofthe rock face close to the Triponzo village. In this site, the mainrock mass geomechanical properties were also collected usingtraditional survey methods in order to validate the results derivedfrom the TLS elaborations.
Laser scanning surveyThe laser scanning investigation was performed by means of a longrange 3D Terrestrial Laser Imaging Sensor (RIEGL LMS-Z420i de-vice), with an accuracy of 0.01 m (one σ at 50-m range under RIEGLtest conditions). The laser scanning output is an array of points, calleda point cloud, which is a set of vertices defined in a 3D coordinatesystem (x, y, z), able to reconstruct a highly detailed 3D environment.
With the aim of experimenting a rapid application of the pro-posed approach, TLS surveys were carried out from easily reachablepoints that, in Valnerina, are located along themain roads only (Figs. 2and 3). The objective of the TLS campaign was to build 3D surfacemodels of the whole slopes to be investigated (for the kinematicanalyses and rock fall simulations) and to reconstruct the geomechan-ical features of the rock masses (for the identification of the main rockfall source areas and the evaluation of the shape and volume of fallingblocks). To accomplish this dual objective, either raw point clouds orderived surfaces have been employed. For this reason, the angularresolution for each scan position (Table 1) has been selected bychoosing the best arrangement between the number of points (toavoid large and too heavy datasets) and the distance between contig-uous points on the rock slopes, whichmust be related to theminimumdimension of the features to be extracted (i.e., discontinuity surfaces,anthropic structures, and Digital Elevation Model (DEM) resolution).
Due to the roughness of the slopes and to the scan positionconstraints, with the aim of limiting the shadow areas as much as
Fig. 2 Location map of the investigated sites (white circles). Triangles indicateTLS observation points
Terrestrial LaserScanning Survey
1m DEM
GeomechanicalAnalysis
BlockDimension
KinematicAnalysis
3D Rock FallSimulations
2D Rock FallSimulations
HR Point cloud
3D surface
Fig. 1 Logic scheme of the proposed procedure: the geometric input parametersare all obtained through TLS data processing
Original Paper
Landslides 11 & (2014)2

possible, each slope has been investigated from different observationpoints. A total of seven scan positions have been performed to coverall the investigated sites, and more than 70 million points werecollected. The angular resolution, the mean rock face distance, themean point–point distance, and the number of acquired points foreach scan position are also reported in Table 1.
The resulting point clouds were subsequently aligned by using ageodetic Global Positioning System (GPS) receiver to determine theposition of a number of tie points physically represented by cylindricalreflectors (Morelli et al. 2012). This operation is always needed forcorrectly georeferencing the point cloud on a chosen reference systemand to merge two or more scans of the same object realized fromdifferent points of view; the standard deviation of the correspondingtie points is reported in Table 1. Finally, all the point clouds were giventheir true colors acquired by a high resolution digital camera installedover the instrument (Fig. 4).
Traditional geomechanical surveyThe traditional quantitative description of discontinuities was exe-cuted by using methods proposed by the International Society forRock Mechanics (1978), which include a methodological analysis
based on a scanline survey. This survey was carried out for validationpurposes on the sole easily accessible rock mass exposure, locatedclose to the Triponzo village (Fig. 3c).
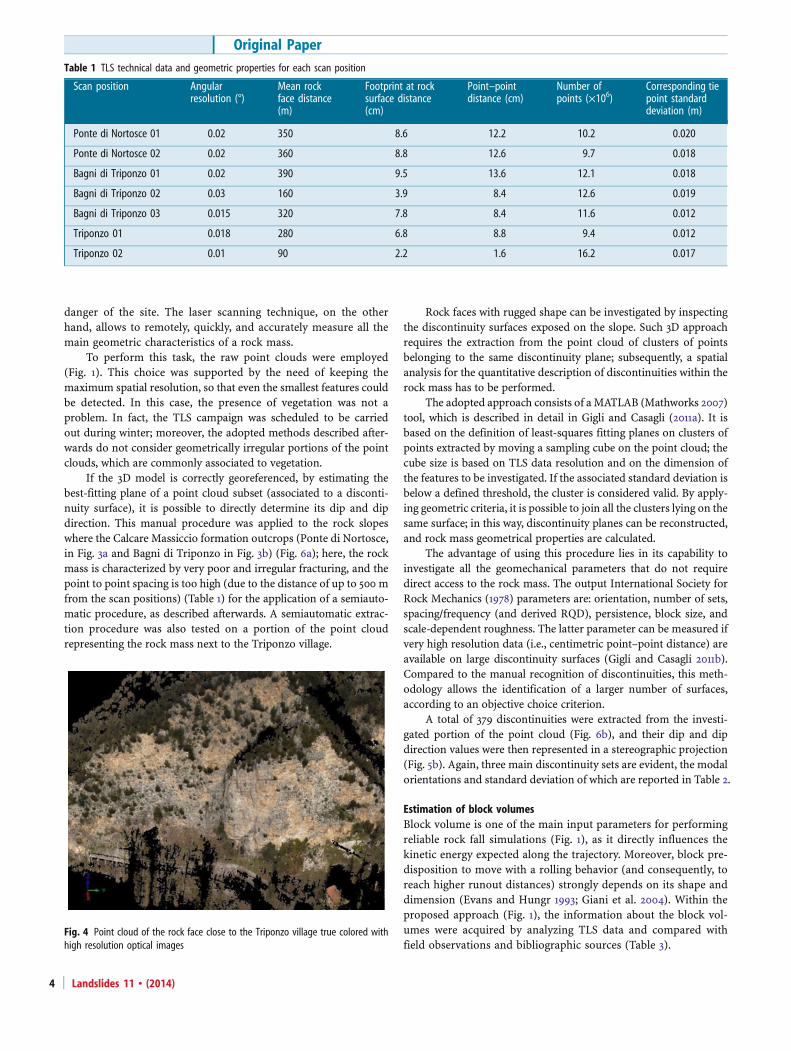
Discontinuity orientation data were represented in stereograph-ic projection (lower hemisphere) for the recognition of the main sets(Fig. 5a). The resulting modal plane orientation and standard devi-ation of each set are reported in Table 2.
TLS data processingWithin the framework of a rapid procedure, quick and reliabledata processing methods have to be chosen. Notwithstanding this,the application to the presented case studies highlighted someproblems, which slowed down the rock fall scenario definition,as described and commented in the following sections.
Analysis of rock mass discontinuitiesAn important limitation of traditional geomechanical surveys of-ten consists in the difficulty (or impossibility) to reach the rockwalls; another common problem, especially when dealing withactive landslides or heavily fractured rock masses, is the intrinsic
a) b)
c)
M
CMCM
RB
SR 209 SR 320
SR 209 Private house
Fig. 3 View of the investigated rockoutcrops: a Ponte di Nortosce, bBagni di Triponzo, and c Triponzo.The main elements at risk, thelocation of rock fall barriers (RB), andthe symbols of the outcroppinggeological formations are alsoreported. CM Calcare Massiccio, MMaiolica
Landslides 11 & (2014) 3
danger of the site. The laser scanning technique, on the otherhand, allows to remotely, quickly, and accurately measure all themain geometric characteristics of a rock mass.
To perform this task, the raw point clouds were employed(Fig. 1). This choice was supported by the need of keeping themaximum spatial resolution, so that even the smallest features couldbe detected. In this case, the presence of vegetation was not aproblem. In fact, the TLS campaign was scheduled to be carriedout during winter; moreover, the adopted methods described after-wards do not consider geometrically irregular portions of the pointclouds, which are commonly associated to vegetation.
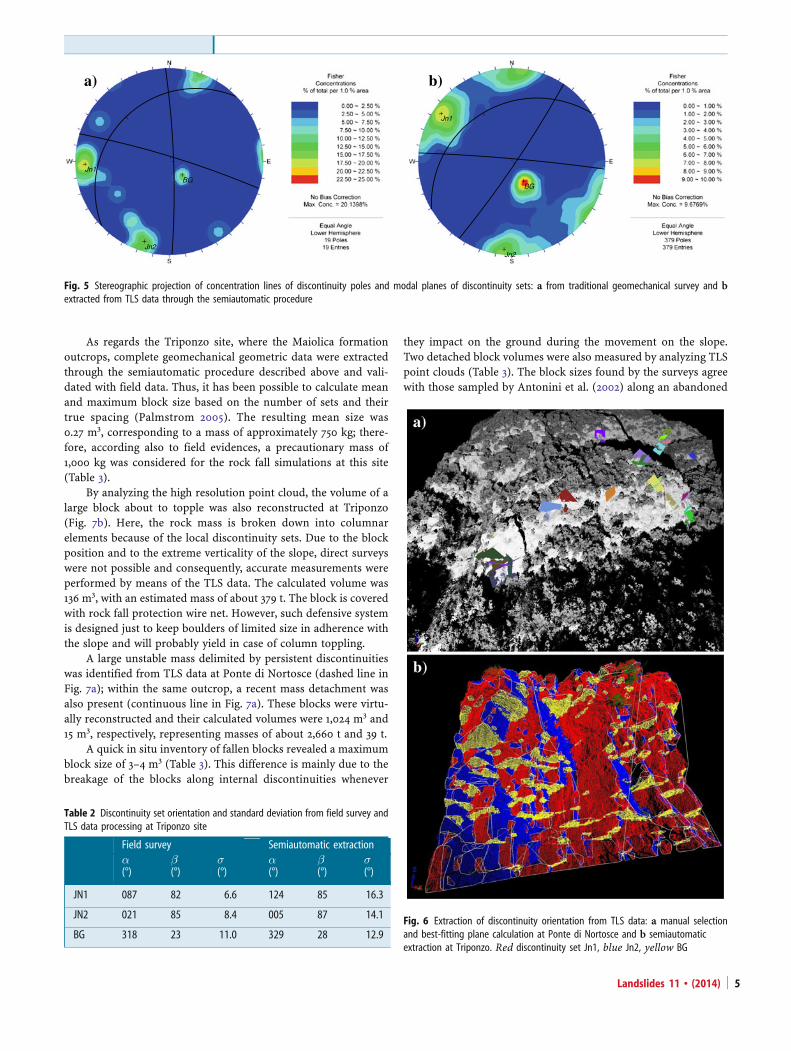
If the 3D model is correctly georeferenced, by estimating thebest-fitting plane of a point cloud subset (associated to a disconti-nuity surface), it is possible to directly determine its dip and dipdirection. This manual procedure was applied to the rock slopeswhere the Calcare Massiccio formation outcrops (Ponte di Nortosce,in Fig. 3a and Bagni di Triponzo in Fig. 3b) (Fig. 6a); here, the rockmass is characterized by very poor and irregular fracturing, and thepoint to point spacing is too high (due to the distance of up to 500 mfrom the scan positions) (Table 1) for the application of a semiauto-matic procedure, as described afterwards. A semiautomatic extrac-tion procedure was also tested on a portion of the point cloudrepresenting the rock mass next to the Triponzo village.
Rock faces with rugged shape can be investigated by inspectingthe discontinuity surfaces exposed on the slope. Such 3D approachrequires the extraction from the point cloud of clusters of pointsbelonging to the same discontinuity plane; subsequently, a spatialanalysis for the quantitative description of discontinuities within therock mass has to be performed.
The adopted approach consists of a MATLAB (Mathworks 2007)tool, which is described in detail in Gigli and Casagli (2011a). It isbased on the definition of least-squares fitting planes on clusters ofpoints extracted by moving a sampling cube on the point cloud; thecube size is based on TLS data resolution and on the dimension ofthe features to be investigated. If the associated standard deviation isbelow a defined threshold, the cluster is considered valid. By apply-ing geometric criteria, it is possible to join all the clusters lying on thesame surface; in this way, discontinuity planes can be reconstructed,and rock mass geometrical properties are calculated.
The advantage of using this procedure lies in its capability toinvestigate all the geomechanical parameters that do not requiredirect access to the rock mass. The output International Society forRock Mechanics (1978) parameters are: orientation, number of sets,spacing/frequency (and derived RQD), persistence, block size, andscale-dependent roughness. The latter parameter can be measured ifvery high resolution data (i.e., centimetric point–point distance) areavailable on large discontinuity surfaces (Gigli and Casagli 2011b).Compared to the manual recognition of discontinuities, this meth-odology allows the identification of a larger number of surfaces,according to an objective choice criterion.
A total of 379 discontinuities were extracted from the investi-gated portion of the point cloud (Fig. 6b), and their dip and dipdirection values were then represented in a stereographic projection(Fig. 5b). Again, three main discontinuity sets are evident, the modalorientations and standard deviation of which are reported in Table 2.
Estimation of block volumesBlock volume is one of the main input parameters for performingreliable rock fall simulations (Fig. 1), as it directly influences thekinetic energy expected along the trajectory. Moreover, block pre-disposition to move with a rolling behavior (and consequently, toreach higher runout distances) strongly depends on its shape anddimension (Evans and Hungr 1993; Giani et al. 2004). Within theproposed approach (Fig. 1), the information about the block vol-umes were acquired by analyzing TLS data and compared withfield observations and bibliographic sources (Table 3).
Table 1 TLS technical data and geometric properties for each scan position
Scan position Angularresolution (°)
Mean rockface distance(m)
Footprint at rocksurface distance(cm)
Point–pointdistance (cm)
Number ofpoints (×106)
Corresponding tiepoint standarddeviation (m)
Ponte di Nortosce 01 0.02 350 8.6 12.2 10.2 0.020
Ponte di Nortosce 02 0.02 360 8.8 12.6 9.7 0.018
Bagni di Triponzo 01 0.02 390 9.5 13.6 12.1 0.018
Bagni di Triponzo 02 0.03 160 3.9 8.4 12.6 0.019
Bagni di Triponzo 03 0.015 320 7.8 8.4 11.6 0.012
Triponzo 01 0.018 280 6.8 8.8 9.4 0.012
Triponzo 02 0.01 90 2.2 1.6 16.2 0.017
Fig. 4 Point cloud of the rock face close to the Triponzo village true colored withhigh resolution optical images
Original Paper
Landslides 11 & (2014)4
As regards the Triponzo site, where the Maiolica formationoutcrops, complete geomechanical geometric data were extractedthrough the semiautomatic procedure described above and vali-dated with field data. Thus, it has been possible to calculate meanand maximum block size based on the number of sets and theirtrue spacing (Palmstrom 2005). The resulting mean size was0.27 m3, corresponding to a mass of approximately 750 kg; there-fore, according also to field evidences, a precautionary mass of1,000 kg was considered for the rock fall simulations at this site(Table 3).
By analyzing the high resolution point cloud, the volume of alarge block about to topple was also reconstructed at Triponzo(Fig. 7b). Here, the rock mass is broken down into columnarelements because of the local discontinuity sets. Due to the blockposition and to the extreme verticality of the slope, direct surveyswere not possible and consequently, accurate measurements wereperformed by means of the TLS data. The calculated volume was136 m3, with an estimated mass of about 379 t. The block is coveredwith rock fall protection wire net. However, such defensive systemis designed just to keep boulders of limited size in adherence withthe slope and will probably yield in case of column toppling.
A large unstable mass delimited by persistent discontinuitieswas identified from TLS data at Ponte di Nortosce (dashed line inFig. 7a); within the same outcrop, a recent mass detachment wasalso present (continuous line in Fig. 7a). These blocks were virtu-ally reconstructed and their calculated volumes were 1,024 m3 and15 m3, respectively, representing masses of about 2,660 t and 39 t.
A quick in situ inventory of fallen blocks revealed a maximumblock size of 3–4 m3 (Table 3). This difference is mainly due to thebreakage of the blocks along internal discontinuities whenever
they impact on the ground during the movement on the slope.Two detached block volumes were also measured by analyzing TLSpoint clouds (Table 3). The block sizes found by the surveys agreewith those sampled by Antonini et al. (2002) along an abandoned
Jn1
Jn2
BG
Jn1
Jn2
BG
b)a)
Fig. 5 Stereographic projection of concentration lines of discontinuity poles and modal planes of discontinuity sets: a from traditional geomechanical survey and bextracted from TLS data through the semiautomatic procedure
Table 2 Discontinuity set orientation and standard deviation from field survey andTLS data processing at Triponzo site
Field survey Semiautomatic extractionα(°)
β(°)
σ(°)
α(°)
β(°)
σ(°)
JN1 087 82 6.6 124 85 16.3
JN2 021 85 8.4 005 87 14.1
BG 318 23 11.0 329 28 12.9Fig. 6 Extraction of discontinuity orientation from TLS data: a manual selectionand best-fitting plane calculation at Ponte di Nortosce and b semiautomaticextraction at Triponzo. Red discontinuity set Jn1, blue Jn2, yellow BG
Landslides 11 & (2014) 5

stretch of the S.S. 320 road. In their study, the average size of thelimestone blocks pertaining to the Calcare Massiccio Formation is4.6 m3. For these reasons, a volume of 5 m3 was considered for therock fall simulations both in Bagni di Triponzo and in Ponte diNortosce (Table 3).
3D surface creationThe extraction of high-resolution surface models was necessary forperforming the kinematic analyses and rock fall simulations(Fig. 1). To achieve this, first of all, it was necessary to filter thepoint clouds acquired with the TLS because of the strong presenceof vegetation on the slopes (Fig. 3).
Currently, there are various methods to eliminate nongroundpoints from a point cloud (Prokop and Panholzer 2009; Vosselmanet al. 2004). Because of the shape of the slopes, and of the need tokeep the procedure as rapid and objective as possible, a 2.5 D rasteralgorithm was chosen, and it was actually able to eliminate thevegetation and, at the same time, to maintain an accurate level ofdetail. The method involves the projection of the point cloud per-pendicularly to a planar raster surface (1-m cell size) and the selec-tion, for each cell, of the point nearest to the plane; identified pointsare then triangulated to generate a surface. For each scan position,the orientation of the best-fitting plane of the slope 3D model wasconsidered as base reference, so as to keep overhanging sectors.
However, as regards the scans performed at Ponte di Nortosce(Fig. 3a) and at Bagni di Triponzo (Fig. 3b), data integration wasnecessary because of the presence of some shadow areas. For thisreason, a second point cloud obtained from an existing 1:10,000Regional Technical Map (CTR) created in the 80s was employed.The two point clouds were, thus, compared, and local high discrep-
ancies were observed, which reached up to 25 m at the top of thesteepest slopes. This difference is due to inaccuracies in the 10-mDEM, which is unable to correctly represent subvertical walls. It'sevident that the source of the data heavily influences the accuracy ofthe DEM and, therefore, all the subsequent derived calculations.
On the other hand, the discrepancy between the twopoint clouds decreased to zero at the base of the slopes,where most of the holes were located. Thus, the point cloudresulting from the CTR map was exported to AutoCAD® andaligned, by rototranslation, to the one obtained with the TLSsurvey.
Once the point clouds were filtered and aligned, 3D slopesurfaces were created through point triangulation. To removepossible spikes due to incomplete vegetation removal and toimprove uniformity, a smoothing procedure was also applied.The three surfaces have the same resolution (1 m), and eventhe subvertical walls are properly and realistically recon-structed (Fig. 8), thus allowing performance of reliable kine-matic analyses and rock fall simulations.
Finally, for 3D and 2D rock fall simulations, a DEM (1-mresolution) (Fig. 1) was created for each slope in aGeographical Information System (GIS) environment, and theposition of roads, tunnels, and housing was extracted fromthe TLS products and overlapped to the terrain models.
Susceptibility scenarios
Kinematic analysisFor the definition of the main rock fall source areas, a spatialkinematic analysis was performed by using discontinuity orientation
Table 3 Comparison of block dimension (in m3) for each investigated lithology, extracted from the field surveys, the literature, and TLS data processing, and the oneemployed in the rock fall simulations
Field surveys TLS Employed insimulationsFrom
geomechanicaldata (Palmstrom2005)
Inventory(max)
Inventory(mean)
Antoniniet al. (2002)
Fromgeomechanicaldata (Palmstrom2005)
Measuredmeana
Calcare Massiccio / 3.9 1.2 4.6 / 2.9 5
Maiolica 0.21 0.32 0.13 / 0.27 / 0.35
a Only two block volumes calculated from TLS data
a) b)Fig. 7 Reconstruction of the shapeand size of unstable blocks fromthe TLS data: a Ponte di Nortosce andb Triponzo
Original Paper
Landslides 11 & (2014)6

data semiautomatically andmanually extracted from the point cloudand the 3D surface models obtained from the TLS data. This kind ofanalysis is able to establish if and where a particular instabilitymechanism is kinematically feasible, given the slope geometry andthe discontinuity orientation (Goodman and Bray 1976; Hoek andBray 1981; Hudson and Harrison 1997; Matheson 1989).
The main instability mechanisms investigated with this ap-proach are: plane failure, wedge failure, block toppling, and flexuraltoppling. Casagli and Pini (1993) introduced a kinematic hazardindex for each instability mechanism. These values are calculatedby counting poles and discontinuities falling in critical areas of thestereographic projection.
A spatial kinematic analysis (Fig. 1) was performed on each unittriangle of the 3D surface models (Fig. 8) by employing a new VisualBasic software called Rock Slope Stability (RSS) proposed byLombardi (2007) and developed specifically for true 3D kinematicanalyses.
This tool overcomes many limitations of the traditionalapproaches, as it is possible to employ true 3D surfaces, and thekinematic conditions leading to the investigated instability mecha-nisms have been extended to overhanging slopes. Thismethod fits theproposed procedure well, as its input data are the high-resolution 3Dmeshes obtained from TLS surveys and the discontinuities extractedwith the manual and semiautomatic methods described above.
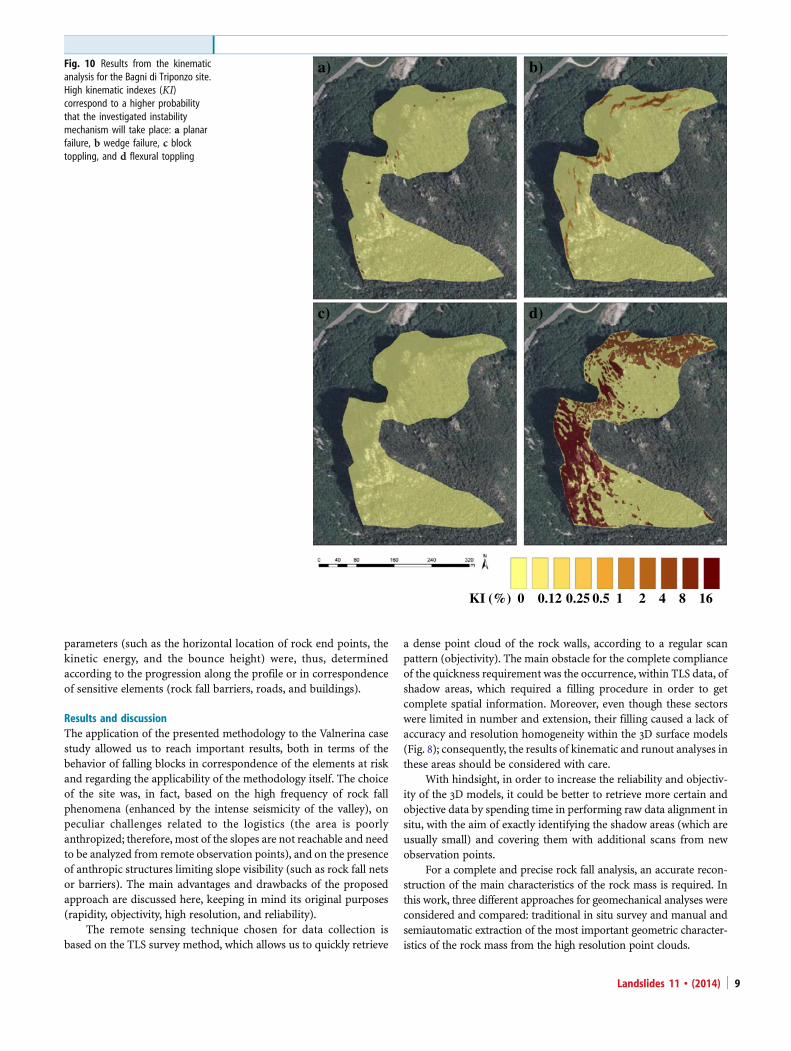
The kinematic analysis results are presented in Figs. 9, 10 and 11.All the investigated sites show quite high probability of occurrence ofkinematic instability mechanisms (max kinematic index up to 20 %),mainly located in the steepest sectors of the slopes. The latter
correspond to the main source areas, where blocks were seeded fromin rock fall simulations. The prevailing instability mechanism istoppling, associated to planar failure (at Ponte di Nortosce andTriponzo) and wedge failure (at Bagni di Triponzo and Triponzo).
Rock fall simulations2D and 3D rock fall simulations were performed (Fig. 1). 3Dmodelingwas used in order to evaluate at large scale the influence of the slopemorphology on the block trajectories, while 2D analyses allowed usto perform a larger number of simulations (statistically more signif-icant) on the most critical profiles identified with the 3D approach.Both methods apply lumped mass logic: each single block is repre-sented by a simple point with its mass concentrated at the center, andits trajectory is analyzed considering the physical laws governing thesequence of different types of motion (free fall, bouncing, rolling,and sliding) (Giani 1992). Thus, the block speed, kinetic energy, andbounce height can be calculated depending on the position on theslope or along the profiles.
Although the physical principles employed are quite simple, theuncertainty, variability, and sensitivity of the input parametersstrongly influence the simulation results. As described above, theproposed procedure aims at quickly and objectively defining most ofthese parameters by analyzing high-resolution TLS point clouds.
Input data for rock fall simulations can be classified as geomet-ric parameters (topography, identification of seed points, limits ofoutcropping materials, location of element at risk or points ofinterest, block shape, and volume) or mechanical parameters (nor-mal and tangential coefficient of restitution and friction angle).
e
dc
ba
f
N (0) S (180)E (90) W (270) N (360)
ASPECT
900 0
OverhangingSLOPE
Fig. 8 3D surface orientation (slopeand aspect) of the investigatedslopes. Ponte di Nortosce (a, b),Bagni di Triponzo (c, d), Triponzo(e, f). Overhangs are visible in theaspect map of the latter site. Smoothsectors correspond to the shadowareas, filled by means of lowresolution data
Landslides 11 & (2014) 7

All geometric data can be retrieved through the analysis of TLSpoint clouds. The extraction of high resolution DEMs, block vol-umes, and rock fall source areas for the investigated cases have beendescribed in “3D surface creation”, “Estimation of block volumes”,and “Kinematic analysis”, respectively. In addition, an accuratelocation of the limits of the outcropping materials and the locationof other elements of interest was possible thanks to the coupledobservation of the point clouds and the oriented optical imagesacquired during the TLS survey.
As regards the remaining parameters, an inventory offallen blocks has been carried out at all the investigated sitesby integrating field observation and TLS data (black points inFig. 12); the mechanical properties were calibrated byperforming a 3D back analysis to obtain the best agreementbetween the distribution of the blocks found in situ and theone derived from the simulations. The resulting values andassociated standard deviation employed in the simulationsare summarized in Table 4.
The initial block velocity was assigned a precautionaryvalue of 1.5 m/s (both to the horizontal and vertical
components). 3D simulations were performed by using theRock fall Analyst software (Lan et al. 2007), which directlyworks in GIS environment. The employed reference surfacewas the 1-m DEM obtained from the TLS data, and blockswere seeded from the areas associated to kinematic indexeshigher than 10. The resulting rock fall paths are presented inFig. 12.
In order to obtain a more accurate assessment of sus-ceptibility scenarios, 2D rock fall simulations were also per-formed by using the RocFall software (Rocscience 2005).
The analysis was carried out along three profiles for each rockslope analyzed, according to the criticalities from the 3D approach(Fig. 12), and the same input parameters of 3D simulations wereemployed. In particular, the trajectories associated to the highestrunout distance for three different sectors of each area have beenconsidered, and the corresponding topographic profiles have beenextracted from the DEMs obtained from TLS data.
For each profile, 10,000 rock falls were simulated, since thelarger the number of simulations, the more statistically significantthe results will be (Fig. 13a, b, and c). Fundamental output
KI (%) 0 0.12 0.25 0.5 1 2 4 8 16
a) b)
c) d)
Fig. 9 Results from the kinematicanalysis for the Ponte di Nortoscesite. High kinematic indexes (KI)correspond to a higher probabilitythat the investigated instabilitymechanism will take place: a planarfailure, b wedge failure, c blocktoppling, and d flexural toppling
Original Paper
Landslides 11 & (2014)8
parameters (such as the horizontal location of rock end points, thekinetic energy, and the bounce height) were, thus, determinedaccording to the progression along the profile or in correspondenceof sensitive elements (rock fall barriers, roads, and buildings).
Results and discussionThe application of the presented methodology to the Valnerina casestudy allowed us to reach important results, both in terms of thebehavior of falling blocks in correspondence of the elements at riskand regarding the applicability of the methodology itself. The choiceof the site was, in fact, based on the high frequency of rock fallphenomena (enhanced by the intense seismicity of the valley), onpeculiar challenges related to the logistics (the area is poorlyanthropized; therefore, most of the slopes are not reachable and needto be analyzed from remote observation points), and on the presenceof anthropic structures limiting slope visibility (such as rock fall netsor barriers). The main advantages and drawbacks of the proposedapproach are discussed here, keeping in mind its original purposes(rapidity, objectivity, high resolution, and reliability).
The remote sensing technique chosen for data collection isbased on the TLS survey method, which allows us to quickly retrieve
a dense point cloud of the rock walls, according to a regular scanpattern (objectivity). The main obstacle for the complete complianceof the quickness requirement was the occurrence, within TLS data, ofshadow areas, which required a filling procedure in order to getcomplete spatial information. Moreover, even though these sectorswere limited in number and extension, their filling caused a lack ofaccuracy and resolution homogeneity within the 3D surface models(Fig. 8); consequently, the results of kinematic and runout analyses inthese areas should be considered with care.
With hindsight, in order to increase the reliability and objectiv-ity of the 3D models, it could be better to retrieve more certain andobjective data by spending time in performing raw data alignment insitu, with the aim of exactly identifying the shadow areas (which areusually small) and covering them with additional scans from newobservation points.
For a complete and precise rock fall analysis, an accurate recon-struction of the main characteristics of the rock mass is required. Inthis work, three different approaches for geomechanical analyses wereconsidered and compared: traditional in situ survey and manual andsemiautomatic extraction of the most important geometric character-istics of the rock mass from the high resolution point clouds.
a) b)
c) d)
KI (%) 0 0.12 0.25 0.5 1 2 4 8 16
Fig. 10 Results from the kinematicanalysis for the Bagni di Triponzo site.High kinematic indexes (KI)correspond to a higher probabilitythat the investigated instabilitymechanism will take place: a planarfailure, b wedge failure, c blocktoppling, and d flexural toppling
Landslides 11 & (2014) 9

First of all, it is important to remark that the field survey is theonlymethod able to produce information about those parameters thatrequire direct access to the rock face (such as aperture, seepage, wallstrength, and filling). However, the latter are not relevant for rock fallsimulations; for this reason, the in situ survey has been employed fordata validation only.
On the other hand, the application of the semiautomatic proce-dure can give a contribution to improve the safety level (since it isnot necessary to physically reach dangerous areas), the spatial reso-lution, the quickness, and the objectivity of the whole approach. Inorder to accurately locate the discontinuity sets of a rock mass, it isnecessary to have the largest number of measures and a goodsampling methodology. The semiautomatic procedure, through itsanalysis algorithm, allows acquisition of a huge amount of data withan objective criterion and investigation of major portions of the rockmass. By performing the discontinuity extraction from different rockmass portions, we are also able to evaluate possible spatial variationsof discontinuity set orientation and other geometrical properties.The application of the presented semiautomatic approach, however,do not always provide satisfying results, such as in the case of rockmasses characterized by prevailing discontinuity traces (Gigli andCasagli 2011a; Kemeny and Post 2003; Ferrero andUmili 2011) by very
irregular (Lato et al. 2012) or poor fracturing, or if the spatialresolution of the point cloud is too low (usually due to the highdistance of the object of interest from the scan position). Moreover,the TLS line of sight acquisition may result in wide shadow areas andsignificant bias if data are acquired from a single scan position (Latoet al. 2010). For these reasons, the Calcare Massiccio rock masseshave been investigated by manually extracting discontinuity surfacesfrom the point cloud.
Thus, representative block dimensions can be semiautomatical-ly calculated only if specific conditions take place (rock mass char-acterized by well-developed discontinuity surfaces and point cloudresolution high enough to appreciate geometric features); otherwise,additional integrative data processing is necessary. This is a veryimportant point that should be kept in mind when exporting theprocedure to other sites, since block size is a key parameter for theforecasting of the kinetic energy in correspondence of the elementsat risk, and its quick and reliable definition is fundamental forcorrect rock fall analyses.
The kinematic analysis allowed quick and objective definition ofthe main rock fall source areas. These results were also confirmed byfield observations that show evidences of occurrence of the predictedinstability mechanisms (Fig. 7).
a) b)
c) d)
KI (%) 0 0.12 0.25 0.5 1 2 4 8 16
Fig. 11 Results from the kinematicanalysis for the Triponzo site. Highkinematic indexes (KI) correspond toa higher probability that theinvestigated instability mechanismwill take place: a planar failure, bwedge failure, c block toppling, andd flexural toppling
Original Paper
Landslides 11 & (2014)10

The geometric inputs of rock fall analyses are, therefore, com-pletely defined; however, to improve simulation reliability, a backanalysis for the calibration of the coefficients of restitution andfriction angle of the outcropping materials is strongly suggested.This is usually done by performing an inventory of fallen blockand carrying out a parametric analysis with the aim of obtainingthe best agreement between the in situ block distribution and thesimulated one. The high-resolution point clouds acquired by the TLScan be useful also for this purpose, allowing for accurate estimationof both the position and dimension of fallen blocks.
The results of rock fall analyses at Ponte di Nortosce show thatthe regional road appears to be heavily rock fall prone, since 88 % ofsimulations reach the roadway, stopping, in some cases, in the fieldsbeyond it. The associated maximum bounce height and kineticenergy are about 1.5 m and 210 kJ, respectively.
At Bagni di Triponzo, the blocks reach the roadway only inexceptional cases (1 %). Almost all the simulations stop at the base
of the rock slope, where the vegetation is denser.Figure 13 shows the importance of employing a realistic topo-
graphic base for reliable rock fall analyses. A comparison between 2Dsimulations performed on profiles extracted from high-resolutionTLS data (Fig. 13c) and from a regional technical map (scale 1:10,000)(Fig. 13d) is presented. Low-resolution topographic maps usuallystrongly underestimate slope steepness, especially in subverticalareas (thus, overestimating it at their base). Moreover, the profileline is constituted of a sequence of unrealistic steps, which can alterthe true behavior of falling blocks.
Finally, at Triponzo, due to the high steepness of the slope, thehorizontal component of block velocity is low, resulting in a higherenergy dissipation and, consequently, in moderate runout distances.The road network and the buildings closest to the rock wall are,therefore, marginally affected by the rock falls, with the exception ofthe western portion of the regional road, where a rock fall gallery wasbuilt to reduce the risk.
Table 4 Mechanical parameters retrieved through back analysis, employed in the rock fall simulations
Material type Rn Rt FrictionMean σ Mean σ Mean σ
Bare rock 0.6 0.05 0.8 0.05 30 2
Vegetated rock 0.5 0.05 0.6 0.05 30 4
Soil 0.3 0.05 0.5 0.05 30 2
Vegetated soil 0.3 0.05 0.4 0.05 30 4
Rn normal coefficient of restitution, Rt tangential coefficient of restitution, Friction fiction angle, σ standard deviation
0 - 10
10 - 20
20 - 30
30 - 40
40 - 50
50 - 60
60 - 70
70 - 80
80 - 90
Slope ( )Rockfalltrajectories
a)
b)
c)
1
23
1
2
3
32
1
Fallen blocks:
Field and TLSSurveys
Validationcampaign
Regional Road
Fig. 12 3D rock fall simulationresults: a Triponzo, b Ponte diNortosce, and c Bagni di Triponzo.The position of fallen blocks extractedfrom TLS and field surveys (blackpoints) and those found duringthe validation inventory (whitepoints) are also reported. Thewhite lines indicate the traces ofthe profiles employed in the 2Danalyses
Landslides 11 & (2014) 11

Avalidation inventory has been carried out after the applicationof the whole procedure (white points in Fig. 12). The results show agood agreement with 3D (Fig. 12) and 2D (Fig. 13) simulations asregards Ponte di Nortosce (where blocks are retained by a recentrock fall barrier) and Triponzo, while some discrepancies betweentrue and simulated block distributions can be observed in the south-western of the Bagni di Triponzo site, where probably the restitutioncoefficient were overestimated due to the presence of thick vegeta-tion (Fig. 3b).
ConclusionsThe objective of this work was to experiment and evaluate theadvantages and drawbacks of a procedure for the complete defi-nition of susceptibility scenarios associated to rock falls usingprimarily the TLS technique. The methodology has been appliedin three test sites located in Valnerina (Umbria Region, Italy). Dueto its sharp morphology, the investigated area is characterized bysteep slopes and deep valleys, and as a consequence, the risk ofrock falls is particularly high, especially along the roads and in the
Regional Road Regional Road
a)
c)
b)
d)
Regional RoadRegional Road
Private house
Fig. 13 2D rock fall trajectories and location of end points: a profile 3 (Fig. 12) at Ponte di Nortosce, b profile 2 (Fig. 12) at Triponzo, c profile 1 (Fig. 12) at Bagni diTriponzo, and d profile 1 at Bagni di Triponzo extracted from a topographic map 1:10,000
Original Paper
Landslides 11 & (2014)12

villages next to the slopes. Furthermore, this predisposition isexacerbated by the intense seismic activity of the entire area.
The TLS technique turned out to be able to provide all thegeometric parameters necessary for performing the rock fall sim-ulations (high-resolution DEM, main source areas, block shapeand size, and limits of the outcropping materials). The choice ofthe test site was also based on the need to try the limits of theprocedure out. The morphology of the area, in fact, allowed per-formance of the scans only from limited and sometimes remoteobservation points. Therefore, the resulting point clouds weresometimes incomplete and, occasionally, had a too low resolutionfor performing automatic data processing. The overcoming ofthese problems (by integrating the point clouds with existingtopographic data and carrying out manual data processing) re-quired a delay of the whole procedure of about 100 %.
Even if the proposed approach has been conceived to employprimarily TLS data, it is important to remark that, in the authors'opinion, field check and in situ data collection are necessary, both tovalidate the results of the procedure and to calibrate the mechanicalparameters of the outcropping materials for reliable simulations.
The application of the proposed methodology to the test siteallowed identification of the main rock fall source areas and associatedinstabilitymechanisms, and the dwellings and transportation corridorsstretches that are exposed to the highest risk. A validation inventoryconfirmed the reliability of the procedure. The presented approachproved to be objective, reliable, and exportable, even if, in particularconditions, integrative activities could be required, thus producing adelay, which, in emergency conditions, could be unacceptable.
Furthermore, the need to process high-resolution data allowsanalysis of only limited rock mass outcrops and the extension of theprocedure to long stretches of roadside rock masses (which can beinvestigated through mobile devices) is, at the moment, unfeasible.The application of the procedure to a real case showed that animprovement in automation is also strongly needed (as regards,for example, the unstable mass detection and the link between thedifferent steps), which will help to further strengthen objectivity andreduce processing time.
AcknowledgmentsThis work was carried out within a research contract between theDepartment of Civil and Environmental Engineering of the Uni-versity of Perugia and the Department of Earth Sciences, Univer-sity of Firenze, entitled: 3D geomechanical survey of rock massesaimed at the evaluation of rock fall risk scenarios in Valnerina(Umbria). The authors are also thankful to Prof. Hengxing Lan forhis kind authorization to employ the Rockfall Analyst software for3D simulations.
Open Access This article is distributed under the terms of theCreative Commons Attribution License which permits any use,distribution, and reproduction in any medium, provided the orig-inal author(s) and the source are credited.
References
Abellan A, Vilaplana JM, Martinez J (2006) Application of a long-range terrestrial laserscanner to a detailed rockfall study at Vall de Nuria (Eastern Pyrenees, Spain). EngGeol 88:136–148
Abellan A, Vilaplana JM, Calvet J, Blanchard J (2010) Detection and spatial prediction ofrockfalls by means of terrestrial laser scanning modelling. Geomorphology 119:162–171
Agliardi F, Crosta GB (2003) High resolution three-dimensional numerical modelling ofrockfalls. Int J Rock Mech Min Sci 40:455–471
Amato A, Azzara R, Chiarabba C, Cimini GB, Cocco M, Di Bona M, Margheriti L, Mazza S,Mele F, Selvaggi G, Basili A, Boschi E, Courboulex F, Deschamps A, Gaffet S, BittarelliG, Chiaraluce L, Piccinini D, Ripepe M (1998) The 1997 Umbria–Marche, Italy,earthquake sequence: a first look at the main shocks and aftershocks. Geoph ResLett 25:2861–2864
Antonini G, Ardizzone F, Cardinali M, Galli M, Guzzetti F, Reichenbach P (2002) Surfacedeposits and landslide inventory map of the area affected by the 1997 Umbria-Marche earthquakes. Boll Soc Geol It 121:843–853
Armesto J, Ordóñez C, Alejano L, Arias P (2009) Terrestrial laser scanning used todetermine the geometry of a granite boulder for stability analysis purposes.Geomorphology 106:271–277
Azzoni A, La Barbera G, Zaninetti A (1995) Analysis and prediction of rockfalls using amathematical model. Int J Rock Mech Min Sci Geomech Abstr 32:709–724
Barchi M, Cardinali M, Guzzetti F, Lemmi M (1993) Relazioni fra movimenti di versante efenomeni tettonici nell'area del M. Coscerno—M. di Civitella, Valnerina (Umbria). BollSoc Geol It 112:83–111 (in Italian)
Bauer A, Paar G, Kaltenbök A (2006) Mass movement monitoring using terrestrial laserscanner for rockfall management. In: van Oosterom P, Zlatanova S, Fendel EM (eds)Geo-information for disaster management. Stringer Berlin, Heidelberg, pp 393–406
Carro M, De Amicis M, Luzi L, Marzorati S (2003) The application of predictive modelingtechniques to landslides induced by earthquakes: the case study of the 26 September1997 Umbria-Marche earthquake (Italy). Eng Geol 69:139–159
Casagli N, Pini G (1993) Analisi cinematica della stabilità di versanti naturali efronti di scavo in roccia. Geologia Applicata e Idrogeologia 28 223–232 (inItalian)
Crosta GB, Agliardi F (2004) Parametric evaluation of 3D dispersion of rockfall trajecto-ries. Nat Hazard Earth Syst Sci 4:583–598
Descouedres F, Zimmermann TH (1987) Three-dimensional dynamic calculation of rock-falls. In: Proceedings of the sixth international congress of rock mechanics, Montreal,Canada 337-342
Dorren LKA, Seijmonsbergen AC (2003) Comparison of three GIS-based models forpredicting rockfall runout zones at a regional scale. Geomorphology 56:49–64
Evans SG, Hungr O (1993) The assessment of rockfall hazard at the base of talus slopes.Can Geotech J 30:620–636
Fanti R, Gigli G, Lombardi L, Tapete D, Canuti P (2012) Terrestrial laser scanning forrockfall stability analysis in the cultural heritage site of Pitigliano (Italy). Landslides.doi:10.1007/s10346-012-0329-5
Ferrero AM, Umili G (2011) Comparison of methods for estimating fracture size and intensityapplied to Aiguille Marbrée (Mont Blanc). Int J Rock Mech Min Sci 48(8):1262–1270
Ferrero AM, Forlani G, Roncella R, Voyat HI (2009) Advanced geostructural surveymethods applied to rock mass characterization. Rock Mech Rock Eng 42:631–665
Ferrero AM, Migliazza M, Roncella R, Rabbi E (2011) Rock slopes risk assessment basedon advanced geostructural survey techniques. Landslides 8:221–231
Giani GP (1992) Rock slope stability analysis. Balkema, RotterdamGiani GP, Giacomini A, Migliazza M, Segalini A (2004) Experimental and theoretical
studies to improve rock fall analysis and protection work design. Rock Mech Rock Eng37:369–389
Gigli G, Casagli N (2011a) Semi-automatic extraction of rock mass structural data fromhigh resolution LIDAR point clouds. Int J Rock Mech Min Sci 48:187–198
Gigli G, Casagli N (2011b) Extraction of rock mass structural data from high resolutionlaser scanning products. Proc. 2nd World Landslide Forum, Rome, 3–7 October, 2011
Gigli G, Frodella W, Mugnai F, Tapete D, Cigna F, Fanti R, Intrieri E, Lombardi L (2012)Instability mechanisms affecting cultural heritage sites in the Maltese Archipelago.Nat Hazards Earth Syst Sci 12:1883–1903. doi:10.5194/nhess-12-1883-2012
Goodman RE, Bray JW (1976) Toppling of rock slopes. ASCE Specialty Conference on RockEngineering for Foundations and Slopes, Boulder Colorado 2:201-234
Guzzetti F, Crosta GB, Detti R, Agliardi F (2002) STONE: a computer program for thethree-dimensional simulation of rock-falls. Comput Geosci 28:1079–1093
Guzzetti F, Reichenbach P, Ghigi S (2004) Rockfall hazard and risk assessment along atransportation corridor in the Nera Valley, Central Italy. Environ Manag 34:191–208
Guzzetti F, Esposito E, Balducci V, Porfido S, Cardinali M, Violante C, Fiorucci F, Sacchi M,Ardizzone F, Mondini A, Reichenbach P, Rossi M (2009) Central Italy seismicsequence-induced lansliding: 1997–1998 Umbria-Marche and 2008–2009 l'Aquilacases. The next generation of research on earthquake-induced landslides: anInternational conference in commemoration of 10th anniversary of the Chi-Chiearthquake 52-60
Landslides 11 & (2014) 13

Hoek E (2000) Practical rock engineering. www.rocscience.comHoek E, Bray JW (1981) Rock slope engineering. Revised third edition. Institute of Mining
and Metallurgy, LondonHudson JA, Harrison JP (1997) Engineering Rock Mechanics. Pergamon Press, p 444Hungr O, Evans SG, Hazzard J (1999) Magnitude and frequency of rock falls and rock
slides along the main transportation corridors of southwestern British Columbia. CanGeotech J 36:224–238
International Society for Rock Mechanics (ISRM)—Commission on The Standardization ofLaboratory and Field Test (1978) Suggested methods for the quantitative descriptionof discontinuities in rock masses. Int J Rock Mech Min Sci Geomech Abstr 15:319–368
Jaboyedoff M, Oppikofer T, Abellán A, Derron M, Loye A, Metzger R, Pedrazzini A (2012)Use of LIDAR in landslide investigations: a review. Nat Hazards 61:5–28
Kemeny J, Post R (2003) Estimating three-dimensional rock discontinuity orientationfrom digital images of fracture traces. Comput Geosci 29:65–77
Lan H, Martin CD, Lim CH (2007) RockFall analyst: a GIS extension for three-dimensionaland spatially distributed rockfall hazard modeling. Comput Geosci 33:262–279
Lan H, Martin CD, Zhou C, Lim CH (2010) Rockfall hazard analysis using LiDAR and spatialmodeling. Geomorphology 118:213–223
Lato M, Vöge M (2012) Automated mapping of rock discontinuities in 3D lidar andphotogrammetry models. Int J Rock Mech Min Sci 54:150–158
Lato M, Hutchinson J, Diederichs M, Ball D, Harrap R (2009) Engineering monitoring ofrockfall hazards along transportation corridors: using mobile terrestrial LiDAR. NatHazards Earth Syst Sci 9:935–946
Lato M, Diederichs M, Hutchinson DJ (2010) Bias correction for static LiDAR scanning ofrock outcrops for structural characterization. Rock Mech Rock Eng 43(5):615–628
Lato MJ, Diederichs MS, Hutchinson DJ (2012) Evaluating roadside rockmasses for rockfallhazards using LiDAR data: optimizing data collection and processing protocols. NatHazards 60:831–864
Lombardi L (2007) Nuove tecnologie di rilevamento e di analisi di dati goemeccanici perla valutazione della sicurezza. Ph.D. Thesis, Università degli studi di Firenze (in Italian)
Lombardi L, Casagli N, Gigli G, Nocentini M (2006) Verifica delle condizioni di sicurezzadella S.P. Lodovica in seguito ai fenomeni di crollo nella cava di Sesto di Moriano(Lucca). Giornale di Geologia Applicata 3:249–256 (in Italian)
Marzorati S, Luzi L, De Amicis M (2002) Rock falls induced by earthquakes: a statisticalapproach. Soil Dynam Earthquake Eng 22:565–577
Matheson GD (1989) The collection and use of field discontinuity data in rock slopedesign. Q J Eng Geol 22:19–30
MathWorks (2007) MATLAB, the language of technical computing. Ver. 7.5 Release2007a. [CD-ROM]
Mikos M, Vidmar A, Brilly M (2005) Using a laser measurement system for monitoringmorphological changes on the Strug rock fall, Slovenia. Nat Hazard Earth Syst Sci 5:143–153
Morelli S, Segoni S, Manzo G, Ermini L, Catani F (2012) Urban planning, flood risk andpublic policy: the case of the Arno River, Firenze, Italy. Appl Geogr 34:205–218
Palmstrom A (2005) Measurement of correlations between block size and rock qualitydesignation (RQD). Tunn Undergr Space Technol 20:362–377
Pfeiffer TJ, Bowen T (1989) Computer simulation of rockfalls. Bull Assoc Eng Geol26:135–146
Pfeiffer TJ, Higgins JD, Schultz R, Andrew RD (1991) Colorado rockfall simulation programuser's manual for version 2.1. Colorado Department of Transformation, Denver
Piteau DR, Clayton R (1976) Computer rockfall model. In: Proceedings of the meeting onrockfall dynamics and protective works effectiveness, Bergamo, Italy, ISMESPublication No. 90 123-125
Prokop A, Panholzer H (2009) Assessing the capability of terrestrial laser scanning formonitoring slow moving landslides. Nat Hazards Earth Syst Sci 9:1921–1928
Rabatel A, Deline P, Jaillet S, Ravanel L (2008) Rock falls in high-alpine rock wallsquantified by terrestrial lidar measurements: a case study in the Mont Blanc area.Geophys Res Lett 35:L10502
Ritchie AM (1963) Evaluation of rockfall and its control. Highw Res Rec 17:13–28Rocscience (2005) RocFall software for risk analysis of falling rocks on steep slopes. Ver.
4.0. User's GuideRosser NJ, Dunning SA, Lim M, Petley DN (2005) Terrestrial laser scanning for monitoring
the process of hard rock coastal cliff erosion. Q J Eng Geol Hydrogeol 38:363–375Scioldo G (1991) La statistica Robust nella simulazione del rotolamento massi. In:
Proceedings Meeting La meccanica delle rocce a piccola profondità, Torino, Italy319-323 (in Italian)
Strouth A, Eberhardt E (2005) The use of LiDAR to overcome rock slope hazard datacollection challenges at Afternoon Creek, Washington. In: 41st US Symposium on RockMechanics, Golden, Colorado. American Rock Mechanics Association
Tapete D, Gigli G, Mugnai F, Vannocci P, Pecchioni E, Morelli S, Fanti R, Casagli N (2012)Correlation between erosion patterns and rockfall hazard susceptibility in hilltopfortifications by terrestrial laser scanning and diagnostic investigations. In: IEEEInternational Geoscience and Remote Sensing Symposium. Remote Sensing for aDynamic Earth. Munich, Germany, 22-27 July 2012, pp. 4809-4812. ISBN 978-1-4673-1159-5
Vosselman G, Gorte BGH, Sithole G, Rabbani T (2004) Recognizing structure in laserscanner point clouds. Int Arch Photogramm Remote Sens Spat Inf Sci 46:33–38
Wickens EH, Barton NR (1971) The application of photogrammetry to the stability ofexcavated rock slopes. Photogram Rec 7(37):46–54
G. Gigli ()) : S. Morelli : S. Fornera : N. CasagliDepartment of Earth Sciences,University of Firenze,Via La Pira 4, 50121 Firenze, Italye-mail: [email protected]
Original Paper
Landslides 11 & (2014)14