Original Article Gene function analysis in osteosarcoma ... · Original Article Gene function...
12
Int J Clin Exp Med 2015;8(7):10401-10410 www.ijcem.com /ISSN:1940-5901/IJCEM0005928 Original Article Gene function analysis in osteosarcoma based on microarray gene expression profiling Liang Zhao 1 , Jinghua Zhang 2 , Hongyu Tan 1 , Weidong Wang 1 , Yilin Liu 1 , Ruipeng Song 1 , Limin Wang 1 1 Department of Orthopedics, First Affiliated Hospital, Zhengzhou University, Henan Province, China; 2 Department of Cardiology, The First Affiliated Hospital, Zhengzhou University, Henan Province, China Received January 14, 2015; Accepted March 19, 2015; Epub July 15, 2015; Published July 30, 2015 Abstract: Osteosa rcoma is an aggressive malignant neoplasm that exhibits osteoblastic differentiation and produc- es malignant osteoid. The aim of this study was to find feature genes associated with osteosarcoma and correlative gene functions which can distinguish cancer tissues from non-tumor tissues. Gene expression profile GSE14359 was downloaded from Gene Expression Omnibus (GEO) database, including 10 osteosarcoma samples and 2 nor- mal samples. The differentially expressed genes (DEGs) between osteosarcoma and normal specimens were iden- tified using limma package of R. DAVID was applied to mine osteosarcoma associated genes and analyze the GO enrichment on gene functions and KEGG pathways. Then, corresponding protein-protein interaction (PPI) network of DEGs was constructed based on the data collected from STRING datasets. Principal component of top10 DEGs and PPI network of top 20 DEGs were further analyzed. Finally, transcription factors were predicted by uploading the two groups of DEGs to TfactS database. A total of 437 genes, including 114 up-regulated genes and 323 down-regulated genes, were filtered as DEGs, of which 46 were associated with osteosarcoma by Disease Module. GO and KEGG pathway enrichment analysis showed that genes mainly affected the process of immune response and the develop- ment of skeletal and vascular system. The PPI network analysis elucidated that hemoglobin and histocompatibility proteins and enzymes, which were associated with immune response, were closely associated with osteosarcoma. Transcription factors MYC and SP1 were predicted to be significantly related to osteosarcoma. The discovery of gene functions and transcription factors has the potential to use in clinic for diagnosis of osteosarcoma in future. In addi- tion, it will pave the way to studying mechanism and effective therapies for osteosarcoma. Keywords: Osteosarcoma, DEGs, PPI network, GO enrichment, transcription factors Introduction Osteosarcoma (OS), the most common and pri- mary malignant bone tumor, is a painful health burden and a deadly disorder [1]. It arises around the metaphysis of tubular long bones that exhibits osteoblastic differentiation, and generates immature bone [2, 3]. Femur, tibia and humerus are the other most common sites of OS [3]. Pain is the most common early symp- tom of OS and can even lead to fracture of the affected bone. The frequency of OS is higher in males than in females and slightly higher fre- quent in Blacks and Hispanics than Caucasians [4]. Osteosarcoma is the most common primary malignant bone tumor in children and young adults [5]. More than 80% of children with osteogenic sarcoma (OS) relapse and 35% to 40% of them die within the first 2 years after diagnosis due to relapse [6]. Although in the past osteosarcoma was a lethal disease, the development of chemotherapy in last 30 years has raised the 5-year survival to 75% [7]. At present, the available standard treatment is complete radical surgery com- bined with multiagent chemotherapy regimens [8]. Using chemotherapy before surgery gives us the opportunity to save the limb in these patients. So chemotherapy is now accepted as the standard preoperative option. But the type of chemotherapy is yet in controversy with the majority of regimens. Treatment of osteosarco- ma remains a challenging issue. In addition, early diagnosis of cancer is an urgent need. The lack of understanding of the molecular mecha- nism, the research in screening biomarkers at the early stage has been hinderedt. Additionally, the exact etiology of OS is unclear because of the complex molecular mechanism of tumor development as well. It is reported to be associ-
Transcript of Original Article Gene function analysis in osteosarcoma ... · Original Article Gene function...

Int J Clin Exp Med 2015;8(7):10401-10410www.ijcem.com /ISSN:1940-5901/IJCEM0005928
Original Article Gene function analysis in osteosarcoma based on microarray gene expression profiling
Liang Zhao1, Jinghua Zhang2, Hongyu Tan1, Weidong Wang1, Yilin Liu1, Ruipeng Song1, Limin Wang1
1Department of Orthopedics, First Affiliated Hospital, Zhengzhou University, Henan Province, China; 2Department of Cardiology, The First Affiliated Hospital, Zhengzhou University, Henan Province, China
Received January 14, 2015; Accepted March 19, 2015; Epub July 15, 2015; Published July 30, 2015
Abstract: Osteosa rcoma is an aggressive malignant neoplasm that exhibits osteoblastic differentiation and produc-es malignant osteoid. The aim of this study was to find feature genes associated with osteosarcoma and correlative gene functions which can distinguish cancer tissues from non-tumor tissues. Gene expression profile GSE14359 was downloaded from Gene Expression Omnibus (GEO) database, including 10 osteosarcoma samples and 2 nor-mal samples. The differentially expressed genes (DEGs) between osteosarcoma and normal specimens were iden-tified using limma package of R. DAVID was applied to mine osteosarcoma associated genes and analyze the GO enrichment on gene functions and KEGG pathways. Then, corresponding protein-protein interaction (PPI) network of DEGs was constructed based on the data collected from STRING datasets. Principal component of top10 DEGs and PPI network of top 20 DEGs were further analyzed. Finally, transcription factors were predicted by uploading the two groups of DEGs to TfactS database. A total of 437 genes, including 114 up-regulated genes and 323 down-regulated genes, were filtered as DEGs, of which 46 were associated with osteosarcoma by Disease Module. GO and KEGG pathway enrichment analysis showed that genes mainly affected the process of immune response and the develop-ment of skeletal and vascular system. The PPI network analysis elucidated that hemoglobin and histocompatibility proteins and enzymes, which were associated with immune response, were closely associated with osteosarcoma. Transcription factors MYC and SP1 were predicted to be significantly related to osteosarcoma. The discovery of gene functions and transcription factors has the potential to use in clinic for diagnosis of osteosarcoma in future. In addi-tion, it will pave the way to studying mechanism and effective therapies for osteosarcoma.
Keywords: Osteosarcoma, DEGs, PPI network, GO enrichment, transcription factors
Introduction
Osteosarcoma (OS), the most common and pri-mary malignant bone tumor, is a painful health burden and a deadly disorder [1]. It arises around the metaphysis of tubular long bones that exhibits osteoblastic differentiation, and generates immature bone [2, 3]. Femur, tibia and humerus are the other most common sites of OS [3]. Pain is the most common early symp-tom of OS and can even lead to fracture of the affected bone. The frequency of OS is higher in males than in females and slightly higher fre-quent in Blacks and Hispanics than Caucasians [4]. Osteosarcoma is the most common primary malignant bone tumor in children and young adults [5]. More than 80% of children with osteogenic sarcoma (OS) relapse and 35% to 40% of them die within the first 2 years after diagnosis due to relapse [6].
Although in the past osteosarcoma was a lethal disease, the development of chemotherapy in last 30 years has raised the 5-year survival to 75% [7]. At present, the available standard treatment is complete radical surgery com-bined with multiagent chemotherapy regimens [8]. Using chemotherapy before surgery gives us the opportunity to save the limb in these patients. So chemotherapy is now accepted as the standard preoperative option. But the type of chemotherapy is yet in controversy with the majority of regimens. Treatment of osteosarco-ma remains a challenging issue. In addition, early diagnosis of cancer is an urgent need. The lack of understanding of the molecular mecha-nism, the research in screening biomarkers at the early stage has been hinderedt. Additionally, the exact etiology of OS is unclear because of the complex molecular mechanism of tumor development as well. It is reported to be associ-

Gene function analysis of osteosarcoma
10402 Int J Clin Exp Med 2015;8(7):10401-10410
ated with a variety of risk factors including age, sex, genetic and familial factors which contrib-ute to the progression of OS [9]. Thus, it is nec-essary to understand the detailed mechanisms of tumorigenicity and metastasis for early diag-nose and novel therapeutic approaches of osteosarcoma [10].
Genetic aberrations have been reported as an important factor that may contribute to osteo-sarcoma pathogenesis. It was reported that many transcription factors such as Twist, Snail1, Slug and Zeb family induce epithelial to mesenchymal transition by downregulating E- cadherin [11]. It was also found that miR-195 levels in sera from osteosarcoma patients were significantly lower than those in healthy con-trols [12], and IL-11Rα was highly expressed in osteosarcoma [13]. Therefore all the detected biomarkers associated with osteosarcoma may be useful for screening osteosarcoma and can predict poor prognosis.
Bioinformatics analysis, an effective way to identify interactions between DNAs and pro-teins in vivo, has become very popular in recent years [14]. In this paper, it was utilized to iden-tify potential target genes and transcription factors, and the gene functions in osteosarco-ma were analyzed to understand the potential biological process of osteosarcoma progress, which has the potential to use in clinic for treat-
ment of osteosarcoma in future. However, more investigations are necessary for better under-standing of the roles of MYC and SP1 in osteo-sarcoma. It may provide insight into tumor for-mation and malignant progression, as well as provide a basis for innovative therapeutic a- pproaches and diagnostic markers for osteosar- coma.
Materials and methods
Microarray data
The gene expression profile GSE14359 was extracted from GEO (Gene Expression Omnibus) database including 10 Osteosarcoma tissue samples and 2 normal tissue samples. Platform information was GPL96.
Data preprocessing
The probe-level data in CEL files were convert-ed into expression value matrix by eReadAffy function [15] in R Affy package and performed background correction and quartile data nor-malization by the robust multiarray average (RMA) [16] algorithm with defaulted parame-ters. Data distribution was presented as box graph. The R/Bioconductor package and chip annotation platform were used to generate gene accession number, and the probes with-out annotation were filtered.
Figure 1. Cassette figures of data distribution. The horizontal axis stands for sample names while the vertical axis represents the expression value. The black line in the cassette is the median of each data group, and the data stan-dardization degree can be judged by its distribution. That all the black lines in the figure are almost on the same straight line reveals a good standardization degree.

Gene function analysis of osteosarcoma
10403 Int J Clin Exp Med 2015;8(7):10401-10410
Gene function analysis of osteosarcoma
10404 Int J Clin Exp Med 2015;8(7):10401-10410
cluster analysis was per-formed and cluster dendro-gram was constructed. In hierarchical cluster analysis, Pearson coefficient was used in sample cluster analysis and Spearman coefficient in gene expression analysis. Cluster dendrogram was constructed to verify the grouping condi-tion of the original data and filter out those unreasonable clusters.
Re-screening of DEGs and function enrichment analysis
Gene expression profile was rebuilt after hierarchical clus-ter analysis and data filtering. The limma package [12] in R was used to identify DEGs between osteosarcoma sam-ples and normal osteoblasts after data filtering. The adjust-ed P-value < 0.05 and |logFC| > 2 were used as the cut-off criterion. DAVID [18] was app- lied to mine osteosarcoma associated genes and analyze the GO enrichment on gene functions and KEGG path-ways. In this study, osteosar-coma associated genes from DEGs were mined by Disease Module. The Annotation Mo- dule was used to analyze the enrichment of the interested genes in each GO function module or KEGG pathway, and
DEGs screening and hierarchical cluster analy-sis
DEGs between osteosarcoma and normal tis-sues were identified by t-test based on samr package [17] in R language. The genes changed for more than 2 times in gene expression were selected and q-value < 0.1 was used as the cut-off criterion. In order to ensure that the screened DEGs can be good characterizations of osteosarcoma and normal tissues, hierarchy
the FDR (false discovery rate) less than 0.05 was used as the cut-off criterion. All DEGs were mapped onto STRING [19] database to con-struct the protein-protein interaction pairs.
Principal component analysis (PCA) of top10 DEGs
In order to distinguish osteosarcoma tissues from normal osteoblasts, ten significantly up-regulated DEGs were screened for principal
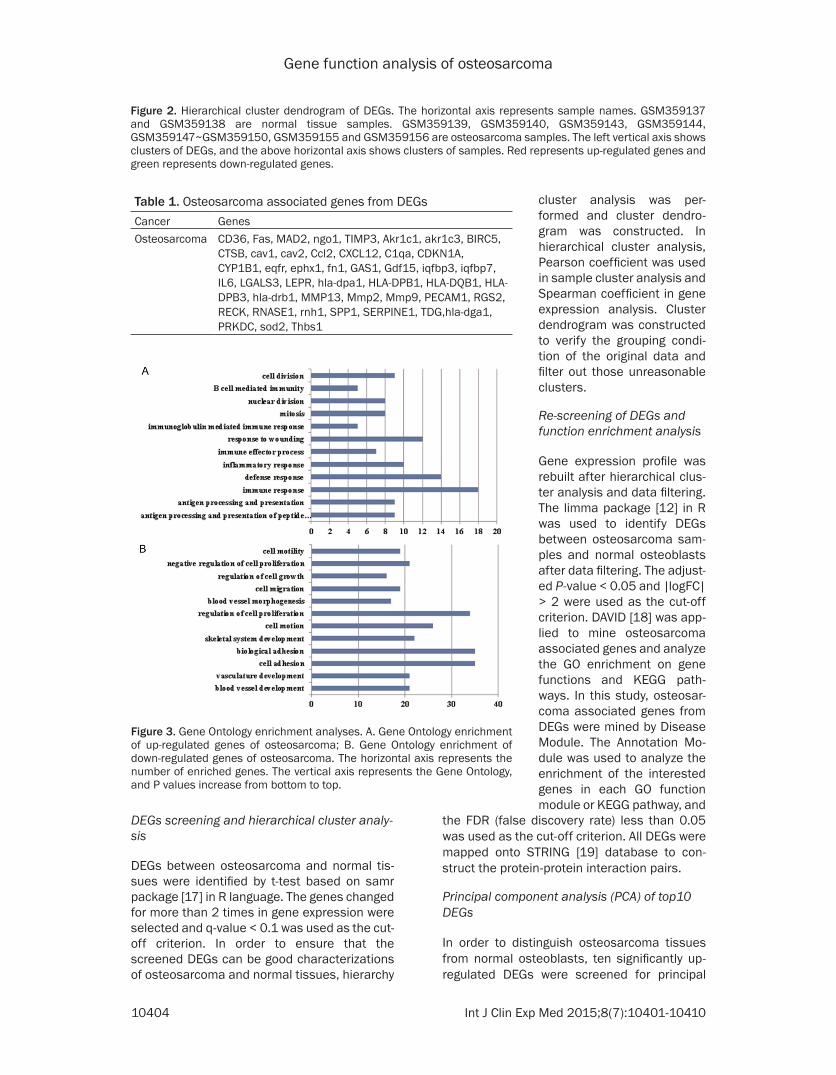
Table 1. Osteosarcoma associated genes from DEGsCancer GenesOsteosarcoma CD36, Fas, MAD2, ngo1, TIMP3, Akr1c1, akr1c3, BIRC5,
CTSB, cav1, cav2, Ccl2, CXCL12, C1qa, CDKN1A, CYP1B1, eqfr, ephx1, fn1, GAS1, Gdf15, iqfbp3, iqfbp7, IL6, LGALS3, LEPR, hla-dpa1, HLA-DPB1, HLA-DQB1, HLA-DPB3, hla-drb1, MMP13, Mmp2, Mmp9, PECAM1, RGS2, RECK, RNASE1, rnh1, SPP1, SERPINE1, TDG,hla-dga1, PRKDC, sod2, Thbs1
Figure 3. Gene Ontology enrichment analyses. A. Gene Ontology enrichment of up-regulated genes of osteosarcoma; B. Gene Ontology enrichment of down-regulated genes of osteosarcoma. The horizontal axis represents the number of enriched genes. The vertical axis represents the Gene Ontology, and P values increase from bottom to top.
Figure 2. Hierarchical cluster dendrogram of DEGs. The horizontal axis represents sample names. GSM359137 and GSM359138 are normal tissue samples. GSM359139, GSM359140, GSM359143, GSM359144, GSM359147~GSM359150, GSM359155 and GSM359156 are osteosarcoma samples. The left vertical axis shows clusters of DEGs, and the above horizontal axis shows clusters of samples. Red represents up-regulated genes and green represents down-regulated genes.

Gene function analysis of osteosarcoma
10405 Int J Clin Exp Med 2015;8(7):10401-10410
DEGs were mapped onto STRING database to build the protein-protein interaction pai- rs. PPI pairs with reliability score higher than 0.4 were screened to construct PPI network of top20 DEGs.
Transcription factor prediction
TfactS database [8] collects target genes of transcription factors after tests. After up- loading the two groups of DEGs to TfactS data-base, four indexes: p-value, q-value, E- value and FDR were utilized to indicate tran-scription factors enrichment. Only when the val-ues of all the four indicators were less than
Figure 4. PPI network of DEGs. The nodes represent the genes and the edges represent the corresponding PPI pairs. Total 323 genes were integrated to the network.
component analysis. PCA is a mathematical algorithm [15] which can not only reduce the data dimension but also concentrate the major-ity of variables. Based on principal component identification, a direction was firstly found, along which the data distributed was named as the maximum to reduce data dimension. Through PCA, we can choose several variables instead of thousands of variables to classify the samples.
PPI network analysis of top20 DEGs
In order to study the interactions among the Top20 DEGs in osteosarcoma group, The Top20

Gene function analysis of osteosarcoma
10406 Int J Clin Exp Med 2015;8(7):10401-10410
cluster and the 2 normal samples in normal sample cluster (Figure 2). The result revealed that grouping was reasonable and the data can be directly applied to further analysis.
Re-screening of DEGs and function enrich-ment analysis
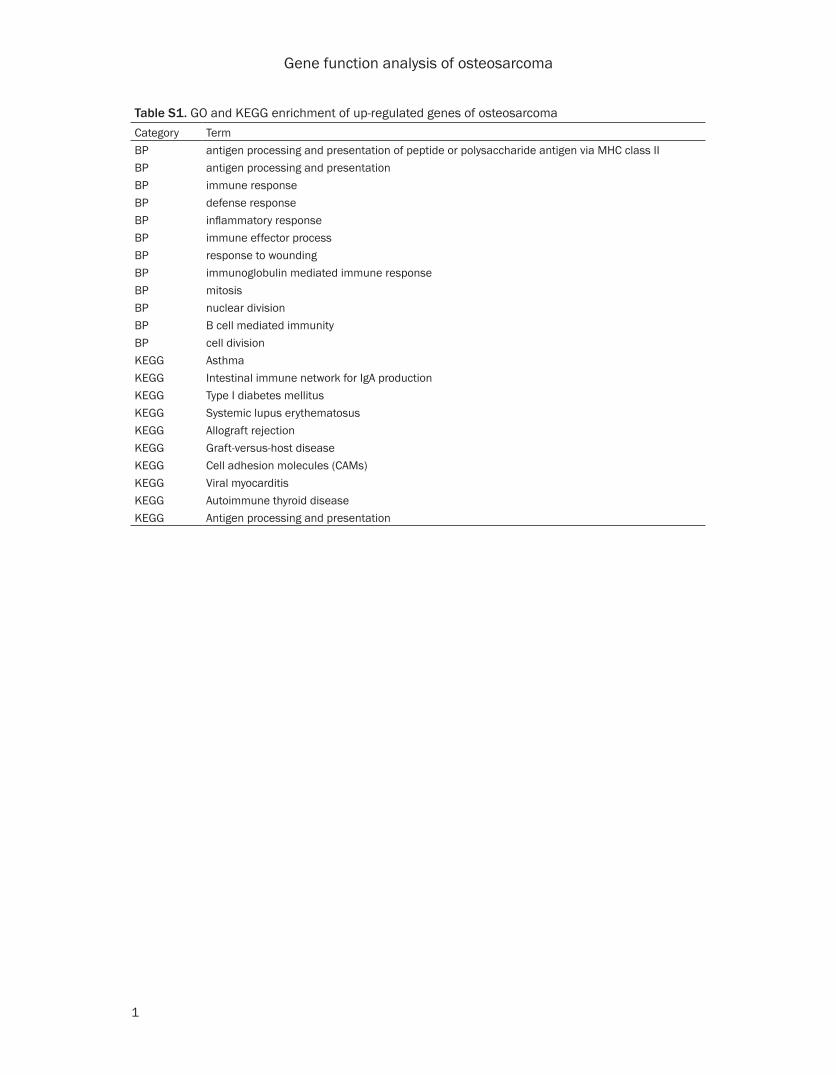
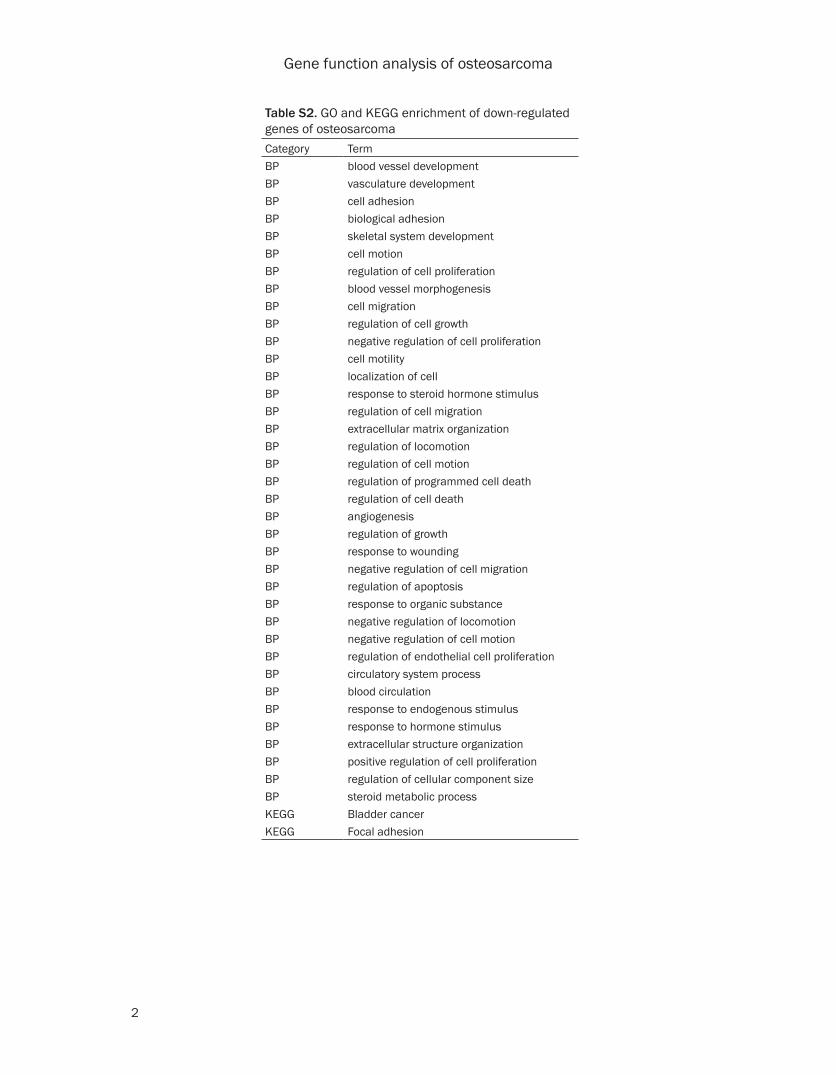
A total of 437 genes were re-screened as DEGs, including 114 up-regulated genes and 323 down-regulated genes. DAVID was used to ana-lyze all the re-screened DEGs. Total 46 osteo-sarcoma associated genes were mined by Disease Module (Table 1). GO and KEGG path-way enrichment analysis showed that the up-regulated genes mainly enriched in the process of immune response, and the down-regulated genes mainly enriched in the development of skeletal and vascular system (Figure 3) (Tables S1 and S2).
Construction of protein-protein interaction (PPI) network of DEGs
All DEGs were mapped onto STRING database to construct the PPI network (Figure 4), and 323 genes were identified to be able to inte-grate to the network.
Principal component analysis (PCA) of top10 DEGs
Ten significantly up-regulated DEGs were screened for principal component analysis. It was shown in Figure 5 that the top 10 DEGs can directly distinguish osteosarcoma tissues from normal tissues. The first principal compo-nent explained 77.95% of the variance in 10 variables, and the second principal component explained 15.38% of the variance. The interpre-tation degree of the cumulative variance was 93.33%.
PPI network analysis of top20 DEGs
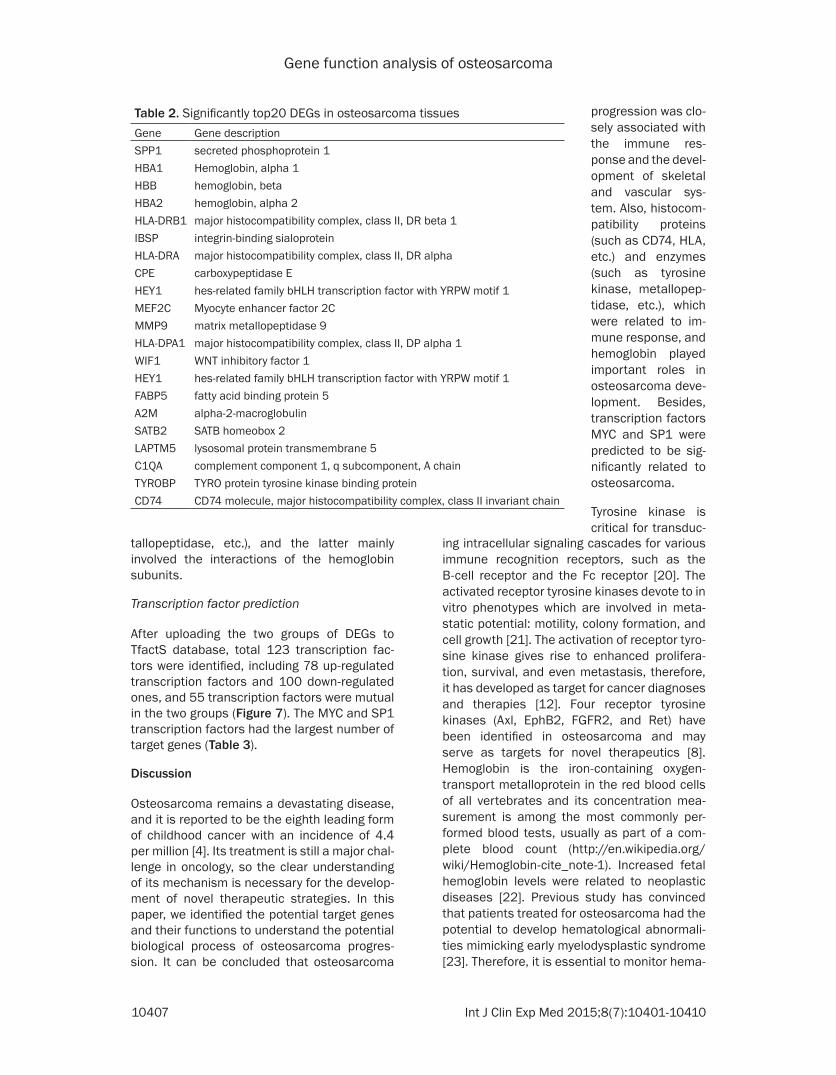
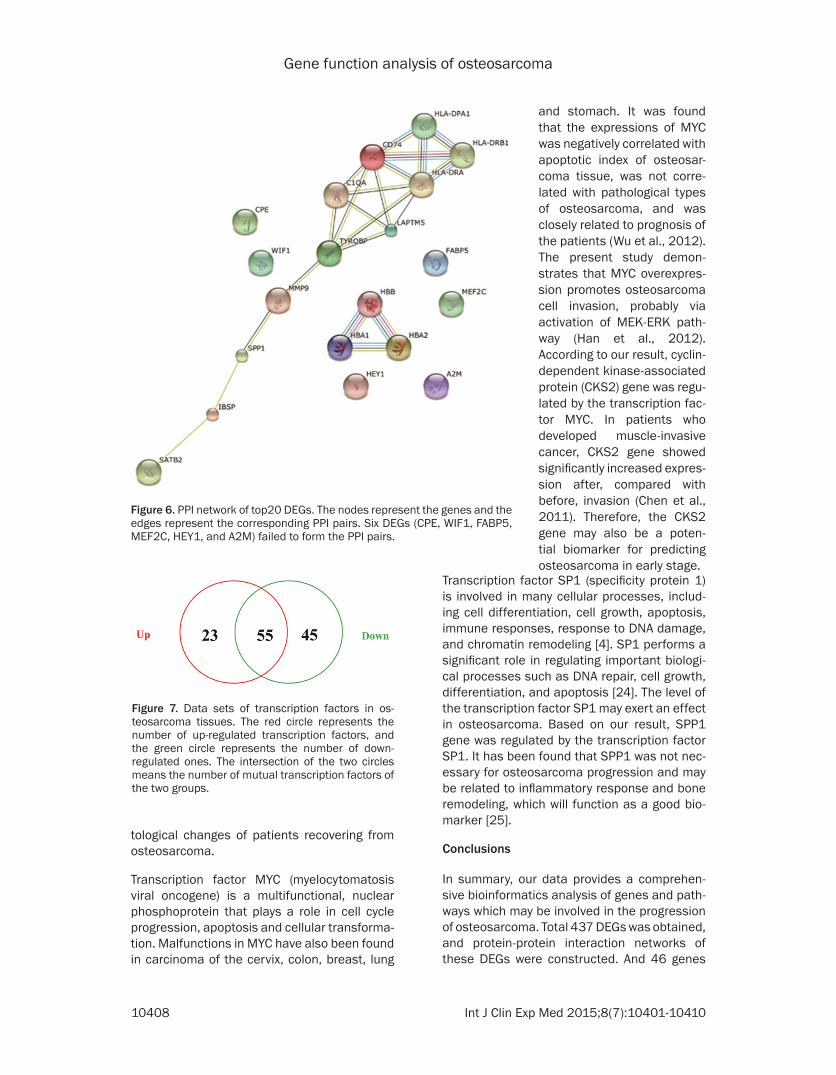
The Top20 DEGs (Table 2) were mapped onto STRING database to construct the protein-pro-tein interaction network (Figure 6). Six DEGs (CPE, WIF1, FABP5, MEF2C, HEY1, and A2M) failed to form the PPI pairs. The PPI network mainly included the histocompatibility complex forming network associated with immune response process and hemoglobin interacting network. The former mainly involved the histo-compatibility proteins (such as CD74, HLA, etc.) and enzymes (such as tyrosine kinase, me-
0.05, target genes of transcription factors could be considered as significant enrichment.
Results
Data preprocessing
The expression profile data were firstly prepro-cessed then analyzed by Affy package in R lan-guage. Total of 13104 genes were screened. Ca- ssette figures before and after data standard-ization was shown in Figure 1. That all the black lines in the figure are almost on the same straight line reveals a good standardization degree.
Differentially expressed genes (DEGs) screen-ing and hierarchical cluster analysis
Total 1608 genes were selected as DEGs, and 545 up-regulated genes and 1063 down-regu-lated genes were included. Hierarchy cluster analysis indicated that the 10 osteosarcoma samples distributed in osteosarcoma sample
Figure 5. Principal component analysis (PCA) of top10 DEGs. The horizontal axis represents the first principal component scores of each sample, and the vertical axis represents the second principal compo-nent scores. The first principal component explained 77.95% of the variance in 10 variables, and the sec-ond principal component explained 15.38% of the variance. The interpretation degree of the cumulative variance was 93.33%. Number 1 and 2 represent the normal samples (2 in total), and number 3-12 represent osteosarcoma tissue samples (10 in total). The red line represents the impact on osteosarcoma tissues of the genetic variables among which the 10 genes were most significantly expressed.
Gene function analysis of osteosarcoma
10407 Int J Clin Exp Med 2015;8(7):10401-10410
progression was clo- sely associated with the immune res- ponse and the devel-opment of skeletal and vascular sys-tem. Also, histocom-patibility proteins (such as CD74, HLA, etc.) and enzymes (such as tyrosine kinase, metallopep-tidase, etc.), which were related to im- mune response, and hemoglobin played important roles in osteosarcoma deve- lopment. Besides, transcription factors MYC and SP1 were predicted to be sig-nificantly related to osteosarcoma.
Tyrosine kinase is critical for transduc-
tallopeptidase, etc.), and the latter mainly involved the interactions of the hemoglobin subunits.
Transcription factor prediction
After uploading the two groups of DEGs to TfactS database, total 123 transcription fac-tors were identified, including 78 up-regulated transcription factors and 100 down-regulated ones, and 55 transcription factors were mutual in the two groups (Figure 7). The MYC and SP1 transcription factors had the largest number of target genes (Table 3).
Discussion
Osteosarcoma remains a devastating disease, and it is reported to be the eighth leading form of childhood cancer with an incidence of 4.4 per million [4]. Its treatment is still a major chal-lenge in oncology, so the clear understanding of its mechanism is necessary for the develop-ment of novel therapeutic strategies. In this paper, we identified the potential target genes and their functions to understand the potential biological process of osteosarcoma progres-sion. It can be concluded that osteosarcoma
ing intracellular signaling cascades for various immune recognition receptors, such as the B-cell receptor and the Fc receptor [20]. The activated receptor tyrosine kinases devote to in vitro phenotypes which are involved in meta-static potential: motility, colony formation, and cell growth [21]. The activation of receptor tyro-sine kinase gives rise to enhanced prolifera-tion, survival, and even metastasis, therefore, it has developed as target for cancer diagnoses and therapies [12]. Four receptor tyrosine kinases (Axl, EphB2, FGFR2, and Ret) have been identified in osteosarcoma and may serve as targets for novel therapeutics [8]. Hemoglobin is the iron-containing oxygen-transport metalloprotein in the red blood cells of all vertebrates and its concentration mea-surement is among the most commonly per-formed blood tests, usually as part of a com-plete blood count (http://en.wikipedia.org/wiki/Hemoglobin-cite_note-1). Increased fetal hemoglobin levels were related to neoplastic diseases [22]. Previous study has convinced that patients treated for osteosarcoma had the potential to develop hematological abnormali-ties mimicking early myelodysplastic syndrome [23]. Therefore, it is essential to monitor hema-
Table 2. Significantly top20 DEGs in osteosarcoma tissuesGene Gene descriptionSPP1 secreted phosphoprotein 1HBA1 Hemoglobin, alpha 1HBB hemoglobin, betaHBA2 hemoglobin, alpha 2HLA-DRB1 major histocompatibility complex, class II, DR beta 1IBSP integrin-binding sialoprotein HLA-DRA major histocompatibility complex, class II, DR alpha CPE carboxypeptidase EHEY1 hes-related family bHLH transcription factor with YRPW motif 1MEF2C Myocyte enhancer factor 2CMMP9 matrix metallopeptidase 9HLA-DPA1 major histocompatibility complex, class II, DP alpha 1WIF1 WNT inhibitory factor 1 HEY1 hes-related family bHLH transcription factor with YRPW motif 1FABP5 fatty acid binding protein 5A2M alpha-2-macroglobulinSATB2 SATB homeobox 2LAPTM5 lysosomal protein transmembrane 5C1QA complement component 1, q subcomponent, A chainTYROBP TYRO protein tyrosine kinase binding proteinCD74 CD74 molecule, major histocompatibility complex, class II invariant chain
Gene function analysis of osteosarcoma
10408 Int J Clin Exp Med 2015;8(7):10401-10410
and stomach. It was found that the expressions of MYC was negatively correlated with apoptotic index of osteosar-coma tissue, was not corre-lated with pathological types of osteosarcoma, and was closely related to prognosis of the patients (Wu et al., 2012). The present study demon-strates that MYC overexpres-sion promotes osteosarcoma cell invasion, probably via activation of MEK-ERK path-way (Han et al., 2012). According to our result, cyclin-dependent kinase-associated protein (CKS2) gene was regu-lated by the transcription fac-tor MYC. In patients who developed muscle-invasive cancer, CKS2 gene showed significantly increased expres-sion after, compared with before, invasion (Chen et al., 2011). Therefore, the CKS2 gene may also be a poten- tial biomarker for predicting osteosarcoma in early stage.
tological changes of patients recovering from osteosarcoma.
Transcription factor MYC (myelocytomatosis viral oncogene) is a multifunctional, nuclear phosphoprotein that plays a role in cell cycle progression, apoptosis and cellular transforma-tion. Malfunctions in MYC have also been found in carcinoma of the cervix, colon, breast, lung
Transcription factor SP1 (specificity protein 1) is involved in many cellular processes, includ-ing cell differentiation, cell growth, apoptosis, immune responses, response to DNA damage, and chromatin remodeling [4]. SP1 performs a significant role in regulating important biologi-cal processes such as DNA repair, cell growth, differentiation, and apoptosis [24]. The level of the transcription factor SP1 may exert an effect in osteosarcoma. Based on our result, SPP1 gene was regulated by the transcription factor SP1. It has been found that SPP1 was not nec-essary for osteosarcoma progression and may be related to inflammatory response and bone remodeling, which will function as a good bio-marker [25].
Conclusions
In summary, our data provides a comprehen-sive bioinformatics analysis of genes and path-ways which may be involved in the progression of osteosarcoma. Total 437 DEGs was obtained, and protein-protein interaction networks of these DEGs were constructed. And 46 genes
Figure 6. PPI network of top20 DEGs. The nodes represent the genes and the edges represent the corresponding PPI pairs. Six DEGs (CPE, WIF1, FABP5, MEF2C, HEY1, and A2M) failed to form the PPI pairs.
Figure 7. Data sets of transcription factors in os-teosarcoma tissues. The red circle represents the number of up-regulated transcription factors, and the green circle represents the number of down-regulated ones. The intersection of the two circles means the number of mutual transcription factors of the two groups.

Gene function analysis of osteosarcoma
10409 Int J Clin Exp Med 2015;8(7):10401-10410
[6] Aung L, Tin AS, Quah TC and Pho RW. Osteogenic sarcoma in children and young adults. Ann Acad Med Singapore 2014; 43: 305-313.
[7] Anninga JK, Gelderblom H, Fiocco M, Kroep JR,
were associated with osteosarcoma. GO and KEGG pathway enrichment analysis showed that genes mainly affected the process of immune response and the development of skel-etal and vascular system. Histocompatibility proteins, enzymes and hemoglobin were close-ly associated with osteosarcoma. Furthermore, we predicted the association of MYC and SP1 with osteosarcoma. The top ten up-regulated genes in osteosarcoma tissue can be used to distinguish cancer samples from normal speci-men. Our discovery may be useful in investigat-ing the complex interacting mechanisms under-lying the disease, and provides a new strategy in the medical therapy of osteosarcoma. However, further experiments are still needed to confirm our result.
Disclosure of conflict of interest
None.
Address correspondence to: Limin Wang, Depart- ment of Orthopedics, First Affiliated Hospital, Zhengzhou University, No. 1, East Jianshe Road, Two-Seven District, Zhengzhou City 450001, Henan Province, China. Tel: 860371-66913114; Fax: 860371-66913114; E-mail: [email protected]
References
[1] Moore DD and Luu HH. Osteosarcoma. Cancer Treat Res 2014; 162: 65-92.
[2] Miao J, Wu S, Peng Z, Tania M and Zhang C. MicroRNAs in osteosarcoma: diagnostic and therapeutic aspects. Tumour Biol 2013; 34: 2093-2098.
[3] Kundu ZS. Classification, imaging, biopsy and staging of osteosarcoma. Indian J Orthop 2014; 48: 238-246.
[4] Ottaviani G and Jaffe N. The epidemiology of osteosarcoma. Cancer Treat Res 2009; 152: 3-13.
[5] Samimi MA, Mirkheshti N and Pazouki A. Assessing the percent of necrosis after neoad-juvant chemotherapy with 24 hr infusional cis-platin/3 days doxorubicin intermittent with if-osfamide-doxorubicin for osteosarcoma. Int J Hematol Oncol Stem Cell Res 2014; 8: 5-8.
Taminiau AH, Hogendoorn PC and Egeler RM. Chemotherapeutic adjuvant treatment for os-teosarcoma: where do we stand? Eur J Cancer 2011; 47: 2431-2445.
[8] Rettew AN, Getty PJ and Greenfield EM. Receptor tyrosine kinases in osteosarcoma: not just the usual suspects. Adv Exp Med Biol 2014; 804: 47-66.
[9] Calvert GT, Randall RL, Jones KB, Cannon-Albright L, Lessnick S and Schiffman JD. At-risk populations for osteosarcoma: the syndromes and beyond. Sarcoma 2012; 2012: 152382.
[10] Lucas MC and Tan SL. Small-molecule inhibi-tors of spleen tyrosine kinase as therapeutic agents for immune disorders: will promise meet expectations? Future Med Chem 2014; 6: 1811-1827.
[11] Yang G, Yuan J and Li K. EMT transcription fac-tors: implication in osteosarcoma. Med Oncol 2013; 30: 697.
[12] Smyth GK. Linear models and empirical bayes methods for assessing differential expression in microarray experiments. Stat Appl Genet Mol Biol 2004; 3: Article3.
[13] Dennis G Jr, Sherman BT, Hosack DA, Yang J, Gao W, Lane HC and Lempicki RA. DAVID: Database for Annotation, Visualization, and Integrated Discovery. Genome Biol 2003; 4: P3.
[14] Conley AB and Jordan IK. Identification of Transcription Factor Binding Sites Derived from Transposable Element Sequences Using ChIP-seq. Computational Biology of Transcription Factor Binding. Springer; 2010. pp. 225-240.
[15] Gautier L, Cope L, Bolstad BM and Irizarry RA. Affy-analysis of Affymetrix GeneChip data at the probe level. Bioinformatics 2004; 20: 307-315.
[16] Irizarry RA, Hobbs B, Collin F, Beazer-Barclay YD, Antonellis KJ, Scherf U and Speed TP. Exploration, normalization, and summaries of high density oligonucleotide array probe level data. Biostatistics 2003; 4: 249-264.
[17] Tusher VG, Tibshirani R and Chu G. Significance analysis of microarrays applied to the ionizing radiation response. Proc Natl Acad Sci U S A 2001; 98: 5116-5121.
[18] Dennis G Jr, Sherman BT, Hosack DA, Yang J, Gao W, Lane HC and Lempicki RA. DAVID: Database for Annotation, Visualization, and
Table 3. Corresponding genes of Transcription factor MYC and SP1Transcrip-tion factor Genes
MYC RGS2, NCAM1, CXCR4, CKS2, CTSC, CCNB1, TPD52, HLA-DPB1SP1 CD163, GGH, CSRP2, NES, MMP9, SPP1, NCAM1
Gene function analysis of osteosarcoma
10410 Int J Clin Exp Med 2015;8(7):10401-10410
[23] Olivares-Esquer JJ, Ortiz-Lazcano S, Aguirre-Gas H, Cervantes-Osorio LF and Gonzalez-Llaven J. [Increased fetal hemoglobin levels in neoplastic diseases. Premlinary report]. Arch Invest Med (Mex) 1975; 6: 413-418.
[24] Dalla-Torre CA, Yoshimoto M, Lee CH, Joshua AM, de Toledo SR, Petrilli AS, Andrade JA, Chilton-MacNeill S, Zielenska M and Squire JA. Effects of THBS3, SPARC and SPP1 expression on biological behavior and survival in patients with osteosarcoma. BMC Cancer 2006; 6: 237.
[25] Raychaudhuri S, Stuart JM and Altman RB. Principal components analysis to summarize microarray experiments: application to sporu-lation time series. Pac Symp Biocomput 2000; 455-466.
Integrated Discovery. Genome Biol 2003; 4: P3.
[19] Szklarczyk D, Franceschini A, Kuhn M, Simonovic M, Roth A, Minguez P, Doerks T, Stark M, Muller J and Bork P. The STRING data-base in 2011: functional interaction networks of proteins, globally integrated and scored. Nucleic Acids Res 2011; 39: D561-D568.
[20] Lohmann DJ and Hasle H. Hematological changes mimicking myelodysplastic syndrome following treatment for osteosarcoma. J Pediatr Hematol Oncol 2014; [Epub ahead of print].
[21] Lee BH, Ryu PD and Lee SY. Serum starvation-induced voltage-gated potassium channel Kv7.5 expression and its regulation by Sp1 in canine osteosarcoma cells. Int J Mol Sci 2014; 15: 977-993.
[22] Pan W, Dong Z, Meng W, Zhang W, Li T, Li C, Zhang B and Chen L. Improvement of influenza vaccine strain A/Vietnam/1194/2004 (H5N1) growth with the neuraminidase packaging se-quence from A/Puerto Rico/8/34. Hum Vaccin Immunother 2012; 8: 252-259.
Gene function analysis of osteosarcoma
1
Table S1. GO and KEGG enrichment of up-regulated genes of osteosarcomaCategory TermBP antigen processing and presentation of peptide or polysaccharide antigen via MHC class IIBP antigen processing and presentationBP immune responseBP defense responseBP inflammatory responseBP immune effector processBP response to woundingBP immunoglobulin mediated immune responseBP mitosisBP nuclear divisionBP B cell mediated immunityBP cell divisionKEGG AsthmaKEGG Intestinal immune network for IgA productionKEGG Type I diabetes mellitusKEGG Systemic lupus erythematosusKEGG Allograft rejectionKEGG Graft-versus-host diseaseKEGG Cell adhesion molecules (CAMs)KEGG Viral myocarditisKEGG Autoimmune thyroid diseaseKEGG Antigen processing and presentation
Gene function analysis of osteosarcoma
2
Table S2. GO and KEGG enrichment of down-regulated genes of osteosarcomaCategory TermBP blood vessel developmentBP vasculature developmentBP cell adhesionBP biological adhesionBP skeletal system developmentBP cell motionBP regulation of cell proliferationBP blood vessel morphogenesisBP cell migrationBP regulation of cell growthBP negative regulation of cell proliferationBP cell motilityBP localization of cellBP response to steroid hormone stimulusBP regulation of cell migrationBP extracellular matrix organizationBP regulation of locomotionBP regulation of cell motionBP regulation of programmed cell deathBP regulation of cell deathBP angiogenesisBP regulation of growthBP response to woundingBP negative regulation of cell migrationBP regulation of apoptosisBP response to organic substanceBP negative regulation of locomotionBP negative regulation of cell motionBP regulation of endothelial cell proliferationBP circulatory system processBP blood circulationBP response to endogenous stimulusBP response to hormone stimulusBP extracellular structure organizationBP positive regulation of cell proliferationBP regulation of cellular component sizeBP steroid metabolic processKEGG Bladder cancerKEGG Focal adhesion