Original Article Factor Structure and Reliability of the ...
7
www.mjms.usm.my © Penerbit Universiti Sains Malaysia, 2012 For permission, please email:[email protected] Original Article Factor Structure and Reliability of the Malay Version of the Perceived Stress Scale among Malaysian Medical Students Sami Abdo Radman AL-DubAi 1 , Mustafa Ahmed ALshAggA 2 , Krishna Gopal RAmpAL 3 , Nik Aziz suLAimAn 2 1 Department of Community Medicine, International Medical School, Management and Science University (MSU) , 40100, Shah Alam, Selangor, Malaysia 2 Department of Pharmacology, Faculty of Medicine, Cyberjaya University College of Medical Sciences (CUCMS), 63000 Cyberjaya, Selangor, Malaysia 3 Perdana University Graduate School of Medicine, Perdana University, Maeps Building, Mardi Complex, 43400, Serdang, Selangor, Malaysia Submitted: 18 Dec 2011 Accepted: 3 March 2012 Abstract Background: The Perceived Stress Scale 10 (PSS-10) is a validated and reliable instrument to measure global levels of perceived stress. This study aims to assess the internal consistency, reliability, and factor structure of the Malay version of the PSS-10 for use among medical students. Methods: The original English version of the PSS-10 was translated and back-translated into Malay language. The Malay version was distributed to 242 Bachelor of Medical Science students in a private university in Malaysia. Test–retest reliability was assessed in 70 students. An exploratory principal component factor analysis with varimax rotation was performed. Reliability was tested using the intraclass correlation coefficient (ICC). Results: All 242 students participated in the initial questionnaire study (validity and factor structure), and 70 students participated in the test–retest reliability of the study. Exploratory factor analysis yielded 2 factors that accounted for 57.8% of the variance. Cronbach’s alpha coefficients for the 2 factors were 0.85 and 0.70, respectively. The reliability test showed an ICC of 0.82 (95% CI: 0.70, 0.89). Conclusion: The Malay version of the PSS-10 showed adequate psychometric properties. It is a useful instrument for measuring stress among medical students in Malaysia. Keywords: Malaysia, medical, psychological, reliability and validity, stress, students Introduction Medical education is stressful and demanding. Previous studies have shown high levels of stress among medical students (1,2). Stress may affect academic performance and students’ physical and mental health (3). Health behaviour may also be affected by stress, as reported by previous studies (4,5). A significant association has been found between stress and sleep disturbances, eating habits (such as infrequently eating breakfast), a lack of physical exercise, alcohol consumption, and smoking and drug consumption (6). Recent studies have also found that perceived stress was associated with low quality of life (7) and with premature death (8). A study found that 2.7% of Swedish students had attempted suicide (2). In 1984, Lazarus and Folkman (9) proposed that psychological stress involves the relationship between an individual and an environment that is appraised by the individual as threatening or overwhelming to his resources and well- being. Accordingly, both internal and external conditions must exist for a stress response to occur; the relation and interaction of these conditions generate the occurrence of stress (10). Stress occurs when an individual is confronted by a situation that the individual perceives as overwhelming (10). The degree of stress is related to the intensity of this threat and to the beliefs and expectations that individuals believe may be achieved or thwarted (9). The importance of research on perceived stress suggests the need for valid and reliable instruments to measure and assess global 43 Malays J Med Sci. Jul-Sep 2012; 19(3): 43-49
Transcript of Original Article Factor Structure and Reliability of the ...

www.mjms.usm.my © Penerbit Universiti Sains Malaysia, 2012For permission, please email:[email protected]
Original Article Factor Structure and Reliability of the Malay Version of the Perceived Stress Scale among Malaysian Medical StudentsSami Abdo Radman AL-DubAi1, Mustafa Ahmed ALshAggA2, Krishna Gopal RAmpAL3, Nik Aziz suLAimAn2
1 DepartmentofCommunityMedicine,InternationalMedicalSchool,ManagementandScienceUniversity(MSU),40100,ShahAlam,Selangor,Malaysia
2DepartmentofPharmacology,FacultyofMedicine,CyberjayaUniversityCollegeofMedicalSciences(CUCMS),63000Cyberjaya,Selangor,Malaysia
3PerdanaUniversityGraduateSchoolofMedicine,PerdanaUniversity,MaepsBuilding,MardiComplex,43400,Serdang,Selangor,Malaysia
Submitted: 18 Dec 2011Accepted: 3 March 2012
Abstract Background:ThePerceivedStressScale10(PSS-10)isavalidatedandreliableinstrumenttomeasure global levels of perceived stress. This study aims to assess the internal consistency,reliability,andfactorstructureoftheMalayversionofthePSS-10foruseamongmedicalstudents. Methods:TheoriginalEnglishversionofthePSS-10wastranslatedandback-translatedintoMalaylanguage.TheMalayversionwasdistributedto242BachelorofMedicalSciencestudentsinaprivateuniversityinMalaysia.Test–retestreliabilitywasassessedin70students.Anexploratoryprincipalcomponent factoranalysiswithvarimaxrotationwasperformed.Reliabilitywas testedusingtheintraclasscorrelationcoefficient(ICC). Results: All242studentsparticipatedintheinitialquestionnairestudy(validityandfactorstructure), and 70 students participated in the test–retest reliability of the study. Exploratoryfactor analysis yielded 2 factors that accounted for 57.8% of the variance. Cronbach’s alphacoefficientsforthe2factorswere0.85and0.70,respectively.ThereliabilitytestshowedanICCof0.82(95%CI:0.70,0.89). Conclusion: TheMalay version of the PSS-10 showed adequate psychometric properties.ItisausefulinstrumentformeasuringstressamongmedicalstudentsinMalaysia.
Keywords: Malaysia,medical,psychological,reliabilityandvalidity,stress,students
Introduction
Medical education is stressful and demanding. Previous studies have shown high levels of stress among medical students (1,2). Stress may affect academic performance and students’ physical and mental health (3). Health behaviour may also be affected by stress, as reported by previous studies (4,5). A significant association has been found between stress and sleep disturbances, eating habits (such as infrequently eating breakfast), a lack of physical exercise, alcohol consumption, and smoking and drug consumption (6). Recent studies have also found that perceived stress was associated with low quality of life (7) and with premature death (8). A study found that 2.7% of Swedish students had attempted suicide (2).
In 1984, Lazarus and Folkman (9) proposed that psychological stress involves the relationship between an individual and an environment that is appraised by the individual as threatening or overwhelming to his resources and well-being. Accordingly, both internal and external conditions must exist for a stress response to occur; the relation and interaction of these conditions generate the occurrence of stress (10). Stress occurs when an individual is confronted by a situation that the individual perceives as overwhelming (10). The degree of stress is related to the intensity of this threat and to the beliefs and expectations that individuals believe may be achieved or thwarted (9). The importance of research on perceived stress suggests the need for valid and reliable instruments to measure and assess global
43Malays J Med Sci. Jul-Sep 2012; 19(3): 43-49

44 www.mjms.usm.my
Malays J Med Sci. Jul-Sep 2012; 19(3): 43-49
perceptions of stress. Cohen et al. (11) stated that an assessment scale for global perceptions of stress could provide a variety of valuable functions. These authors suggested that Lazarus’ proposals about stress were not accompanied by valid measurements of perceived stress. Hence, they created the Perceived Stress Scale (PSS) to measure the degree to which life events are appraised as stressful. This scale is one of the few scales that assess generalised perceptions of stress (12). The PSS measures the degree to which life events are appraised as stressful (12). This method of assessing stress reflects the definition of psychological stress proposed by Lazarus and Folkman (9). In this scale, perceived stress is viewed as an outcome variable that measures the level of stress experienced as a function of objective stressful events, coping processes, and personality factors (6). Additionally, the scale can provide information about the processes through which stressful events influence pathology. It can be used in conjunction with an objective scale to determine whether self-appraised stress mediates the relationship between objective stress and illness (6). This scale was specifically designed for use with community samples with at least a junior high school education (11). Regarding the validity and reliability of the original (English) version of the PSS, a study by Cohen and Williamson (6) included exploratory factor analysis with principal component analysis and varimax rotation as part of the statistical analysis procedures. The results showed 2 factors that conjointly accounted for 41.6% of the variance (25.9% for the first factor and 15.7% for the second factor). Cronbach’s alpha for the total scale was 0.78. This scale has become one of the most widely used instruments for measuring perceived stress and has been translated into several languages; including Spanish, Turkish, Japanese, and Chinese (13–16,19). The PSS-10 was used in our study because it is a brief, easy-to-use version with equivalent psychometric properties to the PSS-14, as recommended by Cohen and William (6). The objectives of this study were to assess the internal consistency, reliability, and factor structure of the Malay version of the PSS-10 for use among medical students.
Subjects and Methods
Participants Of the 249 students enrolled in the Bachelor of Medical Science program at a private
university in Malaysia, all 242 students who were present on the day of the data collection participated in this study. 7 students who were absent on the day of the data collection were excluded from this study. After permission was obtained from the ethical committee of the faculty for access to the students, the investigators visited the students before or after a lecture and distributed the questionnaire to students who agreed to participate.
Instruments
PerceivedStressScale The PSS-10 assesses perceived stressful experiences or stress responses over the previous month with a 5-point Likert scale (0 = never and 4 = very often). PSS-10 scores are obtained by reversing the responses (e.g., 0 = 4, 1 = 3, 2 = 2, 3 = 1, and 4 = 0) to the 4 positively stated items (items 4, 5, 7, and 8) and then summing across all scale items. The scores range from 0–40, with higher scores indicating greater stress.
Translation This study used a forward–backward translation procedure. In this procedure, a forward translation was produced from the original language (English) to Malay language. The Malay language version was then translated back into the English language and compared to the original version. Errors in the target language version were identified through changes in meaning that arose in the back translation. This procedure was repeated until a satisfactory translation was obtained. The final version was reviewed by an expert. The final Malay version was pilot tested on 10 students who did not participate in the study. These students were asked to complete the questionnaire for the pilot study. Additional grammatical errors and misspellings were subsequently corrected.
Procedure The students were informed verbally of the research objectives and benefits. They were informed that they had the option to participate in the study and that their participation would not affect their progress in the course. Confidentiality was assured and written consent was obtained. Test–retest reliability was conducted among 74 students. These students were asked to choose and remember a code name to maintain their anonymity. 3 weeks after the initial testing, retesting was conducted by distributing the same questionnaire. The
Original Article | The Malay version of the PSS
www.mjms.usm.my 45
students were asked to use the same code as in the previous test. Questionnaires without an accurate code were excluded. 70 questionnaires were considered valid for the reliability study.
Statisticalanalysis The data analysis was performed using SPSS version 16 (SPSS Inc., IL, US). Total scores were obtained by summing across all 10 items after reversing the scores on the 4 positive items. A test of normality was conducted, and an exploratory factor analysis of the 10-item questionnaire was performed using a principal component method with varimax rotation (6,17). Correlation analyses, the Kaiser-Meyer-Olkin (KMO) and Bartlett’s Test of Sphericity were used. Cronbach’s alpha was used to test the internal consistency of the questionnaire. Reliability was tested using the intraclass correlation coefficient (ICC) for the sum scores. The values of the ICC vary from 1 (perfectly reliable) to 0 (totally unreliable) (18).
Results
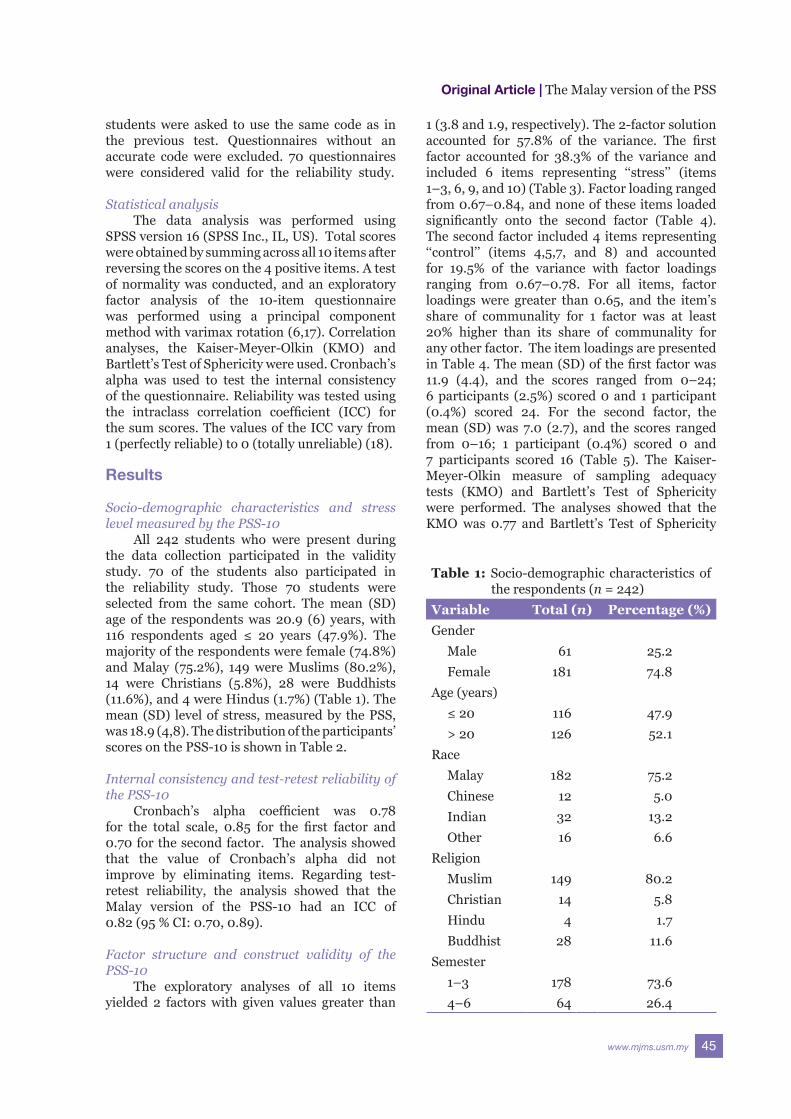
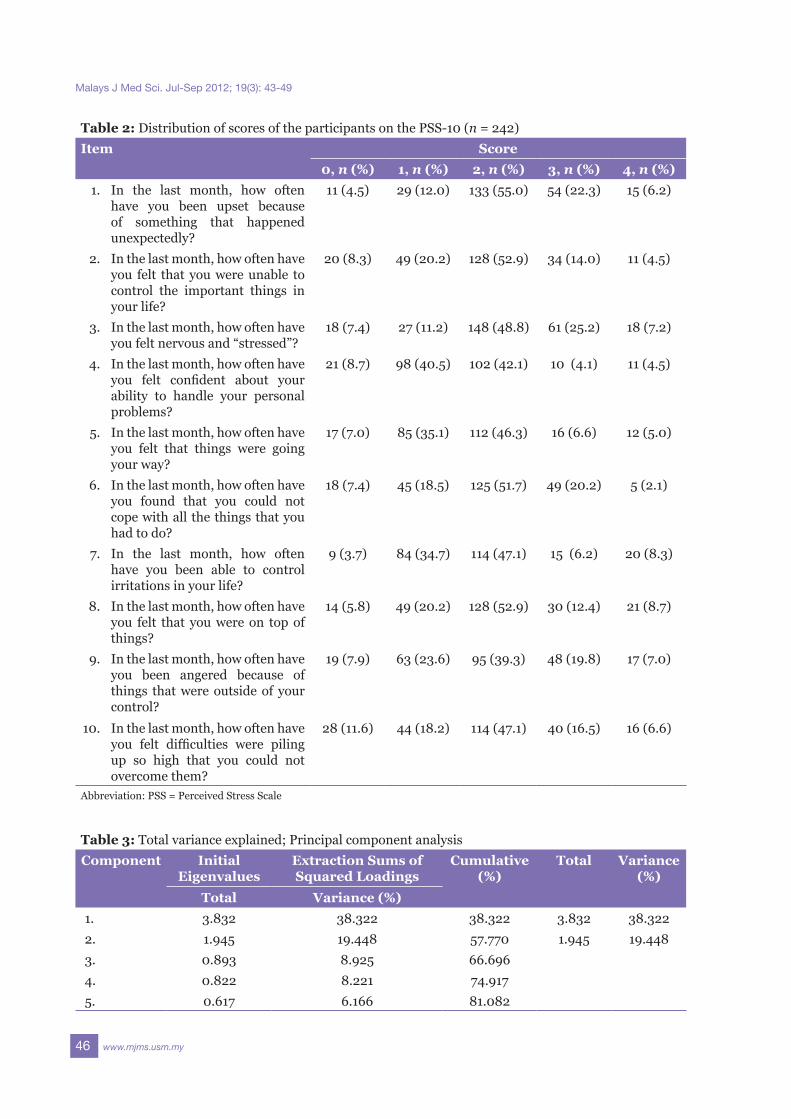
Socio-demographic characteristics and stresslevelmeasuredbythePSS-10 All 242 students who were present during the data collection participated in the validity study. 70 of the students also participated in the reliability study. Those 70 students were selected from the same cohort. The mean (SD) age of the respondents was 20.9 (6) years, with 116 respondents aged ≤ 20 years (47.9%). The majority of the respondents were female (74.8%) and Malay (75.2%), 149 were Muslims (80.2%), 14 were Christians (5.8%), 28 were Buddhists (11.6%), and 4 were Hindus (1.7%) (Table 1). The mean (SD) level of stress, measured by the PSS, was 18.9 (4,8). The distribution of the participants’ scores on the PSS-10 is shown in Table 2.
Internalconsistencyandtest-retestreliabilityofthePSS-10 Cronbach’s alpha coefficient was 0.78 for the total scale, 0.85 for the first factor and 0.70 for the second factor. The analysis showed that the value of Cronbach’s alpha did not improve by eliminating items. Regarding test-retest reliability, the analysis showed that the Malay version of the PSS-10 had an ICC of 0.82 (95 % CI: 0.70, 0.89).
Factor structure and construct validity of thePSS-10 The exploratory analyses of all 10 items yielded 2 factors with given values greater than
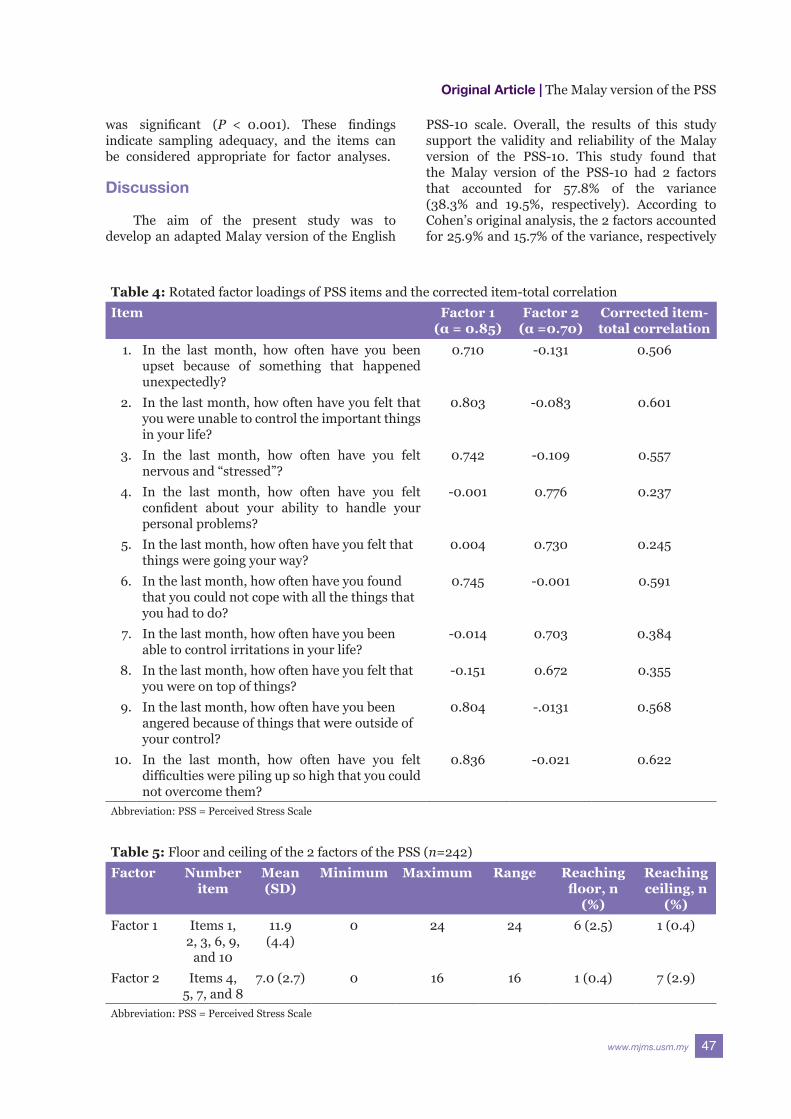
1 (3.8 and 1.9, respectively). The 2-factor solution accounted for 57.8% of the variance. The first factor accounted for 38.3% of the variance and included 6 items representing ‘‘stress’’ (items 1–3, 6, 9, and 10) (Table 3). Factor loading ranged from 0.67–0.84, and none of these items loaded significantly onto the second factor (Table 4). The second factor included 4 items representing ‘‘control’’ (items 4,5,7, and 8) and accounted for 19.5% of the variance with factor loadings ranging from 0.67–0.78. For all items, factor loadings were greater than 0.65, and the item’s share of communality for 1 factor was at least 20% higher than its share of communality for any other factor. The item loadings are presented in Table 4. The mean (SD) of the first factor was 11.9 (4.4), and the scores ranged from 0–24; 6 participants (2.5%) scored 0 and 1 participant (0.4%) scored 24. For the second factor, the mean (SD) was 7.0 (2.7), and the scores ranged from 0–16; 1 participant (0.4%) scored 0 and 7 participants scored 16 (Table 5). The Kaiser-Meyer-Olkin measure of sampling adequacy tests (KMO) and Bartlett’s Test of Sphericity were performed. The analyses showed that the KMO was 0.77 and Bartlett’s Test of Sphericity
Table 1: Socio-demographic characteristics of the respondents (n = 242)
Variable Total(n) Percentage(%)Gender
Male 61 25.2Female 181 74.8
Age (years)≤ 20 116 47.9> 20 126 52.1
RaceMalay 182 75.2Chinese 12 5.0Indian 32 13.2Other 16 6.6
ReligionMuslim 149 80.2Christian 14 5.8Hindu 4 1.7Buddhist 28 11.6
Semester1–3 178 73.64–6 64 26.4
46 www.mjms.usm.my
Malays J Med Sci. Jul-Sep 2012; 19(3): 43-49
Table2: Distribution of scores of the participants on the PSS-10 (n = 242)Item Score
0,n(%) 1,n(%) 2,n(%) 3,n(%) 4,n(%)1. In the last month, how often
have you been upset because of something that happened unexpectedly?
11 (4.5) 29 (12.0) 133 (55.0) 54 (22.3) 15 (6.2)
2. In the last month, how often have you felt that you were unable to control the important things in your life?
20 (8.3) 49 (20.2) 128 (52.9) 34 (14.0) 11 (4.5)
3. In the last month, how often have you felt nervous and “stressed”?
18 (7.4) 27 (11.2) 148 (48.8) 61 (25.2) 18 (7.2)
4. In the last month, how often have you felt confident about your ability to handle your personal problems?
21 (8.7) 98 (40.5) 102 (42.1) 10 (4.1) 11 (4.5)
5. In the last month, how often have you felt that things were going your way?
17 (7.0) 85 (35.1) 112 (46.3) 16 (6.6) 12 (5.0)
6. In the last month, how often have you found that you could not cope with all the things that you had to do?
18 (7.4) 45 (18.5) 125 (51.7) 49 (20.2) 5 (2.1)
7. In the last month, how often have you been able to control irritations in your life?
9 (3.7) 84 (34.7) 114 (47.1) 15 (6.2) 20 (8.3)
8. In the last month, how often have you felt that you were on top of things?
14 (5.8) 49 (20.2) 128 (52.9) 30 (12.4) 21 (8.7)
9. In the last month, how often have you been angered because of things that were outside of your control?
19 (7.9) 63 (23.6) 95 (39.3) 48 (19.8) 17 (7.0)
10. In the last month, how often have you felt difficulties were piling up so high that you could not overcome them?
28 (11.6) 44 (18.2) 114 (47.1) 40 (16.5) 16 (6.6)
Abbreviation: PSS = Perceived Stress Scale
Table3: Total variance explained; Principal component analysisComponent Initial
EigenvaluesExtractionSumsofSquaredLoadings
Cumulative(%)
Total Variance(%)
Total Variance(%)1. 3.832 38.322 38.322 3.832 38.3222. 1.945 19.448 57.770 1.945 19.4483. 0.893 8.925 66.6964. 0.822 8.221 74.9175. 0.617 6.166 81.082
Original Article | The Malay version of the PSS
www.mjms.usm.my 47
was significant (P < 0.001). These findings indicate sampling adequacy, and the items can be considered appropriate for factor analyses.
Discussion
The aim of the present study was to develop an adapted Malay version of the English
Table4: Rotated factor loadings of PSS items and the corrected item-total correlationItem Factor1
(α=0.85)Factor2(α=0.70)
Correcteditem-totalcorrelation
1. In the last month, how often have you been upset because of something that happened unexpectedly?
0.710 -0.131 0.506
2. In the last month, how often have you felt that you were unable to control the important things in your life?
0.803 -0.083 0.601
3. In the last month, how often have you felt nervous and “stressed”?
0.742 -0.109 0.557
4. In the last month, how often have you felt confident about your ability to handle your personal problems?
-0.001 0.776 0.237
5. In the last month, how often have you felt that things were going your way?
0.004 0.730 0.245
6. In the last month, how often have you found that you could not cope with all the things that you had to do?
0.745 -0.001 0.591
7. In the last month, how often have you been able to control irritations in your life?
-0.014 0.703 0.384
8. In the last month, how often have you felt that you were on top of things?
-0.151 0.672 0.355
9. In the last month, how often have you been angered because of things that were outside of your control?
0.804 -.0131 0.568
10. In the last month, how often have you felt difficulties were piling up so high that you could not overcome them?
0.836 -0.021 0.622
Abbreviation: PSS = Perceived Stress Scale
PSS-10 scale. Overall, the results of this study support the validity and reliability of the Malay version of the PSS-10. This study found that the Malay version of the PSS-10 had 2 factors that accounted for 57.8% of the variance (38.3% and 19.5%, respectively). According to Cohen’s original analysis, the 2 factors accounted for 25.9% and 15.7% of the variance, respectively
Table5: Floor and ceiling of the 2 factors of the PSS (n=242)Factor Number
itemMean(SD)
Minimum Maximum Range Reachingfloor,n(%)
Reachingceiling,n
(%)Factor 1 Items 1,
2, 3, 6, 9, and 10
11.9 (4.4)
0 24 24 6 (2.5) 1 (0.4)
Factor 2 Items 4, 5, 7, and 8
7.0 (2.7) 0 16 16 1 (0.4) 7 (2.9)
Abbreviation: PSS = Perceived Stress Scale
48 www.mjms.usm.my
Malays J Med Sci. Jul-Sep 2012; 19(3): 43-49
(6). Previous research on different language versions of the PSS-10 found that the PSS-10 had 2 latent factors and that 2 factors accounted for 52% to 58% of the variance (13–16,19). The minimum acceptable value for factor loading is 0.30 (20). In 1988, Cohen and Williamson (6) found that the factor loadings of the scale items were 0.42 and higher. In the current study, all items met this criteria, and the factor loadings were high (ranging from 0.67–0.84). Previous studies found a minimum factor loading of 0.32 and a maximum of 0.88 (13–16,19). In this study, the first factor weighted most heavily items that were negatively worded (e.g., been upset, unable to control things, felt nervous, and stressed) and the second factor reflected positively worded items (e.g., able to control irritation and ability to handle personal problems). Similar findings were reported by Cohen and Williamson (6). Hewitt et al. (21) called the first factor ‘‘perceived distress’’ because it included items referring to negative affective reactions. In contrast, the second factor was labelled ‘‘perceived coping’’ because it included items reflecting perceptions of coping ability for stressful events. Cronbach’s alpha coefficient was 0.78 for the 10 items of the Malay PSS, which was similar to that reported for the original version (0.78) (6). Cronbach’s alpha coefficient was 0.85 for the first factor and 0.70 for the second factor. Both are acceptable and not far from the values reported in the original version (0.72–0.81) (21). A Cronbach’s alpha of 0.70 or more was considered acceptable (22). The test-retest reliability in this study for the 3 week interval was good (ICC above the criterion of 0.75)(23). A 3-weeks interval for test-retest reliability was used in this study to ensure comparability with other studies (14). Cohen et al. (11) found a test-retest reliability of 0.85 and 0.55 for 2-days and 6-weeks intervals, respectively.
Limitationsofthestudy The use of a homogeneous sample of undergraduate students from only 1 university and 1 college may have affected the generalisability of this study. Another limitation of this study is the absence of concurrent validity assessment, which is recommended for future studies.
Conclusion
The present study of a sample of undergraduate university students demonstrates that the Malay version of the PSS-10 is a reliable and valid measure of stress among medical
students in Malaysia. Future research should involve more diverse, heterogeneous samples to rule out the effect of sample homogeneity on the results. Research on the concurrent validity of this measure is recommended.
Authors’ Contributions
Conception and design, analysis and interpretation of the data, drafting of the article, and Collection and assembly of data: SARADConception and design and assembly of data: MAACritical revision of the article for important intellectual content and final approval of the article: KGRAdministrative, technical, or logistic support: AAS
Correspondence
Dr Sami Abdo Radman AL-DUBAIPhD Occupational Medicine (UKM)Department of Community MedicineInternational Medical School Management and Science University (MSU) University Drive, Off Persiaran OlahragaSection 13, 40100 Shah AlamSelangor, MalaysiaTel: +6017 359 6550Fax: +603 5511 2848E-mail: [email protected]
Reference
1. Shaikh BT, Kahloon A, Kazmi M, Khalid H, Nawaz K, Khan NA, et al. Students, stress, and coping strategies: A case of Pakistani medical school. EducHealth. 2004; 17(3):346–353.
2. Dahlin M, Joneborg N, Runeson B. Stress and depression among medical students: A cross sectional study.MedEduc. 2005;39(6):594–604.
3. Gisele M. Stress in graduate medical degree. MedJAust. 2002;177(1):S10–S11.
4. Hughes RB, Taylor HB, Robinson-Whelen S, Nosek MA. Stress and women with physical disabilities: Identifying correlates. Women’s Health Issues. 2005;15(1):14–20.
5. Kemeny ME. The psychobiology of stress. CurrDirPsycholSci. 2003;12(4):124–129.
6. Cohen S, Williamson G. Perceived stress in a probability sample of the United States. In: Spacapan S, Oskamp S, editors. Thesocialpsychologyofhealth:Claremontsymposiumonappliedsocialpsychology. Newbury Park, CA: Sage Publications; 1988: p. 31–67.
7. Steptoe A, Marmot M. Burden of psychosocial adversity and vulnerability in middle age: Associations with biobehavioral risk factors and quality of life. PsychosomMed. 2003;65(6):1029–1037.
Original Article | The Malay version of the PSS
www.mjms.usm.my 49
8. Nielsen NR, Kristensen TS, Schnohr P, Gronbaek M. Perceived stress and cause-specific mortality among men and women: Results from a prospective cohort study. AmJEpidemiol. 2008;168(5):481–491.
9. Lazarus RS, Folkman S. Stress, coping, and adaptation. New York: Springer. 1984.
10. Agolla JE, Ongori H. An assessment of academic stress among undergraduate students: The case of University of Botswana. EducResRev. 2009;4(2):63–70.
11. Cohen S, Kamarck T, Mermelstein S. A global measure of perceived stress. J Health Soc Behav. 1983;24(4):385–396.
12. Chen CH, Tseng YF, Chou FH, Wang SY. Effects of support group intervention in postnatally distressed women: A controlled study in Taiwan. JPsychosomRes. 2000;49(6):395–399.
13. Reis RS, Hino AA, Anez CR. Perceived stress scale: Reliability and validity study in Brazil. J HealthPsychol. 2010;15(1):107–114.
14. Erci B. Reliability and validity of the Turkish Version of Perceived Stress Scale. Dergisi Ataturk UnivHemşirelikYuksekokuluDergisi. 2006;9(1):58–63.
15. Mimura C, Griffiths P. A Japanese version of the perceived stress scale: Translation and preliminary test. IntJNursStud. 2004;41(4):379–385.
16. Yu R, Ho SC. Psychometric evaluation of the perceived stress scale in early postmenopausal Chinese women. Psychol. 2010;1(1):1–8.
17. Carver CS, Scheier MF, Weintraub JK. Assessing coping strategies: A theoretically based approach. JPersSocPsychol. 1989;56(2):267–283.
18. Deyo RA, Dichr P, Patrick DL. Reproducibility and responsiveness of health status measures. ControlClinTrials. 1991;12(Suppl1):S142–S158.
19. Wongpakaran N, Wongpakaran T. The Thai version of the PSS-10: An investigation of its psychometric properties. BiopsychosocMed. 2010;4:6.
20. Burns N, Grove SK. Thepracticeofnursingresearchconduct,critique,andutilization. 2nd ed. St. Louis: Elsavier Saunders; 1993.
21. Hewitt PL, Flett GL, Mosher SW. The Perceived Stress Scale: Factor structure and relation to depression symptoms in a psychiatric sample. J PsychopatholBehavAssess. 1992;14(3):247–257.
22. Schmitt M. Uses and abuse of coefficient alpha. PsycholAssessment. 1996;8(4):350–355.
23. Lee J, Koh D, Ong CN. Statistical evaluation of agreement between two methods for measuring quantitative variables. Comput Biol Med. 1989;19(1):61–70.