
Origin Energy Limited ABN 30 000 051 696 A nnu Al R epo R ...
136
ANNUAL REPORT 2010 Acting for Tomorrow. STRATEGY PERFORMANCE GROWTH
Transcript of Origin Energy Limited ABN 30 000 051 696 A nnu Al R epo R ...

ANNUAL REPORT 2010
Acting for Tomorrow.STRATEGY PERFORMANCE GROWTH
Registered office
Level 45, Australia Square 264-278 George Street Sydney NSW 2000
GPO Box 5376 Sydney NSW 2001
Telephone (02) 8345 5000 Facsimile (02) 9241 7377 Internet www.originenergy.com.au Email [email protected]
Share register
Link Market Services Limited Level 12, 680 George Street Sydney NSW 2000
Locked Bag A14 Sydney South NSW 1235
Toll Free 1300 664 446 Telephone (02) 8280 7155 Facsimile (02) 9287 0303
Internet www.linkmarketservices.com.au Email [email protected]
Secretaries
Andrew Clarke Helen Hardy
Auditor
KPMG
Bankers
National Australia Bank Westpac Banking Corporation
DiRectoRy Origin Energy Limited
Further information about Origin’s performance can be found on the website: http://reports.originenergy.com.au
Origin
Energy Lim
ited AB
N 30
00
0 0
51 69
6 A
nn
uA
l Repo
Rt 2010

Contents
1. A message from your Chairman and Managing Director 1
2. Management Discussion and Analysis 4
3. Directors’ Report 24
4. Lead Auditor’s Independence Declaration 30
5. Remuneration Report 31
6. Board of Directors 50
7. Executive Management Team 52
8. Corporate Governance 54
9. Financial Statements 57
10. Directors’ Declaration 121
11. Independent Auditor’s Report 122
12. Share and Shareholder Information 124
13. Exploration and Production Permits and Data 126
14. Five Year Financial History 130
15. Glossary 131
shareholder review 2010
acting for Tomorrow.sTraTeGY PerForMaNCe GrowTh
sustainability report 2010
acting for tomorrow.strateGy perForManCe GroWtH
ANNUAL REPORT 2010
Acting for Tomorrow.STRATEGY PERFORMANCE GROWTH
Half Year report to SHareHolderSfor tHe Half Year ended 31 december 2010
acting for tomorrow.StrateGY performance GroWtH
Origin Reporting 2010
This Annual Report is part of Origin’s suite of reporting documents, which includes the Shareholder Review and Sustainability Report. The 2011 Half Year Report to shareholders is released in March. Discover Origin Reporting 2010 on our website http://reports.originenergy.com.au

ORIGIN ENERGY ANNUAL REPORT 2010 1
As we enter our second decade, Origin’s performance will continue to be driven by a clear strategy, that delivers ongoing opportunities for growth, which is to be:
• positioned in the competitive segments of the energy chain;
• integrated across key segments, so as to better manage risk, and enhance the range of growth opportunities; and
• focused on the pursuit of opportunities that leverage the existing business, skills and knowledge.
In the past two years we have deployed approximately $5 billion in balance sheet capacity to grow and develop the business. As a result, a number of projects and acquisitions have made initial or increased contributions to Origin’s financial performance this year.
STRONG PERfORmANcEFor the financial year ended 30 June 2010, we are pleased to report that Origin is in a strong financial position. We have delivered growth in Underlying Profit. Our Operating Cash Flow After Tax approached $1 billion per annum. This enabled us to fund significant growth while keeping gearing at a low 20 per cent, which provides considerable financial flexibility and enables investment in the continued growth of the Company.
Origin reported Statutory Net Profit After Tax of $612 million for the 2010 financial year, compared with $6.9 billion for the prior year. The Statutory Profit for both years contains a number of items that do not reflect the underlying performance of the business. For instance, in the prior year it included a benefit from the gain on the dilution of Origin’s interest in Australia Pacific LNG of $6.7 billion. Some of the benefits of the Australia Pacific LNG transaction have been used to fund the development of operating assets.
Excluding the impact of this and similar items, the Underlying Profit was $585 million for the financial year, a 10 per cent increase on an Underlying Profit of $530 million in the prior year.
Underlying earnings per share, calculated from Underlying Profit, increased 10 per cent to 66.6 cents per share on a weighted average capital base of 878 million shares.
The Board has declared a final fully franked dividend of 25 cents per share, to be paid on 28 September 2010 to shareholders of record on 6 September 2010. This takes the
full year dividend attributable to the 2010 financial year to 50 cents per share, representing 75 per cent of underlying earnings.
UNdERLYING EARNINGSOrigin’s Underlying EBITDA for the 2010 financial year increased 10 per cent or $127 million to $1.35 billion.
Underlying EBITDA for each of Origin’s businesses was as follows.
Exploration and Production Underlying EBITDA was $250 million compared with $264 million in the prior year. The contribution from the recently commissioned Kupe Gas Project and Origin’s increased equity interest in the Otway Gas Project was more than offset by the dilution of Origin’s CSG interests in Australia Pacific LNG, production constraints in the Bass and Cooper basins, production decline in the Perth Basin and expenses relating to the expanded offshore and international exploration program undertaken during the year.
Generation Underlying EBITDA increased 70 per cent to $182 million. Origin increased its generation fleet from 704 MW to 1,620 MW over the course of the 2009 calendar year through the addition of four new or expanded generation plants. The increased EBITDA reflected higher capacity payments from the Retail segment to Generation for this increased capacity.
Retail Underlying EBITDA increased 19 per cent or $89 million to $568 million, achieved through increased gross profit in electricity and gas while maintaining cost to serve. There was also substantial growth in sales of the Company’s retail solar systems which provided an increased contribution to earnings.
A message from your Chairman and Managing Director
Fellow shareholderOn 21 February 2000, Origin Energy was first listed on the Australian Securities Exchange (ASX), and so began a decade of growth – a decade which has seen market capitalisation increase more than twenty fold; from $600 million to more than $13 billion. During that time, your company has been one of the top performing companies on the ASX with Total Shareholder Returns of 28 per cent (1) per annum.
Kevin mccann Chairman
Grant King Managing Director
(1) 10 year Compound Annual Growth Rate since listing to 30 June 2010.

2
A message from your Chairman and Managing Director (continued)
Contact Energy contributed $346 million to Underlying EBITDA, a 6 per cent reduction on the prior year. Higher than normal rainfall during the year resulted in lower wholesale electricity prices which made it harder for Contact to recover higher gas costs and network charges.
chANGING POLIcY ENvIRONmENT Origin’s strong financial performance has been achieved amid continuing uncertainty in global financial markets and in Australia a high level of policy uncertainty. During the course of the year, the Federal Government announced potential changes to the taxation of resource projects and its climate change policy.
Towards the end of the financial year, the Federal Government sought to introduce its Resources Super Profits Tax, which would have had a material adverse impact on a number of Origin’s projects and specifically, the Australia Pacific LNG project. Following significant public debate and industry consultation, the Government’s decision was to apply the existing Petroleum Resource Rent Tax to onshore oil and gas projects. While this represents an additional impost on industry, if passed, it provides greater certainty than the proposed Resources Super Profits Tax and better balances the risks and rewards of investing in resource projects.
Until early 2010, the Federal Government’s policy response to climate change had been following a dual pathway of an expanded Renewable Energy Target (RET), combined with an emissions trading scheme known as the Carbon Pollution Reduction Scheme (CPRS). The expanded RET has been implemented, providing industry with a more certain environment with respect to investment in wind, solar and geothermal. However, the CPRS has been delayed until at least 2013 and its future remains unclear. Without a price on carbon it is difficult to determine which generation technology we should invest in. In particular, investment in combined cycle gas generation is likely to be delayed until the future of the CPRS is determined, or the Government announces other broad based reduction policies.
Origin will continue to work with the Government on this major policy issue.
WELL POSITIONEd fOR fUTURE GROWTh Origin has funded a number of projects and acquisitions during the past two years which will contribute to the Company’s financial performance in 2011. These include:
• full year contributions from the Kupe and Otway Gas projects and the continued expansion of Australia Pacific LNG’s domestic CSG production which is expected to reach more than 100 PJ per annum;
• a full year contribution from the Darling Downs Power Station and a contribution from the Mortlake Power Station for approximately three months; and
• increased contribution by Contact Energy from new investments in the Stratford peaking plant and the Ahuroa gas storage facility which will reduce Contact’s exposure to periods of high rainfall.
We expect these major capital projects will provide substantial additional cash flows and contribution to EBITDA, and will result in a commensurate increase in depreciation and amortisation expense.
Origin also continues to invest in projects which will contribute to the growth of the Company over the long term. This will include a continuation of the high level of total exploration and appraisal expenditure incurred in 2010.
Total expenditure on gas and oil exploration activities is expected to be around $170 million, with the majority of expenditure in the first half of the 2011 financial year. Embedded in the profit guidance is an assumption that some elements of our exploration program may be unsuccessful and will therefore be expensed as part of the underlying performance of the business in the 2011 financial year.
Taking all these factors into account and based on current market conditions, we expect that Underlying EBITDA will increase by approximately 35 per cent in the 2011 financial year when compared with the prior year.
As a consequence, Underlying Profit for the 2011 financial year is expected to be around 15 per cent higher than the prior year.
cAPITALISING ON ThE GROWING dEmANd fOR ENERGY Looking forward, Origin is well-placed to benefit from the growing demand for energy both domestically and overseas.
Over the next year, Origin will address a number of opportunities with the potential to create significant additional value for shareholders. These include:
• a final investment decision by Australia Pacific LNG on its LNG project;
• the NSW Government’s energy asset sales process;
• pursuit of a substantial portfolio of renewable energy opportunities including:
– an extensive pipeline of wind development options,
– geothermal opportunities in Australia and overseas,
– further development of solar photovoltaic technology through Transform Solar, in joint venture with Micron Technology Inc;
• gas and oil exploration opportunities including prospects in Australia, New Zealand, South East Asia and Kenya;
• implementation of the Retail Transformation program; and
• expansion of Contact’s geothermal and peaking generation.
BOARd ANd EmPLOYEESThe health and safety of our people and contractors continues to be our first priority. Encouragingly, we achieved a 38 per cent improvement in our Total Recordable Incident Frequency Rate to 5.6 at 30 June 2010. Despite this progress, we recognise we have much more to do. During the year, several employees and contractors were injured and we were deeply saddened by the death of one of our Queensland-based contractors. These facts are a sobering reminder of the risks we face, and of the importance of continuous improvement in safety.
As we pursue a number of opportunities to further grow and develop the business, we look to strengthen the skills and capabilities of our people. This year, our total employee numbers increased to 4,392 (2), primarily through the growth of our Exploration and Production business.
We appreciate the contribution all of our employees have made to the growth and development of the business throughout the year.
(2) Excluding Contact Energy.

ORIGIN ENERGY ANNUAL REPORT 2010 3
A message from your Chairman and Managing Director (continued)
Over the past 12 months, your Board has been active. It met 11 times and in addition, held several planning and review workshops.
It inspected first-hand the progress at some of Origin’s major development projects, including the official opening of the Kupe Gas Project in New Zealand. Members of the Board also visited the Otway Gas Project and Mortlake Power Station in Victoria. In addition, several meetings were held with operational management throughout the year.
Gender diversity on Boards and in the executive ranks has received focus from the community during the year. Origin has two women on its Board, or 22 per cent of its composition. Director Karen Moses is a member of the Executive Committee of Management and we are developing programs to improve participation rates of women in the executive group. We will be an early adopter of the ASX Governance Recommendations on Diversity on Boards and the workplace.
We would like to express our appreciation to our fellow directors for the commitment and dedication they bring to the Origin Board.
Finally, we would like to take this opportunity to thank all those associated with our business – our investors, customers, communities and employees – for their continued support. The strength of these relationships has been a major contributor to the growth of Origin over the past decade, and positions us well to continue delivering strong results in the future.
Kevin mccannChairman
Grant KingManaging Director
4
Management Discussion and Analysis for the year ended 30 June 2010
All figures in this report relate to businesses of Origin Energy Ltd (“Company”) and the consolidated entity Origin Energy Group (“Origin”) for the year ended 30 June 2010 compared with the year ended 30 June 2009 (the “prior year”), except where otherwise stated. A reference to Contact is a reference to Origin’s subsidiary Contact Energy in New Zealand. A reference to Australia Pacific LNG or APLNG is a reference to Australia Pacific LNG Pty Ltd in which Origin has a 50% equity interest. In accordance with Australian accounting standards Origin consolidates 100% of Contact within its result. All references to $ refer to Australian dollars unless specifically marked otherwise. All references to debt are a reference to interest bearing debt only. Origin’s Statutory Profit contains a number of items in both periods that do not inform the ongoing performance of the business. Underlying Profit excludes the impact of these items to better illustrate the business performance of the Company. This Management Discussion and Analysis therefore focuses on underlying financial measures.
Each underlying measure discussed has been adjusted to remove these items from both this year and the prior year. A detailed reconciliation and description of the items that contribute to the difference between Statutory Profit and Underlying Profit is provided in Appendix 1.
The term EBITDAF used in past reports has been replaced with the term Underlying EBITDA, both of which have the same definition. The term Underlying EBIT has been introduced and excludes the items which do not inform the ongoing performance of the business that were previously included within the EBIT line. Interest, Tax, Depreciation, Amortisation and Non-controlling Interests incorporating the term “Underlying” also exclude the benefit or cost associated with these items.
1. PROfIT ANd dIvIdENd dEcLARATION
1.1StatutoryProfit–$612million,downfrom$6,941million
Origin reported a Net Profit after Tax and Non-controlling Interests (“Statutory Profit”) of $612 million for the year ended 30 June 2010, a decrease of 91% compared with $6,941 million reported in the prior year.
The prior year contained a number of items which did not inform the ongoing performance of the business including the gain on dilution of Origin’s interest in Australia Pacific LNG which, together with other factors, resulted in a net benefit of $6,411 million to the Statutory Profit for that period. This compares with a net benefit from a number of these items totalling only $27 million this year.
1.2Earningspershare–69.7centspershare(“cps”),downfrom791.0cps
Basic earnings per share (“EPS”) calculated from Statutory Profit decreased by 91% to 69.7 cps from 791.0 cps in the prior year. The weighted average capital base of 878 million shares was in line with the prior year, with share issuances over the last two years offsetting a reduction in capital due to the share buyback undertaken in late 2008.
1.3FinalDividend–25cpsfullyfranked
A final fully franked dividend of 25 cps will be paid on 28 September 2010 to shareholders of record on 6 September 2010. This is in line with the prior year. The Company’s Origin shares will trade ex-dividend from 31 August 2010. This will bring the full year dividend attributable to the 2010 financial year to 50 cps.
The Dividend Reinvestment Plan (“DRP”) will apply to this dividend without discount.
1.4UnderlyingProfit–$585million,up10%
Underlying Profit for the year increased 10% or $55 million to $585 million. The result reflects a 10% increase in Underlying EBITDA after expensing costs related to an expanded offshore and international exploration program and the benefit of lower financing costs associated with Origin’s strong balance sheet position.
Excludingoffshoreandinternationalexplorationprogram–$609million,up15%
During the year Origin undertook an expanded exploration program which involved expenditure for offshore drilling in Australia and the farm-in to a portfolio of oil and gas tenements in South East Asia. Origin advised the market that it was possible that some elements of this program may be unsuccessful and could result in a substantial write-off of exploration expenditure in the year.
During the year Origin participated in six wells in this exploration program. As at 30 June 2010 two of these wells were assessed as unsuccessful, resulting in additional exploration expenses amounting to $27 million before tax and $24 million after tax.
Origin’s Underlying Profit excluding expenses associated with this exploration program was $609 million, up 15% on the prior year.
Further details are provided in Section 3.
1.5UnderlyingEPS–66.6cps,up10%
Underlying EPS calculated on the Underlying Profit increased by 10% to 66.6 cps from 60.4 cps on a weighted average capital base of 878 million shares. Origin’s full year dividend of 50 cps represents a payout ratio of 75% based on Underlying EPS.
1.6OperatingCashFlow–$965million,up21%
Group operating cash flow after tax (“OCAT”) increased by 21% or $168 million to $965 million. This was primarily due to higher Underlying EBITDA and lower stay-in-business capex.
Further details are provided in Section 4.
1.7ReconciliationofUnderlyingProfitandStatutoryProfit
Statutory Profits for the year and the prior year contain the impact of a number of items that do not inform the ongoing performance of the business as outlined in the table following.
In the year to 30 June 2010 these items provided an overall benefit of $27 million. This compared with the year to 30 June 2009 in which these items had a benefit of $6,411 million.
ORIGIN ENERGY ANNUAL REPORT 2010 5
Management Discussion and Analysis for the year ended 30 June 2010 (continued)
Reconciliation of Statutory and Underlying Profit
June 2010 June 2009
change %$million
Impact After Tax & Non-
controlling Interests NPAT
Impact After Tax & Non-
controlling Interests NPAT
Statutory Profit 612 6,941 (91)
Items excluded from Underlying Profit
Impairment of assets (23) (218) (89)
Gain on dilution of Origin’s interest in subsidiaries 27 6,678 (100)
Increase (decrease) in fair value of financial instruments 10 (114) (109)
Unwinding of discounts resulting from APLNG receivables and payables 39 46 (15)
Transition and transaction costs (20) (6) 233
Other (6) 25 (124)
Less total excluded items 27 6,411 (100)
Underlying Profit 585 530 10
Underlying EPS (cps) 66.6 60.4 10
A more detailed reconciliation of Statutory Profit to Underlying Profit is provided in Appendix 1.
2. OUTLOOKOrigin enters the 2011 financial year with continuing growth in its underlying business, a strong balance sheet and a range of opportunities for ongoing growth.
During the past two years, Origin has progressively redeployed some of the benefits of the Australia Pacific LNG transaction to fund the development of growth assets. As a result, a number of development projects and acquisitions are expected to make initial, or increased, contributions to Origin’s financial performance.
These include:
• Full year contributions from the Kupe Gas Project in New Zealand and from Origin’s higher equity in the Otway Gas Project which increased from 31% to 67% in March 2010;
• Full year contributions from the 630 MW Darling Downs combined cycle power station which commenced commercial operations on 1 July 2010 and from the 126 MW Mt Stuart Power Station expansion after an eight month contribution in 2010;
• An anticipated one quarter contribution from the 550 MW Mortlake peaking power station currently under development;
• Increased earnings from Contact Energy Ltd (“Contact”) through new investments (including the Stratford peaking power station and the Ahuroa gas storage facility) which will reduce exposure to periods of high rainfall; and
• Continued development of domestic coal seam gas (“CSG”) production, which is expected to reach over 100 PJ per annum for Australia Pacific LNG through the 2011 financial year.
These major projects will provide substantial additional cash flows and contribution to Underlying EBITDA, and will result in a commensurate increase in depreciation and amortisation expenses.
Origin continues to invest in the long term growth of the Company. This will include a continuation of the higher level of exploration and appraisal expenditure seen in 2010. Total expenditure on these activities will likely be around $170 million in the 2011 financial year with the majority of expenditure in the first half of the year. Embedded in guidance is an assumption that some elements of this program may be unsuccessful and will be expensed as part of the underlying performance of the business in the 2011 financial year.
Taking all these factors into account and based on current market conditions, Origin expects that Underlying EBITDA will increase by approximately 35% compared with the prior year.
The high level of investment in development projects and acquisitions over the past year has seen net debt increase to $2.8 billion. As these development projects become operational, interest charges, which were
capitalised during construction, will instead be recognised as an interest expense subsequent to completion. As a consequence, net interest expense will rise in 2011 partially offsetting the growth in EBITDA.
Taking these factors into consideration Origin anticipates Underlying Profit for the 2011 financial year to be around 15% higher than the prior year.
The Company enters the 2011 financial year in a strong financial position, with annual operating cash flows after tax for 2010 of nearly $1 billion, and an adjusted net-debt to net-debt-plus-equity ratio of around 20%. Over the coming year Origin will address a number of opportunities with the potential to create significant additional value for shareholders.
Origin and ConocoPhillips have made substantial progress on the Australia Pacific LNG project and continue to move towards a final investment decision. The Project has established sufficient reserves and resources to cover a two train development; has undertaken a comprehensive Environmental Impact Statement incorporating the cumulative impact of the three major CSG to LNG projects currently proposed; has progressed early works contracts; is moving towards completion of Front End Engineering and Design studies; and expects to have all technical and regulatory approvals by the end of the calendar year. Australia Pacific LNG is engaged with a number of customers with the potential to secure sufficient off-take agreements to enable a final investment decision to be made.
In July 2010 the New South Wales Government commenced a sale process for its energy retail businesses, generation development sites and Gentraders. This represents the final round of privatisation of major energy retailing assets in the National Electricity Market (“NEM”), and represents the sale of dispatch rights for around 27% of the generation assets in the NEM. The value of these assets will be assessed relative to other opportunities Origin has to undertake investments on behalf of shareholders.
Origin will continue with the transformation of its energy retailing systems to improve efficiency, optimise cost to serve and further enhance customer service. This will provide improved customer insights and processes together with better use of technology to engage with customers.
Looking further ahead Origin will continue to pursue its substantial portfolio of renewable energy opportunities and will maintain an active exploration program for energy resources close to developing markets. The renewables portfolio includes an extensive pipeline of wind development options, geothermal opportunities in Australia and overseas, and further development of solar photovoltaic technology through Transform Solar. Greenfield exploration opportunities include prospects in Australia, New Zealand, South East Asia and Kenya.
With this range of opportunities Origin is well-placed to benefit from the growing demand for energy both domestically and overseas.

6
Management Discussion and Analysis for the year ended 30 June 2010 (continued)
3. fINANcIAL REvIEW Of PERfORmANcE
Year ended 30 June2010
$million2009
$millionchange
%
Total external revenue 8,534 8,042 6
Underlying EBITdA 1,346 1,219 10
Underlying depreciation and amortisation (408) (369) 11
Underlying share of interest, tax, depreciation and amortisation of equity accounted investees (42) (31) 35
Underlying EBIT 896 819 9
Underlying net financing costs (13) (32) (59)
Underlying Profit before income tax 883 787 12
Income tax expense on Underlying Profit (232) (183) 27
Underlying net profit after tax before elimination of Non-controlling Interests 651 604 8
Non-controlling Interests share of Underlying Profit (66) (74) (11)
Underlying Profit 585 530 10
Earnings per share – Underlying 66.6¢ 60.4¢ 10
Items excluded from Underlying Profit 27 6,411 (100)
Statutory Profit 612 6,941 (91)
Earnings per share – Statutory 69.7¢ 791.0¢ (91)
Free cash flow 800 661 21
Capital expenditure (including acquisitions) 2,837 2,426 17
Group OCAT 965 797 21
Productive capital (year to 30 June) (1) 8,423 7,256 16
Group OCAT Ratio (year to 30 June) (2) 10.9% 10.4%
Origin Cash (excluding Contact) 823 3,751 (78)
Origin Debt (excluding Contact) (2,570) (2,747) (6)
Contact Net Debt (1,088) (897) 21
Adjusted [net debt to net debt plus equity] (3) 19.7% n/a
(1) Productive capital is 12 months average funds employed excluding capital work in progress and including 50% of APLNG.
(2) Group OCAT Ratio = (OCAT – interest tax shield)/productive capital.
(3) Adjusted to exclude impact of financial instruments.
Further segmentation of the profit and loss line items in the table above is available in note 2 in the financial statements and throughout this document.
3.1Revenue–$8,534million,up6%
Total external revenue increased by 6% or $492 million to $8,534 million.
This primarily reflected an increase in external revenues from the Retail segment. There were smaller increases from the Exploration and Production and Generation segments while revenues from Contact in New Zealand were lower.
Further details are available in Section 9.
3.2UnderlyingEBITDA–$1,346million,up10%
For the year to 30 June 2010 Underlying EBITDA increased 10% or $127 million to $1,346 million. The segment contributions to this result are presented in the following table:
Underlying earnings before interest, tax, depreciation and amortisation (EBITDA)
Year ended 30 June2010
$million2009
$millionchange
%
Exploration & Production 250 264 (5)
Generation 182 107 70
Retail 568 479 19
Contact 346 369 (6)
Underlying EBITdA 1,346 1,219 10
ORIGIN ENERGY ANNUAL REPORT 2010 7
Management Discussion and Analysis for the year ended 30 June 2010 (continued)
Exploration & Production Underlying EBITDA contribution was 5% or $14 million lower than the prior year. The contribution from the recently commissioned Kupe Gas Project and Origin’s increased equity interest in the Otway Gas Project was more than offset by the dilution of Origin’s CSG interests in Australia Pacific LNG, production constraints in the Bass and Cooper basins, production decline in the Perth Basin and expenses relating to the expanded offshore and international exploration program undertaken during the year.
Further details are available in Section 9.1.
Generation Underlying EBITDA increased 70% or $75 million to $182 million. This reflected higher capacity payments from the Retail segment as Origin increased its generation fleet. During the 2009 calendar year four new generation facilities were completed increasing generation capacity from 704 MW to 1,620 MW. This resulted in full year contributions this year from Uranquinty, Quarantine expansion and Cullerin Range and a part year contribution from the Mt Stuart expansion.
Further details are available in Section 9.2.
Retail Underlying EBITDA increased 19% or $89 million to $568 million. This was primarily due to effective management of the energy supply portfolio and increased tariffs for natural gas and electricity enabling growth in margins. Strong growth in sales of residential solar photovoltaic systems further contributed to the result.
Further details are available in Section 9.3.
Contact Underlying EBITDA decreased 6% or $23 million to $346 million. Higher than normal rainfall during the year resulted in lower wholesale electricity prices and increased retail competition. This has made it harder for Contact to recover higher gas costs and network charges.
Further details are available in Section 9.4.
3.3Underlyingdepreciationandamortisation–$408million,up11%
Underlying depreciation and amortisation expenses increased by 11% or $39 million to $408 million. These increases reflect the deployment of the expanded fleet of power stations in Australia and the commissioning of the Kupe Gas Project in New Zealand. The increase was partially offset by the dilution of Origin’s interest in Australia Pacific LNG in October 2008. Australia Pacific LNG’s expense for the four months prior to dilution was accounted for in Underlying depreciation and amortisation. Subsequent to the dilution, Australia Pacific LNG’s expense has been accounted for through an equity accounting line item as described in section 3.4.
3.4Underlyingshareofinterest,tax,depreciationandamortisationofequityaccountedinvestees–$42million,up35%
The share of interest, tax, depreciation and amortisation expenses attributable to equity accounted investees increased 35% or $11 million to $42 million. This increase was primarily due to Australia Pacific LNG being equity accounted for 12 months this year compared with eight months in the prior year. This year’s expense included $32 million in relation to Australia Pacific LNG within the Exploration and Production segment, $7 million attributable to the Bulwer and Osborne power stations and Transform Solar within the Generation segment and $3 million in relation to Contact’s equity accounted investment in the Oakey Power Station.
3.5UnderlyingEBIT–$896million,up9%
For the year to 30 June 2010 Underlying EBIT increased 9% or $77 million to $896 million.
3.6Underlyingnetfinancingcosts–$13million,down59%
Origin’s Underlying net financing cost for the year of $13 million, was $19 million lower than the prior year’s expense of $32 million. This year comprises interest expense of $126 million and interest revenue of $113 million compared with interest expense of $169 and interest revenue of $137 million in the prior year. Interest expense of $126 million was $43 million lower than the prior year primarily due to lower average debt balances during the year associated with operational assets, where interest incurred is expensed. Interest revenue of $113 million was $24 million lower than the prior year primarily due to a decrease in cash on hand due to payments during the year for acquisitions and the tax liability in part relating to the dilution of Australia Pacific LNG.
Capitalised interest for the year was $156 million compared with $120 million in the prior year due to higher capital balances over the year for growth projects. This included the Kupe Gas Project for six months, the Ironbark (ATP 788P) exploration permit, the Darling Downs and Mortlake power stations and Contact’s generation plant and gas storage developments.
3.7 IncomeTaxExpenseonUnderlyingProfit–$232million,up27%
Underlying income tax expense for the year increased 27% or $49 million to $232 million. The underlying effective tax rate was 26% compared with 23% in the prior year. The underlying effective tax rate was lower than the prima facie 30% corporate tax rate mainly due to the recognition of previously unbooked capital losses, the recognition of research and development qualifying expenditure and the recognition of equity accounted income.
3.8Non-controllingInterestsshareofUnderlyingProfit–$66million,down11%
Underlying Profit attributable to Non-controlling Interests decreased 11% or $8 million to $66 million reflecting the lower contribution from Origin’s 51.8% subsidiary, Contact.
3.9UnderlyingProfit–$585million,up10%
Underlying Profit increased 10% or $55 million to $585 million. The result included a 10% increase in Underlying EBITDA after expensing $27 million of costs related to the expanded offshore and international exploration program and the benefit of lower financing costs associated with Origin’s strong balance sheet position.
Excluding expenses associated with the offshore and international exploration program, Origin’s Underlying Profit was $609 million, up 15% on the prior year.

8
4. OPERATING cASh fLOW AfTER TAx (OcAT)
Year ended 30 June2010
$million2009
$millionchange
$millionchange
%
Underlying EBITDA 1,346 1,219 127 10
Change in working capital (179) (103) (76) 73
Stay-in-business capex (179) (209) 30 (14)
Share of APLNG OCAT less EBITDA 18 (14) 32 (229)
Other 61 24 37 154
Tax paid (102) (120) 18 (15)
Group OcAT 965 797 168 21
Net interest paid (165) (136) (29) 21
free cash flow 800 661 139 21
Productive capital 8,423 7,256 1,167 16
Group OcAT Ratio (1) 10.9% 10.4%
(1) Group OCAT Ratio = (OCAT – interest tax shield)/productive capital.
One of Origin’s internal measures of performance is its Group OCAT Ratio which is an indicator of the cash returns the Company is generating from productive funds employed within its operations.
Group operating cash flow after tax increased by 21% or $168 million to $965 million.
The key driver of the increase in OCAT was a $127 million increase in Underlying EBITDA. Other benefits included a decrease of $30 million in stay-in-business capex primarily in the Contact segment due to the timing of expenditure on geothermal power stations, and $18 million from lower tax payments from operations in the year. Origin’s share of Australia Pacific LNG’s OCAT also increased this year due to an improvement in Australia Pacific LNG’s working capital balances through the timing of payments and higher EBITDA. These benefits were partially offset by higher working capital primarily due to increased debtors in the Retail segment as a result of electricity tariff increases. The add-back of exploration write-offs, non-cash equity accounted profits and movements in provision balances are included in the “Other” line item.
Net interest paid was $29 million higher than the prior year primarily due to payment of upfront financing costs for the $2.6 billion refinancing in April 2010 partially offset by lower average interest rates in 2010.
Free cash flow available for funding growth and distributions to shareholders increased by 21% from $661 million to $800 million.
Productive capital in the business increased by 16% in the year. Major assets contributing to this included the Kupe Gas Project from 1 January 2010; the acquisition of an additional 36% interest in the Otway Gas Project from March 2010; and a full year impact of the Uranquinty Power Station.
The combined impact of the increased Group OCAT and Productive capital resulted in a Group OCAT ratio for the year ended 30 June 2010 of 10.9% compared with 10.4% in the prior year.
5. cAPITAL ExPENdITURE ANd dIvESTmENTSCapital expenditure below is based on cash flow amounts rather than accrual accounting.
Capital expenditure on stay-in-business and growth projects was $1,653 million for the year to 30 June 2010.
Stay-in-business capital expenditure was $179 million compared with $209 million in the prior year with the reduction primarily in the Contact segment due to the timing of expenditure on geothermal power stations.
Growth capital expenditure (including capitalised interest) was $1,474 million, 25% lower than in the prior year. This included expenditure on significant projects of $40 million or more in the following areas:
• Exploration and Production – $294 million in total, including: – Kupe Gas Project – $70 million; and – Bass Basin – $67 million.
• Generation Projects – $764 million in total, including: – Mortlake Power Station – $328 million; and – Darling Downs Power Station – $274 million.
• Retail Projects – $88 million in total, including: – Retail Transformation – $65 million.
• Contact – $328 million in total, including: – Tauhara geothermal plant and development – $124 million; – Stratford Power Station – $106 million; and – Ahuroa Gas Storage – $46 million.
Capital expenditure on acquisitions totalled $1,184 million, including $661 million in relation to the Ironbark exploration permit acquisition, $515 million in relation to the increased equity interest in the Otway Basin and $8 million in relation to the acquisition of the Cogent Tri-generation business in the Retail segment.
Total capital expenditure including acquisitions was $2,837 million, compared with $2,426 million in the prior year.
Following completion of the Australia Pacific LNG transaction, ConocoPhillips is funding capital expenditure within Australia Pacific LNG to a cumulative total of $2.3 billion. During the year to 30 June 2010 Australia Pacific LNG’s gross capital expenditure was $720 million. The cumulative capital spent by Australia Pacific LNG since inception of the joint venture is $1,011 million which includes the cash flow generated from operations. Origin has a 50% equity interest in Australia Pacific LNG; however there will be no cash call on Origin until after ConocoPhillips has funded its commitment of $2.3 billion. On current estimates this is likely to occur towards the end of the 2011 financial year.
6. fUNdING ANd cAPITAL mANAGEmENT
6.1NetDebtandEquity
6.1.1 NetDebt
The net debt for the consolidated entity increased to $2,663 million at 30 June 2010 from a net cash balance of $269 million at 30 June 2009, a net movement of $2,932 million.
The calculation of these positions includes a favourable mark-to-market adjustment of $172 million as at 30 June 2010 compared with a favourable adjustment of $162 million as at 30 June 2009. Favourable adjustments act to decrease the net debt quoted.
Excluding these mark-to-market adjustments, the “adjusted net debt” for the consolidated entity was $2,835 million at 30 June 2010 compared with a $107 million cash balance at 30 June 2009, a net movement of $2,942 million.
The movement in the adjusted net debt of $2,942 million is primarily attributable to: cash payments for acquisitions of $1,184 million; growth and stay-in-business capex of $1,653 million; payment of tax liability of $650 million; and dividends of $409 million. These amounts were partially offset by cash flow from operations of $965 million.
Management Discussion and Analysis for the year ended 30 June 2010 (continued)

ORIGIN ENERGY ANNUAL REPORT 2010 9
6.1.2 Equity
Shareholders’ equity increased 3% from $11,144 million at 30 June 2009 to $11,438 million at 30 June 2010. The increase of $294 million is predominantly due to profit after tax and before Non-controlling Interests of $680 million for the year combined with $116 million from share issuance and $11 million from share-based payments. These amounts more than offset the $511 million of dividends paid.
6.1.3 GearingRatios(1)
The following two tables provide different calculations of the net-debt to net-debt-plus-equity ratio based on unadjusted and adjusted positions discussed in 6.1.1 and 6.1.2 above.
Using adjusted values to calculate the net-debt to net-debt-plus-equity ratio removes any short term volatility caused by changes in fair value of financial instruments and is a better long term measure of the strength of Origin’s capital structure.
Calculation of Net-Debt to Net-Debt-plus-Equity:
2010 $million
2009 $million
Net debt/(cash) as reported 2,663 (269)
Equity as reported 11,438 11,144
Net debt to (net debt + equity) 18.9% n/a
Calculation of Adjusted [Net-Debt to (Net-Debt-plus-Equity)] – excluding movements in fair value of financial instruments:
2010 $million
2009 $million
Adjusted net debt/(cash) 2,835 (107)
Adjusted equity 11,552 11,257
Adjusted [net debt to (net debt + equity)] 19.7% n/a
6.2NetDebtexcludingContact
Origin owns 51.8% of the quoted ordinary shares of Contact and is therefore required under the accounting standards to consolidate all of Contact’s assets and liabilities on Origin’s balance sheet. This includes consolidating 100% of Contact’s outstanding debt obligations. However, under the terms of those debt obligations Origin has no liability associated with Contact’s debt.
Excluding Contact’s debt obligations, Origin has an adjusted net debt position as at 30 June 2010 of $1,747 million compared with an adjusted net cash position of $1,004 million as at 30 June 2009, a change of $2,751 million.
Origin refinanced $2.0 billion of its 2011 debt obligations and obtained an additional $0.6 billion of new financing in April 2010 which increased the average maturity of the debt portfolio from three years at 30 June 2009 to four years at 30 June 2010. Origin excluding Contact has a range of financing facilities in place with varying maturities from three months to 10 years.
6.3ShareCapital
During the year Origin issued an additional 6.3 million shares. This included 4.1 million shares issued under the DRP representing $65 million together with 2.1 million shares issued as the result of the exercise of employee options which raised $13 million.
As a consequence the total number of shares on issue at 30 June 2010 increased by 6,286,791 shares to 880,668,872 from 874,382,081 at 30 June 2009.
The weighted average number of shares used to calculate basic earnings per share increased by 505,787 to 877,972,404 from 877,466,617 as at 30 June 2009. In the prior year, 12.1 million shares were purchased by the
Company through an on market share buyback and 5.7 million shares were issued under the DRP and as a result of the exercise of employee options. This resulted in a lower weighted average number of shares used to calculate basic EPS in the prior year.
7. RISK mANAGEmENT
7.1 General
Origin manages its risk exposure in energy markets through a combination of natural hedges in the business, contracts and financial hedges. Policy limits have been approved by the Board for products or financial variables for which there is a material risk exposure. Regular reporting is provided to the Board to review exposures and compliance with these limits.
Consistent with this policy framework Origin undertakes hedging of its exposure to electricity prices, oil prices, interest rates and foreign currency exchange rates.
7.2 ElectricityandGas
In the electricity and gas markets, Origin assesses its policy limits against a combination of profit at risk and extreme events. Within the policy limits, Origin has arrangements in place to cover extreme price and demand events as well as average forecast demand for the near to mid-term.
7.3 EnvironmentalProducts
As part of Origin’s operations in the energy sector, it is exposed to liabilities from various state and federal based government environmental schemes. At present these liabilities accrue during a set of annual compliance periods and are typically related to electricity supply and demand. In order to reduce Origin’s exposure to environmental product prices, the liabilities are first forecast and then an inventory of certificates are accrued during the period in order to meet the expected liability at the end of each compliance period.
7.4 OilandCondensate
On an ongoing basis, Origin assesses its anticipated medium term production volumes, current forward oil prices and risk exposure to movement in oil prices. As a result of these assessments, and having regard to the Board approved risk limits, Origin from time to time enters into hedges for a portion of its oil and condensate production.
For the year to 30 June 2010, 480 thousand barrels were hedged at an effective price of $87.69 per barrel in Australian Dollar terms. In addition, 90 thousand barrels of oil related to production from the Kupe asset, which reports its earnings in US Dollars, was hedged at US$65.35 and did not have associated foreign exchange (“FX”) hedges.
For the year to 30 June 2011, Origin currently has 420 thousand barrels hedged at an effective price of $95.07 per barrel in Australian Dollar terms. In addition, 180 thousand barrels of oil related to production from the Kupe asset was hedged at US$64.44 per barrel and does not have associated FX hedges.
Origin carries a residual exposure to the spread (premium or discount) in prices it receives for the hydrocarbon products it sells relative to the oil benchmarks against which hedges can be written. Such spreads generally relate to the relative quality of the hydrocarbons sold, issues associated with location, transportation and contract flexibility, and supply demand balances for particular hydrocarbon blends. While such spreads are usually modest and relatively stable, the volatility in oil markets and shifts in supply and demand patterns can lead to significant movements in such spreads.
7.5 ForeignExchange
With regard to FX, Origin prudently manages its FX exposure through external hedging arrangements where appropriate.
Origin is primarily exposed to US Dollar exchange rate risk through the sale of commodities and the translation of Origin’s US denominated Exploration and Production activities in New Zealand. NZ Dollar exchange rate risk arises through the translation of Contact’s earnings
(1) The reported numbers for net debt include interest bearing debt obligations only.
Management Discussion and Analysis for the year ended 30 June 2010 (continued)
10
to Australia Dollars. Origin’s FX hedge position associated with US Dollar receipts from the sale of oil is reflected in the oil commentary above.
Origin’s exposure to FX rates is as follows. A one cent depreciation in the US Dollar and NZ Dollar versus the Australian Dollar could reduce Origin’s Australian Dollar profit after tax and Non-controlling Interests for the year to 30 June 2011 by approximately $2.2 million and $0.3 million respectively.
7.6 InterestRates
Origin’s consolidated average interest rate paid on debt for the year to 30 June 2010 was 6.2%. This includes Contact’s NZ dollar denominated debt and Origin’s Australian dollar, US dollar and NZ dollar debt obligations. Origin’s average interest rate paid excluding Contact was 5.6% for the year to 30 June 2010.
Looking forward, approximately 46% of Origin’s consolidated debt obligations are hedged to June 2011 at an average rate of 7.8% including margin. Excluding Contact, Origin has 36% of its debt obligations hedged at an average rate of 7.6% including margin to June 2011. This hedge percentage gradually reduces over the following five plus years.
As at 30 June 2010, Origin held cash on deposit of approximately $823 million compared with $3,895 million at 30 June 2009. This cash was invested at an average rate of 4.4% for the year to 30 June 2010. Looking forward, $500 million of this amount is invested in fixed rate deposits with maturities out to December 2010 at an average rate of 5.8%.
8. PEOPLE, hEALTh, SAfETY & ENvIRONmENT
8.1People
Origin’s employee numbers (excluding Contact) increased by 194 to 4,392 from 30 June 2009. Employee numbers increased in the Exploration and Production segment as Origin further builds its capabilities in delivering major developments. These increases were partially offset by reductions in the Retail segment due to general productivity improvements and the
successful outsourcing of back-office business processes and Retail IT applications support to Wipro.
8.2HealthandSafety
Origin uses as its primary safety performance measure the industry standard Total Recordable Incident Frequency Rate (“TRIFR”). This measures the total number of recordable injuries that occur per million hours worked on a rolling 12 month basis. Recordable injuries include lost time cases, restricted work cases and medical treatment cases. This measure improved by 38% from 9.1 at 30 June 2009 to 5.6 at 30 June 2010.
Regrettably, during the year an automobile accident occurred resulting in the death of a contractor at the entrance to an Australia Pacific LNG site. An investigation into this incident is ongoing.
8.3Environment
During the year there were 15 reported environmental incidents that involved regulatory matters and notification to environmental authorities. Ten incidents involved offsite releases of wastewater, one of which resulted in a small fine. There were two incidents involving leaks and seepage from evaporation ponds. One of the leaks resulted in minor elevated levels of salinity and long-chain hydrocarbons in a sample taken from a licensed groundwater monitoring bore located next to an evaporation pond. One incident involved vegetation clearance beyond the approved disturbance permit area. The remaining two incidents involved internal system oversights that resulted in environmental licences not being renewed on time. All incidents have been resolved in consultation with the respective authorities.
In addition to the offsite releases mentioned above, there were 16 liquid spills greater than 100 litres. These included hydrocarbons, chemicals and contaminated water. None of the recorded spills resulted in serious environmental harm. Environmental incidents have been investigated and preventative actions taken to reduce risk of recurrence.
9. OPERATIONAL REvIEW
9.1Exploration&Production
Financial Performance
Year ended 30 June2010
$million2009
$millionchange
%
Total revenue 522 516 1
Underlying EBITDA 250 264 (5)
Underlying EBIT 48 86 (44)
Operational Performance
Year ended 30 June 2010 2009change
%
Total Production (PJe) 104 104 –
Total Sales (PJe) 117 112 5
Commodity Sales Revenue ($m) 632 572 10
Proved plus Probable Reserves (PJe) 6,207 4,484 38
Origin’s Exploration and Production segment reported record annual sales volumes and commodity revenues during the year and increased Proved plus Probable (“2P”) reserves by 38%.
Underlying EBITDA for the Exploration and Production segment decreased by 5% or $14 million to $250 million. The initial contribution from the Kupe Gas Project, an increased equity interest in the Otway Gas Project and a higher Underlying EBITDA contribution from Australia Pacific LNG was more than offset by the dilution of Origin’s CSG interests in Australia Pacific LNG, production constraints in the Bass and Cooper basins, production decline in the Perth Basin and higher exploration expenses.
During the year Origin embarked on an expanded offshore and international exploration program over and above its usual level of activity. This included drilling four offshore wells in southern Australia and two wells in South East Asia.
Management Discussion and Analysis for the year ended 30 June 2010 (continued)

ORIGIN ENERGY ANNUAL REPORT 2010 11
As at 30 June 2010 four out of six wells completed as part of the exploration program had encountered hydrocarbons. As a consequence only two wells with total expenditure of $27 million were written off from this program – the Somerset 1 well in the Otway Basin and the Tom Su Lua-1X well in Vietnam. At 30 June 2010 the balance of the expenditure was capitalised pending the outcome of commercial and technical studies.
During the course of the year production and sales are reported to the market on a consolidated basis which includes Origin’s 50% share of Australia Pacific LNG. In the statutory accounts the financial performance of Australia Pacific LNG is equity accounted. Consistent with this treatment, revenue and expenses from Australia Pacific LNG do not appear in the Exploration and Production accounts. Origin’s 50% share of Australia Pacific LNG’s EBITDA is however included in the EBITDA of the Exploration and Production segment. Australia Pacific LNG’s depreciation, amortisation, interest and tax expenses are accounted for between EBITDA and EBIT in the line item “Share of interest, tax, depreciation and amortisation of equity accounted investees.” Further commentary on Australia Pacific LNG’s operational and financial performance is provided in Appendix 3.
9.1.1 Production,SalesandRevenues
Origin
Year ended 30 June 2010 APLNG (50%) cSG (1) conventional Total
consolidated Production, Sales and commodity Revenue
Production (PJe) 35.5 – 68.7 104.2
Sales (PJe) 38.5 – 78.6 117.1
Commodity Sales Revenue ($m) 125 – 507 632
Statutory Revenue
Commodity Sales Revenue ($m) – 507 507
Other Revenue ($m) – 15 15
Total Revenue ($m) – 522 522
Origin
Year ended 30 June 2009 APLNG (50%) cSG (1) conventional Total
consolidated Production, Sales and commodity Revenue
Production (PJe) 20.5 18.6 65.2 104.3
Sales (PJe) 22.6 19.8 69.5 112.0
Commodity Revenue ($m) 72 63 437 572
Statutory Revenue
Commodity Sales Revenue ($m) 63 437 500
Other Revenue ($m) – 16 16
Total Revenue ($m) 63 453 516
(1) CSG refers to coal seam gas assets and assets in the Denison Trough that were owned 100% by Origin until October 2008 and since that time have formed part of Australia Pacific LNG.
9.1.2 ProductionandSales
Origin’s share of total production was in line with the prior year at 104 PJe.
The Australia Pacific LNG joint venture was established in late October 2008 with the dilution of Origin’s interest from 100% to 50%. In the financial year ended 30 June 2009 Australia Pacific LNG reported production for eight months, with Origin’s 50% interest totalling 20.5 PJe. This year production attributable to Origin from the joint venture increased by 15.0 PJe or 73% to 35.5 PJe reflecting both higher production rates to supply new contracts and a full year contribution.
In the prior year CSG assets, which are included in Australia Pacific LNG from the end of October 2008, contributed 18.6 PJe to production while the balance of Origin’s assets (referred to as “Conventional” in the table above) contributed 65.2 PJe. Total production from Origin’s assets in the prior year was therefore 83.8 PJe. Production attributable to Origin’s assets this year was 68.7 PJe and represented only production from conventional assets. This was a decrease of 15.1 PJe more than accounted for by the prior year dilution of Australia Pacific LNG.
Comparing year-on-year production from Origin’s conventional assets only, production increased by 5% or 3.5 PJe from 65.2 PJe to 68.7 PJe. Commencement of the Kupe Gas Project in December 2009 (+8.5 PJe), an increased equity share in production from the Otway Gas Project from March 2010 (+3.7 PJe) and higher gas production in the Surat Basin (+1.9 PJe) all added to production. These additions were partially offset by constraints in production from several assets including the BassGas Project due to an extended maintenance shut-down and subsequent unavailability of one well (-3.1 PJe), the Cooper Basin as a result of extensive flooding (-4.8 PJe), the Perth Basin due to natural decline (-2.0 PJe) and other minor reductions totalling 0.7 PJe.
In addition to sales from production, Origin purchases and on-sells production from third parties and from time to time sells production from storage. This year these sales represented 9.9 PJe compared with 4.3 PJe in the prior year.
9.1.3 RevenueandExpenses
Total Revenue increased by 1% from $516 million in the prior year to $522 million this year while sales volumes fell 12% from 89.3 PJe in the prior year to 78.6 PJe this year. Revenues increased despite the decrease in sales volumes largely because higher value liquids production and gas sales from Kupe in New Zealand partially replaced lower value sales from domestic CSG.
Management Discussion and Analysis for the year ended 30 June 2010 (continued)

12
Year ended 30 June2010
$million2009
$millionchange
%
Cost of Goods Sold 58 43 33
Stock movement 8 (11) 178
Royalties and Tariffs 40 44 (9)
General Costs 167 166 1
Exploration 45 40 11
Total Expenses 318 282 12
Cost of Goods Sold was $58 million this year compared with $43 million in the prior year reflecting an increase in the volume of third party purchases. Stock movements due to the sale of gas from storage in the Surat and Cooper basins resulted in an expense of $8 million for the year compared with a benefit of $11 million in the prior year, creating a $19 million year on year variance. The revenue receipts from the associated sales of third party purchases and stock more than offset these costs.
Expenses associated with royalties and tariffs decreased from $44 million to $40 million which largely reflected the lower production volumes from Origin’s conventional onshore assets and equity accounting of Australia Pacific LNG from late October 2008.
General operating costs increased by $1 million to $167 million despite a reduction in production of 15.1 PJe from 83.8 PJe to 68.7 PJe to which these costs relate.
In the prior year costs associated with lower value CSG production were included for four months. The production and relatively low unit costs associated with these assets are now included in Australia Pacific LNG.
During the year Origin added production from the Kupe Gas Project and an increased interest in the Otway Gas Project to its existing portfolio of high-value liquids-rich assets. These assets incur high unit production costs.
Several assets where costs have remained relatively fixed, while production has been constrained, also recorded higher unit production costs. This includes the flood affected Cooper Basin, the Bass Basin due to the extended shut down for maintenance and Origin’s onshore New Zealand assets, due to production constraints during the development of gas storage facilities.
In addition, costs have increased as Origin builds operational capabilities to match the growth in the upstream business.
Exploration expense increased to $45 million this year from $40 million in the prior year. This included $27 million from the write-off of two wells associated with the expanded offshore and international exploration program. Write-offs from normal exploration activity were somewhat lower than the prior year reflecting the success of drilling programs in the Perth and Cooper Basins and lower seismic expenditure than the prior year.
9.1.4 Earnings
Underlying EBITDA
Year ended 30 June2010
$million2009
$millionchange
%
Total Revenue 522 516 1
less expenses (318) (282) 12
add Share of Underlying EBITDA of APLNG 45 29 55
Underlying EBITdA 250 264 (5)
Underlying EBITDA decreased 5% or $14 million to $250 million.
Origin’s equity accounted interest in Australia Pacific LNG contribution to Underlying EBITDA increased 55% or $16 million to $45 million.
Underlying EBITDA from Origin’s assets decreased 13% or $30 million to $205 million. This was due mainly to Origin’s CSG production now being accounted for in Australia Pacific LNG together with production constraints in the Bass and Cooper basins, production decline in the Perth Basin and higher exploration expenses.
Underlying Depreciation and Amortisation
Underlying depreciation and amortisation charges increased 8% or $12 million to $170 million. This primarily reflects Origin’s increased investment in capital intensive offshore gas-liquids assets such as the Kupe Gas Project and an increased interest in the Otway Gas Project. These increases were partially offset by depreciation and amortisation expense for assets now included in Australia Pacific LNG being recorded in the equity accounted line item described below.
Underlying share of interest, tax, depreciation and amortisation of equity accounted investees
Origin’s share of interest, tax, depreciation and amortisation of Australia Pacific LNG is equity accounted and included in a single line item between Underlying EBITDA and Underlying EBIT. This includes 12 months expense in the year totalling $32 million compared with 8 months expense in the prior year totalling $20 million. Further details are provided in Appendix 3.
Underlying EBIT
Underlying EBIT for the year decreased 44% or $38 million from $86 million to $48 million.
9.1.5 Reserves
Origin undertakes a full assessment of its reserves on an annual basis at the end of the financial year. A full Statement of Reserves attributable to Origin at 30 June 2010 is included in Origin’s Annual Reserves Report released to the Australian Securities Exchange (“ASX”) on 30 July 2010.
The 2P reserves attributable to Origin across its areas of interest at 30 June 2010 totalled 6,207 petajoules equivalent (PJe), an increase of 1,723 PJe or 38% from 30 June 2009. The overall increase of 1,723 PJe included additions and revisions totalling 1,827 PJe together with production of 104 PJe.
Management Discussion and Analysis for the year ended 30 June 2010 (continued)

ORIGIN ENERGY ANNUAL REPORT 2010 13
The following summary is extracted from that Statement.
Origin 2P Reserves (1) by Region (PJe)2P Reserves
30-Jun-09Net additions and revisions Production
2P Reserves 30-Jun-10
Australia Pacific LNG
Coal Seam Gas / Denison 3,633 1,474 (36) 5,071
cooper Basin
SA Cooper Basin 148 8 (11) 144
SWQ Cooper Basin 49 17 (9) 57
Other onshore Australia
Western Australia 13 9 (3) 19
Conventional Surat Basin 26 (1) (4) 21
Offshore Australia
Otway Basin – Offshore 220 301 (23) 497
Bass Basin 169 - (7) 162
New Zealand
Offshore Taranaki (Kupe) 194 21 (9) 207
Onshore Taranaki 32 (2) (2) 28
Total 4,484 1,827 (104) 6,207
(1) The information in this Reserves Statement has been compiled by Mr Andrew Mayers, a full-time employee of Origin. Mr Mayers is qualified in accordance with ASX Listing Rule 5.11 and has consented to the form and context in which these statements appear.
Origin’s interests in exploration and production tenements (held directly or indirectly) may change from time to time and some of Australia Pacific LNG’s CSG tenements are subject to commercial arrangements under which, after the recovery of acquisition, royalty, development and operating costs, plus an uplift on development and operating costs, a portion of some of the interests may revert to previous holders of the tenements. Origin has assessed the potential impact of reversionary rights associated with such interests based on the economic tests for reserves outlined in Origin’s Annual Reserves Report dated 30 July 2010 and based on that assessment does not consider that reversion will impact the reserves quoted within this Report.
9.1.6 AustraliaPacificLNG
Australia Pacific LNG has made significant progress in the development of the domestic gas business and has met significant milestones in preparation for the CSG to LNG export project.
Australia Pacific LNG’s equity interest in production capacity now exceeds 300 terajoules per day (TJ per day); 2P reserves have increased by 2,878 PJe or 40% to 10,143 PJe; key Front End Engineering and Design (“FEED”) contracts have been awarded in relation to drilling, upstream processing facilities, major pipelines and the LNG liquefaction facility; the Environmental Impact Statement (“EIS”) for the project was lodged with responses to public submissions being prepared and reviewed with Government agencies; project centres have been opened in Gladstone, Roma and Chinchilla; and an active LNG marketing program is continuing.
Australia Pacific LNG participated in 317 wells during the year. The key focus of activity was to increase production capacity to supply new contracts during the year, together with continuing delineation of reserves and resources. Of the 317 wells drilled, 121 were development wells while 196 were exploration or appraisal wells.
Origin operates the Spring Gully and Talinga gas production facilities on behalf of Australia Pacific LNG. Development at Spring Gully and Talinga continued during the year with the gas plants achieving peaks in excess of 145 TJ per day and 74 TJ per day respectively. Capacity at each plant now stands at 150 TJ per day and 90 TJ per day respectively. Phase 6 of the Spring Gully project which is designed to increase capacity to 180 TJ per day is well advanced and the drilling and tying-in of the remaining wells to fully utilise the capacity at Talinga is on-going.
Australia Pacific LNG also has interests in non-operated producing projects in the Bowen Basin and Surat Basin. At the Fairview field in the Bowen Basin, operated by Santos Ltd, the first phase of the CSG field expansion project has been completed and is delivering approximately 30 TJ per day net to Australia Pacific LNG. On completion the project is expected to deliver approximately 50 TJ per day to Australia Pacific LNG. The QGC operated project in the Walloon coal seams of the Surat Basin covering the Kenya, Argyle and Lauren CSG fields is also progressing. At the end of the period, the Kenya gas plant was delivering approximately 24 TJ per day to Australia Pacific LNG, which is expected to increase to over 50 TJ per day when the project is complete.
Progress on these projects has allowed Australia Pacific LNG to produce at rates in excess of 270 TJ per day in aggregate, with installed capacity of over 300 TJ per day.
The exploration, appraisal and development activity undertaken, together with field development optimisation studies, has resulted in an increase in 2P reserves attributable to Australia Pacific LNG of 2,878 PJe or 40% to 10,143 PJe. Proved, Probable plus Possible (“3P”) reserves increased by 16% to 14,598 PJe, while the combined reserves and resources (3P + 3C) in the Bowen and Surat basins attributable to Australia Pacific LNG increased to over 26,000 PJe. Origin has a 50% interest in these reserves and resources.
Four significant FEED and early works contracts have been awarded relating to the CSG to LNG project.
In late December 2009, Australia Pacific LNG awarded a $220 million drilling and work-over rig contract to Savanna Energy Services Pty Ltd for the provision of two proprietary hybrid drilling rigs and two work-over rigs for a five year term from September 2010. In January 2010 major contracts were signed with McConnell Dowell Constructors and Baulderstone Bilfinger Berger Services Joint Venture for the design, engineering, procurement and early works activity during the planning stages for the 450 kilometre main pipeline and upstream facilities.
In addition, work is continuing with Bechtel on FEED for the liquefaction facility at Curtis Island. The nameplate capacity of each LNG train has increased from 3.5 to 4.5 million tonnes per annum, with an initial development likely to focus on two trains. There is the potential to develop up to four trains on the site.
Australia Pacific LNG’s EIS was submitted to the Queensland Co-ordinator General in February 2010 and the public consultation period was completed on 4 May 2010. Responses to public submissions are currently being prepared and reviewed with Government agencies.
In February 2010, Australia Pacific LNG and QGC agreed a framework for the development of two jointly owned CSG tenements and have entered into conditional gas sales agreements that will support the development of both Australia Pacific LNG and QGC’s proposed LNG projects. The agreement covers up to 640 PJ over a period of 20 years, including approximately 190 PJ over the first two years. This will assist Australia Pacific LNG to manage the ramp up gas for its CSG to LNG project and provides an accelerated export channel to market for this gas.
Management Discussion and Analysis for the year ended 30 June 2010 (continued)

14
The agreement is conditional on QGC making a final investment decision on its proposed CSG to LNG project, and covers only a portion of Australia Pacific LNG’s reserves and resources in these permits.
Australia Pacific LNG is engaged with a number of customers with the potential to secure sufficient off-take agreements to enable a final investment decision to be made.
9.1.7 MajorDevelopmentActivities
Kupe Gas Project (New Zealand)
The Kupe Gas Project commenced final commissioning of its facilities in December 2009. The project contributed to Origin’s financial results from 1 January 2010 and was officially opened on 18 March 2010.
By 30 June 2010 the Project had produced approximately 17 PJe of gas and associated liquids and in doing so achieved the milestone of having produced its one millionth barrel of light crude oil.
A review of technical information from development wells drilled in 2008 combined with early production data and detailed reservoir modelling resulted in an increase in initial 2P reserves of 11% to 431 PJe. The initial reserves are estimated at 273 PJ of sales gas (+8%), 1,114 ktonnes of LPG (+5%) and 18.6 million barrels of light crude oil or condensate (+27%). Origin’s 50% interest provided an increase in initial reserves of 21 PJe, including an additional 2 million barrels of light crude oil.
Otway Basin (Victoria/Tasmania)
On 16 March 2010 Origin increased its equity in the Otway Gas Project from 30.75 per cent to 67.23 per cent acquiring the additional interest from Woodside Energy Ltd. Origin assumed operatorship on 1 July 2010 following a transition period and receipt of all required regulatory approvals.
The acquisition adds to Origin’s existing expertise in operating offshore gas developments including the BassGas Project and the Kupe Gas Project in New Zealand.
During the year the Otway joint venture approved a plant inlet compression project which is expected to extend the production plateau of the field. Construction commenced in early 2010. Site works are now well advanced with fabrication and installation of pipe-work and supports in progress. Commissioning is expected in the first half of calendar year 2011.
The development of the Geographe field is now being planned with a view to progressing to a final investment decision in the first half of calendar year 2011.
In addition technical studies regarding plant turn down performance resulted in an upward revision in 2P reserves of 71 PJe (48 PJe net to Origin).
Bass Basin (Tasmania)
A major maintenance shut-down of the BassGas Project was undertaken from 22 November 2009 to 1 April 2010. Production since the shut-down has been restricted to the Yolla 4 well only which has averaged approximately 50 TJ per day. The Yolla 3 well will remain off-line until an isolation plug installed in the well to ensure safe operation during the shut-down can be retrieved.
In April 2010, the onshore Lang Lang gas plant began supplying raw CO2 for commercial use to a new CO2 recovery unit built and owned by Air Liquide. The CO2 recovery unit will re-use up to 69 thousand tonnes of CO2 per year which previously would have been released into the atmosphere.
Planning work for the Yolla Mid-Life Enhancement (“MLE”) project is continuing following a reassessment of the sequencing and timing of the project’s key components. The project is comprised of three parts; the installation of living quarters and upgraded safety systems on the offshore platform to improve production reliability and maintenance access; the installation of compression on the platform to maximise field recovery; and the drilling of two infill wells to augment production from the existing two wells and to maximise drainage of the field.
The MLE budget will be reassessed following finalisation of the revised project plans. It is presently expected that the offshore construction phase of the project will commence in late calendar year 2011 with the timing of drilling dependent on rig availability.
9.1.8 Exploration
An active exploration program was undertaken during the year that included the offshore wells in the Bass and Otway basins and a range of exploration activities in Australia, New Zealand, Kenya and South East Asia. The Company has farmed-in to a prospective suite of exploration and appraisal opportunities across Thailand, Lao PDR and Vietnam and has farmed-out an interest in the Canterbury Basin in New Zealand where its farm-out partner Anadarko will undertake drilling in 2011.
Australia
In the Bass Basin, Origin drilled three wells in the T/18P permit using the Kan Tan IV semi-submersible rig.
The Trefoil 2 gas appraisal well intersected gas bearing sands in the targeted Eastern View Coal Measures and confirmed the southerly extent of this accumulation.
The gas exploration well Rockhopper 1, approximately 10 kilometres from Trefoil 1, encountered oil and gas in a sequence of interbedded sandstones and shales in the Lower Eastern View Coal Measures. On the basis of that result, a sidetrack appraisal well Rockhopper 1 ST1 was drilled to a location 1.3 kilometres south and down dip of Rockhopper 1. The sidetrack well confirmed hydrocarbon bearing sandstones at this location, and the results of these wells are being evaluated.
In the Otway Basin the Somerset 1 gas exploration well was drilled in T/34P. The well was not successful and was plugged and abandoned.
In May 2010 Origin commenced a program of exploration drilling and pilot production testing for the Ironbark project in ATP 788P. This will include three multi-well pilots, one single-well pilot and two exploration core holes. Two cores holes had been drilled by the end of the year. Further drilling will be undertaken during the course of the coming year.
New Zealand
In the Northland Basin, a two well drilling program targeting gas for the New Zealand market has been delayed and will commence in the September Quarter 2010.
In the Canterbury Basin offshore from Dunedin, Origin has reached agreement to farm-out a 50% interest in exploration permits PEP 38262 and PEP 38264 to Anadarko Petroleum Corporation (“Anadarko”). The permits contain the Carrack/Caravel prospect, which has the potential to hold recoverable resources in excess of 500 million barrels of oil equivalent. A well commitment will become due in the 12 months from August 2010 and Anadarko has agreed to fund the first US$30 million of joint venture exploration costs. Drilling is expected to commence in 2011.
Kenya
Origin has recorded an 800 square kilometre 3D marine seismic survey over the Mbawa prospect prior to the possible selection of a drilling location. The survey was the first 3D seismic survey to be recorded in Kenya. Processing of this data continued during the year. Following interpretation of this data, a decision will be made whether to drill the Mbawa prospect in the third year of the permit or to withdraw from the joint venture.
South East Asia
In Vietnam, Origin operates Block 121 in the Song Hong Basin. During the year Origin acquired 1,965 kilometres of 2D marine seismic data which is currently being processed. In addition, reprocessing of approximately 3,900 kilometres of existing 2D seismic data in the permit was completed and planning for the acquisition of a 3D survey is continuing.
On 16 December 2009, Origin and Salamander Energy plc (“Salamander”) signed a farm-in agreement under which Origin will earn an interest in a portfolio of five exploration blocks operated by Salamander across north-east Thailand, Lao PDR and Vietnam. As part of the joint venture arrangement, Origin will fund US$50 million of joint venture exploration and appraisal expenditure across the five blocks. Origin may also fund up to an additional US$40 million of joint appraisal expenditure if the initial program is successful.
Management Discussion and Analysis for the year ended 30 June 2010 (continued)
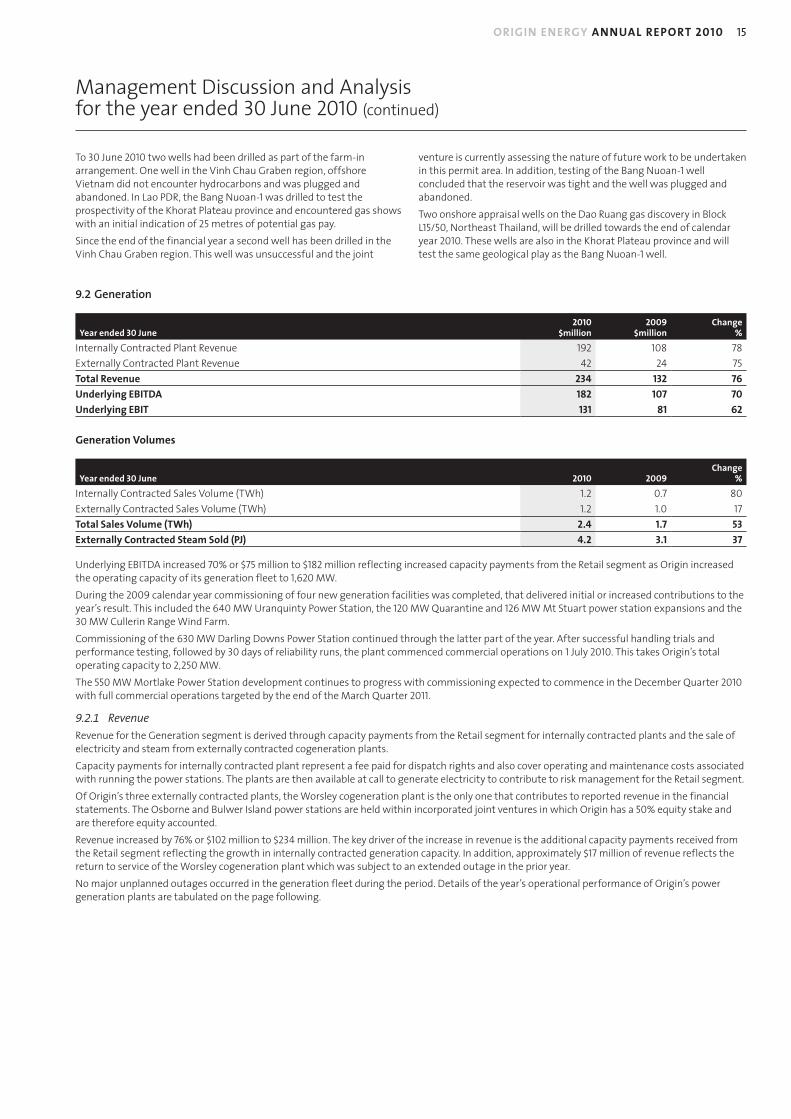
ORIGIN ENERGY ANNUAL REPORT 2010 15
To 30 June 2010 two wells had been drilled as part of the farm-in arrangement. One well in the Vinh Chau Graben region, offshore Vietnam did not encounter hydrocarbons and was plugged and abandoned. In Lao PDR, the Bang Nuoan-1 was drilled to test the prospectivity of the Khorat Plateau province and encountered gas shows with an initial indication of 25 metres of potential gas pay.
Since the end of the financial year a second well has been drilled in the Vinh Chau Graben region. This well was unsuccessful and the joint
venture is currently assessing the nature of future work to be undertaken in this permit area. In addition, testing of the Bang Nuoan-1 well concluded that the reservoir was tight and the well was plugged and abandoned.
Two onshore appraisal wells on the Dao Ruang gas discovery in Block L15/50, Northeast Thailand, will be drilled towards the end of calendar year 2010. These wells are also in the Khorat Plateau province and will test the same geological play as the Bang Nuoan-1 well.
9.2Generation
Year ended 30 June2010
$million2009
$millionchange
%
Internally Contracted Plant Revenue 192 108 78
Externally Contracted Plant Revenue 42 24 75
Total Revenue 234 132 76
Underlying EBITdA 182 107 70
Underlying EBIT 131 81 62
Generation volumes
Year ended 30 June 2010 2009change
%
Internally Contracted Sales Volume (TWh) 1.2 0.7 80
Externally Contracted Sales Volume (TWh) 1.2 1.0 17
Total Sales volume (TWh) 2.4 1.7 53
Externally contracted Steam Sold (PJ) 4.2 3.1 37
Underlying EBITDA increased 70% or $75 million to $182 million reflecting increased capacity payments from the Retail segment as Origin increased the operating capacity of its generation fleet to 1,620 MW.
During the 2009 calendar year commissioning of four new generation facilities was completed, that delivered initial or increased contributions to the year’s result. This included the 640 MW Uranquinty Power Station, the 120 MW Quarantine and 126 MW Mt Stuart power station expansions and the 30 MW Cullerin Range Wind Farm.
Commissioning of the 630 MW Darling Downs Power Station continued through the latter part of the year. After successful handling trials and performance testing, followed by 30 days of reliability runs, the plant commenced commercial operations on 1 July 2010. This takes Origin’s total operating capacity to 2,250 MW.
The 550 MW Mortlake Power Station development continues to progress with commissioning expected to commence in the December Quarter 2010 with full commercial operations targeted by the end of the March Quarter 2011.
9.2.1 Revenue
Revenue for the Generation segment is derived through capacity payments from the Retail segment for internally contracted plants and the sale of electricity and steam from externally contracted cogeneration plants.
Capacity payments for internally contracted plant represent a fee paid for dispatch rights and also cover operating and maintenance costs associated with running the power stations. The plants are then available at call to generate electricity to contribute to risk management for the Retail segment.
Of Origin’s three externally contracted plants, the Worsley cogeneration plant is the only one that contributes to reported revenue in the financial statements. The Osborne and Bulwer Island power stations are held within incorporated joint ventures in which Origin has a 50% equity stake and are therefore equity accounted.
Revenue increased by 76% or $102 million to $234 million. The key driver of the increase in revenue is the additional capacity payments received from the Retail segment reflecting the growth in internally contracted generation capacity. In addition, approximately $17 million of revenue reflects the return to service of the Worsley cogeneration plant which was subject to an extended outage in the prior year.
No major unplanned outages occurred in the generation fleet during the period. Details of the year’s operational performance of Origin’s power generation plants are tabulated on the page following.
Management Discussion and Analysis for the year ended 30 June 2010 (continued)

16
Generation Plant
Nameplate Plant capacity
mW Type
Equivalent Reliability
factor (1) capacity factor
Cullerin Range 30 Internal 98% 41%
Ladbroke Grove 80 Internal 93% 26%
Mt Stuart 414 Internal 99% 1%
Quarantine 216 Internal 98% 15%
Roma 74 Internal 99% 33%
Uranquinty 640 Internal 97% 6%
Bulwer Island (2) 32 External 97% 77%
Osborne (2) 180 External 100% 76%
Worsley (2) 120 External 98% 92%
(1) Equivalent reliability factor is the availability of the plant after scheduled outages.
(2) Origin holds a 50% equity share.
9.2.2 Earnings
Underlying EBITDA increased by 70% or $75 million to $182 million. This reflected the growth in generation capacity from developments completed in the 2009 calendar year including the new Uranquinty Power Station and Cullerin Range Wind Farm and expansions at Mt Stuart and Quarantine power stations. Worsley achieved an equivalent reliability factor of 98% compared to 57% in the prior year where an outage arising from a turbine failure negatively impacted the result.
Depreciation expense increased by 144% or $26 million to $44 million reflecting the increased asset base.
The share of underlying interest, tax, depreciation and amortisation of the generation segment’s equity accounted investees was $7 million compared with $8 million in the prior year.
Underlying EBIT increased by 62% or $50 million to $131 million.
9.2.3 ThermalGenerationDevelopments
The expanded Mt Stuart peaking facility commenced commercial operation in November 2009. The original 288 MW plant was expanded to 414 MW with the addition of a GE Energy 126 MW 9E gas turbine at a capital cost of $110 million.
The Darling Downs Power Station in Queensland is Australia’s largest combined cycle power station and represents an investment of $1 billion by Origin. The plant successfully commenced commercial operations on 1 July 2010, providing an additional 630 MW of capacity to the portfolio.
Commissioning of the 550 MW open cycle power station at Mortlake in Victoria is expected to commence in the December Quarter 2010 with full commercial operations targeted by the end of the March Quarter 2011. The final project cost is expected to increase by 10% to approximately $710 million (excluding capitalised interest). All turbines have been delivered to the site and major construction work is well advanced. The Mortlake site has approval to significantly expand including conversion of the existing plant to a highly efficient combined cycle power station and the addition of extra peaking capacity.
Origin’s thermal generation pipeline now includes 2,670 MW of gas fired power plant development options comprising sites at Mortlake, Spring Gully, Quarantine and Darling Downs. These options provide flexibility to continue to enhance Origin’s electricity supply portfolio.
9.2.4 RenewableEnergyDevelopments
Wind
The Cullerin Range Wind Farm near Goulburn in New South Wales commenced commercial operations on 1 July 2009. Over the year the wind farm operated at a 41% capacity factor.
During the year Origin exercised an option to acquire the Yass Valley Wind Farm project from Epuron. The project has a capacity of between 222 MW and 420 MW depending upon turbine numbers and the turbine technology selected. The project is located within New South Wales approximately 60 km from the Cullerin Range Wind Farm.
In addition, Origin worked actively on permitting and community engagement on the Stockyard Hill and Dundas sites in Western Victoria which were acquired as a result of the WindPower acquisition in 2009. During the year Origin completed the permitting for the 40 MW Lexton site in Victoria.
By the end of the year Origin’s portfolio of potential wind development sites included 96 MW for which Development Applications have been approved, 846 MW that are in the advanced planning and permitting stage, 1,200 MW in the planning and permitting stage and 1,314 MW undergoing feasibility studies.
Geothermal
Origin’s major geothermal energy investment to date is through a 30% interest in the Innamincka Joint Venture with Geodynamics Ltd (“Geodynamics”) and an equity interest of approximately 7% in the listed company. Research and development is based on a world class heat resource of deep fractured granites which are covered by a number of geothermal exploration permits in northern South Australia. During the year an application for $90 million funding under the Renewable Energy Demonstration Program on behalf of the joint venture was successful. The Habanero 3 failure investigation was completed and learnings and actions were built into the new program.
Origin and Geodynamics have also formed the Innamincka Shallows Joint Venture to evaluate the geothermal potential of the shallower Cooper and Eromanga basin section within the existing permit areas. Origin will be the exploration operator and over the next six months will drill and test two slim wells to depths of approximately 2,200 metres. Origin will contribute $4.5 million of project expenditure, in addition to its 50% share of project expenditure for this joint venture, in exchange for a 20% increase in its interest in the Shallows area.
On 28 September 2009 Origin entered into an agreement with Eden Energy Ltd to farm-in to a geothermal licence adjoining the geothermal licences held by Geodynamics in the Cooper Basin. Origin will earn a 70% interest under the agreement and become operator of the project.
Solar
Origin and Micron Technology, Inc (“Micron”) of the United States have formed a 50:50 joint venture, Transform Solar, with a focus on the development of photovoltaic energy. Micron is a US listed company and one of the world’s leading providers of advanced semiconductor solutions. The joint venture is seeking to combine the work Origin has undertaken to date in solar development with Micron’s process and manufacturing capabilities and to examine opportunities for development and commercialisation of solar photovoltaic technology. The first 20 MW production line is being developed in Micron’s US production facilities.
Management Discussion and Analysis for the year ended 30 June 2010 (continued)

ORIGIN ENERGY ANNUAL REPORT 2010 17
9.3Retail
Year ended 30 June2010
$million2009
$millionchange
%
Total revenue 6,393 5,869 9
Underlying EBITDA 568 479 19
Underlying EBIT 503 421 19
Performance metrics by commodity and variance from prior year
Year ended 30 June 2010 Electricity Natural Gas LPG
Commodity Revenue ($m) 4,210 (1)(+6%) 1,044 (2)(+8%) 634 (-1%)
Gross Profit ($m) 652 (+8%) 186 (+9%) 153 (–)
Underlying EBITDA ($m) 501 (+16%) 50 (+11%)
Underlying EBIT ($m) 464 (+16%) 25 (+16%)
Sales – (TWh) 30 (-4%)
Sales – (PJ) 135 (+1%)
Sales – (ktonnes) 491 (+3%)
Total Sales (PJe) 107 (-4%) 135 (+1%) 24 (+3%)
Customer accounts (‘000) – (Change from 30 June 2009) 1,721 (-1%) 868 (–) 349 (+1%)
(1) Excludes electricity pool revenue derived from running merchant plants.
(2) Gas revenue excludes revenues associated with zero margin volumes such as swaps.
9.3.1 RetailPerformance
During the period, the Retail segment revenues increased by 9% or $524 million to $6,393 million. This was driven by higher sales volumes across natural gas and LPG together with tariff increases for natural gas and electricity and strong growth in solar sales from the Customer Solutions business.
The Retail segment’s Underlying EBITDA increased 19% or $89 million to $568 million. This was primarily due to effective management of the energy supply portfolio and increased tariffs for natural gas and electricity enabling growth in margins. Customer Solutions provided increased contribution underpinned by the growth in solar sales.
Electricity
Electricity revenues increased 6% or $252 million to $4,210 million due to tariff increases across all markets, including the benefit from the revised Queensland Competition Authority (“QCA”) decision in June 2009. This was partially offset by a 4% reduction in sales volume to 29.7 TWh, primarily due to lower average demand from commercial and industrial customers.
Wholesale electricity, networks and related procurement costs increased 6% or $202 million to $3,558 million. This was primarily due to increases in network costs across most states, in particular Queensland, New South Wales and South Australia. In addition, higher average historic contract prices and environmental product costs were mostly offset by the benefit of lower pool prices, in particular in the second half of the financial year, and returns from periods of high pool volatility.
The Retail segment pays the Generation segment a capacity payment for the dispatch rights to five open cycle power stations and one wind farm. The Retail segment earns pool revenue when the generation plant is dispatched and is responsible for the cost of providing fuel to run the plant. The net result of pool revenues, capacity payments and fuel costs is included in the cost of goods sold above.
The combination of factors above resulted in an 8% or $50 million increase in electricity gross profit to $652 million.
Natural Gas
Natural gas revenues increased 8% or $78 million to $1,044 million reflecting increased volumes and higher residential tariffs. Natural gas sales volumes increased 1% or 1 PJ to 135 PJ, with reduced mass market consumption due to mild weather being offset by increased sales to wholesale and power generation customers.
Sustained periods of low pool prices due to mild weather and an excess of gas in the market together with effective management of the gas portfolio resulted in a 1% reduction in the unit cost of gas. As a result, gross profit increased by 9% or $16 million to $186 million.
Gas and Electricity Market Churn
Competitor activity increased in the year across all markets, particularly in Queensland and Victoria. In Queensland, the flow through of the revised QCA tariff decision restored margins to appropriate levels and resulted in an increase in competition; while in Victoria competition remains high with deregulated pricing and many active retail competitors.
Origin won 482 thousand new accounts across its gas and electricity business compared to 454 thousand in the prior year. However, overall greater competition led to a net decrease in gas and electricity account numbers of 21 thousand to 2.59 million. Origin’s customer account numbers at 30 June 2010 include approximately 519 thousand signed green energy accounts. This comprises approximately 396 thousand GreenPower electricity and 123 thousand green gas customer accounts, and reflects Origin’s strong market leadership position in this area.
Cost to Serve – Electricity and Natural Gas
Origin includes within its Retail cost to serve all costs associated with servicing and maintaining customers, all churn and customer acquisition and retention costs, and an allocation of corporate costs.
The total cost to serve for Origin’s gas and electricity retail business reduced marginally from $339 million to $336 million despite a higher number of customer acquisitions in the year.
Origin’s cost to serve per customer for its retail gas and electricity was in line with the prior year at $130 per customer.
Management Discussion and Analysis for the year ended 30 June 2010 (continued)

18
Electricity and Natural Gas Margins
Year ended 30 June 2010 2009change
%
Customer numbers (‘000) 2,589 2,610 (21)
Underlying EBITDA/Sales 9.5% 8.8% 0.7
Underlying EBIT/Sales 8.8% 8.1% 0.7
$/customer
Gross Profit/Customer 323 295 28
Opex/Customer 130 130 –
Underlying EBITDA/Customer 193 166 27
Underlying EBITDA across the gas and electricity business increased by 16% or $68 million to $501 million. The higher gross profit across natural gas and electricity together with the marginal decrease in cost to serve resulted in Underlying EBITDA margins increasing from 8.8% to 9.5%.
Underlying EBIT across electricity and natural gas also increased by 16% or $65 million to $464 million. Margins at this level increased from 8.1% to 8.8%.
LPG
Sales revenue decreased 1% or $6 million to $634 million. Exports to New Zealand have decreased following commissioning of Kupe while appreciation of the Australian dollar against Pacific currencies also reduced sales revenue. This was partially offset by a 3% increase in volumes, primarily attributable to the wholesale supply business, from 479 ktonnes to 491 ktonnes.
Lower international benchmark LPG prices resulted in Origin’s average unit product cost being 7% lower than the prior year. As a result, LPG gross profit increased by $1 million to $153 million.
Underlying EBITDA for the LPG business increased 11% or $5 million to $50 million predominantly due to the factors described above together with lower US denominated costs due to FX movements.
LPG customer accounts increased by approximately 2 thousand compared to the prior year with approximately 349 thousand customer accounts by the end of the year.
9.3.2 OperationalCapability–RetailTransformationProgram
Origin is transforming all aspects of its Retail business. This will result in simplified operating processes and a single integrated SAP billing and customer management system. The infrastructure will enable improved data quality, improved customer insights and better use of technology to engage with customers. This will enable Origin to deliver the innovative energy solutions that the changing energy market will require while optimising its cost to serve.
Configuration and system build of the new SAP technology platform for electricity and natural gas products is well advanced. This is expected to be completed by the end of calendar year 2010. Following this, testing and data migration activities will be completed. The system is anticipated to be released to production around the middle of the 2011 calendar year.
The transformation program included the outsourcing of back-office business process support and Retail IT applications support to transformation partner, Wipro.
The transition was successfully completed in December 2009 as planned – to scope, on time and on budget. This was a significant achievement with 396 roles outsourced and 240 Origin people transferred to Wipro.
9.3.3 CustomerSolutionsBusinesses
Origin has over a number of years progressively invested in creating and developing new business lines to provide a greater range of customer offerings and solutions. In particular, development is directed to understanding how customer needs will evolve in a carbon-constrained, technology-enhanced world. Origin looks to create solutions to meet those needs and then convert those solutions to standard and profitable customer offerings.
Past development has included a leading range of green products and carbon offset solutions. The current portfolio includes products such as solar hot water, solar photovoltaic rooftop systems, serviced bulk hot water systems, heat pumps, and tri-generation systems for application in commercial and industrial settings. Origin is currently investigating solutions for customers with smart meters, and options for supporting the introduction of electric vehicles to the Australian market.
Of particular importance this year, Origin’s retail solar photovoltaic business has been able to capitalise on significant recent growth in the market. Following a period of capability build and business development, Origin has doubled its annual sales to in excess of $100 million. Origin is well positioned to continue its growth in this market with a strong brand and product offering. Furthermore, Origin’s Serviced Hot Water business continues to profitably grow, adding 3,300 new customers during the period.
As part of its leadership of the Adelaide Solar Cities program, and to enhance its understanding of consumer behaviours as energy delivery mechanisms change, Origin signed up more than 2,000 customers on innovative “time of use” and “critical peak pricing” products. A subset of these customers will be able to monitor their electricity consumption and receive messages such as peak pricing notifications through an in-home display unit. As part of the Central Victoria Solar Cities program Origin has installed two solar farms which will provide it with experience in the deployment of large scale solar.
During the period Origin acquired and fully integrated the Cogent tri-generation business which brings innovative distributed energy solutions to the development portfolio. During the period the commissioning of two tri-generation units were completed with both generators achieving their expected output. Two additional Energy Supply Agreements were secured with major property developers during the year. In New South Wales, Kinesis and Origin successfully tendered for the development of a 2030 “master plan for distributed energy” within the City of Sydney. The vision is for a network of medium-sized tri-generation plants, totalling approximately 330 MW, within the fabric of the city.
After a portfolio review of products, that considered the most competitive channels to market, a decision was made to close 14 shops in the Origin Shops network in December 2009. Origin retains two destination energy stores – one in Melbourne and one in Adelaide.
Management Discussion and Analysis for the year ended 30 June 2010 (continued)

ORIGIN ENERGY ANNUAL REPORT 2010 19
9.4Contact
Year ended 30 June2010
$million2009
$millionchange
%
Total revenue 1,717 1,797 (4)
Underlying EBITDA 346 369 (6)
Underlying EBIT 214 231 (7)
Performance of operations
Year ended 30 June 2010 2009change
%
Electricity Generated (GWh) 9,691 9,948 (3)
Customer Electricity Sales (GWh) 7,590 7,609 (–)
Gas Sales (retail and wholesale) (PJ) 13.9 15.0 (7)
LPG Sales (Tonnes) 70,327 77,082 (9)
Electricity Customers 477,000 479,000 –
Gas Customers 64,000 67,000 (4)
LPG Customers (including franchisees) 58,000 53,700 8
Total Customers 599,000 599,700 –
Origin owns a 51.8% interest in Contact of New Zealand and consolidates 100% of Contact in accordance with Australian accounting standards. The interests attributable to minority shareholders are recognised as Non-controlling Interest in the Financial Statements.
A financial report entitled “Management discussion of financial results for the year ended 30 June 2010” was issued by Contact to the New Zealand Stock Exchange (NZX) on 20 August 2010 and is available on Origin’s website www.originenergy.com.au. That document contains details regarding Contact’s financial and operating performance during the period, including comparisons to the performance of Contact in the prior year.
In consolidating Contact’s results, Origin has used an average exchange rate for the period of NZ$1.26 to the A$, compared with NZ$1.23 to the A$ for the prior year.
Contact’s Underlying EBITDA decreased to $346 million from $369 million. This was primarily due to a lower contribution by the Electricity segment which was partially offset by a higher contribution from the Other (retail gas, wholesale gas, LPG and meters) segment.
In the Electricity segment, margins from retail electricity and hedged generation were lower. These were partially offset by higher exposed generation margins.
Retail electricity incurred significantly higher energy and network costs while intense competition resulted in higher customer acquisition costs and an inability to fully pass increased costs through to customers.
The hedged generation business incurred higher effective gas costs primarily due to take-or-pay obligations. The exposed generation segment benefited largely from higher volumes partially offset by lower average prices and higher thermal generation costs.
The EBITDA contribution from the Other segment partially offset the Electricity segment primarily due to improved retail and wholesale gas margins.
Further details on how these market dynamics have impacted the financial performance of Contact are available in the reports it has lodged with the NZX.
Underlying EBITDA reported in Origin’s accounts decreased 6% or $23 million to $346 million.
Underlying EBIT decreased 7% or $17 million to $214 million.
H Kevin McCann Chairman
Sydney, 23 August 2010
Management Discussion and Analysis for the year ended 30 June 2010 (continued)

20
10. ORIGIN ENERGY KEY fINANcIALS
Year ended 30 June2010
$million2009
$millionchange
%
Total external revenue 8,534 8,042 6
Underlying EBITDA 1,346 1,219 10
Underlying depreciation and amortisation (408) (369) 11
Underlying share of interest, tax, depreciation and amortisation of equity accounted investees (42) (31) 35
Underlying EBIT 896 819 9
Underlying net financing income/(costs) (13) (32) (59)
Underlying Profit before income tax 883 787 12
Income tax expense on Underlying Profit (232) (183) 27
Underlying net profit after tax before elimination of Non-controlling Interests 651 604 7
Non-controlling Interests share of Underlying Profit (66) (74) (11)
Underlying Profit 585 530 10
Items excluded from Underlying Profit 27 6,411 (100)
Statutory Profit 612 6,941 (91)
Free cash flow 800 661 21
Group OCAT Ratio (year to 30 June) (1) 10.9% 10.4%
Productive capital (year to 30 June) (2) 8,423 7,256 16
Capital expenditure (including acquisitions) 2,837 2,426 17
Total assets 21,834 22,102 (1)
Adjusted total assets (3) 21,194 21,453 (1)
Net debt/(cash) 2,663 (269)
Adjusted net debt/(cash) (3) 2,835 (107)
Shareholders’ equity 11,438 11,144 3
Adjusted shareholders’ equity (3) 11,552 11,257 3
Earnings per share – Statutory 69.7¢ 791.0¢ (91)
Earnings per share – Underlying 66.6¢ 60.4¢ 10
Free cash flow per share 90.8¢ 75.6¢ 21
Interim dividend per share 25¢ 25¢ –
Final dividend per share 25¢ 25¢ –
Total dividend per share 50¢ 50¢ –
Net asset backing per share $12.99 $12.75 2
Adjusted net asset backing per share (3) $13.12 $12.87 2
Net-debt to net-debt-plus-equity 18.9% n/a
Adjusted [net-debt to net-debt-plus-equity] (3) 19.7% n/a
Origin Cash (excluding Contact) 823 3,751 (78)
Origin Debt (excluding Contact) (2,570) (2,747) (6)
Contact Net Debt (1,088) (897) 21
(1) Group OCAT Ratio = (OCAT – interest tax shield)/Productive Capital.
(2) Productive Capital is 12 months average funds employed excluding capital work in progress and including 50% of APLNG.
(3) Adjusted to exclude impact of financial instruments.
Management Discussion and Analysis for the year ended 30 June 2010 (continued)

ORIGIN ENERGY ANNUAL REPORT 2010 21
11. APPENdIx 1 – REcONcILIATION Of STATUTORY TO UNdERLYING PROfIT
Reconciliation year ended 30 June 2010
Before Tax Impact
$millionTax
$million
Non-controlling Interests $million
After Tax & Non-controlling Interests Impact
$millionNPAT
$million
Statutory Profit 612
Impairment of assets (33) 10 – (23)
Increase (decrease) in fair value of financial instruments 15 (4) (1) 10
Gain on dilution of Origin’s interest in subsidiaries 38 (11) – 27
Unwinding of discounted loan payable to APLNG (111) 33 – (78)
Share of unwinding of discounted receivables within APLNG 117 – – 117
Transition and transaction costs (29) 8 1 (20)
New Plymouth asbestos removal/ related costs (4) 1 1 (2)
Change in New Zealand corporate income tax legislation – 8 (3) 5
Tax expense on translation of foreign denominated tax balances – (9) – (9)
Less total excluded items (7) 36 (2) 27
Underlying Profit 585
Underlying Basic EPS (cps) 66.6
A number of items are excluded from the Underlying Profit for the year to 30 June 2010. Together these items provided an after-tax and Non-controlling Interests benefit of $27 million in the year to 30 June 2010. They are excluded from Underlying Profit to better illustrate the business performance of the Company. The after tax and Non-controlling interest impacts of these items are described in more detail below.
Impairmentofassets(expenseof$23million)
During the period ended 30 June 2010 a review of the carrying amount of the Company’s assets led to the recognition of an impairment loss of $23 million after tax. The impairment loss followed a review of the expected production profile in relation to the Western Australian oil assets, onshore New Zealand oil and gas assets and fair value assessment of a property in South Australia and ships used in the Pacific. The asset impairments were measured using a fair value less costs to sell methodology.
Increaseinfairvalueoffinancialinstruments(benefitof$10million)
During the period an increase in the fair value of financial instruments resulted in a benefit of $10 million.
GainondilutionofOrigin’sinterestsinsubsidiaries(benefitof$27million)
In December 2009 Origin completed a transaction with Micron to form a 50:50 joint venture with a focus on the development of photovoltaic technology. As a consequence of this transaction Origin has diluted its interest in Transform Solar Pty Limited (formerly Origin Energy Solar Pty Limited) and has recognised a gain on dilution of $27 million.
UnwindingofdiscountedloanpayabletoAustraliaPacificLNG(expenseof$78million)
A non cash expense of $78 million being the unwinding of the discounted loan payable to Australian Pacific LNG was recorded for the year.
ShareofunwindingofdiscountedreceivableswithinAustraliaPacificLNG(benefitof$117million)
A non cash benefit of $117 million being Origin’s share of the unwinding of the discounted receivables within Australian Pacific was recorded for the year.
Transitionandtransactioncosts(expenseof$20million)
Origin and Contact are undergoing Retail Transformation and Transition Programs which are incurring a number of project costs. As a result of this, Origin has recognised an expense of $11 million in relation to the transition component of these projects. In addition, a $4 million expense is in relation to the transition of the Otway Gas Project and a $5 million expense is in relation to the costs incurred by the consolidated entity relating to successful and unsuccessful acquisition activity.
NewPlymouthasbestosremoval/relatedcosts(expenseof$2million)
During the period an expense of $2 million was recorded in relation to asbestos removal and related costs at the New Plymouth Power Station in New Zealand.
ChangeinNewZealandcorporateincometaxlegislation($5millionbenefit)
As a result of the change in the New Zealand corporate tax legislation from 30% to 28% and the change in relation to the depreciation deductions allowed on buildings, Origin has recognised a benefit of $5 million.
Taxexpenseontranslationofforeigndenominatedtaxbalances(expenseof$9million)
During the period an expense of $9 million was recognised for the foreign currency translation to US Dollars of the long term tax bases recorded in Origin’s Exploration and Production activities in New Zealand which have a US Dollar functional currency.
As a result of these factors, items excluded from Underlying Profit for the year provided an expense of $7 million before tax and a benefit of $27 million after tax. This compares with a $6,883 benefit before tax and a $6,411 benefit after tax in the prior year as detailed in the following table.
Please refer to the “Management Discussion and Analysis” for the year ended 30 June 2009 for more details.
Management Discussion and Analysis for the year ended 30 June 2010 (continued)

22
Reconciliation year ended 30 June 2009
Before Tax Impact
$millionTax
$million
Non-controlling Interests $million
After Tax & Non-controlling Interests Impact
$millionNPAT
$million
Statutory Profit 6,941
Impairment of assets (312) 93 1 (218)
Increase (decrease) in fair value of financial instruments (185) 55 16 (114)
Gain on dilution of Origin’s interest in subsidiaries 7,385 (707) – 6,678
Unwinding of discounted loan payable to APLNG (140) 42 – (98)
Share of unwinding of discounted receivables within APLNG 144 – – 144
Transition and transaction costs (9) 3 – (6)
Recognition of tax benefits not previously brought to account – 25 – 25
Less total excluded items 6,883 (489) 17 6,411
Underlying Profit 530
Underlying Basic EPS (cps) 60.4
12. APPENdIx 2 – mOvEmENTS IN fAIR vALUE Of fINANcIAL INSTRUmENTSOrigin utilises a range of financial instruments and derivatives in order to hedge the various commodity, interest rate and FX risks to which it is exposed. The purpose of hedging is to reduce these risks and deliver a higher level of certainty to the cash flows of Origin’s business. While Origin utilises valid economic risk management instruments to hedge these risks, these instruments must also meet the stringent criteria prescribed under accounting standards in order to qualify for hedge accounting. Instruments that qualify for hedge accounting are recognised in the Balance Sheet through Equity (Hedge Reserve). If the instruments do not qualify for hedge accounting then the change in fair value of these instruments is recognised in the Income Statement.
The most notable instruments that do not qualify for hedge accounting are electricity cap products. These products are used by Origin (and other electricity retailers) to protect the Retail business from extreme price events. However, such instruments do not qualify for hedge accounting, as the timing of potential risk events they protect against cannot be predicted with sufficient certainty.
The following tables summarise the key balances at 30 June 2010 and compares them with the balances at 30 June 2009:
Summary of movements in financial instruments
Balance Sheet
Net Assets ($million) change in Net Assets
$million2010 2009
Commodity Risk Management (152) (200) 48
Contact (234) (240) 6
Treasury and Other (170) (140) (30)
Total (556) (580) 24
Reconciliation of Balance Sheet and Income Statement items associated with movements in financial instruments $million
Recognition of “effective” instruments in Balance Sheet 9
Recognised in Equity (Hedge Reserve post tax) 6
Recognised in Deferred Tax Liability 3
Recognition of “ineffective” instruments in the Income Statement 15
change in net assets (as above) 24
The fair value of financial instruments as measured against market prices is recorded in the Balance Sheet in the derivative asset and derivative liability balances.
The total increase in the value of financial instruments for the year ended 30 June 2010 was $24 million of which $9 million qualified for hedge accounting and is recognised in Equity (Hedge Reserve). The balance of $15 million is recognised as a benefit in the Income Statement and is attributable to:
• Commodity risk management instruments ($21 million) – predominantly electricity caps partially offset by the decrease in forward market prices of carbon instruments during the period. Of the total of $21 million, $4 million is attributable to Contact and $17 million is attributable to Origin (excluding Contact); and
• Interest rate risk management instruments (-$6 million) – predominantly the lower forward interest rates and the appreciation of the Australian and New Zealand Dollars against the US Dollar during the period. The total expense of $6 million is predominantly attributable to Origin.
The benefit in the Income Statement of $15 million this year compares with an expense of $185 million in the prior year, which was predominantly attributable to commodity risk management instruments.
Management Discussion and Analysis for the year ended 30 June 2010 (continued)

ORIGIN ENERGY ANNUAL REPORT 2010 23
13. APPENdIx 3 – INvESTmENT IN AUSTRALIA PAcIfIc LNG The following table is included in the notes to the statutory accounts and extended to provide reconciliation to Australia Pacific LNG’s Statutory Profit.
Financial Performance
Total APLNG $million
Origin’s 50% interest $million
Total APLNG $million
Origin’s 50% Interest $million
12 months to 30 June 2010 8 months to 30 June 2009
Operating revenue 250 145
Operating expenses (161) (88)
Underlying EBITdA 89 45 57 29
Depreciation and amortisation expense (47) (29)
Underlying operating profit before income tax 42 28
Income tax expense (15) (9)
Underlying operating profit after tax 27 14 19 9
Operating Performance
Total APLNG (PJe)
Origin’s 50% interest (PJe)
Total APLNG (PJe)
Origin’s 50% Interest (PJe)
12 months to 30 June 2010 8 months to 30 June 2009
Production Volumes 71.0 35.5 41.0 20.5
Sales Volume 77.0 38.5 45.2 22.6
The Australia Pacific LNG joint venture was formed in late October 2008. All comparatives described below will reflect a full year contribution this year compared with an eight month contribution from November to June in the prior year.
The Australia Pacific LNG joint venture increased its production by 74% or 30.2 PJe, from 41.0 PJe to 71.2 PJe. This was primarily due to the increased gas plant capacity which was brought on during the year to service the Darling Downs Power Station and prepare for delivery to the Rio Tinto Alumina contract.
Revenue increased by 72% or $105 million, from $145 million to $250 million reflecting increased production and higher realised gas prices.
Operating expenses increased 83% or $73 million, from $88 million to $161 million reflecting increased activity in ramping up operation for delivery to domestic contracts.
Depreciation and amortisation expenses increased by 62% or $18 million from $29 million to $42 million reflecting higher production and increased gas plant capacity.
Income tax expense increased in line with higher Underlying Profit before tax.
Underlying profit after tax increased by 42% or $8 million from $19 million to $27 million.
Management Discussion and Analysis for the year ended 30 June 2010 (continued)

24
Directors’ Report for the year ended 30 June 2010
In accordance with the Corporations Act 2001, the Directors of Origin Energy Limited (“Company”) report on the Company and the consolidated entity Origin Energy Group (“Origin”), being the Company and its controlled entities for the year ended 30 June 2010.
1. PRINcIPAL AcTIvITIESDuring the year, the principal activity of Origin was the operation of energy businesses including:
• Exploration and production of oil and gas;
• Electricity generation; and
• Wholesale and retail sale of electricity and gas.
2. RESULT
Statutory Profit – $612 million, down from $6,941 million
Origin reported a Net Profit after Tax and Non-controlling Interests (“Statutory Profit”) of $612 million for the year ended 30 June 2010, a decrease of 91% compared with $6,941 million reported in the prior year.
The prior year contained a number of items which did not inform the ongoing performance of the business including the gain on dilution of Origin’s interest in Australia Pacific LNG which, together with other factors, resulted in a net benefit of $6,411 million to the Statutory Profit for that period. This compares with a net benefit from a number of these items totalling only $27 million this year.
Year ended 30 June2010
$million2009
$millionchange
%
Total external revenue 8,534 8,042 6
Underlying EBITdA 1,346 1,219 10
Underlying depreciation and amortisation (408) (369) 11
Underlying share of interest, tax, depreciation and amortisation of equity accounted investees (42) (31) 35
Underlying EBIT 896 819 9
Underlying net financing costs (13) (32) (59)
Underlying Profit before income tax 883 787 12
Income tax expense on Underlying Profit (232) (183) 27
Underlying net profit after tax before elimination of Non-controlling Interests 651 604 8
Non-controlling Interests share of Underlying Profit (66) (74) (11)
Underlying Profit 585 530 10
Earnings per share – Underlying 66.6¢ 60.4¢ 10
Items excluded from Underlying Profit 27 6,411 (100)
Statutory Profit 612 6,941 (91)
Earnings per share – Statutory 69.7¢ 791.0¢ (91)
Free cash flow 800 661 21
Capital expenditure (including acquisitions) 2,837 2,426 17
Group OCAT 965 797 21
Productive capital (year to 30 June) (1) 8,423 7,256 16
Group OCAT Ratio (year to 30 June) (2) 10.9% 10.4%
Origin Cash (excluding Contact) 823 3,751 (78)
Origin Debt (excluding Contact) (3) (2,570) (2,747) (6)
Contact Net Debt (1,088) (897) 21
Adjusted [net-debt to net-debt-plus-equity] (3) (4) 19.7% n/a
(1) Productive Capital is 12 months average funds employed excluding capital work in progress and including 50% of APLNG.
(2) Group OCAT Ratio = (OCAT – interest tax shield)/Productive capital.
(3) The reported numbers for net debt include interest-bearing debt obligations only.
(4) Adjusted to exclude impact of financial instruments.
Reconciliation of Underlying Profit and Statutory Profit
Statutory Profits for the year and the prior year contain the impact of a number of items that do not inform the ongoing performance of the business as outlined in the table below.
In the year to 30 June 2010 these items provided an overall benefit of $27 million. This compared with the year to 30 June 2009 in which these items had a benefit of $6,411 million.

ORIGIN ENERGY ANNUAL REPORT 2010 25
Directors’ Report for the year ended 30 June 2010 (continued)
Reconciliation of Statutory and Underlying Profit
June 2010 June 2009
$millions
Impact After Tax &
Non-controlling Interests NPAT
Impact After Tax &
Non-controlling Interests NPAT
change %
Statutory Profit 612 6,941 (91)
Items excluded from Underlying Profit
Impairment of assets (23) (218) (89)
Gain on dilution of Origin’s interest in subsidiaries 27 6,678 (100)
Increase (decrease) in fair value of financial instruments 10 (114) (109)
Unwinding of discounts resulting from APLNG receivables and payables 39 46 (15)
Transition and transaction costs (20) (6) 233
Other (6) 25 (124)
Less total excluded items 27 6,411 (100)
Underlying Profit 585 530 10
Underlying EPS (cps) 66.6 60.4 10
3. REvIEW Of OPERATIONS
Revenue – $8,534 million, up 6%
Total external revenue increased by 6% or $492 million to $8,534 million.
This primarily reflected an increase in external revenues from the Retail segment. There were smaller increases from the Exploration and Production and Generation segments while revenues from Contact in New Zealand were lower.
Underlying EBITDA – $1,346 million, up 10%
For the year to 30 June 2010 Underlying EBITDA increased 10% or $127 million to $1,346 million. The segment contributions to this result are presented in the following table:
Underlying earnings before interest, tax, depreciation and amortisation (EBITDA)
Year ended 30 June2010
$million2009
$millionchange
%
Exploration & Production 250 264 (5)
Generation 182 107 70
Retail 568 479 19
Contact 346 369 (6)
Underlying EBITdA 1,346 1,219 10
Exploration & Production Underlying EBITDA contribution was 5% or $14 million lower than the prior year. The contribution from the recently commissioned Kupe Gas Project and Origin’s increased equity interest in the Otway Gas Project was more than offset by the dilution of Origin’s CSG interests in Australia Pacific LNG, production constraints in the Bass and Cooper basins, production decline in the Perth Basin and expenses relating to the expanded offshore and international exploration program undertaken during the year.
Generation Underlying EBITDA increased 70% or $75 million to $182 million. This reflected higher capacity payments from the Retail segment as Origin increased its generation fleet. During the 2009 calendar year four new generation facilities were completed increasing generation capacity from 704 MW to 1,620 MW. This resulted in full year contributions this year from Uranquinty, Quarantine expansion and Cullerin Range and a part year contribution from the Mt Stuart expansion.
Retail Underlying EBITDA increased 19% or $89 million to $568 million. This was primarily due to effective management of the energy supply portfolio and increased tariffs for natural gas and electricity enabling growth in margins. Strong growth in sales of residential solar photovoltaic systems further contributed to the result.
Contact Underlying EBITDA decreased 6% or $23 million to $346 million. Higher than normal rainfall during the year resulted in lower wholesale electricity prices and increased retail competition. This has made it harder for Contact to recover higher gas costs and network charges.
26
Directors’ Report for the year ended 30 June 2010 (continued)
Underlying depreciation and amortisation – $408 million, up 11%
Underlying depreciation and amortisation expenses increased by 11% or $39 million to $408 million. These increases reflect the deployment of the expanded fleet of power stations in Australia and the commissioning of the Kupe Gas Project in New Zealand. The increase was partially offset by the dilution of Origin’s interest in Australia Pacific LNG in October 2008. Australia Pacific LNG’s expense for the four months prior to dilution was accounted for in Underlying depreciation and amortisation. Subsequent to the dilution, Australia Pacific LNG’s expense has been accounted for through an equity accounting line item as described below.
Underlying share of interest, tax, depreciation and amortisation of equity accounted investees – $42 million, up 35%
The share of interest, tax, depreciation and amortisation expenses attributable to equity accounted investees increased 35% or $11 million to $42 million. This increase was primarily due to Australia Pacific LNG being equity accounted for 12 months this year compared with eight months in the prior year. This year’s expense included $32 million in relation to Australia Pacific LNG within the Exploration and Production segment, $7 million attributable to the Bulwer and Osborne power stations and Transform Solar within the Generation segment and $3 million in relation to Contact’s equity accounted investment in the Oakey Power Station.
Underlying EBIT – $896 million, up 9%
For the year to 30 June 2010 Underlying EBIT increased 9% or $77 million to $896 million.
Underlying net financing costs – $13 million, down 59%
Origin’s Underlying net financing cost for the year of $13 million was $19 million lower than the prior year’s expense of $32 million. This year comprises interest expense of $126 million and interest revenue of $113 million, compared with interest expense of $169 and interest revenue of $137 million in the prior year. Interest expense of $126 million was $43 million lower than the prior year primarily due to lower average debt balances during the year associated with operational assets, where interest incurred is expensed. Interest revenue of $113 million was $24 million lower than the prior year primarily due to a decrease in cash on hand due to payments during the year for acquisitions and the tax liability in part relating to the dilution of Australia Pacific LNG.
Capitalised interest for the year was $156 million compared with $120 million in the prior year due to higher capital balances over the year for growth projects. This included the Kupe Gas Project for six months, the Ironbark (ATP 788P) exploration permit, the Darling Downs and Mortlake power stations and Contact’s generation plant and gas storage developments.
Income Tax Expense on Underlying Profit – $232 million, up 27%
Underlying income tax expense for the year increased 27% or $49 million to $232 million. The underlying effective tax rate was 26% compared with 23% in the prior year. The underlying effective tax rate was lower than the prima facie 30% corporate tax rate mainly due to the recognition of previously unbooked capital losses, the recognition of research and development qualifying expenditure and the recognition of equity accounted income.
4. SIGNIfIcANT chANGES IN ThE STATE Of AffAIRSThe following significant changes in the state of affairs of the Company occurred during the year:
Acquisitions
Exploration Permit ATP 788P – On 7 August 2009 Origin acquired a 100% interest in exploration permit ATP 788P for CSG resources in Queensland’s Surat Basin from the Pangaea Group (“Pangaea”) for a consideration of $661 million. Ownership of the permit will allow Origin to control the exploration, development and production of this resource.
Otway Gas Project – Effective 1 July 2009 Origin acquired a further 36% interest in the Otway Gas Project from Woodside Energy Limited increasing its existing interest from 31% to 67%. The purchase consideration was $544 million. Increasing Origin’s interest in the Project provides additional earnings from natural gas sold under existing long term contracts. Origin became the Operator of the project on 1 July 2010.
Commenced Operations
Kupe Gas Project – The Kupe Gas Project in New Zealand commenced final commissioning of its facilities in December 2009. The project contributed to Origin’s financial results from 1 January 2010 and was officially opened on 18 March 2010. Origin has a 50% equity interest in the project and is the project Operator.
Darling Downs Power Station – Commissioning of the Darling Downs Power Station took place through the second half of the year and the facility commenced commercial operations on 1 July 2010. With a capacity of 630 MW Darling Downs is the largest gas-fired combined cycle power station in the National Electricity Market and is supplied with gas by Australia Pacific LNG in which Origin has a 50% interest. Darling Downs will enable Origin to better manage its large electricity wholesale and retail business in Queensland.
The events described above and those as disclosed in the Financial Statements represent the significant changes in the state of affairs of the Company for the year ended 30 June 2010.
5. EvENTS SUBSEqUENT TO BALANcE dATENo matters or circumstances have arisen since 30 June 2010, which have significantly affected, or may significantly affect:
i) The Company’s operations in future financial years;
ii) Results of those operations in future financial years; or
iii) The Company’s state of affairs in future financial years.
6. dIvIdENdSDividends paid during the year by the Company were as follows:
$million
Final dividend of 25 cents per ordinary share, fully franked at 30%, for the year ended 30 June 2009, paid 23 September 2009. 219
Interim dividend of 25 cents per ordinary share, fully franked at 30%, for the half year ended 31 December 2009, paid 1 April 2010. 220
In respect of the current financial year, the Directors have declared a final dividend as follows:
$million
Final dividend of 25 cents per ordinary share, fully franked at 30%, for the year ended 30 June 2010, payable 28 September 2010. 220

ORIGIN ENERGY ANNUAL REPORT 2010 27
Directors’ Report for the year ended 30 June 2010 (continued)
7. BUSINESS STRATEGIES, fUTURE dEvELOPmENTS ANd ExPEcTEd RESULTS
Origin enters the 2011 financial year with continuing growth in its underlying business, a strong balance sheet and a range of opportunities for ongoing growth.
During the past two years, Origin has progressively redeployed some of the benefits of the Australia Pacific LNG transaction to fund the development of growth assets. As a result, a number of development projects and acquisitions are expected to make initial, or increased, contributions to Origin’s financial performance.
These include:
• Full year contributions from the Kupe Gas Project in New Zealand and from Origin’s higher equity in the Otway Gas Project which increased from 31% to 67% in March 2010;
• Full year contributions from the 630 MW Darling Downs combined cycle power station which commenced commercial operations on 1 July 2010 and from the 126 MW Mt Stuart Power Station expansion after an eight month contribution in 2010;
• An anticipated one quarter contribution from the 550 MW Mortlake peaking power station currently under development;
• Increased earnings from Contact through new investments (including the Stratford peaking power station and the Ahuroa gas storage facility) which will reduce exposure to periods of high rainfall; and
• Continued development of domestic CSG production, which is expected to reach over 100 PJ per annum for Australia Pacific LNG through the 2011 financial year.
These major projects will provide substantial additional cash flows and contribution to Underlying EBITDA, and will result in a commensurate increase in depreciation and amortisation expenses.
Origin continues to invest in the long term growth of the Company. This will include a continuation of the higher level of exploration and appraisal expenditure seen in 2010. Total expenditure on these activities will likely be around $170 million in the 2011 financial year with the majority of expenditure in the first half of the year. Embedded in guidance is an assumption that some elements of this program may be unsuccessful and will be expensed as part of the underlying performance of the business in the 2011 financial year.
Taking all these factors into account and based on current market conditions, Origin expects that Underlying EBITDA will increase by approximately 35% compared with the prior year.
The high level of investment in development projects and acquisitions over the past year has seen net interest bearing debt increase to $2.8 billion. As these development projects become operational interest charges, which were capitalised during construction, will instead be recognised as an interest expense subsequent to completion. As a consequence, net interest expense will rise in 2011 partially offsetting the growth in EBITDA.
Taking these factors into consideration Origin anticipates Underlying Profit for the 2011 financial year to be around 15% higher than the prior year.
The Company enters the 2011 financial year in a strong financial position, with annual operating cash flows after tax for 2010 of nearly $1 billion, and an adjusted gearing ratio of around 20%. Over the coming year Origin will address a number of opportunities with the potential to create significant additional value for shareholders.
Origin and ConocoPhillips have made substantial progress on the Australia Pacific LNG project and continue to move towards a final investment decision. The project has established sufficient reserves and resources to cover a two train development; has undertaken a comprehensive EIS incorporating the cumulative impact of the three major CSG to LNG projects currently proposed; has progressed early works contracts; is moving towards completion of FEED studies; and expects to have all technical and regulatory approvals by the end of the calendar year. Australia Pacific LNG is engaged with a number of
customers with the potential to secure sufficient off-take agreements to enable a final investment decision to be made.
In July 2010 the New South Wales Government commenced a sale process for its energy retail businesses, generation development sites and Gentraders. This represents the final round of privatisation of major energy retailing assets in the National Electricity Market (“NEM”), and represents the sale of dispatch rights for around 27% of the generation assets in the NEM. The value of these assets will be assessed relative to other opportunities Origin has to undertake investments on behalf of shareholders.
Origin will continue with the transformation of its energy retailing systems to improve efficiency, optimise cost to serve and further enhance customer service. This will provide improved customer insights and processes together with better use of technology to engage with customers.
Looking further ahead Origin will continue to pursue its substantial portfolio of renewable energy opportunities and will maintain an active exploration program for energy resources close to developing markets. The renewables portfolio includes an extensive pipeline of wind development options, geothermal opportunities in Australia and overseas, and further development of solar photovoltaic technology through Transform Solar. Greenfield exploration opportunities include prospects in Australia, New Zealand, South East Asia and Kenya.
With this range of opportunities Origin is well-placed to benefit from the growing demand for energy both domestically and overseas.
8. dIREcTORSThe Directors of the Company at any time during or since the end of the financial year are:
H Kevin McCann (Chairman) Grant A King (Managing Director) John H Akehurst Bruce G Beeren Trevor Bourne Gordon M Cairns Karen A Moses Helen M Nugent J Roland Williams

28
Directors’ Report for the year ended 30 June 2010 (continued)
9. INfORmATION ON dIREcTORS ANd cOmPANY SEcRETARIESInformation relating to current Directors’ qualifications, experience and special responsibilities are set out on pages 50 and 51. The qualifications and experience of the Company Secretaries is set out below.
Andrew Clarke Group General Counsel and Company Secretary
Andrew Clarke joined Origin in May 2009 and is responsible for the company secretarial and legal functions. He was a partner of a national law firm for 15 years and was managing director of a global investment bank for more than two years prior to joining Origin. Andrew has a Bachelor of Laws (Hons) and a Bachelor of Economics from Sydney University. He is admitted to practice in New South Wales and New York.
Helen Hardy Company Secretary
Helen Hardy joined Origin in March 2010. She was previously General Manager, Company Secretariat of a large ASX listed company, and has advised on governance, financial reporting and corporate law at a Big 4 accounting firm and a national law firm. Helen is a Chartered Accountant and Chartered Secretary. She holds a Bachelor of Laws and a Bachelor of Commerce from Melbourne University, and is admitted to practice in New South Wales and Victoria.
10. dIREcTORS’ mEETINGSThe number of Directors’ meetings, including Board Committee meetings, and the number of meetings attended by each Director during the financial year are shown in the table below:
directors
Board meetings meetings of Board committees
Audit Remuneration hSE Nomination Risk
h A h A h A h A h A h A
H K McCann 11 11 4 4 7 7 5 3 3 3 2 2
G A King 11 11 – – – – 5 5 – – 2 2
J H Akehurst 11 10 – – – – 2 2 3 2 2 2
B G Beeren 11 11 4 4 7 7 – – 3 3 2 2
T Bourne 11 11 – – 7 7 5 5 3 3 2 2
G M Cairns 11 11 – – 7 7 5 5 3 3 2 2
K A Moses 11 11 – – – – – – – – 2 2
H M Nugent 11 11 4 4 7 7 – – 3 3 2 2
J R Williams 11 11 4 4 – – 5 5 3 3 2 2
H: Number of meetings held during the time that the Director held office or was a member of the Committee during the year.
A: Number of meetings attended.
The Board also held additional workshops during the year to consider matters of particular relevance. The Board has also visited Company operations and met with operational management during the year.
11. dIREcTORS’ INTERESTS IN ShARES, OPTIONS ANd RIGhTS Of ORIGIN ENERGY LImITEdThe relevant interests of each Director in the shares and rights or options over such instruments issued by the companies within the consolidated entity and other related bodies corporate at the date of this report are as follows:
directorOrdinary shares held
directly and indirectly Options over ordinary
shares Performance Share Rights
over ordinary shares Ordinary shares in
contact Energy Limited
H K McCann 286,245 – – –
G A King 939,939 1,497,000 (1) 358,000 (2) 16,172
J H Akehurst 14,750 – – –
B G Beeren 1,235,020 – – 21,151
T Bourne 46,822 – – –
G M Cairns 53,939 – – –
K A Moses 220,000 717,000 (3) 129,000 (2) 8,085
H M Nugent 31,059 – – –
J R Williams 46,871 – – –
Exercise price for share options and performance share rights:
(1) 500,000: $7.21, 300,000: $10.32, 400,000: $16.30, 297,000: $15.93.
(2) Nil.
(3) 162,000: $7.21, 211,000: $6.50, 140,000: $10.32, 89,000: $16.30, 115,000: $15.93.

ORIGIN ENERGY ANNUAL REPORT 2010 29
Directors’ Report for the year ended 30 June 2010 (continued)
12. ENvIRONmENTAL REGULATION ANd PERfORmANcEThe Company’s operations are subject to significant environmental regulation under Commonwealth, State and Territory legislation. The Company’s performance in relation to that regulation is described in section 8.3 of the Management Discussion and Analysis.
13. INdEmNITIES ANd INSURANcE fOR dIREcTORS ANd OffIcERS
Under the Company’s Constitution, it must indemnify the current and past Directors, secretaries and senior managers against all liabilities to other persons (other than the Company or a related body corporate) that may arise from their positions as Directors, secretaries or officers of the Company and its controlled entities, except where the liability arises out of conduct involving a lack of good faith. The Company has entered into agreements with current Directors and certain former Directors whereby it will indemnify those Directors from all liability in accordance with the terms of the Constitution for a period of seven years after they cease to be Directors.
The agreements stipulate that the Company will meet the full amount of any such liabilities, including costs and expenses.
Since the end of the previous financial year, the Company has paid insurance premiums in respect of Directors’ and officers’ liability, and legal expense insurance contracts for current and former Directors and officers, including executive officers and Directors of the Company and executive officers and secretaries of its controlled entities.
14. AUdITOR INdEPENdENcEThere is no former partner or director of KPMG, the Company’s auditors, who is or was at any time during the year ended 30 June 2010 an officer of the Origin Group. The auditor’s independence declaration (made under section 307C of the Corporations Act) is attached to and forms part of this Report.
15. NON-AUdIT SERvIcESThe amounts paid or payable to the Origin Group auditor KPMG for non-audit services provided by that firm during the year are as follows (shown to nearest thousand dollars):
1. Acquisition audit and accounting advice $80,000
2. Taxation services $44,000
3. Other assurance services $341,000
Further details of amounts paid to the Company’s Auditors are included in Note 24 to the full financial statements.
In accordance with advice provided by the Audit Committee, the Board has formed the view that the provision of those non-audit services by the auditor is compatible with, and did not compromise, the general standards of independence for auditors imposed by the Corporations Act. The Board’s reasons for concluding that the non-audit services provided did not compromise the auditor’s independence are:
• All non-audit services were subject to the corporate governance procedures that had been adopted by the Company and were below the pre-approved limits imposed by the Audit Committee;
• All non-audit services provided did not undermine the general principles relating to auditor independence as they did not involve reviewing or auditing the auditor’s own work, acting in a management or decision making capacity for the Company, acting as an advocate for the Company or jointly sharing risks and rewards; and
• There were no known conflict of interest situations nor any circumstance arising out of a relationship between the Company (including its Directors and officers) and the auditor which may impact on auditor independence.
16. ROUNdING Of AmOUNTSThe Company is a company of a kind referred to in ASIC Class Order 98/100 dated 10 July 1998 and in accordance with that class order, amounts in the financial report and Directors’ Report have been rounded off to the nearest million dollars unless otherwise stated.
17. REmUNERATIONThe Remuneration Report is attached and forms part of this Directors’ Report.
Signed in accordance with a resolution of Directors:
H Kevin McCann Chairman
Sydney, 23 August 2010

30
Lead Auditor’s Independence Declaration

ORIGIN ENERGY ANNUAL REPORT 2010 31
Remuneration Report for the year ended 30 June 2010
INTROdUcTIONThe Directors are pleased to provide the Remuneration Report for Origin for the 2010 financial year.
During the year the Remuneration Committee undertook a comprehensive review of the Company’s remuneration framework. As part of this review the Committee had regard to the changing external environment governing remuneration practice. In particular, the Board concluded:
• that the overall balance of remuneration settings is appropriate for the Company’s business in terms of the mix between fixed and variable pay, short and long term metrics, relative and absolute hurdles, and between deferred and non-deferred pay;
• a combination of performance measures, operating cash flow after tax (“OCAT”) as a proportion of productive capital (“PC”) and underlying earnings per share (“EPS”) would continue to apply for short term incentives (“STI”) for the 2010/11 year; and
• relative Total Shareholder Return (“TSR”) would continue to apply as the most appropriate performance hurdle for long term incentives (“LTI”) for the 2010/11 year.
The Board proposes to continue to deliver LTIs in the form of both share options (“Options”) and performance share rights (“PSRs”). In reviewing LTI hurdles, the Board noted that its use of Options automatically creates an absolute performance hurdle (share price) that in combination with the relative TSR hurdle provides a dual alignment with shareholders.
One of the Board’s current focuses concerns gender pay equity, and this year’s Report includes a section on this issue.
In its tenth anniversary year, the Board considers that its remuneration objectives and policy have been important in driving the successful performance of the Company and in turn the creation of sustainable shareholder returns.
The competitive challenge for sourcing and retaining key and short-skilled resources continues for the development of the CSG business and the planned conversion of CSG to LNG project.
The Board notes the final Report from the Productivity Commission’s inquiry into executive pay. The Company’s policies are already consistent with many recommendations. The Company’s public submissions expressed concern with the initiatives around Board vacancies and the “two strikes” process around voting on remuneration reports, but observed only minor issues with most findings. The Remuneration Committee and the Board view strong governance, regulation and sound remuneration practice as fundamental to business performance. The Company’s approach to remuneration is guided by its Commitments, Principles and Values.
The Board is disappointed that the Federal Government has not heeded the recommendations of both the Productivity Commission and the Australian Prudential Regulatory Authority to remove the cessation of employment as a taxing point for deferred equity arrangements. This makes it increasingly challenging to implement arrangements that focus on long term goals, delivery and performance while parts of the regulatory framework focus on the short term. Nevertheless, the Board has navigated the complexities of the changing external environment and considers it has maintained the right balances in its remuneration design and implementation.
This Report is presented in the following sections:
1. Key terms;2. Remuneration framework;3. Overview of performance;4. Overview of executive remuneration;5. Employee Retention Plan;6. Employee Share Plan;7. Non-executive Director remuneration; and8. Remuneration tables and additional remuneration disclosures.
1. KEY TERmSThroughout this Report, the following terms have the meaning indicated below:
Key Management Personnel (KMP)
All Directors and those Senior Executive Management officers who have the authority and responsibility for planning, directing and controlling the activities of the Company.
Directors
Executive Directors and Non-executive Directors.
Senior Executive Management
The Managing Director and managers who report to the Managing Director.
Executives
Senior Executive Management plus all those senior employees who have been invited to participate in the Company’s LTI arrangements.
OCAT/PC (OCAT ratio)
Operating cash flow after tax (less interest tax shield) divided by Productive capital. OCAT/PC is one of two performance metrics used to determine STI outcomes, the other being underlying EPS (see below). PC excludes capital works in progress.
Underlying EPS
Underlying profit (Statutory Profit after excluded items) divided by the weighted average number of shares on issue.
2. REmUNERATION fRAmEWORK
2.1RemunerationCommittee
The Board Remuneration Committee is responsible for making recommendations to the Board on director and executive remuneration policy and structure. The composition and functions of the Remuneration Committee are set out in the Remuneration Committee Charter, which was reviewed and updated this year and is available in full on the Company’s website www.originenergy.com.au.
The Remuneration Committee comprises five Non-executive Directors with significant experience working within other Boards on remuneration matters. The independent members are Trevor Bourne (Chairman), Gordon Cairns, H Kevin McCann and Helen Nugent. Bruce Beeren is the other Non-executive Director on the Committee.
2.2AdviserstotheCommittee
The Committee seeks advice from external advisers from time to time. For matters pertaining to the remuneration of Directors and Senior Executive Management, Guerdon Associates is retained by and reports directly to the Remuneration Committee. As independent adviser, Guerdon Associates provides only remuneration advice to the Company. In addition, the Committee draws on remuneration advice from other external organisations, which may also provide other services to the Company. These include The Hay Group, Ernst & Young, and Hewitt Associates (on executive and employee remuneration information, data and benchmarking) and Mercer Consulting (actuarial assessment of superannuation funds, valuations of LTI instruments, and remuneration data and benchmarking).
2.3RemunerationPrinciples
The Committee is focused on managing the remuneration strategy, frameworks, policies and practices to ensure alignment with robust risk management practices and strong governance principles. The following are the key principles by which remuneration is managed:
• To maintain a remuneration framework that has an appropriate mix of fixed pay and “at risk” reward;
• To measure performance for the STI Plan in both financial and non-financial measures; and
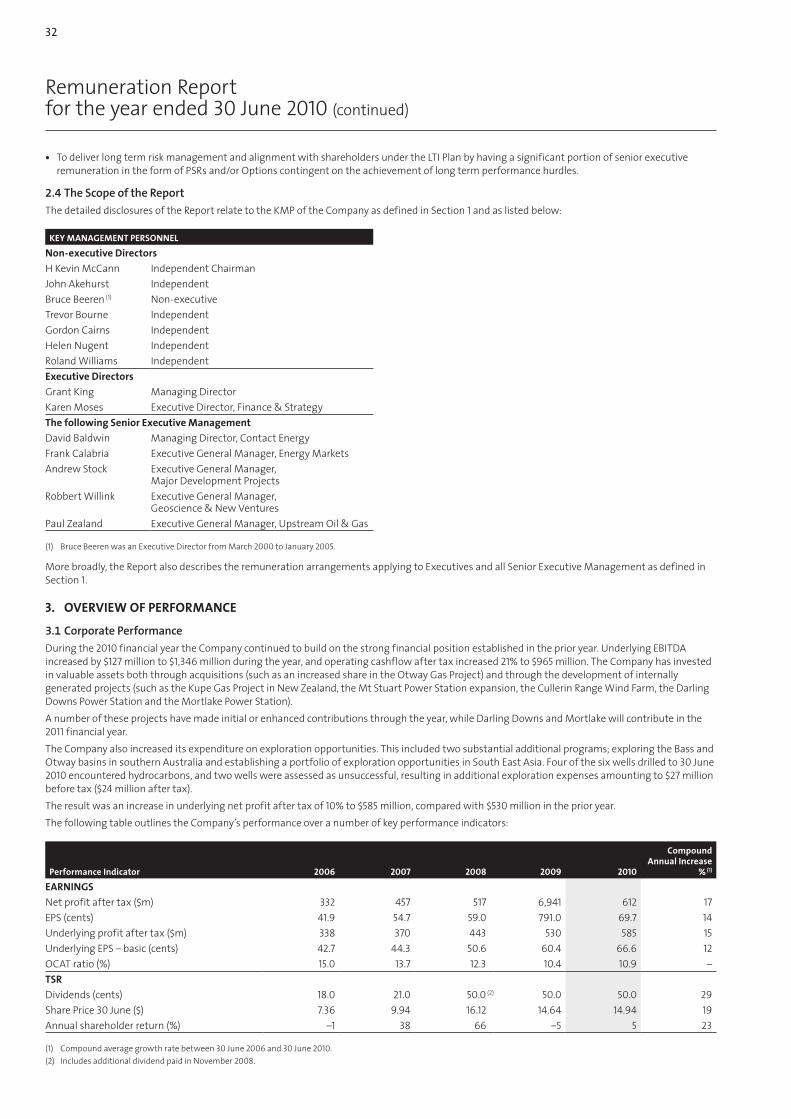
32
Remuneration Report for the year ended 30 June 2010 (continued)
• To deliver long term risk management and alignment with shareholders under the LTI Plan by having a significant portion of senior executive remuneration in the form of PSRs and/or Options contingent on the achievement of long term performance hurdles.
2.4TheScopeoftheReport
The detailed disclosures of the Report relate to the KMP of the Company as defined in Section 1 and as listed below:
KEY mANAGEmENT PERSONNEL
Non-executive directors
H Kevin McCann Independent Chairman
John Akehurst Independent
Bruce Beeren (1) Non-executive
Trevor Bourne Independent
Gordon Cairns Independent
Helen Nugent Independent
Roland Williams Independent
Executive directors
Grant King Managing Director
Karen Moses Executive Director, Finance & Strategy
The following Senior Executive management
David Baldwin Managing Director, Contact Energy
Frank Calabria Executive General Manager, Energy Markets
Andrew Stock Executive General Manager, Major Development Projects
Robbert Willink Executive General Manager, Geoscience & New Ventures
Paul Zealand Executive General Manager, Upstream Oil & Gas
(1) Bruce Beeren was an Executive Director from March 2000 to January 2005.
More broadly, the Report also describes the remuneration arrangements applying to Executives and all Senior Executive Management as defined in Section 1.
3. OvERvIEW Of PERfORmANcE
3.1CorporatePerformance
During the 2010 financial year the Company continued to build on the strong financial position established in the prior year. Underlying EBITDA increased by $127 million to $1,346 million during the year, and operating cashflow after tax increased 21% to $965 million. The Company has invested in valuable assets both through acquisitions (such as an increased share in the Otway Gas Project) and through the development of internally generated projects (such as the Kupe Gas Project in New Zealand, the Mt Stuart Power Station expansion, the Cullerin Range Wind Farm, the Darling Downs Power Station and the Mortlake Power Station).
A number of these projects have made initial or enhanced contributions through the year, while Darling Downs and Mortlake will contribute in the 2011 financial year.
The Company also increased its expenditure on exploration opportunities. This included two substantial additional programs; exploring the Bass and Otway basins in southern Australia and establishing a portfolio of exploration opportunities in South East Asia. Four of the six wells drilled to 30 June 2010 encountered hydrocarbons, and two wells were assessed as unsuccessful, resulting in additional exploration expenses amounting to $27 million before tax ($24 million after tax).
The result was an increase in underlying net profit after tax of 10% to $585 million, compared with $530 million in the prior year.
The following table outlines the Company’s performance over a number of key performance indicators:
Performance Indicator 2006 2007 2008 2009 2010
compound Annual Increase
% (1)
EARNINGS
Net profit after tax ($m) 332 457 517 6,941 612 17
EPS (cents) 41.9 54.7 59.0 791.0 69.7 14
Underlying profit after tax ($m) 338 370 443 530 585 15
Underlying EPS – basic (cents) 42.7 44.3 50.6 60.4 66.6 12
OCAT ratio (%) 15.0 13.7 12.3 10.4 10.9 –
TSR
Dividends (cents) 18.0 21.0 50.0 (2) 50.0 50.0 29
Share Price 30 June ($) 7.36 9.94 16.12 14.64 14.94 19
Annual shareholder return (%) –1 38 66 –5 5 23
(1) Compound average growth rate between 30 June 2006 and 30 June 2010.
(2) Includes additional dividend paid in November 2008.

ORIGIN ENERGY ANNUAL REPORT 2010 33
Remuneration Report for the year ended 30 June 2010 (continued)
From 30 June 2006 to 30 June 2010, the Company’s compound TSR was 22.6% per annum. This was significantly above the ASX 100 Accumulation Index, which increased by 0.4% per annum compound over the same period.
OriginEnergyTotalShareholderReturnsvsASX100TotalReturn(indexedto100from21/02/2000)
Source: Guerdon Associates.
TSR is defined as the growth in Company share price over the relevant performance period with dividends notionally reinvested on the ex-dividend date during the period. The share price is measured on a volume weighted basis for the three months preceding the relevant date.
4. OvERvIEW Of ExEcUTIvE REmUNERATION
4.1RemunerationPolicy
The remuneration policy of the Company is set by the Board and overseen by the Remuneration Committee. The policy purpose is to manage a total framework for rewards that achieves the following outcomes:
• Attracts and retains talented executives;
• Recognises and develops talent internally;
• Links rewards to the creation of sustainable shareholder value over the long term, while managing risk;
• Transacts all business consistently in line with the Company’s Commitments, Principles and Values;
• Builds and develops the competencies and capabilities of staff, providing opportunities for growth and development; and
• Rewards those who deliver outstanding performance.
The methodologies employed to meet these objectives are summarised below:
Policy Objective methodology
Attract and retain outstanding executives whose contribution is consistent with the Company’s Commitments, Principles and Values
Remuneration levels for Executives are reviewed against an ‘all industries’ group of over 440 companies, with some specialist roles benchmarked against smaller ‘peer’ groups of companies.
The median level is applied as a benchmark for fixed pay while the top quartile level is the benchmark for aggregate remuneration (i.e. fixed plus “at-risk” remuneration) for outstanding performance.
Motivate executives to achieve superior performance that is aligned with shareholders’ interests while managing risk
The variable or “at-risk” component of remuneration is determined by Company performance and individual contribution, taking into account risk and sustainability. For Senior Executive Management 43%-61% of total remuneration (depending on level) is at risk when achievements are at target levels. When achievements are at “stretch” or maximum levels, the at-risk proportion increases to 56%-72%.
The at risk remuneration is provided through STI and LTI plans. Value is achieved only where clear and challenging performance hurdles are met.
STI performance is measured against annual financial, safety and individual targets.
LTI allocations (share-based payments) are related to individual performance, actual and potential contribution, and are subject to Company performance hurdles. Vesting is based on achievement against an external measure (relative TSR).
0
200
400
600
800
1,000
1,200
1,400
1,600
30 Jun2000
30 Jun2001
30 Jun2002
30 Jun2003
30 Jun2004
30 Jun2005
30 Jun2006
30 Jun2007
30 Jun2008
30 Jun2009
Origin Total Shareholder Return
30 Jun2010
S&P/ASX 100 Index Total Return
Inde
x Le
vel
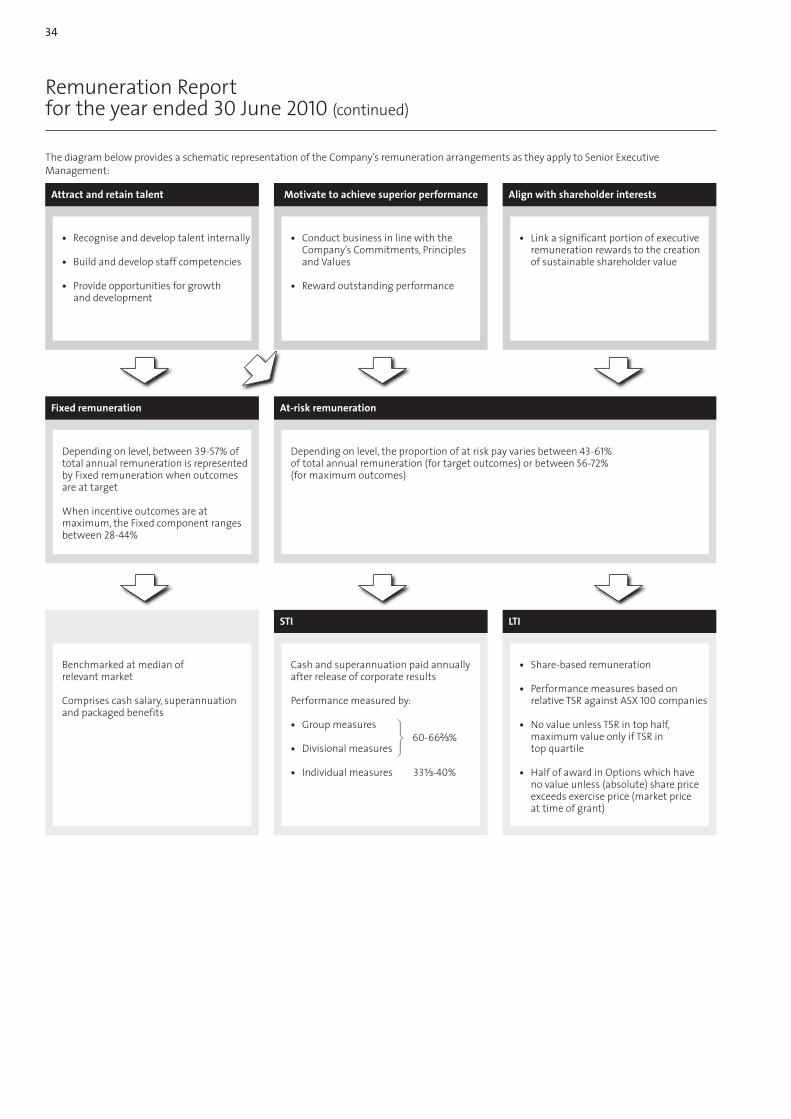
34
The diagram below provides a schematic representation of the Company’s remuneration arrangements as they apply to Senior Executive Management:
Remuneration Report for the year ended 30 June 2010 (continued)
Attract and retain talent Motivate to achieve superior performance Align with shareholder interests
• Recognise and develop talent internally
• Build and develop staff competencies
• Provide opportunities for growth and development
• Conduct business in line with the Company’s Commitments, Principles and Values
• Reward outstanding performance
• Link a significant portion of executive remuneration rewards to the creation of sustainable shareholder value
Fixed remuneration At-risk remuneration
Depending on level, between 39-57% of total annual remuneration is represented by Fixed remuneration when outcomes are at target
When incentive outcomes are at maximum, the Fixed component ranges between 28-44%
Depending on level, the proportion of at risk pay varies between 43-61% of total annual remuneration (for target outcomes) or between 56-72% (for maximum outcomes)
STI LTI
Benchmarked at median of relevant market
Comprises cash salary, superannuation and packaged benefits
Cash and superannuation paid annually after release of corporate results
Performance measured by:
• Group measures • Divisional measures
• Individual measures 33⅓-40%
• Share-based remuneration
• Performance measures based on relative TSR against ASX 100 companies
• No value unless TSR in top half, maximum value only if TSR in top quartile
• Half of award in Options which have no value unless (absolute) share price exceeds exercise price (market price at time of grant)
60-66⅔%

ORIGIN ENERGY ANNUAL REPORT 2010 35
4.2RemunerationMix
The figure below represents the remuneration mix between fixed and variable pay (STI and LTI), when variable pay is at the maximum. The reward mix is determined for different role levels in the Company such that there is an increasing proportion of pay at risk with increasing level of responsibility.
RemunerationMixatMaximumOutcomes
In determining the appropriate mix of performance hurdles to apply, the Board takes a holistic approach to align performance outcomes with strategic business goals and market expectations. In particular, regard is taken to the overall balance of performance measures for the at risk component to ensure there is an appropriate mix between relative and absolute hurdles, short and long term objectives, and financial and non-financial targets. Particular attention has been paid to the level of deferred pay (see Section 4.6).
The mix has been determined in view of the nature of the Company’s business, its capital intensiveness and length of project gestation. The mix results in a relatively high proportion of at risk pay in the LTI component, making it inappropriate to defer further amounts by deferral of some of the short term component.
The diagram below shows how the at risk component of the Company’s executive remuneration framework is structured to align with strategic objectives.
0 10% 20% 30% 40% 50% 60% 70% 80% 90% 100%
ManagingDirector
SeniorExecutive
Management
Fixed STI LTI
Remuneration Report for the year ended 30 June 2010 (continued)
Component Delivery Performance measure Strategic objective
STI Cash Company Measure 1:Underlying EPS
Drive real annual earnings growth(Widely used and understood metric)
Company Measure 2:OCAT/PC
Measure of cash flow required to exceed risk adjusted capital earnings,
reflecting the long term nature of many of the Company’s projects (appropriate
for the Company’s business)
LTI Options/PSRs
Relative TSR(ASX 100)
Measure return on capitalCreate shareholder wealth
(3 – 5 year period)
Total at riskremuneration
Divisional Measure:(e.g. financial measures such as EBITDA,
capital and opex management)
Reward achievement of specific divisional performance goals
Individual Measure:(e.g. project delivery,
culture-engagement, safety)
Rewards individual behaviours in line with corporate philosophy

36
4.3RemunerationDetails
There was a freeze on increases in fixed remuneration for Senior Executive Management in 2009. 59% of other Executives did not have salaries adjusted during the year, reflecting conditions in the general market.
fixed Remuneration
Fixed Remuneration Executives are paid a fixed package amount which includes the minimum regulatory Company superannuation contribution. Executives may salary sacrifice from this package additional superannuation and/or benefits such as novated vehicle lease.
Benefits Benefits include salary continuance insurance, accidental death and disablement, parking and fringe benefits. Some benefits are available through salary sacrifice from fixed package and others are paid in addition to fixed package.
Benchmarking The level of fixed remuneration is reviewed against the median of the relevant market having regard to the Executive’s responsibilities, performance, qualifications, experience and contribution.
A second STI performance measure was adopted in 2009/10: growth in underlying EPS.
variable Remuneration – STI
Performance Period Performance cycle annual; payment annual.
Opportunity Level The maximum opportunity level is expressed as a percentage of fixed remuneration, and is determined by the Executive’s relative influence on company performance. “Target” performance outcomes represent 60% of the maximum level.
Senior Executive Management have maximum STI opportunity levels that are determined by their seniority and role. The maximum ranges from 65% to 100% of fixed remuneration (i.e. 39% to 60% at target).
Payment Vehicle Cash-based plan linking specific financial and non-financial targets with the Executive’s remuneration.
Performance Measures The Company aligns Executive performance requirements with strategic business goals and market expectations and uses three levels of performance measures:
managing director
Senior Executive management
(average of operational
roles)
Group Financial Targets • OCAT/PC (see Section 1)
• Growth in underlying EPS 60% 33⅓%
Business Unit Targets
Non-Financial(e.g. safety performance, project delivery etc)Business Unit Financial(e.g. opex and capex management, cash flow, EBIT and EBITDA measures etc) – 33⅓%
Individual Targets Personal Key Performance Indicators which may be financial or non-financial and may include culture and engagement and people measures, risk and safety plans etc 40% 33⅓%
The STI can be reduced if safety targets are not achieved, or it may be increased or decreased in exceptional circumstances with Board approval.
Performance Assessment Company goals are set, and outcomes approved, by the Board. Division goals are set by the Managing Director and reviewed by the Remuneration Committee. Senior Executive Management performance is assessed by the Managing Director, reviewed by the Remuneration Committee and approved by the Board. The Managing Director’s performance is assessed and approved by the Board.
Payments of annual STI are generally made in September, after the reviews are completed.
David Baldwin is on secondment to Contact Energy Limited (“Contact”) and his STI is assessed by its Board.
Remuneration Report for the year ended 30 June 2010 (continued)

ORIGIN ENERGY ANNUAL REPORT 2010 37
Key management Personnel (excluding Non-executive directors)
maximum STI as a % of fixed remuneration
Actual STI as a % of maximum STI (1)
% of maximum STI payment not achieved (2)
Actual STI payment (3)
Grant King 2010 120 72 28 1,820,000
2009 120 107 0 2,688,000
Karen Moses 2010 100 78 22 900,000
2009 100 84 16 966,663
David Baldwin (4) 2010 100 60 40 396,376
2009 100 30 70 200,147
Frank Calabria 2010 100 81 19 605,000
2009 100 100 0 747,288
Andrew Stock 2010 85 82 18 525,000
2009 85 84 16 532,732
Robbert Willink 2010 75 74 26 340,000
2009 75 54 46 247,050
Paul Zealand 2010 75 65 35 300,000
2009 75 91 9 415,129
TOTAL 2010 73 27 4,886,376
2009 87 13 5,797,009
(1) In exceptional circumstances the Board may award more than the maximum to an individual provided that the maximum overall is not exceeded.
(2) Where the actual STI payment is less than maximum potential, the difference is forfeited. It does not become payable in subsequent years.
(3) 2010 STI constitutes a cash bonus granted for the year ended 30 June 2010, determined following the close of 2010 results and paid in September 2010. 2009 STI constitutes a cash bonus granted for the year ended 30 June 2009, determined following the close of 2009 results and paid in September 2009.
(4) NZD/AUD annual average exchange rate 1.2362 at 30 June 2010 (2009: 1.2291).
variable Remuneration – LTI
Performance Period The performance cycle is 3 to 5 years, issued on a rolling annual basis.
Opportunity Level The maximum opportunity level is expressed as percentage of fixed remuneration. These levels are set by reference to the Executive’s role and contribution to the long term and sustainable growth of the Company. The “target” performance represents 60% of the maximum level.
Senior Executive Managers have maximum opportunities ranging from 55% to 100% of fixed remuneration (33% to 60% at target) depending on their specific role.
Payment Vehicle Under the LTI Plan, Executives are granted a combination of:
(a) PSRs, which are the right to a fully paid share at no cost; and/or
(b) Options, which are the right to a fully paid share at an exercise price equal to the volume weighted average market price for the Company’s shares in the five business days leading up to and including the date of grant, that is the market price at issue.
For the 2009/10 year the Board has determined a maximum allocation value for 145 executives (including two Executive Directors) of $19.8 million for all LTI awards. In terms of potential share issuance this equates to a maximum of approximately 0.3% of issued shares.
Noting the motivating and retention effect of the LTI Plan and the effect it has had on containing turnover where it currently applies, and following a review of market practices to ensure the Company’s remuneration remains competitive, the Board has determined to extend the operation of the LTI Plan to approximately 420 executives in 2010/11. This is forecast to equate to a maximum allocation value of $30 million and a potential maximum of approximately 0.5% of issued shares.
Until this year David Baldwin’s LTI had been in the form of Contact equity (refer to Contact’s website – www.contactenergy.co.nz). In 2009/10 David Baldwin’s LTI delivery was changed to incorporate equity in the Company for alignment with arrangements for other Senior Executive Management, and he will continue to receive equity awards in the Company in future years.
Remuneration Report for the year ended 30 June 2010 (continued)

38
variable Remuneration – LTI
Performance Measures Relative TSR assessed at the end of the performance period against the ASX 100 group of companies (as at date of grant). The degree to which the award vests is determined by the Company’s percentile ranking against the following scale:
TSR Percentile Ranking % of Award vesting
<50th 0%
50th 50%
75th or higher 100%
Between the 50th and 75th percentiles the percentage of award vesting increases proportionately.
Independent testing of TSR is undertaken at the third anniversary of the grant and awards vest according to the highest ranking achieved. Any balance not vested is carried forward and tested at the fourth anniversary, and similarly for the fifth anniversary.
The Board examined re-testing philosophy in 2007 and changed from continuous testing to the two re-tests above. In concluding that this represented an appropriate performance assessment, it is noted that reducing the level of testing results in lower fair valuation of the rights involved, and therefore results in a corresponding increase in the number of rights that must be issued in order to maintain the intended allocation value to the Executive.
In respect of Options, vesting requires that the market price exceed the exercise price.
The Board believes that TSR as a performance measure is both transparent and robust. Relative TSR is a forward looking measure and represents an assessment of the Company’s ability to invest and achieve a return on capital relative to other companies. The Board believes that it is appropriate to measure the Company’s TSR against a peer group as it encourages success and competitiveness in attracting capital, employees and customers relative to peers. The use of Options in conjunction with a relative TSR hurdle provides a combination of an absolute and a relative measure (the absolute share price must appreciate in order for the Options to have any value).
There have been no changes to the Company’s LTI Plan during the year.
Details of the grants made to the Executive Directors and Executives during the 2010 financial year are set out in Section 8.4.
Performance Assessment Prior to 2010 LTI allocations were related to the quantum of STI outcomes. Since 2010 the LTI allocations are based on an assessment of the employee’s actual and potential contribution and overall performance, thus breaking a nexus that previously existed between short and long-term performance.
The Senior Executive Management team is assessed by the Managing Director, reviewed by the Remuneration Committee and approved by the Board. The Managing Director’s performance is assessed by the Board.
In exceptional circumstances the Board may award more than the maximum to an individual provided that the maximum overall is not exceeded.
If the relevant performance conditions are satisfied at the end of the performance period, then the awards will vest and, in respect of:
(a) the PSRs that vest, upon exercise the executive will be allocated shares in the Company at no cost to the Executive; and
(b) the Options that vest, those Options will become exercised upon payment of the exercise price, and the Executive will then be allocated shares in the Company.
Equity Grants The Board’s practice of awarding LTI half by value in the form of Options and half as PSRs was continued in 2010. Because the Options and the PSRs have different values, that means an executive will receive a different number of each.
The number of Options and PSRs for each Executive is calculated by dividing the allocation value of the LTI award for that Executive by the independently-determined fair market value of the unit Option and/or PSR estimated at the date of grant. The fair value is calculated using a Black-Scholes methodology with a Monte Carlo simulation model that takes into account market conditions and performance hurdles.
The recommended number of equity units for Executive Directors is recommended by the Board for approval by shareholders.
Exercise Period and Forfeiture Options and PSRs may only be exercised where the performance hurdle has been met, to the extent set out in the vesting table above.
Unexercised Options and PSRs expire, lapse, or forfeit:
(a) Immediately, if there has been termination for cause;
(b) Six months after notice of resignation, if there has been a resignation by the employee; or
(c) 5¼ years after grant, in all other cases. This means unexercised Options and PSRs remain subject to their performance hurdles and other Plan conditions in the event of genuine retirement, redundancy, Company-initiated transfer of employment, or other termination by the Company without cause.
Remuneration Report for the year ended 30 June 2010 (continued)

ORIGIN ENERGY ANNUAL REPORT 2010 39
variable Remuneration – LTI
Early Vesting Early vesting may occur in certain circumstances, subject to the performance hurdle being achieved:
• On a person/entity acquiring more than 20% of the voting shares in the Company pursuant to a takeover bid that has become unconditional;
• On termination of employment due to death or permanent disability; and
• In other circumstances where the Board determines appropriate (note: such discretion has never been exercised by the Board and would require exceptional circumstances).
Hedging Policy The Company’s policy requires that employees not trade instruments or other financial products which operate to limit the economic risk of any securities held under any equity-based incentive schemes, while those holdings are subject to performance hurdles or are otherwise unvested.
The Company Secretary monitors adherence to this policy. Non-compliance may result in summary dismissal.
Modifications of Terms of Equity-Settled Share-Based Payment Transactions
No terms of equity-settled share-based transactions (including Options and PSRs granted as compensation to a KMP) have been altered or modified by the issuing entity during the reporting period or the prior period.
4.4ManagingDirector’sRemunerationDetails
Further details on the Managing Director’s remuneration arrangements are tabulated below:
managing director Remuneration details
Fixed remuneration The Managing Director’s fixed remuneration for the financial year to 30 June 2010 was unchanged from the prior year at $2,100,000.
The Board commissioned an external report on chief executive remuneration which provided detailed benchmarks across a range of domestic and international peer groups. The Board concluded from the analysis that it was appropriate to increase the Managing Director’s fixed remuneration to $2,300,000 for the financial year to 30 June 2011.
STI The maximum STI opportunity level is 120% of fixed remuneration (72% at target). This level will remain unchanged for the financial year to 30 June 2011.
60% of the Managing Director’s STI is determined on the Company performance measure and 40% on individual measures.
Company performance for 2009/10 was determined against two equally weighted measures, OCAT Ratio and growth in Underlying EPS (see Section 1).
LTI The maximum level for the financial year to 30 June 2010 is 140% of fixed remuneration, maintaining an appropriate balance between short term and long term performance. This level will continue to apply for the financial year to 30 June 2011.
The Managing Director has agreed to maintain a substantial shareholding in the Company.
4.5ContractualArrangements
The table below sets out the main terms and conditions of the employment contracts of the Managing Director and Senior Executive Management.
Name contract duration Notice Period Termination Payments
Grant King To 30 June 2014 • 12 months either party
• Immediate for misconduct, breach of contract or bankruptcy
• 6 months extended illness
• Statutory entitlements only for termination with cause
• Payment in lieu of notice at Company discretion
• For Company termination “without cause”, pro rata STI is payable
Senior Executive Management
Ongoing (no fixed term) • Up to 3 months either party
• Immediate for misconduct, breach of contract or bankruptcy
• Statutory entitlements only for termination with cause
• Payment in lieu of notice at Company discretion
• For Company termination “without cause”, pro rata STI is payable
• For Company termination “without cause”, payment equivalent to 3 weeks’ fixed remuneration per year of service capped at 74 weeks; a minimum may also apply (generally 18-22 weeks)
The above represents current arrangements under existing regulations, prior to the amendments to the Corporations Act 2001 (Cth) regarding termination payments which came into effect on 24 November 2009. Entitlements under pre-existing contracts are not subject to the new limits on termination payments. The new legislative provisions which will apply to agreements entered into with any KMP appointed after 24 November 2009.
Remuneration Report for the year ended 30 June 2010 (continued)

40
4.6TheProportionofPaythatisDeferred
As observed in Section 4.2, the Company’s pay mix has been determined appropriate to its capital intensiveness and the nature of its long life assets. These characteristics distinguish it from other sectors, for example the finance sector, and lead it to a pay mix that is more heavily weighted to the LTI component than is generally the case in those other sectors.
For the Managing Director, the LTI component represents the greatest proportion of pay (140% of Fixed Remuneration compared to 120% of Fixed Remuneration for the STI).
The Company does not defer any part of its STI because a significant proportion of pay is in the LTI which is wholly deferred. Although some organisations defer some of their STI component, this is usually associated with pay mixes which have a higher proportion of pay in the short term component.
The figure below shows the deferral level of the Managing Director’s package structure (calculated at both maximum and target outcomes) compared to market.
Proportionofpaythatisdeferred
Source: Guerdon Associates. Based on 2009 public remuneration disclosures using applicable accounting standards.
4.7GenderPayEquity
The Company adopts an ‘equal pay for equal work’ approach to remuneration. During the organisation-wide salary review process, management analyses salary changes by grade level (using grades to represent ‘equal work’). Variations that occur are negligible in magnitude, and are monitored in order to prevent and eliminate any persistent gaps or potential systemic bias. The Company’s gender distribution has, in common with the energy industry generally, a skew in which females are over-represented in lower-graded jobs and under-represented in higher-graded jobs. The Company is developing targets to improve the gender distribution, and the Board will monitor progress against those targets to foster and develop higher levels of females in senior roles, especially in roles with operational accountabilities.
5. EmPLOYEE RETENTION PLANAs part of the Company’s ongoing operations, from time to time the Board has approved deferred pay retention arrangements used primarily to reduce the risk of loss of employees who manage critical activities, occupy roles that are key to the delivery of operating or strategic objectives, or undertake functions requiring skills that are in short supply and actively sought in the market. The arrangements allow for the key employees to be provided with deferred equity (deferred share rights) or deferred cash payment provided that they remain in employment to a nominated date (generally 2-4 years in the future) and achieve personal performance targets.
The Deferred Share Rights Plan was approved by the Board in early 2010 to provide an equity grant as an alternative to cash. The period of deferral is four years and the equity would be time vesting in equal amounts at the ends of the second, third and fourth year.
As at 30 June 2010, no Deferred Share Rights had been issued, and the number of employees with deferred cash arrangements stood at 31 (2009: 235).
There is no requirement that any retention payment/award be made to an eligible employee on a change of control of the Company. All the retention arrangements that were put in place for key employees during 2008/09 pursuant to the circumstances surrounding the takeover bid by the BG Group and the CSG monetisation process have now been paid out including the contingent retention payments in relation to Senior Executive Management that were reported in 2009 in the Long Term Payments column of the Remuneration Table in Section 8.1.
0
20%
40%
60%
80%
100%
Origin MD at max
CEOsMaterials
CEOsConsumer
Origin MDat target
CEOsASX100
CEOsEnergy
CEOsFinancials
CEOsIndustrials
Per centof
package deferred
Per cent of
package not
deferred
Remuneration Report for the year ended 30 June 2010 (continued)

ORIGIN ENERGY ANNUAL REPORT 2010 41
6. EmPLOYEE ShARE PLANAll permanent employees of the Company in Australia and New Zealand (other than Executive Directors) with more than one year of service are eligible to participate in the Employee Share Plan. The Plan provides for an award of up to $1,000 of shares in the Company if the Company meets specified financial and/or safety targets set by the Board. To be eligible to receive shares, annual performance measures which relate to targeted areas of Company-wide performance must be achieved. Shares awarded under the Plan must be held for at least three years following the award or until the employee ceases employment.
For the year ended 30 June 2010 a safety target was set for combined employee and contractor performance. The target has been met and consequently an award of $1,000 (pro-rata for part-time employees) is scheduled to be made in September 2010. These shares will be purchased on market.
In addition, as part of the Company’s tenth anniversary celebrations, the Board approved a special award of 20 shares to all employees on the same terms as the Employee Share Plan. A total of 69,700 shares were awarded to 3,485 employees on 31 March 2010. Shares for this award were issued.
Other arrangements may apply for employees in operations outside Australia and New Zealand.
7. NON-ExEcUTIvE dIREcTOR REmUNERATION
7.1 Policy
The structure of the Non-executive Director Share Plan has been changed following the Government’s amendments to the taxation of fee sacrifice for shares schemes – i.e. revisions to the minimum shareholding requirement and minimum fee sacrifice amount – refer Section 7.3 for details.
Policy Objective methodology
Promote independence and objectivity
Fees for Non-executive Directors are fixed by role and workload, allowing independent and objective assessment of Executive and Company performance
Attract and retain Directors who have skills required by the Board and with a reputation for directorial skill and ability
Director’s fees are set taking into account the fee levels in companies of comparable market capitalisation to the Company
Alignment of Non-executive Directors with shareholder interests and the development of long term value
Purchase of Company’s shares by Directors to a minimum holding level of 10,000 shares (rules have been amended for 2009/10 – see Section 7.3 for details)
Non-executive Directors are remunerated by way of base fees and Committee fees (inclusive of superannuation). Directors can elect to receive this in the form of participation in the shareholder-approved Non-executive Director Share Plan.
The level of fees paid is based on the scope of the Directors’ responsibilities and the size and the complexity of the Company. The Remuneration Committee considers the level of remuneration required to attract and retain directors with the necessary skills and experience for the Board.
7.2 Non-executiveDirectorFeeStructure
The table below shows the structure and level of Non-executive Director fees for the past two years and for the year ending 30 June 2011. Fees during the 2010 year were unchanged from 2009. The increase in fees to operate for the 2011 year was determined following an external benchmarking review by Guerdon Associates. The Guerdon Report indicated that the Chairman and base director fees together with some of the Committee fees were below market and these have been adjusted accordingly. The Audit Committee fees were deemed to be appropriate and have remained unchanged.
Year ending 30 June 2009 and 2010 2011
Board fees
Chairman $570,000 $620,000
Director $160,000 $180,000
committee fees
Audit
Chairman $55,000 $55,000
Member $28,000 $28,000
Remuneration
Chairman $38,000 $45,000
Member $15,000 $20,000
Health, Safety & Environment
Chairman $38,000 $40,000
Member $15,000 $20,000
Risk
Chairman & members $0 $0
Nomination
Chairman & members $0 $0
7.3 Non-executiveDirectorSharePlan
Prior to 30 June 2009 the Non-executive Director Share Plan required Non executive Directors to sacrifice 25% of their gross fees until they hold a minimum of 20,000 shares in the Company. These shares are acquired on-market by the Trustee of the Plan to be held for participating Non-executive Directors. The Trustee of the Plan may transfer to a Non-executive Director a share acquired under the Plan after five years or upon retirement from office or death of the Non-executive Director.
Following government changes limiting salary sacrifice arrangements to $5,000, from 1 July 2009 Non-executive Directors may sacrifice up to $5,000 per annum. In view of the increase in the market price of the Company’s shares, the minimum shareholding requirement has been reduced from 20,000 to 10,000 shares within three years of appointment.
No allocations were made under the Non-executive Director Share Plan during the financial year.
Remuneration Report for the year ended 30 June 2010 (continued)

42
8. REmUNERATION TABLES ANd AddITIONAL REmUNERATION dIScLOSURES
8.1RemunerationTablefor2010and2009
Short Term Benefits Post Employment BenefitsOther Long Term
BenefitsLong Term Payments
YearBase Salary /
feescontact Energy
fees (1)variable
Remuneration (2)Non-monetary
Benefits (3)Insurance Premiums Total Super
NEd Long Term Benefits (4) Total Accrued LSL
Retention, Options & PSRs (5)
Total Remuneration
% of Total Remuneration
“At Risk”
% of Remuneration in
Options & PSRs
Executive directors
Grant King 2010 2,059,048 107,857 1,820,000 12,200 13,592 4,012,697 40,952 – 40,952 52,500 1,915,458 6,021,607 62% 32%
2009 2,004,450 72,320 2,688,000 4,800 1,982 4,771,552 95,550 – 95,550 115,441 1,109,863 6,092,406 62% 18%
Karen Moses 2010 1,108,802 72,804 900,000 13,398 8,329 2,103,333 40,000 – 40,000 28,750 1,523,000 3,695,083 66% 41%
2009 1,053,210 44,297 966,663 12,676 1,982 2,078,828 96,548 – 96,548 71,665 952,769 3,199,810 60% 14%
Executives
David Baldwin (6) 2010 678,577 – 396,376 – 3,682 1,078,635 – – – – 554,238 (7) 1,632,873 58% 34%
2009 667,155 – 200,147 3,573 614 871,489 – – – – 762,988 1,634,477 59% 19%
Frank Calabria 2010 725,004 – 605,000 12,200 6,137 1,348,341 24,996 – 24,996 9,370 461,972 1,844,679 58% 25%
2009 699,400 – 747,288 4,800 1,982 1,453,470 50,000 – 50,000 15,627 718,564 2,237,661 66% 10%
Andrew Stock 2010 718,040 – 525,000 4,333 30,320 1,277,693 31,960 – 31,960 18,750 377,766 1,706,169 53% 22%
2009 648,067 – 532,732 3,733 1,982 1,186,514 100,000 – 100,000 65,842 557,441 1,909,797 57% 11%
Robbert Willink 2010 527,299 – 340,000 4,800 9,057 881,156 82,701 – 82,701 (45,750) 189,246 1,107,353 48% 17%
2009 526,102 – 247,050 1,300 1,982 776,434 88,450 – 88,450 35,232 401,522 1,301,638 50% 9%
Paul Zealand 2010 566,771 – 300,000 6,133 7,905 880,809 49,896 – 49,896 7,746 220,418 1,158,869 45% 19%
2009 508,667 – 415,129 2,283 1,982 928,061 100,000 – 100,000 9,785 500,705 1,538,551 59% 8%
Non-executive directors
Kevin McCann 2010 555,528 – – 929 181 556,638 14,472 – 14,472 – – 571,110
2009 608,006 – – 666 170 608,842 13,752 – 13,752 – – 622,594
John Akehurst (8) 2010 126,697 – – – 181 126,878 12,232 26,767 38,999 – – 165,877
2009 20,909 – – – – 20,909 1,882 – 1,882 – – 22,791
Bruce Beeren 2010 188,528 86,556 – 1,053 181 276,318 14,472 – 14,472 – 28,313 319,103
2009 240,140 90,621 – 1,108 170 332,039 13,752 – 13,752 – 27,120 372,911
Trevor Bourne 2010 198,528 – – – 181 198,709 14,472 – 14,472 – – 213,181
2009 209,000 – – – 170 209,170 36,000 – 36,000 – – 245,170
Gordon Cairns 2010 149,507 – – – 181 149,688 13,346 32,565 45,911 – – 195,599
2009 168,188 – – – 170 168,358 15,137 33,093 48,230 – – 216,588
Helen Nugent 2010 190,008 – – 2,666 181 192,855 14,573 40,102 54,675 – – 247,530
2009 200,258 – – – 170 200,428 13,752 38,440 52,192 – – 252,620
Roland Williams 2010 186,592 – – – 181 186,773 14,573 39,186 53,759 – – 240,532
2009 197,500 – – – 170 197,670 13,752 40,365 54,117 – – 251,787
Total (9) 2010 7,978,929 267,217 4,886,376 57,712 80,289 13,270,523 368,645 138,620 507,265 71,366 5,270,410 19,119,564
2009 7,751,052 207,238 5,797,009 34,940 13,526 13,803,765 638,575 111,898 750,472 313,592 5,030,972 19,898,801
Remuneration Report for the year ended 30 June 2010 (continued)
(1) Grant King, Bruce Beeren and Karen Moses are the Company’s nominees on the Board of Contact.
(2) Variable remuneration includes the STI in respect of the financial year based on achieving personal goals and satisfying specified performance criteria plus any discretionary amounts awarded for exceptional contributions. 2010 STI constitutes a cash bonus granted for the year ended 30 June 2010, determined following the close of 2010 results and paid in September 2010. 2009 STI constitutes a cash bonus granted for the year ended 30 June 2009, determined following the close of 2009 results and paid in September 2009.
(3) Non-monetary benefits include fringe benefits such as car parking and reportable fringe benefits.
(4) Benefits under the Non-Executive Director’s Share Plan (refer to Section 7.3) or the fees sacrificed for application toward the purchase of such shares where ultimately the sacrifice has been returned as cash.
(5) Includes restricted shares for Contact fees; retention payments as set out in Section 5; and the fair value of equity rights awarded. The fair value of the Options and PSRs is calculated at the date of grant using a Black-Scholes methodology with a Monte Carlo simulation model that takes into account hurdles. The fair value is allocated to each reporting period evenly over the period from date of grant to the first vesting test date. The value disclosed is the portion of the fair value of the Options/PSRs allocated to this reporting period. In valuing the Options/PSRs, market conditions have been taken into account.
(6) David Baldwin is paid in New Zealand currency. Remuneration is converted to Australian dollars using an annual average exchange rate of $1.2362 at 30 June 2010 (2009: $1.2291). Base salary includes holiday pay rate adjustments. Mr Baldwin’s fixed remuneration and all or part of his short term variable remuneration is reimbursed by Contact.
(7) Includes Options and restricted shares issues by Contact, and Options and PSRs issued by the Company.
(8) John Akehurst was appointed as a Non-executive Director on 29 April 2009.
(9) All named Executives and Executive Directors are employed and remunerated by the Company and its controlled entities. All Non-executive Directors are remunerated by the Company.

ORIGIN ENERGY ANNUAL REPORT 2010 43
Remuneration Report for the year ended 30 June 2010 (continued)
Note: Fixed remuneration (as defined in Section 4.3) is the sum of base salary, non-monetary benefits, and superannuation. Where an Executive’s Fixed Remuneration was frozen during the financial year, some variation may occur due to changes in the valuation of non-monetary benefits such as car parking, or changes in the package make-up (for example cash to superannuation or vice versa).
8. REmUNERATION TABLES ANd AddITIONAL REmUNERATION dIScLOSURES
8.1RemunerationTablefor2010and2009
Short Term Benefits Post Employment BenefitsOther Long Term
BenefitsLong Term Payments
YearBase Salary /
feescontact Energy
fees (1)variable
Remuneration (2)Non-monetary
Benefits (3)Insurance Premiums Total Super
NEd Long Term Benefits (4) Total Accrued LSL
Retention, Options & PSRs (5)
Total Remuneration
% of Total Remuneration
“At Risk”
% of Remuneration in
Options & PSRs
Executive directors
Grant King 2010 2,059,048 107,857 1,820,000 12,200 13,592 4,012,697 40,952 – 40,952 52,500 1,915,458 6,021,607 62% 32%
2009 2,004,450 72,320 2,688,000 4,800 1,982 4,771,552 95,550 – 95,550 115,441 1,109,863 6,092,406 62% 18%
Karen Moses 2010 1,108,802 72,804 900,000 13,398 8,329 2,103,333 40,000 – 40,000 28,750 1,523,000 3,695,083 66% 41%
2009 1,053,210 44,297 966,663 12,676 1,982 2,078,828 96,548 – 96,548 71,665 952,769 3,199,810 60% 14%
Executives
David Baldwin (6) 2010 678,577 – 396,376 – 3,682 1,078,635 – – – – 554,238 (7) 1,632,873 58% 34%
2009 667,155 – 200,147 3,573 614 871,489 – – – – 762,988 1,634,477 59% 19%
Frank Calabria 2010 725,004 – 605,000 12,200 6,137 1,348,341 24,996 – 24,996 9,370 461,972 1,844,679 58% 25%
2009 699,400 – 747,288 4,800 1,982 1,453,470 50,000 – 50,000 15,627 718,564 2,237,661 66% 10%
Andrew Stock 2010 718,040 – 525,000 4,333 30,320 1,277,693 31,960 – 31,960 18,750 377,766 1,706,169 53% 22%
2009 648,067 – 532,732 3,733 1,982 1,186,514 100,000 – 100,000 65,842 557,441 1,909,797 57% 11%
Robbert Willink 2010 527,299 – 340,000 4,800 9,057 881,156 82,701 – 82,701 (45,750) 189,246 1,107,353 48% 17%
2009 526,102 – 247,050 1,300 1,982 776,434 88,450 – 88,450 35,232 401,522 1,301,638 50% 9%
Paul Zealand 2010 566,771 – 300,000 6,133 7,905 880,809 49,896 – 49,896 7,746 220,418 1,158,869 45% 19%
2009 508,667 – 415,129 2,283 1,982 928,061 100,000 – 100,000 9,785 500,705 1,538,551 59% 8%
Non-executive directors
Kevin McCann 2010 555,528 – – 929 181 556,638 14,472 – 14,472 – – 571,110
2009 608,006 – – 666 170 608,842 13,752 – 13,752 – – 622,594
John Akehurst (8) 2010 126,697 – – – 181 126,878 12,232 26,767 38,999 – – 165,877
2009 20,909 – – – – 20,909 1,882 – 1,882 – – 22,791
Bruce Beeren 2010 188,528 86,556 – 1,053 181 276,318 14,472 – 14,472 – 28,313 319,103
2009 240,140 90,621 – 1,108 170 332,039 13,752 – 13,752 – 27,120 372,911
Trevor Bourne 2010 198,528 – – – 181 198,709 14,472 – 14,472 – – 213,181
2009 209,000 – – – 170 209,170 36,000 – 36,000 – – 245,170
Gordon Cairns 2010 149,507 – – – 181 149,688 13,346 32,565 45,911 – – 195,599
2009 168,188 – – – 170 168,358 15,137 33,093 48,230 – – 216,588
Helen Nugent 2010 190,008 – – 2,666 181 192,855 14,573 40,102 54,675 – – 247,530
2009 200,258 – – – 170 200,428 13,752 38,440 52,192 – – 252,620
Roland Williams 2010 186,592 – – – 181 186,773 14,573 39,186 53,759 – – 240,532
2009 197,500 – – – 170 197,670 13,752 40,365 54,117 – – 251,787
Total (9) 2010 7,978,929 267,217 4,886,376 57,712 80,289 13,270,523 368,645 138,620 507,265 71,366 5,270,410 19,119,564
2009 7,751,052 207,238 5,797,009 34,940 13,526 13,803,765 638,575 111,898 750,472 313,592 5,030,972 19,898,801
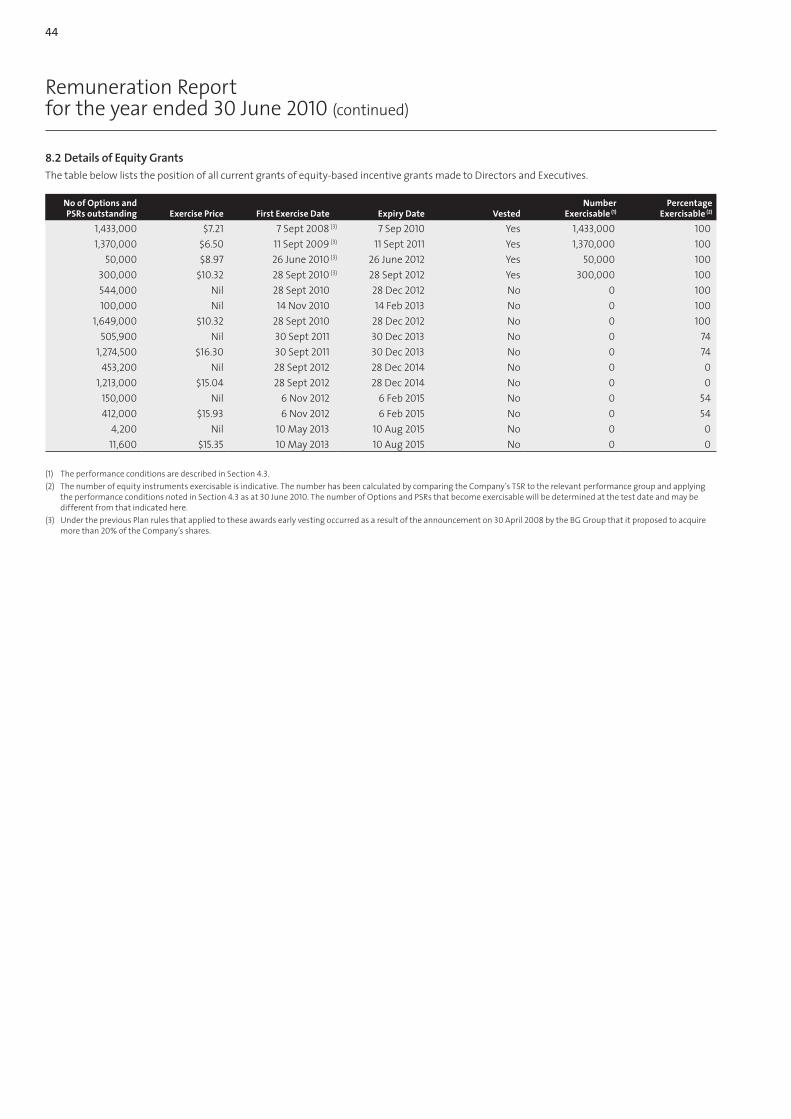
44
8.2DetailsofEquityGrants
The table below lists the position of all current grants of equity-based incentive grants made to Directors and Executives.
No of Options and PSRs outstanding Exercise Price first Exercise date Expiry date vested
Number Exercisable (1)
Percentage Exercisable (2)
1,433,000 $7.21 7 Sept 2008 (3) 7 Sep 2010 Yes 1,433,000 100
1,370,000 $6.50 11 Sept 2009 (3) 11 Sept 2011 Yes 1,370,000 100
50,000 $8.97 26 June 2010 (3) 26 June 2012 Yes 50,000 100
300,000 $10.32 28 Sept 2010 (3) 28 Sept 2012 Yes 300,000 100
544,000 Nil 28 Sept 2010 28 Dec 2012 No 0 100
100,000 Nil 14 Nov 2010 14 Feb 2013 No 0 100
1,649,000 $10.32 28 Sept 2010 28 Dec 2012 No 0 100
505,900 Nil 30 Sept 2011 30 Dec 2013 No 0 74
1,274,500 $16.30 30 Sept 2011 30 Dec 2013 No 0 74
453,200 Nil 28 Sept 2012 28 Dec 2014 No 0 0
1,213,000 $15.04 28 Sept 2012 28 Dec 2014 No 0 0
150,000 Nil 6 Nov 2012 6 Feb 2015 No 0 54
412,000 $15.93 6 Nov 2012 6 Feb 2015 No 0 54
4,200 Nil 10 May 2013 10 Aug 2015 No 0 0
11,600 $15.35 10 May 2013 10 Aug 2015 No 0 0
(1) The performance conditions are described in Section 4.3.
(2) The number of equity instruments exercisable is indicative. The number has been calculated by comparing the Company’s TSR to the relevant performance group and applying the performance conditions noted in Section 4.3 as at 30 June 2010. The number of Options and PSRs that become exercisable will be determined at the test date and may be different from that indicated here.
(3) Under the previous Plan rules that applied to these awards early vesting occurred as a result of the announcement on 30 April 2008 by the BG Group that it proposed to acquire more than 20% of the Company’s shares.
Remuneration Report for the year ended 30 June 2010 (continued)
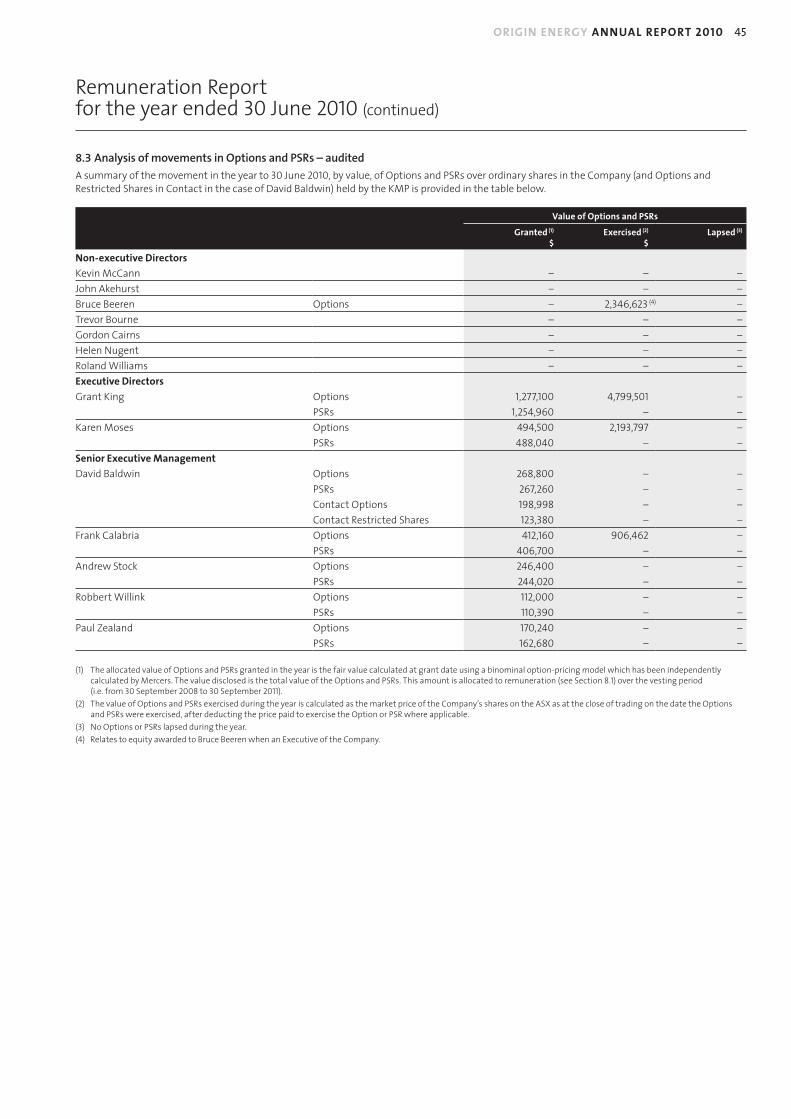
ORIGIN ENERGY ANNUAL REPORT 2010 45
8.3AnalysisofmovementsinOptionsandPSRs–audited
A summary of the movement in the year to 30 June 2010, by value, of Options and PSRs over ordinary shares in the Company (and Options and Restricted Shares in Contact in the case of David Baldwin) held by the KMP is provided in the table below.
value of Options and PSRs
Granted (1) $
Exercised (2)
$Lapsed (3)
Non-executive directors
Kevin McCann – – –
John Akehurst – – –
Bruce Beeren Options – 2,346,623 (4) –
Trevor Bourne – – –
Gordon Cairns – – –
Helen Nugent – – –
Roland Williams – – –
Executive directors
Grant King Options 1,277,100 4,799,501 –
PSRs 1,254,960 – –
Karen Moses Options 494,500 2,193,797 –
PSRs 488,040 – –
Senior Executive management
David Baldwin Options 268,800 – –
PSRs 267,260 – –
Contact Options 198,998 – –
Contact Restricted Shares 123,380 – –
Frank Calabria Options 412,160 906,462 –
PSRs 406,700 – –
Andrew Stock Options 246,400 – –
PSRs 244,020 – –
Robbert Willink Options 112,000 – –
PSRs 110,390 – –
Paul Zealand Options 170,240 – –
PSRs 162,680 – –
(1) The allocated value of Options and PSRs granted in the year is the fair value calculated at grant date using a binominal option-pricing model which has been independently calculated by Mercers. The value disclosed is the total value of the Options and PSRs. This amount is allocated to remuneration (see Section 8.1) over the vesting period (i.e. from 30 September 2008 to 30 September 2011).
(2) The value of Options and PSRs exercised during the year is calculated as the market price of the Company’s shares on the ASX as at the close of trading on the date the Options and PSRs were exercised, after deducting the price paid to exercise the Option or PSR where applicable.
(3) No Options or PSRs lapsed during the year.
(4) Relates to equity awarded to Bruce Beeren when an Executive of the Company.
Remuneration Report for the year ended 30 June 2010 (continued)

46
8.4NumbersofOptionsandPSRsgranted,exercisedandlapsedandassociatedfairvalue
Options and PSRs over ordinary shares of the Company (and Options and Restricted Shares in Contact in the case of David Baldwin) granted or vested to the KMP.
No. of Options & PSRs
Granted in year to
30 June 2010 Grant date fair value (1)
Exercise Price per Option
or PSR (1) Expiry date
No. of Options & PSRs vested
in year to 30 June 2010
Non-executive directors
Kevin McCann – – – – – –
John Akehurst – – – – – –
Bruce Beeren – – – – – –
Trevor Bourne – – – – – –
Gordon Cairns – – – – – –
Helen Nugent – – – – – –
Roland Williams – – – – – –
Executive directors
Grant King Options 297,000 6/11/09 $4.30 $15.93 6/2/15 –
PSRs 108,000 6/11/09 $11.62 Nil 6/2/15 –
Karen Moses Options 115,000 6/11/09 $4.30 $15.93 6/2/15 –
PSRs 42,000 6/11/09 $11.62 Nil 6/2/15 –
Senior Executive management
David Baldwin Options 60,000 28/9/09 $4.48 $15.04 28/12/14 –
PSRs 23,000 28/9/09 $11.62 Nil 28/12/14 –
Contact Options 253,609 1/10/09 $0.78 $4.65 30/11/14 –
Contact Restricted 44,728 1/10/09 $2.76 Nil 30/11/14 –
Frank Calabria Options 92,000 28/9/09 $4.48 $15.04 28/12/14 –
PSRs 35,000 28/9/09 $11.62 Nil 28/12/14 –
Andrew Stock Options 55,000 28/9/09 $4.48 $15.04 28/12/14 –
PSRs 21,000 28/9/09 $11.62 Nil 28/12/14 –
Robbert Willink Options 25,000 28/9/09 $4.48 $15.04 28/12/14 –
PSRs 9,500 28/9/09 $11.62 Nil 28/12/14 –
Paul Zealand Options 38,000 28/9/09 $4.48 $15.04 28/12/14 –
PSRs 14,000 28/9/09 $11.62 Nil 28/12/14 –
(1) All values in Australian currency.
Remuneration Report for the year ended 30 June 2010 (continued)
No Options or PSRs have been granted since the end of the financial year. Options and PSRs were provided at no cost to the recipients.
Options and PSRs expire on the earlier of their expiry date or within six months of notice of resignation of employment. The Options and PSRs are exercisable no earlier than three years after grant date. In addition to a continuing employment service condition, the ability to exercise Options and PSRs is conditional on the consolidated entity achieving certain performance hurdles. Details of the performance criteria are included in the LTI information in Section 4.3 (and, for Contact, refer to Contact’s website – www.contactenergy.co.nz). For Options and PSRs granted in the current year, the earliest exercise date is 28 September 2012 (1 October 2012 for Contact instruments).
8.5ExerciseofOptionsgrantedasremuneration
The following shares were issued on the exercise of Options previously granted as remuneration:
2009/10
Number of Shares
Amount Paid per Share
Non-executive directors
Kevin McCann – –
John Akehurst – –
Bruce Beeren (1) 275,000 $5.98
Trevor Bourne – –
Gordon Cairns – –
Helen Nugent – –
Roland Williams – –
(1) Relates to equity awarded to Bruce Beeren when an Executive of the Company.
2009/10
Number of Shares
Amount Paid per Share
Executive directors
Grant King 500,000 $6.50
Karen Moses 220,000 $5.72
Senior Executive management
David Baldwin – –
Frank Calabria 90,000 $5.72
Andrew Stock – –
Robbert Willink – –
Paul Zealand – –

ORIGIN ENERGY ANNUAL REPORT 2010 47
8.6OptionsandPSRsholdings
Movement, during the reporting period, in the number of Options and PSRs over ordinary shares in the Company (and, for David Baldwin, Options over and restricted shares in ordinary shares in Contact) held directly, indirectly or beneficially by the KMP including their related parties:
Yearheld at
Year Start
Granted as compen–
sation Exercised Lapsedheld at Year
Endvested
during Year
vested & Exercisable at Year End
Non-executive directors
Kevin McCann 2010 – – – – – – –
2009 – – – – – – –
John Akehurst 2010 – – – – – – –
2009 – – – – – – –
Bruce Beeren 2010 Options 275,000 – 275,000 – – – –
2009 Options 550,000 – 275,000 – 275,000 – 275,000
Trevor Bourne 2010 – – – – – – –
2009 – – – – – – –
Gordon Cairns 2010 – – – – – – –
2009 – – – – – – –
Helen Nugent 2010 – – – – – – –
2009 – – – – – – –
Roland Williams 2010 – – – – – – –
2009 – – – – – – –
Executive directors
Grant King 2010 Options 1,700,000 297,000 500,000 – 1,497,000 – 800,000
PSRs 250,000 108,000 – 358,000 – –
2009 Options 2,300,000 400,000 1,000,000 – 1,700,000 – 1,300,000
PSRs 200,000 150,000 100,000 – 250,000 – –
Karen Moses 2010 Options 822,000 115,000 220,000 – 717,000 – 373,000
PSRs 87,000 42,000 – – 129,000 – –
2009 Options 733,000 89,000 – – 822,000 – 593,000
PSRs 51,000 36,000 – – 87,000 – –
Senior Executive management
David Baldwin 2010 Options – 60,000 – – 60,000 – –
PSRs – 23,000 – – 23,000 – –
Contact Options 525,547 253,609 – – 779,156 – –
Contact Restricted Shares 88,342 44,728 – – 133,070 – –
2009 Options – – – – – – –
PSRs – – – – – – –
Contact Options 304,895 220,652 – – 525,547 – –
Contact Restricted Shares 57,322 31,020 – – 88,342 – –
Frank Calabria 2010 Options 399,000 92,000 90,000 – 401,000 – 196,000
PSRs 43,500 35,000 – – 78,500 – –
2009 Options 460,000 49,000 110,000 – 399,000 – 286,000
PSRs 23,500 20,000 – – 43,500 – –
Andrew Stock 2010 Options 393,000 55,000 – – 448,000 – 281,000
PSRs 43,500 21,000 – – 64,500 – –
2009 Options 345,000 48,000 – – 393,000 – 281,000
PSRs 23,500 20,000 – – 43,500 – –
Robbert Willink 2010 Options 62,000 25,000 – – 87,000 – –
PSRs 23,500 9,500 – – 33,000 – –
2009 Options 248,000 22,000 208,000 – 62,000 – –
PSRs 14,500 9,000 – – 23,500 – –
Paul Zealand 2010 Options 65,000 38,000 – – 103,000 – –
PSRs 24,500 14,000 – – 38,500 – –
2009 Options 135,000 21,000 91,000 – 65,000 – –
PSRs 16,000 8,500 – – 24,500 – –
Remuneration Report for the year ended 30 June 2010 (continued)
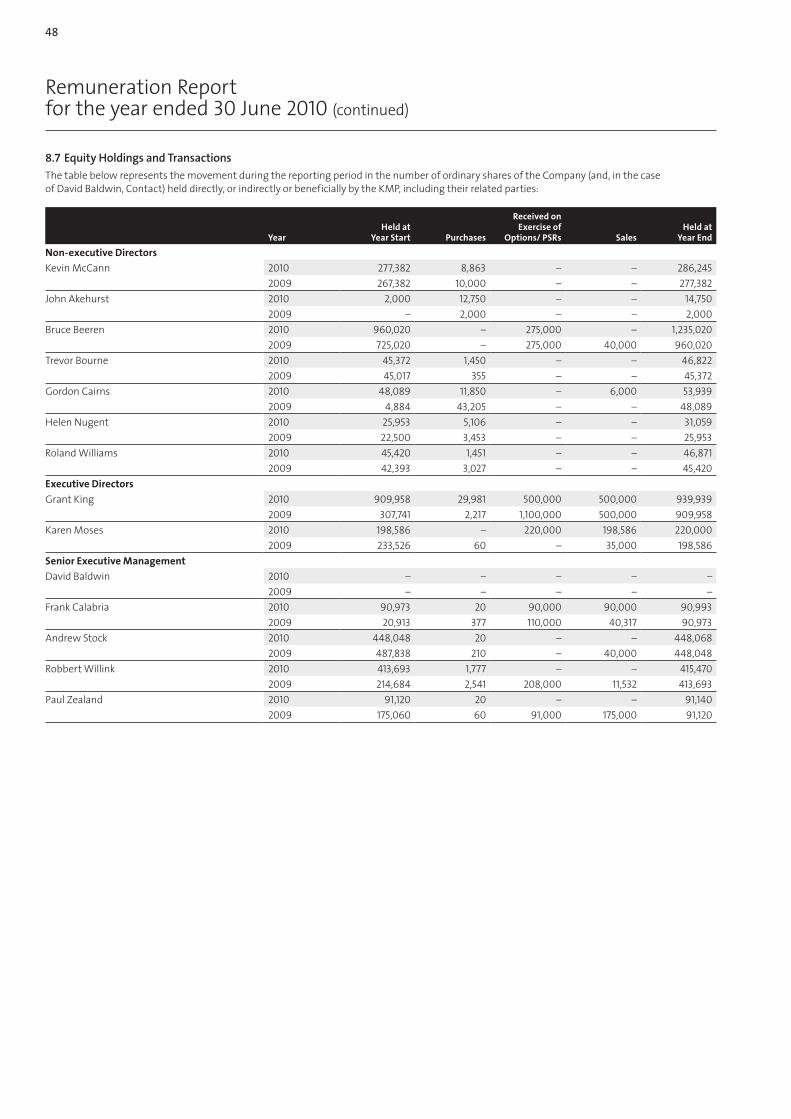
48
8.7EquityHoldingsandTransactions
The table below represents the movement during the reporting period in the number of ordinary shares of the Company (and, in the case of David Baldwin, Contact) held directly, or indirectly or beneficially by the KMP, including their related parties:
Yearheld at
Year Start Purchases
Received on Exercise of
Options/ PSRs Salesheld at
Year End
Non-executive directors
Kevin McCann 2010 277,382 8,863 – – 286,245
2009 267,382 10,000 – – 277,382
John Akehurst 2010 2,000 12,750 – – 14,750
2009 – 2,000 – – 2,000
Bruce Beeren 2010 960,020 – 275,000 – 1,235,020
2009 725,020 – 275,000 40,000 960,020
Trevor Bourne 2010 45,372 1,450 – – 46,822
2009 45,017 355 – – 45,372
Gordon Cairns 2010 48,089 11,850 – 6,000 53,939
2009 4,884 43,205 – – 48,089
Helen Nugent 2010 25,953 5,106 – – 31,059
2009 22,500 3,453 – – 25,953
Roland Williams 2010 45,420 1,451 – – 46,871
2009 42,393 3,027 – – 45,420
Executive directors
Grant King 2010 909,958 29,981 500,000 500,000 939,939
2009 307,741 2,217 1,100,000 500,000 909,958
Karen Moses 2010 198,586 – 220,000 198,586 220,000
2009 233,526 60 – 35,000 198,586
Senior Executive management
David Baldwin 2010 – – – – –
2009 – – – – –
Frank Calabria 2010 90,973 20 90,000 90,000 90,993
2009 20,913 377 110,000 40,317 90,973
Andrew Stock 2010 448,048 20 – – 448,068
2009 487,838 210 – 40,000 448,048
Robbert Willink 2010 413,693 1,777 – – 415,470
2009 214,684 2,541 208,000 11,532 413,693
Paul Zealand 2010 91,120 20 – – 91,140
2009 175,060 60 91,000 175,000 91,120
Remuneration Report for the year ended 30 June 2010 (continued)
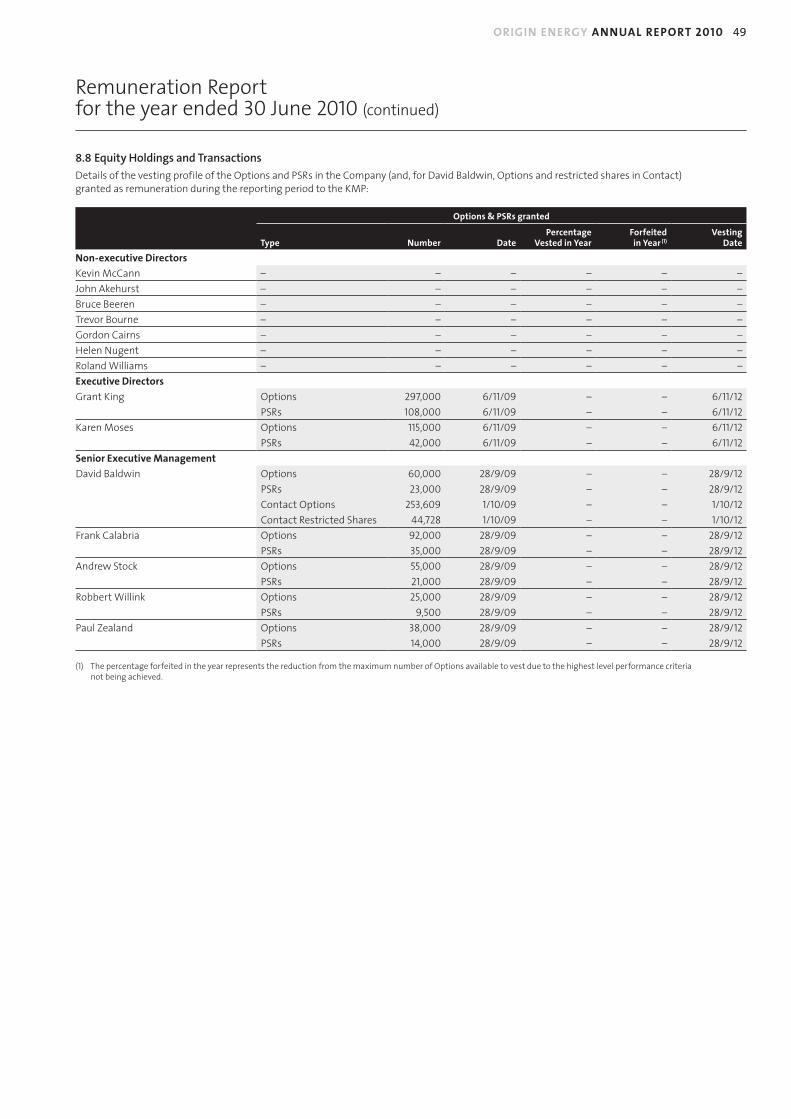
ORIGIN ENERGY ANNUAL REPORT 2010 49
8.8EquityHoldingsandTransactions
Details of the vesting profile of the Options and PSRs in the Company (and, for David Baldwin, Options and restricted shares in Contact) granted as remuneration during the reporting period to the KMP:
Options & PSRs granted
Type Number datePercentage
vested in Yearforfeited in Year (1)
vesting date
Non-executive directors
Kevin McCann – – – – – –
John Akehurst – – – – – –
Bruce Beeren – – – – – –
Trevor Bourne – – – – – –
Gordon Cairns – – – – – –
Helen Nugent – – – – – –
Roland Williams – – – – – –
Executive directors
Grant King Options 297,000 6/11/09 – – 6/11/12
PSRs 108,000 6/11/09 – – 6/11/12
Karen Moses Options 115,000 6/11/09 – – 6/11/12
PSRs 42,000 6/11/09 – – 6/11/12
Senior Executive management
David Baldwin Options 60,000 28/9/09 – – 28/9/12
PSRs 23,000 28/9/09 – – 28/9/12
Contact Options 253,609 1/10/09 – – 1/10/12
Contact Restricted Shares 44,728 1/10/09 – – 1/10/12
Frank Calabria Options 92,000 28/9/09 – – 28/9/12
PSRs 35,000 28/9/09 – – 28/9/12
Andrew Stock Options 55,000 28/9/09 – – 28/9/12
PSRs 21,000 28/9/09 – – 28/9/12
Robbert Willink Options 25,000 28/9/09 – – 28/9/12
PSRs 9,500 28/9/09 – – 28/9/12
Paul Zealand Options 38,000 28/9/09 – – 28/9/12
PSRs 14,000 28/9/09 – – 28/9/12
(1) The percentage forfeited in the year represents the reduction from the maximum number of Options available to vest due to the highest level performance criteria not being achieved.
Remuneration Report for the year ended 30 June 2010 (continued)

50
Board of Directors
GORDONMCAIRNSIndependentNon-executiveDirector
Gordon Cairns joined the Board on 1 June 2007. He is a member of the Remuneration, Risk, Nomination and Health, Safety and Environment committees and is Chairman of the Origin Foundation. He has extensive Australian and international experience as a senior executive, most recently as Chief Executive Officer of Lion Nathan Ltd, and has held senior management positions in marketing and finance with Pepsico, Cadbury Schweppes and Nestlé.
Gordon is currently a director of Westpac Banking Corporation (since July 2004), Rebel Group Pty Ltd (since April 2010), The Centre for Independent Studies and World Education Australia and is a senior advisor to McKinsey & Company and Caliburn Partnership. He holds a Master of Arts (Honours) from the University of Edinburgh.
GRANTAKINGManagingDirector
Grant King was appointed Managing Director of the Company at the time of its demerger from Boral Ltd, in February 2000, and was Managing Director of Boral Energy from 1994. Grant is a member of the Company’s Risk and Health, Safety and Environment committees.
Prior to joining Boral, he was General Manager, AGL Gas Companies. Grant is Chairman of Contact Energy Ltd (since October 2004), a councillor of the Australian Petroleum Production and Exploration Association, a former director of Envestra Ltd (1997-2007) and former Chairman of the Energy Supply Association of Australia Ltd. Grant has a Civil Engineering Degree and a Master of Management.
HKEvINMCCANNAMIndependentNon-executiveChairman
Kevin McCann joined the Board as Chairman in February 2000. He is Chairman of the Nomination and Risk committees and a member of the Audit, Remuneration, and Health, Safety and Environment committees. Kevin is Lead Independent Director of Macquarie Group Ltd; a director of Macquarie Bank Ltd, a director of BlueScope Steel Ltd and of the Australian Institute of Company Directors (AICD). Kevin is also the Chairman of the Sydney Harbour Federation Trust, a Commonwealth agency. He is a Council Member of the National Library of Australia, Chairman of the Corporate Governance Committee of the AICD and a Fellow of the Senate of the University of Sydney.
Kevin’s community activities include Chairmanship of the Development Council of the National Library of Australia and membership of the Law Foundation, University of Sydney.
Kevin practiced as a commercial lawyer as a partner of Allens Arthur Robinson (and its predecessor firm Allen Allen & Hemsley) from 1970 to 2004 and was Chairman of Partners from 1995 to 2004. He was previously Chairman of Healthscope Ltd, a director of Pioneer International Ltd (building materials and products), Ampol Ltd (refiner and retailer of petroleum products), a member of the Takeovers Panel, the State Rail Authority of New South Wales and served on the Defence Procurement Advisory Board.
Kevin has a Bachelor of Arts and Law (Honours) from Sydney University and a Master of Law from Harvard University. He is a Fellow of the AICD.

ORIGIN ENERGY ANNUAL REPORT 2010 51
KARENAMOSESExecutiveDirector,Finance&Strategy
Karen Moses joined the Board in March 2009 and is a member of the Risk Committee. She is responsible for the finance, tax and accounting functions, interactions with capital markets and for information technology. In addition to corporate strategy and transactional activity, she has oversight of overall risk including health, safety and environment, commodity risk, compliance and insurance. Karen oversees the Australia Pacific LNG project for Origin. Prior to Origin, Karen held development and trading roles with Exxon Group (1983-1994).
Karen is a director of Energy and Water Ombudsman (Victoria) Ltd (since October 2005), Australian Energy Market Operator Limited (since July 2009) and Contact Energy Ltd (since October 2004). Karen is a former director of VENCorp (2007-2009) and the Australian Energy Market Operator (Transitional) Ltd (September 2008 – July 2009). Karen holds a Bachelor of Economics and a Diploma of Education from the University of Sydney.
JOHNHAKEHURSTIndependentNon-executiveDirector
John Akehurst joined the Board in April 2009 and is a member of the Nomination, Risk and Health, Safety and Environment committees. His executive career was in the upstream oil and gas and LNG industries, initially with Royal Dutch Shell and then as Chief Executive of Woodside Petroleum Ltd.
John is currently a member of the Board of the Reserve Bank of Australia and a director of CSL Ltd, Securency Ltd, the University of Western Australia Business School and the Curtin University Sustainable Development Institute. He is Chairman of the National Centre for Asbestos Related Diseases and of the Fortitude Foundation, a former chairman of Alinta Ltd and Coogee Resources Ltd and a former director of Oil Search Ltd.
John holds a Masters in Engineering Science from Oxford University and is a Fellow of the Institution of Mechanical Engineers.
HELENMNUGENTAOIndependentNon-executiveDirector
Helen Nugent joined the Board in March 2003 and is Chairman of the Audit Committee and a member of the Remuneration, Risk and Nomination committees. An experienced professional non-executive director, she is currently Chairman of Funds SA. She is also a director of Macquarie Group Ltd (since August 2007), Macquarie Bank Ltd (since June 1999) and Freehills. She is Chancellor of Bond University and President of Cranbrook School.
Previously, Helen was Chairman of Swiss Re Life and Health (Australia) (2001-2010) and a director of UNiTAB (1999-2006), Director of Strategy at Westpac Banking Corporation and a partner with McKinsey & Company, specialising in financial services and mining. Helen has a Bachelor of Arts (Honours); a Doctorate of Philosophy; and an Honorary Doctorate in Business from the University of Queensland. She also holds a Master of Business Administration (with Distinction) from the Harvard Business School. She is a Fellow of the AICD.
BRUCEGBEERENNon-executiveDirector
Bruce Beeren joined the Board as an Executive Director in March 2000. He retired from this position on 31 January 2005 and continues on the Board as a Non-executive Director. He is a member of the Audit, Remuneration, Risk and Nomination committees. With over 30 years experience in the energy industry, Bruce was Chief Executive Officer of VENCorp, the Victorian gas system operator, and held several senior management positions at AGL, including Chief Financial Officer. He is a director of Contact Energy Ltd (since October 2004), Coal & Allied Industries Ltd (since July 2004), Equipsuper Pty Ltd (since August 2002) and ConnectEast Group (since March 2009). He is a former director of Envestra Ltd (2000-2007) and Veda Advantage Ltd (2004-2007). Bruce has degrees in Science and Commerce and a Master of Business Administration. He is a Fellow of CPA Australia and the AICD.
JROLANDWILLIAMSCBEIndependentNon-executiveDirector
Roland Williams joined the Board in February 2000. He is Chairman of the Health, Safety and Environment Committee and a member of the Audit, Risk and Nomination committees. He retired in June 1999 as Chairman and Chief Executive of Shell Australia Ltd, prior to which he was Managing Director, Shell International Gas, and President, Shell Coal International. Roland was previously a director of Boral Ltd (1999-2010), holds a Chemical Engineering degree (Honours) and a Doctorate of Philosophy. He is a Fellow of the AICD and the Institution of Chemical Engineers and a Companion of the Institution of Gas Engineers and Managers.
TREvORBOURNEIndependentNon-executiveDirector
Trevor Bourne joined the Board in February 2000. He is Chairman of the Remuneration Committee and a member of the Risk, Nomination and Health, Safety & Environment committees.
Trevor retired in December 2003 as Chief Executive Officer of Tenix Investments Pty Ltd, prior to which he was Managing Director of Brambles Australia Ltd. Trevor is Chairman of Hastie Group Ltd (since November 2004) and a director of Caltex Australia Ltd (since March 2006). He is a former director of Coates Hire Ltd (2004-2008) and Lighting Corporation Ltd (2004-2008).
Trevor has a Mechanical Engineering degree and a Master of Business Administration.

52
Executive Management Team
FRANKCALABRIAExecutiveGeneralManager EnergyMarkets
Frank Calabria joined Origin as Chief Financial Officer in November 2001 and was appointed to his current role of Executive General Manager, Energy Markets in March 2009. In this role, Frank is responsible for the integrated operations within Australia including power generation and natural gas, electricity and LPG trading and retailing.Prior to joining Origin, Frank held senior finance roles with Pioneer International Limited, Hanson plc and Hutchison Telecommunications.Frank has a Bachelor of Economics from Macquarie University and a Masters of Business Administration (Executive) from the Australian Graduate School of Management.He is a Fellow of the Institute of Chartered Accountants of Australia and a Fellow of the Financial Services Institute of Australasia.
ANDREWCLARKEGroupGeneralCounselandCompanySecretary
Andrew Clarke joined Origin in May 2009 and is responsible for the legal and company secretarial functions. He was a partner of a national law firm and a managing director of a global investment bank prior to joining Origin.
Andrew has a Bachelor of Laws (Honours) and a Bachelor of Economics from Sydney University.
ROBWILLINKExecutiveGeneralManagerGeoscienceandExplorationNewventures
Rob Willink joined SAGASCO Resources (now Origin) in 1988 and is responsible for oil and gas exploration. He is also responsible for the provision of functional (geotechnical) support and ensuring technical excellence in the development of Origin’s existing conventional and CSG fields.Prior to joining Origin, Rob spent nine years with Shell as a petroleum geologist in Australia, Oman and Turkey, and was a lecturer in petroleum geology at the National Centre for Petroleum Geology and Geophysics in Adelaide. Rob has a Bachelor of Science (Honours) from the University of Tasmania and a PhD from The Australian National University.
ANDREWSTOCKExecutiveGeneralManagerMajorDevelopmentProjects
Andrew Stock joined the Company (now Origin) in 1984 and is responsible for Origin’s major capital development projects in upstream petroleum and power generation and the low-emissions technology businesses. With over 30 years of experience, he has previously held senior management roles in petroleum and petrochemical industries in Australia and overseas.Andrew is a director of Geodynamics Limited where he chairs the Remuneration & Nominations Committee, Australia Pacific LNG Pty Limited and The Climate Group, and is a member of the Advisory Board of the faculty of Engineering, Computer and Mathematical Sciences at the University of Adelaide.He has a Bachelor of Engineering (Chemical – Honours) from the University of Adelaide, is a Fellow of the Institution of Engineers Australia, and a Member of the Australian Institute of Company Directors and Australian Institute of Energy.

ORIGIN ENERGY ANNUAL REPORT 2010 53
MELANIELAINGExecutiveGeneralManagerPeopleandCulture
Melanie Laing joined Origin in November 2007 and is responsible for driving the human resources strategy. Prior to joining Origin, Melanie was Regional Human Resources Director for Unisys Asia Pacific where she built a human resources function that supported the business through major growth and change. She has also held senior HR roles with Vodafone Asia Pacific and General Re Corporation.Melanie has a Bachelor of Arts from the University of the Witwatersrand in South Africa and several qualifications in human resources management. She is a Fellow of the Australian Institute of Company Directors and a member of the Australian Human Resources Institute.
PAULZEALANDExecutiveGeneralManagerUpstreamOilandGas
Paul joined Origin in 2005 and manages the Company’s portfolio of oil and gas exploration and production assets in Australia and New Zealand, including the operation of the upstream part of Origin’s Joint Venture with ConocoPhillips: Australia Pacific LNG.Prior to joining Origin, Paul was Chairman and General Manager of Shell in New Zealand. His extensive experience in the oil and gas industry includes upstream, refining and strategy assignments with Shell at various locations in Europe and Australasia.Paul holds a Masters of Business Administration and Bachelor of Science (Mechanical – Honours), is a Non-executive Director Queensland Resources Council, a Fellow of the Institution of Engineers Australia and a member of the Australian Institute of Company Directors.
CARLMCCAMISHExecutiveGeneralManagerCorporateAffairs
Carl McCamish joined Origin in March 2008 and is responsible for corporate brand, sustainability, public policy, corporate communications, and government and media relations.Before joining Origin, Carl was head of strategic development at the private equity firm, Terra Firma. From 2004 to 2006, he was Senior Energy Advisor in the UK Prime Minister’s Strategy Unit and was deputy head of the 2006 UK Energy Review. Before that he worked at McKinsey & Co management consultants.Carl has a Bachelor of Arts and Law from the University of Melbourne and a Masters in Industrial Relations and Labour Economics from Oxford University where he was a Rhodes Scholar.
DAvIDBALDWINChiefExecutiveOfficerContactEnergy,NewZealand
David Baldwin joined Origin Energy as Chief Executive Officer of Contact Energy in May 2006. Prior to joining Origin, David was based in Asia and the US overseeing the energy asset interests of a US-based investment fund.Prior to that, David held senior roles in Asia and the US with MidAmerican Energy Holdings Company, a US-based global energy company, and Shell in New Zealand and the Netherlands. He is currently a director of Gas Industry Company (since 2007).David holds a Master of Business Administration and a Bachelor of Engineering (Chemical).

54
Corporate Governance
Origin’s Board and management are committed to the creation of shareholder value and meeting the expectations of stakeholders to practise sound corporate governance.
To achieve this, every employee and contractor is required to act in accordance with the highest standards of personal safety and environmental performance, governance and business conduct across its operations in Australia and internationally.
cOmPLIANcE WITh ASx cORPORATE GOvERNANcE cOUNcIL’S cORPORATE GOvERNANcE PRINcIPLES ANd REcOmmENdATIONS (ASx PRINcIPLES)This statement summarises the Company’s corporate governance practices which were in place throughout the 2009/10 financial year. The Company is pleased to report that, during the financial year and to the date of this Report, it complied with all of the ASX Principles.
The ASX Principles were revised on 30 June 2010 and the new provisions will apply to the Company from 1 July 2011. However, the Company is in the process of reviewing its practices to not only ensure that all the new recommendations are adopted, but that the Company complies with them before that date.
PRINcIPLE 1: LAY SOLId fOUNdATIONS fOR mANAGEmENT ANd OvERSIGhTThe Board’s roles and responsibilities are formalised in a Board Charter, which is available on the Company’s website. The Charter sets out those functions that are delegated to management and those that are reserved to the Board.
At the time of joining the Company, Directors and senior executives are provided with letters of appointment, together with key Company documents and information setting out their term of office, duties, rights and responsibilities, and entitlements on termination.
The performance of all key executives, including the Managing Director, is required to be reviewed annually against:
(a) a set of personal financial and non-financial goals;
(b) Company goals; and
(c) adherence to the Company’s Commitments, Values and Principles.
The Remuneration Committee considers the performance of the Managing Director and all members of the Executive Management Team when awarding performance-related remuneration through short-term and long-term incentives for the year completed and when assessing fixed remuneration for future periods. Further information on executive remuneration is in the Remuneration Report.
PRINcIPLE 2: STRUcTURE ThE BOARd TO Add vALUEThe Board is structured to facilitate the effective discharge of its duties and to add value through its deliberations.
The Board schedules 11 meetings a year, including a two-day strategic planning meeting and additional workshops to consider matters of particular relevance. If required, additional unscheduled meetings are held to deal with urgent matters. The Board has also visited Company operations and met with operational management during the year.
Each Board meeting, Directors receive reports from executive management, financial and operational reports, a health, safety and environment report and reports on all major projects in which the Company is involved. In addition, the Directors receive reports from Board Committees and, as appropriate, presentations on opportunities and challenges for the Company.
Non-executive Directors also meet without the Executive Directors or management to deal with succession planning, key strategic issues, and Board operation and effectiveness.
All Directors have access to Company employees, advisers and records. In carrying out their duties and responsibilities, Directors have access to advice and counsel from the Chairman, the Company Secretary and the Group General Counsel, and are able to seek independent professional advice at the Company’s expense, after consultation with the Chairman.
The Board’s size and composition is determined by the Directors, within limits set by the Company’s Constitution, which requires a Board of between five and 12 Directors. As at 30 June 2010, the Board comprised nine Directors, including two Executive Directors and seven Non-executive Directors, six of whom are considered independent by the Board. Directors’ profiles and details of their skills, experience and special expertise are set out on pages 50 and 51.
The Company’s Independence of Directors Policy requires that the Board comprises a majority of independent Directors. In defining the characteristics of an independent Director, the Board uses the ASX Principles, together with its own consideration of the Company’s operations and businesses and appropriate materiality thresholds. Further details of the matters considered by the Board in assessing independence are contained in the Independence of Directors Policy which is available on the Company’s website.
The Board reviews each Director’s independence annually. The Board formed the view that at its review for the 2009/10 reporting period, Mr Kevin McCann, Chairman, and Directors Mr John Akehurst, Mr Trevor Bourne, Mr Gordon Cairns, Dr Helen Nugent and Dr Roland Williams were independent.
The Board selects and appoints the Chairman from the independent Directors. The Chairman, Mr H Kevin McCann is independent and his role and responsibilities are separate from those of the Managing Director.
Five Committees assist the Board in executing its duties relating to audit, remuneration, health, safety and environment, nomination and risk.
The Audit Committee, Remuneration Committee, Health, Safety and Environment Committee and Nomination Committee each has a Charter which set out its roles and responsibilities, composition, structure, membership requirements and operation. These are available on the Company’s website. The Charter for the Risk Committee is in the process of being finalised and will be available on the Company’s website when approved. Committee meeting minutes are tabled at the following Board meeting, with additional and specific reporting requirements to the Board addressed in the Committee Charters.
Additional information about the Audit Committee, Risk Committee and Remuneration Committee is provided in response to Principles 4, 7 and 8 respectively.
The Nomination Committee, which met three times during 2009/10, provides support and advice to the Board by:
• assessing the range of skills and experience required on the Board and of Directors;
• reviewing the performance of Directors and the Board;
• establishing processes to identify suitable Directors, including the use of professional intermediaries; and
• recommending Directors’ appointments and re-elections.
A list of the members of each Board Committee is set out below and their attendance at Committee meetings is set out in the Directors’ Report on page 28.
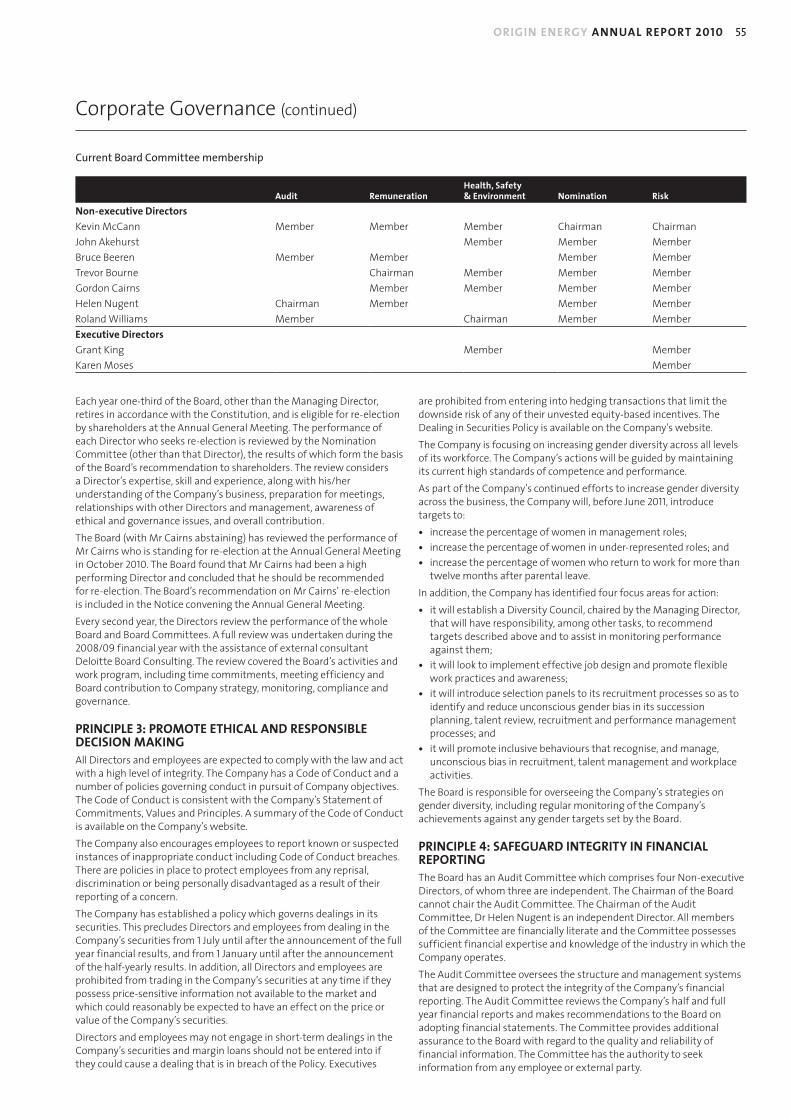
ORIGIN ENERGY ANNUAL REPORT 2010 55
Corporate Governance (continued)
Current Board Committee membership
Audit Remunerationhealth, Safety & Environment Nomination Risk
Non-executive directors
Kevin McCann Member Member Member Chairman Chairman
John Akehurst Member Member Member
Bruce Beeren Member Member Member Member
Trevor Bourne Chairman Member Member Member
Gordon Cairns Member Member Member Member
Helen Nugent Chairman Member Member Member
Roland Williams Member Chairman Member Member
Executive directors
Grant King Member Member
Karen Moses Member
Each year one-third of the Board, other than the Managing Director, retires in accordance with the Constitution, and is eligible for re-election by shareholders at the Annual General Meeting. The performance of each Director who seeks re-election is reviewed by the Nomination Committee (other than that Director), the results of which form the basis of the Board’s recommendation to shareholders. The review considers a Director’s expertise, skill and experience, along with his/her understanding of the Company’s business, preparation for meetings, relationships with other Directors and management, awareness of ethical and governance issues, and overall contribution.
The Board (with Mr Cairns abstaining) has reviewed the performance of Mr Cairns who is standing for re-election at the Annual General Meeting in October 2010. The Board found that Mr Cairns had been a high performing Director and concluded that he should be recommended for re-election. The Board’s recommendation on Mr Cairns’ re-election is included in the Notice convening the Annual General Meeting.
Every second year, the Directors review the performance of the whole Board and Board Committees. A full review was undertaken during the 2008/09 financial year with the assistance of external consultant Deloitte Board Consulting. The review covered the Board’s activities and work program, including time commitments, meeting efficiency and Board contribution to Company strategy, monitoring, compliance and governance.
PRINcIPLE 3: PROmOTE EThIcAL ANd RESPONSIBLE dEcISION mAKINGAll Directors and employees are expected to comply with the law and act with a high level of integrity. The Company has a Code of Conduct and a number of policies governing conduct in pursuit of Company objectives. The Code of Conduct is consistent with the Company’s Statement of Commitments, Values and Principles. A summary of the Code of Conduct is available on the Company’s website.
The Company also encourages employees to report known or suspected instances of inappropriate conduct including Code of Conduct breaches. There are policies in place to protect employees from any reprisal, discrimination or being personally disadvantaged as a result of their reporting of a concern.
The Company has established a policy which governs dealings in its securities. This precludes Directors and employees from dealing in the Company’s securities from 1 July until after the announcement of the full year financial results, and from 1 January until after the announcement of the half-yearly results. In addition, all Directors and employees are prohibited from trading in the Company’s securities at any time if they possess price-sensitive information not available to the market and which could reasonably be expected to have an effect on the price or value of the Company’s securities.
Directors and employees may not engage in short-term dealings in the Company’s securities and margin loans should not be entered into if they could cause a dealing that is in breach of the Policy. Executives
are prohibited from entering into hedging transactions that limit the downside risk of any of their unvested equity-based incentives. The Dealing in Securities Policy is available on the Company’s website.
The Company is focusing on increasing gender diversity across all levels of its workforce. The Company’s actions will be guided by maintaining its current high standards of competence and performance.
As part of the Company’s continued efforts to increase gender diversity across the business, the Company will, before June 2011, introduce targets to:
• increase the percentage of women in management roles;
• increase the percentage of women in under-represented roles; and
• increase the percentage of women who return to work for more than twelve months after parental leave.
In addition, the Company has identified four focus areas for action:
• it will establish a Diversity Council, chaired by the Managing Director, that will have responsibility, among other tasks, to recommend targets described above and to assist in monitoring performance against them;
• it will look to implement effective job design and promote flexible work practices and awareness;
• it will introduce selection panels to its recruitment processes so as to identify and reduce unconscious gender bias in its succession planning, talent review, recruitment and performance management processes; and
• it will promote inclusive behaviours that recognise, and manage, unconscious bias in recruitment, talent management and workplace activities.
The Board is responsible for overseeing the Company’s strategies on gender diversity, including regular monitoring of the Company’s achievements against any gender targets set by the Board.
PRINcIPLE 4: SAfEGUARd INTEGRITY IN fINANcIAL REPORTINGThe Board has an Audit Committee which comprises four Non-executive Directors, of whom three are independent. The Chairman of the Board cannot chair the Audit Committee. The Chairman of the Audit Committee, Dr Helen Nugent is an independent Director. All members of the Committee are financially literate and the Committee possesses sufficient financial expertise and knowledge of the industry in which the Company operates.
The Audit Committee oversees the structure and management systems that are designed to protect the integrity of the Company’s financial reporting. The Audit Committee reviews the Company’s half and full year financial reports and makes recommendations to the Board on adopting financial statements. The Committee provides additional assurance to the Board with regard to the quality and reliability of financial information. The Committee has the authority to seek information from any employee or external party.

56
Corporate Governance (continued)
The internal and external auditors have direct access to the Audit Committee Chairman and, following each scheduled meeting, meet separately with the Committee without Executive Directors or management present.
The Committee reviews the independence of the external auditor, including the nature and level of non-audit services provided, and reports its findings to the Board every six months.
The names of the members of the Audit Committee are set out in the table under Principle 2 and their attendance at meetings of the Committee is set out in the Directors’ Report on page 28.
PRINcIPLE 5: mAKE TImELY ANd BALANcEd dIScLOSUREThe Company has adopted policies and procedures to ensure compliance with its continuous disclosure obligations, and to ensure accountability of senior management for that compliance.
The Company is committed to providing timely, full and accurate disclosure and to keeping the market informed with quarterly releases detailing exploration, development and production, and annual and half-year reports to shareholders.
All material matters are disclosed to the ASX immediately and subsequently to the media, as required by the ASX Listing Rules. All material investor presentations are released to the ASX and are posted on the Company’s website, along with other reports that are not material enough to be an ASX announcement. Shareholders can subscribe to a free email notification service and receive notice of any announcements released by the Company.
The Continuous Disclosure Policy and the Communications with Shareholders Policy are available on the Company’s website.
PRINcIPLE 6: RESPEcT ThE RIGhTS Of ShAREhOLdERSThe Company respects the rights of its shareholders and has adopted policies to facilitate the effective exercise of those rights through participation at general meetings and providing them with information about the Company and its operations.
The Company is committed to providing a high standard of communication to shareholders and other stakeholders so that they have all available information reasonably required to make informed assessments of the Company’s value and prospects.
The Company provides shareholders with a choice of receiving an annual Shareholder Review, a full Annual Report or no report at all. Shareholders who make no election receive a Shareholder Review. Shareholders may also elect to receive their reports electronically or in printed form.
The Company’s website contains a list of upcoming events, all recent announcements, presentations, past and current reports to shareholders, notices of meeting and archived webcasts of general meetings and results announcements. The Company also keeps an internal record of briefings given to investors and analysts, including those present and the main issues discussed.
The Communications with Shareholders Policy is available on the Company’s website.
PRINcIPLE 7: REcOGNISE ANd mANAGE RISKThe Board has an overarching policy governing the Company’s approach to risk oversight and management and internal control systems.
During the 2009/10 financial year, the Board established a Risk Committee to oversee the Company’s policies and procedures in relation to risk management and internal control systems. The Company’s policies are designed to identify, assess, address and monitor strategic, operational, legal, reputational, commodity and financial risks to achieve business objectives. Certain specific risks are covered by insurance and the Board has also approved policies for hedging of interest rates, foreign exchange rates and commodities.
Management is responsible for the design and implementation of the risk management and internal control systems to manage the Company’s material business risks. Management reports to the Risk
Committee on whether those risks are being managed effectively. Top risks are reported to the Risk Committee and the Board, along with associated controls and risk mitigation plans. Management has reported to the Risk Committee and the Board that as at 30 June 2010 its material business risks are being managed effectively.
In addition to reports from the Risk Committee, the Board receives monthly reports on key risk areas such as health and safety, project development, commodity exposures and exchange rates. A general Company-wide review of major risks is undertaken for corporate, operational and development activities.
When presenting financial statements for Board approval, the Managing Director and Executive Director, Finance and Strategy provide a formal statement in accordance with s295A of the Corporations Act with an assurance that the statement is founded upon a sound system of risk management and internal control that is operating effectively in all material respects.
The names of the members of the Risk Committee are set out in the table under Principle 2 and their attendance at meetings of the Committee is set out in the Directors’ Report on page 28.
The Risk Management Policy and information on the Company’s policies on risk oversight and management of material business risks is available on the Company’s website. The Risk Committee is in the process of finalising its Charter, which will be available on the Company’s website when approved.
PRINcIPLE 8: REmUNERATE fAIRLY ANd RESPONSIBLYThe Remuneration Report sets out details of the Company’s policies and practices for remunerating Directors, key management personnel and employees.
The Board has a Remuneration Committee, which comprises four Non-executive Directors, of whom three are independent. The Chairman, Mr Trevor Bourne, is an independent Director. The names of the members of the Remuneration Committee are set out under Principle 2 and their attendance at meetings of the Committee is as set out on page 28 of this Report.
Further information about the Remuneration Committee’s activities is provided in the Remuneration Report.
The remuneration of Non-executive Directors is structured separately from that of the Executive Directors and senior executives. Information on remuneration for Non-executive Directors is in the Remuneration Report on page 42.
All information referred to in this Corporate Governance Statement as being on the Company’s website may be found at the web address: www.originenergy.com.au under the section “Investor Centre” – “Corporate Governance”.
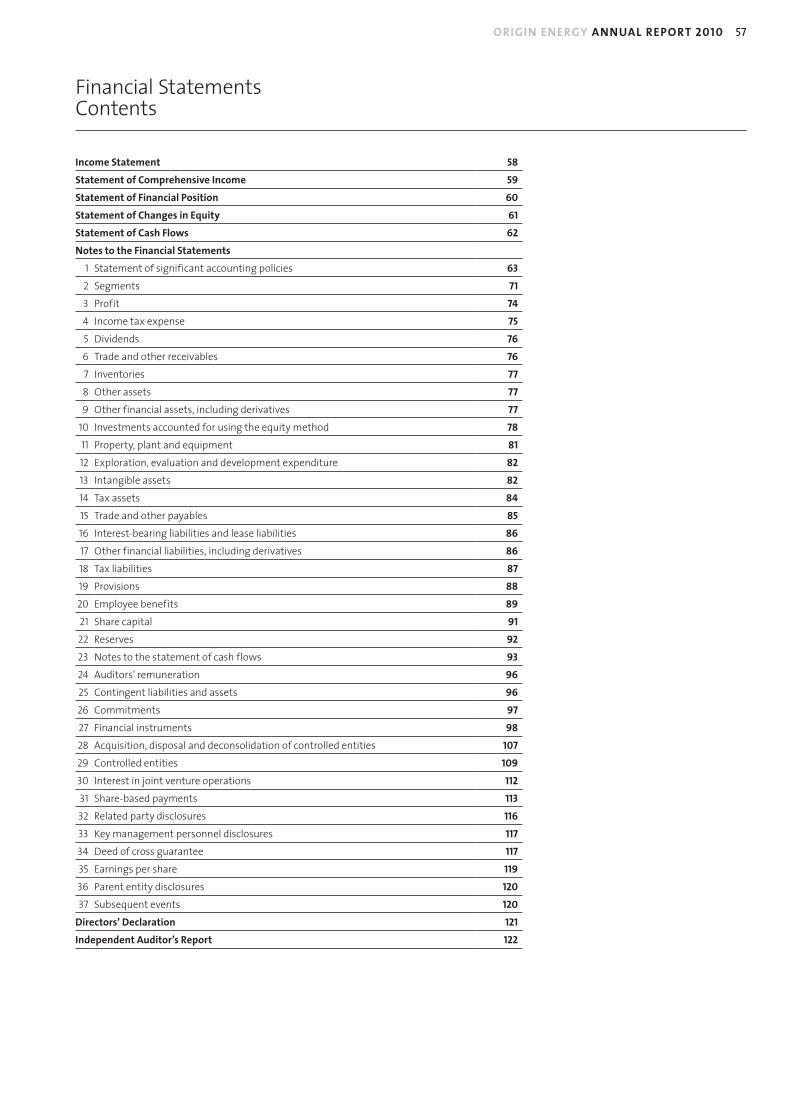
ORIGIN ENERGY ANNUAL REPORT 2010 57
Financial Statements Contents
Income Statement 58
Statement of comprehensive Income 59
Statement of financial Position 60
Statement of changes in Equity 61
Statement of cash flows 62
Notes to the financial Statements
1 Statement of significant accounting policies 63
2 Segments 71
3 Profit 74
4 Income tax expense 75
5 Dividends 76
6 Trade and other receivables 76
7 Inventories 77
8 Other assets 77
9 Other financial assets, including derivatives 77
10 Investments accounted for using the equity method 78
11 Property, plant and equipment 81
12 Exploration, evaluation and development expenditure 82
13 Intangible assets 82
14 Tax assets 84
15 Trade and other payables 85
16 Interest-bearing liabilities and lease liabilities 86
17 Other financial liabilities, including derivatives 86
18 Tax liabilities 87
19 Provisions 88
20 Employee benefits 89
21 Share capital 91
22 Reserves 92
23 Notes to the statement of cash flows 93
24 Auditors’ remuneration 96
25 Contingent liabilities and assets 96
26 Commitments 97
27 Financial instruments 98
28 Acquisition, disposal and deconsolidation of controlled entities 107
29 Controlled entities 109
30 Interest in joint venture operations 112
31 Share-based payments 113
32 Related party disclosures 116
33 Key management personnel disclosures 117
34 Deed of cross guarantee 117
35 Earnings per share 119
36 Parent entity disclosures 120
37 Subsequent events 120
directors’ declaration 121
Independent Auditor’s Report 122

58
Income Statement for the year ended 30 June
2010 2009Note $million $million
Revenue 8,534 8,042
Other income 3(a) 56 7,402
Total expenses, excluding net financing costs 3(b) (7,734) (7,774)
Share of results of equity accounted investees 10(a) 144 172
Net financing costs 3(c) (124) (172)
Profit before income tax 876 7,670
Income tax expense 4 (196) (672)
Profit for the period 680 6,998
Non-controlling interests (68) (57)
Profit attributable to members of the parent entity 612 6,941
Earnings per share:
Basic earnings per share 35 69.7 cents 791.0 cents
Diluted earnings per share 35 69.4 cents 785.9 cents
The income statement should be read in conjunction with the accompanying notes set out on pages 63 to 120.
Operational business segment performance and underlying profit of the consolidated entity is presented in note 2(a) and a reconciliation between statutory profit attributable to members of the parent entity and underlying profit is included in note 2(b).

ORIGIN ENERGY ANNUAL REPORT 2010 59
Statement of Comprehensive Income for the year ended 30 June
2010 2009$million $million
Profit for the period 680 6,998
Other comprehensive income
Available for sale assets:
Valuation loss taken to equity (11) (13)
Cash flow hedges:
Losses/(gains) transferred to income statement 199 (22)
Transferred to carrying amount of assets 8 (22)
Foreign currency translation gain 2 13
Valuation loss taken to equity (194) (391)
Share of decrease in hedging reserves attributable to equity accounted investees – (1)
Net loss on hedge of net investment in foreign operations (3) (5)
Foreign currency translation differences for foreign operations – 30
Actuarial loss on defined benefit superannuation plan (3) (9)
Income tax benefit on other comprehensive income – 138
Other comprehensive income for the period, net of income tax (2) (282)
Total comprehensive income for the period 678 6,716
Total comprehensive income attributable to:
Non-controlling interests 83 90
Members of the parent entity 595 6,626
Total comprehensive income for the period 678 6,716
The statement of comprehensive income should be read in conjunction with the accompanying notes set out on pages 63 to 120.
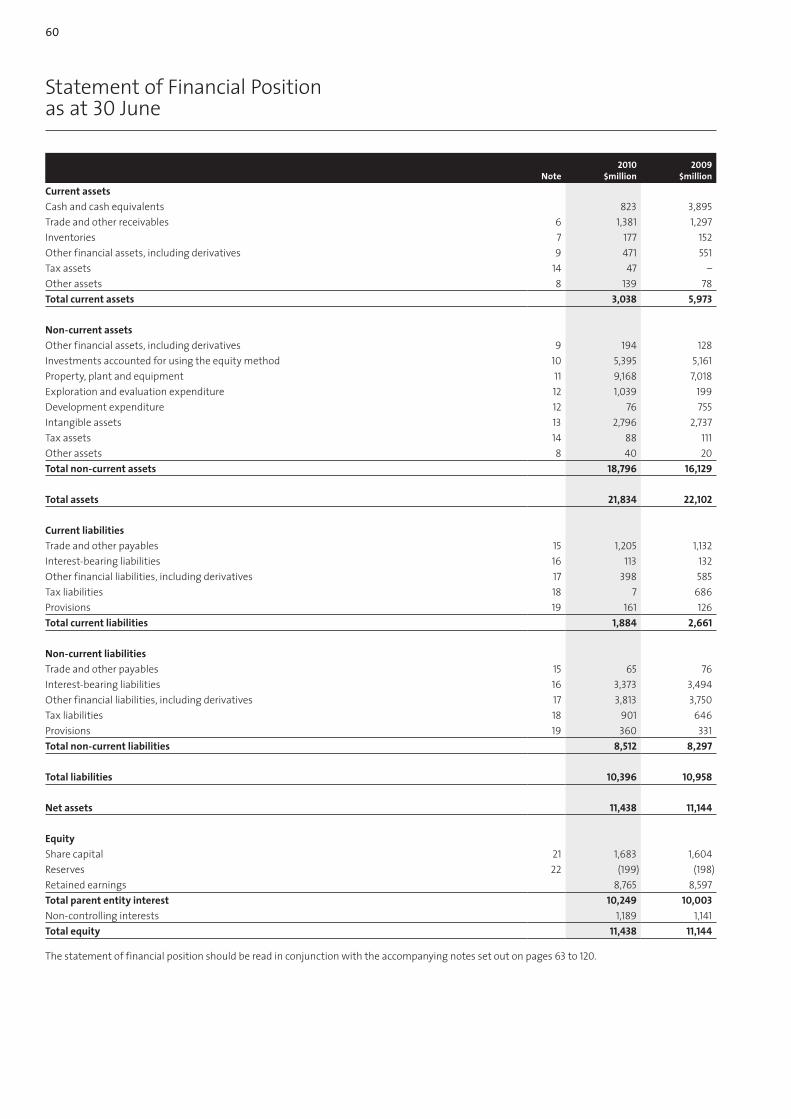
60
Statement of Financial Position as at 30 June
2010 2009Note $million $million
current assets
Cash and cash equivalents 823 3,895
Trade and other receivables 6 1,381 1,297
Inventories 7 177 152
Other financial assets, including derivatives 9 471 551
Tax assets 14 47 –
Other assets 8 139 78
Total current assets 3,038 5,973
Non-current assets
Other financial assets, including derivatives 9 194 128
Investments accounted for using the equity method 10 5,395 5,161
Property, plant and equipment 11 9,168 7,018
Exploration and evaluation expenditure 12 1,039 199
Development expenditure 12 76 755
Intangible assets 13 2,796 2,737
Tax assets 14 88 111
Other assets 8 40 20
Total non-current assets 18,796 16,129
Total assets 21,834 22,102
current liabilities
Trade and other payables 15 1,205 1,132
Interest-bearing liabilities 16 113 132
Other financial liabilities, including derivatives 17 398 585
Tax liabilities 18 7 686
Provisions 19 161 126
Total current liabilities 1,884 2,661
Non-current liabilities
Trade and other payables 15 65 76
Interest-bearing liabilities 16 3,373 3,494
Other financial liabilities, including derivatives 17 3,813 3,750
Tax liabilities 18 901 646
Provisions 19 360 331
Total non-current liabilities 8,512 8,297
Total liabilities 10,396 10,958
Net assets 11,438 11,144
Equity
Share capital 21 1,683 1,604
Reserves 22 (199) (198)
Retained earnings 8,765 8,597
Total parent entity interest 10,249 10,003
Non-controlling interests 1,189 1,141
Total equity 11,438 11,144
The statement of financial position should be read in conjunction with the accompanying notes set out on pages 63 to 120.

ORIGIN ENERGY ANNUAL REPORT 2010 61
Statement of Changes in Equity for the year ended 30 June
Issued capital
Share-based
payments reserve
foreign currency
translation reserve
hedging reserve
Available-for-sale reserve
Retained earnings
Non-controlling
interests Total equity$million $million $million $million $million $million $million $million
Opening balance as at 1 July 2009 1,604 36 (121) (114) 1 8,597 1,141 11,144
Other comprehensive income – – (11) 7 (8) (5) 15 (2)
Profit after tax expense for the period – – – – – 612 68 680
Total comprehensive income/(expense) for the period – – (11) 7 (8) 607 83 678
Dividends paid (refer note 5) – – – – – (439) (72) (511)
Movement in share capital (refer note 21) 79 – – – – – 37 116
Movement in share-based payments reserve – 11 – – – – – 11
Total transactions with owners recorded directly in equity 79 11 – – – (439) (35) (384)
Balance as at 30 June 2010 1,683 47 (132) (107) (7) 8,765 1,189 11,438
Opening balance as at 1 July 2008 1,755 26 (130) 194 10 2,217 1,104 5,176
Other comprehensive income – – 9 (308) (9) (7) 33 (282)
Profit after tax expense for the period – – – – – 6,941 57 6,998
Total comprehensive income/(expense) for the period – – 9 (308) (9) 6,934 90 6,716
Dividends paid (refer note 5) – – – – – (554) (76) (630)
Movement in share capital (refer note 21) (151) – – – – – 18 (133)
Movement in share-based payments reserve – 10 – – – – – 10
Acquisition of Origin LPG (Vietnam) LLC – – – – – – 5 5
Total transactions with owners recorded directly in equity (151) 10 – – – (554) (53) (748)
Balance as at 30 June 2009 1,604 36 (121) (114) 1 8,597 1,141 11,144
The statement of changes in equity should be read in conjunction with the accompanying notes set out on pages 63 to 120.

62
Statement of Cash Flows for the year ended 30 June
2010 2009Note $million $million
cash flows from operating activities
Cash receipts from customers 9,052 8,866
Cash paid to suppliers (7,890) (7,778)
Cash generated from operations 1,162 1,088
Dividends/distributions received from equity accounted investees 13 13
Other dividends received 1 1
Income taxes paid (102) (120)
Net cash from operating activities 23(c) 1,074 982
cash flows from investing activities
Acquisition of property, plant and equipment, exploration and development expenditure and other non-current assets (2,876) (2,143)
Acquisition of businesses, net of cash acquired 23(d) (8) (165)
Interest received 120 126
Net proceeds from sale of non-current assets 7 1
Proceeds from dilution of Origin’s interest in APLNG – 6,889
Costs associated with takeover defence and dilution of Origin’s interest in APLNG (16) (122)
Tax paid on dilution of Origin’s interest in APLNG (548) (131)
Cash in APLNG at dilution – (19)
Net cash (used in)/from investing activities (3,321) 4,436
cash flows from financing activities
Proceeds from borrowings 2,698 4,389
Repayment of borrowings (2,841) (4,996)
Interest paid (285) (262)
Dividends paid by the parent entity (374) (535)
Dividends paid to non-controlling interests (35) (58)
Share buy-back – (195)
Proceeds from issue of share capital 13 25
Net cash used in financing activities (824) (1,632)
Net (decrease)/increase in cash and cash equivalents (3,071) 3,786
cash and cash equivalents at the beginning of the year 3,891 95
Effect of exchange rate changes on cash (1) 10
cash and cash equivalents at the end of the year 23(a) 819 3,891
The statement of cash flows should be read in conjunction with the accompanying notes set out on pages 63 to 120.

ORIGIN ENERGY ANNUAL REPORT 2010 63
Notes to the Financial Statements
Origin Energy Limited (the company) is a company domiciled in Australia. The financial statements of the company for the year ended 30 June 2010 comprise the company and its subsidiaries (together referred to as the consolidated entity) and the consolidated entity’s interest in associates and jointly controlled entities. The consolidated financial statements were approved by the Board of Directors on 23 August 2010.
STATEmENT Of cOmPLIANcEThe financial statements are general purpose financial statements that have been prepared in accordance with Australian Accounting Standards (including Australian Interpretations) adopted by the Australian Accounting Standards Board (AASB) and the Corporations Act 2001. The financial statements of the consolidated entity comply with International Financial Reporting Standards and interpretations adopted by the International Accounting Standards Board.
BASIS Of PREPARATIONThe consolidated financial statements are presented in Australian dollars, which is the functional currency of the majority of the subsidiaries in the consolidated entity. Unless otherwise stated all reference to ‘$’ refers to Australian dollars.
The entity has not elected to early adopt any accounting standards and amendments.
The financial statements are prepared on the historical cost basis except for the following material items in the statement of financial position:
• derivative financial instruments and financial assets classified as available-for-sale that are measured at their fair value; and
• the defined benefit asset is measured as the net total of the plan assets, plus unrecognised past service cost and unrecognised actuarial losses, less unrecognised actuarial gains and the present value of the defined benefit obligation.
The company is of a kind referred to in Australian Securities and Investments Commission (ASIC) Class Order 98/100 dated 10 July 1998 (updated by CO 05/641 effective 28 July 2005 and CO 06/51 effective 31 January 2006) and in accordance with that Class Order, amounts in the financial statements and Directors’ Report have been rounded off to the nearest million dollars, unless otherwise stated.
USE Of ESTImATES ANd JUdGEmENTSThe preparation of financial statements requires management to make judgements, estimates and assumptions that affect the application of policies and reported amounts of assets and liabilities, income and expenses. The estimates and associated assumptions are based on historical experience and various other factors that are believed to be reasonable under the circumstances, the results of which form the basis of making the judgements about carrying values of assets and liabilities that are not readily apparent from other sources. Actual results may differ from these estimates.
The estimates and underlying assumptions are reviewed on an ongoing basis. Revisions to accounting estimates are recognised in the period in which the estimate is revised and in any future periods affected.
The accounting policies set out below have been applied consistently to all periods presented in the financial statements. The accounting policies have been applied consistently by all entities in the consolidated entity.
Certain comparative amounts have been reclassified to conform to the current year’s presentation.
chANGES IN AccOUNTING POLIcIESEffective 1 July 2009, the consolidated entity has changed its accounting policies in the following areas as a result of changes to accounting standards:
• Accounting for business combinations
• Accounting for acquisitions of non-controlling interests
• Determination and presentation of operating segments
• Presentation of financial statements
PRINcIPLES Of cONSOLIdATION
Businesscombinations
Changeinaccountingpolicy
The consolidated entity has adopted revised AASB 3 Business Combinations (2008) and amended AASB 127 Consolidated and Separate Financial Statements (2008) for business combinations occurring on or after 1 July 2009.
Transaction costs that the consolidated entity incurs in connection with a business combination, such as legal fees, due diligence fees and other professional and consulting fees, are expensed as incurred.
Accountingforacquisitionsofnon-controllinginterests
The consolidated entity has applied AASB 127 Consolidated and Separate Financial Statements (2008) for the acquisitions of non-controlling interests that are accounted for as transactions with equity holders in their capacity as equity holders and therefore no goodwill is recognised. The change in accounting policy was applied prospectively.
Subsidiaries
The financial statements of the consolidated entity include the financial statements of Origin Energy Limited and all entities in which it had a controlling interest. Control exists when the company has the power, directly or indirectly, to govern the financial and operating policies of an entity so as to obtain benefits from its activities. In assessing control, potential voting rights that are presently exercisable or convertible are taken into account. The effects of transactions between entities consolidated in the financial statements are eliminated. Non-controlling interests in the equity and results of entities that are under the control of Origin Energy Limited are shown as a separate item in the financial statements. Where control of entities commenced or ceased during the year, the profits or losses are included only from the date control commenced or up to the date control ceased.
Associatesandjointventures(equityaccountedinvestees)
Associates are those entities over which the consolidated entity exercises significant influence, but not control, over the financial and operating policies and which are not intended for sale in the near future. Joint ventures are those entities over whose activities the consolidated entity has joint control, established by contractual agreement. In the financial statements, investments in associates and investments in jointly controlled entities, including partnerships, are accounted for using equity accounting principles.
The financial statements include the consolidated entity’s share of the income and expenses and equity movements of the equity accounted investees, after adjusting to align the accounting policies with those of the consolidated entity, from the date that significant influence or joint control commences until the date that significant influence or joint control ceases. When the consolidated entity’s share of losses exceeds its interest in an equity accounted investee, the carrying amount of that interest (including any long-term investments) is reduced to nil and the recognition of further losses is discontinued except to the extent that the consolidated entity has an obligation or has made payments on behalf of the investee.
The equity accounted results are disclosed in the income statement as ‘share of results of equity accounted investees’.
1. Statement of significant accounting policies

64
Notes to the Financial Statements
Jointlycontrolledoperationsandassets
The consolidated entity’s interests in unincorporated joint ventures are brought to account by including its proportionate share of the joint ventures’ assets, liabilities and expenses and the consolidated entity’s revenue from the sale of its share of output on a line-by-line basis, from the date joint control commences to the date joint control ceases.
Businesscombinationsfromentitiesundercommoncontrol
Business combinations arising from transfers of interests in entities that are under the control of the shareholder that controls the consolidated entity are accounted for by recognising the assets and liabilities acquired at the carrying amounts recognised previously in the consolidated entity’s controlling shareholder’s consolidated financial statements. The components of equity of the acquired entities are added to the same components within the consolidated entity equity. Any cash paid for the acquisition is recognised directly in equity.
SEGmENT REPORTINGAs of 1 July 2009 the consolidated entity determines and presents operating segments based on the information that is internally provided to the Managing Director who is the chief operating decision maker. The Managing Director regularly receives financial information on the underlying profit of each operating segment and the statutory profit. A reconciliation is also received to show the financial impact of the individual items that are excluded from statutory profit in the measurement of underlying profit. The underlying profit information is provided to the Managing Director to assess the performance of Origin’s ongoing business. The nature of items adjusted for in the measurement of underlying profit normally include losses on impairment of assets, gains on dilution of Origin’s interests in subsidiaries, gains and losses on the movement in fair value of financial instruments not qualifying for hedge accounting, net interest expense arising on the unwinding of discounted receivables and payables associated with Origin’s investment in APLNG, transition and transaction costs, one-off tax items and other items that would distort the comparability of the results of the ongoing operations. This change in accounting policy is due to the adoption of AASB 8 Operating Segments. Previously operating segments were determined and presented in accordance with AASB 114 Segment Reporting. Comparative segment information has been re-presented in conformity with the transitional requirements of the standard.
A segment is a distinguishable component of the consolidated entity that is engaged in providing products or services, which is subject to risks and rewards that are different from those of other segments.
cASh ANd cASh EqUIvALENTSCash and cash equivalents comprise cash balances, call deposits and term deposits. Bank overdrafts that are repayable on demand and form an integral part of the consolidated entity’s cash management are included as a component of cash and cash equivalents for the purpose of the statement of cash flows.
TRAdE ANd OThER REcEIvABLESTrade and other receivables are recorded at amortised cost less accumulated impairment losses.
INvENTORIESInventories are valued at the lower of cost and net realisable value. Net realisable value is the estimated selling price in the ordinary course of business, less the estimated costs of completion and selling expenses. Cost is determined predominantly on the first-in-first-out basis of valuation.
dEfERREd ExPENSESExpenditure is deferred to the extent that it is probable that future economic benefits embodied in the expenditure will eventuate and can be reliably measured. Deferred expenses are amortised on a straight-line basis over the period in which the related benefits are expected to be realised.
ImPAIRmENTThe carrying amounts of assets, other than inventories, derivatives and deferred tax assets, are reviewed at each reporting date to determine if there is any indication of impairment. If any such indication exists, the asset’s recoverable amount is estimated, as discussed below.
An impairment loss is recognised whenever the carrying amount of an asset or its cash-generating unit exceeds its recoverable amount. Impairment losses are recognised in the income statement, unless an asset has previously been re-valued, in which case the impairment loss is recognised as a reversal to the extent of that previous revaluation with any excess recognised through the income statement.
Impairment losses recognised in respect of cash-generating units are allocated first to reduce the carrying amount of any goodwill allocated to cash-generating units and then to reduce the carrying amount of the other assets in the cash-generating unit on a pro-rata basis.
When a decline in the fair value of an available-for-sale financial asset has been recognised directly in equity and there is objective evidence that the asset is impaired, the cumulative loss that had been recognised directly in equity is recognised in the income statement even though the financial asset has not been derecognised. The amount of the cumulative loss that is recognised in the income statement is the difference between the acquisition cost and current fair value, less any impairment loss on that financial asset previously recognised in the income statement.
An impairment loss is reversed if there has been an indication that the impairment loss no longer exists and there has been a change in the estimates used to determine the recoverable amount. An impairment loss in respect of goodwill is not reversed. An impairment loss in respect of assets other than goodwill is reversed only to the extent that the asset’s carrying amount does not exceed the carrying amount that would have been determined, net of depreciation or amortisation, if no impairment had been recognised.
cALcULATION Of REcOvERABLE AmOUNTThe recoverable amount of receivables carried at amortised cost is calculated as the present value of estimated future cash flows, discounted at the original effective interest rate (i.e. the effective interest rate computed at initial recognition of these financial assets). Receivables with a short duration are not discounted.
Impairment of receivables is not recognised until objective evidence is available that a loss event has occurred. Significant receivables are individually assessed for impairment. Impairment testing of significant receivables that are not assessed as impaired individually is performed by placing them into portfolios of significant receivables with similar risk profiles and undertaking a collective assessment of impairment. Non-significant receivables are not individually assessed. Instead, impairment testing is performed by placing non-significant receivables into portfolios of similar risk profiles, based on objective evidence from historical experience adjusted for any effects of conditions existing at each reporting date.
The recoverable amount of other assets is the greater of their fair value less costs to sell, and value in use. In assessing value in use, the estimated future cash flows are discounted to their present value using a pre-tax discount rate that reflects current market assessments of the time value of money and the risks specific to the asset. For an asset that does not generate largely independent cash inflows, the recoverable amount is determined for the cash-generating unit to which the asset belongs. The recoverable amount of some assets is their fair value less costs to sell.
1. Statement of significant accounting policies (continued)

ORIGIN ENERGY ANNUAL REPORT 2010 65
Notes to the Financial Statements
INTANGIBLE ASSETS
Goodwill
All business combinations are accounted for by applying the acquisition method. Goodwill represents the difference between the cost of the acquisition and the fair value of the net identifiable assets, liabilities and contingent liabilities acquired. Goodwill is stated at cost less any accumulated impairment losses. Goodwill is allocated to cash-generating units and is not amortised but is tested annually for impairment. In respect of equity accounted entities, the carrying amount of goodwill is included in the carrying amount of the investment in the equity accounted entity. Negative goodwill arising on an acquisition is recognised directly in the income statement.
Otherintangibleassets
Other intangible assets that are acquired are stated at cost less accumulated amortisation and impairment losses. Amortisation is recognised as an expense on a straight-line basis over the estimated useful lives of the assets.
Researchanddevelopment
Expenditure on research activities, undertaken with the prospect of gaining new scientific or technical knowledge and understanding, is recognised in the income statement as an expense as incurred. Expenditure on development activities, whereby research findings are applied to a plan or design for the production of new or substantially improved products and processes, is capitalised if the product or process is technically and commercially feasible and the consolidated entity has sufficient resources to complete development. The expenditure capitalised includes the cost of materials, direct labour and an appropriate proportion of overheads. Other development expenditure is recognised as an expense in the income statement as incurred. Capitalised development expenditure is stated at cost less accumulated amortisation and impairment losses. Amortisation is recognised as an expense on a straight-line basis over the estimated useful lives of the assets.
ExPLORATION ANd EvALUATION ExPENdITUREExploration and evaluation expenditure is accounted for in accordance with the area of interest method. The application of this method is based on a partial capitalisation model closely aligned to the ‘successful efforts’ approach. All exploration and evaluation costs, including directly attributable overheads, general permit activity, geological and geophysical costs are expensed as incurred except the cost of drilling exploration wells and the cost of acquiring new interests. The costs of drilling exploration wells are initially capitalised pending the determination of the success of the well. Costs are expensed where the well does not result in a successful discovery. Costs incurred before the consolidated entity has obtained the legal rights to explore an area are recognised in the income statement.
Exploration and evaluation expenditure is partially or fully capitalised where either (i) the expenditure is expected to be recouped through successful development and exploitation of the area of interest (or alternatively, by its sale) or (ii) exploration and evaluation activities in the area of interest have not at the reporting date reached a stage which permits a reasonable assessment of the existence or otherwise of economically recoverable reserves, and active and significant operations in, or in relation to, the area of interest are continuing, or where both conditions are met. Upon approval for the commercial development of a project, the accumulated expenditure is transferred to development assets.
dEvELOPmENT ASSETSThe costs of oil and gas assets in the development phase are separately accounted for and include costs transferred from exploration and evaluation expenditure once technical feasibility and commercial viability of an area of interest are demonstrable and all development drilling and other subsurface expenditure. When production commences, the accumulated costs are transferred to producing areas of interest.
Land and buildings and surface plant and equipment associated with development assets are recorded in the other land and buildings and other plant and equipment categories respectively.
INvESTmENTS IN dEBT ANd EqUITY SEcURITIESFinancial instruments held for trading are classified as current assets and are stated at fair value, with any resultant gain or loss recognised in the income statement.
Other financial assets held by the consolidated entity are classified as being available-for-sale and are stated at fair value, with any resultant gain or loss recognised directly in equity, except for impairment losses and, in the case of monetary items such as debt securities, foreign exchange gains and losses. When these investments are derecognised, the cumulative gain or loss previously recognised directly in equity is recognised in profit or loss. Where these investments are interest-bearing, interest calculated using the effective interest method is recognised in profit or loss.
The fair value of financial assets classified as available-for-sale is their quoted bid price at the reporting date.
Financial assets classified as available-for-sale investments are recognised/derecognised by the consolidated entity on the date it commits to purchase/sell the investments. Securities held to maturity are recognised/derecognised on the day they are transferred to/by the consolidated entity.
PROPERTY, PLANT ANd EqUIPmENTItems of property, plant and equipment are recorded at cost or deemed cost less accumulated depreciation and impairment losses.
Producingareasofinterest
The costs of oil and gas assets in production are separately accounted for and include costs transferred from exploration and evaluation expenditure, transferred development costs and the ongoing costs of continuing to develop reserves for production. These costs are subject to depreciation and depletion in accordance with the policy outlined below.
Land and buildings and surface plant and equipment associated with producing areas of interest are recorded in the other land and buildings and other plant and equipment categories respectively.
Leasedplantandequipment
Leases of plant and equipment which are classified as finance leases (where the consolidated entity assumes substantially all the risks and rewards of ownership of the assets) are capitalised and amortised over the period during which benefits are anticipated. Other leases are classified as operating leases and the lease costs are expensed on a straight-line basis over the term of the lease, except where an alternative basis is more representative of the pattern of benefits to be derived from the leased assets.
Self-constructedassets
These assets are carried at cost and tested for impairment. The cost of self-constructed assets includes the cost of materials, direct labour, the initial estimate, where relevant, of the costs of dismantling and removing the items and restoring the site on which they are located, an appropriate proportion of production overheads and capitalised interest.
1. Statement of significant accounting policies (continued)

66
Notes to the Financial Statements
Depreciationandamortisation
With the exception of producing areas of interest and land, depreciation is charged to the income statement on a straight-line basis over the estimated useful lives of each part of an item of property, plant and equipment. The carrying values of producing areas of interest are amortised on a units of production basis using the proved and probable reserves to which they relate, together with the estimated future development expenditure required to develop those reserves.
The range of depreciation rates for the current and comparative period for each class of asset are:
Generation property, plant and equipment 1% – 33%
Other land and buildings 1% – 18%
Other plant and equipment 1% – 50%
Producing areas of interest 2% – 25%
NON-cURRENT ASSETS hELd fOR SALENon-current assets (or disposal groups comprising assets and liabilities) that are expected to be recovered primarily through sale rather than through continuing use are classified as held for sale. Immediately before classification as held for sale, the assets (or components of a disposal group) are remeasured in accordance with the consolidated entity’s accounting policies. Thereafter, generally the assets (or disposal group) are measured at the lower of their carrying amount and fair value less cost to sell. Any impairment loss on a disposal group is first allocated to goodwill, and then to remaining assets and liabilities on a pro-rata basis, except that no loss is allocated to financial assets, deferred tax assets, employee benefit assets and investment property which continue to be measured in accordance with the consolidated entity’s accounting policies. Impairment losses on initial classification as held for sale and subsequent gains or losses on re-measurement are recognised in profit or loss. Gains are not recognised in excess of any cumulative impairment loss.
fINANcE LEASESA lease asset and a lease liability equal to the present value of the minimum lease payments are recorded at the inception of the lease. Lease liabilities are reduced by the repayments of principal. The interest components of the lease payments are expensed.
OPERATING LEASESPayments made under operating leases are expensed on a straight-line basis over the term of the lease, except where an alternative basis is more representative of the pattern of benefits to be derived from the leased property. Lease incentives are recognised in the income statement as the integral part of total lease expense spread over the lease term.
TRAdE ANd OThER PAYABLESLiabilities are recognised for amounts to be paid in the future for goods and services received and are recorded at amortised cost.
INTEREST-BEARING LIABILITIESInterest-bearing liabilities are initially recognised at fair value less attributable transaction costs. Subsequent to initial recognition, interest-bearing liabilities are stated at amortised cost with any difference between cost and redemption value being recognised in the income statement over the period of borrowings on an effective interest basis. Interest expense is recognised in the income statement as a component of net financing costs.
dEfINEd BENEfIT SUPERANNUATION PLANThe consolidated entity’s net obligation in respect of the defined benefit superannuation plan is calculated by estimating the amount of future benefit that employees have earned in return for their service in the current and prior periods. The benefit is discounted to determine its present value, and the fair value of the plan assets is deducted. The discount rate is the yield at the reporting date on Commonwealth Government bonds that have maturity dates approximating the terms of the consolidated entity’s obligations. The calculation was performed by a qualified actuary using the projected unit credit method. The calculation for the financial year ending 30 June 2010 was performed on 16 July 2010.
When the benefits of the plan are improved, the portion of the increased benefit relating to past service by employees is recognised as an expense in the income statement on a straight-line basis over the average period until the benefits become vested. To the extent that the benefits vest immediately, the expense is recognised immediately in the income statement.
When the calculation results in plan assets exceeding liabilities to the consolidated entity, the recognised asset is limited to the net total of any unrecognised actuarial losses and past service costs and the present value of any future refunds from the plan or reductions in future contributions to the plan.
Past service cost is the increase in the present value of the defined benefit obligation for employee services in prior periods, resulting in the current period from the introduction of, or changes to, post-employment benefits or other long-term employee benefits. Past service costs may either be positive (where benefits are introduced or improved) or negative (where existing benefits are reduced).
Actuarial gains and losses are recognised directly in retained earnings in the period in which they occur and are presented in the statement of comprehensive income.
dEfINEd cONTRIBUTION SUPERANNUATION fUNdSThe consolidated entity makes contributions to defined contribution superannuation funds. All contributions made by the consolidated entity are recognised as an expense in the income statement as incurred.
LONG-TERm SERvIcE BENEfITSThe consolidated entity’s net obligation in respect of long-term service benefits, other than superannuation plans, is the amount of future benefit that employees have earned in return for their service in the current and prior periods. The obligation is calculated using expected future increases in wage and salary rates including related on-costs and expected settlement dates, and is discounted using the rates attached to the Commonwealth Government bonds at the reporting date which have maturity dates approximating the terms of the consolidated entity’s obligations.
WAGES, SALARIES, ANNUAL LEAvE ANd SIcK LEAvELiabilities for employee benefits for wages, salaries, annual leave and sick leave that are expected to be settled within 12 months of the reporting date represent present obligations resulting from employees’ services provided up to the reporting date calculated at undiscounted amounts based on remuneration wage and salary rates that the company expects to pay as at the reporting date including related on-costs, such as workers compensation insurance and payroll tax.
EqUITY-BASEd cOmPENSATIONEquity-based compensation benefits are provided to employees via the Senior Executive Option Plan, Senior Executive Performance Share Rights Plan and the Employee Share Plan. The accounting policies regarding each of these plans are as follows:
1. Statement of significant accounting policies (continued)

ORIGIN ENERGY ANNUAL REPORT 2010 67
Notes to the Financial Statements
SeniorExecutiveOptionPlanandPerformanceShareRightsPlan
The fair value of the options and performance share rights granted is recognised as an employee benefits expense with a corresponding increase in equity. The fair value is measured at grant date using a binomial model, taking into account market performance conditions only, and recognised over the vesting period during which the employees become unconditionally entitled to the options and performance share rights. The amount recognised as an expense is adjusted to reflect the actual number of options and performance share rights that vest except where forfeiture is due to market related conditions.
EmployeeSharePlan
Where shares allocated to the benefit of employees are purchased by the company on market, the fair value of the shares is recognised as a liability in the statement of financial position until paid and included in the income statement.
PROvISIONSA provision is recognised in the statement of financial position when there is a legal, equitable or constructive obligation as a result of a past event and it is probable that a future sacrifice of economic benefits will be required to settle the obligation, the timing or amount of which is uncertain. Provisions are determined by discounting the expected future cash flows required to settle the obligation at a pre-tax rate that reflects current market assessments of the time value of money and the risks specific to the liability, being the rates on Commonwealth Government bonds most closely matching the expected future payments, except where noted below. When some or all of the economic benefits required to settle a provision are expected to be recovered from a third party, the recovery receivable is recognised as an asset when it is virtually certain that the recovery will be received and is measured on a basis consistent with the measurement of the related provision. In the income statement, the expense recognised in respect of a provision is presented net of the recovery. The unwinding of the discount on the provision is recognised in the income statement as interest expense.
In the statement of financial position, the provision is recognised net of the recovery receivable only when the entity has a legally recognised right to set off the recovery receivable and the provision, and intends to settle on a net basis, or to realise the asset and settle the provision simultaneously. A provision for dividend payable is recognised in the reporting period in which the dividend is declared, for the entire undistributed amount, regardless of the extent to which it will be paid in cash.
Restoration,rehabilitationanddismantling
Provisions for the estimated present value of costs relating to future restoration, rehabilitation and dismantling activities are recognised as liabilities when a legal or constructive obligation arises. Where the obligation arises as a result of the construction or installation of an asset or assets, an amount equal to the initial liability is capitalised as a component of the asset. At each reporting date, the restoration liability is remeasured in line with changes in discount rates, and timing or amount of the costs to be incurred. Any changes in the liability in future periods are added or deducted from the related asset, other than the unwinding of the discount which is recognised as interest expense in he income statement as it occurs. The costs, which include field site rehabilitation and restoration, remediation of soil, groundwater and untreated waste and dismantling and removal of infrastructure, are determined on the basis of current legal requirements and current technology. Changes in estimates are dealt with on a prospective basis.
Uncertainties exist as to the amount of the restoration obligations that will be incurred due to uncertainty as to the remaining life of existing operating sites and the impact of changes in environmental legislation.
Onerouscontracts
A provision for onerous contracts is recognised after impairment losses on assets dedicated to the contract have been recognised and when the expected benefits are less than the unavoidable costs of meeting the contractual obligations. A provision is recognised to the extent that the contractual obligations exceed unrecognised assets.
ShARE cAPITAL
Ordinaryshares
Incremental costs directly attributable to the issue of ordinary shares and share options are recognised as a deduction from equity, net of any related income tax benefit.
Dividends
Dividends are recognised as a liability in the period in which they are declared.
REvENUE REcOGNITION
Revenue
Revenue comprises revenue earned (net of returns, discounts and allowances) from the provision of products or services to entities outside the consolidated entity. Sales revenue is recognised in accordance with the contractual arrangements where applicable and only once the significant risks and rewards of ownership of the goods passes from the consolidated entity to the customer or when services have been rendered to the customer and collectability is reasonably assured. In practice, the above revenue recognition approach is applied to the consolidated entity’s business segments as follows:
• Revenue from the sale of oil and gas in the Exploration and Production business segment is recognised when the commodities have been loaded for shipment and title passes to the customer.
• Revenue from electricity and gas supplied by the Retail business segment is recognised once the electricity and gas has been delivered and is measured through a regular review of usage meters. Revenue from the sale of solar panels is recognised once installation is complete.
• The Generation business segment recognises revenues from the generation of electricity when the electricity has been supplied to customers. A tolling arrangement is in place at commercial rates between the Retail and Generation business segments in relation to the consolidated entity’s merchant power stations. The external revenue generated by the merchant power stations is recognised in Retail’s revenue while Generation receives a tolling fee from Retail for the capacity provided and costs incurred by these power stations.
Governmentgrants
Government grants are recognised in the statement of financial position initially as deferred income when there is reasonable assurance that they will be received and that the consolidated entity will comply with the conditions attaching to them. Grants that compensate the consolidated entity for expenses incurred are recognised as revenue in the income statement on a systematic basis in the same periods in which the expenses are incurred. Grants that compensate the consolidated entity for the cost of an asset are deferred as unearned income until the asset is ready for use at which time they are recognised in the income statement as other income on a systematic basis over the useful life of the asset.
1. Statement of significant accounting policies (continued)

68
Notes to the Financial Statements
Dividends
The consolidated entity has applied amended AASB 127 Consolidated and Separate Financial Statements for the first time from 1 July 2009. Amended AASB 127 specifies that all dividends received from subsidiaries, jointly controlled entities and associates be recognised as income in the consolidated entity’s stand alone accounts when the right to receive the dividend is established. Previously, only post acquisition profits received were treated as income in the consolidated entity’s accounts. The change in accounting policy was applied prospectively in accordance with the transitional provisions of the amended AASB 127.
Revenue from dividends from other investments are recognised when dividends are declared.
Interestrevenue
Interest revenue is recognised as it accrues.
NET fINANcING cOSTSNet financing costs comprise interest payable on borrowings, dividends on redeemable preference shares, unwinding of discounts and interest receivable on funds invested. Borrowing costs are expensed as incurred and included in net financing costs in the income statement.
Financing costs incurred for the construction of a qualifying asset are capitalised during the period of time that is required to complete and prepare the asset for its intended use or sale.
GOOdS ANd SERvIcES TAxRevenues, expenses and assets are recognised net of the amount of goods and services tax (“GST”), except where the amount of GST incurred is not recoverable from the taxation authorities. In these circumstances, the GST is recognised as part of the cost of acquisition of the asset or as part of an item of the expense. Receivables and payables are stated with the amount of GST included. The net amount of GST recoverable from, or payable to, the tax authorities is included as a current asset or liability in the statement of financial position. Cash flows are included in the statement of cash flows on a gross basis. The GST components of cash flows arising from investing and financing activities which are recoverable from, or payable to, the taxation authorities are classified as operating cash flows.
INcOmE TAxIncome tax on the profit and loss for the year comprises current and deferred tax. Income tax is recognised in the income statement except to the extent that it relates to items recognised directly in equity, in which case it is recognised in equity.
Current tax is the expected tax receivable/payable on the taxable income for the year, using tax rates enacted or substantially enacted at the reporting date, and any adjustment to tax payable in respect of previous years.
Deferred tax is recognised in respect of temporary differences between the carrying amounts of assets and liabilities for financial reporting purposes and the amounts used for taxation purposes. The following temporary differences are not provided for: goodwill, the initial recognition of assets or liabilities that affect neither accounting nor taxable profit, and differences relating to investments in subsidiaries to the extent that they will probably not reverse in the foreseeable future. The amount of deferred tax provided is based on the expected manner of realisation or settlement of the carrying amount of assets and liabilities, using tax rates enacted or substantively enacted at the reporting date.
Origin’s Exploration and Production operations in New Zealand have a USD accounting functional currency. New Zealand tax legislation dictates that these operations have a NZD currency for the purposes of submitting their tax returns. Origin is required to translate the NZD tax bases to USD when performing the tax effect accounting calculation,
with the foreign exchange movement recorded in the income statement.
A deferred tax asset is recognised only to the extent that it is probable that future taxable profits will be available against which the asset can be utilised. Deferred tax assets are reduced to the extent that it is no longer probable that the related tax benefit will be realised.
Taxconsolidation
The company and its wholly-owned Australian resident entities, which met the membership requirements, formed a tax-consolidated group with effect from 1 July 2003. The head entity within the tax-consolidated group is Origin Energy Limited.
Tax funding arrangements amounts are recognised as inter-entity amounts, giving rise to a contribution by or distribution to equity participants to the extent they differ from the amounts assumed by the head entity from subsidiaries.
Current tax expense/income, deferred tax liabilities and deferred tax assets arising from temporary differences of the members of the tax-consolidated group are recognised in the separate financial statements of the members of the tax-consolidated group.
The company recognises deferred tax assets arising from unused tax losses of the tax-consolidated group to the extent that it is probable that future taxable profits of the tax-consolidated group will be available against which the asset can be utilised.
Taxationoffinancialarrangements
The Tax Laws Amendment (Taxation of Financial Arrangements) Act 2009 (TOFA legislation) will be applicable to the tax-consolidated group for tax years beginning on or after 1 July 2010. The TOFA legislation is not expected to have a material effect on the current tax expense of the tax-consolidated group. It is unlikely that an election will be made to bring pre-commencement financial arrangements into the TOFA regime.
fOREIGN cURRENcY TRANSAcTIONSTransactions in foreign currencies are translated at the foreign exchange rate ruling at the date of the transaction. Monetary assets and liabilities denominated in foreign currencies at the reporting date are translated to Australian dollars at the foreign exchange rate ruling at that date. Foreign exchange differences arising on translation are recognised in the income statement. Non-monetary assets and liabilities that are measured in terms of historical cost in a foreign currency are translated using the exchange rate at the date of the transaction. Non-monetary assets and liabilities denominated in foreign currencies that are stated at fair value are translated to Australian dollars at foreign exchange rates ruling at the dates the fair value was determined.
fINANcIAL STATEmENTS Of fOREIGN OPERATIONSThe assets and liabilities of foreign operations, including goodwill and fair value adjustments arising on consolidation are translated to Australian dollars at foreign exchange rates in effect at the reporting date. The revenues and expenses of foreign operations are translated to Australian dollars at rates approximating the foreign exchange rates ruling at the dates of the transactions. Foreign exchange differences arising on retranslation are recognised directly in a separate component of equity.
NET INvESTmENT IN fOREIGN OPERATIONSExchange differences arising from the translation of the net investment in foreign operations, and of related hedges are taken to the translation reserve. They are released into the income statement upon disposal. In respect of all foreign operations, any differences that have arisen after 1 July 2004, the date of transition to Australian equivalents to International Financial Reporting Standards (A-IFRS), are presented as a separate component of equity.
1. Statement of significant accounting policies (continued)
ORIGIN ENERGY ANNUAL REPORT 2010 69
Notes to the Financial Statements
ENvIRONmENTAL SchEmE cERTIfIcATESThe consolidated entity holds environmental scheme certificates in order to meet the consolidated entity’s regulatory surrender obligations. Both the environmental certificate assets and the surrender obligations are presented at fair value, being the market price for environmental scheme certificates at the reporting date.
dERIvATIvE fINANcIAL INSTRUmENTSThe consolidated entity uses derivative financial instruments to hedge its exposure to foreign exchange, interest rate, electricity price and commodity price risks arising from operating, financing and investing activities. In accordance with its treasury and energy risk management policies, the consolidated entity does not hold or issue derivative financial instruments for speculative or trading purposes. However, derivatives that do not qualify for hedge accounting are required to be accounted for as trading instruments.
Derivative financial instruments are recognised initially at fair value on the date the instrument is entered into. Where a valuation technique results in a gain or loss at the execution date of an instrument, the day one gain or loss is not recognised at the date of execution and the impact of the day one gain or loss is excluded from the changes in fair value of the instrument recognised each period over the life of the instrument. Subsequent to initial recognition, derivative financial instruments are remeasured to fair value. The gain or loss on re-measurement to fair value is recognised immediately in the income statement unless the derivative is designated and effective as a hedging instrument, in which event, the timing of the recognition of profit or loss depends on the nature of the hedging relationship. The consolidated entity designates certain derivatives as either hedges of the exposure to fair value changes in recognised assets or liabilities or firm commitments (fair value hedges); hedges of the exposure to variability in cash flows attributable to a recognised asset or liability or highly probable forecast transactions (cash flow hedges); or hedges of net investments in foreign operations. Refer to note 27 for further details.
Embedded derivatives are separated from the host contract and accounted for separately if the economic characteristics and risks of the host contract and the embedded derivative are not closely related, a separate instrument with the same terms as the embedded derivative would meet the definition of a derivative, and the combined instrument is not measured at fair value through profit or loss.
hEdGING
Cashflowhedges
Where a derivative financial instrument is designated as a hedge of the variability in cash flows of a recognised asset or liability, or a highly probable forecasted transaction, the effective part of any gain or loss on the derivative financial instrument is recognised directly in equity. When the forecast transaction subsequently results in the recognition of a non-financial asset or non-financial liability, the associated cumulative gain or loss is removed from equity and included in the initial cost or other carrying amount of the non-financial asset or liability. If a hedge of a forecast transaction subsequently results in the recognition of a financial asset or a financial liability, the associated gains and losses that were recognised directly in equity are reclassified into profit or loss in the same period or periods during which the asset acquired or liability assumed affects profit or loss.
For cash flow hedges, other than described above, the associated cumulative gain or loss is removed from equity and recognised in the income statement in the same period or periods during which the hedged forecast transaction affects profit or loss. The ineffective part of any gain or loss is recognised immediately in the income statement.
When a hedging instrument expires or is sold, terminated or exercised, or the entity revokes designation of the hedge relationship, but the hedged forecast transaction is still expected to occur, the cumulative
gain or loss at that point remains in equity and is recognised in accordance with the above policy when the transaction occurs. If the hedged transaction is no longer expected to occur, the cumulative unrealised gain or loss recognised in equity is recognised immediately in the income statement.
Economichedges
The consolidated entity holds a number of derivative instruments for economic hedging purposes under the board approved risk management policies, which are prohibited from being designated as hedges under AASB 139. These derivatives are therefore required to be categorised as held for trading with changes in the fair value being recognised in the income statement.
Fairvaluehedges
Where a derivative financial instrument is designated as a hedge of exposure to changes in fair value of a recognised asset or liability, the changes in fair value of the derivative are recognised in the income statement, together with the changes in fair value of the hedged asset or liability attributable to the hedged risk.
Hedgeofnetinvestmentinforeignoperations
The portion of the gain or loss on an instrument used to hedge a net investment in a foreign operation that is determined to be an effective hedge is recognised directly in equity. The ineffective portion is recognised immediately in the income statement.
AccOUNTING ESTImATES ANd JUdGEmENTS
Restoration,rehabilitationanddismantling
The consolidated entity estimates the future removal costs of offshore oil and gas platforms, production facilities, wells, pipelines, LPG tankers and tanks and generation plants at the time of installation or construction of the assets. In most instances, removal of the assets occurs many years into the future. This requires judgemental assumptions regarding removal date, future environmental legislation, the extent of reclamation activities required, the engineering methodology for estimating cost, future removal technologies in determining the removal cost, and asset specific discount rates to determine the present value of these cash flows. More detail in respect of the restoration, rehabilitation and dismantling provisions is included earlier in this note.
Impairmentofassets
In determining the recoverable amount of assets, in the absence of quoted market prices, estimations are made regarding the present value of future cash flows using asset specific discount rates. For oil and gas properties, expected future cash flow estimation is based on reserves, future production profiles, commodity prices and costs.
Explorationandevaluationexpenditure
The consolidated entity’s accounting policy for exploration and evaluation expenditure is set out earlier in this note. The application of this policy necessarily requires management to make certain estimates and assumptions as to future events and circumstances, in particular, the assessment of whether economic quantities of reserves have been found. Any such estimates and assumptions may change as new information becomes available. If, after having capitalised expenditure under this policy it is concluded that it is unlikely to recover the expenditure by future exploitation or sale, then the relevant capitalised amount will be written off to the income statement.
1. Statement of significant accounting policies (continued)

70
Notes to the Financial Statements
Amortisationofproducingareasofinterest
The carrying values of producing areas of interest are amortised on a units-of-production basis using the proved and probable reserves to which they relate, together with the estimated future development expenditure required to develop those reserves. Certain estimates and assumptions are used in determining these reserves and development cost estimates.
Fairvalueoffinancialinstruments
The fair value of financial assets and financial liabilities must be estimated for recognition and measurement or for disclosure purposes. The fair value of financial instruments that are not traded in an active market is determined using valuation techniques. The consolidated entity uses a variety of methods and makes assumptions that are based on market conditions existing at each reporting date. Refer to note 27 for further details.
Definedbenefitsuperannuationplanobligations
Various actuarial assumptions are utilised in the determination of the consolidated entity’s defined benefit superannuation plan obligations. These assumptions are discussed in note 20.
PRESENTATION Of fINANcIAL ASSETSThe consolidated entity applies revised AASB 101 Presentation of Financial Statements (2007) which became effective 1 January 2009. As a result the consolidated entity presents in the consolidated statement of changes in equity all owner changes in equity, whereas all non-owner changes in equity are presented in the consolidated statement of comprehensive income.
NEW STANdARdS ANd INTERPRETATIONS NOT YET AdOPTEdThe following standards, amendments to standards and interpretations have been identified as those which may impact the consolidated entity in the period of initial application. They are available for early adoption at 30 June 2010, but have not been applied in preparing the financial statements:
AASB 9 Financial Instruments
AASB 124 Related Party Disclosures (revised December 2009)
AASB 2009-5 Further Amendments to Australian Accounting Standards arising from the Annual Improvements Project (May 2009)
AASB 2009-8 Further Amendments to Australian Accounting Standards – Group Cash-settled Share Based Payment Transactions (July 2009)
AASB 2009-10 Amendments to Australian Accounting Standards – Classification of Rights Issues [AASB 132] (October 2009)
AASB 2009-11 Amendments to Australian Accounting Standards arising from AASB 9
AASB 2009-12 Amendments to Australian Accounting Standards
AASB 2009-14 Amendments to Australian Interpretation – Prepayments of a Minimum Funding Requirement – AASB Interpretation 14
AI 19 Extinguishing Financial Liabilities with Equity Instruments
The consolidated entity is currently in the process of assessing the impact of the adoption of these standards.
1. Statement of significant accounting policies (continued)
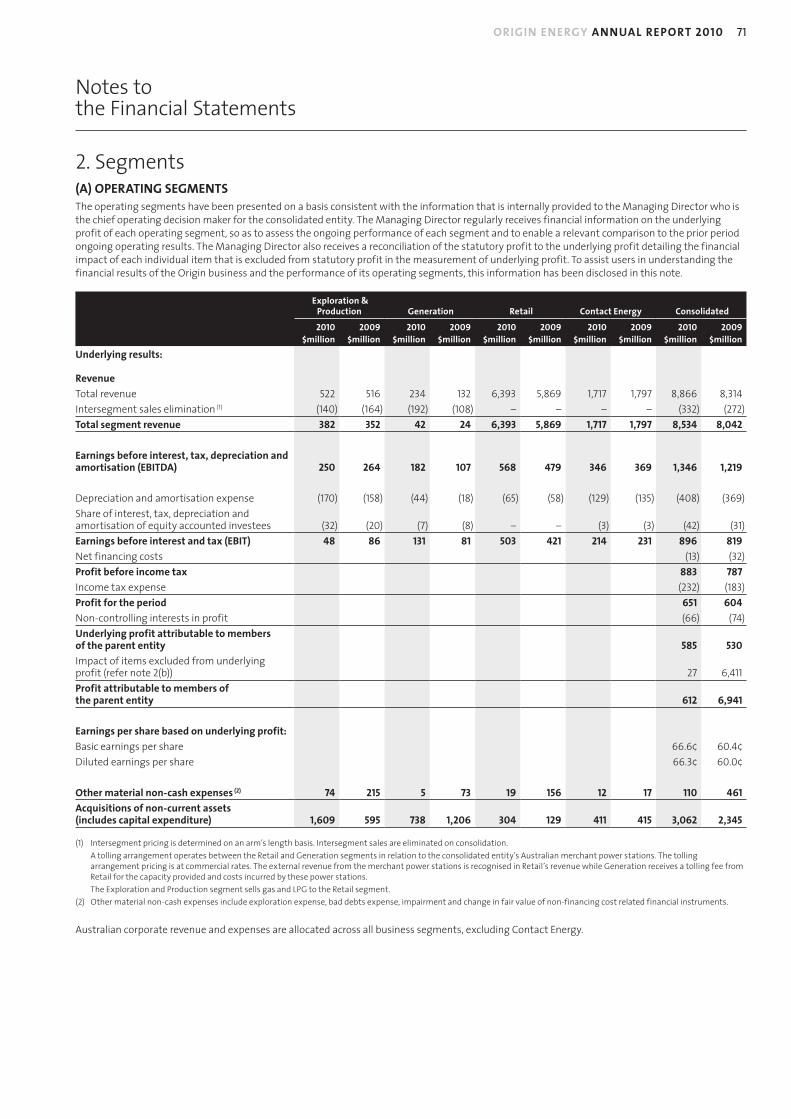
ORIGIN ENERGY ANNUAL REPORT 2010 71
Notes to the Financial Statements
2. Segments(A) OPERATING SEGmENTS The operating segments have been presented on a basis consistent with the information that is internally provided to the Managing Director who is the chief operating decision maker for the consolidated entity. The Managing Director regularly receives financial information on the underlying profit of each operating segment, so as to assess the ongoing performance of each segment and to enable a relevant comparison to the prior period ongoing operating results. The Managing Director also receives a reconciliation of the statutory profit to the underlying profit detailing the financial impact of each individual item that is excluded from statutory profit in the measurement of underlying profit. To assist users in understanding the financial results of the Origin business and the performance of its operating segments, this information has been disclosed in this note.
Exploration & Production Generation Retail contact Energy consolidated
2010 2009 2010 2009 2010 2009 2010 2009 2010 2009$million $million $million $million $million $million $million $million $million $million
Underlying results:
Revenue
Total revenue 522 516 234 132 6,393 5,869 1,717 1,797 8,866 8,314
Intersegment sales elimination (1) (140) (164) (192) (108) – – – – (332) (272)
Total segment revenue 382 352 42 24 6,393 5,869 1,717 1,797 8,534 8,042
Earnings before interest, tax, depreciation and amortisation (EBITdA) 250 264 182 107 568 479 346 369 1,346 1,219
Depreciation and amortisation expense (170) (158) (44) (18) (65) (58) (129) (135) (408) (369)
Share of interest, tax, depreciation and amortisation of equity accounted investees (32) (20) (7) (8) – – (3) (3) (42) (31)
Earnings before interest and tax (EBIT) 48 86 131 81 503 421 214 231 896 819
Net financing costs (13) (32)
Profit before income tax 883 787
Income tax expense (232) (183)
Profit for the period 651 604
Non-controlling interests in profit (66) (74)
Underlying profit attributable to members of the parent entity 585 530
Impact of items excluded from underlying profit (refer note 2(b)) 27 6,411
Profit attributable to members of the parent entity 612 6,941
Earnings per share based on underlying profit:
Basic earnings per share 66.6¢ 60.4¢
Diluted earnings per share 66.3¢ 60.0¢
Other material non-cash expenses (2) 74 215 5 73 19 156 12 17 110 461
Acquisitions of non-current assets (includes capital expenditure) 1,609 595 738 1,206 304 129 411 415 3,062 2,345
(1) Intersegment pricing is determined on an arm’s length basis. Intersegment sales are eliminated on consolidation.
A tolling arrangement operates between the Retail and Generation segments in relation to the consolidated entity’s Australian merchant power stations. The tolling arrangement pricing is at commercial rates. The external revenue from the merchant power stations is recognised in Retail’s revenue while Generation receives a tolling fee from Retail for the capacity provided and costs incurred by these power stations.
The Exploration and Production segment sells gas and LPG to the Retail segment.
(2) Other material non-cash expenses include exploration expense, bad debts expense, impairment and change in fair value of non-financing cost related financial instruments.
Australian corporate revenue and expenses are allocated across all business segments, excluding Contact Energy.
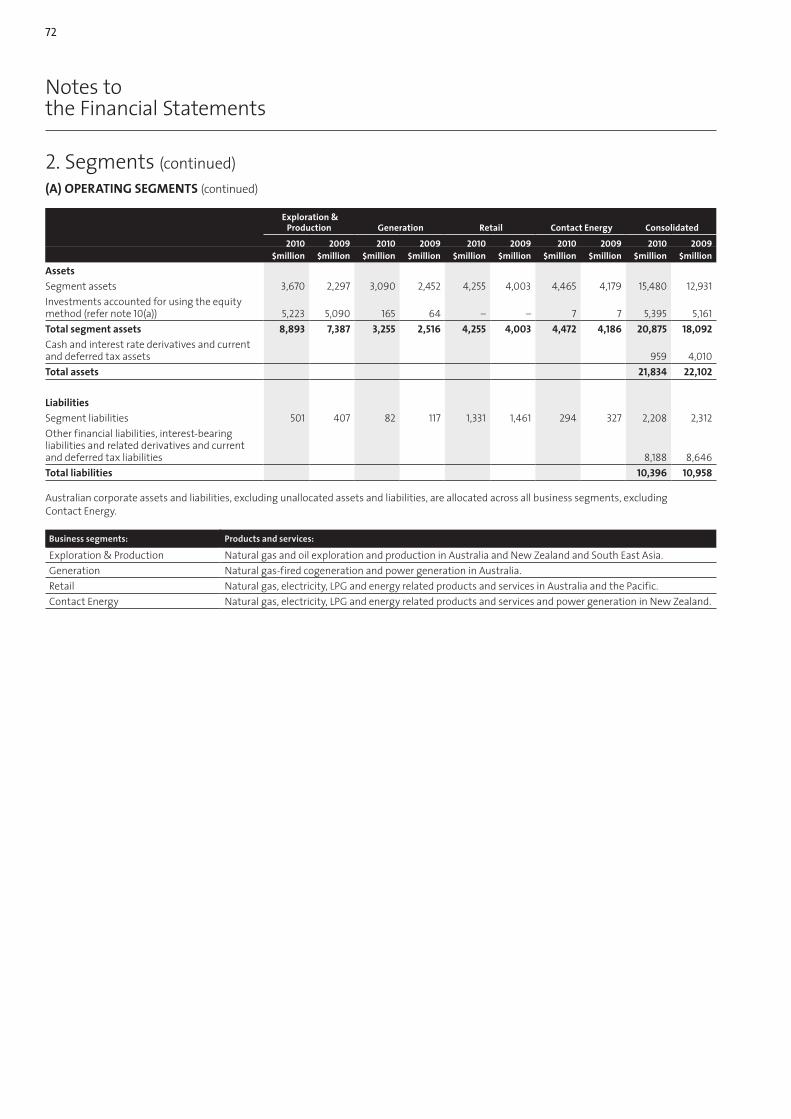
72
Notes to the Financial Statements
2. Segments (continued)
(A) OPERATING SEGmENTS (continued)
Exploration & Production Generation Retail contact Energy consolidated
2010 2009 2010 2009 2010 2009 2010 2009 2010 2009$million $million $million $million $million $million $million $million $million $million
Assets
Segment assets 3,670 2,297 3,090 2,452 4,255 4,003 4,465 4,179 15,480 12,931
Investments accounted for using the equity method (refer note 10(a)) 5,223 5,090 165 64 – – 7 7 5,395 5,161
Total segment assets 8,893 7,387 3,255 2,516 4,255 4,003 4,472 4,186 20,875 18,092
Cash and interest rate derivatives and current and deferred tax assets 959 4,010
Total assets 21,834 22,102
Liabilities
Segment liabilities 501 407 82 117 1,331 1,461 294 327 2,208 2,312
Other financial liabilities, interest-bearing liabilities and related derivatives and current and deferred tax liabilities 8,188 8,646
Total liabilities 10,396 10,958
Australian corporate assets and liabilities, excluding unallocated assets and liabilities, are allocated across all business segments, excluding Contact Energy.
Business segments: Products and services:
Exploration & Production Natural gas and oil exploration and production in Australia and New Zealand and South East Asia.
Generation Natural gas-fired cogeneration and power generation in Australia.
Retail Natural gas, electricity, LPG and energy related products and services in Australia and the Pacific.
Contact Energy Natural gas, electricity, LPG and energy related products and services and power generation in New Zealand.
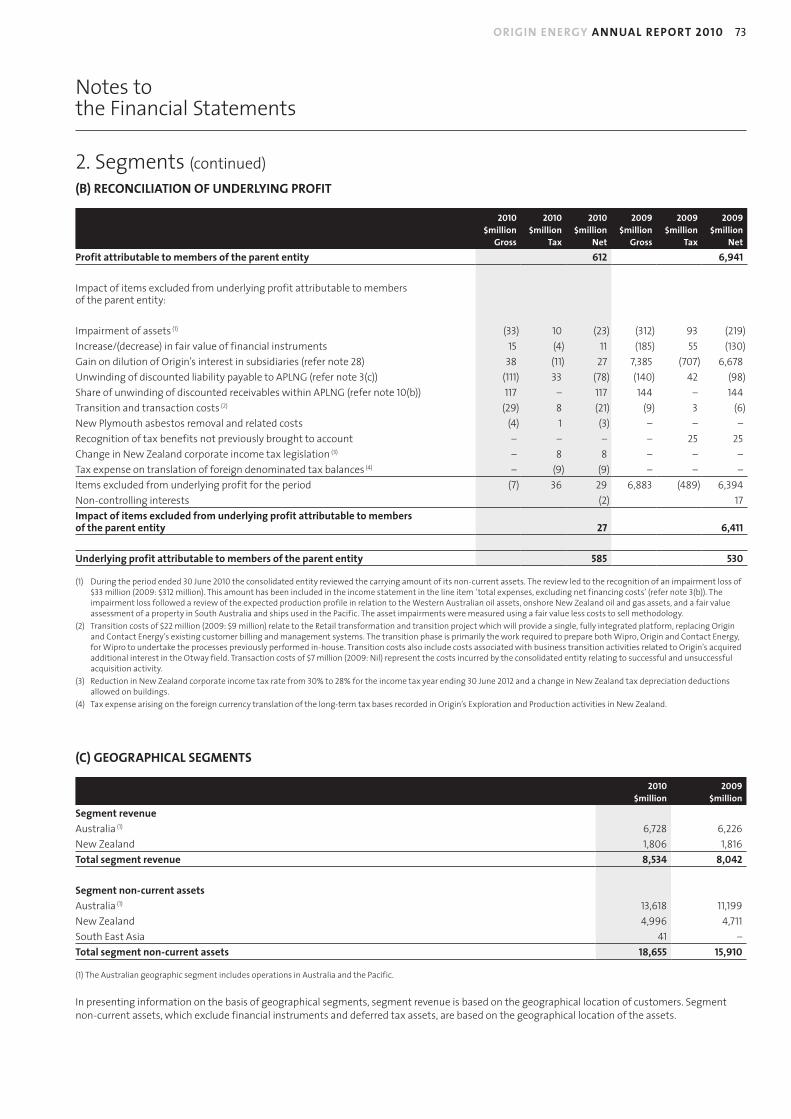
ORIGIN ENERGY ANNUAL REPORT 2010 73
Notes to the Financial Statements
2. Segments (continued)
(B) REcONcILIATION Of UNdERLYING PROfIT
2010 2010 2010 2009 2009 2009$million $million $million $million $million $million
Gross Tax Net Gross Tax Net
Profit attributable to members of the parent entity 612 6,941
Impact of items excluded from underlying profit attributable to members of the parent entity:
Impairment of assets (1) (33) 10 (23) (312) 93 (219)
Increase/(decrease) in fair value of financial instruments 15 (4) 11 (185) 55 (130)
Gain on dilution of Origin’s interest in subsidiaries (refer note 28) 38 (11) 27 7,385 (707) 6,678
Unwinding of discounted liability payable to APLNG (refer note 3(c)) (111) 33 (78) (140) 42 (98)
Share of unwinding of discounted receivables within APLNG (refer note 10(b)) 117 – 117 144 – 144
Transition and transaction costs (2) (29) 8 (21) (9) 3 (6)
New Plymouth asbestos removal and related costs (4) 1 (3) – – –
Recognition of tax benefits not previously brought to account – – – – 25 25
Change in New Zealand corporate income tax legislation (3) – 8 8 – – –
Tax expense on translation of foreign denominated tax balances (4) – (9) (9) – – –
Items excluded from underlying profit for the period (7) 36 29 6,883 (489) 6,394
Non-controlling interests (2) 17
Impact of items excluded from underlying profit attributable to members of the parent entity 27 6,411
Underlying profit attributable to members of the parent entity 585 530
(1) During the period ended 30 June 2010 the consolidated entity reviewed the carrying amount of its non-current assets. The review led to the recognition of an impairment loss of $33 million (2009: $312 million). This amount has been included in the income statement in the line item ‘total expenses, excluding net financing costs’ (refer note 3(b)). The impairment loss followed a review of the expected production profile in relation to the Western Australian oil assets, onshore New Zealand oil and gas assets, and a fair value assessment of a property in South Australia and ships used in the Pacific. The asset impairments were measured using a fair value less costs to sell methodology.
(2) Transition costs of $22 million (2009: $9 million) relate to the Retail transformation and transition project which will provide a single, fully integrated platform, replacing Origin and Contact Energy’s existing customer billing and management systems. The transition phase is primarily the work required to prepare both Wipro, Origin and Contact Energy, for Wipro to undertake the processes previously performed in-house. Transition costs also include costs associated with business transition activities related to Origin’s acquired additional interest in the Otway field. Transaction costs of $7 million (2009: Nil) represent the costs incurred by the consolidated entity relating to successful and unsuccessful acquisition activity.
(3) Reduction in New Zealand corporate income tax rate from 30% to 28% for the income tax year ending 30 June 2012 and a change in New Zealand tax depreciation deductions allowed on buildings.
(4) Tax expense arising on the foreign currency translation of the long-term tax bases recorded in Origin’s Exploration and Production activities in New Zealand.
(c) GEOGRAPhIcAL SEGmENTS
2010 2009$million $million
Segment revenue
Australia (1) 6,728 6,226
New Zealand 1,806 1,816
Total segment revenue 8,534 8,042
Segment non-current assets
Australia (1) 13,618 11,199
New Zealand 4,996 4,711
South East Asia 41 –
Total segment non-current assets 18,655 15,910
(1) The Australian geographic segment includes operations in Australia and the Pacific.
In presenting information on the basis of geographical segments, segment revenue is based on the geographical location of customers. Segment non-current assets, which exclude financial instruments and deferred tax assets, are based on the geographical location of the assets.

74
Notes to the Financial Statements
3. Profit 2010 2009
Note $million $million
(A) OThER INcOmEDividends received from other parties 1 1
Net gain on sale of other assets 4 1
Net foreign exchange gain 4 2
Government grants/subsidies 1 1
Gain on dilution of Origin’s interest in subsidiaries 38 7,385
Other 8 12
Total other income 56 7,402
(B) TOTAL ExPENSES, ExcLUdING NET fINANcING cOSTSRaw materials and consumables used, and changes in finished goods and work in progress (6,340) (6,042)
Labour related expenses 20 (449) (404)
Exploration expense (45) (40)
Depreciation and amortisation expense (408) (369)
Impairment of assets (refer 2(b)) (33) (312)
Increase/(decrease) in fair value of financial instruments 15 (185)
Other expenses (474) (422)
Total expenses, excluding net financing costs (7,734) (7,774)
(c) NET fINANcING cOSTSInterest income
Other parties 113 137
113 137
Interest expense
Other parties (108) (150)
Unwinding of discount on restoration provisions (18) (19)
Unwinding of discounted liability payable to APLNG (item excluded from underlying profit, refer note 2(b)) (111) (140)
(237) (309)
Net financing costs (124) (172)
Net financing costs excluding unwinding of discounted liability payable to APLNG (13) (32)
financing costs capitalised 156 120
Capitalised interest is calculated at an average rate based on the general borrowings of the consolidated entity (2010: 5.75%, 2009: 6.91%).

ORIGIN ENERGY ANNUAL REPORT 2010 75
Notes to the Financial Statements
4. Income tax expense2010 2009
$million $million
Current tax (benefit)/ expense (71) 671
Deferred tax expense 279 29
Over provided in prior years (12) (28)
Total income tax expense in the income statement 196 672
Reconciliation between tax expense and pre-tax net profit
Profit before income tax 876 7,670
Income tax using the domestic corporation tax rate of 30% (2009: 30%)
Prima facie income tax expense on pre-tax accounting profit:
– at Australian tax rate of 30% 263 2,301
– adjustment for difference between Australian and overseas tax rates 3 –
Income tax expense on pre-tax accounting profit at standard rates 266 2,301
Increase/(decrease) in income tax expense due to:
Share of profits of associates (41) (48)
Dilution of Origin’s interest in subsidiaries – (1,508)
Recognition of tax benefits not previously brought to account – (25)
Recognition of change in net tax loss position (23) (14)
Other 6 (6)
(58) (1,601)
Over provided in prior years – current and deferred (12) (28)
Income tax expense on pre-tax net profit 196 672
deferred tax movements recognised directly in equity
Fair value of available-for-sale financial assets (3) (4)
Financial instruments at fair value (including foreign currency translation) 2 (134)
Property, plant and equipment (including foreign currency translation) 5 7
Other items (including foreign currency translation) 3 (3)
7 (134)
2010 2010 2010 2009 2009 2009$million $million $million $million $million $million
Gross Tax Net Gross Tax Net
Income tax expense recognised in other comprehensive income
Available for sale assets:
Valuation loss taken to equity (11) 3 (8) (13) 4 (9)
Cash flow hedges:
Losses/(gains) transferred to income statement 199 (60) 139 (22) 6 (16)
Transferred to carrying amount of assets 8 (2) 6 (22) 6 (16)
Foreign currency translation gain 2 – 2 13 – 13
Valuation loss taken to equity (194) 58 (136) (391) 119 (272)
Share of decrease in hedging reserves attributable to equity accounted investees – – – (1) – (1)
Net loss on hedge of net investment in foreign operations (3) – (3) (5) – (5)
Foreign currency translation differences for foreign operations – – – 30 – 30
Actuarial loss on defined benefit superannuation plan (3) 1 (2) (9) 3 (6)
Other comprehensive income for the period (2) – (2) (420) 138 (282)
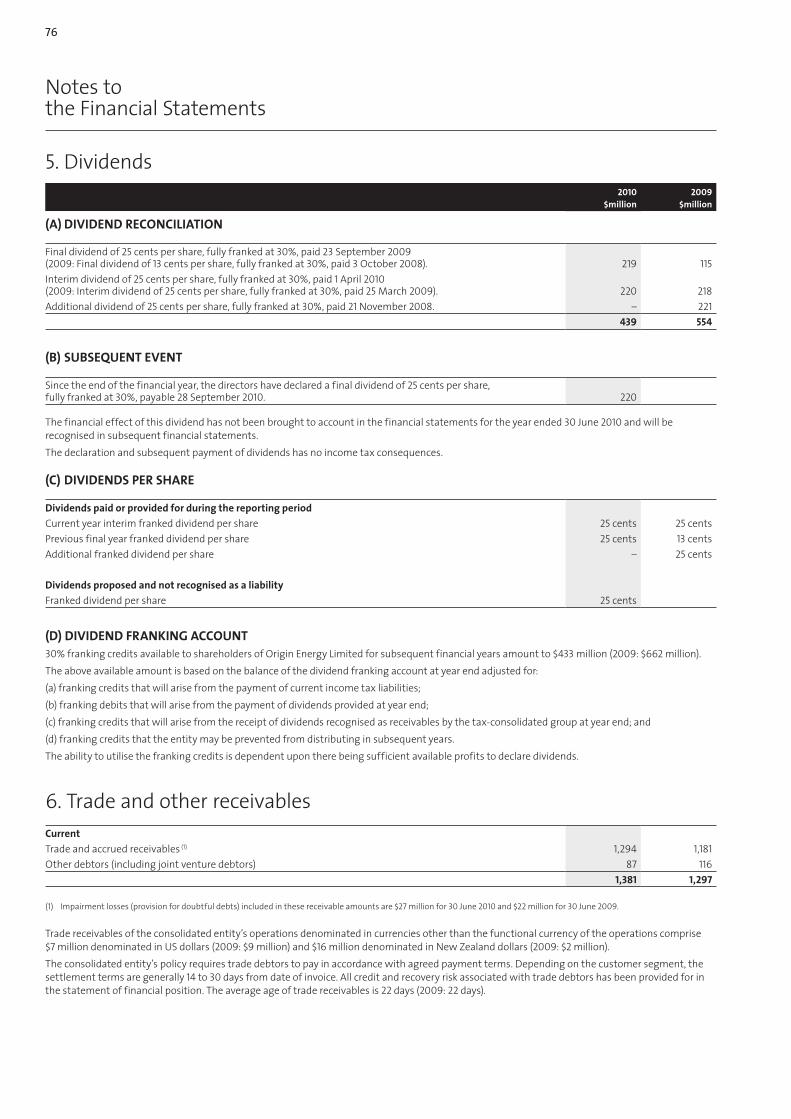
76
Notes to the Financial Statements
5. Dividends2010 2009
$million $million
(A) dIvIdENd REcONcILIATION
Final dividend of 25 cents per share, fully franked at 30%, paid 23 September 2009 (2009: Final dividend of 13 cents per share, fully franked at 30%, paid 3 October 2008). 219 115
Interim dividend of 25 cents per share, fully franked at 30%, paid 1 April 2010 (2009: Interim dividend of 25 cents per share, fully franked at 30%, paid 25 March 2009). 220 218
Additional dividend of 25 cents per share, fully franked at 30%, paid 21 November 2008. – 221
439 554
(B) SUBSEqUENT EvENT
Since the end of the financial year, the directors have declared a final dividend of 25 cents per share, fully franked at 30%, payable 28 September 2010. 220
The financial effect of this dividend has not been brought to account in the financial statements for the year ended 30 June 2010 and will be recognised in subsequent financial statements.
The declaration and subsequent payment of dividends has no income tax consequences.
(c) dIvIdENdS PER ShARE
dividends paid or provided for during the reporting period
Current year interim franked dividend per share 25 cents 25 cents
Previous final year franked dividend per share 25 cents 13 cents
Additional franked dividend per share – 25 cents
dividends proposed and not recognised as a liability
Franked dividend per share 25 cents
(d) dIvIdENd fRANKING AccOUNT30% franking credits available to shareholders of Origin Energy Limited for subsequent financial years amount to $433 million (2009: $662 million).
The above available amount is based on the balance of the dividend franking account at year end adjusted for:
(a) franking credits that will arise from the payment of current income tax liabilities;
(b) franking debits that will arise from the payment of dividends provided at year end;
(c) franking credits that will arise from the receipt of dividends recognised as receivables by the tax-consolidated group at year end; and
(d) franking credits that the entity may be prevented from distributing in subsequent years.
The ability to utilise the franking credits is dependent upon there being sufficient available profits to declare dividends.
6. Trade and other receivablescurrent
Trade and accrued receivables (1) 1,294 1,181
Other debtors (including joint venture debtors) 87 116
1,381 1,297
(1) Impairment losses (provision for doubtful debts) included in these receivable amounts are $27 million for 30 June 2010 and $22 million for 30 June 2009.
Trade receivables of the consolidated entity’s operations denominated in currencies other than the functional currency of the operations comprise $7 million denominated in US dollars (2009: $9 million) and $16 million denominated in New Zealand dollars (2009: $2 million).
The consolidated entity’s policy requires trade debtors to pay in accordance with agreed payment terms. Depending on the customer segment, the settlement terms are generally 14 to 30 days from date of invoice. All credit and recovery risk associated with trade debtors has been provided for in the statement of financial position. The average age of trade receivables is 22 days (2009: 22 days).

ORIGIN ENERGY ANNUAL REPORT 2010 77
Notes to the Financial Statements
7. Inventories
Note 2010 2009
$million $million
Raw materials and stores at cost 69 71
Finished goods at cost 70 81
Inventory gas 38 –
177 152
8. Other assetscurrent
Prepayments 114 52
Deposits 15 22
Other 10 4
139 78
Non-current
Prepayments 38 18
Other 2 2
40 20
9. Other financial assets, including derivativescurrent
Derivative financial instruments 27 361 453
Available-for-sale financial assets 5 10
Environmental scheme certificates 95 88
Other financial assets 10 –
471 551
Non-current
Derivative financial instruments 27 53 108
Environmental scheme certificates 131 –
Available-for-sale financial assets:
Listed shares 7 17
Investments held in other corporations 3 3
10 20
194 128
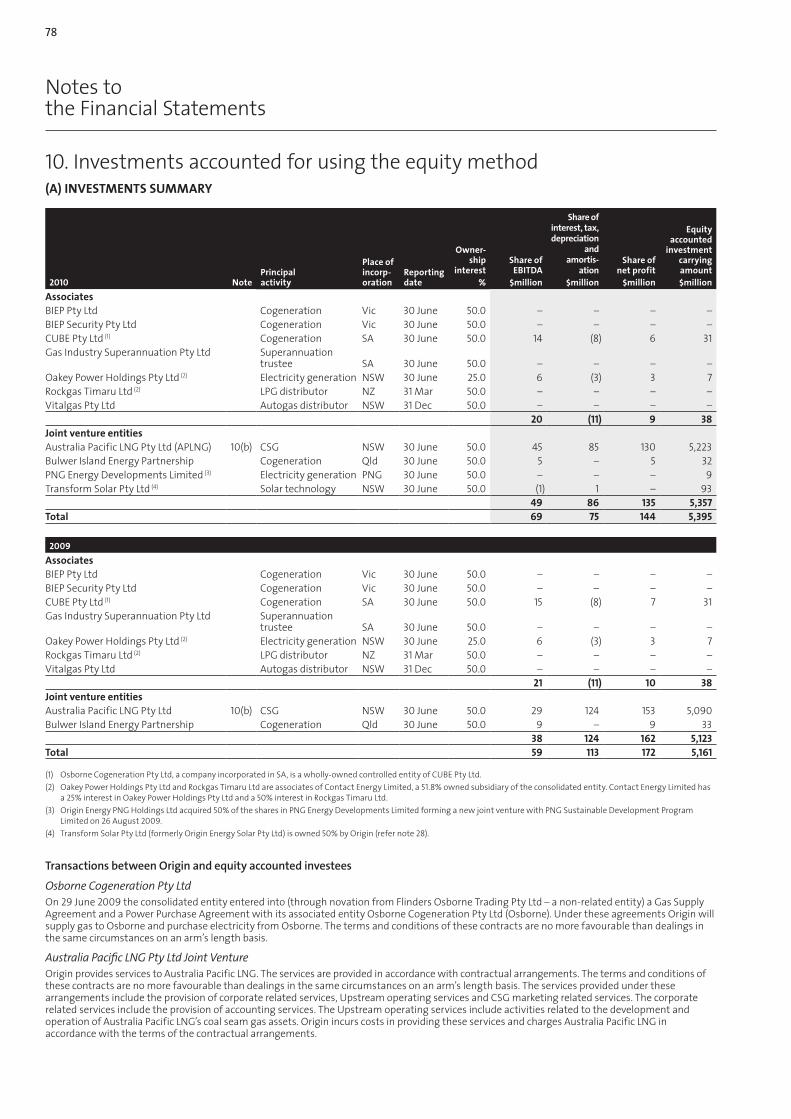
78
Notes to the Financial Statements
10. Investments accounted for using the equity method(A) INvESTmENTS SUmmARY
NotePrincipal activity
Place of incorp-oration
Reporting date
Owner-ship
interestShare of
EBITdA
Share of interest, tax, depreciation
and amortis-
ationShare of
net profit
Equity accounted
investment carrying amount
2010 % $million $million $million $million
AssociatesBIEP Pty Ltd Cogeneration Vic 30 June 50.0 – – – – BIEP Security Pty Ltd Cogeneration Vic 30 June 50.0 – – – – CUBE Pty Ltd (1) Cogeneration SA 30 June 50.0 14 (8) 6 31 Gas Industry Superannuation Pty Ltd Superannuation
trustee SA 30 June 50.0 – – – – Oakey Power Holdings Pty Ltd (2) Electricity generation NSW 30 June 25.0 6 (3) 3 7 Rockgas Timaru Ltd (2) LPG distributor NZ 31 Mar 50.0 – – – – Vitalgas Pty Ltd Autogas distributor NSW 31 Dec 50.0 – – – –
20 (11) 9 38 Joint venture entitiesAustralia Pacific LNG Pty Ltd (APLNG) 10(b) CSG NSW 30 June 50.0 45 85 130 5,223 Bulwer Island Energy Partnership Cogeneration Qld 30 June 50.0 5 – 5 32 PNG Energy Developments Limited (3) Electricity generation PNG 30 June 50.0 – – – 9 Transform Solar Pty Ltd (4) Solar technology NSW 30 June 50.0 (1) 1 – 93
49 86 135 5,357 Total 69 75 144 5,395
2009
AssociatesBIEP Pty Ltd Cogeneration Vic 30 June 50.0 – – – – BIEP Security Pty Ltd Cogeneration Vic 30 June 50.0 – – – – CUBE Pty Ltd (1) Cogeneration SA 30 June 50.0 15 (8) 7 31 Gas Industry Superannuation Pty Ltd Superannuation
trustee SA 30 June 50.0 – – – – Oakey Power Holdings Pty Ltd (2) Electricity generation NSW 30 June 25.0 6 (3) 3 7 Rockgas Timaru Ltd (2) LPG distributor NZ 31 Mar 50.0 – – – – Vitalgas Pty Ltd Autogas distributor NSW 31 Dec 50.0 – – – –
21 (11) 10 38 Joint venture entitiesAustralia Pacific LNG Pty Ltd 10(b) CSG NSW 30 June 50.0 29 124 153 5,090 Bulwer Island Energy Partnership Cogeneration Qld 30 June 50.0 9 – 9 33
38 124 162 5,123 Total 59 113 172 5,161
(1) Osborne Cogeneration Pty Ltd, a company incorporated in SA, is a wholly-owned controlled entity of CUBE Pty Ltd.
(2) Oakey Power Holdings Pty Ltd and Rockgas Timaru Ltd are associates of Contact Energy Limited, a 51.8% owned subsidiary of the consolidated entity. Contact Energy Limited has a 25% interest in Oakey Power Holdings Pty Ltd and a 50% interest in Rockgas Timaru Ltd.
(3) Origin Energy PNG Holdings Ltd acquired 50% of the shares in PNG Energy Developments Limited forming a new joint venture with PNG Sustainable Development Program Limited on 26 August 2009.
(4) Transform Solar Pty Ltd (formerly Origin Energy Solar Pty Ltd) is owned 50% by Origin (refer note 28).
TransactionsbetweenOriginandequityaccountedinvestees
OsborneCogenerationPtyLtdOn 29 June 2009 the consolidated entity entered into (through novation from Flinders Osborne Trading Pty Ltd – a non-related entity) a Gas Supply Agreement and a Power Purchase Agreement with its associated entity Osborne Cogeneration Pty Ltd (Osborne). Under these agreements Origin will supply gas to Osborne and purchase electricity from Osborne. The terms and conditions of these contracts are no more favourable than dealings in the same circumstances on an arm’s length basis.
AustraliaPacificLNGPtyLtdJointVentureOrigin provides services to Australia Pacific LNG. The services are provided in accordance with contractual arrangements. The terms and conditions of these contracts are no more favourable than dealings in the same circumstances on an arm’s length basis. The services provided under these arrangements include the provision of corporate related services, Upstream operating services and CSG marketing related services. The corporate related services include the provision of accounting services. The Upstream operating services include activities related to the development and operation of Australia Pacific LNG’s coal seam gas assets. Origin incurs costs in providing these services and charges Australia Pacific LNG in accordance with the terms of the contractual arrangements.
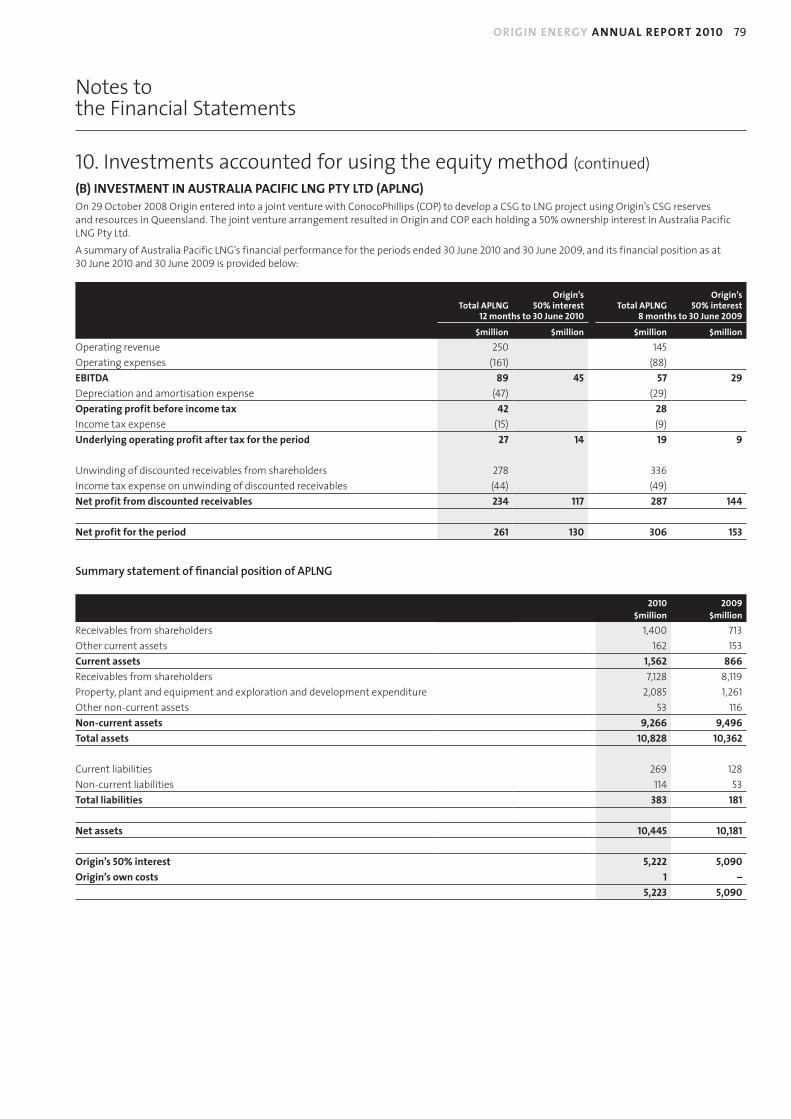
ORIGIN ENERGY ANNUAL REPORT 2010 79
Notes to the Financial Statements
10. Investments accounted for using the equity method (continued)
(B) INvESTmENT IN AUSTRALIA PAcIfIc LNG PTY LTd (APLNG)On 29 October 2008 Origin entered into a joint venture with ConocoPhillips (COP) to develop a CSG to LNG project using Origin’s CSG reserves and resources in Queensland. The joint venture arrangement resulted in Origin and COP each holding a 50% ownership interest in Australia Pacific LNG Pty Ltd.
A summary of Australia Pacific LNG’s financial performance for the periods ended 30 June 2010 and 30 June 2009, and its financial position as at 30 June 2010 and 30 June 2009 is provided below:
Total APLNGOrigin’s
50% interest Total APLNGOrigin’s
50% interest12 months to 30 June 2010 8 months to 30 June 2009
$million $million $million $million
Operating revenue 250 145
Operating expenses (161) (88)
EBITdA 89 45 57 29
Depreciation and amortisation expense (47) (29)
Operating profit before income tax 42 28
Income tax expense (15) (9)
Underlying operating profit after tax for the period 27 14 19 9
Unwinding of discounted receivables from shareholders 278 336
Income tax expense on unwinding of discounted receivables (44) (49)
Net profit from discounted receivables 234 117 287 144
Net profit for the period 261 130 306 153
SummarystatementoffinancialpositionofAPLNG
2010 2009$million $million
Receivables from shareholders 1,400 713
Other current assets 162 153
current assets 1,562 866
Receivables from shareholders 7,128 8,119
Property, plant and equipment and exploration and development expenditure 2,085 1,261
Other non-current assets 53 116
Non-current assets 9,266 9,496
Total assets 10,828 10,362
Current liabilities 269 128
Non-current liabilities 114 53
Total liabilities 383 181
Net assets 10,445 10,181
Origin’s 50% interest 5,222 5,090
Origin’s own costs 1 –
5,223 5,090

80
Notes to the Financial Statements
10. Investments accounted for using the equity method (continued)
(c) INvESTmENTS IN ASSOcIATES
2010 2009$million $million
Results of associates
100% of associates’ revenues 117 122
100% of associates’ net profit 25 25
Summaryofstatementoffinancialpositionofassociates
Assets and liabilities of associates, not adjusted for percentage ownership held by the consolidated entity are as follows:
Current assets 35 30
Non-current assets 211 230
Total assets 246 260
Current liabilities 39 26
Non-current liabilities 117 145
Total liabilities 156 171
Net assets 90 89
(d) INvESTmENTS IN JOINT vENTURE ENTITIES
Results of joint venture entities
100% of joint venture entities’ revenues 285 179
100% of joint venture entities’ net profit 269 322
Summaryofstatementoffinancialpositionofjointventureentities
Assets and liabilities of joint venture entities, not adjusted for percentage ownership held by the consolidated entity are as follows:
Current assets 1,594 873
Non-current assets 9,473 9,559
Total assets 11,067 10,432
Current liabilities 306 132
Non-current liabilities 118 53
Total liabilities 424 185
Net assets 10,643 10,247

ORIGIN ENERGY ANNUAL REPORT 2010 81
Notes to the Financial Statements
11. Property, plant and equipment2010 2009
$million $million
Generation property, plant and equipment
At cost 5,295 4,705
Less: Accumulated depreciation 787 627
4,508 4,078
Other land and buildings
At cost 126 121
Less: Accumulated depreciation and amortisation 21 19
105 102
Other plant and equipment
At cost 4,803 3,389
Less: Accumulated depreciation 1,069 976
3,734 2,413
Producing areas of interest
At cost 1,441 1,002
Less: Accumulated amortisation 620 577
821 425
9,168 7,018
Reconciliations
Reconciliations of the carrying amounts of each class of property, plant and equipment are set out below:
2010$million
Generation property, plant and
equipmentOther land
and buildings
Other plant and
equipment
Producing areas of interest Total
Carrying amount at the beginning of the period 4,078 102 2,413 425 7,018
Additions 375 13 764 144 1,296
Additions through acquisition of entities/operations – 8 387 151 546
Disposals – (3) – – (3)
Depreciation/amortisation expense (144) (3) (149) (93) (389)
Impairment loss (refer note 2(b)) – (4) (4) (25) (33)
Transfers including (to)/from exploration and development expenditure 170 (6) 297 222 683
Dilution resulting from Transform Solar transaction – (1) (2) – (3)
Effect of movements in foreign exchange rates 29 (1) 28 (3) 53
carrying amount at the end of the period 4,508 105 3,734 821 9,168
2009$million
Carrying amount at the beginning of the period 3,083 67 2,314 866 6,330
Additions 712 14 1,016 66 1,808
Additions through acquisition of entities/operations 401 6 – – 407
Disposals – – (1) – (1)
Depreciation/amortisation expense (135) (3) (104) (93) (335)
Impairment loss (refer note 2(b)) – – (256) (5) (261)
Transfers including (to)/from exploration and development expenditure (28) 33 (5) – –
Dilution resulting from APLNG transaction – (12) (550) (412) (974)
Effect of movements in foreign exchange rates 45 (3) (1) 3 44
carrying amount at the end of the period 4,078 102 2,413 425 7,018

82
Notes to the Financial Statements
12. Exploration, evaluation and development expenditure2010 2009
$million $million
Exploration and evaluation expenditure
Net costs carried forward in respect of areas of interest in the exploration and evaluation phase 1,039 199
development expenditure
Net costs carried forward in respect of areas of interest in the development phase 76 755
13. Intangible assetsGoodwill at cost 2,599 2,584
Customer related and other intangible assets at cost 356 295
Less: Accumulated amortisation 159 142
197 153
2,796 2,737
class of asset Average amortisation rate
Customer related and other intangible assets at cost 15% 15%
Reconciliations
Reconciliations of the carrying amounts of each class of intangible asset are set out below:
2010$million
Goodwill
customer related and
other intangibles Total
Carrying amount at the beginning of the period 2,584 153 2,737
Additions through business combinations 10 21 31
Other additions – 56 56
Amortisation expense – (17) (17)
Dilution resulting from Transform Solar transaction – (16) (16)
Effect of movements in foreign exchange rates 5 – 5
carrying amount at the end of the period 2,599 197 2,796
2009$million
Carrying amount at the beginning of the period 2,410 126 2,536
Additions through business combinations and internal development 167 109 276
Amortisation expense – (32) (32)
Impairment expense – (50) (50)
Effect of movements in foreign exchange rates 7 – 7
carrying amount at the end of the period 2,584 153 2,737

ORIGIN ENERGY ANNUAL REPORT 2010 83
Notes to the Financial Statements
13. Intangible assets (continued)
Impairmenttestsforcash-generatingunitscontaininggoodwill
The following cash-generating units have significant carrying amounts of goodwill:
2010 2009$million $million
Retail 1,961 1,950
Contact Energy 442 438
Generation 193 193
Other 3 3
2,599 2,584
Retailcash-generatingunit
The impairment test for the Retail unit’s goodwill is based on a value in use methodology. The value in use calculations apply a discounted cash flow methodology. Cash flow projections are based on Origin Energy’s five-year business plan for the underlying Retail business and cash flows for a further 35-year period are determined based on expected market trends and the expected impact of the key assumptions (discussed below) of the change in customer numbers and customer churn, gross margin per customer and other operating costs per customer. Origin Energy’s electricity and gas business is considered a long-term business and the cash flow projections allow for the risk of increased competition for customers and short-term and long-term customer churn. The cash flow projections are discounted using a pre-tax discount rate of 12.2% (2009: 11.6%).
Key assumptions in the value in use calculation for the Retail cash-generating unit and the approach to determining the value in the current and previous period are:
Assumptions method of determination
customer numbers and customer churn Review of actual customer numbers and historical data regarding movements in customer numbers and levels of customer churn. The historical analysis is considered against current and expected market trends and competition for customers.
Gross margin per customer Review of actual gross margins per customer and consideration of current and expected market movements and impacts.
Other operating costs per customer Review of actual operating costs per customer and consideration of current and expected market movements and impacts.
ContactEnergycash-generatingunit
The Contact Energy goodwill relates to Origin Energy’s acquired 51.8% ownership interest in Contact Energy Limited. The impairment test for the Contact Energy goodwill is based on a fair value less costs to sell methodology. Contact Energy is listed on the New Zealand Stock Exchange and Origin Energy uses the share price of Contact Energy shares to determine the recoverable amount of its investment in Contact Energy and the Contact Energy goodwill.
Generationcash-generatingunit
The impairment test for the Generation unit’s goodwill is based on value in use methodology. The value in use calculations apply a discounted cash flow methodology. Cash flow projections are based on Origin Energy’s five-year business plan for the underlying Generation business and cash flows out to the expected life of each asset. The cash flow projections are discounted using a pre-tax discount rate of 12.2% (2009: 12.1%).
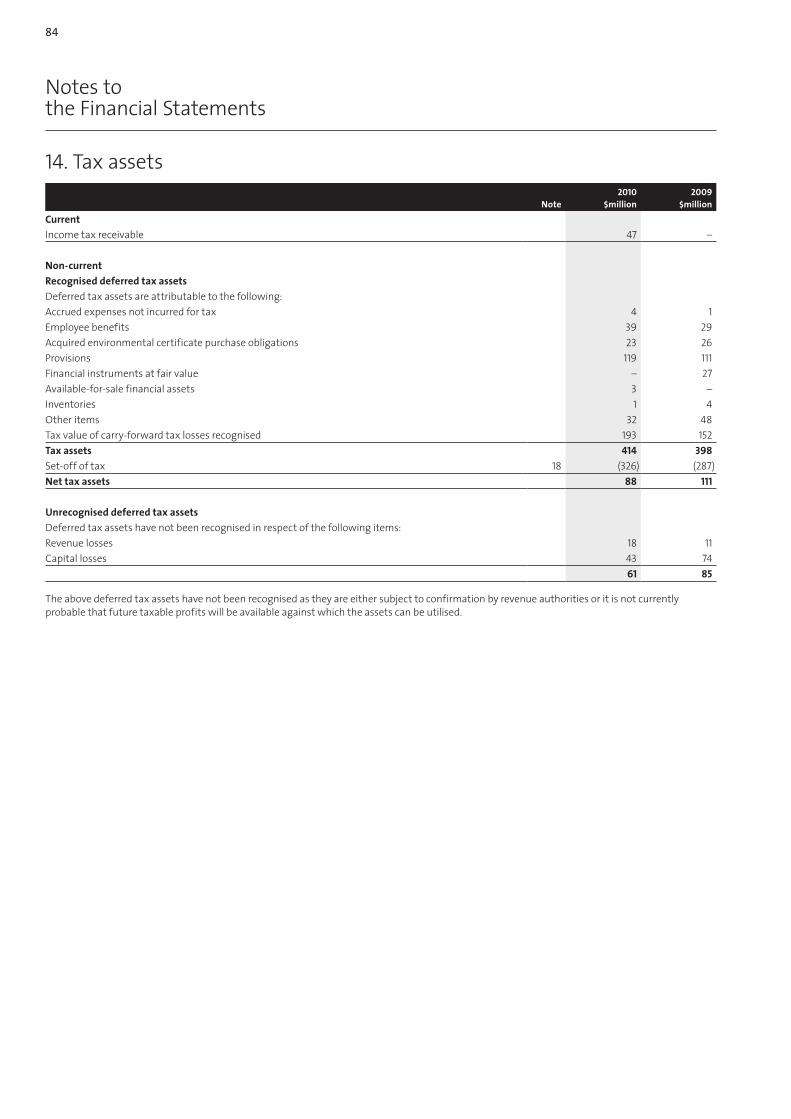
84
Notes to the Financial Statements
14. Tax assets
Note2010 2009
$million $million
current
Income tax receivable 47 –
Non-current
Recognised deferred tax assets
Deferred tax assets are attributable to the following:
Accrued expenses not incurred for tax 4 1
Employee benefits 39 29
Acquired environmental certificate purchase obligations 23 26
Provisions 119 111
Financial instruments at fair value – 27
Available-for-sale financial assets 3 –
Inventories 1 4
Other items 32 48
Tax value of carry-forward tax losses recognised 193 152
Tax assets 414 398
Set-off of tax 18 (326) (287)
Net tax assets 88 111
Unrecognised deferred tax assets
Deferred tax assets have not been recognised in respect of the following items:
Revenue losses 18 11
Capital losses 43 74
61 85
The above deferred tax assets have not been recognised as they are either subject to confirmation by revenue authorities or it is not currently probable that future taxable profits will be available against which the assets can be utilised.

ORIGIN ENERGY ANNUAL REPORT 2010 85
Notes to the Financial Statements
14. Tax assets (continued)
Movementintemporarydifferencesduringtheyear
2010$million
Opening balance
Recognised in income
Recognised in other
comprehensive income
deconsolid-ation/
acquisition of controlled
entitiesclosing balance
Accrued expenses not incurred for tax 1 3 – – 4
Employee benefits 29 10 – – 39
Acquired environmental certificate purchase obligations 26 (3) – – 23
Provisions 111 8 – – 119
Financial instruments at fair value 27 (25) (2) – –
Available-for-sale financial assets – – 3 – 3
Inventories 4 (3) – – 1
Other items 48 (14) – (2) 32
Tax value of carry-forward tax losses recognised 152 43 (2) – 193
Tax assets 398 19 (1) (2) 414
Set-off of tax (287) (326)
Net tax assets 111 88
2009$million
Accrued expenses not incurred for tax 2 (1) – – 1
Employee benefits 27 2 – – 29
Acquired environmental certificate purchase obligations 31 (5) – – 26
Provisions 117 10 – (16) 111
Financial instruments at fair value – 27 – – 27
Inventories 17 (13) – – 4
Other items 19 29 – – 48
Tax value of carry-forward tax losses recognised 98 54 – – 152
Tax assets 311 103 – (16) 398
Set-off of tax (208) (287)
Net tax assets 103 111
15. Trade and other payables2010 2009
$million $million
current
Trade payables and accrued expenses 1,193 1,119
Acquired environmental certificate purchase obligations 12 13
1,205 1,132
Non-current
Other payables 2 2
Acquired environmental certificate purchase obligations 63 74
65 76
Trade payables of the consolidated entity’s operations denominated in currencies other than the functional currency of the operations comprise $1 million of trade payables denominated in New Zealand dollars (2009: $15 million), $2 million of trade payables denominated in Euros (2009: $3 million) and $9 million of trade payables denominated in US dollars (2009: $3 million).

86
Notes to the Financial Statements
16. Interest-bearing liabilities and lease liabilities 2010 2009
Note $million $million
Interest-bearingliabilitiescurrent
Bank loans – secured 13 12
Bank overdrafts – unsecured 23(a) 4 4
Capital market borrowings – unsecured 94 114
Loans from related parties – unsecured – 1
Lease liabilities – secured 2 1
113 132
Non-current
Capital market borrowings – unsecured 1,764 1,789
Bank loans – unsecured 1,293 1,381
Bank loans – secured 310 323
Lease liabilities – secured 6 1
3,373 3,494
Refer to note 27 for further information regarding interest-bearing liabilities.
Interest rates applicable to:
Borrowings including interest rate swap contracts: 2.75% to 7.80% per annum at a weighted average of 6.30% per annum (2009: 2.75% to 8.00% per annum at a weighted average of 5.91% per annum).
Refer to note 27(d) Financial risk factors – interest rate risk (cash flow and fair value), for a summary of interest rate risks.
Operating leases
Lease commitments in respect of operating leases are payable as follows:
Not later than one year 54 29
Later than one year but not later than five years 174 84
Later than five years 155 49
383 162
Operating lease rental expense 39 33
The consolidated entity leases property, plant and equipment under operating leases with terms of 1 to 10 years.
17. Other financial liabilities, including derivativescurrent
Derivative financial instruments 27 330 519
Environmental scheme surrender obligations 68 66
398 585
Non-current
Derivative financial instruments 27 249 298
Loan from APLNG joint venture associated entity 3,564 3,452
3,813 3,750

ORIGIN ENERGY ANNUAL REPORT 2010 87
Notes to the Financial Statements
18. Tax liabilities 2010 2009
Note $million $million
current
Provision for income tax 7 686
Non-current
Recognised deferred tax liabilities
Deferred tax liabilities are attributable to the following:
Property, plant and equipment 615 619
Exploration, evaluation and development expenditure 401 134
Financial instruments at fair value 9 –
Investments in associates 23 7
Unbilled receivables 132 117
Discounted receivables 4 37
Other items 43 19
Tax liabilities 1,227 933
Set-off of tax 14 (326) (287)
Net tax liabilities 901 646
At 30 June 2010 a deferred tax liability balance of $1,558 million (2009: $1,515 million) for temporary differences of $5,195 million (2009: $5,050 million) in respect of Origin’s investment in the Australia Pacific LNG joint venture has not been recognised as Origin is able to control the timing of the reversal of the temporary difference through voting rights prescribed in the shareholders agreement and it is not expected that the temporary difference will reverse in the foreseeable future.
Movementintemporarydifferencesduringtheyear
2010$million
Opening balance
Recognised in income
Recognised in other
comprehensive income
deconsolid-ation/
acquisition of controlled
entitiesclosing balance
Property, plant and equipment 619 (11) 5 2 615
Exploration, evaluation and development expenditure 134 267 – – 401
Financial instruments at fair value – 9 – – 9
Investments in associates 7 16 – – 23
Unbilled receivables 117 15 – – 132
Discounted receivables 37 (33) – – 4
Other items 19 23 1 – 43
deferred tax liabilities 933 286 6 2 1,227
Set-off of tax (287) (326)
Net deferred tax liabilities 646 901
2009$million
Property, plant and equipment 528 (3) 7 87 619
Exploration, evaluation and development expenditure 201 56 – (123) 134
Intangible assets 11 (11) – – –
Financial instruments at fair value 116 18 (134) – –
Available-for-sale financial assets 4 – (4) – –
Investments in associates 6 1 – – 7
Unbilled receivables 117 – – – 117
Discounted receivables – 37 – – 37
Other items 16 6 (3) – 19
deferred tax liabilities 999 104 (134) (36) 933
Set-off of tax (208) (287)
Net deferred tax liabilities 791 646
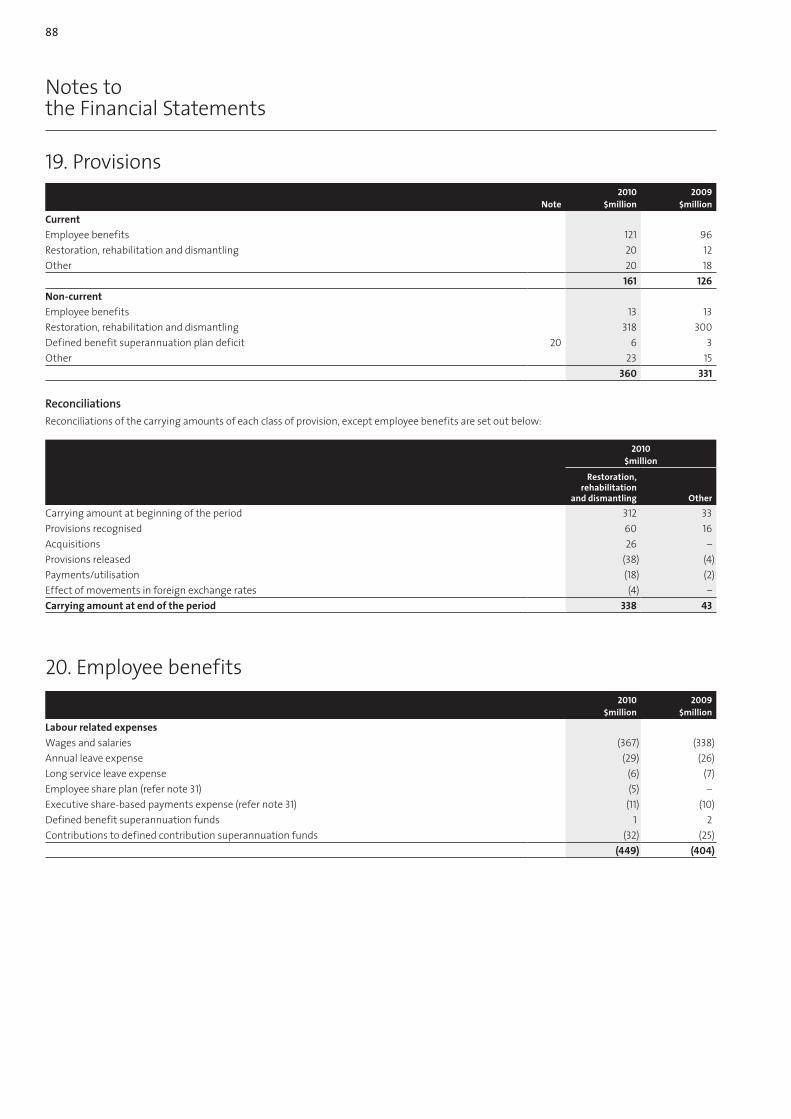
88
Notes to the Financial Statements
19. Provisions
Note2010 2009
$million $million
current
Employee benefits 121 96
Restoration, rehabilitation and dismantling 20 12
Other 20 18
161 126
Non-current
Employee benefits 13 13
Restoration, rehabilitation and dismantling 318 300
Defined benefit superannuation plan deficit 20 6 3
Other 23 15
360 331
Reconciliations
Reconciliations of the carrying amounts of each class of provision, except employee benefits are set out below:
2010$million
Restoration, rehabilitation
and dismantling Other
Carrying amount at beginning of the period 312 33
Provisions recognised 60 16
Acquisitions 26 –
Provisions released (38) (4)
Payments/utilisation (18) (2)
Effect of movements in foreign exchange rates (4) –
carrying amount at end of the period 338 43
20. Employee benefits2010 2009
$million $million
Labour related expenses
Wages and salaries (367) (338)
Annual leave expense (29) (26)
Long service leave expense (6) (7)
Employee share plan (refer note 31) (5) –
Executive share-based payments expense (refer note 31) (11) (10)
Defined benefit superannuation funds 1 2
Contributions to defined contribution superannuation funds (32) (25)
(449) (404)
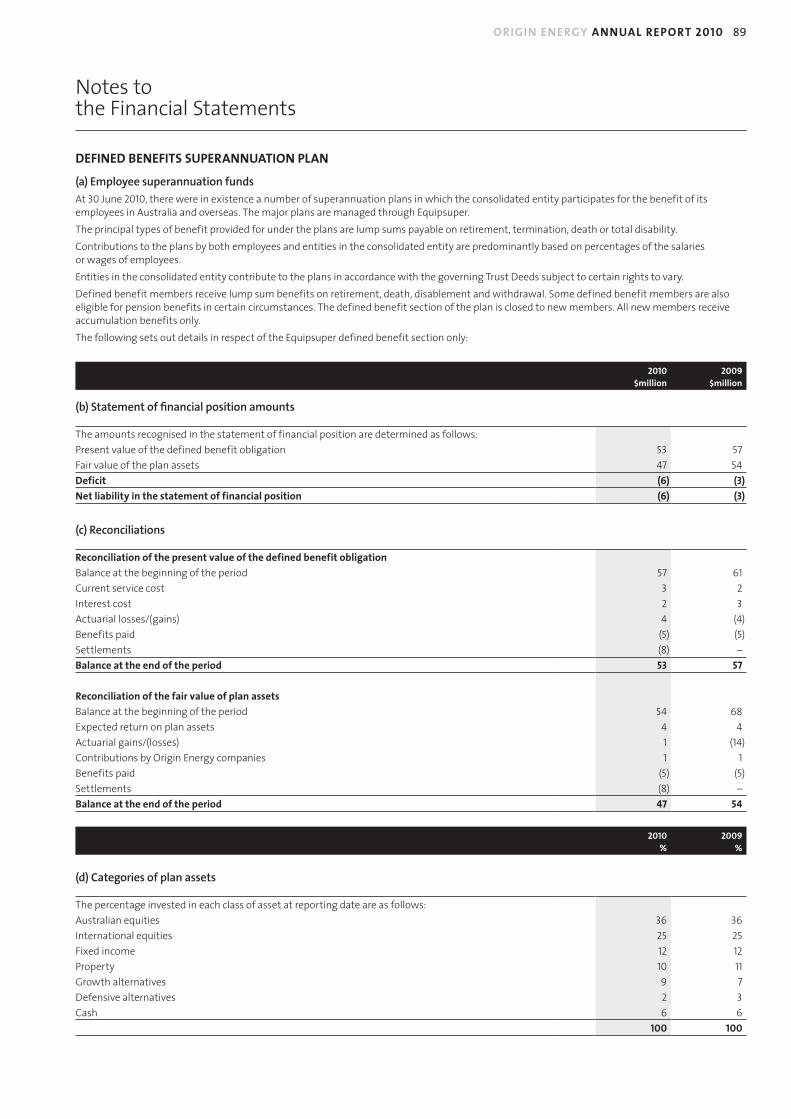
ORIGIN ENERGY ANNUAL REPORT 2010 89
Notes to the Financial Statements
dEfINEd BENEfITS SUPERANNUATION PLAN
(a)Employeesuperannuationfunds
At 30 June 2010, there were in existence a number of superannuation plans in which the consolidated entity participates for the benefit of its employees in Australia and overseas. The major plans are managed through Equipsuper.
The principal types of benefit provided for under the plans are lump sums payable on retirement, termination, death or total disability.
Contributions to the plans by both employees and entities in the consolidated entity are predominantly based on percentages of the salaries or wages of employees.
Entities in the consolidated entity contribute to the plans in accordance with the governing Trust Deeds subject to certain rights to vary.
Defined benefit members receive lump sum benefits on retirement, death, disablement and withdrawal. Some defined benefit members are also eligible for pension benefits in certain circumstances. The defined benefit section of the plan is closed to new members. All new members receive accumulation benefits only.
The following sets out details in respect of the Equipsuper defined benefit section only:
2010 2009$million $million
(b)Statementoffinancialpositionamounts
The amounts recognised in the statement of financial position are determined as follows:
Present value of the defined benefit obligation 53 57
Fair value of the plan assets 47 54
deficit (6) (3)
Net liability in the statement of financial position (6) (3)
(c)Reconciliations
Reconciliation of the present value of the defined benefit obligation
Balance at the beginning of the period 57 61
Current service cost 3 2
Interest cost 2 3
Actuarial losses/(gains) 4 (4)
Benefits paid (5) (5)
Settlements (8) –
Balance at the end of the period 53 57
Reconciliation of the fair value of plan assets
Balance at the beginning of the period 54 68
Expected return on plan assets 4 4
Actuarial gains/(losses) 1 (14)
Contributions by Origin Energy companies 1 1
Benefits paid (5) (5)
Settlements (8) –
Balance at the end of the period 47 54
2010 2009% %
(d)Categoriesofplanassets
The percentage invested in each class of asset at reporting date are as follows:
Australian equities 36 36
International equities 25 25
Fixed income 12 12
Property 10 11
Growth alternatives 9 7
Defensive alternatives 2 3
Cash 6 6
100 100
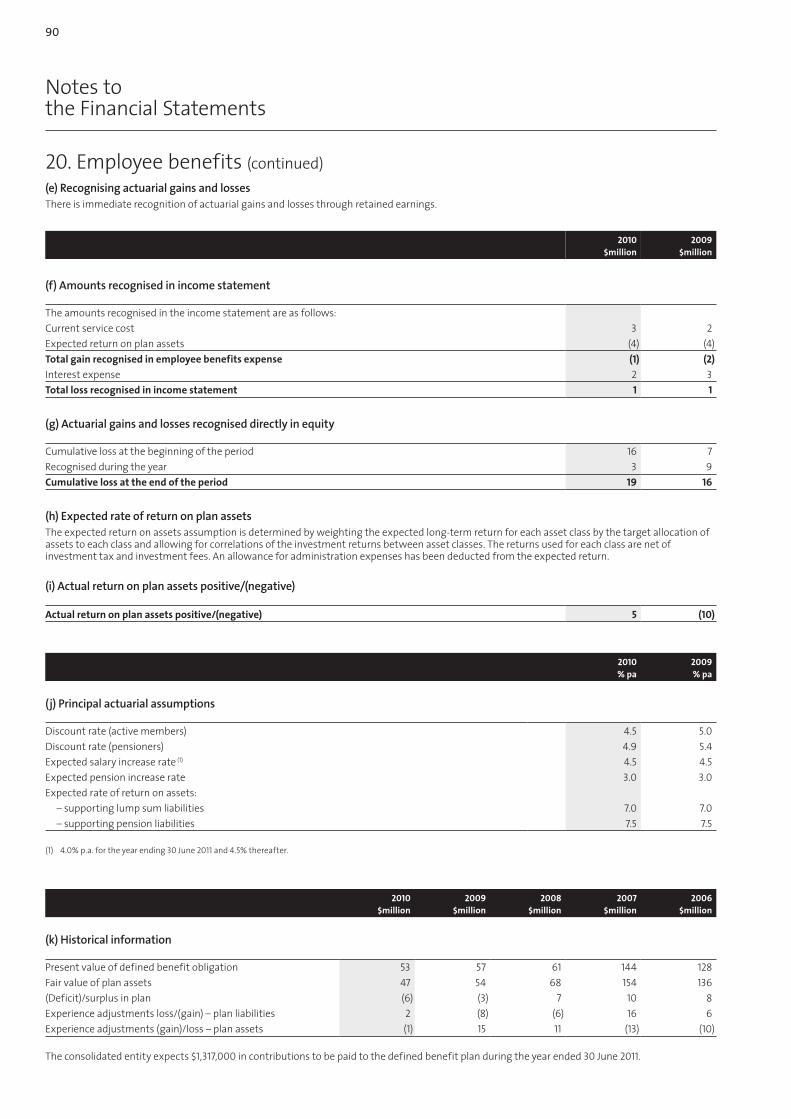
90
Notes to the Financial Statements
20. Employee benefits (continued)
(e)RecognisingactuarialgainsandlossesThere is immediate recognition of actuarial gains and losses through retained earnings.
2010 2009$million $million
(f)Amountsrecognisedinincomestatement
The amounts recognised in the income statement are as follows:
Current service cost 3 2
Expected return on plan assets (4) (4)
Total gain recognised in employee benefits expense (1) (2)
Interest expense 2 3
Total loss recognised in income statement 1 1
(g)Actuarialgainsandlossesrecogniseddirectlyinequity
Cumulative loss at the beginning of the period 16 7
Recognised during the year 3 9
cumulative loss at the end of the period 19 16
(h)ExpectedrateofreturnonplanassetsThe expected return on assets assumption is determined by weighting the expected long-term return for each asset class by the target allocation of assets to each class and allowing for correlations of the investment returns between asset classes. The returns used for each class are net of investment tax and investment fees. An allowance for administration expenses has been deducted from the expected return.
(i)Actualreturnonplanassetspositive/(negative)
Actual return on plan assets positive/(negative) 5 (10)
2010 2009% pa % pa
(j)Principalactuarialassumptions
Discount rate (active members) 4.5 5.0
Discount rate (pensioners) 4.9 5.4
Expected salary increase rate (1) 4.5 4.5
Expected pension increase rate 3.0 3.0
Expected rate of return on assets:
– supporting lump sum liabilities 7.0 7.0
– supporting pension liabilities 7.5 7.5
(1) 4.0% p.a. for the year ending 30 June 2011 and 4.5% thereafter.
2010 2009 2008 2007 2006$million $million $million $million $million
(k)Historicalinformation
Present value of defined benefit obligation 53 57 61 144 128
Fair value of plan assets 47 54 68 154 136
(Deficit)/surplus in plan (6) (3) 7 10 8
Experience adjustments loss/(gain) – plan liabilities 2 (8) (6) 16 6
Experience adjustments (gain)/loss – plan assets (1) 15 11 (13) (10)
The consolidated entity expects $1,317,000 in contributions to be paid to the defined benefit plan during the year ended 30 June 2011.

ORIGIN ENERGY ANNUAL REPORT 2010 91
Notes to the Financial Statements
21. Share capital
Note2010 2009
$million $million
Issued and paid-up capital
880,668,872 (2009: 874,382,081) ordinary shares, fully paid 1,683 1,604
Ordinary share capital at the beginning of the period 1,604 1,755
Shares issued:
• 2,113,200 (2009: 4,585,000) shares in accordance with the Senior Executive Option Plan 31(a) 13 25
• 4,106,271 (2009: 1,144,239) shares in accordance with the Dividend Reinvestment Plan 65 19
• 67,320 (2009: Nil) shares in accordance with the Employee Share Plan 1 –
• Nil (2009: 12,120,880) shares purchased via on-market buy-back at an average price of $Nil (2009: $16.11) (1) – (195)
Total movements in ordinary share capital 79 (151)
Ordinary share capital at the end of the period 1,683 1,604
(1) On 30 October 2008 Origin announced that it would commence an on market share buy back of its ordinary shares. As at 26 February 2009 Origin had purchased a total of 12,120,880 shares on-market at an average price of $16.11 for a total consideration of $195 million when it announced its election to terminate the on-market buy-back of its ordinary shares.
Termsandconditions
Holders of ordinary shares are entitled to receive dividends as declared from time to time and are entitled to one vote per share at shareholders’ meetings. In the event of the winding up of the company, ordinary shareholders rank after creditors, and are fully entitled to any proceeds of liquidation.
The company does not have authorised capital or par value in respect of its issued shares.

92
Notes to the Financial Statements
22. Reserves2010 2009
$million $million
Share-based payments 47 36
Foreign currency translation (132) (121)
Hedging (107) (114)
Available-for-sale (7) 1
(199) (198)
NATURE ANd PURPOSE Of RESERvES:
Share-basedpaymentsreserve
The share-based payments reserve is used to recognise the fair value of options and performance share rights over their vesting period (refer note 31).
Foreigncurrencytranslationreserve
The foreign currency translation reserve records the foreign currency differences arising from the translation of foreign operations, and the translation of transactions that hedge the company’s net investments in foreign operations.
Hedgingreserve
The hedging reserve is used to record the effective portion of the gains or losses on hedging instruments in cash flow hedges that are recognised directly in equity. Amounts are recognised in profit and loss when the associated hedged transactions affect profit and loss or as part of the cost of an asset if non-monetary.
Available-for-salereserve
Changes in fair value and exchange differences arising on translation of investments and settlement residue agreements are taken to the available-for-sale reserve. Amounts are recognised in profit and loss when the associated investments/settlement residue agreements are sold/settled or impaired.

ORIGIN ENERGY ANNUAL REPORT 2010 93
Notes to the Financial Statements
23. Notes to the statement of cash flows(A) REcONcILIATION Of cASh ANd cASh EqUIvALENTSCash includes cash on hand, at bank and short-term deposits, net of outstanding bank overdrafts.
Cash as at the end of the period as shown in the statement of cash flows is reconciled to the related items in the statement of financial position as follows:
Note2010 2009
$million $million
Cash and cash equivalents 823 3,895
Bank overdrafts 16 (4) (4)
819 3,891
(B) ThE fOLLOWING NON-cASh fINANcING ANd INvESTING AcTIvITIES hAvE NOT BEEN INcLUdEd IN ThE STATEmENT Of cASh fLOWS:
Issue of shares in respect of the Dividend Reinvestment Plan 21 65 19
(c) REcONcILIATION Of PROfIT TO NET cASh PROvIdEd BY OPERATING AcTIvITIES:
Profit for the period 680 6,998
Adjustments to reconcile profit to net cash provided by operating activities:
Depreciation and amortisation 408 369
Equity settled share-based payment expense 11 10
Bad debts expense 42 43
Exploration expense 45 40
Impairment of assets 33 312
(Increase)/decrease in fair value of financial instruments (15) 185
Net financing costs 124 172
Increase in deferred taxes 94 552
Gain on dilution of Origin’s interest in subsidiaries (38) (7,385)
Gain on sale of assets (4) (1)
Non-cash share of net profits of equity accounted investees (131) (159)
Changes in assets and liabilities, net of effects from acquisitions/disposals:
– Receivables (133) 88
– Inventories 19 (17)
– Payables 6 (172)
– Provisions 28 (1)
– Other (95) (52)
Total adjustments 394 (6,016)
Net cash provided by operating activities 1,074 982

94
Notes to the Financial Statements
23. Notes to the statement of cash flows (continued)
(d) BUSINESS cOmBINATIONS
2010
CogentEnergyPtyLtd
On 24 July 2009 the consolidated entity acquired 100% of Cogent Energy Pty Ltd (Cogent). Cogent’s business relates to the installation and operation of co-generation facilities. The purchase consideration at completion (net of cash acquired) was $8 million. A further amount of $6 million has been recorded as contingent consideration.
2009
OriginEnergyUranquintyPowerPtyLtd
On 4 July 2008, the consolidated entity acquired 100% of the shares in BBP Uranquinty Power Pty Ltd (renamed Origin Energy Uranquinty Power Pty Ltd “OEUP”). The principal asset of OEUP is the Uranquinty Power Station. The purchase consideration was $537 million. As part of the acquisition Origin acquired existing debt of $404 million and existing cash of $67 million. The net cash outflow resulting from the acquisition was $126 million.
The legal entity, Origin Energy Uranquinty Power Pty Limited, recorded an EBITDA of $25 million and a net loss after fair value of financial instruments, interest and tax of $4 million for the period 1 January 2009 (commissioning date) to 30 June 2009.
OriginLPG(Vietnam)LLC
On 15 August 2008 the consolidated entity acquired a 51% interest in Origin LPG (Vietnam) LLC. The purchase consideration of $5 million was allocated to property, plant and equipment.
Origin LPG (Vietnam) LLC contributed a net result after interest and tax of $Nil to the consolidated entity for the period 30 July 2008 to 30 June 2009. It was not practicable to disclose the expected annualised performance of this entity as if it were owned by Origin Energy for the full financial year ended 30 June 2009 because the appropriate financial information was not available.
WindPowerPtyLtd
On 6 May 2009 the consolidated entity acquired 100% of the shares in Wind Power Pty Ltd and its fully owned subsidiaries. The purchase consideration at completion was $34 million. A further amount of $8 million has been recorded as contingent consideration.
Wind Power Pty Ltd contributed a net profit after interest and tax of $Nil to the consolidated entity for the period from 6 May 2009 to 30 June 2009. It was not practicable to disclose the expected annualised performance of the Wind Power Group as if it were owned by Origin Energy for the full financial year ended 30 June 2009 because the appropriate financial information was not available.
The fair value of the net assets acquired as part of business combinations are detailed in this note.

ORIGIN ENERGY ANNUAL REPORT 2010 95
Notes to the Financial Statements
23. Notes to the statement of cash flows (continued)
(d) BUSINESS cOmBINATIONS (continued)
2010 2009 2010 2009$million $million $million $million
Book value fair value
current assets
Cash and cash equivalents 1 67 1 67
Trade and other receivables – 1 – 1
Other financial assets, including derivatives – 4 – 4
Total current assets 1 72 1 72
Non-current assets
Other financial assets, including derivatives – 4 – 4
Property, plant and equipment 8 351 8 407
Intangible assets – – 8 43
Total non-current assets 8 355 16 454
Total assets 9 427 17 526
current liabilities
Trade and other payables 2 10 2 12
Interest-bearing liabilities 2 – 3 –
Total current liabilities 4 10 5 12
Non-current liabilities
Interest-bearing liabilities 5 404 5 404
Tax liabilities – 13 – 29
Total non-current liabilities 5 417 5 433
Total liabilities 9 427 10 445
Net assets – – 7 81
Goodwill on acquisition – – 8 167
fair value of net assets acquired – – 15 248
Total consideration 15 248
Non-cash consideration (6) (16)
Cash acquired (1) (67)
Net cash outflow for business combinations 8 165
In accordance with the consolidated entity’s policies the fair value of assets and liabilities acquired are provisional and subject to further review for a period of up to 12 months from the date of acquisition.

96
Notes to the Financial Statements
24. Auditors’ remuneration2010 2009
$’000 $’000
Audit services by:
Auditors of the Company (KPMG)
Australia
– Audit and review of the financial reports 1,440 1,693
Overseas
– Audit and review of the financial reports 553 867
1,993 2,560
Other auditors (primarily PWC) (1) 102 119
Other services by:
Auditors of the Company (KPMG)
Australia
– Acquisition audit and accounting advice 80 566
– Taxation services 29 54
– Other services 341 122
Overseas
– Taxation services 15 69
465 811
Other auditors (PWC) (2) 3,416 2,905
5,976 6,395
(1) Other auditors, primarily PricewaterhouseCoopers (PWC), audit financial reports of certain controlled entities located in various Pacific Island countries.
(2) Includes amounts for internal audit, taxation, information technology, risk and quality assurance advice and accounting advice.
25. Contingent liabilities and assetsDetails of contingent liabilities and contingent assets where the probability of future payments/receipts is not considered remote are set out below, as well as details of contingent liabilities and contingent assets, which although considered remote, the directors consider should be disclosed. The directors are of the opinion that provisions are not required in respect of these matters, as it is not probable that a future sacrifice of economic benefits will be required or the amount is not capable of reliable measurement.
Bank guarantees – unsecured (1) 359 481
Letters of credit – unsecured (2) 24 24
383 505
(1) The consolidated entity has provided bank guarantees in favour of the Australian Electricity Market Operator Limited to support its obligations to purchase electricity from the national electricity market.
(2) The consolidated entity has provided overseas suppliers letters of credit to facilitate the importation of equipment.
The consolidated entity has given to its bankers letters of responsibility in respect of accommodation provided from time to time by the banks to Origin Energy Limited’s wholly or partly-owned controlled entities.
Warranties and indemnities have been given by entities in the consolidated entity in relation to environmental liabilities for certain properties as part of the terms and conditions of divestments.
A number of sites within the consolidated entity have been identified as contaminated, all of which are subject to ongoing environmental management programs to ensure appropriate controls are in place and clean-up requirements are implemented. For sites where the requirements can be assessed and costs estimated, the estimated cost of remediation has been expensed or provided for. The contamination has generally resulted from the manufacture of gas from coal and the treatment of the associated by-products conducted at the sites. These activities ceased in the 1970s when manufactured gas was replaced with natural gas from oil and gas fields.
Certain entities within the consolidated entity are subject to various lawsuits and claims. Any liabilities arising from such lawsuits and claims are not expected to have a material adverse effect on the consolidated financial statements.

ORIGIN ENERGY ANNUAL REPORT 2010 97
Notes to the Financial Statements
25. Contingent liabilities and assets (continued)A Demerger Deed was entered into in the 2000 year containing certain indemnities and other agreements between Origin Energy Limited and Boral Limited and their respective controlled entities covering the transfer of the businesses, investments, tax, other liabilities, debt and assets of Boral Limited and some temporary shared arrangements. All known amounts subject to this agreement have been adequately provided for in the consolidated financial statements.
The company, as a venturer in certain joint ventures, is severally liable for 100% of all liabilities incurred by these joint ventures (refer note 30).
Deedofcrossguarantee
Under the terms of ASIC Class Order 98/1418 (as amended by Class Order 98/2017) certain wholly-owned controlled entities have been granted relief from the requirement to prepare audited financial reports. Origin Energy Limited has entered into an approved deed of indemnity for the cross-guarantee of liabilities with those controlled entities (refer note 29).
Transform Solar Pty Ltd was released from its obligations under the Deed of Cross Guarantee by executing a Revocation Deed on 18 November 2009.
A consolidated income statement and a consolidated statement of financial position, comprising the company and controlled entities which are a party to the Deed of Cross Guarantee, after eliminating all transactions between parties to the Deed, at 30 June 2010 are set out in note 34.
26. Commitments 2010 2009
$million $million
capital expenditure commitments
Contracted but not provided for and payable:
not later than one year 264 728
later than one year but not later than five years 191 213
later than five years 79 120
534 1,061
Joint venture commitments
Share of exploration, development and capital expenditure commitments not provided for and payable:
not later than one year 441 266
later than one year but not later than five years 157 170
later than five years 1 1
599 437
Refer to note 16 for lease commitments.

98
Notes to the Financial Statements
27. Financial instrumentsfINANcIAL ASSETSThe consolidated entity classifies its financial assets in the following categories: at fair value through profit or loss, loans and receivables and available-for-sale financial assets. The classification depends on the purpose for which the financial assets were acquired or executed. Management determines the classification of its financial assets at initial recognition and re-evaluates this designation at every reporting date.
(a)Financialassetsatfairvaluethroughprofitorloss
This category has two sub-categories: financial assets held for trading, and those designated at fair value through profit or loss at inception. A financial asset is classified in this category if acquired principally for the purpose of selling in the short term or if so designated by management. Derivatives are also categorised as held for trading unless they are designated as hedges. The consolidated entity holds a number of derivative instruments for economic hedging purposes under the board approved risk management policies, which are prohibited from being designated as hedges under Australian Accounting Standards. These derivatives are therefore required to be categorised as held for trading. Assets in this category are classified as current assets if they are either held for trading or are expected to be realised within 12 months of the reporting date.
(b)Loansandreceivables
Loans and receivables are non-derivative financial assets with fixed or determinable payments that are not quoted in an active market. They are included in current assets, except for maturities greater than 12 months after the reporting date, which are classified as non-current assets. Loans and receivables are classified as ‘trade and other receivables’ in the statement of financial position (note 6).
(c)Available-for-salefinancialassets
Available-for-sale financial assets are non-derivatives that are either designated in this category or not classified in any of the other categories. They are included in non-current assets unless management intends to dispose of, or otherwise realise, the asset within 12 months of the reporting date.
(d)Recognition
Regular purchases and sales of investments are recognised on trade-date, the date on which the consolidated entity commits to purchase or sell the asset. Investments are initially recognised at fair value plus transaction costs for all financial assets not carried at fair value through profit or loss. Financial assets carried at fair value through profit or loss are initially recognised at fair value, and transaction costs are expensed in the income statement. Investments are derecognised when the rights to receive cash flows from the investments have expired or have been transferred and the consolidated entity has transferred substantially all risks and rewards of ownership. Available-for-sale financial assets and financial assets at fair value through profit or loss are subsequently carried at fair value. Loans and receivables are carried at amortised cost using the effective interest method.
Gains or losses arising from changes in the fair value of the ‘financial assets at fair value through profit or loss’ category are presented in the income statement within ‘total expenses, excluding net financing costs’ in the period in which they arise. Changes in the fair value of monetary securities denominated in foreign currency classified as available-for-sale are analysed between translation differences resulting from changes in amortised cost of the security and other changes in the carrying amount of the security. The translation differences are recognised in profit or loss, and other changes in carrying amount are recognised in equity. Changes in the fair value of other monetary securities denominated in the functional currency of the consolidated entity classified as available-for-sale and non-monetary securities classified as available-for-sale are recognised in equity.
The consolidated entity does not recognise day one gains or losses arising from valuation techniques used to estimate the fair value of structured commodity derivatives for which no observable market prices exist. The effect of any day one gains and losses is excluded from recognition both initially and in all subsequent periods during the life of the instrument.
When securities classified as available-for-sale are sold or impaired, the accumulated fair value adjustments recognised in equity are included in the income statement as ‘total expenses, excluding net financing costs’. Interest on available-for-sale securities calculated using the effective interest method is recognised in the income statement. Dividends on available-for-sale equity instruments are recognised in the income statement when the consolidated entity’s right to receive payments is established.
The fair values of quoted investments are based on current bid prices. If the market for a financial asset is not active (and for unlisted securities), the consolidated entity establishes fair value by using valuation techniques. These include the use of recent arm’s length transactions, reference to other instruments that are substantially the same, discounted cash flow analysis, and option pricing models making maximum use of market inputs and relying as little as possible on entity-specific inputs.
The consolidated entity assesses at each reporting date whether there is objective evidence that a financial asset or a group of financial assets is impaired. In the case of equity securities classified as available-for-sale, a significant or prolonged decline in the fair value of the security below its cost is considered an indicator that the securities are impaired. If available-for-sale financial assets are deemed to be impaired, the cumulative loss – measured as the difference between the acquisition cost and the current fair value, less any impairment loss on that financial asset previously recognised in profit or loss – is removed from equity and recognised in the income statement. Impairment losses recognised in the income statement on equity instruments are not reversed through the income statement. Impairment testing of trade receivables is described in note 1.

ORIGIN ENERGY ANNUAL REPORT 2010 99
Notes to the Financial Statements
27. Financial instruments (continued)
dERIvATIvE fINANcIAL INSTRUmENTS ANd hEdGING AcTIvITIESThe consolidated entity uses a range of derivative financial instruments to hedge the risk exposures arising from its operational, financing and investment activities.
Derivatives are initially recognised at fair value on the date they are entered into and are subsequently remeasured at their fair value. The method of recognising the resulting gain or loss depends on whether the derivative is designated as a hedging instrument, and if so, the nature of the item being hedged. The consolidated entity designates certain derivatives as either:
(1) hedges of the fair value of recognised assets, liabilities or firm commitments (fair value hedge);
(2) hedges of a particular cash flow risk associated with a recognised asset, liability or highly probable forecast transaction (cash flow hedge); or
(3) hedges of a net investment in a foreign operation (net investment hedge).
The consolidated entity documents at the inception of the transaction the relationship between hedging instruments and hedged items, as well as its risk management objective and strategy for undertaking various hedge transactions. The consolidated entity also documents its assessment, both at hedge inception and on an ongoing basis, of whether the derivatives that are used in hedging transactions are highly effective in offsetting changes in fair values or cash flows of hedged items.
The fair values of various derivative instruments used for hedging purposes are disclosed in note 9 and note 17. Movements of the hedging reserve in shareholders’ equity are shown in the statement of changes in equity. The fair value of hedging derivatives is classified as either current or non-current based on the timing of the underlying cash flows of the instrument. Cash flows due within 12 months of the reporting date are classified as current and cash flows due after 12 months of the reporting date are classified as non-current. Derivatives which are valid economic hedges, but which do not qualify for hedge accounting, are classified as a current asset or liability.
(a)Fairvaluehedges
Changes in the fair value of derivatives that are designated and qualify as fair value hedges are recorded in the income statement, together with any changes in the fair value of the hedged asset or liability that are attributable to the hedged risk. The gain or loss relating to the cross currency interest rate swaps hedging fixed rate foreign currency borrowings is recognised in the income statement within ‘total expenses, excluding net financing costs’. Changes in the fair value of the hedged fixed rate borrowings attributable to interest rate and foreign exchange rate risk are recognised in the income statement within ‘total expenses, excluding net financing costs’.
If the hedge no longer meets the criteria for hedge accounting, the adjustment to the carrying amount of a hedged item for which the effective interest method is used is amortised to profit or loss over the period to maturity.
(b)Cashflowhedges
The effective portion of changes in the fair value of derivatives that are designated and qualify as cash flow hedges are recognised in equity. The gain or loss relating to the ineffective portion is recognised immediately in the income statement within ‘total expenses, excluding net financing costs’.
Amounts accumulated in equity are recycled in the income statement in the periods when the hedged item affects profit or loss (for instance when the forecast sale that is hedged takes place). The gain or loss relating to the effective portion of interest rate swaps hedging variable rate borrowings is recognised in the income statement within ‘net financing costs’. The gain or loss relating to the effective portion of commodity derivatives hedging floating price forecast purchases is recognised in note 3(b) within ‘raw materials and consumables used, and changes in finished goods and work in progress’. The gain or loss relating to the effective portion of commodity derivatives hedging floating price forecast sales is recognised in the income statement within ‘revenue’. The gain or loss relating to the effective portion of forward foreign exchange contracts hedging export sales is recognised in the income statement within ‘revenue’. The gain or loss relating to the effective portion of forward foreign exchange contracts hedging purchases of non-financial assets (such as capital equipment) is recognised in the initial carrying value of the non-financial asset.
When a hedging instrument expires or is sold, or when a hedge no longer meets the criteria for hedge accounting, any cumulative gain or loss existing in equity at that time remains in equity and is recognised when the forecast transaction is ultimately recognised in the income statement. When a forecast transaction is no longer expected to occur, the cumulative gain or loss that was reported in equity is immediately transferred to the income statement.
(c)Netinvestmenthedges
Hedges of net investments in foreign operations are accounted for similarly to cash flow hedges. Any gain or loss on the hedging instrument relating to the effective portion of the hedge is recognised in equity; the gain or loss relating to the ineffective portion is recognised immediately in the income statement. Gains and losses accumulated in equity are included in the income statement when the foreign operation is disposed.
(d)Derivativesthatdonotqualifyforhedgeaccounting
Certain derivative instruments do not qualify for hedge accounting, despite being valid economic hedges of the relevant risk(s). Changes in the fair value of any derivative instruments that do not qualify for hedge accounting are recognised immediately in the income statement within ‘total expenses, excluding net financing costs’.

100
Notes to the Financial Statements
27. Financial instruments (continued)
fINANcIAL RISK mANAGEmENT
Financialriskfactors
The consolidated entity’s activities expose it to a variety of financial risks: market risk (including foreign exchange risk, interest rate risk and price risk), credit risk and liquidity risk. The consolidated entity’s overall risk management program focuses on the unpredictability of financial and commodity markets and seeks to minimise potential adverse effects on the consolidated entity’s financial performance. The consolidated entity uses a range of derivative financial instruments to hedge these risk exposures.
Risk management is carried out by Group Treasury for interest rate and foreign exchange exposures. Risk management activities in respect of the commodity exposures are undertaken by Origin’s Energy Risk Management Group (ERM). Both Group Treasury and ERM operate under policies approved by the Board of Directors. Group Treasury and ERM identify, evaluate and hedge the financial risks in close co-operation with the consolidated entity’s operating units. The consolidated entity has written policies covering specific areas, such as foreign exchange risk, interest rate risk, electricity price risk, oil price risk, credit risk, use of derivative financial instruments and non-derivative financial instruments, and the investment of excess liquidity.
(a)Marketrisk
(i)Foreignexchangerisk
The consolidated entity operates internationally and is exposed to foreign exchange risk arising from various currency exposures, primarily with respect to the New Zealand dollar, US dollar and Euro. Foreign exchange risk arises from future commercial transactions (including interest payments on long-term borrowings, the sale of oil, the sale and purchase of LPG and the purchase of capital equipment), recognised assets and liabilities (including foreign receivables and borrowings) and net investments in foreign operations.
To manage the foreign exchange risk arising from future commercial transactions, the consolidated entity uses forward foreign exchange contracts transacted by Group Treasury. To manage the foreign exchange risk arising from the future principal and interest payments required on foreign currency denominated long-term borrowings, the consolidated entity uses cross currency interest rate swaps (both fixed to fixed and fixed to floating) which convert the foreign currency denominated future principal and interest payments into the functional currency for the relevant entity for the full term of the underlying borrowings.
Each subsidiary designates contracts with Group Treasury as fair value hedges or cash flow hedges, as appropriate. External derivative contracts are designated at the consolidated entity level as hedges of foreign exchange risk on specific assets, liabilities or future transactions on a gross basis.
The consolidated entity has certain investments in foreign operations whose net assets are exposed to foreign currency translation risk. Currency exposure arising from the net assets of the consolidated entity’s foreign operations is managed primarily through borrowings denominated in the relevant foreign currencies.
The following table summarises the impact of increases/decreases of the relevant foreign exchange rates on the consolidated entity’s post-tax profit for the year and on other components of equity. The sensitivity analysis uses the 95th percentile worst expected outcome for each of the relevant risk variables applicable to each financial instrument determined using the observed range of actual historical price data for the previous five years. All variables other than the relevant primary risk variable identified are held constant in the analysis.
foreign exchange rate change Impact on post-tax profit Impact on other equity
2010 2009 2010 2009 2010 2009
+ / – % + / – ($million) + / – ($million)
USD 24.8% 24.9% – 1 20 22
NZD 14.3% 14.7% 1 1 31 30
EUR 19.4% 19.4% – – 1 18
(ii)Pricerisk
The consolidated entity is exposed to commodity price risk from a number of commodities, including electricity, oil and related commodities associated with the purchase and/or sale of these commodities. The consolidated entity is also exposed to equity securities price risk because of investments held by the consolidated entity and classified on the statement of financial position as available-for-sale and fair value through profit or loss. To manage its commodity price risks in respect to electricity and oil, the consolidated entity utilises a range of derivative instruments including fixed priced swaps, options and futures. The consolidated entity’s equity investments subject to price risk are all publicly traded.
The consolidated entity’s risk management policy for commodity price risk is to hedge forecast future transactions for up to five years into the future. ERM has a risk management policy framework that manages the exposure arising from its commodity-based activities. The policy permits the active hedging of price and volume exposure arising from the retailing, generation and portfolio management activities, within prescribed risk capacity limits. The policy prescribes the maximum risk exposure permissible over any two-day period for the full commodity portfolio, under defined worse case scenarios. The full portfolio is tested daily against this limit, and reported monthly to management.
The following table summarises the impact of increases/decreases of the relevant forward prices (for commodities) and equity prices (for equity investments) on the consolidated entity’s post-tax profit for the year and on other components of equity. The sensitivity analysis is based on reasonably possible changes, over a financial year, in the relevant risk variables applicable to each financial instrument determined using the observed range of actual historical price data for the previous 12 months. All variables other than the relevant primary risk variable identified are held constant in the analysis.

ORIGIN ENERGY ANNUAL REPORT 2010 101
Notes to the Financial Statements
27. Financial instruments (continued)
fINANcIAL RISK mANAGEmENT (continued)
Financialriskfactors(continued)
Impact on post-tax profit Impact on other equity
2010 2009 2010 2009 + / – ($million) + / – ($million)
Electricity forward price 25 3 98 202
Oil forward prices – 7 8 97
Equity securities quoted price – – 15 18
Post-tax profit for the year would increase/decrease as a result of the inherent ineffectiveness in some commodity hedging relationships and some derivative instruments which are valid economic hedges of these commodity price risks which do not qualify for cash flow hedge accounting under AASB 139 requirements. Other components of equity would increase/decrease as a result of the hedging instruments which do qualify for cash flow hedge accounting under AASB 139 and gains on equity securities classified as available-for-sale.
(b)Creditrisk
The consolidated entity manages its exposure to credit risk via credit risk management policies which allocate credit limits based on the overall financial and competitive strength of the counterparty. Publicly available credit information from recognised providers is utilised for this purpose where available. Credit polices cover exposures generated from the sale of products and the use of derivative instruments. Derivative counterparties are limited to high-credit-quality financial institutions and other organisations in the relevant industry. The consolidated entity has Board approved policies that limit the amount of credit exposure to each financial institution and derivative counterparty. The consolidated entity also utilises ISDA agreements with all derivative counterparties in order to limit exposure to credit risk through the netting of amounts receivable from and amounts payable to individual counterparties.
The carrying amounts of financial assets recognised in the statement of financial position, and disclosed in more detail in notes 6 and 9 best represents the consolidated entity’s maximum exposure to credit risk at the reporting date. In respect of those financial assets and the credit risk embodied within them, the consolidated entity holds no significant collateral as security and there are no other significant credit enhancements in respect of these assets. The credit quality of all financial assets that are neither past due nor impaired is appropriate and is constantly monitored in order to identify any potential adverse changes in the credit quality. There are no significant financial assets that have had renegotiated terms that would otherwise, without that renegotiation, have been past due or impaired.
(c)Liquidityrisk
Prudent liquidity risk management implies maintaining sufficient cash and marketable securities, the availability of funding through an adequate amount of committed credit facilities and the ability to close out market positions. Due to the dynamic nature of the underlying businesses, Group Treasury aims to maintain flexibility in funding by keeping committed credit lines available. Certain of the consolidated entity’s interest-bearing liability obligations are subject to change in control provisions under the agreements with third-party lenders. As at 30 June 2010 these provisions were not triggered.
The following summarises the contractual timing of cash flows of the borrowings and related derivative instruments at 30 June 2010 and 30 June 2009:
2010 2009$million $million
Less than one month 144 16
One to three months 40 32
Three to 12 months 172 275
One to five years 6,888 6,581
Included in the balances above is the $3,564 million loan from Australia Pacific LNG which, when called either partially or fully, is payable within 13 months.

102
Notes to the Financial Statements
27. Financial instruments (continued)
fINANcIAL RISK mANAGEmENT (continued)
Financialriskfactors(continued)
(d)Interestraterisk(cashflowandfairvalue)
The consolidated entity’s income and operating cash flows are substantially independent of changes in market interest rates. The consolidated entity’s interest rate risk arises from long-term borrowings. Borrowings issued at variable rates expose the consolidated entity to cash flow interest rate risk. Borrowings issued at fixed rates expose the consolidated entity to fair value interest rate risk. The consolidated entity’s risk management policy is to manage interest rate exposures using Profit at Risk and Value at Risk methodologies using 95% statistical confidence levels. Exposure limits are set to ensure that the consolidated entity is not exposed to excess risk from interest rate volatility. The consolidated entity manages its cash flow interest rate risk by using floating-to-fixed interest rate swaps. Such interest rate swaps have the economic effect of converting borrowings from floating rates to fixed rates.
Under the interest rate swaps, the consolidated entity agrees with other parties to exchange, at specified intervals (mainly quarterly), the difference between fixed contract rates and floating rate interest amounts calculated by reference to the agreed notional principal amounts.
The following table summarises the impact of increases/decreases of the relevant interest rates on the consolidated entity’s post-tax profit for the year and on other components of equity. The sensitivity analysis uses the 95th percentile worst expected outcome for each of the relevant risk variables applicable to each financial instrument determined using the observed range of actual historical price data for the previous five years. All variables other than the relevant primary risk variable identified are held constant in the analysis.
Impact on post-tax profit Impact on other equity
2010 2009 2010 2009 + / – ($million) + / – ($million)
Interest rates (12) 1 14 29
At 30 June 2010, if interest rates at that date had been higher/lower by the 95th percentile worst expected outcome with all other variables held constant, post-tax profit and other components of equity of the consolidated entity would have been higher/ lower by the amounts as set out in the table above. Profit would have been affected mainly as a result of the ineffective portion of cash flow and fair value hedge transactions and the fair value change in derivatives which are valid economic hedges but which do not qualify for hedge accounting. Other components of consolidated equity would have been affected mainly as a result of an increase/decrease in the fair value of interest rate swaps which qualify for cash flow hedge accounting.
Capitalriskmanagement
The consolidated entity’s objectives when managing capital are to safeguard the consolidated entity’s ability to continue as a going concern, so that it can continue to provide returns for shareholders and benefits for other stakeholders and to maintain an optimal capital structure to reduce the cost of capital.
In order to maintain or adjust the capital structure, the consolidated entity may adjust the amount of dividends paid to shareholders, return capital to shareholders, issue new shares or sell assets to reduce debt.
Consistent with others in the industry, the consolidated entity monitors capital on the basis of the gearing ratio. This ratio is calculated as net debt divided by total capital. Net debt is calculated as total interest-bearing borrowings less cash and cash equivalents and fair value adjustments to borrowings in hedge relationships. Total capital is calculated as ‘equity’ as shown in the statement of financial position plus net debt less reserves attributable to fair value adjustments on financial instruments.
The consolidated entity maintains a gearing ratio designed to optimise the cost of capital whilst providing flexibility to fund growth opportunities. The gearing ratios were as follows:
2010 2009$million $million
Total interest-bearing borrowings 3,486 3,626
Less: Fair value adjustments on borrowings in hedge relationships 172 162
Less: Cash and cash equivalents (823) (3,895)
Net debt/(cash) 2,835 (107)
Total equity 11,438 11,144
Less: Reserves (1) 114 113
Total capital (excluding reserves (1)) 14,387 11,150
Total capital (including reserves (1)) 14,273 11,037
Gearing ratio (excluding reserves (1)) 20% (1%)
Gearing ratio (including reserves (1)) 20% (1%)
(1) Represents reserves attributable to fair value adjustments on financial instruments.
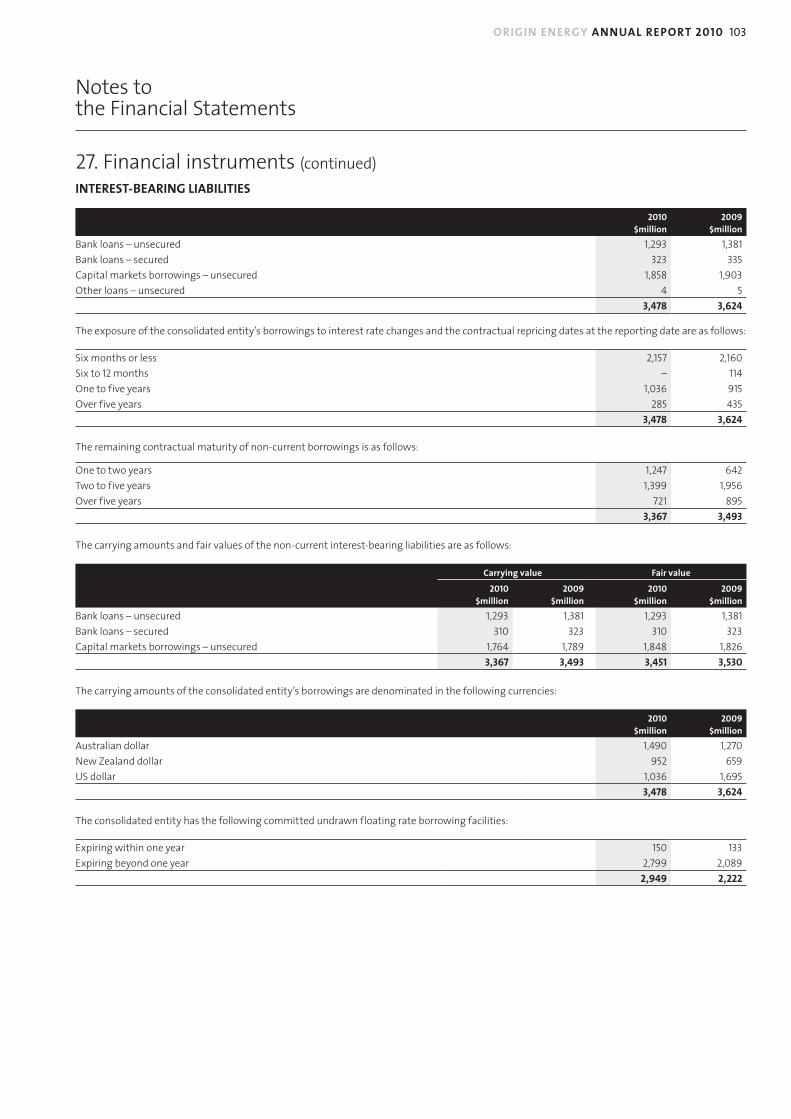
ORIGIN ENERGY ANNUAL REPORT 2010 103
Notes to the Financial Statements
27. Financial instruments (continued)
INTEREST-BEARING LIABILITIES
2010 2009$million $million
Bank loans – unsecured 1,293 1,381
Bank loans – secured 323 335
Capital markets borrowings – unsecured 1,858 1,903
Other loans – unsecured 4 5
3,478 3,624
The exposure of the consolidated entity’s borrowings to interest rate changes and the contractual repricing dates at the reporting date are as follows:
Six months or less 2,157 2,160
Six to 12 months – 114
One to five years 1,036 915
Over five years 285 435
3,478 3,624
The remaining contractual maturity of non-current borrowings is as follows:
One to two years 1,247 642
Two to five years 1,399 1,956
Over five years 721 895
3,367 3,493
The carrying amounts and fair values of the non-current interest-bearing liabilities are as follows:
carrying value fair value
2010 2009 2010 2009$million $million $million $million
Bank loans – unsecured 1,293 1,381 1,293 1,381
Bank loans – secured 310 323 310 323
Capital markets borrowings – unsecured 1,764 1,789 1,848 1,826
3,367 3,493 3,451 3,530
The carrying amounts of the consolidated entity’s borrowings are denominated in the following currencies:
2010 2009$million $million
Australian dollar 1,490 1,270
New Zealand dollar 952 659
US dollar 1,036 1,695
3,478 3,624
The consolidated entity has the following committed undrawn floating rate borrowing facilities:
Expiring within one year 150 133
Expiring beyond one year 2,799 2,089
2,949 2,222

104
Notes to the Financial Statements
27. Financial instruments (continued)
hEdGE AccOUNTING
(a)Fairvaluehedges
The changes in the fair values of the hedged items and hedging instruments recognised in the income statement for the year are disclosed in the following table:
2010 2009$million $million
Gain on the hedging instruments 5 152
Loss on the hedged item attributable to the hedge risk (5) (133)
– 19
(b)CashflowhedgesThe effective portion of the losses on cash flow hedges recognised in the cash flow hedge reserve (194) (391)
The losses transferred from the cash flow hedge reserve to sales 3 10
The losses/(gains) transferred from the cash flow hedge reserve to cost of sales 184 (29)
The losses/(gains) transferred from the cash flow hedge reserve to finance cost 12 (3)
The losses/(gains) transferred from the cash flow hedge reserve to the initial carrying value of non-financial assets 8 (22)
207 (44)
The ineffectiveness (losses)/gains recognised in the income statement from cash flow hedges (2) 8
(c)Netinvestmenthedges
The effective portion of the gains/(losses) on net investment hedges recognised in the foreign currency translation reserve for the year to 30 June 2010 totalled $3 million loss (2009: $5 million loss).
The ineffectiveness recognised in the income statement from net investment hedges for the year to 30 June 2010 totalled $Nil (2009: $Nil).
(d)Derivativesthatdonotqualifyforhedgeaccounting
The net change in fair value of derivatives which do not qualify for hedge accounting (and are therefore required to be classified as held for trading), which has been recognised in the income statement for the year to 30 June 2010 totalled $45 million gain (2009: $97 million loss).
dERIvATIvE fINANcIAL INSTRUmENTS
Assets Liabilities
Note2010 2009 2010 2009
$million $million $million $million
current
Interest rate swaps – – 28 61
Cross currency interest rate swaps 1 – 49 23
Forward foreign exchange contracts 10 16 9 15
Electricity derivatives 348 434 237 413
Oil derivatives 2 3 7 7
9,17 361 453 330 519
Non-current
Interest rate swaps – 1 69 81
Cross currency interest rate swaps – 3 84 71
Forward foreign exchange contracts 12 3 12 4
Electricity derivatives 40 97 80 131
Oil derivatives 1 4 4 11
9,17 53 108 249 298
Total 414 561 579 817

ORIGIN ENERGY ANNUAL REPORT 2010 105
Notes to the Financial Statements
27. Financial instruments (continued)
dERIvATIvE fINANcIAL INSTRUmENTS (continued)
(a)Interestrateswaps
The aggregate notional principal amounts of the outstanding interest rate swap contracts at 30 June 2010 were $1,671 million (2009: $1,892 million). At 30 June 2010, the fixed interest rates vary from 2.75% to 7.80% (2009: 2.75% to 8.00%) and the main floating rates are BBSW, US LIBOR and BKBM. Interest rate swaps are either designated in cash flow hedge relationships or remain non-designated.
The hedged anticipated interest payment transactions are expected to occur at various dates between one month and 14 years from the reporting date as a result of the maturities of the underlying borrowings. Gains and losses recognised in the cash flow hedge reserve in equity (statement of comprehensive income) on interest rate swap contracts as of 30 June 2010 will be continuously released to the income statement in each period in which interest payments are recognised in the income statement until the maturities of the underlying borrowings. During the year to 30 June 2010 no interest rate swaps were de-designated. During the year to 30 June 2009 interest rate swaps with a total notional principal of $900 million were de-designated and cancelled as a result of repayment of the underlying debt instruments.
(b)Crosscurrencyinterestrateswaps
The aggregate notional principal amounts of the outstanding cross currency interest rate swap contracts at 30 June 2010 were $966 million (2009: $1,090 million). At 30 June 2010, the fixed interest rates vary from 4.75% to 6.25% (2009: 4.75% to 6.25%) and the main floating rates are BBSW and BKBM. Cross currency interest rate swaps are designated in either cash flow hedge relationships or fair value hedge relationships.
The hedged anticipated interest payment transactions are expected to occur at various dates between one month and eight years from the reporting date as a result of the maturities of the underlying borrowings. Gains and losses recognised in the cash flow hedge reserve in equity (statement of comprehensive income) on cross currency interest rate swap contracts as of 30 June 2010 will be continuously released to the income statement in each period in which interest payments are recognised in the income statement until the maturities of the underlying borrowings. During the year to 30 June 2010 and the year to 30 June 2009, no hedges were de-designated and all underlying forecast transactions remain highly probable to occur as originally forecast.
(c)Forwardforeignexchangecontracts
The aggregate notional principal amounts of the outstanding forward foreign exchange contracts at 30 June 2010 were $90 million (2009: $374 million). Forward foreign exchange contracts are designated in cash flow hedge relationships.
The hedged anticipated transactions denominated in foreign currency are expected to occur at various dates between one month and three years from the reporting date. Gains and losses recognised in the cash flow hedge reserve in equity (statement of comprehensive income) on forward foreign exchange contracts as of 30 June 2010 will be released to the income statement when the underlying anticipated transactions affect the income statement. During the year to 30 June 2010 and the year to 30 June 2009, no hedges were de-designated and all underlying forecast transactions remain highly probable to occur as originally forecast.
(d)Electricityderivatives
The aggregate notional volumes of the outstanding electricity derivatives at 30 June 2010 were 164 million MWhs (2009: 189 million MWhs). Electricity derivatives are either designated in cash flow hedge relationships or remain non-designated.
The hedged anticipated electricity purchase and sale transactions are expected to occur continuously for each half hour period throughout the next five years from the reporting date consistent with the forecast demand from customers over this period. Gains and losses recognised in the cash flow hedge reserve in equity (statement of comprehensive income) on electricity derivatives as of 30 June 2010 will be continuously released to the income statement in each period in which the underlying purchase or sale transactions are recognised in the income statement. During the year to 30 June 2010 and the year to 30 June 2009, no hedges were de-designated and all underlying forecast transactions remain highly probable to occur as originally forecast.
The inherent variability in the volume of electricity purchased by customers in any half hour period means that the actual purchase requirements can vary from the forecasts. The forecasts are updated for significant changes in underlying conditions and where this leads to a reduction in the forecast below the aggregate notional volume of hedging instruments in the relevant half hour periods impacted, the affected hedging instruments are de-designated and the accumulated gain or loss which had been recognised in the cash flow hedge reserve is recognised directly in the income statement as the underlying forecast purchase transactions for those half hours are no longer expected to occur.
(e)Oilderivatives
The aggregate notional volumes of the outstanding oil and related derivatives at 30 June 2010 were 0.93 Mbbl (2009: 1.50 Mbbl). Oil derivatives are designated in cash flow hedge relationships.
The hedged anticipated oil sale and purchase transactions are expected to occur continuously throughout the next two years from the reporting date consistent with the forecast production and demand from customers over this period. Gains and losses recognised in the cash flow hedge reserve in equity (statement of comprehensive income) on oil derivatives as of 30 June 2010 will be continuously released to the income statement in each period in which the underlying sale or purchase transactions are recognised in the income statement. During the year to 30 June 2010 and the year to 30 June 2009, no hedges were de-designated and all underlying forecast transactions remain highly probable to occur as originally forecast.

106
Notes to the Financial Statements
27. Financial instruments (continued)
fAIR vALUE ESTImATIONThe fair values of financial instruments traded in active markets (such as available-for-sale securities) are based on quoted market prices at the reporting date. The quoted market prices used for financial assets held by the consolidated entity are the current bid prices for the assets.
The fair values of financial instruments that are not traded in an active market (for example, over-the-counter derivatives) are determined by using valuation techniques. The consolidated entity uses valuation techniques consistent with the established valuation methodology and general market practice applicable to each instrument/market. Quoted market prices or dealer quotes for similar instruments are used for long-term debt.
The fair values of interest rate swaps and cross currency interest rate swaps are calculated using the present value of the estimated future cash flows of these instruments.
The fair values of forward foreign exchange contracts are determined using quoted forward exchange rates at the reporting date.
The fair values of commodity swaps and futures are calculated using the present value of the estimated future cash flows using available market forward prices.
The fair values of commodity option contracts which are regularly traded are determined based on the most recent available transaction prices for the same instruments.
Certain commodity derivative instruments utilised by the consolidated entity are not regularly traded and there is no observable market prices or transactions for equivalent or substantially similar instruments. Valuation techniques are required in order to estimate the fair value of such instruments. The valuation technique estimates the fair value of the avoided cost of physical assets at the valuation date required to achieve an equivalent risk management outcome for the consolidated entity, taking into account all relevant variables including capital costs, fixed and variable operating costs, efficiency factors and asset lives. Valuation techniques require the use of a range of variables and assumptions. Maximum use is made of all relevant independent and observable market data when selecting variables and developing assumptions for valuation techniques.
Each instrument is discounted at the market interest rate appropriate to the instrument.
Where the fair value of a derivative is calculated as the present value of the estimated future cash flows of the instrument, there are two key variables used:
• appropriate market pricing data (for the relevant underlying interest rates, foreign exchange rates or commodity prices); and
• discount rates.
For derivative instruments, both of these variables are taken from observed market pricing data at the valuation date and therefore these variables represent those which would be used by market participants to execute and value the instruments.
The nominal value of trade receivables (less impairment allowance) and payables approximate their fair values.
Fairvaluehierarchy
The table below summarises the financial instruments carried at fair value, by valuation method. The different levels in the hierarchy are defined as follows:
• Level 1: quoted prices (unadjusted) in active markets for identical instruments.
• Level 2: inputs other than quoted prices included within Level 1 that are observable for the instrument, either directly (as prices) or indirectly (derived from prices).
• Level 3: one or more key inputs for the instrument are not based on observable market data (unobservable inputs).
2010$million
Note Level 1 Level 2 Level 3 Total
Available-for-sale financial assets 9 15 – – 15
Derivative financial assets 9 – 266 148 414
Derivative financial liabilities 17 – (550) (29) (579)
15 (284) 119 (150)
2009$million
Available-for-sale financial assets 9 30 _ _ 30
Derivative financial assets 9 – 511 50 561
Derivative financial liabilities 17 – (777) (40) (817)
30 (266) 10 (226)

ORIGIN ENERGY ANNUAL REPORT 2010 107
Notes to the Financial Statements
28. Acquisition, disposal and deconsolidation of controlled entities2010
$million
date of acquisition/disposal/
deconsolidationInterest
acquiredcarrying amount
Net consideration
paidBeneficial
ownership
The following entities were acquired during the period:
Cogent Energy Pty Ltd 24 July 2009 100% 15 8 100%
Origin Energy ATP 788P Pty Ltd 7 August 2009 100% 661 661 100%
Origin Energy ATP 788P Unit Trust 7 August 2009 100% – – 100%
The following entities were incorporated/registered during the period:
Origin Energy Chile S.A. (Chile) 8 July 2009
Origin Foundation Pty Ltd 9 December 2009
Yass Valley Wind Farm Pty Ltd 8 December 2009
Origin Energy (Block 31) Pte Ltd 11 December 2009
Origin Energy (Block 01) Pte Ltd 11 December 2009
Origin Energy (L15/50) Pte Ltd 11 December 2009
Origin Energy (L26/50) Pte Ltd 11 December 2009
Origin Energy (Savannahket) Pte Ltd 11 December 2009
Origin Tata Geothermal Pte Ltd 19 April 2010
OTP Geothermal Pte Ltd 19 April 2010
OEL US Inc. 21 April 2010
Origin Energy Mortlake Terminal Station No. 1 Pty Ltd 5 May 2010
Origin Energy Mortlake Terminal Station No. 2 Pty Ltd 5 May 2010
The following entity was deregistered during the period:
Origin Energy ATP 788P Unit Trust 24 December 2009
The following entities ceased to be controlled during the period:
Transform Solar Pty Ltd 18 December 2009
On 18 December 2009 Origin entered into a joint venture with Micron Technology (Micron) with a focus on the development of photovoltaic solar technology. On completion, Transform Solar Pty Ltd (formerly Origin Energy Solar Pty Ltd) issued shares to Micron, providing Micron with a 50% interest in Transform Solar Pty Ltd. Transform Solar Pty Ltd was deconsolidated from the Origin consolidated entity resulting in a pre-tax gain of $38 million. From the inception date of the joint venture, Origin equity accounts for its retained 50% interest in Transform Solar Pty Ltd, refer note 10.
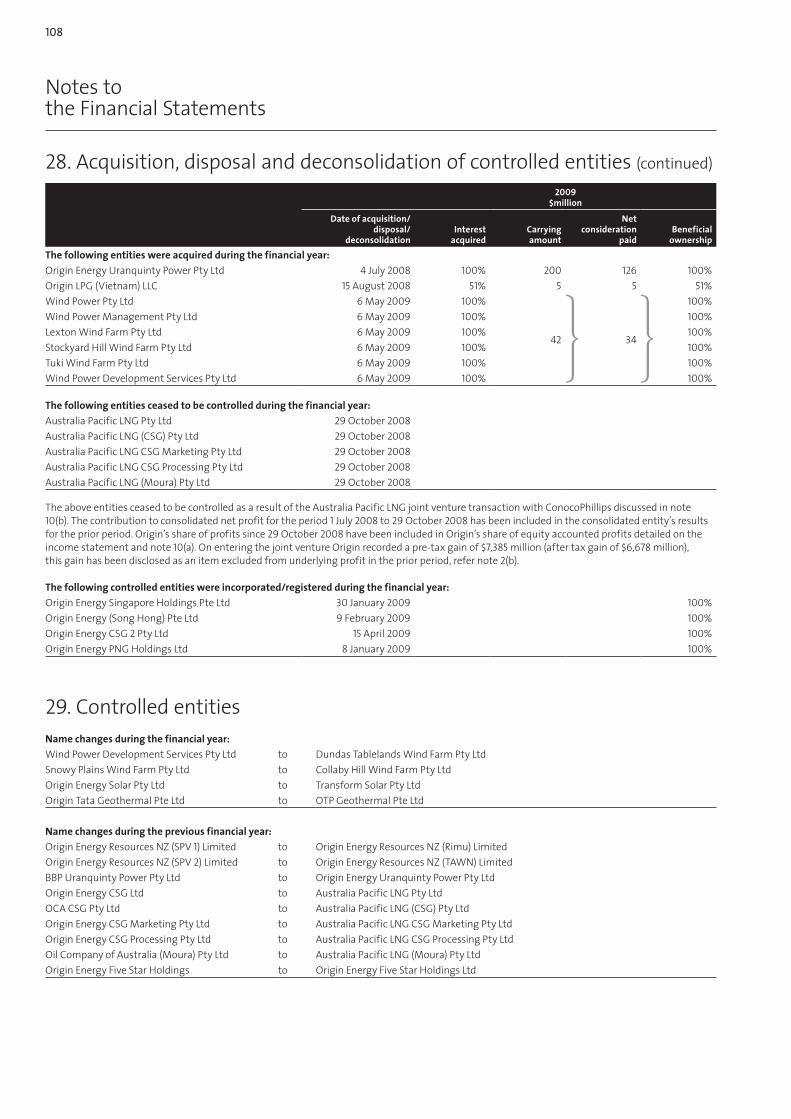
108
Notes to the Financial Statements
28. Acquisition, disposal and deconsolidation of controlled entities (continued)
2009$million
date of acquisition/disposal/
deconsolidationInterest
acquiredcarrying amount
Net consideration
paidBeneficial
ownership
The following entities were acquired during the financial year:
Origin Energy Uranquinty Power Pty Ltd 4 July 2008 100% 200 126 100%
Origin LPG (Vietnam) LLC 15 August 2008 51% 5 5 51%
Wind Power Pty Ltd 6 May 2009 100%
42 34
100%
Wind Power Management Pty Ltd 6 May 2009 100% 100%
Lexton Wind Farm Pty Ltd 6 May 2009 100% 100%
Stockyard Hill Wind Farm Pty Ltd 6 May 2009 100% 100%
Tuki Wind Farm Pty Ltd 6 May 2009 100% 100%
Wind Power Development Services Pty Ltd 6 May 2009 100% 100%
The following entities ceased to be controlled during the financial year:
Australia Pacific LNG Pty Ltd 29 October 2008
Australia Pacific LNG (CSG) Pty Ltd 29 October 2008
Australia Pacific LNG CSG Marketing Pty Ltd 29 October 2008
Australia Pacific LNG CSG Processing Pty Ltd 29 October 2008
Australia Pacific LNG (Moura) Pty Ltd 29 October 2008
The above entities ceased to be controlled as a result of the Australia Pacific LNG joint venture transaction with ConocoPhillips discussed in note 10(b). The contribution to consolidated net profit for the period 1 July 2008 to 29 October 2008 has been included in the consolidated entity’s results for the prior period. Origin’s share of profits since 29 October 2008 have been included in Origin’s share of equity accounted profits detailed on the income statement and note 10(a). On entering the joint venture Origin recorded a pre-tax gain of $7,385 million (after tax gain of $6,678 million), this gain has been disclosed as an item excluded from underlying profit in the prior period, refer note 2(b).
The following controlled entities were incorporated/registered during the financial year:
Origin Energy Singapore Holdings Pte Ltd 30 January 2009 100%
Origin Energy (Song Hong) Pte Ltd 9 February 2009 100%
Origin Energy CSG 2 Pty Ltd 15 April 2009 100%
Origin Energy PNG Holdings Ltd 8 January 2009 100%
29. Controlled entitiesName changes during the financial year:
Wind Power Development Services Pty Ltd to Dundas Tablelands Wind Farm Pty Ltd
Snowy Plains Wind Farm Pty Ltd to Collaby Hill Wind Farm Pty Ltd
Origin Energy Solar Pty Ltd to Transform Solar Pty Ltd
Origin Tata Geothermal Pte Ltd to OTP Geothermal Pte Ltd
Name changes during the previous financial year:
Origin Energy Resources NZ (SPV 1) Limited to Origin Energy Resources NZ (Rimu) Limited
Origin Energy Resources NZ (SPV 2) Limited to Origin Energy Resources NZ (TAWN) Limited
BBP Uranquinty Power Pty Ltd to Origin Energy Uranquinty Power Pty Ltd
Origin Energy CSG Ltd to Australia Pacific LNG Pty Ltd
OCA CSG Pty Ltd to Australia Pacific LNG (CSG) Pty Ltd
Origin Energy CSG Marketing Pty Ltd to Australia Pacific LNG CSG Marketing Pty Ltd
Origin Energy CSG Processing Pty Ltd to Australia Pacific LNG CSG Processing Pty Ltd
Oil Company of Australia (Moura) Pty Ltd to Australia Pacific LNG (Moura) Pty Ltd
Origin Energy Five Star Holdings to Origin Energy Five Star Holdings Ltd
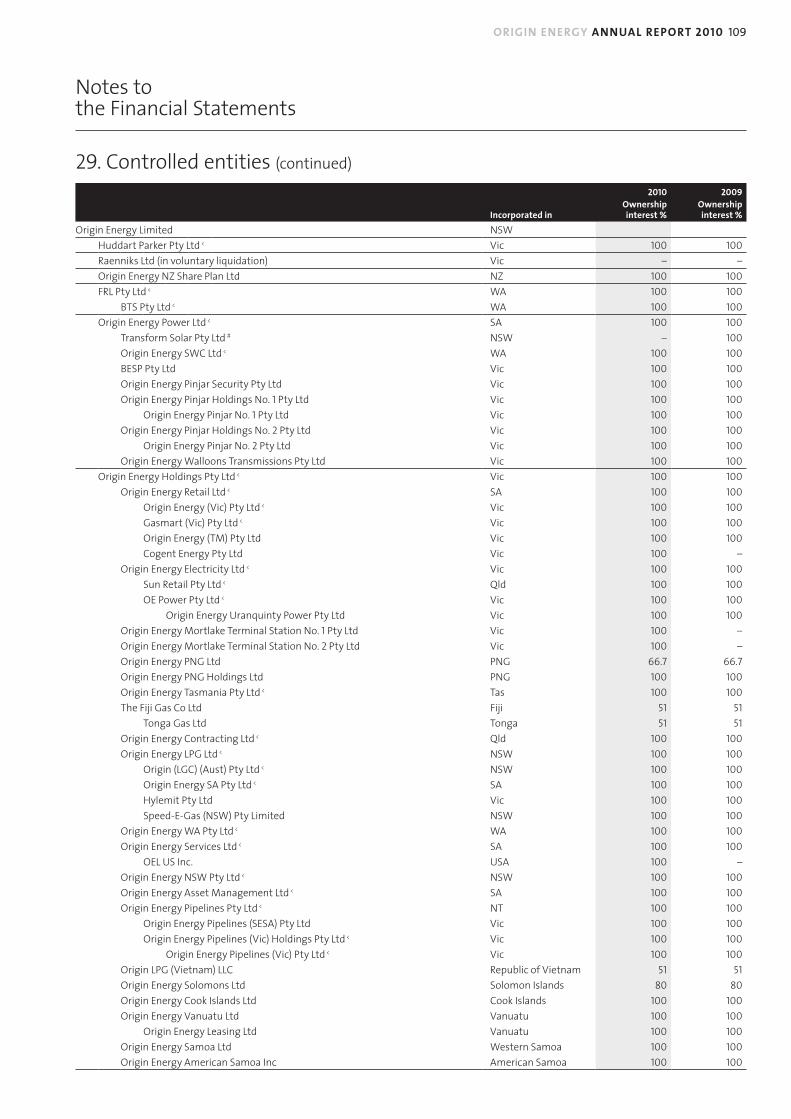
ORIGIN ENERGY ANNUAL REPORT 2010 109
Notes to the Financial Statements
29. Controlled entities (continued)
2010 2009
Incorporated inOwnership interest %
Ownership interest %
Origin Energy Limited NSW
Huddart Parker Pty Ltd < Vic 100 100
Raenniks Ltd (in voluntary liquidation) Vic – –
Origin Energy NZ Share Plan Ltd NZ 100 100
FRL Pty Ltd < WA 100 100
BTS Pty Ltd < WA 100 100
Origin Energy Power Ltd < SA 100 100
Transform Solar Pty Ltd # NSW – 100
Origin Energy SWC Ltd < WA 100 100
BESP Pty Ltd Vic 100 100
Origin Energy Pinjar Security Pty Ltd Vic 100 100
Origin Energy Pinjar Holdings No. 1 Pty Ltd Vic 100 100
Origin Energy Pinjar No. 1 Pty Ltd Vic 100 100
Origin Energy Pinjar Holdings No. 2 Pty Ltd Vic 100 100
Origin Energy Pinjar No. 2 Pty Ltd Vic 100 100
Origin Energy Walloons Transmissions Pty Ltd Vic 100 100
Origin Energy Holdings Pty Ltd < Vic 100 100
Origin Energy Retail Ltd < SA 100 100
Origin Energy (Vic) Pty Ltd < Vic 100 100
Gasmart (Vic) Pty Ltd < Vic 100 100
Origin Energy (TM) Pty Ltd Vic 100 100
Cogent Energy Pty Ltd Vic 100 –
Origin Energy Electricity Ltd < Vic 100 100
Sun Retail Pty Ltd < Qld 100 100
OE Power Pty Ltd < Vic 100 100
Origin Energy Uranquinty Power Pty Ltd Vic 100 100
Origin Energy Mortlake Terminal Station No. 1 Pty Ltd Vic 100 –
Origin Energy Mortlake Terminal Station No. 2 Pty Ltd Vic 100 –
Origin Energy PNG Ltd PNG 66.7 66.7
Origin Energy PNG Holdings Ltd PNG 100 100
Origin Energy Tasmania Pty Ltd < Tas 100 100
The Fiji Gas Co Ltd Fiji 51 51
Tonga Gas Ltd Tonga 51 51
Origin Energy Contracting Ltd < Qld 100 100
Origin Energy LPG Ltd < NSW 100 100
Origin (LGC) (Aust) Pty Ltd < NSW 100 100
Origin Energy SA Pty Ltd < SA 100 100
Hylemit Pty Ltd Vic 100 100
Speed-E-Gas (NSW) Pty Limited NSW 100 100
Origin Energy WA Pty Ltd < WA 100 100
Origin Energy Services Ltd < SA 100 100
OEL US Inc. USA 100 –
Origin Energy NSW Pty Ltd < NSW 100 100
Origin Energy Asset Management Ltd < SA 100 100
Origin Energy Pipelines Pty Ltd < NT 100 100
Origin Energy Pipelines (SESA) Pty Ltd Vic 100 100
Origin Energy Pipelines (Vic) Holdings Pty Ltd < Vic 100 100
Origin Energy Pipelines (Vic) Pty Ltd < Vic 100 100
Origin LPG (Vietnam) LLC Republic of Vietnam 51 51
Origin Energy Solomons Ltd Solomon Islands 80 80
Origin Energy Cook Islands Ltd Cook Islands 100 100
Origin Energy Vanuatu Ltd Vanuatu 100 100
Origin Energy Leasing Ltd Vanuatu 100 100
Origin Energy Samoa Ltd Western Samoa 100 100
Origin Energy American Samoa Inc American Samoa 100 100

110
Notes to the Financial Statements
29. Controlled entities (continued)
2010 2009
Incorporated inOwnership interest %
Ownership interest %
Origin Energy Resources Ltd < SA 100 100
Origin Energy CSG 2 Pty Ltd Vic 100 100
Origin Energy ATP 788P Pty Ltd Qld 100 –
Angari Pty Ltd < SA 100 100
Oil Investments Pty Ltd < SA 100 100
OCA Holdings Pty Ltd Qld 100 100
Origin Energy Wallumbilla Transmissions Pty Ltd Vic 100 100
Oil Company of Australia (Moura) Transmissions Pty Ltd < WA 100 100
Origin Energy Kenya Pty Ltd Vic 100 100
Origin Energy Bonaparte Pty Ltd < SA 100 100
Origin Energy Developments Pty Ltd < ACT 100 100
Origin Energy Zoca 91-08 Pty Ltd < SA 100 100
Origin Energy Petroleum Pty Ltd < Qld 100 100
Origin Energy Northwest Ltd UK 100 100
Sagasco Southeast Inc Panama 100 100
Origin Energy Resources NZ Ltd NZ 100 100
Kupe Development Ltd NZ 100 100
Kupe Mining (No.1) Ltd NZ 100 100
Origin Energy Resources (Kupe) Ltd NZ 100 100
Origin Energy Resources NZ (Rimu) Ltd NZ 100 100
Origin Energy Resources NZ (TAWN) Ltd NZ 100 100
Sagasco NT Pty Ltd < SA 100 100
Sagasco Amadeus Pty Ltd < SA 100 100
Origin Energy Amadeus Pty Ltd < Qld 100 100
Amadeus United States Pty Ltd < Qld 100 100
OE Resources Limited Partnership NSW 100 100
Origin Energy Vietnam Pty Ltd Vic 100 100
Origin Energy Singapore Holdings Pte Ltd Singapore 100 100
Origin Energy (Song Hong) Pte Ltd Singapore 100 100
Origin Energy (Block 31) Pte Limited Singapore 100 –
Origin Energy (Block 01) Pte Limited Singapore 100 –
Origin Energy (L15/50) Pte Limited Singapore 100 –
Origin Energy (L26/50) Pte Limited Singapore 100 –
Origin Energy (Savannahket) Pte Limited Singapore 100 –
Origin Energy Fairview Transmissions Pty Ltd Vic 100 100
Origin Energy VIC Holdings Pty Ltd < Vic 100 100
Origin Energy New Zealand Ltd NZ 100 100
Origin Energy Universal Holdings Ltd NZ 100 100
Origin Energy Five Star Holdings Ltd NZ 100 100
Origin Energy Contact Finance Ltd NZ 100 100
Origin Energy Contact Finance No.2 Ltd NZ 100 100
Origin Energy Pacific Holdings Ltd NZ 100 100
Contact Energy Ltd NZ 51.8 51.4
Contact Australia Pty Ltd Vic 51.8 51.4
Contact Aria Ltd NZ 51.8 51.4
Contact Operations Australia Pty Ltd Vic 51.8 51.4
Contact Wind Ltd NZ 51.8 51.4
Empower Ltd NZ 51.8 51.4
Stratford Power Ltd NZ 51.8 51.4
Rockgas Holdings Ltd NZ 51.8 51.4
Rockgas Ltd NZ 51.8 51.4
Origin Energy Capital Ltd < Vic 100 100
Origin Energy Finance Company Pty Ltd < Vic 100 100
OE JV Co Pty Ltd < Vic 100 100
OE JV Holdings Pty Ltd Vic 100 100
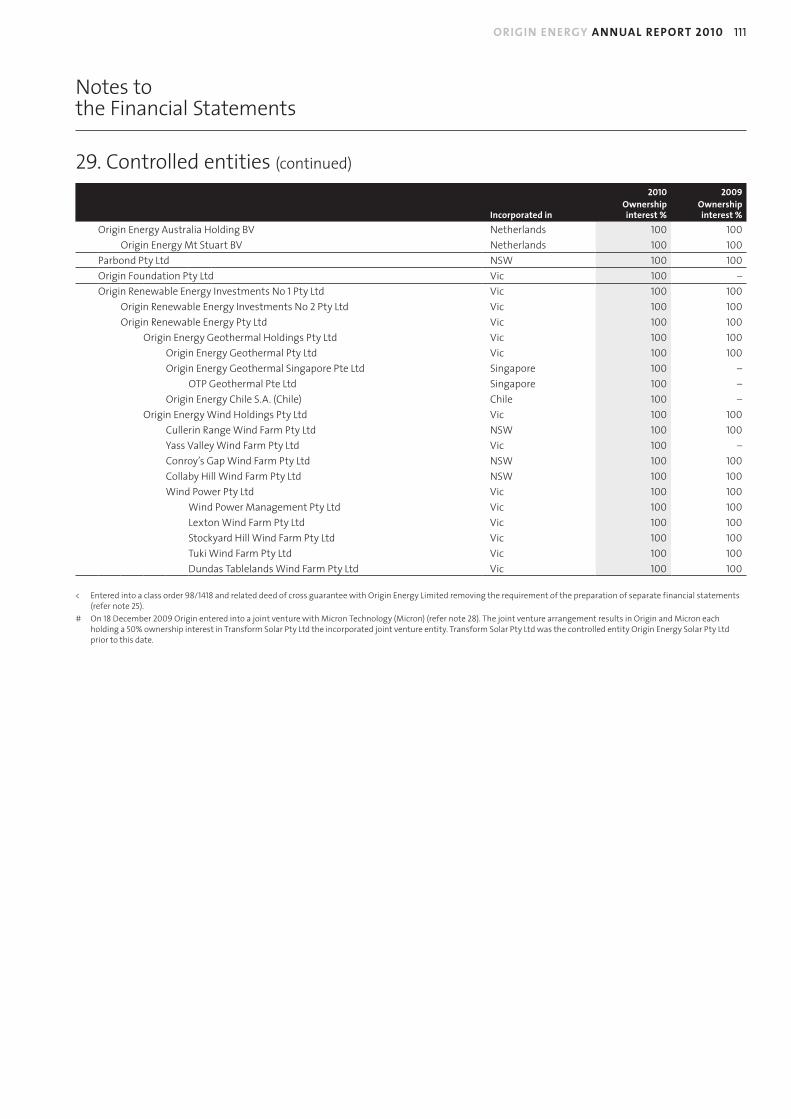
ORIGIN ENERGY ANNUAL REPORT 2010 111
Notes to the Financial Statements
29. Controlled entities (continued)
2010 2009
Incorporated inOwnership interest %
Ownership interest %
Origin Energy Australia Holding BV Netherlands 100 100
Origin Energy Mt Stuart BV Netherlands 100 100
Parbond Pty Ltd NSW 100 100
Origin Foundation Pty Ltd Vic 100 –
Origin Renewable Energy Investments No 1 Pty Ltd Vic 100 100
Origin Renewable Energy Investments No 2 Pty Ltd Vic 100 100
Origin Renewable Energy Pty Ltd Vic 100 100
Origin Energy Geothermal Holdings Pty Ltd Vic 100 100
Origin Energy Geothermal Pty Ltd Vic 100 100
Origin Energy Geothermal Singapore Pte Ltd Singapore 100 –
OTP Geothermal Pte Ltd Singapore 100 –
Origin Energy Chile S.A. (Chile) Chile 100 –
Origin Energy Wind Holdings Pty Ltd Vic 100 100
Cullerin Range Wind Farm Pty Ltd NSW 100 100
Yass Valley Wind Farm Pty Ltd Vic 100 –
Conroy’s Gap Wind Farm Pty Ltd NSW 100 100
Collaby Hill Wind Farm Pty Ltd NSW 100 100
Wind Power Pty Ltd Vic 100 100
Wind Power Management Pty Ltd Vic 100 100
Lexton Wind Farm Pty Ltd Vic 100 100
Stockyard Hill Wind Farm Pty Ltd Vic 100 100
Tuki Wind Farm Pty Ltd Vic 100 100
Dundas Tablelands Wind Farm Pty Ltd Vic 100 100
< Entered into a class order 98/1418 and related deed of cross guarantee with Origin Energy Limited removing the requirement of the preparation of separate financial statements (refer note 25).
# On 18 December 2009 Origin entered into a joint venture with Micron Technology (Micron) (refer note 28). The joint venture arrangement results in Origin and Micron each holding a 50% ownership interest in Transform Solar Pty Ltd the incorporated joint venture entity. Transform Solar Pty Ltd was the controlled entity Origin Energy Solar Pty Ltd prior to this date.

112
Notes to the Financial Statements
30. Interest in joint venture operationsThe consolidated entity holds interests in a number of unincorporated joint ventures.
2010 2009$million $million
Other joint venture information
Sales value of products directly received 468 495
Joint venture profit before tax 54 130
Contingent liabilities (included in note 25) – 3
Capital commitments (included in note 26) 599 437
major assets
Cooper Basin Denison Trough
Bowen Basin Peat
Bass Basin Perth Basin
Kupe Worsley Power Plant
Otway Basin Geodynamics
Surat Basin South East Asia joint ventures
The principal activities of most of these joint ventures are oil and/or gas exploration, development and production, and power generation.
The assets and liabilities of the consolidated entity include the following items which represent the consolidated entity’s interest in the assets and liabilities employed in unincorporated joint ventures, recorded in accordance with the accounting policies described in note 1:
current assets
Cash and cash equivalents 18 27
Trade and other receivables 5 15
Inventories 63 71
Other assets 2 2
Total current assets 88 115
Non-current assets
Trade and other receivables – 2
Producing areas of interest 524 373
Property, plant and equipment 1,224 1,037
Exploration, evaluation and development expenditure 330 174
Other assets – 1
Total non-current assets 2,078 1,587
Total assets 2,166 1,702
current liabilities
Trade and other payables 225 316
Total current liabilities 225 316
Non-current liabilities
Trade and other payables – 1
Tax liabilities 23 17
Provisions 99 67
Total non-current liabilities 122 85
Total liabilities 347 401
Net investment in joint venture operations 1,819 1,301

ORIGIN ENERGY ANNUAL REPORT 2010 113
Notes to the Financial Statements
31. Share-based payments(A) SENIOR ExEcUTIvE OPTION PLANThe company’s Senior Executive Option Plan was approved at the annual general meeting on 13 November 1995. Staff eligible to participate in the plan are those senior executives invited by the Board, with the invitation based on performance and the role the individual plays in guiding the future success of the company. Options granted under the plan entitle the holder to subscribe for one fully paid ordinary share per option. The exercise price of the options is based on the weighted average price of the company’s shares during a five day period determined by the Board to be representative of the company’s position at the time. Except in certain circumstances applicable to specific option tranches, the options are exercisable subject to performance hurdles being met, at any time after the third anniversary of the grant and prior to the expiry date of the options. The performance hurdles that must be met prior to an option becoming exercisable vary by option tranche and are discussed in the footnotes to the Senior Executive Options table in this note. Options granted under the plan do not carry any dividend or voting rights.
During the year, the company issued 1,636,600 options (2009: 1,274,500 options). The exercise prices of the options issued during the year are included in the Senior Executives Option table in this note. The fair value of the options granted is recognised as an employee expense with a corresponding increase in equity. The fair value is measured at grant date using a binomial model, taking into account market performance conditions and is recognised over the vesting period during which the employees become unconditionally entitled to the options. The amount recognised as an expense is adjusted to reflect the actual number of options that vest except where forfeiture is due to market related conditions. The company has recognised $5,079,000 (2009: $5,729,000) as an expense during the year.
The amount recognised in issued capital in the financial statements of the company for the financial year represents the proceeds received from exercise of options and is as follows:
2010 2009Note $million $million
Issued ordinary share capital 21 13 25
Details of options outstanding at the beginning and the end of the financial year and movements during the year are provided in the Senior Executives Options table in note 31(d).
(B) ORIGIN ENERGY SENIOR ExEcUTIvE PERfORmANcE ShARE RIGhTS PLANThe Board approved the Senior Executive Performance Share Rights Plan (PSR Plan) on 17 September 2007. Staff eligible to participate in the plan are those senior executives invited by the Board, with the invitation based on performance and the role the individual plays in guiding the future success of the company. The Performance Share Rights (PSRs) granted under the plan entitle the holder to subscribe for one fully paid ordinary share per PSR, or such other number as adjusted in accordance with the terms of the PSR Plan. The PSRs are unlisted. The exercise price of the PSRs is nil unless otherwise determined by the Board. Except in certain circumstances applicable to specific PSR tranches, the PSRs are exercisable at any time, subject to performance hurdles being met, after the third anniversary of the grant and prior to the expiry date of the options.
The performance hurdles that must be met prior to a PSR becoming exercisable may vary by PSR tranche and are discussed in the footnotes to the Performance Share Rights table in note 31(e). PSRs granted under the plan do not carry any dividend or voting rights.
During the year, the company issued 607,400 PSRs (2009: 505,900). The fair value of the PSRs is recognised as an employee expense with a corresponding increase in equity. The fair value is measured at grant date using a binomial model, taking into account market performance conditions and is recognised over the vesting period during which the employees become unconditionally entitled to the PSRs. The amount recognised as an expense is adjusted to reflect the actual number of PSRs that vest except where forfeiture is due to market related conditions. The company has recognised $5,052,000 (2009: $3,433,000) as an expense during the year.
Details of performance share rights outstanding at the beginning and the end of the financial year and movements during the year are provided in the Senior Executives Performance Share Rights table in note 31(e).
(c) EmPLOYEE ShARE PLANThe Board approved the Origin Energy Employee Share Plan (Origin ESP) on 20 March 2001. All Origin Energy full-time and permanent part-time employees based in Australia with at least one year of service qualify for participation in the Origin ESP. Under the Origin ESP, up to $1,000 worth of fully paid shares are offered to all qualifying employees, in each year in which the Origin ESP is in effect, for no consideration. Shares are awarded under the terms of the Origin ESP in recognition of the contribution employees make to the overall success of Origin Energy, based on performance hurdles established each year. In addition, in the current year under the same terms as the Origin ESP, all qualifying employees received 20 shares for no consideration for the 10th anniversary of the company. The Origin ESP is a Taxed Up Front Employee Share Scheme (eligible for $1,000 concession) under amendments to the Income Tax Assessment Act 1997 (Cth).
Origin Energy Limited shares awarded under the Origin ESP to Australian-based employees are registered as restricted shares which can not be sold for three years from the date of award unless the employee ceases employment. The shares awarded in the name of the qualifying employee, are not subject to forfeiture and vest at the date of award to the employee. Shares awarded under the Origin ESP rank equally with other fully paid ordinary shares on issue and carry full voting and dividend rights.
To enable Origin Energy employees based in New Zealand to receive benefits similar to those of Australian-based employees, the Board has approved the Origin Energy New Zealand Employee Share Plan (New Zealand ESP). The terms and benefits awarded under the New Zealand ESP are similar to those of the Origin ESP and all full-time and permanent part-time employees with at least one year of service qualify for participation in the plan. Under the New Zealand ESP, up to $1,000 worth of fully paid shares are offered to all qualifying employees, in each year in which the New Zealand ESP is in effect, for no consideration.
Shares awarded under the New Zealand ESP are restricted shares which cannot be sold for three years from the date of award and employees may elect to either receive the shares in their name at the time of award or have the shares placed into trust. Shares received by employees in their name at the date of award are not subject to forfeiture and vest at the date of award. Shares held in trust are subject to a three year vesting period before being allocated to employees and may be forfeited if employees do not remain employees of Origin Energy for the full three year vesting period.
Separate plans and procedures, adapting for local laws, have also been implemented to enable employees not based in Australia or New Zealand to receive benefits similar to those awarded under the Origin ESP and the New Zealand ESP.

114
Notes to the Financial Statements
31. Share-based payments (continued)
(c) EmPLOYEE ShARE PLAN (continued)
The following table details the shares awarded under the employee share plans for the years ended 30 June 2010 and 30 June 2009:
2010
date shares grantedNumber of
shares granted cost per share (2)Total cost
$’000
31 March 2010 67,320 $16.77 1,129
31 March 2010 (1) 2,380 $0.00 –
69,700 1,129
2009
30 September 2008 127,527 $16.30 2,079
24 October 2008 (1) 480 $0.00 –
128,007 2,079
(1) Shares awarded to New Zealand-based employees at no cost in the current period as the shares were granted from forfeited shares acquired at market prices in prior periods.
(2) The cost per share represents the weighted average on-market purchase price of the company’s shares.
Under the New Zealand ESP, employees may elect to either receive the shares awarded to them in their name or have the shares placed in trust at the date of award. Shares placed in trust have a three year vesting period. During the year ended 30 June 2010, 20 shares (2009: Nil) were vested to the trust under the New Zealand ESP. During the year ended 30 June 2010, Nil shares (2009: Nil) held in trust vested to employees. The number of shares held in trust under the New Zealand ESP as at 30 June 2010 is 18,804 (2009: 21,164).

ORIGIN ENERGY ANNUAL REPORT 2010 115
Notes to the Financial Statements
31. Share-based payments (continued)
(d) SUmmARY Of SENIOR ExEcUTIvE OPTIONS
2010
Grant datefirst exercise
date Expiry date
Exercise price per
option
hurdle price per
share
Balance at start of the
year Issued Exercised (3)Balance at end
of the yearvested at end
of the year
6 Aug 2004 6 Aug 2007 6 Aug 2009 $5.98 (2) (1) 275,000 – 275,000 – –
26 Nov 2004 26 Nov 2007 26 Nov 2009 $5.72 (2) (1) 698,900 – 698,900 – –
7 Sep 2005 7 Sep 2008 7 Sep 2010 $7.21 (1) 1,811,000 – 378,000 1,433,000 1,433,000
11 Sep 2006 11 Sep 2009 11 Sep 2011 $6.50 (1) 2,131,300 – 761,300 1,370,000 1,370,000
26 Jun 2007 26 Jun 2010 26 Jun 2012 $8.97 (1) 50,000 – – 50,000 50,000
28 Sep 2007 28 Sep 2010 28 Dec 2012 $10.32 (1) 1,649,000 – – 1,649,000 –
28 Sep 2007 28 Sep 2010 28 Sep 2012 $10.32 (1) 300,000 – – 300,000 300,000
30 Sep 2008 30 Sep 2011 30 Dec 2013 $16.30 (1) 1,274,500 – – 1,274,500 –
28 Sep 2009 28 Sep 2012 28 Dec 2014 $15.04 (1) – 1,213,000 – 1,213,000 –
6 Nov 2009 6 Nov 2012 6 Feb 2015 $15.93 (1) – 412,000 – 412,000 –
10 May 2010 10 May 2013 10 Aug 2015 $15.35 (1) – 11,600 – 11,600 –
8,189,700 1,636,600 2,113,200 7,713,100 3,153,000
Key management personnel 3,716,000 682,000 1,085,000 3,313,000 1,650,000
Non-key management personnel 4,473,700 954,600 1,028,200 4,400,100 1,503,000
8,189,700 1,636,600 2,113,200 7,713,100 3,153,000
2009
19 Dec 2003 19 Dec 2006 19 Dec 2008 $4.15 (2) (1) 1,599,000 – 1,599,000 – –
6 Aug 2004 6 Aug 2007 6 Aug 2009 $5.98 (2) (1) 775,000 – 500,000 275,000 275,000
26 Nov 2004 26 Nov 2007 26 Nov 2009 $5.72 (2) (1) 1,517,200 – 818,300 698,900 698,900
20 May 2005 20 May 2008 20 May 2010 $6.75 (1) 100,000 – 100,000 – –
7 Sep 2005 7 Sep 2008 7 Sep 2010 $7.21 (1) 2,648,000 – 837,000 1,811,000 1,811,000
11 Sep 2006 11 Sep 2009 11 Sep 2011 $6.50 (1) 2,762,000 – 630,700 2,131,300 2,131,300
26 Jun 2007 26 Jun 2010 26 Jun 2012 $8.97 (1) 50,000 – – 50,000 50,000
28 Sep 2007 28 Sep 2010 28 Dec 2012 $10.32 (1) 1,649,000 – – 1,649,000 –
28 Sep 2007 28 Sep 2010 28 Sep 2012 $10.32 (1) 300,000 – – 300,000 300,000
30 Sep 2008 30 Sep 2011 30 Dec 2013 $16.30 (1) – 1,274,500 – 1,274,500 –
11,400,200 1,274,500 4,485,000 8,189,700 5,266,200
Key management personnel 4,771,000 629,000 1,684,000 3,716,000 2,735,000
Non-key management personnel 6,629,200 645,500 2,801,000 4,473,700 2,531,200
11,400,200 1,274,500 4,485,000 8,189,700 5,266,200
(1) The performance hurdle for these options is based on the Total Shareholder Return (TSR) index, i.e. the index measuring total shareholder returns maintained by the Australian Securities Exchange that calculates the share price movement of ordinary shares after notional reinvestment of dividends. Whether the exercise hurdle is satisfied within the exercise period is determined by comparing the TSR index of the company with the TSR index of a predetermined reference group of Australian listed companies. The percentage of options that may be exercised is calculated on a sliding scale dependent upon the company’s performance against the reference group of companies. If the Origin Energy TSR exceeds the 50th percentile, 50% of the options may be exercised and if it reaches the 75th percentile, 100% of the options may be exercised. The reference group of companies is available to shareholders and may be accessed via the company’s website. In certain circumstances the options may be exercised prior to the first exercise date. More details of the performance hurdles are included in the Remuneration Report in paragraph 4.3.
(2) Exercise prices have been adjusted to reflect the impact of the Rights Issue in February 2005.
(3) The weighted average share price during the year ended 30 June 2010 was $15.79 (2009: $15.44).

116
Notes to the Financial Statements
31. Share-based payments (continued)
(E) SUmmARY Of SENIOR ExEcUTIvE PERfORmANcE ShARE RIGhTS (PSRs)
2010
Grant datefirst exercise
date Expiry dateExercise
price per PSRhurdle price
per share
Balance at start of the
year Issued Exercised Balance at end
of the yearvested at end
of the year
28 Sep 2007 28 Sep 2010 28 Dec 2012 Nil (1) 544,000 – – 544,000 –
14 Nov 2007 14 Nov 2010 14 Feb 2013 Nil (1) 100,000 – – 100,000 –
30 Sep 2008 30 Sep 2011 30 Dec 2013 Nil (1) 505,900 – – 505,900 –
28 Sep 2009 28 Sep 2012 28 Dec 2014 Nil (1) – 453,200 – 453,200 –
6 Nov 2009 6 Nov 2012 6 Feb 2015 Nil (1) – 150,000 – 150,000 –
10 May 2010 10 May 2013 10 Aug 2015 Nil (1) – 4,200 – 4,200 –
1,149,900 607,400 – 1,757,300 –
Key management personnel 472,000 252,500 – 724,500 –
Non-key management personnel 677,900 354,900 – 1,032,800 –
1,149,900 607,400 – 1,757,300 –
2009
28 Sep 2007 28 Sep 2010 28 Dec 2012 Nil (1) 544,000 – – 544,000 –
28 Sep 2007 28 Sep 2010 28 Sep 2012 Nil (1) 100,000 – 100,000 – –
14 Nov 2007 14 Nov 2010 14 Feb 2013 Nil (1) 100,000 – – 100,000 –
30 Sep 2008 30 Sep 2011 30 Dec 2013 Nil (1) – 505,900 – 505,900 –
744,000 505,900 100,000 1,149,900 –
Key management personnel 328,500 243,500 100,000 472,000 –
Non-key management personnel 415,500 262,400 – 677,900 –
744,000 505,900 100,000 1,149,900 –
(1) The performance hurdle which must be met for the PSRs to be exercised is based on the Total Shareholder Return (TSR) index, i.e. the index measuring total shareholder returns maintained by the Australian Securities Exchange that calculates the share price movement of ordinary shares after notional reinvestment of dividends. Whether the exercise hurdle is satisfied within the exercise period is determined by comparing the TSR index of the company with the TSR index of a predetermined reference group of top 100 Australian listed companies. The percentage of PSRs that may be exercised is calculated on a sliding scale dependent upon the company’s performance against the reference group of companies. If the Origin Energy TSR exceeds the 50th percentile, 50% of the PSRs may be exercised and if it reaches the 75th percentile, 100% of the PSRs may be exercised. The reference group of companies is available to shareholders and may be accessed via the company’s website. In certain circumstances the PSRs may be exercised prior to the first exercise date. More details of the performance hurdles are included in the Remuneration Report in paragraph 4.3.
32. Related party disclosures
ASSOcIATEd ENTITIESInterests held in equity accounted entities are set out in note 10. The business activities of a number of these entities are conducted under joint venture arrangements. The equity accounted entities conduct business transactions with various controlled entities. Such transactions include purchases and sales of certain products, provision of services and dividends. All transactions were conducted on the basis of normal arm’s length commercial terms and conditions. Refer note 10 for further information regarding these transactions.
Refer to note 33 for key management personnel disclosures.

ORIGIN ENERGY ANNUAL REPORT 2010 117
Notes to the Financial Statements
33. Key management personnel disclosures(A) KEY mANAGEmENT PERSONNEL cOmPENSATION TABLESRefer to the Remuneration Report in the Directors’ Report.
(B) EqUITY INSTRUmENTSRefer to the Remuneration Report in the Directors’ Report for details of the following:
(i) Options over equity instruments granted as compensation;
(ii) Exercise of options granted as compensation; and
(iii) Equity holdings and transactions.
(c) LOANS ANd OThER TRANSAcTIONS WITh KEY mANAGEmENT PERSONNEL
(i)Loans
Refer to the Remuneration Report in the Directors’ Report.
(ii)Othertransactionswiththecompanyoritscontrolledentities
Transactions entered into during the year with key management personnel which are within normal employee, customer or supplier relationships on terms and conditions no more favourable than dealings in the same circumstances on an arm’s length basis include:
• the receipt of dividends from Origin Energy Limited;
• participation in the Employee Share Plan, the Senior Executive Option Plan and the Senior Executive Performance Share Rights Plan;
• terms and conditions of employment;
• reimbursement of expenses; and
• purchases of goods and services.
Certain directors of Origin Energy Limited are also directors of other companies which supply Origin Energy Limited with goods and services or acquire goods or services from Origin Energy Limited. Those transactions are made on an arm’s length basis and are approved by management within delegated limits of authority and the directors do not participate in the decisions to enter into such transactions. If the decision to enter into those transactions should require approval of the Board, the director concerned will not vote upon that decision nor take part in the consideration of it.
34. Deed of cross guaranteeThe following summarised consolidated income statement comprises the company and its controlled entities which are party to the Deed of Cross Guarantee (refer notes 25 and 29), after eliminating all transactions between parties to the Deed.
2010 2009for the year ended 30 June $million $million
Summarised consolidated income statement and retained profits
Profit before income tax expense 716 7,771
Income tax expense 128 678
Profit for the period 588 7,093
Retained earnings at the beginning of the period 8,274 1,866
Adjustment for entities leaving Deed of Cross Guarantee 50 (113)
Adjustment for entities entering Deed of Cross Guarantee – (12)
Retained earnings at the beginning of the period 8,324 1,741
Dividends paid (439) (554)
Aggregate of amounts transferred from reserves – (6)
Retained earnings at the end of the period 8,473 8,274
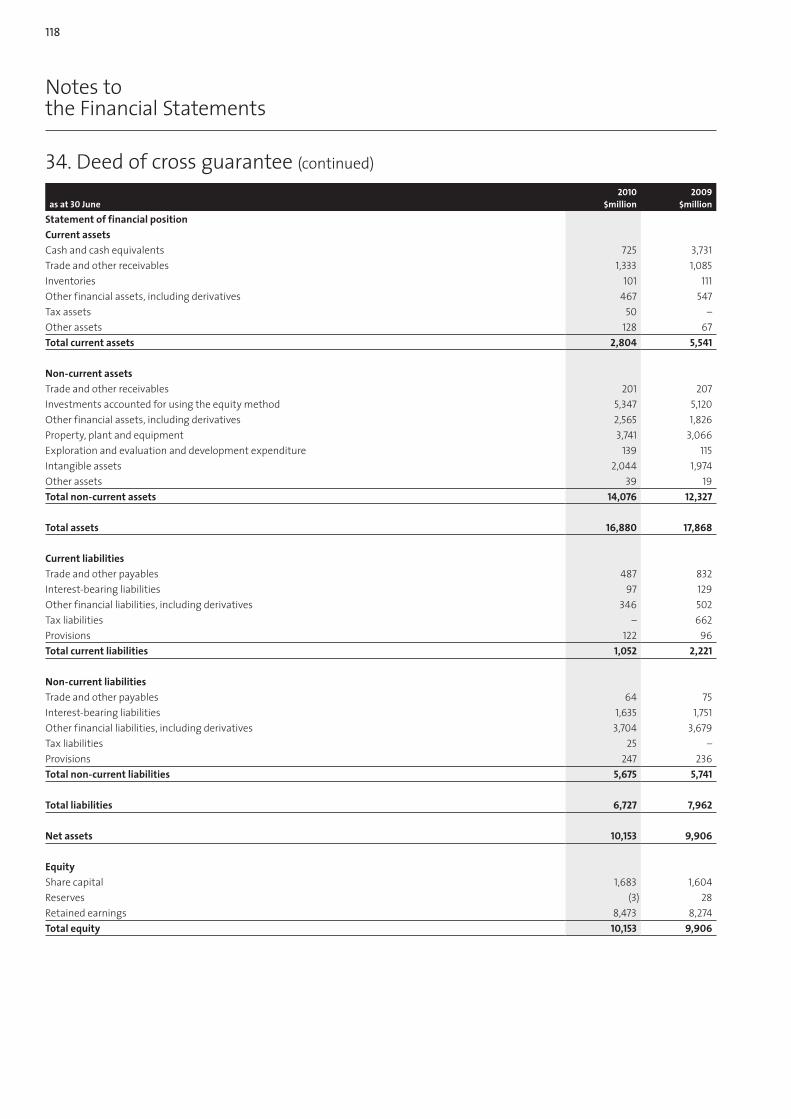
118
Notes to the Financial Statements
34. Deed of cross guarantee (continued)
2010 2009as at 30 June $million $million
Statement of financial position
current assets
Cash and cash equivalents 725 3,731
Trade and other receivables 1,333 1,085
Inventories 101 111
Other financial assets, including derivatives 467 547
Tax assets 50 –
Other assets 128 67
Total current assets 2,804 5,541
Non-current assets
Trade and other receivables 201 207
Investments accounted for using the equity method 5,347 5,120
Other financial assets, including derivatives 2,565 1,826
Property, plant and equipment 3,741 3,066
Exploration and evaluation and development expenditure 139 115
Intangible assets 2,044 1,974
Other assets 39 19
Total non-current assets 14,076 12,327
Total assets 16,880 17,868
current liabilities
Trade and other payables 487 832
Interest-bearing liabilities 97 129
Other financial liabilities, including derivatives 346 502
Tax liabilities – 662
Provisions 122 96
Total current liabilities 1,052 2,221
Non-current liabilities
Trade and other payables 64 75
Interest-bearing liabilities 1,635 1,751
Other financial liabilities, including derivatives 3,704 3,679
Tax liabilities 25 –
Provisions 247 236
Total non-current liabilities 5,675 5,741
Total liabilities 6,727 7,962
Net assets 10,153 9,906
Equity
Share capital 1,683 1,604
Reserves (3) 28
Retained earnings 8,473 8,274
Total equity 10,153 9,906
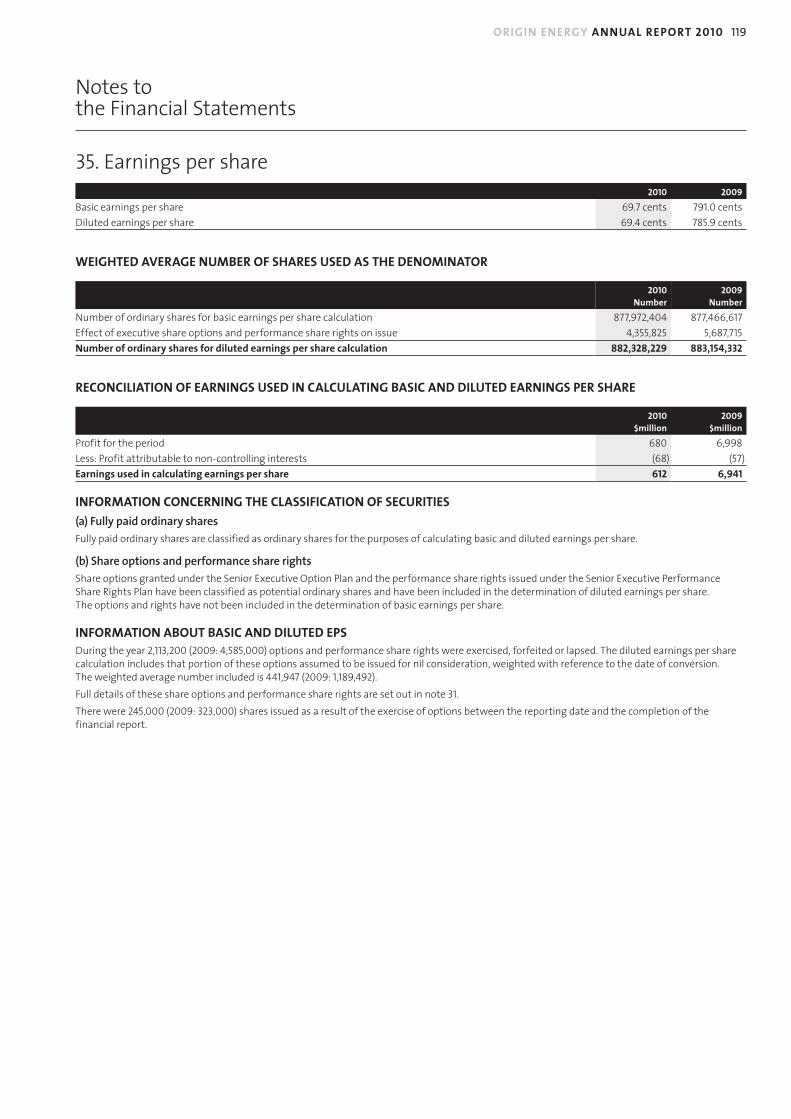
ORIGIN ENERGY ANNUAL REPORT 2010 119
Notes to the Financial Statements
35. Earnings per share2010 2009
Basic earnings per share 69.7 cents 791.0 cents
Diluted earnings per share 69.4 cents 785.9 cents
WEIGhTEd AvERAGE NUmBER Of ShARES USEd AS ThE dENOmINATOR
2010 2009Number Number
Number of ordinary shares for basic earnings per share calculation 877,972,404 877,466,617
Effect of executive share options and performance share rights on issue 4,355,825 5,687,715
Number of ordinary shares for diluted earnings per share calculation 882,328,229 883,154,332
REcONcILIATION Of EARNINGS USEd IN cALcULATING BASIc ANd dILUTEd EARNINGS PER ShARE
2010 2009$million $million
Profit for the period 680 6,998
Less: Profit attributable to non-controlling interests (68) (57)
Earnings used in calculating earnings per share 612 6,941
INfORmATION cONcERNING ThE cLASSIfIcATION Of SEcURITIES(a)Fullypaidordinaryshares
Fully paid ordinary shares are classified as ordinary shares for the purposes of calculating basic and diluted earnings per share.
(b)Shareoptionsandperformancesharerights
Share options granted under the Senior Executive Option Plan and the performance share rights issued under the Senior Executive Performance Share Rights Plan have been classified as potential ordinary shares and have been included in the determination of diluted earnings per share. The options and rights have not been included in the determination of basic earnings per share.
INfORmATION ABOUT BASIc ANd dILUTEd EPSDuring the year 2,113,200 (2009: 4,585,000) options and performance share rights were exercised, forfeited or lapsed. The diluted earnings per share calculation includes that portion of these options assumed to be issued for nil consideration, weighted with reference to the date of conversion. The weighted average number included is 441,947 (2009: 1,189,492).
Full details of these share options and performance share rights are set out in note 31.
There were 245,000 (2009: 323,000) shares issued as a result of the exercise of options between the reporting date and the completion of the financial report.

120
Notes to the Financial Statements
As at, and throughout the financial year ended 30 June 2010 the parent entity company of the group was Origin Energy Limited.
RESULTS Of ThE PARENT ENTITY
Origin Energy Limited
2010 2009$million $million
Profit for the period 130 1,815
Other comprehensive income, net of income tax (5) (53)
Total comprehensive income for the period 125 1,762
financial position of the parent entity at period end
Current assets 19,501 19,464
Non-current assets 1,529 1,425
Total assets 21,030 20,889
Current liabilities 12,334 11,806
Non-current liabilities 5,290 5,452
Total liabilities 17,624 17,258
Total equity of the parent entity comprising:
Share capital 1,683 1,604
Share-based payments reserve 46 36
Hedging reserve (10) (16)
Available-for-sale reserve (7) 1
Retained earnings 1,694 2,006
Total equity 3,406 3,631
PARENT ENTITY cONTINGENcIESThe directors are of the opinion that provisions are not required in respect of these matters, as it is not probable that a future sacrifice of economic benefits will be required or the amount is not capable of reliable measurement.
cONTINGENT LIABILITIESBank guarantees – unsecured 11 15
Letters of credit – unsecured – 1
11 16
The parent entity has entered into a Deed of Cross Guarantee with the effect that the company guarantees debts in respect of its subsidiaries.
Further details of the Deed of Cross Guarantee and the subsidiaries subject to the deed, are disclosed in note 34.
37. Subsequent eventsRefer note 5 for dividends declared subsequent to 30 June 2010.
36. Parent entity disclosures

ORIGIN ENERGY ANNUAL REPORT 2010 121
Directors’ Declaration
1 In the opinion of the directors of Origin Energy Limited (the Company):
(a) the Financial Statements and notes, and the Remuneration Report in the Directors’ Report, are in accordance with the Corporations Act 2001, including:
(i) giving a true and fair view of the financial position of the consolidated entity as at 30 June 2010 and of its performance, for the year ended on that date; and
(ii) complying with Australian Accounting Standards (including the Australian Accounting Interpretations) and the Corporations Regulations 2001.
(b) the financial report also complies with International Financial Reporting Standards as disclosed in note 1.
(c) there are reasonable grounds to believe that the Company will be able to pay its debts as and when they become due and payable.
2 There are reasonable grounds to believe that the company and the controlled entities identified in note 29 will be able to meet any obligations or liabilities to which they are or may become subject to by virtue of the Deed of Cross Guarantee between the company and those controlled entities pursuant to ASIC Class Order 98/1418.
3 The directors have been given the declarations required by Section 295A of the Corporations Act 2001 from the Managing Director and the Executive Director, Finance and Strategy for the financial year ended 30 June 2010.
Signed in accordance with a resolution of the directors:
H Kevin McCann, Chairman Director
Sydney, 23 August 2010

122
Independent Auditor’s Report

ORIGIN ENERGY ANNUAL REPORT 2010 123
Independent Auditor’s Report (continued)
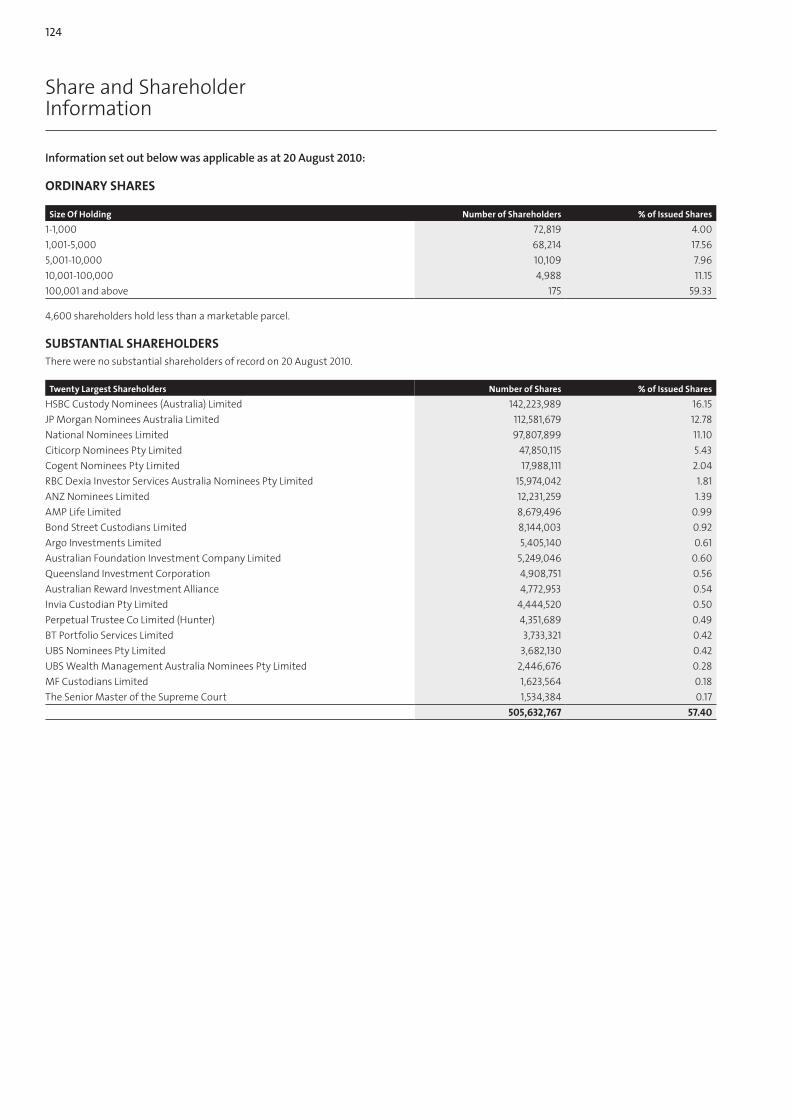
124
Share and Shareholder Information
Informationsetoutbelowwasapplicableasat20August2010:
ORdINARY ShARES
Size Of holding Number of Shareholders % of Issued Shares
1-1,000 72,819 4.00
1,001-5,000 68,214 17.56
5,001-10,000 10,109 7.96
10,001-100,000 4,988 11.15
100,001 and above 175 59.33
4,600 shareholders hold less than a marketable parcel.
SUBSTANTIAL ShAREhOLdERSThere were no substantial shareholders of record on 20 August 2010.
Twenty Largest Shareholders Number of Shares % of Issued Shares
HSBC Custody Nominees (Australia) Limited 142,223,989 16.15
JP Morgan Nominees Australia Limited 112,581,679 12.78
National Nominees Limited 97,807,899 11.10
Citicorp Nominees Pty Limited 47,850,115 5.43
Cogent Nominees Pty Limited 17,988,111 2.04
RBC Dexia Investor Services Australia Nominees Pty Limited 15,974,042 1.81
ANZ Nominees Limited 12,231,259 1.39
AMP Life Limited 8,679,496 0.99
Bond Street Custodians Limited 8,144,003 0.92
Argo Investments Limited 5,405,140 0.61
Australian Foundation Investment Company Limited 5,249,046 0.60
Queensland Investment Corporation 4,908,751 0.56
Australian Reward Investment Alliance 4,772,953 0.54
Invia Custodian Pty Limited 4,444,520 0.50
Perpetual Trustee Co Limited (Hunter) 4,351,689 0.49
BT Portfolio Services Limited 3,733,321 0.42
UBS Nominees Pty Limited 3,682,130 0.42
UBS Wealth Management Australia Nominees Pty Limited 2,446,676 0.28
MF Custodians Limited 1,623,564 0.18
The Senior Master of the Supreme Court 1,534,384 0.17
505,632,767 57.40

ORIGIN ENERGY ANNUAL REPORT 2010 125
Share and Shareholder Information (continued)
ShAREhOLdER ENqUIRIESFor information about your shareholding, to notify a change of address, to make changes to your dividend payment instructions or for any other shareholder enquiries, you should contact Origin Energy’s share registry, Link Market Services Ltd on 1300 664 446. Please note that broker sponsored holders are required to contact their broker to amend their address.
When contacting the share registry, shareholders should quote their security holder reference number, which can be found on the holding or dividend statements.
Shareholders with internet access can update and obtain information regarding their shareholding online at www.originenergy.com.au/investor.
dIvIdENdSOrigin will pay a final dividend for the 2009/2010 year of 25 cents per share (fully franked) on 28 September 2010.
There are several alternatives in relation to the way shareholders can elect to receive their dividends:
• By direct credit, paid into a bank, building society or credit union account in Australia or New Zealand. For payments into New Zealand bank accounts dividends will be paid in New Zealand dollars. The payment of dividends will be electronically credited on the dividend payment date and confirmed by payment advices sent through the mail; or
• By participation in the Dividend Reinvestment Plan (DRP). The DRP enables shareholders to use cash dividends to purchase additional fully paid Origin Energy shares. Details of the DRP can be obtained at www.originenergy.com.au/investor or by contacting the share registry; or
• By cheque paid in Australian dollars.
TAx fILE NUmBERFor resident shareholders who have not provided the share registry with their Tax File Number (“TFN”) or exemption category details, tax at the top marginal tax rate (plus Medicare levy) will be deducted from dividends to the extent they are not fully franked. For those shareholders who have not as yet provided their TFN or exemption category details, forms are available from the share registry. Shareholders are not obliged to provide this information if they do not wish to do so.
INfORmATION ON ORIGIN The main source of information for shareholders is the Annual Report and the Shareholder Review. Both the Annual Report and Shareholder Review will be provided to shareholders on request and free of charge. Shareholders not wishing to receive the Annual Report should advise the share registry in writing so that their names can be removed from the mailing list. Origin’s website www.originenergy.com.au is another source of information for shareholders.
SEcURITIES ExchANGE LISTINGOrigin shares are traded on the ASX. The symbol under which Origin shares are traded is ‘ORG’.
vOTING RIGhTS Of mEmBERSAt a meeting of members, each member who is entitled to attend and vote may attend and vote in person or by proxy, attorney or representative. On a show of hands, every person present who is a member, proxy, attorney or representative, shall have one vote and on a poll, every member who is present in person or by proxy, attorney or representative shall have one vote for each fully paid share held.

126
Exploration and Production Permits and Data
Mouths o
f the
Mek
ong
Indian
Ocean
Timor
Sea
JosephBonaparte
Gulf
OceanPacific
Bay
PacificOcean
South
Sea
Ocean
Indian
UngwanaBay
TasmanSea
Southern
Ocean
Bass Strait
Coral
Sea
South
Sea
My Tho
Vung Tau
Can Tho
Ho Chi Minh City
Ca MauBac Lieu
Vientiane
Savannakhet
Wellington
Auckland
Mombasa
Dongara
Geraldton
Beharra Springs
XyrisHovea
Jingemia
Jurien
Moora
Leeman
Darwin
Wyndham
BowenCharters Towers
Proserpine
LongreachBarcaldine
Clermont
Emerald
Invercargill
Christchurch
Timaru
Dunedin
Qui Nhon
Tuy Hoa
Quang Ngai
Da Nang
Ninh Hoa
Mombasa
Tanga
Malindi
Lamu
Kilifi
Auckland
Hamilton
New Plymouth
Wanganui
AhuroaWaihapa
Rimu
Kupe
Kupegas plant
Moomba
Ballera
Moomba
Ballera
Melbourne
GambierMt.
Portland
Yolla
Thylacine
Port Campbell
LangLang
Gas PlantOtway
Rockhampton
Gladstone
Brisbane
Rolleston
Yellowbank
Spring Gully
Fairview
Talinga
Strathblane
Kenya
Taloona
Yellowbank
Spring Gully Peat
Roma
Kincora
Fairview
Talinga
Strathblane
Kenya
Taloona
0 50
KM
0 100
KM
0
KM
100
0
KM
100
0 50
KM
0 50
KM
0 50
KM
0 75
KM0
KM
1000
KM
100
0 50
KM
0
KM
100
54
31
8
7
6
2
9
1012
11
7 8
2
6
109
5
1 43
1211
KeyOrigin Energy Interests
Other (Non Origin/Contact)NewZealand
WA
NT Qld
SA
NSW
Vic
Tas
Africa
South East Asia
Perth Basin
WesternAustralia
Bonaparte Basin
WesternAustralia
NorthernTerritory
Queensland
Galilee Basin
Canterbury Basin
ZealandNew
Vietnam
Song Hong Basin
Kenya
Lamu Basin
& Northland BasinTaranaki
ZealandNew
Cooper/Eromanga Basin Queensland
New South Wales
South
Australia
Victoria
Otway Basin
Tasmania
Queensland
NSW
Surat/Bowen Basin
Khorat Plateau
Vietnam
Vinh Chau Graben
Thailand
Laos
Tanzania
Vietnam
Cambodia
SA
Perth
Brisbane
Sydney
Melbourne
Hobart
Darwin
Adelaide
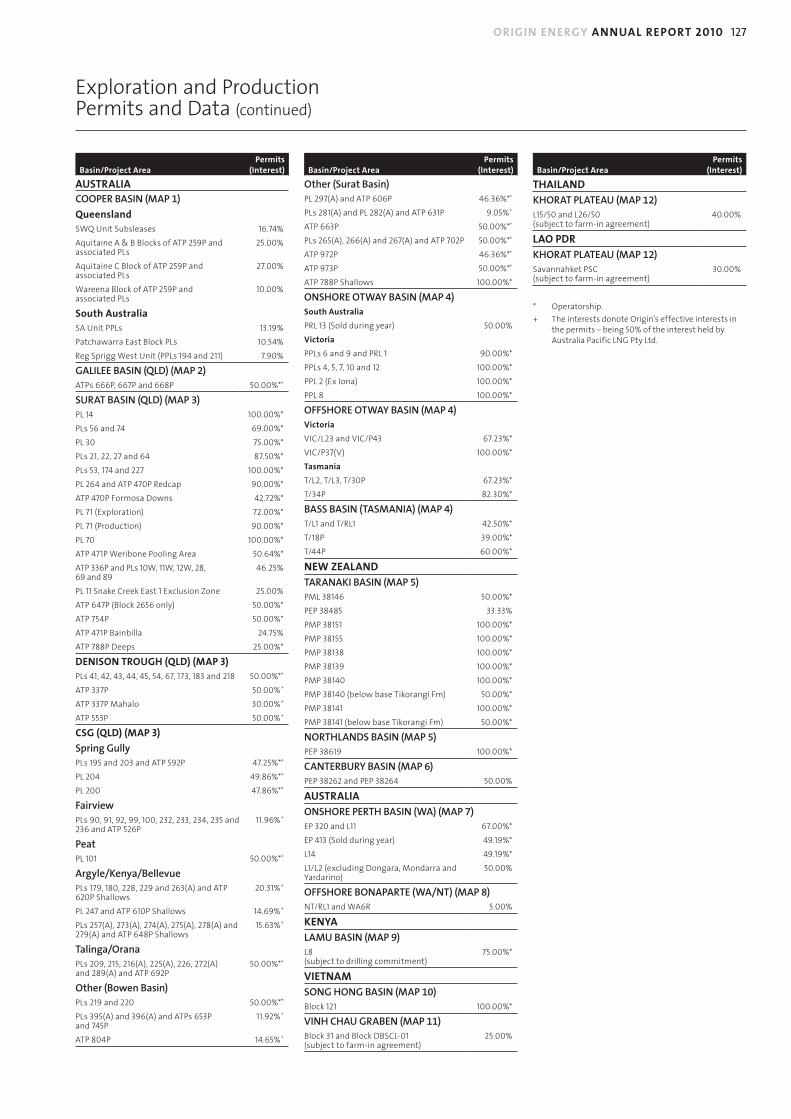
ORIGIN ENERGY ANNUAL REPORT 2010 127
Exploration and Production Permits and Data (continued)
Basin/Project AreaPermits
(Interest)
AUSTRALIACOOPERBASIN(MAP1)
queenslandSWQ Unit Subsleases 16.74%
Aquitaine A & B Blocks of ATP 259P and associated PLs
25.00%
Aquitaine C Block of ATP 259P and associated PLs
27.00%
Wareena Block of ATP 259P and associated PLs
10.00%
South AustraliaSA Unit PPLs 13.19%
Patchawarra East Block PLs 10.54%
Reg Sprigg West Unit (PPLs 194 and 211) 7.90%
GALILEEBASIN(QLD)(MAP2)ATPs 666P, 667P and 668P 50.00%*+
SURATBASIN(QLD)(MAP3)PL 14 100.00%*
PLs 56 and 74 69.00%*
PL 30 75.00%*
PLs 21, 22, 27 and 64 87.50%*
PLs 53, 174 and 227 100.00%*
PL 264 and ATP 470P Redcap 90.00%*
ATP 470P Formosa Downs 42.72%*
PL 71 (Exploration) 72.00%*
PL 71 (Production) 90.00%*
PL 70 100.00%*
ATP 471P Weribone Pooling Area 50.64%*
ATP 336P and PLs 10W, 11W, 12W, 28, 69 and 89
46.25%
PL 11 Snake Creek East 1 Exclusion Zone 25.00%
ATP 647P (Block 2656 only) 50.00%*
ATP 754P 50.00%*
ATP 471P Bainbilla 24.75%
ATP 788P Deeps 25.00%*
dENISON TROUGh (qLd) (mAP 3) PLs 41, 42, 43, 44, 45, 54, 67, 173, 183 and 218 50.00%*+
ATP 337P 50.00%+
ATP 337P Mahalo 30.00%+
ATP 553P 50.00%+
cSG (qLd) (mAP 3)
SpringGullyPLs 195 and 203 and ATP 592P 47.25%*+
PL 204 49.86%*+
PL 200 47.86%*+
FairviewPLs 90, 91, 92, 99, 100, 232, 233, 234, 235 and 236 and ATP 526P
11.96%+
PeatPL 101 50.00%*+
Argyle/Kenya/BellevuePLs 179, 180, 228, 229 and 263(A) and ATP 620P Shallows
20.31%+
PL 247 and ATP 610P Shallows 14.69%+
PLs 257(A), 273(A), 274(A), 275(A), 278(A) and 279(A) and ATP 648P Shallows
15.63%+
Talinga/OranaPLs 209, 215, 216(A), 225(A), 226, 272(A) and 289(A) and ATP 692P
50.00%*+
Other(BowenBasin)PLs 219 and 220 50.00%*+
PLs 395(A) and 396(A) and ATPs 653P and 745P
11.92%+
ATP 804P 14.65%+
Basin/Project AreaPermits
(Interest)
Other(SuratBasin)PL 297(A) and ATP 606P 46.36%*+
PLs 281(A) and PL 282(A) and ATP 631P 9.05%+
ATP 663P 50.00%*+
PLs 265(A), 266(A) and 267(A) and ATP 702P 50.00%*+
ATP 972P 46.36%*+
ATP 973P 50.00%*+
ATP 788P Shallows 100.00%*
ONSHOREOTWAYBASIN(MAP4)South Australia
PRL 13 (Sold during year) 50.00%
victoria
PPLs 6 and 9 and PRL 1 90.00%*
PPLs 4, 5, 7, 10 and 12 100.00%*
PPL 2 (Ex Iona) 100.00%*
PPL 8 100.00%*
OFFSHOREOTWAYBASIN(MAP4)victoria
VIC/L23 and VIC/P43 67.23%*
VIC/P37(V) 100.00%*
Tasmania
T/L2, T/L3, T/30P 67.23%*
T/34P 82.30%*
BASSBASIN(TASMANIA)(MAP4)T/L1 and T/RL1 42.50%*
T/18P 39.00%*
T/44P 60.00%*
NEW ZEALANdTARANAKIBASIN(MAP5)PML 38146 50.00%*
PEP 38485 33.33%
PMP 38151 100.00%*
PMP 38155 100.00%*
PMP 38138 100.00%*
PMP 38139 100.00%*
PMP 38140 100.00%*
PMP 38140 (below base Tikorangi Fm) 50.00%*
PMP 38141 100.00%*
PMP 38141 (below base Tikorangi Fm) 50.00%*
NORTHLANDSBASIN(MAP5)PEP 38619 100.00%*
CANTERBURYBASIN(MAP6)PEP 38262 and PEP 38264 50.00%
AUSTRALIAONSHOREPERTHBASIN(WA)(MAP7)EP 320 and L11 67.00%*
EP 413 (Sold during year) 49.19%*
L14 49.19%*
L1/L2 (excluding Dongara, Mondarra and Yardarino)
50.00%
OFFSHOREBONAPARTE(WA/NT)(MAP8)NT/RL1 and WA6R 5.00%
KENYALAMUBASIN(MAP9)L8 (subject to drilling commitment)
75.00%*
vIETNAmSONGHONGBASIN(MAP10)Block 121 100.00%*
vINHCHAUGRABEN(MAP11)Block 31 and Block DBSCL-01 (subject to farm-in agreement)
25.00%
Basin/Project AreaPermits
(Interest)
ThAILANdKHORATPLATEAU(MAP12)L15/50 and L26/50 (subject to farm-in agreement)
40.00%
LAO PdRKHORATPLATEAU(MAP12)Savannahket PSC (subject to farm-in agreement)
30.00%
* Operatorship.
+ The interests donote Origin’s effective interests in the permits – being 50% of the interest held by Australia Pacific LNG Pty Ltd.

128
Exploration and Production Permits and Data (continued)
dRILLING PROGRAm RESULTS – 1 JULY 2009 TO 30 JUNE 2010
Area/Basin Exploration Appraisal development TotalWells cased for
production
Cooper Oil 1 6 3 10 8 (1)
Cooper Gas – – 16 16 15
CSG – APLNG 47 149 121 317 (2) 275
Denison Trough – APLNG – – – – –
CSG – Origin 2 – – 2 (3) 0
Surat – – – – –
Offshore Otway 1 – – 1 0
Bass Basin 2 1 – 3 0 (4)
Perth Basin 1 1 1 3 3
Bonaparte Basin – – – – –
New Zealand – Offshore – – – – –
New Zealand – Onshore – – 3 3 (5) 3
Kenya – – – – –
Vietnam 1 – – 1 0
Lao PDR 1 – – 1 1
Other – – – – –
Total 56 157 144 357 307
(1) One well suspended as a gas well.
(2) Forty wells drilled as cored slimholes or monitoring wells (not intended for production).
(3) Cored slimholes (not intended for production).
(4) Wells plugged and abandoned as planned but successful in objectives.
(5) Four gas injection wells also drilled in Ahuroa Gas Storage project (one P&A).
POTENTIAL ExPLORATION/APPRAISAL dRILLING PROGRAm fOR 2010/2011(Gross well numbers)
Area/Basin No. of wells
Cooper Oil/Gas –
CSG – APLNG 271
Denison – APLNG –
CSG – Origin 19
Surat Basin 3
Onshore Otway Basin –
Offshore Otway Basin –
Bass Basin 1
Perth Basin 2
Bonaparte Basin 2
New Zealand – Offshore 2
New Zealand – Onshore –
Kenya –
Vietnam 1
Lao PDR –
Thailand 2
Total 303

ORIGIN ENERGY ANNUAL REPORT 2010 129
Exploration and Production Permits and Data (continued)
2P RESERvES BY PROdUcT
Gas (PJ)
LPG (kT)
condensate (kbbls)
Oil (kbbls)
TOTAL (PJe)
2P at 30 June 2009 4,267 1,650 17,312 6,691 4,484
Additions and revisions 1,774 510 5,887 (395) 1,827
Production (89) (94) (1,210) (648) (104)
2P at 30 June 2010 5,952 2,066 21,989 5,648 6,207
2P RESERvES BY REGION
Gas (PJ)
LPG (kT)
condensate (kbbls)
Oil (kbbls)
TOTAL (PJe)
Australia Pacific LNG
Coal Seam Gas / Denison 5,071 – 25 – 5,071
cooper Basin
SA Cooper Basin 109 244 1,613 2,454 144
SWQ Cooper Basin 47 72 604 527 57
Other onshore Australia
Western Australia 17 – 13 301 19
Conventional Surat Basin 17 33 192 188 21
Offshore Australia
Otway Basin – Offshore 425 781 6,204 – 497
Bass Basin 117 365 4,448 349 162
New Zealand
Offshore Taranaki (Kupe) 132 541 8,799 – 207
Onshore Taranaki 16 31 91 1,830 28
Total 5,952 2,066 21,989 5,648 6,207
SALES vOLUmE BY ASSET (PJe) 1 JULY 2009 TO 30 JUNE 2010
Area/Basin Region 2010 2009
Cooper Basin South Australia/Queensland 29.3 30.1
Denison Trough (pre APLNG) Queensland – 1.6
Surat Basin Queensland 4.6 2.8
Peat (pre APLNG) Queensland – 1.3
Fairview (pre APLNG) Queensland – 2.2
Spring Gully (pre APLNG) Queensland – 12.4
Argyle/Kenya/Bellevue (pre APLNG) Queensland – 1.2
Talinga/Orana (pre APLNG) Queensland – 0.0
Denison Trough (post APLNG) Queensland 1.9 1.6
Peat (post APLNG) Queensland 1.6 1.3
Fairview (post APLNG) Queensland 7.9 4.7
Spring Gully (post APLNG) Queensland 21.2 13.6
Argyle/Kenya/Bellevue (post APLNG) Queensland 3.4 1.3
Talinga/Orana (post APLNG) Queensland 2.6 0.0
Katnook/Ladbroke Grove South Australia 0.0 0.0
Perth Basin gas Western Australia 2.2 3.4
Perth Basin oil Western Australia 1.1 1.8
Bass Project Tasmania 7.1 10.2
Otway Gas Project Victoria/Tasmania 24.6 19.7
Kupe New Zealand 8.0 0.0
Taranaki Basin (Onshore) New Zealand 1.7 2.3
Total 117.1 112.0
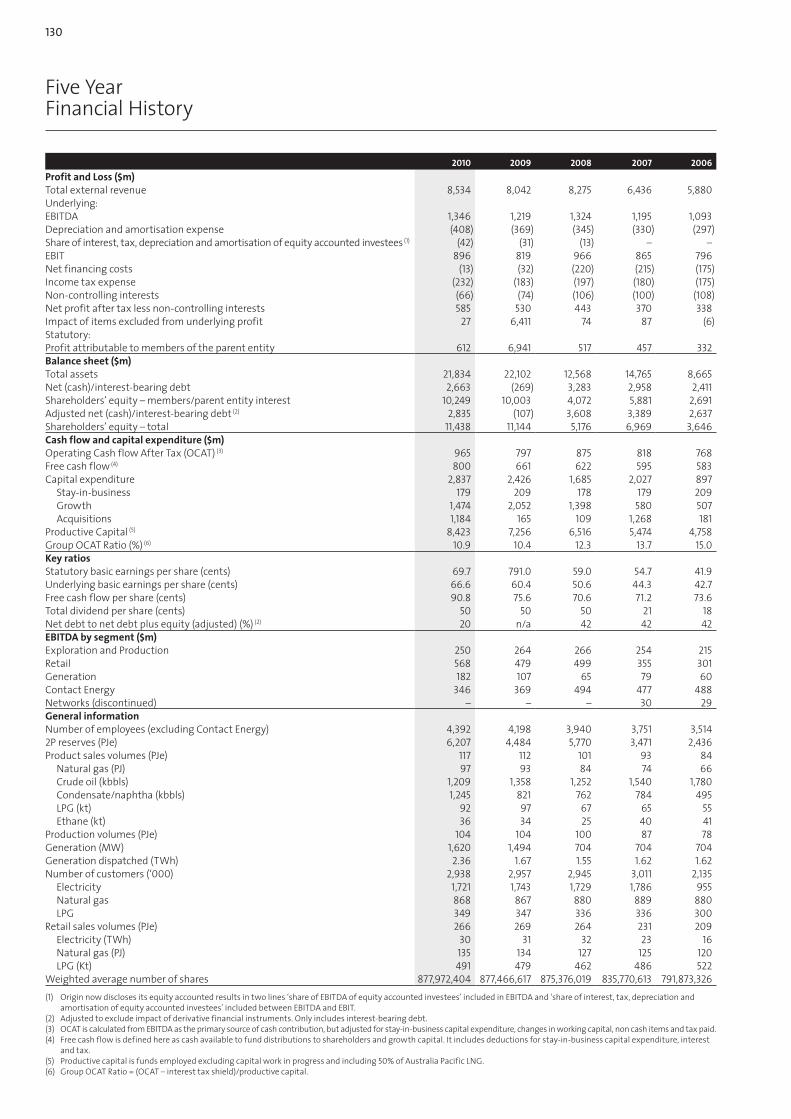
130
Five Year Financial History
2010 2009 2008 2007 2006
Profit and Loss ($m)Total external revenue 8,534 8,042 8,275 6,436 5,880Underlying:EBITDA 1,346 1,219 1,324 1,195 1,093Depreciation and amortisation expense (408) (369) (345) (330) (297)Share of interest, tax, depreciation and amortisation of equity accounted investees (1) (42) (31) (13) – – EBIT 896 819 966 865 796Net financing costs (13) (32) (220) (215) (175)Income tax expense (232) (183) (197) (180) (175)Non-controlling interests (66) (74) (106) (100) (108)Net profit after tax less non-controlling interests 585 530 443 370 338Impact of items excluded from underlying profit 27 6,411 74 87 (6)Statutory: Profit attributable to members of the parent entity 612 6,941 517 457 332Balance sheet ($m)Total assets 21,834 22,102 12,568 14,765 8,665Net (cash)/interest-bearing debt 2,663 (269) 3,283 2,958 2,411Shareholders’ equity – members/parent entity interest 10,249 10,003 4,072 5,881 2,691Adjusted net (cash)/interest-bearing debt (2) 2,835 (107) 3,608 3,389 2,637Shareholders’ equity – total 11,438 11,144 5,176 6,969 3,646cash flow and capital expenditure ($m)Operating Cash flow After Tax (OCAT) (3) 965 797 875 818 768Free cash flow (4) 800 661 622 595 583Capital expenditure 2,837 2,426 1,685 2,027 897
Stay-in-business 179 209 178 179 209Growth 1,474 2,052 1,398 580 507Acquisitions 1,184 165 109 1,268 181
Productive Capital (5) 8,423 7,256 6,516 5,474 4,758Group OCAT Ratio (%) (6) 10.9 10.4 12.3 13.7 15.0Key ratiosStatutory basic earnings per share (cents) 69.7 791.0 59.0 54.7 41.9Underlying basic earnings per share (cents) 66.6 60.4 50.6 44.3 42.7Free cash flow per share (cents) 90.8 75.6 70.6 71.2 73.6Total dividend per share (cents) 50 50 50 21 18Net debt to net debt plus equity (adjusted) (%) (2) 20 n/a 42 42 42EBITdA by segment ($m)Exploration and Production 250 264 266 254 215Retail 568 479 499 355 301Generation 182 107 65 79 60Contact Energy 346 369 494 477 488Networks (discontinued) – – – 30 29General informationNumber of employees (excluding Contact Energy) 4,392 4,198 3,940 3,751 3,5142P reserves (PJe) 6,207 4,484 5,770 3,471 2,436Product sales volumes (PJe) 117 112 101 93 84
Natural gas (PJ) 97 93 84 74 66Crude oil (kbbls) 1,209 1,358 1,252 1,540 1,780Condensate/naphtha (kbbls) 1,245 821 762 784 495LPG (kt) 92 97 67 65 55Ethane (kt) 36 34 25 40 41
Production volumes (PJe) 104 104 100 87 78Generation (MW) 1,620 1,494 704 704 704Generation dispatched (TWh) 2.36 1.67 1.55 1.62 1.62Number of customers (‘000) 2,938 2,957 2,945 3,011 2,135
Electricity 1,721 1,743 1,729 1,786 955Natural gas 868 867 880 889 880LPG 349 347 336 336 300
Retail sales volumes (PJe) 266 269 264 231 209Electricity (TWh) 30 31 32 23 16Natural gas (PJ) 135 134 127 125 120LPG (Kt) 491 479 462 486 522
Weighted average number of shares 877,972,404 877,466,617 875,376,019 835,770,613 791,873,326
(1) Origin now discloses its equity accounted results in two lines ‘share of EBITDA of equity accounted investees’ included in EBITDA and ‘share of interest, tax, depreciation and amortisation of equity accounted investees’ included between EBITDA and EBIT.
(2) Adjusted to exclude impact of derivative financial instruments. Only includes interest-bearing debt.(3) OCAT is calculated from EBITDA as the primary source of cash contribution, but adjusted for stay-in-business capital expenditure, changes in working capital, non cash items and tax paid.(4) Free cash flow is defined here as cash available to fund distributions to shareholders and growth capital. It includes deductions for stay-in-business capital expenditure, interest
and tax.(5) Productive capital is funds employed excluding capital work in progress and including 50% of Australia Pacific LNG.(6) Group OCAT Ratio = (OCAT – interest tax shield)/productive capital.

ORIGIN ENERGY ANNUAL REPORT 2010 131
Glossary
2C Best Estimate Contingent resource.
3C High Estimate Contingent resource.
2P reserves Proved plus Probable reserves. Analysis of geological and engineering data suggest these reserves are more likely than not to be recoverable under reasonable economic, technical and operating methods.
3P reserves Proved plus Probable plus Possible.
AGAAP Australian Generally Accepted Accounting Principles.
A-IFRS Australian equivalents to International Financial Reporting Standards.
Appraisal well Well drilled to determine the size of an oil or gas discovery.
AS 3806 Australian Standard on Compliance Program used to manage regulatory risks.
APLNG Australia Pacific LNG, a 50:50 joint venture between Origin and ConocoPhillips.
Availability The time a generation plant was available for use, after deducting planned and unplanned outage hours, compared with the total time under review.
Barrels (bbls) A measure used for oil production and sales. One barrel equals approximately 159 litres.
Bopd Barrels of oil per day.
Capacity factor A generation plant’s output over a period compared with the expected maximum output from the plant in that period based on 100% availability at the manufacturer’s operating specifications.
Capital expenditure Investment in acquisition or improvement of long-term assets, such as property, plant, or equipment.
Carbon dioxide (CO2) Greenhouse gas produced as a by-product of oil and gas production and when burning fossil fuels and biomass.
Cased and suspended A successful well with a steel casing installed to enable future production.
Churn Mass-market energy customers switching suppliers.
Climate change Any change in climate over time, whether due to natural variability or as a result of human activity.
Coal seam gas (CSG) Natural gas contained within coal seams.
Cogeneration Producing two or more forms of energy from one fuel source. Generally, cogeneration plants operated by Origin produce steam and electricity from natural gas.
CCGT Combined Cycle Gas Turbine power station.
Condensate A light oil that separates during gas production processes due to changes in pressure and temperature.
Contract Price (CP) An international price for LPG, in US dollars, using the Saudi Aramco Contract Price – tender process. Australian LPG producers export LPG or sell into the domestic Australian market at prices that reflect the CP. Similarly, Australian LPG retailers purchase domestically produced or imported LPG based on CP.
Development well A well drilled to enable production from a known oil or gas reservoir.
EBIT Earnings before interest and tax.
EBITDA Earnings before interest, tax, depreciation and amortisation.
EIS Environmental Impact Statement.
Electricity measures • Watt (W) A measure of power when a one ampere of current flows under one volt of pressure.
• Kilowatt (kW) One kW = 1,000 watts.
• Kilowatt Hour (KWh) Standard unit of electrical energy representing consumption of one kilowatt over one hour.
• Megawatt (MW) One MW = 1,000 kW or one million watts.
• Gigawatt hour (GWh) One GWh = 1,000 megawatt hours or one million kilowatt hours.
• Terawatt hour (TWh) One TWh = 1,000 gigawatt hours, or one million megawatt hours.
EOWA Equal Opportunity for Women in the Workplace Agency.
EPA Environment Protection Authority or equivalent state authority.
EPS Earnings per share, total earnings divided by the weighted average shares on issue.
Exploration well A well drilled to identify a new reservoir of oil or gas.
Farm-out arrangement The owner or lessee of mineral rights (the first party) assigns a working interest to an operator (the second party), the consideration for which is specified exploration and/or development activities.
Farm-in arrangement The arrangement from the viewpoint of the second party is termed a “farm-in arrangement.”
FEED Front end engineering and design.
FID Final Investment Decision.
Full Retail Contestability (FRC) Where homes and businesses are able to choose their own energy supplier.
Gas measures • Joule Primary measure of energy in the metric system.
• Gigajoule (GJ) A gigajoule equals one billion joules. An average Victorian household consumes around 55 GJ annually.
• Terajoule (TJ) A Terajoule is equal to 1,000 gigajoules.
• Petajoule (PJ) A Petajoule is equal to one million gigajoules.
• Petajoules equivalent (PJe) An energy measurement Origin uses in its Annual Report to represent the equivalent energy in different products so the amount of energy contained in these products can be compared. The factors used by Origin Energy to convert to PJe are: one million barrels crude oil = 5.83 PJe; one million barrels condensate = 5.41 PJe; one million tonnes LPG = 49.3 PJe; one TWh of electricity = 3.6 PJe.
Geothermal Energy that is generated by converting hot water or steam from deep beneath the Earth’s surface into electricity.
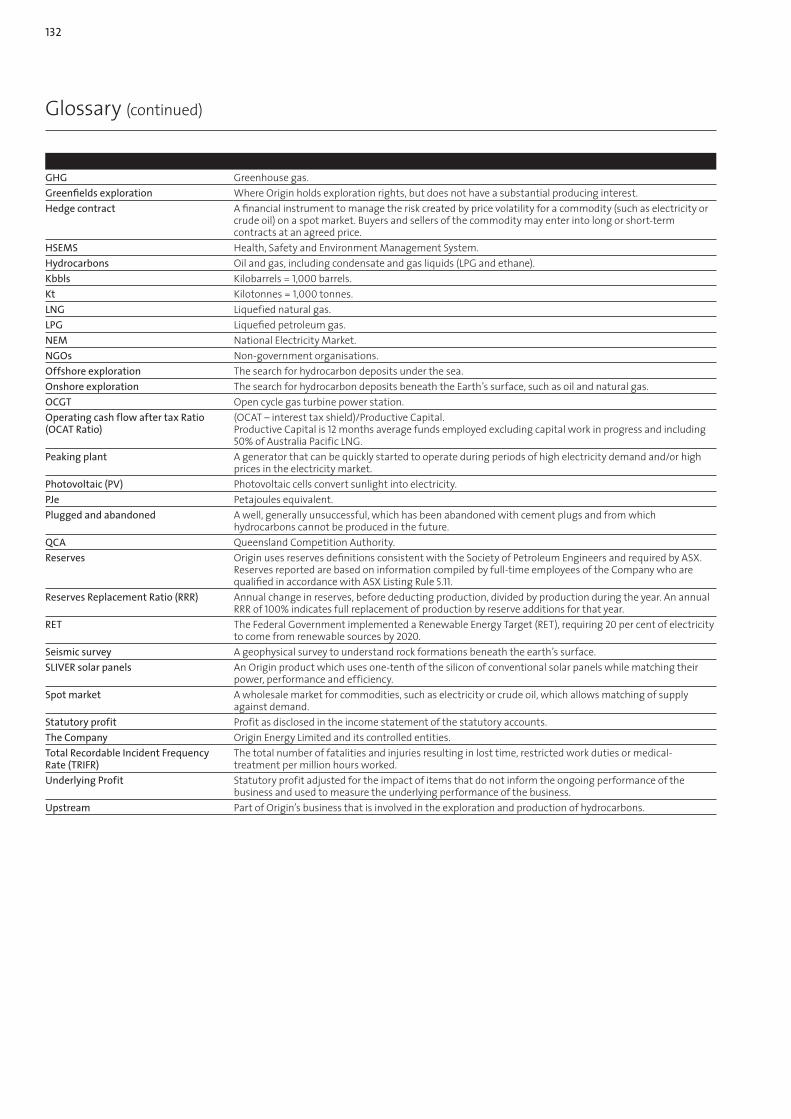
132
Glossary (continued)
GHG Greenhouse gas.
Greenfields exploration Where Origin holds exploration rights, but does not have a substantial producing interest.
Hedge contract A financial instrument to manage the risk created by price volatility for a commodity (such as electricity or crude oil) on a spot market. Buyers and sellers of the commodity may enter into long or short-term contracts at an agreed price.
HSEMS Health, Safety and Environment Management System.
Hydrocarbons Oil and gas, including condensate and gas liquids (LPG and ethane).
Kbbls Kilobarrels = 1,000 barrels.
Kt Kilotonnes = 1,000 tonnes.
LNG Liquefied natural gas.
LPG Liquefied petroleum gas.
NEM National Electricity Market.
NGOs Non-government organisations.
Offshore exploration The search for hydrocarbon deposits under the sea.
Onshore exploration The search for hydrocarbon deposits beneath the Earth’s surface, such as oil and natural gas.
OCGT Open cycle gas turbine power station.
Operating cash flow after tax Ratio (OCAT Ratio)
(OCAT – interest tax shield)/Productive Capital.Productive Capital is 12 months average funds employed excluding capital work in progress and including 50% of Australia Pacific LNG.
Peaking plant A generator that can be quickly started to operate during periods of high electricity demand and/or high prices in the electricity market.
Photovoltaic (PV) Photovoltaic cells convert sunlight into electricity.
PJe Petajoules equivalent.
Plugged and abandoned A well, generally unsuccessful, which has been abandoned with cement plugs and from which hydrocarbons cannot be produced in the future.
QCA Queensland Competition Authority.
Reserves Origin uses reserves definitions consistent with the Society of Petroleum Engineers and required by ASX. Reserves reported are based on information compiled by full-time employees of the Company who are qualified in accordance with ASX Listing Rule 5.11.
Reserves Replacement Ratio (RRR) Annual change in reserves, before deducting production, divided by production during the year. An annual RRR of 100% indicates full replacement of production by reserve additions for that year.
RET The Federal Government implemented a Renewable Energy Target (RET), requiring 20 per cent of electricity to come from renewable sources by 2020.
Seismic survey A geophysical survey to understand rock formations beneath the earth’s surface.
SLIVER solar panels An Origin product which uses one-tenth of the silicon of conventional solar panels while matching their power, performance and efficiency.
Spot market A wholesale market for commodities, such as electricity or crude oil, which allows matching of supply against demand.
Statutory profit Profit as disclosed in the income statement of the statutory accounts.
The Company Origin Energy Limited and its controlled entities.
Total Recordable Incident Frequency Rate (TRIFR)
The total number of fatalities and injuries resulting in lost time, restricted work duties or medical-treatment per million hours worked.
Underlying Profit Statutory profit adjusted for the impact of items that do not inform the ongoing performance of the business and used to measure the underlying performance of the business.
Upstream Part of Origin’s business that is involved in the exploration and production of hydrocarbons.

Contents
1. A message from your Chairman and Managing Director 1
2. Management Discussion and Analysis 4
3. Directors’ Report 24
4. Lead Auditor’s Independence Declaration 30
5. Remuneration Report 31
6. Board of Directors 50
7. Executive Management Team 52
8. Corporate Governance 54
9. Financial Statements 57
10. Directors’ Declaration 121
11. Independent Auditor’s Report 122
12. Share and Shareholder Information 124
13. Exploration and Production Permits and Data 126
14. Five Year Financial History 130
15. Glossary 131
shareholder review 2010
acting for Tomorrow.sTraTeGY PerForMaNCe GrowTh
sustainability report 2010
acting for tomorrow.strateGy perForManCe GroWtH
ANNUAL REPORT 2010
Acting for Tomorrow.STRATEGY PERFORMANCE GROWTH
Half Year report to SHareHolderSfor tHe Half Year ended 31 december 2010
acting for tomorrow.StrateGY performance GroWtH
Origin Reporting 2010
This Annual Report is part of Origin’s suite of reporting documents, which includes the Shareholder Review and Sustainability Report. The 2011 Half Year Report to shareholders is released in March. Discover Origin Reporting 2010 on our website http://reports.originenergy.com.au
ANNUAL REPORT 2010
Acting for Tomorrow.STRATEGY PERFORMANCE GROWTH
Registered office
Level 45, Australia Square 264-278 George Street Sydney NSW 2000
GPO Box 5376 Sydney NSW 2001
Telephone (02) 8345 5000 Facsimile (02) 9241 7377 Internet www.originenergy.com.au Email [email protected]
Share register
Link Market Services Limited Level 12, 680 George Street Sydney NSW 2000
Locked Bag A14 Sydney South NSW 1235
Toll Free 1300 664 446 Telephone (02) 8280 7155 Facsimile (02) 9287 0303
Internet www.linkmarketservices.com.au Email [email protected]
Secretaries
Andrew Clarke Helen Hardy
Auditor
KPMG
Bankers
National Australia Bank Westpac Banking Corporation
DiRectoRy Origin Energy Limited
Further information about Origin’s performance can be found on the website: http://reports.originenergy.com.au
Origin
Energy Lim
ited AB
N 30
00
0 0
51 69
6 A
nn
uA
l Repo
Rt 2010