Electron Density and Energy Distributions in the Positive DC Corona
Orientation, stress and density distributions in injection-moulded amorphous polymers determined by opticaltechniquesWimberger-Friedl, R.
DOI:10.6100/IR364279
Published: 01/01/1991
Document VersionPublisher’s PDF, also known as Version of Record (includes final page, issue and volume numbers)
Please check the document version of this publication:
• A submitted manuscript is the author's version of the article upon submission and before peer-review. There can be important differencesbetween the submitted version and the official published version of record. People interested in the research are advised to contact theauthor for the final version of the publication, or visit the DOI to the publisher's website.• The final author version and the galley proof are versions of the publication after peer review.• The final published version features the final layout of the paper including the volume, issue and page numbers.
Link to publication
General rightsCopyright and moral rights for the publications made accessible in the public portal are retained by the authors and/or other copyright ownersand it is a condition of accessing publications that users recognise and abide by the legal requirements associated with these rights.
• Users may download and print one copy of any publication from the public portal for the purpose of private study or research. • You may not further distribute the material or use it for any profit-making activity or commercial gain • You may freely distribute the URL identifying the publication in the public portal ?
Take down policyIf you believe that this document breaches copyright please contact us providing details, and we will remove access to the work immediatelyand investigate your claim.
Download date: 28. Jul. 2018
Orientation, Stress and Density Distributions
in Injection-Moulded Amorphous Polymers
Determined by Optical Techniques
PR.OEF$CHRIFT
ter verkrijging van de graad van doctor aan de Technische Universiteit Eindhoven, op gezag van de Rector Magnificus, profdr. J-H. van Lint, voor een commissie aangewezen door het College van Dekancn in het. openbaar te verdedigen op
dinsdag 10 december 1991 om 16.00 uur
door
REINHOLD WIMBERGER-FRIEDL
geboren te Haslach (Oostenrijk)

Dit proefschrift is goedgckeuHl door de pr()TrIotorcn prof.dr. H. Jancschitz-Krlegl ell
prof-dLiI". H.E.H. Meijer
Tht., wu'r-k dcsr.r'1:bed in this thesis Jws been ca.Tried o'ut at the Ph.ilips Hcscarch iA1.boratoru;8 j l!Jindhovt:n, as P(]:f'l of the Philips Rf;.<;earch
programme.

An Maria und
meille Eltern
CONTENTS:
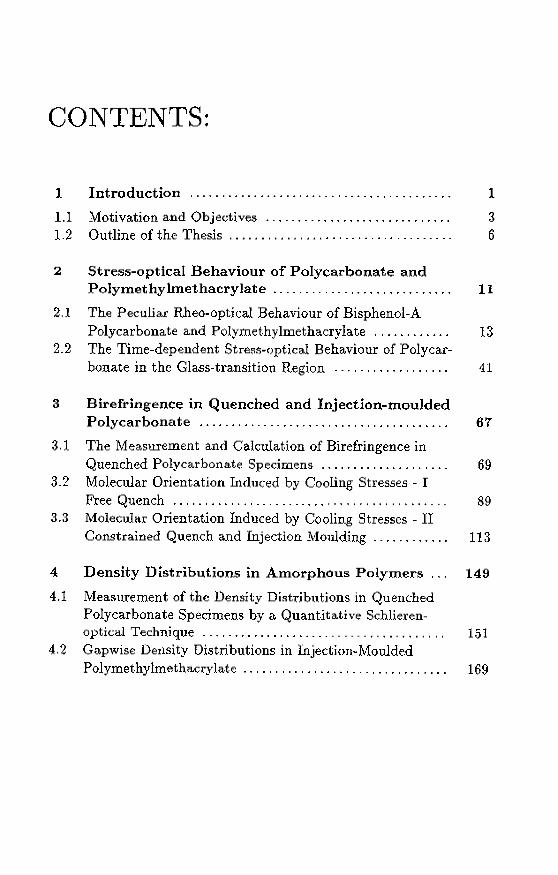
1 Introd uction ........................ __ . _ ... __ .... _ . . . 1
1.1 Motivation and Objectives . _ . __ .. _ . . . . . . . . . . . . . . . . . . . . . 3 1-2 Outline of the Thesis ................... _ .. _ . _. _ _ _ _ _ _ _ _ _ 6
2 Stress-optical Behaviour of Polycarbonate and Polymethylmethacrylate . ___________ ................ 11
2.1 The Peculiar Rheo-optical Behaviour of Bisphenol-A Polycarbonate and Polymethylmethacrylate ............ 13
2.2 The Time-dependent Stress-optical Behaviour of Polycar-bonate in the Glass-transition Region . _ . . . . . . . . . . . . . . . . 41
3 Birefringence in Quenched and Injection-moulded Polycarbonate ......... ____ . . . . . . . . . . . . . . . . . . . . . . . . . . 67
3.1 The Measurement and Ca.lculation of Birefringence in Quenched Polycarbonate Specimens .................... 69
3_2 Molecular Orientation Induced by Cooling Stresses - I Free Quench ............. - - - - - - --........ .. ... .. . .... .. 89
3.3 Molecular Orientation Induced by Cooling Stresses - II Constrained Quench and Injection Moulding. _.. . . . .. . . . 113
4 Density Distributions in Amorphous Polymers... 149
4.1 Measurement of the Density Distributions in Quenched Polycarbonate Spec;imens by a Quantitative SchIieren-optical Technique -- ............... _________ ............ 151
4.2 Gapwise Density Distributions in Injection~Moulded Polymethylmethacrylate ............. , ... ___ . . . . . .. . . . . . 169
r, Injection-moulded Optical Components ........ 193
5. J 1\ nalyt)i8 of the Birerringeno~ Distributions in Compact Dis\.s of Polycarbonate ................. ,.,"',...... 195
() General Conclusions ......... ,.,"""', ... ,...... 217
6,1 Conclusions , .... " ............................. , .. ,. 219 0.2 Reconunendations ..................... , . , . , , , , , . , . . . 223
Summary ........ , .. " ..... , .. ,.,.................. 227
Samenvatting ................. , .. ,"',.".......... 231
Zusammenfassung ., .. ".......................... 235
N awoord ."., .. ,", ............................. ,.. 239
INTRODUCTION
1
1.1 Motivation and Objectives
Organic polymers find inc;reasing use in different kinds of applications beca.use of their attractive properties, most of all the ease of processing. Complex shapes can be achieved by moulding at short cycle times in fully automated production processes (e.g. injectionmoulding). This is attractive from an economical point of view, but it also allows a high degree of functional integration in and miniaturization of products, in that way creating new product opportunities. Therefore orgamc polymers aN replacing inorganic materials in many applications, even in functional components, for instance for optical devices. The consequence is an increasing demand for controlling the properties of polymer products.
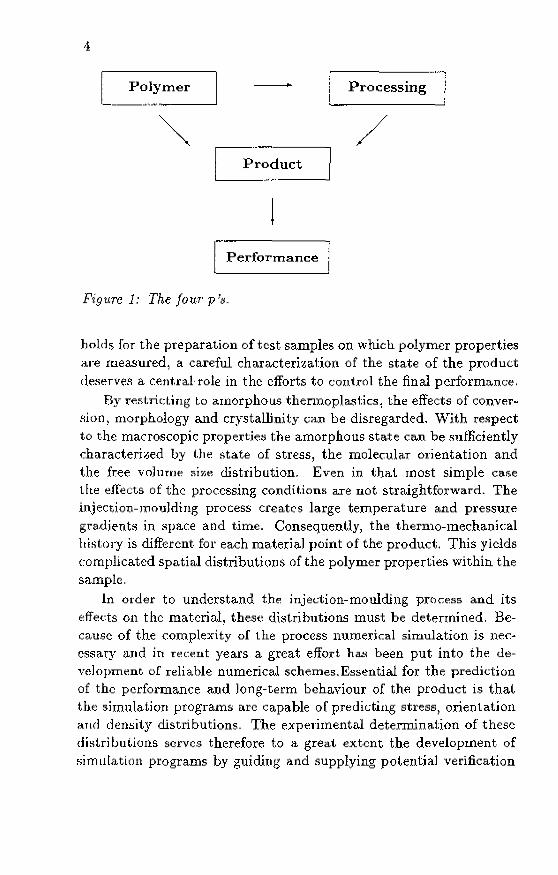
It is task of the chemical engineers to tailor-make materials for specific requirements by molecular design and/or blending. However, it turns out that the properties of polymer products are not intrinsic. Whether one dea.ls with thermopla.stic5~ thermo-,or photosets, unfilled or filled materials) the properties always depend to a great. extent on the processing conditions. The problem is sketched in Fig.l by the four p's. The ultimate goal is the performance of the product. The empirica.l approach often used is to adjust the processing conM
ditions in order to achieve a certain performance. In that case the product itself remains a "black box'l and in general a large number of trial and errors will be needed to achieve that goal. The only determinative link to the performance of the product is its sta.te a.t the end of processing. This state is the key for understanding the effects of processing on the polymer on the one hand, but also the reference for the determina.tion of the performance of the product. Since this even
3
4
I __ ~~~~~_e_r_----l - [ Processing·-·'··'I
~~~~ t
Pigure 1; The fouT' J! '$-
/
holds for the preparation of test samples oU which polymer properties <l.1-e measured, a careful characterization of the state of the pruduct deserveR a central· role in the efforts to control the final performance,
By reRtriding to amorphous thermoplastics, the effects of converflinn, morphology and crystallinity can be disregarded, With respect to the macroscopic propertje~ the amorphous state can be RulIidently characterized by t.he fltate of stress, the molecular OTientation and the free vo]m:ne Ri:-o;e distribution. Even in that. most simple case tlte effects of the processing condit.iolls are not straightforward. The injection-mQulding process creates large temperature and pressure gra{iients in space and time. Consequently, the thermo-mechanical history is different for each materia.] point of the product. This yields complicated spatial distribution::> of the polymer properties within the sample,
In order to understand the injection-moulding process and its dfects on the material, thes(~ di8t.ributions must be determined. Because of the complexity of the Pl"OCCSS numerical simulation is ne<;~ cssary MId in recent years a great effort has been put into the development of reliable numerical schemes, Essential for the prediction of the performance and long-term behaviour of the product is that t.he sirnnlatic>rJ programs arc capable of predicting stress, orientation aud den~ity distributions. The experimental determination of these diHLri blltions serves therefore to a great extent the developlnent of simulation programs by guiding and supplying potential verification
5
of the predictions that already can be made.
Amorphous polymers are transparent to the visible light. Therefore the optical properties are sufficiently described by the real part of the refractive index_ For amorphous systems the refractive index can be related to the poladzability by the Lorentz-Lorenz equation. This equation supplies a direct link between the refractive index and the densitYl one of the properties we need to quantify_ Orientation and residual stresses lead to an anisotropy of the polariubility of the material. For relatively low anisotropies with orthorhombic symmetry the refractive index tensor remains proportional to the polarizability tensor and therefore gives access to the anisotropy introduced by stresses and molecular otientation, which are the other two quantities we need to determine. Thus, the refractive index tensor essentially contains all the information one needs to characterize the state of a.n injection-moulded product:
n = n d + nl n d ---t stress, orientation
n -----t density
There n d denotes the deviatoric part and n. the the average of the refractive index. 1 is t.he unity tensor.
The goal of the investigations presented in this thesis is to measure density, stress and orientation distributions in quenched a.nd injection-moulded samples of polycarbonate (PC) and polymethylmethacrylate (PMMA), all by optical means. The material properties and experimental conditions are detennined and described in order to allow the use of the results for the verification of simulation programs.
1.2 Outline of the Thesis
In order to be able to qllantify orientation) stress and density the attention will be focussed on a munber of different items, like: t,he stress· optical behaviour of the polymers in the entire tempera.ture range of interest, the thcrmomechanic.:a,l history of the samples in quenching and injection-moulding) the ent.TOpy-elastic and energyelastic contribution to birefringence and different experimental techniques) including a new technique to detennine refractive index dis" tributions- The t.heHis consists of a collection of published papers and papers which arc accepted or submitted for publication, {;ontained in chapters which can be read separately, i.e- without the necessity of having read the foregoing chapt.ers. In fact the different chapters are arranged in a logical order which happened not to be the chronological one. ConsequenUYl pl-eviou5 conclusions are not necessarily taken into account in a following chapter_ In order to show the con~ ncctions between the different chapters their contents are illustrated briefly.more debt
The stress-optical behaviour of PC and PMMA
Birefringence has turned out to be a useful for the determination of molecular orientation in polymers. Molecular orientation can be described by an orientational distribution function. Tlw.t is the normalized probability of a chain segment to make a certain angle with the preferential direction. For moderate degrees of orient.atioIl usually the ~econd momentum of that distribution function is a sufficiently accurate representation of t.he total function- By plotting birefrjn~
6
OutliIle of the thesis 7
gence vs_ the second momentum (i.e. order parameter) a straight line is obtained Thus the birefringence is proportional to the order parameter and consequently a good measure for molecular orientation.
As already mentioned one of the reasons to determine orientation distributions is to verify predictions of mould filling programs. Birefringence is attractive for that purpose, too. A stress-optical rule has been established for the entropy clastic response in polymers and proved to be valid in all polymer melts investigated- The stressoptical rule postulates a linear relation between the dcviatoric stress tensor and the deviatoric refractive index tensor. Reduced to two dimensions this is usually written as:
where C is the so-called stress-optical (:oefficient. This coefficient is determined by the molecular configuration and conformation of the polymer chain segments- In Chapter 2.1 the stress-opticaJ coefficient and its temperature dependence are determined for PC and PMMA in the melt by flow birefringence. Strong differences between the rheo-optical behaviour of PC and PMMA are found and interpreted in terms of their molecular structures_ The analysis includes a rheological characterization of the materials.
The stress-optical rule has been used to translate flow induced 8tresses into birefringence. Usually the stresses present at Tg are used to calculate the birefringence due to frozen-in molecular orientation. In those calculations the viscoelastic spectrum used for calculating the stresses, is truu(:ated at the rubbery plateau towards shorter times. Indeed, the stress-optical rule is valid in that regime. The glass transition, however} is not a discontinuous step, as is usually assumed in the calculations- It is the transition from the response dominated by entropy elasticity to that dominated by energy elasticity. For a correct prediction of the stl,'esses and consequently the frozen-in orientation this transition has to be induded} as it is this transition which "freezes inn the orientat.jon of the chain segments. The linear stress-optical rule was developed for entropy elastic systems, therefore it is expected to fail at that transition. For a correct prediction of birefringence the stress optical relation has to be defined
8 Ghap/,er 1.2
in t.he glass transition range as welL In Chapter 2-2 the stress-optical behaviour of PC is investigated in the transition regime from the rubbery to the glassy st.ate by creep experiments on a specially designed tensile tester_ A retardation function is proposed which replaces the linear stress-opt.ical rule. It is t;haractcrized by a time-dependent retarda.tion time and a width expressed in a stretched exponential function. For pure energy elastic systems like the glassy state also a linear stress-optical rule is valid for short times in the ljnear regime, however, with a different stress~optical coefficient. This coefficient is determined by t.he local deformat.ion mechanism. There is also a significant cont.ribution from the change of the interatomic distances with stress. In this way the stress-optical behaviour of PC is described for the whole temperature range covered during pmcessing.
Birefringence in quenched and injection-nlOulded PC
For PC the ratio of the stress-optical coefficient above and below Tg i~ Hluch smaller than for polystyrene (PS) which has often been used in investigations of injection-moulded articles. For PS the contribution of residual stresses to birefringence is hardly noticeable_ Birefringence is therefore no good means to determine residual stresses in injecti(HHlloulded PS. For the same reason the determination of molecular orientation from birefringence is stra.ightforward. In PC, howevel-, the birefringence due to residual stresses is expeded to be much higher. Therefore the. contributions of residual stresses and molecular orientation have to be distinguished_
In order to study the effect of thermal stresses without the con~ tribution of flow induced stresses quenching experiments are carried out. In Chapter .1.1 the calculation of birefringence due t.o thermal stresses is described, making use of the stress-optical rule with different coeflidents above and below Tg. Despite the simple viscouselastic: constitutive relation with a discont,inllous step at. Tg, the program tllrns out to be successful in predicting residual birefringence in quenched PC. In Chapter 3- 2 residual birefringence distribut.ions in fr-cely quenched PC samples are measured and compared with predictions_ The systematic influence of quench conditions as well as the effects of ~ample preparation are discussed. Molecular orienta.tion is found to be induced by cooling stresses above Tg. Wa.Y5 are shown
Outline of the thesis 9
to distinguish experimentally between the orientation and stress contribution. In Chapter 3.3 birefringence distributions are determined in PC samples quenched under constraint in a specially designed apparatus. The presence of the walls turns out to affect the stresses and birefdngence enormously. The distributions are compared with those obtained from injection-moulded PC samples. The contribu~ tions from flow-induced and thermal induced stresses to birefringence are distinguished- This distinction proves not to be equal to that between frozen-in orientation and residual stresses.
Density distributions
The glass transition temperature Tg is defined not just as a mechanical transition, but as the point where the volume expansivity undergoes a sudden change. When a melt is cooled the free volume decreases and the packing of the molecules impl"oves. This requires a local rearrangement of the molecules. With a certain cooling rate the mobility of the system a.t a certain temperature will become insufficient to achieve that rearrangement in time so that the shrinkage will become retarded. This leads to an excess free volume in the system which in turn affects the mechanical properties a.nd the relaxation times. Since the shrinkage is only ret.arded, it will continue with time even when the temperature is constant. ThIs process is called physical aging. The shrinkage leads to a decrease of the mobility. Therefore the process of physical aging is self retarding. Below Tg the mobility is insufficient not only to respond to a certain cooling rate acc;ord. ing to the equjJjbrillm free volume distribution, it is also insufficient to respond to a change of the pressure. When the material vitrifies under pressure and the pressure is then released it cannot recover its equilibrium volume immediately. The compression will be frozen in to some extent. This is known as the so-called formation pressure effect. The density of the polymer therefore will depend on the cool· ing rate at the moment of glass transition and the pressure present during the vitrification. High cooling rates lead to low densities, high pressures to high densities. OIl top of that, also the actual state of stress affects the density via the compressibility of the material in t.he glassy state.
In the past gapwise density distributions have been determined
10 Cllapter .1.2
by micro taming and measuring the dens.ities of the individual slices. Not many reliable results have been obtained in that way. With the aid of a quantitati ve Schlieren optical set-up gapwise refractive index distributions are deterruined and for the first time translated into densi t.y distributions_ The experimental results are (:onnrmed by pl-edictions of a simple analytical modeL In Chapter 4.1 this tedlruque is described and applied to assess the gapwise density distributions in quenched PC specimens. The competition between the effects of cooling rate and residual stresses is demonstI-atcd- In Chapter 4 _ 2 density distributioTls are determined in injection-moulded PMMA samples_ Complicated distributions are observed and explained by the pressure coun:;e recorded in the cavity during vitrification. The formation pressun,: effect is quantified by density measurements on samples obtained under controlled homogeneous conditions_ The inliuenee of injection-moulding parameters is shown and discussed.
Injection-moulded optical components
The effects of orientation, stress and density on the optical properties of polymers have just been used for the assessment ofthe distri butions of thOl':e properties. In this part. the means becomes the purpose.
The requirements for many optical applications are very stringent. For example, in optical data shlrage the focu~ of the laser beam has to be diffraction limited. N one of the optkal components in the light path may deteriorat.e the shape of t.he wave front. The optical path must not be affe(:ted by the components other than meant by the design. Apart from shape deviations especially a variation of the average and the anisotropy of t.he refractive index must be kept as low as possibJe_ In Chapter .5 it is shown as an example, how the stringent optica.l requirements for the Compact Disc can be met, despite the high birefringence in injection-moulded PC- The effects of moulding condit.ions on the optical properties and compensation mechanisms a.re demonstrated_
In a final cha.pter some recommendations for future research are gIven, as based on the conclusions of the results described in this thesis_
Part 2
Stress-optical Behaviour of Polycarbonate and
Polymethylmethacrylate
l1
Chapter 2.1
The Peculiar Rheo-Optical Behaviour of
Bisphenol-A-polycarbonate and
Polymethy Imethacry late l
ABSTRACT: The rheological and stress-optical behaviour of the melts of several grades of Bisphenol-A polycarbonate (PC) and Polymethylmethacryla.te (PMMA) is investigated. Pertinent flow birefringence measurements are carried out in a remodelled cone-plate apparatus1. The shear stress in the polymer melt is calculated frQm the dynamic moduli) which are determined separately. It is shown that the linear stress optical rule is obeyed. In t.his way the stress-optical coefficient C of the melt. can be determined. The low-Mw polycarbonatcs all behave as Maxwellian fluids. The main st.ress direction does not deviate significantly from 45°. In the temperature range from 160 to 260°0 the stress-optical coefficients of the different grades lie between 3 and 4 x 1O-9Pa- 1 and show a weak temperature dependence. The stress-opt.ical coefficient of PMMA is about a factor of 100 lower and shows a peculiar temperature dependence) changing its sign at 144 cC. 'rhe results are discussed in terms of the arusotropy of the pol ariz ability of the polymer chain.
I Repriutcd from: R.Wimbe.gcr-Friedl, Rheol.A<;ta 30 (1991) 329
13
14
Introduction
M auy different ,~spects make birefringence a,n interesting property in polymer t.eduIOlogy: Flow birefringence i~ a method for measuring t.he rheological properties of a polymer melt2 4 and studying molecular conforrnations5 , Stress-birefringence techniques have been applied for a long time. in mechanical engineeringo. Frozen-in birefringence is used to measure Lhe residual stress and orienLation clistributions in injection moulclings7 - 1O . Residual birefringence, however j is an in" convenient property of plastic substrates for optkal application,!\ e,g. for the Compact Disc II ,12.
Tn general j polymeric chain molecules arc optically anisotropic Tha.t. means the polarizability is direction-dependent. '['he pob..riz~ ability is determined by t.he chemical configuration and conformation of the chain. Only if the macromolecules are in a random coil conformation does the ani~>otropy cancel Ollt on a macroscopic scale. In other word", when the randomness of the coil structure is dist.urbed a, HJIUTOHCOpic anisotropy is generally obtained. When a stress is applied to or wmerated in an amorphous isotropic polymer bulk the random coils will be<.:orne distorted, The nature of the response of t.he macromolecules depends on the time scale of t.he process with respect to the relaxation times of the possible modes of motion, Two limiting case~ can be distinguished: at very short t.ime.s j when the diffusion of th~ c.hains is hindered hy lack of mobiHty the stress leads t.o a distortion of bond angles a.nd rotations of groups within the chain segments a.s well as a change of intermolecular distances, so t.hat the restoring energetic forces equal the mechanical force applied. At long times compared to the orientational relaxation time the mobility .i.s high t:nough for t.he chain segments 1.0 orient in the direction of the main stress until the en tropic restoring force equals the mechanical force, Both phenomena lead to an anisotropy of the polarizability of t.he molecules. The short time response j in general j leads to much lower optical anisot.ropy at the same stress level, so that it is disregarded in the. t.reatment of polymer melts. For the case of orientabon t.he si t.uation is unde.rst.ood quite well from a theoretical point of view I:~, The case of deformation in the glassy st.aLe is more complicated due to the predominant contribution of the short time response, There is no mature theory describing the eft'ects wit.h respect to a.niHotropy
Rileo-optical behaviour of PC and PMMA 15
quantitatively on a molecular scaJe, as the glassy state itself is not very well understoode.g .14,"16. In the present contribution only the behaviour at temperatures considerably above the glass transition is discussed. The glass-transition range will be dealt with in a following publication. PC and PMMA were chosen because both are frequently used in optical components. It turns out that both materials are very different in their behaviour and show peculiarities compared to, for instance, the very extensively investigated polystyrene melts.
The stress-optical rule
For an extensive discussion of the stress-optical rule in polymer melts the reader is referred to reference13 . The stress-optical rule of polymer melts goes back to the work of Kuhn and Gruen17 and Treloar~8, who developed this rule for ideal rubbery networks. They showed that by assuming chains to be built up of rod-like segments the entropic stress in a network depends in the same wayan the strain as the anisotropy of the electronic polarizability. For small anisotropies this leads to a linear stress-optical rule by inserting the Lorentz-Lorenz relation between polarizability and refra.ctive index. Lodge19 extended the model to temporary networks and Janeschitz-Kriegl1S showed that it is not even necessary to assume the presence of a network for the derivation of this rule. The stress-optical rule means that the deviatoric Cauchy stress tensor, ad, is proportional to the deviatoric refractive index tensor) n d :
(1)
The stress-optical coefficient, C, is determined by the anisotropy of the polarizability of the statistical rod-like segment (all-a.d, where II and .1 denote the directions parallel and perpendicular to the axis of the rod, respectively.
1 (n2 +2)2 C = 90e
okT n (Oill - r~_d (2)
C is determined by the molecular configuration and conformation and is very characteristic of every polymer. to is th~ permissivity of vacuum, fl. is the average refractive index, k Boltzmann's constant and T the absolute temperature.
16 Clwpter 2..1
2 JI
x
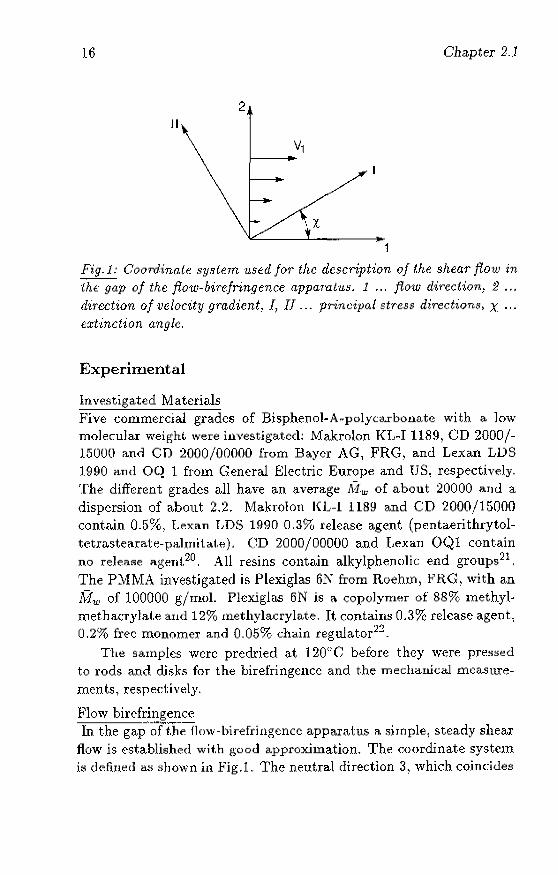
Fig.;: Coordinate. system used fo?' the description of the shear flow in ~(he gap of the flow-birefringence appa.mlus. 1 ... flow direction, 2 .. . direction of velocity gradient, I, II ... principal stress direction!:i) X .. .
extinction angle.
F~xperiIIlent al
Investigated Materials Five commercial grades of Bisphenol.A.polycarbonate with a. Jow molecular weight were investigated: Makrolon KL~I 1189, CD 2000/-15000 an'" CD 2000/00000 from Bayer AG, FRG) and Lexan LVS 1.990 and oq 1 from Ceneral Electric Europe and US, respectively. The different grades all have an a.verage M·w of about 20000 and a dispersion of about 2.2. Ma.krolon ](1,-1 1189 and CD 2000/15000 contain 0.5%, Lexan LDS 1990 0.3% release agent (pentaerithrytoltetrastearate-palrnitat.e). CD 2000/00000 and Lexan OQ1 contain no releMe agent,20. All resins contain alkylphenCllic end groups21. The PMMA investigated is Plexiglas 6N from Roehm, FHG, with an Mw of 100000 g/rnoL Plexiglas 6N is a copolymer of 88% methyl" roethanyla.t,e and 12% methylacrylate. It contain~ 0.3% release agent, 0.2% free monomer and 0.05% chain regulator22.
The samples were predried at 120"C before they were pressed to rods and disks for the birefringence and the mechan.ical measurements, respectively.
Flow birefringence In the gap'~Tth;rlow"bitefrlngence apparatus 11. llirnple, steady shear
flow is established wit.h good approximation. The coordinate system is ddlned as shown in Fig.l. The neutral direction 3, which coincides
Rheo-opt.ical behaviour of PC and PMMA 17
with the principal axis III of the stress ellipsoid, is perpendicular to the plane of Fig.l and parallel to the direction of light propagation in the apparatus. As a consequence the remaining pdndpal axes must lie in the l,2-plane. The principal clirection making the smallest angle with the flow direction is defined as first principal axis 1. The angle between the first principal axis and the flow direction is called extinction angle x. The following interrelations are valid:
r , 20"21 ~n = - = C(O"[ - GIl) = C-, -
d s1n2X (3)
and C = 6..nsin2x 21]q
(4)
There r denotes the optical retardation, d is the thickness of the melt in the direction of light propagation, q is the shear rate and 1] the viscosity, The coaxiality of the stress and refractive index tensors implies that X is a measure of the elasticity of the melt:
(5)
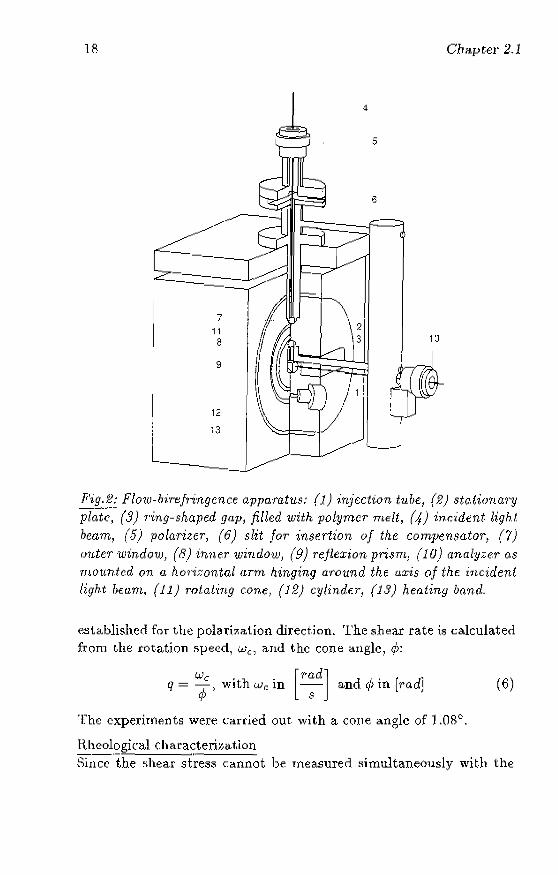
In Fig-2 the set"up is drawn schematically. The prepressed rod is inserted into the injection tube (1), which is screwed into the plate (2), confining the gap (3) at one side. Then tbe whole apparatus is heated and the molten polymer pressed into the gap- The incident beam of tight (4) emerges from a hjgh~pressute mercury lamp. It goes through a polarizer (5), a Berek-type compensator at 45° with respect to the polarizer (6), the outer window (7), the polymer melt (thickness 10 mm), the inner window (8), a prism (9), the analyzer at 90° with respect to the polarizer (10) and a telescope. (Note that compared to ref.1 the light direction is reversed_) The analyzer is mounted on an arm hinging around the axis of the incident light beam (4). The cone (11) is rotated with a constant ang1llar velocity We. With the compensator removed the arm, which bears the analyzer and the telescope and is connected to the prism) is rota.ted to the position of extinction of light. Then it is turned through 45° with respect to the extinction position and the retardation is compensated by tilting the compensator plate. The direction of rotation of the rotor is reversed and the procedure repeated. Therefore, no absolute zero has to be
18 Chapter 2.1
4
--------Ji'ig.2: Flow-bir'efr'ingcnce apparatus: (1) injection tU'Je, (2) sta.tionat'Y plat~',- (3) 1"ing-shaped g(lP, filled with polymer melt, (f.) incident light
beam, (5) polarizer, (6) slit fOT in$ertion oj the compen$ator, (7) mder windo'U), (8) inner window, (9) rejlexion pri,HrL, (10) analyzer as nwwdcd on (], horizontal (l7'm hinging a'round the axis of fhe. incident light beam., (11) rolal'ing cone, (12) cylinde.7', (is) heating band.
established fOT the pola.ri;>;ation direction. The shear rate is calculated from the rotation speed, We, and the cone angle, 1):
q = we) with We in [rad] and 4> in [rad] cJ> s
The experiments were ou-ried out with a cone angle of 1.08°.
H.hcologiea.l (:haracteri;..;at.ioll
(6)
Since ··t"he shear st~es5 cannot be measured simultaneously with the
Rheo~optical behaviour of PC and PMMA 19
birefringence, it has to be obtained from a separate rheological characterization. This is done by a dynamic mechanical analysis. With the rule of Cox and Merz23 the steady shear viscosity can be calculated from the dynamic experiment:
0 " GI ,,:.: / n ( 11
ry(q) ==!1]~(w) !w=q with: 1] = Tl - iry and ry = - and ry w w
(7) To widen the experimental window use is made of the time-temperature superposition principle. The measured dynamic moduli arc reduced to one master curve according to:
(8)
where p denotes the density of the melt. The horizontal shift factors aT obey the WLF shift function24 ;
(9)
The constants Cl and C2 are determined by the well~knQwn WLFplot.
Combining the expression for the zero-shear viscosity, 170 with the rule of Coleman and Markovits25 for the coefficient of the first normal stress difference "[fl,o:
lJ!l,O = lim (((.Tn - 0'22)00) = lim (2G1(w)) (10)
q--+O q2 w-.O w 2
one can relate the dynamic modllli to the initial slope of the extinction angle vs. shear rate curve as obtained from the flow-birefringence measurement:
li (Cot2x(q)) _ (WI'O) _ _ li (G') ill - -- - TO - ill ~-.-
g-.. o q 2'1]0 w-->O G" w (11)
The dynamic moduli were determined with a couette-type apparatus at the University of Lin;.;, with a Rheometries plateaplate rheometer at the Philips Plastics Laboratory and a cone-pla.te rheometer at the Philips Research Laboratories.
20
i (ij 2=.. • 0 0)
.2 if)
ot 0...
o>=",
CD .Q
5 ..
4·
3·
2 LOGT10= 3.46
-3 -2 -1
11'
I I
o
Chapter 2.1
2 3 log w aT [S-1] ____
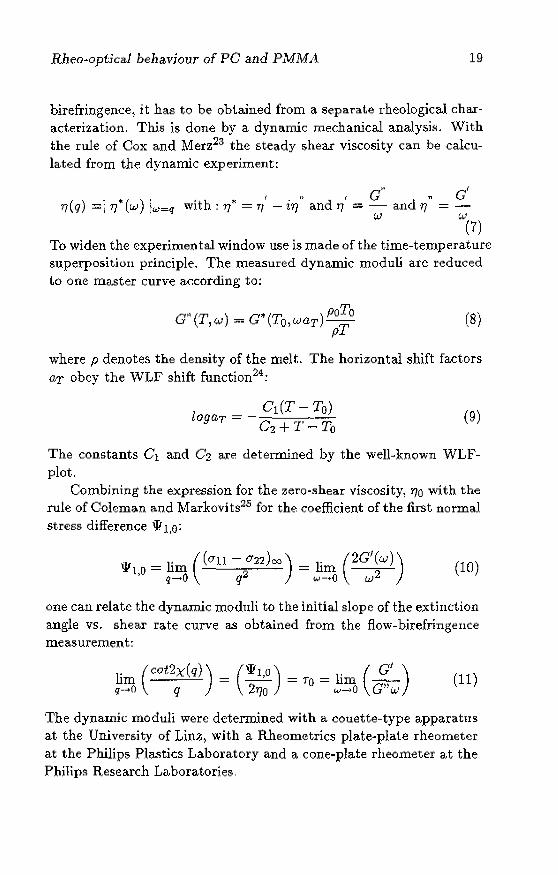
Fig.3: Master C1J,rV€ vf the dynamic moduli, G' and GI!; and the CoxMcrz viscosity, r/" us. reduced frequency, waT; of Makrolon KL-J .t.189 at 220 0 C.
Results and Discussion
Complex Moduli and Viscosity
The dynamic moduli and the Cox-Merz vitlcosity of M1tkrololl KL-I 1189 are shown in Fig.3 for the reference temperature of 220('(J The ini tial slopes of G' and Gn of 2 and 1, respectively, as predicted by linear viscoelastic theory, are reached. The zero-shear l.irnits of 1J and 1't can therefore be obtained, as indicated in the Jigure. One can see that PC shows very little elasticity (compare equations 5 and 11) and the Newtonian-viscosity behaviour rea<:hes to rdatively high shear ['ates. The master Curves were obtained by horizontal shifting. The shift functions, (l'T, of all PC grades are almost identical with Gl = 4.2 and C2 ,= 100°C as best fit for Kl-11189 at the rderence temperature of 220"C. The shift function was obtained ft;,om a so-called WLF-plot (T-To)/logaT vs. (T-To) for Makrololl Kll189 and CD 2000/15000. At temperatures higher than 280 DC the shift function does no longer follow a WLF type of equation but an Arrhenius type one.
Rhev-optical behaviour of PC and PMMA
f ~5 ~
b E'4 '"iii" «j
e:.3 oj::"
0)
o 2
-3 -2 -1 o
21
2 3 logwaT[s-ll -
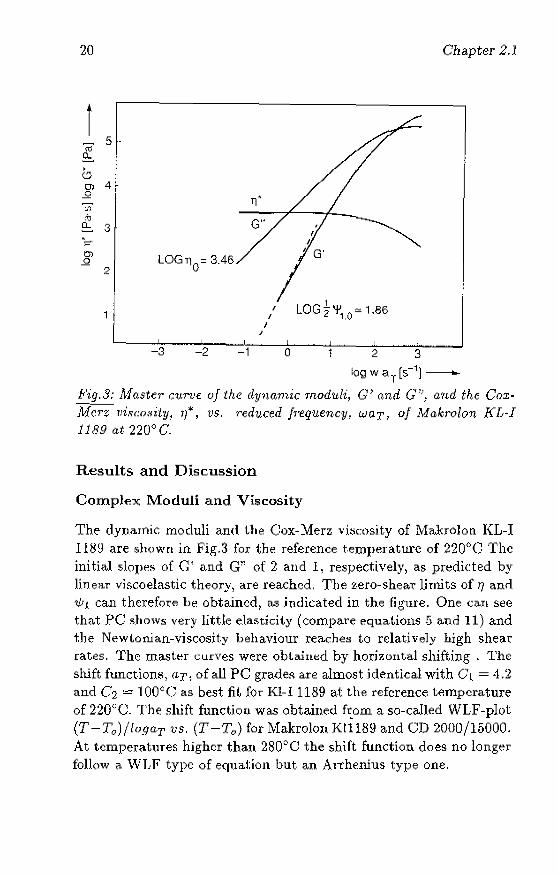
Fig.4; Master C?lr'Ve of the dynamic moduli, G' and G", and the Cox~ Me1'z viscosity, ry", 'Os. red'uced freq·uency, waT, of PMMA Ple.xiglas eN at ZOO°c.
The dynamic moduli and Cox-Merz viscosity of PMMA Plexiglas 6N are shown in Fig.4. From the zero-shear limits of the viscosity and first normal stress coefficient it can be concluded that this material is much more elastic than PC. At the reference temperature of 200°C (~ Tg + 110°C), the shear thinning effect occurs already at much lower shear rates as compared to PC at 220°C (:::::;:: Tg + 80°C). The shift factors of Plexiglas 6N can be described by the WLF equation with 0 1 = 7.77 and O'l. = 215°C fO!" the reference temperature of 200°C. With the aid of the time-temperature superposition principle and the rule of Cox and Merz it is possible to ca.lculate the viscosity for any tempera.ture and shear rate applied in the flow-birefringence experiment.
Flow birefringence of PC
As could be seen from the dynamic moduli (1'1,0 in Fig.3), PC behaves very much like a Maxwellian liquid, meaning that in a steady
22 {;l1apter 2-1
r -3
5
166 215
j/' 172 d~' oj 1 88 231 255
/ JJ( .I' ~ . ')/~f t'f 182. III 20.1.5 208 .J; 243
Jf .f J~{" . "' yl4' .# . _"i{tl J.~; .' h.·· . u;t /$1;
/1" /<h' . ",,://{
6 /,; p' /1
-4
--6_73----....J_2::------_....L1:---------LO-------L----..J2
logq[s 1]_
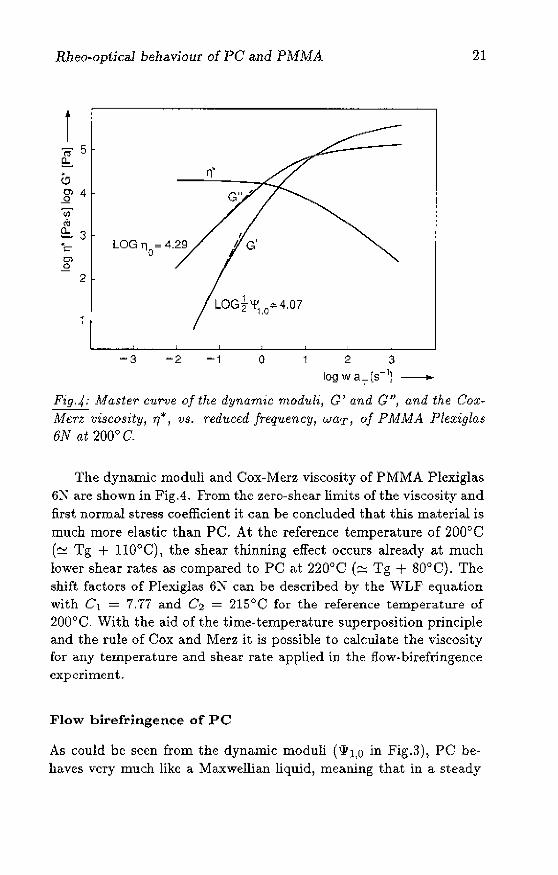
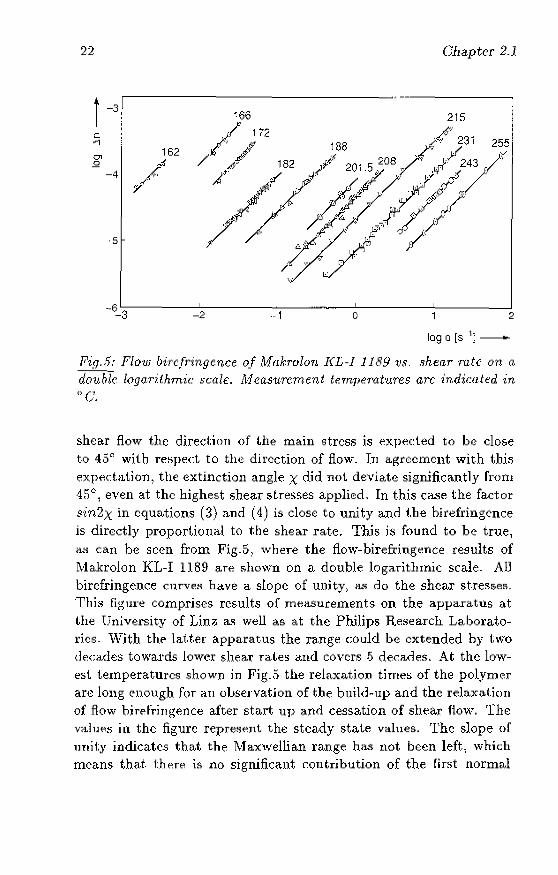
Ji'igJi; Flow Mrc/r-ingcnce of .MfLkrolon ](L-1 1189 vs .. ~he(LT· ratc on a. donbTc logo.rdhrnic 8cale. M casnr-cment ternpemt'ures arc indicated in O(),
shear flow the directioTl of the main stress is expected to be close to 45° wHh reHped to the direction of flow_ Tn agreement with t;hj~ expectation) the extinction angle X did not deviate significantly from 4;;°) even at the highest shea.r stresses applied. In this Case the factor $'in2X in equations (3) and (4) is close to unity a.nd the birefringence is directly proporUonal to the shear rate. Thi8 is found to be true, aH can be seen from Fig-5 , where the flow-birefringence results of Makrolon KL-I 1189 are shown on a double logarithmic scale. All birefringence cnrveH h<:t.ve a slope of unity, as do the shear st.ressetl. This figure comprises results of measurements on the apparatus at the University of Linz as well as at the Philips Research Laboratories. With the latter apparatus the ra.nge could be extended by two decades towai'ds lower shear rates <:t.nd covers .5 decades, At the lowest temperatures shown in Fig.S the relaxat.ion times of the polymer are long enough for an observation of the build"up and the relaxaLion of flow birefrinuence after st.art. up and cessation of shear flow. '1'he va)uf)t> in the figure represent the steady state values. The slope of llnity indicates t.hat the Maxwellian range ha.s not been left, which means that there is no significant. r:outribution of the first normal
Rheo-optical behaviour of PC and PMMA 23
I 0
-1 'j.
e d' -2 ~ OJ .Q
-3
-4.
-5
-6 150 170 190 210 230 250 270
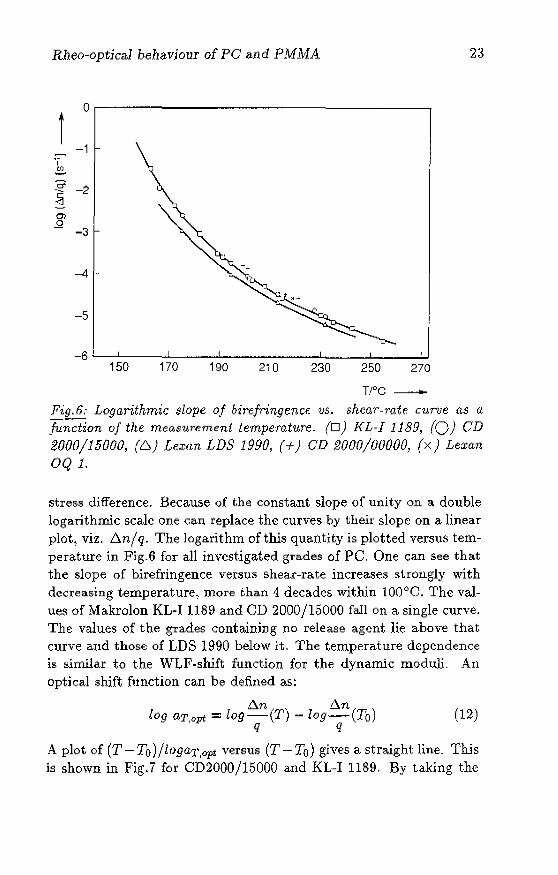
T/oC -----Fig.6; Logarithmic slope of birefringence 'Us. shear-rate curve as a !u;;'ction of the measurement lempemture. (0) KL-J 1189, (0) CD 2000/15000, (6) Le:I;an LDS 1990, (+) CD 2000/00000, (x) Lexan OQ 1.
stress difference. Because of I;he constant slope of unity on a double logarithmic scale one can replace the curves by their slope on a linear plot, viz. !:m/q. The logarithm ofthis quantity is plotted versus temperature in Fig.6 for all investigated grades of PC. One can see that the slope of birefringence versus shear-rate increases strongly with decreasing temperature~ more than 1 decades within 100"0. The valueS of Makrolon KL-I 1189 and CD 2000/15000 fallon a single curve. The values of the grades containing no release agent lie above that curve and those of LDS 1990 below it. The temperature dependence is similar to the WLF-shift function for the dynamic moduli. An optical shift function can be defined as:
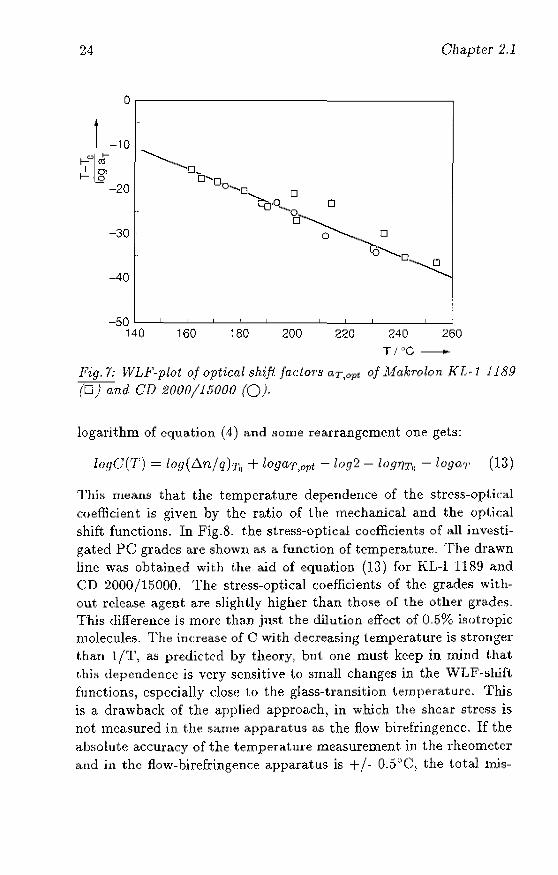
6.n, nn log aT opt ::::: log-(1) -log~(To) , q q (12)
A plot of (T-To)/loga'J.',opt versus (T-To) gives a straight line. This is shown in Fig.7 for CD2000/15000 and KL-I 1189. By taking the
24 Ohapter 2.1
Or-----------------------------------~
f -10
1-00
1 J: 1 01 I- 0
- -20
-30
-40
T/'·'C-
Fig.7: WLF-plot of optical shift facio.,,!>' aT,opt of Makrolon KL-l j 18.9 (0) a.nd CD 2000/1/;000 (0).
logarithm of equation (4) a.nd some rearrangement one gets:
[o!JG(T) = log(!1n/qhh + loga-f,opt -10g2 - logrl'l'o -loga,!, (13)
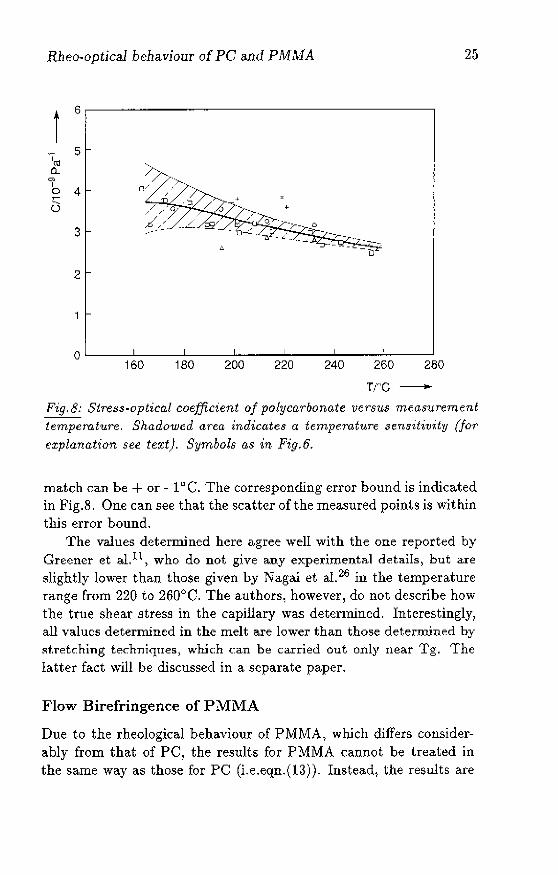
This means that the temperature dependence of the stress-optical coeflkient is given by the ratio of the mechanical and the optical shift functions. In Fig.S. the stress-optical coefficients of all investigated PC grades are shown as a. function of temperature. The drawn line was obtained with the aid of equation (13) for KL-l 1189 and CD 2000/15000. The strcss-optica.l c:oefficients of the grades without release agent are slightly higher than those of the other gr<l,d~s, This difI'erence is more th,l.U just the dilution effect of 0.5% isotropic molecules. The increase of C with decreasing temperature is stronger than t /1\ as predicted by theory, bnt one must keep in mjnd that this dependence is very sensitive t() small changes in the WLF-::lhift functions) especially dOSE~ to the glass-transition temperature. This is a drawback of the a.pplied approach) in wruch Ow shear stress is not measured in the S1l.H1e apparatus as the flow birefringence. If the absol.uk accuracy of the tempeTatmc measurement in the rheometer and .in the flow-birefrinw~nce apparatus is + /- 0.5\\(\ the total lllis-
Rhea-optical behaviour of PC aJld PMMA 25
r 6
1m 5
n.. 0> I 0 4 ~
~-0
3 LJ~
2
TI"C --
Pig.S: Stress-optical coefficient of poly carbonate versus measurement temperature. Shadowed area indicates a temperature sensitivity (for explanation see text). Symbols as in Fig.6.
match can be + or - 1"0. The corresponding error bound is indicated in Fig.8. One can see that the scatter of the measured points is within this error bound.
The values determined here agree well with the one reported by Greener ct al. ll , who do not give any experimental details, but are slightly lower than those given by Nagai et al. 26 in the temperature range from 220 to 260°C. The authors, however, do not describe how the trlIe shear stress in the capillary was determined. Interestingly, all values determined in the melt are lower than those determined by stretching techniques, which can be carried out only near Tg. The latter fact will be discussed in a separate paper.
Flow Birefringence of PMMA
Due to the rheological behaviour of PMMA, which differs considerably from that of PC, the results for PMMA cannot be h-eated in the same way as those for PC (i.e.eqn.(13))- Instea.d, the results are
26
i '? 45 o
o 5 10 15 20 25
Chapter 2.1
2.5 i 2 "0
u
1.5
. 1
0.5
30 q/s 1 __
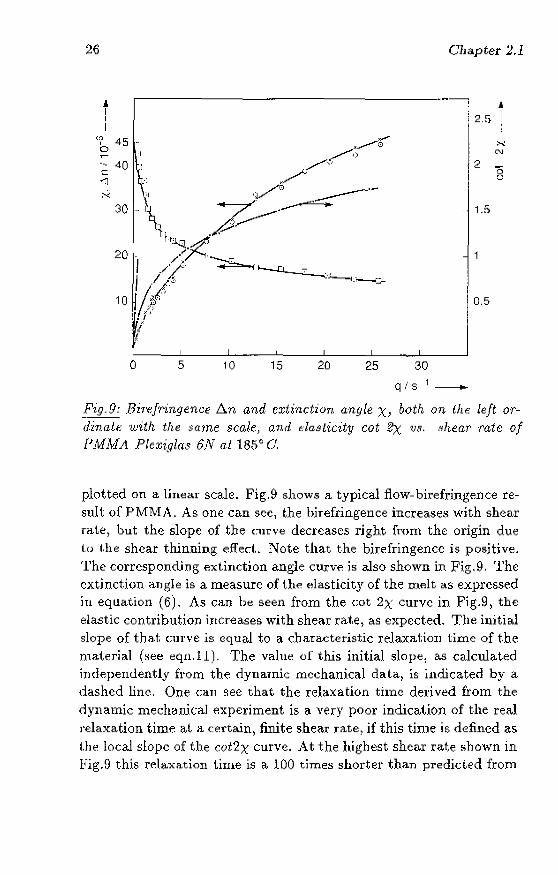
!ig-9: BinJringence b..n and extinction angle X, both on the left ordin(llt; 'With the same scale, and da8licity cot 2x 'Us. shear mte of FMMA Plexiglas 6N at 185() C.
plotted on a linear scale. Fig.9 shows a typical flow-birefringence result of PMMA. As one can sec, the hiTefringence increases with shear Tate) but the slope of the curve decreases right from the origin due 1.0 the shear thinning effect.. Note that the birefringence is positjve. The corresponding extinction angle curVe is also shown in Fig.9. The extindjon angle is a measure of t.he elasticity of the melt as expressed in equation (6). As can be seen from the cot 2X curve in Fig.9) the elastic contribution increases with shear rat.e) as expected. The initial slope of that curve is equal to a characteristic relaxatioIl time of the ma.terial (see eqn.ll). The value of this initial slope) as calculated independently from the dynamic mechanical data) is indicated by a dashed line. One can see that the rela.xation time derived fro111 the dynamic mechanical experiment is a very poor indication of the real relaxation t.ime a.ll:!. u~rtain, finite shear rate) if this time is defined as the local slope of the cot2X curve. At the hight)st shear rate shown in Fig.!} this rdaxation time is a. 100 times shOl"ter than predicted from
Rlwo-optical bellaviour of PC and PMMA
t r~
6 200
-100
-200 .
177,5
i88.5
234 5 678 q/S···1_
27
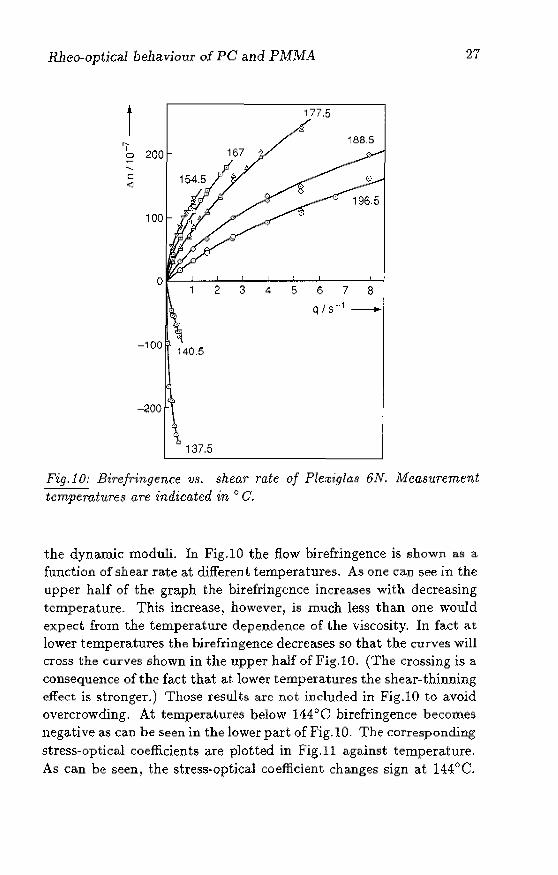
Fig.l0: Birefringence v8. shear rate of Plexigla.q 6N. Measurement temperatures arYl indicated in 0 C.
the dynamic moduli. In Fig.lO the flow birefringence is shown as a function of shear rate at differen t temperatures. As one can see in the upper half of the graph the birefringence increases with decreasing temperature. This increase, however, is much less than one would expect from the temperature dependence of the viscosity. In fact at lower temperatures the birefringence decreases so that the curves will cross the Curves shown in the upper half of Fig.to. (The crossing is a consequence of the fact that at l<lWer temperatures the shear- thinning effect is stronger.) Those results are not included in Fig.I0 to avoid overcrowding. At temperatures below 144"0 birefringence becomes negative as ca.n be seen in the lower part of Fig. 10. The corresponding stress-optical coefficients a.n~ plotted in Fig.ll against tempera.ture. As can be seen, the stress-optical coefficient changes sign at 144()C.
28
r 'I m
0.. ~
10
0
7
6·
5 ...
4
3
2
o f-----j:)..-------------j
-1
-2
-3
130 150 170 190 T/ne _
Chapter 2 . .1
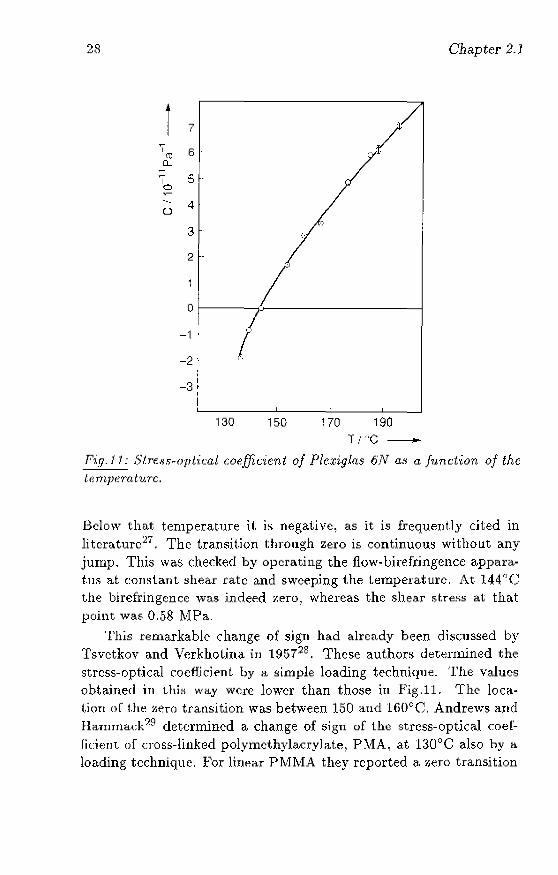
fi\g. 11: SIT'f;.~.N)ptical coefficient of Plexiglas 6N a,s a, fund'ion of the lempemt'l.trc.
Below that temperature it is negative, as it is frequently cited in litcraturc27
• The tra,nsition through zero is continuous without any jump. This wa,$ checked by operating the flow-birefringence apparatllS at constant shear rate and sweeping the temperature. At 144 "C the birefringence was indeed 7.eI"O, whel~eas the shea,r st.ress at that point was 0.58 MPa.
This remarkable change of sign had already been d.is(:llssed by Tsvctkov and VerkhQUna in 195728 . These authors determined the stress-optical coefficient by a simple loading tt~chniqlle. 'rhe values obtained in this way were lower than those in Fig.11. The location 0(" the z.erO transition was between 150 and 160°0. Andrews and HamJIlack29 determined a change of sign of the stress-optical coefficient of' cross-linked polymcthylacrylat~) PMA, at 130°C also hy a loading technique. For linear PMMA they reported a, zero transition
HJlCo-optical behaviour of PC a.nd PMMA 29
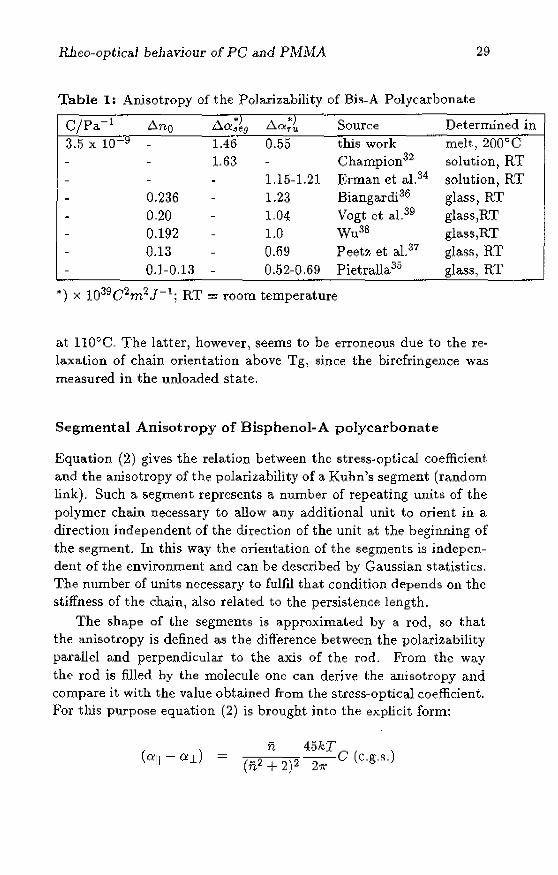
Table 1: Anisotropy of the Polarizability of Bis-A Polycarbonate
CjPa-1 .6. no - ~) *) Source D~terrn.ined in ~a:e9 ~O:TU
3.5 x 10...:.'"9 1.46 0.55 this wQrk melt, 200"0 1.63 Champion32 solution) RT
1.15-1.21 grman ct al. 34 solution) RT 0.236 1.23 Biangardi36 glass) RT 0-20 1.04 Vogt ct a1.39 glass,RT 0.192 1.0 Wu38 glass~RT
0.13 0.69 Peetz et al. 37 glas5~ R.T 0.1.-0.13 0.52-0.69 PietraUa35 glass, RT
at llO°C_ The latter) however~ Seems to be erroneous due to the rela.xation of chain orientation above Tg, since the birefringence was measured in the unloaded state.
Segmental Anisotropy of Bisphenol-A polycarhonate
Equation (2) gives the relation between the stress-()ptical coefficient and the anisotropy of the polarizability of a. Kuhn's segment (random link). Such a segment represents a number of repeating units of the polymer chain necessary to allow any additional unit to orient in a direction independent of the dhection of the unit at the beginning of the segment. In this way the orientation of the segments is independent of the environment and can be described by Gaussian statistics. The number of units necessary to fulfll that condition depends on the stiffness of the chain, a.lso related to the persistence length.
The shape of the segments is approximated by a rod, so that the anisotropy is defined as the difference between the polarizability parallel and perpendicular to the axis of the rod. Prom the way the rod is filled by the molecule one can derive the anisotropy and compare it with the value obtained from the stress-optical coefficient. For this pllrpose equation (2) is brought into the explicit form:
n 45kT (Ji2 + 2)2 ---z;-C (C_g_5.)
30 Chapter 2.1
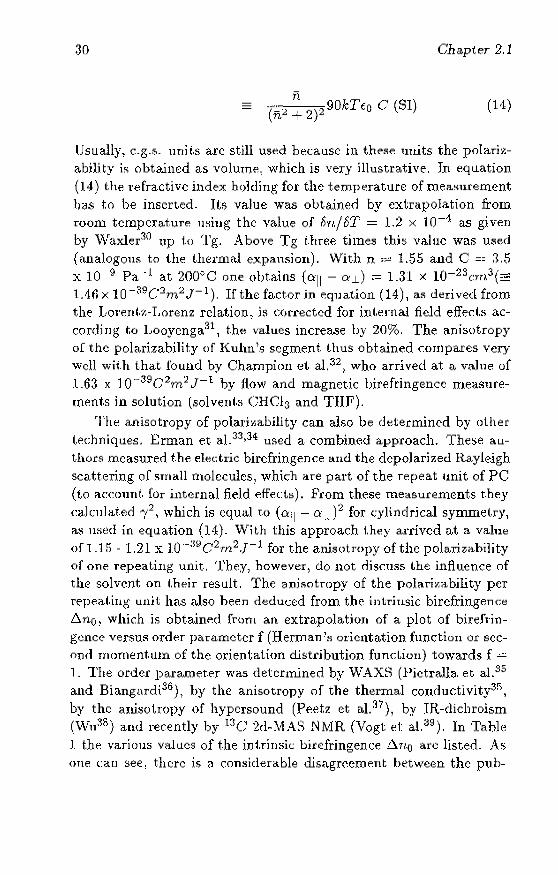
Usually, c-g-s- unit.s are still used because in these units the polarizability is obtained as volume) which is very illustrative. In equation (14) the refractive index holding for the temperature of measurement h<:l.$ to be inserted, Its value was outajned by extrapolation from room tempera.ture lIsiug the value of 8n/6T = 1.2 x 10⁻¹ as given by Waxler30 up to 'l'g. Above Tg thn'l€ times this value was used (analogous to the thCl"mal expansion). With n ,,'" 1.55 and C == 3.5 x 10 9 Pa -1 at 2OCJOC one obta.ins (0::11 - O'_d ;;= 1.31 X 1O-23crn,3(=:
1.46 x lO-- 39 C':lm 2J-l). If the factor jn equation (14), as derived from the Loren(,),-Lorcnz relation, is corrected for internal field effects accord.ing to Looycnga31 , the values increase by 20%. The <'l.nisotropy or the polarizabilif:y of Kuhn)s segment thus obtained c:::ornpares very well with that found by Champioll et al. 32 ) who arrived at a value of 1.63 x 1 W' 39 C>:?m2 J- 1 by flow and magnetic birefringence meaSurements in solution (solvent.s CHC13 and TIIF).
The anisotropy of polal'i:r,ability can also be determined by other techniques. Erman et a.1_ 33 ,34 used a combined approach. These authors measured the electric birefringence and the depolarized Rayleigh scattering of small molecules) which are part of the repeat unit of PC (to account. [or internal field effects). From these measurements they caJclllated '/) which is equal to (all - alJ~ for cylindrical symmetry) as ll~wd in equation (14)- With this approach they arrived at a value of 1 .1 S - 1.21 x 1.0 .. -:Wc2m2.r J for the anisotropy of the polarizability of one repeating unit. They, however) do not discuss the influence of the solvent on their [-esuit. The anigotropy of the pola.rinbility per repeat.ing unit has also been deduced from the intrinsic birefringence 6.110) which is obtained front an extrapolation of a plot of birefringence versug order parameter f (Herman)8 orientation function or second momentum of the orientation distribution fund.ion) towards f "'" 1. The order parameter WitS determined by WAXS (Pietralb. et aL35
and Biangardi36 ), by the anisotropy of the thermal conductivity3f:i,
by the anisotropy of hypcrsound (Peetz ct al.:'!7) , by 1ft-dichroism (W1l38) itnd recently by 13C 2d-MAS NMR (Vogt ~t 3.1. 39 ). In Tabl(~ J. the va.rious values of t.he intrinsic birefringence fino arc listed, As one caIl see) there is <I considel"<lble disagreement between the puh-
Rbeo-optical behaviour of PC and PMMA 31
lished values. Recently PietL-alla and Pieper discussed the problems of determining the intrinsic birefingence of PC10. From the intrinsic birefringence the anisotropy of a repeating unit can be derived with the aid of the Lorentz-Lorenz equation:
(15 )
again assuming a cylindrical shape of the molecule. The subscript ru denotes repeat unit, N A is AvogadrQ's constant and M is the molecular weight of the repeating unit. In this relation anisotropic internal field effects arc not considered. This can affect the result considerably because one has to extrapolate measurements to very high anisotropies (in contrast to flow birefringence). The respective polarizability values are also given in Table 1.
The comparison with the anisotropy of the segmental polari:.r,ability as derived from the stress-optical coeHicient is unfortunately aggravated by the uncertainty about the length of the Kuhn's segment. Champion derived a value of 3.5 repeating units per segment with an oversimplified structure. Tsvetkov et alY use the mtio between the contour length of the chain, L, and the root mea.n square end~to-end distance, < TO >, in order to estimate the average segment length:
(16)
where>. is the projection of a repeat unit on the segment axis and the subscripts ru and seg denote repeat unit and segment, respectively. The root mean square end-to-end distance was derived from SA NS measurements in the bulk by Gawrisch et a1. 42 a.nd Ballard et al.43 as 15.9 nrn for the molecular weight of OUf materials. By assuming all-trans confonnation ..\ = 1.11 nrn. In that way one ends up with an a.nisotropy of the poiarizabUity of the repeat unit of 5.5 x 1 0-40C 2m 2 .1-1, which is in good agreement with that reported by Pietralla et al. 35 . For a compariflon see Table 1.
The relatively high stress-optical cocfficient of PC has been a problem for the use of PC for optical components, especially as substrates for optical disks. Several attempts were therefore made to rcduce the anisotropy of the polarizability of the PC chain by chemical
32 Chap/'er 2 .. 1
i 4 4.5 i
M 3 E u
1 2 -0
1 u "1
0
3 'I J
(\J
E <'J
1.5 u
r 0
0 1;)
-1 -"1
-1.5
-2 -3
-3
-4 -4_5
100 150 200 T / nc -
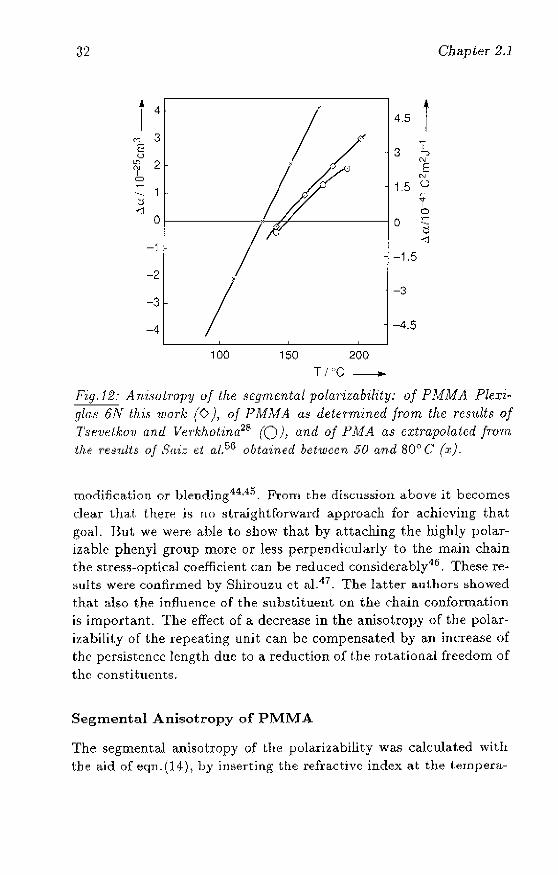
li'if!.12.- A ni8oLn)fJY of Lhe 8egmental polarizability: of P MMA Plexz" glas 6N thl:.~· 1lJorA; (0), of PMMA a.8 deter·mined from the rcsnlts of TS(~'Vf:lko'u and Ve'I'khotina,28 (0), and of PMA as extrapolated jTO'fn
the results of SaL: d a!.G6 obtained between 50 and 80" C (:r;J-
modiAcation or bl~ndjng44,45. From the discllssion above it becomes de(:l.r Und. i.hen~ i~ flO :;i.r(:l.ightfofward approach for achieving that goal. Bul. we wen~ able to show that by attaching the highly polarizable phenyl group more or less perpendicularly to the main chain the ~tre~~-Qptlc.al codfic.i~nt can be reduced considerably16, These results were confirmed by Shirouzu et al. o17
, The la.tteJ' authors showed th(l.t also the influence of the substituent on the chain conformation is important. The effect of a decrease in the anisotropy of the polari~ability of the repeating unit can be compensated by an increase of the persistence length due to a reduction of t.he rotational freedom of the constituents.
Segmental Anisotropy of PMMA
The segmental anisotropy of t.he polarizability was calcuhtted with the aid of eqn-(14)) by inserting the refractive index at the tempera-
Rhea-optical behaviour of PC and PMMA 33
ture of measurement as given by Michel et al. 48 . The result is shown in Fig_12. The anisotropy is in the order of 1 x 1O-41C2rn2.J-l. This is very low compared to polystyrene, which is also a side-chain polymer, but has a ZOO times higher) negative anisotropy. The hydrocarbon backbone would give a positive anisoh:-opy, as has been shown for polypropylene (viz. ~a = 50 x 1O~41C2m2J-\ as derived from the stre55~optical coefficient given in ref.49.). ObviQusly the methylcster substituent compensates that contribution entirelyThe stress~optjcal coefficient of polypropylene shows no temperature dependence. The ester side group must therefore be responsible for that exceptional behaviour. Interestingly, the conformation of this side chain has been investigated in order to interpret the mechanical and dielectricaJ damping behaviour of PMMA in the glassy statei-~.50,51. There was also some speculation about the conformation of the ester side group for the explanation of the temperature dependence of birefringence dlle to frozen-in chain orientation52 ,53. In order to explain the results of dynamic birefringence measurements in the glassy state Read54 calculated the optical anisotropy of are· peat unit for different degrees of rotational freedom in the ester side group. He found (in agreement with28) that for complete freedom of rotation about the C~C bond a positive anisotropy of the repeat unit of OA8 x 1O-25cm3 can be expected- In order to compare this with flow-birefringence results the segment-length must be estimatedBy taking the value of < TO >2 jnZ2 from the Polymer Handbook55 ,
the segmental anisotropy in the case of complete freedom of rotation would be equal to 3 x 1O-25cm3. Looking at Fig.12 one can see that this is equa.l to the value at about 200°C. This suggests that there is free rotation at that temperature. But the slope of the curve is still high, so that the ultima.te value can be expected to be much higher. One reason for an even higher positive anisotropy might be due to the effect that with increasing frequency of the rotation of the bulky side group an increasing strain is exerted on the backbone of the chain. The consequence would be a distortion of bond angles on the one hand and a stiffening of the chain on the other hand. Both effects would increase the maximum segmental anisotropy of the chain.
In conformity with the interpretation of the mechanical spectrum of PMMA by Heijboer et aL 50 we estimated the frequency of the
34 Chapter 2.1
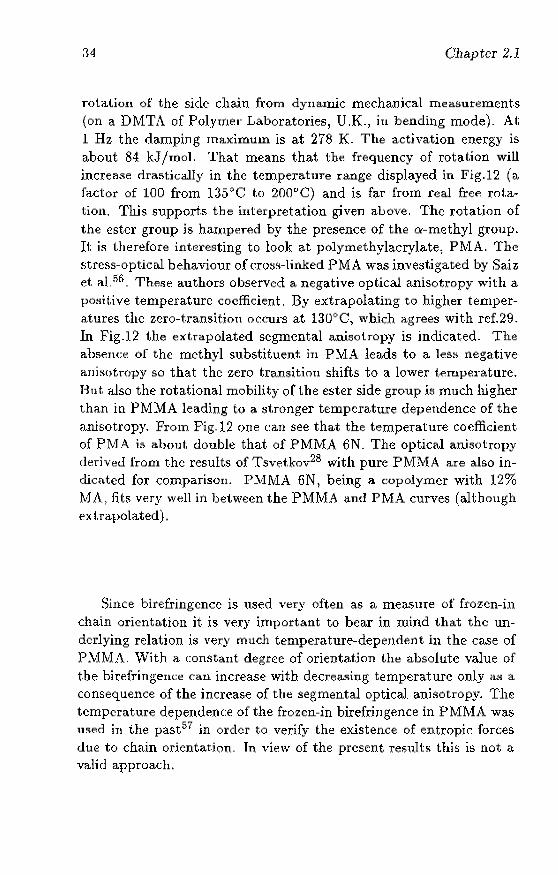
rota.tion of the side chain from dynamic mcchankal measurements (on a DMTA of Polyrne.- Laboratories, U.K., in bending mode)_ At 1 Hz the damping maximum is at 278 K The activation energy is about 84 kJ fmol. That means that the frequency of rotation will increa,se rlrastically in the temperature range displayed in Fig.12 (a fa.ctor of 100 from 135(>C to 200"C) and is far from real free rota· tion. This supporh the interpretation given above. The rotation of the ester group is hampered by the presence of the a-methyl group. It: is t.herefore interesting to look a.t polymethylacrylate, PMA. The stress-optical behaviour of cf()Sfl-linked PMA was investigated by Saiz et a1.!16 _ These authors observed a negative optical anisotropy with a positive temperature coefficient. By extrapolating to higher temperatures the zero-transitiou oCCurS at l30°C, which agrees with ref.29. In Fig-12 the extrapolated segmental anis()tropy is indicated- The absence of the methyl substituent in PMA leads to a less negative anisotropy so that the zero transition shifts to a lower ternpel"ature. Hll t also the rotational mobility of t.he ester side group is much higher than in PMMA leading to a t>tronger temperature dependence of the anisotropy. From Fig-12 one can see that the temperature coefficient of PM A is about. double that of PMMA 6N _ The optical anisotropy derived from the results of Tsvet.kov28 with pure PMMA are also indicated for compa;rison. PMMA fiN, being a copolymer with 12% MA, fits very well in between the PMMA and PMA curves (although ext.rapolated).
Since birefringence is used very often as a meaSUre of frozen-in chain orientation it is very important to bear in mind that the underlying relation it> very much temperature-depenrlent in the case of PMMA._ With a constant degree of orienta.tion the absolute value of the hirefringence can increase with decreasing temperature only a.s a consequence of the increase of the segmental optical anif;otropy. The temperature dependence of the frozen-in birefringence in PMMA was 1Ised in the pastS7 in order to verify the existence of entropic forces due to chain orientation_ Tn view of the present results this is not a valid approach.
Rlleo-optical behaviour of PC and PMMA 35
Conclusions
In their own wa.y both PC and PMMA show a peculiar stress-optical behaviour- In PC the main stress direction hardly deviates from 45° in shear flow. One has to remember this when interpreting birefringence measurements in injectionwmoulded specimens. It was shown that even there the principal direction is dose to 45° 12 . The stressoptica.l coefficient of PC is positive and high. The value of the intrinsic optical anisotropy of PC as derived from the stress-optical coefficient agrees well with the values determined by different other techniques. The segmental anisotropy of the polarizability is rather low in view of the presence of highly polariza.ble groups in the backbone. This is due to the blgh flexibility of the backbone, which leads to a low orientational correlation between the repeating units. The peculiarity of PMMA lies in the very low optical anisotropy, which shows a very strong temperature dependence) changing the sign at 144°C) which is well a.bove the glass-transition range. At 144"C the anisotropy is exactly zero. This temperature dependence is explained by the effect of an increasing freedom of rotation of the methyl-ester side group with increasing temperature. This redm:es the negative c:ontribution of the side group and increases the positive contribution of the backbone by exertIng a strain in the direction of the backbone and stiffening the chain. Thls strong temperature dependence of the intrinsic anisotropy makes it difficult to interpret residual birefringence in mouldings in terms of frozen-in orientation.
Acknowledgement
The author is very grateful to Prof.H.Janeschitz~Kriegl for his cooperation and many valuable discussions and Drs.G.Werumeus Buning for his cooperation during t.he construction of the flow-birefringence apparatus at the Philips Research Laboratories. The contribution of many people at the University of Linz and the Philips Research Laboratories is greatfully acknowledged.
References
1. J.A.van AkeIl) F.H.Gortemaker, H.JanesGhitz-Kriegl and H.M-Laun) Rheo1.Acta 19 j (1980) 159
3G
2, H"hncschjtz-Kriegl, Adv.Polym.Sci,,6, (1969) 170
3. W.Philippoff} Naturc, 178, (1956)811
Chapter 2,.l
4, G.V.Vinogradov, AJJsayey, D.A.Mustafaey and y.y.Podolsky, J,AppL Polym-Sci-, 22} (1978) 665
5, V-N,Tsyetkov, S()Viet Physics Uspck., 6, (1964) 639
(j. A.Kuske (l,nd G_RobertsoIl, "Photoclastic Stress Analysis", J ,Wiley, Chichester (1977)
7- J _L.s.Wales, J.van Leeuwen and R.yan der Vijgh, Polym.Eng.Sci.,
12 (1972) 358
8. M.Fleissner, KunststQrre, 63, (1973) 597
9, M.R.Kamal and V.Tan, Polyrn.Eng.Sci., 19, (1979) 558
10. A,I.Isaycy, Polym.Eng,Sci" 23, (1983) 271
11, J,Greener, RKesel and B.A.Contestable, AIChKJ" 35 j (1989) 119
12. lLWimbergcr-Friedl, Polym-Eng-Sd_, 30, (1990) 813 (Part 5)
13- H-JaneschitJl-Kriegl, "Polymer Melt Rheology and Flow Birefringence" j Springer, Berlin (1983)
14. M.RTl:Lnt and C.L. Wilkes, Polym.Eng,Sd., 21, (1981) 874
15. D.G.LeCrand, W.V.Olszcwski and J_T_Bendler} submitted to Thermochim.Acta
16- LV.Yanna,s ana R.R.LlIise j in "The Strength and StitTness of Polymers", cds. A,E.Zacharia.d~5 and n..S.Portel', M,Dekker, N-Y- (198:3)
1.7. W.Kuhn and F.Gruen, Kolloidzeitsr.hrif(" 101, (1942) 248
18. L.R.C.Trdoar, ))The Physics of RlIhher Elast.icity)) j 3rd cel., Clarendon Pre~ Oxford (1.975)
19. A.S.Lodgc, 'l'.l'ans.Faraday Soc., 52, (1956) 127
Rhea-opticaJ behaviour of PC and PMMA 37
20. J.Jansen Internal Report, Philips Plastic:;! Laboratory (1.986)
21- J.Lub and G.Werumeus Buning, Polymer, 31, (1990) 1009
22 .. J.Jansen Internal Reports, Philips PlastiCfl Laboratory (1984-1985)
23. W.P.Cox a.nd E.H.Merz, J.Polym.Sci., 28, (1958) 619
24. M.L.Willia.ms, R..F.LandeI and .J.D.FerrYI J.Am.Chero.Soc., 11, (1955) 3701
25. B.D.Coleman and H.Markovits, J.Appl.Phys., 35, (1964) 1
26. T.Nagal, Y.Kimizuka, K.Nito and J.Seto, Polym.P,epr..Japall, 35 1142
27, W.Retting, Colloid Polym.Sci., 257, (1979) 689
28. V.N.Tsvetkovand L.N.Verkhotina, Sov.Phys,-Teeh.Phys., 3) (1.958) 87
29. R.D.Andrews and T.J.Hammack, J.Polym.Sci., C-5, (1964) 101
30. R.M,Waxler, D.Horowitz and A.Feldmann, Appl.Optics, 18) (1979) 101
31. H.Looyenga, MoLPhys., 9, (1965) 501
32. J.V.Champion, RA.Deflflon and G.H,Meeten, Polymer, 15, (1974) 301
33. B.Ennan, D.C.Marvin, P.AJrvine and P.J.Flory, Macromolecules, 15, (1982) 664
31. B.Erman, D.Wu, P.A.Irvine, D.C.Marvin and P.J.Flory, Macromolecules, 15 (1982) 670
35. M.Pietralla, H.R.Schubach, M.Dettemnaier and B.Heisc, Progr.Colloid Polym. Sci., 71, (1985) 125
36. M.Biangardi, Colloid Polym.Sci., 259, (1981) 111
38 Chapte.r 2 . .1
37. L.Peetz, J-KKrueger, M_PietraHa, Colloid Polym.s~i_, 265, (1987) 7tH
:18. M.-S.S.Wu, J .Appl.Polym-Sci., 32, (1986) :l263
;{9. H.D.Vogt, M.Detterunaier, J-T.W.Spjess, M.Pietralla, Colloid Polym.Sci. 268, (1990) 22
40. M.Pietralla and TPj~peTj Colloid Polym.Sci. 268, (1990) 797
41_ VoN .Tsyetkoy and L.N .Andreeva, in "Polymer Handbook", 3rd cel., cds. J-Bandrup, KlLTrnmergut, .1. Wiley, N.Y., VJT-577 (lH89)
42. W.Gawrisch, M_G.Brereton and E.W.Fischcr, Polym_BuIL, 4 (1981.) 687
43- D-G-BaJlard, A.N-Bllrge55, P_Cheshire, E.W.Janke and A.Nevin, Polymer, 22, (1981) 1.3;>3
11. J .Creener and J .S.Machcll, J _AppLPolyrn_Sci., 40, (1990) 221
45. G.Werumeus Bnning and RM_R.Gijsen, Polym.Prcpr., 29, (1988) 211
46 _ G. Wennne1l5 Bunl ng, R.. Wimbergcr-Friedl, I-LJ ,mesdlitz-Kriegl and T.M.Ford, in "Integrat.ion of Fundamental Polymer Scienc::e and Technology-2, eds-P-J- Lemstra, L.A.Kkintjens, Elsevier, London, (1988) 105
47. S'shirouzo, K.Shigcmatsu, S-Sakamoto, 'T'_Nakagawa and S.Tagam.l) Japan.J. Appl. Physics , 28, (1989) 801
18. P.Michcl, J.Dugas, J.M.Cadou and L_Mart.in, .].Macromol.Sci., B25, (1986) ;319
19 . .r .L.S. Wales, "The Application of Flow Birefringence to Rheological Studies of Polymer Melts", Delft University Press, Delft, 1\)76
GO. ,J.Hcijboer, .J.M.A.Baas, RYan de Graat' and M.A.Hoefnagel, Polymer, 28, (1987) 509
'JJeo-optical behaviour of PC and PMMA 39
51- J.M.G.Cowie and R.Ferguson, Polymer, 28, (1987) 503
52. S.-D.Hong, S.Y.Chung, R.F.Fedon. and J .Moacanin, J_Polym.Sci.Polyrn.Phys., 21, (1983) 1647
53. Y.V.Chistyakov, O.s.Arkhireyev a.nd B.M.Zuyev, Polyrn.sci.USSR, 26, (1984) 2116
54. B.E.Read, J.Polym-Sci., C-16, (1967) 1887
55. M,Kurata and Y.Tsunashima, in ))Polymer Handbook)) j eds. J.Bandrup and E.H.lrnIIlergut, 3rd ed_, J.Wiley, New York, (1989) VII-1
56. E.Saiz, E.fuande and J.E.Mark, Macromolecules, 17, (1984) 899
57. L.C.KStruik, Polym.Eng.8d., 18, (1978) 799
Chapter 2.2
The Time-Dependent Stress-Optical
Behaviour of Polycarbonate in
the Glass Transition Region 1
AnSTRACT: The mechanical and stress-optical behaviour of Bisphenol A polycarbonate was investigated in the glasstl"i;lIlsition region. For this PUl"pose optical creep experiments were carried out in shear and elongation on a tensile tester specially designed for use on a microscope stage. A Kohlrausch Williams Watts equation (KWW) with a temperature independent parameter {3 could successfully be applied to the curves describing the ti:me-dependent values of the stress-optical coefficient for several temperatures. The temperature dependence of the corresponding retardation time could be established and described by the WLF equation_ For variable stresses the time~ dependent birefringence is obtained from a generalized linear stress-optical rule as modelled according to linear superposition. The time temperature superposition principle was applied to all measurernents. With the dynamic mudu)j some deviations were observed at the transition from the rubbery plateau to the Q' relaxation. The strainoptical coefficient was found to decrease with increasing time and strain. The strain dependence was found to be independent of temperature at constant stress.
1 Reprinted from: R-Whnbcrger-PriedI and J.G. de Bruin, to appear in Rheol Acta 30 (1991)
41
42 Chapter 2.2
Introduction
Birefringence is frequently used for the verification of injection -moulding sirnulationsJ - 4 . Recently, the simulation programs have become sopbist.icated enough to carry out a visc()aelastic analysis of the complete process by making usc of the Leonov constitutive models. Until now the residual birefringence wa.s pI"eructed by USe of the stress-optical rule in the molten state. However, by including the trajectory around and below the glass transition temperature in the calculations in order to describe relaxation phenomena and thermal sire:>s(;s, the stress-optical relation cannot be used in a siTIlple way!}. As will be shown, the stress-optical relation needs to be extended into a constitutive relation silnilar to a rheological one.
A linear relation between applied stress and observed birefringence was first discovered in inorganic glasses and later in rubbers. The strt:H:lf>"optical rule, as it is used in rheology studying polymer melts a,nd solutions, is based on the existence of chain segments with localized interaction sites as introduced in the theory of rubber elast.ici ty7,8" There the entropic retracting force and the anigotropy of the polarizability both depend in the game way on the orientation of the segments; i.e. the strain in the network9 . Obviously, this is an idealized description. In a real system the avplication of a strain will first lead to an ela5tic distortion of the chemical and physical bonds between the atoms. This thennodynamically unfavoured state will relax towards a situation, where parts of the chain segment.!'> are 1iwiHted out of their ITuninl11m energy conformations. At even longer tiHws the chains can relax by correlated rearrangements which lead to a.n average orientat.ion of the chajn segments in the stress direc· tion. The initial elastic response is also called energy-elastic and is dominating .in the gla.s15Y state at short ti.rnes and low stress levels (linear regime). The ultimate respoJlse is called entropy-clastic aud is dominating in rubbers and polymer melts. It has been shown that in both cases a linear relation between birefringence and stress holds lO,H. This i15 expressed by the so~called stress-optical coefficient C. In the following the coefficient fvr the glassy, short time response will be called e.g, and the one for t.he rubbery, long time response Om..
The nature of the glass transition has been the subject of many
Stress-optical behaviour of PC at Tg 43
studies 12- 14. It is generally believed that at this transition the long range positional order is frozen in, but the local mobility is retained. It was found that the kinetics of this so-called ~ -relaxation follows a temperature dependence~ which can be described by the VogelTanunan-Fukher (VTF) equation; equivalent to the relation given by Williams, Landel and Ferry (WLF)l2:
log( IT ) = _ G\(T - To) (1) TT~ 0.2 + T - To
There r denotes the relaxation time, Cl, O2 are constants and T is the absolute temperature. However~ the process cannot be described by a single relaxation time. Instead, one assumes a spectrum of relaxation times, introduced by a statistical variation of the environment of an individual segment which relaxes by single activated processIn that case the time-temperature superposition principle can be applied, since the shape of the spectrum does not change with temperature. Instead of using a discrete relaxa.tion time spectrum, Williams and Watts1!) introduced a stretched exponential function_ This is equivalent to a continuous; box-like spectrum with the exponent j3 indicating the width of the spectrum:
Pt = <I?oe;rp [- (~)t3] ) with 0 S /3 S 1 (2)
where tI> is a relaxa.tion modulus and t is time_ This empirical, so~ called KWW equation was found to be very successful in fitting experimental data]6 _ Since the a-relaxa.tion mechanism is responsible for the transition from the energy-elastic to the entropy-elastic response) instead of using a discrete spectrum17,18 the KWW equation is used here to describe the time-dependent stress-optical coefficient:
(3)
with T being a retardation time. The time dependence of the stress~ optical coefficient also implies that the conventional stress-optical rule ca,n only be applied to the stress incretnent) as expressed in a stress~ optical constitutive equation of the following kind:
(4)
44 Chapter 2.2
n d denotes the birefringence t.ensor) (Jd is the deviatoric; stress tensor and s is time. The appa.rent stress-optical coefficient Capp,t = b.71,t/ .6..al can have any value from 0 to 00) depending on the. stresstemperature history.
Since stress, birefl"ingence and strain are linked to each other, a 5tra.in-optical coefficient K can also be used .
.6.n f{ = (). -1) = CE (5)
There E de.notes thc Young)s modulus and .\ = lito. In idealrubber5 hi refringence is proportional to (.\2 - .\-1)[8]. Raha and Bowden [19] showecl fur thermopla.stic polymers in the rubbery state that this relation holds if the. concentration of chain segments was a.llowed to decrease with st.rain:
..6.71, ~ G'NO().2 - A-1)exp(-b(). - 1)) (6)
The constant C) is proportional to the stress-optical coefficient as deri ved from rubber elasticity:
(7)
where k is Boltzmann':=; constant, T is the absolute temperature, .6..0: is the anisotropy of the polarizabiJity of the chain segments. n is the average refractive index and No the number of segments per unit volume. The. exponential term in equation 6 should account for the loss of cntanglements with incTeasing orienta.tion of the chain segments. Bott.o et a1. 20 reporten a further improvement by distinguishing between a. permanent and temporary part of the physical network.
In a previom; paper the stress-optical behaviour of polycarbonate ,l,ud polymethylmethacrylate in the melt was described 21. In the present contribution the transition [Will the glassy to the rubbery state, i.e. the transition from the energy-elastic to the entropy-elastic responsc) is investigated for polycarbonate. Tn order to focus the a.t.tentioIl OIl the t.ime dependence of the respon:o:e, all experlments wen:~ caHied out at. very low stress levels) whcre the material behaves lilwarly.
Stressftoptical bellaviour of PC at Tg 45
4 3 2 7 2 3 6
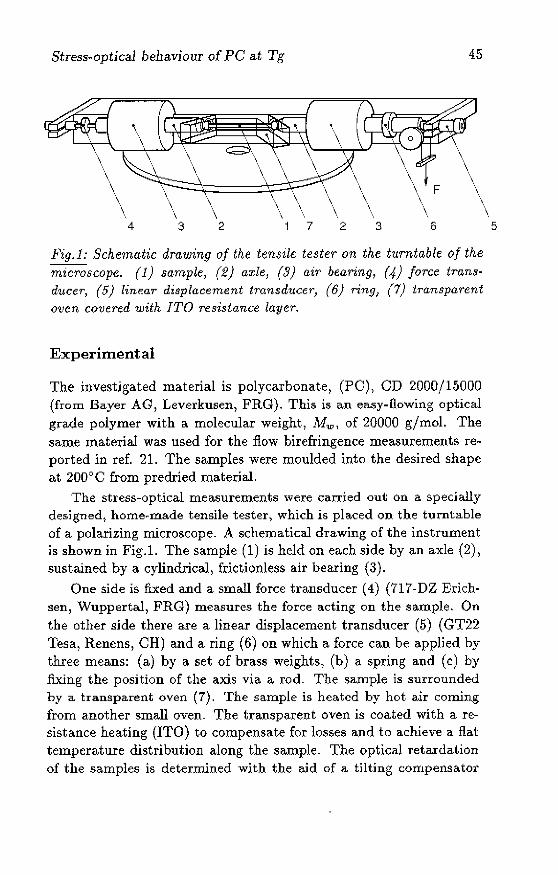
Fig. 1 : Schematic drawing of the tensile tester on the turntable oj the microscope. (J) sample, (2) axle j (3) air bearing, (J) force tran,~ducer, (5) linear displacement transducer, (6) ring, (7) transparent oven co~u:.red with ITO resistance layer.
Experimental
The investigated material is polycarbonate, (PC), CD 2000/15000 (from Bayer AG, Leverkusen, FRG). This is an easy-flowing optical grade polymer with a molecular weight, Mw, of 20000 g/:mol. The same material was used for the flow birefringence measurements ren
potted in ref. 21. The samples were moulded into the desired shape at 200°C from predried ma.terial.
The stress-optical measurements were ca.rried out on a specially designed, home· made tensile tester, which is placed on the turntable of a polarizing microscope- A schematical drawing of the instrument is shown in Fig.I. The sample (1) is held on each side by an axle (2), sustained by a cylindrical, frictionless air bearing (3).
One side is fixed and a small force transducer (4) (717-DZ Erichsen, Wuppertal, FRO) measures the force acting on the sample. On the other side there are a linear displacement transducer (5) (GTZ2 Tesa, Renens, CR) and a ring (6) on which a force can be applied by three means: (a) by a set of brass weights, (b) a spring and (c) by fixing the position of the axis via a rod. The sample is surrounded by a transparent oven (7). The sample is heated by hot air coming from another small oven. The transparent oven is coated with a resistance heating (ITO) to compensate for losses and to achieve a flat temperature distribution along the sample- The optical retardation of the samples is determined with the aid of a tilting compensator
5
4() Chapter 2.2
fc======:::Ij= .... O.8 ...
2.0 1.0
b -.... :~: .. ~:~:.~.~: ~::.- 3, 0
2.0 :::::.t:==~*.i/.;;::::I:~ .. -~ ... \4= .. = ... = .. =:j=. 1.0
~ .. ···························50·_·---_·_-
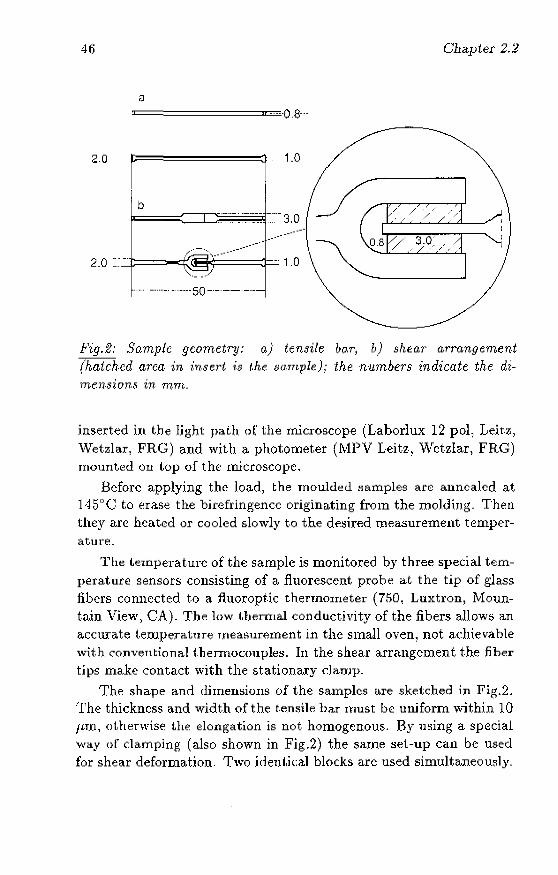
Fig. 2: Sample geometry: a) tensile bo,T j ')) shear arrangement (hatched area in l:nsert is I,he sample); ihe n,·umbers indicate the dimenswns zn mrn.
inserted in the light pa.th o[ the microscope (Laborlux 12 pol, Leit.z, Wetzlar, FRG) and with a photometer (MPV Leitz, Wetzlar, FRG) mounted OIl top of the microscope.
Before applying the load, the moulded samples are annealed at 145"C to erase the birefringence originating from the molding. Then they arc heated or cooled slowly to the desired measurement temperature.
The tClnperatul"c of the sample is monitored by three special temperature sensors consisting of a fluorescent. probe a.t the tip of glass fibers connected to a fiuoroptic thermometer (750, Luxtron, Mountain View, CA). The low thermal conductivity of the fibers allow!:! an a,ccurat.e t.emperature measurement in the small oven, not a,chievable with convent.ional thermocouples. In the shear arrangement the fiber tips make contact with the stationary clamp.
The shape and dimensions of the samples are sketched in Fig.2. The thickness and widt.h of the t.ensile bar must be uniform wit.hin 10 innj otherwise the elongation is not homogenous. By using a special way or damping (also shown in Fig.2) the same set-up can be used for shear deformation. Two identical blocks are used simultaneow:!ly.
Stress~optica1 behaviollr' of PC at Tg 17
The blocks are cut from a rod and machined precisely to the dimensions of the gap of the clamps. No glue is used. Due to the higher thermal ex.pansion ofthe polymer, the blocks make good contact with the clamp surfaces once heated to the glass transition temperature.
The creep experiments in elongation W€;l'e carried out at different temperatures between 138 - 145°0. Since the sample is fixed at one side, the area in the light path moves continuously and part of the sample moves out of the oven, Therefore much attention is paid to the homogeneity of the elongation, in order to make sure that the stress and strain history is the same for the pa.rt; of the sample that passes the light path during the experiment. The sample is divided into zones by marks applied before mounting. At the end of the creep experiment the sample is cooled at constant load, F) and the final state is frozen in. The local elongation is determined from the local change of the distance between the marks and the local change in the width and the thickness of the rectangula.r rod. The total elongation of the sample) 6Lh is recorded by the lineal' displacement transducer. The true stress) crt, and strain, At, at any time are determined from the initial width, wo, the initial thickness, do) the final local change in length, !:::.loo) the final width, Woo) the final thickness, doo and the total elongation, 6Loo:
with:
F at =-
Wtdt (8)
i1L t It::::;:: Lo + L1lo--
4LOQ (9)
The stress-optical coefficient is calculated from the measured quantities as follows:
(10)
r denotes the optical retardation, as derived from the compensator and/or the intensity, I:
2 1rr 1 = Iosin (-)
p.
There J.I. denotes the wavelength of the light.
(11)
48 Chapter 2.2
The creep experiments in shear were carried out at djfferent temperatures from 135 - 150°C. In shear the deformations could be kept very small. This results in very small displacements of the central blade) typically below 0.1 nun. The sample does not move under the light-. spot. In shear t,he area of the shear plane does not change so that the shear stresH remains constant throughout the experiment. Tll contrast to elongation t.he rinal state (:annot be frozen in because thermal stresses build up as soon as t.he temperature drops below the glass transition temperature due to the adhesion of the polymer to the clamps. The stress-optical coefficient is calculated with the aid ()f the following equation:
Ct
= Lh~ls'in2Xt = ~sin2Xt . . 20"21 4F
(12)
X denotes the extinction angle, 1 the length of the blocks and 0"2)
the shear stress. The geometry of the shear is that of a sliding plate rheometer. One important point is the fact that there is a free surface normal to the shear plane. The stress distribution is affected by the presence of that surface. The srnalllength to thickness ratio of the shear blocks could make all end corredioll necessary. The chO)len arrangement allowed uS to invest.ig,tt.e the stress distribution at the edges with the aid of the same polarizing microscope, on which the whole set-up is placed. The results of these investigat.ions will be pu blished separa.tely22. In this c.ontext the results MC corrected for end cff'eds by using a.n efFective length of the blocks) so that. the true local shear stress is used for the calculation of t.he stress-opti(:al coeffic.ieIlt .
The dynamic moduli of the mat.erial were determined with the aid of a dynanilc mechanical thermal analyzer (DMTA Polymer Laboratorie~, Loughborough) UK) both in it 4-point bending and a shear arrangement. The moduli were determined at 5 frequencies viz. 0.33, 1.0, 3.0) 10.0 and 30.0 Hz in singJe experiment by sweeping t.he temperature at a rate of O.33°C per minute. In that way essentia.lly iHothermal condit.ions arc achieved during t.he aquisition of a single data point. The samples were moulded at 200°C and cooled at typically 20°C/rnin. The cooling: rate at the glass transiti<Hl and the aging during storage previous to t.he dynamic mechanical ;;malysis determines the density of the sample. Since the mechanical analysis
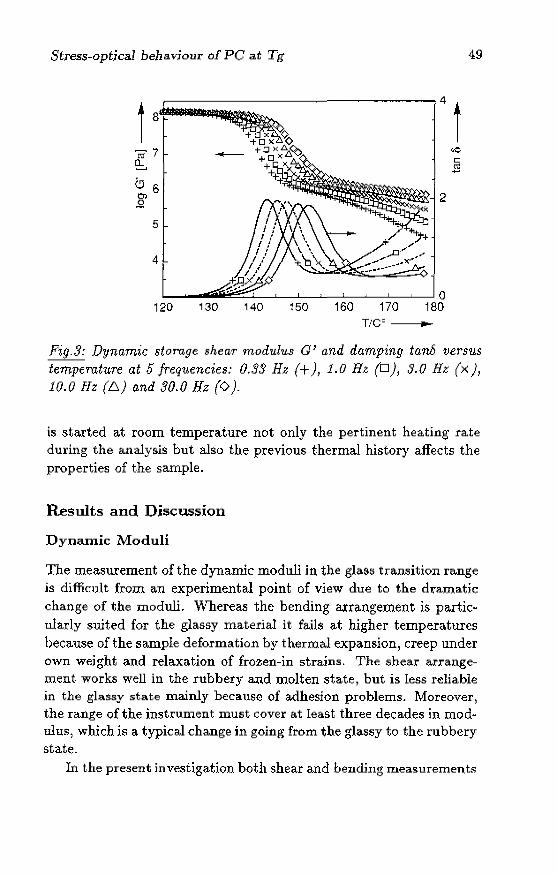
St;ress~optical behaviour of PC at Tg 49
120 130 140 150 160 170 T/C o
..
Fig.3: Dynamic storage shear modulus G' and damping taM versus temperature at 5 frequencies: 0.33 Hz (+),1.0 Hz (0), 3.0 Hz (x), 10.0 Hz (6) and 30.0 Hz (0).
is started at room temperature not only the pertinent heating rate during the analysis but also the previous thermal history affects the properties of the sample.
Results and Discussion
Dynamic Moduli
The measurement of the dynamic moduli in the glass transition range is difficult from an experimental point of view due to the dramatic change of the moduli. Whereas the bending arrangement is partic u
ulady suited for the glassy material it fa.Us at higher temperatures because of the sample deformation by thermal expansion, creep under Own weight and relaxation of frozen-in strains. The shear arrangement works well in the rubbery and molten state, but is less reliable in the glassy state mainly because of adhesion problems. Moreover, the range of the instrument must cover at least three decades in mod~ ulus, which is a typical change in going from. the glassy to the rubbery state.
In the present inve:;;tigation both shear and bending measurements
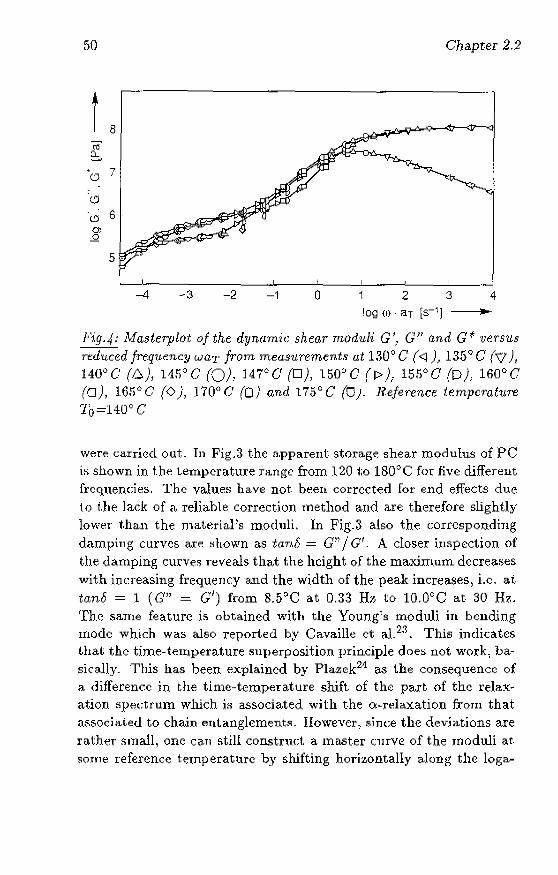
50 Chapter 2,2
t 8 ~ e::. . 7 0
(j
(j
OJ ..Q
-1 2 3 4 log (I) . aT [5-1J ..
Fig.4: Ma5teT-plot of the dyTwmic shear moduli G', G" and Gt versus reduced frequency wal.' from. m.easurement.~ at 130 0 C (<l), 1350 C (\I), 140°C (6),115°(/ (0),147°0 (0), 150°C (1)),155°0 (D), 160°C (0),16.1°0 (OJ, 170"0 (0) and 175°C (0). Reference temperatur"e 10=140° C
w~Y'~ carried out. Tn Fig.3 the a.pparent storag~ shear modulus of PC is shown in the temperature range from 120 to 180°C for five different frequencies. The valll~s have not been corrected for end effects due to t.he lack of a reli(l.ble correction method and are therefore slightly lower than the D:1l:LteriaPs moduli. In Fig.3 also the conesponding da,mping curves are shown as tanh = G" / G f
. A closer iuspection of the damping curve5 reveals that the height of the maximuIll decreases with increasing frequency and the width of the peak increases, i.e, at tano = 1 (OJ) = G 1
) ftom 8.5°C at 0.33 Hz, to lO.O°C at 30 Hr.. The :;;;ame feature i~ obtained with the Young)s moduli in bending wode which waS also reported by Cavailk ct al.23 . This indicates that the time-temperature :;;;uperposition principle does not work, basically. This has been explained by Plazek21 as the consequence of a difference in the time-temperature shift. of the part of the relaxation 5pectrum which i5 associated with the o;·relaxation from that associated to chain entanglement8. However) :;;;jnce the dev.iations are rather 5mall, one C(l,n still construct a master c:urve of the rnoduli at some reference temperature by shifting horizontally along the loga-
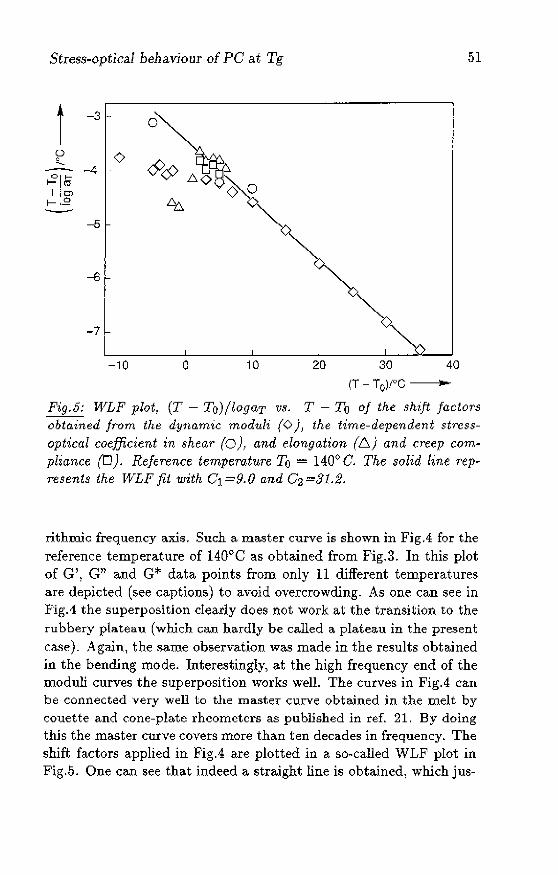
St;n~$$-optical behaviour of PC at Tg 51
t -3 _.
<)
-5
-6
-7
-10 o 10 20 30 40
(T - T o)l°C ----:l ... ~
Fig. 5: WLF plot, (T - To)!logaT Wi. T - To of the shift factors obtained from the dynamic moduli (OJ, the time-dependent strcssoptical coefficient in shear (0), and elongation (6) and creep com.
pliance (D). Re/erence temperature To = 1400 C. The solid line 1'epresents the WLF fit with C1 =9.0 and C2=31.2.
rithmic frequency axis. Such a master curve is shown in FigA for the reference temperature of 140°C as obtained from Fig.3. In this plot of G', G" and G* data points from only 11 different temperatures are depicted (see captions) to avoid overcrowding. As one can see in Fig.1 the superposition clearly does not work at the transition to the rubbery plateau (which can hardly be called a plateau in the present case)_ Again, the same observation was made in the results obtained in the bending mode. Interestingly, at the high frequency end of the moduli curves the superposition works well. The curves in Fig.4 can be connected very well to the master curve obtained in the melt by couette and cone-plate rheomctcrs as published in ref. 21. By doing this the master curve covers mOre than ten decades in frequency. The shift factors applied in Fig.4 are plotted in a so"calied WLF piot in Fig.5. One can see t.hat. indeed a st.raight. line is obtained) which jus-
52 Chapter 2_2
tifies the use of the WLF equation. However, at tempel-atures below about 148°C t,he data points fall below that straight line. This means that the shift factors are smaller than one would extrapolate from the high temperature data. This is the consequence of the volumetric glass transition, which is passed a.t. around 148°C at the pertinent heating rate of the experiment. The exce:;;;s free volume built in during the moulding of the sample leads to shorter relaxation times than predicted by the WLF equation (which is based 011 an equilibriuIO free volume distribution) _ At lower heating rates and/or annealing the relaxation tjmes are expected to increase (a.t temperatures below 148°C)_ For comparison, at 1 48()C maximum damping is at 5 Hz and maxJwmn loss modulus would be at about 70 Hz. The strajght line in Fig-5 waS obtained with the (:onstants C1 =9 -0 and C2=31.2"C. These WLF constants give a slightly steeper temperature dependence than the oneS reported in ref. 21.
Shear creep measurements
Creep measurements were carried out in a sandwich construction as described in t.he experimental section. The total ~tra.in necessary to reach the final, steady-state value of the stress-optical coefficient was found to be very low, typically below 0.1. Therefore the shape of the samplefl was essentially unaffected and the free surfaces remained flat. The extinction angJe remained at 45" throughout the whole experiment. Therefore the factor sin2x in equation (12) equals one and can be disregarded for the determination of the ~hess-optical coefficient _ The measured time-dependent stress-optical coefficient is shown in Ji'ig.6 for 4 different temperatures on a double logarithmic scale- The results at times shorter than 0.5 s were omitted, as there the time necessary to apply the load begins to affect the results. Therefore the short time response is not covered except at the lowest temperature. Nevertheless, one call see that the curves are es~entially similar. The similarity is demonstrated by the quality of the KWW fit (eqn.3) to the experimental values. The solid lines in Fig-6 represent the best fit, which was obta.ined with a value of /3 ~ 0.72 ± 0.01. Cy
was set: to 1.1O- lo Pa- 1 and em. was adjusted to fit the experimental steady state value. As one ntn see, the fit is excellent at all four temperatmcs with the same value of (3. Values for (3 as derived from
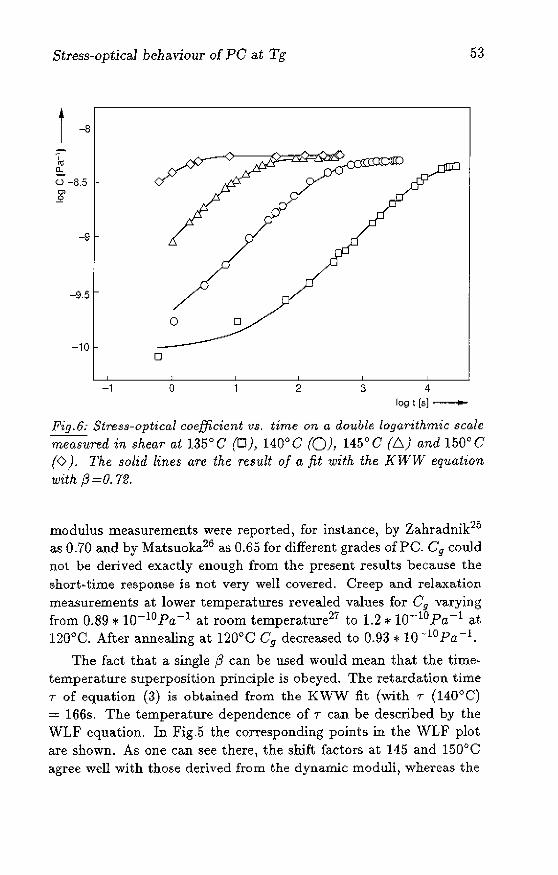
Stress-optical behaviour of PC at Tg
t -8
~ ~ 0-8.5 -
~
-9
-9.5
-10
o D
o
-1 o
53
2 3 4
log t [5] -----
Fig.6.- Stress-optical coefficient vs. time on a double logarithmic scale measured in shear at J.35°C (0),140(>0 (0), 145°0 (6.) and 150°C (0). The solid lines are the result of a fit with the KWW equation with f3 =0.72.
modulus measurements were reported, for instance, by Zahradnik25
as 0-70 and by Matsuoka26 as 0.65 for different grades of Pc. Cg could not be derived exactly enough from the present results because the short·time response is not very well covered. Creep and relaxation measurements at lower temperatures revealed values for Cg varying from 0.89 * 10-10 Pa- l at room temperature27 to 1.2 * 10--10 Pa-1 at 120°C. After annealing at 120°C Cg decreased to 0.93 * 10. 10 Fa -1.
The fact that a single f3 can be used would mean that the time· temperature superposition principle is obeyed. The retardation time T of equation (3) is obta.ined from the KWW fit (with T (l40eC) = 166s. The temperature dependence of T can be described by the WLF equation. In Fig-5 the corresponding points in the WLF plot are shown. As one can see there, the shjft factors at 145 and 150°C agree well with those derived from the dynamic moduli, whereas the
54 Clwpter 2.2
value <l.t U5°C lies on the line extrapolated from higher temperatures) in contrast to the values obtained from the DMTA at the same temperature. Thitl is not unexpeGted if the deviation of the shift fact.ors froUi the WLF equation if> interpreted as the consequence of the volumetric glass transition. In the creep experiment the sample is held at the measurement. temperature for about half an hour (after preannealing at 145°C) compared to 3 minutes in the DMTA. During the residence at the measurement. temperature before the creep experiment t.he volumetric glM,s t.ransition is Qbviol1s1y passed.
The shape of the curves in Fig.6 is not affect.ed by temperature. Therefore a master curve ca.n be constructed hy horizontal shifting on the h')garithmic time axis. The slight temperature dependence of the stea.dy .. state value has to be accounted for by adjusting em. Unfortunately) it is not yet clear how this small temperature dependence of em is 1.0 be extrapolated out,side the temperat.ure range of Fig.6. Flow birefringence measurements revealed that Om increases with decreasing temperature in the range from 255 1.0 IGO°Cfll. The stress-opticaJ coefficient. given in the same reference is also considerably lower tha.n the one determined in the present shear creep experiment. From the flow birefringence results one would extrapolate a value of 4 - 4.5 x 10.-9 Pa 1 compared to 4.8 " 5.5 x 1O-9Pa-- 1 obtained by the shear creep measureHients in the same temperature ra.nge. The reason for this discrepancy has not yet been found.
The st.ress-optical coefficient of PC was determined In the past. by relating the spinline stress to t.he residual birefringence in melt spun fibers. In this way Kang and Whit.e28 .reported a value of 5.5 x 10' 9pO,·-t for PC. These authors, however) use the value of (;.2 x 10-9 Po. 1 to fit birefringenn~ distributions in thick fibers. Shirotlzu ct al. 29 obt.ained a value of 4.2 x 10.-9 Pa-1 with the same technique. These authors report re,sult.s from stretching experiments qf Kawata and fbshirnoto yielding a stress-optical coefficient of 5.5 x 10⁻⁹ Pa' 1
Fig.4 or the same reference supports very dearly our finding that the extrapola.t.ion of flow birefringence results yields a significa.ntly lower stress~optical coefficient than those obtained at temperat.ures ju:-:t above Tg. This difference could only be explained by a. rapid or discontinuous change of' the segmental optical anisotropy of PC a.t about l(iOoC. Such a change could be caused by a conformational
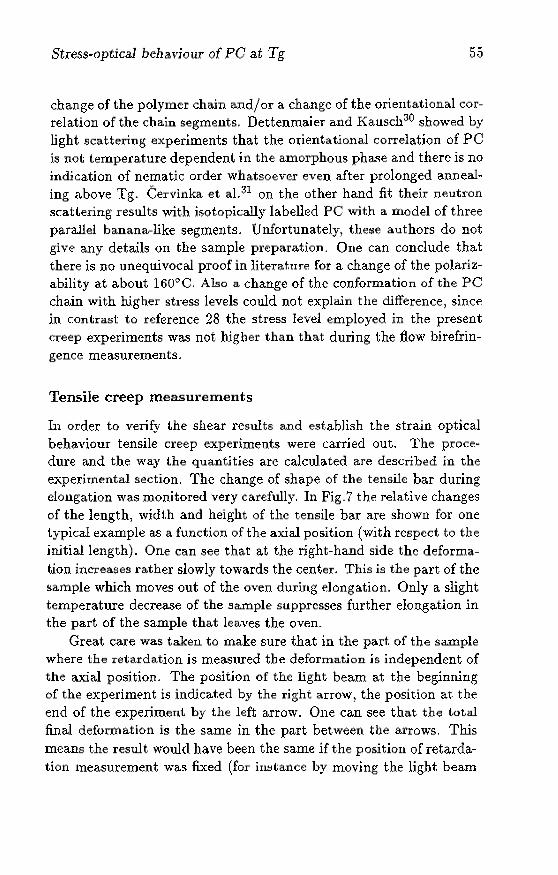
Stress-optical behaviour of PC at Tg 55
change of the polymer chain and/ Or a change of the orientational correlation of the chain segments. Dettenmaier and Kausch30 showed by light scattering experiments that the orientational correlation of PC is not temperature dependent in the amorphous phase and there is no indication of nematic order whatsoever even after prolonged anDeaI~ ing above Tg. Cervinka et al. 31 on the other hand fit their neutron scatLering results with isotopically labelled PC with a model of three pataUe! banana-like segments. Unfortunately, the$e authors do not give any details on the sample preparation. One can conclude that there is no unequivocal proof in literature for a change of the polatizability at a.bout 160°C. Also a change of the conformation of the PC chain with rugher stress levels could not explain the difference, since in contrast to reference 28 the stress level employed in the present Greep experiments was not higher than that during the flow birefringence measurements.
Tensile creep measurements
In order to verify the shear results and establish the strain optical behaviour tensile creep experiments were carried out. The proce" dure and the way the quantities are calculated are described in the experimental section. The change of sha.pe of the tensile bar during elongation was monitored very carefully. In Fig.7 the relative changes of the length, width and height of the tensile bar are shown for one typical example as a function of the axial position (with respect to the initial length). One can see that at the right-hand side the deformation increases rather slowly towards the center. This is the part of the sample which moves out of the oven during elongation. Only a slight temperature decrease of the sample suppresses further elonga.tion in the part of the sample that leaves the OVen.
Great care was taken to make sure that in the part of the sample where the retardation is measured the deformation is independent of the axial position. The position of the light beam at the beginning of the experiment is indica.ted by the right arrow, the position at the end of the experiment by the left arrow. One can see that the total final deformation is the same in the part between the arrows. This means the result would have been the same if the position of retardation measurement wa.s fixed (for instance by moving the light beam
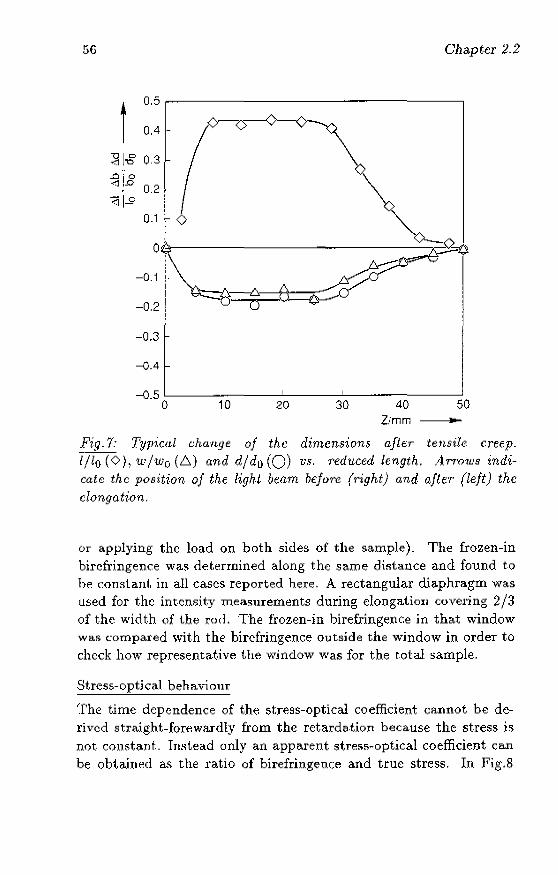
56 Ghaptel' 2.2
f 0.5
0.4 -
:g I,§' 0.3
~iE 0.2 -1 0 <1-
0.1
0
-0.1
-0.2
-0.3
-0.4
-0.5 L-__ -J-__ -----L ___ ...l..-__ --L __ -----.J
o 1 0 20 30 40 50 Z/mm ..
!ig.7: Typi(.(rl change of the dimension$ after tensile creep. 1110 (0), wlwQ (6) and dido (0) vs. reduced length. ATTOws indicate the position of the light beam before (right) and alte'f' (left) the elongation.
Or applying the load on bot.h sides of the sample). 'The frozen-in birefringence WaS det,errnined along the same distance and found to be COTl~taIlt. in all cases reported here. A rectangular diaphragm was used for the intensity measurements during elongation covering 2/3 of the width of the rod. The frozen-in birefringellce in tha.t window was compared with the birefringence Qutside the window in order to check how representative the window was for the total sample.
Stress-optical behaviour
'{'he time dependence of the stress-optical coefficient (:annot be derived straight-forewardly from the retarda.tion because the stress is not consta.HL In.stead only an apparent stress-optical coefficient can be obtained as the ratio of birefringence and true stress. In Fig.8
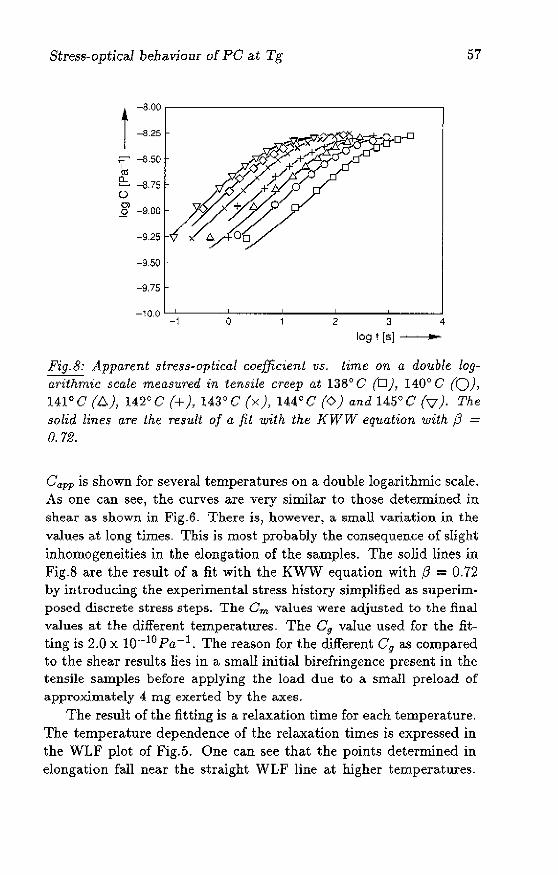
Stress-optical behaviour of PC at Tg
+ -8.00
I -8.25
,=-' -8.50 to e:.. -8.75 ()
~ -9.00
-9.50··
-9.75
-10.0 '---'---_..J........,~_--'-___ ....... __ __'_ __ .......J
-1 0 2 3 4
IOgt[5] ~ ........... -
57
Fig-8: Apparent !)tress-optical coefficient us. time on a double logarithmic scale measured in tensile creep at 138° C (0), 140° C (0), 141°C (6), 142°C (+), 143°C (x), 144°C (0) and 145Q C ('7). The solid line.~ aTe the result oj a fit with the KWW equation with f3 =
0.72.
Capp is shown for several temperatures on a double logarithmic scale. As one can see) the curves are very similar to those determined in shear as shown in Fig.6- There is, however, a small variatjon in the va.lues at long times- This is most probably the consequence of slight inhomogeneities in the elongation of the samples. The solid lines in Fig.S are the result of a fit with the KWW equation with f3 = 0.72 by introducing the experimental stress history simplified as superim
posed discrete stress steps. The Om values were adjusted to the final values at the different temperatures. The Cg value used for the fitting is 2.0 x 10--10 Pa-1. The reason for t.he different Cg a.S c()mpared to the shear results lies in a small initial birefringence present in the tensile samples before applying the load due to a small preload of approximately 4 mg exerted by the axes.
The result of the fitting is a relaxation time for each temperature. The temperature dependence of the relaxation times is expressed in the WLF plot of Fig.5. One can see that the points determined in elongation fall near the straight WLF line at higher temperatures-
58 Chapter 2.2
The values obhinerl at temperatures below 142"C fall below that line. The reason is t.ha.t the volumetric glass transition had not been reached in the experiments carried out below 142<:>C. In the tensile creep measurements the stabilization time at. the measurement temperature was kept shorter tha.n in the shear experiments for the reason of dimensional stability of the samples. One must also keep in mind how extremely sensitive the WLF plot is in the vicinity of the reference temperature, since the denominator approadH~s zero.
In conclusion, one can st.ate that the tensile creep experiment.s verify the resuUs obtained by shear creep. The time dependence can be described by a KWW equation with a f3 value of 0.72. Also the relaxation times and their tempenituTe dependence are the same. The value of em is about 5.6 * 1.0.-9 Pa-1• The stress-()ptical rule can be applied in the way it is described by equations :3 and 4. The retardation tiHle -r can be determined from equation 13 for the reference temperature of 140DC:
1 - 2 22 9.0 * (T - 140) '} d .ogry -. - WIt I T in secon s 31.2 + T - 110
(1.3)
as long as the material has equilibrium density. The deviation from this shift fund-ion occurs as soon as the volumetric glass transition is pas~ed. The transition temperabue is cooling rate dependent. The rate dependence of the transition itself can also be dedved from the WLF shift function:
" (.) T (.) logaTC2 '1 g ,v q = g,11 gO + C 1
'1 - .ogaT
q ) where aT = -;
qO (14)
There Tg,'V denotes the volumetric glass transition temperature and q the cooling rate dT / dt at: T=Tg. The constants 0 1 and C2 should be identical to the ones of the mechanical shift function as long as the same reference tem.perature i~ uscd. As a referencc point one can take for instance from Fig.5 l'g,V = 148<:>0 at q = 0.33 0 K/min.
This means that the temperature dependence of the time-dependent stress~optical function is described by the same WLF relation as the limiting temperature of the range of validity of the W LF relation. Below that tempeTatme the shift factors become time dependent) wit.h the limiting values at long times equal to ones extrapolated using
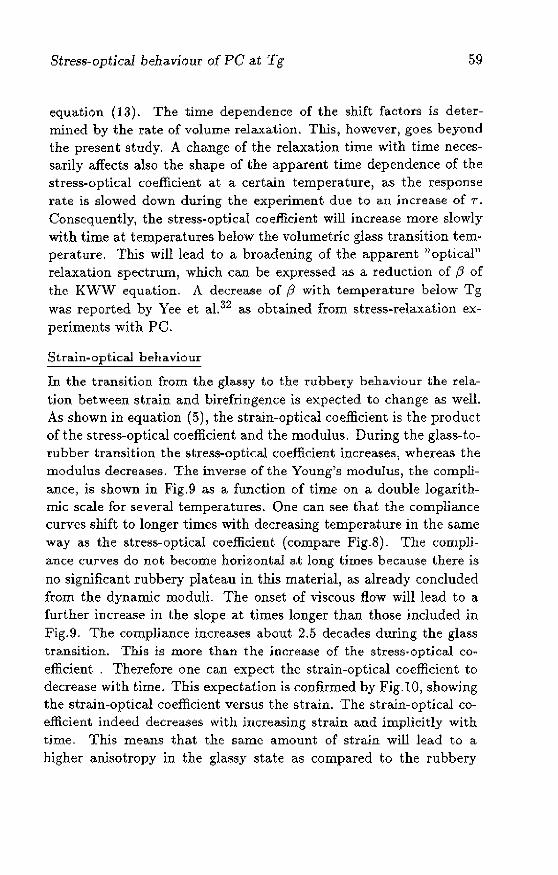
Stress-optical behaviour of PC a.t Tg 59
equation (13). The time dependence of the shift factors is determined by the rate of volume relaxation. TIlls, however, goes beyond the present study. A change of the relaxation time with time necessarily affects also the shape of the apparent time dependence of the stress.-optical coefficient at a certain temperature, as the response rate is slowed down during the experiment due to an increase of r. Consequently, the stress-optical coefficient will increase more slowly with time at temperatures below the volumetric glass transition temperature. This will lead to a broadening of the apparent "optical" relaxation spectrum, which can be expressed as a reduction of (3 of the KWW equation. A decrease of t3 with temperature below Tg was reported by Yee et a1.32 as obtained from stress-rela.xation experiments with PC.
Strain-optical behaviour
In the transition from the glassy to the rubbery behaviour the relation between strain and birefringence is expected to change as well. As shown in equation (5), the strain-optical coefficient is the product of the stress-optical coefficient and the modulus. During the glass-to" rubber transition the stress-optical coefficient increases, whereas the modulus decreases. The inverse of the Young's modulus, the compliance, is shown in Fig.9 as a function of time on a double logarithmic scale for several temperatures. One can see that the complia.nce curves shift to longer times with decreasing temperature in the same way as the stress-optical coefficient (compare Fig-8). The compliance Curves do not become horizontal a.t long times because there is no significant rubbery plateau in this material, as already concluded from the dynamic moduli. The onset of viscous flow will lead to a further increase in the slope at. times longer than those inclu.ded in Fig.9. The compliance increases about 2.5 decades during the glass transition. This is more than the increase of the stress-optical co" efficient . Therefore one can expect the strain-optical coefficient to decrease with time. This expectation is confirmed by Fig-tO, showing the strain-optical coefficient versus the strain. The strain-optical coefficient indeed decreases with increasing strain and implicitly with time- This means that the same amount of strain will lead to a higher a.nisotropy in the glassy state as compared to the rubbery
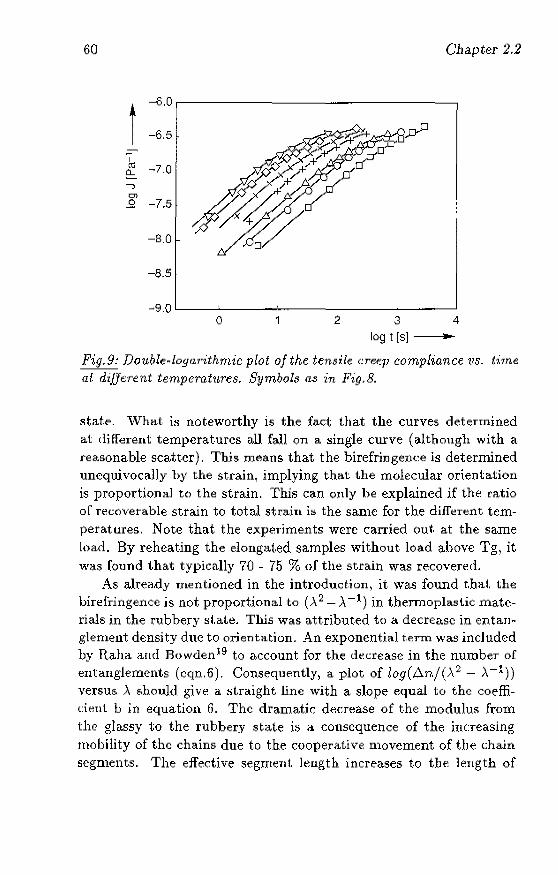
60 Ollapter 2.2
-6.0
I -6.5
'6 -7.0 n...
" Ol
.9 -7.5
-8.0
-8.5
-9.0 0 2 3 4
log t [s1 .. Fig. 9: Double-log(1,1·ithmic plot of the tensile creep compliance vs. hme at difJerent temperatures. Symbols as in Fig.S.
~tate. What is noteworthy is the fa.ct that the curves deteTTnined at difl'erent temperatures all fallon a single ClU've (although with a reasonable scatter), This means that the birefringence is determined unequivocally by the strain, implying that the molecular orientation is proportional to the strain. This can only be explained if the ratio or recoverable strain to total strain is the same for the different temperatures. Note that the experiments were carried out at the same load. By reheating the eloIlgat,ed samples without load above Tg, it WaS found that typically 70 - 75 % of the strain was recovered.
As a.lready mentioned in the introduction, it was found that the bireiJ:ingence is not proportional to (--\2 -.\ -1) in thermoplastic materials in the rubbery st.ate. This was attributed to a decrease in entanglement density due to orientation. An exponential term waS included by Raha a!ld Bowden J9 to account for the decn:asc in the number of entanglements (eqn.6). Conseqmmtly, a plot of log(6.nj(),2 _ ,\-1)) versus ,\ should give a ~t.raight line with a slope equal to the coefficient. b in equation 6. The dramatk decrease of the modulus from the glassy to the rubbery statei::; a consequence of the increasing mobility of the chains due to the cooperative movement of the chain segments. The effective segment. length increases to tllt': length of
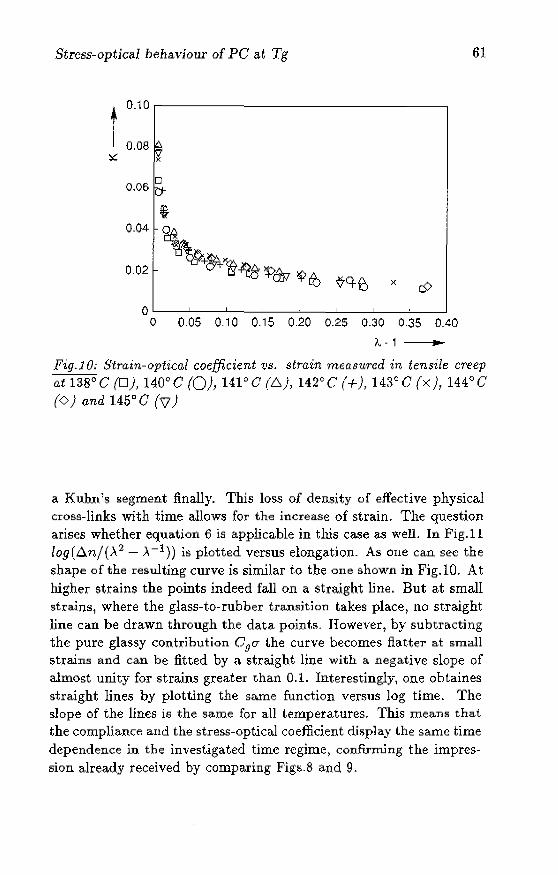
Stress-optical behaviour of PC at Tg
t 0.10
x: 0,08 ~
o 0,06 p-
i 0.04 <2&
002 ~+~lk& 'l>dJ, 'i' ~ x
O~--~---L __ ~ ____ ~ __ -L __ ~ ____ L-__ ~ ° 0.05 0.10 0.15 0.20 0.25 0.30 0.35 0.40
A- 1 ...
61.
Fig. 1 0: Stmin-optical coefficient '/)$. strain measured in tensile c7'eep
at 138°e (0), 1400C (0), 14FC (6), 142°e (+), 143c G (x), 144°e (0) and 145" () (\] )
a Kuhn's segment finally. This loss of density of effective physical cross-links with time allows for the increase of strain. The question arises whether equation 6 is applicable in tlus case as well, In Fig,l1 log(6.n/(>,2 - -X-i)) is plotted versus elongation. As oue can see the shape of the resulting curve is similar to the one shown in Fig.lO. At higher strains the points indeed fall on a straight line. But at small strains, where the glass-to-rubber tra.nsitjon takes place, no straight line can be drawn through the data point.s, However, by subtracting the pure glassy contribut.ion GgO" the curve becomes flatter a.t small strains and can be fitted by a straight line with a negative slope of almost unity for strains greater than 0,1. Interestingly, one obtaines straight lines by plotting the same function versus log time. The slope of the lines is the sa.me for all temperatures. This means that the compliance and the stress-optical coefficient di5play the same time dependence in the investigated time regime, confirming the impression already received by comparing Figs.8 and 9.
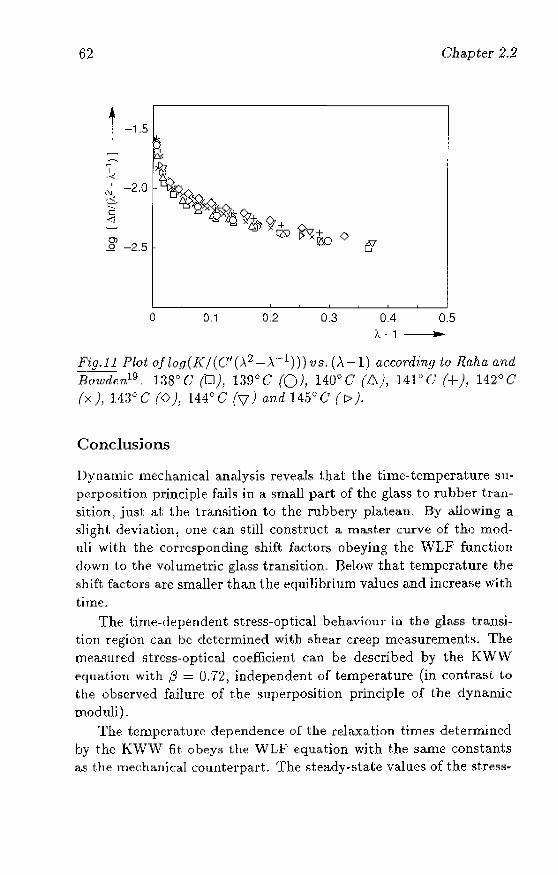
62 Gllapter 2.2
o 0.1 0.2 0.3 0.4 0.5 A. - 1 ...
Fig.11 Plot o!log(K/(G'() .. 2_X-· 1 )))vs. ('\-1) according to Ra}w and BOlllfif:n19 . 138~C (0)) 139"(} (0), 140°C (b.), 141"C (+), 142°C (x)) l1:~oC (0)) 144°C (\1) and 14.5')(, (1)).
Conclusjons
Dynam.ic mechanical analysis reveab that the time-temperature superposition principle fails in a small part of the glass to rubber transition, just at the transition to the rubbery plateau_ By allowing a slight. deviatioIl j OIle can still construct. a mast.er curve of the modIlli with the corresponding shift factor~ obeying the WLF function down to the volumetric glass transition- Below that temperature the shift factors arc smaller than the equilibrium values and increa.t>e with time.
The time-dependent stress-optical beha.viollr in the glass transition region can be determined with shear creep measurementt>. The OIeaflured stress-optical coefficient can be described by the KWW
~qllat.ion with fJ = 0.72, independent of temperature (in contrast to the observed failure of the sllperposition principle of the dynamic moduli)-
Thc tcmpcrahll'0. dependence of the relaxation times determined by the KWW fit obeys the WLF equation with the same constants as the rnechanical counterpart. The steady-state values of the stress-
Stress-opticaJ. behaviour of PC at Tg 63
optical coefficient at long times are higher than the values obtained from flow birefringence measurements. An explanation cannot be gjven yet. The apparent stress-optical coefficient as determined in tensile creep can be fitted with the same KWW parameters as in shear, if the increase of the true stress is taken into account.
The strain-optical coefficient is also time dependent. It decreases with time and strain. The strain dependence is independent of temperature at. the same stress level. The decrease of the strain-optical coeffident with strain can be described by introducing an exponential decrease of the entanglenltmt density with strain for strains greater t.han O-l.
The usc of the uncorrected linear stress-optical rule for the prediction of residual birefringence distributions, for instance in injectionmoulded specimens in connection with a viscoelastic material description, can lead to serious deviations. Due to the time dependence of the stress-optical coefficient , a deviation from linearit.y can occur at much higher temperatures than the conventional glass transition temperature. Instead, a constitutive stress-optical function is suggested a.s expressed by equations 3 and 4. This relation is equivalent to a linear visco-elastic constitutive equation, so that one still Gao talk about a linear stress"optica.l rela.tion-
References
1. Isayev,A.T. and Hieber,C.A_, RheoLActa 19, (1980) 168
2. Greener,J. and Pearson,G.H., J.Rheology 27, (1983) 115
3- Ma.vridis,H., Hrymak,A_N_ and Vlachopoulos,J. J.Rheology 32, (1988) 639
4. Flaman A.A.M. Build-1lP and Relaxation of MoleG1Uar Orientation in Injection-Moulding. (1990) Dissertation, Eindhoven
5. Baaijens, P.P.T. Rheol.Acta 30,(1991) 284
6. Wust,C.J. and Bogue)D.C., J.Appl.Poiym.Sci., 28) (1983) 1931
7. Kuhn,W. and Gruen,P., Kolloidzeitschrift 101, (1942) 248
64 Chapter 2.2
8. Trcloar,L.n.C. ))The Physics of Rubber Elaflticity)', 3td ed., (1975) Clarendon Press, Oxford
9. hneschitz-Kriegl)H., MakJ-omol.Chem. 40, (1960) 140
1.0. Rudd,J.F. and Anclrews,R.D., J.Appl.Physics 31, (1960) 818
11. J aneschitz-Kriegl)L "Polymer Melt Rheology and Flow Birefringen ce)) (1983) Springer, B~rlin
12. Ferry,J.D. "Viscoelastic Properties of Polymers") 31'd cd., (1980) J .Wiley) New York
13. Tant,M.ll. and Wilkes)G.L., Polym.Eng.Sci. 21, (1981.) 874
11. O'Reilly,J .M., eRC Crit.Rev.SoJid State Ma.ter.Sci. 1.3, (1987) 259
15. Williams,G. and Watts,D.C.; Trans.Faraday Soc. 66; (1970) 80
16. Rajagopal,A.K. and Ngai,K.L., in "Relaxations in Complex Systems", eds.Ngai,K.L. and Wright,G.B., US Dept-of Commerce, Springfield, VA; (1984) 275
17. Priss,L.S.; Vishnyakov,l.1. and Pavlova;I.P., Intern.J .Polym. Mater. 8, (1980) 85
18. Read;B.E., Polym.Eng.Sci. 23, (1983) 835
19. Raha,S. and Bowdeu,P.B., PolYIIler 13, (1.972) 175
20. Botto,P.A., DuckeU;R.A. and Ward,LM., Polymer 28,(1987) 257
21. Wimbcrger"fi'riedl)R., Rheo1.Acta 30, (1991) 329 (Chapter 2.1)
22. Wimberger-Friedl,"R. a.nd De Bn1in"LG., t.o be submitted to llheoLActa.
23. Cavaille,J.Y., JOllrdan,C., Perez,J'J Monncrie,L. and .lohari,G.P., J .Polym.Sci. Polym Phys Ed. 25, (1.987) 1235
24. PlazekJJ.D., J Polym Sci Polym Phys Ed. 20, (1982) 729
Stress-optical behaviour of PC at Tg 65
25. Zahradnik,F., Paper presented at the Tagung der Deutschen Rheologischen Gesellschaft, (1989) Darmstadt
26. Matsuoka,s., Paper presented a.t the Discussion Meeting on Relaxations in Complex Systems~ (1990) Crete (to be published
in J .Non-Cryst.801ids)
27. WimbergerftFriedl,R. and Hendriks,R,.D.M.H., Polymer 30, (1989) 1143 (Chapter 3.1)
28. Kang,H.J. and White,J .L., Intern.Polym.Processing I, (1986)
12
29- Shirouzu,S., Shigematsu,K., Sakamoto,S., Nakagawa,T. and Tagami,S. J apan.J .AppLPhys. 28, (1989) 801
30. Dettenmaier,M. and Kausch,H.H., Colloid Polyro.Sd. 259, (1981) 209
31. Cervinka;L.; Fischer,E.W., Hahn,K., Jiang,B.-Z., Hellmann,G-P. and K uhujK.-J., Polymer 28, (1987) 1287
32. Yee,A.F., Bankert,R.,l.,Ngai,K.L. and Rendell,R.W., J.Polym.sd. Polym- Phys.Ed. 26, (1988) 2463
Note added at proof: Hoppler2 reports a decrease of the stress-optical coefficient of polystyrene with time at temperatures well above Tg during elongation. This is explained by an influence of the stress on the populations of local conformations sO that certain populations with a different polarizability are favoured in the presence of stress. This effect could probably explain the difference between the stress-optical coefficient found in the present investigation and that found by flow birefringence 21 .
Whereas with flow birefringence the steady state values at long times were obtained, in the creep experiments around Tg only short times were accessed.
2Hopplet H.U., "Die Beschreibung der dehnungsinduzierten Doppdbrechullg von gcschmolzcncm Polystyrol mit einem kinetischen Orientierungsmodell." Dissertation (1990) ETH Ziidch
Part 3
Birefringence in Quenched and
Injection-moulded Polycarbonate
67
Chapter 3.1
The Measurement and Calculation of Birefringence in Quenched Polycarbonate
Specimens 1
ABSTRACT: The stress-induced birefringence in quenched polycarbonate disks is calculated with a numerical program a.nd compared with birefringence mea.surements. Use is made of a thermo-viscous-elastic material model with a discontinuous change of the properties a.t the glass transition temperature, Tg . The birefringence is calculated with the aid of the stress-optical rule using the measured stress- optical coefficients in the molten and the glassy sta.te, respectively. The birefringence present at the moment of glass transition is 'frozen in' and added to the birefringence, which builds up below Tg . The calculated birefringence distributions fit the distributions measured in the cross-sections of the samples. The birefringence distributions are unbalanced beca.use of the contribution of frozen-in orientation, induced by the cooling stresses above Tg • In constrained quenchlng the contact with the wall leads to high tensile stresses in the melt, which induce, depending on the adhesion of the polymer to t.he wall, unexpected birefringence distributions.
~~-------------------iReprinted from; R.Wiroberger-Friedl nnd R.D.H.M_ Hendriks, Polymer 30 (1989) 1143
69
70 Chapter 3.1
Introduction
ThE' dimensional Rt.ability of amorphous polymer specimenH is determined not. only by the non·equilibrium v()lumc relaxation) called physic;d agingl but also by the presence of internal stresses and ori· entation of the polymer chains2. In injection-moulding the polymer undergoes a very complicated stre5~·:'ltrain tempera-tun: course) of which only parLs can be described quantita,tively3-5. Nevertheless) it is this course) which detennines the frozen·in stresses and olicntat.ion distribution in the sample. Therefore it seems desirable to have access to this 'state) of the specimen from two points of view) namely to h,ive a real rcferenc:e for the measurement of the dimensional stability and to be able to verify the results of numerical simulations. The ult.imate goal is to come to a predidioll of the dimensional stability from the numerica.1 $i mulation of the processing cycle.
The birefringence technique has been successfully applied for the aualysis offrozen-in orientation in injection moulded samplcs ti ,7. Mostly polystyrene (PS) has been used for this purpose. The stress-optical ~ensitivity of PS in the glassy state is 100 time!;; lower than ill the molten state8,9. ThenJore the contribution of the cooling stresses to the birdrlngcnce can be neglected compared to that of the flow induced stresses lO . BispherlOl-A-polycarbouate (PC), however, has a high stress-optical sensitivity above as well as below the glasstransition temperature (I:q), as will be shown. Therefore both) the frozen-in orientation and the cooling stres:.oes) contribute to a comp;L~ rable extent to the residual birefringence. In order 1,0 be able to split these two components one has to quantify one of the contributions. [n our investigations we t.ry to quantify the birefringence caused by cooling stresses alone.
For this purpose the stress-optical behaviollT and the mechanical properties of PC arc determined in the molten and in the glassy state. Disk shaped specimens are quenched in a. turbulent liquid (free-quendung) and in a specially designed apparatus (constrained quenching), The residual birefringence clisLribution is deternuned and compared with the results obtained with a numerical program developed for this purpose.
Birefringence in Quenched PC 71
Stress-optical characterization
It ha..'l been shown experimentally that in polymer melts the birefringence (.6.n) is proportional to the applied stress-difference (LlO")
(1)
This is the well known stress-optical rule 11 . The stress-optical coefficient (Om) is proportional to the anisotropy of the polarizability of the polymer chain. In the glassy state also a linear relation has been found8 , although it has not yet been derived theoretically. While in the melt the application of a stress-difference leads to an orientation of the chain segments, refeITed to as entropic stress, in the glassy state the intermolecular distances are changed and the chain bonds arc distorted locally, referred to as energetic stress. In the glass transition region the time scale of orientation is comparable to a characteristic processing time so that C becomes time-dependent and the linearity of the stress-optical rule is lost. When the melt is cooled through the glass transition in a stressed state the orientation is frozen in.
Birefringence is accessible as the path difference or optical retardation (r) of the orclinary and extraordinary beam in the plane perpendicular to the direction of light propagation. For the measurement of the retardation between (::Nssed polarizers the principal clirectioHs of the medium have to lie in this plane and the polarizer must be at 45<:1 with respect to the principal directions-
The standard techniques for the isotherttlal characterization are uniaxial extension and simple-shear- Since the refractive index and stress tensor are coaxial in the isothermal case in uniaxial extension the draw direction is at 45 0 with respect to the polarizer. The stress~ optical coefficient is calculated as follows:
(2)
where 0"1 is the tensile stress-Uniaxial extension is difficult to achieve in melts. Therefore the
simple-shear deformation is used. There one has to be aware of the rotation of the main stresses in the shear plane around the angle X, which depends on the shear rate. The crossed polarizers must. be rotated around the neutral direction of t.he shear flow about that
72 Chap/,er :U
angle. The strcss-opticaJ (:oefficient is calculated then with the aid of the following fonnula12 ;
Om = b.n sin(2X) !2cr21 (3)
where 0"21 is the shear stress.
Cooling stresses
The combination of all inhomogenous temperature distribution and a strong temperature dependence of the mechanical properties leads to a build-up of cooling stresses. This was first observed in inorganic:: glasses. Aggarwala and Saihel13 developed an a.nalytical solution by assuming that the viscosity changes from zero to infinity at a certain temperature. Struik 2 and Greener and Kenyon U applied this model for polymers. Lee, Rogers and Woo15 first included vi8coela.stic behaviour of the glass. Their model was applied to polymers by Wust and Bogue16 and Lee em et al. 17
• Sin<:e the mechanical methods of measurement of internal stresses, the best known technjque being layer removal at! introduced by Treuting and Rcad18 , can be applied succe8sfully only under certain assumptions in simple georuetries19-21 the birefringence has become an important alternative. The observed birefringence disLri butions are not balanced 1O,l5,22,23 generally because birefringence has, as already mentioned, two different physical origins. Therefore models, which eitber disregard the modulus or visGosity above 19 or make use of a single stress-optical coefficient c:;annoL predict residual birefringence distribut.ions correctly.
When a thin specimen is quenched freely the shrinkage of the surface layer induces compressive stresses in the still soft core. With further penetration of Lhe solidification the incremental layer passes the glass t.ransition in a stressed fltate. Whether this stress is ten~ sile or compressive depends on t.he difference in mechanical properties above and below Tg and also on the temperature st.ep, wh.ich is applied. As every v{~lurne element passes the glass transi Lion in stressed sta.te thf)re will always be a contribution of orientation of the molecules to the residual birefringence clistribution. The degree of unbalance of the latter depends on the difference in stress-optical coefficients above and below l'q and the vwling conditions, i.e. the begin temperature.
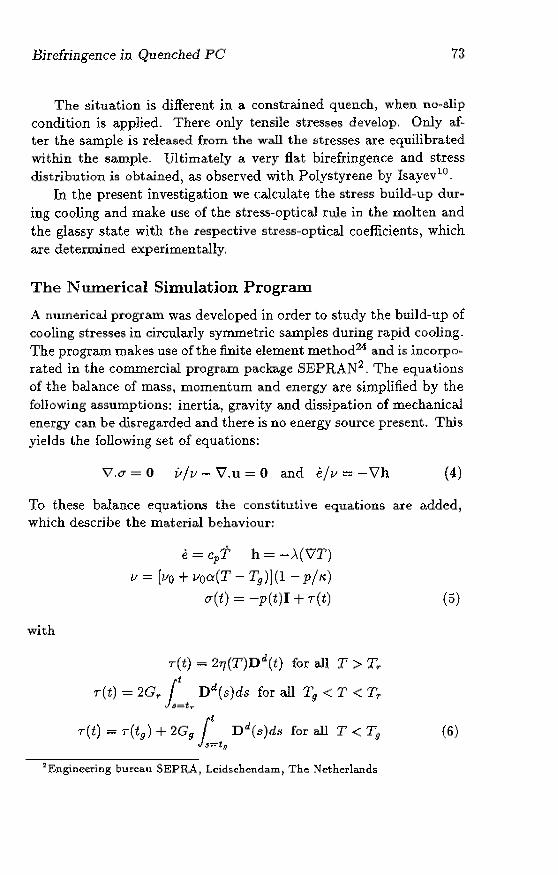
Birefringence in Quenched PC 73
The situation is different in a constrained quench, when no"slip condition is applied. There only tensile stresses develop. Only af~ ter the sample is released from the wall the stresses are equilibrated within the sample- Ultimately a very flat birefringence and stress clistribution is obtained) as observed with Polystyrene by Isayev10 .
In the present investigation we calculate the stress build-up during cooling and make use of the stress-optical rule in the molten and the glassy state with the respective stress-optical coefficients, which are determ.ined experimentally.
The Numerical Simulation PrograIIl
A numerical program was developed in order to study the build-up of cooling stresses in circularly synunetric samples during rapid coolingThe program makes use of the finite element method2
'i and is incorpo" rated in the commercial program package SEPRAN2 _ The equations of the balance of mass, momentum and energy ate simplified by the following assumptions: inertia., gravity and dissipation of mechanical energy can be disregarded and there is no energy source present. Tills yields the following set of equations:
V.a = 0 v/v ~ \7.u = 0 and elv ~ -Vh (4)
To these balance equations the constitutive equations are added, which describe the material behaviour:
with
e = cpT h = -)'(V'T)
v = [110 + I-w:~(T - Tg)](l - pi"')
cr(t) = -p(t)I + r(t)
T(t) = 2ry(T)D d(t) for all T> T ..
r(t) = 2G,.1:tT Dd(s)ds for all 19 < T < TT
(5)
T(t) = T(ty) + 2Gg l:tg Dd(s)ds for all T < Tg (6)
2Engineering bureau SEPRA, Leidschendam, The Netherlands
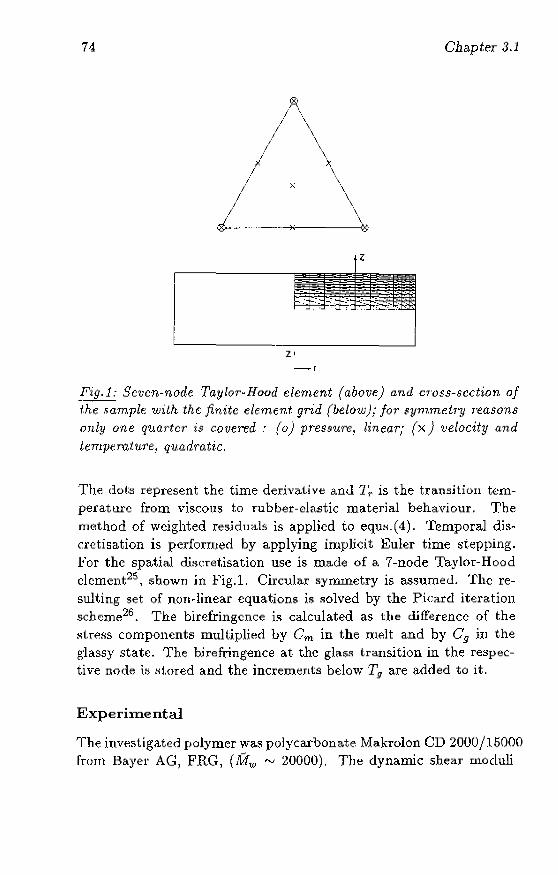
74 Clwpter 3.1
x
d·,·· " ....... --.--.. """*"-----0
Fig.i.- Seven-node Taylor"Hood element (above) and cr'oss-scction of i.he 8G,mpif; wdh the finite element grid (below); for sym.me.t7'JJ 7'easons only one quarter is covered.' (0) pressure, linear; (x) velocity and [empemtvrej quadratic,
The dots represent the time derivative and l~ is the transition temperature from viscolls to rubber-elastic material behaviour, The rnethod of weighted residua.1s is applied to equ~.(4). Temporal dis" crctisation is performed by applying implicit Euler time stepping. For the spatial discNt.isation use is made of a 7-node Taylor-Hood clcment25 , shown in Fig.I. Circular synunetry is assumed. The resulting set of non· linear equations is solved by the Picard iteration scheme26 . The birefringence is calculated as the difference of the ~t.ress components multiplied by Om in the melt and by Cg in the glassy state, The birefringence at the glass transition in the respective node i~ Hi.ored and the increments below Tg are added to it.
Experilnental
'The jnvest.igated polymer Wag polycarbonate Makrolon CD 2000/15000 rrorn Bayer AG, FRG, (JVrw '" 20000). The dynamic shea.r moduli
Birefringence in Quenched PC 75
G' and G I' ill the melt wcre determined with a Rheometries RVE
M plate-plate rheometer and a cone-plate rheometer. The complex moduli E"" and G* in the glassy state were determined with a dynamic mechanical thermal analyser) DMTA, of Polymer Laboratories in bending and shearing mode) respectively. The linear expansion coefficient was measured with the aid of a Perkin Elmer TMS-2 thermal
mechanical analyser. The stress-optical coefficient in the melt (em) was determined
with a flow birefringence apparatus in a modified cone-plate arrangement as described in ref.27, but with reversed light direction. In the glassy sta.te the stressaoptical coefficient (Cg ) was determined in muaxial extension on a micro-tensile tester placed on the turntable of a polarizing microscope. The stressroptical characteriza.tion will be published in mOfe detail in due course-
Two types of quenching experiments were carried out. In the free-quenching experiment the prepressed samples, disks of typically 3 em diameter, were annealed in an oven for several hours at 170°C and then dropped in a stined N aCl solution of a given temperature (NaCI was added to match the density with that of the polymcr). In the constrained"quenching experiment the sample of the same dimensions was placed between two pistons and a quartz cylinder) as shown in Fig.2- The whole set-up was then kept above Tg for several hours before by opening a valve thermostated water WaS pumped through the pistons. The temperatures of the cooling copper plates and the specimen were recorded during cooling with the aid of a fiuoroptic thermometer Luxtron 750- After thermal equilibrium had been reached the sam.ples were removed.
The frozen-in birefringence distributions were measured in Imm thick radial cross-sections cut out of the samples. The cutting surfaces were treated with a diamond mill to make them smooth and flat.
Results and Discussion
Stress~optical behaviour
As already mentioned a detailed stress-optical characterization of PC will be published. Here only part of the results is shown to justify
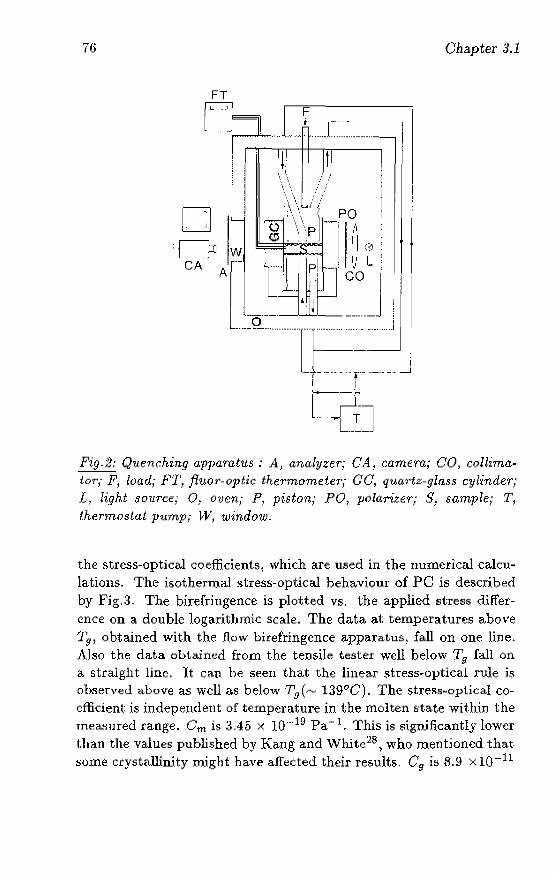
76 Chapter 3.1
FT F
, ... t ....... .L ........................ _
:1'?l W CA
A
--"'-_.. r' '--'" _.- J
... -ct Fig-2: Quenching (Jpparatus : A, analyzer; CA, mmera,. CO, collimator,- P, load,- PI', fluor-optic thermometer,- Ge, quadz-glass cylinder,. L, light $OlLrCe,- 0, oven; P, piston," PO, ]Jola'rizer,. S, sample; T, thermosta,t pump,- W, window-
the stress-optical coefficient5, which are used in the numerical calculations. The isothermal stress-optical behaviour of PC is described by Fig.3. The birefringence is plotted vs. the applied stress difference on a double logarithmic scale. The data a.t temperatures above 1!i' obtained with the How birefringence appara.tus, fall on one line, Also the data obtained from the tensile tester well below Tg fallon a stl'alght line. It can be seen that the linear stress~optical rule is observed above as well as below Tg(~ 139°0). The stresswoptical coefficient is independent of temperature in the molten state within the mea~;ured range. em is J.45 x 10._. 19 Pa -1. This is significantly lower than the values published by Kang and White28 , who mentioned that some crystallinity might have affected their results. 0 9 is 8.9 X 10⁻¹¹
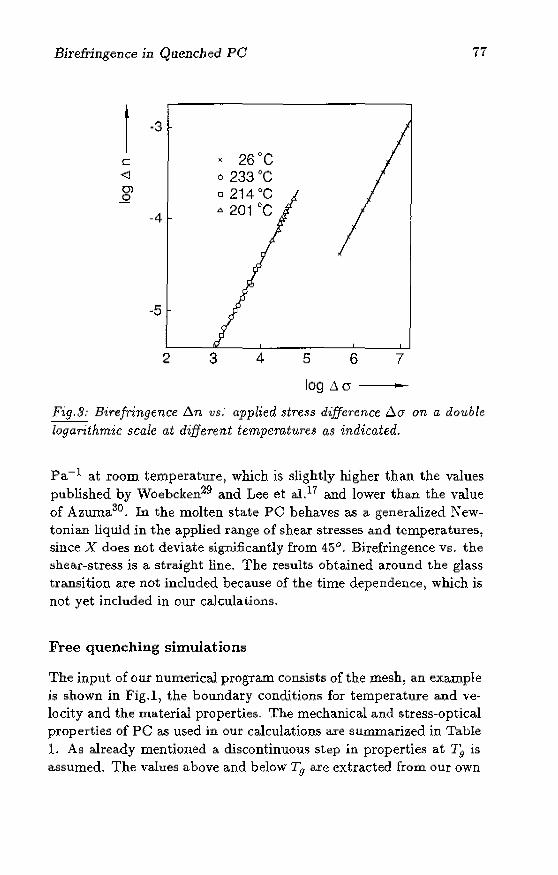
Birefringence in Quenched PC 77
1 ·3
26°C c -<l o 233°C 0)
o 214 DC 0
-4 ~ 201°C
2 4 5 6 7
log .10 ..
Fig.3: Birefringence. .6..n 'Us: applied stress difference 6.0" on a double logarithmic scale at different temperatures as indicated.
Pa-~ at room temperature) which is slightly higher than the values published by Woebcken29 and Lee et alY and lower than the value of Azuma30 . In the molten state PC behaves as a generalized Newtonian liquid in the a.pplied range of shear stresses and tempera.tures) sillce X does not deviate significantly from 45°. Birefringence vs. the shear-stress is a. straight line. The results obtained around the glass transition are not included because of the time dependence) which is not yet included in our calculations.
Free quenching simulations
The input of our numerical program consists of the mesh) an example is shown in Fig.I, the boundary conditions for temperature a.nd velocity and the material properties. The mechanical and stress-optical properties of PC as used in our calculations are summarized in Table L As already mentioned a discontinuous step in properties at '19 is assumed. The values above and below Tg arc extracted from our own
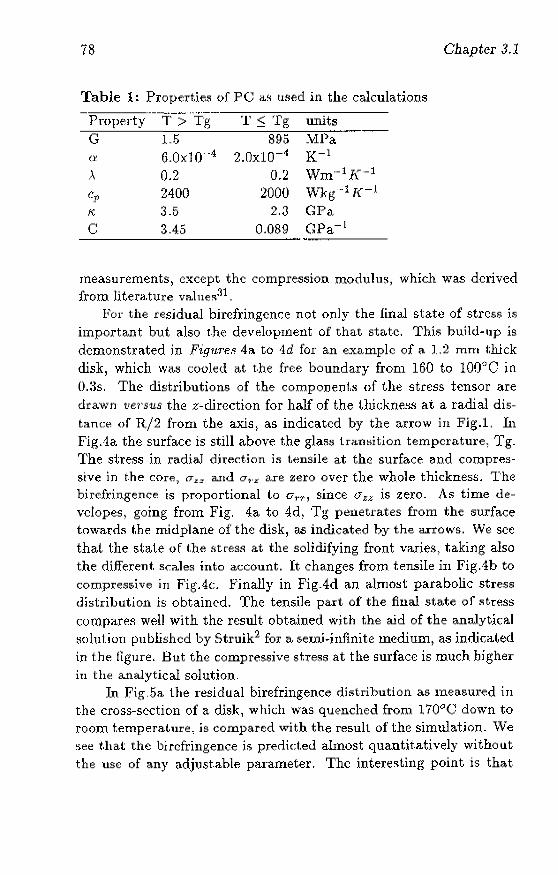
78
Table 1: Propert.ie5 of PC as llsed in the calculatioIls
G 1.5 u 6.0xl0-4
A 0.2 2400 3-5 3.45
T < Tg 895
2.0xl0-"
0.2 2000
2.3 0.089
units Mpa-·---~
K- 1
Wm--1K·- 1
Wkg-· 1l(-1
GPa CPa-- l
Chapter 3.1
measurements) except the compression modulu~, which was derived from litera.ture vallles31 _
For the resjdual birefringence not only the final state of stress is important but also tJH) development of that state. This build-up is demonstrat.ed in Pig1J.1'e8 4a to 1d for an example of a. 1..2 mm thick disk) which wag cooled ctt the free boundary from 160 to 100')0 in O.:k The distributions of the components of the stress tensor are drawn venus the z-rurection for half of the t.hickness at a radial distance of R/2 from the axis) as indicated by the arrc>W in Fig.1. In Fig.1a the surface is still above the glass transition temperature) TgThe stress in radial. direction is tensile at the surface and compressive in the core, CTzz and at·" are zero over the whole thickness. The birefringence is proportional to O"t·t' , since (I zz is zero- As time devclopes, going froIll Fig. 4a to 4d, Tg penetrates from the surface towanh t,he midplane of the disk, as indicated by the arrows. We sec thai t.he state of the fitresfl at the solidifying front varies, taking also the different scales into account. It changes from tensile in Fig.4b to compressive in FigAc. Finally in FigAd an alJTl()~t parabolic stress distribution is obtained. The tens.i1e part of the final state of stress comparefi well with the result obtained with the aid of the analytical tl~)lution published by Struik2 for a semi~inf1nite mediuIll) as imlicated in the figure. But the compressive stre55 at the surface is much higher iu the analytical solution.
In Fig.5a the residual birefringence distribution as measured in the cross-section of a disk, whidl was quenched from. 170°C down to room temperature, is compared with the result of the simulation- We see that the birefringence is predicted almost quantitatively without the usc of any adjustable parameter. The interesting point is that
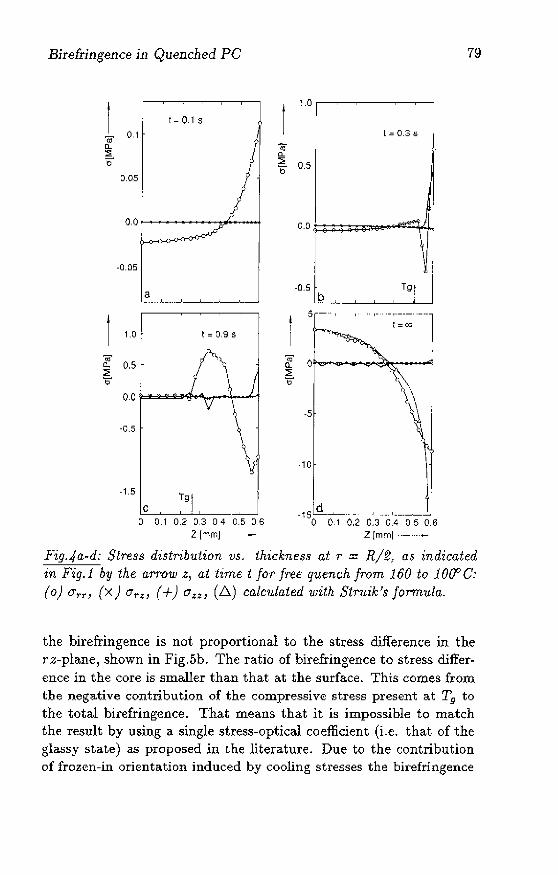
Birefringence in Quenched PC
'"R1 0.1 0.. !;. b
0.05
-0.05
1.0
-1.5
t - 0.1 s
a _." ••• ,.I,._, __ • .....J.-L-~_
1 = 0.9 S
c o 0.1 0.2 0.3 0.4 0.5 0.6
Z Irnm)
1 = 0.3 s OJ' 0.. ::;;: 1) 0.5
~J o.o~~\
-0.5 Tgr
p. ,----'--'---'-----'-----' 5
·10
d -15 .....L.._ •••• , I. I " .... ,,\ •. __ --'-
o 0 1 0.2 0.3 0.4 0.5 0.6 Z [mmJ··_·_· .. ·-
79
Fig.4a-d: Stre.ss distribution vs. thickne.~.~ at T := R12, as indicated in F'ig.l by the arrow z, at time t for free quench from 160 to JOifC: (0) 0'.,..,., (x) a.,.;:, (+) a;:~, (.6.) calC?1.late.d '(/lith Str1J,ik'$ jorm;uln_
the birefringence is not proportional to the stress difference in the r z-plane, shown in Fig.5b. The ratio of birefringence to stress difference in the core is smaller than that at the surface. This comes from tbe nega.tive contribution of the compressive stress present at Tg to the total birefringence. That means that it is impossible to match the result by using a. single stress-optical coefficient (i,e. that of the gl~sy state) as proposed iu the literature. Due to the contribution of frozen-in orientation induced by cooling stresses the birefringence
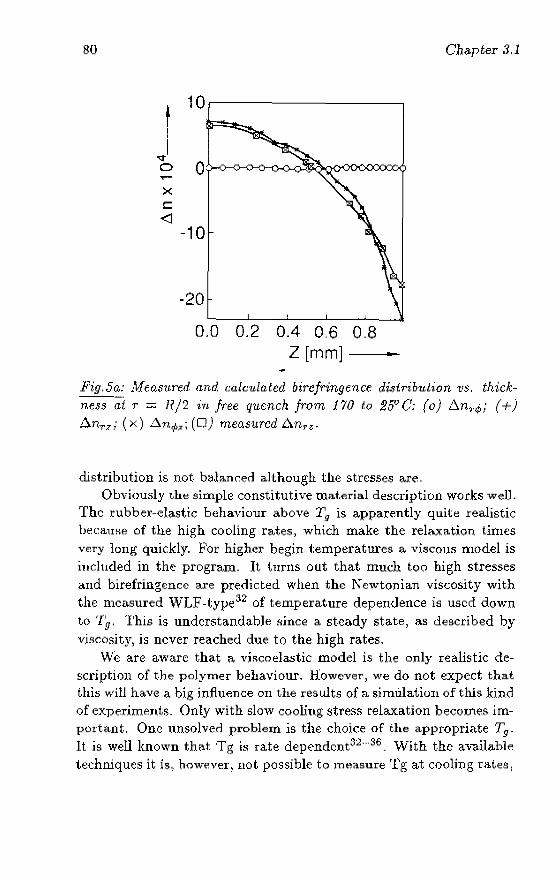
80 Chapter :U
10
J 0 0 ......
X c: <l
-10
-20 -
0.0 0.2 0.4 0.6 0.8 Z [mm] -
Fig.5a: Measu.red a.Tul calculated birefringence distribution 'Us. thickness ;;:-i T ;:;::; R/2 -in free quench from 170 to 25'-'0; (0) !J.n~"4>; (+) tJ..nTZ ; (x) tl'fl.¢~; (0) measured L\nrz •
distribution is not bahnced although the stresses are. Obviously the simple constitutive mat.erial description works welL
The rubber-ebstic behaviour above Tg is a.pparently quite realistic hecam~e of the high cooling rates, whi{:h make the relaxa.tion times very long quickly. For higher begin temperatures a viscolls model is iIlcluded in the program. It Lnrns out that much too high stresses and birefringence are predicted when the Newtonian viscosity with the measured WLF-type 32 of temperature dependence is used down to '[g. This is understandable since a stea.dy state, as described by vjgcogity, is never reached due to the high rates.
We arc aware that a viscoela.stic model is the only realistic description of the polymer behaviour. However, we do not expect that this will ha.ve a. big influence 011 the results of a. simulation of this kind of experiments. Only with slow cooling sh'€gg relaxation becomes important. One unsolved problem is the choice of the appropriate Tg .
It is well known t.hat Tg is rate dependent:}2··36. With the ava.ila.ble techniques it is) however l uot possible t.o measure 'l'g a.t cooling rates l
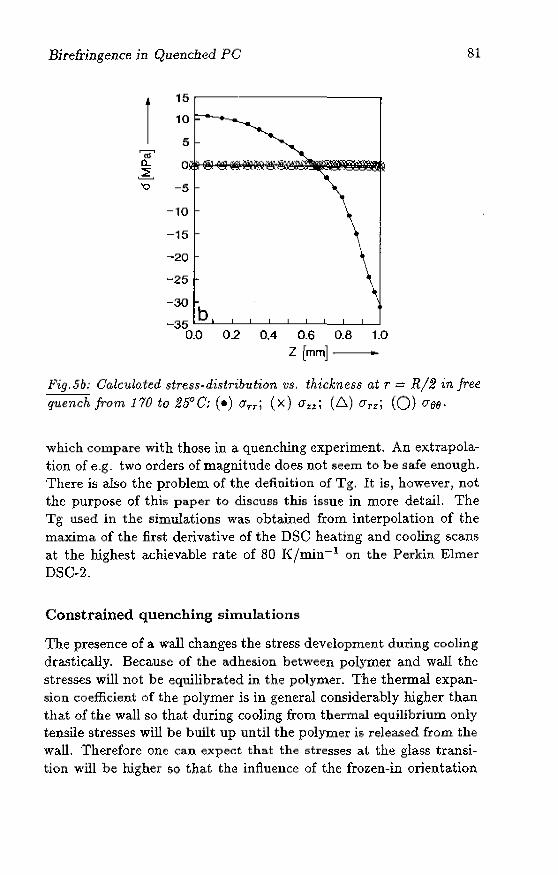
Birefringenc~ in Quenched PC 81
1 15
10
5 ro n... a 6 '0 -5
-10
-15
-20
-25
-30
-35 b
0_0 02 0.4 0_6 0_8 1_0
Z [mm] ....
Fig.5b: Calculated stres5-di.~tTibution VS. thickness at r ~ R/2 in free
quench from 170 to 25°C; (.) OTT; (x) O"Z'Z'; (.0..) O"rz; (O) O"flf)·
which compare with those in a quenching experiment. An extrapolation of e-g- two orders of magnitude does not seem to be safe enough. There is also the problem of the definition of Tg. It is, however) not the purpose of this paper to discuss this issue in more detail. The Tg used in the simula.tions was obtained from interpolation of the maxima of the first derivative of the DSC heating and cooling scans at the highest achievable rate of 80 K/min- 1 on the Perkin Ehner DSC~2.
Constrained quenching simulations
The presence of a wall changes the stress development during cooling dta..<;tically. Because of the a.dhesion between polymer and wall the stresses will not be equilibrated in the polymer. The thermal expansion coefficient of the polymer is in general considerably higher tha.n that of the wall so that during cooling frow thermal equilibrium only tensile stresses will be built up until the polymer is released from the wall. Therefore one can expect that the stresses at the glass transition will be higher so that the influence of the frozen-in orientation
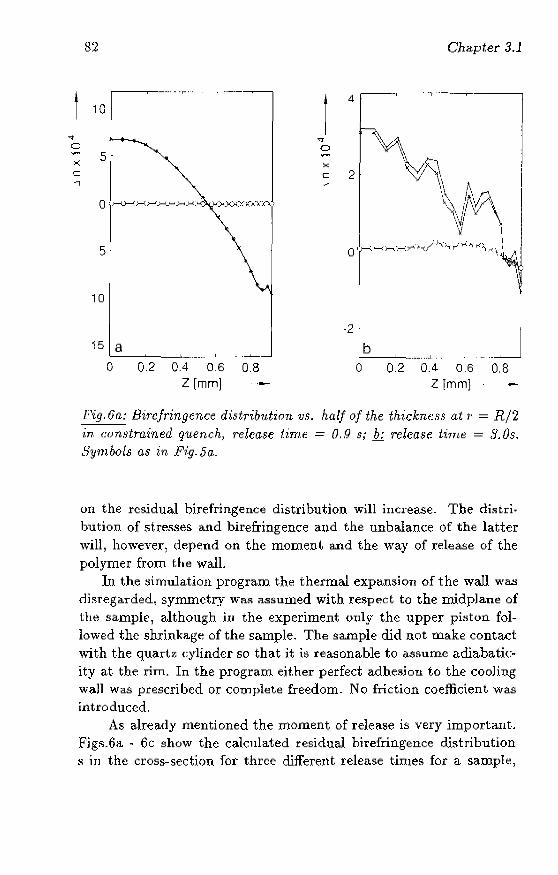
82 Chapter 3.1
4 10
5
5
10
-2
15 a '---~--. ..I..- .. -- ... ,
b '-----'--... _ ....... _,
o 0.2 0.4 0.6 0.8 a 0.2 0.4 0.6 0,8 Z[mm] Z[mm]
Fig. Ga: Bi7'C/ringence di5tribldirm 'U.s. half of the thickTU!88 at 7' = R/2 in con.~tmined quench, release time ~ 0,,9 si b: release. hme = S. Os. Symbols as in Fig- 50 ..
un the residual birefringence distribution will increase. The distri. bution of st.resses and birefringence and the unbalance of the latter will, however) depend on the moment and the way of release of the polymer from the wall.
In the simulation program the thermal expansion of the wall was
clisl'egardeci, synunctry was assumed with respect to the midpJane of the sample, although in the experiment only the upper piston followed the shrinkage of the sample. The sample did not make contact with the quart;" cylinder so that it is reasonable to assume adiabatic· ity at the rim. In the program either perfect adhesion to the cooling wall WaS prescribed or complete freedom. No friction coefficient was Introduced.
As already mentioned the moment of release is very important. Figs_6a - 6c show the ca.lclllated residual birefringence distl'ibution s in the cross-section for three different; release times for a sample,
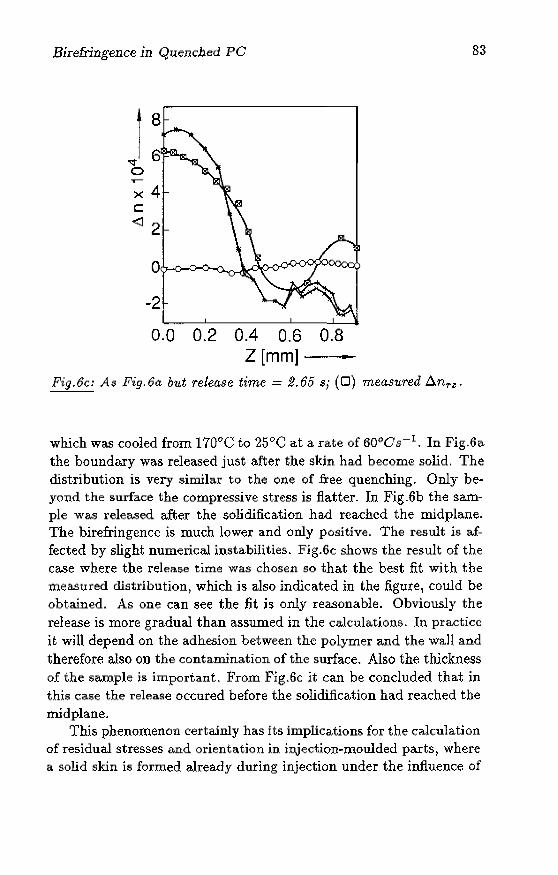
Birefringence in Quenched PC
r-
x4 c <12
-2
0.0 0.2 0.4 0.6 0.8 Z[mm] ---
Fig.6c: A.~ Fig.6a but release time = 2.65 Si (0) measured .6.nrz .
83
which was cooled from 170°0 to 25°0 at a rate of 6000s- 1• In Fig.6a
the boundary was released just after the skjn had become solid. The distribution is very similar to the one of free quenching. Only beyond the surface the compressive stress is flatter. In Fig.6b the sample was released after the solidification had reached the midplane. The birefringence is much lower and only positive. The result is affected by slight numerical instabilities. Fig.Bc shows the result of the case where the release time was chosen so that the best fit with the measured distribution, which is also indicated in the figure, could be obtained. As one can see the fit is only reasonable. Obviously the release is more gradual than assumed in the calculations. In practice it will depend on the adhesion between the polymer and the wall and therefore also on the contamination of the surface. Also the tltickness of the sample is important. Prom Fig.6c it can be concluded that in this ca.se the release occured before the solidification had reached the midplane.
This phenomenon certainly has its implications for the calculation of residual stresses and orientation in injection~moulded parts, where a solid skin is formed already during injection under the influence of
84 Chapter 3.1
high preS5lJre gradients. Simulation programs usually aSsume no-slip condition.
While in the example shown for free quenching one might accept the error made by using a single 'adjusta.ble j stress-optic;a.l coefficient) it is impossible to obtain a reasonable fit in this way in the COTH:ltrained-qu€nched case) as one can conclude from Flg.6c.
Conclusions
Polycarbonat.e is very suitable for the measurement of stress-induced hirefringeIlce because its high positive stress-optical coefficient in the melt and in the glassy state.
The numerical program is able to predict residual birefringence distributions in quenched PC specimens by making llSe of the linear stress-optical rule above and below 1i; and freezing in the birefringence at T.q. The simple elastic constitutive relation gives satisfactory results for the simulation of the cooling at high rates.
'fhe measured and calculated birefringence distributions are not balanced, since the stresses built up in the molten state induce orientation) which is frm;en in at the glass transition. Therefore it is not possible to fit the measured distributions with a single stressor strain-optical coefficient. The incorporation of t.he stress-optical coefficient of t,he melt.. makes it possible to use the same model also for the calculation of flow-induced frozen-in birefringence in injection moulding simulations.
By quenching between two solid walls high tensile stresses are built up in the melt so that more orientation is frozen in. This leads to a flaL birefringence distribution. Depending on t;be moment of rebifle from the walls the flat part of the distribution wlll reach furt;her towards the midplane of the sample. It is possible to fit the measured birefringence by adjusting the moment of release in the simulation. It t.urns out that this release can occur before complete solidification of the sample but depends on the adhesion Qf the polymer on the walls. However) little or nothing is known about the adhesion during rapid cooliug. We therefore intend to modify the cooling surfaces in such a way that we can learn more about this phenomenon experimentally, since we believe that it is of importance for the simulation of the injection moulding process.

Birefringence in Q!1eIlciled PC 85
Acknowledgement
The authors would like to express their thanks to DLF.P.T. Baaijens for h.is help with the development of the numerical program.
List of symbols
C stress-optical coefficient Dd deviatoric rate of deformation ten!lOl" E Young)s modulus G shear modulus I unit tensor R radius T.,. rubber temperature Tg glass transition temperature cp specific hea.t e differential internal energy h heat flux density .6..n birefringence p hydrostatic pressure r radial direction u velocity z axial direction () tangential direction r retardation X extinction angle a thermal volume expansion coefficient '17 viscosity K compression modulus A thermal conduGtivity v specific volume va specific volume at glass transition (J stress tensor 0"1 tensile stress o':n shear stress T deviatoric stress tensor \i' nahla operator
86 Chapter :U
Literature
1. Stmik,L.C.E., )Physical Aging In Amorphous Polymers And Othcr Materials', Elseviet, Amsterdam,1978
2. Struik,L.C.K, Polym.Eng.Sd.,1978, 1.8, 799
3. Sitters)C.,'Numcrical Simulation Of Injection-Molding', PhD -thesis, Techn. Univ. Eindhoven, 1988
4. Wang,V.,Hieber,C., SPE 1(lth Annual Tedm.Conf., Atlanta, 1988, p.Z90
S. Mavridis,H.,Hrymak,A.N.,Vlachopoulos,.L, J .Rheol., 1988, 32 639
fl. Walflfl,J.L.S., van Leeuwen,J., vander Vijgh, R.) Polym.Eng.Sci., 1972, 12, :lS8
7. Isayev, A.I., Hieber, C.A., RheoLActa, 1980, 19, 168
8. Rudd, J.F., Andrews, R.D., J.AppLPhys., H160, 31, 818
9. Wales, ,LL.S., 'The Application of Flow BirefringelH;e to Rheological Stuclies of Polymcr Melts" Delft University Press, 1976
10. Isayev, A.I., Polyrn. Eng. Sci., 1983, 23, 271
11. Jancschitz-Kriegl, H., 'Polymer Melt Rheology and Flow Birefringence', Springer, Berlin, 1983
12. Janeschitz-Kriegl, H., Adv. Polyrn. Sci., 1969, 6, 1.70
13. Aggarwala, RD., Saibel, E., Phys. ChelU. Glasses, 1961, 2,
"137
1.4. Greener, J., Kenyon, P.M., Proc. SPIE- Int. Soc. Opt. Eng., 1981, 279, 92
15. Lee, KM., Rogers, T.G.) Woo, T.G, J.Am.Ceram.Soc., 1965) 48, 4RO
16. Wust, C.J., Bogue, D.C., .J. Appl. Polym. Sci., 1983,28, 1931
Birefringence in Quenched PC 87
17. Lee, S., dela Vega) J.) Bogue, D.C.) J. Appl. Polym. Sci., 1986, 31) 2791
18. Treuting, R.G., Read, W.T., J. AppL Phys., 1951, 22, 130
19. So, P., Broutman, L.J., Polym. Eng. Sci., 1976, 16, 785
20. Haworth, B., Sa.ndilands, G.J., White, .l.R., Plast. Rubb. Int., 1980, 5, 109
21. White, J.R., Polym. Testing, 1984, 4, 165
22. Saffell, J .R., Windle, A.H., J. Appl. Polym. Sci., 1980, 25, 1117
23. Mittal, R.K., Rashmi, V., Polym. Eng. Sci., 1986, 26, 310
24. Zienkiewicz, O.C., 'The Finite Element Method' 3rd ed., McGrawHill, London, 1977
25. Soulaiman, A., Fortin, M., Ouellet, Y., Dhatt, G., Bertrand) F., Compo Meth. AppL Mech. Eng., 1987, 62, 47
26. Baaijens, F.P.T., in 'Flow Modelling In Industrial Processes" cds. Bush, A.W., Lewis, B.A., Warren, M.D., Ellis Horwood ltd., Engla.nd, 1988
27. van Aken) J .A., Gortemaker, F .R, Janeschltz-Kriegl, H., Laun, H.M., R.heol. Acta, 1980, 19, 159
28. Ka.ng, H.J., White, J.L., Intcru. Polym. Processing, 1986, 1,1
29. Woebcken, W., Kunststoffe, 1961, 51, 547
30. Azuma., K, Soezima, Y., Jap. J. AppL Phys., 1967, 6,909
31. Zoller, P., J. Polym. Sci. Polym. Phys. Ed., 1982, 20, 1453
32. Williams, M.L., Landel, R .. .F., Ferry, ,LD., J. Arner. Chern. Soc., 1955, 77, 3701
n. Ferry, ,J.D., 'Viscoelastic Properties of Polymers', 3rd ed.) J.Wiley, New York, 1980
88 Cllapter 3.1
34. Aklonis, J.J., Polym. Eng. Sci., 1981, 21, 896
35. Chow, T.S., Po]ym. Eng. Sci., 1981, 24, 1079
36. Ichihara, S., Komatsu, A., IIata, T., Polym. J., 1971, 2, 644
Chapter 3.2
Molecular Orientation Ind nced by Cooling Stresses in Polycarbonate - I
Free Quenchingl
ABSTRACT: The residual birefringence distributions io quenched polycarbonate disb are determined in crosssections_ Unbalanced distributions of approximately para~ bolie shape are obtained in general. The systematic variation of the birefringence distribution with quench conditions is interpreted in terms of a stress and an orientation contribution. The distributions can be predicted by a numerical program making use of the linear stress-optical rule with a different stress-optical coefficient above and below the glass transition. The contribution of molecular odentation is distinguished experinlentaliy from the stress contribution by annealing experiments, layer removal and sectioning_ The influence of sectioning 00 birefringence is investigated with the numerical program, measurements in oblique incidence, rod quenching and layer removal.
lR.Wimberge~-Friedl and J_G_de Bruin, Sllbmitted to J_Polym.Sci.-B Polym_Phys.
89
90 Chapter 3.2
Introduction
'rhermal stresses in inQrganic and polymeric glasses have received a lot of attent.ion ill the past because of their t.echnological importance l - 14 .
Along with the development of theoretical models, birefringence has been used very often for the experimental determination of the thermal stress dist.ribution in glassy samples. For this purpose use has been made of the stress-optical rule which represents a linear i'elation bdween birefringence of the medium and the stress diffel~ence in the plane perpendicular to the direction of light propagation. This simple rdation in combinat.ion with the ease of ort.hoscopy makes birefrin" gence the most attractive technique for that purpose. In polymeric glasses there ls~ however, the problem that also molecular orientation gives riRe to birefringence. Molecular orientation is usually created by flow-induced stresses during the moulding operation and birefringence has been used very often [01· the assessment of molecular orien~ tation in polymeric specimens \2, 15,16. Also in this casc use has been made of a stress-optical law which relates the flow-induced stresses in a polymeric melt to the birefringence in a linear wayH. Molecular orlElnta1;ioll can be frozen in during the vitrification of the polymer at its glass transition temperature Tg. In order to avoid a contribution of flow-induced orientation to the residual birefringence, quenching experiments have been carried out on unoriented samples by scveral investigatorsi.e.9-14. N everthelcss, experimental blrcfringencEl distributions were found to be unbalam:ed, which means positive and neg-aU ve aI'eas are not of equal siz-e. With a linear 5tress~optical rule this would violate the balance of moments in the sample. This discrep,tHey has been ascribed to the presence of molecular orientation9,lO
or a failure of the linear stress.optical rule in some wayll,12.
Cooling stresses occur upon anisothe-rmal cooling in samples with a strong dependem:e of the modulus on temperature, as it is observed during the glass transition of amorphous polymers. But also the stress-optical coefficient. is known to change in the same temperature range fronl the rubbery to the glassy value18,19. This means that g(:resses introduced at high temperatures will contribute in a different way to the final birefringence diskibution than st,resses which a.re built up at temperatures below the glass transition. In a. previ-01lS paper20 the observed unbalance of the birefringence distribution
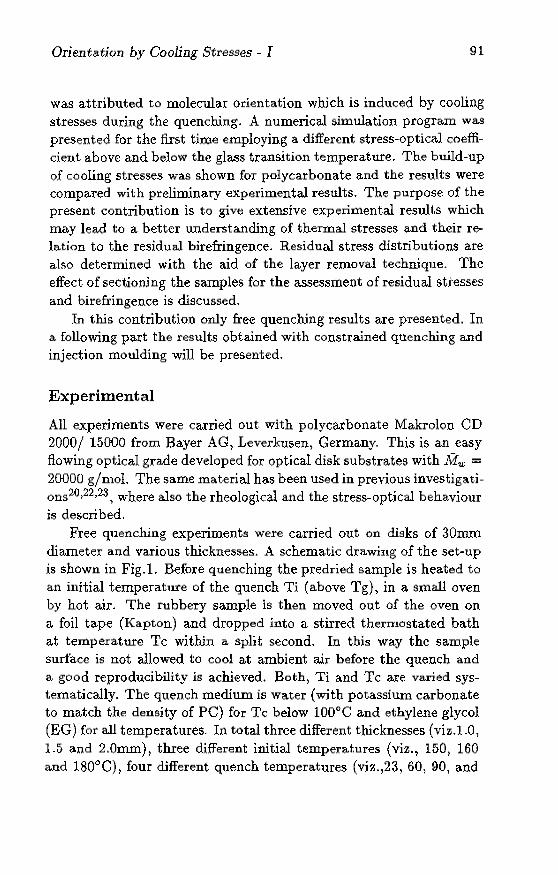
Orientation by Cooling Stresses - I 91
was attributed to molecular orientation which is induced by cooling stresses during the quenching. A numerical simulation program was presented for the first time employing a different stress-optical coefficient above and below the glass transition temperature. The build-up of cooling stresses was shown for polycarbonate and the results weH~ compared with preliminary experimental results. The purpose of the present contribution is to give extensive experimental results which may lead to a better understanding of thermal stresses a.nd their relation to the residual birefringence. Residual stress distributions are abo determined with the aid of the layer removal techruque. The effect of sectioning the samples for the assessment of residual sti"esses and birefringence is discussed.
In this contribution only free quenching results are presented. In a following part the results obtained with constrained quenching and injection moulding will be presented.
Experimental
All experiments were carried out with polycatbonate Makrolon CD 2000/ 15000 from Bayer AG, Leverkusen, Germany. This is an easy flowing optical grade developed for optical disk substrates with Mw = 20000 g/mol. The ~ame material has been used in previous investigations20 ,22,23, where also the rheologkal and the stress-optical behaviour is described.
Free quenching experim.ents were carried out on disks of 30:m..m. diameter and various thicknesses. A schematic drawing of the set-up is shown in Fig.!. Before quenching the predried sample is heated to an initial temperature of the quench Ti (above Tg), in a small oven by hot air. The rubbery sample is then moved out of the oven on a foil tape (Kapton) and dropped into a stirred thermostated bath at temperature Tc within a split second. In this way the sample surface is not allowed to cool at ambient all" before the quench and a good reproducibility is achieved. Both, Ti and Tc are varied systematically. The quench medium is water (with potassium carbonate to match the density of PC) for Tc below 100°C and ethylene glycol (EG) fot all temperatures. In total three different thicknesses (viz.LO, 1-5 and 2.0mm), three different initial tempera.tures (viz., 150, 160 and 180( 0), four different quench temperatures (viz.,23, 60, 90, and
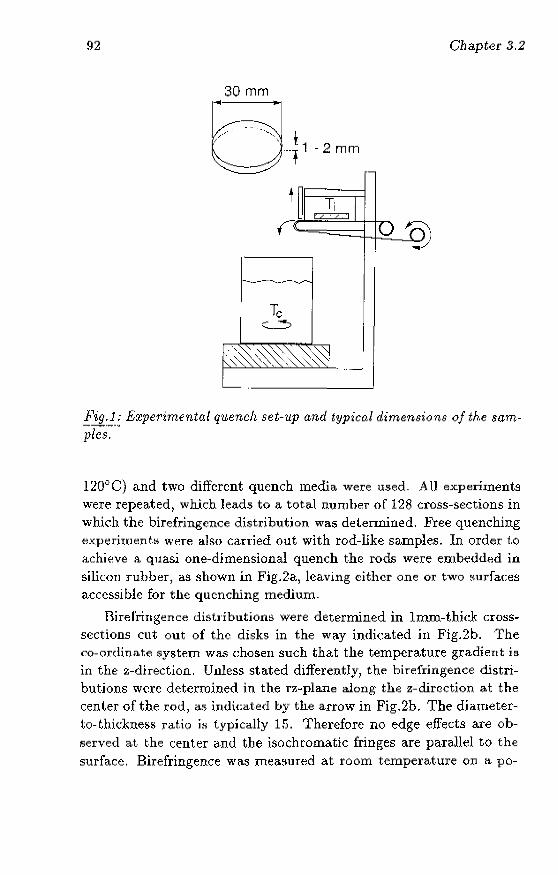
92 Chapter 3.2
30 mm
C;:~:;J ! ~····11-2mm
-._-_.-.-, .. -....... -.--..----
E'!:i:L Experimental quench set-up and typical dimensions of the samples.
120°C) and two different quench media were used- All ex.periments were repeated) which leads to a totaJ number of 128 cross-sections in which the birefringence distribution wag detennined. :Free quenching experlwen ts Were also carried out with rod-like samples. In order t.o a.chieve a quasi one-dimensional quench the rods were embedded in silicon rubber, as shown in Fig.2a, leaving either one or two ~urra.ces accessible for the quenching medium-
Birefringence distributions were determ.ined in Imm-thkk crOsS· sections cut out of the disks in the way indi(3ated in Fig.2b. The co-ordinate system was chosen such that the tempera.ture gradient is in the z-direction. Unless stated differently) the birefringence distributions were determined in the rz~plane along the z-rurcction at the center of the rod) as indicated by the arrow in Fig.2b. The djaUleterto-thickness ratiQ is typically 15. Therefore no edge effects are observed at the center Mld the isochromatk fringes are parallel to the surface. Birefringence was meatlured at room temperature on a po-
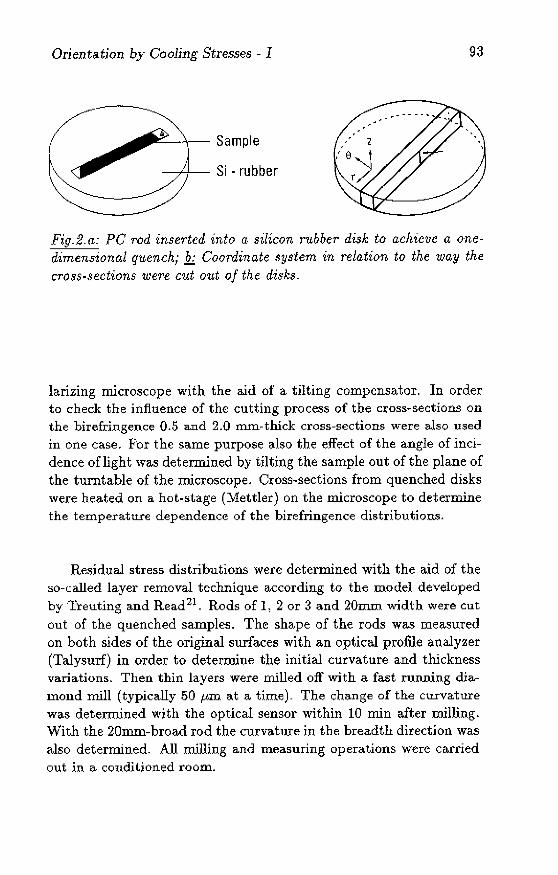
Orientation by Gooling Stresses - I
.......... ""'---'"'r-- Sample
------,,Lf-- S i - ru b b e r
93
Fig. 2. (1,: PC Tod inserted into a silicon rubbeT disk to achieve a onedimensional quench,- b; Coordinate ,~ystem in relation to the way the
CTO$s-sections were cut out of the disks.
larizing microscope with the aid of a tilting compensator. In order to check the influence of the cutting process of the cross~sections on the birefringence 0.5 and 2.0 rum-thick cross-sections were also used in one case. For the same purpose also the effect of the angle of incidence of light was determined by tilting the sample out of the plane of the turntable of the r.nicroscope. Cross~sections from quenched disks were heated on a hot-stage (Mettler) on the microscope to determine the temperature dependence of the birefringence distributions.
Residual stress distributions were determined with the aid of the so-called layer removal technique according to the model developed by 1''reuting and ReadZl . Rods of I, 2 or 3 and 20mm width were cut out of the quenched samples. The shape of the rods was measured on both sides of the original surfaces with an optical proflle analyzer (Talysurf) in order to determine the initial curvature and thickness variations. Then thin layel"S were milled off with a fast running diamond mill (typically 50 /till at a time). The change of the curvature was deter:o.-llned with the optical sensor within 10 min after milling" With the 20mm-broad rod the curvature in the breadth direction was also determined. All r.nilling and measuring operations were carried out in a conditioned room.
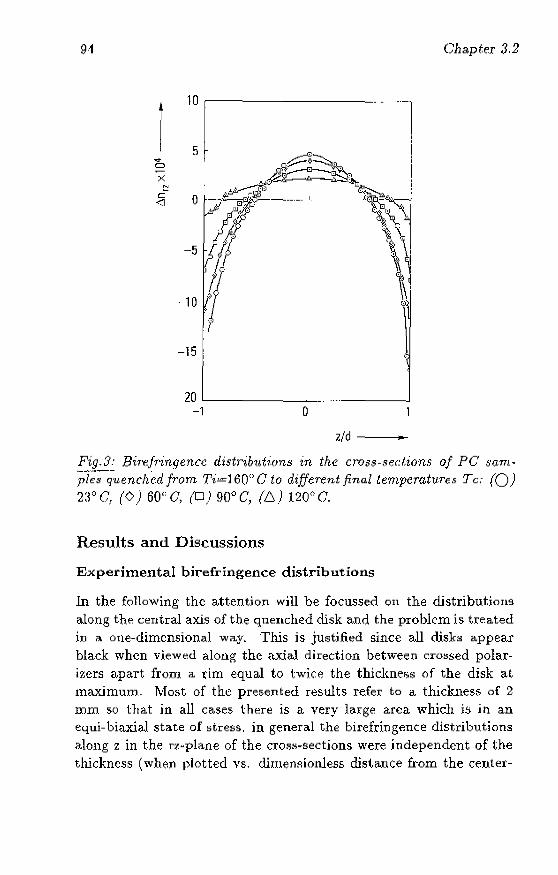
91 Clwpter 3.2
10
1 5 .... 0
X N
C 0 <I
-15
20 ~ __________ ~ -1 o
z/d ..
Fig.3: Bin~ff'ingence distdbntions in the clOss"sections of PC sam· Pi~·;-q.uenchcd from. Ti",,"160" C to different final lemperahm;.s Tc: (0) 2:FC, (0) 60"0, (0) 90°C, (6) 120"C.
Results and Discussions
Experimental birefringence distributions
In the following the a.ttention will be focussed OIl the djstrjbutions along the central axis of the quenched disk and the problem is treated in a one-dimensional way. This is justified since all rusks a.ppear black when viewed along the axial direction between crossed polarizers apa.rt from a. tIm equal to twic~ the thickne8s of the disk at maximum. Most of the presented results refer to a thi.ckness of 2 mm so that in all cases there is a very large area which is in an equi-biaxial state of stress. in general the birefringence distributions along z in th~ rz-plane of the cross-sections were independent of the thickness (when plotted vs, dimellflionless dista.nce from the ceuter-
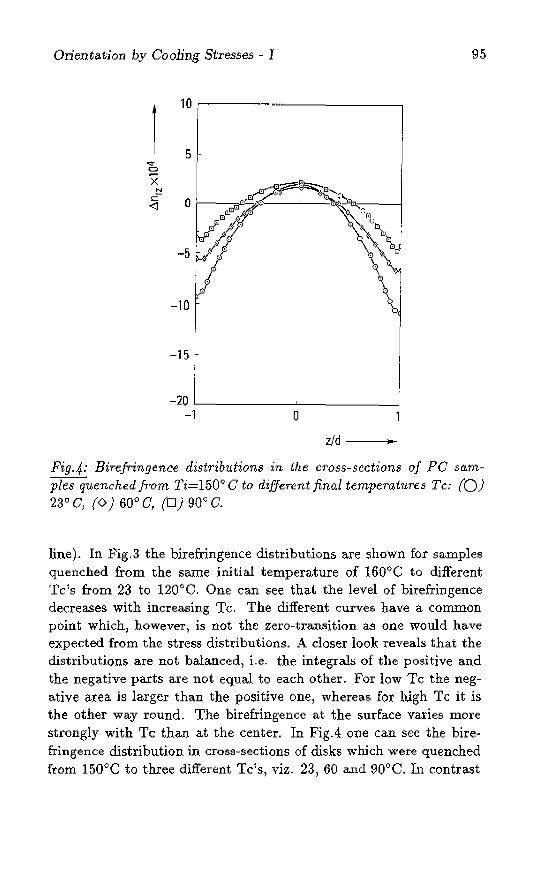
Orienta.tion by Cooling Stresses - I
1 x ~
10 r-----
5 .
.§ 0 f-----="" #. __ ..L-__ ~
-5
-10
-15
-20 '--____ ----'-_____ --" -1 o
z/d )00
95
Fig.4: Birefringence distributions 1:n the cross-sections of PC samples quenched from l'i=150° C to different final temperatures Tc: (0) 23° C (0) 60° C, (0) 90° C.
line). In Fig.3 the birefringence distributions are shown for samples quenched from the same initial temperature of 160"0 to different Tc's from 23 to 1.20"0. One can see that the level of birefringence decreases with increasing Tc;. The different curves have a common point which) however, is not the zero-transition as one would have expected from the stress distributions. A closer look reveals that the distributions are not balanced, i.e- the integrals of the positive and the nega.tive parts are not equal to each other. For low Tc;: the negative area is larger than the positive one, whereas fot high Tc it is the other way round. The birefringence at the 5udace varies more strongly with Tc than at the center. In FigA one can sec the birefringence distribution in cross-sections of disks which were quenched from 150°C to three different Te's, viz. 23) 60 and 90°C. In contrast
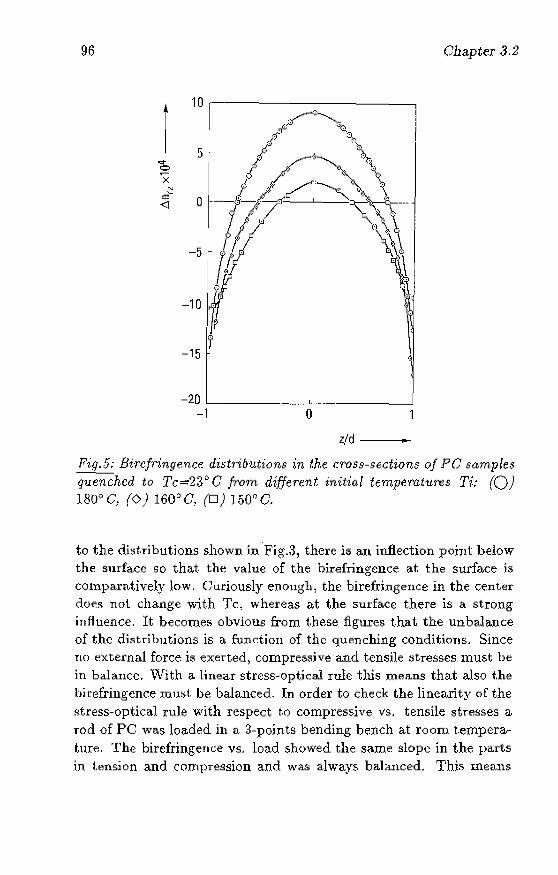
96
1 "b X
N
c=~
<l
10----
5
a
-10 ,
t
-15
-20 '--________ .... I. .... ______ ----'
-1 o z/d ..
Ohapter 3.2
Fig. /); Bircfringenc~ distr-ibutions in the cmss-sections of PC samples quenched to Tc~23() C from different initial tempe'rat'ures Ti: (0) 1800 C, (0) 160() C~ (0) ] 5W C.
to the distributions shown in Fig.3, there is an inflection point below the. surface so that t.he value of the birefringence at. the surface is comparatively low. Curiously enough, the birefringence in the center doe.s not change with Tel whereas at the surface there is a strong influence, It becomes obvious from t.hese figures that the unbalauce of the distributions is a fundioll of the quenching conditions, Since no external force is exerted, compressive and tensile stresses must be in balance, With a linear stress-optkal rule tllls means that also t.he birefringence Inust be balanced_ In order to check the linearity of the stress-optical rule with respect t.o compressive vs. tensile stresses a TOd of PC was loaded in a 3-points bending bench at room temperature. The birefringence vs. load sh()wed the sa.me slope in the parts in tenslon and compression and was always balanced, Thig means
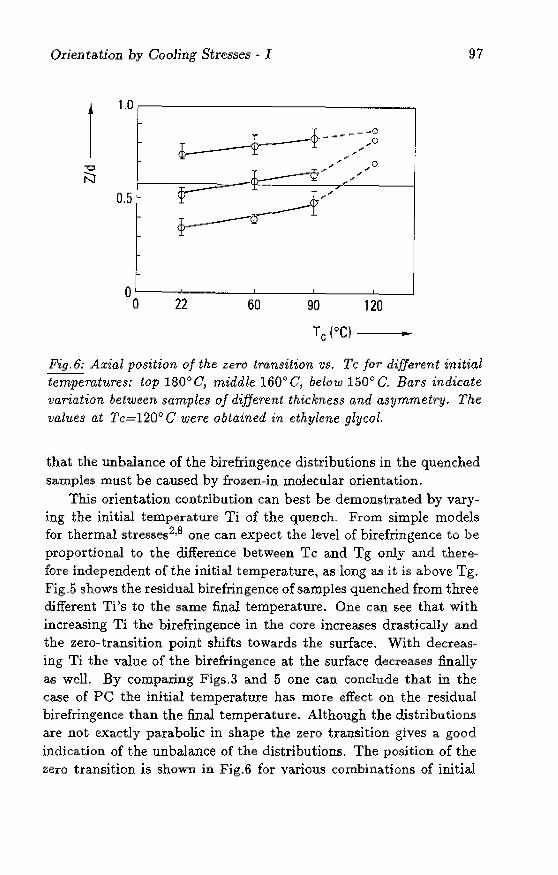
Orientation by Cooling Stresses ~ I 97
1
1.0,-------------____ -,
0.5
o~-~-----~--~--~-~ o 22 60 90 120
Fig.6; Axial position of the zerO transition vs. Tc for differ'ent initial temperatures; top 1800 C, middle 160<> C, below 1500 C. Bars indicate variation between samples of different thickness and asymmetry. The values at Tc=120° C were obtained in ethylene glycol.
that the unbalance of the birefringence distributions in the quenched sa.mples must be caused by frozen-in lnolecular orientation.
This orientation contribution can best be demonstrated by varying the initial temperature Ti of the quench. From simple models for thermal stresses2,8 one can expect the level of birefringence to be proportional to the difference between Tc and Tg only and therefore independent of the initial temperature, as long as it is above Tg. Fig.5 shows the residual birefringence of samples quenched from three different Ti)s to the same final temperature. One can see that with increasing Ti the birefringence in the core increases drastic;aUy and the zero-transition point shifts towards the surfa.ce. With decreasing Ti the value of the birefringence at the surface decreases finally as well. By comparing Figs.3 and 5 one can conclude that in the ca.se of PC the initial tempera.tur.e ha.s mOre effect on the residual birefringence than the finaJ temperature. Although the distributions are not exactly parabolic in shape the zero transition gives a good indication of the unbalance of the distributions. The position of the zero transition is ShOWll in Fig.6 for various combinations of initial
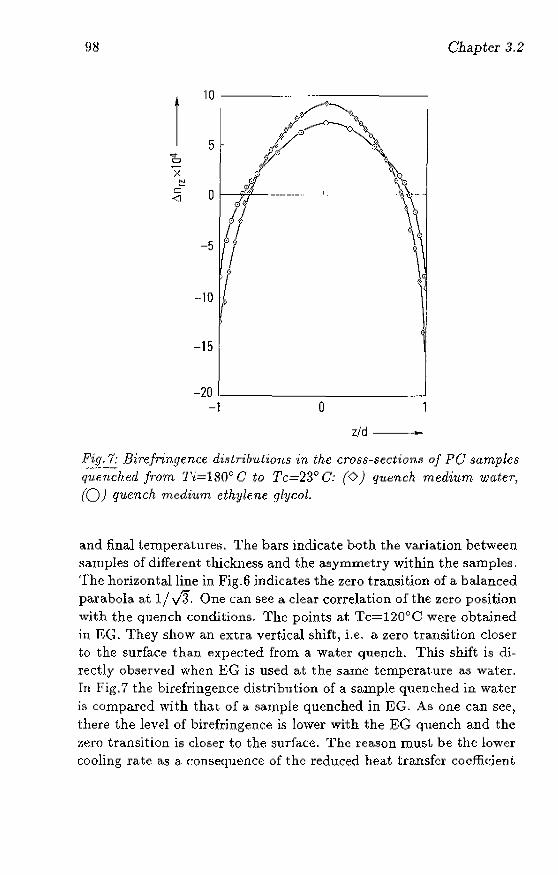
9S Chapter 3.2
1
10
~ 0
X t:!
c: 0 <I
-5
-·10 [
-15
-20 _. _____ ---'-___ _ -1 o
z/d -_ ... _-
Fig. 1: Birefringence dislrilJ'lltions in the cross-section.~ of PC samples q~~:;';-;;·h€d from Ti=1800 C to Tc=23° c: (0) quench medium water, (0) quench medium ethylene glycol.
and final temperatUl'ef!. The bars indicate both the variation between samples of different thickness and the asymmetry within the samples. The horizontal line in Fig-6 .indicates the zero transition of a balanced parabola at 1/ v'J. One can see a clear correlation of the zero position with the quench conditions. The points at Tc=120°C were obtained .in EG. They show an extra vertical shift, i.e. a zero transition closer to the surface than expected from a water quench. This shift is directly observeu when BG is used at the same temperature as water. In Fig.7 the birefringence distribution of a sample quenched in water is compared with that of a sample quenched in EG. As one can see, there the level of birefringence is lower with the EG quench and the :t;(~ro transition is closer to the surface. The reason must, be the lower cooling rate as a. consequence of the reduced heat transfer coeffident
Orientatioll by Cooling Stresses" I 99
in EG-
It can be concluded that both, low Ti and low Tc lead to a shift of the birefringence distribution towards the negative direction and rugh temperatures to a shift in the positive direction. With increasing quench tempetatures the distributions also become flatter. The effect of the initial temperature on the birefringence is stronger than that of the final temperature_
This systematic variation of the unbalance of the distributions points towards a systetnatic contribution of molecular orientation, which is induced by thermal stresses above and around Tg. This effect can be rationalized as follows; During the free quench the surface of the sample shrinks first- This shrinkage is opposed to a certain extent by the core) whi<;h is still at its initial temp',;n-ature. This will lead to tensile stresses at the surface during vitrification2o _ Therefore tensile orientation will be frozen in there. With proceeding cooling the compressive strain in the core will increase 50 that at a certain distance from the surface thi5 compressive strain cannot be compensated by the tensile strain due to the thermal shrinkage before the vitrification of that specific layer. Therefore from some distance from the surface onwa.rds the material will pass the gla.ss transition under compressive stress. Only with further cooling below Tg will the stress become tensile there. For molecular orientation, however, the stress present at Tg is decisive. From these qualitative a.rguments one can expect a contribution from molecular orientation which is tensile at the surface and compressive in the core. This is opposite to the contribution of the final state of stress which is tensile in the cOre.
On the grounds of the same qualitative arguments, one should also be a.ble to explain the systematic varia.tions as shown for instance in Figs.5 and 6. With higher initial temperatures the total strain in the material cooled from l'i to Tg at the surface will increase. Therefore the ten5ile orientation contribution at the surface will increase, leading to a less nega.tive birefringence there and a zero transition closer to the surface a5 confirmed by exper.iment. Initially the core is compressed at a higher temperature so that more relaxation can take place berm-e solidification. However) also the tensile strain due to the shrinkage from Ti to Tg is higher so that much less compressive orientation or even tensile orientation can be expected in the core,
100 Chapter .1.2
leacling to a higher birefringence value there_ With low initial temperatures less tensile strain due to the shrinkage at the surface will be developed above Tg. But the compressive strain in the Gore cannot relax as the temperature of the core is dose to Tg right from the beginning, resulting in a lower birefringence in the core. A variation of the quench temperature with low Ti will have little influence on the orientation at the surface, but a strong influence on that of the core. The compressive strain in the core increases with decreasing Tc before solidification because of the inGreased shrinkage of the skin. As (:an be $een in FigA. this increased compressive orientation in the core counteracts the increased tensile stresses developed below Tg as far as birefringence is concerned. As a consequence of that the hiHJ,ingence in the core is independent of Tc.
Qualitatively all the at first sight surprising results can be int.er~ preted in thif; way.
Numerical simulation
III order t.o be able to interpret the residual birefringence distribution a, numerical program was developed) which can predict the buHd-up of cooling stresses in amorphous specimens with rotational f;yullnetry20. The constitutive material model is viscous-elastic·elastic. This means that above a c:ertain temperature Tr a viscous model is employed with a temperature-dependent Newtonian viscosity following a WLF equation. Between Tr- and Tg an elastic model is used wit.h the rubbety plateau modulus of the material independent of temperat.ure. At. 'T'g t.here if; l;L discontinuous step to the glassy modulus, which is again independent of tempera.ture- The thermodyna.mic properties are assumed to change at the Sawe temperature as the modulus. Table 1 shows the properties of PC as they were used in the' calculations- The ttlroperature at the surface is prescribed. Not only the temperature and the stress components are calculated in every node of the mesh, but also the birefringence components n rj• -.~ n zz , nee - nn: and n1'1' - nO@- When Tg is passed in a certain node, the momentary values of the birefringence are stored as orientational birefringence- The birefdngence increments built up below Tg are then added to it. To calculate the birefringence use is made of the stress-optica) rule with the stress-optical coefficient C equal to
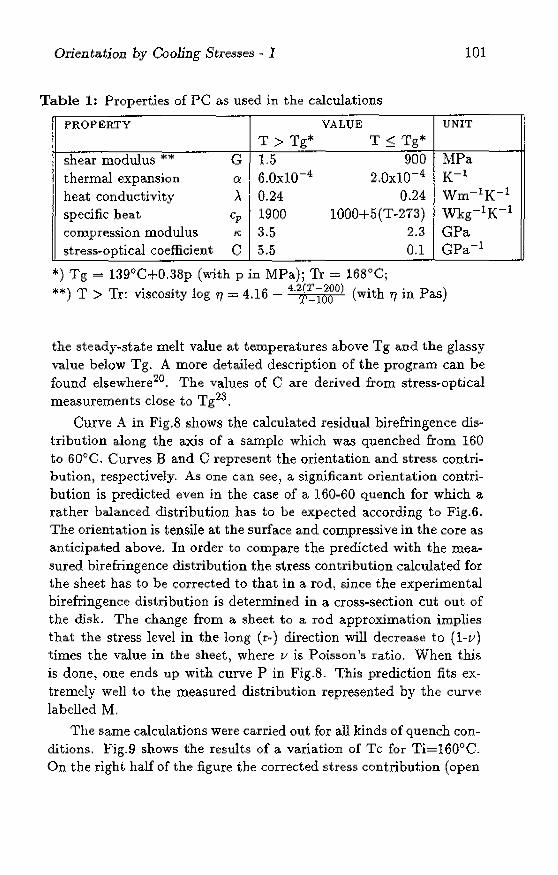
Orientation by Cooling Stresses" 1 101
Table 1: Properties of PC as used in the calculations .
PROPERTY VALUE UNIT
T> Tg* T ~ Tg*
shear modulus ** G 1.5 900 MPa. thermal expansion Q 6.0xlO-4 2.0x10⁻⁴ K-l
heat conductivity ,\ 0.24 0.24 Wm-1K- 1
specific heat cp 1900 1000+5(T-273) Wkg-1K- 1
compression modulus /(, 3.5 2.3 GPa stress-optical coefficient C 5.5 0.1 GPa-1
*) Tg == 1390 C+O,38p (with p in MPa); Tr = 1680 0;
**) T > Tr: viscosity log 'I] = 4.16 - 4.2'P:_l"J8°) (with Tf in Pas)
the steady"state melt value at temperatures above Tg and the glassy value below Tg. A more detailed description of the program can be found elsewhere~20, The values of C are derived from st.ress-optical measurements close to Tg23 ,
Curve A in Fig.S shows the calculated residual birefringence d.isy
tribution along the axis of a sample which was quenched from 160 to 60°C. Curves Band C represent the orientation and stress contribution, respectively. As one can see) a significant orientation contribution is predicted even in the case of a 160-60 quench for which a rather balanced distribution has to be expected according to Fig.6, The orientation is tensile at the surface and compressive in the core as anticipated above. In order to compa.re the predicted with the measured birefringence distribution the stress contribution calcula.ted for the sheet has to be corrected to that in a rod) since the experimental birefringence distribution is determined in a cross-section cut out of the dj~k. The change from a. sheet to a rod approximation implies that the stress level in the long (r-) direction will decrease to (l~v) times the value in the sheet, where 1.1 is Poisson's ratio, When this is done, one ends up with curve P in Fig.B. This prediction fits ex" tremcly well to the measured distribution represented by the curve labelled M,
The same calculations were carried out. for all kinds of quench conditions, J:<~ig.9 shows the results of a variation of Tc for Ti=160°C. On the right half of the figure the corrected stress contribution (open
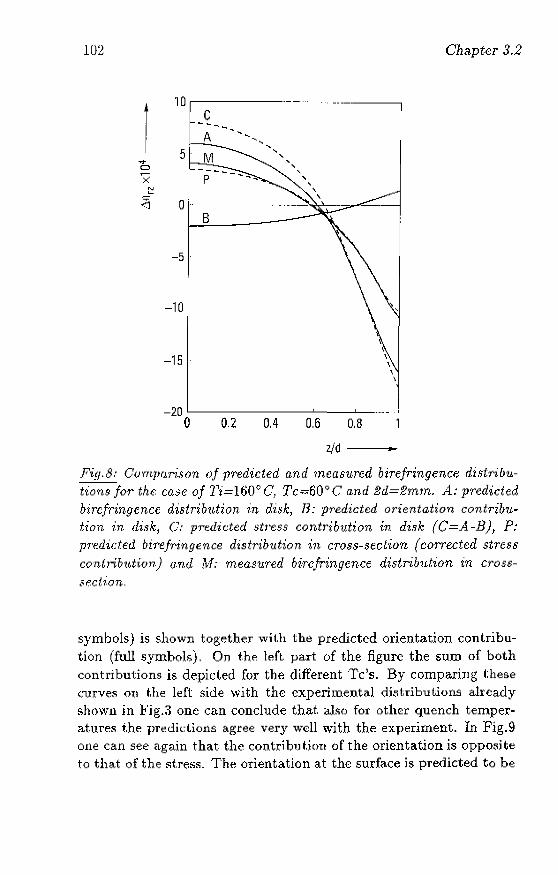
102 Chapter 3.2
10
1 c -~
A ~
~"
5 .... 0
X t:!
<;;;
0 <1
-10
-15
-20L---~----~--~----~ o 0.2 0.4 0,6 0,8
z/d ...
Fig.S; Cotrqmr-ison of pr'edicted and measured birefringence di.9lributions for the case of Ti=16()<' C, Tc·=60° C a.nd 2d=2mm. A: predicted birefringence distribution in di<~k, ]l: predicted orientation contrib1).· fion h1. disk, C; pr'ed'icted 8tt'CSS contribution in disk (G=A-B), P: pTf;;rl-ided birefringence distribution in cross-sed'ion (corrected stress contribtdion) (jmd M.- measured birefringence dist7'1:b1dion in crosssedion.
symbols) is shown together with the predicted orientation CCHltribution (full symbols), On th~ left. part of the figure the sum of both contributions is depicted for the different Tds. By comparing these curves ou the left side with the experimental distributions already shown in f'ig.;{ one can conclude that a.ho for other quench temperatures t.h~ predictions agree very well with the experiment. In Fig.9 one can see again that the contr.iblltioIl of the orientation is opposite to tha.t of the stress. The orientation at the surfa,ce is predicted to be
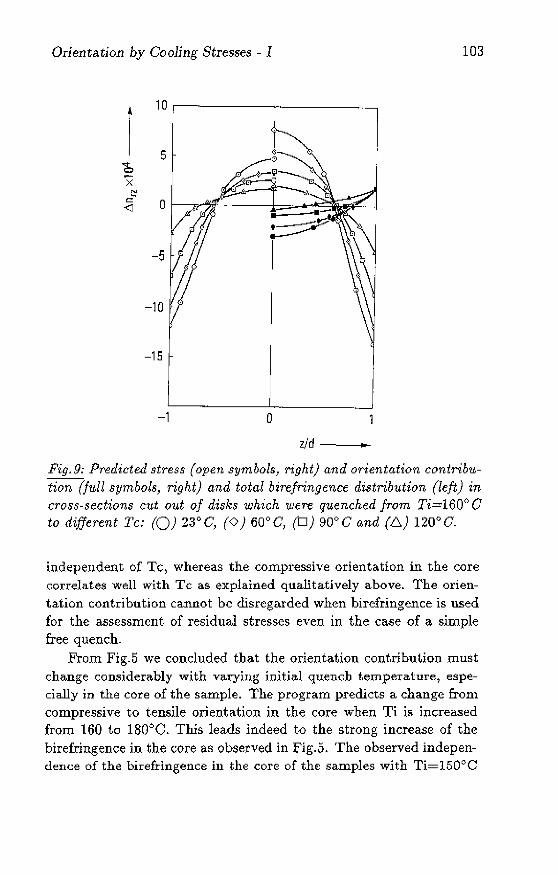
Orientation by Cooling Stresses - I 103
r -x
-15
-1 o z/d ""
Fig.,9; Predicted stress (open symbols, right) and orientation contribution (full symbols, right) and total birefringence distribution (left) in cross-sections cut out of disks which '1j.]{;,re quenched from Ti=160° C to different Tc: (0) 23°C, (0) 60°C, (0) 90°C and (6) 120°C_
independent of Te, whereas the compressive orientation in the core Gorrelates well with Tc as explained qualitatively above. The orientation contribution cannot be disregarded when birefringence is used for the assessment of residual stresses even in the case of a simple free quench.
From Fig-5 we concluded tha.t the orientation contribution .Ulust change considerably with varying initial quench t.emperature, especially in the core of the sample. The program predicts a change from compressive to tensile orientation in the core when Ti is increased from 160 to 1806 0. This leads indeed to the strong increase of the birefringence in the GOre as observed in Fig.5. The observed independence of the birefringence in the core of the samples with Ti=150°C
104 Chapter 3.2
a~ :-;hown in FigA is, however, not predicted correctly by the program. With low Tc the birefringence in the core is overestimated. The rea.son is most probably an incorrect stress prediction. Obviously, the error due to the oversimplification of the glass transition becomes significant when the initial temperature is chosen very close to Tg.
Influence of sectioning
For the present investigations the effects of cutting are a core issue for several reasons: (i) Since birefringence is measured in cross-sections, a simple correction ha.s already been introduced above in order to account for the decrease in the stress level parallel to the cutting planes. It would be worthwhile to check that effect. (ii) Stress distributioHil in polymer samples have been determined by the so-caJled layer removal technique: thin layers of material are milled away in the thickness diredion. The resulting curvature as a function of remain~ ing thickness is then translated into a. stress distribution by making several assumptions, i.e. a constant modulus through the thickness, a perfectly flat object of constant thickness to begin with, nO end effects and either a uniaxial or equibiaxial gtate of stress with no stress variation in the direction of the sheet21 . (iii) Saffell and Windle9
proposed to relieve st.resses by reducing the dimensions of the sample perpendicular to the thickness direction of the sheet. MillslO showed that) when the length of the section is less than 20% of the thickness of the sheet, the stresses are reduced to 5% of their original value. The st.rel':l': distribution could then be derived from the change of birefringence upon sectioning. Before the distinction between orientation and stress contribution will be treated first the effect of cutting the cross-sections will be discussed.
!iross-section width, Before cutting the quenched disks appear homogenously black be
tween crossed polarizers. By cutting the opticaJ retardation increases close to tht) cutting lines. In. the cross-sections there is a para.bolic mstribution of the integral birefringence when viewed in the z-mrection, as shown in Fig.10 for one example. The positive and negative areas of the parabola are equal in magnitude, which is about one tenth
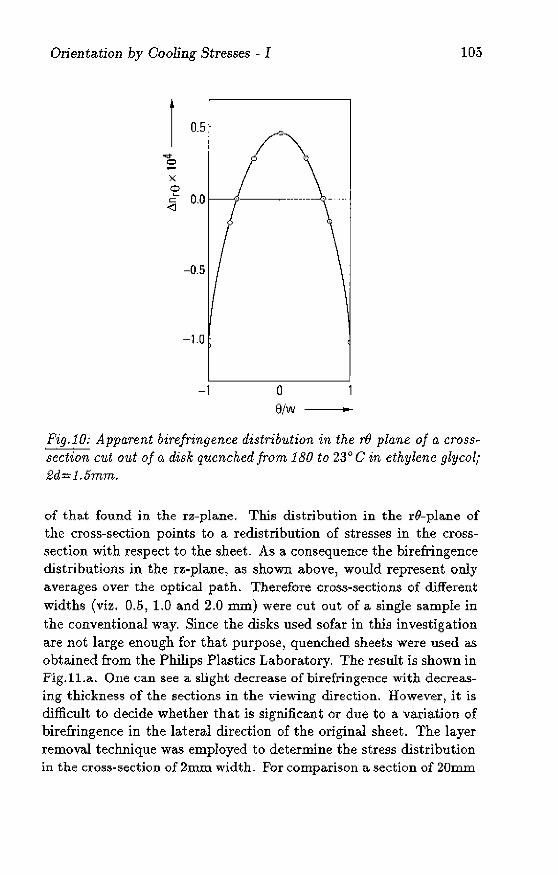
Orientation by Cooling Stresses - I 105
-1.0
-1 o e/w too
Fig.l0: Apparent birefringence distribution in the rf) plane of a crosssection cut out of a disk quenched from 180 to 23° C in ethylene glycoli 2d=1.5mm.
of tha.t found in the rz-plane. This distribution in the rO-plane of the cross-section points to a redistribution of stresses in the crosssection with respect to the sheet. As a consequence the birefringence distribution5 in the rz-plane~ as shown above) would represent only averages over the optical path. Therefore cross-sections of different widths (viz. 0.5, LO and 2.0 mm) were cut out of a single sample in the conventional way. Since the disks used sofar in this investigation are not large enough for that purpose, quenched sheets were used as obtained from the Philips Plastics Laboratory. The result is shown in Fig.ll.a. Qne can See a slight decrease of birefringence with decreasing thickness of the sections in the viewing direction. However, it is difficult to decide whether that is significant Or due to a varia.tion of birefringence in the lateral direction of the original sheet. The layer removal technique was employed to determine the stress distribution in the cross-section of 2mm width. For comparison a. section of 20mm
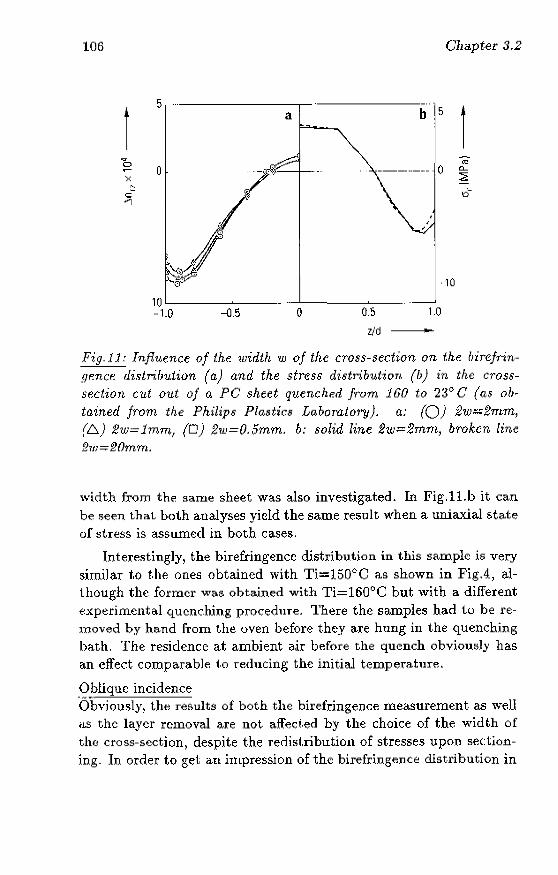
106 Chapter 3.2
5 ...
1 a b 5
1 0 '" 0 a... 'x ~ "
<;;; t)"
"'1
10
10L-------~---··1.0 -0.5 o 0.5 1.0
z/d ...
Fig.i}: Influence of the width 'Ill of the cross-section on the; bircfringe11,Cf'. dist.,.dnJ.tion (a) and the stress distribution (b) in the crosssection cut out of a PC sheet quenched from 1 GO to 23° C (a5 ob
tained from the Philips Plastics LuboratM"gJ. a: (0) 2w=2mm, (6.) 2w=lmm} (0) 2w=O.5mm. b: solid line 2w:;::!!2mm, broken line 2711=20mm.
width from the same sheet was also investigated. In Fig.l1.b it can be seen that both analyses yield the same result when a uniaxial state of stress is assumed in both cases.
Interestingly, the birefringence distribution in this sample is very sirnilar to the ones obtained with Ti=150"C as shown in FigA, although the former was obtained with Ti=160°C but with a different experimental qucnc}ung procedure. 'There the samples had to be removed by hand from the oven before they are hung in the quenching bat.h. The residence at ambient air bdore the quench obvioutlly has an effect compa.ra.bJ~ 1,0 reducing the initial temperature.
g"?liquc incidence Obviously) the results of both the birefringence measurement as well as the layer removal a.re not affected by the choice of the width of the cross-section) despite the redist.ribution of stresses upon sectioning, In order to get an impression of the birefringence distribution in
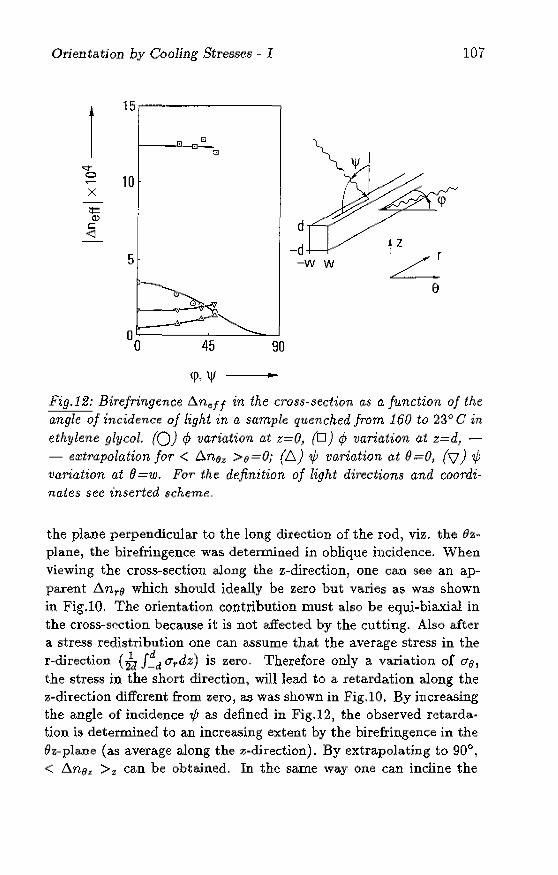
Orientation by C<wling Stresses - I
1
15
(;] t----El-[;J_
[;J
<:t-o
10 X
:t= Q)
c:: <1
5
~~ -6~~~
00 45 90
(P, \If ~
d
-d
e
107
Pig.12: Birefringence t!..neff in the cross-section (1.$ a function of the angle of incidence of light in a sample quenched from 160 to 23° C in ethylene glycol. (0) ¢ variation at z=O, (0) ¢ variation at z=d, -- extrapolation for < D.nf)z >f) =Oi (6) 'Ij; variation at 0 =0/ (V) 7j; variation at IJ =w. For the definition of light directions and coordinates sec inserted scheme.
the plane perpendicular to the long ditection of the rod, viz. the 8zplane, the birefringence was determined in oblique incidence. When viewing the cross-section along the z-direction, one can see an apparent flnr(J which should ideally be zero but varies as was shown in Fig.lO. The orientation contribution must also be equi-biaxial in the cross-section because it is not affected by the cutting. Also after a stress redistribution one can assume that the average stress in the r-direction (ta J~d O'Tdz) is zero. Therefote only a variation of 0"(;,
the stress in the short direction, will lead to a retardation along the z-direction different from zero, as was shown in Fig.lO. By i:ucreasing the angle of incidence 'r/J as defined in Fig.12 j the observed retardation is determined to an increasing extent by the birefringence in the ez-plane (as average along the z-direction). By extrapolating to 90°, < t!..nf}t >z can be obtained. In the same way one can incline the
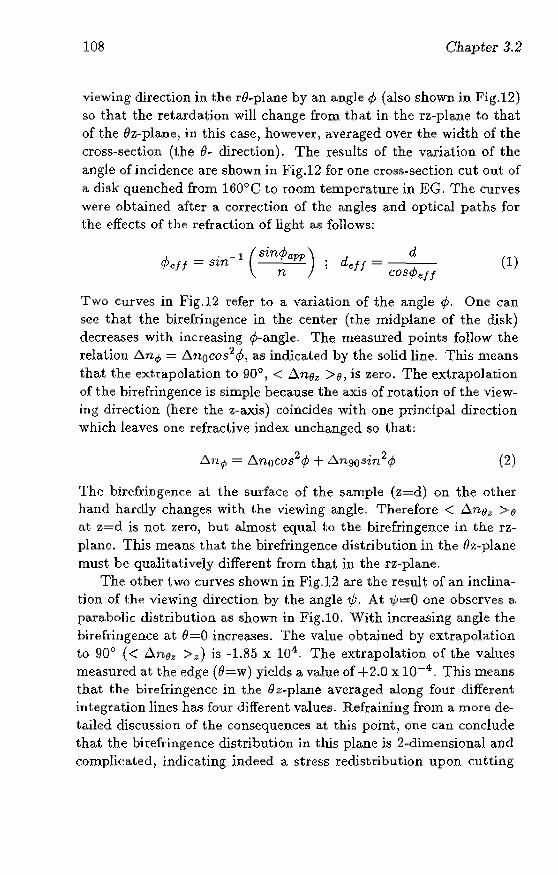
108 Cllapter 3.2
viewing direction in the r(}-plane by a.n angle ¢ (also shown in Fig.12) so that the retardation will change from that in the rz-plane to that of the Oz-pla.ne j in this case) however, averaged over the width of the cross-section (the a- direction). The results of the variation of the angle of incidence are shown in Fig.12 for one cross-section cut out of a digk quenched from 160°C to room temperature in gG. The curves were obtained after a corredion of the angles and optical paths for the effects of the refraction of light as follows:
.. " 1 (Sin¢app ) d felt = sm ; d~/J = ---n cos¢e/f
(1)
Two curves in Fig.12 refer to a variation of the angle ¢. One can sec that the birefringence in the center (the midplane of the disk) decreases with increasing ¢-angle. The measured points follow the relation f).n", = f).nOcos2¢, as indicated by the solid line. This means that t.he ext.rapolation to 90° J < 6n/1z >/1, is zero. The extrapolation of the birefringence is simple because the axis of rotation of the viewing direction (here the z-axis) coincides with one principal direction which leaves one refractiv~ index unchanged 50 that;
(2)
The bircfringenGe at the sudace of the sample (z=d) on the other hand harcliy changes with t.he viewing angle. 'Therefore < D.nl)z >fI at z=d is not zer{)) but almost equal 1;0 the birefringenc~ in the rzplanc. This means that the birefringence distribution in the Oz~plane must be qualitatively different from that in the rz-plane.
The other t,wo curves shown in Fig.l2 are the result of an inclination of the viewing direction by t.he angle 1J;. At 1j)~0 one observes a. para.bolie distribution as shown in Fig.10. With increasing angle the birefringence at 0=0 increa...~es. The value obtained by extrapolation to 90° « .6.noz >;;) is -1.85 X 10⁴
• The extrapolation of the values mea.sured at the edge (a=w) yields a value of +2.0 x 10⁻⁴ . This means that the birefringence in the (1z-plane averaged along four different integration lines has four different values. Refraining from a more detailed discussion of the consequences at this point) one cau conclude that the birefringence distribution in this plane is 2-dimensional and complicated) indicating indeed a stress redistribution upon cutting
Orientation by Cooling Stresses - J 109
1 5
~~ 'b
X N 0 ... ~
-<J
-1 0 --.~-,.~ .. '" 'M "', .• '" •... ,- .• -" •• - •• "-,~''' .• ,., ,.
o z/d joo
Fig.iS: Half of birefringence distribution in rod quenched from 160 to 23° C inserted in silicon rubber disk. (0) quench from both sides, (0) quench from one side! (6.) difference of double and single sided quench.
the cross-section.
Rod quenching Therefore quenching experiments were carried out on rods $0 that the birefringence can be determined directly without sectioning. In order to achieve adiabatic conditions in one direction (the viewing direction), the rod was embedded in a disk of silicon rubber, as shown in Fig-2-a.. At the interface between PC and the rubber a thin layer of silicon grease was applied to avoid adhesion and keep the quench medium out. In Fig.13 the birefrillgence distribution in such a rod (quenched from 160 to 60°C) is shown, Comparing that distribution with that observed in the cross-section of a disk quenched under the same conditions (Fig,3) shows that the birefringence in the rod is considerably lower. The average hi refringence is also more negative in the case of thtl rod. The reason could be an influence of the silicon
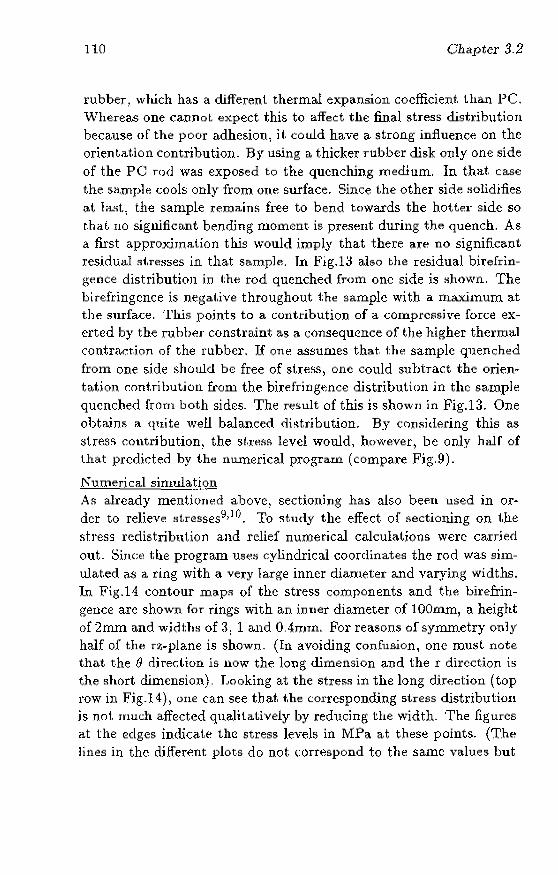
110 Chapter 3.2
rubber, which has a different thermal expansion coefficient than PC. Whereas one cannot expect this to affect the final stress distribution because of the poor adhesion) it could have a strong influence on the orientation contribution. By using a thicker rubber disk only one side of the PO rod was exposed to the quenching medium. In that case the sa.mple (;ools only from one surface. Since the other side solidifies ;~.t last.) the sample remains free to bend towards the hotter side so that uo significant bending moment is present during the quench. As a first approximation this would imply that there are no significa.nt residual stresses in that sampk In Fig.lJ also the residual birefringeIICB distribution in the rod quenched from one side is foIhown. The birefringence is negative throughout the sample with a maximum at the surface. This points to a contl"ibution of a compressive force exerted by the rubber constraint as a. consequence of the higher thermal contraction of the rubber. If one aSsumes that the sample qnenched from one side should be free of stress) one could sl.lhtract the orientat.ion mnhibution from the bire.fringence distribution in the sample quenched from both sides. The result of tIlls is shown in Fig.13. One obhtins a quite well balanced di~tribution. By considering this as stress contribution, the st.ress level would, however) be only half of that predicted by the numerical prograrn (compa.re Fig.9).
Numerical simula!i.9!! As already mentioned above, sectioning has also been used in or~ der to relieve stresses9,1O. To study the effect. of sectioning on the stress redistribution and relief Ilumerical calculatioos were carried out. Sino) the program U5e~ cylindrical coordinates the rod was simulated ,is a ring with a very large inner diametel" and varying widths. Tn Fig.14 contour map5 of the stress co:mponents and the birefringence arc shown for rings with an imler diameter of 100mm, a height of 2mm and wjdj;h~ of 3) 1 and OAmIIl. For reasons of synunetry only half of the rz-plane is shown. (In avoiding confusion, one mu(o!t note that the () diredioll is now the long dimension and the r direction i~ the short dimension). Looking at the stress in the long direction (top row in Fig.14)) one can see that the corresponding stress distribution is not much affected qualitatively by reducing the width. The figures at. the edges imlicate the stress level~ in MPa at these points. {The lines in the different plots do not: correspond t.o the same values but
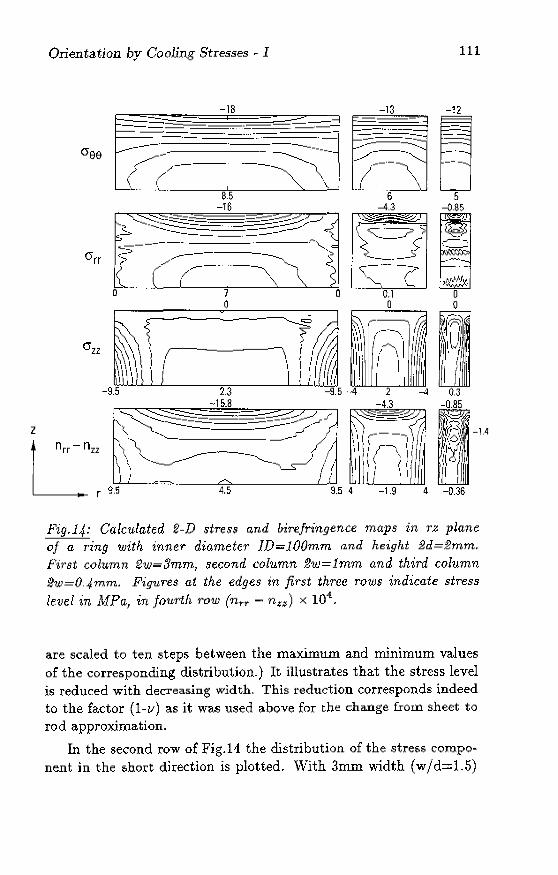
z
Orientation by Cooling Stresses" I III
-~ -
.----'-".,-
o 7
Fig.14: Calculated 2-D stress and birefringence maps in rz plane of a Ting with inner diameter JD=100mm and height 2d=2mm. Pirst column 2w=3mm j !Jecond column 2w=lmm and third column 2w=O.4mm. Figures at the edges in first three rows indicate stress
level in MPu, in fM~rth row (n.,.'r - n-t:,:,) X 104•
are scaled to ten steps between the maximum and minimum values of the corresponding distribution.) It illustrates that the stress level is reduced with decreasing width. This reduction corresponds indeed to the factor (1-1/) as it was used above for the change from sheet to rod approximation.
In the second row of Fig.l1 the distribution of the stress compo~ nent in the short di,ection is plotted. With 3mm width (w/d=1.5)
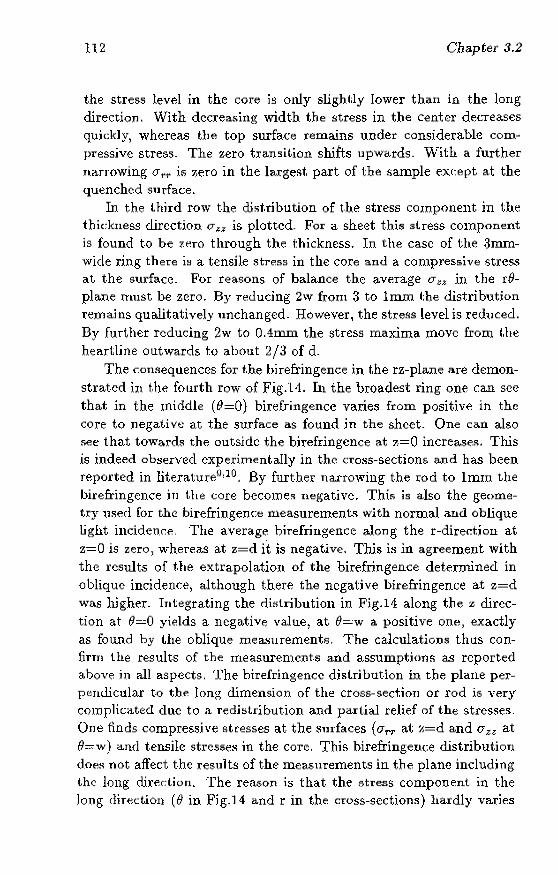
112 Chapter 3.2
the stress level in the core is only slighUy lower tha.n in the long direction. With decreasing width the stress in the center decreases gllickly} wherea.s the top surface remains under considerable com~ prcssivc stress. The zero transition shifts upwards, With a further narrowing (frr is zerO in the large:1t part of the sample ex!.:ept at the quenched surface.
In the third row the clistribution of t.he stress component in the thickness direction cr ~~ is plotted. For a sheet this stress component is found to be zerO through the thickness. In the case of the 3nunwide ring there i~ a tensile stress in the core and a compressive :stress at the surface. For reasons of balance the average (f:-:z in the r8-plane must be zero, By reducing 2w froUl 3 to lmm the distribution n:mains qualitatively unchanged, However, the stress level is reduced. By further reducing 2w to O.4mlll the r:;tress maxima lnove from the heartline outwards to about 2/3 of d.
The c.:onsequenccs for the birefringence in the rz-plane are demonstrated in t.he fOllrth row of Fig.11. In the broadest ring Qne can see that in the middle (61=0) birefringence varies from positive in the core to negative at the surface as found in the sheet. One can also see that towards the outside the birefringence at ;,,=0 increases. This is indeed 0 b~erved experimentally in the cross-sections and has been reported in literatureO,lO. By further narrowing the l'od to Imrn the birefringence in I.he core becomes negative. This is also the geometry used for the birefringence measurements with norlllal and oblique light incidenc-:e. The average birefringence along the r-diredion at z=O is zero? whereas at z=d it is negative. Tills is in agreement with the results of the extrapolation of the birefringence determined in oblique incidence, although there the negative birefringence at z=d was higher. Integrating the ditltribution in Fig.l1 along the z direction at e=-:o yields a negative value, at e=w a positive one, exactly as found by the oblique measurements, The calculations thus confirm the results of the measurements and assumptions as reported above in all aspects. The birefringence distribution in the plane perpendicular to the jong dimension of t.he cross-section or rod is very cornplicated due to a redi~tribution and partial relief of the stresses. One finds compressive stresses at the (mrfaces (O"rr at :t.=d and G zz at 8=w) and tensile stresses in the core, This birefringem:e distribution doetl not affect the results of the measurements in the plane including the long dir~dion. The reason i~ that the stress component in the long direction (e in Fig.14 and r in the cross-sections) hardly vari~s
Orientation by Cooling Stresses - I 113
1 5
--~ .q
<;;;:I
x ~ 0 \;;;
<I
-5
--10
-15
o 0_5 1.0
z/d ..
Fig . .15: Calculated stress contribution to birefringence in nng (ID= 1 OOmm, 2d=2mm) as a junction of the '/J}idth oj the ring. (0) 2w=3mm, (0) 2w:::;tjmm and (6.) 2w=O.4mm.
in the width direction (top row of Fig.14) aud the average stress (T:;:;
along the viewing direction C.!~ r~w I7z ;;dr) must be zerO at any value of z.
By further reducing the width to 20% of the height (2w=0.4mm)) the birefringence level js reduced to below 10% of the original value in the sheet (Mills10 predicted 5%). But the distribution is rather complicated and the sign has changed in the core. The corresponding one~dirnensional distribution along z at 0=0 is shown in Fig.15 for dHferent widths. There one can see that for a rod with a width smaller than the height the positive part of the birefringence distribution in the core is turned into a negative one which slowly approaches zero with further decreasing width. The negative pa.rt a.t z=d also
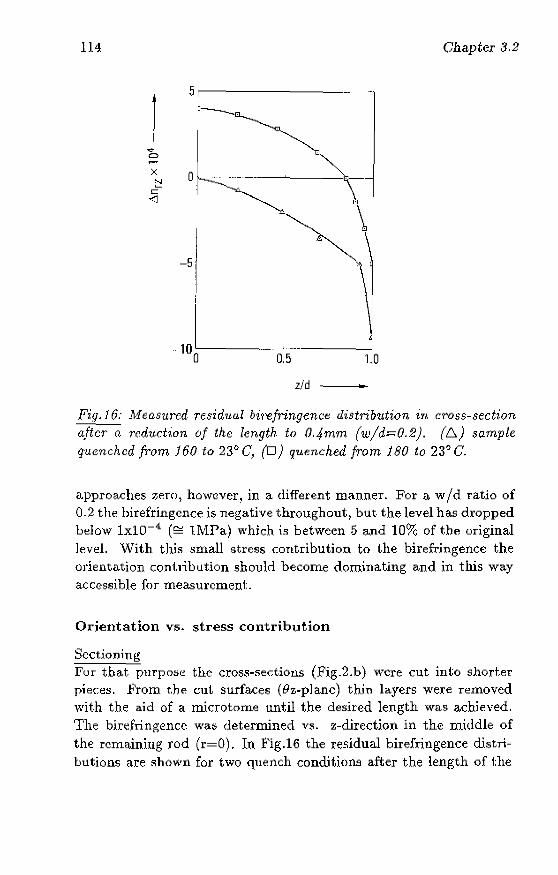
114 Gllapter 3.2
1
5
.... 0
x 0 ::! c <l
-5
10 '-----........ L .... _ •• ____ --"
o 0.5 1.0
z/d ""
Fig. 16: Measured residual bi7"·efringe.nc~ distribution in cross-se.ction after a rcdv.ction of the length to O.4mm (w/d==:O.2). (6) sample qacnchcd from j 60 to 230 C, (D) quenched from 180 to 23° C.
approaches zero} however, in a. different manner. For a. w!d ratio of 0.2 the birefringence is negative throughout, but the level has dropped below lxlO-4 (~ lMPa) which is between 5 and 10% of the original level. With this small stress contribution to the birefringence the orientation contribution should become dominating and in this way accessible for measurement.
Orientation ys. stress contribution
Sectioning Fur that p1lrpose the cross-sections (Fig.2.b) were Cllt into shorter pieces. From t.he cut surfa.ces (th-planc) thin layers were removed with the a.id of a microtome until the desired length was a.chieved. The birefringence was determined vs. z-direction in the middle of the remaining rod (r=O). In Fig.16 the residual birefringence distributions are shown for two quench conditions after the length of the
Orientation by Cooling Stresses - I 115
cross~section had been reduced to 20% of the thickness. By comparing with the calculated stress contribution (Fig.15L one can conclude that there must be a considerable orientation contribution in both cases. In the case of the quench from 1.80°0 the whole distribution is shifted by about 4 x 10⁻⁴ to the positive direction as compared to the case of 160°C initial que:uch temperature. A tensile orientation is found in the core as predicted and found by annealing experiments. In both examples of Fig.16 a strong compressive orientation is indicated at the surface. This is in contrast to the expectations based on the results of the numerical simulations, as shown in Fig.9 for Ti~16WC. The reason for this could be that the stresses at the surface are not relieved to the same extent as predicted by the calculations. Another reason would be the failure of the linear stress-optical mle during stress relaxa.tion so that birefringence would not relax in the same way as the stresses and part of the parabolic stress contribution would be superimposed on the orientation induced above Tg. This point will be discussed in a following publication.
By subtracting the residual birefringence in the short sections from the birefringence distribution of the "long" cross-sections) one can obtain the stress which relaxed upon sectioning. In Fig.17 this stress contribution is compared with the stress distributions obtained with the aid of the layer removal technique and the numerical program. One can see that there are considerable differences between the results of the different approaches. Concerning the result of sectioning, Olle must be aware that this distribution would have to be corrected for the stress present in the specimen after sectioning (i.e. Fig.15). This correction is estimated as :$; -10%. Such a correction would improve the balance of the distribution shown in Fig.17, in which the positive area is significantly larger than the negative one. In comparison with the stress distribution obtained by layer removal, it is interesting to note that the compressive parts agree very well, whereas the tensile stress in the core derived from layer reIIloval is only half of that derived from sectioning. This difference cannot be explained by stress relaxation, since the samples were of the same age (younger than one week). With respect to the layer removal techn.ique, however, one has to ta.ke into account that the number of measurement points of the curve as well as the degree of the poly-
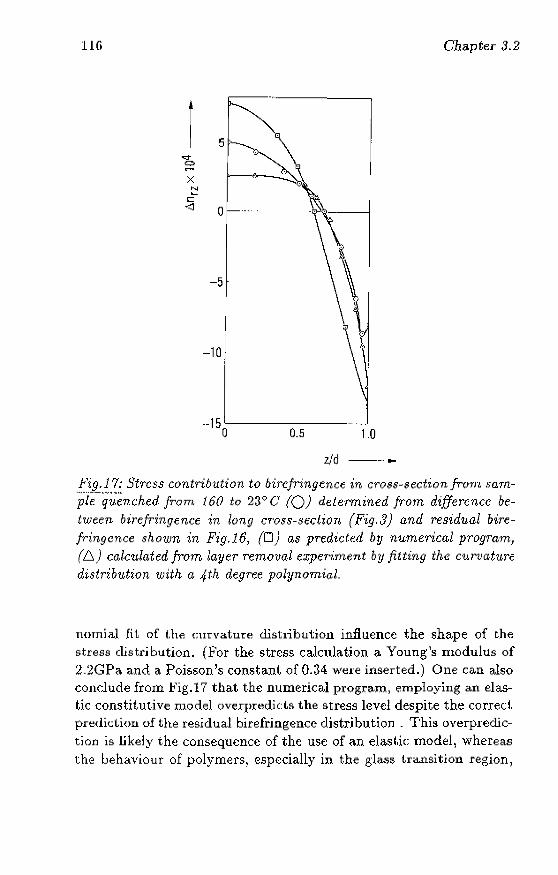
116
1
.. -150'-----~--0.5 1.0
zJd -_ ....
Chapter .1.2
Fig.17: Str'ess contrib-ution to birefringence in cross"section from saTn'p'i~~q;~~~nched from . .160 to 23" C (0) determined from difference be
tween birefringence in long CT'oss-seclion (Fig.3) and residual birefringence shown in Fig. 16, (D) as predicted by numerical program, (6) calculated from layer removal exper'irnent by fitting the curvature distribution with a 4th degree polynomial.
nornial fit of t.he curvature distribution influence the shape of the stress distribution. (For the stress calculation a Young's modulus of 2.2GPa and a Poisson's constant of 0.34 were inserted.) One can also conclude from Fig.17 that the numerical program, employing an elastic constitutive model overpredi(;ts the stress level despite the correct. prediction of the residual birefringence distribution. This overprcdiction is likely the consequence of the use of an elas\,ic model, whereas the behaviour of polymers, especially in the glass transition region,
Orientation by Gooling Stresse!!l - I 117
is known to be viscoelastic24 , A viscoelastic analysis in combina.tion with the rugh cooling rates is highly complicated, also in view of the complicated stress-optical behaviour 13,25, It would, however, become tra.ctable when the stress-optical rule is also treated ill a )'viscoelastie' time-dependent way26 , as suggested in ref.23 for polycarbonate.
Annealing Another possibility to distinguish experimentally between orientation and stress contribution is to heat the sample to the glass transition temperature, One can expect the stress contribution to disappear before the orientation, However, when looking carefully at such an experiment it is found to be rather complicated. First of all the sample must be completely free to expand during hea.ting and not be hampered by the surrounding. Only with a low or a very homogenous orientation in the sa.mple will the thermal expansion coefficients be equal in the different parts of the sample so that no extra stresses are created during heating. With heating one can expect that the stress level will decrease as a consequence of the decrease of the modulus with temperature and time (depending on the heating rate). When Tg is reached, all constraints have been removed so that no significant stresses will be present in the sample anymore. But already below Tg stress relaxation is expected to be vety fast so that stresses disappear below Tg. In a quenched sample the surface is the constraint for the core. Therefore, when the surface creeps under the present stress) this will lead to a relief of stress in the core and therefore also in the surface, The apparent stress rela.xation will be accelerated by creep of the constraints. In Fig.iS t.he birefringence is plotted VS. temperature. This graph was obtained by heating a cross"section on a glass slide covered with a thin film of silicon oil to prevent adhesion- The birefringence was measured at two positions, corresponding to the COre and the surface of the original disk) on a polarizing microscope during heating. At the bottom of the figure the cumulated time of the heating scan is shown as a function of temperature. In parts a and b diffenmt average heating rates were applied, By looking at Fig.18.a one can see that the decay of birefringence is accelerated with increasing temperature for both curves in a similar way. The birefringence should become zero just above 140"C~ The heating at a rate of lOoe/min was halted at the measurement points for soIne
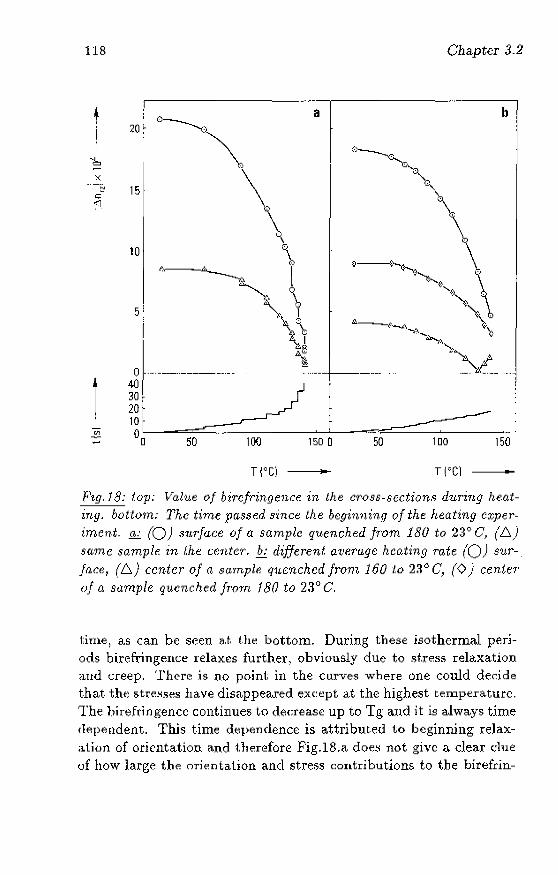
118
1
c;:
"1"
1
20
15
10
5
o -........ -.. ---... -----.-.-........ .. 40 30 20 10
Chapter 3_2
a b
o [L) -~""5:I:=0=----_~ ___ ~--.L __ ===---~ ____ " ...
100 1500 50 100 150
T(OC) T (OC) -Pig. 18: top: Value of birefringence in the cross-section$ dUTing heating. bottom: The time pa$.~€d since the beginning of the heating experiment. a: (0) .~1J,71(J,(;e of a sample quenched Ir-om 180 to 23(> C, (.6.) same samplp. in Lhe coder. b: different a:l)emge heating rate (0) sur-.
jace, (.6.) center of a sample q1wnched from 160 to 2:l° C, (0) centeT
oj a sample quenched fT'orn 180 to 2:jO C.
time) as can be seen ~.t, the bottom. During these isothermal periods bi.refringence relaxes further) obviously due to stress relaxation awl creep. There is no point in the curves where one could decide that the stresses have disappeared except at the highest temperature. The bireftingence continues to decrease up to Tg and it is always time dependent. This time dependence is attributed to beginning reJax<'I.tion of orientation and therefore Fig.l8.a doe!; not give a cleaT due of how large the orientation and stress contributions to the birefl'in-
Orientation by Cooling Stresses - I 119
gence have been. Only by using high heating rates can one suppress relaxation. In Fig.18.b two samples with different quench conditions are compared at a higher heating rate. The birefringence in the center and at the surface (with respect to the original disk) of a sample which was quenched from 160°0 to room temperature is shown together with the birefringence in the center of a sample quenched from 180°C to room temperature. One can see that the birefringence in the core of 160-sarnple changes sign at I30°C} whereas the birefringence in the cOre of the l80-sample does not approach zero. This means that indeed in the one case there is tensile orientation in t.he core and in the other case compressive orientation, as predicted by the calculatjons. In contrast to the predictions, but in qualitative agreement with the results of sectioning, there is a compressive orientation at the surface. This difference with the predictions could be explained by stress relaxation, where the compressive stresses in the core are partially transformed into compressive orientation. However, the effects of stress relaxation on birefringence will be discussed in a separate contribution.
Conclusions
The residual birefringence distribution in quenched PC specimens is approximately parabolic in shape with a positive birefringence in the core and a negative at the sUlface. The distributions are not balanced in general.
Both the level as well as the unbalance of the bitefdngence vary systematically with the quench conditions, the initial quench temperature being the roost determining parameter.
The systematic variation of the unbalance is explained by molecular orientation which is hlduced by thermal stresses present above and at the glass transition temperature.
A numerical program which makes use of the linear stress-optical rule employing the stress-optical coefficient of the melt above Tg and that of the glass below Tg is capable of predicting the birefringence distribution correctly for reasonable quenc:;:h conditions. The program predicts the build· up of tensile molecular orientation at the surface of the sample. The orientation in the core is compressive for low and tensile for rugh initial quench temperatures.
120 Chapter 3-2
Cutting cross-sections out of the quenched samples leads to a partial relief and a redistribution of stre5ses in the plane perpendicular to the cross-section. However} this redistribution does not affect the results of the birefringence measurements in the cross-sections-
By reducing the length of the cross-section to below 20% of the thickness more than 90% of the residual stress can be relieved, The stress cont.ribution det.ermined in t.his way is considerably lower than the predicted one. It is also different from the one determined by the layer removal technique.
Several experimental findings indicate that part of the parabolic stress is relaxed without a proportional reduction in birefringence.
Tt is not possible to elimlnate the stress contribution to the birefringence by annealing below Tg because of the tirne-dependent stressoptical behaviour .
Acknow ledgement
The author~ a.re very grateful to Ir.C_van Hastenberg and Ir.G.Schennink from the Philips Plastics Laboratory) OOP PMF) for supplying the quenched PC sheet and software for the evaluation of the layer removal mea.surements- This work could not have been carried out in this way without the careful preparation of the cross-sections and the milling done by Rvan Vlerken at our laboratory-
References
L Boley)B.A.., Wiener)J-L, "Theory of Thermal Stresses)\ ,LWiley, New York (1960)
2_ Aggarwala,B.D" Saibel,E., Phys.Chem,Glass, 2, (1961), 1 37
3- Muki,R, Sternberg,E., J-AppLMeGh.) 28) (1961)} 193
1, Lee,E.H., Rogers,T.G" Woo,T.C., J.Amcr,Ccram.soc-, 48, (1965)} 480
S. Narayanaswarni}O.S.) Gardon)R., .LAmer.Ceram.Soc,, 52, (1969), 554
Orientation by Cooling Stresses ~ I 121
7. So,P., Broutman,L.J., Polym.Eng.Sci., 16, (1976); 785
8. Struik, L.O.E., Polym.Eng.Sci.) 18, (1978), 799
9. Saffell,J.R.., Windle,A.H., J.AppLPolym.ScL, 25, (1980), 117
10. Mills;N.J., .}.Mater.Sci., 11, (1982), 558
11. Greener,J., Kenyon,P.M., Proc.SPIE, 291; (1981), 92
12. Isayev,AJ., Polyrn.Eng.sci., 23, (1983), 271
13. Wust,C.J., Bogue,D.C.; J.AppLPolym.Sd., 28, (1983), 1931
14. Lee,S., DelaVega,J.; Bogue,D.C., J .Appl.Polym.Sci.; 31, (1986); 2791
15. WaJes,JJ.J.S.,VanLeeuwen;J.; VanderVijgh,R., Polym.Eng.Sc::i., 12, (1972), 358
16. Ka.mal,M.R., Tan,Y., Polym.Eng.ScL, 19, (1979); 558
17. Janeschitz-Kriegl,H.; llMelt Rheology and Flow Birefringence", Springer, Bedin (1983)
18. Priss,L.S., Vishnyakov,LL) Pavlova)LP., Intern.J.Polym.Mater., 8, (1980),85
19. Read;B.E., Polym.Eng.8ci., 23, (1983),835
20. Wimberger-Friedl;R., Hendriks;R.D.H.M.; Polymer; 30, (1989), 1143 (Chapter 3.1)
21. Treutillg,RG., Read,W.T.; J.Appl.Phys., 22, (1951), 130
22. Wimberger-Friedl,R., Rheo1.Acta, 30, (1991),329 (Chapter 2.1)
23. Wimberger-Friedl,R., to appea.r in Rheol.Acta, 30, (1991) (Chapter 2.2)
24. Ferry,J.D' l "Visco-elastic Properties of Polymers" , 3rd ed., J.Wiley, New York, (1.980)
122 Chapter 3.2
25. Carey,D.A., Wust,C.J., Bogue)D.C., .T.Appl.Polym.Sd., 25, (1980), 575
26. Sugimori,S., Miyano,Y., KlUlio,T., Exper.Mcchan.) 24, (1984), 150
Chapter 3.3
Molecular Orientation Induced by Cooling Stresses in Polycarbonate - II
Constrained Quench and Injection Moulding1
ABSTRACT: Residua.l birefringem:e distributions are determined in polycarbonate samples obtained by quenching in a specially designed appara.tus and by injection moulding. The birefringence in the quenched samples is positive and ahuost constant, independent of the quench temperature, but varies strongly with initial temperature between 150 and 180<>0. The residual stress level, as determined by layer removal and sectioning, is very low. The birefringence distribution is due to a tensile equi-biaxial orientation which is induced by cooling stresses built up above Tg. The samples which were injection moulded with a high injection speed and without packing pressure display the same birefringence distribution as the quenc:::hed samples apart from a local maximum beneath the surface due to the shear flow during filling. The birefringence plateau in the core hardly depends on the mould temperature, as it is mainly deterrnined by a. tensile orientation induced by cooling stresses above Tg. The residual stress level is in the order of only IMPa. The application of a packing pressure leads to a compressive stress maximum beneath the surface and tensile stresses at the surface.
~ R. Wirnberger" Friedl, su bruit ted to J .Polyru. Sd.- B Polyrn.Phys.
123
124 Chapter 3-3
Introduction
Complica,ted residual stress distributions have been reported for injectionmoulded samples and ascribed to thermaJ and flow-induced stresses built up during the moulding operation 1-5 _ A very convenient technique to determine residual stress distribution is the so-called layer removal (LR) technique as introduced by Treuting and Read6 . But because of several principal as well as practical limitations of this tccllllique7
, especially the low spatial resolntion, alternative techniques have been employed, birefringence being the most frequently used one for amorphous polynlers.
In injection-moulded specimens there will always be contributions of flow-induced frozen-in orientation and of residual stresses to bire~ fringen<.:e- Sinc.:e for most polymers the stress-optical coefficient of the melt is considerably higher than that of the glass, the contribution of molecular orientation will be predominant in gcncral8 - 11 _
The measurement: of the frozen-in molecular orienta.tion is an important part of the characterization of the state of a moulded product. Orientation affects the properties and determines the dimensional stability of polymer products to a great extent. Since orientation is accompanied by entropy stresses above Tgj the question has arisen whether fTo7.en~iIl Ol"ientation should be called residual stresses12 . It is of course a matter of definition, but the flow-induced orientation has different consequences than nreal" stresses for a product in the sense that it cannot be measured by LR.. It is the viscoelastic memory of stresses, whose recovery has been tremendously retarded by the cooling through Tg. Therefore it will not be ca.lled residual stress hete j but frozen-in orientation.
Tn order 1,0 sLudy residual stresses, in particular the thermally induced ones, mostly free guenching experiments have been carried ouL 13 The boundary conditions in free quenching are) however, quite different from those in injection-molllding. A much marc relevant experiment is constrained quem:hing. Comparing the birefringence distributions of samples quenched freely and between pJates) Saffell and Windle14 reported essentially parabolic distributions for both cases, whereas Isayevll reported completely different distributions in the case of samples quenched between plates. In injection-moulded samples not only the anisotberrnal cooling gives rise to residllal stresses,
Orientation by Cooling SLresses - II 125
but also the pressure variation during vitrification2,l5,16 _ When the pressure varies with time while the solidification proceeds, subsequently vitrified layers will be hampered in their response to a pres~ sure change. This leads to residual stresses which are compressive in those layers which vitrified under the highest pressure and tensile in those vitrified under the lowest pressure.
In the present contribution the stress a.nd birefringence distributions in constrained-quenched polycarbonate will be described and compared with those found in injection-moulded samples_ The frozenin orientation will be distinguished from the thermal and the pressure· indw:ed residual stresses.
ExperiInental
All cxperimellts were carried out with polycarbonate CD 2000/15000 froUl Bayer AG, Leverkusen) FRG. This ;:=; an optical grade with low molecular weight) the same which was used in previous investiga.tions_13
Quench Apparatus In order to simulate injection-moulding conditions the cooling rate should be as high as possible. However, no deformation must be applied previous to and during the quench. Therefore an apparatus was developed, in which the sample can be annealed in situ. The predried sample is placed between two pistons with copper faces in a quartz cylinder with an inner diameter of 30 nun, shown in Fig.l. The whole arrangement is then heated to Ti above Tg of the sample. The top piston is loaded with typi(:ally 5N (corresponding to 7kPa pressure in the sample) to ensure a good thermal contact during the quench when the sample contracts. Upon ~)pening a valve thermostated wa.ter is pumped through both pistons (indicated by the hatched area in Fig.l), which were empty initially. The pistons fit precisely into the quartz cylinder. The latter is sufficiently insulating so that the rim of the PC sa.mple does not solidify before the core. Only then can the upper piston follow the local axial shrinkage of the sample at a.ny place, a precondition for high and homogeneous cooling rates. The true cooling rates were determined by glass fiber ))therIllOCOUpIes" connected to a fiuoroptic thermometer (Luxtron 750)- At the tip of the glass fiber there is a fluorescent component embedded in a
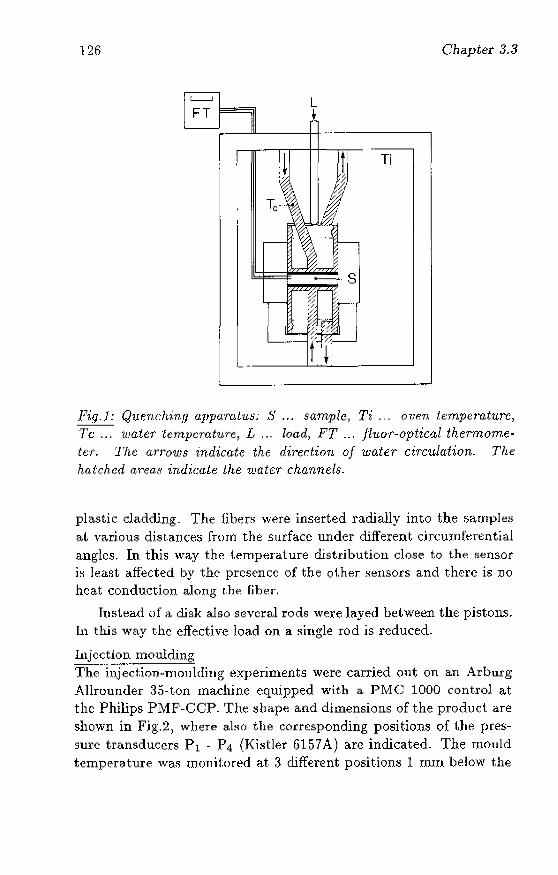
126
L
•
Chi:lptel" 3.3
Ti
Pig.}: Quenching (l,p]1(]:mlus; S ... sample, Ti ... oven lc:mpemtu7'C, '1'(; ... water lcmpcmture, L ... load, FT ... jtuor-optical thermometer. The arrows indicate the direction of water circulation. Thf; hatched are-a.b' 1:ndic(],lf.: lhe water channels.
plastic cladding. The fibers were inserted radially into the samples at various di8(.ann~s from the surface under different drnunf(~rential angles. In this w~.y t.hp. temperature distribution close to the sensor is least affected by the presence of the other sensors and there is no heat conduction along t.he fiber.
Instead of a disk also several rods were layed between the pistons. III th.is way the effective loa,d on a single rod is reduced.
l.nj_~~~!.~~~2E'°ulding The injection"mouldiug experiments were carried out on an Arburg Allrouwler 35-ton machine equipped with a PMC 1000 control at the Philips PMF-CCP. The sbape and dimensions of the produc;t are shown in Fig.2, where abo the corresponding positions of t,he pressure transducers Pi - P 4 (Kistler 61.57 A) arc indicated. The lOould
tcmpera.ture wa:o: monitored at 3 different positions 1 nun below the
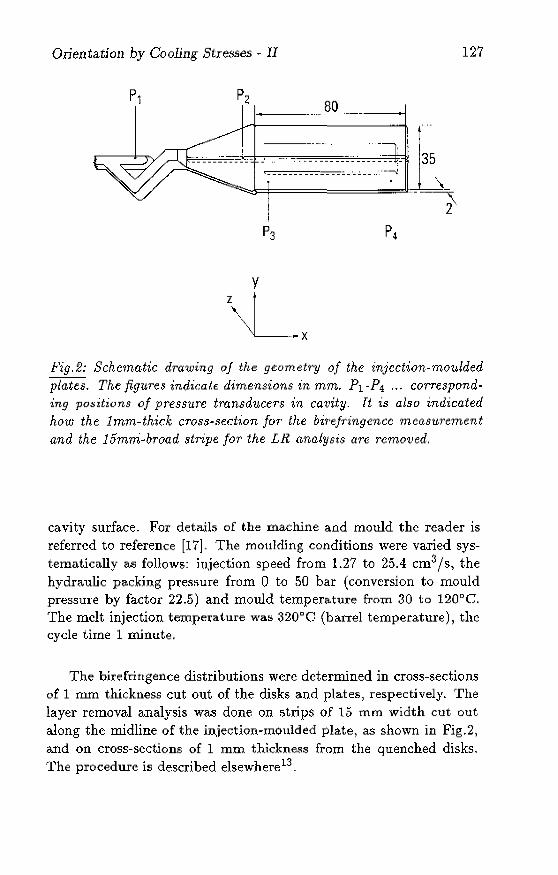
Orientation by Cooling Stresses ~ 11
80 .. ,.,
,------'-".'" • ",., r t .. ,""":'":' .... - - --- --'-::."~:.- --"~:- c-- 35
\-::_7.-_=-=_7. __ =-=_7. __ =-=-_______ '':' '':''''_ .:. __ .. .... I
~ ... -----.s, 2
y
\L.x
127
Fig.2: Schematic drawing of the geometr'Y of the injection-moulded plates. The figures indic;ate dimensions in mm. Pi -P4 ... corresponding positions of pressure transducers in cavity. [t is also indicated how the Imm-thick cro,~s-section JOT the bir-ejringencc measurement and the 15mm"broad stripe /01' the LR analysis arc removed.
cavity surface. For details of the machine and mould the reader is referred to reference [17]. The moulding conditions were varied systematically as follows: injection speed from 1.27 to 25.4 cm3/s, the hydraulic packing pressure from 0 to 50 bar (conversion to mould press me by factor 22.5) and mould temperature from 30 to 120"0. The melt injection temperature was 320 0 e (barrel temperature), the cycle time 1 minute.
The birefringence distributions were determined in cross-sectioJls of 1 nUll thickness cut out of the disks and plates, respectively. The layer removal analysis was done on strips of 15 rnm width cut out along the midline of the in,jection-rnolllded plate, as shown in Fig.2, and on cross-sections of 1 mm thickness fronl the quenched disks. The procedure is described elsewhere 13 _
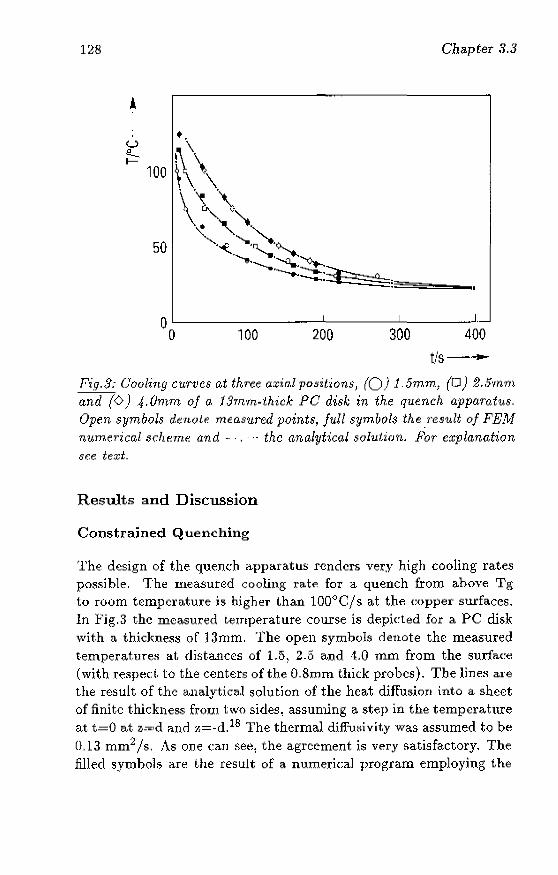
128 Chapter .1.3
100
50
o L-___ L-_~ _ _'____ ___ ____L_ ___ •. J
o 100 200 300 400
t/s---
Fig.S.- C:oohng curves at three a,r;ia.l positions, (0) l,5mm j (C1) 2./imm and (6) .4,Omm of G, 13mm-lhick PC disk in the ql1ench apparatus. Open symbols denote measured points, full symbols the .result of FEM numerical scheme and - " ..... the analytical solution. Por explanation
see text.
Results and Discussion
Constrained Quenching
The design of the quench apparatus renders very high cooling rates possible, The measured cooling rate for a quench from ahove Tg to room temperature is higher than 100°C/s at the copper surfaces. In Fig.3 the measured temperature course is depided for a PC disk with a thicknes8 of 13mm. The open symbols denote the measured temperature~ at. distances of 1.5, 2.5 and 1.0 mm from the surface (with respect to the centers of the O.8rom thick probes). The lines are the result of the ttnalytica.l solution of the heat diffusion into a sheet of finite thickness from two sides, assuming a steP in the temperature at t=O at z=;d and :-I=_d.18 The thermal diffuili vity was assumed to be (),13 mm2 /s. As one (:an see, the agreement is very satisfactory. The filled syroboh are the result of a numerical program employing the
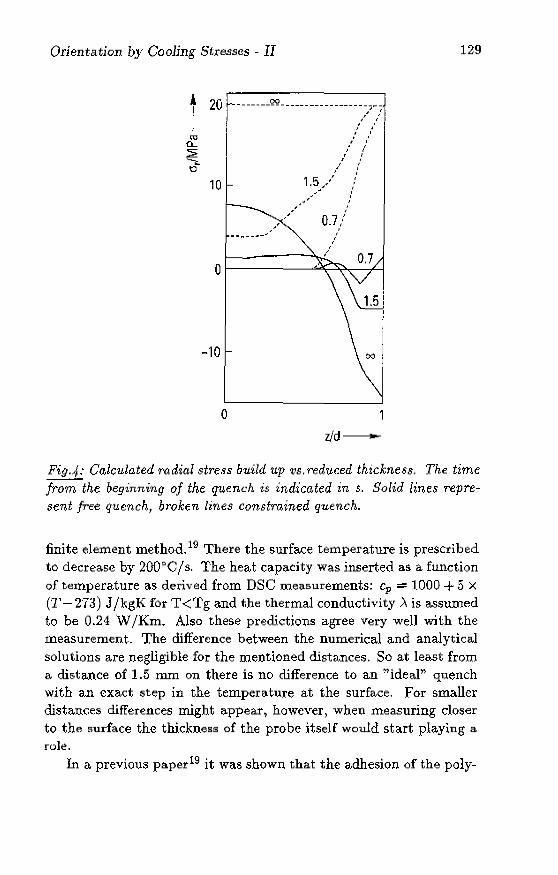
Orientation by Cooling Stresses - II
t 20 - ___ - __ '?2 ________________ _
I~"~""-
10
-" •• n __ ..... J'
-10
o
, , . , ,
, , , . , !
1.5,/ -,-//",
0.7
1
z/d-----
129
Fig.4: Calculated radial stre.~s build up vs.reduced thickness. The. time from the beginning of the quench is indicated in s. Solid lines re.pre.sent free quench, broken lines constrained quench.
finite element method. 19 There the surface temperature is prescribed to decrease by 200<)0/5. The heat capa.city was inserted a.s a function of temperature as derived from DSC measurements: cp ;;;;::: 1.000 + 5 X
(1'- 273) J /kgK for T<Tg and the thermal conductivity A is assumed to be 0.24 W /Km. Also these preclictions agree very well with the measurement. The difference between the numerical and analytical solutions are negligible for the mentioned distances. So at least from a distance of 1.5 mm on there is no difference to an "idear~ quench with an exact step in the temperature at the surface. For smaller distances differences might appear ~ however) when measuring closer to the surface the thickness of the probe itself would start plaYing a role.
In a previous paper19 it was shown that the adhesion of the poly-
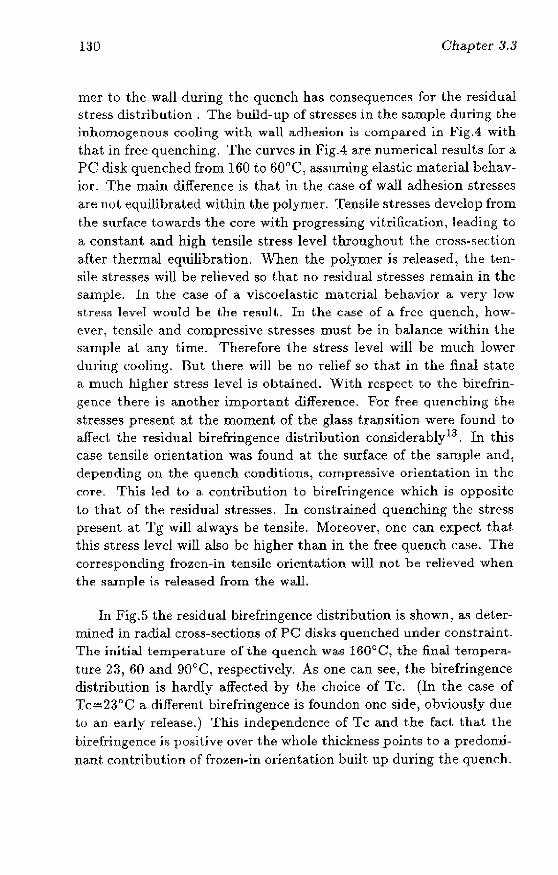
no Chapter 3.3
mer to the wall during the quench has cODsequenee5 for the residual stress dlstdbution . The build-up of stresses in the sample during the inhoffiogenous cooling with wall adhesion is compared in Fig.4 with that in free quenching. The curves in FigA an~ numerical results for a PC disk quenched from 160 to 600C, assuming elastic material behavior. The main djJferem~e is that in the case of wall adhesion stresses are not, equilibrated within the polymer. Tensile stresses develop from the surface t.owards the core with progressing vitriJicatj()l\) leading to a constant and high tensile stress level throughout the cross-section a,fter thermal equilibration. When the polymer is reh~ased) the tensile strellses will be relieved 50 that no residual stresses remain in the sample. In the case of a viscoelastic material behavior it very low st.re.ss level wOllld be the reslllt.. In the ca.se of a free quench) however) tensile and compressive stresses must be in balance within the sample at. any time. Therefore the stress level wHl be much lower during cooling. But there will be nO relief so that in the final state a much higher stress level is obtained. With respect to the birefringence there is another important difference. For free quenching the lltresses present at the moment of the gla.ss t.ransit.ion were found to afl'ed the residual birefringence distribution considerablyl3. In this case tensile orientation was found at the surface of the sample and) depending on the quench conditions) compressive orientation in the (~Ore. This led t.o a, contdbuhon t.o hirefringence which is opposite 1.0 thaI. of t.he residual stresses. In constrained quenching the stress present at Tg will always be tensile. Moreover) one can expect that this stress level will also be higher than in the free quelH:h case. The corresponding frozen-in tensile orientation will not be relieved when the sample is released [rom the wall.
In Fig. 5 the resid ual birefringence distri bu tion is shown, as determined in radial cross-sections of PC disks quenched under constraint. The initial temperature of the quench was 160°C, the final temperature 23, 60 and 90°0, respectively. As one can see, the hirefringence distribution is hardly affected by t.he choice of Tc. (In the case of Tc~23QC a different. birefringence is foundon one side) obviously due to an eady release.) This independence of Tc and the fact. that the birefringcm:e is positive over the whole thickness points to a predomjna.nt contribut.ion of frozen-in orientation built up during the quench.
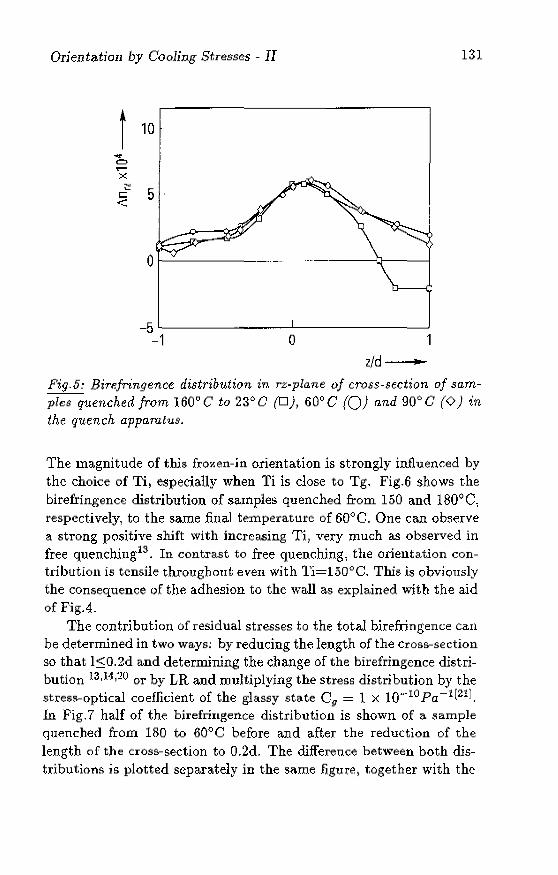
Orientation by Cooling Stresses - II
t 10 ..... 0, ..... x
Qf-------
_5L-____________ -L--__________ ~
-1 o z/d Jr
131
Fig.5: Birefringence distribution in rz-plane of cross-section of samples quenched from 1600 C to 23° C (0), 60° C (0) and 90° C (0) in the quenc.h apparatus.
The magnitude of tills frozen-in orientation is strongly influenced by the choice of Ti) especially when Ti is close to Tg. Fig.6 shows the birefringence distribution of samples quenched from 150 and 180<>C, respectively, to the same finaJ temperature of 60°C. One can observe a strong positive shift with increasing Ti, very much as observed in free quenchillg13 . In contrast to free quenching, the orientation contribution is tensile throughout even with 'l'i=150°C. This is ObvjQ1lsly the consequence of the adhesion to the wall as explained with the aid of FigA.
The contribution of residual stresses to the total birefringence can be determined in two ways: by reducing the length of the cross-section so that l50.2d and determining t.he change of the birefringence distribution l3,l<:I,20 or by LR and multiplying the stress distribution by the stress-optical coefficient of the glassy state C g = 1 x 10·,,·10 Pa-1[21j.
In Fig.7 half of the birefringence distribution is shown of a sample guenched from 180 to 60°C before and after the reduction of the length of the cross-section to O.2d. The difference between both distributions is plotted separately in the same figure, together with the
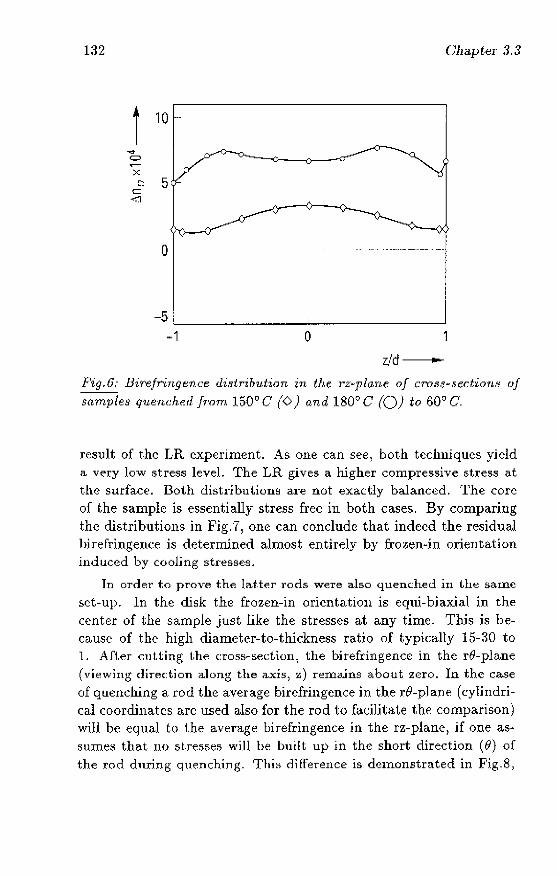
132 Chapter .1.3
t 10 ...
..".
0 ~
X [-.! 5
c <I
o
-5L-____________ ~ __ --------~ -1 o
z/d ... Pig.v: Birefringence disirib1Ltion in the r;:~pl(J.ne of cro.~.h~ection8 of
samples q?Lenched JmTn 1500 C (0) and 1800 C (0) to 600 C.
result of the LR experiment. As one can see, both techniques yield a very low stress level. The LR gives a higher compressive stress a.t the surface. Both distributions are not exactly balanced. The core of the sample is essentially stress free in both cases. By comparing the distributions in Fig.7, one can conclude that indeed the residual birefringence is determined almost entirely by frQzen~in orientation induced by cooling stresses.
In order to prove the latter rods were also quenched in the same set-up. In the disk the frozen-in orientation is equi-biaxial in the center of the sample just like the stresses at any time. This is be~ cause of the high diameter-to-thickness ratio of (-.ypically 15-30 to 1. Af1.er cutting the cross~section, the bil"efringence in the re-plane (viewing direction along the axis, z) remains about zero. In the case of q uench.ing a wd the average birefringence in the rO~plane (cylindrical coordinates arc used also for the rod to facilitate the comparison) will be equal tn the a.vera.ge birefringence in the rz-planc, if one as~ sumes tha.t no st.re5::>es wiH be built up in the short direction (0) of t.he rod during quenching. This difference is demonstrated in Fig.8,
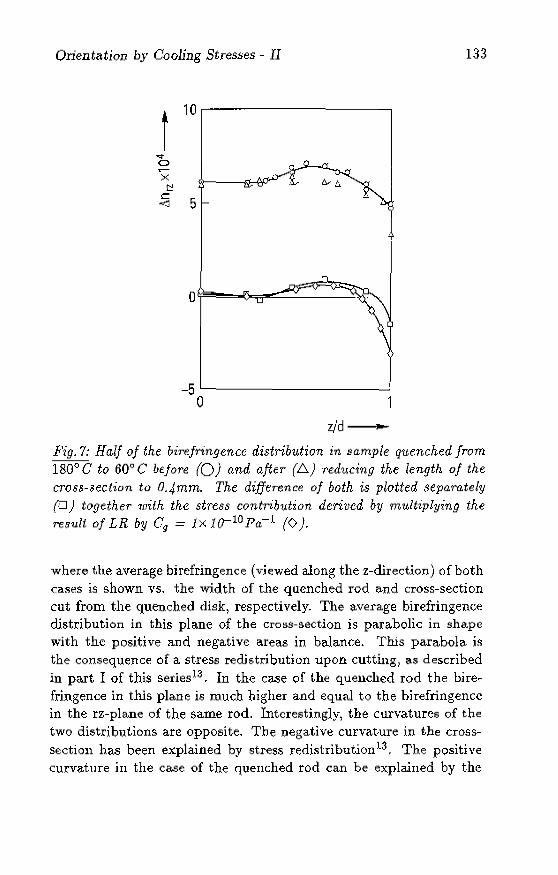
Orientation by Cooling Stresses - II 133
t 10~--~----------~
-5~----------------~ o
z/d • Pig. 7: Half of the birefringence distribution in sample quenched from
180°C to 60°C before (0) and after (1::,.) reducing the length of the
cross-section to O.4mm. The diffeT'fmce of both is plotted separately
(D) together with the stress contribution derived by multiplying the result of LR by Cg = Jx 10- 10 Pa- 1 (0).
where the average birefringence (viewed along the z-diredion) of both caseS is shown vs. the width of the quenched rod and cross-section cut from the quenched disk, respectively. The average birefringence distribution in this plane of the cross-section is parabolic in shape with the positive and negative areas in balance. This para.bola is the consequence of a stress redistribution upon cutting) as described in part I of this series l3 . In the case of the quenched rod the birefringence in tills plane is much higher and equal to the birefringence in the rz-plane of the same rod. Interestingly, the curvatures of the two distributions are opposite. The negative curvature in the CrOSSsection has been explained by stress redistribution 13. The positive curvatllre in the case of the quenched rod can be explained by the
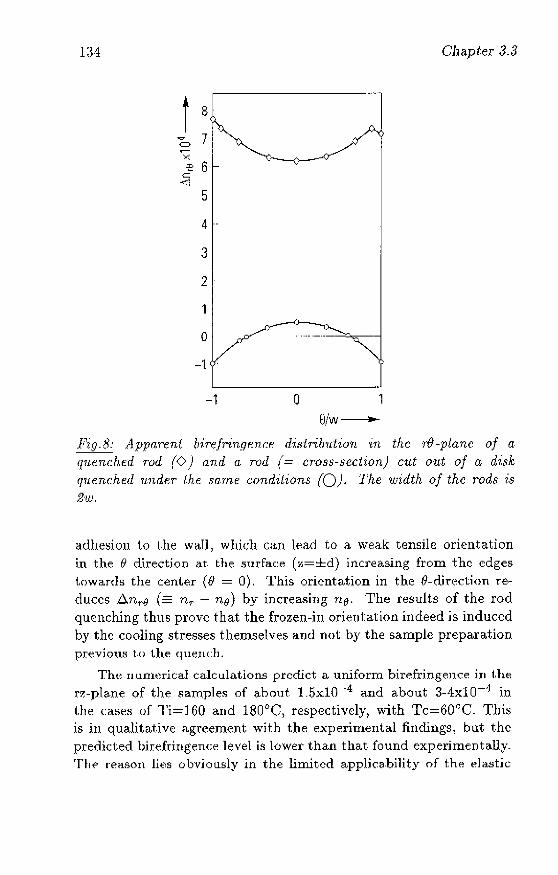
U4
t """ = ~
x ~
c; -<':'I
8
7
6
5
4
3
2·
o
-1
-1
Cllapter 3-3
o 8/w----
Pig-8: Appa:rent li1:refringf:nCf~ (hslr'ib'lltio1t 'in the d}-pLane of a q1J,~nchf::d TOri (0) and (1. md (= cr·oss-section) cut out of a disk (pu~T1.ch~d 1J,ndf'-r the. sarn~ conditions (0). The width of the rods is 2w.
adhesion to Lhe wall, which ca.n lead to a weak tensile orientation in the (I ciirectioD at the 51lrfa~:e (z=±d) increasing from the edges t.owards the center (0 = 0). This orientation in the e-din~dioTl re
duces .6.701'9 (= 701' - no) by increa:o;ing no. The results of the rod quenching thus prove that the frozen-in orienta.tion indeed is induced by the cooling stresses themselves and J)ot by the sample preparation pr.evious t.o t.he quench.
The IIumerical calculations predict a. uniform birefringence in t.he fr,-pla.ne of the samples of about L5xlO-4 and about 3-4xlO-4 in t.h e caHeS of '1'i=] 60 and 180DC~ respectivcly~ with Tc=60 Q C- Thi~
is in qua..litatiV(: agreement with the experimental findings, but the predicted birefringen<;e level is lower than that found experimentallyThe reason lit1S obvjously in the limited applica.bility of the elastic
Orientation by Cooling Stresses - II 135
com;titlltive model employed. Before release a. tensile stress level of more than 20MPa. is predicted. This comes quite close to the yield stress. Because of the viscoelastic nature of the polymer, it is not very probable that such high stresses will be reached at alL In part 113
differences between the predic;ted and found orientation contribution to birefringence were ascribed to stress relaxation accompanied by the build~up of orientation. Because of the high stress level before release, this effect is expected to be more important in constrained quenching and is the reason for the underpredictioIl of the birefringence by the calculations.
Injection moulding
From the experiments of constrained quenching we have learned that in the case of adhesion of the polymer to the wall only very low levels of residual stresses can be expected. In injection moulding t.he melt temperatures are much higher than those applied in the quench experiments. In general a compression stage follows the filling stage of the injection~moulding cycle in which the material is pressed against the mould walls and shrinkage is opposed. :For both reasons wall adhesion can be expected during the major part of the moulding cycle. However, during the compression stage, when the polymer vitrifies from the wall towards the core, the pressure level changes rather quickly. Consequently, consecutive layers vitrify under different formation pressures. Because of the wall adhesion the surface layers will not. be compressed according to the hydrosta.tic pressure in the cote, since the wall wHl take up the compressive stress components parallel to the wall. Only the normal stress in the z-diredion will be equal to the pressure in the molten core. This means that, when the pressure decays, la.yers which vitrified in the meantime will try to expand more than those vitrified earlier and under lower pressure. This expansion will be opposed by the top layers leading to residual stresses which are compressive in those layers which vitrify at the highest pressure2,1.5,16. In the absence of wall adhesion, pressure variations during the vitrification would not lead to residual stresses as long as a quasi-equilibrium pvT-behaviour is assumed. The eff'ed of the formation pressure on the final "frozen-in" density22 is regarded as a second order effect as far as residual stresse~ are concerned.
136 Chapter 3.3
When the pressure drops to zero and the thermal shrinkage is not yet completed this wm inevitably lead to a release from the wall. However, this l"elease will also change the thermal boundary conditions in an unpredictable way. A nyway, the cooling rate will drop considerably. Consequently, the still hot core will even heat up the surface layers aga.in. In paricuiar, such a "complete)) release can be expected near edges where the shrinkage cannot be compensated locally by mould elasticity because of a 3-climensional cooling.
To put it simply: with wall adhesion one can expect very low thermally induced but signHicant pressurE: induced residual streSf;eflj without. adhesion OIle will have no effective quenr:h. nut there is also the possibHity of an intermediate condition, where one bas a positive pressure, that means good thermal contact but bad adhesion on a lubricated surface. In that calle the polymer can slip along t.he mould surface and one would have conditions comparable to the free quench. 'J'his slippage could also be coupled to a maximum "yield" stress ab()Ve whit;h adhesion is lost and friction occurs.
In order to investigate the thermally induced residual stresses and orientation in injection-moulded PC, experiments were carried out with a flat plate gemuetry, as shown in Fig.2. The rr)oulding cond.itions were r:hosen such that the flow-induced orientation will be a minimum. With a high injection speed and no separate packing sta.ge, the part. of the specimen which solidifies under shear stresses in general can be confined to a thin surface layer. In Fig.9 the pressure recorded by the 4 transdU(:ers in the mould is shown for the case of it high inject.iull flpeed of 25.4 em:! /s (~ 36crn/s flow front speed) and a mould temperature of 60"C. No separate packing pressure was applied, but t.he changeover from the filling to t.he packing stage was chosen such that it presflure peak occured J as ca,n be seen in Fig.G. This assures a. (:{Hnplete filling of the cavity. One can see that only during the filling stage (left of the peak) is there a pressure gradient. in the fluw direction. After the completion of the filling a,U pressure curves lie on top of each other, so that no shear stres~es will be present within the polymer. The birefringence distrilnltion in the sample 0 bta.ined under these conditions is shown in Fig.l0 for a distance from the gate equal to that of transducer P3' The maximum at tho surface is due to the elonga.tj~H1 of the melt at the flow front23 ,24 .
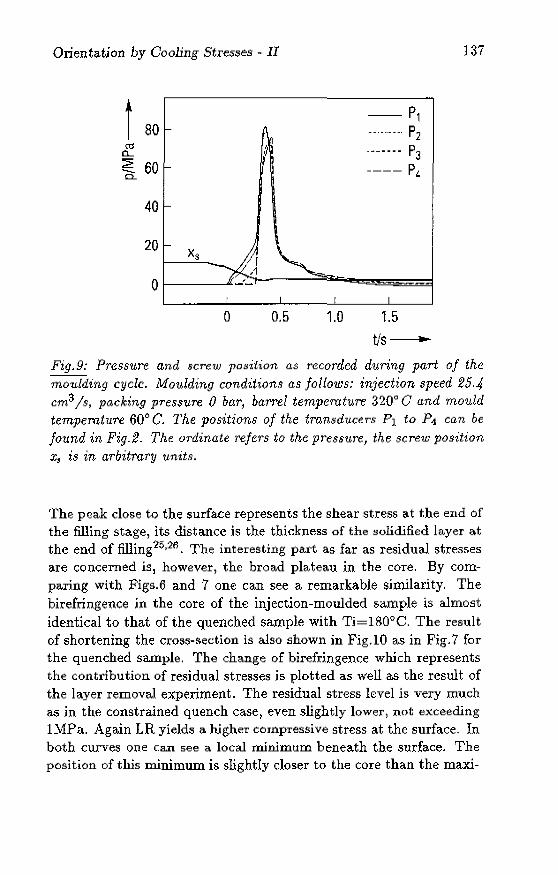
Orientation by Cooling Stresses ~ II J37
t 80 1 (tl
~ n... ~ 60 I - J 0..
--P, , .......... P2 -." •... P3 ---- P4
40 -
20 Xg
0
o 0.5 1.0 1.5
tis ...
Fig. 9: Pressure and screw pos1twn as recorded during part of the
moulding cycle. Moulding condition.9 as follows: injection speed 25·4 em3/s, packing pressure 0 bar, barrel temperature 320<:> C and mould tempemt1L1'e 60° G. The positions of the transduce.l'.~ PI to P1 can be found in Fig-2. The ordinate refers to the pressure, the screw position
Xs is in aTbitra1'Y units.
The peak close to the surface represents the shear stress at the end of the flliing stage, its distance is the thickness of the solidified layer at the end of ffiling25 ,26. The interesting part as far as residual stresses are concerned is, however, the broad plateau in the cOre. By comparing with Figs.6 and 7 one can see a remarkable sintilarity. The birefringence in the core of the injection-moulded sa.mple is almost identical to that of the quenched sample with Ti=180°C. The result of shortening the cro55-section is also shown in Fig.lO as in Fig.7 for the quenched sample. The change of birefringence which represents the contribution of residual stresse5 is plotted as well as the result of the layer removal experiment. The residual stress level is very much as in the constrained quench case, even slightly lower, not exceeding IMPa. Again LR yields a higher compressive stress at the surface. In both curves one can see a local minimum beneath the surface. The position of this minimum is slightly closer to the COre than the maxi-
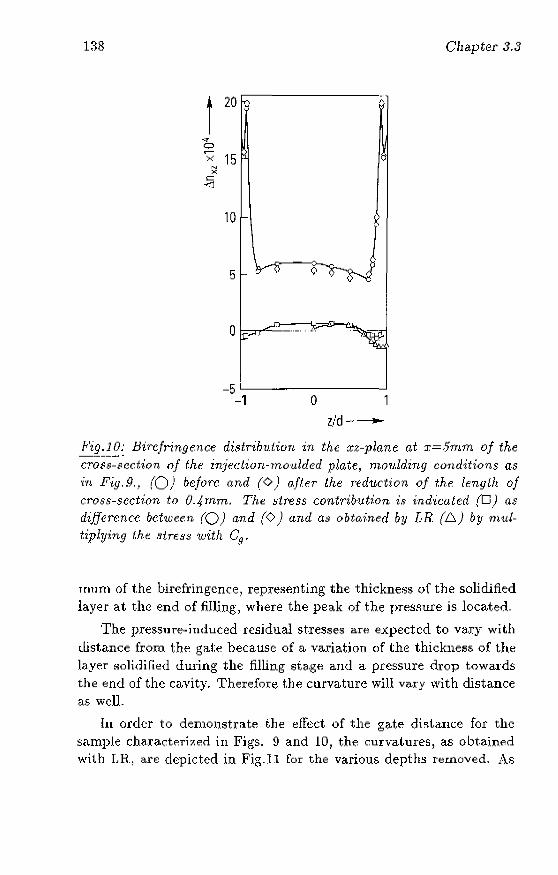
138 Chapter 3.3
t 20
~T
0 ~
Yo' 15 N
" c -<:1
10
_5L-______ L-____ ~
-1 o z/d-·--
Fi:2:..!!!.:: Birefringence di$trilmtion 'in the xz-plane at x=5rnm of the cross-section oj the injf.·dion-moalded plate, m.Q?J.lding conditions as 'in Fig .. CJ., (0) before and (0) aIler lhe 7,eduction oj the lenglh of cross-section to O·4mm.. The stress contribution is ind'icuted (0) as difference between (0) and (0) and as obtained by LR (.6.) by nwttipllling the. stress 'with °9 ,
Hlum of t.he birefringence) representing the thickness of the solidified layer at the end of filling, where the peak of the pn~Sfmre is located.
The pressure-iuduced residual stresses are expected to va.ry with d.istance from the gate because of a variabon of the thickness of the b.yer solidiJied dming the filling sta.ge and a. pressure drop t.owa.rds the end of the cavity. Therefore the curvature will vary with distance as well.
In order to demon5tn~.te the effect of the gate di~tallce for the sample chara.ct.eriJlea in Figs. 9 and 10) the curvatures) as obtained wit.h LH., are depicted in Fig.]l [01" the various depths removed. As
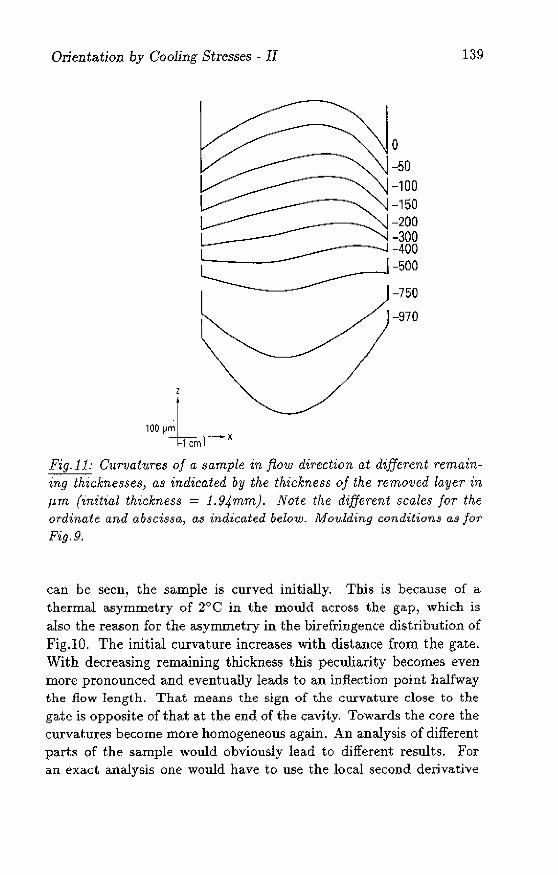
Orientation by Cooling Stresses - II
z
100~) ihcml--x
---~
o -50 -100 -150 -200 -300 -400 -500
-750
-970
139
Fig-i!: CUTvatuTe:J of a .. ~ample 'in flow direction at different remaining thicknesses, (LS indicated by the thickness of the removed layer in f.LTn (initial thickness = 1. 94mm). Note the different scales for the ordinate and abscissa, a:J indicated below- M01).lding conditions as for Fig.9.
can be seen, the sample is curved initially. This is beca.use of a thermal asymmetry of 2°e in the mould across the gap, which is also the reason for the asymmetry in the birefringence distribution of Fig.lO. The initial curvature increases with distance from. the gate. With decreasing remaining thickness this peculiarity becomes even more pronounced and eventually leads to an inflection point halfway the flow length. That means the sign of the curvature close to the gate is opposite of that at the end of the cavity. Towards the core the curvatures become mOre homogeneous again. An analysis of different parts of the sample would obviously lead to different results. For an exact analysis one would have to use the local second derivative
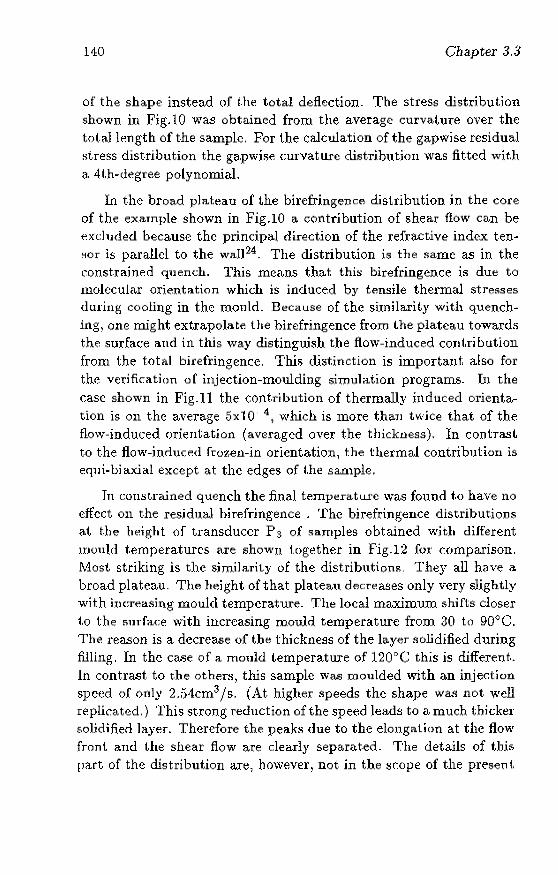
140 Chapter 3.3
of the shape instead of t.he total deflection- The stress distribution shown in Fig.10 was obtained from the average curvature over the tota.llength of the sample. For the calculation of the gapwise residual stress distribution the ga.pwise cmvaturc distribution was fitted wit.h <~. 4th-degree polynomial.
Ll the broad plateau of the birefringence distribution in the core of the example shown in Fig.lO a contribution of shear flow can be excluded because the principal direction of the refractive index ten~Or is parallel to the waJl24 _ The distribution is the same as in the const.rained quench. This means t.hat this birefringence is due to molecular orjentat.ion which is induced by tensile thermal stresses during cooling in the monld. Because of the similarity with quenching, one might extrapolate the birefringence from the plateau toward5 the surfa.n:~ and in this way distingwsh the flow-induced contribution from the total birefringence. This di~tinction is important also for t.he verification of injection-moulding simulation programs_ In the case shown in Fig.l1 the contd bution of thermally induced orientation is on the average 5xlO·4} which is more than twice that of t.he flow-induced ()J:j~ntation (averaged over the thickness). In contrast to the flow-induc:ed frozen-in orientation, the thermal contribution is equi-biaxial except at the edges of t.he sample.
Tn con1lLrained quench the final temperature was found to have no effect on the residual hirefringence . The birefringence distributions <It the height of tl"ansduccr Ps of samples obtained with different mould temperatures are shown together in Fig.12 for comparison. Most striking is the similarity of the distributions_ They all have a broad plateau_ The height of that plateau decreases only very slightly with increasing mould temperature_ The local maximum shifts closer to the surfa.ce with increasing mould temperature from 30 to 90°C. The reason is a decrease of the thickness of the layer solidified during filling. In the case of a mould temperature of 120"C this is different. In contrast. to the ot.hers} this sample was moulded with an injection speed of only 2.54cm3/s. (At. higher speeds the shape was not well replicated.) This strong reduction of the speed leads to a much thickelsolidHied layer. Therefore the peaks due to the elongat.ion at the flow froni and the shear flow are dearly separated. The details of t.hjs pa.rt of the distribution are, however, not in the ~cope of the present
Orientation by Cooling Stresses - IT 141
30 60 90 120
10
5 r-~ - ) .~ V- '" V
I I I I
o o o o z/d ...
Pig.i2; Birefr-ingence distribution in the xz-plane at x=5mm of cro,~ssections of samples obtained with different mould temperatures, as indicated in the graphs. Other machine parameters as in Pig.9, except injection speed fo7' the case of 120<> C mould temperature which was only 2.54 cm3/s.
investigation of residual stresses. The results of the gapwise LR analyses are depicted in Fig.13
for the same samples. The lower half of the figure shows the measured changes of curvature vs. the remaining thickness. The lines are the interconnections between the points obtained by fitting the experimental values with a 4th-degree polynomial) which is the basis of the stress calculations. One can see that the c;urvatures are positive a.nd increase with decreasing mould temperature. The cor" responding stress distributions are shown in the upper half of Fig.13. The stress levels are considerably low. They increase with decreasing mould temperature Tm. For Tm=30°C there is a compressive stress maximum beneath the surface. For Tm=60°C there is a similar compressive stress maximum even doser to the surface. In the case of TITI=906 C the compressive stress maximum ha5 moved into the surface. Since this local compressive maximum is attributed to the pressure peak at the end of filling, this shift of the position with increasing mould temperature is explained by a decrease of the thickness of the solidified layer at that stage of the moulding cycle. The
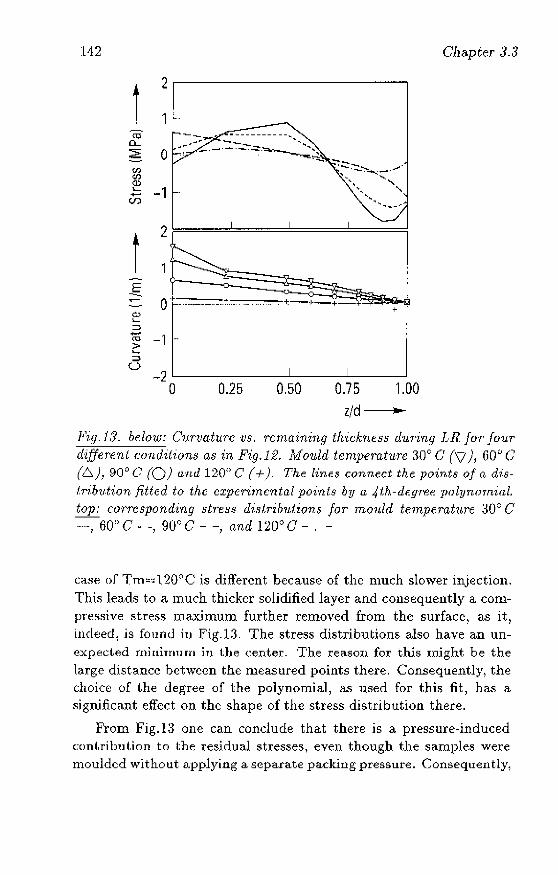
142
1
t E -<D ':::>
2~--------------------~~
1 _. -- , o ~~<-.-.':.~--:-~.~::~
......... - ...
2~==~================~
0··==--··_······_ .. ··:': .. - ....... _ ... +:-+-+--+-+
~ -1 ... L.,.
::I U
_2L-----~-----L----~----~
o 0.25 0.50 0.75 1.00 z/d ...
Chapter 3-3
Fiy.1.1_ bdow: Curvature vs. remaining th·ickness d'urinq LR Jor JO?lr
different conditions as in Fig.i2. Mould ternpemtU7'e 30° C tv), (l0° (7
(6), 90° C (0) and 120" C (+), The. line.s connect the points of a distribv-tion fitted to the experimental points by a 4lh-dt;YT'flf:: polynom.ial. top: corresponding !it·tess distrilmtions fOT monld temperatnre ::10° C ..... _, 60"C" -,90°C - -, and 120°C - . -
Case of Trn,,',,120°C is different because of the much slower injection. Th.i~ lea.ds to a much thicker solid.ified layer and consequently a compressive stress ll1a..ximum further removed from the surface, as it, indeed, is found iI) Fig.13- The stress distributions also have an unexpected miniullIHI in the (:enter. The reason for this might be the large distance between the measured points there. Consequently, the choice of the Jegree of the polynomial; a.s used for this fit, has a significant effect on the shape of the stress distribution there.
From Fig.!:) one can conclude that there is a pressure-induced cont.ribution to I;h~ residual stresses, even though t.he samples were moulded without applying a separate packing pressure. Consequently,
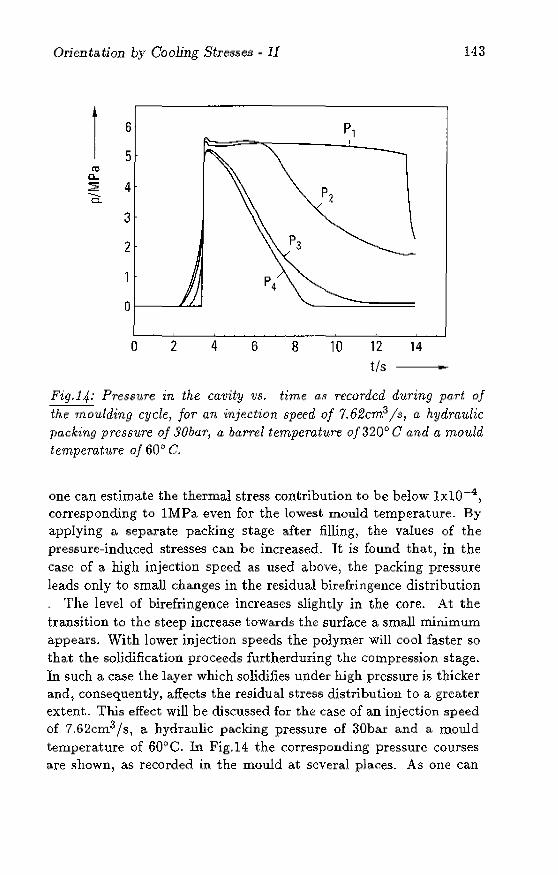
Orientation by Cooling Stresses. 11
1 6
5
3
2
o 1-------'"--'-'
o 2 4 6
143
P,
8 10 12 14
tis ...
Fig.14: Pressure in the cavity VB. time as Tf:corded during part of
the moulding cycle, for an 'injection speed of 1. 62cm.3 /9, a hydraulic packing pressure of JObur, a barrel temperature of 320 0 C and a mould temperature ()j 60 0 C.
one can estimate the thermal stress contribution to be below lxlO-4 )
corresponding to lMPa even for the lowest mould temperature. By applying a separate packing stage after filling) the values of the pressure-induced stresses can be increased. It is found that) in the case of a high injection speed as used above) the packing pressure leads only to small changes in the residual birefringence distribution . The level of birefringence increases slightly in the core. At the transition to the steep increa.se towards the surface a small minimum appears. With lower injection speeds the polymer will cool faster so that the solidification proceeds furtherduring the compression stage. In such a case the layer which solidifies under h.igh pressure i:;;; thicker and} consequently, affects the residual stress distribution to a greater extent.. This effect will be discussed for the case of an injection speed of 7.62cm3/s, a. hydraulic packing pressure of 30bar and a mould temperature of 60(>0. In Fig.14 the corresponding pressure cour:;;;es are shown} as recorded in the mould at several places. As one can
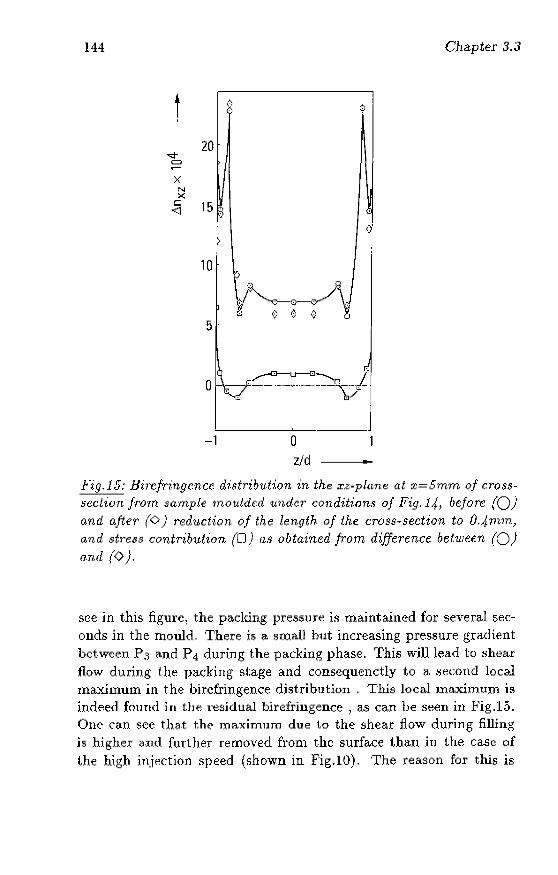
144
1 X
N :.<
20
t:: 15. <1
10
o
-1
0-0-0
o 0 0
o z/d -
Chapter .1.3
Fig.15: Birefringence distribntion in the xz-plane at x=5mm of crO$$section from sample moulded under condition.~ of Fig. 14, before (0) and after (0) reduction of the length of the cross· section to O.4mm, and stress contribution (0) (l,9 obtained from difference behlleen (0) and (0).
see jn this figure, the packing preS5ure is maintained for severa,I seconds in the mould. There is a. small but jncreasing pressure gradient between Ps and P 4 during the packing phase. This will I~ad to shear flow during the p;v:kiug stage and consequenctly to ~, 5econd local maximum in the birefringence distribution . This local maximum is ind~ed found in the residual bjrefringence , as can he Seen in Fig.15. One can see tha,t the maximum due to the shear flow during filling is higher a.nd further removed from the surface than .in the case of t.he high injection speed (shown in Fig.lO), The reason for this is
Orientation by Cooling Stresses· II 145
a lower melt tempera.ture because of the reduced convection. The level of birefringence in the core is also higher in this case because of the pac:::king pressure effect. The contribution of residual stresses is determined in the same way as before by reducing the length of the cross-section to OAmm. The change of the birefringence distribution upon this sectioning is a.lso shown in Fig.15. The stress contribution shows a positive pla.tea.u in the core, a local negative maximum at a distance couesponding to the nlinimum in the birefringence and a maximum at the surface. This means that there are tensile stresses at the surface. This residual stress distribution is in qualitative a.greement with that predicted by Baajjens16 for PC, assuming slightly different moulding conditions.
Tensile stresses at the surface are not desirable as this can lead for instance to a. reduced resistance against environmental stress cracking. Based on the reslllts ofthis analysis, one can expect to get tensile stresses at the surface even under "standard" moulding conditions. It has been shown that, because of the wall adhesion, a low thermal stress level is obtained in general. This makes the pressure-induced residual stresses more important. In injection moulcling the first layer will solidify during filling at a comparably low pressure level. Then the material is compressed and a maximum pressure is achieved wIDeh relaxes ra.ther quickly during the progress of the vitrification. The residual stresses will be compressive in the layers which vitrify at the highest pressure and tensile in those vitrified under the lowest presSure. The pressure-induced tesidual stresses will therefore usually be tensile at the surface. Only when there is a compa.rable compressive thermal stress t.here can the total stress level be kept negative. It is therefore impor-tant to keep the pressure~induced residual stresses as low a.s possible. This can be achieved by using high injection speeds, low packing presSures and relatively high mould temperatures.
Conclusions
With the aid of a specially designed quench apparatus very rugh cooling rates are achieved. The measured cooling rates in the polymer sample agree very well with the predictions of the analytical solution for a.n ideal quench.
The birefringence in PC samples quenched under constraint is
146 Chapter 3.3
positive and almost constant through the thickness in all cases. The level of this birefringence is not affected by the choice of the quench temperature, but very tlensitl ve to the initial temperature between lSO and 180°(;.
By reducing the lateral dimensions of the cross-section to 20% of its height) the orientation and st.ress contribution to the birefringence CMl be distinguished. In t.his way and also by layer removal a very low stress level is established for the constrained-quenched samples. The birefringence is mainly determined by a constant tensile orienta" tion wbidl is equi.biaxial, parallel to the disk surface. Both the low stress level as well as the high orientation a.re t.he consequence of the adhesion of the polymer to the wall d1uing quench.ing.
In Ilat platesinjedion moulded at high injection speed and without a separate packing stage the birefringence displays a broad plateau in the core very much as in the quenched samples. This plateau is hardly affected by the choice of the mould temperature. The residual stress level is in the order of I MPa for low mould temperatures, being tensile in the core and compressive beneath the surface. It decreases with increasing mould temperature.
As in the quenched samples there is a tensile equi-biaxial molecUlal" orientation induced by thermal stresses present. dming vitrification. In th~ cas~ of high injection speeds tills orientation is higher than the average orientation induced by the flow-induced stresses, sillce the latter is confined to a. thin layer beneath the surface.
By applying a packing pressure a. local compressive stress Inaxi~ mum is created at a distance from the surface, which correspond1:l to the thickness of the solidified layer at the moment of compression at the end of filling. Because of the low thermal stress level this pressure contri bu tion can become predominant. In this way highly undesirable tensile stresses arc induced at the surface. Tlus effect will be stronger with lower injection speed and higher packing pressure.
Acknowledgement
The a.uthors are. very grateful to Ir.D.Samoy and W.de Natris from the Philips PMF-CCP for their help with the injection-moulding ex" peri men ts and H. va.n VIer ken for the careful preparation of the Crosssections.
Orientation by Cooling Stresses - II 147
References
L Spencer,R-S'j Gilmore)G.D.) Modern Plastics (1959) 97
2. Wiegand,H., Vetter,H., Kunststoffe) 56 (1966) 761
3. Wiegand,H., Vetter,H., Kunststofi'e) 57 (1967) 276
4. Wiibken,G-, Plastvera.rb~iter, 26 (1975) 17
5. Siegmann,A.) Buchman,A., Kemg,S., Polym.Eng,Sci., 22 (1982) 560
6. Treuting,R.G., Read,W.T., J.Appl.Phys., 22 (1951) 130
7. White,J.R., PolYIIl.Test., 4 (1984) 165
8. Wales,J.L.S., van Leeuwen,J.) van det Vijgh)R., Polym.Eng.Sci., 12 (1972) 358
9. Fleifinel',M.) Kunststoffe, 63 (1973) 636
10. Kamai,M.R., Tan,V., Polym.Eng.Sci., 19 558
11. Isayev,A.I., Polym.Eng.Sci., 23 (1983) 271
12. Struik,L.C.E., Polym.Eng.Sci., 18 (1978) 799
13. Wimberger-Fricdl,lt., de Bruin,J .G., to be submitted to J .Polym.Sci.B Polym.Phys., (Chapter 3_2)
14. Saffell,J.R., Windle,A.H., J.Appl.Polym.Sci., 25 (1980) 1117
15. Titomaulio,G. DrucatoN., Kamal,M.R.) Intern.Polym-Proc- 1 (1987) 55
16. Baaijens,F.P.T., R.heol.Acta, 30 (1991) 284
17. Flaman,A.A.M., "Build-up and Relaxation of Molecular Orientation in Injection Moulding", Thesis (1990) Eindhoven
18. Carslaw,H.s., Jaeger,T.C., "Conduction of Heat in Solids", Claren~ don Press (1959) Oxford
148 Chapter 3.3
19. Wimberger-Fricdl,R., Hcndriks,R.D.H.M., Polymer, 30 (1989) 1143 (Chapter 3-1)
20. Mil1s,N.J., J-Mater.8ci. 17 (1982) 558
21. Wimberger-Fricdl,R., de Bruin,J .G., to appear in Rhcol.Acta 30 (1991) (Chapter 2.2)
22_ Greener,l., Polym.Eng.Sci., 26 (1986) 534
23. Tadmor,Z., J.AppLPolyrn.Sci., 18 (1974) 1753
24. Wimberger-Friedl,R.., Polyrn.Eng.5ci., 30 (1990) 8U(Part 5)
25_ Janeschitz-Kricgl,H., Rheol.Acta, 16 (1977) 327, 18 (1979) 693
26_ 15ayev,A-I_, Hieber,C.A., Rhcol.Acta, 19 (1980) 168
Part 4
Density Distributions in Amorphous Polymers
149
Chapter 4.1
Measurement of the Density Distributions
in Quenched Polycarbonate Specimens by
a Quantitative Schlieren-optical Technique1
ABSTRACT: A neW technique for the determination of spatial density distributions is described. The density is derived from the refractive index gradient as determined with a quantitative Schlieren-optical technique. The advantages of this technique are a high spatial resolution and sensitivity. Gapwise profiles can be measured without slicing the sample so that more reliable data are obtained quickly. This is demonstrated for the gapwise density distributions in quenched polycarbonate spedmens. It is shown that the density distribution is determined by a competition between the local cooling rate variation and the cooling stress distribution. The residual density is predominantly determined by the coolant temperature. The density in the core is higher than a.t the surface for high coolant temperatnres) wherea.s [or low coolant temperatures the density in the COre is lower than at the surface. The observed effects are explained semiquantitatively by a simple model using calculated cooling stresses a.nd cool" ing rates.
lRcprintc=d from: R..Wirnbetger-Friedl, G.Prast, A.V.Kurstjens and J.G.deBruin, to appear in J.Polyrner Sd.-B rolyzn.Phys., 30 (1992)
151
152 Chapter 4.1
Introduction
It is well known that the gla-ssy state of polymers is not a thermodynamic equilibrium state1-. 3 . That means that the properties a.re path dependent. One of the relevant thermodynamic properties is the density. It was shown tha.t the density at a certain temperature and time is det.ermined not only by the cooling rate and the pressure present during solidification1
- 8) but also by the tempel'a.~ ture and deformation history below the glass transition temperature, T g9. The density changes while the system is relaxing towards an equilibrium distribution ()f free volume. Despite the importance of that phenomenon for the prediction of dimensional stability of plastic products, only few measurements of density distributions have been published and current processing simulat.ion programs still make use of quasi-equilibrium pvT-relationships, i.e. the Tait equationlO,l1, which cannot account for time"dependent volumetric effects, One bottleneck in the attempt to improve that situation is the limited experimental accessibility of the density distributions. The standard technique involves ~dicing the sample and determining the average density of the individual slices in a. density gradient column 12--15.
Apart from the tjme~consuI1ling sample prepara.t.ion this has the disadva.ntage oflirnited resolution (the slice thickuess), stress relief and/or introduction during nllcrotoming and finally the slow sa.turation of some polymers with the water of the column, which can lead to mis~ iuttlrJ)retations. In this contribution a new technique for the detennination of' denRity distributions is introduced. The tcchnique is based on (I. quantitative Schlicren-optica18et~up16,17) which will be disCllssed briefly. As an illustration of the possibilities of the new technique) gapwise density distributions in quenched disks of polycarbonate will be shown and the in fluence of the quenching (;onditions will be demonstrat.ed.
Theoretical background
For the application of a.n optical technique for the determination of density distributions first of aU a relation between the refractive index and density is needed, This relation is supplied by the Lore.ntz-Lorenz
Density Distribution in Quenched PC by Schlieren-optics 153
equation;
(1)
There n is the average refractive index, N A is Avogadro's constant, EO
the dielectric constant of vacuum, M is the molecular weight, a is the molecular polarizability and p is the density of the meru1.Ul1. Since we are interested hi a density distribution, we need to determine the gradient of the density with respect to a certain direction, z. By extending
op dp Em oz dn 8z
(2)
we introduce the refractive index gradient, which is the property that is determined by the Schlieren technique as will be described below. The derivative of the density with respect to the refractive index could most easily be detennined from the Lonmtz-Lorenz equation if the polarizability was assumed to be constant. The validity of that approach was investiga.ted in the past for inorganic glasses and crystals by Muellet18 , Waxler and Weir19 and Havinga and Bosman20 .
It was found that in general the polarizability is a function of density, and the behaviour varies considerably for different materials. In order to account for that effect Mueller introduced the strain polarizability parameter Ao:
[dn] _ (1 _ A ) [on] dp e!1;p - 0 op [,-f,'
(3)
where L-L denotes the Lorentz-Lorenz equation and exp means ex· perimentaJJy dtermined. By GOIubiniIl.g with eq.2 tIlls yields;
(4)
With the aid of equation (4), the local density gradient is determined from the refractive index gradient.
The Schlieren-optical set-up
The quantita.tive Schlieren measurement was described by Prast17 .
Here only a short description of the experimental set-up and principle will be given. A schematic drawing of the transmissive set-up is
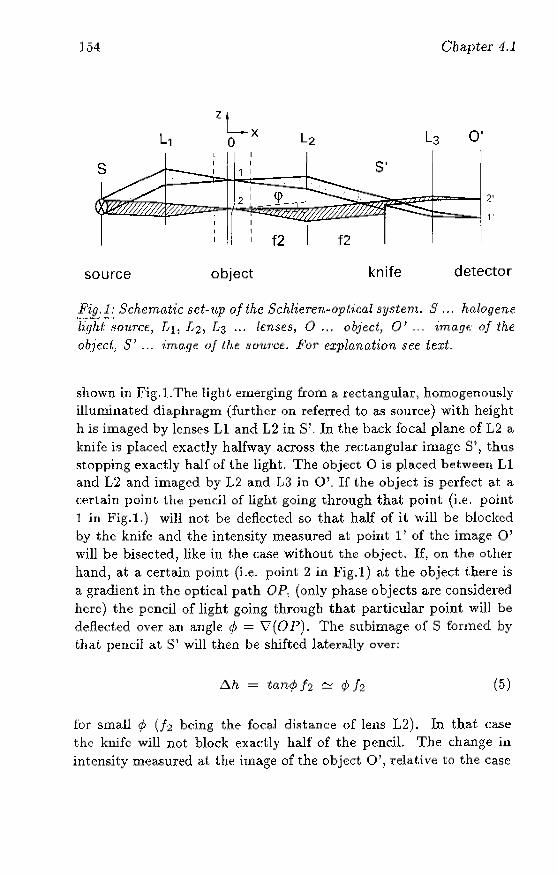
1.54 Ohapter 4.1
L1 ZL
o X L2 L3 0'
1 I S'
2 2'
l'
f2 f2
source object knife detector
Fig.1: Schematic sct-np of the Schlieren-opUcal system. S ... halogene 'E;;';t'~01l.rCf:" [,1, [,2, [,3 ... lenses, 0 ... object, 0' --- im(L9 f : of the o~ject! S' --- iTn(1.qp. oj the source. Por explanation see text-
shown in Fig.l. The Jigh t ernel-ging fWill a rectangular, homogenously illuminated diaphragm (further on referred to as source) with height h is imaged by lenses L1 and L2 in S' _ In the back focal plane of L2 a knife is placed exactly halfway across the rectangular image S\ thus stopping exad;Jy haJf of the light. The object 0 is placed between Ll and L2 and imaged by L2 and 1,3 in 0'. If the object is perfect a.t a certain point the pencil of light going through that: point (i.e. point 1 in Fig.I.) will not be deflected so that half of it will be blocked by the knife and the intensity measured at point 1) of the image 0' will be bisected, like in the Ca."H~ without the object. If, on the other hand, at a certain point (i.e- point 2 in Fig.I) at the object t.here is a gradient in the optical path OP, (only phase objects are considered here) the pencil of light going through that particular point will be deflected over (j,n angle 4) = V (() P). The subimage ~)f S formed by that pencil at S' will then be shifted laterally over:
t!J..h = tan¢h ~ 1>12 (5)
for small ¢ (h being the foca.l distance of lens L2). In tha,i; case the knife will not block exactly half of the penciL The change in intensit:y measured at the ilnage of the object 0', relative to the case
Density Distribution in Quenched PC by Schlieren~optics 155
of a perfect object is given by:
fl.[ fl.h
To' - h/2 ¢h h/2
b(OP) 212 /jz h
(6)
This local intensity difference is directly proportional to the local gradient in the optical path. The optical path length is the product of refractive index and thickness of the object, so that both a local gradient in the thickness or in the refractive index will give the same effect;
(OP)(z) = n(z)d(z) + nm(D - d(z)) (7)
nm represents the refractive index of the surrounding medium and D is an arbitrary distance. By differentiating one obtains:
By either using perfectly flat objeds or using immersion liquids, which match the refractive index of the sample well, the second term Can be neglected} so that one can rewrite eqn-(6):
ill (z) 10
and combined with eqn_(2):
tin(z)d(z) 2/2 6z h
tip (z) = 111 (z)~ dp 6z 10 2hd dn
(9)
(10)
That means that the local gradient in density is directly proportional to the observed intensity difference upon insertion of the knife. The validity of eqn.(lO) is of COurse limited to the validity of the underlying assumptions of i.e- small gradients (tan¢ ~ if;), no variations in propagation direction and no gradient in the absorbtion of the material. Errors due to imperfections in the optical components, light source intensity distributions and detector sensitivity are eliminated by subtracting reference measurements without sample.
156 Chapter 4.1
Birefringence
Eqn.(lO) is applicable by assuming that the refractive index would only depend on density. Most polYltleric samples, however) are birefringent due to frozen~in <:hain orientation and/oT cooling stresses21 ,22.
To a first approximation we assume that the average po]aTizability is not affected as long as the chain orientation is low. But since the optical measurement is carried out in transmission, it is not necessarily the average polarizability t.hat is observed. In order to account for a varying birefringence) the Lorentz-Lorenz relation is rewritten for each principal refraclive index component) ni ;:::: nl) n2) n3:
n; - 1 I () () d ° ( n 2 - 1) ,[ ° P -;J-- ;:::: J( P Z (Xi z an T ~ ;:::: J( G\:iT
n i + 2 oZ n i + 2 uZ
oat] + p--6z (ll)
with ](' = N A/M e.o. Since the average polarizability is not affected one O;lO put for instance for the uniaxial case:
[au,e] "'" -2 [oaoJ ) 6z V 6z V
(12)
where the subscripts e and 0 denote extraordinary and ordinary, respectively. By substituting in eqn.(ll) i ;:::: e and i ;:::: 0, the term bo;jfiz can be eliminated with the relation of eqn.(12) and one ob-tain.s:
0: (:~ : ~) + 2 [;Dz (~~ ~ ~ ) (13)
by making use of eqn.(1), one obtain:;;:
(14)
assuming Gn~ 6ft
(15) (n~ + 2)2
The similarity between eqn.(14) and (2) is obvious. This means that in the c;ase of uniaxial birefringence it is sufficient to carry out two Schlieren measurements with light polarized parallel and perpendicular to the optica.l axis of the mediuru) respectively) a.nd interpolate
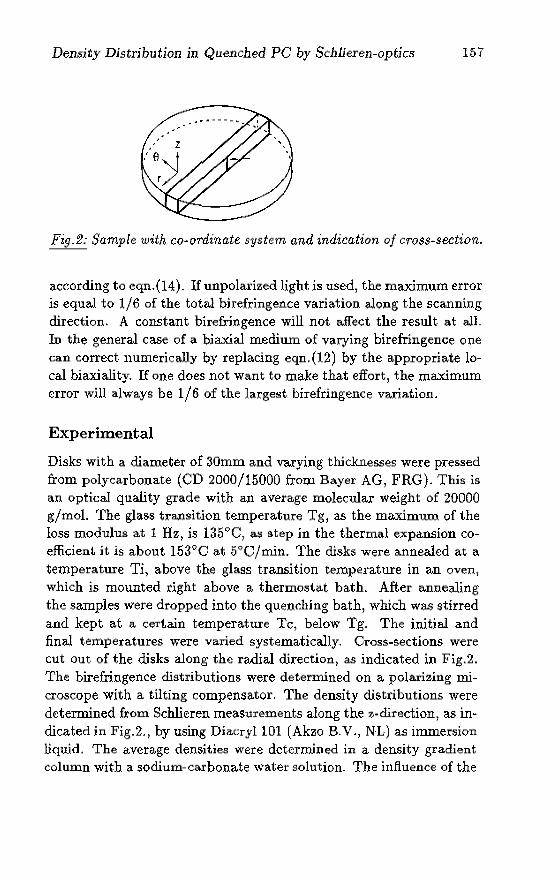
Density Distribution in Quenched PC by Sc11lieren-optic5 157
Fzg_2: Sample with co~ol'dinate system and indication of crO$$~section.
according to eqn. (14) _ If un polarized light is used, the maximum error is equal to 1/6 of the total birefringence variation along the scanning direction. A constant birefringence will not affect the result at alL In the general case of a biaxial medium of varying birefringence one can correct numerically by replacing eqn.(12) by the appropriate local biaxiality. If one does not want to make that effort, the maximum error will always be 1/6 of the largest birefringence variation.
Experimental
Disks with a diameter of 30mm and varying thicknesses were pressed from polycarbonate (CD 2000/15000 froIll Bayer AG, FRG). This is an opt.ical quality grade with all average molecular weight of 20000 g/mol. The glass trallsition temperature Tg, as the maximum of the loss modulus at 1 Hz, is 135°C) a.s step in the thermal expansion coefficient it is about 153°C at 5t;JCjmin. The disks were annealed at a temperature Ti, above the glass transition temperature in an oven, which is mounted right above a thermosta.t bath. After annealing the samples were dropped into the quenching bath, which was stirred and kept at a certain tempera-true TC j below Tg. The initial and final temperatures were varied systematically, Cross-sections were cut out of the disks along the radial direction, as indicated in Fig.2. The birefringence distributions were determined on a polarizing microscope with a tilting compensator. The density distributions were determined from Schlieren measurements along the z-direction, as in~ dicated in Fig.2., by using DiacryllOl (Abo B-V., NL) as immersion liquid. The average densities were determined in a density gradient column with a sodium-carbonate water solution, The influence of the
158 Chapter 4.1
cooling rate at Tg on the final density was determined by isotherwal cooling of PC samples at constant rate fnlHl above Tg to room temperature. For the low cooling rates CS:; 10° /min) a programmable hot sta.ge (Mettler, G~rmaIlY) was u~eJ. Intermed.iate cooling rates were (lchieved in the DSC (DSC-2 Perkin Blmer j US) and the highest cooling ratef> were applied in a constrained quenching experiment (described in ref.n). The thickness of the samples was adjusted to the cooling rate to make shure that the temperature variation within the sample remained within JOC.
Results and Discussion
The relative density of an infinitesimal volume element within a moulded sample of an amorphous polymer is determined by the mo· mentary st.aLe of stress and the history, especially the stress and the cooling rate present during vitrification. Therefore one can expect a considerable density variation within a sample, especially in the gapwise direction. In the case of freely quenched samples, it is reaSOIlable to disregard the InJluence of pressure present during vitrification. Therefore the gapwise density distribution will be determined by the residual (cooling) stresses and the cooling rate during vitrification only. One can expect a competition between those two effects. Sinc;e density increases with decreasing cooling rate, that would lead to a density illcreasing from the surface towards the core of a quenched sample. Cooling stresses on the other hand are tensile in the core a,nd compressive at the surface, leading to the opposite effect.
In Fig.3. a typical result of the Schlieren measurement of a crosssection of a quenched sample is shown. The erratic llue is the measured J(~cal gradient as derived from the local intensity change at the ddector. The smooth line is the integraJ of the gradient, where the edges are put to zero, since this is a relative measurement and the average slope is determined by several circumstances not related to the density of the object. The gapwise distributions of the rdractive index ,md the density derived from it as shown always start and end at <!'er(l. They are related to the real distribution in the following way:
h [n(H) - n(O) ] n (z) = n (z) _.. n (0) + - .. -~MTi-- z (16)
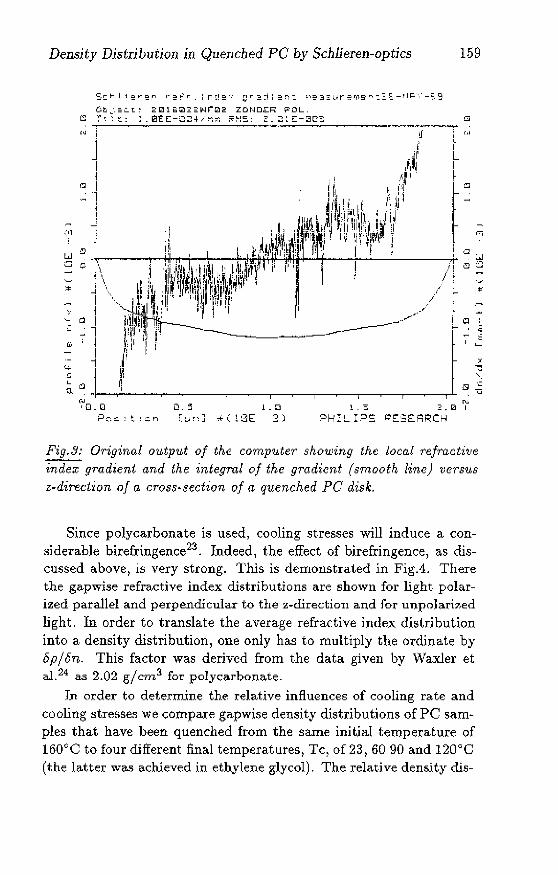
Density Distribution in Qmmched PC by Schlieren-optics 159
'0 i J
1 ~
Cl 1
<1 l.J , . .;;.-' ---l---'nI-Tt+-+--ft-,~ <::1 1\
1 \ :* J \,
1 \,.
~ i '-~ 1
- ...,; l III 1 j
1
'... l o
x ~ '-,
~, c::l a -= ~~-'--~-T--~-r--~-'~--'-~--.-~--r-~-'~ . U
N L . S :2, (j I
('oJ
10.0 a.~ 1.0 P'7'''-' t ,,,n (CJ,,,J *( !BE 3) PHILIPS PESt:ARCH
Fig. 3: Original output of the computer showing the local refractive ~ndex gradient and the integral of the gradient {smooth line} versus z-dir'ection oj (L (;rO.~5·5ection of a quenched PC disk.
Since polycarbQnate is used, cooling stresses will induce a considerable birefringence23 • Indeed, the effect of birefringence, as discussed above, is very strong. This is demonstrated in FigA. There the gapwise refractive index distributions are shown for light polarized parallel and perpendicular to the z-cliredion and for unpola.rized light. In order to translate the average refractive index di:..;tribution into a density distribution, one only has to multiply the ordinate by 8p/8n. This factor was derived from the data given by Waxler et al. 24 as 2.02 gj cm.3 for polycarbonate.
In order to determine the relative influences of cooling rate and cooling stresses we compare gapwise density distributions of PC sam~ pIes that have been quenched from the same initial temperature of 160()C to four different final temperatures, Tc, of 23,6090 and 120°C (the latter was achieved in ethylene glycol). The relative density dis-
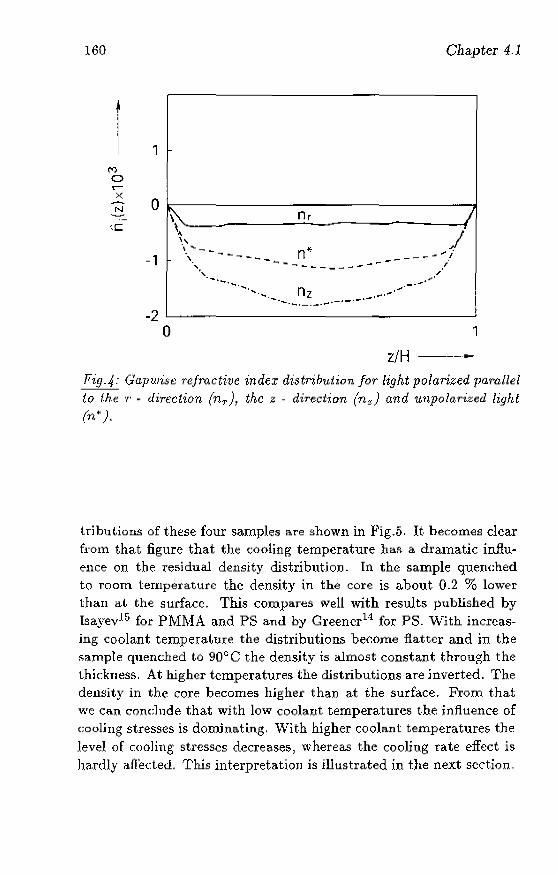
160
1 ('I)
o ..----x -N
q::
Cllapter 4.1
1
o ~ nr J \ .... \-~-~------~_-~-_---n-'-.*-----~_-_-----... -.!-. ...f
-1
-2
... .... ~-~--~-~~-~~-~ , ,,' ....
-'
....... ...,._._.,-J
o 1
z/H ---... -
Fig·4 -- Gapwise refractive index distribution for light polarized lHL'rallel to the .,. - (li'rection (nr ), the z - direction (nz) and unpolarized light (n"' ).
trihutiolls of these four samples are shown in Fig.5. It becomes clear f!"Om that figure that the cooling temperature has a dramatic influence on the residual density distribution. In the sample quenched t.o room temperature the density in the core is about 0.2 % lower than at the surface. This compa}'"es well with results published by Isayev15 for PMMA and PS and by Greencr14 for PS. With increasing coolant temperatl1(t': the distributions become flatter and in the sa.mple quenched to 90°0 the density is almost constant through the thickness. At higher temperatures the distributions are inverted. The density in the core becomes higher than at the surface. From that we can conclude that with low coolant temperatures the influence of cooling stresses is dominating. With higher coolant temperatures the level of cooling stresses decreases, whereas the cooling tate effect is lHI.rdly affed.ed. This interpreta.tioJl is illustrated in the next section.
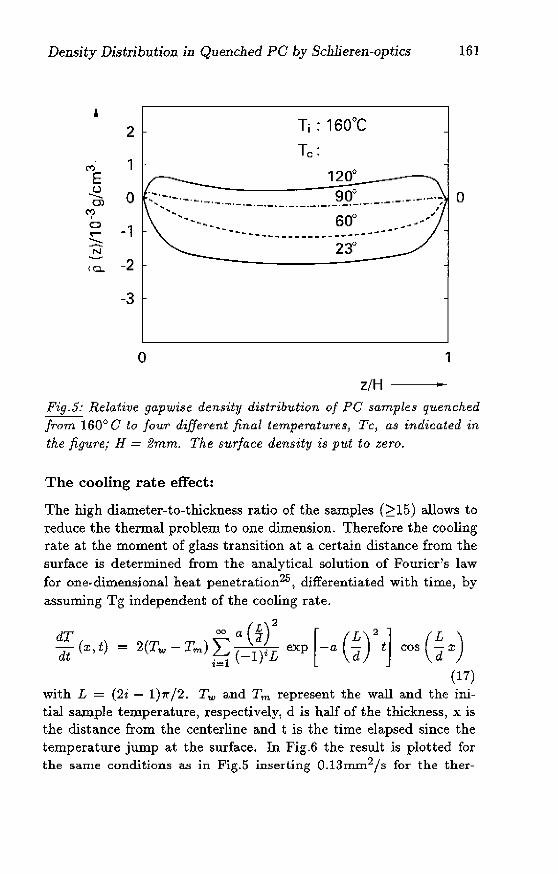
Density Distribution ill Quellched PC by Sclllieren-optics 161
1 2
1 M
E J2. 0 OJ 90" 0
-.~.-,-.~~-.~.-.---.-.-.-,-.-.---. ('( a -1 0:-
~ --~ ---... _----_ ... ---_ ....
N
<Cl,. -2
-3
o 1
z/H "" Fig-5: Rela.tive ga.pwise den,~ity distribution of PC samples quenched from 160Ci C to Jour different final tempemt1L7'es, Tc, as indicated in the figure; H = 2mm. The surface density is put to zero.
The cooling rate effect:
The high diameter-tQ-thickness ratiQ of the samples (;:::15) allows to reduce the thermal problem to one climension. Therefore the cooling rate at the moment of glass transition at a certain distance from the surface is determined from the analytical solution of Fourier's law for one-dimensional heat penetration25 , differentiated with time, by assuming Tg independent of the cooling rate.
dT = a (~)2 [ L 2] L dt(x,t) = 2(Tw -Tm)t;(_1)iL exp -a(--d") t cos(-;:r'l:)
(17) with L = (2i - 1)1(/2. Tw and I'm represent the wall and the initial sample temperature, respectively, d is half of the thickness, x is the distance from the centerline and t is the time elapsed since the temperature jump at the surface. In Fig.6 the result is plotted for the same conditions as in Fig.5 inserting O.13rnIll2/s for the ther-
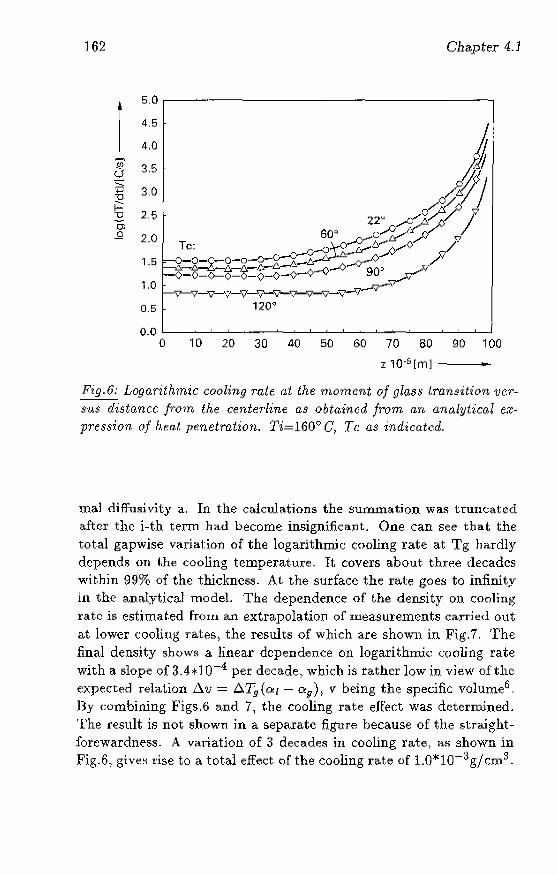
162 Chapter 4.1
1
5.0
4.5
4.0
Ui' 3.5 Q .~
~ 3.0 ""0
~ 2.5 ""0
OJ ..Q 2.0
1.5
1.0
0.5
0.0 0 10 20 30 40 50 60 70 80 90 100
z 10.5 [m] '"'
Fig.6: Logarithmic cooling rate o.t the moment of glas!i I,mnsition vcrs'us distance from the center-line as obtained from an analytical c,'t
pression of hf.(},l penetmtion. Ti=160° C, Tc as indicated.
ma.l rliffusivity <t. In the calculat.ions the summation was truncated after the i-th term had become insignificant. One can see that the total gapwise variation of the logarithmic cooling rate at Tg hardly depends on t.he cooling temperature. H covers about three decades within 99% of the thickness. At. the surface the rate goes to infinity in the analytical model. The dependence of Lhe density on cooling rate is estimated from an extrapolation of measurements carried out at lower cooling rates, the results of which are shown in Fig.7. The final density sb()ws a linear dependence on logarithmic cooling rate with a slope of 3.4* 10.-4 per decade) whidl is rather low in view of the expected relaLion 6.v = b.Tg (O:[ - a g ), v being the specific volume6.
By combining Figs.6 and 7, the cooling rate efred was dcterm.ined. The result is not shown in a separate figure because of the sLraightforewardness. A variation of 3 decade5 in cooling rate, aR shown in Fig.6, gives rise to a. total effect Qf the cooling rate of LO*10-3g/cm 3 .
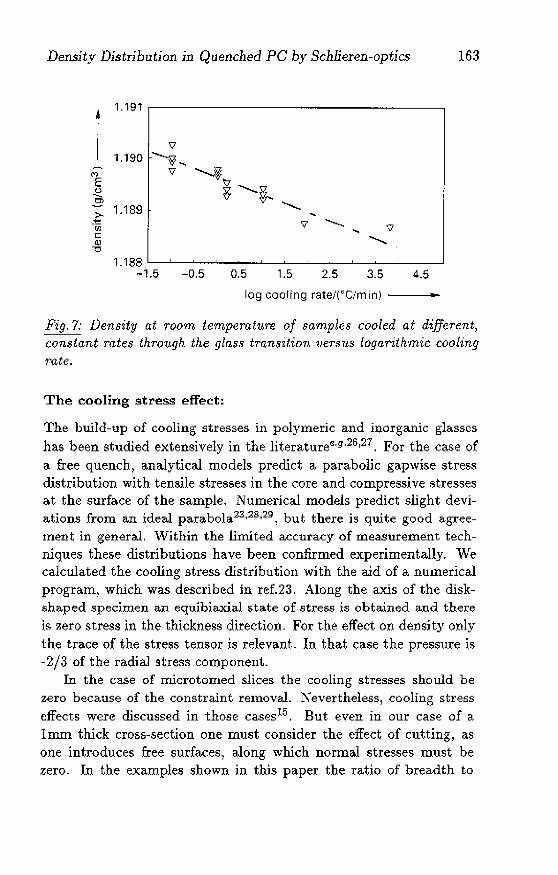
Density Distribution in Quenched PC by Schlieren-optics 163
1
1.191
\l 1.190 ......... '0 ...
<:') 'V ~~ E (.) {; --u-., 01 .......... >- 1.189
. ~ \l ........ VJ ... \I c --a,J
"0
1.188 -1.5 -0.5 0.5 1.5 2.5 3.5 4.5
log cooling ratef("C/min) -
Pig.7: Density at room temperature of samples cooled at different, (;onstant rates thro1},gh the gla!J.~ tran.~itio1/, VerSl1$ logm'ithmic cooling rate.
The cooling stl'ess effect:
The build-up of cooling stresses in polymeric and inorga.nic glasses has been studied extensively in the literature€·g·26,27, For the case of a free quench) analytical models predict a parabolic gapwise stress distribution with tensile stresses in the core and compressive stresses at the surface of the sample. Numerical models predict slight deviations from an ideal parabola23,28,29) but there is quite good agreement in general. Within the limited accuracy of measurement techniques these distributions have been confirmed experimentally. We calculated the cooling stl'ess distribution with the aid of a numerical program, which was described in ref.23. Along the axis of the diskshaped specimen an equibiaxial state of stress is obtained and there is zero stress in the thickness direction. For the effect on density only the tra.ce of the stress tensor is relevant. In that case the pressure is -2/3 of the radial stress component.
In the case of rnicrotomed slices the cooling stresses should be zero because of the constraint removal, Nevertheless, cooling stress effects were discussed in those casesJ5 . But even in our case of a lmm thick cross-section one must consider the effect of cutting, as one introduces free surfaces, along which normal stresses must be zero. In the examples shown in this paper the ratio of breadth to
1(l4 Chapter 4 . .1
thj~~knesg is 0.5. That means, also according to Mills29, that the
stress level in O-direction is muc.h lower than in r-direction. The ~tre:>s component in z-direction integrates to zero along 0, anyway. Therefore we assume that only i7rT contributes significantly to the pressure. Moreover, due to the extra freedom in the perpendicular direction, the stress in I".direction will also decrease by a. {ac;tar (1 - JJ), where v is Poisson'~ constant. The local pressure in the (Toss-section is thus obtained from the stress predicted in the disk as [onows:
-(1 - v)arr P (Z)rod = - 3 (Z)disk (lS)
From that we detemline the gapwise density distribution in the following way:
p(z) = PO + k log(TTg (z)) + J{P(Z)rod (19)
Po and k arc determined fl-om Fig.7, where PO is the density at log(1'(lg)) = 0 and k is the slope. K denotes the bulk compression modulus at room temperature. log(TTg (z)) is obtained from Fig.G. The results obtained in this way for the experimental quenching conditions are shown in Fig.S. In contrast t.o Fig.5, where the relative density is ~et to zero at the surface, the curves in Fig.8 arc absolute, as predicted. It becomes obvious that the calculated curves show the same features as the experimentally determined distributions. The density right at the surface waS not predicted, because t.he analytical model assumes an infinite cooling rate there. By in~ eluding a.n effective heat transfer coefficient this problem might be solved. The difficulty, however, is that for high coefficients (i.e. high Biot moduli) only very dose t.o the surface the differences become distinguishable29
• But this area is not accessible for measurement. 'the temperature decrease was measured 1.Stnn1 beneat.h the surface of a. 13mm t.hick disk during quendling. with a glass fiber themocou~ pIe. The results could be fit well with the analytical model assuming unlimited heat transfer at the surface and employing a heat diffusivity of O.I3mm2 /s for PC.
As one can see in Fig.S the magnitudes of the gapwise va.riations agree very well with the experimental values. In the core the density .is higher than at t.he surface only for Tc = 120°C. FOT the lowest
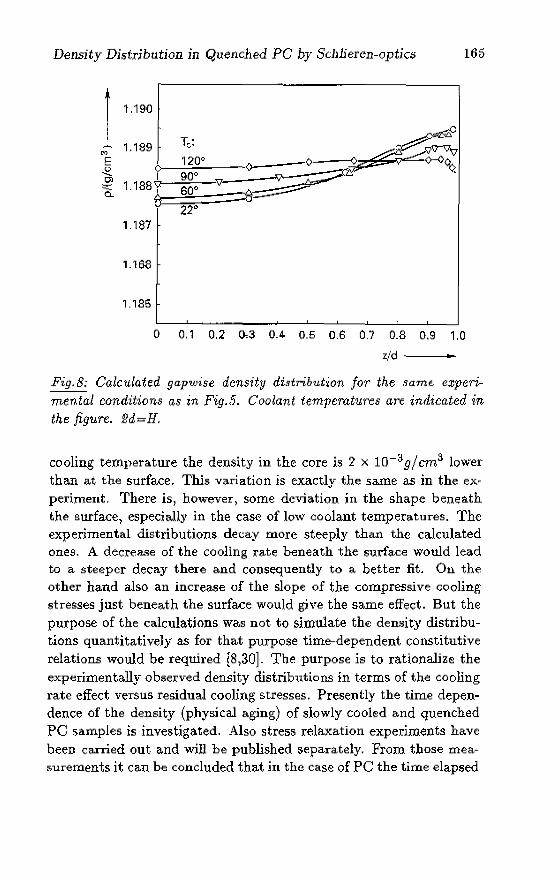
Density Distribution in Quenched PC by Sdllieren-optics 165
1.187
1.168
1.185
o 0.1 0.2 0,3 0.4 0.5 0.6 0.7 0.8 0.9 1.0
z/d •
Fig.S; Calculated gapwise density distribution for the same experimental conditions as in Fig.5. Coolant temperatures are indicated in the figure. 2d=H.
cooling temperature the density in the core is 2 >< 1O-3g/ cm3 lower than at the surface. This va.riation is exactly the same as in the eX" periroent. There is, however, some deviation ill the shape beneath the surface, especially in the case of low coolant tempera.tures. The experimental distributions decay more steeply than the calculated ones. A decrea..~e of the cooling ra.te beneath the surface would lead to a steeper decay there and consequently to a better fit. On the other hand also an increase of the slope of the compressive cooling stresses just beneath the surface would give the same effect. But the purpose of the calculations was not to simulate the density distributions quantitatively as for that purpose time-dependent constitutive relations would be required [8,30J. The purpose is to rationalize the experimentally observed density distributions in terms of the cooling rate effect verSUS residual cooling stresses. Presently the time dependence of the density (physical aging) of slowly cooled and quenched PC samples is investigated. Also stress relaxation experiments have been carried out and will be published separately. From those measurements it ca.n be concluded tha.t in the case of PC the time elapsed
166 Chapt;er 4.1
between quenching and the Schlieren measurement had nO significant effect on the observed distributions.
So far the strong influence of the coolant temperature was illustrated. The influence of the initial temperature before the quench is far less pronounced. It turns out that the shape of gapwise logarithmic vitrification cooling rate is affected slightly; but the I.evel of cooling stresses is not affected, as long as the inillial temperature is not too close to Tg. In accordance with thai. it Was found that only the slope of the density distribution beneath the surface is reduced slightly with increasing initial temperature. At initial temperatures dose to Tg the cooling stress distribution is altered 5C) that beneath the surface the densit.y shows a sHlall maximum and the total gapwise variation is smaller. By reducing the thickness of the disks from 2.0mm to 1.0mm the total variation in cooling rate is reduced. As a consequence also the total variation of the density is slightly reduced with disk thickness.
Conclusions
The Schlieren-optical technique gives direct access to spa.tial density distributions in transparent samples. Because of its high resolution; it is especially suited for the detennination of gapwise density distributions in moulded amorphous polymer specimens. In this way much marc detailed information is obtained than with conventional slicing techniques. This wa.s demonstrated for polycarbonate samples quendwd under ditrerent conditions. It could be shown that the gapwise density distribut.ion is determined by a competition of the effect of decreasing cooling rate fI·om the surface towards the core and the presence of cooling stresses, which are compressive at the surface and tenslle in the core. A semi-quantitative interpretation was obtained by determining the cooling rate effect separately and combining it with cooling stresses, which were predicted with a numerica.l program. The density distributions are most of all determined by the final temperature of the quench. With low coolant temperatures the density will be lowe~j, in the core and with high tempel·atures it will be lowest at the ~mrfa.ce. At coolant temperatures around 100°C the density becomes almost constant.
Density Dist;ribution in Quenched PC by Schlieren-optics 167
Acknowledgement
The authors are very greatful t.o Mr.J .ILA. van Vlerken for the careful preparation of the cross-sections.
References
1. L.C.E. Struik) Physjcal Aging in Amorphous Polymers and Other Materials, Elsevier) Amsterdam) 1978
2. M.R. Tant and G.L. Wilkes, Polyrn.Eng.Sci.) 21, 874, (1981)
3. J.M. O)Reilly, CRe Grit. Rev. Solid State & Mater.Sci., 13) 2.19) (1987)
4. G. Goldbach and G. Rchage) RheoLActa, 6, 30, (1967)
5. RM. Kimmel and D.R. Uhlmann) J.AppLPhys.) 42,4917, (1971)
6. S. Ichihara, A. Komatsu) and T. Rata) Polymer J., 2, 650, (1971)
7. J.E. McKinney and R. Simha) J.Res.NatLBur.Stand.-A, 8lA, 283, (1977)
8. A.R .. Ramos, A.J. Kovacs, J.M. O'Reilly, J.J. TI::ibone, and .1. Greener, J.Polym.Sci.Polym.Phys.Ed.) 26, 501 (1988)
9. R. Pi:xa) B. Grisoni, T. Gay, and D. Froelich, Polym.Bull., 16, 381) (1986)
10. V. Wang and C. Hieber, SPE ANTEC Tech.Papers) 34, 290, (1988)
11. F.P.T. Baaljens, in Flow Modelling in Indust.rial Processes, eds. A.W. Bush et aL, E. Horwood Ltd., Eugland, 1988
12. 7.;. Bakerdjian and M.R. Kamal) Polym.Ellg.8ci., 17,96, (1977)
13. M.a. Kamal and F.R. Moy, J.AppLPolym.Sci., 28, 1787, (1983)
11. J. Greener, Polym.Eng-Sci., 26, 534, (1986)
168 Cllapter 4-1
l5- AI lsayev and 1'_ Hariharan) Polyrn.Eng.Sci., 25, 271, (1985)
16. H. Wolter, in Handbuch der Physik, Band 24, ed. S. Fluegge, Springer, Berlin, 1956, 555·645
17. G. Prast) Philips Tech.R.ev., 43, 184, (1987)
18. H. Mueller, Physics, 47, 179, (1935)
19, R.M, Wa,xler and C-B. Weir, J.Res.NatLBur.Stand.- A, 69A, 325 (1965)
20. E.E. Havinga and A,J, Bosman, Phys_Rev.A, 140, 292, (1965)
21.. AJ- Isayev, Polym.Eng-Sci.) 23, 271, (1983)
22, R.. Wimberger-Friedl, Polym.Eng.Sd., 30,813, (1990) (Part 5)
23. R. Wirnberger-Friedl and R.D.H.M. Hendriks, Polymer, 30, 1143, (1989) (Chapter 3.1)
21. R.M. Waxler, D. Horowitz) and A. Feldmann, AppLOptics, 18) 101, (1979)
25. H.S. Carslaw and T.e. Jaeger, Conduction of Heat in Solids, Clarendon Press, Oxford, 1947
26. B.A. Boley and .T.R. Wiener, Theory of Thermal Stresses, J .Wiley, New York, 1960
27. B.D. Aggarwala and E. Saibel, Phys_Chem_Glasses, 2) 137) (1961)
28. E.H. Lee, T.O. Rogers, and T,e. Woo, J,Amer.Ceram-Soc, 48, 480, (1965)
29. N.J. Mills, J.Mater.Sci., 17, 558, (1982)
30. C .. L Wust and D.C. Bogue, J.AppLPolym.8ci., 28,1931, (1983)
Chapter 4.2
Gapwise Density Distributions in
Injection-Moulded Polymethylmethacrylate1
ABSTRACT: Residual density distributions are determined in injection-moulded polyroethyhnethacrylate (PMMA) with the aid of a quantitative Schlieren-optical technique. The gapwise distributjons typically show a maximum beneath the surface. The height of the maximum as well as the level in the core vary with distance from the gate of the mould. The density distributions and the influence of the moulding parameters are explained by the pressure course measured in the cavity and the process of vitrification of the sample during moulding. The magnitudes of the variations of the gapwise distributions agree with the average density variations measured in a density gradient column. Residual stresses do not contribute significa.ntly to the determined distributions. The density maximum. is found closer to the surface than the maximum in birefringence which is induced by the shear flow during filling. The magnitude of the density variations is less tha.n predicted by the pseudocompressibility as determined in samples vitrified under constant pressure.
1 R.Wimberg~r-Friedl and J-G. De Bruin, submitted to PolYID_Eng.Sci.
169
1.70 Chap/;~r 4.2
Introduction
Tt i:-; w~Jl known that the :;;pecific volume of glassy materials like amorphous pc)lymers depends OIl the thennomechanical history) especially the cooling rate and the pressure during vitrification 1,2. In any case all eXCeflfl free volume is built up below the glass transition. This excess free volunlt~ relaxes slowly with time, a process called physical aging:~. Already at temperatures not far below the glass transition temperature Tg the time to reach equilibrium becomes longer than the experimental time scale and also longer than the typical life time of <t polymer product. Physical aging not only strongly affed:;; the mechanical properties) a change in density is also accompanied by a change of the dimensions of the sample. It is therefore of gn~at. importance for the dimensional stability of polymer products.
In injection-moulding the product undergoes a complicated thermomechanicaI history. Both, the cooling rate as well as the pressure present Juring vitrification vary considerably in the gapwise dire(> tion. In order to be able to understand and predict the dimensional stability of injection-moulded polymer products it is essential to know the density distribution in the product as well a,s th~ format.ion conditions at. every point.
Olle can distinguish four important parameters that affect the re:;;ic:lual den:;;ity of an injectionnTnoulded amorphous polymer: the .rnomentary state of stress) the sta.te of fltress during vitrification (the pressure being t.he most important partL the cooling rate during vit.rification and the temperature history since the vitrification. The latter is assumed to be the same for all parts of the sample so that it will not affect the spatial distribution of the density. The deviatoric state of stress during vitrification is mentioned since this will lead to molecular orientation which can affect the density as well. Also that influence will be disregarded in tbe present investigation. The effect of cooling rate and residual stresses on t.he density of quenched polycarbonate specimens was the subject of It previous investigation1
,
'There it was found that for quenching temperatures of (I,bout. .50"() below 'rg both effects caned out and an almost constant density is obtained. It can be expected that a typical variation of the cooling rate of about :~ decades at marimum has much less effect on the specific volume than a pressure of up to 1000 bar during vitrification5 .
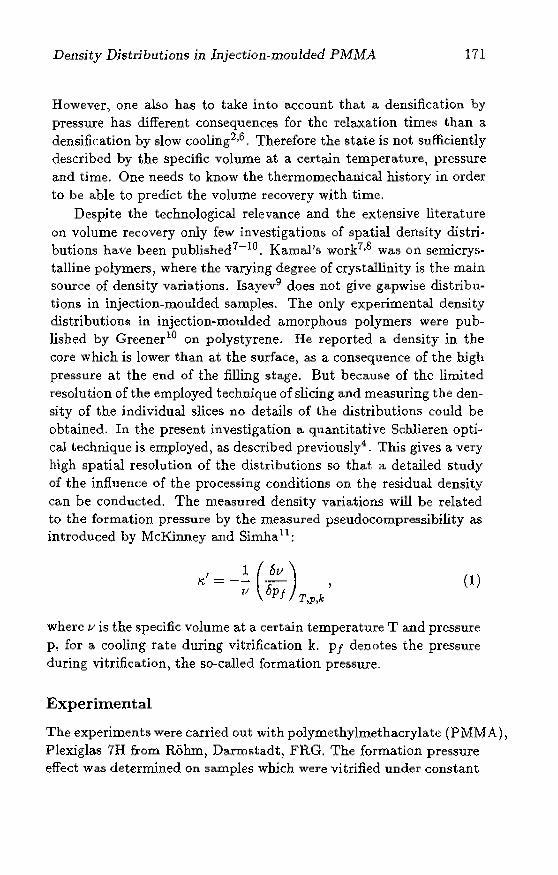
Density Distributions in .Injection-moulded PMMA 171
However, one abo has to take into account that a densification by pressure has different consequences for the relaxation times than a densifkation by slow cooling2,6. Therefore the state is not sufficiently described by the specific volume at a certain temperature) pressure and time. One needs to know the thermomechallical history in order to be able to predict the volume recovery with time.
Despite the technological relevance and the extensive literature on volume recovery only few investigations of spatial density distributions have been published 7- 10 . KamaFs work7,8 was on semicrystalline polymers) where the varying degree of crystallinity is the main source of density variations. Isayev9 does not give ga.pwi~e distributions in injection-moulded samples. The only experimental density distributions in injection-moulded amorphous polymers were published by Greener lO on polystyrene. He reported a density in the core which is lower than at the surface) as a conseqnence of the hlgh pressure at the end of the filling stage. But because of the limited resolution of the employed technique of slicing and measuring the density of the individual slices no details of the distributions could be obtained. In the present investigation a quantitative Schlieren opti~ cal technique is employed) as described previously4 _ This gives a very high spatial resolution of the distributions so tha.t a. detailed study of the influence of the processing conditions on the residual density can be conducted. The measured density variations will be related to the formation pressure by the measured pseudocompressibility as introduced by McKinney and Simha 11;
(1)
where /.1 is the specific volume at a certain temperature T and pressure p, for a cooling rate during vitrification k. p f denotes the pressure during vitrification, the so-called formation pressure_
Experimental
The experiments were carried out with polymethylmethacrylatc (PMM A)) Plexiglas 7H from Rohm, Darmstadt, FRG. The formation pressure effect was deterrrlined on samples which were vitrified under constant
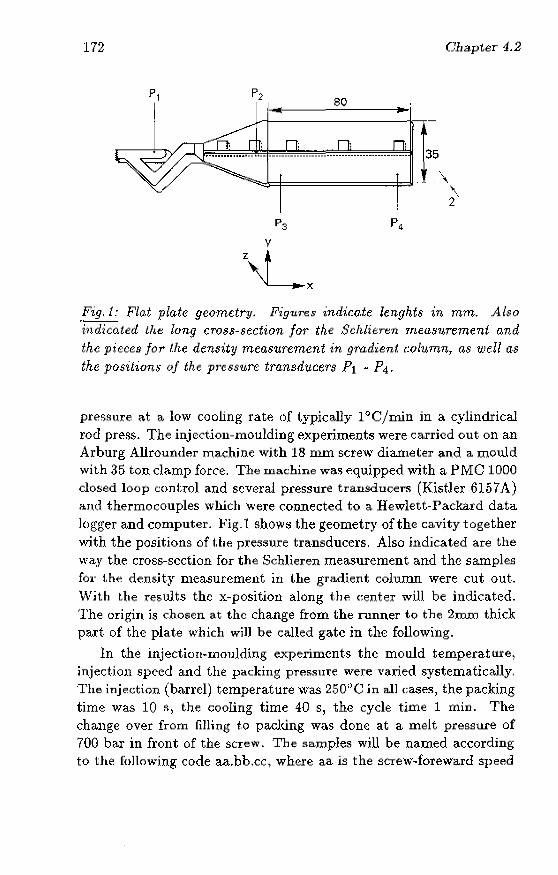
172 Glupter 4.2
80 ... ...
35
\ }
P4
Fig. 1: Plo,t plate geometry. FiguT'es indica.te lenghts in mm. Also indicated the long cross-section for the Schli€T'en me.US11,rement and the pieces for the density measurement in gradient column, as well as
the posiliQn.~ of the pressure transducers PI - P4.
pressure a.t a low cooling rate of typically IOCjmin in a cylindrical rod press. The injection-moulding experiments were carried out on an Arburg Allrounder ma.chine with 18 nun screw diameter and a mould with 35 ton damp force. The machine was equipped with a PMC 1000 dosed loop control and several pressure transducers (KistJer 6157A) and thermocouples which were cODJlected to a Hewlett-Packard data logger and computer. Fig.l shows the geometry ofthe cavity together with the positions of the pressure transducers. Also indicated are the way the cross-section for the S(:hlieren measurement and the samples for the density mea.surement in the gradient column were cut out. With the results the x-position along the (:enter will be indicated. The origin is chosen at the change from the runner to the 2mm thick part of the plate which will be called gate in the following.
In the injection-moulding experiments the mould temperature, injection speed and the packing pressure were varied systema.tically. The injection (ba.rrel) temperature was 250')0 in all ca..o;es, the packing time was 10 fI, the cooling time 40 s, the cycle time 1 min. The change over from filling t.o packing was done at a melt pressure of 700 bar in front of the screW. The samples will be named according to the following code aa.bb.cc, where aa is the screw~fo1'eward speed
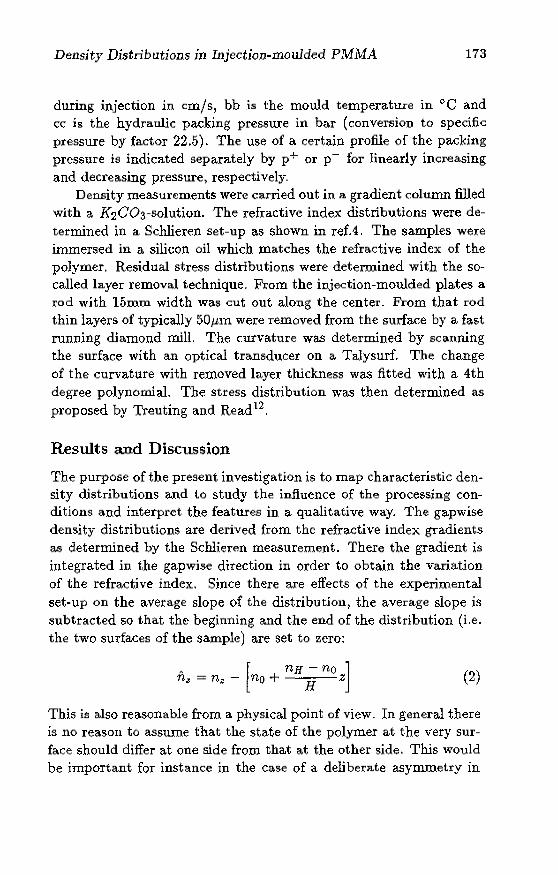
Density Distributions in Injection-moulded PMMA 173
during injection in ern/s, bb is the mould temperature in °C and cc is the hydraulic packing pressure in ba.r (conversion to specific pressure by factor 22.5). The use of a certain profile of the packing prcssure is indicated separately by p+ or p- for linearly increasing and decreasing pressure, respectively.
Density measurements were carried out in a gradient column filled with a K2C03-solution. The refractive index distributions were determined in a Schlieren set-up as shown in TefA. The samples were immersed in a silicon oil which matches the refractive index of the polymer. Residual stress distributions were determined with the socalled layer removal technique. From the inje<::tion-moulded plates a rod with I5mm width was cut out along the center. From that rod thin layers of typically 50pm were removed from the surface by a fast running diamond mill. The curvature was determined by scanning the surface with an optical transducer on a Talysurf. The change of the curvature with removed layer thickness was fitted with a 4th degree polynomiaL The stress distribution was then determined as proposed by Deuting and Read12 .
Results and Discussion
The purpose of the present investigation is to map characteristic den~ sity wstributions and to study the influence of the processing conditions and interpret the features in a qualitative way. The gapwise density distributions are derived from the refractive index gradients as determined by the Schlieren measurement. There the gradient is integrated in the gapwise direction in order to obtain the variation of the refractive index. Since there are effects of the experimental set-up on the average slope of the distribution, the average slope is subtracted so that the beginning and the end of the distribution (i.e. the two surfaces of the sample) are set to zcro:
. [nH - no ] n z = n~ - no + H Z (2)
This is also reasonable from a physical point of view- In general there is no reason to assume that the state of the polymer at the very surface should differ at one side from that at the other side. This would be important for instance in the case of a deliberate asymmetry in
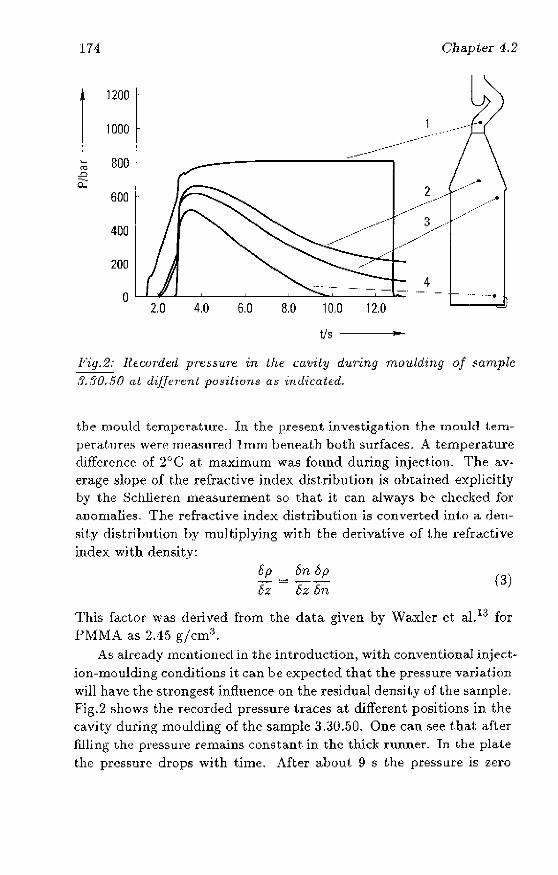
174 Chapter 1.2
J
1200
1000
~ 800 [tJ
.D ~-0-
2 600 .. " .----
3 .' ....
400 .---. .. --_ .
... -.. ----
200 4
a ..... , ..... 2.0 4.0 6.0 8.0 10,0 12.0
tis 100
Fig. 2; Hf:C()Tderi pT'eS~rUTe in thf: cuvdy during moulding of sample
S. SO. 50 at difJt::Tent positions as inJicated.
the mould temperature. In the present investiga,t.ion t.he moule! teIT1~
pera.tlln~s wen-~ Tlwasllr~d 1 nun beTleath both surfaces. A tenlperature difference of 2°C at maximum was found during injection. The average !Slope of the refradive inckx. distribution is obtained explicitly by the Schlieren measurement so that It can always be checked for anomalies. The refractive index distribution is converted into a den~ sity distribution hy multiplying wit.h the derivative of the l"efractive index with density:
Op On bp 6z "'" bz bn
(3)
This factor was derived from the data given by Waxler et cl. IS for l'MMA as 2.15 g/cm:~.
As already mentioncd in thc introduction, with conventional injection-moulding conditions it can be expected that the pressure variation will have the strongest influence on the residual densi t.y of the sample, Fig.2 flhows the Tecorded pressure traces at different positions in the cavity during moulding of the sample 3.30.50. One can see that. after ruling the pressure remains constant in the thick runner. Tn the plate the pressure drops with time. After about 9 $ the pressure is zero
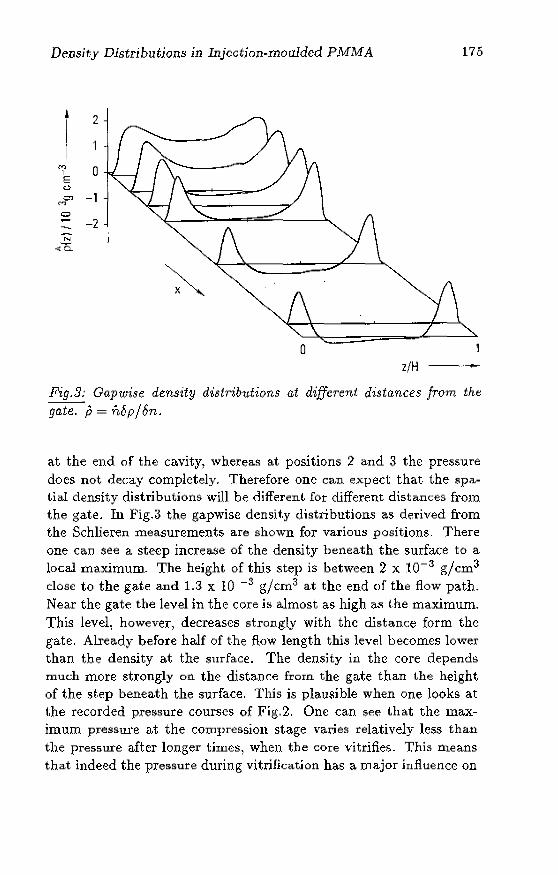
Density Distributions in Injection-moulded PMMA 175
1 2
'" a I E u <;n -1
M
S -2
N
<Cl.
a z/H -- .. --
Fig. 3: Gapwi!5e density distributions at different distances from the gate. p= n6p/6n.
at the end of the cavity, whereas at positions 2 a.nd 3 the pressure does not decay completely. Therefore one can expect that the spa.tial density distributions will be different for cUfferent distances from the gate. In Fig.3 the gapwise densjty distributions as derived from the Schlieren measurements are shown for various positions. There one can see a steep increase of the density beneath the surface to a local maximum. The height of tills step is between 2 x 10-.3 gjcm3
dose to the gate and 1.3 x 10 -3 g/ cm3 at the end ~)r the flow path. Near the gate the level in the core is almost as high as the maximum. This level, however, decreases strongly with the distance form the gate. Already before half of the flow length this level becomes lower than the density at the surface. The density in the core depends much more strongly on the dista.nc:e frOIn the gate than the height of the step beneath the surface. This is plausible when one looks at the recorded preS5ure courses of Fig.2. One can see that the maximum pressure at the compression stage va.ries relatively less than the pressure after longer times, when the core vitrifies. This means that indeed the pressure during vitrification has a major influence on
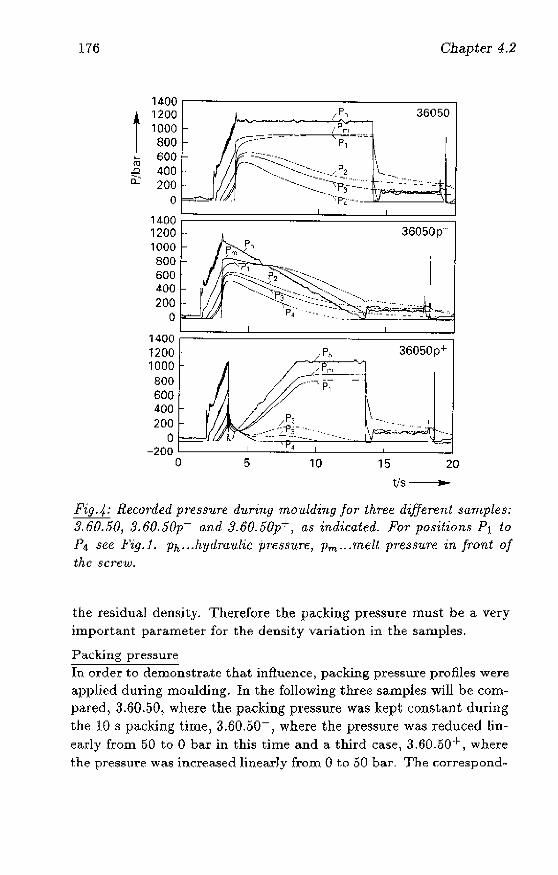
176 Chapter 4.2
1400
t 1200 1000 800
"- 600 ro
J::l 400 [L 200
0
1400 1200 36050p" 1000 800 600 400 200
0
1400 1200 . 36050p+ 1000 800 600 400 200
0 -200
0 5 10 15 20
tis ..
Pig.4; Recor'ded pr'essu're dur'ing moulding JOT thr'ee d'iffeT'enl sa·m.ples; .'1.60. liO, S.60.tiOp- a.nd 3- 60- 50p+, as indica.ted_ For positions P1 to P.1 see Fig. i. Ph" .hytlTy)'·u.lic pTe.~$UT'(;., Pm ... melt p·re.~S?J.r'e 'in front of the screw.
the residua.l denflity. The:refore the pa.cking pressure must be a very important parameter for the density variation in the samples.
Packing pressure In order to demonstrate tha.t influence) pa.cking pressure profiles were applied during moulding. In the following three samples will be compared~ 3.60.50~ where the packing pressure WaS kept constant dllring the 1.0 s pa.cking time) 3.60.50-) where the pressure was :reduced linearly from 50 to 0 bar in this time and a third case, 3.60.50+ 1 where the pressure was increa.sed linearly from 0 to 50 bar. The cOTrespond~
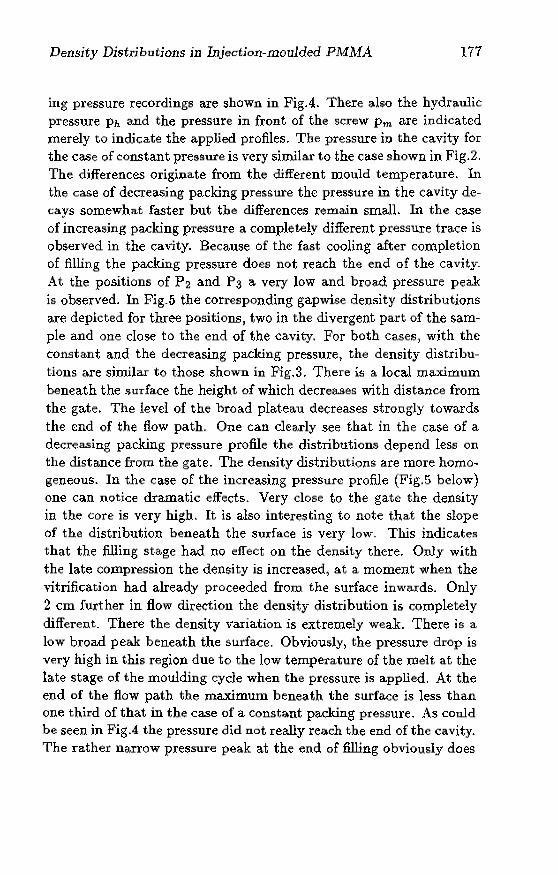
Density Distributions in Injection-moulded PMMA 177
iIlg pressure rec:;;ordings are shown in FigA. There also the hydra.ulic pressure Ph. and the pressure in front of the screw Pm are indicated merely to indkate the applied profiles. The pressure in the cavity for the case of constant pressure is very similar to the case shown in Fig.2. The differences originate from the different would temperature. In the case of decreasing packing pressure the pressure in the cavity decays somewhat faster but the differences remain small. In the case of increasing packing pressure a completely different pressure trace is observed in the cavity. Because of the fast cooling after completion of filling the packing pressure does not reach the end of the cavity_ At the positions of P2 and P3 a very low and broad pressure peak is observed. In Fig_5 the corresponding gapwise density distributions are depicted for three positions, two in the divergent part of the sample and one close to the end of the cavity. For both cases, with the constant and the decreasing packing pressure, the density distributions are similar to those shown in Fig.3. There is a local ma.ximum beneath the surface the height of which decreases with distance from the gate. The level of the broad plateau decreases strongly towards the end of the flow path. One can clearly see that in the ease of a decreasing packing pressure proffie the distributions depend less on the distance from the gate. The density distributions are more hOUlOgeneous. In the case of the increasing pressure profile (Fig.5 below) one can notice dramatic effects. Very close to the gate the density in the core is very high. It is also interesting to note that the slope of the distribution beneath the surface is very low_ Tllis indicates tha.t the filling stage had no effect on the density there. Only with the late compression the density is increased) at a moment when the vitrification had already proceeded from the surface inwa.rds. Only 2 em further in flow direction the density distribution is completely different_ There the density variation is extremely weak. There is a low broad peak beneath the surface. Obviously) the pressure drop is very high in this region due to the low ternperature of the nlelt at the late stage of the moulding cycle when the pressure is applied. At the end of the flow path the maximum beneath the surfa.ce is less than one third of that in the case of a constant pa.cking pressure. As could be seen in Fig.4 the pressure did not really reach the end of the cavity. The rather narrow pressure peak at the end of filling obviously does
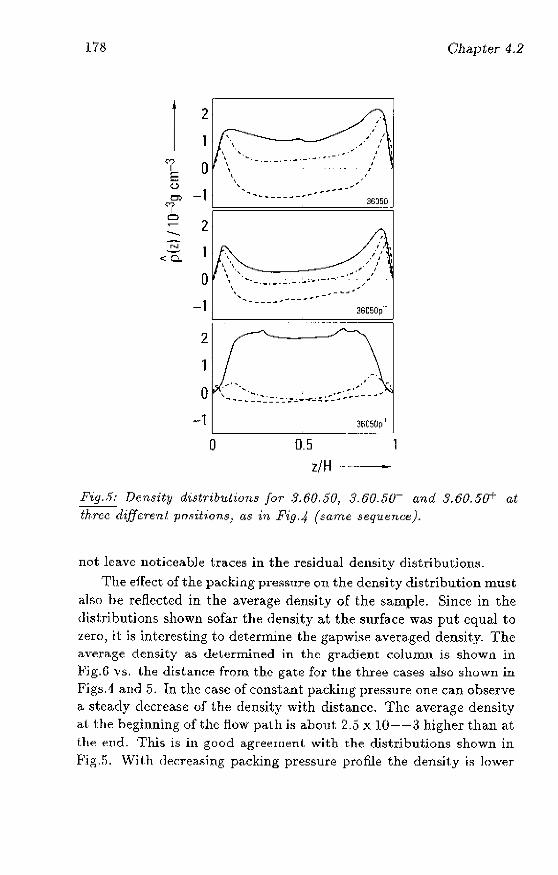
178
1 '7 E o
<Q.
2
o -1
2
o -1
2
o .. ·1
o
............ ___ ... _.r .............
............
.I • ... _.-. ....
"
r ,
36050
36050p
.' . r'
.., ... _ .. :~ .... ..:::. __ ".:-..:...:. ....... ..::; :...-_~:".r'" - _ ...
360S0p I
0.5
z/H ..... _--
Ohapt;er 4.2
Fig.S: Density distr'ibulions JOT .1.60.50, $.60JiO- and S.60.5()+ at three differeTtl prw:tions) as in Fig.4 (same sequence).
not leave noticeable traces in the residual density distributlows.
The effect of the packing pressure au the density distribution must also he reflected in the average dem;jty of the sample. Since in the distributions shown sofar the density at the surface was put equal to ;.>;ern, it is interesting to determine the gapwis~ avera.ged density- The avera.ge density as determined in t.he gradient colunm is shown in Fjg.6 vs. the distance from the gate for the three cases also shown in Fig~.1 and .5. Tn the case of constant packing pressure one can observe a steady decrease of the density with distance. The average density a.t the heginning of the flow path is about 2.5 X 10--3 higher than at the f~nd_ This is in good a.greement. with the distributions shown in F.ig.!). Wit.h de.creasing packing pressure profile the density is lower
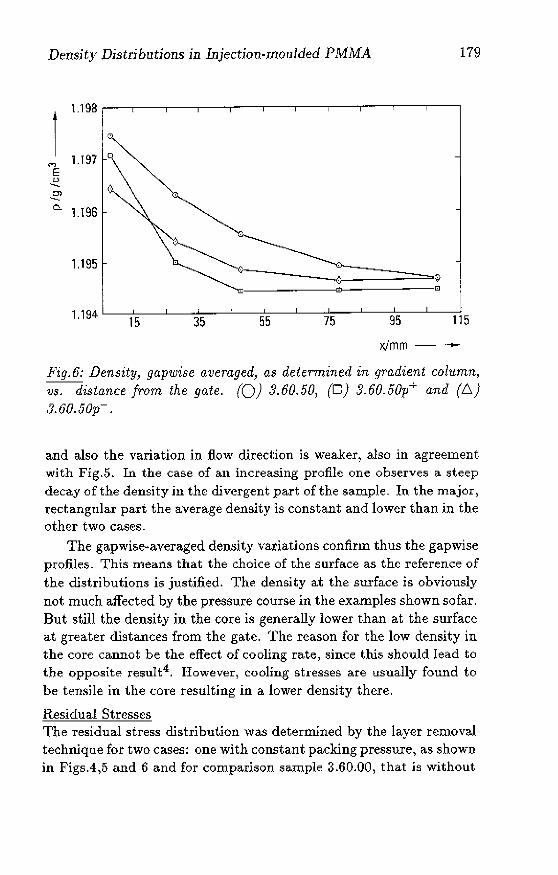
Density Distributions in Injection-mollided PMMA 179
1
1.198
1.197 .., E u
'"'-OJ
'"'-0- 1.196
1.195
1. 194 L--1~5---1...--3~5~--L...--::!:55:-----L-~7::::'5~--'--~95;----'------;-:;1l5
x/mm·-
Fig.G: Density, gapwise averaged, as determined in gradient column, vs. distance from the gate. (0) 3.60.50, (D) 3.60.50p+ and (6) .1. 60. 50p- .
and also the variation in flow direction is weaker, also in agreement with Fig.5. In the case of an increasing profile one observes a steep decay of the density in the divergent part ofthe sample. In the major, rectangular part the average density is constant and lower than in the other two cases.
The gapwise~averaged dem>ity vax-iations confirm thus the gapwise profiles. This means that the choice of the surface as the reference of the distributions is justified. The density at the surface is obviously not much affected by the pressure course in the examples shown safar. But still the density in the C~)I:e is generally lower than at the surface at greater distances from the gate. The reason for the low density in the core cannot be the effect of cooling rate, since this should lead to the opposite resuIt4 • However, cooling stresses are usually found to be tensile in the core resulting in a lower density there.
Residual Stresses The residual stress distribution was determined by the layer removal technique for two cases: one with constant packing pressure, as shown in Figs.4,5 and 6 and for comparison sa.mple 3.60.00, that is without
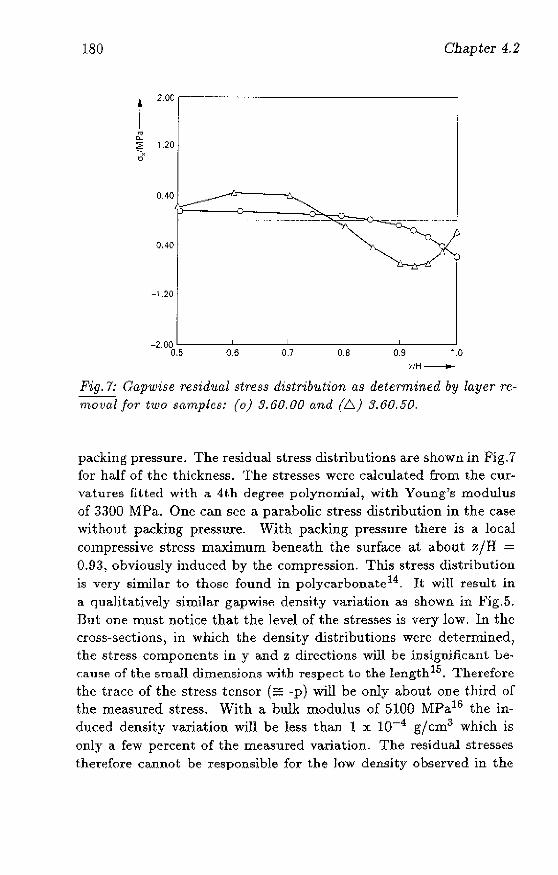
180
t '" c..
2.00
~ 1.20 'x t)
OAO
0.40
-1.20
Cbapter 4.2
_. __ .. _ ........ _._------------
-2.00 L-__ ---'-___ ...l...-__ ----' ___ --'--__ -----'
0.5 0.6 0.7 0.8 0.9 1.0
(!H_
Fig. 7: Gapwise residual stress distribution as determined by layer removal for two samples: (0) 3.60.00 and (6) 3.60.50.
packing pressure. The residual stress rnstribu tions are shown in Fig.7 for half of the thickness. The stresses were calculated from the curvatures fitted with a 4t.h degree polynomial, with Young's modulus of 3:mo MPa. One can sec a parabolic stress distribution in the case without packing pressure. With packing pressure there is a local compressive stress maximum beneath the surface at about 7,/H = 0.93, obviously induced by the compression. This stress distribution is very similar to those found in polycarbonate14 . It will result in a gualit.ative1y similar ga.pwise densit.y variation as shown in Fig.5. But one must notice that the level of the stresses is very low. In the cross-sections, in which the density distributions were determined, the stress components in y and z directions will be insignjfi.c;ant because of the small dimensions with respect to the length 15. Therefore the trace of the stress tensor (;;;:; -p) will be only about one thi.rd of the measured stress. With a bulk modulus of 5100 MPa16 the ind1.Ked density variation will be less than 1 x 10⁻⁴ g/cm3 which is only a few percent of the measured variation. The residual stresses therefore cannot be responsible for the low density observed in the
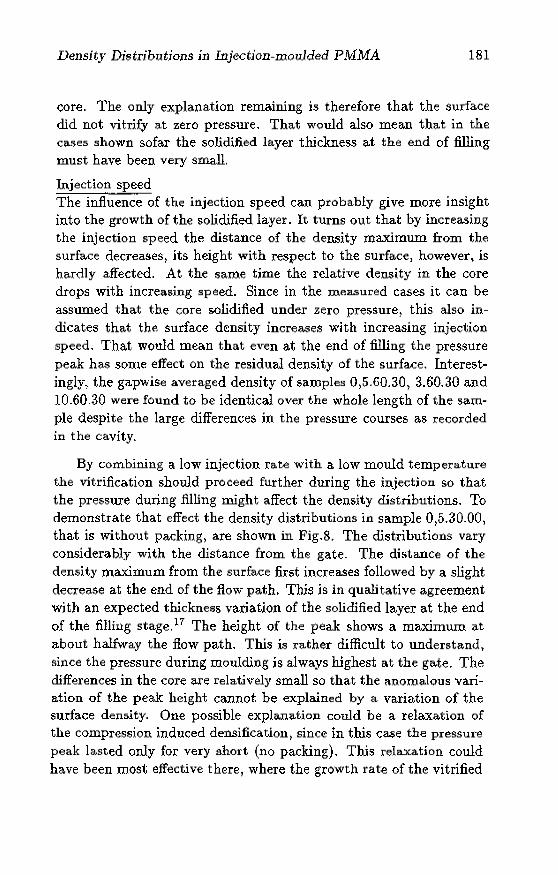
Density Distributions irl Injection-moulded PMMA 181
core. The only explanation remaining is therefore that the surface did not vitrify at zerO pressure. That would also mean that in the CMeS shown safar the solidified layer thickness at the end of filling must have been very small.
Injection speed The influence of the injection speed can probably give more insight into the growth of the solidified layer. It turns out that by increasing the injection speed the distance of the density maximum from the surface decreases, its height with respect to the surface, however~ is ha.rdly affected. At the sa.me time the relative density in the core drops with increasing speed. Since in the measured cases it can be assumed that the core solidified under zero pressure, this also indicates that the surface density increases with increasing injection speed. That would mean that even at the end of filling the pressure peak has some effect on the residual density of the surface. Interestingly? the gapwise averaged density of samples 0,5.60.30, 3.60.30 and 10.60.30 were found to be identical over the whole length of the sample despite the large differences in the pressure courses as recorded in the cavity.
By combining a low injection rate with a low mould temperature the vitrification should proceed further during the injection so that the pressure du:dng filling might affect the density distributions. To dernonstrate that effect the density distributions in sample 0)5.30.00, that is without packing, ate shown in Fig.8. The distributions vary considera.bly with the distance from the gate. The distance of the density maximum from the surface first increases followed by a slight decrease at the end of the flow path. This is in qualitative agreement with an expected thickness vatiation of the solidified layer at the end of the filling stage. n The height of the peak shows a maximum at about halfway the flow path. This is rather difficult to understand, since the pressure during moulding is always highest at the gate. The differences in the core are relatively small so that the anomalous variation of the peak height cannot be explained by a. variation of the surface density. One possible explanation could be a relaxation of the compression induced densification, since in this case the preSSUl'e peak lasted only for very short (no packing). Tills relaxation could have been most effective there, where the growth rate of the vitrified
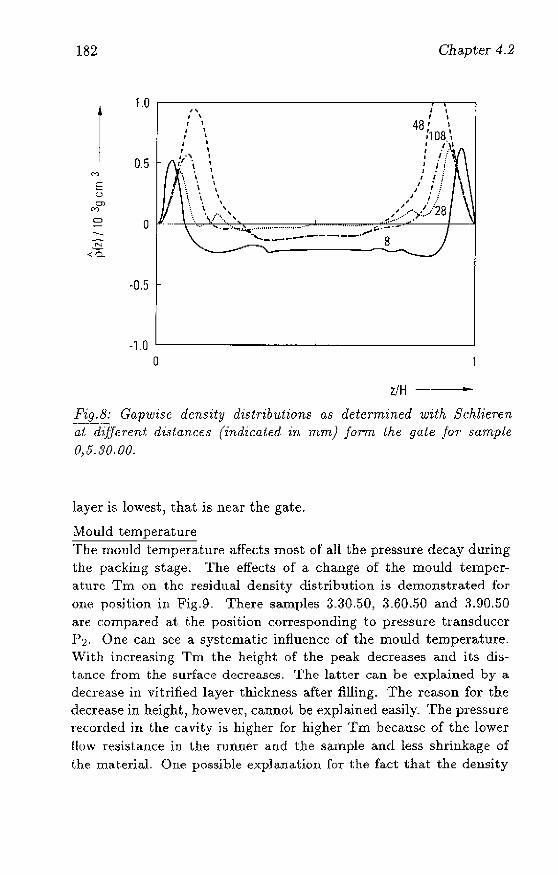
182
1 M
I E u OJ
'7 D
N
<~
1.0
0.5
" I \ I \
I \ I \
I \ I \
'i'. 1 I. \ '
\ \ " \ '\ \ \ '\ 1
\;. , : , I ....
\ \; ".' ....
ChapteT 4.2
j \ j \
48 j \
:1 08 ~ : /y I I! 'ii , - ~
I I' / i./
"J "../ /.···,//28 ,.:::----... ;. ... -
. - .J-.I..a,.; .......... , •........ , ..• ,.. . .......... ~. -- ....
-......-~--.-----. 8
-1.0 '-------_____ -----.J ________ -----l
o
z/H ...
Fig.8: Gapwise density distributions as determined with Schlieren -;X-(liifcmo:nt di.~ta,nr;e:.s (indicated in mm.) Jm-m the gale J01' sample 0,5.30.00.
layer is lowest, that is near the gate.
Mould temperature The mould temperature afrec;ts most of all the pressure decay during the packing stage. The effects of a change of the mould temperature Tm on the residual density distribution is demonstrated for one position in Fig.9. There sample!:! 3.30.50) 3.60.50 and 3.90.50 are compared at the position corresponding to pressure transducer P2. One ca.n sec a systematic influence of the mould temperature. With increasing 'T'rn the height of the peak decreases and its distance from the surface decreases. The latter can be explained by it deCl"eaSe in vitrified layer thickness after filling. The rcason for the decrease in height) however, cannot be expJained. easily. The pressure reconied in the cavity i~ higher for higher 'I'm because of the lower ll(lw re$irstan~;e iu the runner and the sample and less shrinkage of the material One pos!:!ible explanat;ion fm· the fact that the density
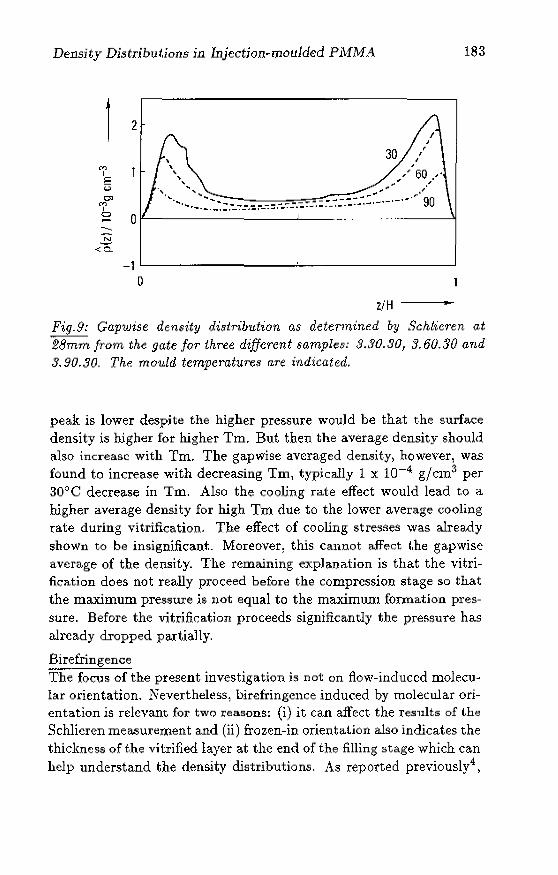
Density Distribu/,ions in Injection~moulded PMMA
M I E ~
OJ M
I a
O~----------------L---
-1L---------------~--------------~
o z/H ...
183
Fig- 9: Gapwise density di!)irib'utian as determined by Schlieren at 28mm from the gate Jor three different sample!): 3.30.30, 3.60.30 and 3.90.30. The mould temperature,~ are indicated.
peak is lower despite the higher pressure wQuld be that the surface density is higher for higher Tm. But then the average density shQuld also increase with Tm. The gapwise averaged density, however, was found to increase with decreasing Tm, typically 1 x 10⁻⁴, g/cm3 per 30°C decrease in Till, Also the cooHng rate effect would lead t.o a.
higher average density for high Tm due to the lower average cooling rate during vitrification. The effect of cooling stresses was already shown to be insignificant. Moreover, this cannot affect the gapwise average of the density. The remaining explanation is that the vitrification does not really proceed before the compression stage so that the maximum pressure is not equal to the maximum formation pressure, Before the vitrification proceeds significantly the pressure has already dropped partially.
Birefringence The focus of the present investigation is not on flow-induced molecu" lar orientation. Nevertheless j birefringence induced by molecular orientation is relevant for two reasonS: (i) it can affect the results of the Schlieren measurement and (ii) frozen-in orientation also indicates the thickness of the vitrified layer at the end of the filling stage which can help understand the density distributions, As reported previously4 j
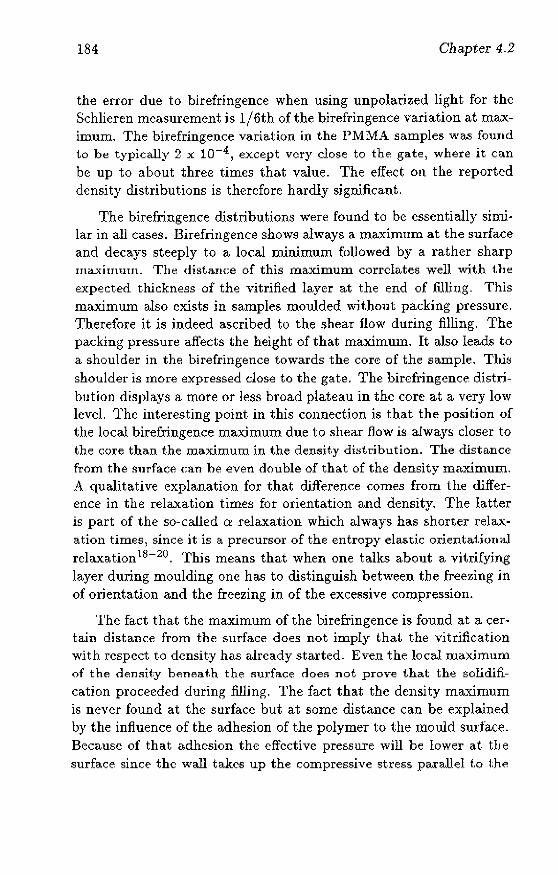
184 Chapter 4.2
the errOl" due to birefringence when using unpolarized light for the Schlieren measurement is 1!6th of the birefringence variation at maximum. The birefringence variati.on in the PMMA samples was found to be typically 2 x 10⁻⁴ , except very close to the gate) where it can be up to about three times that value. The effect on the reported density distributions is therefore hardly significant.
The birefringence clistributions Were found to be essentially similar in all cases. Birefringence shows always a. maximum. at the surface and decays steeply to a local minimum followed by a rather sharp maximuHI. The distance of this maximum correlates well with the expected thickness of the vitrified layer at the end of ftHing. This maximum also exists in samples moulded wit.hout packing pressure. Therefore it is indeed ascribed to the $hNr How during filling. The packing pressure affects the height of that maximum. It also leads to a shoulder in the birefringence towards the core of the sample. This shoulder is mOre expressed dose to the gate. The birefringence distribution displays a more or less broad plateau in the core at a very low level. The interesting point in this connection is that the position of the locaJ birefringence ma.rimum due to shear flow is always closer to the (~ore than the ma.rimum in the densit;y distribution. The distance from the surface can be even double of that of the density maximum. A qualitative explanation for that clifference comes from the difference in the relaxation times for orientation and density. The latter is part of the so-called Q relaxation which always has shorter relaxation times, since it is a precursor of the entropy elastic orientatimllw relaxation l8 - 2o . This means that when one talks about a vitrifying layer during moulding one has to distinguish between the freezing in of orientation and the freezing in of the excessive compression.
The fact that the maximum of the birefringence is found at: a certain distance from the surface does not im.ply that the vitrification with respect to density has already started. Even the local maximum of the density beneath the $urface does not prove that the solidification proceeded during filling. The fact that the density maximum is never found at the surface but at some distance can be explained by the influence of the adhesion of the polymer to the mould surface. Because of that adhesion the effective pressure will be lower at tlJe surface since the wall takes up the compressive stress parallel to the
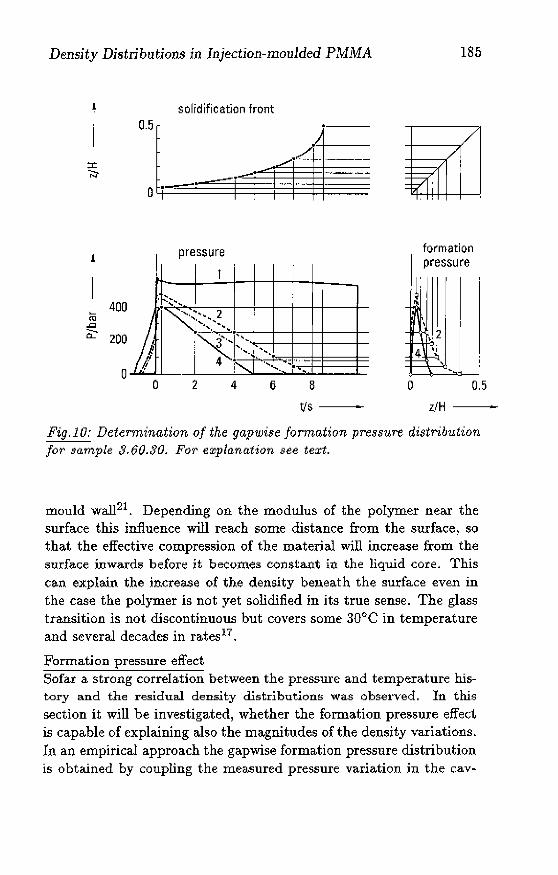
Density Distributions in Injection-moulded PMMA
solidification front
pressure
1
. ,~ -........
~ " 2
~"'" Ii ... · ... ·f ....... rj 4 i,' ... ~. '. o o 2 4 6 8
tis ---
185
formation pressure
4 ':~ '---' ~,
o 0.5
z/H
Fig. 1 0; Determination of the gapwise formation pre!5!5ure distr-ibution for sample 3.60.30. For explanation see text.
mould wall21 . Depending on the modulus of the polymer near the surface this influence will reach some distance from the surface) 50
that the effective compression of the material will increase from the surfa.ce inwa.rds before it becomes constant in the liquid core. This can explain the increase of the density belleath the surface even in the case the polymer is not yet solidified in its true sense. The glass transition is not discontinuous but covers some 30°C in temperature and several decades in rates l7 .
Formation pressure effect Sofar a strong correlation between the pressure and temperature history and the residual density distributions was observed. In this section it will be investigated, whether the fonnation pressure effed is capable of explaining also the magnitudes of the density variations. In an empirical approach the gapwise formation pressure distribution is obtained by coupling the measured pressure variation in the cav-
..
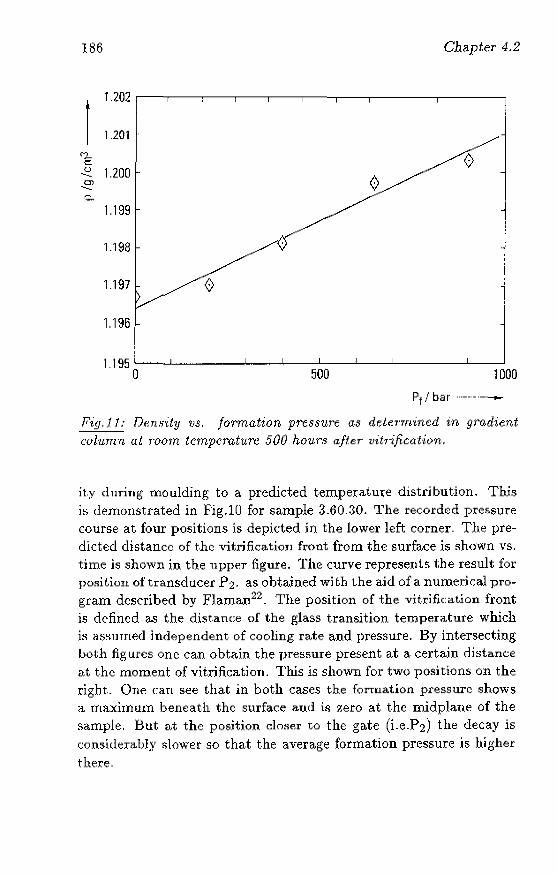
186 Chapter 4.2
1
1.202
1.201 ("')
E u 1.200 --Ol --0..
1.199
1.198
1.197 0
1.196
1.195 a 500 1000
Ptf bar .. ---·---
Pig. 11: Dwn8dy V8. j07'mation pressure a5 del€1'Tn'ined in gradie.nt
column at mom temperature 500 hou.rs after' vit'rification.
ity during moulding to a predicted temperature distribution. This is demonstrated in Fig.lO for sample 3-60.30. The recorded pressure course at four positions is depicted in the lower left corner. The predicted distance of the vitrification front from the surface is shown vs. time is shown in the upper figure. The curve represents the result for position of transducer P2. as obtained with the aid ofa numerical pro
gram described by Plaman22 . The position of the vitrifi~;ation front is defined as the distance of the glass transition tempera.ture which is I:l.s~mmed independent of cooling rate and pressure. By intersecting both figures one can obtain the pressure present at a certain distance at the moment of vitrification. This is shown for two positions on the righL One ca.n see that in both ca.ses the fon:nation pressure shows a. maximum beneath the surface and is zero at the midplane of the sample. But at the position closer to the gate (i.e-P2) the decay is considerably slower so that the average formation pressure is higher there.
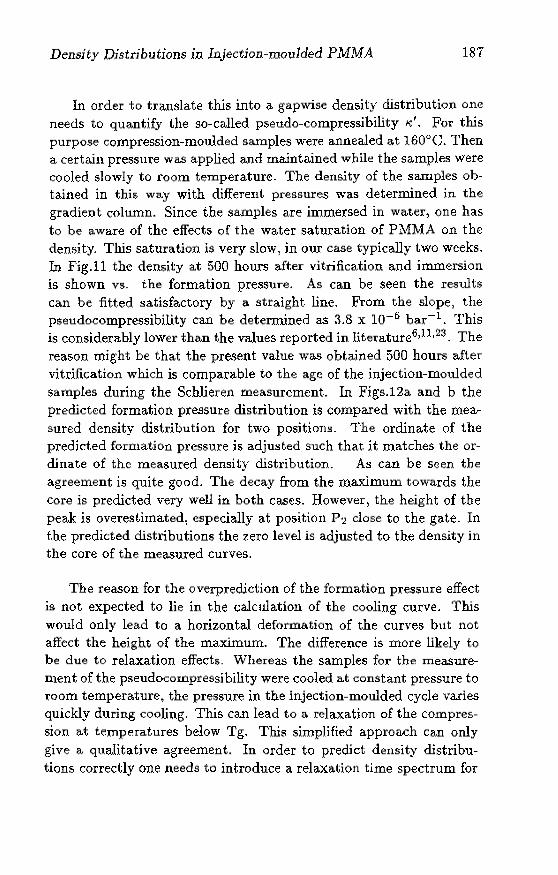
Density Distributions in Injection-moulded PMMA 187
In order to trauslate tills into a gapwise density distribution one needs to quantify the so-called pseudo-compressibility /'i,'. For this purpose cmnpression-moulded samples were annealed at 160"C. Then a certain pressll.re was applied and maintained while the samples were cooled slowly to room temperature, The density of the samples obtained in this way with different pressures was determined in the gradient column. Since the samples are immersed in water; one has to be aware of the effects of the water saturation of PMMA on the density. This saturation is very slow) in our case typically two weeks. In Fig.ll the density at 500 hours after vitrification and immersion is shown vs- the formation pressUJ-e. As can be seen the results can be fitted satisfactory by a straight line. From the slope, the pseudocompressibility can be determined as 3.8 x 10⁻⁶ bar-i. This is considerably lower than the values reported in iiterature6,1l,n, The reason might be that the present value was obtained 500 hours after vitrification which is comparable to the age of the injection-moulded samples during the Schlieren measurement. In Figs.12a and b the predicted formation pressure distribution is compared with the mea~ sured density distribution for two positions. The ordinate of the predicted formation pressure is adjusted such that it matches the ordinate of the measured density distribution. As can be seen the agreement is quite good. The decay from the maxlmum towards the core is predicted very well in both cases. However, the height of the peak is overestimated, especially at position P2 close to the gate. In t.he predicted distributions the zero level is adjusted to the density in the core of the measured curves.
The reason for the overprediction of the forma.tion pressure effect is not expected to lie in the calculation of the cooling curve. This would only lead to a horizontal deformation of the curves bllt not affect the height of the maximum. The difference is more likely to be due to relaxation effects_ Whereas the samples for the meaSurelllent of the pseudocornpressibility were cooled at constant pressure to room temperature, the pressure in the injection-moulded cycle varies quickly during cooling. This can lead to a relaxation of the compression at temperatures below Tg. Tills simplified approach can only give a qualitative agreement. In order to predict density distributions correctly one needs to introduce a relaxation time spectrum for
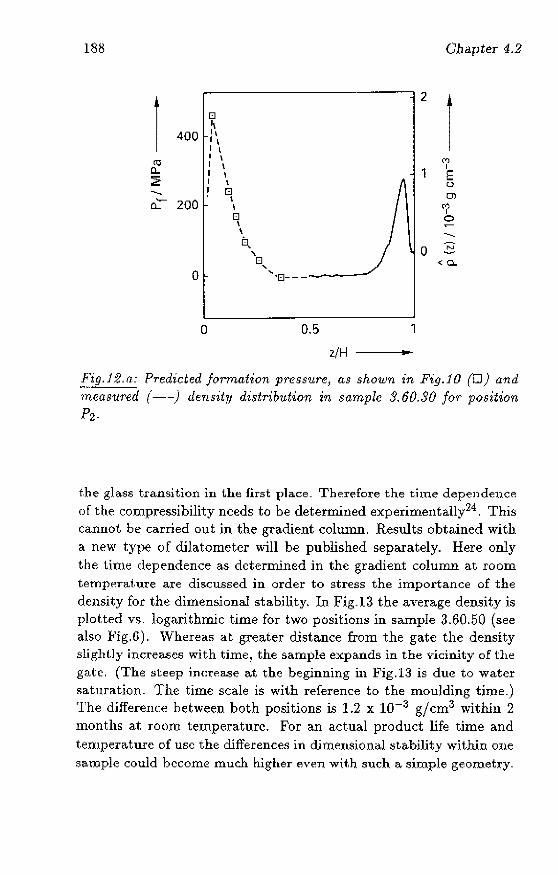
188 Chapter 4.2
1
2
1 [J 1\
400 1\ 1\ I \ I \ M (1J I \ I Cl.. I \ 1 E :2 I \ u
--- ~ [J OJ
~ 200 \ \ 1 [J 0
\ \
---0. 0 ~ " [J .... <Q.
0 ... '[J---
o 0.5 1
z/H ...
!!:ig . .f 2. fL: Predicted formation pressure, as shown in Fig. 1 0 (0) and measured (--) density di.~tribution in sample 3.60.30 for position Pz.
the gla.ss transition in the first place. Therefore the time dependence of the compressibility needs to be determined experimentally24. This cannot be carried out in the gradient coluum. Results obtained with a new type of dilatometer will be published separately. Here only the time dependence as determined in the gradient column at room temperature are discussed in order to stress the importance of the density for the dimensional stability. In Fig.13 the average density is plot.ted VI':. logarithmic time for two positions in sample 3.60.50 (see also Fig.G). Whereas at greater clista.nce from the ga.te the density slightly increases with time, the sample expands in the vicinity of the gate. (The steep increase at the beginning in Fig.13 is due to water :o;atllration. The time scale is with reference to the mouJding time.) The difference between both positions is 1.2 x 10⁻³ g!cm3 within 2 months at room temperature. For an actual product life time and temperature of use the differences in dimensional 8tability within one sa.mple could become much higher even wit.h such a. simple geometry.
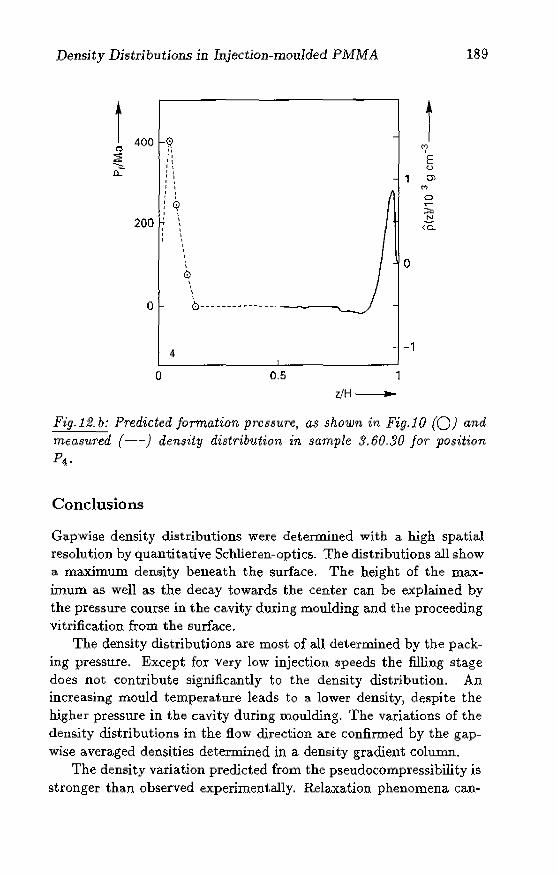
Density Distributions in Injection-moulded PMMA
t 400 ~ ~ 'I :a: I,
'I """'- I,
0... ' I I I , I
I I , , , I
~<il
200
o
4
o
I
I
o , o
I
b--- ----".- -- -- ~~----..
- -1
0.5
z/H----
189
t
Fig.12.b: Predicted formation pressure, as shown in Fig.10 (0) and measured (--) density distribution in sample 3.60.30 for position
P1'
Conclusions
Gapwise density distributions were determined with a high spatial resolution by quantitative Schlieren-optics. The distributions all show a maximum density beneath the surface. The height of the ma.ximum as well as the decay towards the center can be explained by the pressure cour5e in the cavity during moulding and the proceeding vitrification from the surface.
The density distributions are most of all determined by the packing pressure. Except for very low injection speeds the filling stage does not contribute significantly to the density distribution. An increasing mould temperature leads to a lower density) despite the higher pressure in the ca.vity during moulding. The variations of the density distributions in the flow direction are confirmed by the gapwise averaged densities determined in a density gra.dient column.
The density variation predicted from the pseudocompressibility is stronger than observed experimentally. Relaxation phenomena ca.n-
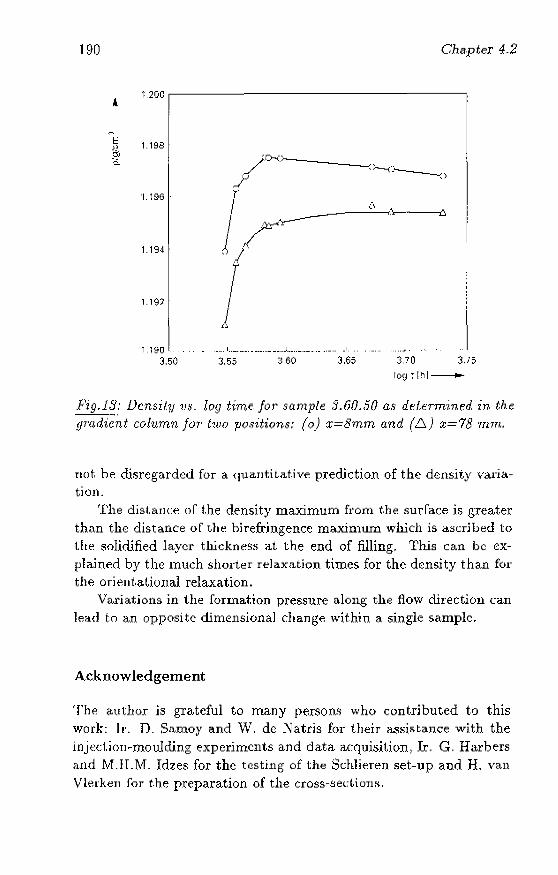
190 Chapter 4-2
t 1.200 r-------------------------,
~
I::: " 1.198 a, c..
'1.196 .
1.194
1.192
1,190 . 3,50
... ,I .. __ .•. , ... ,., ___ ., .•. ,_ .. ", .. L •..•. ".,.,., .• ", .. , .. ,. "I,. .",J,
3,55 3,65 370 3,15
Pig.13: iJcnsil]/ 'V,~_ log time for sample ,'1.60.50 as df:{e.rm'i11.f;:d in the f/mdi~';t column for· two positions: (0) x=8mm and (.6) );=78 mm..
not he clisregardcd for a quantitative precliction of the density variation.
The dist.allce or the density maximum from the surface is greater than the distance of the birefdngence maximum which is ascribed to t.he solidified layer thickness at the end of filling. This can be explained by the much shorter relaxation times for the density than for the oriel)t,a,tional relaxation.
Variations in the [ormation pressure along the flow direction can lead to an opposite dimensional change within a single sample.
Acknow ledgement
The author is grateful to many persons who contributed to this work: Ir. D- Samoy and W. de Natris for their assista,nce with the injcc1.ioIl~nlOulding experiments and data acqui5itioTI) IT. G. Harbers and M.lLM_ ldzes for the testing of the Schlieren set-up and R van VIerken for the preparation of the cross-sections.
Density Distributions jn Injection-moulded PMMA 191
References
1. Kovacs,A.J., Fortsch.Hochpolym. Forsch., 3, 394 (1963)
2. Goldbach,G., Rehage,G., RheoLActa, 6, 30 (1967)
3. Struik,L.C.E, "Physical Aging of Amorphous Polymers and Other Materials", Elsevier, Amsterdam (1978)
4. Wimberger-Friedl,R., Prast,G., Kurstjens,A.V., De Bruin,J .G., to a.ppear in J.Polyro.Sci.-B Polym.Phys., 30 (1992) (Chapter 4.1)
5. McKinney).E., Goldstein,M.J., J.Res.Nat.Bur.Stand., 18A j 331 (1974)
6. Bree,H.W., Heijboer,J., Stmik,L.C.E., Tak, A.G.M.J'J J .Polym.Sci.B Polym.Phys.Ed., 12, 1857 (1974)
7. Tan,V., Kamal,M.R., J.Appl.Polym.Sci. 22, 2341 (1978)
8. Kamal,M.R., Moy,FJf., J .AppLPolym.Sci. 28, 1787 (1983)
9. Isaycv,A.L, Hariharan,T., Polym.Eng.Sci., 25, 271 (1985)
10. Greener,J., Polym.Eng.sci., 26, 534 (1986)
11. McKinney,J .E., Siffiha,R., J.Re!l.Nat.Bur.Stand., S1A, 283 (1977)
12. Treuting,RG., Read,W.T., J.Appl.Phys., 22, 130 (1951)
13. Waxler,RM' j Horowitz,D' J Feldmann,A., AppLOptics, 18, 101 (1979)
14. Wimberger-Friedl,R., 1)ubmitted to J.Polym.Sci. Polym.Phys. (Chapter 3.3)
15. Wimbergcr-Friedl,R., De Bruin,J.G., submitted to J.Polm.Sci. Polym.Phys. (Chapter 3.2)
16. Van Krevelen,D.W., Hoftyzer)P.J., "Properties of Polymers", Elsevier, Amsterdam, 1976
17. JaneschiL:-,-Kl"iegl,H.,RheoLActa, 18,693 (1979)
192 Chapter 4.2
18- Ferry) ,D" " Viscoelastic Properties of Polymers", J. Wiley, New York (1980)
1.9- Aklonls,J.J., Polym.Eng.Sd., 21, 896 (1981)
20, Plazek,D,J., Rosncr,M.J., Plazek,D.L., J.Polym.Sci.-B Polym.Phys., 26, 473 (l988)
21. Baaijens,F.P.T" RheoLActa 30, 284 (1991)
22. Flaman,A.A.M., "Build-up and Relaxation of Molecular Orientation in Injection Moulding" j Thesis, Eindhoven (1990)
23. ShiHhkin,NJ_, Sov_Phys, Solid State Phys., 2, 322 (1960)
24_ Tribone) .J-, O'Reilly,J.M., Greener,J., J.Polym.sci.-B Polym.Phys. 27, 837 (1989)
Part 5
Injection-moulded Optical Components
193
Chapter 5.1
Analysis of the Birefringence Distributions in Compact Discs of Polycarbonate1
ABS'fRACT: The birefring~nce distributions in injectionmolded Compact Discs (CD) are determined in radial and tangential cross-sections and interpreted in terms of the process. The influence of processing conditions is discussed in several examples. It is shown that despite the hlgh birefringence level the retardation of a beam of normal incidence is almost zero due to several compensation mechanisms. One optical axis is almost perpendicularto the surface. The mediuffi)however, is biaxial with the prefer-ential directions depending on the distance from the surface and the radial position. In contrast to a parallel beam zero retarciati(m cannot be achieved with a COIl
vergent beam in injection-molded polycarbonate disks for that reason.
lreprinkd from: R Wimberger-}i\,iedl, Po/ym..gng.Sci.30 (1990) 813
195
196 Chapter 5.1
Introduction
The most severe problem in the mass production of the Compact Disc (CD) w~ing the injection-molding technique was the birefringeIlce of the polycarbonate (PC) substrate. The retardation of the laser beam hat! to be less than 50 nm, single pass1,2. Although the problem was solved technologically3-7, there is still a need for a better understanding of what determines the residual birefringence and how it can be controlled. One of the reasons is the introduction of erasable optical disks like the magneto-optical disk, where the information is detected as a rotation of the polarization of the laser beam. 'J'herefore the retardation in the substrate of thjs type has to be considerably lower than in the CD. Especially the frequency of the variation of the retardation along the trace of the laser beam is critical.
Several attempts have been made to explain the influence of proc:;essing on the residual optical retardation and the performance of the CD8- i5 . However, no satisfying explanation of the observed sensitivity of the retardation on small variations in processing has been given because only the integral retardation over the disk thickness was determined. In the present investigation the influence of the filling, packing and cooling stage on the residual birefringence distributions in the cross-sections of the disks will be discussed as well as the consequenc:;es for the integral retardation.
Theo:ry
As will be shown, a thorough understand.ing of the injection-molding process and the stress-optical behaviour of the polymer is the key to understanding the retardation of the light passing through t.he ~lUbstrate. To fa.cilita.te the discussions both item.s will be introduced briefly.
Stress-Optical Behavior
The refractive index in a material point of a transparent birefringent medium can be represented by a second rank tensor or geometrically by an ellipsoid, the so-called indicatrix. The axes of this refractive index ellipsoid represent the preferential directions ofthe medium, their lengths are equal to the refractive index for the respective directions
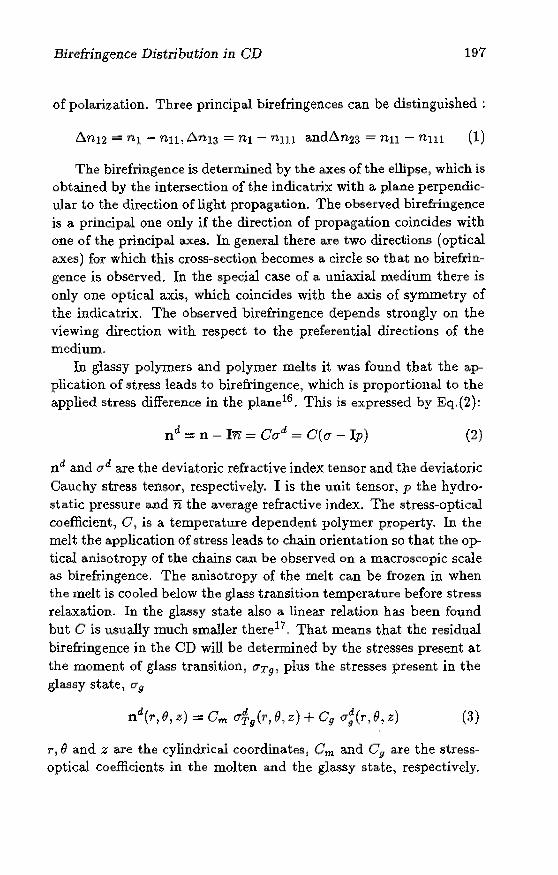
Birefringence Distribution in CD 197
of polarization. Three principal birefringences can be distinguished:
The birefringence is determined by the axes of the ellipse) which is obtained by the intersection of the indicatrix with a plane perpendicular to the direction oflight propagation. The observed birefringence is a. principal one only if the direction of propagation coincides with one of the principal axes. In general there are two directions (optical axes) for which this cross-section becomes a circle so that no bireftingence is observed. In the special case of a uniaxial medium there is only one optical axis) which coincides with the axis of symmetry of the indicatrix. The observed birefringence depends strongly on the viewing direction with respect to the preferential directions of the medium.
In glassy polymers and polymer melts it was found that the ap~ plication of stress leads to birefringence, which is proportional to the applied stress difference in the plane16 . This is expressed by Eq.(2):
(2)
n d and ad are the deviatoric refractive index tensor and the deviatork Cauchy stress tensor, respectively. I is the unit tensor, p the hydro· static pressure and n the average refractive index. The stress-optical coefficient, 0, is a temperature dependent polymer property. In the melt the application of stress leads to chain orientation so that the optical anisotropy of the chains can be observed on a macroscopic scale as birefringence. The anisotropy of the melt can be frozen in when the melt is cooled below the glass transition temperature before stress relaxation. In the glassy state also a linear relation has been found but C is usually much smaller there17. That means that the residual birefringence in the CD will be determined by the stresses present at the moment of glass transition, O''Tg) plus the stresses present in the glassy state, 0' 9
(3)
1", Band z are the cylindrical coordinates j Om and Cg are the stressoptical coefficients in the molten and the glassy state, respectively.
198 Chapter 5 . .1
One ha~ to be aware of the fact that this is not the arithrnetjc; but the t~nsorial sum of both contributions. In bisphcnol-A polyc<Hbonat.~ C is posjtive and high both in the melt and the glassy state 10,18.
Injection Molding
Dllriug t.he filling stage the melt flows from a central gate towards the rim. Three different types of flow can be distinguished: (a) The velocity of the melt is zero at the cavity surface and a maximum in the midplane of the cavity. Since the shape of the flow front does not change, the melt arriving from the core must be elongated towards the wall leading to the well-known fountain flow at the frollt l9 . The rate of elongation at the front is proportional to the radial velocity. (b) From the gate toward~ the rim the cin:umJerence of the melt increases. Therefore the melt will be elongated .in tangential diredion at a tate pl"Oportional to the radial velocity. (c) The third) rheologically dominating, flow type i~ the shear flow due to the velocit.y gradient. in the thickness direction. As soon as the melt makes contact with the UloId wall at the flow front solidification starts penetrating towards the ~;Ore 50 that the stresses present in the solidifying layer and the corresponding chain orientaion are frozen in. But the growth of the solid layer 1jlows down quickly because of the convection of heat by the flow.
A t the end of the filling stage the bulk is compressed. The volume flux at a certain dista.nce from the gate is determined by the compression and therma.l shrinkage in the volume behind it. The solidification proceeds much faster than during fil1ing 50 t.hat also t.he stres~e~ creat~d by the compensation flow are frozen in. In the solidified part the thennal ~hrinkage cannot. be compensated anymore so that finally tensile cooling stresses develop in t.he core€·g·18,20-22.
Retardation
Because of this cOTnpJicated stress-temperature history the residual birefringence will vary considerably) especially in the thickness direction. However, symmetry with respect to the a.xi~ and the midplane of the disk can be pre~ll11Jed. For the application only the retardation of t}H' f(l(cussed IMer beam
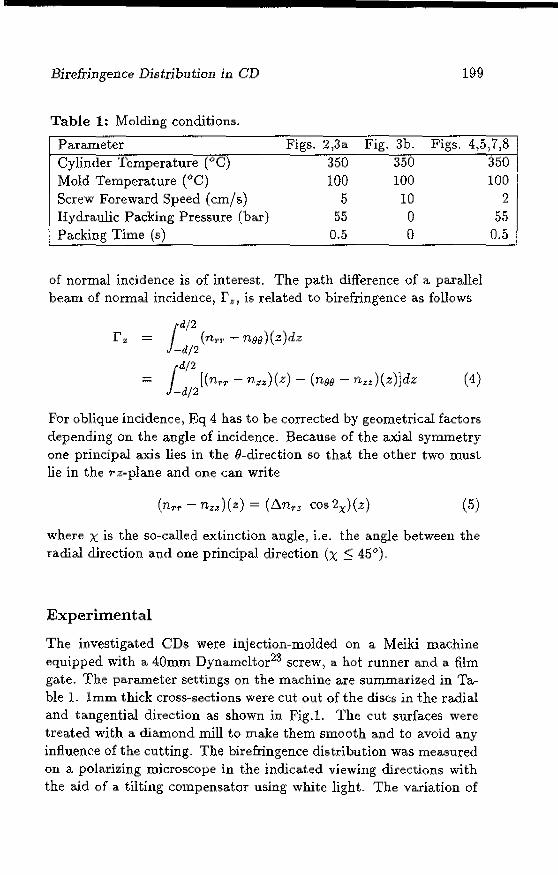
Birefringence Distribution in CD 199
Table 1: Molding conditions.
Parameter Figs. 2,3a Fig. 3b. Figs. 4,5)7,8 Cylinder Temperature (,'0") 350 350 Mold Temperature (°0) 100 100 Screw Foreward Speed (cm/s) 5 10 Hydraulic Packing Pressure (bar) 55 0 Packing Time (s) 0.5 0
of normal incidence is of interest. The path difference of a parallel beam of nonnal incidence) r z) is related to birefringence as follows
rz = jd/2 (nt'?, - nBB)(z)dz
-d/2
ld/ 2
;;;;; [(nrr - nt.::)(z) - (n.9.9 - ntz)(z)Jdz -d/2
(4)
For oblique incidence, Eq 4 has to be corrected by geometrical factors depending on the angle of incidence. Because of the axial symmetry one principal axis lies in the O-direction so that the other two must lie in the T z-plane and one tan write
(5)
where X is the so-called extinction angle, i.e. the angle between the radial direction and one principal direction (X :$ 45°).
Experimental
The investigated CDs were injection-molded on a Meiki machine equipped with a 40mm Dynamcltor23 screw, a hot runner and a .film gate. The parameter settings on the machine are summarized in Table 1. Imm thick cross-sections were cut out of the discs in the radial and tangential dir-ection as shown in Fig.1. The cut surfaces were treated with a diamond mill to make them smooth and to avoid any influence of the cutting. The birefringence distribution was measured on a polarizing microscope in the indicated viewing directions with the aid of a tilting compensator using white light. The variation of
350 100
2 55
0.5 -
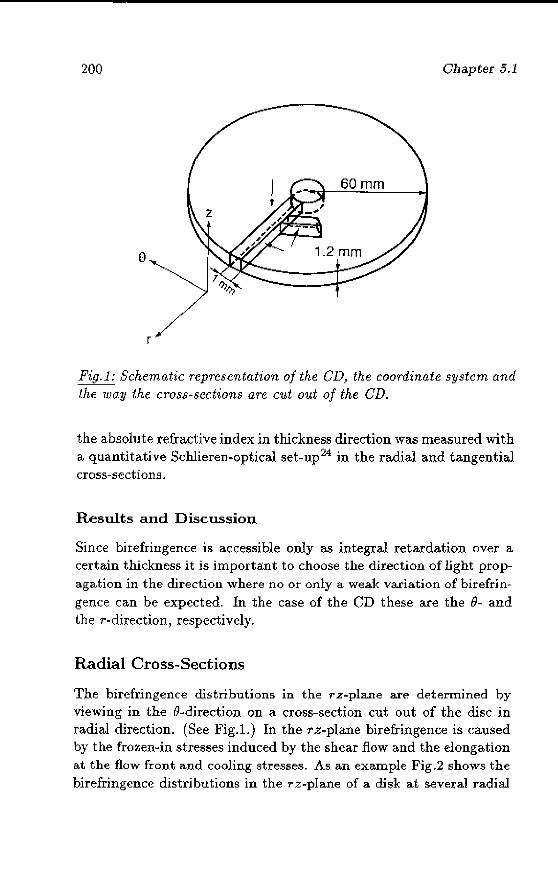
200 Chapter 5.1
60mm
o
r
Fig. 1 : Schematic representation of the CD, the coordinate system and the. way the cross-sections are cut out of the CD.
the absolute :refractive index in thickness direction was measured with a quantitative Schlieren-optical 5et~up24 in the radial and tangential cross-sections.
Results and Discussion
Since birefringence is accessible only as integral retardation over a certain thickness it is importa.nt to choose the direction of light propagation in the direction where no or only a weak variation of birefringence can be expected. In the case of the CD these are the ()- and the T-direction J respectively.
Radial Cross-Sections
The birefringence distributions In the T z-plane are determined by viewing ill the O~directioD on a cross-section cut out of the elise in radial direction. (See Fig.l.) In the 'i"z-plane birefri.ngence is caused by the fr()zen"in stresses induced by the shear flow and the elongation at the flow front and cooling stresses. As an example Fig.2 shows the birefringence distributions in the T z-plane of a disk at several radial
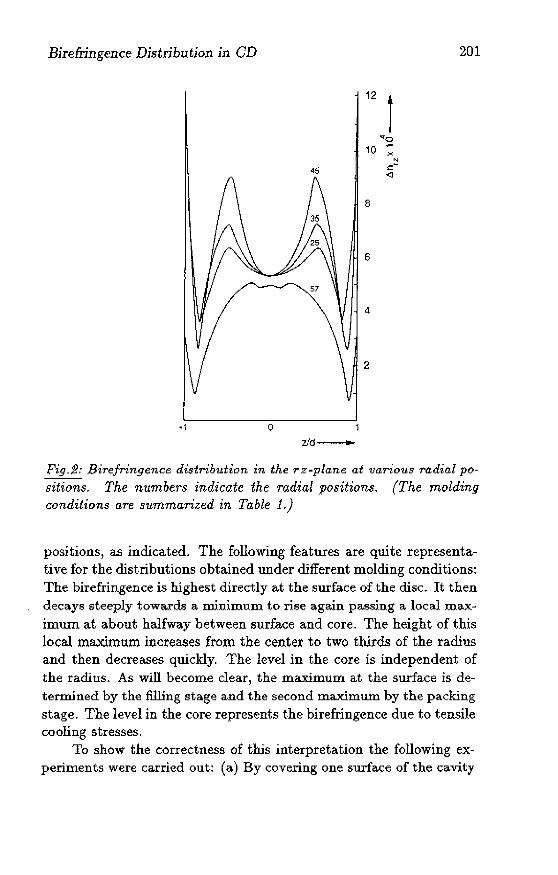
Birefringence Distribution in CD 201
12
) "'0
10 -x
" 45 -=.--<I
8
·1 o
Fig.2: Birefringence di!$lribution in the rz-plane at various radial positions. The numbers indicate the radial positions. (The molding conditions are summarized in Table 1.)
positions) as indicated. The following features are quite representative for the distributions obtained under different molding conditions: The birefringence is highest directly at the surface of the disc. It then decays steeply towards a minimum to rise again passing a local maXimum at about halfway between surface and core. The height of this local maximum increases from the center to two thirds of the radius and then decreases quickly. The level in the core is independent of the radius. As will become clear) the maximum at the surface is determined by the filling stage and the second maximum by the packing stage. The level in the core represents the birefringence due to tensile cooling stresses.
To show the correctness of this interpretation the following experiments were carried out: (a) By covering one surface of the ca.vity
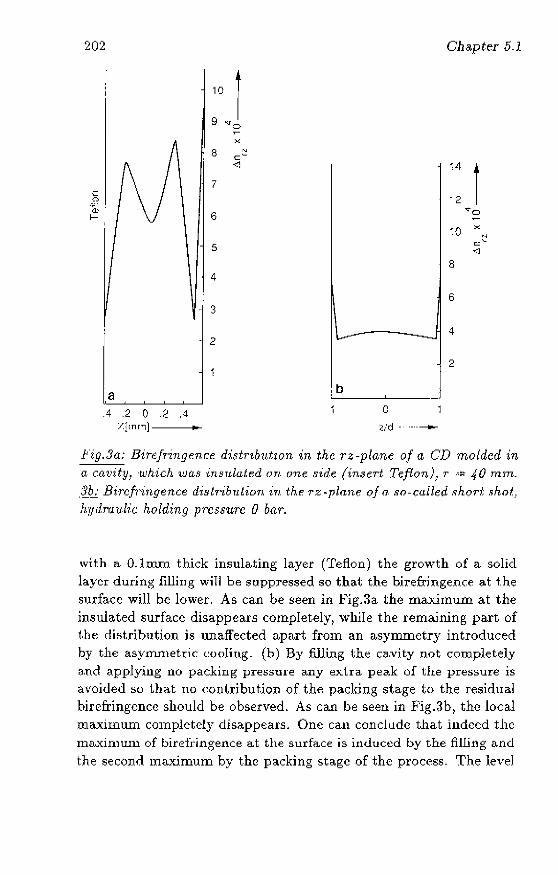
202
c o 'ill I-
a .4 .2 0 .2 .4
/.[rnrT11----i~-
10 1 9 "'0
><:
8 c <l
7
6
5
4
3
2
~
b
o dd .. -.......
Chapter 5.1
14 1 12
8
6
4
2
Fig.Sa: Bir41'ingence d1:stribntion in the rz-plane of a CD molded in a cavity, which waB insulated on one .~ide (inse.rt Te.fton)) r .':>:" 40 mm_ :J....lz.;. Birefringence d'islribTLlion in the T z -pla,ne of a so"called short ,~hot! hydmnlic holding pressure 0 bar.
with a O-lmm thick insulating layer (Teflon) the growth of a solid layer during filling will be suppressed so that the birefringence a.t the surface will be lower. As can be seen in Fig,3a the maximum at the 1nsulated surface disappears completely, while the remaining part of the diHtriblltion 1S unaffected apart from an asymmetry introduced by the asymmetric: coollng_ (b) By filling the ca,v1ty not completely a,ud applying no packing pressure any extra peak of the pressure is avoided so that. no contribution of the packing sta.ge t<) the residllal birefringence should be observed. As can be seen in Flg.3b, the local maximum completely disappears. One can conclude that indeed the maximulll of birefringence at the surface is induced by the filling and the second maximum by the packing stage of the process- The level
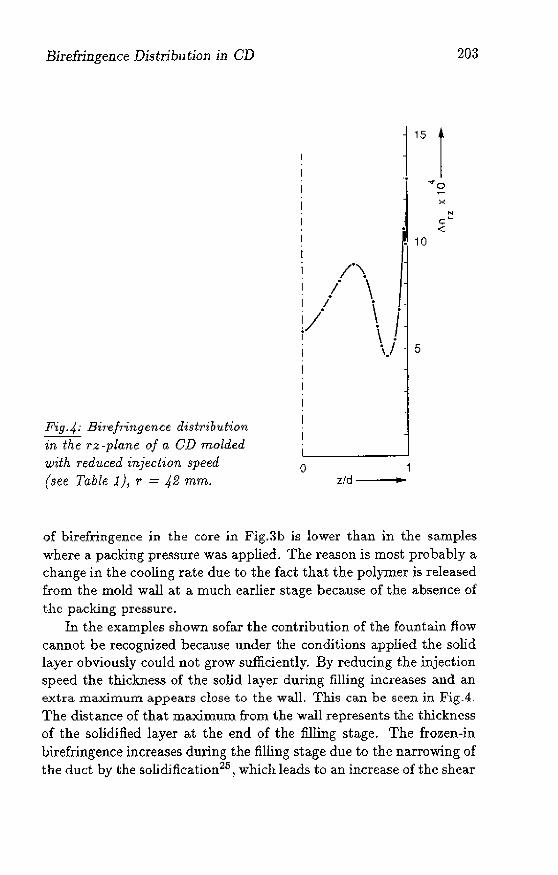
Birefringence Distribution in CD
Fig.4: Bir'ejringence distribution in the rz-plane. of a CD m.olde.d with reduced injection speed (see Table. 1), r = 42 mm.
/"\ ! \
• 10
I I 0
i/o \ i \ . \/ 5
o z/d ---I ......
203
x
of birefringence in the COre in Fig.3b is lower than in the sa.mples where a packing pl'e~flUl'e was applied. The reason is most probably a change in the cooling rate due to the fact tha.t the polymer is released from the mold wall at a much earlier stage because of the absence of the packing pressure.
In the examples shown sofar the contribution of the fountain flow cannot be recognized because under the conditions applied the solid layer obviously could not grow sufficiently. By reducing the injection speed the thickness of the solid layer during filling increases and an extra maximum appears close to the wall. This ca.n be seen in FigA. The distance of that maximum frOID the wall represents the thickness of the solidified layer at the end of the filling stage. The frozen~in birefringence increases during the filling stage due to the narrowing of the duct by the solidification 25, which leads to an increase of the shear
204 Chapter 5.1
stresses. The superposition of the decreasing frozen-in elongation and the increasing frozen-in shear stress leads to a local minimum~ at only about twenty micron from the surface in this case. This distance corresponds weU with the penet.ration depth of the wall temperature in the time intenal necessary to before shear flow is established behind the flow front.
One important contribution remains to be discussed: that of the cooling stresses. Since the level of birefringence in the midplane is the same for all saTIlp]es molded at the same mold temperature it is likely that tllis is solely determined by cooling stresses- That does not THean that there is no frozen-in orientation) sim:e it has been shown that cooling stresses can lead to orientation especially when the sample is constrained by mold walls 18,26. The principal direction will, however~ always be parallel to the wall (x ~ 0). Since PC behaves very anelastlc 10,18,27 the principal direction of the birefringence due to shear-stresses will be close t.o 45° with respect to the flow direction. Sadron28 gave a formula to calcula.te the birefringence and extinction angle when several contributions are superimposed
Ei ~ni sin 2xi and tan 2 - -'---------'-"-X - I\ Ani cos 2xi
(6)
If we distinguish only two contributions) namely one with Xi = 0° one with Xj = 45°, Bq 6 becomes very simple and can be solved when .6.n and X is known
(7)
Cornpa.ring Eq-7 with Eq-5 teaches us that the shear component at 45° does not contribute to the retardation of a beam of normal incidence.
As an .illustrative example) the splitting of the birefringence distribution into an ~elongational' and )shear) contribution is shown in Fig.5 for the distribution already shown in FigA. The lower curve shows the extinction angle distribution. We see that the positions of the maxima of the angle coincide with those of the local maxima of the birefringence distribution. The extinction angle is almost equal
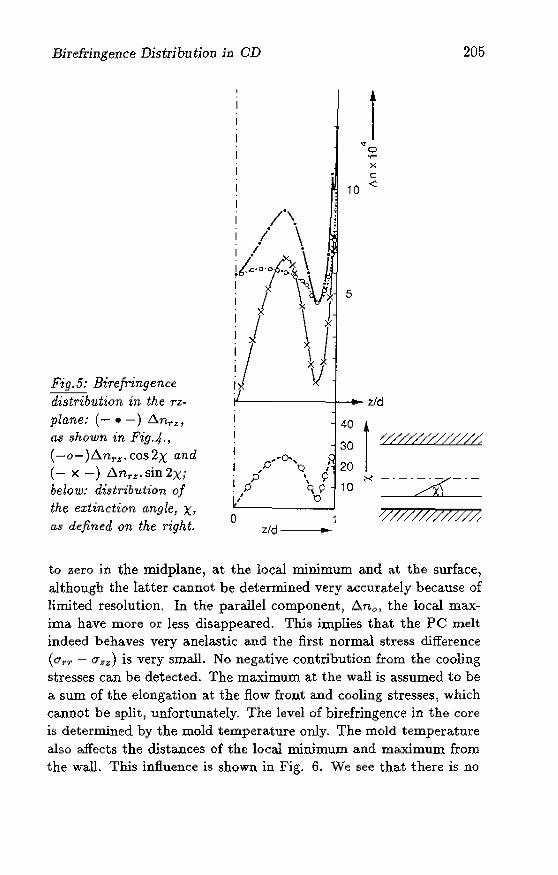
Birefringence Distribution in CD
1 ... o .,... x c
10 -<l
205
Fig.5: Birefringence distribution in the rzplane: (- • -) An,.", as shown in Fig.4., (-o-)6.nrz.cos2X (Lnd
(- x -) 6.n,.~. sin 2X; below: distribution of the extinction angle., X, as defined on the. right.
1'-------+_ ... zid
40 r 30 'i////////////
20 10 ;-< ----&---
o /////////-//:; z/d ...
to zero in the midplane, at the local minimum and at the surface, although the latter cannot be determined very accurately because of limited resolution. In the parallel component, L\nOl the local maxima have more or less disappeared. This implies that the PC melt indeed behaves very aneiastic and the first norma.l stress difference (ert't' - CTzz ) is very small. No negative contribution from the cooling stresses can be detected. The maximum at the wall is assumed to be a sum of the elongation at the flow frout and cooling stresses) which cannot be split, unfortunately. The level of birefringence in the core is determined by the mold temperature only. The mold temperature also affects the distances of the local minimum and maximum from the wa.IL This influence is shown in Fig. 6. We see tha.t there is no
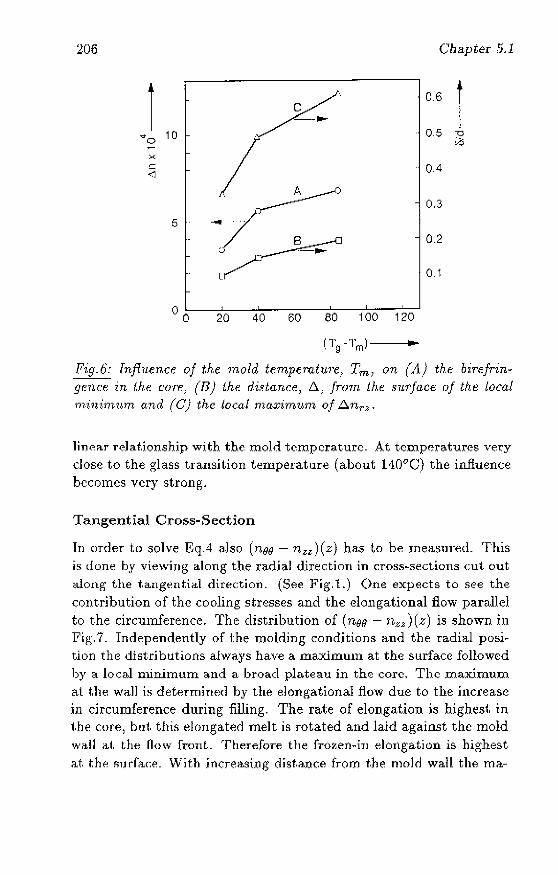
206
r .... 0 10
x c <I
5 .......
/~ I .. r-
20 40 60 80 100 120
(T9 -Tm) ...
Chapter Ed
0.6
r 0.5 "D
'<;
0.4
0.3
0.2
0.1
Fig.6: Tnfiu.ence of the mold temperahtTe1 Tml on (A) the bire.frin.1e·71.C~ in the COT'e., (n) the dista.nr.e., 6.., jT'Oln lh~ slLrface oj the local rninimnm and (e) the tocal maximum of ..6.nrz ,
linear relationship wjth the mold temperature, At temperatures very close to the glass transition temperature (about l100C) the influence becomes very strong.
Tangential Cross-Section
In order to solve Eq.4 aJso (11,00 - 11,.1'.1')(z) has to be meMllred_ This is done by viewing along t.he rad.hl direction in crosswsect.ions cut out along the tangential direction. (See Fig.l.) One expects to see the contribution of the cooling stresses and the eiongational flow parallel to the circumference, The distribution of (noB - nzz)(z) is shown in Pig.7. Independently of the mol.ding conditions and the radial posi~ tion the distributions always have a maximum at the surface followed by a local minimum and a broad plateau in the core, The maximum at. t.he wall i~ dderrnined by the elongational flow due to the increase in circumference during filling, The rate of elongation is highest in the core) but this elongated melt is rotated and laid against the mold wall at t.he now f,ont.. Therefore the fro;"en"in elongation is highest at the surface. With increa.sing distance from the mold wall. the ma-
Birefringence Distribution ill CD 207
teriaJ originates from a layer with If:ss elongation and has had more time to relax 50 that we observe a steep decrease of birefringence. In the disc, which had been molded with an in8ulating sheet on one side also the ma:x.imum at the surface in the 8z-plane disappeared. (As demonstrated for the Tz~plane in Fig.3a-)
The second ma.:cinlum in the 6nr;::-distribution originating from the shear flow during the filling and packing stage is absent in the Oz-plane. This is understandable} since the rate of elongation is always highest in the cOre and not at the solidifying layer, while the shear stresses arc zero in the core and increase towards the wall. Obviously} the orientation due to the elongation of the melt can relax before solidification. The level in the core is only slightly higher than in the radial cross·seGtion. This means that either the level of cooling stresses is slightly higher in the ta1lgential direction or very little elongation is frozen in. The similarity between the radial and tangential distributions implies that the underlyillg contribution of the cooling stresses is at lea.o;t very similar in both directions. Obviously) because of the great diameter to thickness ratio an equibia;-;:ial state of stress is built up} which means that cooling stresses should contribute to the birefringence in the rz-plane to the same extent as in the 8z-plane_
Retardation
It is interesting to compare the parallel component in the r z"plane (Fig.5) with the distribution in the Oz-plane (Fig.7). We See that they are almost identical. By subtracting those two curves from each other (Eq.4) the lower curve in Fig.7 is obtained. The integral of this curve OVel' the thickness is equal to the retardation of a beam of normal in" eidenc€:. As ca.n be seen this integral is very smalL Despite the high birefringence in the CD, on average about 6 X 10⁻⁴ (also found by Joshizawa8,9) the retardation in normal incidence can become zeroThis is because of three reasons: (i) a fortuitous compensation effect of the ftozen-in orientation due to the fountain flow and shear flow in radial direction by the elongation in circumferential direction frozen in at the flow front; (ii) the anelastic flow behaviour of the PC grades used so that only very small normal stress differences are developed) and (iii) the equibiaxiaJity of the cooling stresses) which gives a con-
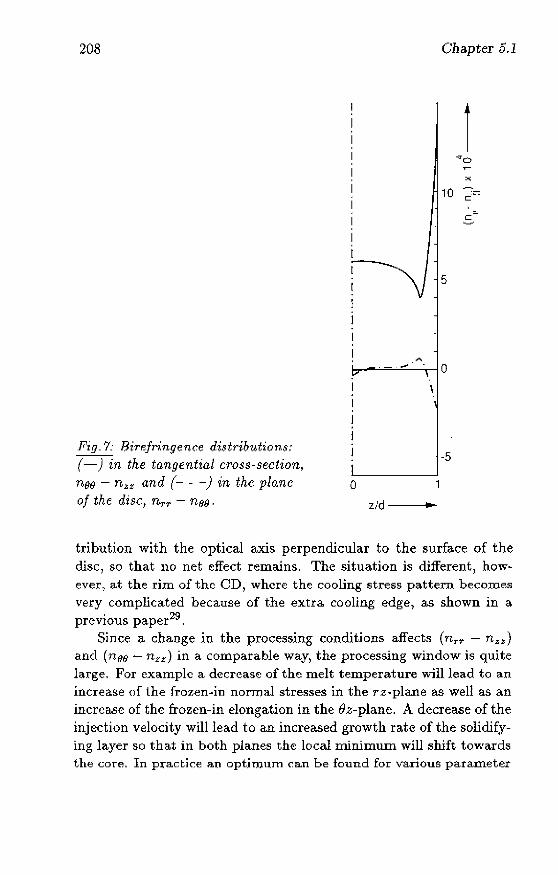
208
Fig_ 7: Birefringence distributions: (-) in the tangential cross-section, nM - n zz and (- - -) in the plane of the disc, nrr - nfl(J.
o z/d----1·-
Chapter 5.1
r """0
:..;
10 c "-
c ~
5
-5
tribution with the optical aXis perpendicular to the surface of the disc, so that no net effect remains. The situation is different, how~ ever, at the rim of the CD, where the cooling stress pattern becomes very complicated because of the extra cooling edge, as shown in a previous paper29.
Since a. change in the processing conditions affects (nT1'" - n.,.,) and (nflB ~ n Z .,) in a comparable way) the processing window is quite large. For example a decrease of the melt temperature will lead to an increase of the frozen~in nonnal stresses in the T z-plane as well as an increase of the frozen-in elongation in the 8z-plane. A decrease of the injection velocity will lead to an increased growth rate of the solidifying layer so that in both planes the local minimum will shift towards the core. In practice an optimllm can be found for various parameter
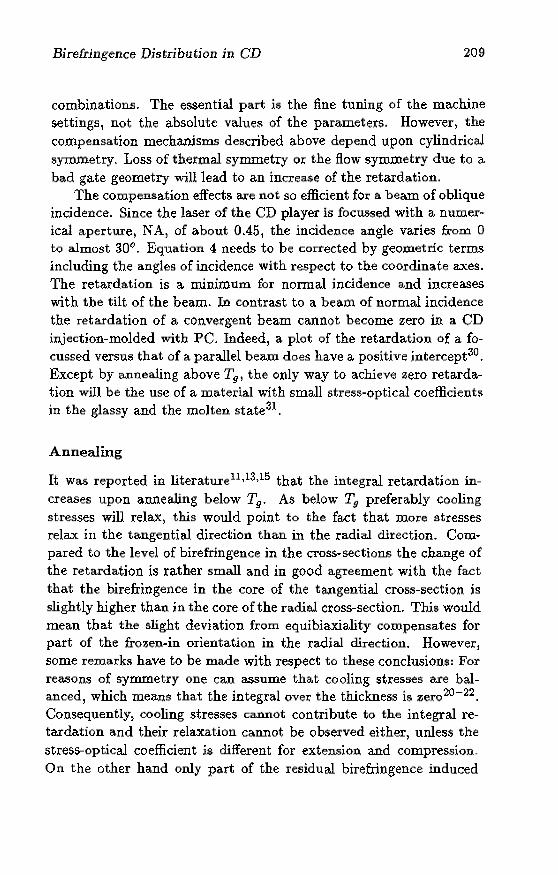
Birefringence Distribution in CD 209
combinations. The essential part is the fine tuning of the machine settings, not the absolute values of the parameters. However) the compensation mechanisms described above depend upon cylindrical symmetry. Loss of thermal symmetry Or the flow syDJ.Jlletry due to a. bad gate geometry will lead to an increase of the retardation.
The compensation effects are not so efficient for a beam of oblique incidence. Since the laser of the CD player is focussed with a numer~ icat aperture) NA, of a.bout 0.45, the incidence angle va.ries from 0 to almost 30°. Equation 4 needs to be corrected by geometric terms including the angles of incidence with respect to the coordinate axes. The reta.rdation is a. minimum for nonual incidence and increases with the tilt of the bea.m. In contrast to a bea.m of normal incidence the retardation of a. convergent beam cannot become zerO in a CD injection-molded with PC. Indeed, a plot of the retardation of a focussed versus that of a parallel beam does have a positive intercept30 .
Except by a.nnealing above Tg) the only way to achieve zerO retardation will be the use of a material with small stress-optical coefficients in the glassy and the molten state3l .
Annealing
It was reported in literature U ,13,15 that the integral retardation increases upon annealing below Tg. As below Tg preferably cooling stresses will relax, this would point to the fact that more stresses relax in the tangential direction than in the ra.dial direction. CoIU~
pared to the level of birefringence in the cross~sections the change of the retardation is rather small and in good agreement with the fact that the birefringence in the core of the tangential cross-section is slightly higher than in the core of the radial cross-section. Tills would mean that the slight deviation from equibiaxiality compensates for part of the frozen-in orientation in the radial direction. However, some remarks have to be made with respect to these conclusions! For reasons of symmetry one can assume that cooling stresses are balanced, which means that the integral over the thickness is zeroZO-Z2. Consequently) cooling stresses cannot contribute to the integral retardation and their relaxation cannot be observed either, unless the stress-optical coefficient is different for extension and compression_ On the other hand only part of the residual birefringence induced
210 Chapter 5.1
5 r x
It:: I
-5 c ----1 o 1
z/d ..
!ig.8: A bsolute variation of the 7'ejmctive index components nee and n zz in the tangential r:ro8~"'H~clionJ T = 42 1mn.
by cooling tltn~K~e5 is proportional to the final stress state18 ,26. It is also known tha,t during stress relaxation in the glassy sta.te of PC birefringence relaxes much more slowly than the stresses doa2 ,ll:-i.
Annealing of radial and tangential cross-sections indeed showed t.ha.t birefringence in the COrt~ does not disappear below Tg , For example by heating a radial cross-section of the sample already shown ill Fig,2 at a rate of 1 ° /min to 130'-'C the birefringence in the core drops to 2/3 oi' t..he initial value, After keeping the sample for 135 Illin\lt(~s at J 30oe, it drops to 1/3 of the initial value. At the same timo the vallle of the loca.l maximum dropped to 55%, while the ext.inction angle increased [rorn 30 to 38°. Also 1/3 of the birefringence <11, the surfa,ce vanished. This means that orientation already starts to relax at thai; temperature. In order to explain the observed relaxation processes in detail it: is nec.essary to know the time-dependent stress-optical behaviollt of the mat.erial around Tg , which will be the tlubjed of a subsequent papt~t. At. this point it can ~mly be stressed that one has to be very careful with explaiuiug chauges of the integral reLI,)"(btion upon annealing in a simple way.
Hirefringerlce Distribution ill CD 211
Refractive Index
Birefringence is a measure for the anisotropy of the refractive index, but the pro(~essing history also affects the mean refractive index of the medium as the latter is proportional to the local density. The density is determined by the conditions of 50lidification~·g·34,35 and the pres~l1lre. In Fig.8 the distribution of two refractive index components is shown as determined with the Schlieren-optical device with the direction of polarization in the 0- and z-direction l respectively. The order of magn.itllde of the va.riation of the absolute refractive index is comparable with tha.t of the birefringence. Both refractive index components show a. similar distribution with a maximum at a certain disL(l.llce from the surface, corresponding to the position of the local minimum in the birefringence distribution. This distance represents the thickness of the solid layer at the onset of the packing stage. The decrease of the refractive index towards the core can be explained by the presence of tensile cooling stresses and the fact that the pressure in the cavity during packing was lower than during filling at the same radial position. With increasing injection speeds the maxjmum in the refractive index shifts towards the surface- With increasing packing pressure the level in the core increases. The distance between the two curves is equal to the birefringence distribution in that plane.
Conclusions
The deviatoric refractive index tensor is established by measuring the birefringence and the variation of the refractive index cornponents in radial and tangential cross-sections. Birefringence in the CD is very high) on average 6 - 7 x 10⁻⁴ . It shows a maximtun at the surface due to frozen-in e1ongational orientaion built up in the fountain flow of the flow front, shear induced orientation and cooling stresses. The thickness of the layer solidified during the filling stage is very small using standard conditions. It is increased by reducing the injection speed and/or the mold temperature.
The preferential directions of the medium do not coincide with the cylindrical coordinate axes of the disc. Only one axis of the indicatrix lies in the circumferential direction. The other two axes) including the
212 Chapte.r 5.1
shortest one} lie in the 1·z~pl.ane rotated about an angle X with respect to the radial direction- This angle varies with the distance f!"Om the surface and the radial position} since it is determined by the amount of frozen-in shear stresses. Although the birefringence in the r z-plane shows a complicated profile, the component (nrr - n zz ) remains more or less equal to the birefringence in the Oz-plane. Therefore the direction of one of the optical axes almost coincides with the normal to the clisc surface. The other optical axis switches between the rzand the Oz~plane in going from the surface towards the core in a way, which dependfl on t.he radial position and of course the processing conditions.
The retardation of a beam of normal incidence is very low because of the compensation of the contributions of the normal stress differences developed in the shear flow of the filling and packing stage and the elongational flow in circumferential direction, which is frozen in becallse of the fountain flow at the flow front. The processing window is rather broad in view of the delicate balance of the birefringence in the radial and tangential direction because both are affected by a change in the molding conditions in a similar way.
Thermal stresses are responsible for the high level of birefringence in both croS$ftsections_ A small contribution to the integral retardation due to a. non~linear effect cannot be ruled out with certainty. In the regions of two to three times the thickness from the outer rim, however) the contribution of thennal stresses is dominating the integral retardation- Frozen"in shear stresses give no net contribution to the reta.rdation of a beam of normal incidence. However both} cooling stresses and shear stresses) do have an important influence OIl the retardation of a convergent beam so that the retardation of a convergent beam will always be non-Zero. The only ways to improve this are annealing above 1:9 or the use of a material with a much lower stl-ess-optical coefficient. in the molten as well as the gla.gsy state_
Because of the high level of birefringence in the substrate a disturbance of the synunetry of the flow pattern Or the cooling stresses wjU lead to a local increase of the retardation. This is especially cd tical for the application in magneto-optical, erasable media as the frequency of the variation of the retardation is important.
Birefringence Distribution in CD 213
Acknowledgement
The author wishes to thank Prof.H.Janeschitz-Kriegl, Dr.J.F.Dijksman, Ir.B.H.A.van den Brule and Dr.L.Minnema for their support and valuable discussions, J .H.A.van Vlerken for preparing the cross-sections, lng.A.Sevriens and h.D.Samoy for carrying out the injection-molding experiments and Ir.G.Prast and Ing.A.V.M.Kurstjens for their assistance with the Schlieren measurements.
References
1. Compa.ct Disc System Description ('Red Booklet') Philips-Sony standardization agreement.
2 . .1. Hennig, Kunststoffe, 75; 425 (1985)
3. S. Fujiwara, Japan Plastics Age, 5/6, 21 (1984)
4. S. Anders a.nd B. Hardt, Kunststoffe, 77 , 21 (1987).
5. G. Kaempf; H. Loewer and M.W. Witman, Polym. Eng. Sei., 27, 1421 (1987).
6. M. Dunn, SPE ANTEC Tech. Papers, 34,259 (1988).
7. L. Schmidt and J. Maxam, Ibidem; 334.
8. A. JosWzawa and N. Matsubayashi, PrQc. SPIE Int. Soc. Opt. Eng., 695,91 (1986).
9. A. Yo shizawa , Optics, 15,414 (1986).
10. M. Takeshima and N. Funakoshi, J. Appl. Polym. Sci., 32, 3457 (1986).
1.1. A. lwasawa and K. Funakoshi, Am. Chem. Soc., Div. Polym. Chem. Polym. Prepr., 29/2) 237 (1988).
12. S.J. Willey, M.G. Hansen) L.R. Cummins, C.M. Karas and A.S. Ulmer, Froc. SPIE, 896, 79 (1988).
214 Chapter 5.1
U. M.'"J. Brckner, Am. Chem. Soc., Div. Polym. ChCIll. PolYIll. Prepr., 29/2, 234 (1988).
14. J. Greener, B .. Kesel and B.A. Contestable, A. 1. Ch. E. J., 35, 119 (1989).
lS. S. Anders, H. Schmid and K. Sommer, Kunststoffe, 79, S5 (UJ89).
16. H . .Janeschitz-Kriegl, Polymer Mdt Rhf'.()loyy ilnd Flot!} Birefringence, Elsevier, Amsterdam (1983).
17. D.W. Van Krevelen and P . .1. J-ioftijzer, Properties of Polymers, Elsevier, Arnslerdam (1976).
18, R.. Wimberger-Friedl and R..D.H.M. Hendriks, Polymer, 30, 114:3 (1989) (Chapl.er 3.1)
19. Z. Tadmor, J. Appl. Polym. Sci., 18, 1.753 (1971).
20. E.M. Lee, T.G. liogers and T.e. Woo, 1. Amer. Ccmsn .. Soc., 4H, 480 (1%5).
2l. L.C.£' Struik, P()lym. Eng. Sci., 18, 799 (1978).
n. C . .], WusL and D,C. Bogue, .J. Appl. Polym. Sci" 28, 1931 (1983).
2:L M. Kuuogi, 'Spritzgiessvorrichtung', German Patent no.2029353.
24. C. PrasL, to be published.
25. H . .lancschitz-Kriegl, Pnre App/. Ghent., 55, 799 (1983).
26. A.I. Tsaycv, Folym. Eng. Sci., 23, 271 (1983).
27. R. Wimbcrgcr-FriedJ, llheol, Acta, 30, 329 (1991.) (Chapter 2.1)
2H, C. Sadnm, j, de Phy.siq?Lf?, 9, 38J. (1938).
29. R, WiIllberger-Friccll and H. JI:LTleschitz-Kricgl, in Integration of Polymf'.T Science and T(-;(~h.nology-2, P.J. Lemstra and L.A. Klcintjens j ji;dR., Elsevier, Arnsterc:larn, (1988),
Birefringence Distribution in CD 215
30. K. Grywatz, private communications.
31- G.H. Werumcus Buning, R. Wimbergcr-Friedl, H. JaneschitzKrieg] and T.M. Ford, in Integration of Fundamental Polymer Science and Technology.2) P.]. Lemstra and L.A. Klcintjens, !Dds., Elsevier, Amsterdam (1986).
32. M.M.Qayyum and J.R.White, Polymer, 23,129 (1982).
33. D.G.Legrand, W.V.Olszewski and J.T.Bendler, J. Polym. Sci. Polym. Phys. Ed., 25, 1149 (1987).
34. J.D. Ferry, Viscoelastic Properties of Polymers, 3rd ed., J. Wiley, New York, (1980).
35. S. Ichihara, A. Komatsu and T. Hat.a, Polym. J., 2,644 (1971).
Part 6
General Conclusions
217
6.1 Conclusions
The state of an injectjQn~moulded amorphous polymer is quantified in tenus of molecular orientation, residual stress and density distri~ butions by optical measurements.
Stress-optical behaviour
For the translation of birefringence into orientation and residual stresses the stressMoptical behaviour is determined in the whole temperature range covered during processing. The stress-optical coefficient is a time-dependent quantity. The change from the short-time to the long-time value can be described by a stretched~exponential function. At experhnental time scales the short-time value is observed in the glassy state. It reflects an energy-elastic response of the material to a mechanical load. The long-time value is observed in the melt as flow birefringence. It reflects the entropy-clastic response of the chain molecules to a stress. Both limiting values are temperature de~ pendent. For PC the width of the stretched-exponential function is independent of temperature in the glass~transition region. As long as the system is at equilibrium density, the relaxation times scale with temperature according to the same WLF function as determined for the viscosity. Below Tg the relaxation rates depend on the thenno~ mechanical history.
In the melt both, PC and PMMA were found to behave in a peculiar way. PC is very inelastic leading to a strong rotation of the principal direction with respect to the walls in shear flow. This has important consequences for the birefringence in iujection~moulded PC samples. Whereas the stress-optical coefficient of PC is high and slightly increases with decreasing temperature, tha.t of PMMA is low
219
220 Chapter 6.1
and decreases strongly with temperature. It changes sigll at 146"0 from positive to negative. Below that temperature the negative value keeps increasing. The reason is a strollg temperature dependence of the anisotropy of the polarizability of PMMA. Consequently, the relation between frozen-in mole<;ula.r orientation and birefringence is tempel'ature dependent in PMMA. From the stress~optical coefficient in the melt the intrinsic birefringence is calculated fot PC. This is the birefringence in the case of perfect orientation (order parameter === 1) and necessary to translate birefringence into molecular orientation.
The stress-optical coefficient in the glassy sta.te of PC is about a hundred times higher than that of polystyrene, which has frequently been used for the analysis of frozen-in orientation. Therefore the residual birefringence in injection-moulded PC will also be determined by residual stresses and can be used for the purpose of measuring the latter. A prerequisite is the possibility to distinguish the contributions of molecular orientation and residual stress.
Orientation and stress distribution
The distinction between fI'Ozen-in orientation and residual stresses is not equivalent to that between flow-induced and thermally induced stresses.
Thermal stresses also induce molecular orientation. This effect is responsible for the observed unbalance of birefringence clistributions in <Jllenched PC samples a.. .. well a.s for the high level of birefringence in the core ofinjection-tnoulded PC samples. In freely quenched samples this thermal orientation contribution varies in thickness direction- In samples quenched under constraint and in injection-moulded sam~ pIes it. is almost constant. Orientation induced by cooling stresses can be predicted without iududing the time dependence of the stressoptical coefficient. The time dependence leads t.o a third contribution to orieutation. During creep and stress relaxation the stress-optical coefficient increases. Energy-elastic stresses relax towards orientation. In total one can distinguish five contributions to the residual birefringence in injection~moulded PC, (i) orientation due to flowinduced st.resses, (ii) orientation due to thermaJ~ and ptes$ure-induced stresses) (iii) orientati<m due to relaxation of residual stresses, (iv) residual thermal stresses and (v) residual pressure"indllced stresses.
Conclusions 221
Due to the effects of wall adhesion pressure-induced residual stresses dominate the thermal-induced ones and should therefore be distinguished from the former.
The experimental distindion between orientation and stress contribution can be made by slicing the cross-sections such that stresses are relieved. The thennally induced orientation can be distinguished safely from the flow-induced one by extrapolating the orientation in the core towards the surface of the sample. Wbereas the orientation induced by thermal and compression stresses is equibiaxial and parallel to the wall, the flow-induced orientation is biaxial and at some angle with respect to the wall. In shear flow this direction is close to 45° for PC.
Flow induced stresses lead to three birefringence maxima in the cross-section in general, (i) at the surface due to the strain at the flow front, (ii) at the distance equal to the thickness of the vitrified layer a.t the end of filling due to shear flow during filling and (iii) closest to the COre at the distance equal to the thickness of the vitrified layer at the end of the packing phase due to shear flow during packing. Depending on the moulding conditions and the position in the cavity two of the three maxima can be absent or coincide. Only the maximum at the surface is universal (The reason might be that it is mainly due to orientation induced by tensile pressure-induced residual stresses). By subtracting the 45 9 component (the shear contribution) from the total birefringence both maxima due to shear flow disappear. In the case of the investigated! easy-flowing grade of PC the average degree of molecular orientation in the sample due to flow~induced stresses is lower than that due to thermal-induced stresses.
Density distributions
A new technique is a.pplied for the mea.surement of spatial density distributions. For the first time density distributions are obtained with high resolution and accuracy in the same cross-sections as used for the birefringence measurements. The density distributions are derived from the refractive index gradients as determined with a quantitative Schlieren-optical setftup.
The local density is approximately a linear function of (i) the logarithmic cooling rate (H) and the pressure during vitrification and
222 Clwpter 6.1
(iii) the trace of the momentary state of stress. In free-quenched PC samples t.he measured ga.pwise density distribution can be explained by a competition between the cooling rate effect j leading to a denfl.ity in t.be core higher than at the surface, and the residual stress effed, leading to the opposite. For low quench temperatures the residual stress effect dominates, for qnenGh temperatures close to Tg the cooling rate effect was found stronger. In injection-moulded samples the pressure va.dation during moulding is the dominating parameter. Density distributions in injedion~moulded PMMA in general show a loca.l maximum beneath the surface and a broad plateau in the Core_ The varia.tions are in the order of 2xlO-3g!cm3 . The influence of the pn)cessing pa.rameters on the distributions can be explained qualitat.ively by t.he re(:orcied pressure course in the cavity during the growth of the vitrified layer from the wall towards the core. The variations along the flow path agn~e with the observed var.iations of the gapwise-averagcd density. The spatial density variat.ions can be kept. smallest by applying high mould temperatul"eS, high injection rates and low packing pressures-
'rhe dislance of t.he local density maximum from the surface is found considerably smaller tha.n the distance of the maximum of the birefringence, indicating the thickness of the vitrified layer at the end of the filling stage. This difference is explained by the difference of the relaxat.ion ra.tes of density and orientation. The ,jvitrification" with resped. t.o density occurs at lower temperatures than the j'vltrification,j with resped. to molecular orientation. Several phenomena) like t.he decrease of the density with higher mould t.emperatures, ca.n only be explained by the fact that under certain conditions the vitrification starts on Iy a.f1,(~J' t.he completion of filling.
The height.s of the local maxima in the density distributions are found lower t.han predided from the formation pressure effect and the pselldocomprcssibility, as obtained from samples vitrified at constant pressure. This points to an influence of the time dependence of the comprE~ssibilit.Y in the vicinity of the glass transition temperature. This time dependence can even be observed at room temperature. The volmne rdaxation in those parts of the sample which vitrified und(~r higb pressure leads to expansion, while other parts are shrinkmg.
6.2 Recommendations
The complete state of an injection-moulded article can be quantified now) but still some work needs to be done. Most of the phenomena described in this thesis were observed with CD 2000/15000) a special) easy-flowing optical grade of PC. It is not expected that this choice leads to specific phenomena) but it would be worthwhile to investigate in how far the relative importance of certain effects depends Oll
the molecular weight of PC. Apart from the effect of the magnitude of the strefls-optical coefficient it is interesting to check the lllliversality of phenomena like orientation induced by cooling stresses and stress relaxation in other amorphous polymers like PS. The birefringence distributions observed in free-quenched PS strongly indicate the existence of tluch effects.
A structural clifference between the stress-optical coefficient detennined by flow birefringence and that by creep around Tg was observed. There are indkations that the reason might be a time dependence of the molecular conformations under the influence of stress. It would be interesting to study such an effect in PC in more detaiL
Simulation programs
Up to nOw the most advanced, viscoelastic simulation prograTIJS either clisregard the glMfi transition phenomenon1 or decouple it from the flow analysis via a rate-independent temperature2 . Instead) by using
l A.A.M.Flaman, Build-up and rdaxation of molecular orienta.tion in injection moulding, Thesis, Eindhoven (1990)
~L.F.A.Douven, Towards the computation of properties of injedion.moulded product!;, Thesis, Eindhoven (1991)
223
224 Chapter 6.2
a relaxation time spectrum that covers the whole time scale of the materials rcponse, many distinctions like "above or below Tg" would become obsolete or evolve naturally from the calculations. For CD 2000/15000 the dynarni~: moduli and shift functions are available for the total time ~:(:ale- A difference between the shift functions of the a transition and of the entropy-elastic spectrum has been observedThe universality of that phenomenon is :oot yet proved. Moreover, its effect on the predictions of the simulations is llot expected to be very significant. The part of the relaxation spectrum that represents the a relaxation can also be used to describe the time dependence of the stress-optical coefficient (instead of the stretched exponential). In that way all described phenomena of the residual bitefringence distributjons should be predicted. Unfortunately, the relaxation time spectrum for the density is not yet determined for PC and PMMA. As a start one might use the mechanical O! relaxation spectrum for that purpose as well, until experimental data become available.
Glassy state
In the glass transition the free volume distribution becomes path dependent. That means relaxation spectra not only depend on the actual temperature and pressure, but also on the thermomechanicaJ history_ A broadening of the a transition with decreasing tempera~ ture has been observed in the glassy state of PC. The time depen~ dence of the compressibility is not yet investigated. Also the effect of the free volume distribution on the orientational relaxatioIl times is still unknown, despite its crucial importance for the dimensional stability_ It is therefore suggested to concentrate the experiITlental efforts in the future On the kinetics in the glassy state) also including secoTloary relaxations. After all, the ultimate goal is the prediction of the long term performance of polymer products.
Edge effects
For the practical applicability of the built-up knowledge and its predictive power it is impoItant to be able to include complex shapesNot just optical components, which ;require a higb shape accuracy, dimensional stability, as well as a controlled refractive index, are es-
Recommendations 225
sentiaJly 3-dimensional in character. The focus in this thesis is on quasi-one-dimensional situations, that means the thickness is small compared to the length and the width of the sample and the edges are far away. Close to the edges the distributions of all properties become far more complex. Optical techniques, as used here, are favourable because of their high resolution. However, the measurement in transmission requites the varia.tions in viewing direction to be small for the thickness necessary for a sufficient resolution (dependent on the magnitude of the observed effects).
Edge effects lead to characteristic shape deviations because of normal stresses in thickness direction which develop during vitrification. This shape deviation affects the thermal boundary conditions in a way which cannot be predicted yet. A systematic investigation of residual birefringence distributions can give direction towards a better understanding of edge effects and how they can be eliminated Or controlled.
Summary
The long-term performance of a polymer product depends on its state at the end of processing. The thenXlomechanical h.istory during pro" cessing determines the degree of molecular orientation, the state of stress and the density of the materiaL During injection-moulding high pressure and temperature gradients develop which lead to COID
plicated spatial distributions of orientation, stress and density. In order to understand and predict the performance of polymer prod· uds one needs to determine the5e distributions. Such an analysis also gives insight iuto the moulding process and supplies a pot.ential verification for the process simulation programs. Because of the complexity of the distributions a high resolution is required. This fact makeR optical techniques attra.ctive. For a.morphous thermoplastics the refractive index tensor contains all the necessary information_ The anisotropic part, i.e. birefringence, reflects molecular orientation and st.resses, the isotropic part reflects the density of the material_
The scope of this thesis is to quantify for the first time the complete Rtate of an injection-moulded amorphous polymer by measuring molecular orientation, residual stresses and density distributions by optical techniques. For this purpose the contribution of molecular orientation and residual stresses to birefringence is clistinguished quantitatively and an optic;al technique for density measurements is introduced.
Whereas the measurement of birefringence lS rather straightforeward, its interpretation is difficult. The basis for the translation of birefringence to orientation and stress is the stress-optical behaviour of the polymer. In a polymer melt there is a linear relation between the mole<;ular orientation, birefringence and the applied stress. By cooling below the glass transition temperature the roolec-
227
228 Summary
ular orientation is frozen in. Residua.l birefringence not; only is a measure for frozen-in orientation, it also supplies a relation to the state Df st.ress prior to vitrification which can be used for the verification of injectimt moulding simulation programs. In chaptcr 2.1 the stress-optical behaviour of bisphenol-A polycarbonate (PO) and polymethylmethacrylate (PMMA) is investiga.ted in the molten state by flow birefringence in a modified cone-plate rheometer. PC shows a positive and high stress-optical coefficient, that of PMMA is very low and strongly temperature dependent, even changing sign at 146°C. This means that the relation between birefringence and orientation is temperature dependent which makes PMMA not well suited for an analysis as intended in this thesis.
When at the glass transition the orientation becomes frozen in, the linearity of the relation between birefriugence and the momentary state of stress jslost. In chaptcr 2.2 the linear stress-optic:al rule of the melt is replaced by a time-dependent relation. The stress-optical coeffident. of PC, as determined in creep ex.periments on a self-designed optical tensile tester, is described by a stretched-exponential (Kohlrausch) function. This time-dependent stress-optic:al constitutive relation allows a consistent prediction of birefringence by simulation programs employing a viscoelastic; model for the glass transition.
For short times also a linear relatl0n is valid) reHecting the energyelastic response which is usually ObSel"Ved in the glassy state. The short-time, glassy value of PC is very high, as compared to any other polymer. This means that a.bo residual stresses contribute signif. kantIy to the birefringence distribution in PC samples_ Therefore both, molecular orientation and l-esidual stresses can be determined by birefringence measurements.
The distinction between the contribution from orientation and residual stresses to the birefringence in injection-u101llded PC is not possible a priori because of the coTnplicated spatial distributions. In par-t S the contribution of thermal stresses is distinguished from that of flow-induced stresses by investigating samples quenched freely and under constraint in specially designed experimental set-ups. It is shown that also thermal stresses induce molecular orientation. This therm.a.lly induced orientation Carl be preclicted even with an elastic constitutive rnodd if the respective values of the stress-optical coeffi~
Summary 229
dent above and below Tg are used as described in chapter 3.1. The contribution of orientation to the birefringence is obtained experimentally by appropriate sectioning leading to a stress relief. Residual stresses are determined by the la.yer removal technique. Quenching under constraint leads to totally different birefringence and residual stress distributions than quenching freely due to the effects of the a.dhesion of the polymer to the solid walls. The birefringence in injeGtion-moulded PC consists of an almost constant tensile contribution from thermally induced orienta.tion superimposed on a con~ tribution from flow-induced orientation, similar to what has been described for polystyrene. In contrast to freely quenched samples the residual stress level is very low. Residual stresses are mainly induc:ed by the pressure variation during vitrification.
There are many parameters that affed the density of a glassy polymer. In injection-moulded produc:ts complicated spatial distributions can be expected but have not been observed yet because of the lack of experimental techniques. In part 4 a new technique for the measurement of density distributions is introduced. With a Sc:hlieren-optical set-up refractive index gradients ate determined. With a linear relation between refractive index and density, density distributions are determined in the same cross-sections as used for the birefringence measurements. In freely quenched PC samples the density is found to be determined by a. competition of the effect of a. parabolic residual stress distribution and tha.t of the cooling rate whic:h decreases from the surface towards the core of the sample. The effect of cooling rate on the final density is determined experimentally. The density distributions are predicted by a simple analytical model making use of the stress distributions predicted by the program described in chapter 3.1. In injection"l'lloulded samples the density distributions are dominated by the effect of the pressure present during the vitrification of the sample. As the formation pressure also the density varies strongly with distanc:e from the walls and along the flow path. The influence of the moulding conditions on the density dis~ tributions is explained in terms of the pressure variations measured in the mould cavity and the proceeding vitrification of the polymer. The effect of formation pressure on the final density is determined experimentally.
Summary
The strong variations of the optical properties are useful for the purpose of the assessment of the frozen-in thermomechanka.l history pr a product. In injection-moulded optical components, however, they lea.d to a degradation of the optical performance. The knowledge of the relation of the injection-moulding process and the s(;ress~optical beha.vi(mr with the optical properties enables an optimization of the moulding condi tioHs and the material choice. In components like lenses edge effects play an important role. Therefore a polymer with a low ~tn~ss-optical coefficient is indispensable. In j)a1't 5 it. is, however, 5hown that PC Call be used even for components with high optical requirements like the Compact Disc Compensation mechanisms of the birefringence arc demonstrated .. Due to the inelastic behaviour of PC in the melt flow-induced orientation i~ low and hardly contributes t,(j the integral rcta.nla.t,jon of the laser beam.
Samenvatting
Het lange duur gedrag van een kunststof produkt hangt aJ van zijn toestand na verwerking. De thermomechanische geschiedenis gedurencie de verwerking bepaalt de hoeveelheid moleculaJre orientatie) de spanningstoestand en de dichtheid van het materiaaL Tijdens spuitgieten ontstaan grote druk- en temperatuurgradicnten) die tot ingewikke1de ruimtelijke verdelingen van orientatie) spa.nning en dicht~ heid lejden. Om het gedrag van een polymeerprodukt te begrijpen en te kunnen voorspellen moeten deze verdelingen bepaald worden. Ben dergelijke analyse levert oak inzicht in het spuitgictproces op en dient als mogelijke verificatic van spuitgiet simulatieprogramma)s. Vanwegc de cOITlplexiteit van de verde1ingen is cen hoge resolutie vereist. DaarVOQT zijn aptische technieken :-.eer aantrekkelijk. In een amorfe therrnoplast bevat de brekingsindex alle noodzakelijke informatie. Het anisotrope gedeelte\ oak dubhele breking genoemd) wcerspiegelt maleculaire orientatie en spanningen) het isotrope gedee1t.e de dichtheid van het. materiaal.
Onderwerp van dit. proefschrift is het kwantificeren van de COUlplete toestand van ceo gespuitgiet amorf polyrneer door middel van het meten van moleculaire arientatie-) restspannings- en dichtheids" verdelingen gebrllik makend van optische techniekcn. De bijdragen van orientatie en spanningen worden gescheiden en een optische tech~ niek voor dichtheidsmetingen wordt gelntroduceerd.
Ret. meten van dubbele breking is betrekkelijk simpel, de intcrpretatie echter nogallIloeilijk. De basis voor de vertaling van dubbele breking naar orientatie en spanning is het spannings~opti5che gedrag van het polymcer. In de polymere smelt bestaat een line air Vel'band tussen de moleculaire orientatie) de dubbele breking en de aangelegde spanning. ZQdra het materiaal beneden zijn glasovergangs-
231
232 Samenvatting
temperatuur a£koelt, wordt de orienta-tie ingevroren. Ingevtoren dubbele breking is niet aIleen een maat voor ingevroren orientatie zij geeft ook de spanningstoestand aan voor het stollen, een belangrijke grootheid voor de verificatie van simulatieprogramrna's. In hoofdstuk 2.1 wordt het spannlngsoptische gedrag van polycarbonaat (PC) ell
polymethylmethacrylaat (PMMA) in de smelt bestudeerd met behulp van stromings dubbele brekingsmetingen in €len gemodificeerde conus p]aat reometer. Polycarbonaat vertoont een positieve hoge spanningsoptische coefficient, die van PMMA is heel laag en sterk temperatuursafhankelijk, waarbij zelfs het voorteken bij 14W'C ver~ andert. Dit betekent, dat het verba.nd tll~~en dubbele breking en oricntatie temperatuursafhankelijk is, hetgeen PMMA met geschlkt rnaakt voor een onderzoek zoals bedoeld in dit proefschrift.
Wanneer in de glasovergang orientatie is ingevroren) gaat de lineaire relatie tussen dubbele breking en de actuele spanmngstoestand verloren. In hoofdstuk 2.2 wordt de lincaire spannings-optische wet vervangcn door cen tijdsafhankelijk verband. De spa.nnings-optische coefficient va.n polycarbonaat) zoals bepaald met kruipexperimentcn op een zelfgebouwde optische trekbank, wordt weergegeven als Kohlrausch functie. Dit tijdsafl.lankelijk) spannings-optisch constitutief verband staat. cen consistente voorspelling van dubbele breking door simwatieprograrnma's toe, welke gebruik maken van een viscoelastisch model VOoT de glasovergang.
Voor korte tijden geldt ook een Hneair verband, gebaseerd op eeo enetgie elastisch gedrag, zoals over het algemeen in de glastoestand wotdt waargenorneu. De korte duu;£", oftewel glas waarde van polycarbonaat is bijzonder hoog) vergclekcn bij andere polymeren. Djt, betekent, dat ook restspanningen significant bijdragen tot de dubbele brekingsverdeling in polycarbonaat. VandaM dat 7iOwe1 moleculaire orientatie als ook de restspanningen met behulp van dubbele bteking gerneten kunnen worden.
De scheiding van orientatie en spanningsbijdrage aan de dubbele breking in gespuitgict polycarbonaat is niet rechtsstreeks mogelijk vanwege de ingewikkelde ruimtelijke verdelingen. In deel 3 van het proefschrift wordt de bijdrage va.n ther:rn.ische spannlngen onclerscheiden van die van st.romingsgei·nduceerde spanningen d.ffi.V. het bestuderen van monsters) welke vrij en opgesloten zijn afgeschrikt in aparte
Sam en vatting 233
cxperimentele opstellingen. Er wordt aangetoond dat thermische spanningen ook tot orientatie leiden. Deze thermische orientatie wordt voorspeld door een programOla, dat gebruik maakt van een elastisch model, waarbij de spannings-optische coe:tficienten van boven en onder Tg worden gebruikt, zoals beschreven in hoofdstuk 3.1. De orientatiebijdrage tot de dubbcle breking kan experimenteel worden bepaaJd door het op de juiste marner doorsnijden van het monster) zodat de restspanrungen wegvallen. Restspanningen WOrdell bepaald met de zogenaa.mde layer removal methode. Opgesloten afschrikken leidt tot compleet andere dubbele brekings- en $panningsverdelingen dan vrij afschtikken, als gevolg van de invloed van de hechting van het polymeer aan de wand_ De dubbele breking in gespuitgiet polycarbonaat bevat een bijna constante rekbijdrage van thernllsch gelnduceerde oriemtatie en een bijdrage van strom.ingsgeillduceerde orientatie, vergelijkbaar met de verdeUngen zoals voor polystyreen beschreven. In tegenstelling tot vrij afgeschrikte monsters is het niveau van restspanrnngen laag. Restspanningen worden vooral veroorzaakt door het drukverloop gedurende het stollen.
De dichtheid van een glasachtig polymeer wordt door vele parameters beinvloed. In gespuitgiete produkten kan een ingewikkelde verdeling worden verwacht, hetgeen echter nag niet experimenteel is aangetoond vanwege het ontbreken van een geschikte meetmethode. In deel 4 wordt een nieuwe techniek voor het meten van dichtheidsverdelingen geintroduc:eerd. Met behulp van Schlieren-optiek worden brekingsindex gradienten gemeten. Via een linealr verband tussen brekingsindex en dichtheid kunnen dichtheidsverdelingen worden bepa-ald in dezelfde dwarsdoorsnedes waarin de dubbele breking wordt gemeten- In vrij afgeschrikte monsters van pOlycarbonaat wordt de dichtheid bepaald door een competitie tussen het effect van de parabolische spanningsverdeling en het effect van de afkoelsnelheid, welke van het oppervlak naar de kern van het monster toe afneemL De invloed van de afkoelsnelheid op de dichtheid is experimented vastgelegd. De dichtheidsverdeHngen worden berekend, waarbij gebruik wordt gemaakt van de spanningsverdelingen zoals berekend in hoofdstuk 3.1. De dichtheidsverdelingen in gespuitgiete PMMA InOll
sters worden beheerst door de invloed van de druk tijdens het stollen. Net als deze zogenaamde fonnatiedruk verloont oak de dichtheid een
234 S.?Ullen va. t (;j ng
sterke va,riatie met de afstand tot de wand en in de stromingsrichting. De invloed van de spuitgietcondities op de dichtheidsverdelingen kan worden verklaard door het gerneten drukverloop in de matrijs g~dllnmde de groei van de stollaag en de experimenteel bepa-alde invloed van de formatiedruk op de dic:htheid.
De grote va.ria.tie in de OptiSdH'l eigenschappen is aantrekkelijk voor het rneLen van de ingevroren thennomechanische geschiedenis in cen produkt. Echter in gespuitgiete opti(olche komponenten leidt dit tot. een ven:toring van de optische functie. De kennis van hct verband tussen het spuitgietproces en het spanningsoptisch gec:lI'ag en de optische eigellf>chappen geven de mogelijkhcld tot optimalisatie van de verwerkingscondities en de materiaalkeuze, In dee! 5 Van hd proefschrift wordt getoond dat polycarbouaat zelfs voor komponenten met hoge optische eisen, zoals de Compact Disc kan worden gcbruikt. Compensatie effecten van de dubbcle breking en het inclastisch gcdrag van polycarbonaat in de smelt, waardoor de stromingsgei:nduceerde orientatie nauwelijks bijdra.agt, lei den tot een lage optiflche retardatie Van de laserbunc:lel.
Zusammenfassung
Das Langzeitvel'halten von Kunststoffprodukten wird bestirnmt durch den Zustand des Produkts am Ende del' Verarbeitung. Die thermomechanische Historie warelld der Verarbeitung bestimmt den Grad der molekulal'en Orlentiel'ung j den Spallnungszustand und die Dichte des Materials. Wal'end des Spritzgufiprozesses entstehen groBe Druck und Temperaturgradienten j die zu kompJizierten Vel'teilungen von Orientiel'ung Spannung und Dichte fiihren. Urn die Eigenschafteu und das Langzeitverhalten von Kunststoffpl'odukten vel'stehen und vorhersagen zn k5nnen j mussen djese Vel'teilnngen bestirnmt werden. Eille soiche Analyse verbessert auch das Vel'stiindnis des Spritzgieflpl'ozesses und gibt die Moglichkeit del' Verifikation von Simulationspl'ogrammen. Wegcn del' K()mplexititt der Verteilungen ist eine hohe AuflQ$ung erfol'derlich. Darum sind optlsche Methoden schr geeignet. In aroorphen Kunststo:ifen enthalt del' Brechungsindex alle notwendigen Inforrnationen. Der anisotrope Teil, Doppelbrechung genannt, gibt die rnolekulal'e Orientierung und Spannungen, der isotrope Teil die Dlchte des Klmststoffes wieder.
Gegenstand diesel' Dissertation ist die Bestimmung des gesamten Zustandes von spl'itzgegossenen amorphen Kunststoffell j indem die molekulare Orientierung, Restspannungcn und Dichtevcrteilungen mit optischen Methoden gemess~n werden. Zu diesem Zweck wird del' Beitrag del' Orientierung von clem der Spannungen gctrennt und eineoptlsche Methode zur Dichtebestimmung eingefiihrt.
Die Bestinunung del' DQPpelbrechung ist l'elativ einfach j jhre Interpretation jedoch $chwierig. Die Gtundlage fiir die Umrcchnung von Doppelbl'echung in Ol'ientierung und Spannung 1st das spannungsoptische Verhalten des Kunststoffes. In der Polymerschmelze besteht ein linearer Zusammenhallg zwischen del' rnolekularen Odelltierung,
235
236 Zusammenfassung
der Doppelbl'echung und der angelegten Spannung. DUTCh Abkilhlcn unterhalh des Glasubel'ganges kann Orientieruug eingefroren werden. Eingefrorene Doppelbl'cchung ist nicht nllr eln MaG fi.ll' die eingefrorene OrientieTung, sondern spiegclt aueh den Spannungszustand zum Zeitpunkt des Einfrienms wider, welcher wiederum der Verifika~ tion der Berechnungen von Simulatioll8progntInmen client. In Kapitel 2.1 wird das spannungsoptische Verhalten YOIl Bisphenol-A Polycarbonat (PC) und Polymethylmethacrylat (PMMA) untersucht rnittels Stromungsdoppelbrechungsmessungen in einern modifizierten KonusPlatte Rheometer_ PC besitzt einen hohen, po~itiven spannungSQPtischen KoefIizienten, der von PMMA ist sehr niedrig und stark tempcraturabhangig, selb:;;t das Vorzeichen andert sich bei 146°C_ Dies bedeutet, daB der Zusammenhang 7.wischen Doppelbrechung und Oricntierung zeitabhangig ist. Deshalb ist PMMA nieht gut geeignet fUr den Zweck der hier beschriehenen Untersuchungen.
Sobald beim Glasubergang Orientierung einfriert, geht cler lineare Zusammenhang zwischen Doppelbrechung und momentaner Spannung verloreu_ In Kapitel 2.2 wird clas line are spannungsoptiseh~ Gesetz ersetzt dun::h eine zeitabhangige Grofie. Der zeitabhangige spannungsoptische Koeffizient yon PC, gemessen in Kriechexperimenten auf einer selbstgebauten optischen Zugbank, i:;;t gut mit ciner Kohlrausch Funktion Zu bcschreibeu_ Mit dieser zeitabhangigen spannungsoptischen Konstitutivgleichung kann die Doppelbrechung auf konsistente Weise berechnct werden durch Simulationsprograrnme, die den Glasiibergang viskoelastisch bcschreiben_
Bei kurzen Zeiten gilt auch ein linearer Zusammenhang zwischen Spannung und Doppelbrechung, welcher €lill energieelastisches Ver~ halten widerspiegelt, wie es gewohnlich im Glaszustand zu beobachten ist- DeT Kur7.zeit oder Glaswert von PC ist vergleichsweise sehr hach. Aus diesem Grund tragcn auch Restspannungen signifikant 7.llr Doppelbl"echung in PC bei und konnen heide, Orientierung und Restspannungen, iiber die Doppelbrechung bestimmt werden.
Die Unterscheidung des Orientierungs- und Restspannungsbeitrages Zur Doppelbrechung in spritzgegossenem PC ist nicht a. priori moglich wegen der Komplexitat der Verteilungen. In Teil 3 der Dissertation wird der Beitrag del' thermischen Spannungen llnterschieden von clem del' ~tri)mungsjnduzierten Spannungen dUTch Un-
Zusamwenfassung 237
tersuchungen von Proben) welche in speziellen Anordnungen frei und geschlossen abgeschreckt wllrden. Es wird gezeigtj daB auch thermisehe Spannungen Zu molekularel' Orientierung fUhren_ Diese thermi:Kh induzierte Orientierung kann sclbst mit eiuent einfachen} elastischen Modell (beschrieben in Kapitel 3.1) berechnet werden) wenn die entsprcehcllden spannungsoptischen Koeffizienten in deT Schmclze und dem Glas verwendet werden_ Experimentel1 kann der Orien" tierungsbeitrag bestimmt werden, in dem man die Probe derartig durehschneidet) dafi die Spannungen wegfallen. Restspannungcll wer" den mit det sogenanntcn 'layer removal'-Methode bestinunt. GeschlosseneR A bschrecken fiihrt zu total andercn Doppelbrechungs- und Spannungsvetteilungen auf Grund des Einflu:Bes del' Wandhaftung_ Die Doppelbrechung in spritzgegossenen PC Proben besteht aus einem beinahe konstanten Dehnbeitrag von der thermisch induzierten Orientierung und einem Beitrag der strolnllmgsinduzierten Orientierung) iihnlich wie er fiit Polystyrol beschrieben wurde. 1m Gegensatz zu frei abgeschreckten Proben ist hier das Restspannungsniveau sehr niedrig. Restspannllngen sind vor aHem a,uf den Einflu:B der Druckvariation wahrend cler En:;tarrung zuruckzufiihren.
Die Dichte dues Polymcrglases winl durch viele GraBen bestimrnt. In spdtzgegossenen Proben kann man daher komplizierte Dichtever-teilungen erwarten. Diese tl.lnd jedoch noch nicht expetimentell bcsehrieben, wegen des Fehlens ciner geeigueten MeBmethode_ In Teil 4 del' Disserta.tion wird eine neue Methode zur Bestimrnung der Dichtcvcrteilungen eingefiihrt, Mit ciner schlierenoptischen Anord!lung werden Brechungsindexgradienten bcstimmt- Uber eine lineare Rela.tion zwischen Brechungsindex und Dichte werden so ZUlU
ersten Mal Dichteverteilungcn in den gleichen Probenquerschnitten bestimmt, in denen aach die Doppelbrechung gemessen wird. In frei abgeschrecktcn PC Proben wird die Dichte einerseits durch die parabolische Restspannungsverteilung und andererseits durch di.e von (tuHen !lach innen abnehmende Abkuhlgeschwindigkeit beherrscht. D~~r EinfluB der Abkuhlgeschwindigkeit auf die Diehte wjrd experimentell bestirnrnt. Die DiehtcverteHungen werden berechnct unter Berlicksichtigllng del' Spannungsverteilung} so wie sie in Kapitel 3,1 berechnet wurde- In spdt7,gegossenen PMMA Proben wird die Dichte vor aHem durch den Druck wahrend der Erstarrung bestimmt. Genau
2~8 Zusammenhssung
so wic dieser sogenannte Formierungsdruck variiert auch tile Dichte sehr stark mit dem Abst.and von der Wand und dem Fliefiweg. Der EinJJuH del' Verarbcitungsbedingungen wird rnit Hilfe des im Werkzeug gcmcssene.u Dru<:kvel"laufes wahrend der Erstan-llng des K llllststofres crkIart, wobei del' Einflufl des Formierungsdtuckes auf die Dichte unabhangig bestirrnnl. wurde.
Die starke Variation der optischen Eigenschaften ist wii.nschenswcrt fur die nes1.i1l1IDung der eingef.rorenen therrnorne~:hanis(:hen Historie des Materials in eiIlem Pl'Qdukt. In spritzgegosscncn optischen Kompollenten jedoch fiihrt dies Zu St~~nUlgen deT optischcn Funktion dieser Komponenten. Die Kenntnis det Zusammenhiinge zwischen dem Spritzgufiprozefi, dem spannungsoptischen Verhalten des Kunststaffes und den optischen Eigcllschaften des Produktes el'moglichen eine Optimierung det Verarbeitungsbedingungen und del" Material" wahl. Tn TeiI 5 der Dissertation wird gezeigt, daIl PC auch fUr Komponenten vcrwendet. werden kann, an welche hohe op1.ische Anspl'i.i.che gestellt wcrckn j wie z.B. die Compact Disc. Kompensationseffekte der Doppelbrechung, sowle das unelastische VerhaJten von PC, wodurch uur sehr wenig stri)mung:sinduzierte Oricnticrung aufgebaut wird, fiihren zu cinem niedrigen Gangunf.erschicd des Laserbundels.
Nawoord
Het onderzoek is uitgevoerd in de groep Polymeren en Orgamsche Chemie van bet Philips N atuurkundig Laboratorium in samenwerking met de grocpen Mechanica en Transportverschijnselen en het Kunststof[enlab van de PMF in het onderzoeksproject Precisiespuitgieten- Th wil aIle collega's die bij dit project betrokken "ijI) geweest} als ook alle andere menSen buiten dit project} die op enigerlei manier hebben bijgedragen tot het totstaudkomen van dit procfschrift} hartelijk bedanken voor hun medewerking en de aangenamc, ~ollstructievc manier van samenwerken-
De bijdragc van deze mensen blijkt zowel uit het co-auteurschap bij diverse hoofdstukken van dit proefschrift als uit de acknowledgements in de desbel:reITende hoofdstukken. Tach wil ik nog eens apart IIujn dank uitspreken aan Hans de Bruin voor zijn zorgvuldigc manier van experimenteren, een voorwaarde 0111 clit soort onderzoek succesvo] te kunnen uitvoercn.
Een centrale rol in het onderzoek hebben de dwarsdoorsnedcs gespccld, Hans van Vlerken heeft in de afgelopen jaren vele honderden doonmedes voor mlj uit de monsters gehaald. De bijzondere kwaliteit van deze doorsncdes hebben het mogelijk gemaakt vele verschijnselen te begrijpen.
Dc directie van het Philips N atuurkundig Laboratorium ben ik erkentelijk voor de gelegenheid die zij luij geboden hebben om djt onderzoek uit te voeren en de resultaten daarvan in dit proefschrift vast te legge-no Mijn groepsleider Robert-J a.n Visser wil ik clanken voor de positieve manier waarop hij rnijn wens om te promoveren steunde en mlj aanmoedigde in de laatste rase van het schrijven van
239
het procfschrift. Mijn dank gaat ook uit llaar aile collega's binnen de groep ea Cl"
buiten die door hun zorgv111dige manier van lezen van de manuscriptcn cen bdangrijke stcun voor mij zijn gcwecst. In het bijzonder wil ik mijn kamcrgenoten Dick Broer en Ytsen Wielstra hedankcn voor hun ondcrstcunjng en voorbceld.
Bcidc promotoren wi! ik beclanken voor de bcrcidheid mee te werkcn aan de oncollventioncle constructic die gekozcn is voor de promoUe en de zorgvuldjge correcties van de ma.nuscripi:en. Hermann .J ancschitz-Kriegl ben ik r.etlr erkentdijk VOM zijn enthousiasmc Cll betrokkenheid, welke altijd erg stimulerend VOOl' mij zijn geweest.
Stellingen behorende bij het proefschrift
van R. Wimberger-Friedl
1. De scheiding tussen st.roming8~ en thermisch geluduceerde spanningen is nid eq uivaJent aan de scheiding tussen orientatie en fest.spanningen. Afkoelspanningcn leiden tot fOokculaire orientatie.
Dit pTUefschrift, ded 3
2. Vrij afschrikken lcidt tot een geheel andere verdeling van rcst-spanningen en dubbele breking dan spuitgieten. De invloed van de hecht.ing van het polymcer aan de wand leidt in hd laatste geval tot. veellagere thermischc spanningen en tegelijk tot hoge drukgei'nduceerdc spannin~ gen.
Dit proefschrift, ded 3, L.P.A. DotIVen, p roefsch tift, Eindhoven 1991
3. lIet feit dat. de ingevwren dubbele brcking in PMMA sterk tcmperatuursafhankelijk is, bewijst niet de aanwezighcid van entropie-elastischc span~ ningen in de gla.<;toest'1I1J.
L.C.E Struik, Polym.Eng.8ci.} 18 {1978} 799; V.N. Tsvetkov and L.N. Verkhotina, 50v. Phys. -Tech.Phys., 3 (1958) 87, dit proefschrift, hoofdShl.k 2.1
4. De overschatting van het drukeffect op de rcstspanningen heeft dczelfde oOfzaa.k als hct overschaUen van het format.iedrukeJlect op de dicht.heidsverdelingen) namelijk hct. niet in rekening brengen van de tijdsafhankelijkheid van de comprcssibiliteit.
L..F.A. D01Lven} proefschrift} Eindhoven .1991, F.P. T. Baaijens, Rhcol. Acta, 30 (1991) 284, dit proe/'>chrijt, hoojdstuk 4·2
5. Dc opsplitsing van de dubbele bIeking in polycarbonaat in ccn spannings~ en cen oricntatie bijclrage door J~P. Wu en J.L.White is onjuist) cvcnals de orderparameter verdeling berekend uit de dubbele breking. De bijdrage van thermische spanningcn :l:OU volgens de a.ut.curs eerst van de dubbele breking afgetrokken moct.cn worden) hetgeen in het getoonde voorbceld nid wordt gedaa.n. Beidc alternatieven zijn cchter incorrect. Ook de hoofdassen van de dllbbcle breking liggen niet in het 2,3 vla.k 1
zoals impliciet veronderst.cld. Verder is de bcwcring, da1. vroeger niet de echtc dubbele breking maar em schijnhare waarde is gemeten) onjuist, zelfs in de geva.Jlcn waarbij de hoofdrichting buiten beschouwing is ge1a.ten.
J..p' Wu and .T.£. White, Polym . .Eng. Sci. , 31 (1991) 652
2
6. Ret door M.M.Qayyum and J.R.White gevonden verschil in de spanningsoptische coefficient van polycarbonaat in trek en drnk kan worden verklaard door het ontstaan van hoge afschuifspanningen in compressie bij de gekozen geometrie ten gevolge van de hechting aan de klemmen_
M.M. Qayyum and J.R. White} Polymer, 23 (1982) .129
7. Dc door T.-S. Chung gegeven verklaring voor verschillen in door Kamal en Greener gevonden dichtheidsverdelingen is ver gezocht en onjuist, In plaats van de voor de hand liggende effect en van de kristalliniteit in het geval van Kamal's data te benutten wordt het verschil toegeschreven aan verschillen in de (onbekende) aanspuitgeometrie. De door hem met behulp van een onjuist model berekende dichtheidsvariaties verschillen factoren van de experimentele gegevens en beschrijven de schijnbare experimentele discrepantie niet eellS kwalitatief.
T.-S. Chung, Polym.Eng.$ci., 28 (1988) 1509
8. De door A.I. Isayev en T. Hariharan gemcten grate verschillen in de verdichting van PS en PMMA zijn veroorzaakt door de verschillen in vochtopname van deze twee materialen. Het feit dat de schijnbare krirnp van PMMA redelijk kan worden voorspeld, betekent dat het gebruikte model eerder de diffusie van wa.ter goed kan beschrijven dan de fysische veroudering.
AJ Isayev) T. Hariharan} Polym.Eng.Sci., 25 (1985) 271
9. De kunst van reometrie is het beheersen en meten van de temperatuur.
10. Vertrouw geen commercieel meeta.pparaat. De producenten van meetapparatuur hebben de neiging de eigenlijke meting in Ben nblack box" tc stoppen en de absolute juistheid van de resultaten door middel van mooie j door computers gegenereerde plaatjes te suggereren.
11. Een beperking van de beschikbaarheid van ondersteunende diensten j
faciliteiten en budgetten in een onderzoeksinstelling leidt (in eerste instantie) tot een verh()ging van de output in vorm van publikaties. Dit mag echter niet als efficientieverhoging worden gei'nterpreteerd.
12_ Veel mensen hebben een heke1 aan hierarchie maar willen weI zelf graag de baas zijn.
3


![The Relativistic Electron Density [1ex] and Electron ... · PDF fileThe Relativistic Electron Density and Electron Correlation Markus Reiher ... Electron density distributions for](https://static.fdocuments.us/doc/165x107/5ab2020e7f8b9aea528d15ec/the-relativistic-electron-density-1ex-and-electron-relativistic-electron-density.jpg)


![Estimation of the 3D electron density distributions in the [1ex] solar … · 2015. 5. 22. · ESTIMATION OF THE 3D ELECTRON DENSITY DISTRIBUTIONS IN THE SOLAR CORONA FOR MORE REALISTIC](https://static.fdocuments.us/doc/165x107/6112226129051a7b0b070e6c/estimation-of-the-3d-electron-density-distributions-in-the-1ex-solar-2015-5.jpg)