Synthesis of Ruthenium nitrosyl complexes of bipyridine and phenanthroline.

188
P. Sathyadevi, 2011
Chapter VI
Organometallic ruthenium(II) complexes: Synthesis, structure and
influence of substitution at azomethine carbon towards DNA/BSA
binding, radical scavenging and cytotoxicity
The coordination chemistry of ruthenium complexes with pyridine and its
derivatives is one of the most studied areas due to their catalytic, redox, photoreactivity,
biological and supramolecular properties. A small variation of the coordination
environment around ruthenium ion effected by alterations in the donor centre, ligand
structure and chelate ring size significantly vary the properties of the complexes.1,2
Because of the broad range of applications possessed by mixed ligand ruthenium
Abstract
Bivalent, ruthenium organometallics containing hydrazone ligands have been synthesised
from the reactions of [RuH2(CO)(PPh3)3] and benzoic acid pyridine-2-ylmethylene-hydrazide (HL1)
(1) / benzoic acid (1-pyridin-2-yl-ethylidene)-hydrazide (HL2) (2) / benzoic acid (phenyl-pyridin-2-yl-
methylene)-hydrazide (HL3) (3). The composition of the new complexes were found to be
[RuH(CO)(PPh3)2(L1)] (4), [RuH(CO)(PPh3)2(L
2)] (5) and [RuH(CO)(PPh3)2(L
3)] (6) based on the
elemental analysis, UV-visible, infrared and 1H NMR spectroscopic data. The X-ray crystal structure
of one of the above complexes, [RuH(CO)(PPh3)2(L3)] (6) demonstrated a distorted octahedral
coordination geometry around the metal center. An investigation on the effect of substitution at the
azomethine carbon of the hydrazone coordinated in these ruthenium chelates on the potential binding
with DNA/BSA, free radical scavenging and cytotoxicity is presented. The magnitude of the binding
constant (Kb) obtained from absorption spectral titration varies from 10-5
-10-7
M-1
depending upon the
nature of the substituent’s attached at the azomethine carbon atom and the same was found to decrease
in the order 6 > 5 > 4. Interaction of the above complexes 4-6 with bovine serum albumin (BSA)
suggested the occurrence of static quenching process between them and the number of binding sites
was found to be ~0.6-0.9 that proves single mode of binding. The conformational changes of BSA
upon the addition of metal chelates have also been monitored using synchronous fluorescence
measurements. Further, free radical scavenging and cytotoxicity of the compounds 4, 5 and 6 against
ABTS+, O2
- and OH radicals and HeLa and A341 cell lines under in vitro conditions proved their
pharmacological properties.

189
Organometallic ruthenium(II) complexes: ….
P. Sathyadevi, 2011
complexes, there is a continuous endeavor to synthesize new complexes of it with an
objective to fine tune their properties.
Over the years, much attention has been paid to investigate the chemistry of
transition metal complexes with large number of hydrazones as co-ligand, in particular
pyridine containing systems. Hydrazone ligands create an environment similar to the one
present in biological systems usually by making coordination through oxygen and
nitrogen atoms. Various important properties of carbonic acid hydrazides, along with
their applications in medicine and analytical chemistry, have led to increased interest in
their complexation characteristics with transition metal ions.3 The hydrazone unit offers a
number of attractive features such as the degree of rigidity, a conjugated -system and an
NH unit that readily participates in hydrogen bonding and may be a site of protonation-
deprotonation. It is well established that the formation of metal complexes plays an
important role to enhance the biological activity of free hydrazones.4
Hydrazone ligands are very promising compounds from the view point of
coordination chemistry because of their ability towards complexation and involvement in
wide range of biological and non-biological properties.5,6
The chemistry of transition
metals with ligands from the hydrazine family has been of interest to coordination as well
as bioinorganic chemists due to their different bonding modes with both electron–rich
and electron-poor metals.7,8
The structural motif, –N=C–CH=N–NH–C=N–, present in
heterocyclic hydrazones is a remarkable tool for development of multifunctional organic
receptors that find applications in chemical, environmental and biological sciences.
Hydrazones of pyridine-2-carboxaldehyde is a well studied system in transition metal
coordination chemistry, providing metal complexes with important magnetic, redox,
photochemical, ion exchange, catalytic and biological activities.9-13
The metallochemistry
of biomolecules has been largely focused on proteins, amino acids, nucleic acids and
carbohydrates.14-17
Heterocyclic hydrazones constitute an important class of biologically
active drugs that have attracted the attention of medicinal chemists due to their wide
ranging pharmacological properties like antifungal, antibacterial and anticonvulsant
compounds.18-22
During the last two or three decades, there has been an increasing
attention on the binding study of small molecules to DNA, since it is an important genetic
substance in organisms.23-25
Errors in gene expression can often cause diseases and play a
190
Organometallic ruthenium(II) complexes: ….
P. Sathyadevi, 2011
secondary role in the outcome and severity of human diseases.26
Hence, a complete
understanding of DNA-drug binding is significant in the rational design of DNA
structural probe, DNA footprinting, sequence-specific cleaving agents and potential
anticancer drugs.27-30
To design effective chemotherapeutic agents and better anticancer
drugs, it is essential to explore the interactions of metal complexes with DNA.
Serum albumin is the major soluble protein constituent in the circulatory system
of a wide variety of organisms and it has the ability to reversibly bind to a large variety of
endogenous and exogenous ligands such as fatty acids, drugs, and metal ions in the
bloodstream.31,32
The drug-protein complex not only strongly affected the absorption,
distribution, metabolism and excretion properties of drugs, but also influenced the drug
stability and toxicity during the chemotherapeutic process. Therefore, knowledge on the
mechanism of interaction between the selected drug and protein has become very vital to
design several new drugs with improved potential.33,34
In the current work, the authors
have chosen bovine serum albumin (BSA) as a model protein to investigate its interaction
with the newly synthesised ruthenium hydrazone chelates 4-6 owing to its similarity with
human serum albumin (HSA) in respect of approximately 76% sequence homology, and
3D structure.35
From the literature reports, it is understood that the variation in the bulkiness of
substituents present in the ligand that was coordinated to a transition metal in the
complexes containing them have an influence on the DNA binding of them. Based on the
above mentioned factors and in continuation of our interest on the studies related to
various hydrazone ligands towards transition metals, we herein, present the synthesis and
structural investigations of three new ruthenium hydrazone complexes containing the
azomethine carbon substituted with hydrogen or methyl or phenyl groups. Further studies
to explore the effect of these substitutions at the azomethine carbon on DNA / BSA
binding, free radical scavenging and cytotoxicity of these organometallic complexes were
also undertaken under in vitro conditions.

191
Organometallic ruthenium(II) complexes: ….
P. Sathyadevi, 2011
Experimental section
Materials
Reagent grade chemicals were used without further purification in all the
synthetic work. All solvents were purified by standard methods. The compounds
RuCl2·6H2O, triphenylphosphine, benzhydrazide, pyridine-2-carbaldehyde, 2-acetyl
pyridine and 2-benzoyl pyridine were purchased from Sigma-Aldrich Chemie and Alfa
Aesar, respectively and used as received. Calf thymus (CT DNA) and bovine serum
albumin (BSA) were purchased from Himedia. The human cervical cancer cell line
(HeLa), human skin cancer cell line (A431) and non-cancerous NIH 3T3 mouse
embryonic fibroblasts was obtained from National Centre for Cell Science (NCCS),
Pune, India. All the other chemicals and reagents used for DNA binding, protein binding,
antioxidant and cytotoxicity assays were of high quality.
Physical measurements
Microanalyses (% C, H & N) were performed on a Vario EL III CHNS analyzer.
IR spectra of the samples were recorded using KBr pellets on a Nicolet Avatar instrument
in the frequency range of 400-4000 cm-1
. 1H NMR spectra of ligands and their metal
hydrazone complexes were recorded on a Bruker AMX 500 spectrometer operating at
500 MHz using DMSO as solvent and tetramethylsilane as an internal standard. The
electronic absorption and emission spectra were recorded in DMSO-buffer (5:95)
solution on a Jasco V-630 spectrophotometer and Jasco FP 6600 spectrofluorometer
respectively at room temperature.
A BRUKER APEX 2 X-ray (three-circle) diffractometer was employed for crystal
screening, unit cell determination, and data collection. The XRD data of the complex 6
was collected at 110 K with MoKα radiation λ = 0.70173Å. The structure was refined
(weighted least squares refinement on F2) to convergence.
36 X-seed was employed for the
final data presentation and structure plots.37
Integrated intensity information for each
reflection was obtained by reduction of the data frames with APEX2.38
The integration
method employed a three dimensional profiling algorithm and all data were corrected for
Lorentz and polarization factors, as well as for crystal decay effects. Finally the data was
merged and scaled to produce a suitable data set. SADABS 39
was used to correct the data

192
Organometallic ruthenium(II) complexes: ….
P. Sathyadevi, 2011
for absorption effects. A solution was obtained readily using XS as implemented in
SHELXTL. To possibly verify the solvated molecule and its occupancy, SQUEEZE was
applied using PLATON (after the removal of the ethanol molecule from refinement). All
non-hydrogen atoms were refined with anisotropic thermal parameters.
Synthesis of ruthenium(II) starting precursor complex
The precursor metal complex [RuH2(CO)(PPh3)3] was prepared according to the
literature method.40
Preparation of carbonyldihydridotris(triphenylphosphine)ruthenium(II)
[RuH2(CO)(PPh3)3]
A solution of 0.13 g (0.5 mmol) of ruthenium trichloride trihydrate (RuCl3·3H2O)
in ethanol (5 cm3), aqueous formaldehyde (5 cm
3, 40 %) and 0.15 g of potassium
hydroxide in ethanol (5 cm3) were added quickly and successively to a boiling solution of
0.79 g (3 mmol) of triphenylphosphine in ethanol (35 cm3). The solution was heated
under reflux for 15 minutes and then cooled. The resultant grey compound was separated
and washed successively with ethanol, water and n-hexane and dried in vacuo.
Yield: 72%. Colour; Grey; mp: 160 °C.
Synthesis of hydrazone ligands
The reactions involved in the synthesis of hydrazone ligands and its
corresponding ruthenium hydrazone complexes were given in scheme 6.1.
Synthesis of benzoic acid (pyridine-2-yl-methylene)-hydrazide HL1 (1)
Benzoic acid pyridine-2-ylmethylene-hydrazide ligand (1) was prepared by
refluxing a mixture of benzhydrazide (0.680 g; 5 mM) and pyridine-2-carboxaldehyde
(0.478 g; 5 mM) in 50 mL of absolute ethanol for 8 h as given in scheme 6.1. The
reaction mixture was cooled to room temperature and the solid obtained was filtered,
washed several times with distilled water and recrystallized from EtOH to afford the
ligand 1 in pure form with good yield.

193
Organometallic ruthenium(II) complexes: ….
P. Sathyadevi, 2011
Yield: 90%. Colour: Creamy white; mp: 120 °C. Anal. Found (%) for C13H11N3O1 (Mol
wt = 225.246): C, 69.51; H, 5.09; N, 18.97. Calculated (%): C, 69.32C; H, 4.92; N, 18.66.
Selected IR bands (νmax in cm-1
): 3202 (N–H); 1661 (C=O); 1586 (C=N); 1072 (N–N).
1H NMR (500 MHz, [D6] DMSO): δ (ppm): 14.63 (s, 1H, enolic OH); 8.59 (s, 1H, NH);
8.43-7.38 (m, 9H, Ar–H); 7.53 (s, 1H, HC=N).
Synthesis of benzoic acid (1-pyridin-2-yl-ethylidene)-hydrazide HL2 (2)
Benzoic acid (1-pyridin-2-yl-ethylidene)-hydrazide ligand (2) was prepared by
refluxing a mixture of benzhydrazide (0.680 g; 5 mM) and 2-acetyl pyridine (0.605 g; 5
mM) in 50 mL of absolute ethanol for 8 h as given in scheme 6.1. The reaction mixture
was cooled to room temperature and the solid obtained was filtered, washed several times
with distilled water and recrystallized from EtOH to afford the ligand 2 in pure form with
good yield.
Yield: 88%. Colour: Pale yellow; mp: 125 °C. Anal. Found (%) for C14H13N3O1 (Mol wt
= 239.273): C, 70.36; H, 5.41; N, 17.41. Calculated (%): C, 70.28; H, 5.48; N, 17.56.
R
NN
O
Ru
PPh3
H
OC
NPh3P
R
NNH
O
NNR
O
H2NNH
O
EtOH
EtOH, MeOH
R
NN
HO
N+
[RuH2(CO)(PPh3)3]
Reflux, 8h
Reflux, 48h
Ligand R
HL1
HL2
HL3
H
CH3
C6H5
Scheme 6.1 Synthesis of hydrazone ligands and their ruthenium complexes.

194
Organometallic ruthenium(II) complexes: ….
P. Sathyadevi, 2011
Selected IR bands (νmax in cm-1
): 3178 (N–H); 1656 (C=O); 1540 (C=N); 1060 (N–N). 1H
NMR (500 MHz, [D6] DMSO): δ (ppm): 14.86 (s, 1H, enolic OH); 9.12 (s, 1H, NH);
8.46-7.23 (m, 9H, Ar–H); 2.52 (s, 3H, CH3C=N).
Synthesis of benzoic acid (phenyl-pyridin-2-yl-methylene)-hydrazide HL3 (3)
Benzoic acid (phenyl-pyridin-2-yl-methylene)-hydrazide ligand (3) was prepared
by refluxing a mixture of benzhydrazide (0.680 g; 5 mM) and 2-benzoyl pyridine (0.915
g; 5 mM) in 50 mL of absolute ethanol for 8 h as given in scheme 6.1. The reaction
mixture was cooled to room temperature and the solid obtained was filtered, washed
several times with distilled water and recrystallized from EtOH to afford the ligand 3 in
pure form with good yield.
Yield: 85%. Colour: Pale yellow; mp: 131 °C. Anal. Found (%) for C19H15N3O1 (Mol wt
= 301.342): C, 75.52; H, 5.15; N, 13.81. Calculated (%): C, 75.73; H, 5.02; N, 13.94.
Selected IR bands (νmax in cm-1
): 3143 (N–H); 1678 (C=O); 1581 (C=N); 1075 (N–N).
1H NMR (500 MHz, [D6] DMSO): δ (ppm): 15.09 (s, 1H, enolic OH); 8.86 (s, 1H, NH);
8.01-7.43 (m, 14H, Ar–H).
Synthesis of ruthenium(II) hydrazone complexes
Synthesis of [RuH(CO)(PPh3)2(L1)] (4)
Complex 4 was synthesised by refluxing a methanolic solution of
[RuH2(CO)(PPh3)3] (0.917 g; 1 mM) and the ethanolic solution of ligand 1 (0.224 g; 1
mM) (40 mL) for 48 h (scheme 6.1). After cooling the reaction mixture to room
temperature, the precipitate formed was filtered, washed with a mixture of ethanol and
methanol and dried in vacuo. The purity of the complex was checked by TLC and
isolation of crystals suitable for single crystal XRD studies went unsuccessful.
Yield: 58%. Colour: Reddish brown; mp: 237 °C. Anal. Found (%) for Ru1C50H41N3O2P2
(Mol wt = 878.897): C, 68.49; H, 4.82; N, 4.61. Calculated (%): C, 68.33; H, 4.70; N,
4.78. Selected IR bands (νmax in cm-1
): 1598, 1480 (C=N–N=C); 1369 (C–O); 1092 (N–
N); 2023 (Ru–H); 1953 (Ru–CO). UV-visible (DMSO-buffer): λmax (nm): 266 & 305

195
Organometallic ruthenium(II) complexes: ….
P. Sathyadevi, 2011
(ILCT); 376 (LMCT); 441 (MLCT). 1H NMR (500 MHz, [D6] DMSO): δ (ppm): 8.21 (s,
1H, HC=N); 8.02-6.32 (m, 39H, Ar–H); -10.09 (dt, 1H, Ru–H).
Synthesis of [RuH(CO)(PPh3)2(L2)] (5)
Complex 5 was synthesised by refluxing a methanolic solution of
[RuH2(CO)(PPh3)3] (0.917 g; 1 mM) and the ethanolic solution of ligand 2 (0.239 g; 1
mM) (40 mL) for 48 h (scheme 6.1). After cooling the reaction mixture to room
temperature, the precipitate formed was filtered, washed with a mixture of ethanol and
methanol and dried in vacuo. The purity of the complex was checked by TLC and
isolation of crystals suitable for single crystal XRD studies went unsuccessful.
Yield: 55%. Colour: reddish brown; mp: 243 °C. Anal. Found (%) for Ru1C51H43N3O2P2
(Mol. wt = 892.925): C, 68.89; H, 4.88; N, 4.61. Calculated (%): C, 68.60; H, 4.85; N
4.71. Selected IR bands (νmax in cm-1
): 1591, 1481 (C=N–N=C); 1366 (C–O); 1092 (N–
N); 2028 (Ru–H); 1961 (Ru–CO). UV-visible (DMSO-buffer): λmax (nm): 269 & 309
(ILCT); 442 (MLCT). 1H NMR (500 MHz, [D6] DMSO): δ (ppm): 2.77 (s, 3H,
CH3C=N); 8.12-6.26 (m, 39H, Ar–H); -10.56 (dt, 1H, Ru–H).
Synthesis of [RuH(CO) (PPh3)2(L3)] (6)
Complex 6 was synthesised by refluxing a methanolic solution of
[RuH2(CO)(PPh3)3] (0.917 g; 1 mM) and the ethanolic solution of ligand 3 (0.301 g; 1
mM) (40 mL) for 48 h (scheme 6.1). After cooling the reaction mixture to room
temperature, the precipitate formed was filtered, washed with a mixture of ethanol and
methanol and dried in vacuo. The purity of the complex was checked by TLC following
which the sugar like reddish brown crystals of complex 6 suitable for single crystal X-ray
diffraction studies were obtained in a mixture of ethanol and methanol.
Yield: 59%. Colour: Reddish brown; mp: 244 °C. Anal. Found (%) for
Ru1C56H45N3O2P2 (Mol wt = 954.993): C, 70.69; H, 4.88; N, 4.51. Calculated (%): C,
70.43; H, 4.75; N, 4.40. Selected IR bands (νmax in cm-1
): 1588, 1479 (C=N–N=C); 1365
(C–O); 1091 (N–N); 2024 (Ru–H); 1952 (Ru–CO). UV-visible (DMSO-buffer): λmax

196
Organometallic ruthenium(II) complexes: ….
P. Sathyadevi, 2011
(nm): 265 (ILCT); 428 (MLCT). 1H NMR (500 MHz, [D6] DMSO): δ (ppm): 8.16-6.21
(m, 44H, Ar–H); -10.02 (dt, 1H, Ru–H).
DNA binding studies
Electronic absorption experiments
Electronic absorption titration experiments were performed with a fixed
concentration of metal complex (25 μM) but variable nucleotide concentration ranging
from 0 to 25 μM and after each addition of DNA to the metal complex, the readings were
noted.
Competitive binding measurements
A proof for the binding of complexes 4, 5 and 6 with DNA via intercalation was
obtained through the emission quenching experiment involving the competitive DNA
binding between them and ethidium bromide carried out in the buffer by keeping
[DNA]/[EtBr] = 2; [DNA] = 10 μM, [EtBr] = 5 μM and varying the concentrations of the
metal complexes (0-80 μM). The buffer used in the binding studies was 50 mM Tris HCl,
pH 7.2, containing 10 mM NaCl. For all fluorescence measurements, the entrance and
exit slits were maintained at 5 and 10 nm, respectively. The excitation wavelength was
545 nm, and the emission range was set between 530 and 750 nm and the experimental
data were measured at room temperature. In this method, fixed amounts of DNA and
EtBr were titrated with increasing amounts of complex over a range of complex
concentrations from 0-80 μM. The experiments were conducted at 20 °C in a Tris buffer.
EB was non-emissive in Tris-HCl buffer solution (pH, 7.2) due to fluorescence
quenching of free EB by the solvent molecules. In the presence of DNA, EB showed
enhanced emission intensity due to its intercalative binding to DNA. A competitive
binding of the metal complexes to CT DNA resulted in the displacement of the bound EB
thereby decreasing its emission intensity. The quenching constant (Kq) was calculated
using the classical Stern-Volmer equation,41
I0/I = Kq [Q] + 1
where, I0 and I are the respective emission intensities in the absence and presence of
quencher, Kq is the quenching constant and [Q] is the quencher concentration. Kq is the

197
Organometallic ruthenium(II) complexes: ….
P. Sathyadevi, 2011
slope, obtained from the plot of I0/I vs [Q]. The apparent binding constant (Kapp) has been
calculated from the equation,
KEB [EB] = Kapp [complex]
The complex concentration was obtained from the value at a 50% reduction of the
fluorescence intensity of EB and KEB = 1.0×10⁷ M
-1.
Protein binding studies
Binding of metal hydrazone complexes with bovine serum albumin (BSA) was
studied from the fluorescence spectra recorded with an excitation at 280 nm and
corresponding emission at 345 nm assignable to that of bovine serum albumin (BSA).
The excitation and emission slit widths and scan rates were kept constant for all the
experiments. Sample solutions were carefully degassed using pure nitrogen gas for 15
minutes by using quartz cells (4×1×1 cm) with high vacuum teflon stopcocks. Stock
solution of BSA was prepared in 50 mM phosphate buffer (pH, 7.2) and stored in the
dark at 4 °C for further use. Concentrated stock solutions of the ligands and its copper
complexes were prepared by dissolving them in DMSO:phosphate buffer (5:95) and
diluted suitably with phosphate buffer to required concentrations. 2.5 mL of BSA
solution (1 μM) was titrated by successive additions of a 5 μL stock solution of metal
hydrazone complexes (10-4
M) using a micropipette. Synchronous fluorescence spectra
was also recorded using the same concentration of BSA and complexes as mentioned
above with two different λ (difference between the excitation and emission wavelengths
of BSA) values such as 15 and 60 nm.
Antioxidant studies
The superoxide, hydroxyl and ABTS radical scavenging activities of the
ruthenium hydrazone complexes were determined by the methods described by
Beauchamp et al , Nash and Re et al, respectively.42-44
Superoxide radical scavenging activity
The superoxide (O2–) radical scavenging assay was done based on the capacity of
the compounds to inhibit formazan formation by scavenging the superoxide radicals
generated in riboflavin-light-NBT system. Each 3 mL reaction mixture contained 50 mM

198
Organometallic ruthenium(II) complexes: ….
P. Sathyadevi, 2011
sodium phosphate buffer (pH, 7.6), 20 µg riboflavin, 12 mM EDTA and 0.1 mg NBT.
Reaction was started by illuminating the reaction mixture with different concentration of
the test compounds (10-50 µM) for 90 seconds. Immediately after illumination, the
absorbance was measured at 590 nm. The entire reaction assembly was enclosed in a box
lined with aluminum foil. The above reaction mixture without test sample was used as
control.
Hydroxyl radical scavenging activity
The hydroxyl (OH) radical scavenging activity of complexes 4-6 have been
investigated using the Nash method. In vitro hydroxyl radicals were generated by Fe
3+ /
ascorbic acid system. The detection of hydroxyl radicals was carried out by measuring
the amount of formaldehyde formed from the oxidation reaction with DMSO. The
formaldehyde produced was detected spectrophotometrically at 412 nm. A mixture of 1.0
mL of iron-EDTA solution (ferrous ammonium sulphate (0.331 mM) and EDTA (0.698
mM), 0.5 mL of EDTA solution (0.048 mM) and 1.0 mL of DMSO (10.83 mM) DMSO
(v/v) in 0.1 M phosphate buffer, pH 7.4) were sequentially added to the test tubes
containing the test compounds with different concentrations in the range of 10-50 µM.
The reaction was initiated by adding 0.5 mL of ascorbic acid (1.25 mM) and incubated at
80-90 °C for 15 min in a water bath. After incubation, the reaction was terminated by the
addition of 1.0 mL of ice cold TCA (107 mM). Subsequently, 3.0 mL of Nash reagent
was added to each tube and left at room temperature for 15 min. The reaction mixture
without sample was used as control. The intensity of the colour formed was measured
spectrophotometrically at 412 nm against reagent blank.
ABTS cationic radical scavenging activity
Total antioxidant activity assay using ABTS cationic radical was studied
according to the following procedure. ABTS (2,2'-Azino-3-ethylbenzthiazoline-6-
sulfonic acid diammonium salt) was dissolved in water to a 5 mM concentration and its
cationic radical was produced by reacting with 5 mM potassium persulfate. The resulting
mixture was kept in dark at room temperature for 12-16 h before use. Prior to assay, the
solution was diluted in ethanol (about 1:79 v/v) and equilibrated to 30 °C to give an

199
Organometallic ruthenium(II) complexes: ….
P. Sathyadevi, 2011
absorbance of 0.70±0.02 at 734 nm. After the addition of 2 mL of diluted ABTS cationic
radical solution to different concentration (10-50 µM) of the compounds, the absorbance
was taken at 30 °C exactly 30 min after the initial mixing and the reaction mixture
without test sample was used as control.
For each of the above assay, tests were run in triplicate by varying the
concentration of complexes 4, 5 and 6 ranging from 10-50 μM. The percentage activity
was calculated by using the formula,
% activity = [(A0-AC)/A0] × 100
where, A0 and AC represent the absorbance in the absence and presence of the test
compounds, respectively. The 50% activity (IC50) can be calculated from the result of
percentage activity.
Cytotoxicity
The in vitro cytotoxicity assay (IC50) was performed on the human cervical cancer
cell line HeLa, human skin cancer cell line A431 and the NIH 3T3 mouse embryonic cell
line by MTT assay.45
The HeLa tumour cell lines used in this work were grown in Eagles
Minimum Essential Medium containing 10% fetal bovine serum (FBS) and the NIH 3T3
fibroblasts were grown in Dulbeccos Modified Eagles Medium (DMEM) containing 10%
FBS. For the screening experiments, the cells were seeded into 96 well plates in 100 mL
of the respective medium containing 10% FBS, at a plating density of 10,000 cells/well.
The cells were incubated at 37 °C in 5% CO2 and 95% air at a relative humidity of 100%
for 24 h prior to the addition of the complexes. The complexes were solubilized in
dimethylsulfoxide and diluted in the respective serum free medium. After 24 h, 100 mL
of the medium containing the test compounds with various concentrations (e.g. range of
15-500 µM for all the three complexes to HeLa and NIH 3T3 normal cell lines whereas
7.5-250 µM of complexes 4 and 5 and 3.12-100 µM concentration of complex 6 to the
A431 cell lines) was added and incubated at 37 °C in an atmosphere of 5% CO2 and 95%
air with 100% relative humidity for 48 h. All measurements were made in triplicate and
the medium containing no test complexes served as the control. After 48 h, 15 mL of
MTT (5 mg/mL) in phosphate buffered saline (PBS) was added to each well and
incubated at 37 °C for 4 h. The medium with MTT was then flicked off and the formazan

200
Organometallic ruthenium(II) complexes: ….
P. Sathyadevi, 2011
crystals that had formed were solubilized in 100 mL of DMSO and the absorbance at 570
nm was measured using a micro plate reader. The % cell inhibition was determined using
the following formula,
% cell Inhibition = 100 - Abs(sample) / Abs(control) × 100.
The IC50 values were calculated from the graph plotted between % cell inhibition
and concentration.
Results and discussion
The reactions of [RuH2(CO)(PPh3)3] with the hydrazone ligands benzoic acid
(pyridine-2-yl-methylene)-hydrazide (HL1) (1), benzoic acid (1-pyridin-2-yl-ethylidene)-
hydrazide (HL2) (2) and benzoic acid (phenyl-pyridin-2-yl-methylene)-hydrazide (HL
3)
(3) yielded complexes of the type [RuH(CO)(PPh3)2(L1)] (4), [RuH(CO)(PPh3)2(L
2)] (5)
and [RuH(CO)(PPh3)2(L3)] (6) (scheme 6.1). The analytical data of the above said
complexes are in good agreement with the proposed molecular formulae with 1:1 metal
to ligand stoichiometries (given in the experimental part). All the synthesised compounds
are quite stable in air and light and soluble in most of the common organic solvents and
are well characterised using several physico-chemical techniques.
Infrared spectra
To identify the mode of coordination of the free ligands to the ruthenium ion, the
IR spectra of the metal hydrazone complexes were compared with that of the free
hydrazone ligands in the region 4000-400 cm-1
. The spectra of the free hydrazone ligands
1, 2 and 3 displayed the characteristic absorption bands in the range of 3143-3202, 1656-
1678, 1540-1586 and 1060-1075 cm-1
due to ν(N–H), ν(C=O), ν(C=N) and ν(N–N) vibrations,
respectively. The bands due to the ν(N–H) and ν(C=O) vibrations of the free ligand were
absent in the spectra of complexes 4-6 thus indicating that enolization and deprotonation
had taken place prior to coordination. This was further confirmed by the detection of two
new bands in the ranges 1598-1480 cm-1
and 1365-1369 cm-1
that are assigned to ν(C=N–
N=C) and ν(C–O) stretching vibrations, respectively. The band attributed to ν(N–N) stretching
underwent a positive shift of 17-32 cm-1
in comparison with that of the free ligand, thus
implying that coordination involves the nitrogen atom of the azomethine group. Further,

201
Organometallic ruthenium(II) complexes: ….
P. Sathyadevi, 2011
the presence of Ru–H and Ru–CO has been identified from the absorptions found in the
range of 2023-2028 and 1952-1961 cm-1
respectively. Taken collectively, the foregoing
spectral data indicate that the hydrazone behaves as a monobasic bidentate (NO)
chelating ligand in each of the complexes 4-6.
Electronic spectra
The electronic absorption spectra of complexes 4, 5 and 6 consist of two to four
well-resolved bands in the range of 250 to 450 nm. Complex 4 exhibited absorptions at
266, 305, 376 and 441 nm. Similarly complex 5 showed its absorptions at 269, 309, 442
nm and complex 6 displayed at 265 and 428 nm. The high energy absorption bands
appeared in the spectra of respective complexes at 266, 269 and 265 nm are assigned to
π→π* intra ligand charge transfer transitions and the band that were found at 305 and
309 nm for complexes 4 and 5 can be attributed to n→π* intra ligand charge transfer
transitions of the imine group. Further, the band that was present at 376 nm for the
complex 4 was due to ligand to metal charge transfer (LMCT) transitions and the bands
that were present at 441, 442 and 428 nm for complexes 4, 5 and 6 respectively can be
assigned to metal to ligand charge transfer (MLCT) transitions.
1H NMR spectra
1H NMR spectrum of the free hydrazone ligands and their complexes were
assigned on the basis of observed chemical shift. The spectra of the ligands 1, 2 and 3
displayed a sharp singlet respectively at 14.63, 14.86 and 15.09 ppm due to enolic OH
proton. Another singlet observed at 8.59, 9.12 and 8.86 ppm are attributed to NH proton
of the respective ligands. But, the NMR spectrum of complexes 4-6 did not register any
signals corresponds to either NH or enolic OH and indicated that the ligands adopted enol
form followed by deprotonation prior to coordination with the metal ion. In addition, a
sharp singlet observed in the spectrum of ligand 1 owing to azomethine (HC=N) proton
at 7.53 ppm underwent downfield shift and aroused its peak at 8.21 ppm in the spectrum
of complexes. Further, ligand 2 showed a singlet at 2.52 ppm for (CH3C=N) which upon
complexation exhibited its peak at 2.77 ppm. The signal due to Ru–H for all the
complexes appeared as doublets of triplet at -10.09, -10.56 and -10.02 ppm respectively

202
Organometallic ruthenium(II) complexes: ….
P. Sathyadevi, 2011
that are due to coupling to the two phosphorus nuclei.46,47
The signals corresponding to
the protons of aromatic moieties of the ligands were observed as multiplets in the range
of 6-8.1 ppm.
Fig. 6.1 1H NMR spectra of complexes 4 and 5.
[RuH(CO)(PPh3)2(L2)] (5)
[RuH(CO)(PPh3)2(L1)] (4)

203
Organometallic ruthenium(II) complexes: ….
P. Sathyadevi, 2011
X-ray crystallography
From the elemental analyses, IR, electronic and 1H NMR spectroscopic studies it
is understood that both the complexes 4-6 are not structurally similar to each other.
Hence, the exact structures of the complexes have been studied by using single crystal X-
ray diffraction method.
Crystallographic study of [RuH(CO)(PPh3)2(L3)] (6)
An ORTEP representation of the structure of [RuH(CO)(PPh3)2(L3)] (6) inclusive
of the atom numbering scheme is shown in Fig. 6.3. Crystal and structure refinement data
and the bond parameters associated with the metal centers are listed in Table 6.1 and
Table 6.2. Complex 6 features the coordination of HL3 (3) ligand to the metal ion thus
forming a fused five membered chelate rings. Systematic reflection conditions, and
statistical tests of the data suggested that the crystals of 6 are triclinic with
centrosymmetric space group P-1, Z = 2 and unit cell dimensions a = 11.9691(14) Å, b =
Fig. 6.2 1H NMR spectrum of complex 6.
[RuH(CO)(PPh3)2(L3)] (6)

204
Organometallic ruthenium(II) complexes: ….
P. Sathyadevi, 2011
12.0656(14) Å, c = 17.618(2) Å; V = 2387.0(5) Å3 Dc = 1.385 Mg/m
3. Ruthenium centre
is in distorted octahedral H(CO)NOP2 coordination sphere with meridionally spanning
imine N and deprotonated amide O donor bidentate ligand and the hydrogen atom and
carbonyl molecule of the starting metal precursor form an H(CO)NO square plane around
the metal centre. The bulky PPh3 molecules from the precursor complex are trans
oriented to occupy the remaining two axial positions of the coordination pockets. As
expected, the two trans Ru–P bond lengths are much longer than the four equatorial bond
lengths indicating a large axial distortion. This lengthening is most likely due to the
strong trans effect of the PPh3 ligands. The lengthening is evidenced by two central bond
lengths Ru1–P1 [2.3736(3) Å] and Ru1–P2 [2.3469(3) Å] that are longer when compared
to that of the other four basal planar bonds Ru1–O2 [2.1011(2) Å], Ru1–N1 2.1946(3)
Å], Ru1–H1 [1.4438(2) Å], Ru1–C1 [1.8274(2) Å]. The trans angle of P1–Ru1–P2
[169.02(7)°] is not close to the ideal value of 180°, that provides further evidence for the
lengthening of axial substituent. However, the other trans angles of the basal planes
namely C1–Ru1–N1 [105.85(6)°], N1–Ru1–O2 [75.66(6)°], O2–Ru1–H1[92.47(6)°] and
H1–Ru1–C1 [86.02(6)°], are constrained by the meridional ligands that clearly indicates
Fig.6.3 Molecular structure of complex 3, with displacement ellipsoids drawn at 50% probability level.

205
Organometallic ruthenium(II) complexes: ….
P. Sathyadevi, 2011
that the coordination geometry around the ruthenium metal center is in distorted
octahedral. In addition, a molecule of ethanol was found solvated in the unit cell. Further,
there exists a hydrogen bonding between the solvated ethanol molecule and pyridine
nitrogen (N3) of the ligand moiety. The unit cell packing diagram along with hydrogen
bonding is given in Fig. 6.4.
Fig. 6.4 Unit cell packing diagram of the complex 6 with hydrogen bonding.

206
Organometallic ruthenium(II) complexes: ….
P. Sathyadevi, 2011
Table 6.1 Crystal and structure refinement data.
Description Complex 6
Formula C57.74H50.23N3O2.87P2Ru Formula weight 995.11
Temperature (K) 110(2)
(Å) 0.71073 Å
Crystal system Triclinic
Space group P-1
Cell dimensions a (Å)
b (Å)
c (Å)
(°)
(°)
(°)
11.9691(14)
12.0656(14)
17.618(2)
95.5210(10) 107.1440(10)
97.3580(10)
Z 2 hkl limits -15<=h<=15
-15<=k<=15
-22<=l<=22
Dcalcd (Mg/m3) 1.385 F(000) 1029
Crystal size (mm3) 0.10×0.05×0.03
Independent reflections 10758 [R(int) = 0.0249]
Data / restraints / parameters 10758 / 0 / 594
Goodness of fit on F2 1.067 Final R indices [I>2sigma(I)] R1 = 0.0355, wR2 = 0.0855
R indices (all data) R1 = 0.0419, wR2 = 0.0894
Table 6.2 Selected bond lengths (Ǻ) and bond angles (°).
Complex 6
Bond lengths (°) Bond angles (Å)
Ru1–H1 1.4438(2) P1–Ru1–O2 84.19
Ru1–C1 1.8274(2) H1–Ru1–O2 92.47
Ru1–O2 2.1011(2) H1–Ru1–P2 83.91
Ru1–N1 2.1946(3) P2–Ru1–C1 87.44
Ru1–P1 2.3736(3) C1–Ru1–N1 105.85
Ru1–P2 2.3469(3) N1–Ru1–P1 95.64
N1–N2 1.4047(1) P1–Ru1–P2 169.02
N2–C2 1.3110(1) C1–Ru1–O2 178.49
C2–O2 1.2872(1) H1–Ru1–N1 167.78
P1–C27 1.8268(1) C3–C2–N2–N1 177.86
P2–C45 1.8357(2) C9–N1–N2–C2 173.35
N1–C9 1.3038(1) N2–N1–C9–C15 -173.96

207
Organometallic ruthenium(II) complexes: ….
P. Sathyadevi, 2011
Biological properties
DNA binding studies
Electronic absorption measurements
The electronic absorption spectra of complexes 4, 5 and 6 consist of two to four
well-resolved bands in the range of 250 to 450 nm. Complex 4 exhibited absorptions at
266, 305, 376 and 441 nm. Similarly complex 5 showed its absorptions at 269, 309, 442
nm and complex 6 displayed at 265 and 428 nm. These bands were assigned to ILCT,
LMCT and MLCT transitions that were discussed in previous section. Upon the addition
of DNA, all the absorption bands corresponding to complex 4 showed significant
increase in its absorption intensity at the beginning followed by hypochromism together
Fig. 6.5 Electronic absorption spectra of complexes 4-6 (25 μM) in the absence and presence of increasing amounts of CT DNA (2.5, 5.0, 7.5, 10.0, 12.5, 15.0, 17.5 and 20.0, 22.5 and 25 μM). Arrows show the changes in
absorbance with respect to an increase in the DNA concentration.
6
250 300 350 400 450 500 550
0.0
0.1
0.2
0.3
0.4
0.5
Ab
so
rban
ce
Wavelength (nm)
250 300 350 400 450 500 550
0.0
0.1
0.2
0.3
0.4
0.5
Ab
so
rban
ce
Wavelength (nm)
4
250 300 350 400 450 500 550
0.0
0.1
0.2
0.3
0.4
0.5
Ab
so
rban
ce
Wavelength (nm)
5

208
Organometallic ruthenium(II) complexes: ….
P. Sathyadevi, 2011
with a blue shift of about 1, 1, 5 and 0 nm respectively. In the case of complex 5 and 6 we
observed the same phenomenon of hyperchromism followed by hypochromism
respectively at 269, 309, 442, 265 and 428 nm together with a blue shift of 1, 1, 0, 2 and
1 nm. These results are similar to those reported earlier for various metallointercalators48
suggesting that the complexes were bound to DNA in an intercalative mode. The
electronic absorption spectra of all the complexes with or without CT DNA are shown in
Fig. 6.5.
Competitive binding studies
Fluorescence quenching of EB-DNA complex is used to monitor the binding of
metal complexes to DNA regardless of their binding modes and only measures their
ability to influence the EB luminescence intensities in the EB-DNA complex.49
It has
been previously reported that the fluorescence intensity of EB-DNA could be decreased
by addition of the complexes as quenchers, indicating the competition between the
complexes and EB in binding to DNA that proved the intercalation of metal complexes to
the base pairs of DNA.50,51
The fluorescence emission spectra of EB bound to DNA in the absence and
presence of the three complexes are shown in Fig. 6.6. From the figure, it is clear that an
appreciable reduction in the fluorescence intensity of about 40.98, 57.21 and 88.43%
together with bathochromic shift of 1, 1 and 14 nm, respectively, was observed on
addition of Ru(II) carbonyl hydrazone complexes 4, 5 and 6 to DNA pre-treated with EB,
indicating the replacement of EB molecules accompanied by intercalation of the
complexes with DNA.52,53
The fluorescence quenching spectra of DNA-bound EB by
complexes 4, 5 and 6 illustrated that the quenching of EB bound to DNA by the test
complexes are in good agreement with the linear Stern-Volmer equation. The ratio of the
slope to the intercept obtained by plotting I0/I vs [Q] (as insets in Fig. 6.6) yielded the
value of quenching constant (Kq) corresponding to the three complexes 4, 5 and 6 as
8.9016×10³
M-1
, 1.4302×10⁴
M-1
and 1.8834×10⁵
M-1
, respectively. From the plot of
intensity against complex concentrations furnished in Fig. 6.6, the values of the apparent
DNA binding constant (Kapp) were calculated using the equation, KEB [EB] = Kapp
[complex] and found to be 4.2061×10⁵
M-1
, 6.5184×10⁵
M-1
and 2.5984×10⁶
M-1
,
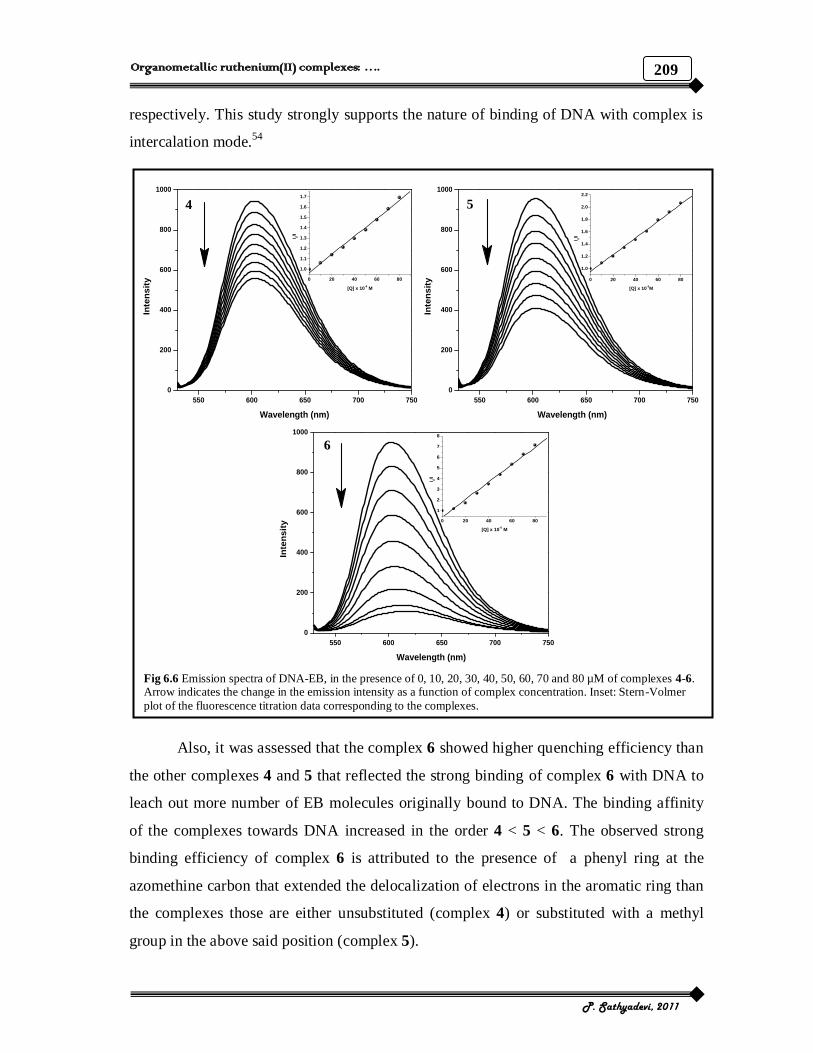
209
Organometallic ruthenium(II) complexes: ….
P. Sathyadevi, 2011
respectively. This study strongly supports the nature of binding of DNA with complex is
intercalation mode.54
Also, it was assessed that the complex 6 showed higher quenching efficiency than
the other complexes 4 and 5 that reflected the strong binding of complex 6 with DNA to
leach out more number of EB molecules originally bound to DNA. The binding affinity
of the complexes towards DNA increased in the order 4 < 5 < 6. The observed strong
binding efficiency of complex 6 is attributed to the presence of a phenyl ring at the
azomethine carbon that extended the delocalization of electrons in the aromatic ring than
the complexes those are either unsubstituted (complex 4) or substituted with a methyl
group in the above said position (complex 5).
5
550 600 650 700 750
0
200
400
600
800
1000
Inte
ns
ity
Wavelength (nm)
0 20 40 60 80
1.0
1.2
1.4
1.6
1.8
2.0
2.2
I 0/I
[Q] x 10-6M
4
550 600 650 700 750
0
200
400
600
800
1000
Inte
ns
ity
Wavelength (nm)
0 20 40 60 80
1.0
1.1
1.2
1.3
1.4
1.5
1.6
1.7
I 0/I
[Q] x 10-6 M
6
550 600 650 700 750
0
200
400
600
800
1000
Inte
ns
ity
Wavelength (nm)
0 20 40 60 80
1
2
3
4
5
6
7
8I 0
/I
[Q] x 10-6 M
Fig 6.6 Emission spectra of DNA-EB, in the presence of 0, 10, 20, 30, 40, 50, 60, 70 and 80 µM of complexes 4-6. Arrow indicates the change in the emission intensity as a function of complex concentration. Inset: Stern-Volmer
plot of the fluorescence titration data corresponding to the complexes.

210
Organometallic ruthenium(II) complexes: ….
P. Sathyadevi, 2011
Protein binding studies
Fluorescence quenching measurements
Serum albumins are proteins that are amongst others involved in the transport of
metal ions and metal complexes with drugs through the blood stream. Binding to these
proteins may lead to loss or enhancement of the biological properties of the original drug,
or provide paths for drug transportation. Hence, the binding experiments with BSA were
carried out using the newly synthesised ruthenium hydrazone complexes 4, 5 and 6.
Generally known fact is that the fluorescence of a protein is caused by three intrinsic
characteristics of the protein, namely tryptophan, tyrosine, and phenylalanine residues.
Fluorescence quenching refers to any process that decreases the fluorescence intensity of
a fluorophore due to a variety of molecular interactions including excited state reactions,
molecular rearrangements, energy transfer, ground state complex formation and collision
quenching. Qualitative analysis of ruthenium hydrazones bound to BSA has been
undertaken by examining the respective fluorescence spectra. The intensity of
fluorescence band of BSA observed at 345 nm was quenched to an extent of about 42.44,
43.90 and 51.58% from its initial intensity upon the addition of metal hydrazone chelates
4-6 together with a hypsochromic shift of 5 to 7 nm due to the formation of a ruthenium
hydrazones-BSA complex. Fig. 6.7 showed the effect of increase in the concentration of
test compounds on the emission intensity of BSA.
The fluorescence quenching is described by Stern-Volmer relation: I0/I = 1 + KSV
[Q]; where I0 and I are the fluorescence intensities of the fluorophore in the absence and
presence of quencher, respectively, KSV is the Stern-Volmer quenching constant and [Q]
is the quencher concentration. KSV value obtained from the plot of I0/I vs [Q] (as insets
in Fig. 6.7) was found to be 6.201×10⁵
M-1
,
7.339×10⁵
M-1
and 8.832×10⁵
M-1
corresponding to the respective ruthenium hydrazone complexes 4, 5 and 6. The observed
linearity in the plot supported the fact that the quenching of BSA by the test complexes
are in good agreement with the linear Stern-Volmer equation. The calculated KSV values
for the test compounds exhibits their strong protein-binding ability.

211
Organometallic ruthenium(II) complexes: ….
P. Sathyadevi, 2011
UV-visible absorption measurements
UV-visible absorption measurement is a simple method to explore the structural
changes and is useful to distinguish the type of quenching exist i.e., static or dynamic
quenching. Dynamic quenching only affects the excited states of the fluorophore and
there are no changes in the absorption spectra. However, ground-state complex formation
will frequently result in perturbation of the absorption spectrum of the fluorophore. From
the absorption spectra of pure BSA and BSA-complex 4-6 shown in Fig. 6.8, it can be
said that, upon addition of ruthenium complexes to a fixed concentration of BSA led to a
gradual increase in BSA absorption, while keeping the position of the peak unchanged.
Fig 6.7 Emission spectra of BSA (1×10⁻⁶ M; λexi = 280 nm; λemi = 345 nm) as a function of concentration of the
complexes 4-6 (0, 2, 4, 6, 8 and 10×10-7 M). Arrow indicates the effect of metal complexes on the fluorescence
emission of BSA.
300 350 400 450
0
200
400
600
800
Inte
ns
ity
Wavelength (nm)
0 2 4 6 8 10
1.0
1.2
1.4
1.6
I 0/I
[Q] x 10-7 M
4
300 350 400 450
0
200
400
600
800
Inte
ns
ity
Wavelength (nm)
0 2 4 6 8 10
1.0
1.2
1.4
1.6
1.8
I 0/I
[Q] x 10-7 M
5
300 350 400 450
0
200
400
600
800
Inte
ns
ity
Wavelength (nm)
0 2 4 6 8 10
1.0
1.2
1.4
1.6
1.8
2.0
Inte
nsit
y
[Q] x 10-7 M
6

212
Organometallic ruthenium(II) complexes: ….
P. Sathyadevi, 2011
The result implies that an interaction between test compounds and BSA occurs. In other
words, the fluorescence quenching between 4-6 and BSA is mainly ascribed to be static
quenching.55
The above results can be rationalized in terms of strong interaction between
ruthenium chelates and BSA may lead to a change in the conformation of BSA.
Binding analysis
For the static quenching interaction, if it is assumed that there are similar and
independent binding sites in the biomolecule, the binding constant (Kb) and the number
of binding sites (n) can be determined according to the method described by using the
following equation56
: log [(F0-F)/F] = log [K] + n log [Q], where in the present case, K is
the binding constant for the metal hydrazones-BSA complex and n is the number of
250 275 300 325 350
0.0
0.1
0.2
0.3
0.4
0.5
Ab
so
rban
ce
Wavelength (nm)
BSA
BSA + Complex 5
240 260 280 300 320 340
0.0
0.1
0.2
0.3
0.4
0.5
Ab
so
rban
ce
Wavelength (nm)
BSA
BSA + Complex 4
250 275 300 325 350
0.0
0.1
0.2
0.3
0.4
0.5
Ab
so
rban
ce
Wavelength (nm)
BSA
BSA + Complex 6
Fig. 6.8 Absorption spectra of BSA (1×10⁻⁵ M) and BSA-complexes 4-6 (BSA= 1×10⁻⁵ M and complexes 4-6 =
1×10⁻⁶ M).

213
Organometallic ruthenium(II) complexes: ….
P. Sathyadevi, 2011
binding sites per albumin molecule that can be determined from the slope and intercept of
the double logarithm regression curve of log [(F0-F)/F] versus log [Q] (Fig. 6.9). The
binding constants obtained from the plot corresponding to complexes 4, 5 and 6 were in
the magnitude of 1.0247×10⁴
M-1
, 1.0726×10⁵ M
-1 and 1.9533×10
5 M
-1, respectively. The
values of n found are 0.6906, 0.8480 and 0.9159 which indicates that there is a single
mode of binding in BSA for the ruthenium hydrazones.
The significantly high Kb value for the ruthenium hydrazone complex 6, in
comparison to that of its 4 and 5 analogue could be due to the presence of extended
delocalization of electrons by the aromatic ring ie., phenyl group substituted at the
azomethine carbon which facilitate its BSA binding propensity as observed in the DNA
binding experiments discussed in the previous section.
Synchronous fluorescence spectroscopic studies of BSA
Synchronous fluorescence spectroscopy is a very useful method to study the
microenvironment of amino acid residues by measuring the emission wavelength shift
and have several advantages such as sensitivity, spectral simplification, spectral
bandwidth reduction and avoiding different perturbing effects. Vekshin57
suggested a
useful method to study the environment of amino acid residues by measuring the possible
shift in the wavelength of emission maximum, the shift in position of emission maximum
-6.0 -6.2 -6.4 -6.6 -6.8
-0.8
-0.6
-0.4
-0.2
0.0
log
[F
0-F
/F]
log [Q]
Complex 4
Complex 5
Complex 6
Fig. 6.9 Plot of log [(F0-F)/F] vs log [Q].

214
Organometallic ruthenium(II) complexes: ….
P. Sathyadevi, 2011
280 300 320 340 360
0
50
100
150
200
250
300
Inte
ns
ity
Wavelength (nm)
6A
280 300 320 340 360
0
50
100
150
200
250
300
Inte
ns
ity
Wavelength (nm)
5A
300 320 340 360 380
0
50
100
150
200
250
300
350
Inte
ns
ity
Wavelength (nm)
5B
280 300 320 340 360
0
50
100
150
200
250
300
350
Inte
ns
ity
Wavelength (nm)
4A
300 320 340 360 380
0
50
100
150
200
250
300
Inte
nsity
Wavelength (nm)
4B
300 320 340 360 380
0
50
100
150
200
250
300
350
Inte
ns
ity
Wavelength (nm)
6B
Fig 6.10 Synchronous spectra of BSA (1×10⁻⁶ M) as a function of concentration of the complexes 4-6 (0, 2, 4, 6, 8 and 10×10-7 M) with wavelength difference of Δλ = 15 nm (A) and Δλ = 60 nm (B). Arrow indicates the change in
emission intensity w.r.t various concentration of complexes 4-6.

215
Organometallic ruthenium(II) complexes: ….
P. Sathyadevi, 2011
corresponding to the changes of the polarity around the chromophore molecule. As is
known, synchronous fluorescence spectra show tyrosine residues of BSA only at the
wavelength interval Δλ of 15 nm whereas tryptophan residues of BSA at Δλ of 60 nm.
The synchronous fluorescence spectra of both tyrosine and tryptophan residues present in
BSA were shown in Fig. 6.11 with respect to various concentrations of ruthenium
hydrazone complexes added.
After the addition of complex 4 to BSA, a slight increase in the intensity of
tyrosine residue along with a bathochromic shift of 1 nm was observed in the
fluorescence spectra. Similar changes were also observed in the case of complex 5.
However, addition of complex 6 to the BSA solution caused a very slight decrease in the
intensity of tyrosine residue but without any change in the wavelength of emission.
Regarding the effect of adding ruthenium hydrazone complexes to the BSA solution, a
significant decrease in the intensity of tryptophan fluorescence emission was observed by
the addition of all the three complexes without any change in the position of emission
wavelength. These observations do indicate that the complexes 4, 5 and 6 did not affect
the microenvironment of tyrosine residues during the binding process significantly but
the tryptophan microenvironment to a larger extent. The interaction of ruthenium
hydrazone chelates with tryptophan residue led to a decrease in the polarity of the
fluorophore by an increasing the hydrophobicity around it.
Antioxidant studies
It is well documented in the literature that transition metal hydrazone complexes
displayed significant antioxidant activity.58
Therefore, we undertook a systematic
investigation on the antioxidant potential of the newly synthesised ruthenium(II)
hydrazone organometallics 4, 5 and 6 against O2-, OH and ABTS cationic radicals as a
function of concentration of the test compounds ranging from 0 to 50 µM and the results
were shown in Fig. 6.11. IC50 values of the complexes 4-6 against superoxide radicals
were found to be 30.09, 26.57 and 23.34 μM, respectively. In the case of OH and ABTS
radical scavenging activities, the IC50 values of the above set of three complexes were in
the magnitude of 40.13, 34.88, 29.98, 28.72, 26.21 and 22.64 μM, respectively.

216
Organometallic ruthenium(II) complexes: ….
P. Sathyadevi, 2011
Results of the antioxidant activity data of bivalent ruthenium complexes against
the free radicals i.e., ABTS cationic, O2- and OH revealed that the activity decreased in
the order of 6 > 5 > 4. The superior free radical scavenging potential of complex 6 could
be related to the presence of 6 -electron delocalized phenyl ring at the azomethine
carbon than the complexes 4 and 5 that are having H or CH3 at the same position. A
similar effect due to the presence of phenyl substitution at the azomethine carbon was
also observed in DNA/BSA experiments. Out of the three radical species chosen to
examine the potential towards ABTS cationic radicals than others. The radical
scavenging ability of the new complexes were compared with that of the standard
antioxidant butylated hydroxyl anisole (BHA) in which case the titled complexes shown
better performance than the standard indicating that they have more scope to apply for in
vitro trials.
In vitro cytotoxicity
It is commonly believed that DNA is the main target of many antitumour agents59
and most of the drugs act through binding to DNA. From the DNA binding experiments
discussed elsewhere in the manuscript it can be understood that all the three ruthenium
complexes did interact with DNA. In order to determine their anticancer properties, in
vitro cytotoxicity tests were conducted utilising all the three ruthenium hydrazone
complexes against a pair of selected human tumour cell lines HeLa and A341 and NIH
3T3 normal cell lines by means of a colorimetric assay (MTT assay) that measures
mitochondrial dehydrogenase activity as an indication of cell viability after an exposure
10 20 30 40 50
20
30
40
50
60
70Hydroxyl radical
Scaven
gin
g a
cti
vit
y (
%)
Concentration ( M)
Complex 4
Complex 5
Complex 6
10 20 30 40 50
30
40
50
60
70
80
90ABTS Cationic radical
Scaven
gin
g a
cti
vit
y (
%)
Concentration ( M)
Complex 4
Complex 5
Complex 6
10 20 30 40 50
20
40
60
80Superoxide radical
Scaven
gin
g a
cti
vit
y (
%)
Concentration ( M)
Complex 4
Complex 5
Complex 6
Fig. 6.11 Trends in the inhibition of ABTS cationic, hydroxyl and superoxide radicals by the ruthenium(II)
hydrazone complexes 4, 5 and 6 at various concentrations.

217
Organometallic ruthenium(II) complexes: ….
P. Sathyadevi, 2011
period of 48 h in the respective concentration range of 15-500 µM for all the three
complexes to HeLa and NIH 3T3 normal cell lines whereas 7.5-250 µM of complexes 4
and 5 and 3.12-100 µM concentration of complex 6 to the A431 cell lines. Upon
increasing the concentration of complexes, the results of MTT assay revealed that the
complexes 4, 5 and 6 exhibited excellent cytotoxic potencies with IC50 values generally
in the low micromolar concentrations. The activities corresponding to inhibition of cancer
cell growth at maximum level were tested and figures are not presented here. In parallel,
the influence of widely used anticancer drug, cisplatin has been also assayed as
standard.60
The IC50 values of all the three complexes ranged from 18-122 μM, indicating
that all of these complexes exhibited antitumour activity against both the tumour cell
lines in different degrees (Fig. 6.12). A simple structure activity relationship (SAR)
analysis suggest that among the three types of the complexes under investigation, the
complex 6 posses phenyl substitution at azomethine carbon showed potential activity
than rest of the complexes 4 and 5 with H or CH3 groups at the same position of the
ligands respectively. Hence, we realized that the substitution at the azomethine carbon
played a vital role on the pharmacophore of the metal chelates and hence, the cytotoxic
activities of the present ruthenium complexes are mainly governed by those ligands that
are highly cytotoxic themselves, while complexation to metal ions rather serves to
modulate their mode of action and activity. These investigations clearly said that the
449
122
54
382
109
48
347
94
18
0
50
100
150
200
250
300
350
400
450
IC50 V
alu
es (
M)
Complex 4 Complex 5 Complex 6
NIH 3T3
HeLa
A431
Fig. 6.12 Comparison of IC50 values between complexes 4, 5 and 6 on the inhibition of NIH 3T3, HeLa and A431 cell lines.

218
Organometallic ruthenium(II) complexes: ….
P. Sathyadevi, 2011
complexes in particular are effective against A341 cells than HeLa cell lines under
identical experimental conditions without causing significant damage to the normal NIH
3T3 cells. As evident from the IC50 values, it was also observed that the activity of
cisplatin overcomes the tested complexes 4 and 5 to some extent but the complex 6
showed a comparable activity to cisplatin under in vitro conditions.
Conclusion
Three new bivalent ruthenium carbonyl complexes with hydrazone ligands HL1,
HL2 and HL
3 have been synthesized and well characterized in detailed by elemental
analysis and spectral techniques (UV-visible, IR and 1H NMR). The molecular structure
of one of the complexes 6 investigated through X-ray crystallography demonstrated an
octahedral geometry around the metal ion. All the newly synthesised complexes have
been subjected to examine their biological property like DNA binding, protein binding,
antioxidant and cytotoxicity under in vitro experimental conditions. The DNA binding
ability of the above complexes assessed by absorption and emission spectra suggested an
intercalative mode of binding with different binding affinities. Results of BSA binding
experiments revealed that the quenching mechanism found between the protein and tested
ruthenium hydrazone complexes is a static type. The synchronous fluorescence spectral
measurements confirmed the occurrence of conformational changes at tryptophan micro
environment of BSA. The antioxidant activity showed that all the metal complexes can
serve as potential antioxidants. The results of cytotoxicity experiments revealed that the
complexes synthesised in this work possess moderate activity against both the of HeLa
and A341 cell lines with a preference to inhibit the proliferation of later thereby proved
that the selected compounds could serve as promising candidates in antitumour
applications. At this juncture, it is notable to mention that the major chemical and
biological findings of this study throw some light on the potential of these complexes in a
reasonable range of concentrations under in vitro conditions. In our opinion, the
significant outcome of the present investigation regarding the abilities of ruthenium
organometallic hydrazone complexes towards various biological evaluations is that the
substitution of the phenyl ring at the azomethine carbon of the ligand led to an increased

219
Organometallic ruthenium(II) complexes: ….
P. Sathyadevi, 2011
interaction with biomolecules such as DNA/BSA, free radicals and tumour cell lines than
the rest of the complexes without such a phenyl ring in that position.

220
Organometallic ruthenium(II) complexes: ….
P. Sathyadevi, 2011
Reference
1. K. Kalyansundaram and M. Gratzel, Coord. Chem. Rev., 1998, 177, 347-414.
2. E.Y. Li, Y.-M. Cheng, C.-C. Hsu, P.-T. Chou, G.-S. Lee, I.-H. Lin, Y. Chi and C.-S. Liu, Inorg. Chem., 2006, 45, 8041-8051.
3. M. Katual and G. Dutt, Talanta, 1972, 22, 151-166.
4. B. Singh, R. Shrivastava and K.K. Narang, Synth. React. Inorg. Met. Org. Chem., 2000, 30, 1175-1192.
5. C.M. Amstrong, P.V. Bernhardt, P. Chin and D.R. Richardson, Eur. J. Inorg.
Chem., 2003, 1145-1156.
6. A. Basoglu, S. Parlayan, M. Ocak, H. Alp, H. Kantekin, M. Ozdemir and U. Ocak, Polyhedron, 2009, 28, 1115-1120.
7. A.A.R. Despaigne, J.G. Da Silva, A.C.M. Do Carmo, O.E. Piro, E.E. Castellano and H. Beraldo, J. Mol. Struct., 2009, 920, 97-102.
8. S. Pal, J. Pushparaju, N.J. Sangeetha and S. Pal, Trans. Met. Chem., 2000, 25, 529-
533.
9. A. Wood, W. Aris and D.J.R. Brook, Inorg. Chem., 2004, 43, 8355-8360.
10. V. Sadus and M. Angelica, Trans. Met. Chem., 1995, 20, 256-261.
11. M. Mohan, M.P. Gupta and L. Chandra, Inorg. Chim. Acta, 1988, 151, 61-68.
12. E. Mihkelson, J. Inorg. Nucl. Chem., 1981, 43, 127-136.
13. C. Mirco, P. Paolo, P. Corrado and R. Dominga, J. Mol. Catal. A Chem., 2002, 178, 21-26.
14. W. Kaim, B. Schewederski, O. Heilmann and F.M. Hornung, Coord. Chem. Rev., 1999, 182, 323-342.
15. W. Kaim and B. Schwederski, Bioinorganic Chemistry, Wiley, Chichester, 1994.
16. B. Lippert, BioMetals, 1992, 5, 195-208.
17. D.M. Whitfield, S. Stoijkowski and B. Sarkar, Coord. Chem. Rev., 1993, 122, 171-
225.
18. Y. Kim, Y. Kang and D. Baek, Bull. Korean Chem. Soc., 2001, 22, 141-144.
19. H. Beraldo, W.F. Nacif and D.X. West, Spectrochim. Acta A, 2001, 57, 1847-1854.
20. J.R. Dimmock, R.N. Puthucode, J.M. Smith, M. Hetherington, J.W. Quail and U. Pugazhenthi, J. Med. Chem., 1996, 39, 3984-3997.
21. J.R. Dimmock, S.N. Pandeya, J.W. Quail, U. Pugazhenthi, T.M. Allen and G.I. Kao, Eur. J. Med. Chem., 1995, 30, 287-301.
22. J.R. Dimmock, S.N. Pandeya, J.W. Quail, U. Pugazhenthi, T.M. Allen and G.I.
Kao, Eur. J. Med. Chem., 1995, 30, 303-314.

221
Organometallic ruthenium(II) complexes: ….
P. Sathyadevi, 2011
23. K.E. Erkkila, D.T. Odom and J.K. Barton, Chem. Rev., 1999, 99, 2777-2795.
24. J.K. Barton and A.L. Raphael, J. Am. Chem. Soc., 1984, 106, 2466-2468.
25. A. Chouai, S.E. Wicke, C. Turro, J. Bacsa, K.R. Dunbar, D. Wang and R.P. Thummel, Inorg. Chem., 2005, 44, 5996-6003.
26. J. Hooda, D. Bednarski, L. Irish and S.M. Firestine, Bioorg. Med. Chem., 2006, 14,
1902-1909.
27. F. Liang, P. Wang, X. Zhou, T. Li, Z.Y. Li, H.K. Lin, D.Z. Gao, C.Y. Zheng and C.T. Wu, Bioorg. Med. Chem. Lett., 2004, 14, 1901-1904.
28. J.M. Kelly, A.B. Tossi, D.J. McConnel and C. O. Huigin, Nucleic Acids Res., 1985, 13, 6017-6034.
29. V. Uma, V.G. Vaidyanathan and B.U. Nair, Bull. Chem. Soc. Jpn., 2005, 78, 845-
850.
30. W. Szczepanik, J. Ciesiolka, J. Wrzesinski, J. Skala and M. Jezowska-Bojczuk, Dalton Trans., 2003, 1488-1494.
31. Y.P. Wang, Y.L. Wei and C. Dong, J. Photochem. Photobiol. A Chem., 2006, 177, 6-11.
32. J.N. Tian, J.Q. Liu, Z.D. Hu and X.G. Chen, Bioorg. Med. Chem., 2005, 13, 4124-
4129.
33. L.B. Qu, X.L. Chen, R. Yang, L. Wang and H.J. Zeng, Chin. J. Chem., 2007, 25, 1151-1155.
34. Y.J. Hu, H.G. Yu, J.X. Dong, X. Yang and Y. Liu, Spectrochim. Acta A, 2006, 65, 988-992.
35. X.M. He and D.C. Carter, Nature, 1992, 358, 209-215.
36. G.M. Sheldrick, Acta Cryst., 2008, A64, 112-122.
37. L.J. Barbour, J. Supramol. Chem., 2001, 1, 189-191.
38. APEX2 “Program for Data Collection on Area Detectors” BRUKER AXS Inc.,
5465, East Cheryl Parkway, Madison, WI 53711-5373, USA.
39. G.M. Sheldrick, SADABS, Program for Absorption Correction of Area Detector
Frames, BRUKER AXS Inc., 5465, East Cheryl Parkway, Madison, WI 53711-5373, USA.
40. R.A.S. Pelgado, W.Y. Lee, S.R. Choi and Y.Cho, M.J.Jun, Trans. Met. Chem.,
1991, 16, 241-244.
41. P. Krishnamoorthy, P. Sathyadevi, K. Senthil Kumar, P. Thomas Muthiah, R. Ramesh and N. Dharmaraj, Inorg. Chem. Comm., 2011, 14, 1318-1322.
42. C. Beauchamp and I. Fridovich, Anal. Biochem., 1971, 44, 276-287.
43. T. Nash, Biochem. J, 1953, 55, 416-421.

222
Organometallic ruthenium(II) complexes: ….
P. Sathyadevi, 2011
44. R. Re, N. Pellegrini, A. Proteggente, A. Pannala, M. Yang and C. Rice-Evans, Free Radic. Bio. Med., 1999, 26, 1231-1237.
45. M. Blagosklonny and W.S. EI-diery, Int. J. Cancer, 1996, 67, 386-392.
46. J.D.E.T. Wilton-Ely, Ming Wang, Sanaz J. Honarkhah, Derek A and Tocher, Inorg.
Chim. Acta, 2005, 358, 3218-3226.
47. J.G. Małecki and R. Kruszynski, Polyhedron, 2010, 29, 1023-1028.
48. P. Sathyadevi, P. Krishnamoorthy, R.R. Butorac, A.H. Cowley, N.S.P. Bhuvanesh and N. Dharmaraj, Dalton Trans., 2011, DOI: 10.1039/C1DT10767D.
49. W.J. Mei, J. Liu, H. Chao and L.N. Ji, Trans. Met. Chem., 2003, 28, 852-857.
50. G.Y. Bai, K.Z. Wang, Z.M. Duan and L.H. Gao, J. Inorg. Biochem., 2004, 98, 1017-1022.
51. S.A. Tysoe, R. Kopelman and D. Schelzig, Inorg. Chem., 1999, 38, 5196-5197.
52. H. Mansuri-Torshizi, R. Mital, T.S. Srivastava, H. Parekh and M.P. Chitnis, J.
Inorg. Biochem., 1991, 44, 239-247.
53. E.J. Gao, X.M. Zhao, Q.T. Liu and R. Xiu, Acta Chim. Sin., 2004, 62, 593-597.
54. V. Rajendiran, M. Murali,E. Suresh, S. Sinha, K. Somasundaramc and M. Palaniandavar, Dalton Trans., 2008, 148-163.
55. D. Senthil Raja, G. Paramaguru, N.S.P. Bhuvanesh, J.H. Reibenspies, R. Renganathan and K. Natarajan, Dalton Trans., 2011, 4548-4559.
56. X.Z. Feng, Z. Yang, L.J. Wang and C. Bai, Talanta, 1998, 47, 1223-1229.
57. N.L. Vekshin, Biophysics, 1996, 1176-1182.
58. Y. Li, Z.Y. Yang and M.F. Wang, Eur. J. Med. Chem., 2009, 44, 4585-4595.
59. F. Gao, H. Chao, F. Zhou, Y.X. Yuan, B. Peng and L.N. Ji, J. Inorg. Biochem.,
2006, 100, 1487-1494.
60. P. Krishnamoorthy, P. Sathyadevi, A.H. Cowley, R.R. Butorac and N. Dharmaraj, Eur. J. Med. Chem., 2011, 46, 3376-3387.