Organizing Data Once it is collected, data can be organized in a table. The number of days each...
8
Organizing Data Once it is collected, data can be organized in a table. The number of days each student in a class of 25 was recorded as follows: 0, 3, 1, 0, 4, 2, 1, 3, 5, 0, 2, 0, 0, 0, 4, 0, 1, 1, 2, 1, 0, 7, 3, 1, 0 This data would be easier to analyze if it was in a table. A bsences Tally Frequency 7 6 5 4 3 2 1 0 1 0 1 2 3 3 6 9 Total Frequency 25 Sometimes data is grouped into specific intervals. Test scores for a class of 32 were recorded as follows: 90, 85, 74, 86, 65, 62, 100, 95, 77, 82, 50, 83, 77, 93, 73, 72, 98, 66, 45, 100, 50, 89, 78, 70, 75, 95, 80, 78, 83, 81, 72, 75 Interval Tally Frequency 91 - 100 81 - 90 71 - 80 61 - 70 51 - 60 45 - 50 6 8 11 4 0 3 Total Frequency 32
-
Upload
rosamund-skinner -
Category
Documents
-
view
215 -
download
2
Transcript of Organizing Data Once it is collected, data can be organized in a table. The number of days each...

Organizing DataOnce it is collected, data can be organized in a table.
The number of days each student in a class of 25 was recorded as follows:0, 3, 1, 0, 4, 2, 1, 3, 5, 0, 2,
0, 0, 0, 4, 0, 1, 1, 2, 1, 0, 7, 3, 1, 0This data would be easier to analyze if it was in a table.
Absences Tally Frequency
7
6
5
4
3
2
1
0
1
0
1
2
3
3
6
9
Total Frequency 25
Sometimes data is grouped into specific intervals.
Test scores for a class of 32 were recorded as follows:90, 85, 74, 86, 65, 62, 100,
95, 77, 82, 50, 83, 77, 93, 73, 72, 98, 66, 45, 100, 50, 89, 78, 70, 75, 95, 80, 78, 83, 81, 72, 75
I nterval Tally Frequency
91 - 100
81 - 90
71 - 80
61 - 70
51 - 60
45 - 50
6
8
11
4
0
3
Total Frequency 32

Stem and Leaf PlotsLet’s put the test score example into a Stem and Leaf Plot.
Student test scores:
Stem Leaf
90, 85, 74, 86, 65, 62, 100, 95, 77, 82, 50, 83, 77, 93, 73, 72, 98, 66, 45, 100, 50, 89, 78, 70, 75, 95, 80, 78, 83, 81, 72, 75
10
9
8
7
6
5
4
0, 0
Enter the data into the table.
0, 5, 3, 8, 5
5,6,2,3,9,0,3,14, 7, 7, 3, 2, 8, 0, 5, 8, 2, 55, 2, 6
0, 05
Arrange the leafs in numerical order.Stem Leaf
10
9
8
7
6
5
4
0, 0
0, 3, 5, 5, 8
0, 1, 2, 3, 3, 5, 6, 90, 2, 2, 3, 4, 5, 5, 7, 7, 8, 82, 5, 6
0, 0
5
Make a key.
Key8| 3 83

More Stem and Leaf PlotsOrganize the following data, which represents the number of hours in a month spent watching television for 15 people, into a Stem and Leaf Plot.135, 107, 144, 90, 158,133, 101, 147, 151, 142, 109, 145, 113, 155, 110Stem Leaf
9
10
11
12
13
14
15
1, 7, 9
0, 3
3, 5
2, 4, 5, 71, 5, 8
0
Key
13| 3 133
What is the greatest number of hours spent watching television in a month?158
hours
What is the least number of hours spent watching television in a month?
90 hours
How many people spend at least 130 hours watching television in a month?
9 people
What percentage of people spend 100 hours and 120 hours watching television in a month?
533.3%
15
What is the range of hours spent watching television in a month?
From 90 to 158 hours

HistogramsA Histogram is a vertical bar graph in which each interval is represented by the width of the bar and the frequency is represented by the height of the bar.
Let’s look at the test score example again.I nterval Frequency
91 - 100 6
81 - 90 8
71 - 80 11
61 - 70 4
51 - 60 0
45 - 50 3
Test Scores of 32 Students
Test Scores ( Intervals)
Frequency
41-50 51-60 61-70 71-80 81-90 91-100
12
11
10
9
8
7
6
5
4
3
2
1
0

Another Histogram
The following table represents the number of miles per gallon obtained by 40 drivers.
I nterval Frequency
16 - 19 5
20 - 23 11
24 - 27 8
28 -31 5
32 - 35 7
36 - 39 3
40 - 43 1
Miles per Gallon for 40 Drivers
Mileage (Miles per Gallon)
Frequency
16-19 20-23 24-27 28-31 32-35 36-39 40-43
12
11
10
9
8
7
6
5
4
3
2
1
0

Cumulative Histogram
The following table represents test scores of 240 students in a school.
I nterval Frequency
51 - 60 45
61 - 70 60
71 - 80 75
81 - 90 40
91 - 100 20
Test Scores
Frequency
51-60 61-70 71-80 81-90 91-100
75
70
65
60
55
50
45
40
35
30
25
20
15
10
5
0
Now let’s make a Cumulative Frequency Table.
Cumulative
I nterval Frequency Frequency
51 - 60 45 45
61 - 70 60 105
71 - 80 75 180
81 - 90 40 220
91 - 100 20 240
Cumulative Histogram
Test Scores51-60 61-70 71-80 81-90 91-100
Frequency
240
220
200
180
160
140
120
100
80
60
40
20
0
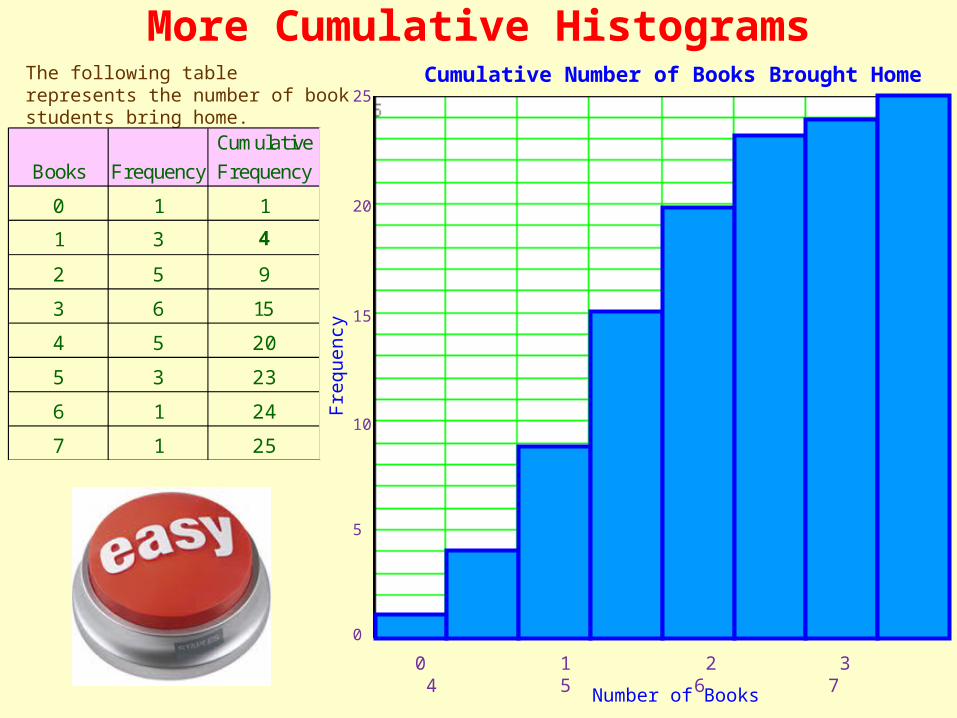
More Cumulative HistogramsThe following table represents the number of book students bring home.
Cumulative
Books Frequency Frequency
0 1 1
1 3 4
2 5 9
3 6 15
4 5 20
5 3 23
6 1 24
7 1 25
Cumulative Number of Books Brought Home
Number of Books
0 1 2 3 4 5 6 7
Frequency
25
20
15
10
5
0

More Cumulative HistogramsThe following table represents the number of book students bring home.
Cumulative
Books Frequency Frequency
0 2 2
1 5 7
2 7 14
3 5 19
4 6 25
5 2 27
6 1 28
7 2 30
Cumulative Number of Books Brought Home
Number of Books
0 1 2 3 4 5 6 7
Frequency
30
25
20
15
10
5
0