Organizational Risk Perception of Disasters: Do Risk ... · PDF file2 Organizational Risk...
27
1 Organizational Risk Perception of Disasters: Do Risk Managers Matter? Abdul-Akeem Sadiq, PhD (Corresponding Author) School of Public and Environmental Affairs Indiana University-Purdue University Indianapolis 801 West Michigan Street, Indianapolis, IN 46202 (317) 278-1013 [email protected] John D. Graham, PhD School of Public and Environmental Affairs Indiana University The authors are grateful to the National Science Foundation and the Mid-America Earthquake Center for providing the funding for this project. The authors are also grateful to our research collaborators on this project and Maria Rooijakkers for her research efforts. The findings and conclusions of this paper are those of the authors and do not imply endorsement by any component of Harvard University or other sponsors of this workshop. Comments should be directed to the authors.
Transcript of Organizational Risk Perception of Disasters: Do Risk ... · PDF file2 Organizational Risk...

1
Organizational Risk Perception of Disasters: Do Risk Managers Matter?
Abdul-Akeem Sadiq, PhD (Corresponding Author)
School of Public and Environmental Affairs
Indiana University-Purdue University Indianapolis
801 West Michigan Street, Indianapolis, IN 46202
(317) 278-1013
John D. Graham, PhD
School of Public and Environmental Affairs
Indiana University
The authors are grateful to the National Science Foundation and the Mid-America Earthquake
Center for providing the funding for this project. The authors are also grateful to our research
collaborators on this project and Maria Rooijakkers for her research efforts. The findings and
conclusions of this paper are those of the authors and do not imply endorsement by any
component of Harvard University or other sponsors of this workshop. Comments should be
directed to the authors.

2
Organizational Risk Perception of Disasters: Do Risk Managers Matter?
Abdul-Akeem Sadiq and John D. Graham
ABSTRACT
Previous research on risk perception suggests that individual neglect of disasters is likely due to
an inability to process information about low-probability, high-consequence threats and moral
hazard.(3)
As a result, it is important to study the quality of organizational responses to disasters,
since they may be crucial to compensating for the frailty of individual choice. Preliminary
evidence suggests that an organizational risk manager is important in disaster planning,(4)
but
there is no empirical evidence (to our knowledge) that having a designated risk manager leads to
the adoption of risk-reducing measures in organizations. Additionally, there is limited research
on the relationship between risk perception and the adoption of risk-reducing measures at the
organizational level. The goal of this study is to empirically answer two questions. (1) “Does
having a risk manager in an organization predict the adoption of risk-reducing measures?” (2)
“What is the relationship between risk perception and the adoption of risk-reducing measures at
the organizational level?” Using data collected from a sample of public, private, and non-profit
organizations in the Memphis/Shelby County area, Tennessee in 2006, we find that organizations
with risk managers adopted more risk-reducing measures than organizations without risk
managers and that risk perception is a significant predictor of risk-reducing measures. This study
builds on a small, but growing literature on how organizations perceive risks and respond to
them.(8-13)
KEY WORDS: Organizational risk perception; risk manager; mitigation and preparedness
measures; hazards; disasters

3
1. INTRODUCTION
The colossal nature of disaster-induced losses is, indeed, worrisome as the annual losses,
measured globally, and the number of victims of disasters continue to increase each year.(1, 2)
For
instance, in 2011, disasters worldwide killed 30,773 people and caused an unprecedented $366.1
billion in economic losses.(2)
With regard to the number of disaster victims, in 2011, the number
of disaster victims (244.7 million) surpassed the 2001 to 2010 average of 232 million.(2)
In light
of the magnitude and persistent increases in disaster losses, there is a pressing need to study
ways of stemming disaster losses. Although it is difficult or impossible to change the magnitude
and frequency of disasters, mitigation and preparedness activities can help ameliorate disaster
impacts.
Natural and man-made disasters (e.g., earthquakes and chemical spills) can lead to
concentrated harm in a localized area where organizations are potentially impacted. Previous
research suggests that neglect of disasters by individuals is likely due to an inability to process
information about low-probability, high-consequence threats and moral hazards.(3)
Since
previous research suggests that individuals may not respond optimally to the risks of natural and
man-made disasters, it is especially important to study the quality of organizational responses,
since they may be crucial to compensating for the frailty of individual choice.
Preliminary evidence suggests that an organizational risk manager is important in disaster
planning,(4)
but there is no empirical evidence (to our knowledge) that having a designated risk
manager leads to the adoption of risk-reducing measures in organizations. Additionally,
researchers have extensively studied risk perception at the individual level.(5-7)
However, there is
limited research on the relationship between risk perception and the adoption of risk-reducing
measures at the organizational level. Against the backdrop of a lack of empirical evidence in
4
these two lines of research, the goal of this study is to empirically answer two research questions.
(1) “Does having a risk manager in an organization predict the adoption of risk-reducing
measures?” (2) “What is the relationship between risk perception and the adoption of risk-
reducing measures at the organizational level?”
To answer this question, we use data collected from a sample of public, private, and non-
profit organizations in the Memphis/Shelby County area, Tennessee in 2006. The results suggest
that risk managers do matter when it comes to reducing the risks faced by organizations. More
importantly, the results show that organizations with risk managers adopted more of both active
and passive risk-reducing measures than organizations without risk managers. As expected, the
results also indicate that risk perception is a significant predictor of risk-reducing measures. Our
study adds to a small but growing literature on how organizations perceive risks and respond to
them.(8-13)
The following section discusses relevant literature on risk perception at the individual and
organizational levels. We then present our methodology and data collection procedures. Next, we
present the results, discuss the implications of the results, and offer some policy
recommendations. Finally, we conclude by highlighting the limitations of our study and outlining
an agenda for future research in risk reduction at the organizational level.
2. LITERATURE REVIEW
2.1. Disasters and Organizations
One of the fundamental goals of organizations is survival.(14)
Survival is so important that
organizational theorists have devoted much time to studying how organizations manage to
survive.(15)
Disasters constantly threaten this goal by causing organizational disruption,(16)
loss of

5
sales and property taxes,(17)
and loss of services from public organizations and nonprofits,
consequently, undermining the economy and support systems of communities.(16)
For example,
the impact of Hurricane Katrina on colleges and universities in the Gulf Coast area was severe –
it resulted in temporary closures at Tulane University, Dillard University, and Loyola University
New Orleans.(18)
In fact, between 2005 and 2006, Tulane University, Xavier University, and
Loyola University New Orleans lost more than 10 percent, 12 percent, and 26 percent in
revenues, respectively, as a result of Hurricane Katrina.(18)
In addition, a survey conducted after
Hurricane Katrina by the Mississippi Center for Nonprofits indicated that 67 percent of nonprofit
organizations in the Biloxi-Pascagoula metro area suffered losses of paid staff members or
volunteer staff, 77 percent reported total building loss or major building damage, and 93 percent
reported losses of programs or services.(19)
The impacts of Hurricane Katrina on organizations
are at the extreme end of a long continuum of losses attributable to various disasters.
The challenge for organizations is to find ways of ensuring continuity during and after
disasters. Organizations stand a better chance of surviving disasters and continuing their day-to-
operations if they have preparedness and mitigation strategies in place before disasters strike.(20)
The unit of analysis in this study is the organization because organizations are an important
decision-making unit in the community and they may be able to compensate for some of the
well-known deficiencies in individual perception and management of risks. Furthermore, if
organizational risk perception and management is plagued by similar deficiencies, then one
cannot expect organizations to overcome frailties in personal or household decision making
about risk.

6
2.2. Disaster Research at the Organizational Level
Although there is a large body of research on disasters conducted at the individual,
household, and community levels, little research has been conducted at the organizational
level.(21, 22)
Fortunately, a small body of pre-disaster research at the organizational level is
beginning to emerge due to the foundational work of Quarantelli, Lawrence, Tierney, and
Johnson.(23)
These researchers examined how chemical companies and government agencies in
18 U.S. communities plan for chemical emergencies.(23)
After this foundational study, other
researchers have conducted organizational level studies. In fact, a few years after this
foundational study, Drabek(24-27)
investigated how businesses in the tourism industry carry out
evacuation planning and Mileti et al.(28)
studied how 54 businesses in eight San Francisco
counties adopt earthquake preparedness measures. Furthermore, Barlow(29)
investigated the
impact of Iben Browning earthquake prediction on 20 businesses in the St. Louis area and
Dahlhamer and D’ Souza(30)
investigated the determinants of business disaster preparedness in
Memphis/Shelby County, Tennessee and Des Moines/Polk County, Iowa. Finally, Webb et al.(22)
examined the preparedness and disaster experiences of businesses in different parts of the
country, including Memphis, Tennessee. More recently, other organizational level studies have
emerged.(4, 11, 13, 31-34)
Despite the emergency of this latest crop of research on mitigation and
preparedness at the organizational level, more organizational studies are needed.
2.3. Determinants of Mitigation and Preparedness (Risk-Reducing) Measures
2.3.1. Risk Manager
An organizational risk manager is defined in this study as a designated employee (full-
time or part-time) charged with designing, adopting and/or implementing a wide range of risk

7
management programs. The risk manager assesses organizational vulnerability to disasters and
communicates potential risks and planned responses to organizational members through videos,
pamphlets and e-mails.(35)
Prior studies have established the important roles risk managers play
in managing the risks faced by organizations.(4)
Others have examined the roles of risk managers
in corporations.(35)
While organizations may hire risk managers with the expectation that they will adopt
risk-reducing measures and, consequently, reduce their organizations’ risks from both man-made
hazards (e.g., terrorist attacks and chemical spills) and natural hazards (e.g., earthquakes and
tornadoes), the expectation may not become reality. Risk managers may be too dislocated from
the core functions of the organization to exert a significant influence. Moreover, if employees
and core-business managers have low risk perceptions, it may be difficult for the risk manager to
raise perceptions enough in the organization to support implementation of measures to reduce
risk. And risk managers, even if present, may lack the necessary resources (including leadership
support) to effectuate change. To the best of our knowledge, there is no empirical evidence that
having a risk manager leads to the adoption of risk-reducing measures.
2.3.2. Risk Perception at the Organizational Level
Some researchers have examined risk perception at the household(36)
and organizational
levels.(33)
However, most previous research on risk perception has focused on individual risk
perception and how risk perception relates to individual choice and then contributes to societal
conceptions of acceptable risk.(5, 6)
With regard to the type of risks, previous researchers have
studied risk perception of technological risks,(37)
environmental or natural hazards,(38-41)
and a
combination of the two.(42)

8
2.3.3. Organizational Size
Researchers have found that larger organizations are more likely to mitigate and prepare
for disasters than smaller organizations.(23-27, 32)
In fact, research has shown that, among a variety
of independent variables that have been tested, firm size is the most consistent(30)
and
important(22)
predictor of organizational mitigation and preparedness. The most straightforward
interpretation as to why larger firms devote more to disaster mitigation and preparedness than do
smaller firms is that larger firms have more resources available to them.(28, 30, 43)
Resource
availability has been found to be a significant predictor at the organizational level, as well as the
household(44)
and community(45, 46)
levels. But firm size may also act merely as a surrogate for a
variety of other variables that are difficult to measure (e.g., planning horizon of executives,
presence of professionalized boards of directors with a stake in the organization’s future, and so
forth).
2.3.4. Ownership Pattern
In addition to size, there are differences in ownership patterns—whether the organization
is a single firm or a franchise—with respect to the adoption of mitigation and preparedness
measures. Empirical evidence suggests that franchises do more to mitigate and prepare for
disasters than single firms. For instance, Drabek(24-27)
found that firms that were part of a larger
chain engaged in more disaster evacuation planning than single firms did. This finding is in line
with that of Quarantelli et al.,(23)
who found that national chemical companies engaged in more
preparedness than single local chemical firms. Dahlhamer and D’Souza(30)
provide an
explanation for this finding by arguing that this difference may be due to the mandates given by
corporate headquarters to local chapters to engage in disaster preparedness.

9
2.3.5. Organizational Sector
Evidence in the disaster literature indicates that some sectors engage in more mitigation
and preparedness than others. For instance, Drabek(24, 27)
found that there was a significant
relationship between business type and disaster evacuation planning, with lodging businesses
having more extensive disaster evacuation plans than restaurants, entertainment businesses, and
firms in the travel industry. Similarly, in their study of 54 firms on preparedness for earthquakes
in San Francisco, Mileti et al.(28)
found an indirect relationship between firm type and earthquake
preparedness. Further, Dahlhamer and D’Souza(30)
found that businesses in the finance,
insurance, and real estate sector, do more to prepare for disasters than businesses in other sectors.
This finding may be explained by the higher degree of regulation and oversight in this sector,(22)
though adequate measures of regulation and oversight have not yet been developed to test this
hypothesis.
2.3.6. Concern about Disaster Impact
A body of research on risk and disaster visualizations suggests that information on the
potential impacts of disasters can motivate people to take steps to reduce their risks.(47)
In other
words, a high level of concern about the impact of disasters may lead to greater engagement in
preparedness activities.(48)
For example, Showalter’s(49)
study of the effect of Iben Browning
earthquake prediction found that concern over loss of life and personal injury was positively
correlated with respondents’ willingness to engage in preparedness activities.
2.3.7. Organizational obstacles
Organizations must address both internal and external obstacles to disaster mitigation and
preparedness. However, in this study, our focus is on internal obstacles to disaster mitigation and

10
preparedness, which we define as factors inside the organization, that inhibit the ability of
organizations to mitigate and prepare for disasters. The internal obstacles considered in this study
fall into three major categories; lack of information, lack of management and organizational
members’ support, and lack of financial resources.
The acquisition of information is an important ingredient to disaster preparedness(50)
because it allows organizations to make choices about how to allocate resources toward
mitigation, preparedness, response, and recovery. It is also important that management and
organizational members support the adoption of mitigation and preparedness measures. The
policymaking process, where policy entrepreneurs must mobilize support for their issues,
demonstrates this well.(46, 51-53)
Finally, a lack of financial resources is likely to reduce the ability
of an organization to adopt disaster mitigation and preparation measures.(54, 55)
2.3.8. Determinants not in our Study
There are some determinants of organizational mitigation and preparedness that we did
not have measures for in our study. One such determinant is previous experience. Barlow(29)
and
Drabek(25, 26)
both found that previous experience with disasters positively predicted future
preparedness for disasters. Another determinant is whether a business leases or owns the
property where they operate. A study by Dahlhamer and D’Souza(30)
found that businesses that
owned their property engaged in more preparedness measures than businesses that leased their
properties. Finally, the age of the organization was not considered in this study. Research in this
area has been inconsistent; Drabek(24)
found that organizations that have been in existence for at
least 6 years were more likely to have extensive disaster evacuation plans, while Quarantelli et

11
al.(23)
found that older chemical firms were less likely to prepare for disasters than newer
chemical firms.
2.4. Hypothesis
The goal of this paper is to empirically answer two research questions. (1) “Does having
a risk manager in an organization predict the adoption of risk-reducing measures?” (2) “What is
the relationship between risk perception and the adoption of risk-reducing measures at the
organizational level?” To answer these two questions, we offer and test the following
hypotheses:
H1: An organization with a risk manager is more likely than an organization without a
risk manager to adopt mitigation and preparedness measures.
H0: An organization with a risk manager is less likely than an organization without a
risk manager to adopt mitigation and preparedness measures.
H2: Organizational risk perception leads to the adoption of mitigation and preparedness
measures.
H0: Organizational risk perception does not lead to the adoption of mitigation and
preparedness measures.
3. METHODOLOGY
3.1. Data Collection
Data were collected from the Memphis/Shelby County area, Tennessee in 2006. One of
the authors was a member of a research team that collected these data from a sample of public,
private, and non-profit organizations. The research team began by conducting exploratory

12
interviews with 15 different organizations in Memphis/Shelby County, Tennessee. Interviewees
were asked open-ended questions about the type of actions their organizations had taken in
respect to risk, as well at their attitudes toward hazard risk management and risk information.
The interviews were conducted either in person or via telephone in the spring and summer of
2006. Each interview took approximately 30-60 minutes. Following those interviews, the
research team processed the responses and returned them to the interviewees to verify accuracy.
The results of the exploratory interviews were then used to develop the survey instrument
utilized in phase two.
In the fall of 2006, a survey was mailed to 733 organizations in Memphis/Shelby County,
TN. The survey was in two parts; the first consisted of questions regarding risk issues in
organizations and the actions organizations were taking to address risks, the second part
contained questions about demographic information of the respondents. The survey was
distributed using a stratified sampling technique. With the help of the Memphis Regional
Chambers of Commerce, the research team queried an online reference service, ReferenceUSA,
using “number of employees” as a key index variable to allow organizations of all sizes in the
Memphis Metropolitan Area to be surveyed and represented in sufficient numbers. The
categories ranged from no employees to over 9,999 employees. The research team re-categorized
the number of employees into seven distinct categories (1-9, 10-19, 20-49, 50-99, 100-249, 250-
499, and ≥ 500). From these categories, the research team randomly selected 100 organizations
from each of the first six categories, all 101 organizations from the seventh category, and then
added 32 utility companies in Memphis/Shelby County area for a total of 733 organizations.
The survey was administered using a modification of Dillman’s total design method.(56)
Using the letterhead of the University of Memphis, the team mailed a letter to each of the 733
13
organizations describing the study and seeking participation. Following this, the research team
mailed the first batch of surveys and follow-up postcards. Then, a second batch of surveys was
sent out. The survey was addressed to the owners and risk managers of these organizations. Of
the 733 organizations, 227 returned the survey (response rate of 31 percent) and 10 declined to
participate in the study, citing reasons such as, “business is not being fully operational” and “due
to the private nature of our business”, among other reasons.
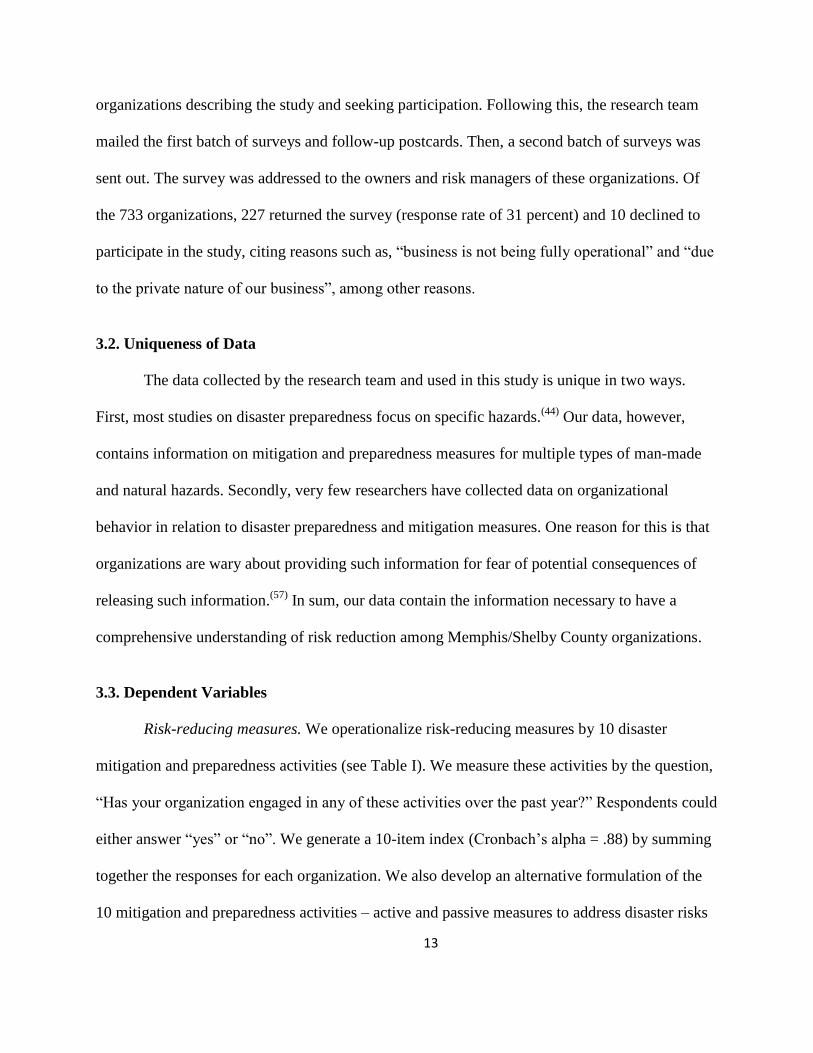
3.2. Uniqueness of Data
The data collected by the research team and used in this study is unique in two ways.
First, most studies on disaster preparedness focus on specific hazards.(44)
Our data, however,
contains information on mitigation and preparedness measures for multiple types of man-made
and natural hazards. Secondly, very few researchers have collected data on organizational
behavior in relation to disaster preparedness and mitigation measures. One reason for this is that
organizations are wary about providing such information for fear of potential consequences of
releasing such information.(57)
In sum, our data contain the information necessary to have a
comprehensive understanding of risk reduction among Memphis/Shelby County organizations.
3.3. Dependent Variables
Risk-reducing measures. We operationalize risk-reducing measures by 10 disaster
mitigation and preparedness activities (see Table I). We measure these activities by the question,
“Has your organization engaged in any of these activities over the past year?” Respondents could
either answer “yes” or “no”. We generate a 10-item index (Cronbach’s alpha = .88) by summing
together the responses for each organization. We also develop an alternative formulation of the
10 mitigation and preparedness activities – active and passive measures to address disaster risks

14
(see Table I). Additionally, we add the active measures together (Cronbach’s alpha = 0.81) and
the passive measures together (Cronbach’s alpha = 0.83). Active measures are those activities
that involve an organization actually doing something to address its risks, not just discussing
which actions to take. Passive measures are activities that involve an organization simply
discussing or mentioning risk-reducing measures to be taken. We assume that active measures
are more capable of reducing the impacts of disasters on organizations than passive measures. As
a result, organizations that adopt active hazard adjustments may stand a better chance of
surviving disasters in comparison to those that only enact passive hazard adjustments.
Table I. Active and Passive Risk-Reducing Measures
Risk-Reducing Measures
Active
1. Attended disaster meetings/training courses outside
your organization
2. Held disaster-related workshops/training within your
organization
3. Arranged site visits by consultants or experts to better
prepare for disasters
4. Provided information to customers/members of the
community on issues related to disasters
5. Assessed or evaluated vulnerability to disasters or
estimated potential losses from disasters
6. Engaged in non-structural mitigation measures (e.g.,
securing computers)
7. Engaged in structural mitigation measures (e.g.,
strengthening parts of a building)
Passive
1. Mentioned a potential disaster in an organizational
meeting
2. Discussed in an organizational meeting short-term
responses to disasters
3. Discussed in an organizational meeting long-term
strategies for recovery from disasters

15
3.4. Independent Variables
Presence of a risk manager – We measure this variable by asking the following question
in the survey, “Does your organization have a risk manager?” Respondents could either answer
“yes” or “no”. This independent variable is dichotomous, and so, we create a dummy variable –
1 for organizations that have a risk manager and 0 for organizations that do not have a risk
manager.
Risk Perception – We measure this variable by asking the following question in the
survey, “Using the thermometer scale below, please indicate the extent to which you perceive the
following disasters are a worry for your organization”, on a scale of 100 (a great deal of worry),
50 (moderate worry), and 0 (no worry at all). The survey contained 15 different disasters (Bird
flu/pandemics, chemical spills, drought, earthquakes, extreme heat, extreme winds/tornadoes,
fires, flooding, hurricanes, ice storms, severe storms, terrorist attacks, toxic releases, violent
crimes, and water pollution). We create an index by adding together the responses for all 15
disasters. The 15-item index has a Cronbach’s alpha of 0.89.
3.5. Control Variables
We control for the following variables that the literature on risk reduction say are
important predictors of risk-reducing measures – concern over disaster impacts, organizational
obstacles, ownership patterns of organizations, organizational size, and organizational sector
(education, health, and wholesale/retail trade sectors).
Concern over Disaster Impact – We measure this variable by asking the following
question in the survey, “Please indicate the extent to which the following disaster impacts might
adversely affect your organization” (1=minor adverse impact and 5=major adverse impact). The

16
13 disaster impacts are: (i) damaged reputation, (ii) disruption in supplies or deliveries, (iii)
inability to communicate with employees, (iv) inadequate number of employees, (v) loss of
commercial goods, (vi) loss of customers, (vii) loss of data, (viii) loss of life, (ix) loss of life
support (food, water, etc.), (x) loss relative to competitor’s loss, (xi) power outage, (xii)
structural damage, (xiii) transportation disruption. We create an index, mean disaster impact, for
this variable by adding together the values for all 13 disaster impacts (Cronbach’s alpha = 0.81)
and dividing by 13.
Organizational Obstacles – We measure this independent variable by the survey
question, “Please indicate the extent to which the following statements are obstacles to disaster
planning in your organization”: (a) lack of financial resources to prepare for disasters, (b) lack of
support from upper-level management within your organization, (c) lack of support from mid-
and lower-level organizational members, (d) lack of information about the frequency and
magnitude of disasters, (e) lack of convincing information about the potential impacts of
disasters, (f) unclear organizational benefits from disaster planning and mitigation. The scale of
the variables is 1 to 5 (minor to major obstacle). We develop an index, the mean of all the
obstacles by adding together the values for all the obstacles (Cronbach’s alpha = 0.85) and
dividing by six.
Ownership Pattern – Memphis Regional Chambers of Commerce provided the
information on whether an organization is a single firm or part of a franchise.
Organizational Size – We operationalize this variable by the number of full-time
employees in an organization. Memphis Regional Chambers of Commerce provided the
information on organizational size.

17
Organizational Sector – Memphis Regional Chambers of Commerce provided the
information on the sector which an organization belongs to.
3.6. Statistical Analysis
We assume that there are some organizations in our sample that are against the adoption
of mitigation and preparedness measures and regard these organizations as having negative
values for mitigation and preparedness measures. We also assume that there are some
organizations in our sample that engaged in more than 10 mitigation and preparedness measures
over the past year. For instance, some organizations might have stored water and food in addition
to adopting all 10 mitigation and preparedness measures. We have restricted the sample by
bounding the dependent variable between zero (lower limit) and 10 (upper limit). In other words,
the dependent variable is censored from both left and right, meaning that one cannot observe
organizations that are below zero or above 10.
We estimate a Tobit regression to answer the two research questions. Tobit is the
appropriate technique for analyzing censored samples because it will take in to account
organizations that engage in negative and above 10 mitigation and preparedness measures. We
also estimate an Ordinary Least Square (OLS) regression in order to compare the OLS results
with the Tobit results. Finally, we estimate a Logit regression to understand the relationship
between individual mitigation and preparedness measures and risk manager as well as between
individual mitigation and preparedness measures and risk perception. Logit is appropriate in this
case because of the binary nature of the responses (“yes” or “no”).

18
4. RESULTS
According to Table II, organizations in our sample adopted an average of 4.7 out of 10
risk-reducing measures. In addition, about 44 percent of organizations in our sample have a risk
manager and about 56 percent do not have a risk manager. With regard to risk perception, the
mean risk perception is about 457 out of a maximum of 1365.
Table II. Descriptive Statistics for Dependent and Independent Variables
Variable Obs. Mean Std. Dev. Min Max
Risk-Reducing Measures 206 4.7427 3.2710 0 10
Risk Manager 207 .4444 .4981 0 1
Risk Perception 224 456.9018 285.3145 0 1365
Single Location 218 .7798 .4153 0 1
Employee Size 215 5.7860 2.0758 1 11
Mean Disaster Impact 220 3.6426 .7615 1 5
Mean Obstacle 212 2.5118 1.3729 0 5
Educational Sector 225 .08 .2719 0 1
Health Sector 225 .1556 .3632 0 1
Whole Sale/Retail Sector 225 .1511 .3589 0 1
Table III presents the results of the OLS and Tobit regressions. The results of the Tobit
regression are similar to those of OLS; both models show that having a risk manager
significantly increases the likelihood of adopting risk-reducing measures. Taking the OLS result
as an example; holding all other variables constant, the presence of a risk manager leads to a 2.06
increase in the number of risk-reducing measures adopted. The other variable of interest, risk
perception, has a positive and significant relationship with the adoption of risk-reducing

19
measures in both models. Again, taking the OLS results as an example, holding all other
variables constant, a unit increase in risk perception increases the number of risk-reducing
measures adopted by 0.0017. Single location, mean obstacle, and wholesale/retail sector have
negative and significant relationships with risk-reducing measures. In addition, employee size
and educational sector have positive and significant relationships with risk-reducing measures.
Table III. Ordinary Lease Square and Tobit Regression Results
Variable OLS Tobit
Coefficient
(Std. Error)
Coefficient
(Std. Error)
Risk Manager 2.0557***
(.3842)
2.2243***
(.4640)
Risk Perception .0017**
(.0007)
.0022**
(.0009)
Employee Size .4927***
(.0859)
.5924***
(.1045)
Single Location -1.3013***
(.4465)
-1.5855***
(.5404)
Mean Disaster Impact -.0439
(.2564)
-.1096
(.3127)
Mean Obstacle -.3681***
(.1282)
-.4195***
(.1556)
Educational Sector 1.1815*
(.6348)
1.2820*
(.7606)
Health Sector .4678
(.4737)
.6820
(.5662)
Wholesale/Retail Sector -1.7014**
(.4808)
-2.2959***
(.6015)
Constant 2.3222**
(1.08612)
1.9943
(1.3142)
Observations
180 180
Adj. R2 (Prob. > F = 0.0000)
.5311
Pseudo R2 (Prob. > Chi
2 = 0.0000) .1539
***p < 0.01 **p < 0.05 *p < 0.1
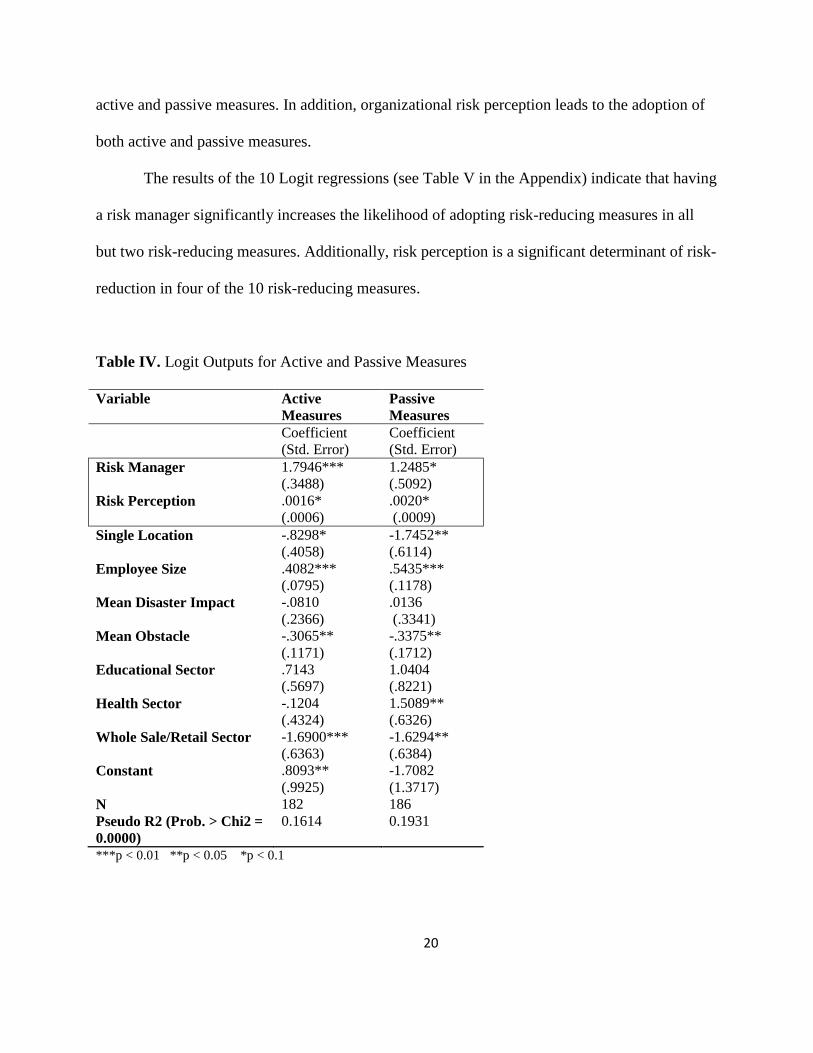
Table IV, which presents the results of the active and passive analysis indicates that there
is a significant and positive relationship between having a risk manager and the adoption of both
20
active and passive measures. In addition, organizational risk perception leads to the adoption of
both active and passive measures.
The results of the 10 Logit regressions (see Table V in the Appendix) indicate that having
a risk manager significantly increases the likelihood of adopting risk-reducing measures in all
but two risk-reducing measures. Additionally, risk perception is a significant determinant of risk-
reduction in four of the 10 risk-reducing measures.
Table IV. Logit Outputs for Active and Passive Measures
Variable Active
Measures
Passive
Measures
Coefficient
(Std. Error)
Coefficient
(Std. Error)
Risk Manager 1.7946***
(.3488)
1.2485*
(.5092)
Risk Perception .0016*
(.0006)
.0020*
(.0009)
Single Location -.8298*
(.4058)
-1.7452**
(.6114)
Employee Size .4082***
(.0795)
.5435***
(.1178)
Mean Disaster Impact -.0810
(.2366)
.0136
(.3341)
Mean Obstacle -.3065**
(.1171)
-.3375**
(.1712)
Educational Sector .7143
(.5697)
1.0404
(.8221)
Health Sector -.1204
(.4324)
1.5089**
(.6326)
Whole Sale/Retail Sector -1.6900***
(.6363)
-1.6294**
(.6384)
Constant .8093**
(.9925)
-1.7082
(1.3717)
N 182 186
Pseudo R2 (Prob. > Chi2 =
0.0000)
0.1614 0.1931
***p < 0.01 **p < 0.05 *p < 0.1
21
5. DISCUSSION
Hiring a risk manager comes with the expectation that a risk manager will help an
organization to reduce its risks from natural and man-made hazards. In fact, Ward(35)
argues that
risk managers are in charge of developing and implementing risk management programs within
organizations. Unfortunately, we are not aware of any study that empirically shows that hiring a
risk manager leads to the adoption of risk-reducing measures. The results of our analyses provide
empirical evidence to support the assertion that hiring a risk manager does, in fact, lead to the
adoption of risk-reducing measures in organizations. Furthermore, hiring a risk manager is
associated with the adoption of both active and passive measures. Our results also suggest that
organizational risk perception leads to the adoption of risk-reducing measures. This result is in
agreement with previous findings on risk perceptions.(33)
Finally, our result indicates that
organizational risk perception is associated with the adoption of both active and passive
measures.
Our results are interesting because they suggest that risk managers make a big difference
when it comes to adopting risk-reducing measures in organizations. And that risk managers are
not just talking about risk reducing measures to adopt, but that they are also involved in more
proactive measures that can actually reduce the impacts of disasters on organizations. The
significant relationship between risk-reducing measures and the presence of risk managers in
organizations leads us to recommend that organizations interested in reducing their risks should
consider hiring a risk manager if they can afford it. For organizations who cannot afford to hire a
risk manager, the federal, state, or local government should consider providing risk management
services at no cost to such organizations with the ultimate goal of helping organizations reduce
their disaster risks.

22
The significant and negative relationship between adoption of risk-reducing measures and
organizational obstacles suggests that risk managers are confronted with some obstacles in their
bid to reduce organizational risks. An appropriate recommendation in this regard might be for
organizations to pay attention to these obstacles with the goal of reducing their impacts on the
risk manager. If an organization is successful in doing so, the risk manager may be more
effective at managing the organization’s risks from both man-made and natural disasters.
6. CONCLUSION
For low-probability, high-consequence events that can impact entire organizations, it is
important to understand organizational preparation for such events. In this study, risk-reducing
measures are 10 mitigation and preparedness measures that could help to diminish organizations’
losses from natural and man-made disasters. The purpose of this study is to determine whether a
designated risk manager is associated with a stronger portfolio of risk-reducing measures and
whether organizational risk perception predicts the adoption of risk-reducing measures. The
results are encouraging. They indicate that hiring a risk manager leads to the adoption of risk-
reducing measures and that a risk manager is associated with the adoption of both active and
passive measures. In addition, the results show that organizational risk perception is associated
with the adoption of risk-reducing measures.
There are some limitations to our study. First, although we postulate that risk managers
are a causative agent, it could be that the presence of a risk manager is endogenous, and is partly
induced by the number of risk-reducing measure in the organization. In other words,
organizations with lots of risk-reducing measures may be more likely to hire a risk manager than
organizations with few risk-reducing measures. This is because the former have more resources
23
at stake in risk management than the latter. A much more complex research design – and
possibly an experimental design – is necessary to resolve this matter. Second, because our study
is based on Memphis/Shelby County region, our results may not be easily generalizable to other
parts of the country. Third, our measure of “the presence of a risk manager” may not be accurate
because some organizations might spread their risk management function across multiple jobs. If
they do so, it is not clear that our survey instrument captured such arrangements. Fourth, we did
not control for some variables that are significant determinants of risk-reduction like past disaster
experience, age of the organization, and whether an organization leases or owns the business
property where it operates.(30, 44, 58)
As a result, our analyses may suffer from some omitted
variable bias.
Despite these limitations, we are confident that our study adds to the small, but growing
literature on organizational perception and management of risk. Future research should examine
whether the type of risk manager matters (e.g., full-time versus part-time and placement within
the organization) and whether the resources allocated to risk managers have an impact. By
isolating which aspects of the risk manager’s role are most important, research can provide clues
about how a culture of risk management may be infused in all units within their organizations.(35)

24
REFERENCES
1. Munich Reinsurance Group. Annual report 2008: Knowledge at work, 2008. Available at
http://www.munichre.com/publications/302-05985_en.pdf.
2. Guha-Sapir D, Vos F, Below R, with Ponserre S. Annual disaster statistical review 2011:
The numbers and trends. Brussels: Center for Research on the Epidemiology of Disasters,
2012. Available at: http://cred.be/sites/default/files/2012.07.05.ADSR_2011.pdf.
3. Kunreuther H, Ginsberg R, Miller L, Sagi P, Slovic P, Borkan B, Katz N. Disaster
insurance protection: Public policy lessons. John Wiley and Sons, 1978.
4. Sadiq AA, Weible C. Obstacles and disaster risk reduction: Survey of Memphis
organizations. Natural Hazards Review, 2010; 11(3):110-117.
5. Slovic P. Perception of risk. Science, 1987; 236:280-285.
6. Slovic P. The perception of risk: Risk, society, and policy series. London: Earthscan,
2000.
7. Lindell MK, Perry RW. The protective action decision model: Theoretical modifications
and additional evidence. Risk Analysis, 2011; 1-17.
8. Dynes RR, Drabek TE. The structure of disaster research: Its policy and disciplinary
implications. International Journal of Mass Emergencies and Disasters, 1994; 12: 5-23.
9. Mitchell VW. Organizational risk perception and reduction: A literature review. British
Journal of Management, 1995; 6(2): 115-133.
10. Penrose JM. The role of perception in crisis planning. Public Relations Review, 2000;
26(2): 155-165.
11. Fowler KL, Kling ND, Larson MD. Organizational preparedness for coping with a major
crisis or disaster. Business and Society, 2007; 46(1): 88-103.
12. Alberto A. Governing disasters: The challenges of emergency risk regulation. Edward
Elgar, 2011.
13. Sadiq AA. Adoption of hazard adjustments by large and small organizations: Who is
doing the talking and who is doing the walking? Risk, Hazards & Crisis in Public Policy,
2011; 2(3): 1-17.
14. Shafritz JM, Ott JS, Jang YS. Classics of organizational theory (Sixth ed.): Wadsworth,
2005.
15. Pfeffer J, Salancik GR. The external control of organizations: A resource dependence
perspective. New York: Harper and Row, 1978.
16. Lindell MK, Perry RW. Planning and preparedness. In Waugh WL, Tierney KJ. (Ed.),
Emergency management: Principles and practice for local governments (second edition)
ICMA Press, 2007.
17. Tierney KJ. Business vulnerability and disruption: Data from the 1993 Midwest floods.
Paper presented at the 41st North American Meetings of the Regional Science Association
International, 1994.
18. Weisbrod BA, Asch ED. Endowments for a rainy day. Stanford Social Innovation
Review(Winter), 2010.
19. Pipa T. Weathering the storm: The role of local nonprofits in the Hurricane Katrina relief
effort. The Aspen Institute, 2006.
20. McManus DJ, Carr HH. Risk and the need for business continuity planning. In Doughty
K (Ed.), Business continuity planning: Protecting your organization’s life. Auerbach

25
Publications, 2001.
21. Tierney KJ. Impacts of recent disasters on businesses: The 1993 Midwest floods and the
1994 Northridge Earthquake (No. NCEER-SP-0001). Buffalo: Multidisciplinary Center
for Earthquake Engineering and Research, State University of New York at Buffalo,
1997.
22. Webb GR, Tierney KJ, Dahlhamer JM. Business and disasters: Empirical patterns and
unanswered questions. Natural Hazards Review, 2000; 1(2): 83-90.
23. Quarantelli EL, Lawrence C, Tierney K, Johnson T. Initial findings from a study of
socio-behavioral preparations and planning for acute chemical hazard disasters. Disaster
Research Center, Department of Sociology, Ohio State University, 1979.
24. Drabek TE. Anticipating organizational evacuations: Disaster planning by managers of
tourist-oriented private firms. International Journal of Mass Emergencies and Disasters,
1991; 9(2): 219-245.
25. Drabek TE. New study shows that growing tourist industry is inadequately prepared for
emergencies. Hazard Technology, 1994a; 14(1): 17, 21.
26. Drabek TE. Disaster evacuation and the tourist industry. Institute of Behavioral Science,
University of Colorado, 1994b.
27. Drabek, TE. Disaster responses within the tourist industry. International Journal of Mass
Emergencies and Disasters, 1995; 13(1): 7-23.
28. Mileti DS, Darlington JD, Fitzpatrick C, O’Brien PW. Communicating earthquake risk:
Societal response to revised probabilities in the Bay Area. Fort Collins: Hazard
Assessment Laboratory and Dept. of Sociology, Colorado State University, 1993.
29. Barlow H. Safety officer accounts of earthquake preparedness at riverside industrial sites.
International Journal of Mass Emergencies and Disasters, 1993; 11(3): 421-435.
30. Dahlhamer JM, D’Souza MJ. Determinants of business disaster preparedness in two U.S.
metropolitan areas. International Journal of Mass Emergencies and Disasters, 1997; 15:
265-281.
31. Light PC. Predicting organizational crisis readiness: Perspectives and practices toward a
pathway to preparedness. New York: New York's Center for Catastrophe Preparedness
and Response, 2008.
32. Sadiq AA. Digging through disaster rubble in search of the determinants of
organizational mitigation and preparedness. Risk, Hazards & Crisis in Public Policy,
2010; 1(2).
33. Han Z, Nigg J. The influences of business and decision makers’ characteristics on
disaster preparedness—A study on the 1989 Loma Prieta earthquake. International
Journal of Disaster Risk Science, 2011; 2(4): 22-31.
34. Chikoto GL, Sadiq AA, Fordyce E. Disaster mitigation and preparedness: Comparison of
nonprofit, public, and private organizations. Nonprofit and Voluntary Sector Quarterly,
2012; 1-20.
35. Ward S. Exploring the role of the corporate risk manager. Risk Management, 2001; 3(1):
7-25.
36. Lindell MK. North American cities at risk: Household responses to environmental
hazards. In Rossetto T, Joffe H, Adams J (Ed.), Cities at risk: Living with perils in the
21st century. Dordrecht: Springer, 2013.
37. Slovic P, Fischhoff B, Lichtenstein S. Facts and fears: Understanding perceived risk.
26
Societal Risk Assessment: How Safe is Safe Enough. Edited by Schwing R, Albers W.
Plenum Press, 1980; 181-214.
38. Mileti D, Sorensen H. Natural hazards and precautionary behavior. In Weinstein ND (ed).
Taking care: Why people take precautions. New York: Cambridge University Press,
1987.
39. Mileti DS, Darlington JD. The role of searching behavior in response to earthquake risk
information. Social Problems, 1997; 44(1): 89-103.
40. Perry RW, Lindell MK. Volcanic risk perception and adjustment in a multi-hazard
environment. Journal of Volcanology and Geothermal Research, 2008; 172: 170-178.
41. Wachinger G, Renn O, Begg C, Kuhlicke C. The risk perception paradox—Implications
for governance and communication of natural hazards. Risk Analysis, 2013; 33(6):1049-
1065.
42. Sadiq AA. Mitigating and preparing for disasters: A survey of Memphis organizations.
(Doctoral Dissertation), 2009.
43. Tierney KJ. Businesses and disasters: Vulnerability, impact, and recovery. In Quarantelli
EL, Rodriquez H, Russell D. (Ed.), Handbook of disaster research: Springer, 2006; 275-
296.
44. Mileti DS. Disasters by design: A reassessment of natural hazards in the United States.
Washington, DC: Joseph Henry Press, 1999.
45. May PJ, Birkland TA. Earthquake risk reduction: An examination of local regulatory
efforts. Environmental Management, 1994; 18: 923-927.
46. Wood RS. Earthquake entrepreneurs: Local policy systems and the regulation of public
risks in California. State and Local Government Review, 2004; 36(3): 198-211.
47. Sandman PM, Weinstein ND, Miller P. High risk or low: How location on a "risk ladder"
affects perceived risk. Risk Analysis, 1994; 14(1): 35-45.
48. Nigg JM. The social impacts of physical processes: How do we manage what we can’t
control? (Preliminary Paper). Newark: Disaster Research Center, University of Delaware,
1996.
49. Showalter PS. Prognostication of doom: An earthquake prediction’s effect on four small
communities. International Journal of Mass Emergencies and Disasters, 1993; 11: 279-
292.
50. Major AM. The utility of situational theory of publics for assessing public response to a
disaster prediction. Public Relations Review, 1998; 24(4): 489-508.
51. Kingdon JW. Agenda, alternatives, and public policies. New York: Harper Collins, 1984.
52. Prater CS, Lindell MK. Politics of hazard mitigation. Natural Hazards Review, 2000;
1(2): 73-81.
53. Olshansky RB. Making a difference: Stories of successful seismic safety advocates.
Earthquake Spectra, 2005; 21(2): 441-464.
54. Wyner AJ, Mann DE. Preparing for California’s earthquakes: Local government and
seismic safety: Institute of Governmental Studies, University of California, Berkeley,
1986.
55. Bostrom A, Turaga RMR, Ponomariov B. Earthquake mitigation decisions and
consequences. Earthquake Spectra, 2006; 22(2): 313-327.
56. Dillman DA. Mail and internet surveys: The total design method. New York: Wiley,
2000.

27
57. Auf der Heide E. Disaster response: Principles of preparation and coordination, 1989.
Available at Orgmail2.coe-dmha.org/dr/flash.htm.
58. Siegrist M, Gutscher H. Flooding Risks: A comparison of lay people’s perceptions and
expert’s assessments in Switzerland. Risk Analysis, 2006; 26(4): 971-979.
APPENDIX
Table V. Logit Outputs for Individual Risk-Reducing Measures
Variable Attend
Meeting
Mention
Disaster
Held Work
Shops
Short-term
Response
Long-
Term
Recovery
Attend
Meeting
Provide
Information
Vulnerability
Assessment
Non-
Structural
Mitigation
Structural
Mitigation
Risk
Manager
1.1466***
(.3978)
.9053*
(.4628)
1.4906***
(.4243)
.5826
(.4529)
.8980**
(.4091)
1.9044***
(.4457)
.8940**
(.4006)
1.4388***
(.4021)
.3784
(.3669)
.9651**
(.4157)
Risk
Perception
.0019**
(.0008)
.0006
(.0008)
.0021**
(.0009)
.0011
(.0008)
.0019**
(.0008)
.0012
(.0008)
.0020**
(.0008)
.0006 (.0007) -.0007
(.0007)
.0008
(.0008)
Single
Location
-.3678
(.4887)
-1.3468**
(.5864)
-.7334
(.5293)
-1.7111***
(.6120)
-1.0903**
(.5347)
-.9303*
(.4879)
-.5686
(.4490)
-.6832
(.4934)
-.6206
(.4375)
-.1269
(.4704)
Employee
Size
.3926***
(.0991)
.3050***
(.0985)
.4230***
(.1068)
.4630***
(.1034)
.4280***
(.1053)
.2614**
(.1049)
.0372
(.0937)
.1800**
(.0910)
.2662***
(.0823)
.1652*
(.0983)
Mean
Disaster
Impact
-.0696
(.2859)
.1917
(.2872)
-.3686
(.3097)
.0431
(.2924)
-.1744
(.2975)
-.1140
(.3065)
-.1275
(.2878)
-.1364
(.2758)
.2991
(.2451)
-.1058
(.2810)
Mean
Obstacle
-.2336*
(.1411)
-.0386
(.1510)
-.4501***
(.1565)
-.2062
(.1527)
-.4196***
(.1515)
-.3017**
(.1515)
-.0581
(.1389)
-.1343
(.1359)
-.0454
(.1231)
-.3943***
(.1457)
Educational
Sector
.4758
(.6569)
.8398
(.8491)
.4712
(.6785)
.6877
(.7480)
.5658
(.6396)
.1319
(.6304)
1.8633***
(.6732)
.9558 (.8389) .2246
(.6025)
-.4782
(.6452)
Health Sector .5528
(.5268)
1.2505**
(.6244)
.4320
(.5649)
1.4095**
(.6209)
.5533
(.5382)
-.5896
(.5952)
-.6852
(.5531)
-.2515
(.4888)
.4233
(.4685)
-.7021
(.5570)
Whole
Sale/Retail
Sector
-1.4182**
(.6363)
-1.2381**
(.5279)
-2.0194***
(.7499)
-.5296
(.5378)
-2.0163***
(.7540)
-.8842
(.7205)
-1.2010*
(.6849)
-1.6554***
(.5546)
-.4156
(.4618)
-1.5905**
(.8037)
Constant -2.6412**
(1.2230)
-.9086
(1.1940)
-1.1712
(1.2333)
-.8989
(1.1898)
-1.4578
(1.2131)
-2.2035*
(1.2629)
-1.3924
(1.1478)
.0635
(1.1480)
-1.5688
(.9973)
-1.2945
(1.1265)
***p < 0.01 **p < 0.05 * p < 0.1