Organizational capacity and profit shifting
65
Discussion Paper No.1795 September 2021 Organizational capacity and profit shifting Katarzyna Bilicka Daniela Scur ISSN 2042-2695
Transcript of Organizational capacity and profit shifting

Discussion Paper
No.1795
September 2021
Organizational capacity and profit shifting
Katarzyna Bilicka Daniela Scur
ISSN 2042-2695

Abstract This paper analyses the effect of a firm’s organizational capacity on the reported profitability of multinational enterprises (MNEs). Better organizational practices improve productivity and the potential taxable profits of firms. However, higher adoption of these practices may also enable more efficient allocation of profits across tax jurisdictions, lowering actual taxable profits. We present new evidence that MNE subsidiaries with better such practices, when located in high-tax countries, report significantly lower profits and have a higher incidence of bunching around zero returns on assets. We show these results are driven by patterns consistent with profit-shifting behavior. Further, using an event study design, we find that firms with better practices are more responsive to corporate tax rate changes. Our results suggest organizational capacity, especially monitoring-related practices, enables firms to engage in shifting profits away from their high-tax subsidiaries.
Key words: profit shifting, organizational capacity, monitoring practices, multinationals JEL: H26; H32; M11; M2
We thank Nick Bloom, Nathan Canen, Raj Chetty, Michael Devereux, Tim Dowd, Andreas Haufler, Peter Egger, Antoine Ferey, Claudio Ferraz, Silke Forbes, Bob Gibbons, Maria Guadalupe, Anna Gumpert, Jim Hines, Kristina McElheran, Jacob Miethe, Andrea Prat, Raffaella Sadun, André Seidel, John Van Reenen, Mike Waldman and Erina Ytsma for their comments. Further thanks to the participants of the NBER Summer Institute 2021, NBER Productivity Innovation and Entrepreneurship 2021 spring meeting, NBER Organizational Economics 2020 fall meeting, SIOE 2020, Econometric Society World Congress 2020, IIPF 2019 Annual Congress, EEA 2019 Annual meeting, NTA 2019 Annual meeting, Empirical Management Conference 2019 and seminar participants at MIT, UC Berkeley, Cornell, Oxford, NYU, CMU, Utah, SSE, Bath, Groningen, LMU Munich, Mannheim and UQAM for their helpful suggestions. We gratefully acknowledge funding from the Cornell Centre for Social Sciences. We would also like to thank Ali Abbas and Qiwei He for excellent research assistance.
Katarzyna Bilicka, Utah State University, NBER and CEPR. Daniela Scur, Cornell University, CEPR and Centre for Economic Performance, London School of Economics.
This paper was produced as part of the Centre’s Growth Programme. The Centre for Economic Performance is financed by the Economic and Social Research Council.
Published by Centre for Economic Performance London School of Economics and Political Science Houghton Street London WC2A 2AE
All rights reserved. No part of this publication may be reproduced, stored in a retrieval system or transmitted in any form or by any means without the prior permission in writing of the publisher nor be issued to the public or circulated in any form other than that in which it is published.
Requests for permission to reproduce any article or part of the Working Paper should be sent to the editor at the above address.
K. Bilicka and D. Scur, submitted 2021.

1 Introduction
Understanding heterogeneity in firm performance is one of the oldest topics in economics, and
the unique role of managers is highlighted in the earliest papers (Walker; 1887). Decades of
empirical work have consistently shown a clear and significant positive relationship between
good managers, good management and productivity (e.g., Bandiera et al.; 2015; Bloom et al.;
2013, 2016; Dessein and Prat; 2019; Ichniowski et al.; 1997), but the relationship with prof-
itability is less straightforward (e.g., Adams et al.; 2005; Armstrong et al.; 2012; Bloom,
Genakos, Sadun and Van Reenen; 2012; Dyreng et al.; 2010; Koester et al.; 2017). While
productivity is a more direct measure of production effectiveness, profitability measures —
such as returns on assets (ROA) — inherently include strategic decisions on reporting and
may be more reflective of aggressive accounting practices than actual performance (Bertrand
and Schoar; 2003).
In this paper, we explore the relationship between organizational capacity and firm prof-
itability across countries with different tax rates, and propose that this capacity is an impor-
tant enabler of legal tax avoidance by multinationals (MNEs).2 The literature on legal tax
avoidance (and, in particular, profit shifting) has primarily focused on the characteristics of
individual managers to explain a firm’s propensity to engage in these activities (Armstrong
et al.; 2012; Desai and Dharmapala; 2006; Dyreng et al.; 2010; Koester et al.; 2017). Other
than firm size, studies have found few other firm characteristics to be systematically linked
with such practices (Bilicka; 2019). We build a unique dataset of manufacturing multina-
tional enterprises (MNEs) across 21 countries, matching management practices data to fifteen
years of detailed firm accounts information and classify the tax regimes the firms operate in,
as well as their levels of aggressive accounting practices.3
We have three main sets of results. First, we classify firms based on the location of
their operations; for every year between 2004 and 2018, we identify whether they operate
their production subsidiaries in low- or high-statutory tax rate countries. We find that
the well-documented average positive relationship between management practices and firm
profitability only holds in low-tax countries, while the relationship with productivity holds in
both high- and low-tax jurisdictions.4 This suggests that MNE subsidiaries adopting “good”
2This paper focuses on legal tax avoidance and profit shifting practices, not illegal tax evasion.3We focus our analysis on multinational corporations (MNEs) for three reasons: first, they are able to
shift profits abroad, unlike domestic firms. Second, due to their international nature and size, they are areasonably comparable group with publicly available data. Third, MNEs often span several jurisdictions,allowing us to exploit variation in statutory tax rates across jurisdictions and time.
4For evidence on the positive relationship between management and firm performance and the averagepositive relationship with firm profitability, see for example: Bloom et al. (2013, 2014); Giorcelli (2019).
1
management practices generate higher revenues that, on average, do not translate into higher
reported profits outside of lower-tax jurisdictions.5 This pattern persists in the sample of
firms where we observe management practices for multiple subsidiaries within the same MNE,
and it is not present when we consider the sample including only domestic firms. Using an
event study design exploiting tax rate cuts across countries, we find that MNE subsidiaries
respond to tax cuts by reporting higher profits in jurisdictions that enact those cuts, and
that this increased reporting is driven by the better managed firms.6
Second, we show the patterns we observe are consistent with organizational capacity en-
abling firms to shift profits more effectively across jurisdictions. A main challenge in studying
profit shifting practices is that these activities are not directly observable to firm outsiders.
However, there are certain firm behaviors that are indicative of “aggressive avoidance.” The
measures we use include firms that have large disparities between their reported financial
and taxable profits (large book-tax differences) (Desai; 2003; Desai and Dharmapala; 2006,
2009); MNEs that have tax haven subsidiaries or headquarters in their ownership tree (Desai
et al.; 2006; Dowd et al.; 2017; Gumpert et al.; 2016; Hines and Rice; 1994); and firms that
report ROAs near zero (Bilicka; 2019; Johannesen et al.; 2020). We show that the patterns
we uncover in reporting practices of better managed firms are driven by those that exhibit
these “aggressive” behaviors. We rule out real productivity differences and local investment
incentives as alternative possible channels driving our results.
To explain how better management could enable profit shifting, we propose a simple
framework where firms adopting better management practices have more tractable and pre-
dictable production plans and we use the detailed plant-level data on management practices
to iteratively consider each practice. We document that the set of practices related to moni-
toring production are most consistently correlated with lower profitability in high-tax coun-
tries. Broadly, practices linked to tractability and predictability of production, as well as
firm-related incentives (rather than plant-specific incentives) are most likely to enable profit
shifting.
Our findings are distinct from, though complementary to, the literature on the effect of
individual managers and manager-specific qualities on profit shifting. While this literature
focuses on the characteristics of individuals who are in the position of manager, we focus
on the organizational structure those managers operate in. There could certainly be an
5We use “good management” here to mean a higher score in the World Management Survey measure,which has been linked to better firm productivity, product quality, average profitability, survival and inno-vation. See Scur et al. (2021) for a survey. We describe this measure in detail in the Data section.
6Fuest et al. (2018) and Serrato and Zidar (2016) use a similar design to consider the effects of corporatetax rate cuts on wages.
2
interaction effect: for any given level of organizational capacity, a good manager can be
better able to take advantage of it relative to a bad manager. But we propose that even a
good manager will not be able to shift profits effectively without the appropriate structures in
place. Empirically, we show that the link between organizational capacity and profit shifting
does not vary substantially across firms with different levels of individual manager quality
(proxied by executive compensation). We do find that, however, that results are driven by
MNEs with more centralized decision-making. Thus, the effects of organizational capacity
on profit shifting are of first order importance.
Our paper contributes to the literatures on profit shifting and the effect of management
practices on firm performance. First, the profit shifting literature finds that large MNEs with
links to tax havens tend to report low profits in high-tax countries (Desai et al.; 2006; Dowd
et al.; 2017; Gumpert et al.; 2016; Hines and Rice; 1994), but beyond firm size there is scant
evidence on what characteristics enable profit shifting (Bilicka; 2019; Wier and Reynolds;
2018). There is evidence on a variety of strategies that firms can use to avoid paying corpo-
rate taxes, such as debt shifting (Desai et al.; 2004; Huizinga et al.; 2008), transfer pricing
(Cristea and Nguyen; 2016; Davies et al.; 2018) and intellectual property location (Dischinger
and Riedel; 2011). Our paper provides a mechanism that enables firms to use these vari-
ous tools more (or less) effectively. Second, there is a vast literature on the strong positive
relationship (correlational and causal) between these good management practices and firm
performance. This relationship is consistent across sectors and countries.7 More recently,
studies have started to focus on the relationship between these practices and outcomes other
than productivity, such as labor flows (Bender et al.; 2018; Cornwell et al.; 2021) and inequal-
ity (Bloom, Ohlmacher and Tello-Trillo; 2020). We contribute to this new set of outcomes,
providing the first evidence of the relationship between these management practices and tax
planning activities.
This question has substantial policy relevance from a micro as well as macro perspective.
At the micro level, management upgrading projects have come into vogue motivated by
the potential of large gains in productivity.8 As governments tax firm profits rather than
productivity, the relationship between better management and potentially lower corporate tax
revenues matters for the cost-benefit calculus. From a macro-perspective, our results suggest
7See, for example Bloom, Genakos, Sadun and Van Reenen (2012); Bloom, Lemos, Sadun and Van Reenen(2020); Bloom and Van Reenen (2007); Lemos et al. (2021) and Scur et al. (2021) for a summary.
8For example, since 2014 there were 15 operations projects relating to improving management practices“funded” by the World Bank, amounting to 2.6 billion dollars in direct lending. There were also a further 26technical assistance, advisory services and knowledge management projects (without specific costs attachedto them). Knack et al. (2020) reviews the relevance of the World Bank’s non-lending instruments.
3

that heterogeneity in firm management quality can mediate the effectiveness of corporate tax
cuts and should be taken in to account when devising such policies.
2 Conceptual framework
In this section we discuss the conceptual framework underpinning our empirical investigation.
In short, we propose that MNE subsidiaries need good organizational capacity to enable
effective tax planning, including local tax minimization and shifting of “excess” profits across
subsidiaries. We consider that a firm has “good” organizational capacity (henceforth, good
management) when they use, on average, a set of mostly formal management practices in
their day-to-day operations of their subsidiaries.9 To minimize their tax burden, firms will
first aim to lower their local tax liabilities as much as possible using, for example, investment
incentives and local tax law provisions particular to their operation. Once firms exhaust
local options, they will consider whether and how much of their excess profits to move to
other jurisdictions under the MNEs global operations. To provide context, we briefly outline
the most common methods of profit shifting used by MNEs, and subsequently propose how
organizational capacity can influence a firm’s ability to use them.
2.1 Methods of profit shifting
Profit shifting happens via three main types of actions: debt shifting, transfer pricing and
patent location. For debt shifting, a subsidiary of an MNE located in high-tax country
borrows funds from a subsidiary located in low-tax country. Interest payments on this debt
are deductible against taxable profits, reducing the tax liability in the high-tax country. The
interest payments accrue to the subsidiary in the low-tax country, being taxed at the lower
rate and reducing the overall tax liability of the MNE. In our context, predictable income
streams enable effective debt shifting as lending to a subsidiary with a clear profit forecast
allows the tax planner to predict the appropriate amount of debt to reduce the overall tax
liability to near zero, but not as far as leaving the subsidiary reporting negative profits. It
is important to stay near zero and avoid being too far into the negative, as that can be
9“Formal management practices” here implies that there is a clearly determined, formal process in placethat governs the day-to-day operations of the plant rather than the manager simply running things in anad-hoc manner (that is, informally). For example, we would consider a firm that has a specific set of keyperformance indicators that are measured weekly a “formal” practice, and a loose set of indicators that amanager tends to track whenever they feel is necessary an “informal” practice. Section 3 describes the datain more detail, including further examples.
4

problematic for several reasons. First, firms they care about shareholder perception and
prefer subsidiaries not to incur losses, especially if they are in fact involved in profitable
activities. There is also a limit on the amount that low-tax subsidiaries can lend, and too
much debt could also increase the likelihood of risky investments and result in potential
bankruptcy. Having formalized processes that outline a set of production indicators to be
regularly tracked and monitored, as well as clear and linked targets across the firm and
divisions allows for such planning to take place and enables potential short-term adjustments
when necessary.
For transfer pricing, a subsidiary located in high-tax country buys intermediate products
from subsidiaries in low-tax countries at prices that are higher than market prices, reducing
profits by increasing costs. The low-tax seller earns revenue from the sale which is taxed
at lower rates. This strategy relies on mis-pricing goods (generally inflating) relative to
their market value and is best achieved using goods that are difficult to price on third party
markets, such as intangibles. This is a popular activity because it is hard for governments
to legally detect, but the “mis-prices” must be relatively fixed in the short-run. Too much
change in the prices of the same intangibles year-on-year raises red flags with government
auditors. For patent location, MNEs can locate their patents in low-tax subsidiaries, such
that any profits earned on those patents will be taxed at lower rates. Further, royalties for
the use of those patents by other subsidiaries will also be taxed at lower tax rates, while
the cost of paying the royalties will be deducted against profits in high-tax countries. In
our context, mis-pricing of goods relies on knowing production levels and feasibility of trade
between locations, while determining the amount of royalty payments is easier when one can
track firm productivity.
There is no dataset available that would allow for clear identification of which strategies
firms are using, as some of these practices remain opaque even within firms. As our framework
is consistent with profit shifting decisions using any (or all) the above strategies, we do not
need to identify between them but simply need to understand that these are the potential
activities that firms engage in to shift profits, and that better organizational capacity affects
the extent to which firms are capable of executing these actions.
2.2 Organizational capacity and tax planning activities
We propose that predictability of production, such as being able to request and receive
information on accurate production and profits forecasts for different subsidiaries, allows the
HQ manager to plan tax liabilities accordingly. Tractability of production, such as having
5

clear production plans with reasonable timelines enables the HQ manager to request specific
changes to subsidiary production plans to fit specific target requirements. Having those
figures available allows the HQ manager to make production targets and profit reallocation
decisions between subsidiaries for the current year as well as plan for the following years.
The HQ managers make decisions about profit allocations, while plant-level managers make
decisions related to production efficiencies. As such, it is unlikely that plant-level managers
will implement better management practices with the exclusive goal of enabling profit shifting
and we do not expect reverse causality to be an issue in this setting.
Our framework implies that better management, via more tractable and predictable pro-
duction, enables firms to carry out effective tax planning and thus shift a larger share of
profits, as they seek to maximize their after-tax profits. We propose that the potential ef-
fect of management on profit shifting activities is causal in the same spirit as the effect of
management on productivity is causal. For example, in Bloom et al. (2013) a random sam-
ple of firms were provided with professional management consulting and the authors find a
causal relationship between better management and firm performance, as the treated firms
experienced an increase of 13% in productivity within the first year. This improvement in
performance naturally happened via the managers who implemented the changes and the
employees who became more efficient in their production activities. In our context, better
management would affect profit shifting in a similar manner, in that the shifting happens
via the HQ managers who decide on the allocation of profits but it is the existence of the
good management structures that make such reallocation decisions possible. To be sure, this
is not to imply that we draw causal inference from the set of correlational results presented
in this paper, but rather to provide clarity on how we perceive the chain of causality in this
context.
Further, our framework is distinct from the literature that considers the effect of individual
managers, or manager-specific quality on profit shifting (Armstrong et al.; 2015; Desai and
Dharmapala; 2006; Koester et al.; 2017). This literature implicitly assumes that when a
decision is made at the HQ, it can be enacted. We propose that firm heterogeneity in
management quality at the subsidiary level can significantly impact the operationalization of
profit shifting strategies. While there could be an interaction effect such that better managers
still do better with a given level of organizational structure, even a good manager will not be
able to shift profits effectively without a minimum level of organizational capacity.
Finally, while profit shifting decisions are made by managers at the HQ and not by
individual subsidiary managers, HQ can still adopt local incentive policies that are aligned
with their profit allocation goals. For example, HQ can choose to link manager bonuses to
6
MNE performance rather than subsidiary performance. As such, we expect that firms with
higher degrees of centralized decision-making are also more likely to be able to engage in
profit shifting behavior. Thus, we expect that the effect that organization capacity has on
profit shifting is still of first order importance.
3 Data
We use two main data sources for this paper: the World Management Survey (WMS), a
random sample of mid- to large-sized manufacturers from 21 countries, and Bureau van Dijk’s
Orbis, a provider of firm-level accounting data. We describe each in turn below. Our primary
analysis sample starts with all MNE subsidiaries in the WMS sample for which we have
financial data, including at least profit and loss before taxes and total assets. This includes
1,783 subsidiaries, belonging to 1,388 unique parent MNEs and yields 16,076 subsidiary-year
observations between 2004 and 2018.10 For a series of robustness checks, we (a) include the
set of domestic firm subsidiaries in the WMS located in the set of countries of the primary
analysis sample (yielding 2,458 subsidiaries and 16,446 subsidiary-year observations between
2010-2018);11 (b) include the full set of subsidiaries belonging to a MNE that has at least
one observation in the WMS sample (yielding 79,949 subsidiaries and 537,508 subsidiary-
year observations). For our event study analysis, we restrict the latter “extended” sample to
only subsidiaries in countries that experienced a single tax rate reduction within the sample
period. This yields a sample of over 17,581 subsidiaries with over 115,721 subsidiary-year
observations. Table I reports summary statistics across all firm-years for the baseline and
event study samples.
3.1 Management data: World Management Survey
To measure the level of adoption of management practices in a firm we use the World Manage-
ment Survey, a project that has systematically collected data on the adoption of structured
management practices in firms since 2004. The WMS focuses on medium- and large-sized
10We require unconsolidated subsidiary level data to analyze differences in the allocation of profits betweenfirm subsidiaries. Thus, we are unable to use Compustat for the US, which includes consolidated level data.
11The domestic firms sample includes only firms located in the countries included in the baseline MNEsample (see Figure I for a list of countries). While the WMS has a larger set of domestic firms in its fullsample, domestic firms do not face the same reporting requirements as multinationals and thus only a smallset have publicly available financial data. A more thorough analysis of tax reporting patterns in domesticfirms requires access to country-specific administrative tax records, which we explore in future work.
7
firms, drawing a random sample of firms with employment of between 50 and 5,000 work-
ers. The WMS methodology, first described in Bloom and Van Reenen (2007), employs a
double-blind, interview-based evaluating tool that defines and scores a set of 18 basic man-
agement practices on a scoring grid from one (“little/no formal management practices”) to
five (“best practice”). The topics covered include adoption of lean manufacturing practices,
performance monitoring, target setting and people management (see Table C1 and C2 for
the full list of questions and the explanation of the measures).
Measuring management practices: The WMS project systematically collects compara-
ble and time-consistent data on the types of practices used at thousands of manufacturing
plants. It uses an interview-based survey tool, where highly trained interviewers engage a
middle manager in a semi-structured conversation about the day-to-day practices followed at
their establishment. The respondent managers were those who were senior enough in their
establishment to have decision powers, but not too senior so as to be detached from the
day-to-day running of the establishment. The most common respondent is either the plant
general manager or operations manager. The survey is set up as an interview, and the ques-
tions although structured, are mostly open-ended so the manager being interviewed is not
guided towards what a high or low scoring answer might be.12 The method is double blind
on the side of the interviewees, but also the interviewers who will not typically know more
than the organization’s name and phone number in advance. The average WMS response
rate is usually between 40 and 50 percent, which is extremely high considering that many
firms surveys typically get far lower response rates.13
The conversation follows a set of broad practices spanning operations/monitoring, target
setting and people/incentive management practices. The WMS does not measure the skills
of the manager but rather measures the processes embedded in each managerial practice in
place within the establishment. Broadly, the scores for each management topic imply the
following: A score between 1 to 2 refers to an establishment with practically no structured
management practices or very weak management practices implemented; a score between 2
to 3 refers to an establishment with some informal practices implemented, but these practices
consist mostly of a reactive approach to managing the organization; a score between 3 to 4
refers to an establishment that has a good, formal management process in place (though not
yet often or consistent enough) and these practices consist mostly a proactive approach to
12This avoids the manager simply giving the answer she thinks the interviewer wants to hear.13For example, Altig et al. (2020); Ben-David et al. (2013); Bloom, Bunn, Chen, Mizen, Smietanka and
Thwaites (2019) where response rates in firm surveys range from 0.1% to 13%.
8

managing the organization; a score between 4 to 5 refers to well-defined strong practices in
place which are often seen as best practices in the sector.
Defining management indices: Following our framework, we focus on the 12 topics
that directly relate to operations management and exclude the questions relating to people
management from the primary analysis. We use the term “management” to refer to the index
of these 12 operations management questions throughout this paper. These are the practices
that relate to the tractability and predictability of production, including monitoring and
target-setting practices (such as having key performance indicators that are measured and
tracked regularly and related targets that link HQ to shop-floor goals). We use the people
management index (and its 6 specific practices) in our discussion of mechanisms.
We build two indices of management: a continuous index with the double-standardized
average across the 12 topics, and a binary indicator dividing firms into two groups based
on a methodological cutoff of the practices measured.14 The indicator takes a value of 1 if
the firm scores above 3 on the 1 to 5 scale, or having achieved a minimum level of “formal”
management practices, while those with scores below 3 have, at best, an “informal” set of
practices. We use the terms good management and formal management interchangeably.
Our primary sample includes only firms that are subsidiaries of MNEs from the WMS sam-
ple. They operate in various countries in North America, Europe, Latin America and Asia.
The MNE subsidiary scores in our sample range from 1.25 to 4.92, with the 25th percentile
at 2.9 and the 75th percentile at 3.75. This suggests that while the average MNEs across
the countries tends to have “formal” practices in place, there is still substantial variation in
management practices across firms and countries. Figure I reports the distribution of scores
across countries, including the corporate tax rate for each country next to the country name.
The average management score for firms in high-tax subsidiaries is 3.41 and the score for
firms in low-tax subsidiaries is 3.32 (Table I). While this difference is statistically significant,
its magnitude is small and, on average, the countries with the lowest average management
scores do not also have the lowest corporate tax rates in the sample. This should alleviate
the concern that our results could be simply picking up a correlation between more “formal”
management and tax rates in high tax-countries. As management practices are sticky, we
assume they are mostly constant across years (or, at least maintain their tendency towards
mostly formal practices in place).15
14The WMS z-score is computed by standardizing each question, taking the average, and standardizingthe average. The binary indicator comes from the methodological cutoff used in the scoring of each questionby the WMS interviewers (as in Cornwell et al. (2021)).
15For WMS firms with panel data we take the average across years. Unfortunately, the sample size that
9

Measuring decentralization and managerial incentives: The WMS collects addi-
tional information on decentralization and type of manager incentives. There are three
decentralization questions that measure at which level a set of key decisions are made for the
firm. The three decisions are: (a) new product introductions, (b) sales and marketing, (c)
hiring of new full time workers. The scoring follows a 1 (all decisions are taken at HQ) to 5
(plant manager has complete authority over these decisions) scale, where 3 means decisions
are equally shared between HQ and the plant.16 We focus on the non-HR decentralization
measures (a and b) and our decentralization measure is an average of the two scores. The
survey also collects three variables on specific manager incentives: (i) the average size of man-
agerial bonuses, (ii) the share of the managerial bonus tied to overall company performance
and (iii) the share of the managerial bonus that is tied to plant-specific performance.
3.2 Firm and financial measures
Profitability, performance and investment measures: From the Orbis dataset, re-
turn on assets (ROA) is our preferred measure of firm profitability, as is common in the
productivity literature as well as the tax and profit shifting literature. It is defined as profit
and losses before taxes divided by total assets. An alternative common outcome variable is
the effective tax rate (ETR), which measures the amount of taxes paid relative to a firm’s
profits. Effective tax rates are often used in profit shifting literature to illustrate how little
tax MNEs pay in various jurisdictions relative to the tax rates. We focus our analysis on
profitability but report additional results using ETR as an outcome variable in the Appendix.
We measure performance using the log of sales per employee. We proxy for investment using
the annual growth rate of fixed assets.
Aggressiveness: book-tax differences, tax havens and bunching near zero ROA
We use three proxies for aggressive tax avoidance behavior. Our first proxy follows the most
commonly used approach and uses the size of book-tax difference (BTD), which measures
the difference between pre-tax book earnings and taxable income. The literature has linked
this measure with tax-planning activities of MNEs, and in particular Manzon and Plesko
(2002) show that approximated measures of demand for tax shelters help explain the varia-
tion in BTDs across firms. These measures have been subsequently used in the literature to
approximate for aggressive tax planning. Desai and Dharmapala (2006) show that increases
includes panel data is not large enough to allow us to look at changes in management.16This measure has been validated and used in other work (Aghion et al.; 2021; Bloom, Sadun and Van
Reenen; 2012).
10
in incentive compensation tend to reduce the level of tax sheltering, Desai and Dharmapala
(2009) show that the effect of tax avoidance on firm value is a function of firm governance.
Desai (2003) points out further that the size of BTDs is related to managerial motives asso-
ciated with earnings management. Thus, BTDs have been shown to be reliable proxies for
both tax sheltering and earnings management and are thus an appropriate tool to use in the
context of analyzing the relationship between management and tax planning practices.17
We calculate BTDs following the literature and subtract from the pre-tax profits the
current tax expense multiplied by the corporate tax rate. We calculate the size of that
difference for each firm, adjusting for deferred taxes where firms report them, to create
permanent book tax differences. We then scale the size of this difference by firm’s total
assets and classify firms with larger than median BTDs as more likely to be aggressive tax
avoiders and those with below median BTDs as likely to be non-aggressive avoiders.18
A second proxy for aggressive tax avoidance is the use of tax havens by multinational
firms. Gumpert et al. (2016); Hines and Rice (1994) show that having a tax haven in the
firm structure signifies behaviour consistent with more aggressive profit shifting. Under this
definition, we classify a firm as being aggressive when an MNE has at least one tax haven
subsidiary (or HQ) in the firm ownership tree. Unlike BTD, a firm level proxy for tax
aggressiveness, the presence of tax haven is an MNE-level proxy. The majority of MNEs in
our sample have tax havens in their firm structure, which is consistent with evidence from
previous literature (Desai et al.; 2006; Gumpert et al.; 2016).19
Our third proxy follows a relatively recent approach and measures the incidence of bunch-
ing around zero reported accounting profits (Bilicka; 2019; Johannesen et al.; 2020). This
approach has the benefit of having the lowest data requirements, as it simply uses the distri-
bution of ROAs across the sample. It is also the most straightforward, as the non-parametric
analysis does not require additional assumptions to be imposed for the classification of firms.
The only assumption is that firms looking to minimize their tax liabilities aim to report as
close to zero accounting profits as possible.
17Erickson et al. (2004) show that traditional BTD measures may not always be a reliable signal of earningsmanipulation. BTDs of companies that were committing some tax fraud are not larger than those companiesthat did not. In the context of this paper, this means that there may be firms that we have classified asnon-aggressive avoiders that may be aggressively tax planning. This would bias the findings against ourhypothesis.
18Our results are not sensitive to choosing alternative thresholds such as classifying the top 25% as beingaggressive avoiders and bottom 25% as non-aggressive.
19While Orbis has poor coverage of financial information for tax haven subsidiaries (Torslov et al.; 2018),we only need to know the existence of such subsidiaries and this more basic information is well reported.
11
Country-year tax rates: Using the location of the HQ and the subsidiary, we use country-
year corporate statutory tax rates from the Centre for Business Taxation Corporate Tax
Database to define high- and low-tax environments.20 We define low tax country-year cells
as those with statutory corporate tax rates below median in a given year, and high tax
country-year cells as those with tax rates above median in a given year. As such, a particular
country will be classified as high- or low- tax on an annual basis, depending on their relative
tax rate in each year.21
4 Main Results
4.1 Management and profitability across tax jurisdictions
Reduced form evidence The core relationship between management and firm perfor-
mance has been consistently estimated across and within countries. The correlation between
management and profitability is noisier than the correlation between management and op-
erating revenue. Broadly, this suggests that higher turnover generated by firms with better
management practices does not necessarily translate into higher reported profitability every-
where. To unpack these patterns, we estimate a reduced form model correlating the ROA
of each firm to their management scores, the tax rate in the subsidiary and the interaction
between the two:
ROAict = α + β1Mi + β2CTRatect + β3Mi × CTRatect + γ1Xit + ηc + δt + εict (1)
where ROAit is the returns on assets, Mi is management score indicator, CTRatect is
the statutory corporate tax rate in country c at time t, Xit includes firm level and MNE
level controls. ηc are country fixed effects and δt are year fixed effects. Firm level controls
include: log of the number of employees, the log of total assets, and log of the total number
of subsidiaries that MNE has. The management score indicator takes a value of 1 if the firm’s
score is equal to or above a value of 3, interpreted as having on average “formal” practices
in place. We run the reduced form model across the main set of samples used in this paper
20For domestic firms, the HQ and any subsidiaries will have a common country of operation by definition.The data is available in the CBT website. For further data documentation see the Eureka website.
21For instance, UK had 30% corporate tax rate in 2007 (above median tax rate), but had gradually loweredits main corporate rate to 19% in 2017 (below median tax rate).
12

and report the results in Table II.22
Columns (1) to (3) start with the full sample of MNE and domestic firms in the WMS
with financial information. Column (1) affirms the positive correlation between formal man-
agement and average reported profitability, as well as average higher profitability of MNEs. It
also shows that reported profitability is significantly lower in higher-tax countries. Columns
(2) includes an interaction between the MNE indicator and the country statutory corporate
tax rate, and the coefficient on the interaction is not significantly different from zero, though
it is negative. Column (3), in turn, includes an interaction between the formal management
indicator and the statutory corporate tax rate, and the coefficient is significant and nega-
tive. Taken together, these results suggest that the variation in reported profits across tax
jurisdictions are not simply driven by firm ownership, and a firm’s organizational capacity
explains an important part of this variation.
In Columns (4) and (5) we split the sample into domestic firms (that is, firms that have
operations exclusively within the country where they are headquartered) and MNEs. It
is clear that the negative interaction coefficient of management and tax rate is driven by
MNEs. Specifically, the coefficients in Column (5) imply that if we were to move a firm
with formal management from a country at the 25th percentile value of corporate tax rates
(approximately 22%) to a country at the 75th percentile of tax rates (approximately 30%),
they would report almost 3 percentage points lower ROA in the higher tax country. Figure II
depicts the relationship in Column (5) across the distribution of the management score. We
plot the local linear regressions of management scores on profitability for MNE subsidiaries
in low-tax and high-tax country-years separately. The commonly documented relationship
between management and profitability seems to be primarily driven by firms located in low-
tax countries, while no discernible pattern exists for firms located in high-tax countries. This
stands in stark contrast to the relationship between management and performance, where
there is no differential pattern between high- or low-tax countries (Figure B1).
Pooled cross sectional data allows us to observe the location of reported profits, but not
the allocation of these profits across jurisdictions within MNEs. This is a concern if firms with
formal management are more likely to locate in high- or low-tax jurisdictions for reasons that
are unobserved. To partially address this concern, in Column (6) we restrict the sample to the
set of MNEs in the WMS sample for which we observe multiple subsidiaries belonging to the
22We use different standard error clustering across different specifications depending on the sample we useand the variation we explore, following Abadie et al. (2017). We use robust standard errors in the baselinespecifications, but cluster at the MNE level when we explore the within-MNE variation.
13
same MNEs and run a model with MNE fixed effects.23 The coefficient on the interaction
term between management and tax rate is significantly negative, and we further plot the
marginal effects of the continuous measure of management for high- and low-tax subsidiaries
in Figure III. The differences are statistically significant beyond a management score of 3,
consistent with Table II.
In all, the correlations in Table II show that only multinational firms with formal man-
agement tend to report lower profits in countries with higher tax rates. This pooling across
years yields a static analysis of the stock of profit allocated to each type of jurisdiction across
all years. However, understanding the dynamics of profit allocation across jurisdictions re-
quires variation in tax rates across time, and the more relevant causal inference question is
understanding how management practices enable firms to respond to tax changes.
Event study evidence We exploit the time dimension of our data to consider the effect
of a tax rate cut on the allocation of profits across jurisdictions, holding firm management
quality constant. This is a reasonable assumption in the short to medium run, as management
practices have been shown to be remarkably sticky and organizational change is notoriously
difficult (Gibbons and Henderson; 2012). We further assume that if we observe one subsidiary
in an MNE with mostly formal practices in place, then all other subsidiaries within the same
MNE hold the same tendency. This is not a likely to be a strong assumption, as Bloom,
Brynjolfsson, Foster, Jarmin, Patnaik, Saporta-Eksten and Van Reenen (2019) show that
the largest variation in management practices is attributed to the differences between firms,
rather than across establishments within firms.
Our identifying variation comes from changes in corporate tax rates across jurisdictions
in our sample, and our event is defined as a corporate tax rate cut relative to the rate in the
previous year for a particular country. A reduction in a tax rate should induce a subsidiary
to report more profits in that country (all else equal), and our conceptual framework pre-
dicts that this behavior would primarily manifest in better managed firms, as they have the
tractability and predictability practices needed to enable an efficient reallocation of profits.
We estimate the following specification:
ROAit = α +4∑
κ=−4
δt1[t = κ] + σ1X′
it + ηt + εit (2)
23This comes with the caveat that the sample includes only 617 firms and 6,084 firm-year observations,representing approximately one-third of the total baseline sample.
14
where ROAit is the return on assets for firm i at time t.∑4
κ=−4 1[t = κ] is a series
of year dummies that equal one when the tax reform was κ years away, with the dummy
variable corresponding to κ = −1 as the omitted category. X′it is a set of firm- and country-
level controls (including GDP growth, cost of capital, investment as share of GDP in both
subsidiary and HQ countries), ηt is a year fixed effect, and εit is the error term.
The coefficients of interest are the δt, as they measure the average change in reported
profits relative to the κ year before or after the reform across the subsidiaries in our sample.
Following McCrary (2007), we bin event dummies at endpoints of the event window (in our
case, at t = −4 and t = 4) such that the end dummies include all reforms occurring 4 or
more years beyond the window. This is to account for the different timing of tax rate cuts
across countries, which yields an unbalanced panel for event times.24
We use the event study sample described in Section 3 focusing on the subsidiaries in
countries that had only one tax cut in the event window. It is the simplest iteration of this
exercise with the most straightforward interpretation. Restricting our analysis to this subset
of countries avoids issues related to possible anticipation of tax changes as well as slow and
staggered sequential introductions of large tax rate cuts.25 We implement this restriction
at the firm level, such that firms that experienced only one tax rate cut in their “sample
lifetime” are also included even if the country they are located in had multiple tax changes
throughout the entire sample period.26
We do not include a control group in our event study analysis sample. There are several
reasons for not doing so. First, the ideal control group would include firms located in countries
where no tax rate changes occurred during our sample period. Most countries have between
1 to 3 tax rate cuts between 2005 - 2018, with only 7 countries not enacting any changes in
this period. This would not constitute a representative group of countries relative to those
with tax cuts. Second, our event times span different years across different countries. If we
built a synthetic control group for any one particular country, it is not clear how this would
apply to other countries with different time lines and reference years. In principle it could
be possible to treat each tax rate cut as a separate event and construct a synthetic group for
24The binning at the end-points of the window is the reason we do not plot the endpoint estimates in theevent study graphs.
25For example, the UK scheduled an 11 percentage point tax cut to be implemented on a one-percentagepoint annual reduction from 2010 to 2022.
26In our sample, a firm located in a country with tax cuts in 2009 and 2013 (i.e., Sweden), for example,could still be in the sample if the firm only reports data between 2004 and 2011 and not after, or between2010 and 2017, but not before. We include a map of the countries included in our event study sample inFigure B5b.
15

each of those weighting the outcomes of each of those event studies.27. However, the data
requirement of such an approach are too stringent for our context and thus we favor the
more straightforward approach of omitting a control group.28 We use the variation in tax
rate changes and between different management types to identify the effects of tax rate cuts
for the firms in our event study sample.
Table III reports the results for the simple pre- and post- analysis, averaging across the
relevant time periods. Columns (1, 4 and 7) include only country and year fixed effects,
Columns (2, 5 and 8) add firm and macro-level controls and Columns (3, 6 and 9) add MNE
fixed effects. Columns 1-3 include the full sample, while columns 4-6 focus on aggressive firms
and columns 7-9 on non-aggressive firms, using the tax haven definition of aggressiveness.
The coefficient on the interaction between the formal management indicator and the post-
tax cut indicator is positive in Columns 1-3 which indicates that firm reported profitability
increases after a tax rate cut. The coefficients in Column (2) suggest that, following a tax
rate cut, firms with formal practices in place report 2.8 percentage points higher ROA in
those jurisdictions in the post-period. This positive response is driven by aggressive firms,
while we see no reported profitability response from non-aggressive firms. Looking at the
within-MNE correlations in Column (3), the results are the closest we get to understanding
reallocation patterns across subsidiaries of the same MNE. While the coefficient value halves,
it is still significant in the post-period for firms with formal management (p value = 0.052).
This is also driven by aggressive firms (Columns 6 and 9).
Figure IV shows the coefficient plots of the time event dummy variables from t = −3 to
t = 3, setting t − 1 as the reference time period (highlighted by the dashed line). Panel (a)
plots event dummy coefficients separately for firms with formal and informal management
in place. As the sample only includes subsidiaries in country-years that experienced a tax
rate cut, the interpretation of each coefficient is the change in reported profits relative to
the year prior to the tax cut across the sample. Subsidiaries with formal management are
represented by white diamonds, and subsidiaries with informal management are represented
by shaded diamonds. There is no evidence of a significant pre-trend in periods before the
tax rate cut, but there is a clear positive and statistically significant response starting from
27As in, for example, Campos et al. (2014); Dube and Zipperer (2015)28Given the staggered nature of the tax rate cuts we analyze, including a control group brings with it
a concern that the estimated effects may be contaminated when “already-treated” observations act as con-trol group (Borusyak and Jaravel; Working Paper; Callaway and Sant’Anna; 2020; de Chaisemartin andD’Haultfoeuille; 2020; Sun and Abraham; 2020). These problems arise from negative weights in the compu-tation of the average treatment effect. As such, we instead opt for a conservative sample selection that allowsfor the clearest interpretation of the differential patterns we are concerned with.
16
t = 0 onward for firms with formal management. Firms with informal management show a
delayed response, which is not statistically different from zero until period t = +2. In Panel
(b) we plot that the difference between firms with formal and informal management. Again
there is no difference in pre-trends, and the difference is statistically significant in all post
time periods.
We conducted a series of robustness and sensitivity checks with various definitions of
event windows and event definitions, including accounting for multiple tax changes within
the sample period, accounting for the size of the tax change, and limiting the sample to a
balanced sample. These results are summarized in Figure B6 in the Appendix and yield
qualitatively similar patterns.
4.2 Explaining reporting patterns: evidence for profit shifting
Once firms exhaust local options, they will consider whether and how much of their excess
profits to move to other jurisdictions under the MNEs global operations.29 First, in Panel A of
Table IV we repeat the specification from Column (5) in Table II for the sub-samples of firms
across two definitions of aggressive avoidance behavior detailed in Section 3. In Columns (1)
and (3) we proxy for aggressive and non-aggressive behavior with above- and below-median
BTDs, respectively, and in Columns (2) and (4) with the presence or no presence of tax
haven in the firm ownership tree. The interaction coefficients suggest that firms with formal
management report significantly lower ROAs in higher tax environments, but only if firms
are also classified as aggressive tax avoiders. We find no significant relationship for firms that
are less likely to be aggressive. Figure V plots the marginal effects across the distribution of
the management score, consistent with the results in Table IV.
In Panel B of Table IV we instead consider the probability a firm reports “near-zero”
ROA. The Table reports the results of a linear probability model with an indicator taking
a value of 1 if ROA is within 0.05 percentage points of zero as an outcome variable. We
proxy for aggressive behavior as in Panel A, and similarly find that the interaction coefficient
between formal management and subsidiary corporate tax rate is positive and significant
only for firms that are classified as aggressive. These results are clearest in a simple plot of
the distribution of ROA for firms with formal and informal management, in high- and low-
tax countries. Figure VI shows that a larger share of MNEs operating in high-tax countries
29In our conceptual framework we do not need to distinguish between the possible modes of profit shiftingthat firms use, but rather assume that firms will use whatever modes are available and suit them best. Adeeper exploration of these modes is outside the scope of this paper.
17

report near zero ROAs relative to MNEs operating in low-tax countries. No such pattern is
apparent in firms with informal management. Again, consistent with profit shifting behavior,
we show the bunching patterns are driven by firms classified as “aggressive” (Figure VII).30
4.3 Explaining profit reporting patterns: alternative channels
Our evidence thus far suggests that better managed firms report lower profitability in high-
tax countries. While this is consistent with better management enabling profit shifting, these
patterns could also be explained by other reasons. In this section, we discuss two potential
alternatives — differences in performance and differences in ability to take advantage of
investment tax incentives — and show why we believe the data is most consistent with the
profit shifting channel. We summarize these results in Table V.
Performance Columns (1) reports the results of our baseline specification with a common
measure of productivity, log of sales per employee, as the outcome variable. The interaction
term between formal management and corporate tax rate is positive and significant, suggest-
ing that despite having lower profitability, firms with formal management are (if anything)
more productive in high-tax countries.31 A similar pattern in the dynamic exercise with
our event study suggests there is no significant difference in productivity response between
formal and informal management firms following a tax rate cut (Figure B2). Thus, “real”
performance differences do not seem to explain lower profitability in high tax countries for
firms with formal management practices.
Investment In our conceptual framework, we outlined that firms have two primary chan-
nels to minimize tax liabilities (local investment tax deductions or profit shifting) and man-
agement practices could work through either channel. Firms could use tax law provisions
within their jurisdictions to lower their taxable profits at a first instance. Using fixed asset
growth as a proxy for investment, Columns (2) reports the results with this alternative out-
come variable. We find that firms in higher-tax countries have lower investment rates, but we
do not find evidence that this is differentially true for firms that have formal management in
place. Another useful variable for insight into this question is the amount that a firm claims
as depreciation in a year, though data for this variable is quite limited. In principle, the
30We use the definition of aggressiveness based on having BTD above median, and we report the Havendefinition in the Appendix, Figure B4.
31To be sure, there is a clear positive relationship between management and productivity in both low- andhigh-tax countries, though the level of productivity is higher in high-tax countries (Figure B1).
18

difference between a firm’s reported EBIT (earnings before interest and taxes) and EBITDA
(earnings before interest, taxes and depreciation of assets) should give us the depreciation
amount claimed. However, in practice these lines are not always reported in income state-
ments and thus we have a large share of missing values. Profit and loss statements, where
ROA comes from, are relatively more complete and another reason ROA is a more commonly
used metric. Still, we run an exercise of iterating through these various outcomes and report
the results in the Appendix (Table B3).32 For this selected sample of firms, the interaction
coefficient between management and the tax rate suggests depreciation plays only a minor
role in explaining the differences we are interested in. As such, we see deductions from in-
vestment as part of the story, but not contributing to our understanding of the difference in
reported profits between high and low tax jurisdictions.
The role of individual managers Our paper focuses on management practices that are
distinct from individual manager quality as there is a large literature on the role of individual
managers and accountants on firm’s performance (Bertrand and Schoar; 2003; Zwick; 2021)
and on firm’s tax avoidance (Dyreng et al.; 2010; Koester et al.; 2017). In this literature,
the effects of individual managers are separated from that of firm specific characteristics by
exploiting the movement of managers across firms. Data constraints prevent us from repli-
cating this approach,33 but we run a simple exercise to consider this channel with available
measures of level of centralization from the WMS and CEO and CFO compensation data
from Orbis.
A measure of the role of HQ managers is the level of centralization of decision-making. In
Columns (3) and (4), we use a WMS proxy for centralization described in Section 3 and split
the sample into firms that have decisions made primarily jointly or at the plant (decentralized)
or primarily at HQ (centralized). The interaction term is only significantly negative for firms
that make decisions primarily at the HQ. This is consistent with our conceptual framework,
where we argue that decisions about allocation of profits across subsidiaries (and consequently
profit shifting) are taken at the parent level but need good management structures at the
local level to be effectively executed.
An alternative measure of the quality of HQ managers used in the literature is the CEO
and CFO compensation. The Orbis directors data includes the latest information on position
and salary of various executive managers, but is often missing the time frame in which they
32We show the sample is selected (Column 3 reports the same specification as in Column 1 using only thefirms with EBIT and EBITDA data available), so results should be interpreted with caution.
33Our focus is on both private and public firms, and directors data is mostly available for the latter.
19
serve. As such, we cannot build a panel of executive compensation and aggregate over
the executive team, as in Armstrong et al. (2012); Desai and Dharmapala (2006). Instead,
we consider the latest current average salary within Chief Executive Officers (CEOs) and
Chief Financial Officers (CFOs).34 This value does not vary over time, and only 2.8% of
managers hold contemporaneous positions in more than one firm. Column (5) repeats the
baseline specification for the sample of firms for which we have executive compensation data to
highlight the selectiveness of this sample. The interaction term is still negative and significant,
but the magnitude is almost four times larger than the “full sample” baseline coefficient. Still,
controlling for CFO compensation (Column 6) or CEO compensation (Column 7) does not
meaningfully change the magnitude of the interaction coefficient across specifications. These
results suggest that the effect of formal management practices on a firm’s capacity to shift
profits is relevant beyond the effect of individual manager quality.
Summary on channels Taken together, the patterns of lower profit reporting by better
managed firms that we observe in higher tax countries countries appear to be driven by profit
shifting activities. As the results in Tables IV and V show, differences in profitability between
high- and low- tax countries cannot be attributed to differences in performance, investment
or individual managers.
5 Mechanisms: how management practices enable profit
shifting
As the patterns we find are consistent with better managed firms engaging in profit shifting
practices, the next question becomes how plant-level management structures could affect de-
cisions made at the MNE headquarters. In this section, we consider whether our management
measure is picking up fundamental (or “real”) practices that “enable” or “constrain” profit
shifting activities or whether it is likely to be proxying for other unobservable characteristics
such as simply overall “competence”. We use enabling to mean that firms with higher scores
in a particular practice are more likely to report lower profits in high-tax countries relative
to low-tax countries. We use constraining to mean that, despite firms looking to minimize
reported profits in a high-tax jurisdiction, higher scores in a particular practice are correlated
with higher reported profits.
34The average salary in the finance, accounting and legal departments within our sample of MNEs issimilar to the the CFO average salary.
20

5.1 Specific practices and reported profitability
The WMS includes individual measures for 18 different management practices across four
broad areas, as discussed in Section 3: lean manufacturing, production monitoring, target-
setting and people management. Each practice carries a wealth of information about the
inner workings of the firm. Thus far we have aggregated the 12 operations-related questions
into a single index, but there are three distinct “sub-areas” within the operations section.
For this exercise, we also use the remaining 6 questions related to people management. We
discuss each set in turn.
The results we describe below are summarized in Figure VIII, which plots the coefficients
of the interaction term between subsidiary tax rate and each of the each of the 18 management
practices from the WMS survey with profitability as outcome variable.35 We report the
interaction coefficients for aggressive firms (green circles) and non-aggressive firms (orange
circles), using the presence of tax haven in MNE ownership tree to define aggressiveness.
We include corresponding tables with individual practices and sub-indices in the Appendix:
Tables B4 and B5 for profitability and repeat the exercise for productivity in Tables B6 and
B7.
Manufacturing competence: lean operations The closest metric we have to “having
one’s act together” is the first two topics in the WMS questionnaire: the interviewer asks
the manager to describe the production process in their firm, and further probes about the
adoption of modern manufacturing best practices and the rationale for adoption. A lower
score on these topics suggests a firm has relatively rudimentary production processes, with
little automation and independent (ad-hoc) introduction of new processes and practices, and
the adoption of practices was primarily a necessary response. A higher score implies a firm has
effective and optimized production systems (including modern manufacturing processes such
as just-in-time production, automation and flexible support systems), and their introduction
was borne out of a proactive competitiveness drive. The results suggest that aggressive
firms with better lean operations practices report lower profits in higher-tax countries. Non-
aggressive firms, however, have a substantial positive relationship. If the patterns we interpret
as profit shifting were driven only by “overall manufacturing competence”, we would expect
to see both aggressive and non-aggressive firms to have a negative correlation.
35Figure and B3 repeats that exercise for performance.
21

Tractability and Predictability: monitoring and target-setting practices The next
set of practices, aggregated in the monitoring index, measure the quality and rigour of per-
formance tracking at the firm. The five processes measured here include the set of key
performance metrics used and recorded at the firm, the frequency of measurement as well as
the structure, quality and follow-up of managerial performance meetings. A lower score on
these topics suggests a firm has an inadequate number of performance indicators (either too
few or too many) tracked with inadequate regularity (or not tracked at all), and little to no
structure in managerial performance review meetings. A higher score implies a firm has a rea-
sonable number of performance indicators that reflect their overall performance, tracked with
regular oversight and structured review meetings including clear documentation of outcomes
and accountability of follow-up plans.
The coefficient on the interaction term in Figure VIII is significantly negative for all the
individual practices for aggressive firms. For non-aggressive firms we find no significant re-
lationship on average, and only one of the individual questions is significant (and positive).
This is consistent with our conceptual framework that focuses on predictability and tractabil-
ity of production as important enablers of profit shifting. The practices in this index directly
measure a firm’s ability to plan production patterns so they predictable and consistent, but
also be able to adjust their production levels on short-notice to act on policy directives from
HQ.
The set of practices relating to target-setting provide a more nuanced picture. The five
practices in this index broadly measure the type, construction and time horizon of targets
and goals of the organization (both plant and firm). The first two practices measure linkages
between HQ and the plant level targets. More specifically, firms with higher scores in “types
of targets” tend to include shareholder concerns in their target-setting, while those with lower
scores primarily focus on operational and local financial goals. Firms with higher scores in
“interconnection of targets” tend to build targets that iteratively link the work on the shop
floor to the overall firm targets. The other three topics, however, are primarily measuring
plant-specific practices relating to the time horizon of goals, the difficulty of plant-specific
goals and how clear and understandable the goals are to shop-floor workers. Firms with
higher scores on these practices have short, medium and long-term horizons, targets that are
tough but achievable and shopfloor workers have a good understanding of their targets and
those of the plant. Firms with lower scores mostly focus on short-run goals, have targets that
are either too easy or too hard, and shopfloor workers are unlikely to understand their goals
or those of the plant.
The interaction coefficient on the average target-setting index is not significant for neither
22
aggressive nor non-aggressive firms. However, the two practices related to targets that link
HQ and subsidiary are significantly negative for aggressive firms. This is consistent with our
conceptual framework, as a focus on shareholder value and strong linkages between plant
and HQ goals would enable better reallocation of profits across subsidiaries. These latter
three measures, however, speak to specific local goals of the manufacturing plant, and thus
would not necessarily have a direct relationship with profit reporting decisions coming from
the HQ.
Incentives and alignment: people management The last set of practices in the survey
relate to people management. The topics cover how firms find and recruit good workers,
evaluate performance to reward and promote good employees as well as deal with poor
performers, and how firms retain their top talent. While these practices relate primarily to
the shopfloor workers, three questions include aspects related to managerial incentives as well
(rewarding performance, promotions and distinctive workplace). Firms with higher scores
on these three practices would discuss having performance-based rewards and professional
development for at least their managers (even if shopfloor are rewarded based on tenure),
and creating a “distinctive value proposition” that attracts top talent to their firm instead of
competitors. Firms with higher scores on the other three practices would have regular local
performance assessments of their shopfloor workers, address underperformance quickly, and
go to great lengths to retain their best workers in their plant.
The interaction effect for the overall index is negative for aggressive firms, though only
the three practices including aspects related to performance or promotions seem to enable
profit shifting. One possibility is that aggressive firms align their incentives to base bonuses
on MNE performance instead of local plant performance. Evidence suggests this is likely the
case, as we can verify with the WMS measures of bonus allocation.36 This is consistent with
our conceptual framework in that firms need to have the basic set of monitoring and target-
setting tools as a platform from which to build effective incentives for their managers. While
this allows for a link to the complementary literature on managerial fixed effects driving
profit shifting, it is outside the scope of this paper and we leave further exploration of this
interaction to future work.
36Panel B of Tables B5 shows that firms offering larger manager bonuses tend to report lower profits inhigher tax countries — but only if the bonuses depend on MNE performance and only in case of aggressivefirms.
23

5.2 Alternatives: general competence or characteristics
Broadly, our results show that practices linked to tractability and predictability of production
(that is, operations), as well as firm-related incentives (and not plant-related incentives) are
most likely to enable profit shifting — but only for firms also classified as aggressive tax
avoiders. The same specifications using productivity as an alternative outcome yield almost
the opposite result, suggesting these firms are significantly more productive in real terms but
not in reported profitability terms (Figure B3). However, the management practices that we
measure could simply be a proxy for general competence, where a firm that is well-managed
also has good earnings management, or a number of other confounding firm characteristics.
In this scenario, our index provides little tangible information to elucidate what profit-
shifters actually do. If this were the case, we would expect to see a more consistent rela-
tionship between the set of individual practices and reported profitability, especially those
that measure plant-level competence that is relatively unrelated to HQ decision-making. It
is also unlikely that management is simply proxying for other characteristics. We verify that
most relevant characteristics, such as decentralization, firm-level aggressiveness and tax rate
of locations, are not systematically correlated with either the formal management indicator
or the continuous management index (Table B1). We find that larger firms and those that
have at least one subsidiary in a tax haven tend to be better managed, but we include three
key measures of firm size (in terms of number of employees, number of subsidiaries and fixed
assets) as controls in all our main specifications and use various proxies of firm aggressiveness
to mitigate this issue.
6 Conclusion
In this paper, we revisit the relationship between management practices and firm perfor-
mance, focusing on the link with firm profitability. We document that there are substantial
and significant differences in reported profitability depending on the statutory tax rates of
the subsidiary location for multinational firms. We find the link between better management
and higher reported profitability is only present in low-tax jurisdictions, and evidence that
this behavior is consistent with better managed firms being more able to engage in profit
shifting activities. Practices related to tractable and predictable production, as well as prop-
erly aligned incentives are most likely to enable such actions. Using an event study design,
we show better managed firms are also more likely to respond to a tax cut with reporting
higher profits in the newly-lower tax jurisdiction. We consider possible determinants of this
24

pattern, and rule out that this is driven by “real” performance differences. We also do not
find evidence of differential take-up of local tax incentives.
The results in this paper are important from a policy perspective. Our results suggest
that, while better firm management may increase firm productivity and “real” profitability,
they also seem to reduce reported profitability in high-tax countries. Lower reported profits
can lead to lower corporate tax revenues, having potentially important welfare implications.
Further, this is relevant for countries engaging in government-funded policies to improve man-
agement quality of firms. While we are not suggesting that governments should stop funding
these projects altogether, an understanding of the multiple potential effects of management
beyond productivity should factor into the cost-benefit analysis.
More generally, the results presented in this paper are likely to be lower bound estimates
of how large the effect of management is for profit shifting. This is because profits reported
by firms are generally different between tax returns and accounting statements, as Bilicka
(2019) shows. This difference is markedly larger for multinational firms and thus the evidence
shown here may be even more pronounced with tax returns data instead of accounting data
for reported MNE profits. Replicating this exercise with tax records data is a fruitful area of
future work.
25

References
Abadie, A., Athey, S., Imbens, G. W. and Wooldridge, J. (2017). When should you ad-
just standard errors for clustering?, Working Paper 24003, National Bureau of Economic
Research.
Adams, R., Almeida, H. and Ferreira, D. (2005). Powerful CEOs and their impact on corpo-
rate performance, Review of Financial Studies 18(4): 1403–1432.
Aghion, P., Bloom, N., Lucking, B., Sadun, R. and Van Reenen, J. (2021). Turbulence,
firm decentralization, and growth in bad times, American Economic Journal: Applied
Economics 13(1): 133–69.
Altig, D., Barrero, J. M., Bloom, N., Davis, S. J., Meyer, B. H. and Parker, N. (2020).
Surveying business uncertainty, Journal of Econometrics .
Armstrong, C. S., Blouin, J. L., Jagolinzer, A. D. and Larcker, D. F. (2015). Corporate
governance, incentives, and tax avoidance, Journal of Accounting and Economics 60(1): 1
– 17.
Armstrong, C. S., Blouin, J. L. and Larcker, D. F. (2012). The incentives for tax planning,
Journal of Accounting and Economics 53(1): 391 – 411.
Bandiera, O., Guiso, L., Prat, A. and Sadun, R. (2015). Matching Firms, Managers, and
Incentives, Journal of Labor Economics 33(3): 623–681.
Ben-David, I., Graham, J. R. and Harvey, C. R. (2013). Managerial Miscalibration, The
Quarterly Journal of Economics 128(4): 1547–1584.
Bender, S., Bloom, N., Card, D., Van Reenen, J. and Wolter, S. (2018). Management
practices, workforce selection, and productivity, Journal of Labor Economics 36(S1).
Bertrand, M. and Schoar, A. (2003). Managing with Style: The Effect of Managers on Firm
Policies*, The Quarterly Journal of Economics 118(4): 1169–1208.
Bilicka, K. A. (2019). Comparing uk tax returns of foreign multinationals to matched do-
mestic firms, American Economic Review 109(8): 2921–53.
Bloom, N., Brynjolfsson, E., Foster, L., Jarmin, R., Patnaik, M., Saporta-Eksten, I. and
Van Reenen, J. (2019). What drives differences in management practices?, American
Economic Review 109(5): 1648–83.
26
Bloom, N., Bunn, P., Chen, S., Mizen, P., Smietanka, P. and Thwaites, G. (2019). The Impact
of Brexit on UK Firms, NBER Working Papers 26218, National Bureau of Economic
Research, Inc.
Bloom, N., Eifert, B., Mahajan, A., McKenzie, D. and Roberts, J. (2013). Does Management
Matter? Evidence from India, The Quarterly Journal of Economics 128: 1–51.
Bloom, N., Genakos, C., Sadun, R. and Van Reenen, J. (2012). Management practices across
firms and countries, The Academy of Management Perspectives 26: 12–33.
Bloom, N., Lemos, R., Sadun, R., Scur, D. and Van Reenen, J. (2014). The New Empirical
Economics of Management, Journal of the European Economic Association 12(4).
Bloom, N., Lemos, R., Sadun, R. and Van Reenen, J. (2020). Healthy business? manage-
rial education and management in health care, The Review of Economics and Statistics
102(3): 506–517.
Bloom, N., Ohlmacher, S. and Tello-Trillo, C. (2020). Management and inequality. Stanford
Mimeo.
Bloom, N., Sadun, R. and Van Reenen, J. (2012). The organization of firms across countries,
The Quarterly Journal of Economics 127(4): 1663–1705.
Bloom, N., Sadun, R. and Van Reenen, J. (2016). Management as a technology?, Working
Paper 22327, National Bureau of Economic Research.
Bloom, N. and Van Reenen, J. (2007). Measuring and explaining management practices
across firms and countries, The Quarterly Journal of Economics 122: 1351–1408.
Borusyak, K. and Jaravel, X. (Working Paper). Revisiting event study designs.
Callaway, B. and Sant’Anna, P. H. (2020). Difference-in-differences with multiple time peri-
ods, Journal of Econometrics .
Campos, N. F., Coricelli, F. and Moretti, L. (2014). Economic Growth and Political In-
tegration: Estimating the Benefits from Membership in the European Union Using the
Synthetic Counterfactuals Method, IZA Discussion Papers 8162, Institute of Labor Eco-
nomics (IZA).
Cornwell, C., Schmutte, I. and Scur, D. (2021). Building a productive workforce: the role of
structured management practices, Management Science forthcoming.
27

Cristea, A. D. and Nguyen, D. X. (2016). Transfer Pricing by Multinational Firms: New
Evidence from Foreign Firm Ownerships, American Economic Journal: Economic Policy
8(3): 170–202.
Davies, R. B., Martin, J., Parenti, M. and Toubal, F. (2018). Knocking on tax haven’s
door: Multinational firms and transfer pricing, The Review of Economics and Statistics
100(1): 120–134.
de Chaisemartin, C. and D’Haultfoeuille, X. (2020). Difference-in-Differences Estimators of
Intertemporal Treatment Effects, Papers 2007.04267, arXiv.org.
Desai, M. A. (2003). The divergence between book income and tax income, Tax Policy and
the Economy 17: 169–206.
Desai, M. A. and Dharmapala, D. (2006). Corporate tax avoidance and high-powered incen-
tives, Journal of Financial Economics 79(1): 145 – 179.
Desai, M. A. and Dharmapala, D. (2009). Corporate Tax Avoidance and Firm Value, The
Review of Economics and Statistics 91(3): 537–546.
Desai, M. A., Foley, C. F. and Hines, J. J. (2006). The demand for tax haven operations,
Journal of Public Economics 90(3): 513–531.
Desai, M. A., Foley, C. F. and Hines, J. R. (2004). A Multinational Perspective on Capital
Structure Choice and Internal Capital Markets, Journal of Finance 59(6): 2451–2487.
Dessein, W. and Prat, A. (2019). Organizational Capital, Corporate Leadership, and Firm
Dynamics, CEPR Discussion Papers 13513, C.E.P.R. Discussion Papers.
Dischinger, M. and Riedel, N. (2011). Corporate taxes and the location of intangible assets
within multinational firms, Journal of Public Economics 95(7): 691 – 707.
Dowd, T., Landefeld, P. and Moore, A. (2017). Profit shifting of U.S. multinationals, Journal
of Public Economics 148: 1 – 13.
Dube, A. and Zipperer, B. (2015). Pooling multiple case studies using synthetic controls: An
application to minimum wage policies, IZA Discussion Papers 8944, Bonn.
Dyreng, S. D., Hanlon, M. and Maydew, E. L. (2010). The effects of executives on corporate
tax avoidance, The Accounting Review 85(4): 1163–1189.
28

Erickson, M., Hanlon, M. and Maydew, E. L. (2004). How Much Will Firms Pay for Earn-
ings that do not Exist? Evidence of Taxes Paid on Allegedly Fraudulent Earnings, The
Accounting Review 79(2): 387–408.
Fuest, C., Peichl, A. and Siegloch, S. (2018). Do Higher Corporate Taxes Reduce Wages?
Micro Evidence from Germany, American Economic Review 108(2): 393–418.
Gibbons, R. and Henderson, R. (2012). What do managers do?, in R. Gibbons and J. Roberts
(eds), The Handbook of Organizational Economics, Princeton University Press.
Giorcelli, M. (2019). The long-term effects of management and technology transfers, Ameri-
can Economic Review 109(1): 121–52.
Gumpert, A., Hines, J. R. and Schnitzer, M. (2016). Multinational firms and tax havens,
The Review of Economics and Statistics 98(4): 713–727.
Hines, J. R. and Rice, E. M. (1994). Fiscal Paradise: Foreign Tax Havens and American
Business, The Quarterly Journal of Economics 109(1): 149–182.
Huizinga, H., Laeven, L. and Nicodeme, G. (2008). Capital structure and international debt
shifting, Journal of Financial Economics 88(1): 80–118.
Ichniowski, C., Shaw, K. and Prennushi, G. (1997). The effects of human resource man-
agement practices on productivity: A study of steel finishing lines, American Economic
Review 87: 291–313.
Johannesen, N., Tørsløv, T. and Wier, L. (2020). Are less developed countries more exposed
to multinational tax avoidance? method and evidence from micro-data, World Bank Eco-
nomic Review 34(3): 790–809.
Knack, S., Parks, B. C., Harutyunyan, A. and DiLorenzo, M. (2020). How Does the World
Bank Influence the Development Policy Priorities of Low-Income and Lower-Middle Income
Countries?, Policy Research Working Paper Series 9225, The World Bank.
Koester, A., Shevlin, T. and Wangerin, D. (2017). The role of managerial ability in corporate
tax avoidance, Management Science 63(10): 3285–3310.
Lemos, R., Muralidharan, K. and Scur, D. (2021). Personnel management and school produc-
tivity: Evidence from india, Working Paper 28336, National Bureau of Economic Research.
29
Manzon, Jr., G. B. and Plesko, G. A. (2002). The Relation between Financial and Tax
Reporting Measures of Income., Tax Law Review 55(2).
McCrary, J. (2007). The effect of court-ordered hiring quotas on the composition and quality
of police, American Economic Review 97(1): 318–353.
Scur, D., Sadun, R., Van Reenen, J., Lemos, R. and Bloom, N. (2021). The World Man-
agement Survey at 18: lessons and the way forward, Oxford Review of Economic Policy
37(2): 231–258.
Serrato, J. C. S. and Zidar, O. (2016). Who Benefits from State Corporate Tax Cuts? A
Local Labor Markets Approach with Heterogeneous Firms, American Economic Review
106(9): 2582–2624.
Sun, L. and Abraham, S. (2020). Estimating dynamic treatment effects in event studies with
heterogeneous treatment effects, Journal of Econometrics .
Torslov, T. R., Wier, L. S. and Zucman, G. (2018). The missing profits of nations, Working
Paper 24701, National Bureau of Economic Research.
Walker, F. A. (1887). The Source of Business Profits, The Quarterly Journal of Economics
1(3): 265–288.
Wier, L. and Reynolds, H. (2018). Big and ‘unprofitable’, Working paper, UNU-WIDER.
Zwick, E. (2021). The costs of corporate tax complexity, American Economic Journal: Eco-
nomic Policy 13(2): 467–500.
30

Tables and figures
Table I: Descriptive Statistics for Each Sample.
Low tax vs High tax Aggressive vs Non-Aggressive
Low taxMean
High taxMean
Low taxN
High taxN
Non-AggMean
AggMean
Non-AggN
AggN
Panel A: Management-only sampleEmployment 1445.03 921.59 10771 5305 1124.32 1563.32 8477 6741Profit & Loss before tax 16707.74 19471.80 10771 5305 8267.07 31069.29 8477 6741Return on Assets 0.06 0.05 10771 5305 0.02 0.12 8477 6741Effective Tax Rate 0.17 0.22 10017 5199 0.25 0.11 8475 6741Management 3.32 3.41 10771 5305 3.34 3.38 8477 6741Formal mgmt = 1 0.74 0.79 10771 5305 0.75 0.77 8477 6741
Panel B: Event study sampleEmployment 713.47 943.15 49225 79625 644.38 1152.57 63765 53141Profit & Loss before tax 19043.44 21687.37 49227 79629 2954.02 41999.02 63767 53143Return on Assets 0.05 0.01 49227 79629 -0.04 0.13 63767 53143Effective Tax Rate 0.16 0.15 41874 73991 0.18 0.12 62751 53114Management (avg) 3.47 3.42 49227 79629 3.44 3.44 63767 53143Formal mgmt (avg) = 1 0.84 0.84 49227 79629 0.84 0.85 63767 53143
Note: Data from the World Management Survey (2004-2014) matched with Orbis (2004 to 2018). TheEffective Tax Rate is the ratio of reported tax payments to profit and loss before taxes. Management isthe average for the WMS operations management questions (including lean management, monitoring andtarget-setting). Panel A shows descriptive statistics for the sample for which we observe managementmeasures at the firm level. Panel B show descriptive statistics for the firms in our Event Study; that is,firms that are located in countries that experienced one tax rate cut throughout the sample period. Lowtax subsidiaries are firms located in countries with below median statutory corporate tax rate in a givenyear. High tax subsidiaries are firms located in countries with above median statutory corporate tax ratein a given year. Non-aggressive are firms with book tax difference (BTD) below median in a given yearand Aggressive are firms with BTD above median in a given year.
31

Table II: Summary of Baseline Results With ROA as the Outcome Variable.
(1) (2) (3) (4) (5) (6)ROA ROA ROA ROA ROA ROA
Formal management=1 0.007*** 0.007*** 0.029*** 0.017** 0.041*** 0.037(0.002) (0.002) (0.007) (0.008) (0.015) (0.030)
Subsidiary corp tax rate -0.105*** -0.093** -0.060 0.128*** -0.236*** -0.323***(0.036) (0.036) (0.038) (0.040) (0.075) (0.117)
MNE=1 0.015*** 0.021*** 0.015***(0.003) (0.008) (0.003)
MNE=1 -0.025× Subsidiary corp tax rate (0.027)
Formal management=1 -0.078*** -0.038 -0.121** -0.169*× Subsidiary corp tax rate (0.025) (0.028) (0.054) (0.098)
Firm controls 3 3 3 3 3 3
Country FE 3 3 3 3 3 3
Year FE 3 3 3 3 3 3
MNE FE 3
Observations 32522 32522 32522 16446 16076 6084# firms 4241 4241 4241 2458 1783 617Dependent Variable Mean 0.045 0.045 0.045 0.031 0.058 0.061Sample Baseline Baseline Baseline Baseline Baseline Baseline
All All All Domestic MNE within GUO
Note: Data from Orbis and the World Management Survey. Baseline sample includes only firms for which we observe management scores andwere directly matched to Orbis financial data. Formal management = 1 is a dummy equal to one when the average for the WMS operationsmanagement questions (including lean management, monitoring and target-setting) is 3 or above, on a scale of 1 to 5. Subsidiary corp taxrate is the annual statutory corporate tax rate in the country where a firm is operating. The outcome variable in all columns is Returns onAssets (ROA) which is the ratio of profit and loss before taxes and total assets. All specifications include country and year fixed effects.Columns (1) - (4) include only multinationals (MNEs) and Column (5) includes only domestic firms. Year of accounts for MNEs include2004-2018, and domestic firms year of accounts include 2010-2018. Firm controls for Columns (1) - (4) include log of employment, log offixed assets and log of number of subsidiaries in the MNE. Firm controls for Column (5) include log of employment and log number ofdomestic production sites. Standard errors are robust in columns 1-3 and 5 and clustered at the MNE level in column 4.
32

Table III: Pre-post Summary Table, Event Study Sample.
All firms Aggressive firms Non-Aggressive firms
Dependent variable: ROA (1) (2) (3) (4) (5) (6) (7) (8) (9)
Formal management=1 -0.023** -0.022*** -0.024** -0.024*** -0.003 -0.006(0.010) (0.008) (0.011) (0.008) (0.012) (0.013)
POST tax cut=1 -0.008 -0.010 0.002 -0.011 -0.011 0.003 0.001 -0.007 -0.024(0.011) (0.010) (0.007) (0.011) (0.010) (0.008) (0.018) (0.020) (0.018)
Formal management=1 0.023** 0.028*** 0.014* 0.026** 0.030*** 0.013* -0.000 0.011 0.020× POST tax cut=1 (0.011) (0.011) (0.007) (0.012) (0.011) (0.008) (0.022) (0.022) (0.016)
Year FE 3 3 3 3 3 3 3 3 3
Country FE 3 3 3 3 3 3 3 3 3
Macro controls 3 3 3 3 3 3
Firm controls 3 3 3 3 3 3
MNE FE 3 3 3
Observations 115721 100539 100539 110767 96476 96476 4954 4063 4063# firms 17581 17581 17581 16861 16861 16861 720 720 720Dependent Variable Mean 0.030 0.030 0.030 0.030 0.030 0.030 0.051 0.051 0.051
Note: Data from Orbis and the World Management Survey. This table includes only the firms in the Event Study sample, which includes allsubsidiaries belonging to an MNE that has at least one plant observed in the WMS. Management data is then averaged across all subsidiarieswithin an MNE. Aggressive firms are defined as having a subsidiary in a tax haven. Non-aggressive firms are defined as not having anysubsidiaries in a tax haven. The event considered here is firms that experienced one tax rate cut during the sample period. POST is adummy equal to 1 in the years after the tax rate cut. The outcome variable in all columns is ROA (returns on assets) which is the ratio ofprofit and loss before taxes and total assets. Firm controls include log of employment, log of fixed assets and log of number of subsidiariesin the MNE. Standard errors are clustered at the MNE level in Columns 3, 6 and 9 and robust otherwise.
33
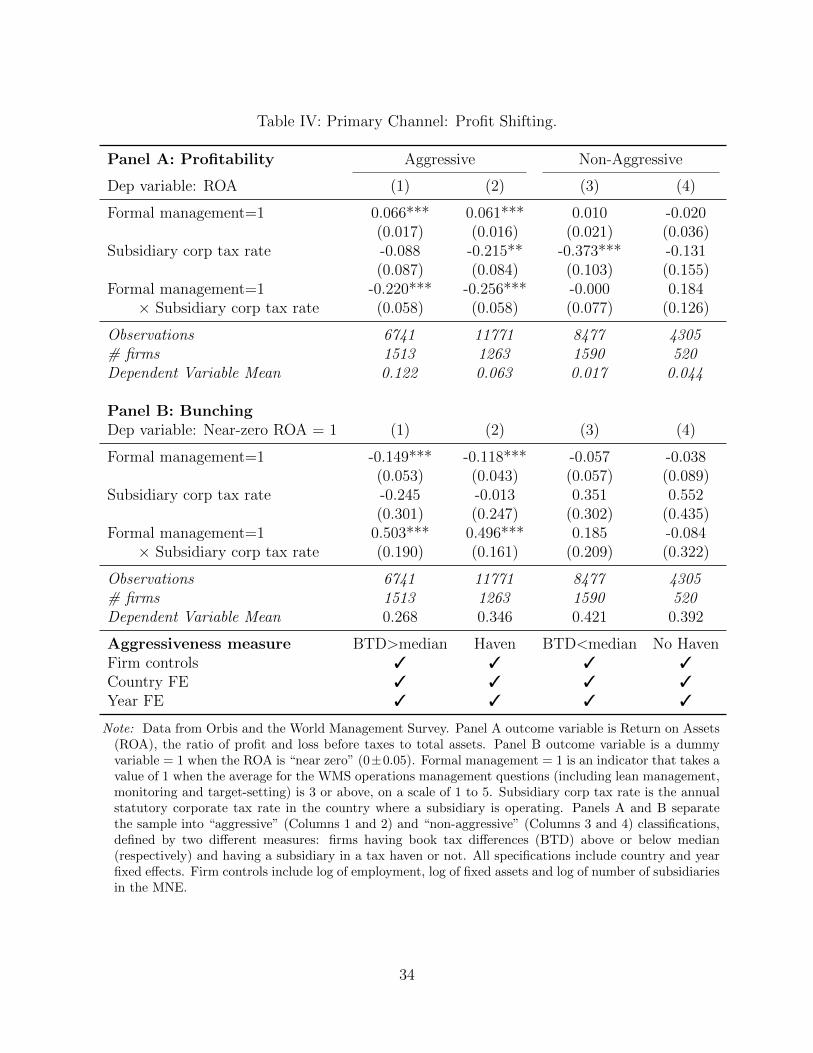
Table IV: Primary Channel: Profit Shifting.
Panel A: Profitability Aggressive Non-Aggressive
Dep variable: ROA (1) (2) (3) (4)
Formal management=1 0.066*** 0.061*** 0.010 -0.020(0.017) (0.016) (0.021) (0.036)
Subsidiary corp tax rate -0.088 -0.215** -0.373*** -0.131(0.087) (0.084) (0.103) (0.155)
Formal management=1 -0.220*** -0.256*** -0.000 0.184× Subsidiary corp tax rate (0.058) (0.058) (0.077) (0.126)
Observations 6741 11771 8477 4305# firms 1513 1263 1590 520Dependent Variable Mean 0.122 0.063 0.017 0.044
Panel B: BunchingDep variable: Near-zero ROA = 1 (1) (2) (3) (4)
Formal management=1 -0.149*** -0.118*** -0.057 -0.038(0.053) (0.043) (0.057) (0.089)
Subsidiary corp tax rate -0.245 -0.013 0.351 0.552(0.301) (0.247) (0.302) (0.435)
Formal management=1 0.503*** 0.496*** 0.185 -0.084× Subsidiary corp tax rate (0.190) (0.161) (0.209) (0.322)
Observations 6741 11771 8477 4305# firms 1513 1263 1590 520Dependent Variable Mean 0.268 0.346 0.421 0.392
Aggressiveness measure BTD>median Haven BTD<median No HavenFirm controls 3 3 3 3
Country FE 3 3 3 3
Year FE 3 3 3 3
Note: Data from Orbis and the World Management Survey. Panel A outcome variable is Return on Assets(ROA), the ratio of profit and loss before taxes to total assets. Panel B outcome variable is a dummyvariable = 1 when the ROA is “near zero” (0±0.05). Formal management = 1 is an indicator that takes avalue of 1 when the average for the WMS operations management questions (including lean management,monitoring and target-setting) is 3 or above, on a scale of 1 to 5. Subsidiary corp tax rate is the annualstatutory corporate tax rate in the country where a subsidiary is operating. Panels A and B separatethe sample into “aggressive” (Columns 1 and 2) and “non-aggressive” (Columns 3 and 4) classifications,defined by two different measures: firms having book tax differences (BTD) above or below median(respectively) and having a subsidiary in a tax haven or not. All specifications include country and yearfixed effects. Firm controls include log of employment, log of fixed assets and log of number of subsidiariesin the MNE.
34
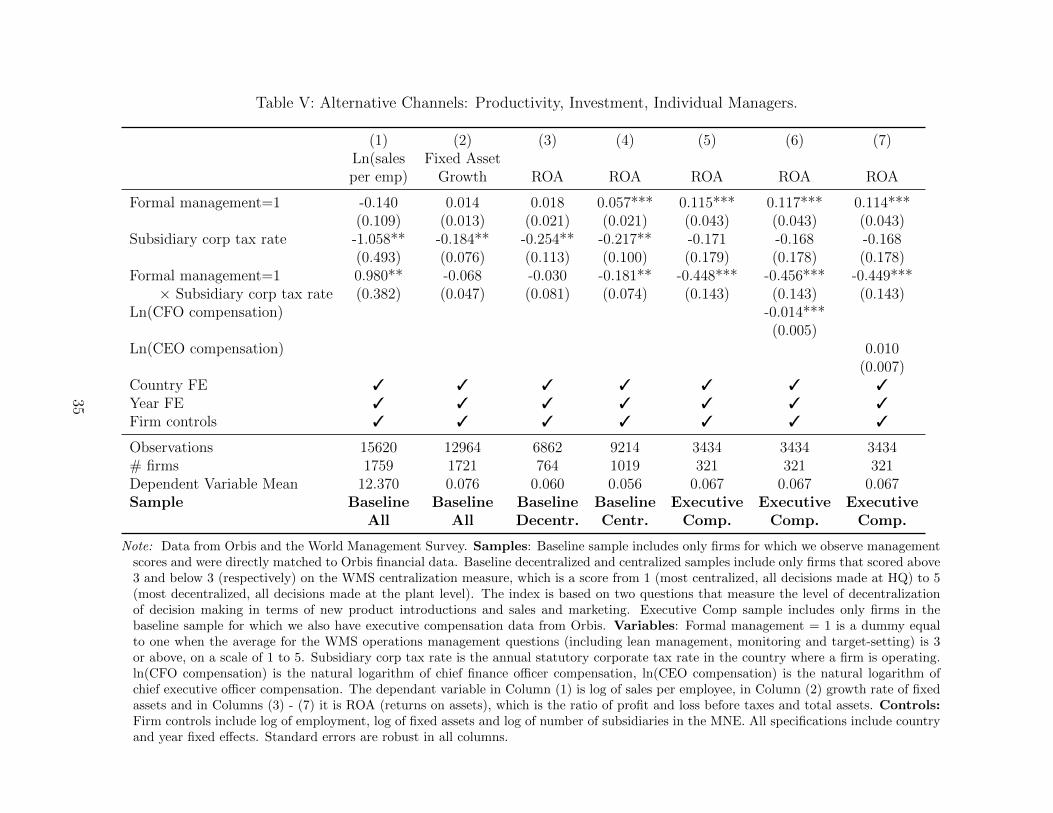
Table V: Alternative Channels: Productivity, Investment, Individual Managers.
(1) (2) (3) (4) (5) (6) (7)Ln(sales Fixed Assetper emp) Growth ROA ROA ROA ROA ROA
Formal management=1 -0.140 0.014 0.018 0.057*** 0.115*** 0.117*** 0.114***(0.109) (0.013) (0.021) (0.021) (0.043) (0.043) (0.043)
Subsidiary corp tax rate -1.058** -0.184** -0.254** -0.217** -0.171 -0.168 -0.168(0.493) (0.076) (0.113) (0.100) (0.179) (0.178) (0.178)
Formal management=1 0.980** -0.068 -0.030 -0.181** -0.448*** -0.456*** -0.449***× Subsidiary corp tax rate (0.382) (0.047) (0.081) (0.074) (0.143) (0.143) (0.143)
Ln(CFO compensation) -0.014***(0.005)
Ln(CEO compensation) 0.010(0.007)
Country FE 3 3 3 3 3 3 3
Year FE 3 3 3 3 3 3 3
Firm controls 3 3 3 3 3 3 3
Observations 15620 12964 6862 9214 3434 3434 3434# firms 1759 1721 764 1019 321 321 321Dependent Variable Mean 12.370 0.076 0.060 0.056 0.067 0.067 0.067Sample Baseline Baseline Baseline Baseline Executive Executive Executive
All All Decentr. Centr. Comp. Comp. Comp.
Note: Data from Orbis and the World Management Survey. Samples: Baseline sample includes only firms for which we observe managementscores and were directly matched to Orbis financial data. Baseline decentralized and centralized samples include only firms that scored above3 and below 3 (respectively) on the WMS centralization measure, which is a score from 1 (most centralized, all decisions made at HQ) to 5(most decentralized, all decisions made at the plant level). The index is based on two questions that measure the level of decentralizationof decision making in terms of new product introductions and sales and marketing. Executive Comp sample includes only firms in thebaseline sample for which we also have executive compensation data from Orbis. Variables: Formal management = 1 is a dummy equalto one when the average for the WMS operations management questions (including lean management, monitoring and target-setting) is 3or above, on a scale of 1 to 5. Subsidiary corp tax rate is the annual statutory corporate tax rate in the country where a firm is operating.ln(CFO compensation) is the natural logarithm of chief finance officer compensation, ln(CEO compensation) is the natural logarithm ofchief executive officer compensation. The dependant variable in Column (1) is log of sales per employee, in Column (2) growth rate of fixedassets and in Columns (3) - (7) it is ROA (returns on assets), which is the ratio of profit and loss before taxes and total assets. Controls:Firm controls include log of employment, log of fixed assets and log of number of subsidiaries in the MNE. All specifications include countryand year fixed effects. Standard errors are robust in all columns.
35
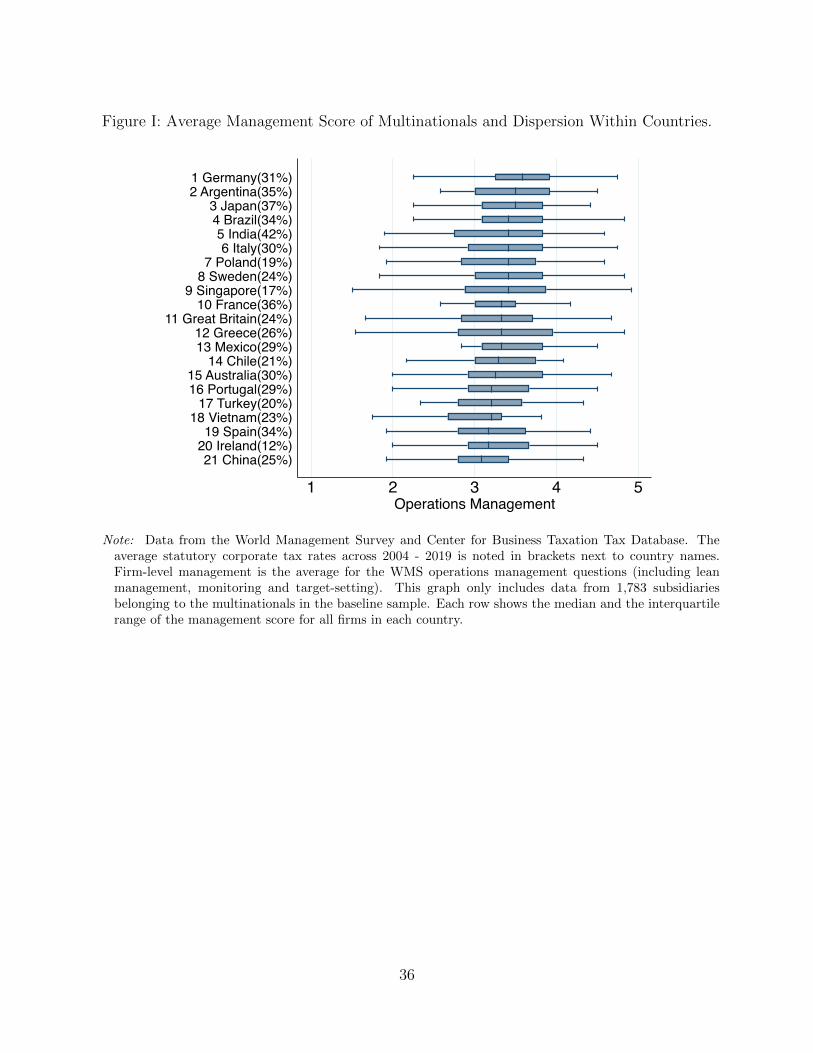
Figure I: Average Management Score of Multinationals and Dispersion Within Countries.
1 2 3 4 5Operations Management
21 China(25%)20 Ireland(12%)19 Spain(34%)
18 Vietnam(23%)17 Turkey(20%)
16 Portugal(29%)15 Australia(30%)
14 Chile(21%)13 Mexico(29%)12 Greece(26%)
11 Great Britain(24%)10 France(36%)
9 Singapore(17%) 8 Sweden(24%) 7 Poland(19%)
6 Italy(30%) 5 India(42%)
4 Brazil(34%) 3 Japan(37%)
2 Argentina(35%) 1 Germany(31%)
Note: Data from the World Management Survey and Center for Business Taxation Tax Database. Theaverage statutory corporate tax rates across 2004 - 2019 is noted in brackets next to country names.Firm-level management is the average for the WMS operations management questions (including leanmanagement, monitoring and target-setting). This graph only includes data from 1,783 subsidiariesbelonging to the multinationals in the baseline sample. Each row shows the median and the interquartilerange of the management score for all firms in each country.
36

Figure II: ROA and Operations Management in Low- and High-tax Country-years.
0.0
5.1
.15
ROA
1 2 3 4 5Operations management score
Low tax subsidiary
0.0
5.1
.15
ROA
1 2 3 4 5Operations management score
High tax subsidiary
Note: Data from the World Management Survey and Orbis. Baseline sample includes only firms thatfor which we observe management scores and were directly matched in both WMS and Orbis. On thehorizontal axis we have operations management, which is the average for the WMS operations managementquestions (including lean management, monitoring and target-setting). On the vertical axis we have ROA,which is the ratio of profit and loss to total assets. Low tax subsidiary are firms located in countrieswith below median statutory corporate tax rate for a given year. High tax subsidiary are firms located incountries with above median statutory corporate tax rate for a given year. The graphs present coefficientsfrom local linear regressions run with bandwidth 0.5.
37

Figure III: Within-MNE Relationship Between Management and ROA
0.0
5.1
.15
Pred
icted
RO
A
1 2 3 4 5Operations ManagementLow tax sub High tax sub
Note: Data from the World Management Survey and Orbis. Baseline sample includes only firms that forwhich we observe management scores and were directly matched in both WMS and Orbis. Here, welimit the sample to MNEs with at least two subsidiaries for which we observe management. The resultspresented in this graph are marginal effects from the regression of ROA on operations management scoreinteracted with high tax subsidiary dummy using MNE fixed effects. Thus, they show within MNEvariation. Each blue square corresponds to the predicted ROA at a given management level for firmslocated in high tax countries. Each red circle corresponds to the predicted ROA at a given managementlevel for firms located in low tax countries. On the horizontal axis we have operations managementscore, which is the average for the WMS operations management questions (including lean management,monitoring and target-setting). On the vertical axis we have ROA which is the ratio of profit and lossto total assets. Low tax subsidiary are firms located in countries with below median statutory corporatetax rate for a given year. High tax subsidiary are firms located in countries with above median statutorycorporate tax rate for a given year.
38

Figure IV: Event Study: Tax Cuts and Reported Profits.
(a) Reported Profitability, formal vs informal
-.04
-.02
0.0
2.0
4.0
6
ROA
(rela
tive
to p
re-ta
x ch
ange
per
iod,
t=-1
)
t=-3 t=-2 t=-1 t=0 t=+1 t=+2 t=+3
Formal management Informal management
(b) Difference between formal and informal
-.04
-.02
0.0
2.0
4.0
6
ROA
(rela
tive
to p
re-ta
x ch
ange
per
iod,
t=-1
)
t=-3 t=-2 t=-1 t=0 t=+1 t=+2 t=+3
Estimated coefficient difference
Note: Data from the World Management Survey and Orbis. This figure plots yearly coefficients fromevent study estimation, where the outcome variable is ROA (returns on assets). ROA is the ratio ofprofit and loss before taxes and total assets. White diamonds in Panel A correspond to coefficients forfirms with formal management practices in place, where formal management is defined as a dummy equalto one when the average for the WMS operations management questions (including lean management,monitoring and target-setting) is 3 or above, on a scale of 1 to 5. Shaded diamonds in Panel A correspondto coefficients for firms with informal management (scores below 3 on the 1 to 5 scale). In Panel B, weplot the coefficients for the estimated difference between formal and informal management firms.
39

Figure V: ROA and Operations Management in Low- and High-tax Country-Years by Ag-gressiveness
-.05
0.0
5.1
.15
Pred
icted
RO
A
1 2 3 4 5Operations Management
Low tax subHigh tax sub
Aggressive
-.05
0.0
5.1
.15
Pred
icted
RO
A
1 2 3 4 5Operations Management
Low tax subHigh tax sub
Non-Aggressive
Note: Data from the World Management Survey and Orbis. Baseline sample includes only firms that forwhich we observe management scores and were directly matched in both WMS and Orbis. The resultspresented in this graph are marginal effects from the regression of ROA on operations management scoreby high vs. low corporate tax location. Panel (a) includes only firms classified as aggressive (book-taxdifferences above median). Panel (b) includes only firms classified as non-aggressive (book-tax differencesbelow median). Each square corresponds to the predicted ROA at a given management level for firmslocated in high tax countries. Each circle corresponds to the predicted ROA at a given managementlevel for firms located in low tax countries. Low tax subsidiary are firms located in countries with belowmedian statutory corporate tax rate for a given year. High tax subsidiary are firms located in countrieswith above median statutory corporate tax rate for a given year. The operations management score isthe average for the WMS operations management questions (including lean management, monitoring andtarget-setting). ROA is the ratio of profit and loss to total assets.
40

Figure VI: Bunching Around Zero ROA
02
46
Dens
ity
-.5 0 .5ROA
Formal management
02
46
Dens
ity
-.5 0 .5ROA
Informal management
High tax Low tax
Note: Data from the World Management Survey and Orbis. Baseline sample includes only firms that forwhich we observe management scores and were directly matched in both WMS and Orbis. We plot thedistribution of ROA, which is the ratio of profit and loss to total assets. ROA restricted between -0.5 and0.5. formal management is a dummy equal to one when the average for the WMS operations managementquestions (including lean management, monitoring and target-setting) is 3 or above, on a scale of 5. Hightax is a dummy equal to 1 when the firm is located in a country with above median statutory corporatetax rate. Hence, blue solid lines show the distribution of ROA for subsidiaries in high tax countries, whilered dashed lines for subsidiaries in low tax countries.
41

Figure VII: Bunching of ROA around Zero for Aggressive Firms by Management Type.
(a) Aggressive
02
46
Dens
ity
-.5 0 .5ROA
Formal management
02
46
Dens
ity-.5 0 .5
ROA
Informal management
High tax Low tax
(b) Non-aggressive
02
46
Dens
ity
-.5 0 .5ROA
Formal management
02
46
Dens
ity
-.5 0 .5ROA
Informal management
High tax Low tax
Note: Data from the World Management Survey and Orbis. Static sample includes only firms that forwhich we observe management scores and were directly matched in both WMS and Orbis. We plot thedistribution of ROA, which is the ratio of profit and loss to total assets. ROA restricted between -1 and1. formal management is a dummy equal to one when the average for the WMS operations managementquestions (including lean management, monitoring and target-setting) is 3 or above, on a scale of 5. Hightax is a dummy equal to 1 when the firm is located in a country with above median statutory corporatetax rate. Hence, blue solid lines show the distribution of ROA for subsidiaries in high tax countries,while red dashed lines for subsidiaries in low tax countries. In Panel A we show the ROA distributionsfor aggressive firms and in Panel B for non-aggressive. Non-aggressive are firms with book tax difference(BTD) below median and Aggressive are firms with BTD above median.
42

Figure VIII: Mechanisms: Management Practices and Firm Profitability for Aggressive and Non-aggressive firms
Q1: Lean adoption x Tax Rate Q2: Rationale for Lean x Tax Rate
Q1: Process Doc x Tax Rate Q2: Perf tracking x Tax Rate
Q3: Perf review x Tax Rate Q4: Perf dialogue x Tax Rate
Q5: Consequence mgmt x Tax Rate Q1: Type of targets x Tax Rate Q2: Interconnection x Tax Rate
Q3: Time horizon x Tax Rate Q4: Stretch goals x Tax Rate
Q5: Clarity of goals x Tax Rate Q1: Talent recruitment x Tax Rate
Q2: Rewarding perf x Tax Rate Q3: Addressing underperf x Tax Rate
Q4: Promotions x Tax Rate Q5: Distinctive workplace x Tax Rate
Q6: Talent retention x Tax Rate
-.4 -.2 0 .2 .4
AggressiveLe
anM
onito
ring
Targ
ets
Peop
le
Coefficients-.4 -.2 0 .2 .4
Non-Aggressive
Coefficients
Note: Data from the World Management Survey and Orbis. This figure plots the interaction coefficients from a regression of profitability(ROA) on each of the 18 individual management topics, subsidiary corporate tax rates and controls for firm size (log of fixed assets, logof employment, log of number of subsidiaries) as well as year and industry fixed effects. We classify firms as “aggressive” if they have asubsidiary in a tax haven. Darker color markers indicate statistically significant coefficients (at the 5 percent level), and light gray markersindicate coefficients that are not significantly different from zero (at the 5 percent level).
43

Appendices
A Conceptual Framework
Let all subsidiaries have a common objective function of after-tax profit maximisation achieved by
maximizing production across all plants and minimizing tax liabilities. The manager at the HQ
is responsible for the tax planning strategy of the entire corporate group.37 Let a firm have two
subsidiaries, one in a high tax (with tax rate τH) and one in a low tax (with tax rate τL) location.
The HQ manager wants to minimize its tax liabilities, by reallocating a share, α ∈ [0, 1], of profits
from the high tax location to the low tax location. Moving profits is costly and we assume that the
cost of profit shifting (c) increases in the amount of profits (π) that a firm makes and in the share
of profits (α) that a firm shifts at an increasing rate, such that∂c
∂π> 0,
∂c
∂α> 0, and
∂2c
∂α2> 0
(consistent with Hines and Rice (1994); Huizinga et al. (2008)).
We assume that profits are an increasing function of the quality of management (m), such that∂π(m)
∂m> 0 (consistent with Bloom, Sadun and Van Reenen (2012)). We propose that the cost
function that the HQ manager faces takes the form c(α,m, π(m)). In particular, we include an
additional factor: the quality of management of the MNE (m > 0). Firms with better management
face lower costs for shifting profits:dc
dm=
∂c
∂m+∂c
∂π
∂π(m)
∂m< 0. We assume that they have
decreasing cost of shifting when the share of shifted profits increases, such that∂2c
∂α∂m< 0, and
those that shift more profits in levels are also going to face decreasing costs, such that∂2c
∂α∂π< 0.
The firm is minimizing its tax liability:
minα∈[0,1]
τH(1− α)π(m) + τLαπ(m) + c(α,m, π(m))
The first order condition for this problem is: (τL − τH)π(m) +∂c
∂α= 0
We use this simple minimization problem to show how management affects the share of shifted
profits; that is, the sign of∂α∗∂m
. Thus, we differentiate the FOC with respect to m, which yields:
∂α∗∂m
=− ∂2c
∂α∂m+ (τH − τL)
∂π(m)
∂m− ∂2c
∂α∂π
∂π(m)
∂m∂2c
∂α2
> 0
Proposition: Better management increases share of shifted profits α.
37While a subsidiary can also be involved in tax planning decisions, we assume it is always in conjunctionwith the HQ as tax planning across borders — profit shifting — involves at least two entities located indifferent jurisdictions and requires a certain level of coordination.
44

B Additional Tables and Figures
Table B1: Correlates of Management Practices.
(1) (2) (3) (4)Formal Formal
z-management z-management management management
Firm characteristicsLn(employment) 0.011 0.010 0.002 0.001
(0.007) (0.007) (0.003) (0.003)Ln(fixed assets) 0.005** 0.005** 0.002** 0.002**
(0.002) (0.002) (0.001) (0.001)Ln(# subsidiaries) 0.079*** 0.051*** 0.026*** 0.011*
(0.012) (0.014) (0.005) (0.006)Fixed asset growth -0.001 -0.018 0.007 -0.001
(0.065) (0.064) (0.031) (0.031)z-centralization -0.012 -0.012 0.010 0.010
(0.023) (0.023) (0.011) (0.011)
AggressivenessBTD > median 0.013 0.018 -0.004 -0.001
(0.059) (0.059) (0.027) (0.027)Effective Tax Rate -0.106 -0.110 -0.052 -0.053
(0.134) (0.133) (0.058) (0.058)Book tax differences (median) 0.609 0.577 0.208 0.192
(0.513) (0.506) (0.221) (0.216)Has a tax haven subsidiary 0.300*** 0.152***
(0.061) (0.030)Tax RateSubsidiary Corp Tax (median) 0.535 0.287 0.901 0.776
(1.757) (1.744) (0.800) (0.793)
Observations 1783 1783 1783 1783
Note: Data from Orbis and the World Management Survey. This table shows coefficients from a regressionof management practices on a set of explanatory variables. In all columns we average the explanatoryvariables across all time periods, unless otherwise specified. In columns 1 and 2 the outcome variable isz-management, which is the continuous operations management score. In Columns 3 and 4, the outcomevariable is an indicator that takes a value of 1 when the average for the WMS operations managementquestions (including lean management, monitoring and target-setting) is 3 or above, on a scale of 1 to 5.The WMS z-centralization measure is a score from 1 (most centralized) to 5 (most decentralized). BTD> median is a dummy equal to 1 when book-tax difference is above median. Effective tax rate is a ratiofo tax liability to profit and loss before taxes. Subsidiary corp tax rate is the median statutory corporatetax rate in the country where a subsidiary is operating. All specifications include country and year fixedeffects. Standard errors are robust in all columns.
45
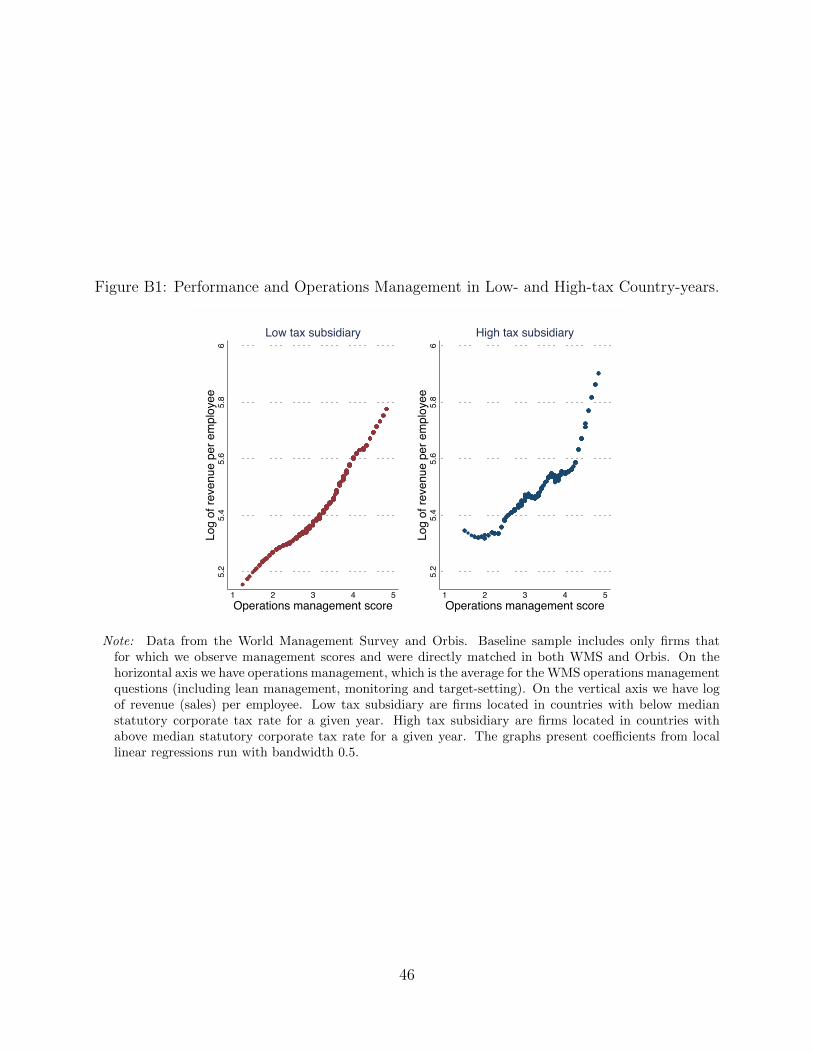
Figure B1: Performance and Operations Management in Low- and High-tax Country-years.
5.2
5.4
5.6
5.8
6Lo
g of
reve
nue
per e
mpl
oyee
1 2 3 4 5Operations management score
Low tax subsidiary
5.2
5.4
5.6
5.8
6Lo
g of
reve
nue
per e
mpl
oyee
1 2 3 4 5Operations management score
High tax subsidiary
Note: Data from the World Management Survey and Orbis. Baseline sample includes only firms thatfor which we observe management scores and were directly matched in both WMS and Orbis. On thehorizontal axis we have operations management, which is the average for the WMS operations managementquestions (including lean management, monitoring and target-setting). On the vertical axis we have logof revenue (sales) per employee. Low tax subsidiary are firms located in countries with below medianstatutory corporate tax rate for a given year. High tax subsidiary are firms located in countries withabove median statutory corporate tax rate for a given year. The graphs present coefficients from locallinear regressions run with bandwidth 0.5.
46

Table B2: Pre-post Summary Table, Event Study Sample, Sales per Employee.
Dependent variable: All firms Aggressive firms Non-Aggressive firms
ln(sales per employee) (1) (2) (3) (4) (5) (6) (7) (8) (9)
Formal management=1 0.060 0.051 0.052 0.045 0.063 0.078(0.142) (0.111) (0.157) (0.121) (0.125) (0.110)
POST tax cut=1 0.183 0.157* 0.071 0.247** 0.222** 0.119** -0.180** -0.305*** -0.293***(0.111) (0.088) (0.054) (0.125) (0.101) (0.060) (0.083) (0.108) (0.096)
Formal management=1 -0.021 -0.028 0.074 -0.068 -0.062 0.044 0.094 0.086 0.154× POST tax cut=1 (0.136) (0.117) (0.057) (0.150) (0.128) (0.062) (0.110) (0.112) (0.112)
Year FE 3 3 3 3 3 3 3 3 3
Country FE 3 3 3 3 3 3 3 3 3
Firm controls 3 3 3 3 3 3
Macro controls 3 3 3 3 3 3
MNE FE 3 3 3
Observations 65131 55803 55803 61622 52939 52939 3509 2864 2864# firms 11047 11047 11047 10490 10490 10490 557 557 557Dependent Variable Mean 12.811 12.811 12.811 12.819 12.819 12.819 12.671 12.671 12.671
Note: Data from Orbis and the World Management Survey. This table includes only the firms in the Event Study sample, which includes allsubsidiaries belonging to an MNE that has at least one plant observed in the WMS. Management data is then averaged across all subsidiarieswithin an MNE. Aggressive firms are defined as having a subsidiary in a tax haven. Non-aggressive firms are defined as not having anysubsidiaries in a tax haven. The event considered here is firms that experienced one tax rate cut during the sample period. POST is adummy equal to 1 in the years after the tax rate cut. The outcome variable in all columns is ROA (returns on assets) which is the ratio ofprofit and loss before taxes and total assets. Firm controls include log of employment, log of fixed assets and log of number of subsidiariesin the MNE. Standard errors are clustered at the MNE level in Columns 3, 6 and 9 and robust otherwise.
47

Figure B2: Event Study: Tax Cuts and Productivity.
(a) Productivity, formal vs informal
-.2-.1
0.1
.2.3
Ln(s
ales
per
em
ploy
ee)
(rela
tive
to p
re-ta
x ch
ange
per
iod,
t=-1
)
t=-3 t=-2 t=-1 t=0 t=+1 t=+2 t=+3
Formal management Informal management
(b) Difference between formal and informal
-.2-.1
0.1
.2.3
Ln(s
ales
per
em
ploy
ee)
(rela
tive
to p
re-ta
x ch
ange
per
iod,
t=-1
)
t=-3 t=-2 t=-1 t=0 t=+1 t=+2 t=+3
Estimated coefficient difference
Note: Data from the World Management Survey and Orbis. This figure plots yearly coefficients from eventstudy estimation, where the outcome variable is performance (log of sales per employee). White diamondsin Panel A correspond to coefficients for firms with formal management practices in place, where formalmanagement is defined as a dummy equal to one when the average for the WMS operations managementquestions (including lean management, monitoring and target-setting) is 3 or above, on a scale of 1 to 5.Shaded diamonds in Panel A correspond to coefficients for firms with informal management (scores below3 on the 1 to 5 scale). In Panel B, we plot the coefficients for the estimated difference between formaland informal management firms.
48

A simple comparison of ROA with EBIT can shed some light on the use of debt shifting by
MNEs. Again with the caveat that data is extremely limited for this exercise, we compare firms
that have made data on both their ROA (from profit and loss statement) and EBIT (from income
statement) available to shed some light on the use of interest deductability by MNEs (Table B3).
For this selected sample of firms, there is limited evidence that interest deductability plays a role.
Magnitude-size, the interaction coefficient for EBIT as an outcome variable in Column 4 is smaller
than the coefficient for ROA in Column 3, but not statistically significant.
Table B3: Understanding the Channels: Alternative Measures of Profitability.
(1) (2) (3) (4) (5) (6) (7)ROA ROA* ROA EBIT EBITDA Depreciation ETR
Formal management=1 0.041*** 0.040*** 0.084** 0.074** 0.071** -0.008 0.059*(0.015) (0.016) (0.036) (0.033) (0.032) (0.007) (0.035)
Subsidiary corp tax rate -0.236*** -0.221*** 0.221 0.121 0.072 -0.067** 0.848***(0.075) (0.079) (0.156) (0.138) (0.133) (0.032) (0.216)
Formal management=1 -0.121** -0.117** -0.208* -0.182 -0.159 0.043* -0.296**× Subsidiary corp tax rate (0.054) (0.056) (0.122) (0.112) (0.107) (0.024) (0.131)
Country FE 3 3 3 3 3 3 3
Year FE 3 3 3 3 3 3 3
Firm controls 3 3 3 3 3 3 3
Observations 16076 14129 4741 4741 4741 4741 15216# firms 1783 1783 517 517 517 517 1750Dependent Variable Mean 0.058 0.055 0.059 0.061 0.103 0.042 0.187
Note: Data from Orbis and the World Management Survey. WMS sample includes only firms for which weobserve management scores and were directly matched in both WMS and Orbis. Formal management = 1is a dummy equal to one when the average for the WMS operations management questions (including leanmanagement, monitoring and target-setting) is 3 or above, on a scale of 1 to 5. Subsidiary corp tax rateis the annual statutory corporate tax rate in the country where a firm is operating. The outcome variablein Columns (1)-(3) is Returns on Assets (ROA) which is the ratio of profit and loss before taxes and totalassets. ROA in Columns (1) and (3) is calculated using contemporaneous profit and loss before taxes andassets, while Column (2) uses lagged assets in the denominator. In Column (4) outcome variable is EBIT,defined as earnings before interest and tax. Column (5) outcome is EBITDA, defined as earnings beforeinterest, tax and depreciation. Column (6) outcome variable is depreciation, calculated as the differencebetween EBITA and EBIT. Column (7) outcome is Effective Tax Rate (ETR), calculated as the ratio oftax liability to profit and loss before taxes. In Column (3), we limit the sample to only firms for which weobserve both EBIT and EBITDA as a reference point. All specifications include country and year fixedeffects. Firm controls include log of employment, log of fixed assets and log of number of subsidiaries inthe MNE. Standard errors are robust in all columns.
49

Table B4: Individual Management Practices and Tax Rate: Interaction Coefficients.
Table of coefficients: each cell is a unique regression.
All Aggressive Non-Aggressive
ROA ROA ROA(1) (2) (3) (4) (5) (6)
Z-Index: Lean ops × Tax Rate -0.015 -0.007 -0.056** -0.089*** 0.220*** 0.076**(0.022) (0.022) (0.024) (0.026) (0.050) (0.031)
Q1: Lean adoption × Tax Rate -0.001 0.006 -0.042* -0.065** 0.201*** 0.067**(0.021) (0.021) (0.024) (0.026) (0.051) (0.029)
Q2: Rationale for Lean × Tax Rate -0.030 -0.022 -0.063*** -0.097*** 0.169*** 0.067**(0.021) (0.021) (0.022) (0.025) (0.049) (0.029)
Z-Index: Monitoring × Tax Rate -0.074*** -0.068*** -0.107*** -0.121*** 0.041 -0.003(0.022) (0.022) (0.025) (0.027) (0.056) (0.029)
Q1: Process Doc × Tax Rate -0.045** -0.037 -0.077*** -0.028 0.107** 0.002(0.022) (0.023) (0.025) (0.025) (0.055) (0.028)
Q2: Perf tracking × Tax Rate -0.059** -0.053** -0.092*** -0.125*** 0.004 0.053*(0.024) (0.024) (0.026) (0.026) (0.065) (0.032)
Q3: Perf review × Tax Rate -0.100*** -0.096*** -0.132*** -0.123*** -0.019 -0.076**(0.023) (0.022) (0.025) (0.027) (0.059) (0.032)
Q4: Perf dialogue × Tax Rate -0.048** -0.045* -0.063** -0.152*** 0.006 0.070**(0.024) (0.024) (0.028) (0.029) (0.040) (0.032)
Q5: Consequence mgmt × Tax Rate -0.048** -0.040* -0.065** -0.056** 0.040 -0.054*(0.023) (0.023) (0.026) (0.028) (0.056) (0.028)
Z-Index: Targets × Tax Rate -0.011 -0.006 -0.048* -0.110*** 0.107** 0.051(0.025) (0.025) (0.028) (0.031) (0.054) (0.034)
Q1: Type of targets × Tax Rate -0.065*** -0.062*** -0.086*** -0.070*** -0.001 -0.047(0.022) (0.022) (0.024) (0.026) (0.058) (0.029)
Q2: Interconnection × Tax Rate -0.007 -0.001 -0.044* -0.043 0.045 0.029(0.020) (0.020) (0.023) (0.026) (0.043) (0.025)
Q3: Time horizon × Tax Rate -0.001 0.004 -0.020 -0.091*** 0.106** 0.045(0.022) (0.021) (0.024) (0.026) (0.045) (0.030)
Q4: Stretch goals × Tax Rate 0.047* 0.050* 0.019 -0.076** 0.065 0.094***(0.028) (0.027) (0.030) (0.030) (0.065) (0.036)
Q5: Clarity of goals × Tax Rate -0.010 -0.007 -0.009 -0.063** 0.049 0.030(0.022) (0.022) (0.025) (0.028) (0.057) (0.030)
Observations 16057 16057 11752 6737 4305 8465# firms 1781 1781 1261 1512 520 1588Dependent Variable Mean 0.058 0.058 0.063 0.122 0.044 0.017
Aggressiveness measure Tax Haven BTD Tax Haven BTDCountry FE 3 3 3 3 3 3
Year FE 3 3 3 3 3 3
Firm controls 3 3 3 3 3
Note: Data from Orbis and the World Management Survey. Tax rate is the statutory corporate tax rate inthe country where a firm is operating. The definition of each management practice is in Table C1. Theoutcome variable in all columns is ROA (returns on assets) which is the ratio of profit and loss beforetaxes and total assets. In columns 3 and 4 aggressive firms are those with tax haven as part of theirownership structure or those with above median book tax difference (BTD) respectively. In columns 5and 6 non-aggressive firms are those without tax havens as part of their ownership structure or thosewith below median book tax difference (BTD) respectively. Firm controls include log of employment, logof fixed assets and log of number of subsidiaries in the MNE. Standard errors are robust in all columns.
50
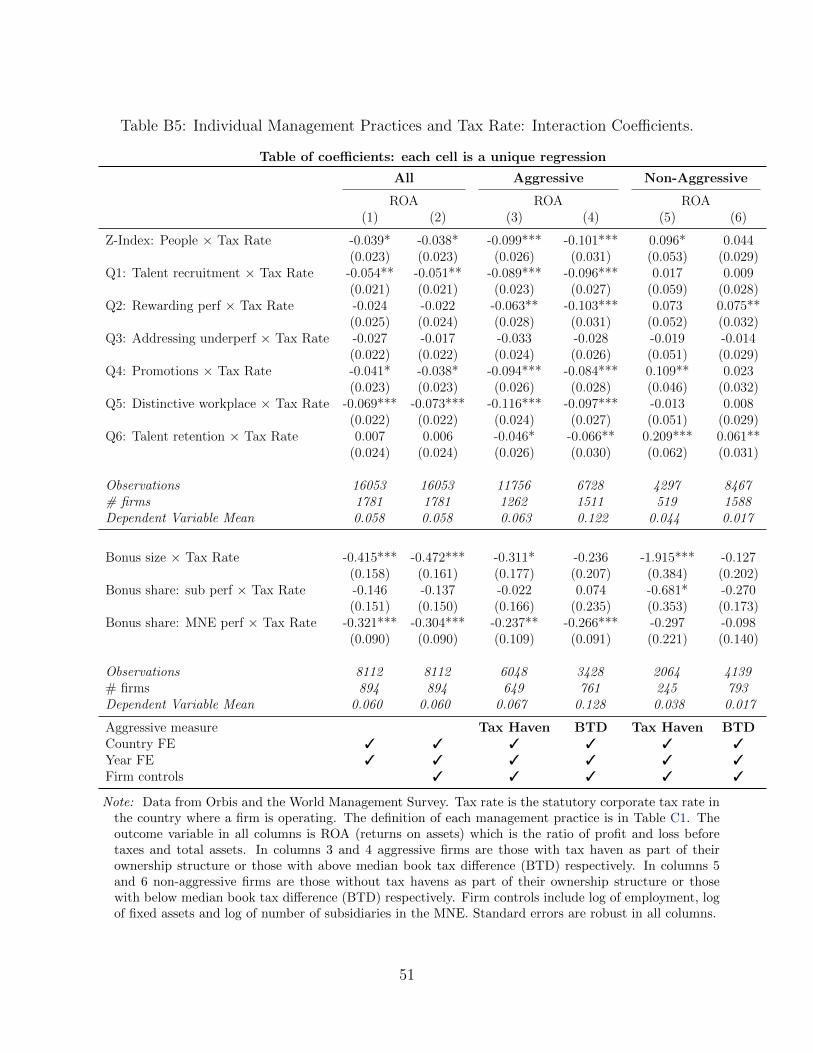
Table B5: Individual Management Practices and Tax Rate: Interaction Coefficients.
Table of coefficients: each cell is a unique regression
All Aggressive Non-Aggressive
ROA ROA ROA(1) (2) (3) (4) (5) (6)
Z-Index: People × Tax Rate -0.039* -0.038* -0.099*** -0.101*** 0.096* 0.044(0.023) (0.023) (0.026) (0.031) (0.053) (0.029)
Q1: Talent recruitment × Tax Rate -0.054** -0.051** -0.089*** -0.096*** 0.017 0.009(0.021) (0.021) (0.023) (0.027) (0.059) (0.028)
Q2: Rewarding perf × Tax Rate -0.024 -0.022 -0.063** -0.103*** 0.073 0.075**(0.025) (0.024) (0.028) (0.031) (0.052) (0.032)
Q3: Addressing underperf × Tax Rate -0.027 -0.017 -0.033 -0.028 -0.019 -0.014(0.022) (0.022) (0.024) (0.026) (0.051) (0.029)
Q4: Promotions × Tax Rate -0.041* -0.038* -0.094*** -0.084*** 0.109** 0.023(0.023) (0.023) (0.026) (0.028) (0.046) (0.032)
Q5: Distinctive workplace × Tax Rate -0.069*** -0.073*** -0.116*** -0.097*** -0.013 0.008(0.022) (0.022) (0.024) (0.027) (0.051) (0.029)
Q6: Talent retention × Tax Rate 0.007 0.006 -0.046* -0.066** 0.209*** 0.061**(0.024) (0.024) (0.026) (0.030) (0.062) (0.031)
Observations 16053 16053 11756 6728 4297 8467# firms 1781 1781 1262 1511 519 1588Dependent Variable Mean 0.058 0.058 0.063 0.122 0.044 0.017
Bonus size × Tax Rate -0.415*** -0.472*** -0.311* -0.236 -1.915*** -0.127(0.158) (0.161) (0.177) (0.207) (0.384) (0.202)
Bonus share: sub perf × Tax Rate -0.146 -0.137 -0.022 0.074 -0.681* -0.270(0.151) (0.150) (0.166) (0.235) (0.353) (0.173)
Bonus share: MNE perf × Tax Rate -0.321*** -0.304*** -0.237** -0.266*** -0.297 -0.098(0.090) (0.090) (0.109) (0.091) (0.221) (0.140)
Observations 8112 8112 6048 3428 2064 4139# firms 894 894 649 761 245 793Dependent Variable Mean 0.060 0.060 0.067 0.128 0.038 0.017
Aggressive measure Tax Haven BTD Tax Haven BTDCountry FE 3 3 3 3 3 3
Year FE 3 3 3 3 3 3
Firm controls 3 3 3 3 3
Note: Data from Orbis and the World Management Survey. Tax rate is the statutory corporate tax rate inthe country where a firm is operating. The definition of each management practice is in Table C1. Theoutcome variable in all columns is ROA (returns on assets) which is the ratio of profit and loss beforetaxes and total assets. In columns 3 and 4 aggressive firms are those with tax haven as part of theirownership structure or those with above median book tax difference (BTD) respectively. In columns 5and 6 non-aggressive firms are those without tax havens as part of their ownership structure or thosewith below median book tax difference (BTD) respectively. Firm controls include log of employment, logof fixed assets and log of number of subsidiaries in the MNE. Standard errors are robust in all columns.
51

Figure B3: Mechanisms: Management Practices and Firm Productivity for Aggressive and Non-aggressive Firms.
Q1: Lean adoption x Tax Rate Q2: Rationale for Lean x Tax Rate
Q1: Process Doc x Tax Rate Q2: Perf tracking x Tax Rate
Q3: Perf review x Tax Rate Q4: Perf dialogue x Tax Rate
Q5: Consequence mgmt x Tax Rate Q1: Type of targets x Tax Rate Q2: Interconnection x Tax Rate
Q3: Time horizon x Tax Rate Q4: Stretch goals x Tax Rate
Q5: Clarity of goals x Tax Rate Q1: Talent recruitment x Tax Rate
Q2: Rewarding perf x Tax Rate Q3: Addressing underperf x Tax Rate
Q4: Promotions x Tax Rate Q5: Distinctive workplace x Tax Rate
Q6: Talent retention x Tax Rate
-2 -1 0 1 2
AggressiveLe
anM
onito
ring
Targ
ets
Peop
le
-2 -1 0 1 2
Non-Aggressive
Note: Data from the World Management Survey and Orbis. This figure plots the interaction coefficients from a regression of performance(log of sales per employee) on each of the 18 individual management topics, subsidiary corporate tax rates and controls for firm size (log offixed assets, log of employment, log of number of subsidiaries) as well as year and industry fixed effects. We classify firms as “aggressive” ifthey have a subsidiary in a tax haven. Darker color markers indicate statistically significant coefficients (at the 5 percent level), and lightgray markers indicate coefficients that are not significantly different from zero (at the 5 percent level).
52

Table B6: Table of Coefficients: Interaction Between Individual Management Practices andTax Rate.
All Aggressive Non-Aggressive
ln(sales per employee) ln(sales per employee) ln(sales per employee)(1) (2) (3) (4) (5) (6)
Z-Index: Lean ops × Tax Rate 0.749*** 0.547*** 0.663*** -0.101 -0.248 1.240***(0.216) (0.170) (0.194) (0.217) (0.299) (0.261)
Q1: Lean adoption × Tax Rate 0.560*** 0.480*** 0.577*** -0.080 -0.117 1.129***(0.206) (0.162) (0.186) (0.214) (0.278) (0.236)
Q2: Rationale for Lean × Tax Rate 0.762*** 0.480*** 0.616*** -0.101 -0.264 1.055***(0.202) (0.161) (0.185) (0.200) (0.275) (0.257)
Z-Index: Monitoring × Tax Rate 0.373* 0.493*** 0.492** 0.113 -0.392 0.794***(0.216) (0.178) (0.207) (0.229) (0.269) (0.261)
Q1: Process Doc × Tax Rate 0.182 0.418** 0.230 0.017 0.520** 0.742***(0.201) (0.167) (0.198) (0.227) (0.251) (0.234)
Q2: Perf tracking × Tax Rate 0.737*** 0.854*** 0.764*** 0.267 0.749*** 1.139***(0.208) (0.169) (0.197) (0.208) (0.278) (0.249)
Q3: Perf review × Tax Rate 0.075 0.164 0.184 -0.162 -0.565** 0.580**(0.210) (0.170) (0.200) (0.211) (0.281) (0.251)
Q4: Perf dialogue × Tax Rate 0.504** 0.476** 0.769*** 0.249 -0.996*** 0.681**(0.240) (0.195) (0.238) (0.233) (0.254) (0.307)
Q5: Consequence mgmt × Tax Rate -0.101 -0.029 0.023 0.010 -0.883*** -0.042(0.193) (0.157) (0.182) (0.206) (0.328) (0.221)
Z-Index: Targets × Tax Rate 0.804*** 0.652*** 0.638*** 0.262 0.224 1.165***(0.245) (0.203) (0.238) (0.244) (0.301) (0.310)
Q1: Type of targets × Tax Rate 0.922*** 0.582*** 0.702*** 0.191 -0.137 0.845***(0.188) (0.153) (0.171) (0.208) (0.296) (0.210)
Q2: Interconnection × Tax Rate 0.757*** 0.571*** 0.502** 0.282 0.104 0.963***(0.208) (0.169) (0.202) (0.216) (0.234) (0.243)
Q3: Time horizon × Tax Rate 0.553*** 0.429** 0.487** 0.151 -0.180 0.830***(0.203) (0.168) (0.193) (0.213) (0.274) (0.252)
Q4: Stretch goals × Tax Rate -0.266 0.183 0.001 0.230 0.425 0.321(0.257) (0.216) (0.266) (0.242) (0.294) (0.350)
Q5: Clarity of goals × Tax Rate -0.021 -0.118 -0.112 -0.315 -0.128 0.141(0.192) (0.155) (0.179) (0.206) (0.298) (0.219)
Observations 15601 15601 11394 6600 4207 8275# firms 1757 1757 1246 1494 511 1570Dependent Variable Mean 12.370 12.370 12.400 12.416 12.288 12.377
Aggressive measure Tax Haven BTD Tax Haven BTDCountry FE 3 3 3 3 3 3
Year FE 3 3 3 3 3 3
Firm controls 3 3 3 3 3
Note: Data from Orbis and the World Management Survey. Tax rate is the statutory corporate tax rate inthe country where a firm is operating. The definition of each management practice is in Table C1. Theoutcome variable in all columns is ROA (returns on assets) which is the ratio of profit and loss beforetaxes and total assets. In columns 3 and 4 aggressive firms are those with tax haven as part of theirownership structure or those with above median book tax difference (BTD) respectively. In columns 5and 6 non-aggressive firms are those without tax havens as part of their ownership structure or thosewith below median book tax difference (BTD) respectively. Firm controls include log of employment, logof fixed assets and log of number of subsidiaries in the MNE. Standard errors are robust in all columns.
53

Table B7: Table of Coefficients: Interaction Between Individual Management Practices andTax Rate.
All Aggressive Non-Aggressive
ln(sales per employee) ln(sales per employee) ln(sales per employee)(1) (2) (3) (4) (5) (6)
Z-Index: People × Tax Rate -0.074 0.133 0.167 -0.085 -0.637** 0.447*(0.196) (0.160) (0.188) (0.214) (0.260) (0.231)
Q1: Talent recruitment × Tax Rate 0.058 0.080 0.178 -0.111 -0.662** 0.488**(0.201) (0.159) (0.183) (0.205) (0.303) (0.222)
Q2: Rewarding perf × Tax Rate -0.190 -0.190 -0.142 -0.613*** -0.478* 0.035(0.182) (0.154) (0.185) (0.204) (0.284) (0.204)
Q3: Addressing underperf × Tax Rate 0.107 -0.019 -0.033 0.294 -0.637** -0.414**(0.175) (0.144) (0.167) (0.189) (0.251) (0.205)
Q4: Promotions × Tax Rate -0.318* -0.125 -0.033 -0.380* -0.678*** 0.185(0.185) (0.153) (0.181) (0.202) (0.259) (0.218)
Q5: Distinctive workplace × Tax Rate -0.400* -0.020 -0.017 -0.152 -0.665** 0.553**(0.216) (0.169) (0.197) (0.224) (0.291) (0.241)
Q6: Talent retention × Tax Rate 0.047 0.488*** 0.385** 0.181 0.987*** 0.682***(0.186) (0.152) (0.170) (0.193) (0.367) (0.212)
Observations 15597 15597 11398 6591 4199 8277# firms 1757 1757 1247 1493 510 1570Dependent Variable Mean 12.369 12.369 12.400 12.415 12.287 12.377
Bonus size × Tax Rate 1.677 0.929 0.800 -0.314 0.128 3.041**(1.468) (0.960) (1.037) (1.310) (2.341) (1.391)
Bonus share: sub perf × Tax Rate -3.783*** -3.068*** -3.802*** -0.170 -2.930 -3.068**(1.168) (0.995) (1.154) (1.570) (2.800) (1.259)
Bonus share: MNE perf × Tax Rate -0.986 -1.055* -2.258*** -1.329* 1.650 0.328(0.755) (0.592) (0.726) (0.733) (1.073) (0.978)
Observations 7803 7803 5813 3327 1990 4021# firms 877 877 638 751 239 780Dependent Variable Mean 12.336 12.336 12.349 12.393 12.298 12.347
Aggressive measure Tax Haven BTD Tax Haven BTDCountry FE 3 3 3 3 3 3
Year FE 3 3 3 3 3 3
Firm controls 3 3 3 3 3
Note: Data from Orbis and the World Management Survey. Tax rate is the statutory corporate tax rate inthe country where a firm is operating. The definition of each management practice is in Table C1. Theoutcome variable in all columns is ROA (returns on assets) which is the ratio of profit and loss beforetaxes and total assets. In columns 3 and 4 aggressive firms are those with tax haven as part of theirownership structure or those with above median book tax difference (BTD) respectively. In columns 5and 6 non-aggressive firms are those without tax havens as part of their ownership structure or thosewith below median book tax difference (BTD) respectively. Firm controls include log of employment, logof fixed assets and log of number of subsidiaries in the MNE. Standard errors are robust in all columns.
54
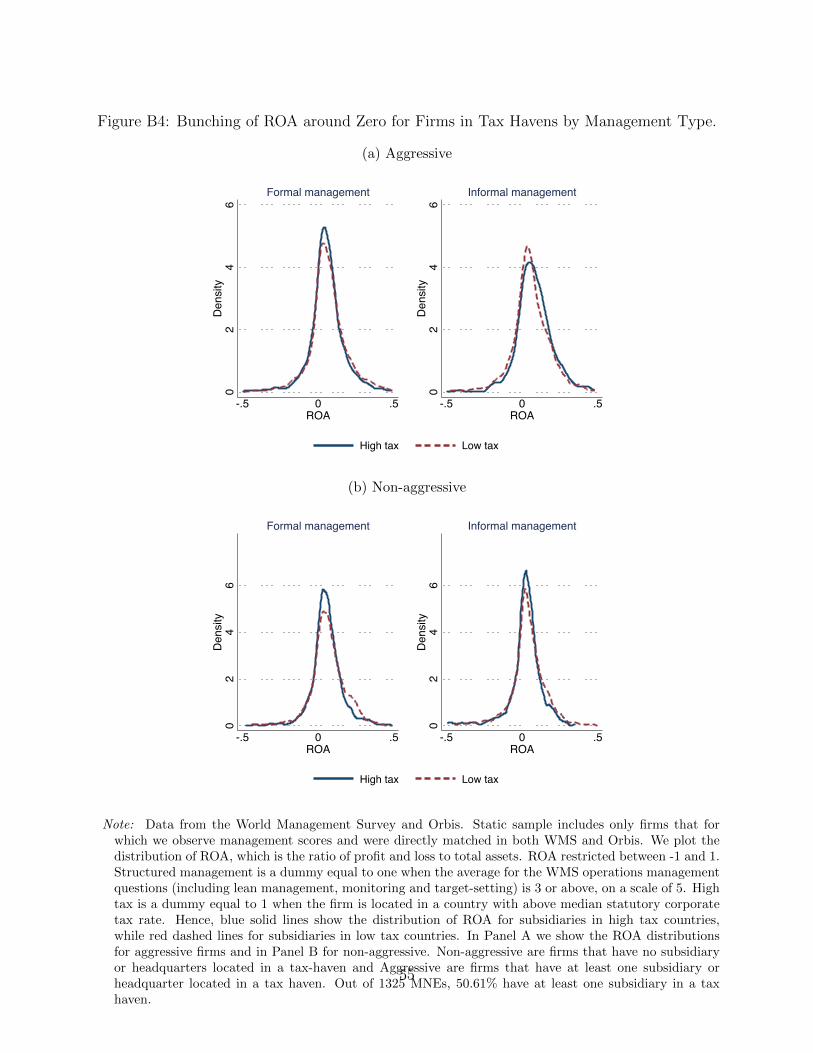
Figure B4: Bunching of ROA around Zero for Firms in Tax Havens by Management Type.
(a) Aggressive
02
46
Dens
ity
-.5 0 .5ROA
Formal management
02
46
Dens
ity-.5 0 .5
ROA
Informal management
High tax Low tax
(b) Non-aggressive
02
46
Dens
ity
-.5 0 .5ROA
Formal management
02
46
Dens
ity
-.5 0 .5ROA
Informal management
High tax Low tax
Note: Data from the World Management Survey and Orbis. Static sample includes only firms that forwhich we observe management scores and were directly matched in both WMS and Orbis. We plot thedistribution of ROA, which is the ratio of profit and loss to total assets. ROA restricted between -1 and 1.Structured management is a dummy equal to one when the average for the WMS operations managementquestions (including lean management, monitoring and target-setting) is 3 or above, on a scale of 5. Hightax is a dummy equal to 1 when the firm is located in a country with above median statutory corporatetax rate. Hence, blue solid lines show the distribution of ROA for subsidiaries in high tax countries,while red dashed lines for subsidiaries in low tax countries. In Panel A we show the ROA distributionsfor aggressive firms and in Panel B for non-aggressive. Non-aggressive are firms that have no subsidiaryor headquarters located in a tax-haven and Aggressive are firms that have at least one subsidiary orheadquarter located in a tax haven. Out of 1325 MNEs, 50.61% have at least one subsidiary in a taxhaven.
55

Figure B5: Sample Coverage Maps.
(a) Countries with at least one firm in the WMS sample
(b) Countries with at least one firm in the Event Study sample
56

Figure B6: Event Study Sensitivity Analysis.
-.04
-.02
0.0
2.0
4.0
6
ROA
(rela
tive
to p
re-ta
x ch
ange
per
iod,
t=-1
)
t=-3 t=-2 t=-1 t=0 t=+1 t=+2 t=+3
Balanced panel Multiple tax changes Size tax change
Note: Data from the World Management Survey and Orbis. In this figure we plot yearly coefficients fromevent study estimation of the difference between formal and informal management firms. Darker barswith diamond markers correspond to the event study run only on the observations belonging to a balancedpanel. Mid-dark bars with square uses a sample that includes multiple tax changes. Lighter bars withcircle markers include controls for the size of the tax change.
57

C Data Appendix: Index questions
58

Table C1: World Management Survey Questions: Operations management
Q Question topic Explanation of scoring
O1 Adoption of modern practices(Lean operations sub-index)
What aspects of manufacturing have been formally in-troduced, including just-in-time delivery from suppliers,automation, flexible manpower, support systems, atti-tudes, and behavior?
O2 Rationale for adoption(Lean operations sub-index)
Were modern manufacturing techniques adopted just be-cause others were using them, or are they linked to meet-ing business objectives like reducing costs and improvingquality?
O3 Process problemdocumentation (Monitoringsub-index)
Are process improvements made only when problemsarise, or are they actively sought out for continuous im-provement as part of normal business processes?
O4 Performance tracking(Monitoring sub-index)
Is tracking ad hoc and incomplete, or is performancecontinually tracked and communicated to all staff?
O5 Performance review(Monitoring sub-index)
Is performance reviewed infrequently and only on a suc-cess/failure scale, or is performance reviewed continuallywith an expectation of continuous improvement?
O6 Performance dialogue(Monitoring sub-index)
In review/performance conversations, to what extent arethe purpose, data, agenda, and follow-up steps (likecoaching) clear to all parties?
O7 Consequence management(Monitoring sub-index)
To what extent does failure to achieve agreed objectivescarry consequences, which can include retraining or re-assignment to other jobs?
O8 Target balance(Target setting sub-index)
Are the goals exclusively financial, or is there a balanceof financial and non-financial targets?
O9 Target interconnection(Target setting sub-index)
Are goals based on accounting value, or are they based onshareholder value in a way that works through businessunits and ultimately is connected to individual perfor-mance expectations?
O10 Target time horizon(Target setting sub-index)
Does top management focus mainly on the short term,or does it visualize short-term targets as a “staircase”toward the main focus on long-term goals?
O11 Target stretching(Target setting sub-index)
Are goals too easy to achieve, especially for some “pro-tected/special” areas of the firm, or are goals demandingbut attainable for all parts of the firm?
O12 Performance clarity(Target setting sub-index)
Are performance measures ill-defined, poorly under-stood, and private, or are they well-defined, clearly com-municated, and made public?
Notes: Table contents from Scur et al. (2021). The Q column refers to the question numbers as we have defined the indicesin this paper (operations and people management). The main difference between our categorization and the WMS is that webundle the operations sub-practices into one, so we can effectively compare people and non-people practices. The last columnincludes a more detailed explanation of the types of follow-up questions that are asked of the manager to garner the informationrequired for scoring.
59

Table C2: World Management Survey Questions: People management
Q Question topic Explanation of scoring
P1 Managing human capital(People managementsub-index, survey Q13)
To what extent are senior managers evaluated and heldaccountable for attracting, retaining, and developing tal-ent throughout the organization?
P2 Rewarding high performance(People managementsub-index, survey Q14)
To what extent are people in the firm rewarded equallyirrespective of performance level, or is performanceclearly related to accountability and rewards?
P3 Fixing poor performers(People managementsub-index, survey Q15)
Are poor performers rarely removed, or are they re-trained and/or moved into different roles or out of thecompany as soon as the weakness is identified?
P4 Promoting high performers(People managementsub-index, survey Q16)
Are people promoted mainly on the basis of tenure, ordoes the firm actively identify, develop, and promote itstop performers?
P5 Attracting human capital(People managementsub-index, survey Q17)
Do competitors offer stronger reasons for talented peopleto join their companies, or does a firm provide a widerange of reasons to encourage talented people to join?
P6 Retaining human capital(People managementsub-index, survey Q18)
Does the firm do relatively little to retain top talent, ordoes it do whatever it takes to retain top talent whenthey look likely to leave?
B1 What is a manager’s bonus asa percentage of salary?
A value between 0 and 1.
B2 What is the % of the bonusthat is based on individualperformance?
A value between 0 and 1.
B3 What is the % of the bonusthat is based on companyperformance?
A value between 0 and 1.
DC Decentralization Where are decisions taken on new product introduc-tions—at the plant, at the CHQ or both? How muchof sales and marketing is carried out at the plant level(rather than at the CHQ)? Score 1: All decisions aretaken at HQ. Score 3: Decisions are jointly determined.Score 5: All decisions are taken at the plant level. De-centralization score is the average of the two questions.
Notes: Table contents from Scur et al. (2021). The Q column refers to the question numbers as we havedefined the indices in this paper (operations and people management). The main difference between ourcategorization and the WMS is that we bundle the operations sub-practices into one, so we can effectivelycompare people and non-people practices. The last column includes a more detailed explanation of the typesof follow-up questions that are asked of the manager to garner the information required for scoring.
60

CENTRE FOR ECONOMIC PERFORMANCE Recent Discussion Papers
1794 Monica Langella Alan Manning
Income and the desire to migrate
1793 Nicholas Bloom Arjun Ramani
The donut effect of Covid-19 on cities
1792 Brian Bell Nicholas Bloom Jack Blundell
This time is not so different: income dynamics during the Covid-19 recession
1791 Emanuel Ornelas Patricia Tovar
Intra-bloc tariffs and preferential margins in trade agreements
1790 Jose Maria Barrero Nicholas Bloom Steven J. Davis
Why working from home will stick
1789 Scott R. Baker Nicholas Bloom Steven J. Davis Marco Sammon
What triggers stock market jumps?
1788 Nicolas Bloom Robert S. Fletcher Ethan Yeh
The impact of Covid-19 on US firms
1787 Philippe Aghion Antonin Bergeaud Matthieu Lequien Marc J. Melitz Thomas Zuber
Opposing firm-level responses to the China shock: horizontal competition versus vertical relationships
1786 Elsa Leromain Gonzague Vannoorenberghe
Voting under threat: evidence from the 2020 French local elections
1785 Benny Kleinman Ernest Liu Stephen J. Redding
Dynamic spatial general equilibrium

1784 Antonin Bergeaud Clément Malgouyres Clément Mazet-Sonilhac Sara Signorelli
Technological change and domestic outsourcing
1783 Facundo Albornoz Irene Brambilla Emanuel Ornelas
Firm export responses to tariff hikes
1782 Gabriel M. Ahlfeldt Stephan Heblich Tobias Seidel
Micro-geographic property price and rent indices
1781 Ria Ivandić Tom Kirchmaier Neus Torres-Blas
Football, alcohol and domestic abuse
1780 Monica Langella Alan Manning
The measure of monopsony
1779 Holger Breinlich Elsa Leromain Dennis Novy Thomas Sampson
Import liberalization as export destruction? Evidence from the United States
1778 Andrew E. Clark Conchita D’Ambrosio Anthony Lepinteur
Marriage as insurance: job protection and job insecurity in France
1777 Marc J. Melitz Stephen J. Redding
Trade and innovation
1776 Holger Breinlich Valentina Corradi Nadia Rocha Michele Ruta J.M.C. Santos Silva Tom Zylkin
Machine learning in international trade research – evaluating the impact of trade agreements
1775 Giuseppe Berlingieri Luca Marcolin Emanuel Ornelas
Service offshoring and export experience
The Centre for Economic Performance Publications Unit Tel: +44 (0)20 7955 7673 Email [email protected]


![Base Erosion and Profit Shifting [BEPS] Analysis and India ... · PDF fileBase Erosion and Profit Shifting [BEPS] Analysis and India perspective 2017](https://static.fdocuments.us/doc/165x107/5aba58ca7f8b9a24028b629f/base-erosion-and-profit-shifting-beps-analysis-and-india-erosion-and-profit.jpg)