Organization of Aab Petroleum Exporting Countries (OAPEC)s3.amazonaws.com/zanran_storage/ ·...
267
Transcript of Organization of Aab Petroleum Exporting Countries (OAPEC)s3.amazonaws.com/zanran_storage/ ·...


Organization of Aab Petroleum Exporting Countries (OAPEC)
The Secretary General’s 35th Annual Report
A.H. 1428-1429 / A.D. 2008

All rights reserved. The Organization of Arab Petroleum Exporting Countries (OAPEC), 2008
OAPEC
P.O.Box 20501 SAFAT, 13066 Kuwait
State of Kuwait,
Tel: (00965) 495000 Fax: (00965) 4959755
Email: [email protected] & [email protected]
Website: http://www.oapecorg.oro
______________________________________________________________________________
THE MINISTERIAL COUNCIL
H.E. Dr. Chakib Khelil People’s Democratic Republic of Algeria
H.E. Abdul Hussein bin Ali Mirza Kingdom of Bahrain
H.E. Eng. Samih Samir Fahmy Arab Republic of Egypt
H.E. Dr.Hussein Al-Shahrastani Republic of Iraq
H.E. Eng. Mohammad Abdullah Al-Ulaim State of Kuwait
H.E. Dr. Shokri Mohammad Ghanim Great Socialist People’s
Libyan Arab Jamahiriyah H.E. Abdullah bin Hamad Al-Attiyah State of Qatar
H.E. Eng. Ali bin Ibrahim Al-Naimi Kingdom of Saudi Arabia
H.E. Eng. Sufian Al-Alaw Syrian Arab Republic H.E. Mohammad Bin Zaen Al-Hamly United Arab Emirates

______________________________________________________________________________
THE EXECUTIVE BUREAU
Mr. Mohamed Ras Al Kaf People’s Democratic Republic of Algeria
Mr. Ali Abdul Jabar Al-Sawad Kingdom of Bahrain
Mr. Ahmad Saeed Al Ashmawi Arab Republic of Egypt
Mr. Abdul Sahib Salman Qutob Republic of Iraq
Eng. Adel Abdul Aziz Al-Jasim State of Kuwait Mr. Fathi Mohammed El-Abbar Great Socialist People’s
Libyan Arab Jamahiriyah Mr. Salem Buti Al-Naimi State of Qatar
Mr. Nasser Bin Ibrahim Al-Fouzan(1) Kingdom of Saudi Arabia Dr. Hassan Zainub Syrian Arab Republic
Mr. Nasser Mohammed Al-Sharhan United Arab Emirates
_____________________________________________________

______________________________________________________________________________
THE JUDICIAL TRIBUNAL
Dr. Moustafa Abdul Hayy Al-Sayed President
Shaikh Abdul Rahman bin Jaber Al Khalifa
Vice-President
Mr. Jawad Omar Al-Sakka Member
Dr. Nabil Abdullah El-Araby Member
Mr. Khalifa Daalouj Al-Kobaissi Member

______________________________________________________________________________
THE GENERAL SECRETARIAT
Mr. Abdul Aziz A. Al-Turki(1) Secretary General
The Arab Center for Energy Studies
Dr. Mohammed Mukhtar Al-Lababidi Director of the Technical Affairs Department
Dr. Jamil Mohammed Tahir Director of the Economics Department
Mr. Aissa Siouda Acting Supervisor of the Information and Library Department
_____________________________
Director of the Finance and Administrative Affairs Department*
* The Finance and Administrative Affairs
Department is currently under the supervision of the Secretary General
____________________________________________________

Contents
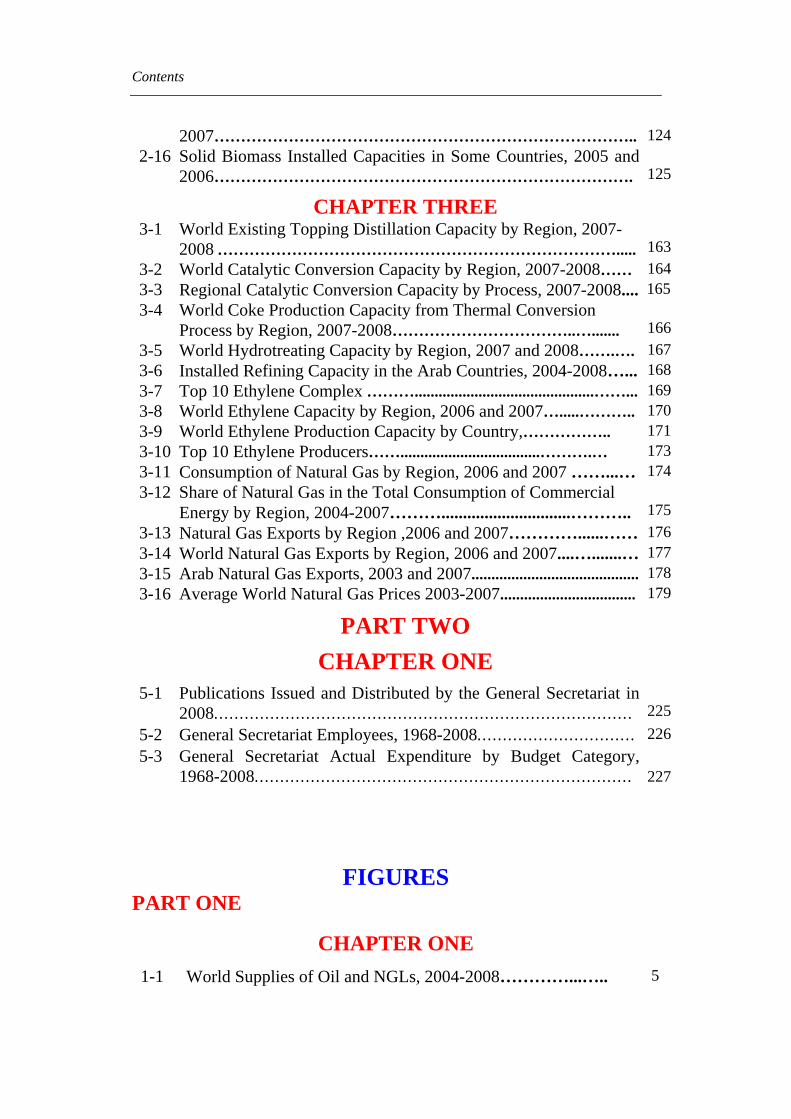
CONTENTS PREFACE ................................................................................................................ 1
PART ONE
INTERNATIONAL DEVELOPMENTS IN OIL AND ENERGY
CHAPTER ONE: DEVELOPMENTS IN GLOBAL MARKETS AND THEIR IMPACT ON OAPEC MEMBER COUNTRIES
Foreword…… ….… .. …………………….…...……………………………………… 3 I. Major Developments in the World Oil Market in 2008And Related
Factors …………………………………………………………………….……4
1. Supplies………………..…………………….……………..……………….. 4 1-1 OPEC Supplies………….…………………………………………. 5 1-2 Non-OPEC Supplies……………..………………………………….. 7 2. World Oil Demand…………………..………………………...………….. 7 2-1 OECD Countries…………………….…………………………..…… .…. 11 2-2 Developing Countries…………………..…..…..………………….….... 12 2-3 Countries in Transition……………………...……………………… 12 3. Price Trends …... ….… …..……... …..… .. .…………….…..….………… 13 3-1 Crude Oil Prices…………………………………………………… 13
3-2 Spot Prices for Oil Products………………………………...……… 14 3-2-1 Premium Gasoline Prices …………………………………………. 15 3-2-2 Gasoil /Diesel Prices……………………...…………………… 16 3-2-3 Fuel Oil Prices……………………………………………………… 16 3-3 Oil Freight Prices………………………..……………...……… 16 4. World Oil Inventories…………………………………………… 17 4.1 World Commercial Stocks……………………………………...…… 18 4.2 US Strategic Petroleum Reserve………………...…………...… 18
II. Value of OAPEC Member Countries Petroleum Exports……………. 19 III. Developments in Oil and Energy Consumption in the Arab Countries…...
20 1. Arab Countries……..………………….. ………..….….………………… 20
1-1 Total and Per Capita Energy Consumption……..……...............… 21

Contents
1-2 Energy Consumption by Source…….……............…. …….…….……. 23
1-2-1 Petroleum Products…………………………………………………….. 26
1-2-2 Natural Gas………... ………………..… ………..………………………. 27
1-2-3 Hydroelectricity…………………..…………………… …..….………… 28
1-2-4 Coal……... ……………….…………………… ……… …..….………… .. 28
2. Total Energy Consumption in OAPEC Member Countries.. ………. 29
2-1 Total and Per Capita Energy Consumption………………….. 29
2-2 Energy Consumption by Source…………………….…………… 30
2-2-1 Petroleum Products. ……….……… . ………………..… ………. .……… 31
2-2-2 Natural Gas ……………..… . ……….……… ………. ………………..…. 32
2-2-3 Hydroelectricity and Coal………… ……... .. .……………………….. 33 3. Final Energy Consumption in Arab Countries……...………………… 34
3-1 Final Energy Consumption by Source...…………………….……… 34
3-1-1 Final Consumption of Petroleum Products….………………………... 34
3-1-2 Final Consumption of Natural Gas………….…………….………… 35
3-1-3 Final Consumption of Electricity………..…………………….…….. 35
3-2 Final Energy Consumption by Sector ..........… ..……………………. 35
3-2-1 Energy Consumption in the Industrial Sector……………….…..……. 36
3-2-2 Energy Consumption in the Transport Sector……………………… 36
3-2-3 Energy Consumption in Other Sectors of the Economy………….….. 36
4. Local Prices………………………………………………….……………... 37
CHAPTER TWO: ARAB AND WORLD DEVELOPMENTS IN
THE EXPLORATION, RESERVES AND PRODUCTION OF ENERGY RESOURCES
I. Oil and Gas……. .……… .………… …………………….…………….……… 69
1. Exploration and Production: An Overview…….. .……… … ….……… 69
1-1 Seismic Surveys……..... ……….………….……………………… …….... 74
1-2 Exploratory and Developmental Drilling………….............................. 75
2. Oil and Natural Gas Reserves………..... ……………….………. .……… 78
2-1 Oil Reserves………..…………….. ……….……………… ………………. 78

Contents
2-1-1 OAPEC Members and Other Arab Countries............................................. 78
2-1-2 OPEC Countries………………………………………...………………… 79
2-1-3 North Sea………………………………………………………………….. 80
2-1-4 North America……………...……………………………………………... 80
2-1-5 CIS and China…………………...………………………………………... 80
2-1-6 Brazil………………...………………………….………………………... 80
2-1-7 Rest of the World…………………………………………………...……… 80
2-2 Natural Gas Reserves……………………………..………………...…. 81
2-2-1 OAPEC Members and Other Arab Countries……………..…………….. 81
2-2-2 OPEC Countries…………………………………………..……………... 82
2-2-3 North Sea…………………………………….…………………………... 82
2-2-4 North America………….……………………………………………… 83
2-2-5 CIS and China............................................................................................ 83
2-2-6 Brazil......................................................................................................... 83
2-2-7 Rest of the World....................................................................................... 83
3. Hydrocarbon Liquids and Natural Gas Production…...……. …… ….. 83
3-1 Hydrocarbon Liquids Production…… .…… …...…………... …….……… 83
3-1-1 Oil Production…………..………………………………..……………….. 83
3-1-1-1 OAPEC Members and Other Arab Countries ………………………….. 84
3-1-1-2 OPEC Countries………………………………………………………… 86
3-1-1-3 North Sea………………………………………………………………... 86
3-1-1-4 North America………………………………...………………………… 86
3-1-1-5 CIS and China………………………………...………………………… 86
3-1-1-6 Brazil……………………………………………………………………. 87
3-1-1-7 Rest of the World ………………………………………….……………. 87
3-1-2 NGL Production in OAPEC Members and the World……………..… 87
3-2 Marketed Natural Gas ………………………………………….…………. 87 3-2-1 OAPEC Members and Other Arab Countries…………………………….. 87 3-2-2 OPEC Countries………………………………………...………………… 88 3-2-3 North Sea…………………………………………………...……………... 89 3-2-4 North America………………………………………………...…………... 89 3-2-5 CIS and China………………………………………….………...……….. 89

Contents
3-2-6 Rest of the World…………………………………………………...……... 90
II. Coal ………..……… …….. ……………………………….…………….……… 90
III. Nuclear Energy………………………..…….. ………….….………….……… 92
IV. Renewable Energy Sources .........… . …..… ……….. ……….… .. …….……… 93
1. Hydropower... ….…..… ……...……. ……….……………… …. ………….. 95
1-1 Hydropower in the World……………….………………………………… 95
1-2 Hydropower in the Arab Countries……...…………………………..…… 96
2. Wind Power ..……... .……………………....…..................….…………… 96 2-1 Wind Power in the World………………..………………………………… 96 2-2 Wind Power in the Arab Countries……..…………...…………………. 97 3. Solar Power ..................................................... …….…………………..…. 99
3-1 Solar Power in the World………………………..……….……………... 99
3-2 Solar Power in the Arab Countries……………………..………………… 99
4. Geothermal Power.…………. ………….… .. ………….………… …..… 100
4-1 Geothermal Power in the World……………..……………………...…….. 100
4-2 Geothermal Power in the Arab Countries ……………………..……..…. 101
5. Solid Biomass Energy………………………………………………… 101
5.1 Solid Biomass Energy in the World …………………...……… 101
5.2 Solid Biomass Energy in the Arab Countries …………………….. 102
6. Ocean and Tidal Power………………………………………………. 102
CHAPTER THREE: ARAB AND WORLD DEVELOPMENTS IN PETROLEUM DOWNSTREAM INDUSTRIES
I. Refining Industry………………………………….. .….…………….……… .. 127
1. World Developments .………………… ……..………….. ……….……… .. 127 2. Developments in Arab Countries………… ……..……..………….……. 133
II. Petrochemical Industries ……..………… ……... ….… . …………….……… .. 138
1. World Developments .……… ...………….. ……………………….…… ..… 138

Contents
2. Arab Developments………….….……………………………….. .……… . 141 2-1 Egypt………………….………………..……………………………… 141 2-2 Kuwait……………………………………………………………….. 141 2-3 Qatar………...……………………………………………………… 142 2-4 Saudi Arabia………………………………………………………... 142 2-5 UAE…………………………………………………………………... 144 III. Natural Gas Consumption, Trade and Processing………….. …. .………. 145
1. World Developments .… ……..…….. …………………………….……… .. 145 1-1 Natural Gas Consumption……………..………….. …… ...……….……. 145
1-2 Natural Gas Trade………….………………………………….……..……. 147 2. Arab Developments…………………..…………... ……………….……… . 150 2-1 Algeria………………………………………………………………… 150 2-2 Bahrain……………………………………………………………… 151 2-3 Egypt……………………….……………………………………….. 151 2-4 Iraq………………………………………………………………….. 152 2-5 Kuwait……………………………………………...………………… 153 2-6 Libya……………………...……..………………………………….. 153 2-7 Oman………………..………………………………………………... 153 2-8 Qatar………………………………………...…………………...….. 154 2-9 Saudi Arabia……………………………………………….………... 155 2-10 Syria…………………………………………..…………………………… 155 2-11 Tunisia…………….…….………………..……………………………… 156 2-12 UAE…………………...….………………..……………………………… 156 2-13 Yemen…………...….……………………………………….………..…… 156 3. World’s Most Important Gas Activities………….………….………… 156
PART TWO OAPEC ACTIVITIES IN 2008
CHAPTER ONE: THE MINISTERIAL COUNCIL AND THE EXECUTIVE BUREAU
I. The Ministerial Council….. ….……………….………… ……... …….……… 181 II. The Executive Bureau ……...……………….……….…… ……..... ….……… 181
CHAPTER TWO: THE GENERAL SECRETARIAT I. The Data Bank and Related Activities ……. . ……...…… ……… …….…… 182

Contents
1. Data Bank …….…… ……………………… …..…… .. ..………….…… .… 182 1-1 Monitoring Development of the Data Bank………………………… 182
1-2 Reports and Papers……………………………...………………….. 182 1-3 Other Activities…………………………………………………... 183
2. Information and Library Services …….………… ……...…………….. 183
2-1 Bibliographical Services……………………………………………. 183
2-2 Indexing and Classification………………………………………… 184
2-3Acquisition…………………………...…………………………. 184
2-4 Current Awareness and Lending……………………………………….. 184 3. Studies, Papers, and Reports …….…………… …….... …….…… .…
3-1 Study on the “Features of Some Developments in the Ptroleum-Drilling Domain …………………………………………………
185
3-2 Study on “Options for Refining to Refine HeavyCrudes”…………..…………………………………………………
185
3-3 Paper Entitled “Natural Gas Supply and Demand Outlook to2017”……………….…………………………………………………
186
3-4 Paper Entitled “The Current and Future Role of Improved Productionof Petroleum in the Arab Countries…………………………...….…
186
3-5 Paper Entitled “Investments in OAPEC Member Countries RefiningIndustry” ……….……..…………………………………………..
187
3-6 Paper Entitled “ The Petrochemical Industry and its Status in the ArabCountries”………..………………………..……………………..
187
3-7 Paper Entitled “Transportation of Natural Gas and its Uses in theArab Countries…………………………………………..………….
188
3-8 Paper Entitled ‘Reducing the Environmental Impacts of Oil and GasExploration and Production Activities”…...…………………………….
188
3-9 Paper Entitled: The Petroleum Industry in Reducing ClimateChange………………………………………………………………..…….
189
3-10 Study Entitled “Fluctuations in Exchange Rates of US DollarAgainst Other Major Currencies and Their Imapct in MemberCountries’ Oil Revenues”…………………………………...…………...
190 3-11 Study Entitled ‘Development of Renewable Energy and their
Implications in World Oil Markets and member Countries………….
191 3-12 Study Entitled ‘Development of Oil and Gas Production in Sub-
Sahara” …………………………..………………...………………………
192
Contents
3-13 Study Entitled “Fluctuations in Oil Prices: Factors and Implicationson Member Countries’ Oil Revenues” ………………………………...
193
3-14 Study Entitled “Sources of Energy in the Global Energy Balance:Current Situation and Future Prospects” ………………………………..
194
3-15 Study Entitled “The Global Financial Crisis and its Initial PotentialImpact on the Petroleum Industry in the Arab Counties”……………
195
II. Arab and International Cooperation…………………………………….
1. Seminars and Meetings Organized by General Secretariat……….…. 196 1-1 Seminar on “Natural Gas Industry: Present and Future” ……………….. 196 1-2 15th Coordination Meeting of Environment Experts in OAPEC
Countries ……………………………….……….………………...………
197 1-3 8th Meeting of Working Group on Prospects for Cooperation in
Natural Gas Investment in OAPEC Member Countries ……………
198 1-4 Conference on “Developments in Techniques of Exploration and
Production”……………..……………………………………………
199 2. Conferences, Seminars and Meetings Attended by the General
Secretariat …….… ………………… …..……… ………. …….… . .…………
2-1 Joint Kuwaiti-Japanese Symposium on Fuel Cells Under the Rubric of “Research and Development and Applications of Fuel Cells and Hydrogen Production Technology……………………………….…
200 2-2 14th International Annual Fertilizer Forum and Exhibition…......…..… 201 2-3 10th Mediterranean Petroleum Conference and Exhibition
International Energy Foundation …………………...………….…..
202 2-4 GCC Policy Development Meeting on Clean Fuels and Vehicles…… 202 2-5 Fourth Coordination Meeting of Oil Training Institute Officials in
OAPEC Member Countries………….………………...……..…….
203 2-6 Syrian International Oil and Gas Exhibition SYROIL 2008 ……… 204 2-7 Middle East Gasoline and Diesel Conference 2008………………….. 205 2-8 First Arab Chemical and Petrochemical Industries Forum………… 205 2-9 13th Meeting of the Climate Change Subcommittee……………….. 206 2-10 Extraordinary Session of the Council of Arab Ministers
Responsible for Environment Affairs (CAMRE)…………………...
207 2-11 30th Oxford Seminar………………………...………………….…… 207 2-12 14th Meeting of the Climate Change Subcommittee…….……….… 208 2-13 OPEC’s Coordination Meeting in Preparation for “Cop-14, and
CMP-4” Meetings …………...…………………………….…..…
209 2-14 Forty Meeting of the Executive Office of the Council of Arab
Ministers Responsible for the Environment………………………
210

Contents
2-15 Meeting of the Conference of the Parties (COP-14) and theConference of the Parties Serving as the Meeting of the Parties tothe Kyoto Protocol (CMP-4)………………………………....……
210 2-16 1st Conference on Arab-Sino Cooperation in Energy………..……. 212 2-17 Meeting of WEC Cleaner Fossil Fuels Systems Committee………… 212 2-18 Meeting of 81st Session of Arab Economic and Social Council…… 213 2-19 Experts Meeting and Meeting of Executive Bureau of Council of
Arab Ministers Responsible for Electricity…………..….………….
214 2-20 International Energy Forum Meeting Atheist …………..………….. 214 2-21 orkshop on Energy Poverty in Africa…………..………………… 215 2-22 Meeting of Institutions Participating in the Joint Arab Economic
Report,2008…………………..…………………..…………………
216 2-23 39th Meeting if the Higher Coordination Committee on Joint Arab
Action…………..……………………………………………………
216 2-24 Meeting of Economic and Social Council …………..………….… 217 2-25 Experts Meeting and Meeting of Executive Bureau of Council of
Arab Ministers Responsible for Electricity…………..……………..
217 2-26 2nd IEA Meeting on International Energy Statistics……......……..… 218 2-27 Preliminary Meeting for Preparing the Joint Arab Economic Report,
2009……………………………………….....……………………
219
III. Energy Resources Monitor-Arab and International……………..…… 219
IV. The Promotion of Scientific Research ….…..…………..…… …….....…… 219
VI. Supporting Activities………………………………………………………..... 221
1. Media Activities .…….……… …….…. ……….……………….………… 221
1-1 Editing, Printing, Publishing, and Distribution .…..… ….....….……
1-2 Press and Media…………………. .…… ….. …….……………………
1-3 33rd Arab Book Fair……………….. ….………… ….…..… ..………
221
221
221
2. Administrative and Financial Activities………………... ..…..……… 222 2-1 Evolution of the Administrative Structure…………….…….. ….…
2-2 Evolution of Actual Expenditure …..….…… ……….. …….…….…
222
222
CHAPTER THREE: OAPEC-SPONSORED VENTURES I. The Arab Maritime Petroleum Transport Company (AMPTC)
230
II. The Arab Shipbuilding and Repair Yard Company (ASRY)…............. 232

Contents
III. The Arab Petroleum Investments Corporation (APICORP) .............…. 235
IV. The Arab Petroleum Services Company (APSCO) ...…......... ………… 240
1. Arab Drilling and Workover Company (ADWOC) …........... . …..… 242
2. Arab Well Logging Company (AWLCO)…………………………. 243
3. Arab Geophysical Exploration Services Company (AGESCO) … 245
4. Arab Company for Detergent Chemicals (ARADAT) ………… 246
APPENDICES
I. Press Releases of OAPEC Ministerial Council Meetings in 2008……. 248
1- The 80th Meeting of OAPEC’s Council of Ministers………………... 248
2- The Eighty-First Meeting of OAPEC’s Council of Ministers…… 248
II. Meetings and Seminars Sponsored or Attended by the GeneralSecretariat,2008…………………………………………………………..
250
Contents
TABLES
PART ONE
CHAPTER ONE
1-1 Total & Annual changes in World Oil and NGLs Supply,2004 - 2008............................................................................................... 41
1-2 Growth in the World Economy and Oil Demand by Region, 2004-2008...................................................................................................
42
1-3 World Economic Growth, 2004-2008…………………………………... 43 1-4
Total & Annual Change in World Oil Demand, 2004-2008…....... 44
1-5 World Oil Demand by Region, 2004-2008…………………….. 45 1-6 Total & Annual Change in Oil Demand in OECD Countries,
2004-2008………..……………………………………..……………
46 1-7 Total & Annual Change in Oil Demand in Developing
Countries, 2004-2008……………………………………………..
47 1-8 Total & Annual Change in Oil Demand in Oil Demand in
Countries in Transition, 2004-2008………...…………………….
48 1-9 Spot Price of OPEC Basket of Crudes, 2004-2008………..….…… 49 1-10 Average Spot Prices of the OPEC Basket and Selected Arab
Crudes, 2004-2008…………………………………………………
50 1-11 Nominal and Real Prices of Crude Oil, 1995-2008…………… 51 1-12 Average Monthly Market Spot Prices of Petroleum Products,
2007-2008…………………………………………………………..
52 1-13 Share of Tax in Gasoline Prices in some Industrial
Countries,2007- 2008…………………………………………....
53 1-14 Spot Tanker Freight Rates, 2007-2008…………………………... 54 1-15 OECD Oil Inventories at Quarter End, 2007 & 2008.................... 55 1-16 Value of Oil Exports in OAPEC Member Countries, 2004-2008.. 56 1-17 Value of OAPEC Oil Exports in Current and Real Prices, 1995-
2008………………………………………………..…...…
57 1-18 Energy Consumption in the Arab Countries, 2004-2008………. 58 1-19 Per Capita Energy Consumption in the Arab Countries, 2004 and
2008…………………………………………………….
59
1-21 Energy Consumption in OAPEC Member Countries, 2004-2008. 60 1-22 Energy Consumption in OAPEC Member Countries by Source,

Contents
2004-2008……………………………...………………………… 61 1-22 Petroleum Products' Consumption in OAPEC Member
Countries, 2004-2008 ……………………………………….. 62 1-23 Natural Gas Consumption in OAPEC Member Countries, 2004-
2008…………………………………………………………. 63 1-24 Hydroelectricity Consumption in OAPEC Member Countries,
2004-2008……………………………………………………... 64 1-25 Coal Consumption in OAPEC Member Countries, 2004-2008….. 65 1-26 Relative Distribution of Final Energy Consumption According to
Sources and Sectors in OAPEC Member and Other Arab Countries in 2006…………………………………………… 66
1-27 Domestic Prices of Petroleum Products in OAPEC Member Countries, 2008………………………………………...……… 67
1-28 Domestic Prices of Petroleum Products in OAPEC Member Countries, 2008………………………………………………... 68
CHAPTER TWO
2-1 Seismic Surveys Worldwide, 2004-2008........................................... 105
2-2 Average Number of Active Rigs Worldwide, 2004-2008…………. 106
2-3 Petroleum Discoveries in OAPEC Members and Other Arab Countries, 2004- 2008....................................................................
107
2-4 Arab and World Oil Reserves, 2004-2008………………….…….. 108
2-5 Arab and World Natural Gas Reserves, 2004-2008………………. 110
2-6 Arab and World Hydrocarbon Liquids Production, 2004-2008… 112 2-7 NGL Production in OAPEC Members and Other Arab Countries,
2004-2007…………………………………………………. 114 2-8 Arab and World Marketed Natural Gas, 2004-2007…………. 115 2-9 World Coal Reserves, 2004-2007…………………………. 1172-10 World Coal Production, 2004-2007………………….………. 1182-11 Nuclear Power Reactors in Operation and Under Construction
Worldwide ………………………………………………………... 1192-12 Installed Hydro Power Capacities in Some Countries, 2005 and
2006…………………………………………………………………. 1212-13 Installed Wind Power Capacities in Some Countries 2006,2007…. 1222-14 Cumulative Installed Photovoltaic Power Capacities in Some
Countries, 2006 and 2007………………………………………….
1232-15 Installed Geothermal Capacities in Some Countries, 2006 and
Contents
2007…………………………………………………………………….. 1242-16 Solid Biomass Installed Capacities in Some Countries, 2005 and
2006…………………………………………………………………….
125
CHAPTER THREE 3-1 World Existing Topping Distillation Capacity by Region, 2007-
2008 ………………………………………………………………….....
163 3-2 World Catalytic Conversion Capacity by Region, 2007-2008…… 164 3-3 Regional Catalytic Conversion Capacity by Process, 2007-2008.... 165 3-4 World Coke Production Capacity from Thermal Conversion
Process by Region, 2007-2008……………………………..….......
1663-5 World Hydrotreating Capacity by Region, 2007 and 2008…….…. 1673-6 Installed Refining Capacity in the Arab Countries, 2004-2008…... 1683-7 Top 10 Ethylene Complex ……….............................................……... 1693-8 World Ethylene Capacity by Region, 2006 and 2007….....……….. 1703-9 World Ethylene Production Capacity by Country,…………….. 1713-10 Top 10 Ethylene Producers……...................................……….… 1733-11 Consumption of Natural Gas by Region, 2006 and 2007 ……...… 1743-12 Share of Natural Gas in the Total Consumption of Commercial
Energy by Region, 2004-2007………..............................………..
1753-13 Natural Gas Exports by Region ,2006 and 2007…………......…… 1763-14 World Natural Gas Exports by Region, 2006 and 2007....….......… 1773-15 Arab Natural Gas Exports, 2003 and 2007.......................................... 1783-16 Average World Natural Gas Prices 2003-2007.................................. 179
PART TWO CHAPTER ONE
5-1 Publications Issued and Distributed by the General Secretariat in2008..................................................................................
225
5-2 General Secretariat Employees, 1968-2008............................... 2265-3 General Secretariat Actual Expenditure by Budget Category,
1968-2008..........................................................................
227
FIGURES PART ONE
CHAPTER ONE 1-1 World Supplies of Oil and NGLs, 2004-2008…………...….. 5

Contents
1-2 OPEC Memebers’ Production Quotas Cut Decisions to Avoid Future Price Slide During 2008……………………………………..
6
1-3 Annual Change in World Supplies of Crude Oil and NGL’s,2004-2008……………………………………………………...
7
1-4 World Economic Growth and Demand Growth 2004-2008…….. 8
1-5 World Economic Growth 2007-2008…………………………………. 9
1-6 World Oil Demand, 2004-2008………………………………………. 10 1-7 Distribution of World Oil Demand by Region, 2004-2008……… 10 1-8 OECD Demand for Oil by Region, 2004-2008……………. 11
1-9 Weekly Movement of OPEC Basket of Crudes, 2008………….. 14
1-10 Premium Gasoline Prices, 2007-2008………………………... 15
1-11 Gasoline Prices in some OECD Countries, November 2008………… 16
1-12 US SPR at Quarter End, 2007-2008………………………….. 19 1-13 Monthly Oil Prices and Value of OAPEC Oil Exports January-
December, 2008……………………………………………….
20 1-14 Arab Countries GDP in Current Prices 2003-2007……………………. 21 1-15 Per Capita GDP of Arab Countries in Current Prices, 2003-2007 22 1-16 Energy Consumption in the Arab Countries by Source, 2008………… 24
1-17 Per Capita Energy Consumption in the Arab Countries, 2008….. 25 1-18 Energy Consumption in Arab Countries and the World, 2007… 25 1-19 Breakdown of Petroleum Product Consumption in the Arab
Countries, 2008…………………………………….…………….
26 1-20 Oil Consumption in the Arab Countries and the World, 2007………… 27
1-21 Natural Gas Consumption in the Arab Countries and theWorld,2007…………………………………………………….
28
1-22 Energy Consumption in OAPEC Member Countries, 2004-2008…... 29 1-23 Per Capita Energy Consumption in OAPEC Member
Countries,2008…………………………………………………..
30 1-24 Energy Consumption in OAPEC Member Countries by Source,
2008…………………………………………………………….
31 1-25 Natural Gas Consumption in OAPEC Member Countries and the
World, 2004-2008………………………………………………..
32 1-26 Natural Gas Consumption as a percentage of Total Energy
Consumption in OAPEC Member Countries,2008………………
33 1-27 Relative Distribution of Final Energy Consumption by Source
and Sector in the Arab Countries,2006……………………...
35
Contents
1-28 Relative Distribution of Final Energy Consumption by Sectorand Source in the Arab Countries,2006……………………….
36
CHAPTER TWO
2-1 Seismic Surveying Activity in Different Parts of the World, in 2004-2008…………………………………………………..…………
75
2-2 Active Drilling Rigs Worldwide,2004-2008……….………..…… 76 2-3 Distribution of Active Drilling Rigs Worldwide, 2008………..… 76 2-4 Oil Discoveries in OAPEC Member Countries and Other Arab
Countries, 2004-2008………………………………………..…….…
77 2-5 Gas Discoveries in OAPEC Member Countries and Other Arab
Countries, 2004-2008…………………………………………..…….
77 2-6 World Oil Reserves by International Grouping, End 2008…….… 78 2-7 The Evolution of Oil Reserves in OAPEC and OPEC Member
Countries, 2004-2008…………………………………..…………….
79 2-8 World Natural Gas Reserves, End 2008 ………………………..…. 81 2-9 The Evolution of Natural Gas Reserves in OAPEC and OPEC
Member Countries, 2004-2008……………………………..…….
82 2-10 World Oil Production by International Grouping, 2008............... 84 2-11 Oil Production Rates in OAPEC and OPEC Member Countries,
2004-2008……………………………………………..……….
85 2-12 Marketed Natural Gas by International Grouping, 2007…....…... 88 2-13 Marketed Natural Gas in OAPEC and OPEC Member Countries,
2004-2007..............................................................................................
88 2-14 World Coal Reserves, End 2007………………………...….…. 90 2-15 World Production of Hard Coal, 2007……………...………. 91
CHAPTER THREE
3-1 World Primary Distillation Capacity by Region, End 2008……….. 128
3-2 World Catalytic Conversion Capacity by Region, End 2007.. 128
3-3 World Catalytic Reforming Capacity by Region, End 2007-2008.. 129
3-4 World Catalytic Cracking Capacity by Region, End 2007-2008…. 130
3-5 World Hydrocracking Capacity by Region, End 2007-2008……. 1313-6 World Capacity for producing Coke from Thermal Conversion
Processes by Region, End 2008………………………………....
1323-7 Distribution of Hydrotreating capacity by Region, End 2008…..… 133
Contents
3-8 Evolution of Primary Distillation Capacity in the Arab Countries,2004-2008………...…………………………………………….…....
133
3-9 World Existing Ethylene Production Capacity by Region, End 2007…………….………………………………………………………
138
3-10 Ethylene Operating Rate Worldwide………………………….……… 139 3-11 Distribution of Total Existing Ethylene Capacities, end of 2007… 140 3-12 Natural Gas Exports Worldwide,2007……………………….. 1463-13 Share of Natural Gas in the Total Consumption of Commercial
Energy, 2004-2007……………………………………………
1473-14 Natural Gas Export Worldwide,2007…………………………….. 148 3-15 Natural Gas Export Worldwide, 2006-2007……………………. 149 3-16 Arab Natural Gas Export, 2007…………………………………… 149 3-17 World Prices of Natural Gas, 2003-2007…………………………. 150

PREFACE
This Report is being published at a time when the world is passing through a severe economic crisis that has resulted in a deep recession not witnessed since 1929 and 1933. The repercussions of the financial crisis first took the US financial and banking system by storm at the end of the summer, 2008. Then it moved on to attack other countries, upsetting sectors and industries of the global economy without exception. World petroleum markets (oil and natural gas) were some of the sectors worst affected by the crisis, which shook the world economy to its roots. A sharp drop in oil prices affected the socioeconomic situation in the Arab world, where petroleum constitutes the main source of wealth and the cornerstone of several Arab economies.
World oil prices were severely hit by the global economic crisis, especially in the fourth quarter of 2008. In the second and third quarters they had hit record levels of $147 per barrels (for the West Texas benchmark crude) and over $130/b for the OPEC basket (July 2008), giving an annual average price of $94.1/b, which was the highest annual average since the basket was introduced in 1987. The financial crisis brought these prices crashing down to $38/b in December 2008. World oil supplies, on the other hand, reached an annual average of 86 million b/d, which was unprecedented.
The 35th Secretary General’s Annual Report highlights the efforts of OPEC and OAPEC member countries to mitigate the impact of price fluctuations and restore balance to the petroleum market. They include efforts to activate dialogue and consultation between OPEC and various bodies and organizations representing oil importing countries for the mutual benefit of the two sides. The efforts culminated in the Jeddah Energy Meeting between producers and consumers on 22 June 2008.
On the other hand, the Report reviews the efforts exerted by OAPEC member countries to develop all phases of their oil industries and to implement many projects aimed at promoting sustainable socioeconomic development and using their petroleum export revenues to upgrade their infrastructure and enhance their health and education provision.
The Report provides a detailed analysis of data and statistics about various aspects of the oil and energy industry. Part One reviews international developments in oil and energy, including the fluctuations on global markets and their impact on OAPEC member countries. It also examines the factors affecting the market, whether they be the market

forces of supply, demand, and oil stocks, or those affecting market trends, such as geopolitical issues and energy policies adopted by various political and economic blocs. Moreover, it considers factors with an indirect impact on petroleum, such as the trend adopted by investment and hedge funds of looking for ‘new investment receptacles,’ which boosted activity on futures’ markets and resulted in paper barrels far exceeding actual demand for oil. In the same vein, the Report discusses price trends in 2008 and their impact on OAPEC members’ oil revenues, which fuel their socioeconomic development. It provides an initial indication of the evolution of oil and energy consumption in Arab countries in general, and OAPEC member countries in particular, according to the basic energy sources available (oil, natural gas, coal, and hydroelectricity). Furthermore, it highlights the final consumption of energy by economic sector and summarizes the latest oil price developments in Arab countries.
Part One also considers Arab and international developments in the energy sector, starting with the exploration and production of various energy sources, with a particular focus on oil and gas, and moving on to Arab and international developments in the downstream oil industry (refining and petrochemicals) and the natural gas industry.
Part Two of the Report relates to OAPEC's activities in 2008, ranging from the meetings of the Ministerial Council and Executive Bureau to the studies and reports compiled by the General Secretariat and the seminars and meetings convened by it. As usual, it contains a special section on the achievements of OAPEC-sponsored ventures in the past year, as they sought to benefit from the encouraging climate of high oil and gas prices in the first months of the year and the concomitant rise in demand for petroleum support services. The relative abundance of liquidity helped them to boost their capability and efficiency in their various fields of activity. It also reviews the measures they have taken to deal with the impact of the global financial crisis on their activities.
In conclusion, we hope that this Report illustrates clearly the features, activities and goals of the Organization of Arab Petroleum Exporting Countries and that the reader will find the information he or she seeks.
Secretary General Abbas Ali Naqi

3
PART ONE
INTERNATIONAL DEVELOPMENTS IN OIL AND ENERGY
CHAPTER ONE
DEVELOPMENTS IN GLOBAL MARKETS AND
THEIR IMPACT ON OAPEC MEMBER COUNTRIES
FOREWORD
The year 2008 witnessed the worst financial crisis the world had seen since the 1930s. The crisis, which had begun in August 2007 when the high-risk subPrime mortgage market collapsed in the US, escalated the following year, as the situation in global financial markets had a negative impact on the real economy. Many economies experienced a decline in growth rates in 2008, following several years of strong growth. Many advanced economies even went into or on the brink of recession.
US and European monetary authorities sought to take emergency measures to restore market stability, including the injection of vast amounts of liquidity, swift intervention to save vulnerable financial institutions, providing guarantees for deposits, and enacting legislation in the US for the use of public funds to buy bad debts from the banks. Nevertheless, the measures continue to be surrounded by considerable uncertainty and have not yet proved successful.
The oil market was not immune from developments in the global economy. They had a clear impact on world demand for oil, which began to drop, and on oil prices, which took an unprecedented downward turn.
OPEC countries resorted to new measures they had never used before. On three separate occasions they cut production quotas, the first being in September and the last being in December, making a total cut of 4.2 million b/d in output in 2008, which was the largest cut ever. These measures were taken as part of urgent efforts to stabilize the oil market and stem the slide in crude oil prices, restoring them to levels acceptable to all parties.

Although OPEC countries closely monitored events in the oil market throughout the year, oil prices continued to fluctuate and fell to their lowest level of less than $40 per barrel in December. The slide was reflected in the oil inventory levels of industrial countries, which jumped to their highest level in five years. Moreover, it affected the value of OAPEC members’ oil exports, which are closely linked to price movements and are the mainstay of socioeconomic development.
Chapter One of the Report examines major developments in the oil market, the factors behind them, and their impact on the value of oil exports. It also reviews oil and energy consumption developments in the Arab countries, and OAPEC members in particular.
I. MAJOR DEVELOPMENTS IN THE WORLD OIL MARKET IN 2008 AND RELATED FACTORS
In order to examine the key developments in the oil market in 2008, the following section reviews various aspects of the market, in particular, world oil supplies, world oil demand, price trends for crude oil and major oil products, crude oil freight rates, and changes in international oil inventories, and impact on OAPEC members revenue from oil exports.
1. Supplies
Average oil supplies (crude oil and natural gas liquids) in 2008 rose by 1.4 million b/d, or 1.7%, compared with 2007, rising to 86.0 million b/d, which was the highest annual rate of oil production ever recorded, as shown in Table (1-1) and Figure (1-1).
At the beginning of the first quarter of 2008 world supplies rose about 700,000 b/d above the last quarter of 2007, rising to 86.3 million b/d. Then they rose again in the second quarter by 300,000 b/d to 86.6 million b/d, but in the third and fourth quarters they changed course, falling by about 800,000 b/d and 300,000 b/d, respectively, to 85.5 million b/d at the end of the year.
The global financial crisis clearly affected the oil market, since the increase in world oil supplies witnessed in the first half of 2008, amounting to 1 million b/d more than the last quarter of 2007, was wiped out in the second half of the year, when supplies dropped by 1.1 million b/d from their first half level.
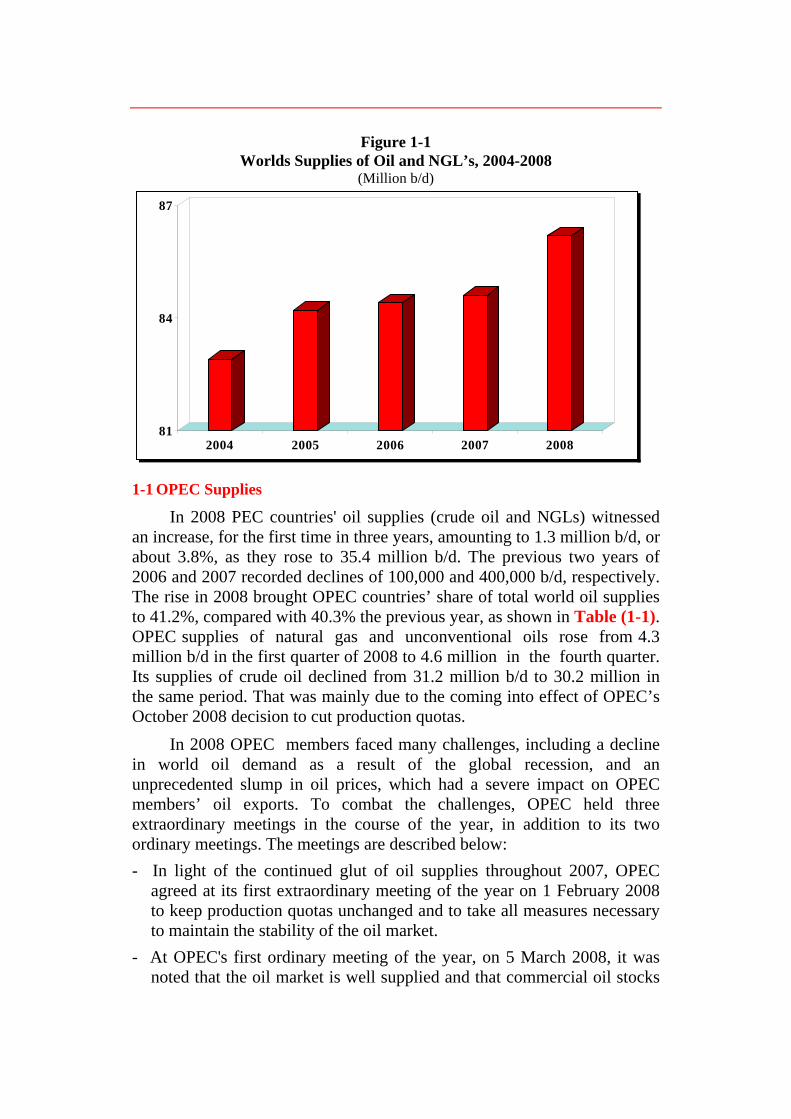
Figure 1-1
Worlds Supplies of Oil and NGL’s, 2004-2008 (Million b/d)
81
84
87
2004 2005 2006 2007 2008
1-1 OPEC Supplies
In 2008 PEC countries' oil supplies (crude oil and NGLs) witnessed an increase, for the first time in three years, amounting to 1.3 million b/d, or about 3.8%, as they rose to 35.4 million b/d. The previous two years of 2006 and 2007 recorded declines of 100,000 and 400,000 b/d, respectively. The rise in 2008 brought OPEC countries’ share of total world oil supplies to 41.2%, compared with 40.3% the previous year, as shown in Table (1-1). OPEC supplies of natural gas and unconventional oils rose from 4.3 million b/d in the first quarter of 2008 to 4.6 million in the fourth quarter. Its supplies of crude oil declined from 31.2 million b/d to 30.2 million in the same period. That was mainly due to the coming into effect of OPEC’s October 2008 decision to cut production quotas.
In 2008 OPEC members faced many challenges, including a decline in world oil demand as a result of the global recession, and an unprecedented slump in oil prices, which had a severe impact on OPEC members’ oil exports. To combat the challenges, OPEC held three extraordinary meetings in the course of the year, in addition to its two ordinary meetings. The meetings are described below: - In light of the continued glut of oil supplies throughout 2007, OPEC
agreed at its first extraordinary meeting of the year on 1 February 2008 to keep production quotas unchanged and to take all measures necessary to maintain the stability of the oil market.
- At OPEC's first ordinary meeting of the year, on 5 March 2008, it was noted that the oil market is well supplied and that commercial oil stocks

were at good levels, higher than average of the last five years. The OPEC Conference therefore decided once again to keep production quotas unchanged and reiterated member countries commitment to market stability and ensuring sufficient supplies.
- OPEC’s second ordinary meeting on 9-10 September 2008 noted that the output measures adopted by OPEC countries had ensured that oil market is well supplied. The conference therefore agreed to keep to the production quotas set in September 2007 (28.8 million b/d) after adjusting them to include new members (Angola and Ecuador) and exclude Indonesia and Iraq, which reduced the total quotas by 500,000 b/d.
- At its second extraordinary meeting on 24 October 2008, OPEC discussed the global financial crisis and economic situation and their impact on the oil market. In view of demand decline for energy in general, and oil in particular, and a collapse of oil prices, OPEC decided to cut the production quotas of its 11 members by 1.5 million b/d effective from 1 November 2008.
- At its third extraordinary meeting on 17 December 2008, OPEC agreed once again to cut 2.2 million b/d from the actual production of its 11 members in September, which totaled 29.045 million b/d. This brought the total quota cuts in 2008 effective from 1 January 2009 to 4.2 million b/d, which was the biggest quota cut in a single year since production quotas were introduced in 1982, as shown in Figure (1-2).
Figure 1-2 OPEC Members’ Production Quotas Cut Decisions to Avoid Further Price
Slide During 2008 (Thousand b/d)
0
1000
2000
3000
4000
5000
Septemer 2008 Oct-08 Dec-08 Total cuts in 2008

1-2 Non-OPEC Supplies
Total non-OPEC oil supplies rose to about 50.6 million b/d in 2008, which was on average 100,000 b/d more than in 2007, as shown in Table (1-1).
Among this group, China’s production rose by 100,000 b/d to 3.9 million b/d and that of developing countries rose by 300,000 b/d. In contrast OECD oil supplies declined by about 300,000 b/d to 19.8 b/d in 2008, while Former Soviet Union supplies remained unchanged from their 2007 level of 12.5 million b/d.
Figure (1-3) shows the annual change in oil supplies from OPEC and non-OPEC producers in 2004-2008.
Figure 1-3 Annual Change in World Supplies of Crude Oil and NGL’s, 2004-2008
(million b/d)
-1
-0.5
0
0.5
1
1.5
2
2.5
3
2004 2005 2006 2007 2008
OPEC Rest of the World
2. World Oil Demand
The events of 2008 highlighted the close link between world economic growth rates and world oil demand growth rates. The sharp drop in world economic growth rates from 5.0% in 2007 to 3.8% in 2008 was accompanied by a decline in world oil demand growth from 1.2% in 2007 to -0.1% in 2008. Figure (1-4) and Table (1-2) show the annual rates of growth in world oil demand compared with world economic growth rates.
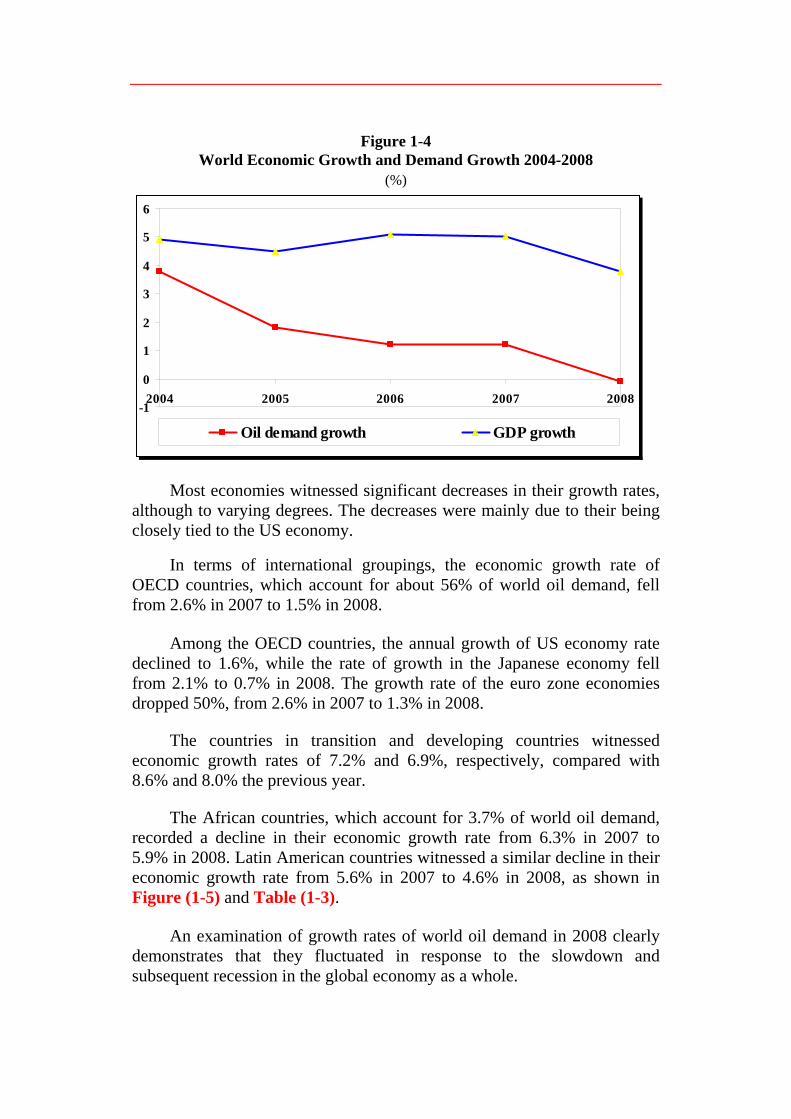
Figure 1-4 World Economic Growth and Demand Growth 2004-2008
(%)
-1
0
1
2
3
4
5
6
2004 2005 2006 2007 2008
Oil demand growth GDP growth
Most economies witnessed significant decreases in their growth rates, although to varying degrees. The decreases were mainly due to their being closely tied to the US economy.
In terms of international groupings, the economic growth rate of OECD countries, which account for about 56% of world oil demand, fell from 2.6% in 2007 to 1.5% in 2008.
Among the OECD countries, the annual growth of US economy rate declined to 1.6%, while the rate of growth in the Japanese economy fell from 2.1% to 0.7% in 2008. The growth rate of the euro zone economies dropped 50%, from 2.6% in 2007 to 1.3% in 2008.
The countries in transition and developing countries witnessed economic growth rates of 7.2% and 6.9%, respectively, compared with 8.6% and 8.0% the previous year.
The African countries, which account for 3.7% of world oil demand, recorded a decline in their economic growth rate from 6.3% in 2007 to 5.9% in 2008. Latin American countries witnessed a similar decline in their economic growth rate from 5.6% in 2007 to 4.6% in 2008, as shown in Figure (1-5) and Table (1-3).
An examination of growth rates of world oil demand in 2008 clearly demonstrates that they fluctuated in response to the slowdown and subsequent recession in the global economy as a whole.

Figure 1-5
World Economic Growth 2007-2008 (%)
5.0
3.8
0123456789
O ECDCountries
Countries inTransition
DevelopingCountries
Africa Latin America World
2007 2008
At the beginning of the first quarter of 2008 it was forecast that world oil demand would grow by 1.2 million b/d, but before long, at the end of the second quarter, the forecast had been revised to 1.1 million b/d. By the end of third quarter it had fallen to 0.9 million b/d, and at the beginning of the fourth quarter the forecast was revised downwards to 0.6 million b/d. At the end of the year it dropped by another 100,000 b/d.
Low economic growth rates had a negative impact on world oil demand growth, which dropped by 100,000 b/d, or 0.1%, below its 2007 level. This was the lowest growth rate for the last ten years. World demand for oil in 2008 totaled 85.8 million b/d, as shown in Figure (1-6) and Table (1-4).
The level of oil demand varied from one international grouping to another. Whilst it dropped sharply in the OECD countries in 2008 by 1.5 million b/d from 2007 to 47.7 million b/d, it rose in the developing countries by about 1.2 million b/d and in the countries in transition by 200,000 b/d.
The change in demand levels of each grouping altered their shares in total world demand in 2008. The share of the OECD countries declined from 57.3% in its 2007 level to 55.6%, while that of the developing countries rose from 37% to 38.5%, and similarly countries in transition rose from 5.7% to 5.9%, as shown in Figure (1-7) and Table (1-5).
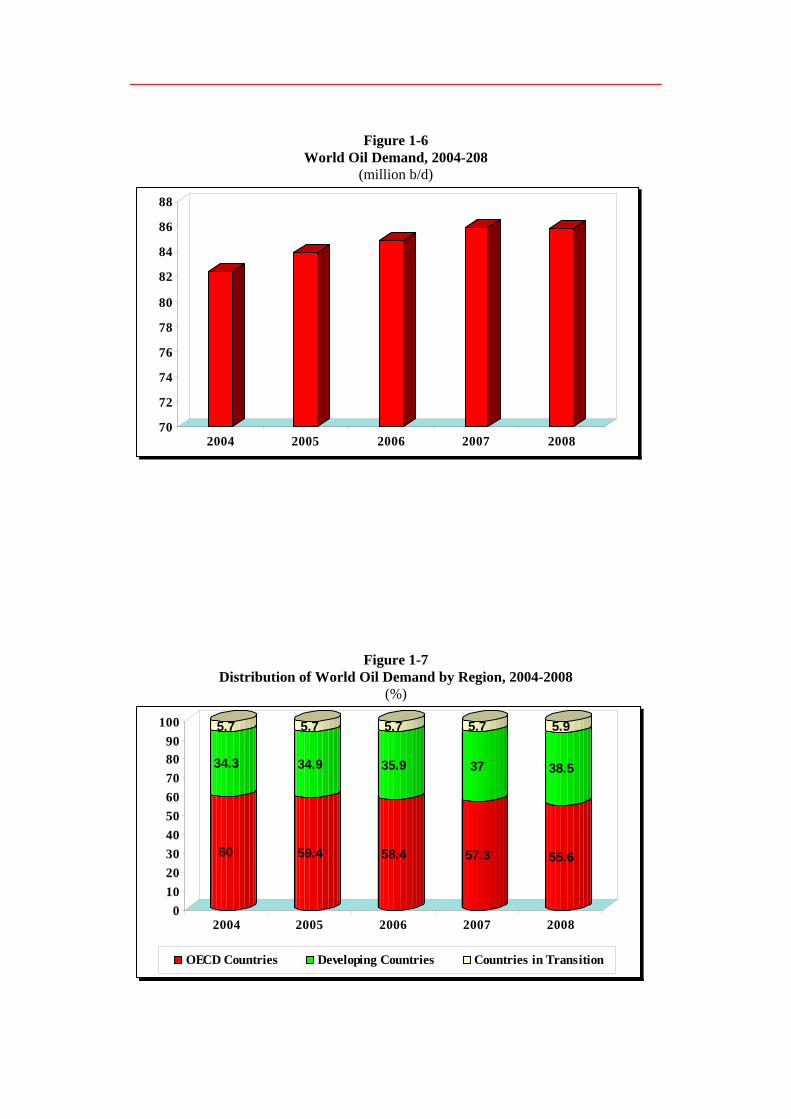
Figure 1-6 World Oil Demand, 2004-208
(million b/d)
70
72
74
76
78
80
82
84
86
88
2004 2005 2006 2007 2008
Figure 1-7 Distribution of World Oil Demand by Region, 2004-2008
(%)
60
34.3
5.7
59.4
34.9
5.7
58.4
35.9
5.7
57.3
37
5.7
55.6
38.5
5.9
0102030405060708090
100
2004 2005 2006 2007 2008
OECD Countries Developing Countries Countries in Transition
Developments in world oil demand are examined by international
grouping below.
2-1 OECD Countries
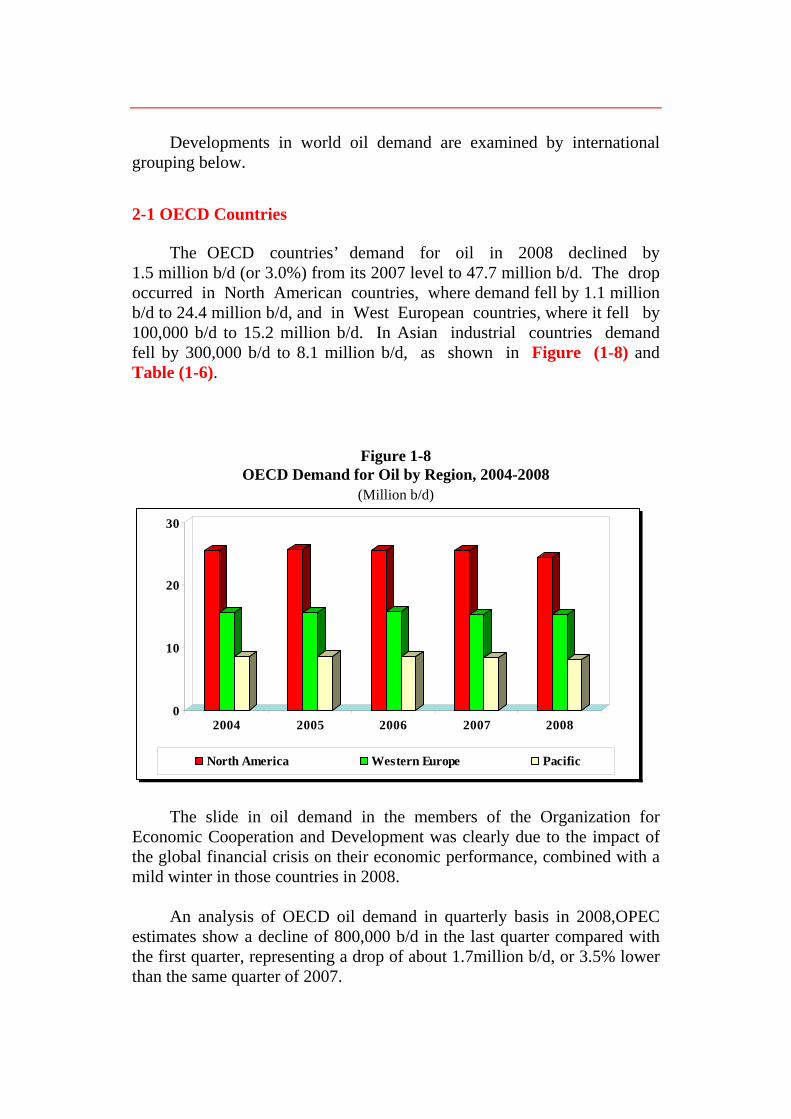
The OECD countries’ demand for oil in 2008 declined by 1.5 million b/d (or 3.0%) from its 2007 level to 47.7 million b/d. The drop occurred in North American countries, where demand fell by 1.1 million b/d to 24.4 million b/d, and in West European countries, where it fell by 100,000 b/d to 15.2 million b/d. In Asian industrial countries demand fell by 300,000 b/d to 8.1 million b/d, as shown in Figure (1-8) and Table (1-6).
Figure 1-8 OECD Demand for Oil by Region, 2004-2008
(Million b/d)
0
10
20
30
2004 2005 2006 2007 2008
North America Western Europe Pacific
The slide in oil demand in the members of the Organization for Economic Cooperation and Development was clearly due to the impact of the global financial crisis on their economic performance, combined with a mild winter in those countries in 2008.
An analysis of OECD oil demand in quarterly basis in 2008,OPEC estimates show a decline of 800,000 b/d in the last quarter compared with the first quarter, representing a drop of about 1.7million b/d, or 3.5% lower than the same quarter of 2007.

The major contribution made by OECD countries to world oil demand meant that world demand in the fourth quarter of 2008 decreased by about 400,000 b/d from the first quarter and by about 700,000 b/d compared with the same quarter of 2007.
2-2 Developing Countries
Although demand for oil in the developing countries in 2008 rose by 1.2 million b/d above its 2007 level to a record 33 million b/d, the annual rate of growth declined from 4.3% in 2007 to 3.7% in 2008.
Demand in the developing countries is the main driver of world oil demand, as it rose by 4.7 million b/d between 2004 and 2008.
Among this grouping, demand in the Middle East and Africa rose by 400,000 b/d to 10 million b/d, of which the Arab countries accounted for 5.4 million b/d, or 54% of the region’s demand and about 16.3% of total demand in the developing countries. The increase was largely due to high economic growth rates in most countries of the region, in contrast to other countries of the world.
Most of the increase in the Arab countries demand occurred in OAPEC member countries, where it rose 4.4% from 4.5 million b/d in 2007 to 4.7 million b/d in 2008.
Demand in the Asian developing countries rose by 600,000 b/d to 17.3 million b/d in 2008. China, which accounted for 46% of total demand in the Asian developing countries, accounted for 67% of the increase in demand of the Asian developing countries and for a third of the increase among all developing countries. Its demand rose by 400,000 b/d to 8 million b/d in 2008. Indian demand increased by about 200,000 b/d, bringing its demand to 3.1 million b/d in 2008, while demand in the Latin American countries rose by about 200,000 b/d to 5.7 million b/d, as shown in Table (1-7).
2-3 Countries in Transition
Oil demand in the countries in transition totaled 5.1 million b/d in 2008, which was 200,000 b/d, or 4.1%, higher than the previous year. Demand in the FSU rose by 100,000 b/d, which was the same rise recorded in 2007. Demand in the countries of Eastern Europe also rose by the same amount of 100,000 b/d, bringing their total to 1 million b/d in 2008, as shown in Table (1-8).
3. Price Trends
3-1 Crude Oil Prices
The price of OPEC basket of crudes rose by $25/b, or 36.2%, in the course of 2008, as the spot price for the OPEC basket averaged $94.1/b, compared with $69.1 in 2007.
There was a wide disparity in the quarterly average prices in 2008. In the first quarter the average was about $92.7/b, rising in the second quarter by $25/b, or 27%, to $117.6/b. Then it began to take a downward path, slowly at first, falling by about $4.1/b in the third quarter, to $113.5/b. However, in the last quarter it took a sharp nosedive to $52.5/b, representing a drop of $61/d or 53.7%, compared with the previous quarter, as shown in Table (1-9).
The financial crisis cast its shadow on the sharp fluctuations that oil prices witnessed throughout the year. The escalation of prices from January to July 2008 was not due to oil market fundamentals (demand, supply and inventory levels). In fact there was no shortage of oil supplies that could be considered a major factor behind any price rise.
Moreover, inventory levels were higher than average for the previous five years. Other factors were behind the steep rise in oil prices, including speculation on oil futures markets.
As the financial crisis became more apparent and panic spread, the owners of hedge and investment funds all over the industrial world, which own huge amounts of money, were tempted to invest in the oil market with a view to making big short-term profits from buying and selling paper barrels. As soon as the crisis deepened and financial markets and banks collapsed one after another at the beginning of August 2008, oil prices went into freefall at an unprecedented speed. The price of the OPEC basket fell by $27.7/b in October and continued to fall until it leveled off at $38.6/b in December, the lowest level reached during the period 2005-2008.
The fall in the average price of the OPEC basket, from its highest level in 2008 ($131.2/b) to its lowest in December ($38.6/b) amounted to $92.6/b, or over 70%. Figure (1-9) shows the weekly movement of the OPEC basket price and OPEC decisions to cut production quotas so as to maintain the stability of prices and prevent them from falling to the levels recorded in 1998 and early 1999.

Figure 1-9 Weekly Movement of OPEC Basket of Crudes, 2008
($/b)
18
38
58
78
98
118
138
158Ja
nuar
y
Febr
uary
Mar
ch
Apr
il
May
June
July
Aug
ust
Sept
embe
r
Oct
ober
Nov
embe
r
Dec
embe
r
First cut :500 tb/d
Second cut :1.5 mb/d
Third cut :2.2 mb/d
Spot prices for various Arab crudes followed the same general trend. They rose in the first half of 2008 and fell in the second half. However, the average price of these crudes was significantly higher than in 2007. The increases ranged from $24.2/b to $26.4/b, or between 32.4% and 38.4%. Algerian crude rose by 32.4% to $98.9/b, while Saudi Arabian Light rose by 38.4% to $95.2/b.
The UAE’s Murban crude rose by 35.8% to $99/b, while Kuwaiti crude and Libyan Sidra rose by 37.3% and 35.3%, respectively. Qatar Marine crude and Iraqi Basra rose by 36.9% and 38.7%, respectively, as shown in Table (1-10).
The nominal value of the rise in crude oil prices of $25/b during 2008 was only slightly different from its real record value measured in 1995 prices, after adjustment according to the index, which represents the value of a unit of OECD exports. The real price increase amounted to $18.8/b, or 33.3%, to reach and average of $75.3/b during 2008, as shown in Table (1-11).
3-2 Spot Prices for Oil Products
There was a huge rise in the annual average prices of various oil products on all major markets in the world in 2008, although the amounts varied according to the product and the market.
3-2-1 Premium Gasoline Prices
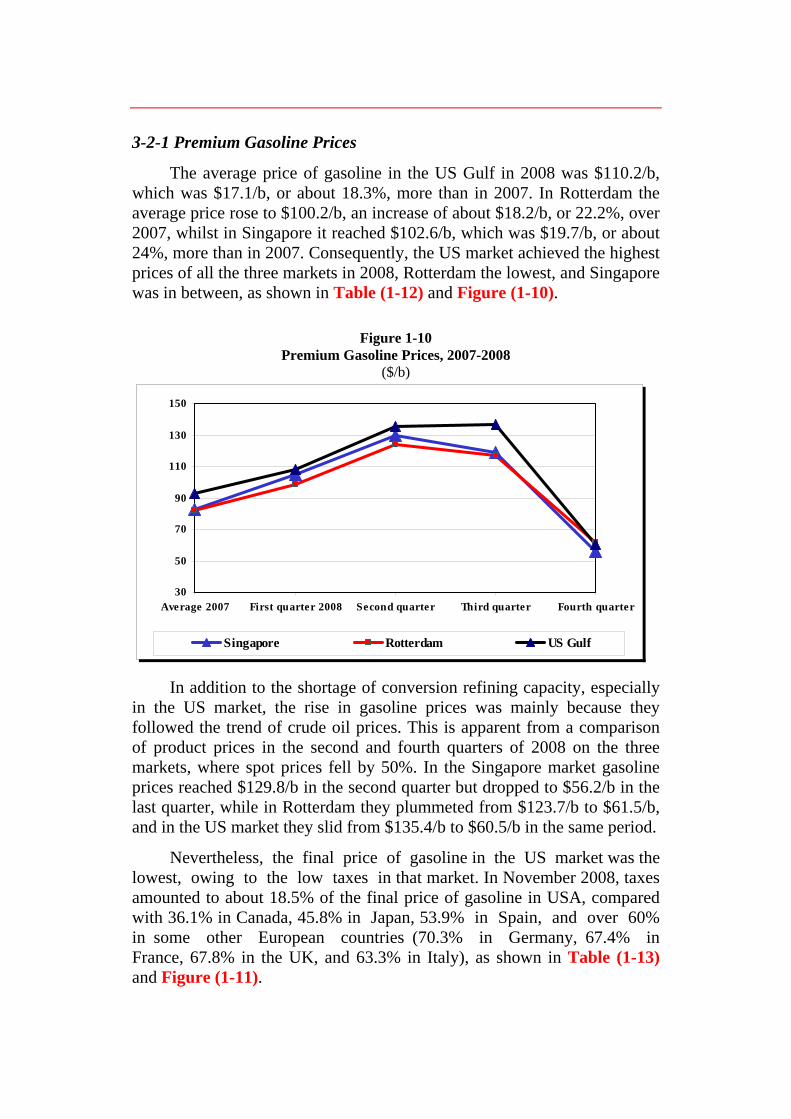
The average price of gasoline in the US Gulf in 2008 was $110.2/b, which was $17.1/b, or about 18.3%, more than in 2007. In Rotterdam the average price rose to $100.2/b, an increase of about $18.2/b, or 22.2%, over 2007, whilst in Singapore it reached $102.6/b, which was $19.7/b, or about 24%, more than in 2007. Consequently, the US market achieved the highest prices of all the three markets in 2008, Rotterdam the lowest, and Singapore was in between, as shown in Table (1-12) and Figure (1-10).
Figure 1-10 Premium Gasoline Prices, 2007-2008
($/b)
30
50
70
90
110
130
150
Average 2007 First quarter 2008 Second quarter Third quarter Fourth quarter
Singapore Rotterdam US Gulf
In addition to the shortage of conversion refining capacity, especially in the US market, the rise in gasoline prices was mainly because they followed the trend of crude oil prices. This is apparent from a comparison of product prices in the second and fourth quarters of 2008 on the three markets, where spot prices fell by 50%. In the Singapore market gasoline prices reached $129.8/b in the second quarter but dropped to $56.2/b in the last quarter, while in Rotterdam they plummeted from $123.7/b to $61.5/b, and in the US market they slid from $135.4/b to $60.5/b in the same period.
Nevertheless, the final price of gasoline in the US market was the lowest, owing to the low taxes in that market. In November 2008, taxes amounted to about 18.5% of the final price of gasoline in USA, compared with 36.1% in Canada, 45.8% in Japan, 53.9% in Spain, and over 60% in some other European countries (70.3% in Germany, 67.4% in France, 67.8% in the UK, and 63.3% in Italy), as shown in Table (1-13) and Figure (1-11).

Figure 1-11 Gasoline Prices in some OECD Countries, November 2008
($/litre)
0.0
0.2
0.4
0.6
0.8
1.0
1.2
1.4
1.6
1.8U
SA
Can
ada
Spai
n
Japa
n
Uni
ted
Kin
gdom
Fran
ce
Ital
y
Ger
man
y
Price without Tax Tax
3-2-2 Gasoil/Diesel Prices
Gasoil prices in 2008 were relatively high in most markets compared with gasoline and fuel oil, because gasoil is in demand throughout the year, especially in the transport, heating and cooling sectors. The highest increase occurred in Rotterdam, where gasoil prices were 41.5% higher than in 2007, as the average annual price rose to $125.3/b. The Singapore market came next with a 39.5% increase, bringing the average price to $123.6/b, while on the US market gasoil prices rose by 36.2%, giving an average price of $121.4/b.
3-2-3 Fuel Oil Prices
Fuel oil prices rose in 2008 on all markets. On the Rotterdam market the average price of fuel oil rose 48.3% above 2007 to $76.4/b, on the Singapore market it rose by about 35.3% to $75.8/b, while on the US market the average price rose by 34.7% to $73.8/b.
3-3 Oil Freight Prices
Crude oil freight prices on all routes rose by over 40% in 2008 compared with their 2007 levels for several reasons, but mainly because of the oil market was in contango, which prompted some participants to store crude oil at sea. Reports indicate that over 40 very large crude carriers (VLCCs), or over 8% of the global fleet, were used for storage in the
Middle East, the Gulf of Mexico, Asia, and the North Sea. The freight price rise may also be attributed to the poor weather conditions that closed some ports and made crossing some Turkish straits difficult. Moreover, the strike at the Fos-Lavera port in France caused more bottlenecks and affected the available tonnage.
The average price for oil shipments from Arabian Gulf ports to the East on VLCCs (230,000-280,000 DWT) was 136 points on the World Scale (WS)1. This was 45 points, or 49.7%, higher than in 2007.
Freight prices for shipments from Arabian Gulf ports to the West, on crude carriers with a capacity of 270,000-285,000 DWT, averaged 99 points on the WS, which was 32 points, or about 47.6%, higher than in 2007, as shown in Table (1-14).
In the Mediterranean region there was a similar rise in freight prices for small and medium-sized tankers (80,000-85,000 dwt). The average freight price in 2008 was 205 WS points, which was 60 points, or about 41.4%, higher than in 2007.
In July 2008 crude oil freight prices on all routes registered the highest level. Average freight prices on the Arabian Gulf-East route reached 235 WS points and on the Arabian Gulf-West route they topped 144 WS points, while cross the Mediterranean route they peaked at 278 WS points. Then in November 2008 they fell, to 70, 61, and 120 WS points, respectively.
4. World Oil Inventories
The year 2008 witnessed a significant rise in total world oil stocks (commercial and strategic) as they rose by about 165 million barrels, or 2.5%, to 6756 million barrels at the end of December 2008. Crude oil stocks at sea account for about 80% of the tanker business worldwide. Independent stocks near consumption centers such as in Caribbean ports and the ports of Rotterdam and Singapore exceeded 1000 million barrels at the end of 2008, totaling 1021 million barrels.
The significant rises in the commercial stocks of OECD countries, and the US in particular, placed a downward pressure on prices. The lack of cooperation on the part of non-OPEC producers jeopardized the stability of

the world oil market. There is a real need for effective cooperation between OPEC and non-OPEC producers to maintain oil market stability. 4-1 OECD Commercial Stocks
The rise in supply levels before OPEC’s decisions to cut production quotas helped build up the levels of commercial stocks in OECD countries in 2008. Total stocks rose by 24 million barrels in the second quarter of the year above their level in the first quarter, or by 3.3%, to 2580 million barrels. In the third quarter they rose once again by 67 million barrels above second quarter levels. In the last quarter of the year there was a significant increase of about 72 million barrels compared with the end of 2007, bringing them to 2638 million barrels at year end.
All commercial stocks in the OECD countries amounted to 56 days of forward consumption, which is four days higher than the usual average of 52 days. This level is three times the annual production of Kuwait, four times that of Libya, and five times that of Algeria. Saudi Arabia’s declaration in June 2008 that it would raise its production by 500,000 b/d in an attempt to curb rising oil prices added another 45 million barrels to the stocks at that time.
4-2 US Strategic Petroleum Reserve
The US Strategic Petroleum Reserve (SPR) passed the 700 million barrel level for the first time in 2008, as it totaled 702 million barrels at year end, 5 million barrels higher than at the end of 2007.
What is more, the SPR did not fall below the 700 million barrel mark throughout the year. After reaching 700 million barrels in the first quarter of 2008, the SPR rose by 6 million barrels to 706 million barrels at the end of the second quarter, then dropped slightly to 702 million barrels in the third quarter, and remained at the 702 million barrel level in the fourth quarter.
Since 2004, the US Administration has adopted a more flexible attitude toward releasing quantities of the SPR to compensate for any shortage of supply. This gives more importance to the commercial aspect of the SPR than the previous policy, which regarded the SPR as a last line of defense to be used only at times of major crisis. See Figure (1-12) and Table (1-15).
Usable commercial stocks are the stocks kept by oil companies as a hedging measure to counter any sudden interruption of supplies or for

speculation purposes when prices rise. The level of these stocks rose sharply by about 126 million barrels, or 11.5%, at the end of 2008 to 1223 million barrels.
Figure 1-12 US SPR at Quarter End, 2007-2008
(Million barrels)
675
680
685
690
695
700
705
710
First quarter Second quarter Third quarter Fourth quarter
2008 2007
II. VALUE OF OAPEC MEMBERS’ COUNTRIES PETROLEUM EXPORTS
The oil price fluctuations of 2008, which saw prices fall by $92.6/b, or 70%, from their peak of $131.2/b in July to their lowest level of $38.6/b in December, had a detrimental effect on the value oil exports. Oil exports are the main engine of socioeconomic development in the oil producing Arab Countries, the mainstay of their central bank reserves of foreign exchange, and the main source of their budget surpluses.
On examining the impact of recent developments in oil prices on the value of OAPEC members’ oil exports, the initial estimates show, they totaled $145.7 billion in the first quarter of 2008, when prices were about $92.7/b. Then in the second and third quarter they rose to $188.7 billion and $191.2 billion, respectively, as oil prices rose to $117.6/b and $113.5/b respectively in those periods. After oil prices began to fall below the $100/b threshold from September to the end of 2008, the value of oil exports suffered a similar sharp drop, reaching $83.3 billion in the last quarter, which was 56% less than the previous quarter and 43% less than the first quarter of the year.
A comparison of the estimated value of oil revenues for each quarter of 2008 with the previous quarter shows a sharp decline of $107.9 billion in the last quarter from the third quarter. This is mainly attributable to the drop

in oil prices resulting from the repercussions of the global financial crisis. Monthly data on the movement of oil prices and the estimated monthly value of OAPEC members’ oil exports may give a clearer picture of the damage done by the drop in prices from August 2008 until the end of the year, owing to the fallout from the global financial crisis, as shown in Figure (1-13).
Figure 1-13 Monthly Oil Prices and Value of OAPEC Oil Exports, January-December
2008 ($/b)
0
10
20
30
40
50
60
70
80
90
Jan. Feb. Mar. Apr. May June July Aug. Sept. Oct. Nov. Dec.
$Bill
ion
0
20
40
60
80
100
120
140
$/b
Value of OAPEC Oil Exports OPEC Basket Price
A year-on-year comparison shows that the value of members’ oil exports rose by 45.6%, from $425 billion in 2007 to $618 billion in 2008, or by $193 billion. An analysis of individual countries shows that the rise varied from one country to another. It ranged in Iraq, Libya, Qatar, Saudi Arabia, Syria, and the UAE, for example, from 40%-65%, while in Algeria it was 38.9%, in Kuwait 20.7%, and in Egypt 19.8%, as shown in Table (1-16). The value of OAPEC members’ oil exports in real 1995 prices, after adjustment for GDP in the OECD countries, rose from $347.2 billion in 2007 to $494.6 billion in 2008, or by 42.5%, as shown in Table (1-17).
III. DEVELOPMENTS IN OIL AND ENERGY CONSUMPTION IN THE ARAB COUNTRIES
1. Arab Countries

This section provides a rough picture of total energy consumption in
the Arab countries in general, and OAPEC member countries in particular, according to energy sources. It also attempts to shed light on final primary energy consumption by major economic sectors.
1-1 Total and Per Capita Energy Consumption
Energy consumption growth in the Arab countries, like all countries in the world, is affected by three key variables: GDP, population, and prevailing energy prices on local markets. The following paragraphs provide an overview of these variables.
1- GDP: Data published in the Joint Arab Economic Report in September 2008 indicate that GDP growth rate followed a downward trend in constant prices in the Arab countries. It peaked at 7.4% in 2003 but in 2004 it declined to 7.1%, in 2005 to 6.7%, in 2006 to 6.4%, and to 5.6% in 2007, when it amounted to $1472 billion, as shown in Figure (1-14). The overall average energy intensity in the Arab countries was about 6.5 kg of oil equivalent per $1000 of GDP in 2007. The Arab countries may be divided into three groups on the basis of GDP in 2007 constant prices, as follows:
Figure 1-14 Arab Countries’ GPD in Current Prices 2003-2007
($billion)
0
200
400
600
800
1000
1200
1400
1600
2003 2004 2005 2006 2007
a) Countries with a growth rate of less than 5.0%: The seven countries in this group are Mauritania (0.9%), Morocco (2.2%), Yemen (3.1%), Saudi Arabia (3.5%), Lebanon (4%), and Algeria and Kuwait (4.6%).
b) Countries with a growth rate of 5%-10%: The 11 countries in this group are Djibouti (5.2%), Jordan and Iraq (5.9%), Tunisia (6.3%), Bahrain (6.6%), Syria and Oman (6.7%), Libya (6.8%), Egypt (7.1%), the UAE (7.4%), and Sudan (9.7%).
c) Countries with a growth of over 10%: The only country in this group is the Qatar (14.2%).
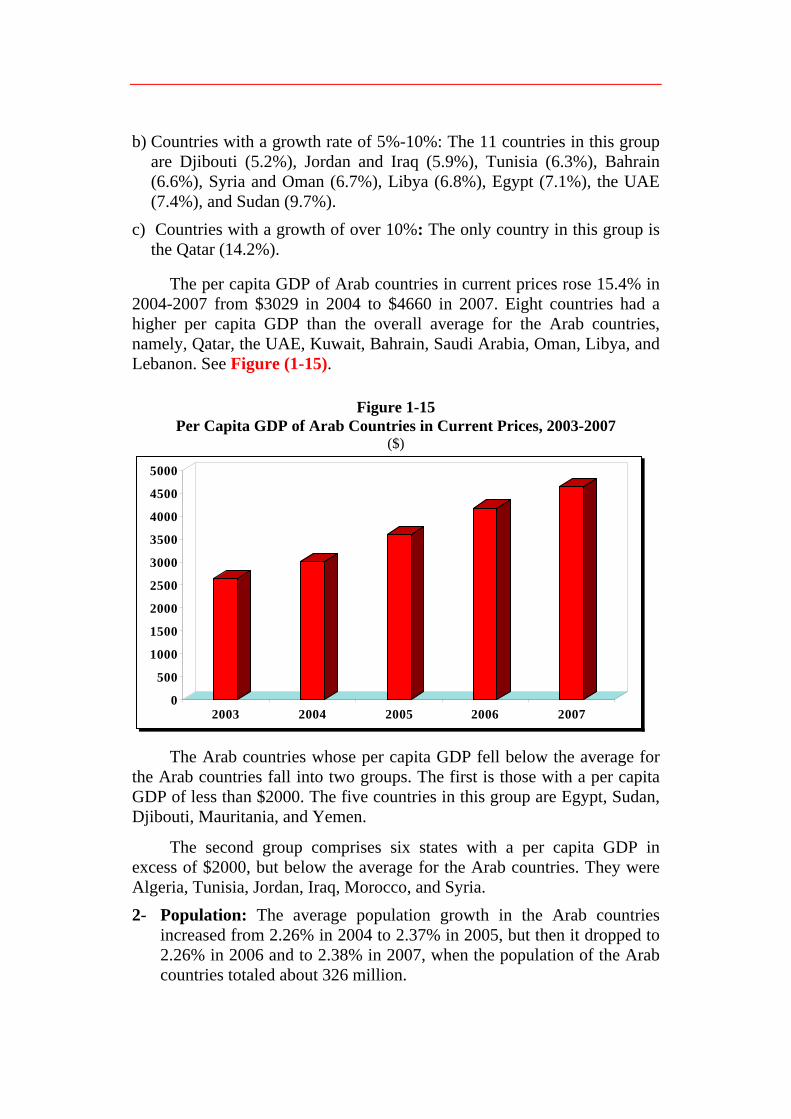
The per capita GDP of Arab countries in current prices rose 15.4% in 2004-2007 from $3029 in 2004 to $4660 in 2007. Eight countries had a higher per capita GDP than the overall average for the Arab countries, namely, Qatar, the UAE, Kuwait, Bahrain, Saudi Arabia, Oman, Libya, and Lebanon. See Figure (1-15).
Figure 1-15 Per Capita GDP of Arab Countries in Current Prices, 2003-2007
($)
0
500
1000
1500
2000
2500
3000
3500
4000
4500
5000
2003 2004 2005 2006 2007
The Arab countries whose per capita GDP fell below the average for the Arab countries fall into two groups. The first is those with a per capita GDP of less than $2000. The five countries in this group are Egypt, Sudan, Djibouti, Mauritania, and Yemen.
The second group comprises six states with a per capita GDP in excess of $2000, but below the average for the Arab countries. They were Algeria, Tunisia, Jordan, Iraq, Morocco, and Syria. 2- Population: The average population growth in the Arab countries
increased from 2.26% in 2004 to 2.37% in 2005, but then it dropped to 2.26% in 2006 and to 2.38% in 2007, when the population of the Arab countries totaled about 326 million.

3- Prices: Several Arab countries in the recent years have resorted to
raising the prices of oil products, especially gasoline. In 20006 ten Arab countries raised gasoline prices on the local market, namely, Egypt, Iraq, Jordan, Lebanon, Morocco, Sudan, Syria, Tunisia, Yemen and the UAE. Moreover, Morocco raised the prices of some oil products on local markets. The data available for 20007 indicate that one country, Syria, raised gasoline prices on the local market. Among OAPEC member countries in 2008, Syria raised the prices of oil products in March, while Jordan cut oil product prices six times starting on 10 July 2008 in response to the fall in crude oil prices on world markets.
1-2 Energy Consumption by Source
Initial estimates show that energy consumption growth in the Arab countries between 2004 and 2008 was stable at about 4.3% in 2007-2008, after registering increases of 7.9% in 2004, 6.3% in 2005, and 5.5% in 2006. Total energy consumption in the Arab countries exceeded the 10 million barrels of oil equivalent per day (boe/d) threshold in 2008.
Energy consumption in the Arab countries is increasingly dependent on petroleum (oil and natural gas), owing to the declining share of other sources, such as hydroelectricity and coal.
The biggest increase in consumption occurred in natural gas consumption, which rose by 5.7% a year between 2004 and 2008, while oil consumption grew by 4.9% in the same period.
There was no significant increase in the consumption of hydroelectricity and coal. Oil continues to be the main source of energy consumption in the Arab countries, despite the increasing use of natural gas. Oil meets over half the Arab countries energy requirements, accounting for 53.9% in 2008, compared with 44.5% for natural gas, 1.4% for hydroelectricity, and 0.2% for coal.
Among non-OAPEC Arab countries oil plays a bigger role in the energy mix, accounting for over three quarters (77.5%) of their energy needs, compared with 51.6% in OAPEC member countries. On the other hand, natural gas plays a bigger role in OAPEC member countries, accounting for 47.2% of their total energy consumption, compared with 17.2% in other Arab countries, as shown in Figure (1-16) and Table (1-18). The disparity in energy consumption may be attributed to the differing availability of hydrocarbon resources in the Arab countries.

Energy consumption in the Arab countries grew at different rates in the period 2004-2008, averaging per annum 5.3% for OAPEC member countries and 3.7% for other Arab countries. OAPEC members accounted for 91% of total energy consumption in the Arab countries in 2008 and other Arab countries for 9%.
This disparity in energy consumption mainly reflects the disparity in the size of their national economies, the size and exploitation of their hydrocarbon resources, and their populations.
• Size of national economy: The GDP of OAPEC member countries accounted for about 83.9% of the Arab countries GDP in 2007.
• Energy resources: OAPEC member countries possessed 98% of the Arab countries crude oil reserves at the end of 2008 and 97.4% of their natural gas reserves.
• Population: OAPEC member countries accounted for about 63.3% of the total population of the Arab countries in 2008.
Figure 1-16 Energy Consumption in the Arab Countries by Source, 2008
(%)
0
10
20
30
40
50
60
Petroleumproducts
Natural Gas Hydroelectricity Coal
The disparity in energy consumption is particularly stark when one examines per capita energy consumption, which amounted to 15.8 boe in OAPEC member countries in 2008, compared with 2.7 boe among other
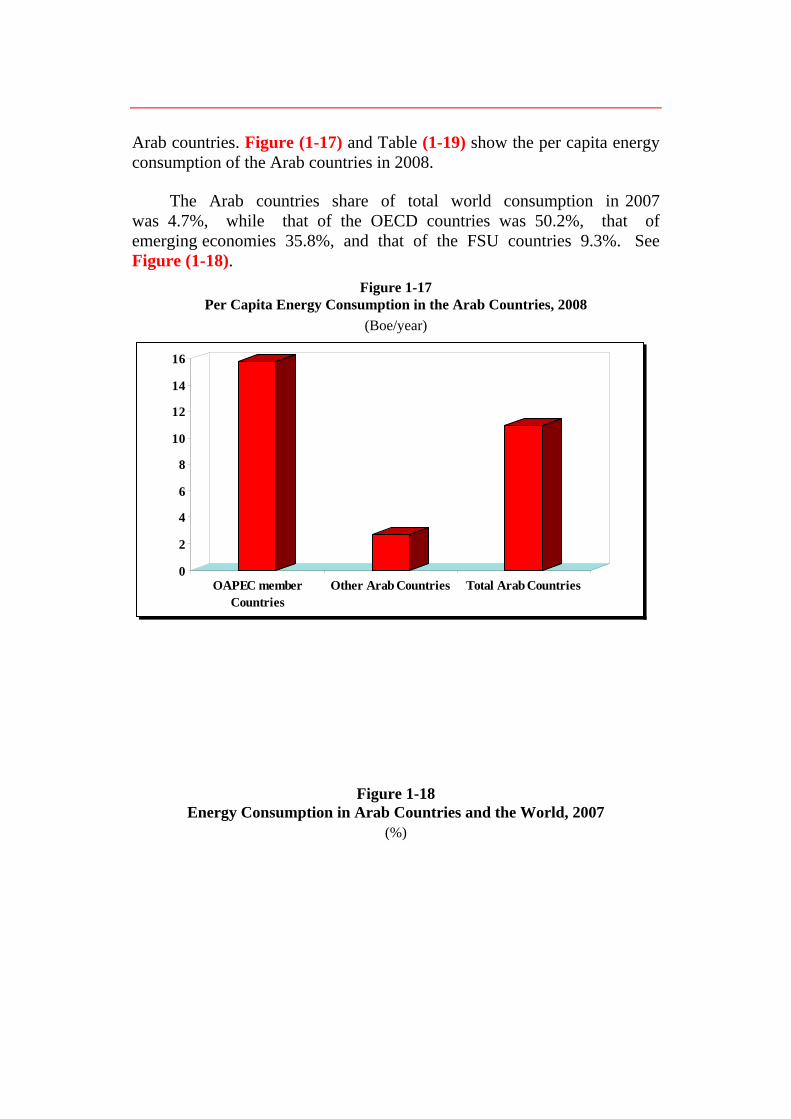
Arab countries. Figure (1-17) and Table (1-19) show the per capita energy consumption of the Arab countries in 2008.
The Arab countries share of total world consumption in 2007 was 4.7%, while that of the OECD countries was 50.2%, that of emerging economies 35.8%, and that of the FSU countries 9.3%. See Figure (1-18).
Figure 1-17 Per Capita Energy Consumption in the Arab Countries, 2008
(Boe/year)
0
2
4
6
8
10
12
14
16
OAPEC memberCountries
Other Arab Countries Total Arab Countries
Figure 1-18 Energy Consumption in Arab Countries and the World, 2007
(%)

0
10
20
30
40
50
60
Arab Countries
OECD Countries
EmergingEconomies
FSU
1-2-1 Petroleum Products
There was a slowdown in the growth rate of petroleum products’ consumption in the Arab countries in 2008, when it fell to 3.9%, compared with 6.1% in 2006 and 4.2%in 2007. The actual consumption of petroleum products in these countries in 2008 amounted to 5.4 million boe/d, compared with 4.5 million boe/d in 2004. Moreover, the share of petroleum products in total energy consumption in the Arab countries in the period 2004-2008 declined from 54.4% in 2004 to 53.9% in 2008.
The OAPEC members’ share of total petroleum products’ consumption in the Arab countries in 2008 was 87.1%, while that of other Arab countries was 12.9%.
The relative breakdown of petroleum product consumption in the Arab countries in 2007 puts gasoil/diesel in first place with 32.8%, followed by gasoline with 20.3%, and fuel oil in third place with 20.1%. LPG came next with 8.1% of the total, followed by jet fuel with 4.6%, and lastly kerosene with 1.8%.
Crude oil is still used directly as a fuel in power plants and refineries in several Arab countires, accounting for 9.1% of total petroleum products' consumption. Figure (1-19) shows the breakdown of petroleum product consumption in the Arab countries.
Figure 1-19 Breakdown of Petroleum Product Consumption in the Arab Countries, 2008

(%)
Fuel Oil% 20.1
Others% 3.2
Crude Oil% 9.1
Gas Oil/Diesel% 32.8
Jet Fuel% 4.6
Gasoline% 20.3
LPG% 8.1
Kerosene% 1.8
The Arab countries accounted for 6.9% of world oil consumption in 2007, while the OECD countries took a 56.9% share, emerging economies 31.5%, and FSU countries 4.7%. See Figure (1-20).
Figure 1-20 Oil Consumption in the Arab Countries and the World, 2007
(%)
0
10
20
30
40
50
60
Arab Countries
OECD Countries
EmergingEconomies
FSU
1-2-2 Natural Gas
Natural gas is the second biggest source in the energy balances of Arab countries. Owing to the huge efforts they have exerted to expand their
use of the hydrocarbon resources available, Arab countries consumption of natural gas in the period 2004-2008 rose by 5.7% from 3.6 million boe/d in 2004 to 4.5 million boe/d in 2008. This resulted in the share of natural gas in total energy consumption in the Arab countries rising from 43.6% in 2004 to 44.6% in 2008.
Natural gas is only consumed in a significant way in a relatively small number of Arab countries, including some OAPEC member countries, which accounted for 96.5% of the Arab countries total consumption of natural gas in 2008, as shown in Table (1-18). Oman is the main consumer of natural gas among non-OAPEC Arab countries, while Jordan and Morocco also consume small quantities.
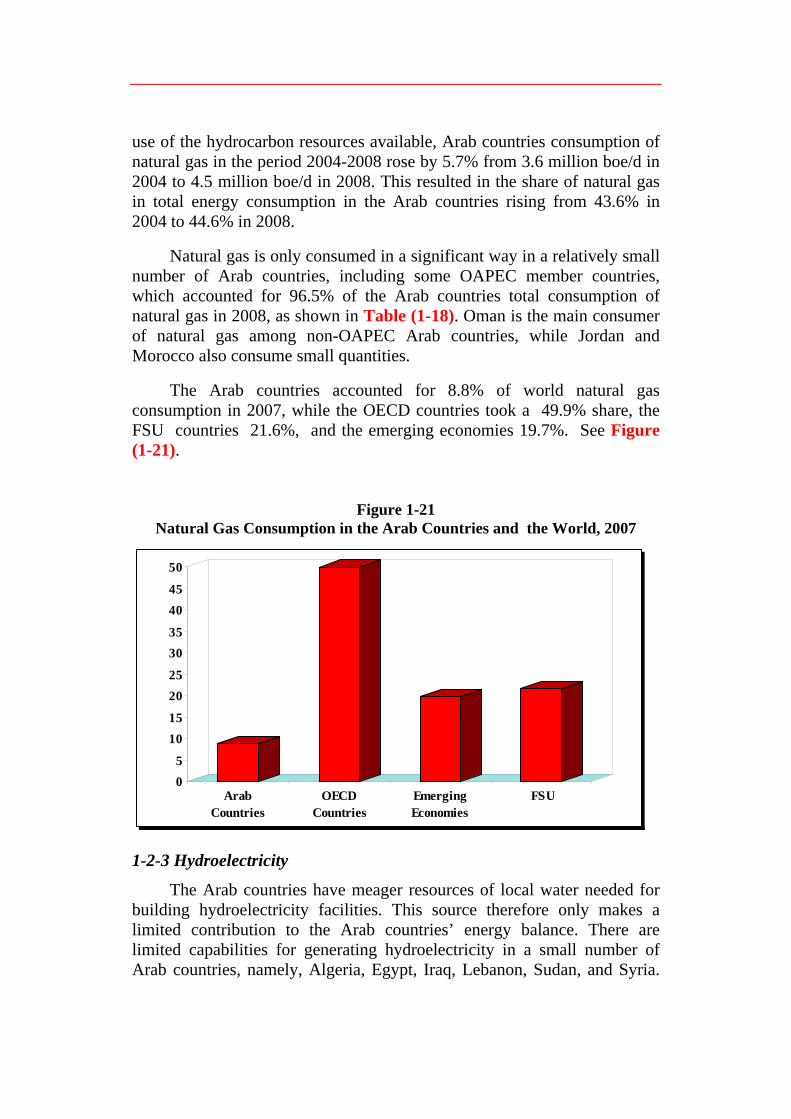
The Arab countries accounted for 8.8% of world natural gas consumption in 2007, while the OECD countries took a 49.9% share, the FSU countries 21.6%, and the emerging economies 19.7%. See Figure (1-21).
Figure 1-21 Natural Gas Consumption in the Arab Countries and the World, 2007
05
1015
2025
3035
4045
50
Arab Countries
OECD Countries
EmergingEconomies
FSU
1-2-3 Hydroelectricity
The Arab countries have meager resources of local water needed for building hydroelectricity facilities. This source therefore only makes a limited contribution to the Arab countries’ energy balance. There are limited capabilities for generating hydroelectricity in a small number of Arab countries, namely, Algeria, Egypt, Iraq, Lebanon, Sudan, and Syria.

Initial estimates show that the hydroelectricity production and consumption in these countries were stable in the period 2004-2008 at about 136,000 boe/d. The share of hydroelectricity in total Arab energy consumption declined from 1.65% in 2004 to 1.35% in 2008.
The Arab countries accounted for 0.8% of total world hydroelectricity consumption in 2006, while the emerging economies accounted for 49.5%, the OECD countries for 41.7%, and the FSU countries for 8%.
1-2-4 Coal
Coal resources are only found in a small number of Arab countries, namely, Algeria and Egypt, which are OAPEC members, and Lebanon and Morocco, which are not. Even in these four countries, coal makes a limited contribution to the energy balance, with an estimated total consumption of about 24,700 boe/d in 2008, compared with 23,100 boe/d in 2004. Its share of total energy consumption in the Arab countries declined from 0.29% in 2004 to 0.25% in 2008. The Arab countries accounted for 0.1% of world coal consumption in 2007, while the emerging economies accounted for 57.4%, the OECD countries for 37.3%, and the FSU countries for 5.2%. 2. Total Energy Consumption in OAPEC Member Countries
2-1 Total and Per Capita Energy Consumption
Initial estimates indicate that energy consumption in OAPEC member countries in 2008 rose by 4.5% to about 9.1 million boe/d, although the annual rate of growth in 2004-2008 was 5.3%.
There was a marked difference between OAPEC member countries in terms of energy consumption. Three groups may be identified: 1. Five members with a growth rate of over 6%, namely, Libya (8.7%),
Qatar (7.6%), the UAE (6.5%), Saudi Arabia (6.2%), and Kuwait (6%),. 2. Four members with a growth rate of 4%-6%, namely, Algeria (5.4%),
Syria (5.2%), Bahrain (4.9%), and Tunisia (4.6%). 3. Two members with a growth rate of less than 4%, namely, Egypt (2.7%)
and Iraq (0.4%).
The rise in energy consumption in OAPEC member countries in 2008 is estimated at about 389,000 boe/d. It is mainly attributable to five countries: Saudi Arabia (115,000 boe/d), Egypt (50,000 boe/d), the UAE and Algeria (45,000 boe/d), and Qatar (37,000 boe/d).
The increase in other member countries ranged between 14,000 boe/d in Bahrain and 23,000 boe/d in Kuwait. Figure (1-22) and Table (1-20) compare OAPEC members’ energy consumption in 2004 with 2008.

Figure 1-22 Energy Consumption in OAPEC Member Countries, 2004 and 2008
(Thousand boe/d)
0
500
1000
1500
2000
2500
3000A
lger
ia
Bah
rain
Egy
pt
Iraq
Kuw
ait
Lib
ya
Qat
ar
S. A
rabi
a
Syri
a
Tun
isia
UA
E
2004 2008
Saudi Arabia accounted for about 27.6% of total Arab energy
consumption in 2008, followed by Egypt with 12.8%, the UAE with 10%, Algeria with 8.5%, and Kuwait with 6.1%. The per capita rate of energy consumption in OAPEC member countries rose by 3% per annum in the period 2004-2008, from 14 boe in 2004 to 15.8 boe in 2008.
This modest growth in per capita energy consumption resulted from the relatively high rate of population growth (2.25%) against an energy consumption growth rate of 5.29% in that period. The per capita energy consumption rate in OAPEC member countries ranged from 6.3 boe in Egypt to 232 boe in Qatar.
The high level of per capita energy consumption in some OAPEC members was primarily due to energy-intensive local industries and their relatively small populations. Figure (1-23) shows the per capita energy consumption of OAPEC member countries.
Figure 1-23 Per Capita Energy Consumption in OAPEC Member Countries, 2008
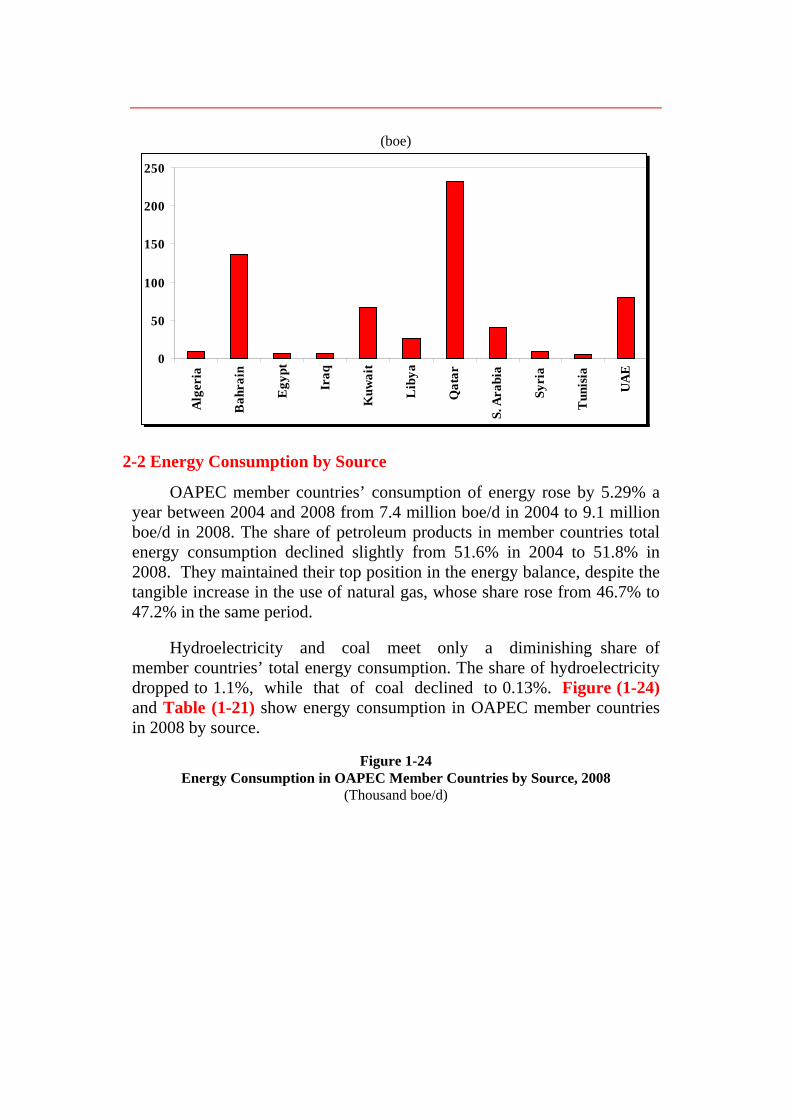
(boe)
0
50
100
150
200
250
Alg
eria
Bah
rain
Egy
pt
Iraq
Kuw
ait
Lib
ya
Qat
ar
S. A
rabi
a
Syri
a
Tun
isia
UA
E
2-2 Energy Consumption by Source
OAPEC member countries’ consumption of energy rose by 5.29% a year between 2004 and 2008 from 7.4 million boe/d in 2004 to 9.1 million boe/d in 2008. The share of petroleum products in member countries total energy consumption declined slightly from 51.6% in 2004 to 51.8% in 2008. They maintained their top position in the energy balance, despite the tangible increase in the use of natural gas, whose share rose from 46.7% to 47.2% in the same period.
Hydroelectricity and coal meet only a diminishing share of member countries’ total energy consumption. The share of hydroelectricity dropped to 1.1%, while that of coal declined to 0.13%. Figure (1-24) and Table (1-21) show energy consumption in OAPEC member countries in 2008 by source.
Figure 1-24 Energy Consumption in OAPEC Member Countries by Source, 2008
(Thousand boe/d)

0500
100015002000250030003500400045005000
Petroleumproducts
Natural Gas Hydroelectricity Coal
2-2-1 Petroleum Products
OAPEC members’ consumption of petroleum products increased by 5.16% a year in the period 2004-2008, while total energy consumption rose by 5.29% a year in the same period. Petroleum products’ consumption amounted to 4.7 million boe/d in 2008, compared with 3.8 million boe/d in 2004. The average growth of petroleum products’ consumption in 2008 had been 4% which was less than previous years. Six member countries recorded increases above the OAPEC average in 2008: Bahrain (11.9%), Qatar (9.6%), Algeria (4.7%), the UAE (4.4%), and Saudi Arabia and Syria (4%).
The increase in petroleum products’ consumption in OAPEC member countries amounted to about 182,000 boe/d in 2008. It occurred mainly in five countries, namely, Saudi Arabia, Egypt, the UAE, Algeria, and Iraq. Petroleum products’ consumption rose by 65,000 boe/d in Saudi Arabia, by 20,000 boe/d in Egypt, and by 15,000 boe/d in each of Algeria, Iraq, and the UAE. The consumption of these member countries accounted for over 71% of the total petroleum products’ consumption of member countries in 2008. The consumption increase in other member countries ranged between 4,000 boe/d in Tunisia and 13,500 boe/d in Syria. See Table (1-22).
The relative importance of petroleum products in total energy consumption varies from one member country to another. In 2008 they met more than half of the energy requirements in seven OAPEC countries, namely, Iraq, Syria, Tunisia, Kuwait, Saudi Arabia, Libya, and Egypt. In Iraq petroleum products accounted for 81.9% of total energy consumption, in Syria 72.3%, in Tunisia 66.2%, in Saudi Arabia 60.2%, in Kuwait 64.9%, in Libya 51%, and in Egypt 50.4%. In the remaining OAPEC
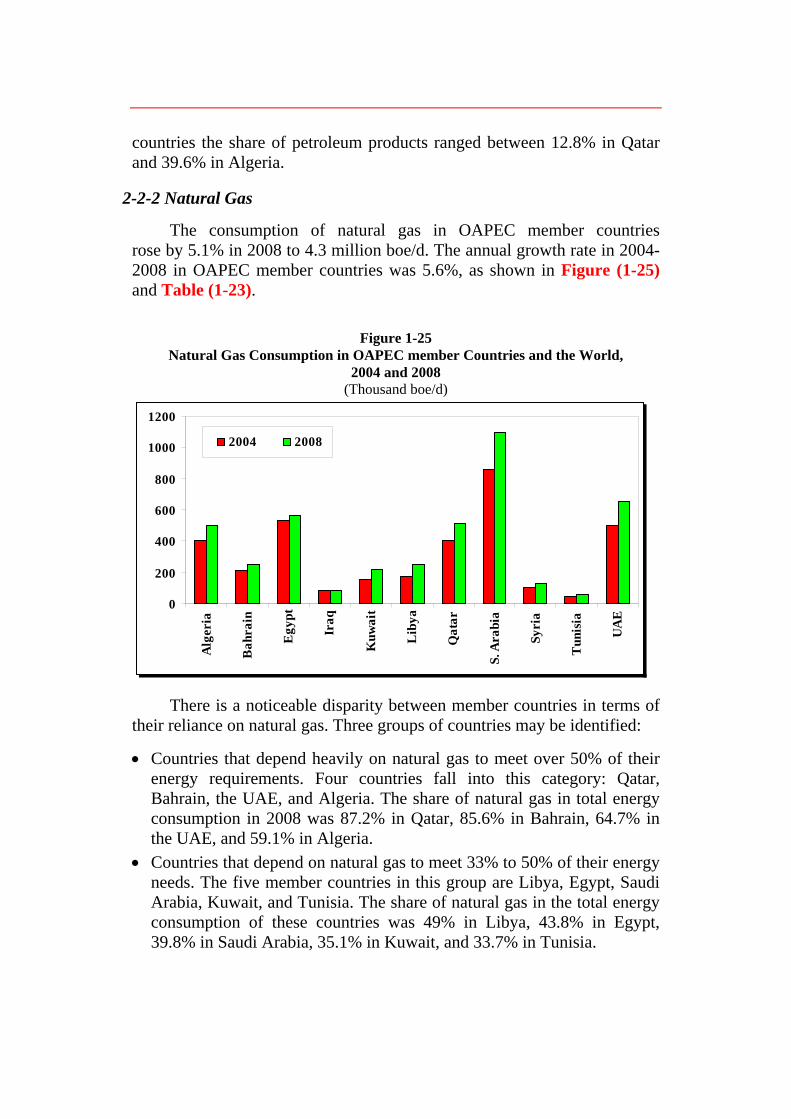
countries the share of petroleum products ranged between 12.8% in Qatar and 39.6% in Algeria.
2-2-2 Natural Gas
The consumption of natural gas in OAPEC member countries rose by 5.1% in 2008 to 4.3 million boe/d. The annual growth rate in 2004-2008 in OAPEC member countries was 5.6%, as shown in Figure (1-25) and Table (1-23).
Figure 1-25 Natural Gas Consumption in OAPEC member Countries and the World,
2004 and 2008 (Thousand boe/d)
0
200
400
600
800
1000
1200
Alg
eria
Bah
rain
Egy
pt
Iraq
Kuw
ait
Lib
ya
Qat
ar
S. A
rabi
a
Syri
a
Tun
isia
UA
E
2004 2008
There is a noticeable disparity between member countries in terms of their reliance on natural gas. Three groups of countries may be identified:
• Countries that depend heavily on natural gas to meet over 50% of their energy requirements. Four countries fall into this category: Qatar, Bahrain, the UAE, and Algeria. The share of natural gas in total energy consumption in 2008 was 87.2% in Qatar, 85.6% in Bahrain, 64.7% in the UAE, and 59.1% in Algeria.
• Countries that depend on natural gas to meet 33% to 50% of their energy needs. The five member countries in this group are Libya, Egypt, Saudi Arabia, Kuwait, and Tunisia. The share of natural gas in the total energy consumption of these countries was 49% in Libya, 43.8% in Egypt, 39.8% in Saudi Arabia, 35.1% in Kuwait, and 33.7% in Tunisia.

• Countries that rely moderately on natural gas, using it for less than 33% of their energy requirements. The two countries in this group, Syria and Iraq, rely on natural gas for 26.2% and 14.7%, respectively, of their total energy needs.
Five member countries accounted for about 77.2% of the total natural gas consumption in OAPEC member countries in 2008. They are Saudi Arabia, the UAE, Egypt, Qatar, and Algeria. Their shares of the total OAPEC consumption of natural gas were 25.6% by Saudi Arabia, 15.1% by the UAE, 13% by Egypt, 11.9% by Qatar, and 11.6% by Algeria. Figure (1-26) shows the degree to which OAPEC member countries depend on natural gas to meet their energy requirements.
Figure 1-26 Natural Gas Consumption as a Percentage of Total Energy Consumption in
OAPEC Member Countries, 2008 (%)
0102030405060708090
100
Alg
eria
Bah
rain
Egy
pt
Iraq
Kuw
ait
Lib
ya
Qat
ar
S. A
rabi
a
Syri
a
Tun
isia
UA
E
2-2-3 Hydroelectricity and Coal
Hydroelectricity consumption in OAPEC member countries in 2008 amounted to about 100,000 boe/d. Just five member countries use this energy source: Egypt, Iraq, Algeria, Syria, and Tunisia.
Hydroelectricity represented a tiny proportion of total energy consumption in these countries, ranging from 0.1% in Tunisia to 5.1% in Egypt. Its share of total energy consumption in OAPEC countries in 2008 did not exceed 1.1%, as shown in Table (1-24).

OAPEC countries' negligible consumption of coal was no more than
12,000 boe/d in 2008. It was limited to two members: Egypt consumed about 8,500 boe/d, while Algeria consumed 3,300 boe/d of coal. The share of coal in total OAPEC energy consumption did not exceed 0.13% in 2008, as shown in Table (1-25).
3. Final Energy Consumption in Arab Countries
3-1 Final Energy Consumption by Source
The Arab countries rely predominantly on petroleum products to meet the lion’s share of their final consumption energy needs. Petroleum products accounted for 63.3% of final consumption in the Arab countries in 2006. Natural gas came in second place with 20.8%, while electricity met 15.5% of final consumption. Coal made a tiny contribution of no more than 0.4%.
Since the Arab countries vary widely in terms of their oil and natural gas resources and their use of natural gas, petroleum products meet most of the final consumption requirements of non-OAPEC Arab countries.
In 2006 they met 81.5% of final consumption in these countries, compared with 61% in OAPEC members. Natural gas met 23.2% of final consumption in OAPEC member countries, but only 1.2% in other Arab countries.
The share of electricity in final consumption is comparable in both member and non-member countries, accounting for 15.5% in OAPEC members and 15.2% in non-member countries. Coal accounted for 2% of final consumption in non-OAPEC Arab countries, and just 0.22% in OAPEC members.
3-1-1 Final Consumption of Petroleum Products
The transport sector is the major consumer of petroleum products in the Arab countries, with a share of 52.8% in 2006. In second place came the industrial sector with about 32.2%, followed by the other sectors combined (household, commercial, and agricultural) with 15%.
3-1-2 Final Consumption of Natural Gas

The industrial sector is the main consumer of natural gas in the Arab countries, accounting for 89% of final natural gas consumption in 2006. The other sectors (household, commercial, and agricultural) together accounted for 11%.
3-1-3 Final Consumption of Electricity
The household, commercial, and agricultural sectors are the main consumers of electricity in the Arab countries. They accounted for 80.1% of final electricity consumption in 2006.
The industrial sector came in second place with a 19.7% share of the total. Meanwhile, the transport sector represented a meager 0.2%. See Figure (1-27) and Table (1-26).
Figure 1-27 Relative Distribution of Final Energy Consumption by Source and Sector in
the Arab Countries, 2006 (%)
80.08
19.71
0.21
11.01
88.99
14.97
32.17
52.86
100.00
0
20
40
60
80
100
120
Electricity Natural Gas Petroleumproducts
Coal
Other Sectors Industrial Sector Transport Sector
3-2 Final Energy Consumption by Sector
The industrial sector is the main consumer of energy in the Arab countries, with a 42.3% share of total final consumption in 2006. The transport sector accounted for 33.5%, and the other sectors (household, commercial, and agricultural) combined accounted for 24.2% of final energy consumption. 3-2-1 Energy Consumption in the Industrial Sector

Petroleum products met 48% of the industrial sector’s requirements in
the Arab countries in 2006, while natural gas accounted for 43.8%. Electricity accounted for 7.2% and coal for no more than 1%. The Arab countries differ widely in terms of the relative importance of energy sources in meeting their industrial sector requirements. Natural gas met 46.5% of the industrial sector's final consumption in OAPEC member countries in 2006, but no more than 4.1% in other Arab countries. On the other hand, petroleum products met 46.5% of the industrial sector’s final energy consumption in OAPEC countries, but in other Arab countries their share rose to 71.1%. 3-2-2 Energy Consumption in the Transport Sector
The transport sector relies almost entirely on petroleum products for its energy requirements in the Arab countries. Petroleum products accounted for 99.9% of final consumption in this sector in 2006. Electricity accounted for just 0.1%. The transport sector’s consumption of petroleum products represented a third (33.4%) of final energy consumption in the Arab countries in 2006. 3-2-3 Energy Consumption in Other Sectors of the Economy
The other economic sectors, which include the household, commercial and agricultural sectors, relied on various sources to meet their energy needs in 2006: electricity 51.3%, petroleum products 39.2%, natural gas 9.5%. see Figure (1-28)
Figure 1-28 Relative Distributing of Final Energy Consumption by Sector and Source in the
Arab Countries, 2006 (%)
43.8
48.0
7.2
1.0
99.9
0.1
9.5
39.2
51.3
0
20
40
60
80
100
Industrial Sector Transport Sector Other Sectors
Natural Gas Petroleum products Electricity Coal
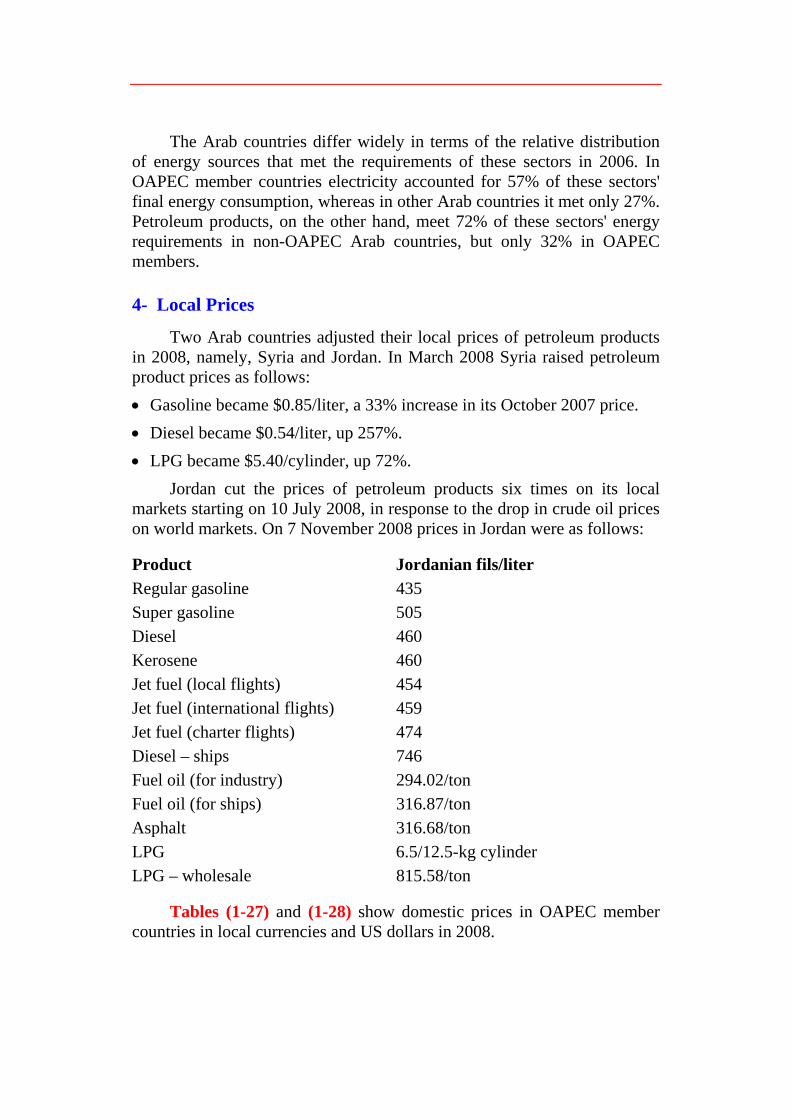
The Arab countries differ widely in terms of the relative distribution of energy sources that met the requirements of these sectors in 2006. In OAPEC member countries electricity accounted for 57% of these sectors' final energy consumption, whereas in other Arab countries it met only 27%. Petroleum products, on the other hand, meet 72% of these sectors' energy requirements in non-OAPEC Arab countries, but only 32% in OAPEC members.
4- Local Prices
Two Arab countries adjusted their local prices of petroleum products in 2008, namely, Syria and Jordan. In March 2008 Syria raised petroleum product prices as follows: • Gasoline became $0.85/liter, a 33% increase in its October 2007 price. • Diesel became $0.54/liter, up 257%. • LPG became $5.40/cylinder, up 72%.
Jordan cut the prices of petroleum products six times on its local markets starting on 10 July 2008, in response to the drop in crude oil prices on world markets. On 7 November 2008 prices in Jordan were as follows:
Product Jordanian fils/liter Regular gasoline 435 Super gasoline 505 Diesel 460 Kerosene 460 Jet fuel (local flights) 454 Jet fuel (international flights) 459 Jet fuel (charter flights) 474 Diesel – ships 746 Fuel oil (for industry) 294.02/ton Fuel oil (for ships) 316.87/ton Asphalt 316.68/ton LPG 6.5/12.5-kg cylinder LPG – wholesale 815.58/ton
Tables (1-27) and (1-28) show domestic prices in OAPEC member countries in local currencies and US dollars in 2008.
PART ONE
TABLES OF CHAPTER ONE
DEVELOPMENTS IN GLOBAL MARKETS AND THEIR IMPACT ON OAPEC MEMBER COUNTRIES
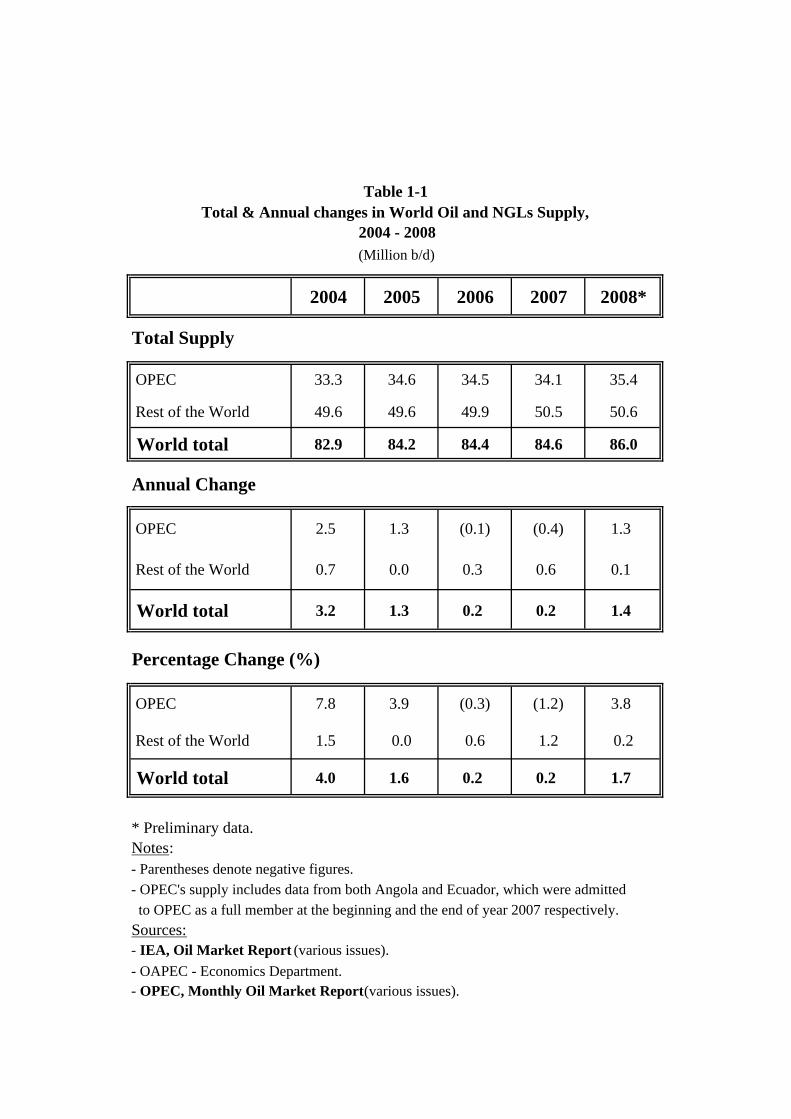
Table 1-1Total & Annual changes in World Oil and NGLs Supply,
2004 - 2008(Million b/d)
2004 2005 2006 2007 2008*
OPEC 33.3 34.6 34.5 34.1 35.4
Rest of the World 49.6 49.6 49.9 50.5 50.6
World total 82.9 84.2 84.4 84.6 86.0
OPEC 2.5 1.3 (0.1) (0.4) 1.3
Rest of the World 0.7 0.0 0.3 0.6 0.1
World total 3.2 1.3 0.2 0.2 1.4
OPEC 7.8 3.9 (0.3) (1.2) 3.8
Rest of the World 1.5 0.0 0.6 1.2 0.2
World total 4.0 1.6 0.2 0.2 1.7
* Preliminary data.Notes:- Parentheses denote negative figures.- OPEC's supply includes data from both Angola and Ecuador, which were admitted to OPEC as a full member at the beginning and the end of year 2007 respectively.Sources:- IEA, Oil Market Report (various issues). - OAPEC - Economics Department.- OPEC, Monthly Oil Market Report (various issues).
Total Supply
Annual Change
Percentage Change (%)

Table 1-2Growth in the World Economy and Oil Demand by Region,
2004-2008(%)
2004 2005 2006 2007 2008*
OECD countries
GDP 3.2 2.6 3.0 2.6 1.5
Oil demand 1.6 0.8 (0.4) (0.8) (3.0)
Developing countries
GDP 7.5 7.1 7.9 8.0 6.9
Oil demand 7.6 3.6 4.1 4.3 3.7
Countries in transition
GDP 8.2 6.8 8.2 8.6 7.2
Oil demand 4.4 2.1 0.0 2.1 4.1
World total
GDP 4.9 4.5 5.1 5.0 3.8
Oil demand 3.8 1.8 1.2 1.2 (0.1)
* Preliminary data.
Note: Parentheses denote negative figures.Sources:- IEA, Oil Market Report (various issues). - IMF, World Economic Outlook (various issues) .- OAPEC - Economics Department.- OPEC, Monthly Oil Market Report (various issues).
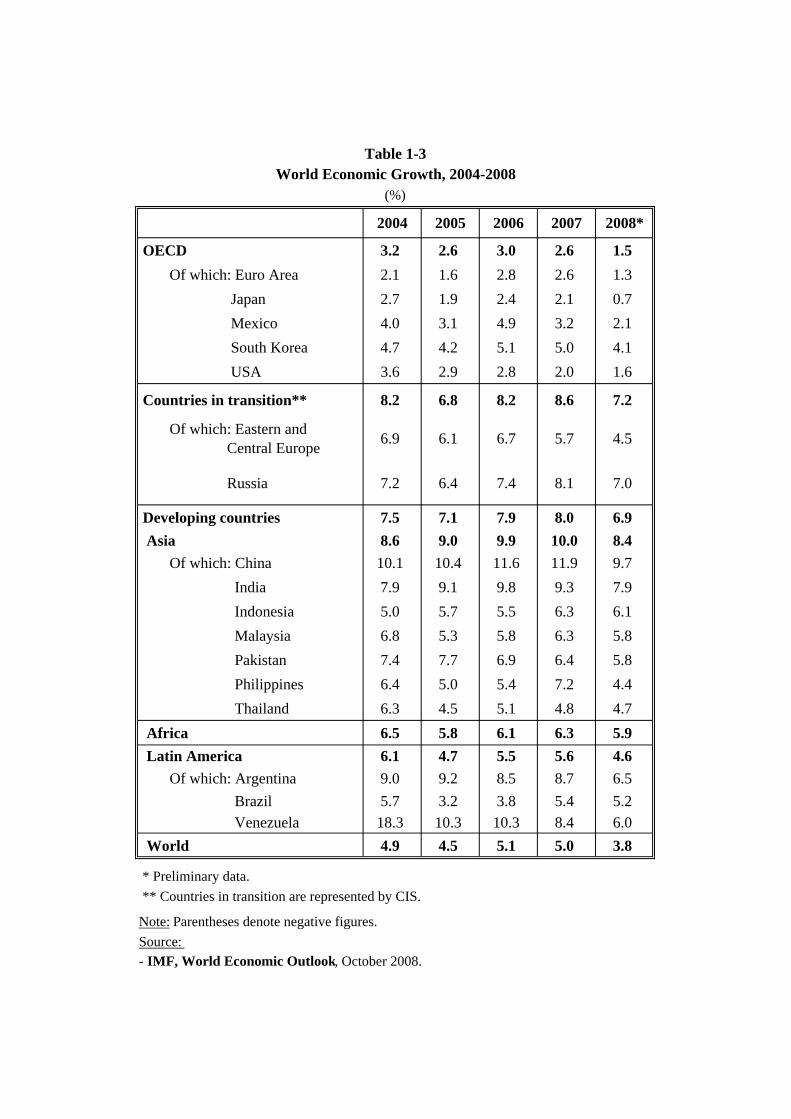
Table 1-3World Economic Growth, 2004-2008
(%)
2004 2005 2006 2007 2008*
OECD 3.2 2.6 3.0 2.6 1.5 Of which: Euro Area 2.1 1.6 2.8 2.6 1.3 Japan 2.7 1.9 2.4 2.1 0.7 Mexico 4.0 3.1 4.9 3.2 2.1 South Korea 4.7 4.2 5.1 5.0 4.1 USA 3.6 2.9 2.8 2.0 1.6
Countries in transition** 8.2 6.8 8.2 8.6 7.2
Of which: Eastern and Central Europe 6.9 6.1 6.7 5.7 4.5
Russia 7.2 6.4 7.4 8.1 7.0
Developing countries 7.5 7.1 7.9 8.0 6.9 Asia 8.6 9.0 9.9 10.0 8.4 Of which: China 10.1 10.4 11.6 11.9 9.7 India 7.9 9.1 9.8 9.3 7.9 Indonesia 5.0 5.7 5.5 6.3 6.1 Malaysia 6.8 5.3 5.8 6.3 5.8 Pakistan 7.4 7.7 6.9 6.4 5.8 Philippines 6.4 5.0 5.4 7.2 4.4 Thailand 6.3 4.5 5.1 4.8 4.7 Africa 6.5 5.8 6.1 6.3 5.9 Latin America 6.1 4.7 5.5 5.6 4.6 Of which: Argentina 9.0 9.2 8.5 8.7 6.5 Brazil 5.7 3.2 3.8 5.4 5.2 Venezuela 18.3 10.3 10.3 8.4 6.0 World 4.9 4.5 5.1 5.0 3.8
* Preliminary data. ** Countries in transition are represented by CIS.
Note: Parentheses denote negative figures.Source: - IMF, World Economic Outlook, October 2008.

Table 1-4 Total & Annual Change in World Oil Demand, 2004-2008
(Million b/d)
2004 2005 2006 2007 2008*
World total demand 82.4 83.9 84.9 85.9 85.8
Annual Change in World Oil Demand (Million b/d)
3.0 1.5 1.0 1.0 (0.1)
Change (%) 3.8 1.8 1.2 1.2 (0.1)
* Preliminary data.Sources:- IEA, Oil Market Report (various issues). - OAPEC - Economics Department.- OPEC, Monthly Oil Market Report (various issues).

Table 1-5World Oil Demand by Region, 2004-2008
(Million b/d)
2004 2005 2006 2007 2008*
OECD countries 49.4 49.8 49.6 49.2 47.7 Developing countries 28.3 29.3 30.5 31.8 33.0 Countries in transition 4.7 4.8 4.8 4.9 5.1
World total 82.4 83.9 84.9 85.9 85.8
* Preliminary data.
Sources:- IEA, Oil Market Report (various issues).
- OAPEC - Economics Department.- OPEC, Monthly Oil Market Report (various issues).
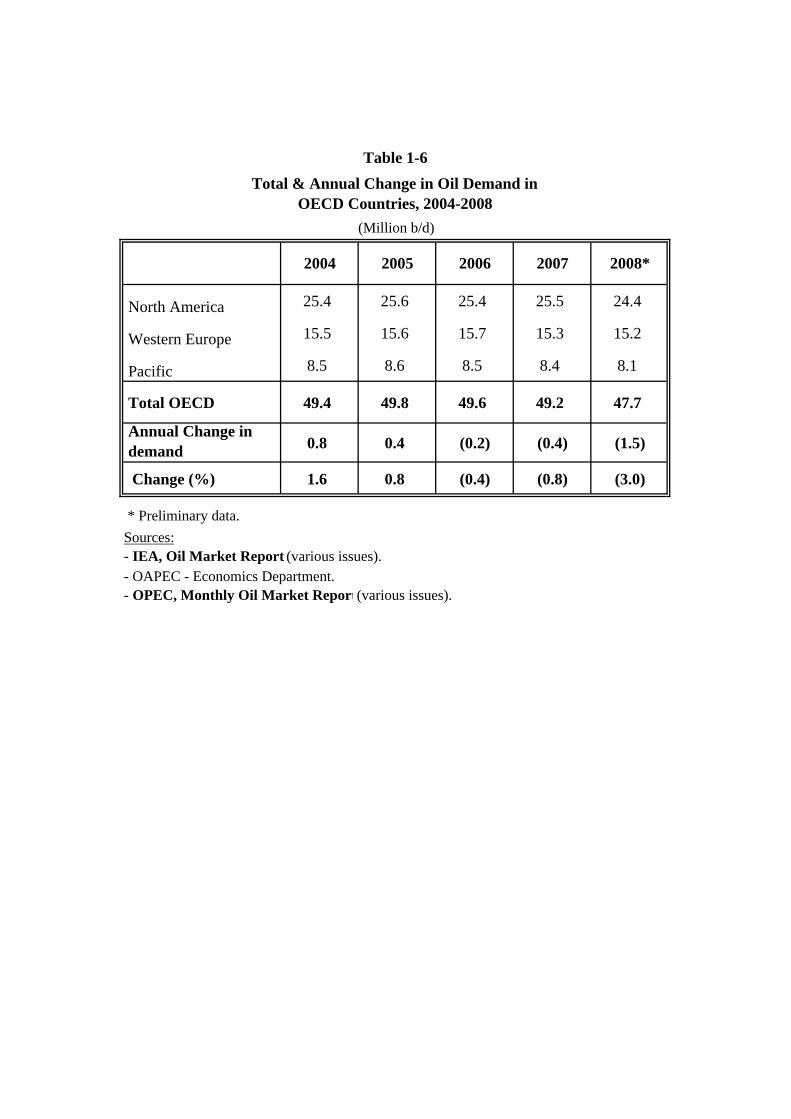
Table 1-6 Total & Annual Change in Oil Demand in
OECD Countries, 2004-2008(Million b/d)
2004 2005 2006 2007 2008*
North America 25.4 25.6 25.4 25.5 24.4
Western Europe 15.5 15.6 15.7 15.3 15.2
Pacific 8.5 8.6 8.5 8.4 8.1
Total OECD 49.4 49.8 49.6 49.2 47.7
Annual Change in demand 0.8 0.4 (0.2) (0.4) (1.5)
Change (%) 1.6 0.8 (0.4) (0.8) (3.0)
* Preliminary data.Sources:- IEA, Oil Market Report (various issues). - OAPEC - Economics Department.- OPEC, Monthly Oil Market Report (various issues).

Table 1-7 Total & Annual Change in Oil Demand in
Developing Countries, 2004-2008(Million b/d)
2004 2005 2006 2007 2008*
Arab countries 4.2 4.6 4.9 5.2 5.4
Of which: Member countries 3.6 3.9 4.2 4.5 4.7 Other Arab countries 0.6 0.7 0.7 0.7 0.7 Other countries in the Middle East and Africa 4.4 4.1 4.3 4.4 4.6
Total Middle East and Africa 8.6 8.7 9.2 9.6 10.0
Asian developing countries 14.8 15.4 16.0 16.7 17.3
Of which: China 6.5 6.7 7.2 7.6 8.0 India 2.6 2.6 2.6 2.9 3.1 Other countries 5.7 6.1 6.4 6.2 6.2
Latin America 4.9 5.2 5.3 5.5 5.7
Of which: Brazil 2.2 2.2 2.2 2.3 2.4 Other countries 2.7 3.0 3.1 3.2 3.3
Total developing countries 28.3 29.3 30.5 31.8 33.0
Annual Change in demand in developing countries 2.0 1.0 1.2 1.3 1.2
Change (%) 7.6 3.6 4.1 4.3 3.7
* Preliminary data.Sources:
- IEA, Oil Market Report (various issues). - OAPEC - Economics Department.- OPEC, Monthly Oil Market Report (various issues).
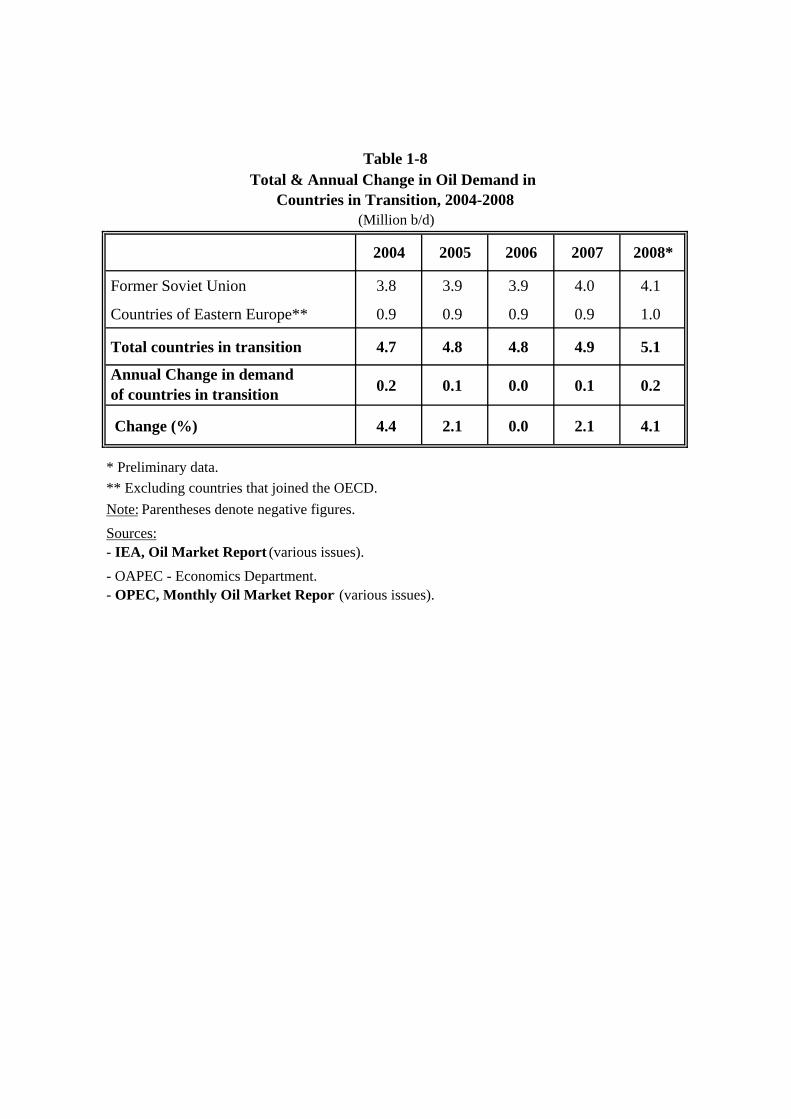
Table 1-8Total & Annual Change in Oil Demand in
Countries in Transition, 2004-2008(Million b/d)
2004 2005 2006 2007 2008*
Former Soviet Union 3.8 3.9 3.9 4.0 4.1
Countries of Eastern Europe** 0.9 0.9 0.9 0.9 1.0
Total countries in transition 4.7 4.8 4.8 4.9 5.1
Annual Change in demand of countries in transition 0.2 0.1 0.0 0.1 0.2
Change (%) 4.4 2.1 0.0 2.1 4.1
* Preliminary data.** Excluding countries that joined the OECD.Note: Parentheses denote negative figures.Sources:- IEA, Oil Market Report (various issues). - OAPEC - Economics Department.- OPEC, Monthly Oil Market Report (various issues).

Table 1-9Spot Price of OPEC Basket of Crudes, 2004-2008
($/barrel)
2004 2005 2006 2007 2008
January 30.3 40.2 58.5 50.7 88.4
February 29.6 41.7 56.6 54.5 90.6
March 32.1 49.1 57.9 58.5 99.0
April 32.4 49.6 64.4 63.6 105.2
May 36.3 46.9 65.1 64.5 119.4
June 34.6 52.0 64.6 66.9 128.3
July 36.3 53.1 68.9 71.9 131.2
August 40.3 57.8 68.8 68.7 112.4
September 40.4 57.9 59.3 74.2 96.9
October 45.4 54.6 55.0 79.3 69.2
November 38.9 51.3 55.4 88.8 49.8
December 35.7 53.1 57.9 87.1 38.6
First quarter 30.7 43.7 57.7 54.6 92.7
Second quarter 34.5 49.5 64.7 65.0 117.6
Third quarter 39.0 56.3 65.7 71.6 113.5
Fourth quarter 40.0 53.0 56.1 85.1 52.5
Annual average 36.0 50.6 61.1 69.1 94.1
Sources:- OAPEC - Economics Department- OPEC, Monthly Oil Market Report(various issues).
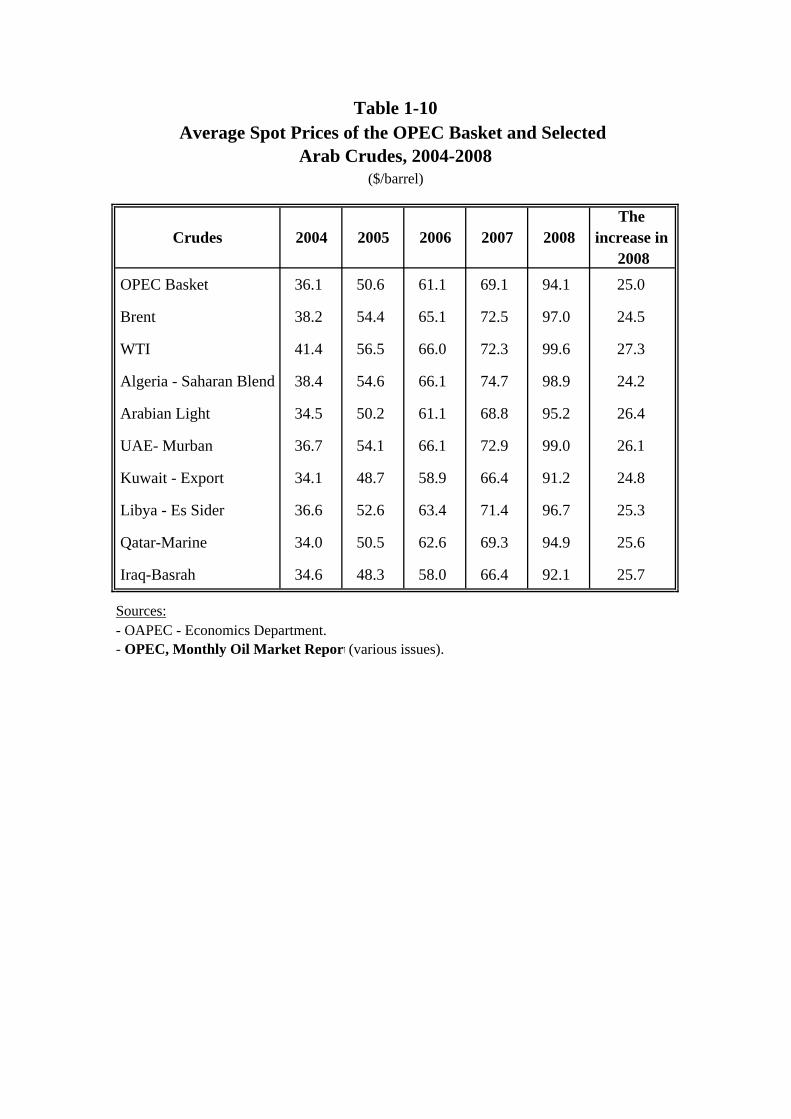
Table 1-10Average Spot Prices of the OPEC Basket and Selected
Arab Crudes, 2004-2008($/barrel)
Crudes 2004 2005 2006 2007 2008The
increase in 2008
OPEC Basket 36.1 50.6 61.1 69.1 94.1 25.0
Brent 38.2 54.4 65.1 72.5 97.0 24.5
WTI 41.4 56.5 66.0 72.3 99.6 27.3
Algeria - Saharan Blend 38.4 54.6 66.1 74.7 98.9 24.2
Arabian Light 34.5 50.2 61.1 68.8 95.2 26.4
UAE- Murban 36.7 54.1 66.1 72.9 99.0 26.1
Kuwait - Export 34.1 48.7 58.9 66.4 91.2 24.8
Libya - Es Sider 36.6 52.6 63.4 71.4 96.7 25.3
Qatar-Marine 34.0 50.5 62.6 69.3 94.9 25.6
Iraq-Basrah 34.6 48.3 58.0 66.4 92.1 25.7
Sources:- OAPEC - Economics Department.- OPEC, Monthly Oil Market Report (various issues).

Nominal Price Index* 1995=100 Real 1995 Prices
1995 16.9 100.0 16.91996 20.3 101.9 19.91997 18.7 103.6 18.01998 12.3 105.0 11.71999 17.5 105.9 16.52000 27.6 107.5 25.72001 23.1 109.6 21.12002 24.3 111.3 21.82003 28.2 113.1 24.92004 36.0 115.2 31.22005 50.6 117.5 43.02006 61.0 120.0 50.82007 69.1 122.3 56.5
2008** 94.1 125.0 75.3
* The index represents the GDP Deflator of industrial countries as published by the IMF.** Preliminary data.Sources:
-IMF, International Financial Statistics Yearbook , September 2007. - OAPEC - Economics Department- OPEC, Monthly Oil Market Report(various issues).
Table 1-11Nominal and Real Prices of Crude Oil, 1995-2008
($/barrel)
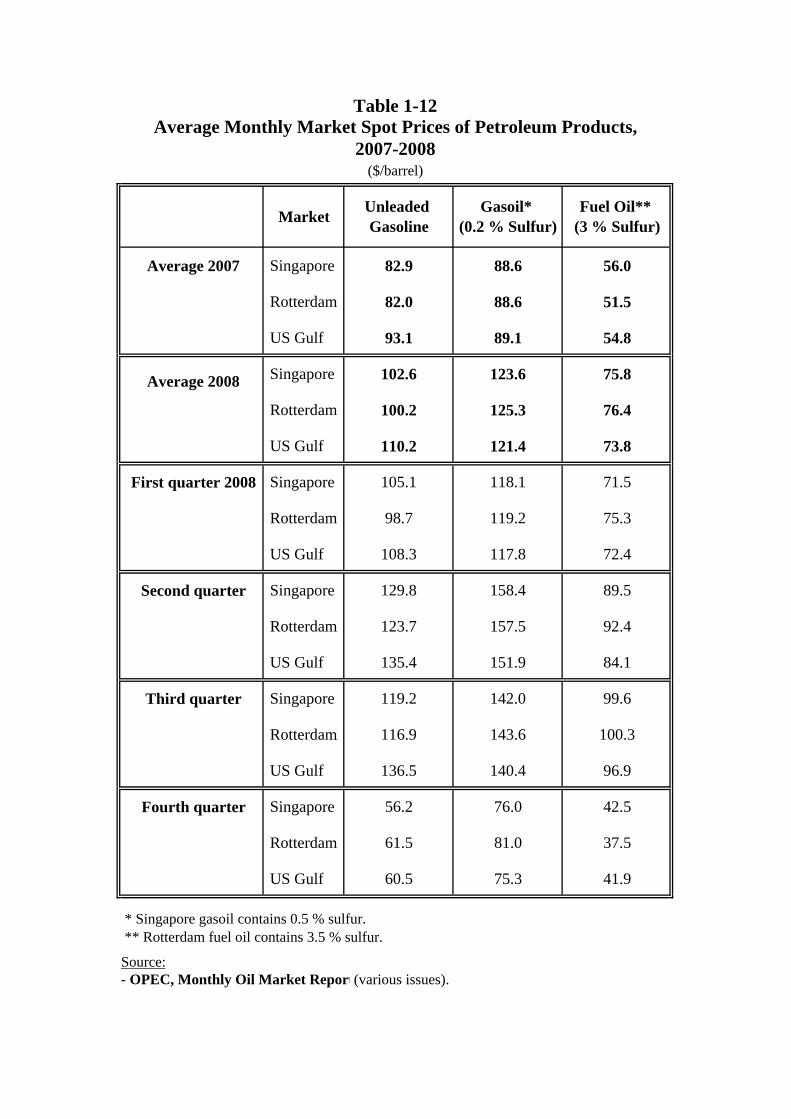
Table 1-12Average Monthly Market Spot Prices of Petroleum Products,
2007-2008($/barrel)
Market Unleaded Gasoline
Gasoil* (0.2 % Sulfur)
Fuel Oil** (3 % Sulfur)
Average 2007 Singapore 82.9 88.6 56.0
Rotterdam 82.0 88.6 51.5
US Gulf 93.1 89.1 54.8
Average 2008 Singapore 102.6 123.6 75.8
Rotterdam 100.2 125.3 76.4
US Gulf 110.2 121.4 73.8
First quarter 2008 Singapore 105.1 118.1 71.5
Rotterdam 98.7 119.2 75.3
US Gulf 108.3 117.8 72.4
Second quarter Singapore 129.8 158.4 89.5
Rotterdam 123.7 157.5 92.4
US Gulf 135.4 151.9 84.1
Third quarter Singapore 119.2 142.0 99.6
Rotterdam 116.9 143.6 100.3
US Gulf 136.5 140.4 96.9
Fourth quarter Singapore 56.2 76.0 42.5
Rotterdam 61.5 81.0 37.5
US Gulf 60.5 75.3 41.9
* Singapore gasoil contains 0.5 % sulfur. ** Rotterdam fuel oil contains 3.5 % sulfur.
Source:- OPEC, Monthly Oil Market Report(various issues).

Price without
TaxTax
End- UserPrice
Tax (%)
Price without
TaxTax
End- UserPrice
Tax (%)
Canada 0.74 0.34 1.08 31.48 0.46 0.26 0.72 36.11
France 0.75 1.21 1.96 61.73 0.49 1.02 1.51 67.55
Germany 0.77 1.29 2.06 62.62 0.45 1.07 1.52 70.39
Italy 0.82 1.16 1.98 58.59 0.56 0.97 1.53 63.40
Japan 0.78 0.66 1.44 45.83 0.76 0.64 1.40 45.71
Spain 0.78 0.80 1.58 50.63 0.53 0.67 1.20 55.83
United Kingdom 0.73 1.36 2.09 65.07 0.47 0.99 1.46 67.81
USA 0.70 0.11 0.81 13.58 0.46 0.11 0.57 19.30
Source:
- IEA, Oil Market Report (various issues).
Table 1-13Share of Tax in Gasoline Prices in some Industrial Countries,2007-2008
($/liter)
November 2007 November 2008

Table 1-14Spot Tanker Freight Rates, 2007 - 2008
(World scale)
Arabian Gulf - East *
Arabian Gulf -West **
Mediterranean - Mediterranean ***
Average 2007 91 67 145 January 2007 73 54 206 February 73 52 113 March 99 73 154 April 75 60 158 May 96 68 182 June 78 64 109 July 64 49 118 August 59 48 91 September 60 46 100 October 61 47 149 November 96 73 151 December 256 171 210 Average 2008 136 99 205 January 2008 156 118 188 February 126 90 144 March 119 90 222 April 128 91 265 May 204 138 279 June 201 139 237 July 235 144 278 August 92 89 181 September 119 92 183 October 105 86 162 November 70 61 120 December 77 54 204
* Vessels of 230-280 dwt.** Vessels of 270-285 dwt.*** Vessels of 80-85 dwt.Source:- OPEC, Monthly Oil Market Report (various issues).
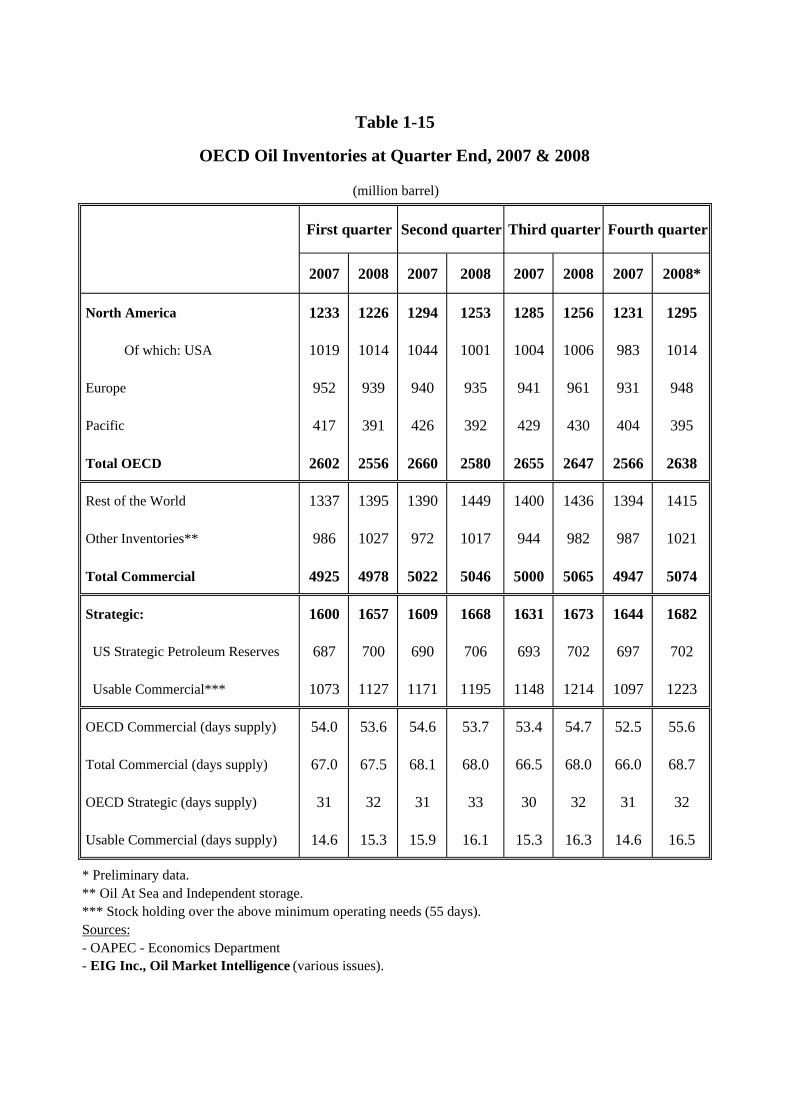
2007 2008 2007 2008 2007 2008 2007 2008*
North America 1233 1226 1294 1253 1285 1256 1231 1295
Of which: USA 1019 1014 1044 1001 1004 1006 983 1014
Europe 952 939 940 935 941 961 931 948
Pacific 417 391 426 392 429 430 404 395
Total OECD 2602 2556 2660 2580 2655 2647 2566 2638
Rest of the World 1337 1395 1390 1449 1400 1436 1394 1415
Other Inventories** 986 1027 972 1017 944 982 987 1021
Total Commercial 4925 4978 5022 5046 5000 5065 4947 5074
Strategic: 1600 1657 1609 1668 1631 1673 1644 1682
US Strategic Petroleum Reserves 687 700 690 706 693 702 697 702
Usable Commercial*** 1073 1127 1171 1195 1148 1214 1097 1223
OECD Commercial (days supply) 54.0 53.6 54.6 53.7 53.4 54.7 52.5 55.6
Total Commercial (days supply) 67.0 67.5 68.1 68.0 66.5 68.0 66.0 68.7
OECD Strategic (days supply) 31 32 31 33 30 32 31 32
Usable Commercial (days supply) 14.6 15.3 15.9 16.1 15.3 16.3 14.6 16.5
* Preliminary data.** Oil At Sea and Independent storage.*** Stock holding over the above minimum operating needs (55 days).Sources:- OAPEC - Economics Department- EIG Inc., Oil Market Intelligence (various issues).
Table 1-15
OECD Oil Inventories at Quarter End, 2007 & 2008
(million barrel)
First quarter Second quarter Third quarter Fourth quarter

Table 1-16Value of Oil Exports in OAPEC Member Countries,
2004-2008($ Million)
2004 2005 2006 2007 2008*
Algeria 13862 21029 25492 27757 38543
Bahrain 3450 5066 5923 7106 5895
Egypt*** 1829 2526 1812 3502 4197
Iraq 17751 24058 31585 38056 63000
Kuwait 26670 42440 53109 59026 71218
Libya 18653 27518 34110 36944 52084
Qatar 11694 13774 17685 18741 27428
Saudi Arabia 92856 137050 162000 171837 267174
Syria 2639 3672 5219 5644 7989
Tunisia ** ** ** ** **
UAE 29624 43502 53222 56025 80635
Total 219028 320635 390157 424638 618163
* Preliminary data. ** Preliminary data indicate that oil consumption exceeds oil production.*** Official sources for 2007
Sources:- OAPEC - Economics Department. - OPEC, Monthly Oil Market Report(various issues).

Table 1-17Value of OAPEC Oil Exports in Current and
Real Prices, 1995-2008($ Billion)
Year At Current Prices Expressed in Real 1995 Prices
1995 93.7 93.71996 108.7 106.91997 110.0 106.21998 76.8 73.11999 109.7 103.62000 177.2 164.82001 148.6 135.62002 142.0 127.62003 159.5 141.02004 219.0 190.0 2005 320.6 272.7 2006 390.2 325.12007 424.6 347.2
2008* 618.2 494.6 * Preliminary data.Note: Real revenues are obtained by deflating current prices by the GDP Deflator of industrial countries as published by the IMF Source:- OAPEC - Economics Department.

Table 1-18Energy Consumption in the Arab Countries, 2004-2008
(Thousand boe/d)
2004 2005 2006 2007(1) 2008(2)
Petroleum products * Member countries 3845 4055 4326 4520 4702
Other Arab countries 617 645 661 675 698
Total Arab countries 4462 4701 4987 5195 5400
Natural gas Member countries 3460 3730 3912 4093 4300
Other Arab countries 116 124 140 150 155
Total Arab countries 3576 3854 4052 4243 4455
Hydroelectricity Member countries 100 100 100 100 100
Other Arab countries 35 35 35 35 35
Total Arab countries 135 136 136 136 136
Coal Member countries 12 12 11 12 12
Other Arab countries 12 14 13 13 13
Total Arab countries 24 26 24 25 25
Total Energy
Member countries 7417 7898 8350 8725 9114
Other Arab countries 780 818 849 874 901
Total Arab countries 8196 8716 9199 9599 10015
* Petroleum products include crude oil used in power plants. - (1) Preliminary data. - (2) Estimated data.Note : The total may not add up due to rounding.Sources:- Country papers presented to the Seventh Arab Energy Conference, Cairo, Egypt, 11 - 14 May, 2002. - Country papers presented to the Eighth Arab Energy Conference, Amman, Jordan 14 - 17 May, 2006. - OAPEC - Economics Department.
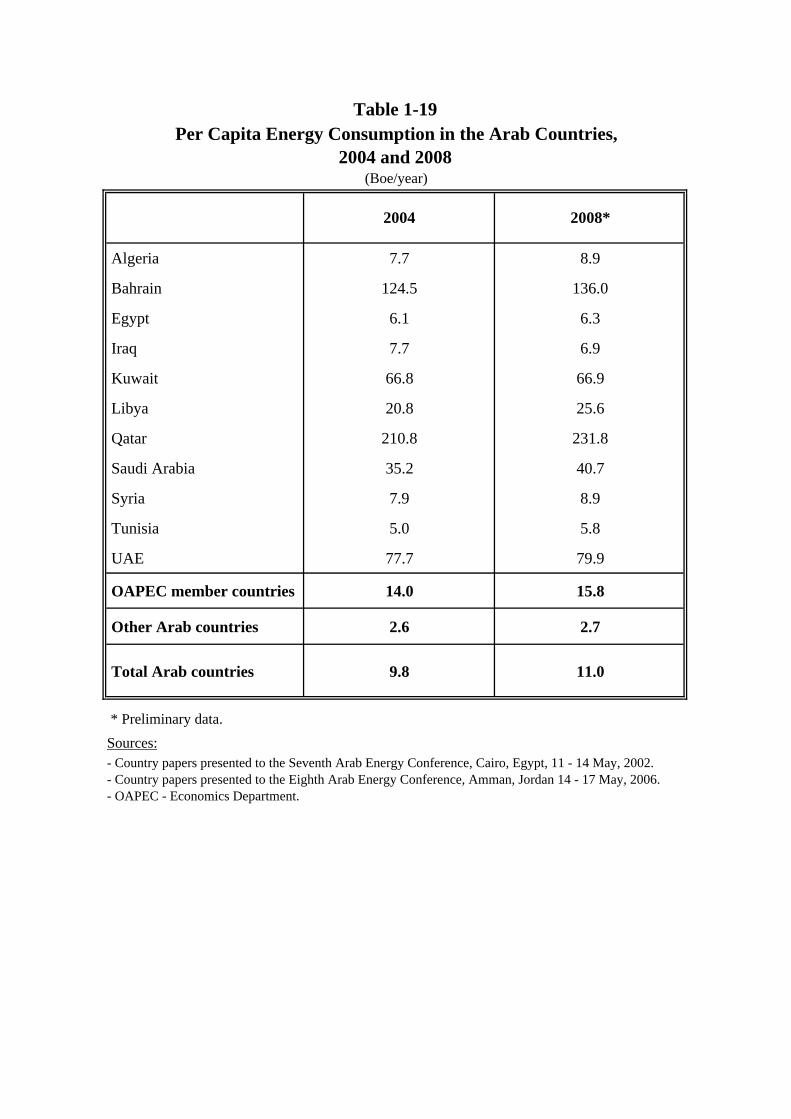
Table 1-19Per Capita Energy Consumption in the Arab Countries,
2004 and 2008(Boe/year)
2004 2008*
Algeria 7.7 8.9
Bahrain 124.5 136.0
Egypt 6.1 6.3
Iraq 7.7 6.9
Kuwait 66.8 66.9
Libya 20.8 25.6
Qatar 210.8 231.8
Saudi Arabia 35.2 40.7
Syria 7.9 8.9
Tunisia 5.0 5.8
UAE 77.7 79.9
OAPEC member countries 14.0 15.8
Other Arab countries 2.6 2.7
Total Arab countries 9.8 11.0
* Preliminary data.Sources:- Country papers presented to the Seventh Arab Energy Conference, Cairo, Egypt, 11 - 14 May, 2002. - Country papers presented to the Eighth Arab Energy Conference, Amman, Jordan 14 - 17 May, 2006. - OAPEC - Economics Department.

Table 1-20Energy Consumption in OAPEC Member Countries,
2004-2008(Thousand boe/d)
2004 2005 2006 2007(1) 2008(2)
Algeria 686 727 771 801 846
Bahrain 241 263 273 277 292
Egypt 1149 1189 1198 1229 1279
Iraq 571 552 545 565 580
Kuwait * 484 514 555 589 612
Libya 365 422 456 490 510
Qatar 437 461 507 548 585
Saudi Arabia * 2176 2320 2530 2650 2765
Syria 389 416 440 459 477
Tunisia 136 142 150 157 163
UAE 781 893 924 960 1005
Total 7417 7898 8350 8725 9114
* Including energy consumption in the oil industry . - (1) Preliminary data. - (2) Estimated data.Note : The total may not add up due to rounding.Sources:- Country papers presented to the Seventh Arab Energy Conference, Cairo, Egypt, 11 - 14 May, 2002.
- Country papers presented to the Eighth Arab Energy Conference, Amman, Jordan 14 - 17 May, 2006. - OAPEC - Economics Department.

Table 1-21Energy Consumption in OAPEC Member Countries by Source,
2004-2008(Thousand boe/d)
2004 2005 2006 2007(1) 2008(2)
Petroleum products* 3845 4055 4326 4520 4702
Natural gas 3460 3730 3912 4093 4300
Hydroelectricity 100 100 100 100 100
Coal 12 12 11 12 12
Total energy 7417 7898 8350 8725 9114
* Including Oil consumption of the power plants in some OAPEC member countries. - (1) Preliminary data. - (2) Estimated data.Note : The total may not add up due to rounding.Sources:- Country papers presented to the Seventh Arab Energy Conference, Cairo, Egypt, 11 - 14 May, 2002.
- Country papers presented to the Eighth Arab Energy Conference, Amman, Jordan 14 - 17 May, 2006.
- OAPEC - Economics Department.
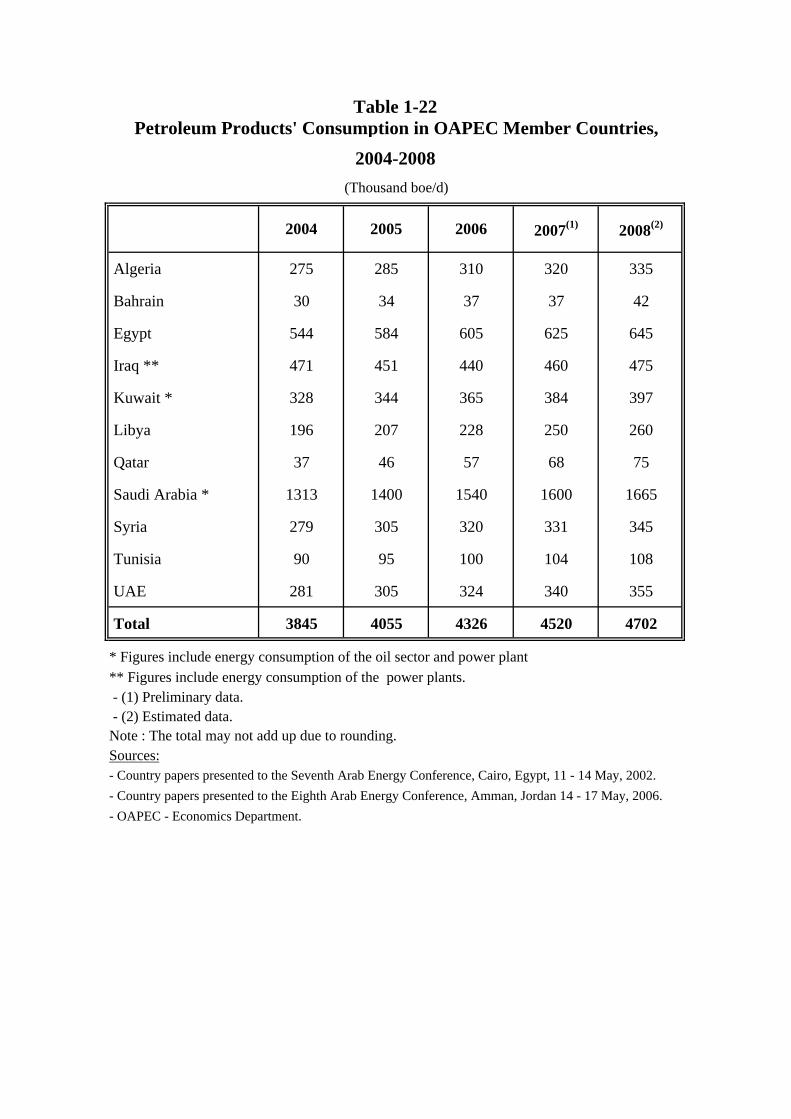
Table 1-22Petroleum Products' Consumption in OAPEC Member Countries,
2004-2008(Thousand boe/d)
2004 2005 2006 2007(1) 2008(2)
Algeria 275 285 310 320 335
Bahrain 30 34 37 37 42
Egypt 544 584 605 625 645
Iraq ** 471 451 440 460 475
Kuwait * 328 344 365 384 397
Libya 196 207 228 250 260
Qatar 37 46 57 68 75
Saudi Arabia * 1313 1400 1540 1600 1665
Syria 279 305 320 331 345
Tunisia 90 95 100 104 108
UAE 281 305 324 340 355
Total 3845 4055 4326 4520 4702
* Figures include energy consumption of the oil sector and power plant** Figures include energy consumption of the power plants. - (1) Preliminary data. - (2) Estimated data.Note : The total may not add up due to rounding.Sources:- Country papers presented to the Seventh Arab Energy Conference, Cairo, Egypt, 11 - 14 May, 2002. - Country papers presented to the Eighth Arab Energy Conference, Amman, Jordan 14 - 17 May, 2006. - OAPEC - Economics Department.
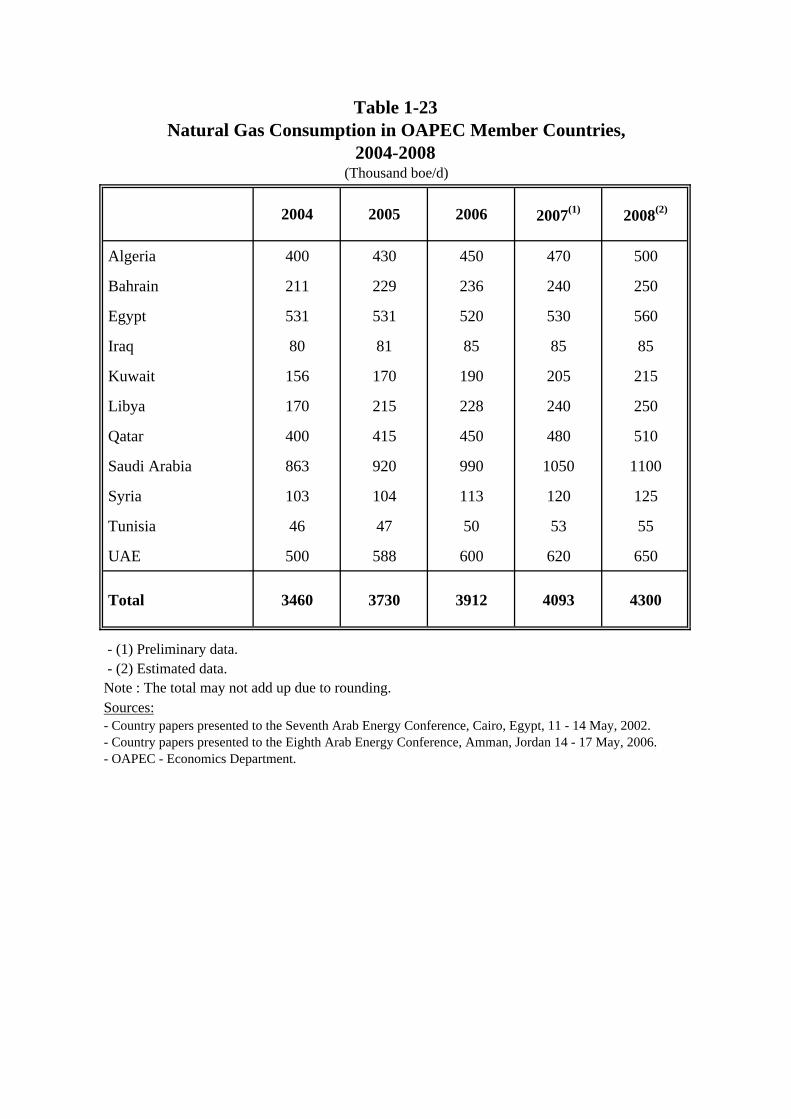
Table 1-23Natural Gas Consumption in OAPEC Member Countries,
2004-2008(Thousand boe/d)
2004 2005 2006 2007(1) 2008(2)
Algeria 400 430 450 470 500
Bahrain 211 229 236 240 250
Egypt 531 531 520 530 560
Iraq 80 81 85 85 85
Kuwait 156 170 190 205 215
Libya 170 215 228 240 250
Qatar 400 415 450 480 510
Saudi Arabia 863 920 990 1050 1100
Syria 103 104 113 120 125
Tunisia 46 47 50 53 55
UAE 500 588 600 620 650
Total 3460 3730 3912 4093 4300
- (1) Preliminary data. - (2) Estimated data.Note : The total may not add up due to rounding.Sources:- Country papers presented to the Seventh Arab Energy Conference, Cairo, Egypt, 11 - 14 May, 2002. - Country papers presented to the Eighth Arab Energy Conference, Amman, Jordan 14 - 17 May, 2006. - OAPEC - Economics Department.
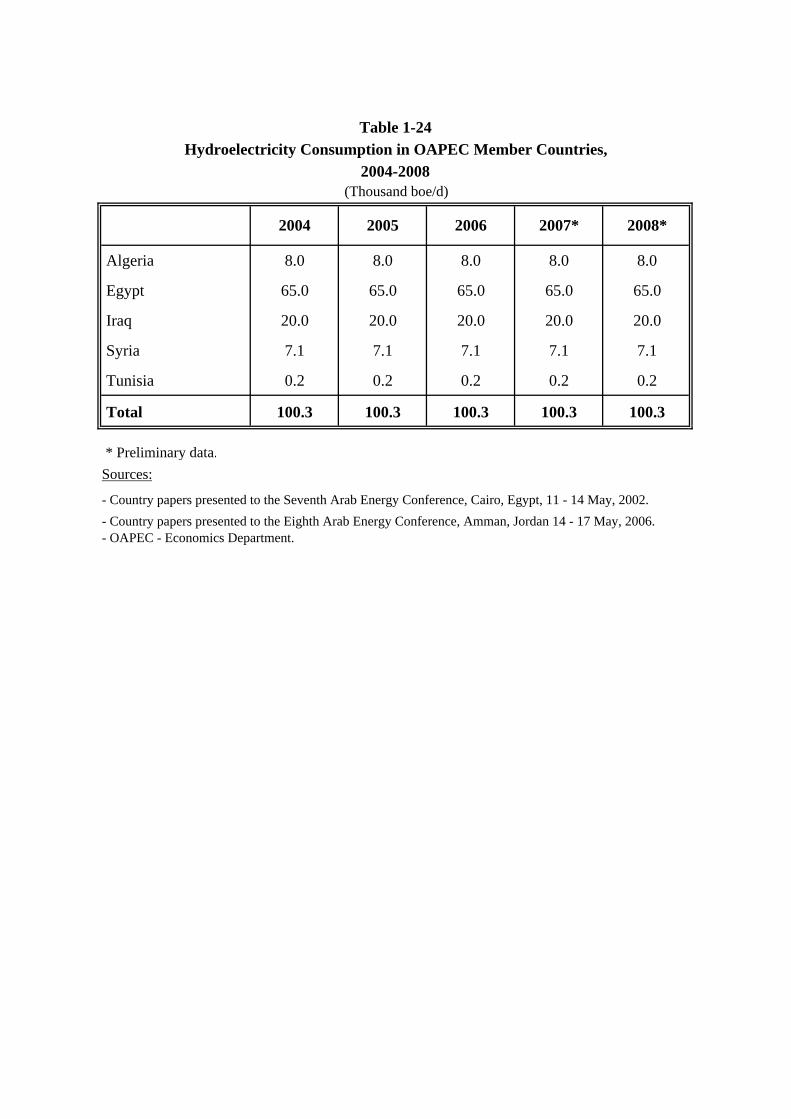
Table 1-24Hydroelectricity Consumption in OAPEC Member Countries,
2004-2008(Thousand boe/d)
2004 2005 2006 2007* 2008*
Algeria 8.0 8.0 8.0 8.0 8.0
Egypt 65.0 65.0 65.0 65.0 65.0
Iraq 20.0 20.0 20.0 20.0 20.0
Syria 7.1 7.1 7.1 7.1 7.1
Tunisia 0.2 0.2 0.2 0.2 0.2
Total 100.3 100.3 100.3 100.3 100.3
* Preliminary data.Sources:
- Country papers presented to the Seventh Arab Energy Conference, Cairo, Egypt, 11 - 14 May, 2002. - Country papers presented to the Eighth Arab Energy Conference, Amman, Jordan 14 - 17 May, 2006. - OAPEC - Economics Department.

Table 1-25Coal Consumption in OAPEC Member Countries,
2004-2008(Thousand boe/d)
2004 2005 2006 2007* 2008*
Algeria 3.2 3.4 3.2 3.3 3.3
Egypt 8.8 8.6 8.2 8.5 8.5
Total 12.0 12.0 11.4 11.8 11.8
* Preliminary data.Sources:- Country papers presented to the Seventh Arab Energy Conference, Cairo, Egypt, 11 - 14 May, 2002. - Country papers presented to the Eighth Arab Energy Conference, Amman, Jordan 14 - 17 May, 2006. - OAPEC - Economics Department.
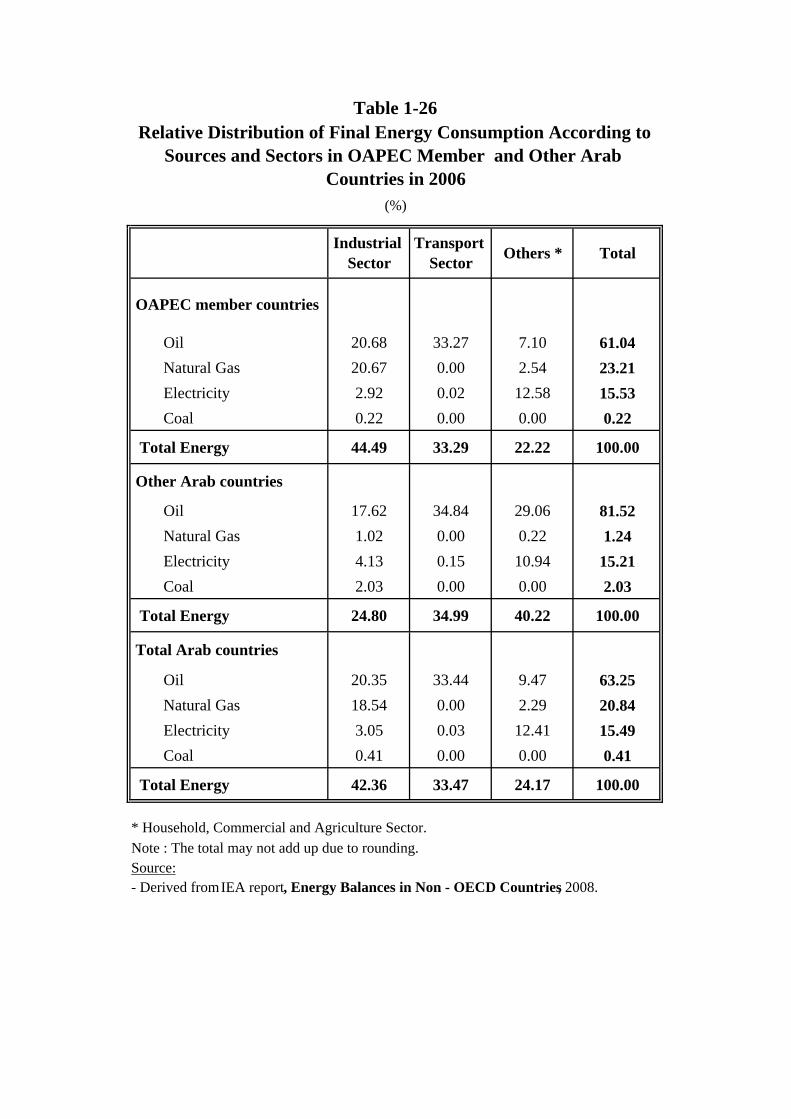
Table 1-26Relative Distribution of Final Energy Consumption According to
Sources and Sectors in OAPEC Member and Other Arab Countries in 2006
(%)
Industrial Sector
Transport Sector Others * Total
OAPEC member countries
Oil 20.68 33.27 7.10 61.04 Natural Gas 20.67 0.00 2.54 23.21 Electricity 2.92 0.02 12.58 15.53 Coal 0.22 0.00 0.00 0.22
Total Energy 44.49 33.29 22.22 100.00
Other Arab countries
Oil 17.62 34.84 29.06 81.52 Natural Gas 1.02 0.00 0.22 1.24 Electricity 4.13 0.15 10.94 15.21 Coal 2.03 0.00 0.00 2.03
Total Energy 24.80 34.99 40.22 100.00
Total Arab countries
Oil 20.35 33.44 9.47 63.25 Natural Gas 18.54 0.00 2.29 20.84 Electricity 3.05 0.03 12.41 15.49 Coal 0.41 0.00 0.00 0.41
Total Energy 42.36 33.47 24.17 100.00
* Household, Commercial and Agriculture Sector.Note : The total may not add up due to rounding.Source:- Derived from IEA report, Energy Balances in Non - OECD Countries, 2008.

Table 1-27Domestic Prices of Petroleum Products in OAPEC
Member Countries, 2008(Local currency/liter)
Currency Gasoline Household Gas oil/ LPG
Premium Regular Kerosene Diesel
Algeria Dinar 23.0 21.2 - 13.7 9.0
Bahrain Fils 100 80 25 70 100*
Egypt Piaster 130 90 75 75 250**
Iraq Dinar 50 40 5 10 200**
Kuwait Fils 65 60 55 55 750**
Libya Dirham 150 105 80 140 1500**
Qatar Dirham 70 65 55 60 10
Saudi Arabia Halala 60.0 - 43.4 37.1 67.4
Syria Lira 48.0 - 22.7 18.0 240**
Tunisia Millime 998 998 180 357 158
UAE Fils 168 138 133 165 215**
* Per kilogram.** Per cylinder.Sources:- Country papers presented to the Seventh Arab Energy Conference, Cairo, Egypt, 11 - 14 May, 2002. - Country papers presented to the Eighth Arab Energy Conference, Amman, Jordan 14 - 17 May, 2006. - OAPEC - Economics Department.
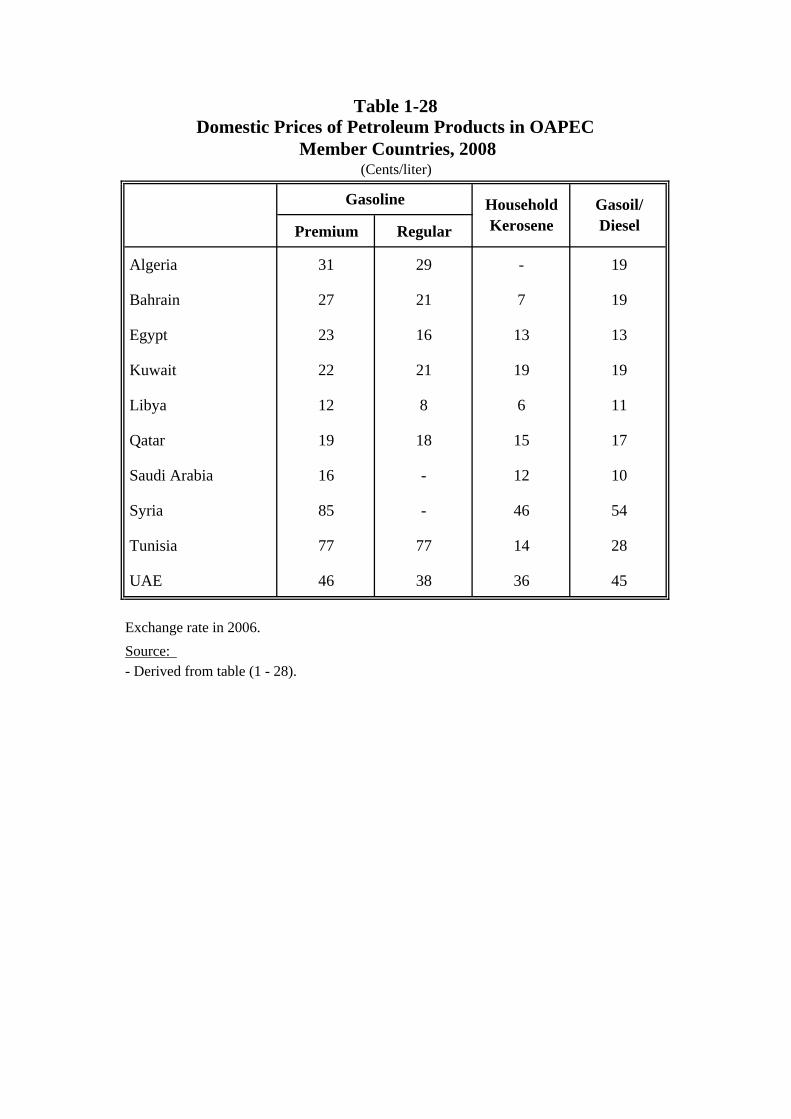
Table 1-28Domestic Prices of Petroleum Products in OAPEC
Member Countries, 2008(Cents/liter)
Gasoline Household Gasoil/
Premium Regular Kerosene Diesel
Algeria 31 29 - 19
Bahrain 27 21 7 19
Egypt 23 16 13 13
Kuwait 22 21 19 19
Libya 12 8 6 11
Qatar 19 18 15 17
Saudi Arabia 16 - 12 10
Syria 85 - 46 54
Tunisia 77 77 14 28
UAE 46 38 36 45
Exchange rate in 2006.Source: - Derived from table (1 - 28).
CHAPTER TWO
ARAB AND WORLD DEVELOPMENTS IN THE EXPLO RATION, RESERVES AND PRODUCTION
OF ENERGY RESOURCES
I. OIL AND GAS 1. Exploration and Production: An Overview
In 2008 the oil market witnessed high oil prices that reached record levels of around $147 per barrel. Despite the tirades of blame heaped on the petroleum exporting countries, supply and demand proved that the price hike was not due to a shortage of oil on the market but to speculative activities that drove up the price of the paper barrel. Prices were affected by the unemployment figures in the US, a stock selling-spree, a bigger than expected decline in US inventories, and a depreciation of the dollar.
The dramatic drop in oil prices in the last quarter of 2008 to less than $40 per barrel confirmed that supply and demand were not the major cause of the wave of oil price rises. Oil exploration and production expenses rose in 2008 by about 20% compared with 2007 to reach a total of $418 billion. The US accounted for $98 billion of total expenses, Canada accounted for $27.5 billion, and the rest of the world accounted for $293 billion.
According to Lehman Brothers, based in New York, figures obtained following a survey of 398 petroleum companies showed that production companies increased their exploration and production spending by more than $35 billion in 2008.
Companies’ spending in 2007 increased around $8.5 billion more than their planned budget, the survey found. US companies alone accounted for $3.5 billion of this increase. Most companies anticipate an additional 10% increase in spending in 2009 (according to forecasts prior to the oil price drop in the fourth quarter of 2008).According to the survey, exploration and production spending in companies in the Arab countries rose, specifically in ADNOC, the UAE, by 15%, in Aramco, Saudi Arabia, by 31%, and in Sonatrach, Algeria, by 40% as shown in the following table:
Country Company Budget 2007 Exploration and Production
Billion dollars
Budget 2008 Exploration and Production
Billion dollars UAE ADNOC 1.95 2.25 Saudi Arabia Aramco 9 11.8 Algeria Sonatrach 3.5 4.9
High oil prices prompted a boost in the oil exploration sector on the global level to search for new reserves in inaccessible areas such as deep offshore areas. International oil companies allocated enormous sums in their budgets to this end. This led to a rise in the number of crews working on seismic surveys worldwide. In the Middle East the number of crews rose by 61% in 2008 over 2007. In addition, the number of rigs operating in the world increased.
Within the context of intense activity in the exploration and production sector triggered by high oil prices, a number of joint ventures and production-sharing agreements were signed in Arab countries in 2008, in addition to many producing field development agreements. In the UAE, Dana Gas company signed an agreement with Sharjah Emirate to explore and develop West Sharjah offshore block covering more than 1,000 sq km, and including Al-Zoura gas field. Preliminary investments in exploration operations are estimated at around $65 million, in addition to $55 million in development operations. Abu Dhabi National Oil Company (ADNOC) and Royal Dutch Shell Plc signed a memorandum of understanding under which they will explore deep offshore gas fields. In addition, Occidental Petroleum Corporation announced the signing of a preliminary agreement with ADNOC to appraise and develop Jarn Yaphour and Ramhan oil and gas fields in the Emirate of Abu Dhabi. The Jarn Yaphour field is located onshore near the city of Abu Dhabi and first production from the field, expected in 2009, is anticipated at around 10,000 barrels of oil equivalent per day. As for Ramhan field, it is located in very shallow water near the Abu Dhabi refinery. Tested in 1992 it flowed at a combined rate of 1,750 barrels of oil and 397,000 cu m of gas per day. The field is expected to come on stream in 2011 with an output of 10,000 boe/d.
Bahrain signed two exploration and production-sharing agreements, one with US Occidental and another with Thailand’s PTT oil and gas exploration company in some offshore blocks. Both company committed to hiring Bahraini contractors, employing and training Bahraini staff, also to protecting the marine environment.
In Tunisia two Vietnamese companies were awarded franchises to extract oil in Gabes Gulf, south Tunisia, covering around 3,976 sq km. It is estimated that the prospecting operation investments will be at least $2 million. Canadian Superior Energy Inc. and the Tunisian/Libyan Joint Oil Company concluded two deals, one of which includes exploration and production-sharing agreement in the offshore ‘7th November Block’ covering 3,000sq m. Another one comprises a swap agreement, which allows the Joint Oil Company to exploit the Canadian company’s offshore ‘Marinas’ block on the Canadian east coast. The offshore block is located 10 km north of the Exxon Mobil fields. The Tunisian/Libyan Joint Oil
Company was established under an international agreement concluded between Tunisia and Libya on 8 August 1988 and is part of the Tunisian Enterprise of Petroleuml Activities and Libya Oil Holding Company.
In Algeria the Italian company Eni won a bid for Kerzak block exploration license with an area of 16,000 sq km located at a distance of 400 km south west Hassi R’mel field. In partnership with Russian Rosneft, Sonatrach plans in 2012 to bring on stream between 50,000 and 60,000 b/d in Takuazet region south Algeria. The development of El-Merk field was approved with Conoco Phillips and Anadarko with an estimated cost of at least $2 million. Production from the field in 2012 is anticipated to be 100,000 boe/d in the form of crude oil and wet gas.
In Kuwait intensive exploration operations led to new oil discoveries in many fields such as Raudhatain, Ratqa, Bahra, and al-Dhabi. Kuwait drilled 13 wells as part of its first evaluation project to produce heavy oil. Kuwait Oil Company KOC expects to produce 700,000 b/d of heavy oil by 2020. New discoveries of commercial gas, condensates, and heavy oil were made in the fields of Bahra, Raudhatain, Um Naqa, Sabriya and al-Dhabi.
Among agreements made for exploration and production-sharing, one was made between Libya and the UAE’s Liwa Energy consortium for gas exploration and production sharing in Sirte basin, where at least $70 million will be spent on exploration and prospecting operations. Libya’s National Oil Corporation (NOC) signed an agreement with Shell whereby the later will start seismic surveys covering 1,750 sq km, and drill 6 exploratory wells, spending at least $95 million on exploration and prospecting operations. The company also signed a production-sharing agreement with Exxon Mobil committing it to exploration and prospecting operations in Contract Area 21, which comprises four blocks covering a total of 100,000 sq km, located offshore at a distance of around 177 km opposite the coastline of the Sirte basin. These operations include Exxon carrying a 2D seismic survey of 4,000 km, and a 3D seismic survey of 2,000 sq km at a cost of around $97 million. In addition, NOC announced signing an exploration and production-sharing agreement with the consortium of Algerian Sonatrach, Oil India and Indian Oil covering the Ghadames basin. The consortium is committed to 2,000 km of 2-D seismic survey, 2,600 sq km of 3-D seismic survey and drilling eight exploratory wells at a cost of $152 million.
On the other hand, each of Repsol-YPF SA, OMV AG and Total SA will get smaller shares of oil produced from Marzouk field, following a comprehensive revision of the terms of contracts concluded between these companies and NOC. It was reported that these companies will get 13% of the oil they produce in block NC-115 and block NC-186, where output is around 300,000 b/d. Gazprom Libya BV selected WesternGeco for 3-D
seismic surveying of 3,400 sq km in the Ghadames basin. Russian Gazprom has gained oil prospecting rights in many blocks in Libya since 2007 and reportedly spent more than $100 million on prospecting and exploration operations.
Groundstar Resources Ltd, registered in Calgary, Canada, announced signing contracts for the exploration, development and production of petroleum in Block XIV on the Syrian-Iraqi borders, and in Block XVI on the Syrian-Jordanian border. The exploration period is four years. In Syria a framework agreement for joint cooperation was signed between the Syrian Gas Company and Syrian Petroleum Company on the one hand and Total Exploration and Production Syria and Total Exploration, Production and Oil Activities, on the other. This agreement paves the way for enhanced joint cooperation and strategic partnerships that allow developing joint projects between the Syrian companies and Total, as well as creating joint job opportunities in exploration and production projects inside and outside Syrian territories. In addition, the Syrian Ministry of Petroleum and Mineral Resources and the Syrian Petroleum Company (SPC) signed with Syria Shell Petroleum Development and partners a 10-year extension agreement for development of Al-Furat Petroleum Company’s fields.
Iraq signed with Niko Resources Ltd. a production-sharing agreement, to explore and develop petroleum resources covering 846 sq km in the Qara Dagh Block in Al-Sulaimaniya area. The agreement commits Niko Resources to conducting 2D seismic surveys of 300 km, and drilling one exploration well during the first exploration phase.
Addax Petroleum Corp. acquired a 33.33% interest in the production-sharing contract of Sangaw North in the Kurdistan region of Iraq located approximately 80 km southeast of Taq-Taq field. Sterling Energy PLC runs the operations in an area stretching around 492 sq km, where a 2D seismic survey of 310 km is planned, and drilling the first exploration well is expected in mid-2009.
China National Petroleum Company (CNPC) and Iraq signed a $3 billion oil service agreement for the development of Ahdab field located at a distance of about 170 km south of Baghdad. Production is expected in three years time.
In Qatar, CGGVeritas scooped up a contract worth around $140 million from Qatar to carry out high-resolution seismic survey on the Dukhan filed. The period of the contract is 30 months.
The Egyptian General Petroleum Corporation signed three contracts with a number of British, Italian, Malaysian, and Kuwaiti companies to
explore for oil in Rashid area in the Mediterranean, in deep water west of the Nile Delta on the Mediterranean Sea, and north of Bardawil. The investments are estimated at around $2 billion.
French Total and Brazil’s Petrobras signed a three-year memorandum of understanding with Jordan’s Natural Resources Authority to extract oil shale in Wadi Magher area. The consortium will undertake an intensive one-year exploration and prospecting program, after which it will report the findings to the Jordanian government and submit a feasibility study and future plans for work, which if approved will pave the way to extending the memorandum for three more years and thereby start commercial production of oil from shale. It is reported that Jordan has 40-60 billion tons of oil shale reserves distributed among more than 20 sites in the Kingdom.
In Sudan the Swedish company Lundin Petroleum started drilling exploration well Muny Deng-1 in Block 5B where it targets Cretaceous depth of 2,300 m.
In Oman CGGVeritas was awarded a contract by Petroleum Development Oman (PDO) to undertake high-density onshore seismic survey. This contract will increase the number of active vibrator fleets and double crew capacity to 25,000 channels, making it the largest high-resolution seismic operation in Oman. Work under the new configuration will commence at the beginning of 2009, and is expected to continue through the first quarter of 2011.
In Yemen, an Ethiopian-Yemeni technical committee signed a memorandum of understanding between the two countries in the fields of oil, gas and energy. The agreement affirms the importance of encouraging investment between the two countries in the areas of oil, gas and energy.
In spite of intensive world exploration operations driven by high oil prices (prior to their drop in the second half of 2008), world oil reserves rose slightly by no more than 0.9% to reach 1,164.3 billion barrels at the end of 2008 compared with 1,153.67 billion barrels at the end of 2007. In addition, 31 billion barrels of oil were produced in 2008. Exploration operations paid off in some countries, especially in Brazil where state-owned Petrobras and British BG Group announced the discovery of Carioca, a giant oil field which could hold a reserve of 33 billion barrels of oil equivalent. Similarly, Anadarko Petroleum Corp. and Devon Energy Corp. announced a new oil discovery in Block BM-C-30 where 1-APL-1-ESS well was drilled at a depth of around 1,417 m. The Block is located in Campos basin opposite the Brazilian coast at a distance of around 38 km south east of the giant field Jupiter. Studies carried on this discovery revealed preliminary figures suggesting Carioca specifications match those of Jupiter. The discovered reserve is estimated at 2 billion barrels of oil
equivalent. However, these figures are not accurate enough to be listed among world oil reserves, mainly because they do not specify the quantity of gas and oil discovered separately but are calculated as oil equivalent only.
Arab countries’ oil reserves remained close to their 2007 level, rising slightly by no more than 0.4% to around 659 billion barrels in 2008 compared with 656 billion barrels in 2007. Most of the increase was accounted for by Libya. Estimates of world natural gas reserves witnessed an increase of 1.1% to over 177 trillion cu m at the end of 2008, compared with 175.2 trillion cu m in 2007. Estimates of Arab countries natural gas reserves rose slightly by no more than 0.2% from around 53.6 trillion cu m in 2007 to 53.7 trillion cu m in 2008. The increase was accounted for by Egypt and Syria.
The Arab states witnessed extensive exploration operations in 2008 that led to 92 discoveries, of which the most recent was in Morocco where Irish Circle Oil holding Ouled N’Zala permit, announced a gas discovery northeast of the capital Rabat. Circle Oil reported that ONZ6 well produced when tested 3.32 million cu ft (around 94,000 cu m) of gas. The well was completed and closed awaiting future production. On its Ouled N’Zala permit, the company is continuing a six-well drilling planned program. In Yemen an oil discovery was made in crystalline base rocks. Canadian CalValley Petroleum Inc. announced in Yemen at the beginning of 2008 its plans to test appraisal well Qarn Qaymah-2, following the company’s first oil discovery over the granite basement zone of block 9 located at south of Sayun-Masila basin. The well was drilled to a depth of 1975 m to appraise Kohlan formation sandstones, which were previously tested in well Qarn Qaymah-1. The crystalline base was drilled to a depth of 785 m, deviated at an inclination of 72 degrees, which equates a 380 meters vertical depth. The drilling showed the presence of hydrocarbons in six fracture zones. Gas-shows were associated with the first two zones, while oil shows were observed in the remaining four. The reservoir pressure is estimated at around 5,000 psi (pound per square inch).Major oil exploration and production developments in the Arab countries and the world are summarized below.
1-1 Seismic Surveys The number of crews working on seismic surveys worldwide in 2008
rose by 19% compared with 2007, reaching an average of 356 crew/month, as shown in Figure (2-1) and Table (2-1). This reflects the increased interest and activity in prospecting and exploration, and the resulting increase in the number of rigs operating worldwide.
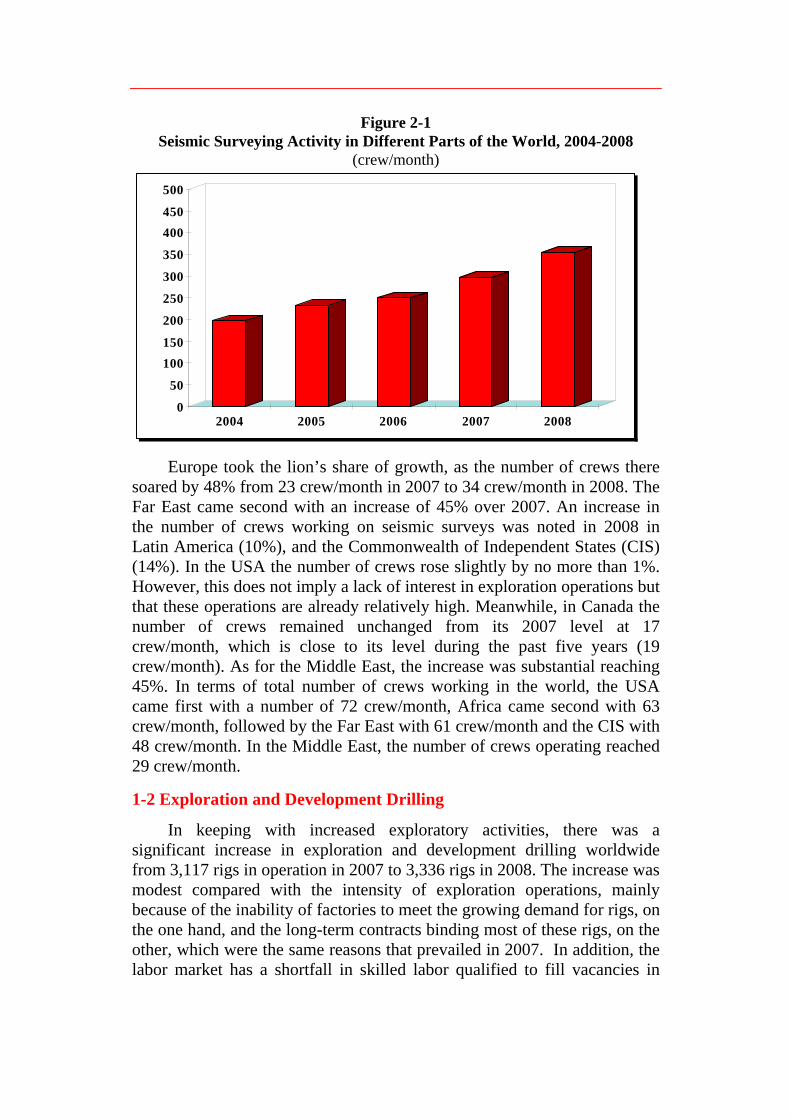
Figure 2-1 Seismic Surveying Activity in Different Parts of the World, 2004-2008
(crew/month)
0
50
100150
200
250
300
350
400450
500
2004 2005 2006 2007 2008
Europe took the lion’s share of growth, as the number of crews there soared by 48% from 23 crew/month in 2007 to 34 crew/month in 2008. The Far East came second with an increase of 45% over 2007. An increase in the number of crews working on seismic surveys was noted in 2008 in Latin America (10%), and the Commonwealth of Independent States (CIS) (14%). In the USA the number of crews rose slightly by no more than 1%. However, this does not imply a lack of interest in exploration operations but that these operations are already relatively high. Meanwhile, in Canada the number of crews remained unchanged from its 2007 level at 17 crew/month, which is close to its level during the past five years (19 crew/month). As for the Middle East, the increase was substantial reaching 45%. In terms of total number of crews working in the world, the USA came first with a number of 72 crew/month, Africa came second with 63 crew/month, followed by the Far East with 61 crew/month and the CIS with 48 crew/month. In the Middle East, the number of crews operating reached 29 crew/month.
1-2 Exploration and Development Drilling
In keeping with increased exploratory activities, there was a significant increase in exploration and development drilling worldwide from 3,117 rigs in operation in 2007 to 3,336 rigs in 2008. The increase was modest compared with the intensity of exploration operations, mainly because of the inability of factories to meet the growing demand for rigs, on the one hand, and the long-term contracts binding most of these rigs, on the other, which were the same reasons that prevailed in 2007. In addition, the labor market has a shortfall in skilled labor qualified to fill vacancies in
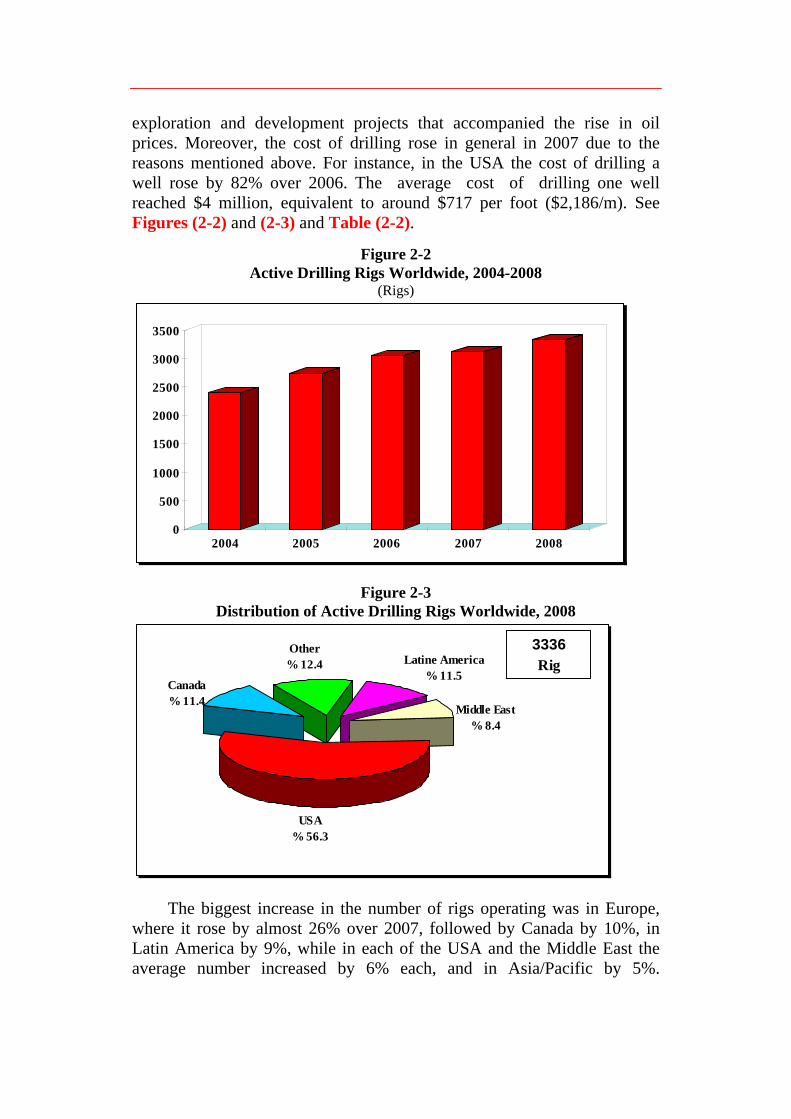
exploration and development projects that accompanied the rise in oil prices. Moreover, the cost of drilling rose in general in 2007 due to the reasons mentioned above. For instance, in the USA the cost of drilling a well rose by 82% over 2006. The average cost of drilling one well reached $4 million, equivalent to around $717 per foot ($2,186/m). See Figures (2-2) and (2-3) and Table (2-2).
Figure 2-2 Active Drilling Rigs Worldwide, 2004-2008
(Rigs)
0
500
1000
1500
2000
2500
3000
3500
2004 2005 2006 2007 2008
Figure 2-3 Distribution of Active Drilling Rigs Worldwide, 2008
Latine America% 11.5
USA% 56.3
Other% 12.4
Canada% 11.4
Middle East% 8.4
3336Rig
The biggest increase in the number of rigs operating was in Europe, where it rose by almost 26% over 2007, followed by Canada by 10%, in Latin America by 9%, while in each of the USA and the Middle East the average number increased by 6% each, and in Asia/Pacific by 5%.

Meanwhile, the average number of rigs operating in Africa fell by 1% from 66 in 2007 to 65 in 2008. Preliminary figures indicate that the exploration activities and subsequent drilling activities led to at least 202 discoveries worldwide, of which 112 were oil and 90 gas. Of these, the Arab countries accounted for 55 oil discoveries and at least 37 gas. See Figures (2-4) and (2-5) and Table (2-3).
Figure 2-4 Oil Discoveries in OAPEC Member Countries and Other Arab Countries,
2004-2008
0
10
20
30
40
50
2004 2005 2006 2007 2008
OAPEC Members Other Arab Countries
Figure 2-5 Gas Discoveries in OAPEC Member Countries and Other Arab Countries,
2004-2008
0
5
10
15
20
25
30
35
40
2004 2005 2006 2007 2008
OAPEC Members Other Arab Countries
2. Oil and Natural Gas Reserves
Estimates indicate that oil reserves dropped in 2008 in several countries, namely the UK, Mexico, Norway, Canada and others. On the other hand, the estimated oil reserves rose in other countries, especially

Venezuela and Libya. In addition, estimated reserves rose in Argentina, Brazil, Ecuador, and the USA. The same applies to gas, whose estimated reserves rose in some countries like Egypt and most non-Arab OPEC members, while it decreased in other countries such as the CIS.
2-1 Oil Reserves
The estimated oil reserves of some countries remained unchanged due to the fact that most countries do not reevaluate their reserves on annual basis, or did not make any new discoveries, or did not develop any previous ones. On the other hand, the estimated oil reserves rose significantly in some countries such as Venezuela and Brazil. Oil reserves dropped in other countries such as the UK, where some new discoveries were announced in 2008, but insufficient to offset the decrease of reserves. The world’s estimated oil reserves rose slightly in 2008 to 1.16 trillion barrels, compared with 1.15 trillion barrels in 2007, or by no more than 0.9%. See Figure (2-6) and Table (2-4).
Figure 2-6 World Oil Reserves by International Grouping, End 2008
CIS% 8.5
Others% 6.9
OAPEC Members% 56.6
Non-Arab OPEC% 24.9
North America% 3.2
1164.3Billion barrels
2-1-1 OAPEC Members and Other Arab Countries
OAPEC members’ estimated oil reserves rose 0.4% in 2008 over 2007. Many discoveries were made in Egypt, in the Gulf of Suez, the Eastern and Western Desert, and the Mediterranean Sea, which added around 330 million barrels to Egypt’s reserves. Estimates for Libya showed that oil reserves rose 5.3% to 43.66 billion barrels in 2008 compared with 41.46 billion barrels in 2007. Libya announced 8 new oil onshore and offshore discoveries in 2008 in the Sirte, Ghadames and Slouq basins.

The Arab states accounted for 57.7% of total world proven oil reserves in 2008, and OAPEC members accounted for 56.6% of the world total. Figure (2-6) shows the share of OAPEC member countries and other international groupings of estimated world oil reserves at the end of 2008. Figure (2-7) shows the evolution of OAPEC and OPEC members’ proven oil reserves in the period 2004-2008.
Figure 2-7 The Evolution of Oil Reserves in OAPEC and OPEC Member Countries,
2004-2008 (Billion barrel at year end)
0
200
400
600
800
1000
2004 2005 2006 2007 2008
OAPEC Members OPEC Countries
2-1-2 OPEC Countries
OPEC countries’ estimated proven oil reserves increased in 2008 due to the increase in Venezuela and Libya’s reserves. In 2007 OPEC members’ combined estimates were around 927.06 billion barrels, compared with about 939 billion barrels at the end of 2008, which accounted for 68% of total world proven oil reserves.
In this context, Ecuador’s estimated oil reserves soared by 140 million barrels, while in Iran reserves fell by more than 2 billion barrels, and in Indonesia they fell by around 470 million barrels. There was no significant change in the reserves of other OPEC countries. See Figure (2-7).
2-1-3 North Sea
The estimated oil reserves of the UK continued to fall from about 3.6 billion barrels at the end of 2007 to about 3.41 billion at the end of 2008. Similarly, those of Norway declined from 6.87 billion barrels in 2007 to 6.68 billion in 2008, despite more than 6 new discoveries made in Norway

that year. As a result the share of those two countries together in world oil reserves decreased from 0.9% at the end of 2007 to 0.8% at the end of 2008. The North Sea accounted for 0.9% of world oil reserves in 2008 if the oil reserves belonging to Denmark, estimated at 1.06 billion barrels at the end of 2008, are included.
2-1-4 North America
The estimated oil reserves of North America declined. In Canada conventional oil reserves dropped from 5.39 billion barrels at the end of 2007 to 4.94 billion at the end of 2008. In Mexico, oil reserves were down 9.9%, from 11.65 billion barrels at the end of 2007 to 10.50 billion at the end of 2008. On the other hand, US estimated oil reserves rose from 20.97 billion barrels at the end of 2007 to 21.32 billion at the end of 2008. Consequently, this group of countries accounted for 3.2% of world oil reserves at the end of 2008, compared with 3.3% at the end of 2007.
2-1-5 CIS and China
The estimated oil reserves of the CIS were down 1.8% dropping from 100.68 billion barrels in 2007 to 98.9 billion barrels in 2008. In China, reserves remained unchanged from their 2007 level, despite 4 new oil discoveries in 2008. This group accounted for 9.8% of total world oil reserves at the end of 2008, compared with 10% at the end of 2007.
2-1-6 Brazil
In Brazil, the estimated oil reserves increased by 3.8% from 12.18 billion barrels at the end of 2007 to 12.64 billion at the end of 2008. Brazil accounted for more than 1% of world oil reserves at the end of 2008.
2-1-7 Rest of the World
Estimates indicate that oil reserves in the rest of the countries not included in the previous categories increased by around 5.3% over 2007. For instance, the estimated oil reserves of this group totaled about 26.76 billion barrels at the end of 2007, and stood at 28.18 billion at the end of 2008. The countries of this group accounted for about 0.24% of the world’s reserves at the end of 2008.
2-2 Natural Gas Reserves
Worldwide demand for natural gas remained changeable in 2008, on the one hand because of the weak economic growth in some countries, and on the other due to the interrelated increased prices of gas and oil. However, the interest in gas prospecting and exploration increased. As a
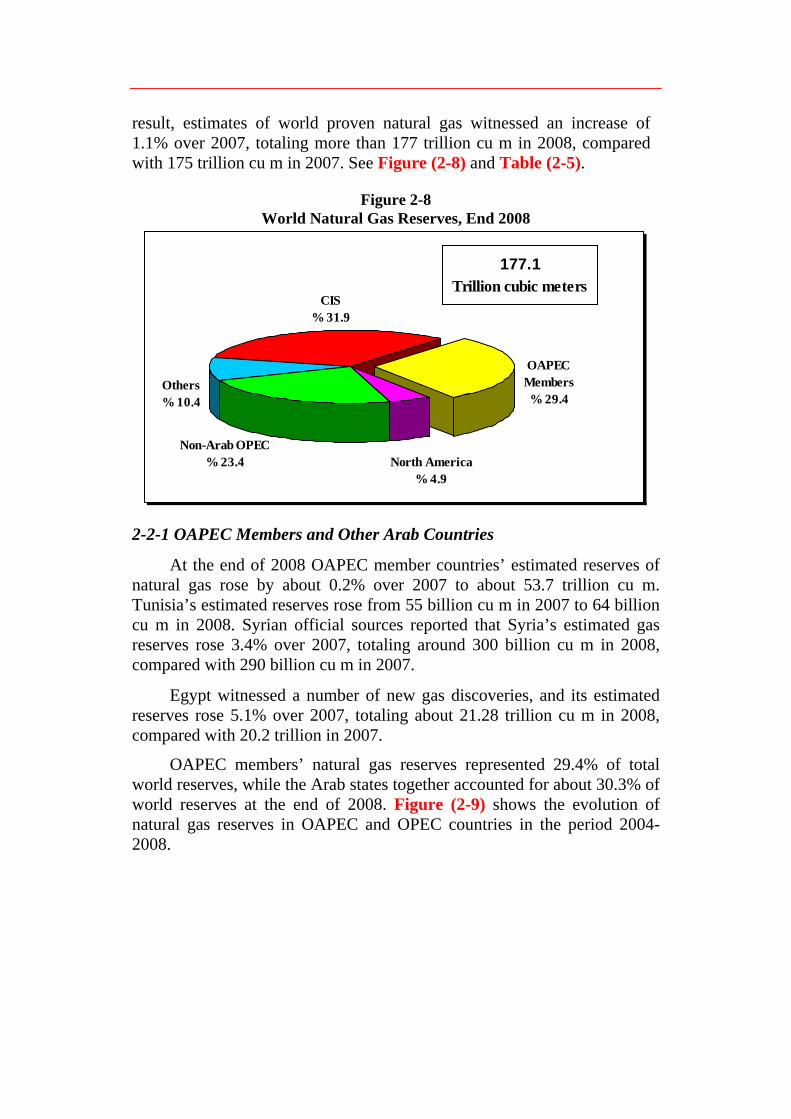
result, estimates of world proven natural gas witnessed an increase of 1.1% over 2007, totaling more than 177 trillion cu m in 2008, compared with 175 trillion cu m in 2007. See Figure (2-8) and Table (2-5).
Figure 2-8 World Natural Gas Reserves, End 2008
CIS% 31.9
Others% 10.4
Non-Arab OPEC% 23.4 North America
% 4.9
OAPEC Members% 29.4
177.1Trillion cubic meters
2-2-1 OAPEC Members and Other Arab Countries
At the end of 2008 OAPEC member countries’ estimated reserves of natural gas rose by about 0.2% over 2007 to about 53.7 trillion cu m. Tunisia’s estimated reserves rose from 55 billion cu m in 2007 to 64 billion cu m in 2008. Syrian official sources reported that Syria’s estimated gas reserves rose 3.4% over 2007, totaling around 300 billion cu m in 2008, compared with 290 billion cu m in 2007.
Egypt witnessed a number of new gas discoveries, and its estimated reserves rose 5.1% over 2007, totaling about 21.28 trillion cu m in 2008, compared with 20.2 trillion in 2007.
OAPEC members’ natural gas reserves represented 29.4% of total world reserves, while the Arab states together accounted for about 30.3% of world reserves at the end of 2008. Figure (2-9) shows the evolution of natural gas reserves in OAPEC and OPEC countries in the period 2004-2008.
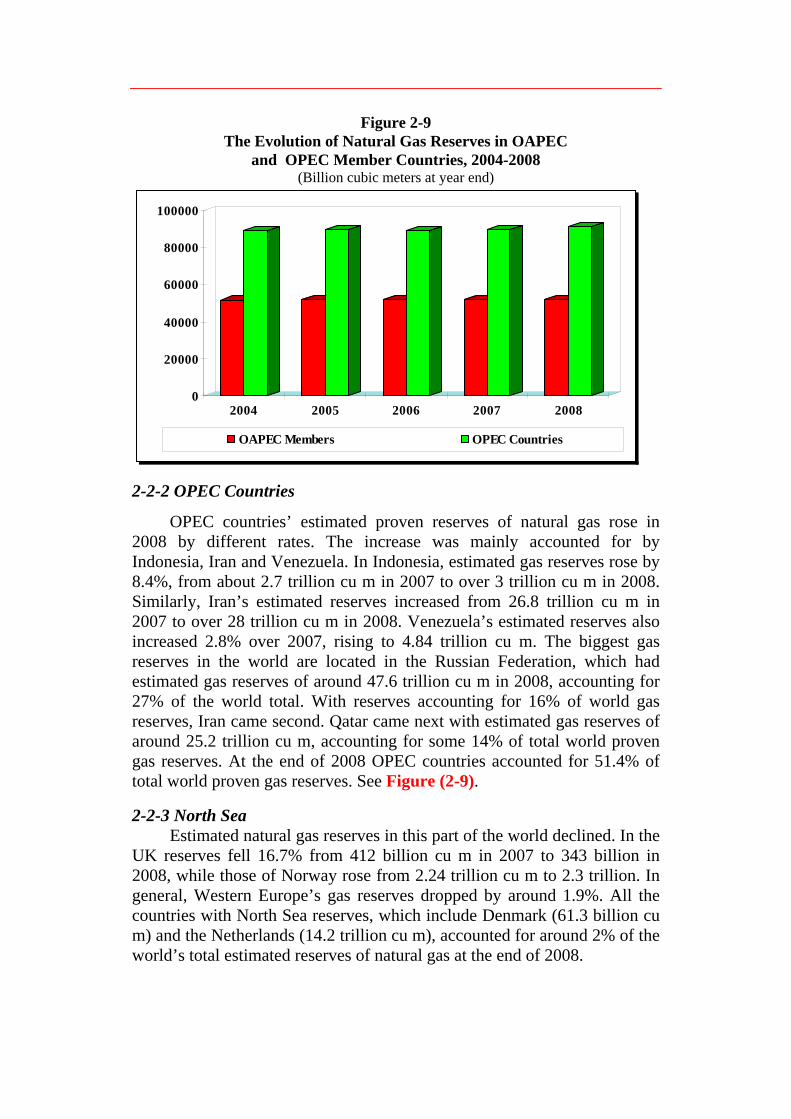
Figure 2-9 The Evolution of Natural Gas Reserves in OAPEC
and OPEC Member Countries, 2004-2008 (Billion cubic meters at year end)
0
20000
40000
60000
80000
100000
2004 2005 2006 2007 2008
OAPEC Members OPEC Countries
2-2-2 OPEC Countries
OPEC countries’ estimated proven reserves of natural gas rose in 2008 by different rates. The increase was mainly accounted for by Indonesia, Iran and Venezuela. In Indonesia, estimated gas reserves rose by 8.4%, from about 2.7 trillion cu m in 2007 to over 3 trillion cu m in 2008. Similarly, Iran’s estimated reserves increased from 26.8 trillion cu m in 2007 to over 28 trillion cu m in 2008. Venezuela’s estimated reserves also increased 2.8% over 2007, rising to 4.84 trillion cu m. The biggest gas reserves in the world are located in the Russian Federation, which had estimated gas reserves of around 47.6 trillion cu m in 2008, accounting for 27% of the world total. With reserves accounting for 16% of world gas reserves, Iran came second. Qatar came next with estimated gas reserves of around 25.2 trillion cu m, accounting for some 14% of total world proven gas reserves. At the end of 2008 OPEC countries accounted for 51.4% of total world proven gas reserves. See Figure (2-9).
2-2-3 North Sea Estimated natural gas reserves in this part of the world declined. In the
UK reserves fell 16.7% from 412 billion cu m in 2007 to 343 billion in 2008, while those of Norway rose from 2.24 trillion cu m to 2.3 trillion. In general, Western Europe’s gas reserves dropped by around 1.9%. All the countries with North Sea reserves, which include Denmark (61.3 billion cu m) and the Netherlands (14.2 trillion cu m), accounted for around 2% of the world’s total estimated reserves of natural gas at the end of 2008.

2-2-4 North America
US proven natural gas reserves rose significantly in 2008 by about 12.6% to 6.73 trillion cu m, compared with 5.98 trillion cu m at the end of 2007, while those of Mexico dropped from 392 billion cu m in 2007 to 373 billion in 2008.
The countries of this group accounted for 5% of total world reserves of natural gas at the end of 2008.
2-2-5 CIS and China
The estimated natural gas reserves of Turkmenistan declined 6% since no new gas discoveries were reported which caused the estimated reserves of the CIS to drop 1% to 56.5 trillion cu m in 2008, compared with around 57 trillion in 2007. This group of countries constituted 33% of total world reserves of natural gas at the end of 2008.
2-2-6 Brazil
In Brazil estimated gas reserves rose 4.9% to 365 billion cu m in 2008, compared with 348 billion cu m in 2007.
2-2-7 Rest of the World
This group comprises the natural gas producing countries not covered by the aforementioned groups. The estimated proven natural gas reserves of these countries rose slightly from about 11.4 trillion cu m at the end of 2007 to about 11.47 trillion at the end of 2008.
This group accounted for 6% of total world reserves of natural gas at the end of 2008.
3. Hydrocarbon Liquids and Natural Gas Production
3-1 Hydrocarbon Liquids Production
Oil production covers both crude oil and condensates production, while hydrocarbon liquids production covers crude oil, condensates and natural gas liquids (NGLs) as well.
3-1-1 Oil Production
World oil production increased 0.2% from 86.05 million b/d in 2007 to around 86.20 million b/d in 2008. Growing world demand for oil and high prices encouraged producing countries to increase their output until the beginning of the second half of 2008 when prices began to slump, on the one hand due to due to the US real estate crisis, and on the other

because of a drop in market speculation and trading in ‘paper barrels’. See Figure (2-10) and Table (2-6).
The evolution of Arab and world production of petroleum (oil and gas) in 2008 is reviewed below.
Figure 2-10 World Oil Production by International Grouping,
2008
Others% 33.6
North America% 11.5
CIS% 14.4
OAPEC Members% 25.7
Non-Arab OPEC% 14.8
86.2Million b/d
3-1-1-1 OAPEC Members and Other Arab Countries
Available data indicate that the oil production of most OAPEC member countries witnessed in 2008 an increase of about 6.4% over 2007. Oil production rose from 21 million b/d in 2007 to 22.19 million b/d in 2008. Production declined in some countries such as Bahrain and Algeria, while in the UAE it rose 2.9%. Tunisia’s production also soared significantly from 70,000 b/d in 2007 to 85,000 b/d in 2008. Bringing new fields on stream accounted for this increase, mainly the offshore El-Bibane field.
Saudi Arabia contributed to this increase as its daily production rate rose from 8.75 million b/d in 2007 to about 9.31 million b/d in 2008. Similarly, Syria’s production rate increased by 5.4% to 390,000 b/d in 2008, as some new oil discoveries came on stream and output increased in some fields due to the application of modern technologies and enhanced oil recovery techniques.

Political stability in Iraq contributed to the 23.1% increase in oil production rate, driving output up to 2.27 million b/d in 2008, compared with 1.85 million in 2007.
Official figures in Kuwait indicated an increase in oil production rates, totaling 2.68 million b/d in 2008, compared with 2.57 million in 2007. New wells and effective well maintenance accounted for this increase. Similarly, Libya’s production rose from 1.66 million b/d in 2007 to 1.75 million in 2008, while that of Egypt rose 4.3% to about 659,000 b/d in 2008, compared with 632,000 b/d in 2007.
Meanwhile, there were slight changes in the oil production of other Arab states in 2008. That of Sudan rose from 460,000 b/d in 2007 to 490,000 in 2008 and Oman’s rose by about 5.4% from 710,000 b/d in 2007 to 748,000 b/d in 2008. Yemen’s production fell 7.4% from 315,000 b/d in 2007 to 291,000 b/d in 2008.
Together, the Arab states produced about 23.72 million b/d of oil in 2008, which was 6.2% more than their 2007 total of 22.3 million b/d. The OAPEC members’ share of world oil production amounted to 25.7% in 2008, while the Arab countries as a whole accounted for 27.5% of total world oil production in the same year. See Figures (2-10) and (2-11) Table (2-6).
Figure 2-11 Oil Production Rates in OAPEC and OPEC Member Countries,
2004-2008 (Million b/d)
0
5
10
15
20
25
30
35
2004 2005 2006 2007 2008
OAPEC Members OPEC Countries

3-1-1-2 OPEC Countries
The OPEC countries’ oil production witnessed an increase of 5.9% over 2007. Their production rose to 33.6 million b/d in 2008. This growth was due to an increase in the output of most OPEC countries except Algeria, where production fell from 1.39 million b/d in 2007 to 1.36 million b/d in 2008. Nigeria’s production was down 1.7% to 2.13 million b/d, but it is expected to rise in 2009 following the development of the offshore Agbami field, with an expected output of 250,000 b/d.
The Arab members of OPEC accounted for about 24% of total world oil production, while the OPEC countries together accounted for 39% of world oil production in 2008. See Figure (2-11).
3-1-1-3 North Sea
UK oil production continued to fall in 2008. Its output declined by 8% compared with 2007 reaching 1.34 million b/d. The decline was greater in Norway where oil production fell 9.9% from 2.24 million b/d in 2007 to about 2 million b/d in 2008. The UK and Norway together accounted for around 4% of total world oil production in 2008.
3-1-1-4 North America
Canada’s oil production dropped from 2.18 million b/d in 2007 to about 2.16 million b/d in 2008. Canada’s output of unconventional oil, totaling over 1 million b/d in 2008, accounted for 47% of its total oil production.
Meanwhile, US production dropped by 3.6% to about 4.94 million b/d and Mexico’s output decreased significantly by 9.8%, to about 2.8 million b/d in 2008. Together, the countries of this group accounted for 11% of total world oil production in 2008.
3-1-1-5 CIS and China
CIS production of oil rose in 2008 by over 1.9%. For instance, Kazakhstan’s production rose by 285,000 b/d, Azerbaijan’s production rose 64,000 b/d, and Turkmenistan’s rose by 31,000 b/d. Meanwhile, the Russian Federation’s fell from 9.83 million b/d in 2007 to 9.77 million b/d in 2008. China’s production rate rose from 3.76 million b/d in 2007 to 3.81 million b/d in 2008.
This group accounted for about 18.8% of total world oil production in 2008, which was slightly higher than its 18.5% share in 2007.

3-1-1-6 Brazil
In Brazil, output rose by about 2.8% from about 1.76 million b/d to about 1.81 million b/d in 2008.
3-1-1-7 Rest of the World
The oil production of the remaining countries of the world not covered by the aforementioned groups dropped 6.2% in 2008 from about 19.6 million b/d in 2007 to about 18.4 million b/d. This group accounted for 21% of total world oil production in 2008.
3-1-2 NGL Production in OAPEC Members and the World
World production of natural gas liquids (NGLs) increased in 2007 by around 1.1% from 8.2 million b/d in 2006 to around 8.3 million b/d. Moreover, OAPEC members’ NGL production rose in the same year from 2.8 million b/d in 2006 to about 3 million b/d in 2007. In Qatar, NGL production rose more than 62%, from about 200,000 b/d in 2006 to 326,000 b/d in 2007. Similarly, Kuwait’s NGL production rose from 30,000 b/d in 2006 to 40,000 b/d in 2007. As for Algeria, NGL production increased 3.6%, from 1.12 million b/d in 2006 to 1.16 million b/d in 2007. OAPEC members accounted for over 36% of world NGL production in 2007. See Table (2-7).
3-2 Marketed Natural Gas
The quantity of natural gas marketed worldwide dropped in 2007 by around 0.1% to about 2,940 billion cu m compared with about 2,944 billion cu m in 2006. Figure (2-12) and Table (2-8) show the distribution of marketed natural gas in the period 2004-2007.
3-2-1 OAPEC Members and Other Arab Countries
OAPEC members’ quantity of marketed natural gas continued to rise in 2007, from 362 billion cu m in 2006 to 367 billion cu m. Increases were recorded in Bahrain (3.6%), Libya (15.2%), Qatar (20.8%), Saudi Arabia (8.2%), Tunisia (30.6%), and the UAE (3.8%). However, the quantities dropped in the other OAPEC members. Oman’s output rose 0.2%, from 25.14 billion cu m in 2006 to 25.17 billion in 2007. OAPEC member countries accounted for about 12.5% of the world’s total volume of marketed gas in 2007. The Arab states together accounted for around 13.4% in 2007, compared with 13.1% in 2006. See Figures (2-12) and (2-13) and Table (2-8).

Figure 2-12 Marketed Natural Gas by International Grouping, 2007
OAPEC Members% 12.5
CIS% 28.9
Others% 24.0
Non-Arab OPEC% 8.3
North America% 26.4
2940Billion cubic meters/year
Figure 2-13 Marketed Natural Gas in OAPEC and OPEC Member Countries, 2004-2007
(Billion cubic meters/year)
0
100
200
300
400
500
600
2004 2005 2006 2007
OAPEC Members OPEC Countries
3-2-2 OPEC Countries The marketed gas of OPEC countries as a whole continued to rise in
2007, it reached about 544 billion cu m, which was about 18 billion higher than its 2006 level. Nigeria contributed significantly to this increase with a rise of 6.5 billion cu m, bringing its total output in 2007 to 35 billion cu m. Iran’s share of the total increase was over 3.3 billion cu m, bringing its output in 2007 to 11.2 billion cu m. Venezuela’s production increased from
26 billion cu m in 2006 to 28.5 billion cu m in 2007. Angola contributed to this increase with around 150 million cu m, after rejoining OPEC in 2006. Meanwhile, that of Indonesia plummeted 9.9% from 74 billion cu m in 2006 to around 66.7 billion cu m in 2007. Similarly, Ecuador’s production decreased in the same period from 280 billion cu m to 275 billion cu m.
OPEC countries accounted for about 17.9% of the world’s total volume of marketed natural gas in 2006 and their share rose to 18.5% in 2007. See Figure (2-13).
3-2-3 North Sea The UK volume of marketed natural gas dropped in 2007, from 80.2
billion cu m in 2006 to 72.4 billion. Similarly, Norway’s production also fell, from 90.5 billion cu m to 89.7 billion cu m. Norway and the UK together accounted for about 5.8% of the world’s total volume of marketed natural gas in 2007.
3-2-4 North America
The quantity of marketed natural gas in the US continued to rise in 2007. It increased by more than 4.2%, from about 524 billion cu m in 2006 to about 546 billion in 2007. Similarly, Mexico’s production climbed about 6.5% from 43.4 billion cu m in 2006 to 46.2 billion in 2007. In Canada, production declined 1.8% from 18.7 billion cu m in 2006 to about 18.4 billion in 2007. The countries of this group accounted for 2.64% of the world’s total volume of marketed natural gas in 2007.
3-2-5 CIS and China
The Commonwealth of Independent States’ production of marketed natural gas rose slightly by no more than 2.1% from about 831 billion cu m in 2006 to 848.6 billion cu m in 2007, owing to an increase in Turkmenistan’s production, followed by Kazakhstan and Azerbaijan. On the other hand, Uzbekistan’s production declined from 72 billion cu m in 2006 to 58.5 billion in 2007. The marketed gas of the Russian Federation dropped from 628.4 billion cu m in 2006 to 607.4 billion cu m in 2007.
Meanwhile, China’s production soared 18% from about 58.6 billion cu m in 2006 to 69.3 billion cu m in 2007.
The countries of this group accounted for around 31% of the world’s total volume of marketed natural gas in 2007, compared with around 30% in 2006
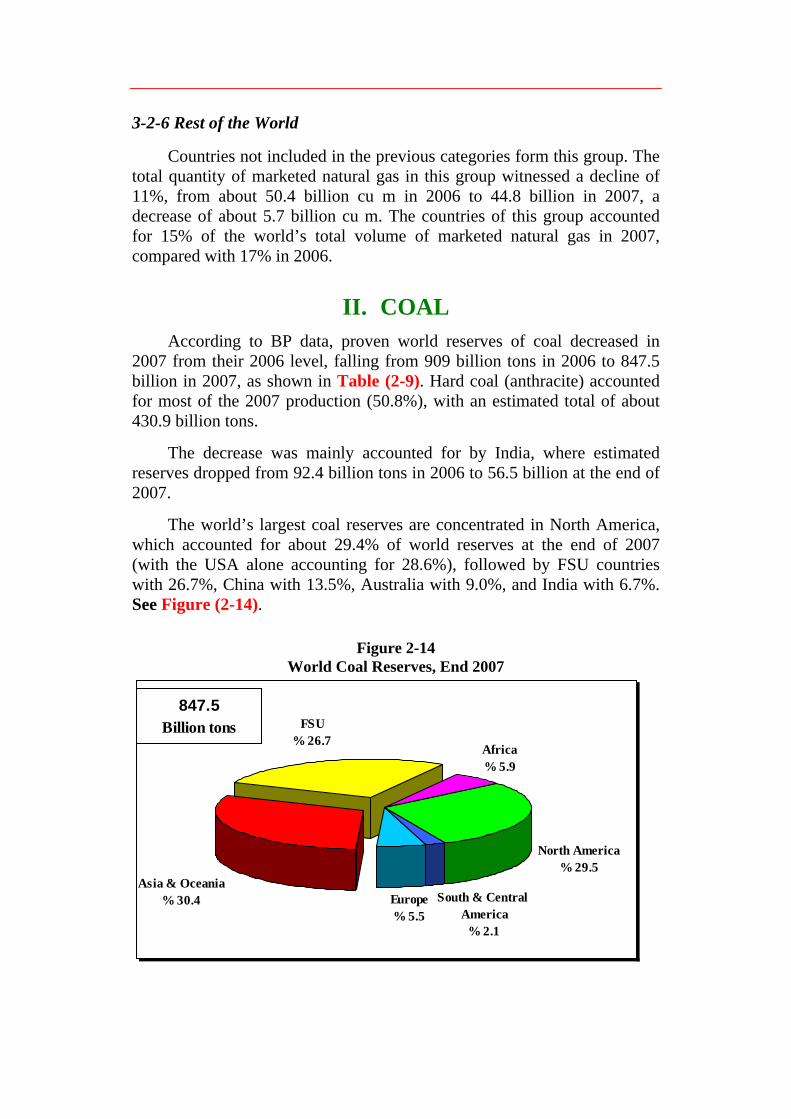
3-2-6 Rest of the World
Countries not included in the previous categories form this group. The total quantity of marketed natural gas in this group witnessed a decline of 11%, from about 50.4 billion cu m in 2006 to 44.8 billion in 2007, a decrease of about 5.7 billion cu m. The countries of this group accounted for 15% of the world’s total volume of marketed natural gas in 2007, compared with 17% in 2006.
II. COAL According to BP data, proven world reserves of coal decreased in
2007 from their 2006 level, falling from 909 billion tons in 2006 to 847.5 billion in 2007, as shown in Table (2-9). Hard coal (anthracite) accounted for most of the 2007 production (50.8%), with an estimated total of about 430.9 billion tons.
The decrease was mainly accounted for by India, where estimated reserves dropped from 92.4 billion tons in 2006 to 56.5 billion at the end of 2007.
The world’s largest coal reserves are concentrated in North America, which accounted for about 29.4% of world reserves at the end of 2007 (with the USA alone accounting for 28.6%), followed by FSU countries with 26.7%, China with 13.5%, Australia with 9.0%, and India with 6.7%. See Figure (2-14).
Figure 2-14 World Coal Reserves, End 2007
South & Central America
% 2.1
Europe% 5.5
Africa% 5.9
North America% 29.5
Asia & Oceania% 30.4
FSU% 26.7
847.5Billion tons

World production of coal rose from about 6,187.2 million tons in 2006 to 6,395.6 million in 2007. Hard coal accounted for most of the production with an estimated total of about 5,543 million tons, of which China produced 2,536.7 million tons in 2007, or 39.7% of the world total production, followed by the USA with 1,039.2 million tons, or 17.2% of the world total, then India with 478.2 million tons, or 7.5%. Next in line came the Russian Federation and Germany. See Table (2-10) and Figure (2-15).
International trade in hard coal (anthracite and coke) totaled about 917 million tons in 2007. Australia topped the list of exporters with exports totaling 244 million tons, followed by Indonesia with 202 million, the Russian Federation with 100 million, South Africa and Colombia with 67 million each, and China with 54 million.
Figure 2-15 World Production of Hard Coal, 2007
North America% 17.3
South & Central America
% 1.5
FSU% 7.6
Africa% 4.3
Asia & Oceania% 57.9
Europe% 11.46395.6
Million tons
The main importers of hard coal are Japan, whose imports totaled 182 million tons in 2007, followed by South Korea with 88 million, Taiwan with 69 million, India with 54 million, the UK with 50 million, China with 48 million, and Germany with 46 million.
In 2007 the international steel industry consumed about 13% (about 717 million tons) of the total hard coal production, since more than 70% of the industry relies on coal.
Coal accounted for around 41% of world electricity generation in 2006. Countries that rely heavily on coal for their power generation include Poland and South Africa (93.0% each), Australia (80.0%), China (78%),

Occupied Palestine (71.0%), Kazakhstan (70.0%), India and Morocco (69% each), the Czech Republic (59.0%), Greece (58.0%), the USA (50%), and Germany (47%).
Since coal is the most environmentally harmful fuel and most of its reserves lie in the industrial countries, these countries are trying hard to turn it into clean (green) fuel. Research centers are working round the clock to find a way to convert coal to gas in the coal mines so as to cut gas emissions into the atmosphere, and to develop economically feasible technology for converting coal into liquid fuel (CTL).
In the Arab countries there were no significant developments in 2007 in the coal mining industry. El-Maghara mine, located in the Sinai Peninsula in Egypt, is the only operating coal mine. It had an estimated production of about 37,000 tons in 2002, compared with about 125,000 tons per year in the 1990s. The fall in production is due to the conversion of power plants to natural gas and to the absence of a coal market. Morocco is working on reinvesting in the coal from some of its mines that had recently closed.
III. NUCLEAR ENERGY Nuclear reactors currently generate electricity in 31 countries, mainly
in the USA, Western Europe, and developed countries in Asia such as Japan and South Korea. However, most of the new reactors currently being built are in Asian countries such as Japan, South Korea, China, India, and Iran. The building of new reactors stopped in the USA and most Western European countries in the 1980s. The year 2007 witnessed the construction of 10 reactors worldwide, 6 of which were in China, and 2 in each of South Korea and the Russian Federation. There were estimated to be 44 reactors under construction at the end of 2008, of which 29 were in Asia (11 in China and 6 in India). See Table (2-11).
At the end of 2008, the number of nuclear power reactors in operation numbered 438 with a total design capacity of 371,675 MW, and a total of 44 reactors were under construction with a total capacity of 38,000 MW. The electricity generated by nuclear reactors in 2007 totaled about 2,749 terawatt-hours, which is equivalent to 13.8% of all the electricity generated worldwide.
In 2008, no new reactors came into service. On the other hand, five reactors were permanently mothballed, one of which was in Slovakia with a capacity of 408 MW, two in Armenia with a capacity of 376 MW each, and the remaining reactors were not identified by the International Atomic Energy Agency (IAEA). According to the IAEA, since nuclear power
began to be used to generate electricity through 2008 the number of reactors mothballed was 120 with a total capacity of 35,329 MW.
Nuclear power accounted for about 76.9% of total power generation in France in 2007, 64.4% in Lithuania, 54.3% in Slovakia, 54.1% in Belgium, and 48.1% in Ukraine. It accounted for around 19% in the USA, 27.5% in Japan, 35.3% in South Korea, and 1.9% and 2.5% in China and India, respectively.
As for the future of nuclear power, following recent oil price increases, the importance and possible use of nuclear power were reviewed in some countries. In this context, once again attention focused on nuclear fusion technology. A project to build an experimental nuclear fusion reactor was launched at the end of June 2005 in Cadarache in the Bouches-du-Rhône region of France through a partnership between the European Union, the Russian Federation, China, the USA, and South Korea. In some developing countries, attention has focused on acquiring nuclear technology for peaceful purposes, mainly electricity generation.
In the Arab states, following the resolution of the GCC states summit concluded in December 2006 which called for the use of nuclear power for peaceful purposes, the Arab summit convened in Riyadh, 28-29 March 2007 issued a similar resolution. It was followed by talks with the IAEA and with countries that build reactors, especially France and the USA, which reached an understanding with some Arab countries on building reactors for electricity generation and using nuclear power for peaceful purposes.
In general, it can be said that the future of nuclear power remain uncertain and that any expansion in the short term will mostly occur in developing Asian countries, in particular China and India.
IV. RENEWABLE ENERGY SOURCES Renewable energy sources play a secondary role in supplying world
energy. The renewable energy resources are the primary sources that exist in nature, and constantly available, but the technology used to convert them into electricity or engine power still needs technical and environmental development before it becomes economically viable for use. Renewable energy sources include hydroelectricity, solar, wind, geothermal, biomass, ocean, and tidal energy.
In Europe, Germany, Denmark and Spain are committed to founding the International Renewable Energy Agency (IRENA), to foster the production and use of renewable energy worldwide.

The GCC countries are seeking to support activities in the field of renewable energy, in particular Saudi Arabia, which signed a contract to generate thousands of MW from space, solar concentrators, or fuel cells. The UAE is giving strong backing to renewable energy and is currently seeking to build solar power stations with a capacity of 500 MW, in addition to a relatively large desalination plant.
Total installed capacity for wind power and solar power in the GCC countries is expected to reach 5,000 MW by 2015, distributed as follows: Bahrain (1,000 MW), Qatar (3,500 MW), the UAE (400 MW), Kuwait (100 MW), and the rest in Oman.
By 2015, the total installed wind and solar power capacity are expected to reach the following Megawatts its in some Arab countries: Egypt (4135 MW), Morocco (824 MW), Algeria (400 MW), Tunisia (170 MW), Syria (100 MW), Sudan (100 MW), Yemen (50 MW), Jordan (20 MW).
In the UAE, Abu Dhabi hosted the World Future Energy Summit, 19-21 January 2009, where the government renewed its commitment to foster renewable energy policies and pledged that by 2020 renewable energy sources will account for at least 7% of the Emirate’s total power generation capacity. Abu Dhabi’s Masdar Company estimates this commitment will create a renewable energy market valued at US$6 billion-$8 billion in the Emirate, creating business opportunities for local and international companies.
In Bahrain, there are two big projects for renewable energy. The first one is incorporated in Bahrain World Trade Center, where three parallel wind turbines have been installed with a capacity of 0.66 MW. The second one is the Euro-University, which will have roofs covered with solar photovoltaic cells.
Oman has carried out many solar and wind power projects, namely street lighting and generating electricity using wind power. Qatar is expected to benefit from its renewable energy resources soon.
Algeria encourages investment in renewable energy resources, especially solar and wind energy. Algeria’s national program aims to increase the share of renewable energy to about 5% of total primary energy consumption by 2010, and to 10% by 2020. Algeria seeks to use solar and wind power to generate 575 MW of electricity in 2020. It is worth mentioning that Algeria is currently relied on Electricity generation from natural gas by 99.6%, and 0.2% for both hydropower and solar photovoltaic cells.

While the relevant authorities support adoption of policies that encourage the use of renewable energy, however progress is still limited in Jordan, whereby the government has set a target of reaching 3% for the share of renewable energy in electricity production by 2017.
In Egypt, despite the progress in using renewable energy, the country relies mainly on hydropower that accounts for 17% of total production. Egypt is working on reaching 850 MW of wind energy in 2010 equivalent to 3% of the total electricity generated, and 8% of the total in 2020.
In Morocco, the government has adopted a policy of encouraging the use of renewable energy and many projects currently provide rural areas with electricity, but the percentage did not exceed 0.1% of total production for only 0.1% of total production. Morocco hopes to increase the number of solar heaters to 400,000 or seven times the current figure.
Syria relies on hydropower, which supplies the country by 41% if its electricity and the share of renewable energy does not exceed 2%. It uses wind power and hopes it will contribute around 4% of total electricity generated by 2010. According to official Syrian sources, the Syrian market is open to Arab and foreign investors to invest in establishment of wind farms to generate electricity on a large scale and link to public gird network. In addition, the government is willing to buy all sorts of power produced using renewable energy, and considers such projects as a priority for investment so as to meet the growing demand for electric power.
1. Hydropower
1-1 Hydropower in the World
According to the World Energy Council (WEC), the total installed hydropower capacity in the world amounted to about 778.038 GW at the end 2005.
According to the IEA, the total installed hydropower capacity in its member countries amounted to 423 GW in 2006 compared with 418.9 GW in 2005. Meanwhile, in OECD countries it amounted to about 434.9 GW in 2006, compared with 430.6 in 2005.
In this regard, China ranked first, where its total installed hydropower capacity reached 100 GW by end of 2005. In 2006 the USA was ranked second with about 99.2 GW, compared with 98.8 GW in 2005, then Canada 72.6 GW compared with 71.9 GW in 2005. In Japan, total installed hydropower capacity amounted to 47.3 GW in 2006, compared with 47.2 GW in 2005. As for France, the total installed hydropower capacity remained unchanged in 2006 from its 2005 level of 25.1 GW.

China expects its installed hydropower capacity to reach about 190 GW by 2010, and 300 GW by 2020.
In South Korea where the annual growth rate averaged the highest over the period 2005-2006, the total installed hydropower capacity increased from 3,883 MW in 2005 to 5,485 MW in 2006. Turkey, with 1.22% rate of growth rate over the same period, witnessed an increase in its installed capacity from 12,906 MW in 2005, to 13,063 MW in 2006. Meanwhile, in the UK where the growth rate was -0.96%, installed hydropower capacity decreased from 4,289 MW in 2005 to 4,248 MW in 2006. Similarly, Denmark’s installed hydropower capacity fell from 11 MW in 2005 to 9 MW in 2006.
The growth rate reached its lowest level of -18.18% (for the year 2005 & 2006). Table (2-12) shows the total installed hydropower capacity in some countries.
1-2 Hydropower in the Arab Countries
Several Arab countries with which have sources, use hydropower for electricity generation, especially Egypt, Syria, Iraq, Lebanon, Tunisia, Morocco, and Algeria. Some of these countries have additional sources that are not exploited so far.
According to the 2007 WEC statistics, the total installed hydropower capacity in the Arab countries following until end of 2005 was estimated as follows: Egypt (2850 MW), Syria (1616 MW), Morocco (1498 MW), Lebanon (280 MW), Algeria (275 MW), Iraq (260 MW), Tunisia (62 MW) and Jordan (10 MW).
It should be noted that the competent authorities of the Hashemite Kingdom of Jordan is preparing studies for the exploitation of Hydropower resources, with capacity expected to reach 400-800 MW, through a project that includes both Jordan and Palestine (West Bank and Gaza) and the occupied Palestine.
2. Wind Energy
2-1 Wind Energy in the World
The total installed wind power capacity in the world amounted to about 94,005 MW in 2007 compared with 74,306 MW in 2006, according to statistics of British Petroleum (BP Statistical Review of World Energy, June 2008. See Table (2-13).

Total cumulative wind power capacity in the 27 countries of the EU amounted to 56,535 MW at the end of 2007, compared with 48,069 MW at the end of 2006, according to the European Wind Energy Association (EWEA).
Germany still ranks first in the world, with a total installed wind capacity of about 22,247 MW in 2007, compared to 20,622 MW in 2006. The USA comes at second rank, with a capacity of about 16,879 MW at the end of 2007 compared with 11,635 MW at the end of 2006, followed by Spain third rank with a capacity of about 15,145 MW at the end of 2007, compared with 11,623 MW at the end of 2006.
India came at fourth rank with a capacity of about 7,845 MW at the end of 2007, compared with 6,228 MW at the end of 2006, followed by China at 5th rank with a capacity of about 5,875 MW at the end of 2007, compared with 2,588 MW in 2006. Denmark comes at 6th rank with a capacity of 3,125 MW at the end of 2007, compared with 3,136 MW at the end of 2006, and its annual growth rate of fell by (-0.4%).
The annual growth rate of installed wind power capacity was the highest in China (127%) among the nations of the world for the years 2006 and 2007.
In France, total installed wind power capacity increased from 1,567 MW at the end of 2006 to about 2,454 MW at the end of 2007, thereby achieving a growth rate of 56.6% over the same period.
The growth rate in other countries for the years 2006 and 2007 was as follows: USA (45.1%), Sweden (38.0%), Spain (30.3%), Italy (28.4%), India (26%), Portugal (25.3%), UK (21.8%), Netherlands (12.1%), Germany (7.9%), Norway (2.5%), and Austria (1.8%).
2-2 Wind Energy in the Arab Countries
Wind Energy is available in most Arab countries, on an estimated average of 1400 hr/year. The best wind power potential may be found in Oman, Egypt, and Morocco where full load hours of appropriate wind reaches 2500 hr/year with a speed ranging from 8 to 11 m/sec.
According to statistics of British Petroleum (BP Statistical Review of World Energy, June 2008), the total installed wind power capacity in some Arab countries in 2007 amounted to the following 310 MW in Egypt, 124 MW in Morocco, 20 MW in Tunisia, 1 MW Algeria, 6 MW in Occupied Palestine, 2 MW in Jordan, and 1 MW in Syria. Following below some details:
- Jordan In Jordan a project to generate electricity using wind power is under
way, with a capacity of 60 MW, funded by Global Environment Facility (GEF) US$ 7 million, and aims to overcome the existing barriers to developing these sources, such as the lack of a legal and regulatory framework and insufficient data relevant to wind energy.
- Bahrain Bahrain announced a big were project for using wind power through
installing three parallel wind turbines with a capacity of 0.66 MW at the Bahrain World Trade Center.
- Egypt Since 2001, many projects were implemented to generate electricity
using wind power in Al-Zaafarana area with a capacity of 310 MW in cooperation with Germany, Denmark, and Spain. On 1 February 2007, the Spanish group Gamesa Eolica was contracted to implement a new wind power project with a capacity of 120 MW also in Al-Zaafarana. The project is expected to start operation in mid-2009. Egypt intends to install wind farms and reach a capacity of 1050 MW by 2011.
- Morocco Seeking to develop the production of renewable energy, Morocco
signed in February 2007 an agreement to launch a project that will provide the city of Tangier (East Morocco) with electricity using wind power with a capacity of 140 MW. Morocco’s Office Nationale d’Electricité (ONE) will complete the project in collaboration with the Spanish group Gamesa Eolica, who will install the field equipment. Some 165 wind-operated electric generators will be installed on pipe-like fences in the mountain villages of Dhar Saadane (310 hectares) and Beni Mejmel (100 hectares) situated east and south east of the city of Tangier, respectively. The project also aims to install equipment for monitoring, controlling, measuring, and protecting, as well as a monitoring station for remote control in the field, and a satellite monitoring system and equipment to measure meteorological changes.
Morocco’s ONE chose to execute this project in the city of Tangier because it has considerable wind throughout the year. Figures obtained during the project’s assessment showed a wind speed of 9 meters per second, a speed capable of turning the electric generators’ giant blades. The project is co-funded by Spain, the European Investment Bank, and the German bank KFW with loans of €100 million, €80 million, and €50 million, respectively.
3 Solar Energy
3-1 Solar Energy in the World
According to IEA statistics, the installed photovoltaic capacity worldwide at the end of 2007 stood at about 7,841 MW, compared with 5,584 MW in 2006. Germany was the world leader in using photovoltaic cells, with a cumulative installed capacity of about 3,862 MW in 2007, compared with 2,727 MW in 2006.
Japan came second in rank with a cumulative installed capacity of 1,918.9 MW in 2007, compared with 1,708.5 MW in 2006, followed by the USA 3rd rank with a capacity of 830.5 MW in 2007, compared with 624 MW in 2006, as shown in Table (2-14).
The annual growth rate of installed solar power capacity fell in Germany from 49.9% in (2005-2006) to 41.6% in (2006-2007). In Spain, total installed photovoltaic capacity increased from 143 MW at the end of 2006 to about 655 MW at the end of 2007, thereby achieving the highest annual growth rate (358%) among the EU countries in 2007. Similarly, in South Korea, total installed photovoltaic capacity rose from 34.7 MW at the end of 2006 to about 77.6 MW at the end of 2007, thereby achieving a growth rate of 123.6%.
The worldwide growth rates were as follows: Italy (140.4%), France (71.3%), Germany (41.6%), the USA (33.1%), the UK (26.6%), Canada (25.9%), Switzerland (21.9%), Australia (17.4%), Japan (12.3%), and Mexico (5.6%).
3-2 Solar Energy in the Arab Countries
Solar energy is available in the Arab countries at the rates more than other countries of the world, and the region is capable of using this energy efficiently. Some Gulf states have built small solar powered water desalination plants. Solar energy is also used for water heating in some Arab states (particularly in Jordan) through solar hot water systems. However, this method is less popular nowadays due to the lack of specifications suitable for solar heaters.
In the UAE, Masdar Company is planning to build a plant to generate electricity using solar power in which it will be the first carbon-free city in the world. It is expected to open at the end of 2009. The plant is being designed and constructed by Abu Dhabi-based Enviromina Power Systems. The plant is expected to generate about 10 MW, and to be grid connected following the installation of 87,777 thin-film crystalline silicon panels.

Qatar intends to install a solar complex with a capacity of 3.5 GW by 2013, and 4.5 GW by 2036.
Algeria is currently implementing the IEA SolarPACES program, which indicates that Algeria could export solar power to Europe in future, especially it will be linked to the European power grid. Algeria is expected to generate electricity using solar power over 20 years equivalent to 72 coal-powered stations, capable of supplying 100 million customers or the whole population of Algeria, Morocco, Tunisia and Libya. By 2040, the country is expected to meet about 5% of the world’s electricity needs.
In Egypt contracts were signed for implementing the first solar thermal power plant in Kuraymat area. The project’s total capacity is estimated at 140 MW, of which 20 MW constitutes the capacity of the solar component.
The plant will employ a hybrid solar system using concentrated solar power technology and connecting to a natural gas fuelled combined cycle. The project, funded by the Global Environment Facility (GEF), Japan Bank for International Cooperation, is scheduled to operate mid-2010, with an expected capacity of about 852 Gwh/year.
4. Geothermal Energy
4-1 Geothermal Energy in the World
According to statistics of British Petroleum (BP Statistical Review of World Energy, June 2008), the installed geothermal capacity in the world amounted to 9,720.4 MW in 2007, compared with 9,574.2 MW in 2006.
According to IEA statistics, installed geothermal capacity in its member countries amounted to about 3,972 MW in 2006, compared with 3,955 MW in 2005. Meanwhile, in OECD member countries, installed geothermal capacity amounted to about 5,354 MW in 2006, compared with 5,147 MW in 2005.
Installed geothermal capacity in IEA Europe member states amounted to 720 MW in 2006, compared with 701 MW in 2005. See Table (2-15).
As shown in the table, the USA ranked first, with installed geothermal capacity of 2,937 MW in 2007, compared with 2,831 MW in 2006, followed by the Philippines 2nd in rank, with a capacity of about 1,978 MW in 2007, same as in 2006. Mexico comes 3rd in rank, with a capacity of about 960 MW in 2007, compared with 953 MW in 2006. In Italy, installed geothermal capacity amounted to 811 MW in 2007, which was the same as in 2006.

Annual growth of rates installed geothermal capacity increased in some countries between 2006 and 2007, mainly in the USA (3.7%), Iceland (8.1%), and Mexico (0.7%), while the annual growth rate remained unchanged in Turkey, New Zealand, Japan, Indonesia, and Italy.
4-2 Geothermal Energy in the Arab Countries
Geothermal Energy resources discovered in Arab countries are still limited, and geological search operations are not yet completed. Nevertheless, limited unexploited potential has been found in Egypt, Jordan, Yemen, Syria, Saudi Arabia, Morocco, Tunisia, and Algeria.
5. Solid Biomass Energy
5.1 Solid Biomass Energy in the World
According to IEA Statistics the installed biomass capacity in its member countries totaled about 22,201 MW in 2006, compared with 19,260 MW in 2005. Meanwhile, in OECD member countries, it amounted to around 22,493 MW in 2006, compared with 19,552 MW in 2005. See Table (2-16).
In the IEA’s European members, the installed solid biomass capacity totaled about 13,348 MW in 2006, compared with 10,592 MW in 2005.
The USA ranked first in installed solid biomass capacity, with about 6,670 MW in 2006, compared with 6,471 MW in 2005, followed by Sweden 2nd rank with a capacity of 3,202 MW in 2006, compared with 2,526 MW in 2005. Italy comes 3rd in rank with a capacity of 1,923 MW in 2006 compared with 510 MW in 2005, followed by Finland 4th in rank with a capacity of 1,730 MW in 2006 compared with 1,720 MW in 2005. Meanwhile, installed solid biomass capacity in Denmark fell significantly from 584 MW in 2005 to 455 MW in 2006.
Annual growth rates of installed solid biomass capacity increased in some countries between 2005 and 2006, mainly in Italy (277.1%), the Czech Republic (31.8%), Sweden (26.8%), Spain (10.5%), Germany (8.5%), the UK (7.8%), Belgium (4.4%), the USA (3.1%), and Finland (0.6%). On the other hand, the annual growth rate fell significantly between 2005 and 2006 in Denmark (-22.1%), the Netherlands (-12.8%), and Canada (-1%). The annual growth rate remained unchanged in Austria, Australia, Mexico, South Korea, and Turkey.

5.2 Solid Biomass Energy in the Arab Countries
Solid biomass energy is used in the Arab countries for cooking and heating, especially in remote areas. However, these resources are relatively limited due to the semi-arid nature of most lands. Agricultural, animal and timber waste are the main source of biomass.
6. Ocean and Tidal Power
According to the IEA statistics the total installed ocean and tidal power Energy in its member countries in 2005 remained unchanged from previous years at about 261 MW. France accounted for 240 MW, Canada for 20 MW, and the UK for 1 MW.

PART ONE
TABLES OF CHAPTER TWO
ARAB AND WORLD DEVELOPMENTS IN THE EXPLORATION, RESERVES AND PRODUCTION OF
ENERGY RESOURCES

Table 2-1Seismic Surveys Worldwide, 2004-2008
(Crew at year end)
2004 2005 2006 2007 2008
Canada 16 23 20 17 17
USA 46 59 61 71 72
Latin America 15 19 22 29 32
Europe 10 13 14 23 34
CIS 19 27 36 42 48
Middle East 20 14 15 18 29
Africa 24 30 40 56 63
Far East 46 47 42 42 61
World total 196 232 250 298 356
Source: - World oil, Several issuse, Jan.- Nov. 2008.

Table 2-2 Average Number of Active Rigs Worldwide, 2004-2008
(Rig)
2004 2005 2006 2007 2008
Canada 369 458 470 346 379
USA 1190 1380 1648 1769 1878
Latin America 290 316 324 354 384
Europe 70 70 77 78 98
Middle East 230 248 238 265 280
Africa 48 50 58 66 65
Asia/Pacific 197 225 228 241 252
World total 2394 2746 3043 3119 3336
Source: - Baker Hughes, January 2009.
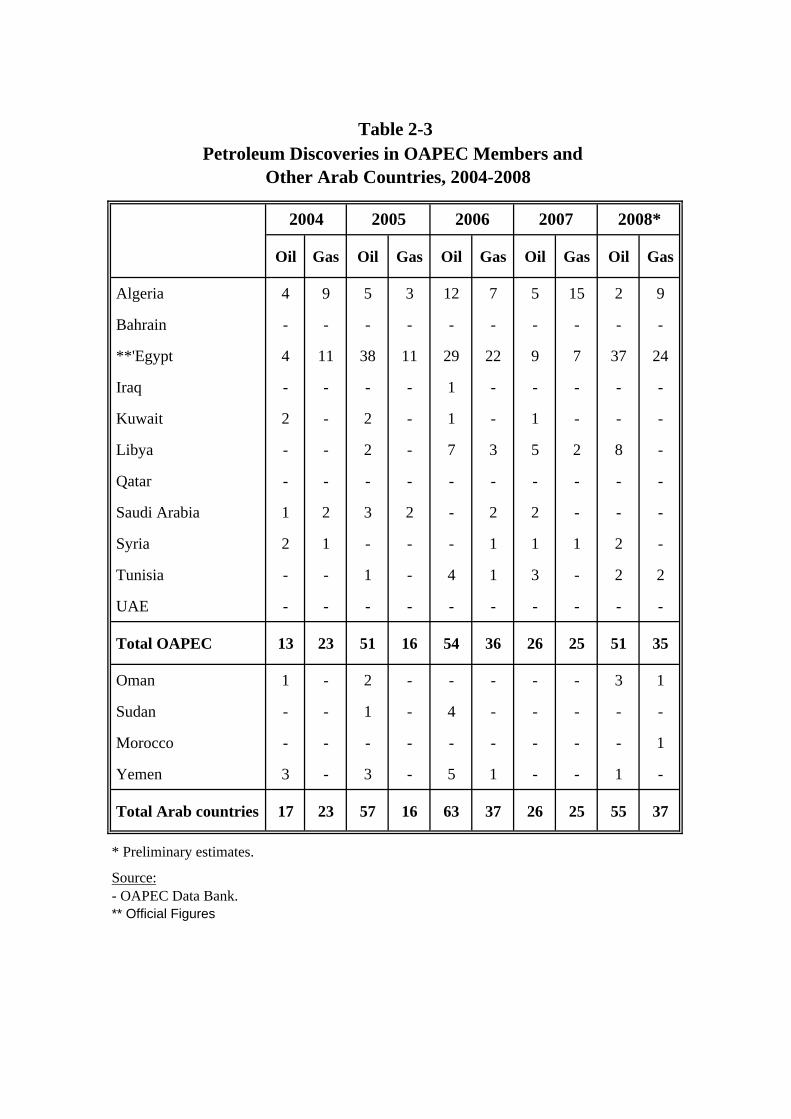
Table 2-3Petroleum Discoveries in OAPEC Members and
Other Arab Countries, 2004-2008
2004 2005 2006 2007 2008*
Oil Gas Oil Gas Oil Gas Oil Gas Oil Gas
Algeria 4 9 5 3 12 7 5 15 2 9
Bahrain - - - - - - - - - -
**'Egypt 4 11 38 11 29 22 9 7 37 24
Iraq - - - - 1 - - - - -
Kuwait 2 - 2 - 1 - 1 - - -
Libya - - 2 - 7 3 5 2 8 -
Qatar - - - - - - - - - -
Saudi Arabia 1 2 3 2 - 2 2 - - -
Syria 2 1 - - - 1 1 1 2 -
Tunisia - - 1 - 4 1 3 - 2 2
UAE - - - - - - - - - -
Total OAPEC 13 23 51 16 54 36 26 25 51 35
Oman 1 - 2 - - - - - 3 1
Sudan - - 1 - 4 - - - - -
Morocco - - - - - - - - - 1
Yemen 3 - 3 - 5 1 - - 1 -
Total Arab countries 17 23 57 16 63 37 26 25 55 37
* Preliminary estimates.
Source:- OAPEC Data Bank.** Official Figures
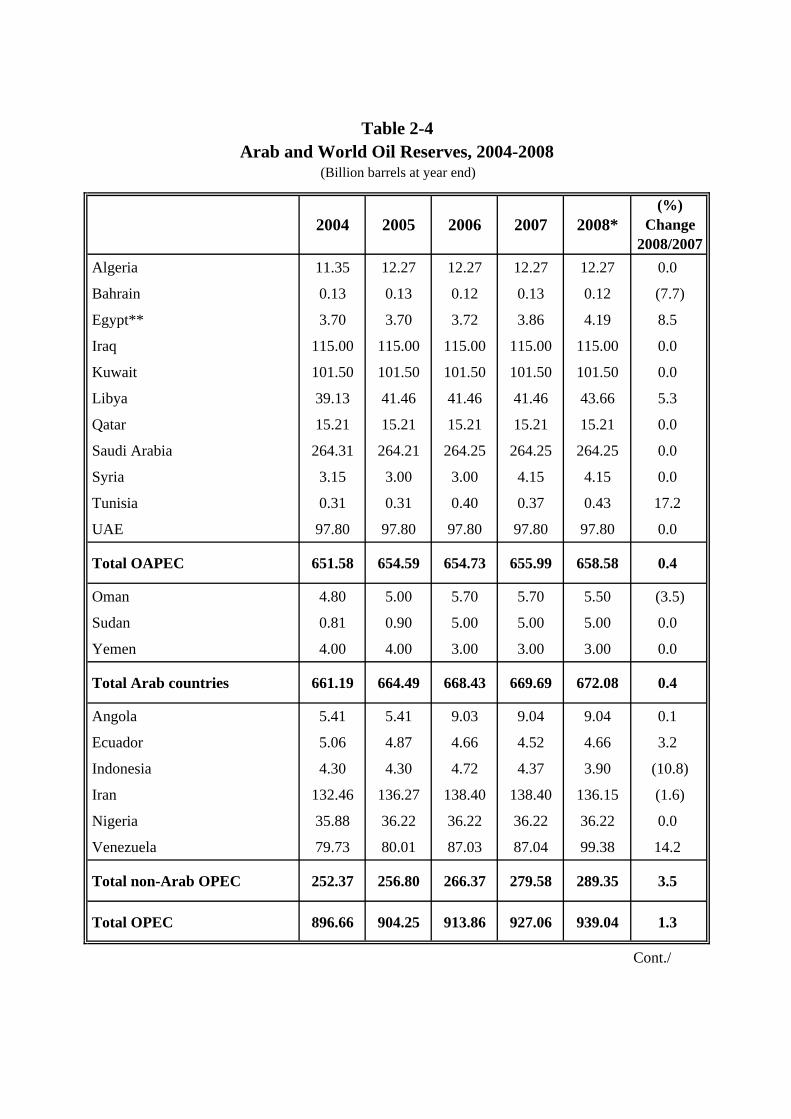
Table 2-4Arab and World Oil Reserves, 2004-2008
(Billion barrels at year end)
2004 2005 2006 2007 2008*(%)
Change2008/2007
Algeria 11.35 12.27 12.27 12.27 12.27 0.0
Bahrain 0.13 0.13 0.12 0.13 0.12 (7.7)
Egypt** 3.70 3.70 3.72 3.86 4.19 8.5
Iraq 115.00 115.00 115.00 115.00 115.00 0.0
Kuwait 101.50 101.50 101.50 101.50 101.50 0.0
Libya 39.13 41.46 41.46 41.46 43.66 5.3
Qatar 15.21 15.21 15.21 15.21 15.21 0.0
Saudi Arabia 264.31 264.21 264.25 264.25 264.25 0.0
Syria 3.15 3.00 3.00 4.15 4.15 0.0
Tunisia 0.31 0.31 0.40 0.37 0.43 17.2
UAE 97.80 97.80 97.80 97.80 97.80 0.0
Total OAPEC 651.58 654.59 654.73 655.99 658.58 0.4
Oman 4.80 5.00 5.70 5.70 5.50 (3.5)
Sudan 0.81 0.90 5.00 5.00 5.00 0.0
Yemen 4.00 4.00 3.00 3.00 3.00 0.0
Total Arab countries 661.19 664.49 668.43 669.69 672.08 0.4
Angola 5.41 5.41 9.03 9.04 9.04 0.1
Ecuador 5.06 4.87 4.66 4.52 4.66 3.2
Indonesia 4.30 4.30 4.72 4.37 3.90 (10.8)
Iran 132.46 136.27 138.40 138.40 136.15 (1.6)
Nigeria 35.88 36.22 36.22 36.22 36.22 0.0
Venezuela 79.73 80.01 87.03 87.04 99.38 14.2
Total non-Arab OPEC 252.37 256.80 266.37 279.58 289.35 3.5
Total OPEC 896.66 904.25 913.86 927.06 939.04 1.3
Cont./
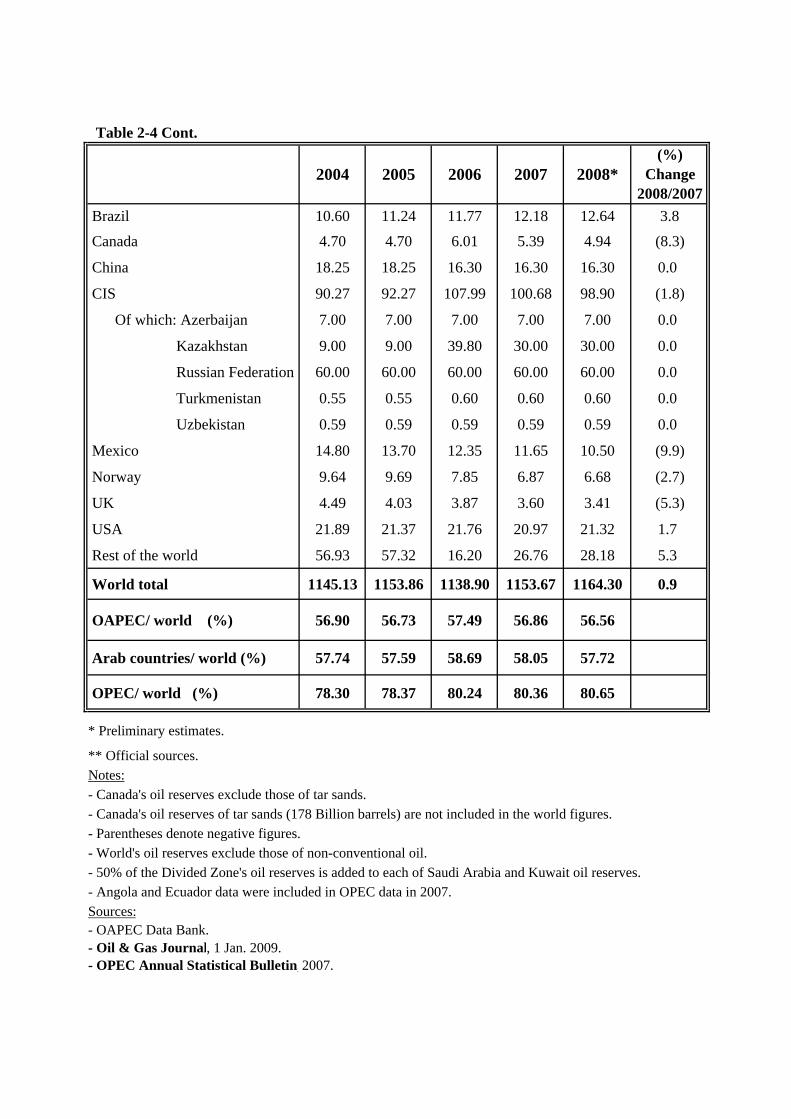
Table 2-4 Cont.
2004 2005 2006 2007 2008*(%)
Change2008/2007
Brazil 10.60 11.24 11.77 12.18 12.64 3.8
Canada 4.70 4.70 6.01 5.39 4.94 (8.3)
China 18.25 18.25 16.30 16.30 16.30 0.0
CIS 90.27 92.27 107.99 100.68 98.90 (1.8)
Of which: Azerbaijan 7.00 7.00 7.00 7.00 7.00 0.0
Kazakhstan 9.00 9.00 39.80 30.00 30.00 0.0
Russian Federation 60.00 60.00 60.00 60.00 60.00 0.0
Turkmenistan 0.55 0.55 0.60 0.60 0.60 0.0
Uzbekistan 0.59 0.59 0.59 0.59 0.59 0.0
Mexico 14.80 13.70 12.35 11.65 10.50 (9.9)
Norway 9.64 9.69 7.85 6.87 6.68 (2.7)
UK 4.49 4.03 3.87 3.60 3.41 (5.3)
USA 21.89 21.37 21.76 20.97 21.32 1.7
Rest of the world 56.93 57.32 16.20 26.76 28.18 5.3
World total 1145.13 1153.86 1138.90 1153.67 1164.30 0.9
OAPEC/ world (%) 56.90 56.73 57.49 56.86 56.56
Arab countries/ world (%) 57.74 57.59 58.69 58.05 57.72
OPEC/ world (%) 78.30 78.37 80.24 80.36 80.65
* Preliminary estimates.
** Official sources.Notes:- Canada's oil reserves exclude those of tar sands.- Canada's oil reserves of tar sands (178 Billion barrels) are not included in the world figures.- Parentheses denote negative figures.- World's oil reserves exclude those of non-conventional oil.- 50% of the Divided Zone's oil reserves is added to each of Saudi Arabia and Kuwait oil reserves.- Angola and Ecuador data were included in OPEC data in 2007.Sources:- OAPEC Data Bank.- Oil & Gas Journal, 1 Jan. 2009.- OPEC Annual Statistical Bulletin, 2007.
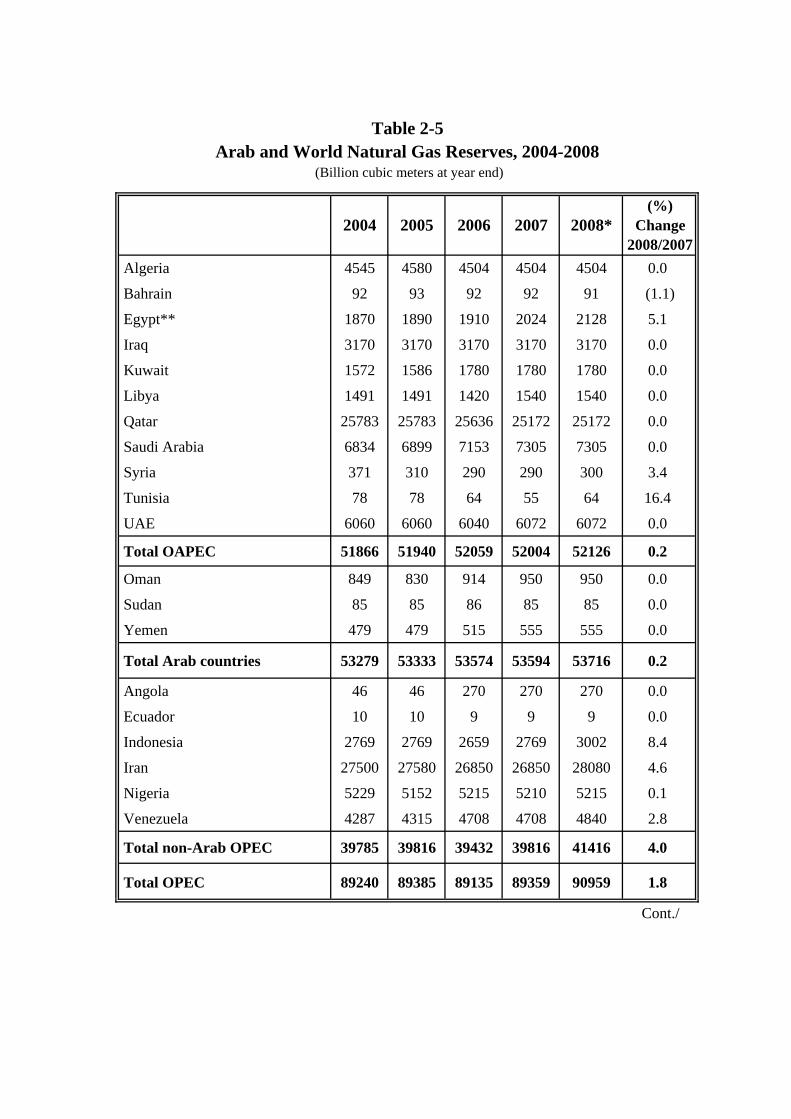
Table 2-5Arab and World Natural Gas Reserves, 2004-2008
(Billion cubic meters at year end)
2004 2005 2006 2007 2008*(%)
Change2008/2007
Algeria 4545 4580 4504 4504 4504 0.0
Bahrain 92 93 92 92 91 (1.1)
Egypt** 1870 1890 1910 2024 2128 5.1
Iraq 3170 3170 3170 3170 3170 0.0
Kuwait 1572 1586 1780 1780 1780 0.0
Libya 1491 1491 1420 1540 1540 0.0
Qatar 25783 25783 25636 25172 25172 0.0
Saudi Arabia 6834 6899 7153 7305 7305 0.0
Syria 371 310 290 290 300 3.4
Tunisia 78 78 64 55 64 16.4
UAE 6060 6060 6040 6072 6072 0.0
Total OAPEC 51866 51940 52059 52004 52126 0.2
Oman 849 830 914 950 950 0.0
Sudan 85 85 86 85 85 0.0
Yemen 479 479 515 555 555 0.0
Total Arab countries 53279 53333 53574 53594 53716 0.2
Angola 46 46 270 270 270 0.0
Ecuador 10 10 9 9 9 0.0
Indonesia 2769 2769 2659 2769 3002 8.4
Iran 27500 27580 26850 26850 28080 4.6
Nigeria 5229 5152 5215 5210 5215 0.1
Venezuela 4287 4315 4708 4708 4840 2.8
Total non-Arab OPEC 39785 39816 39432 39816 41416 4.0
Total OPEC 89240 89385 89135 89359 90959 1.8
Cont./
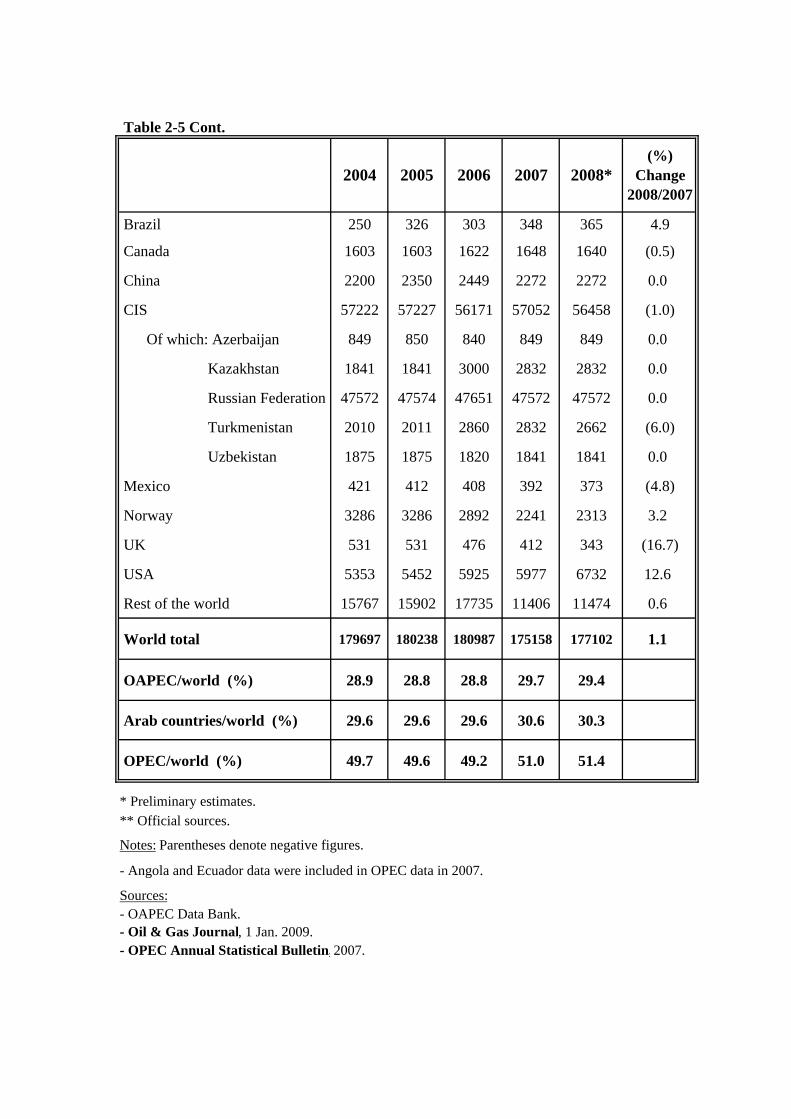
Table 2-5 Cont.
2004 2005 2006 2007 2008*(%)
Change2008/2007
Brazil 250 326 303 348 365 4.9
Canada 1603 1603 1622 1648 1640 (0.5)
China 2200 2350 2449 2272 2272 0.0
CIS 57222 57227 56171 57052 56458 (1.0)
Of which: Azerbaijan 849 850 840 849 849 0.0
Kazakhstan 1841 1841 3000 2832 2832 0.0
Russian Federation 47572 47574 47651 47572 47572 0.0
Turkmenistan 2010 2011 2860 2832 2662 (6.0)
Uzbekistan 1875 1875 1820 1841 1841 0.0
Mexico 421 412 408 392 373 (4.8)
Norway 3286 3286 2892 2241 2313 3.2
UK 531 531 476 412 343 (16.7)
USA 5353 5452 5925 5977 6732 12.6
Rest of the world 15767 15902 17735 11406 11474 0.6
World total 179697 180238 180987 175158 177102 1.1
OAPEC/world (%) 28.9 28.8 28.8 29.7 29.4
Arab countries/world (%) 29.6 29.6 29.6 30.6 30.3
OPEC/world (%) 49.7 49.6 49.2 51.0 51.4
* Preliminary estimates.** Official sources.
Notes: Parentheses denote negative figures.
- Angola and Ecuador data were included in OPEC data in 2007.
Sources:- OAPEC Data Bank.- Oil & Gas Journal, 1 Jan. 2009.- OPEC Annual Statistical Bulletin,2007.
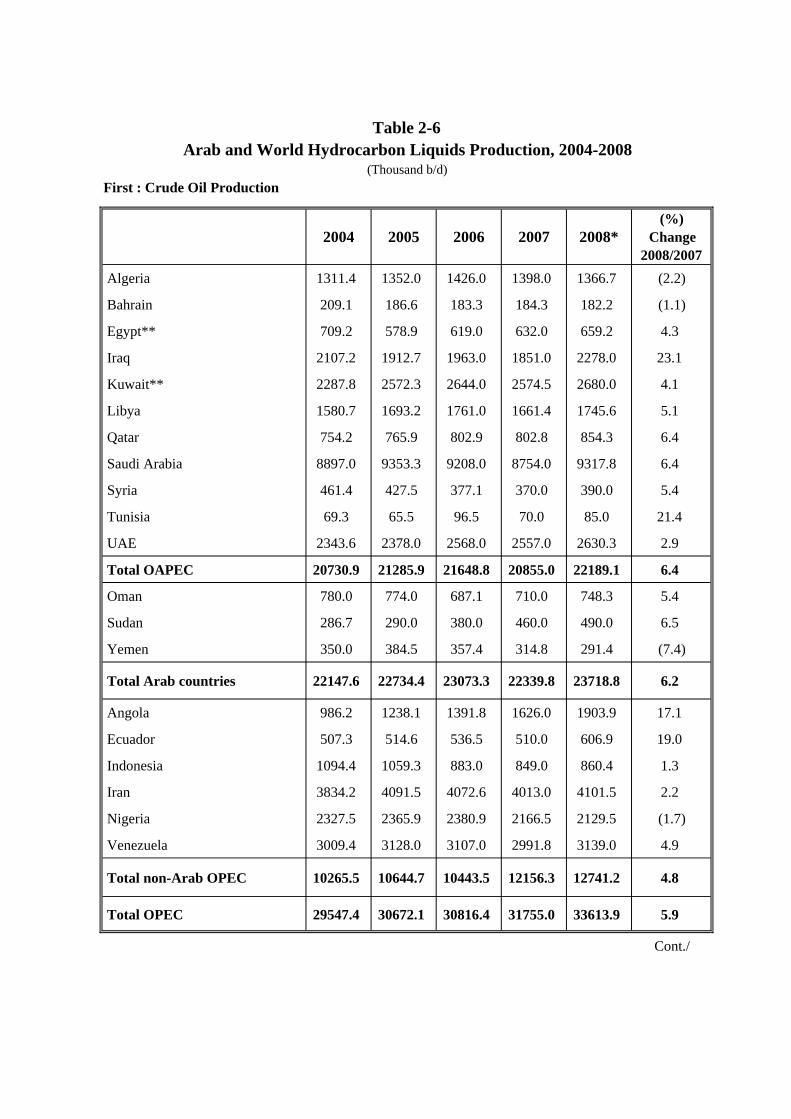
Table 2-6Arab and World Hydrocarbon Liquids Production, 2004-2008
(Thousand b/d)First : Crude Oil Production
2004 2005 2006 2007 2008*(%)
Change2008/2007
Algeria 1311.4 1352.0 1426.0 1398.0 1366.7 (2.2)
Bahrain 209.1 186.6 183.3 184.3 182.2 (1.1)
Egypt** 709.2 578.9 619.0 632.0 659.2 4.3
Iraq 2107.2 1912.7 1963.0 1851.0 2278.0 23.1
Kuwait** 2287.8 2572.3 2644.0 2574.5 2680.0 4.1
Libya 1580.7 1693.2 1761.0 1661.4 1745.6 5.1
Qatar 754.2 765.9 802.9 802.8 854.3 6.4
Saudi Arabia 8897.0 9353.3 9208.0 8754.0 9317.8 6.4
Syria 461.4 427.5 377.1 370.0 390.0 5.4
Tunisia 69.3 65.5 96.5 70.0 85.0 21.4
UAE 2343.6 2378.0 2568.0 2557.0 2630.3 2.9
Total OAPEC 20730.9 21285.9 21648.8 20855.0 22189.1 6.4
Oman 780.0 774.0 687.1 710.0 748.3 5.4
Sudan 286.7 290.0 380.0 460.0 490.0 6.5
Yemen 350.0 384.5 357.4 314.8 291.4 (7.4)
Total Arab countries 22147.6 22734.4 23073.3 22339.8 23718.8 6.2
Angola 986.2 1238.1 1391.8 1626.0 1903.9 17.1
Ecuador 507.3 514.6 536.5 510.0 606.9 19.0
Indonesia 1094.4 1059.3 883.0 849.0 860.4 1.3
Iran 3834.2 4091.5 4072.6 4013.0 4101.5 2.2
Nigeria 2327.5 2365.9 2380.9 2166.5 2129.5 (1.7)
Venezuela 3009.4 3128.0 3107.0 2991.8 3139.0 4.9
Total non-Arab OPEC 10265.5 10644.7 10443.5 12156.3 12741.2 4.8
Total OPEC 29547.4 30672.1 30816.4 31755.0 33613.9 5.9
Cont./
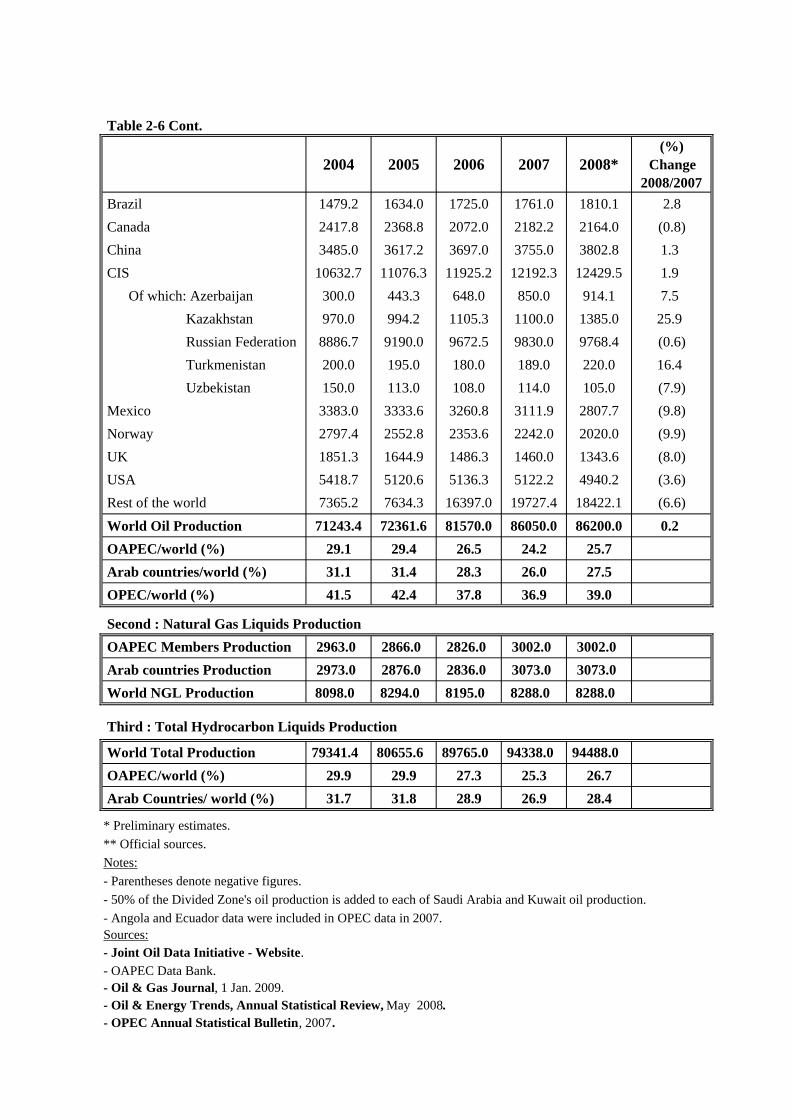
Table 2-6 Cont.
2004 2005 2006 2007 2008*(%)
Change2008/2007
Brazil 1479.2 1634.0 1725.0 1761.0 1810.1 2.8 Canada 2417.8 2368.8 2072.0 2182.2 2164.0 (0.8) China 3485.0 3617.2 3697.0 3755.0 3802.8 1.3 CIS 10632.7 11076.3 11925.2 12192.3 12429.5 1.9 Of which: Azerbaijan 300.0 443.3 648.0 850.0 914.1 7.5 Kazakhstan 970.0 994.2 1105.3 1100.0 1385.0 25.9 Russian Federation 8886.7 9190.0 9672.5 9830.0 9768.4 (0.6) Turkmenistan 200.0 195.0 180.0 189.0 220.0 16.4 Uzbekistan 150.0 113.0 108.0 114.0 105.0 (7.9) Mexico 3383.0 3333.6 3260.8 3111.9 2807.7 (9.8) Norway 2797.4 2552.8 2353.6 2242.0 2020.0 (9.9) UK 1851.3 1644.9 1486.3 1460.0 1343.6 (8.0) USA 5418.7 5120.6 5136.3 5122.2 4940.2 (3.6) Rest of the world 7365.2 7634.3 16397.0 19727.4 18422.1 (6.6) World Oil Production 71243.4 72361.6 81570.0 86050.0 86200.0 0.2 OAPEC/world (%) 29.1 29.4 26.5 24.2 25.7 Arab countries/world (%) 31.1 31.4 28.3 26.0 27.5 OPEC/world (%) 41.5 42.4 37.8 36.9 39.0
OAPEC Members Production 2963.0 2866.0 2826.0 3002.0 3002.0 Arab countries Production 2973.0 2876.0 2836.0 3073.0 3073.0 World NGL Production 8098.0 8294.0 8195.0 8288.0 8288.0
World Total Production 79341.4 80655.6 89765.0 94338.0 94488.0 OAPEC/world (%) 29.9 29.9 27.3 25.3 26.7 Arab Countries/ world (%) 31.7 31.8 28.9 26.9 28.4
* Preliminary estimates.** Official sources.Notes:- Parentheses denote negative figures.- 50% of the Divided Zone's oil production is added to each of Saudi Arabia and Kuwait oil production.- Angola and Ecuador data were included in OPEC data in 2007.Sources:- Joint Oil Data Initiative - Website.- OAPEC Data Bank.- Oil & Gas Journal, 1 Jan. 2009.- Oil & Energy Trends, Annual Statistical Review, May 2008.- OPEC Annual Statistical Bulletin, 2007.
Second : Natural Gas Liquids Production
Third : Total Hydrocarbon Liquids Production

2004* 2005* 2006* 2007*(%)
Change2007/2006
Algeria 990 1140 1120 1160 3.6
Bahrain 10 10 10 10 0.0
Egypt 70 70 70 70 0.0
Iraq 30 30 30 30 0.0
Kuwait 30 40 30 40 33.3
Libya 60 60 60 60 0.0
Qatar 180 210 200 326 63.0
Saudi Arabia 1183 983 983 983 0.0
Syria 10 10 10 10 0.0
Tunisia - - - - -
UAE 400 313 313 313 0.0
Total OAPEC 2963 2866 2826 3002 6.2
Oman - - - 61 -
Yemen 10 10 10 10 0.0
Total Arab countries 2973 2876 2836 3073 8.4
World total 8098 8294 8195 8288 1.1
OAPEC/world (%) 36.6 34.6 34.5 36.2
* Preliminary estimates.Sources:- OAPEC Data Bank.- Oil & Energy Trends, Annual Statistical Review,May 2008.
NGL Production in OAPEC Members and Other Arab Countries,2004-2007
(Thousand b/d)
Table 2-7

Table 2-8Arab and World Marketed Natural Gas,
2004-2007(Million cubic meters/year)
2004 2005 2006 2007*(%)
Change2007/2006
Algeria 82009 89235 88209 83000 (5.9)
Bahrain 9449 10700 11100 11500 3.6
Egypt 32400 42500 52800 46500 (11.9)
Iraq 1750 2650 3500 1660 (52.6)
Kuwait 10900 12300 12900 12600 (2.3)
Libya 8060 11300 13195 15200 15.2
Qatar 39170 45800 49500 59800 20.8
Saudi Arabia 65680 71240 73461 79500 8.2
Syria 5934 7200 7300 5320 (27.1)
Tunisia 2370 2467 2373 3100 30.6
UAE 46290 47000 47400 49200 3.8
Total OAPEC 304012 342392 361738 367380 1.6
Oman 20065 21776 25139 25179 0.2
Total Arab countries 324077 364168 386877 392559 1.5
Angola 750 650 680 830 22.1
Ecuador 240 260 280 275 (1.8)
Indonesia 75400 73800 74000 66700 (9.9)
Iran 89663 100900 108600 111900 3.0
Nigeria 22388 22400 28500 35000 22.8
Venezuela 28405 28900 26000 28500 9.6
Total non-Arab OPEC 215856 226000 238060 243205 2.2
Total OPEC 469715 505525 526225 544165 3.4
Cont./

Table 2-8 Cont.
2004 2005 2006 2007*(%)
Change2007/2006
Canada 189390 185900 187000 183700 (1.8)
China 40800 50000 58600 69300 18.3
CIS 822660 813200 830900 848600 2.1
Of which: Azerbaijan 10200 10400 7700 10300 33.8
Kazakhstan 12600 15400 23500 27300 16.2
Russian Federation 674510 635200 628400 607400 (3.3)
Turkmenistan 63600 na na 67400 -
Uzbekistan 41960 63600 72000 58500 (18.8)
Mexico 47940 39200 43400 46200 6.5
Norway 81560 87000 90500 89700 (0.9)
UK 110490 78000 80200 72400 (9.7)
USA 544190 511800 524100 545900 4.2
Rest of the world 395670 505503 504589 448436 (11.1)
World total 2772633 2860771 2944226 2940000 (0.1)
OAPEC/world (%) 11.0 12.0 12.3 12.5
Arab countries/world (%) 11.7 12.7 13.1 13.4
OPEC/world (%) 16.9 17.7 17.9 18.5
* Preliminary estimates.Notes:- Parentheses denote negative figures.- Angola and Ecuador data were included in OPEC data in 2007.
Sources:- OAPEC Data Bank.- Oil & Energy Trends, Annual Statistical Review, May 2008.- OPEC Annual Statistical Bulletin, 2007.

(Billion tons at year end)
2004 2005 2006 2007
North America 253.2 253.2 253.2 249.3
Canada 6.6 6.6 6.6 6.6 USA 246.6 246.6 246.6 242.7 Central & South America* 21.1 21.1 21.1 17.5 Of which: Brazil 10.1 10.1 10.1 7.1 Colombia 6.6 6.6 6.6 7.0 Europe (except FSU) 59.8 59.8 59.8 46.3 Of which: Germany 6.7 6.7 6.7 6.7 Poland 14.0 14.0 14.0 7.5 UK 0.2 0.2 0.2 0.2 Asia/Oceania 296.9 296.9 296.9 257.5 Of which: Australia 78.5 78.5 78.5 76.6 China 114.5 114.5 114.5 114.5 India 92.4 92.4 92.4 56.5 Indonesia 5.0 5.0 5.0 4.3
Former Soviet Union (FSU) 227.3 227.3 227.3 226.0
Africa 50.3 50.3 50.3 49.6 Of which: South Africa 48.8 48.8 48.8 48.0
Middle East 0.4 0.4 0.4 1.4
World total 909.1 909.0 909.0 847.5
* Mexico is classified within Central and South America.Source:- BP Statistical Review of World Energy, June 2005, June 2006 , June 2007 and June 2008.
World Coal Reserves, 2004-2007Table 2-9

Table 2-10World Coal Production, 2004-2007
(Million tons/year)
2004 2005 2006 2007
North America 1075.2 1094.1 1120.8 1108.6 Canada 66.3 67.6 66.0 69.4 USA 1008.9 1026.5 1054.8 1039.2 Central & South America* 77.3 85.2 93.3 98.8 Of which: Brazil 5.4 6.3 5.9 5.9 Colombia 53.7 60.6 67.3 71.7 Mexico 9.9 10.8 11.5 12.2 Europe (except FSU) 732.0 724.7 719.1 725.9 Of which: Czech Republic 62.0 62.0 62.4 62.6 Germany 207.8 202.8 197.1 201.9 Poland 162.4 159.5 156.1 145.8 UK 25.1 20.5 18.5 17.0 Asia/Oceania 2994.9 3274.3 3503.0 3699.9 Of which: Australia 366.1 378.8 385.3 393.9 China 1992.3 2204.7 2373.0 2536.7 India 407.7 428.4 449.2 478.2 Former Soviet Union (FSU) 453.2 467.5 489.6 488.3 Of which: Kazakhstan 86.9 86.6 96.2 94.4 Russian Federation 281.7 298.3 309.9 314.2 Ukraine 81.3 78.8 80.2 76.3 Africa 249.2 249.0 260.6 273.2 Of which: South Africa 243.4 244.4 256.8 269.4
Middle East 1.1 1.1 0.8 0.8
World total 8852.8 5895.6 6187.2 6395.6
* Mexico is classified within Central and South America.Source:- BP Statistical Review of World Energy, June 2005, June 2006 , June 2007 and June 2008.

Table 2-11Nuclear Power Reactors in Operation and Under
Construction Worldwide (End of 2008)
Country
Reactors in Operation
Reactors Under Construction
Electricity Suppliedby Nuclear
Reactors 2007
No. of Capacity No. of Capacity TWh* (%) of Total
Units (MWe) Units (MWe) Electricity
Argentina 2 935 1 692 7.1 6.2
Armenia* 1 376 - - 1.8 43.5
Belgium 7 5824 - - 48.2 54.1
Brazil 2 1795 - - 12.4 2.8
Bulgaria 2 1906 2 1906 14.6 32.1
Canada 18 12621 - - 93.3 14.7
China 11 8438 11 10120 62.9 1.9
Czech Republic 6 3619 - - 26.1 30.3
Finland 4 2696 1 1600 23.9 28.9
France 59 63260 1 1600 440.4 76.9
Germany 17 20470 - - 140.5 27.3
Hungary 4 1829 - - 14.7 36.8
India 17 3782 6 2910 17.8 2.5
Iran - - 1 915 - -
Japan 55 47587 2 2191 279.0 27.5
Lithuania 1 1185 - - 9.8 64.4
Mexico 2 1300 - - 10.4 4.6
The Netherlands 1 482 - - 4.2 4.1
Pakistan 2 425 1 300 2.4 2.3
Cont./
Country

Table 2-11 Cont.
Country
Reactors in Operation
Reactors Under Construction
Electricity Suppliedby Nuclear
Reactors 2007
No. of Capacity No. of Capacity TWh* (%) of Total
Units (MWe) Units (MWe) Electricity
Romania 2 1300 - - 7.0 13.0
Russia 31 21743 8 5809 159.8 16.0
Slovak Republic* 4 1688 - - 15.3 54.3
Slovenia 1 666 - - 5.0 41.6
South Africa 2 1800 - - 13.2 5.5
South Korea 20 17451 5 5180 142.9 35.3
Spain 8 7450 - - 55.0 17.4
Sweden 10 8995 - - 67.4 46.1
Switzerland 5 3220 - - 27.8 40.0
Taiwan 6 4921 2 2600 40.6 19.3
Ukraine 15 13107 2 1900 92.5 48.1
UK 19 10222 - - 62.4 15.1
USA 104 100582 1 1165 848.9 19.4
Total 438 371675 44 38888 2748.9 13.8
* One Reactor had been closed end of 2008 ineach of Armenia and Slovak Republic.
Sources:- BP Statistical Review of World Energy, June 2008.- IAEA, Website.(Nuclear Power Plants Information), Jan. 2009.
Country
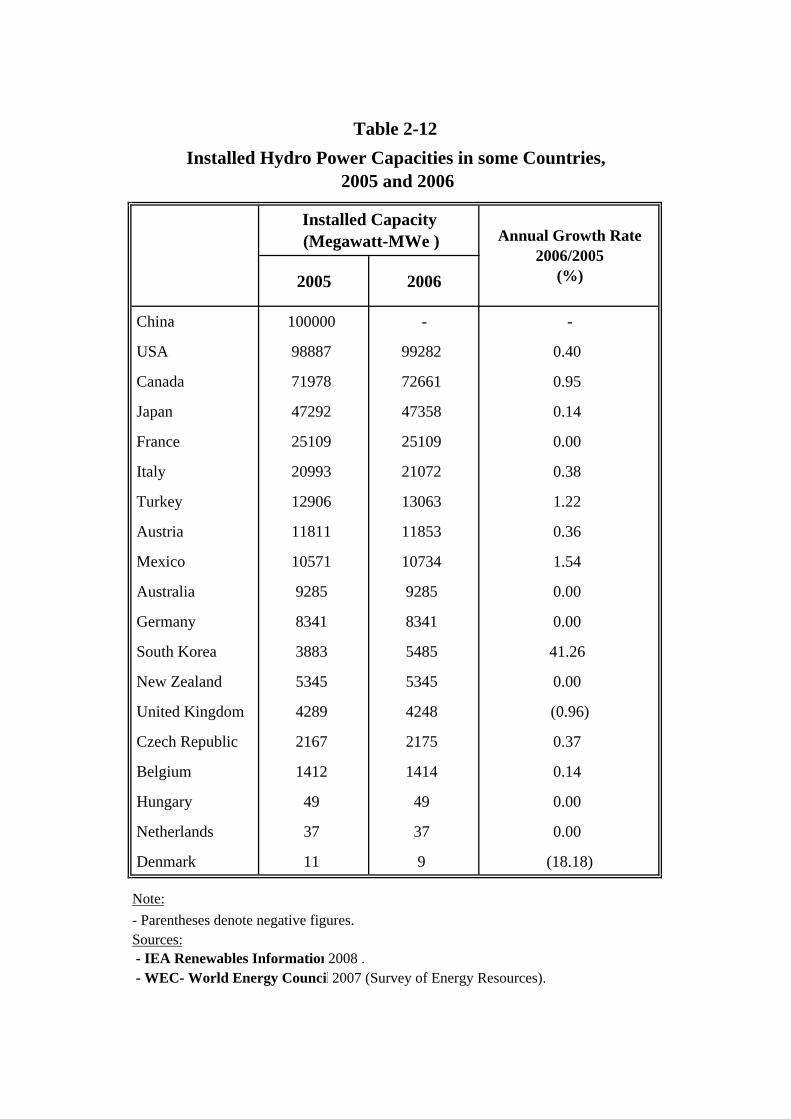
Installed Capacity (Megawatt-MWe )
2005 2006
China 100000 - -
USA 98887 99282 0.40
Canada 71978 72661 0.95
Japan 47292 47358 0.14
France 25109 25109 0.00
Italy 20993 21072 0.38
Turkey 12906 13063 1.22
Austria 11811 11853 0.36
Mexico 10571 10734 1.54
Australia 9285 9285 0.00
Germany 8341 8341 0.00
South Korea 3883 5485 41.26
New Zealand 5345 5345 0.00
United Kingdom 4289 4248 (0.96)
Czech Republic 2167 2175 0.37
Belgium 1412 1414 0.14
Hungary 49 49 0.00
Netherlands 37 37 0.00
Denmark 11 9 (18.18)
Note:- Parentheses denote negative figures.Sources: - IEA Renewables Information 2008 . - WEC- World Energy Council 2007 (Survey of Energy Resources).
Annual Growth Rate2006/2005
(%)
Installed Hydro Power Capacities in some Countries, 2005 and 2006
Table 2-12

2006 2007
Germany 20622 22247 7.9
USA 11635 16879 45.1
Spain 11623 15145 30.3
India 6228 7845 26.0
China 2588 5875 127.0
Denmark 3136 3125 (0.4)
Italy 2123 2726 28.4
France 1567 2454 56.6
United Kingdom 1962 2389 21.8
Portugal 1716 2150 25.3
Netherlands 1558 1746 12.1
Japan 1457 1681 15.4
Austria 965 982 1.8
Sweden 571 788 38.0
Norway 325 333 2.5
Note:- Parentheses denote negative figures.Sources:- BP Statistical Review of World Energy, June 2008. - EWEA- European Wind Energy Association 2008 . - WEC- World Energy Council 2007 (Survey of Energy Resources).
Table 2-13Installed Wind Power Capacities in some Countries,
2006 and 2007
Installed Capacity(Megawatt-MWe )
Annual Growth Rate2007/2006
(%)

Cumulative Installed Capacity (Megawatt-MWe )
2006 2007
Germany 2727.0 3862.0 41.6
Japan 1708.5 1918.9 12.3
USA 624.0 830.5 33.1
Spain 143.0 655.0 358.0
Italy 50.0 120.2 140.4
Australia 70.3 82.5 17.4
South Korea 34.7 77.6 123.6
France 43.9 75.2 71.3
Netherlands 52.7 53.3 1.1
Switzerland 29.7 36.2 21.9
Austria 25.6 27.7 8.2
Canada 20.5 25.8 25.9
Mexico 19.7 20.8 5.6
United Kingdom 14.3 18.1 26.6
Source: - IEA Trends in Photovoltic Applications 2008 .
Annual Growth Rate2007/2006
(%)
Cumulative Installed Photovoltaic Power Capacities in some Countries, 2006 and 2007
Table 2-14
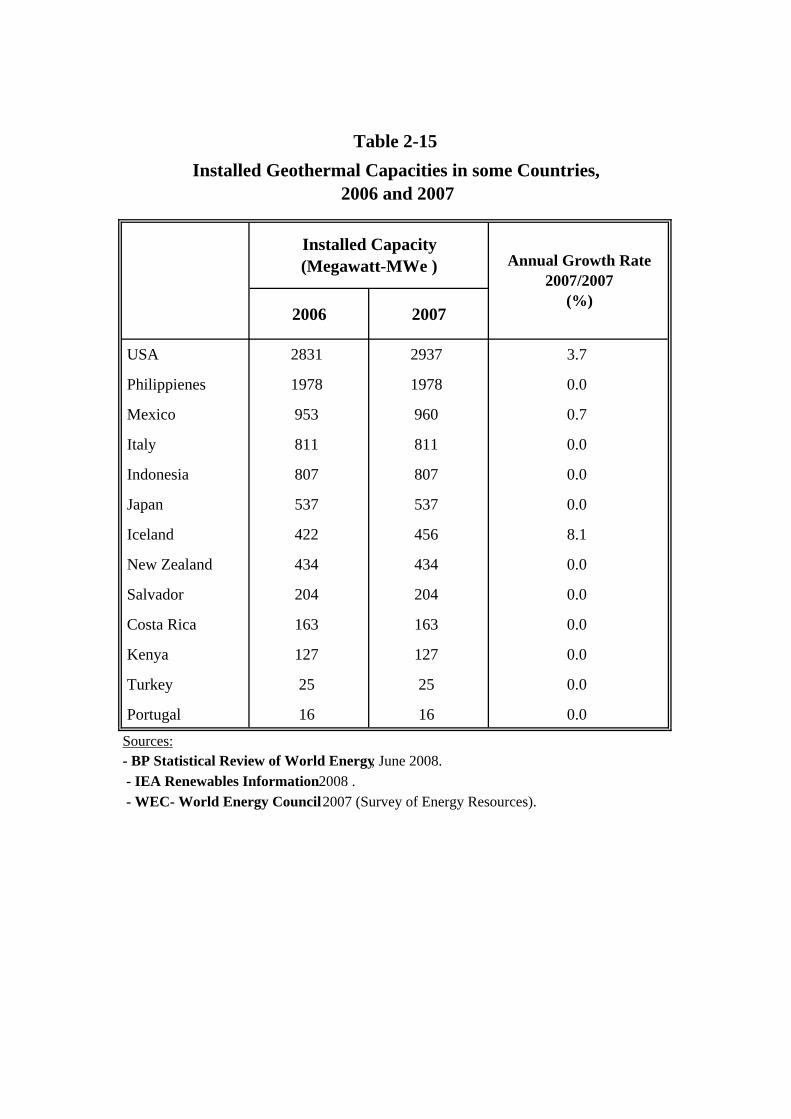
2006 2007
USA 2831 2937 3.7
Philippienes 1978 1978 0.0
Mexico 953 960 0.7
Italy 811 811 0.0
Indonesia 807 807 0.0
Japan 537 537 0.0
Iceland 422 456 8.1
New Zealand 434 434 0.0
Salvador 204 204 0.0
Costa Rica 163 163 0.0
Kenya 127 127 0.0
Turkey 25 25 0.0
Portugal 16 16 0.0Sources:- BP Statistical Review of World Energy, June 2008. - IEA Renewables Information 2008 . - WEC- World Energy Council 2007 (Survey of Energy Resources).
Annual Growth Rate2007/2007
(%)
Table 2-15Installed Geothermal Capacities in some Countries,
2006 and 2007
Installed Capacity(Megawatt-MWe )

2005 2006
USA 6471 6670 3.1
Sweden 2526 3202 26.8
Italy 510 1923 277.1
Finland 1720 1730 0.6
Czech Republic 1182 1558 31.8
Canada 1556 1541 (1.0)
Germany 1008 1094 8.5
Austria 766 766 0.0
Australia 546 546 0.0
United Kingdom 475 512 7.8
Denmark 584 455 (22.1)
Spain 354 391 10.5
Belgium 294 307 4.4
Netherlands 343 299 (12.8)
Mexico 292 292 0.0 Turkey 72 72 0.0 South Korea 17 17 0.0
Note:- Parentheses denote negative figures.Source: - IEA Renewables Information 2008 .
Annual Growth Rate2006/2005
(%)
Table 2-16Solid Biomass Installed Capacities in some Countries,
2005 and 2006
Installed Capacity(Megawatt-MWe )
CHAPTER THREE
ARAB AND WORLD DEVELOPMENTS IN PETROLEUM DOWNSTREAM INDUSTRIES
I. REFINING INDUSTRY
1. World Developments
The total primary distillation capacity of crude oil in 2008 maintained the same growth rate as previous years. It reached its highest level in over seven years ago, rising by 300,000 b/d above 2007. It totaled about 85.6 million b/d at the end of 2008 compared with 85.31 million at the end of 2007. There was a slight decline of the number of operational refineries, from 657 refineries in 2007 to 655 in 2008.
The rise in the total primary distillation capacity of crude oil was due to the operation of Qingdao Refinery, China, with a total capacity of 200,000 b/d. This is in addition to a number of expansions in some existing refineries in various parts of the world, which offset the decline in others refineries, as follows:
• 45,000 b/d at Jean Gaulin Refinery in Quebec, Canada, from 215,000 b/d to 260,000 b/d.
• 30,000 b/d at Yosu Refinery in South Korea, from 650,000 b/d to 680,000 b/d.
• 30,000 b/d at Oita Refinery in Japan, from 130,000 b/d to 160,000 b/d. • 16,000 b/d at El Dorado Refinery in the US, from 110,000 b/d to
126,000 b/d. • 27,000 b/d at LyondellBasell’s Berre l’Etang Refinery in France, from
78,000 b/d to 105,000 b/d.
Two refineries were shut down in 2008: MOL Refinery in Hungary and Koramo Kolin Refinery in the Czech Republic.
Asia topped the world’s regions in terms of oil refining capacity increase in 2008 compared with 2007. The increase amounted to 269,000 b/d, or 1.2%. Then came Western Europe with an increase of 34,000 b/d, or 0.27%, compared with 2007. Figure (3-1), Table (3-1)

Figure 3-1 World Primary Distillation Capacity by Region, End of 2008
North America% 24.5
Africa% 3.8
South America/Caribbean
% 7.7
Asia/Pacific% 26.3
Middle East% 8.2
Western Europe% 17.4
Eastern Europe/CIS
% 12.1
85.6Million b/d
In another development, the total capacity for catalytic conversion processes, which include fluid catalytic cracking (FCC), catalytic hydrocracking, and catalytic reforming, rose by 240,000 b/d, or 0.78%, from its 2007 level. It totaled about 31.03 million b/d at the end of 2008, compared with 30.79 million b/d at the end of 2007. Figure (3-2), Table (3-2).
Figure 3-2 World Catalytic Conversion Capacity by Region, End of 2008
Asia/Pacific% 19.2
Middle East% 5.2
Eastern Europe/CIS
% 8.6
South America/Caribbean
% 5.9
Africa% 2.4
Western Europe% 17.9
North America% 40.8
31.03Million b/d
Catalytic hydrocracking capacity recorded the biggest increase in total
capacity compared with other catalytic processes. At the end of 2008 it rose to about 5.14 million b/d, compared with 4.95 million b/d at the end of
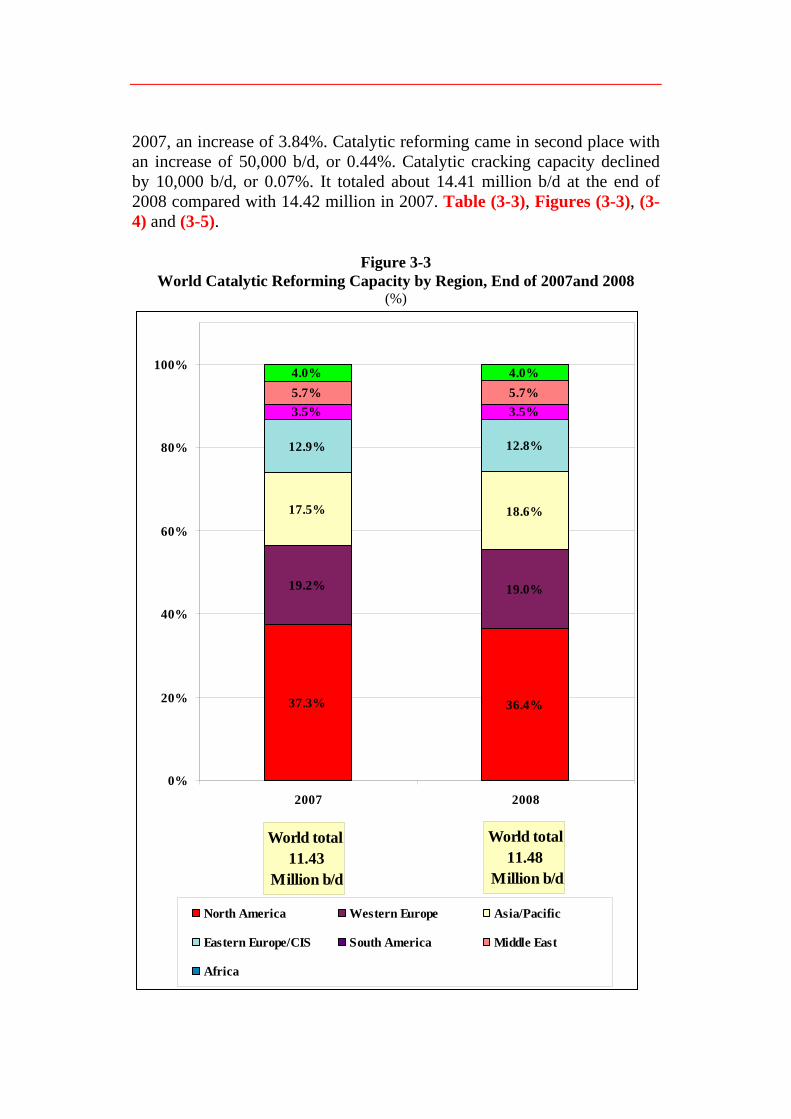
2007, an increase of 3.84%. Catalytic reforming came in second place with an increase of 50,000 b/d, or 0.44%. Catalytic cracking capacity declined by 10,000 b/d, or 0.07%. It totaled about 14.41 million b/d at the end of 2008 compared with 14.42 million in 2007. Table (3-3), Figures (3-3), (3-4) and (3-5).
Figure 3-3 World Catalytic Reforming Capacity by Region, End of 2007and 2008
(%)
World total 11.48
Million b/d
37.3% 36.4%
19.2% 19.0%
17.5% 18.6%
12.9% 12.8%
3.5% 3.5%5.7% 5.7%4.0% 4.0%
0%
20%
40%
60%
80%
100%
2007 2008
World total 11.43
Million b/d
North America Western Europe Asia/Pacific
Eastern Europe/CIS South America Middle East
Africa

Figure 3-4 World Catalytic Cracking Capacity by Region, End of 2007 and 2008
(%)
World total 14.41
Million b/d
45.8% 46.3%
15.4% 15.2%
19.3% 19.4%
6.4% 6.1%
9.1% 9.1%
2.5% 2.5%
1.5%1.5%
0%
20%
40%
60%
80%
100%
2007 2008
World total 14.42
Million b/d
North America Western Europe Asia/Pacific
Eastern Europe/CIS South America Middle East
Africa
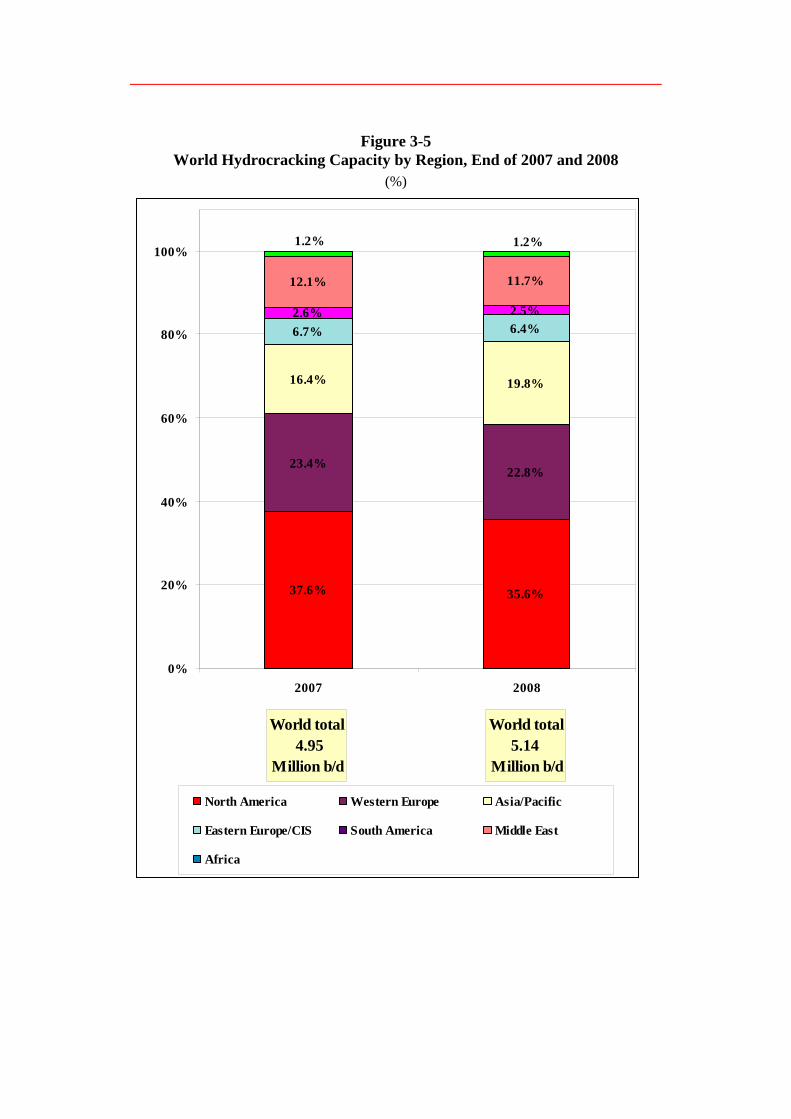
Figure 3-5 World Hydrocracking Capacity by Region, End of 2007 and 2008
(%)
World total5.14
Million b/d
37.6% 35.6%
23.4%22.8%
16.4% 19.8%
6.7% 6.4%2.6% 2.5%
12.1% 11.7%
1.2%1.2%
0%
20%
40%
60%
80%
100%
2007 2008
World total 4.95
Million b/d
North America Western Europe Asia/Pacific
Eastern Europe/CIS South America Middle East
Africa
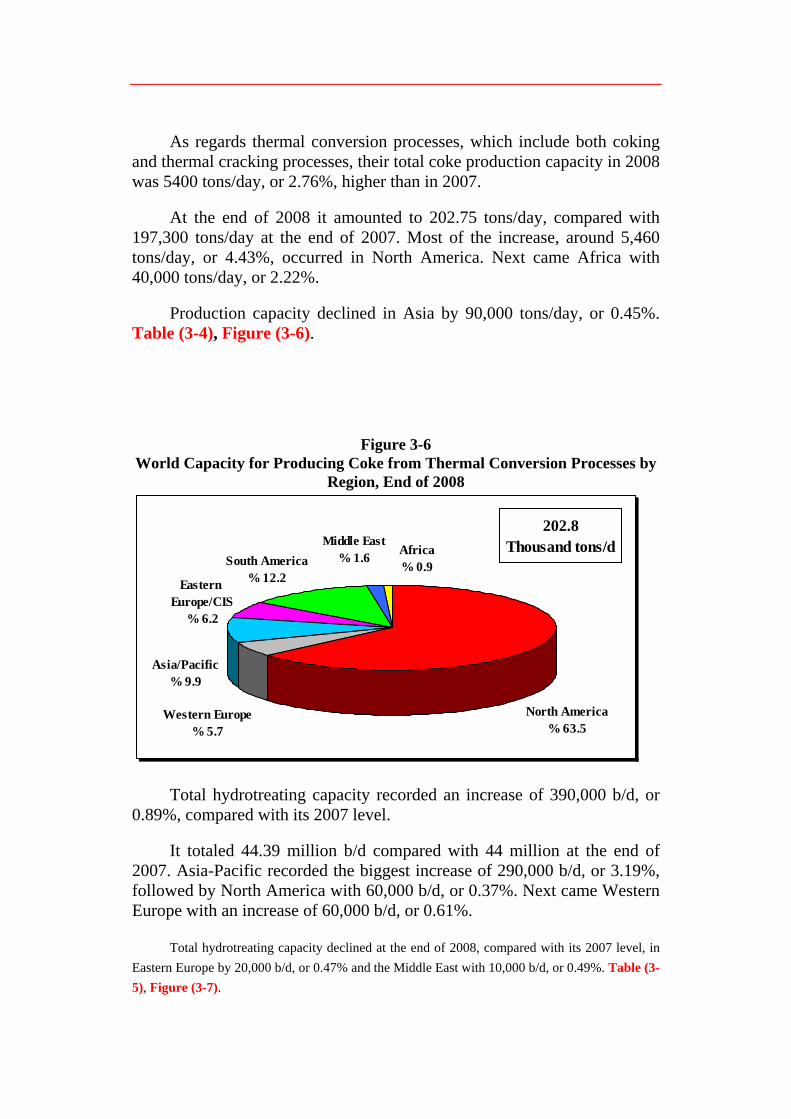
As regards thermal conversion processes, which include both coking and thermal cracking processes, their total coke production capacity in 2008 was 5400 tons/day, or 2.76%, higher than in 2007.
At the end of 2008 it amounted to 202.75 tons/day, compared with 197,300 tons/day at the end of 2007. Most of the increase, around 5,460 tons/day, or 4.43%, occurred in North America. Next came Africa with 40,000 tons/day, or 2.22%.
Production capacity declined in Asia by 90,000 tons/day, or 0.45%. Table (3-4), Figure (3-6).
Figure 3-6 World Capacity for Producing Coke from Thermal Conversion Processes by
Region, End of 2008
South America% 12.2
Middle East% 1.6
North America% 63.5
Africa% 0.9
Western Europe% 5.7
Eastern Europe/CIS
% 6.2
Asia/Pacific% 9.9
202.8Thousand tons/d
Total hydrotreating capacity recorded an increase of 390,000 b/d, or 0.89%, compared with its 2007 level.
It totaled 44.39 million b/d compared with 44 million at the end of 2007. Asia-Pacific recorded the biggest increase of 290,000 b/d, or 3.19%, followed by North America with 60,000 b/d, or 0.37%. Next came Western Europe with an increase of 60,000 b/d, or 0.61%.
Total hydrotreating capacity declined at the end of 2008, compared with its 2007 level, in Eastern Europe by 20,000 b/d, or 0.47% and the Middle East with 10,000 b/d, or 0.49%. Table (3-5), Figure (3-7).

Figure 3-7 Distribution of Hydrotreatong Capacity by Region, End, 2008
Asia/Pacific% 21.2
Eastern Europe/CIS
% 9.6
Western Europe% 22.3
Africa% 1.9
North America% 36.2
Middle East% 4.6
South America% 4.3
44.4Million b/d
2. Developments in Arab Countries
The total primary distillation capacity of refineries in the Arab states remained unchanged at the end of 2008 from its level in 2007. No closures, operation of new refineries or expansions were recorded in OAPEC member countries or other Arab states. The total primary distillation capacities of the 50 oil refineries in OAPEC member countries accounted for 6.61 million b/d, or 89.4 %, of the total primary distillation capacity of the Arab states, which amounted to 7.40 million b/d. Total primary distillation capacity at the 14 oil refineries in other Arab states accounted for the remaining 789,000 b/d, or 10.6 %, of the Arab total. Figure (3-8), Table (3-6).
Figure 3-8 Evolution of Primary Distillation Capacity in the Arab Countries, 2004-2008
(Million b/d)
0
1
2
3
4
5
6
7
2004 2005 2006 2007 2008
OAPEC Members Other Arab Countries
Development and expansion projects for the installed oil refineries in OAPEC member countries and other Arab counties encountered a number of difficulties. They led to delaying the operation of some refineries, which were expected to come on stream in 2008. Decisions to proceed with implementation were also delayed, especially with regard to the construction projects for new refineries, which are still in the phase of feasibility study or engineering design. Tables (3-7) and (3-8). The most important difficulties were as follows:
• High prices of construction materials at the beginning of the year.
• The international financial crisis, which is expected to lead to international economic recession, according to many economists.
• Growing demands by the local environment protection agencies, which call for halting the construction of new projects because the refining industry is hazardous and not environmentally friendly.
• Decline of oil price on the international markets in the final quarter of the year. Investors avoided taking risks on long-term projects based on the expectation that the world economy would suffer recession in the coming years as a result of the current international financial crisis.
Development projects in the existing oil refineries were less affected due to their low cost compared with the construction of new ones and their importance in the refining industry. Such projects improve the capability of oil refineries to produce cleaner fuel and meet the standards and regulations of environment protection.
In Bahrain, Bahrain Petroleum Company (BAPCO) announced the inauguration of its 45,000 b/d hydrocracker and other auxiliary units that help the refinery meet environment protection regulations. It will help the Company export high quality, LPG to the international markets. The project involves the construction of other new units, including a 220 tons/day sulfur recovery unit, sour water treatment units and other units to recover the hydrogen sulfide from gases produced by the refinery.
In Algeria, Sonatrach announced its plans of preparation for tendering for the implementation of the EPC of the 300,000 b/d Tiaret Refinery in early 2009 at a cost of $6 billion. The commencement date is likely to be postponed to 2014. The Ministry of Energy and Mines confirmed that the expansion project is underway in the existing oil refineries: Skikda, Arzew and Algiers.
In Syria, the Ministry of Petroleum and Mineral Resources announced the signing of the statutes of the Furoqlos Company, a joint venture

between the Homs Refinery, the National Iranian Oil Refining and Distribution Company (NIORDC), Petroleos de Venezuela, and Petrofield Refinery Ltd. of Malaysia. The joint venture undertakes to complete the studies for construction of a 140,000 b/d crude oil refinery project in the Furoqlos area, to the east of Homs governorate.
Kuwait’s Noor Financial Investment Company is carrying the finance management of the second refinery, which is expected to be built in Deir ez-Zour in the eastern region with a capacity of 140,000 b/d. The company announced that the techno-economic feasibility study indicated that the estimated cost had risen to $2.6 billion and that construction work is expected to begin in 2009. The third oil refinery project, which is expected to be built in Deir ez-Zour with a capacity of 100,000 b/d, is likely to be carried out according on schedule. A Chinese company will construct and finance most of it.
It is noteworthy that development work at Banias Refinery, located on the Mediterranean coast, is under way. It will improve product quality to meet international standards.
In Qatar, the operation of the 146,000 b/d Ras Laffan condensate refinery was postponed until the third quarter of 2009. The project had been expected to come on stream at the end of 2008. The delay was due to difficulties with securing the necessary construction materials and skilled man power. The expected completion date of the 250,000 b/d al-Shaheen refinery at Mesaieed was postponed from 2011 to 2013.
In Kuwait, the construction project of the 615,000 b/d fourth refinery at al-Zour Terminal was also delayed. Moreover, recent studies show that the estimated construction cost has risen to about $20 billion. Work is under way to develop the other three refineries owned by the Kuwait National Petroleum Company at Mina al-Ahmadi, Mina Abdullah and Shuaiba, with a total design capacity of about 930,000 b/d. It was announced recently that the decision to shut down the Shuaiba refinery after the operation of the new one would be reconsidered. Reports showed that the refinery functioned steadily over the past four years and yielded considerable revenues.
In Libya, it was announced that preparation for tendering for EPC for the construction of the 200,000 b/d Melitah refinery was under way. The project's estimated cost is expected to total about $4 billion. It is expected to come on stream in 2014. Libya’s National Oil Corporation (NOC) announced the signing of a partnership agreement with investment companies for upgrading Ras Lanuf refinery at an estimated cost of over $2 billion.
Search is still underway for specialized companies to carry out the revamping project of al-Zawia refinery. The project includes construction of a continuous catalytic reforming unit to boost gasoline production in addition to hydrotreating, isomerization and desulfurization units.
In Egypt, finance is still being sought for the revamping of Musturud Refinery, which includes the construction of a new hydrocracker with its auxiliary facilities. It was decided that a delayed coking unit be added to the project so as to maximize diesel production at a cost of $2.7 billion. No new developments were reported with regard to the new refinery construction projects announced before such as the 50,000 b/d Aswan Refinery and another 130,000 b/d refinery in Ain al-Sokhna, southeast of Cairo on the Red Sea.
In Yemen, construction work on the 60,000 b/d Ras Isa Refinery was postponed due to a lack of sufficient local crude oil to run the refinery. However, it was announced that a study is being carried out for the construction of a 160,000 b/d refinery in two stages if an external source of oil, such as Saudi Arabia, can be secured.
In Saudi Arabia, there is a conviction that the Kingdom can benefit from the current economic conditions by accepting tempting offers to construct new projects.
The Kingdom is currently building four new refineries at Jubail, Yanbu, Ras Tanura and Jizan. Each has a capacity of 400,000 b/d, which will boost the Kingdom’s refining capacity from 2,098,000 b/d to 3,698,000 b/d. They are expected to come on stream by the end of 2012.
Development of the existing refineries is still under way. It aims to boost their capacity to produce clean, high quality fuel. The development project at Sasref Refinery, which is owned by Saudi Aramco and Shell, aims to produce 10 ppm ultra-low sulfur diesel by building a new hydrocracker and upgrading the existing unit.
It is expected to be completed by the end of 2009. This is in addition to the development projects at Ras Tanura and al-Riyadh refineries, as well as rehabilitating al-Khafji Refinery, which was mothballed in 1990.
Saudi Aramco announced the launch of a project to expand the existing Saudi Aramco Mobil Refinery (Samref). Phase I will involve the construction of a new hydrocracker, upgrading the existing middle distillate hydrocracker and construction of a fluid catalytic cracking unit at a cost of $700 million. Phase II will involve the construction of a 40,000 b/d hydrotreater, a sulfur recovery unit and a hydrogen gas producing unit at a cost of $800 million.

Table 3-7 New refinery construction projects in OAPEC member countries
Table 3-8 New refinery construction projects in other Arab states
Country Project Status Production
capacity 1000 b/d
Start-up date
Oman Al-Duqm Feasibility study 200 -
Sudan Port Sudan Feasibility study 150 2010
Morocco Al-Jarf al-Asfar Feasibility study 200 2015
Ras Issa Engineering design 160 2012 Yemen
Hadramout Feasibility study 50 -
Country Project Status Production
capacity 1000 b/d
Start-up date
UAE Fujaira Feasibility study 500 -
Algeria Tiaret Feasibility study 300 2014
Yanbu Initial design and engineering
400 2012
Jubail Initial design and engineering
400 2012
Ras Tanura Feasibility study 400 2012
Saudi Arabia
Jizan Feasibility study 400 -
Furoqlos Feasibility study 140 2012
Deir ez-Zour Feasibility study 140 2012
Syria
Deir ez-Zour Feasibility study 100 2012
Two refineries in Kurdistan
Cornerstone laying 10/10 2009
Two refineries in Karbala
Under construction 140/30 - Iraq
Distillation unit in al-Najaf
Feasibility study 10 -
Ras Lafan Under construction 146 2009 Qatar
Al-Shaheen Feasibility study 250 2013
Kuwait Al-Zour Terminal Bid studying 615 2014
Aswan Refinery Feasibility study 50 - Egypt
Ain al-Sokhna Feasibility study 130 -
Tunisia Skhira Feasibility study 140 2010

II. PETROCHEMICAL INDUSTRIES
1. World Developments
World ethylene production capacity in 2007 rose by 2 million tons/year, which was considerably more than the 2006 increase of 245,000 tons/year. This increase brought world ethylene production in 2007 to 119.6 million tons/year, or 1.7% higher than the 2006 total of 117.6 million. It was the result of operating a new train in an existing plant. Formosa Petrochemicals in Mailiao, Taiwan, operated a new 1.2 million ton/year ethylene cracker, the largest in Asia. Formosa Petrochemicals complex has three trains at a total production capacity of 2.5 tons/year, which makes it the largest ethylene production complex in Asia and the second largest worldwide. The remaining 800,000 tons were due to a number of expansions and debottlenecking at existing units. No shutdown was recorded during the year.
Figure (3-9) shows that increases in production capacities recovered from the last year low level, which was the lowest in the last 20 years.
The increases recorded in 2007 were the highest in over 20 years. New projects that will produce over 17 million tons/year are expected to come on stream in the Middle East in 2008 after being delayed many times. Most of them are in Iran.
Figure 3-9 World Existing Ethylene Production Capacity by Region, End of 2007
0
1
2
3
4
5
6
7
8
1989
1990
1991
1992
1993
1994
1995
1996
1997
1998
1999
2000
2001
2002
2003
2004
2005
2006
2007
*200
8

Figure (3-10) shows that there was a slight rise in the global operating rate in 2007, but is still lower than the peak (93%) in 2004. Operating rates are expected to drop to the low levels of 2001-2003 as a result of large production capacities coming on stream in December 2008.
Figure (3-10) also shows that the demand for ethylene will not keep pace with rapidly expanding capacity.
Figure 3-10 Ethylene Operating Rate Worldwide
020406080
100120140160180
2000
2001
2002
2003
2004
2005
2006
2007
2008
2009
2010
2011
2012
Dem
and,
cap
acity
, mill
ion
tone
s
76788082848688909294
operating rate %
demand capacity operating rate
Table (3-7) shows the world’s ten largest ethylene production complexes. Nova Chemical Corporation’s 2.8 million ton/year Joffre Plant in Canada remains the top spot on the list. Formosa Petrochemicals is a new listing in this table due to operating its new unit at the Mailiao complex, which was previously 14th largest in the world. Now it is the world’s second largest ethylene complex. As a result, all other companies fell a spot from last year rating. Shell Chemical’s 1.5 million ton/year Norco Plant in Louisiana fell off the list.
Figure (3-8) compares the existing world ethylene production capacity by region in 2006 and 2007. Figure (3-11) shows distribution of total existing ethylene capacities at the end of 2007.
The Pacific region and Western Europe recorded the highest rates during that period - 1.4 million tons/year and 490,000 tons/year respectively. Other regions recorded some increases, except the Middle East, which recorded a slight decline.

Figure 3-11 Distribution of Total Existing Ethylene Capacities, end of 2007
South America% 4.2
Western Europe% 20.8
Eastern Europe/CIS
% 7.1
Asia/Pacific% 27.5
Africa% 1.4
North America% 30.2
Middle East% 8.9
119.6Million tons
In addition to the start-up of the Formosa Plant in Mailiao, two other
plants in Asia-Pacific showed large expansions of ethylene production capacity. Samsung-Total Petrochemical (50/50) joint venture boosted the production capacity of its naphtha cracker in Daesan, South Korea, from 600,000 tons/year to 820,000 tons/year in June 2007. Exxon Mobil successfully completed the expansion of its steam cracker in Singapore, to increase its total ethylene production capacity to 900,000 tons/year, with an increase of 40,000 tons over the previous year. Moreover, two major expansions were completed in Western Europe. BASF boosted the production capacity of its ethylene plant in Antwerp, Belgium, to 1.08 million tons/year, with an increase of 208,000 tons/year. OMV completed an expansion of its petrochemical plant in Burghausen in Bavaria, Germany and boosted its ethylene production capacity by 110,000 tons/year to 450,000 tons/year. Table (3-9) shows world’s ethylene production capacity by country in 2006 and 2007.
In 2007 there were two significant developments in terms of acquisition and ownership. LyondellBasell Industries purchased the 320,000 ton/year ethylene plant in Munchsmuntser, Germany, from Ruhr Oel. Basell and Lyondell Chemical Co. merged to form LyondellBasell Industries. The $20 billion deal included the Lyondell subsidiary Equistar Chemicals LP, which has six ethylene production plants in the US.
Table (3-10) lists the world’s ten largest ethylene producers in 2007. Two changes have taken place in the order of the companies. The LyondellBasell acquisition moved it up to fifth on the list and Formosa’s new plant in Taiwan allowed the company to move up to seventh place. The company was not included in the list last year.

2. Arab Developments
2-1 Egypt
Egypt’s Supreme Energy Council decided to cancel Agrium’s nitrogen fertilizer project that was scheduled to be build at Ras el-Bar, Damietta, Egypt, and to ban the establishment of any industrial projects in that area. The Council agreed that Misr Oil Processing Company (Mopco) should complete the agreement negotiated with Agrium Egypt and implement the Company’s plans on dedicated land in the general industrial zone to the west of the navigational canal, which will bring technical and economic benefits to Egypt. It also called for the establishment of an advanced environment monitoring station in Damietta, which will be supervised by the Ministry of the Environment and the Governorate’s Environment Department.
2-2 Kuwait
Kuwait Petroleum Corporation (KPC) is considering building a refining and petrochemical complex in India. It is in talks with India’s Reliance Industries Ltd. (RIL) and India Oil Corporation on the possibility of collaborating on the project, which will be built from scratch. The project comprises a 150,000-400,000 b/d refinery and a petrochemical complex that includes an 800,000 ton/year ethylene plant. KPC will supply the refinery with Kuwaiti oil. The refined products and petrochemicals will be exported.
KPC carried out a feasibility study to construct a $5 billion petrochemical complex in Nansha in Guangdong province, China. The complex will comprise a one million ton/year ethylene plant and is expected to come on stream in 2010-2011.
A consortium of China’s Sinopec and KPC will construct it. Dow Chemical and Shell may join the consortium. China’s National Development and Reform Committee approved the project in 2006 but the provincial government has opposed it on environment grounds, claiming that the area is not suitable for such industrial activities.
The Kuwaiti government decided to cancel a joint venture deal with the US Dow Chemical Company (DOW) in December 2008. The Petrochemical Industries Company (PIC) had signed an agreement with DOW to establish K-Dow Petrochemicals. PIC was due to pay $7.5 billion for its share after Kuwait and Dow reduced the value of the joint venture, which was announced in December 2007, by over 8% to $17.4 billion. This came after Kuwait requested to reduce its shareholding in light of the slump in international demand. Kuwait cancelled the deal because the joint venture was not economically viable in light of the international financial crisis.

2-3 Qatar
The rise in profit margins of the Qatari petrochemical industry resulted in doubling the net profit of the industry in the first half of 2008, compared with the first half of 2007. Net profit rose from 2 billion Qatari riyals to QR4.6 billion ($1.26 billion). The profit margins of Qatar Petrochemicals (Qapco) rose by over 100% to QR1.58 billion in 2008. Qapco aims to hit sales of 315,000 tons of ethylene, 400,000 tons of low density polyethylene (LDPE), 37,000 tons of LPG, 29,000 tons of secondary gases, and 62,000 tons of sulfur. Production capacity is scheduled to reach 720,000 tons of ethylene and 404,000 tons of LDPE by the end of 2008. The profits of Qatar Fertilizer Company (Qafco) also rose in the first half of 2008, by 93%, to QR1.72 billion. Sales this year are expected to amount to 425,000 tons of ammonia and 2.97 million tons of urea. Production capacity is estimated at 2.09 million tons/year of ammonia and 2.92 million tons/year of urea.
Qatar’s production of petrochemicals currently represents 2% of the Gulf states’ total petrochemical production. It will rise to 4%-5% with the start-up of new projects in 2009. Three new Qapco plants will come on stream with investments of over $1 billion. They are a 1.83 million ton ethylene cracker at Ras Laffan and a 45,000 ton LDPE plant owned by Qatofin, both of which will come on stream in June 2009. The third project will come on stream in 2010. • Qatar Petroleum signed an agreement with South Korea’s petrochemical
company Honam in May 2008 to build a huge petrochemical complex at Mesaieed. The complex will comprise four plants with a combined capacity of 2.8 million tons/year to produce propylene, styrene monomer, polystyrene, aromatics (xylene) and other products.
• Qatar Fuel Additives Company Limited (Qafac) currently produces 832,000 tons/year of methanol. The company is considering the construction of a new 2.2 million ton/year methanol plant at Mesaieed. The $540 million plant will be the largest of its type in the world.
• Qatar Plastic Products Company plans to be the largest manufacturer of packing materials in the Gulf to meet the growing demand for such materials in the Middle East. The company boosted its production capacity of polyethylene films to 30,000 tons/year in 2008 and of polymer to 2 million tons/year.
2-4 Saudi Arabia
Saudi Aramco continues to implement the major petrochemical projects in which it participates. They include the second stage of
PetroRabigh Complex and Ras Tanura Complex, as well as a number of joint ventures in China.
Aramco and Total signed agreements in May 2008 to proceed with a petrochemical complex to be built in Jubail after two years of studying the engineering design. The joint venture was established with 62.5% ownership by Aramco and 37.5% by Total. Some 25% of Aramco’s share will be offered for public subscription. The complex will comprise a 400,000 b/d refinery and produce 700,000 tons/year of paraxylene, 140,000 tons of benzene and 200,000 tons of propylene. The project is expected to come on stream in 2012.
PetroRabigh is expected to postpone the start-up of a number of its units until the first quarter of 2009 because operating costs rose by 3%. PetroRabigh Complex comprises a 1.3 million ton/year ethylene unit and a 900,000-ton/year propylene unit. It also comprises other plants that will produce 300,000 tons/year of polyethylene, 350,000 tons/year of polypropylene, 200,000 tons/year of propylene oxide, and 600,000 tons/year of ethylene glycol and butane-1.
• The Saudi Ministry of Petroleum and Mineral Resources mediated in August 2008 between Sipchem and SABIC regarding the supply of ethylene and propylene feedstock to nine derivatives plants to be built by Sipchem in Jubail. SABIC may own 50% of the complex, which is worth $5 billion. The need for the feedstock is crucial after Sipchem recently decided to postpone its plans to build an olefins complex with a capacity of one million tons/year of ethylene and 215,000 tons/year of propylene as costs rose to $2 billion. Sipchem hopes to pass on its ethane and propane allocations for the complex to SABIC to feedstock its units.
• Ar Razi Company inaugurated a new methanol plant in Jubail in January 2008, which boosted its total production capacity by 1500 tons/day to 5000 tons/day.
• The Arabian Industrial Fibers Company (Ibn Rushd) plans to boost its petrochemical production. In August 2008 it announced the construction of a polypropylene plant in Yanbu with a capacity of 525,000 tons/year. The plant is expected to come on stream in 2012.
• SABIC signed an agreement in January 2008 to acquire 35% of the petrochemical complex shares, which Osos Petrochemicals is planning to construct in Yanbu at a cost of $1 billion. The project comprises a plant to produce polybutylene terephthalate, or PBT, and intermediates related products. It comprises units that will produce 60,000 tons/year of PBT, 50,000 tons/year of butanediol, 3500 tons/year of tetrahydrofuran (THF) and 85,000 tons/year of maleic anhydride (MA). Once the agreement comes into effect, SABIC's share of the total global PBT production will be 15%.
• Al-Mutaqadima Complex [Advanced Polypropylene Company (APPC)] started propylene and polypropylene production in the first quarter of 2008. The complex comprises a 455,000 ton/year propane dehydrogenation plant and a 450,000 ton/year polypropylene plant.
• SABIC and Saudi Aramco plan to reinforce cooperation between them in local and international investment projects, especially in China, where Saudi companies have growing interests. The two companies signed a cooperation agreement in July 2008, according to which SABIC will market the products of Saudi Aramco from its joint venture with Sinopec in Fujian province. The Saudi government encourages both companies to reinforce joint development with the foreign company.
2-5 UAE
Developments in the petrochemical industry in the UAE are concentrated in Abu Dhabi, where most of the capacity for producing olefins and polymers is owned by the Abu Dhabi Polymers Company (Borouge). The Company dominates the petrochemical industry and is currently carrying out “Borouge-2” expansion project in addition to the “Borouge-1” Complex in Ruwais. The project is expected to come on stream in 2010. Upon its completion, Ruwais will be one of the world’s largest plastic and chemical production areas.
Borouge 2 is one of the largest petrochemical projects in the Middle East. It will boost the Company’s production capacity of polyolefins from 600,000 tons/year to 2 million tons/year. The new capacity will comprise one 540,000 ton/year and two polypropylene units with a total capacity of 800,000 tons/year.
The Company initiated a feasibility study for “Borouge-3” in April 2008. It aims to boost its production capacity to 2.5 tons/year of polyolefins, which will bring its total production capacity to 4.5 million tons/year by 2014. The project will strengthen the Company’s position in global markets.
The international petroleum investment company “Borealis” intends to develop the petrochemical industry at Taweelah. The company signed a preliminary agreement with the Abu Dhabi Investment Council in 2008 to carry out a feasibility study for the construction of a Petrochemical complex called Chemaweyaat-1. This $20 billion project will comprise naphtha crackers, aromatics, phenol and derivatives units with a capacity to produce 7 million tons/year. This project is based on the company’s desire to focus on olefins and polyolefins. The construction of a melamine plant will be included in the feasibility study after the company decided not to construct a melamine plant at Borouge site in Ruwais. Upon its completion,

scheduled for 2013-2014, Chemaweyaat-1 will be the largest integrated grass root chemical project in the world.
Sharjah witnessed a development in the petrochemical industry in early 2008. The first petrochemical plant in al-Hamriyah free zone came on stream. It comprises a 1180-ton/day ammonia unit and a 1000-ton/day urea unit.
JPF RAK LLC, a joint venture between JPF Industries Limited, a dedicated polyester manufacturer in India, and RAKIA (Ras al-Khaimah Investment Authority), inaugurated its new polyethylene terephthalate (PET) resin plant in Ras al-Khaimah. The joint venture will have a production capacity of 200 tons/day of PET films for the packaging industry and 600 tons/day of bottle-grade PET resin.
Fujairah Plastic, the largest producer of polymer films used for packaging in the UAE, aims to double its production during 2007-2010 drived by the growing international demand. The company currently produces about 240,000 tons/year at its plants in Sharjah, Ajman and Fujairah and exports 70% of its production. Its fourth plant located in Fujairah’s industrial area came on stream in 2008 with a capacity of 12,000 tons/year, which will rise to 24,000 tons/year in 2009.
III. NATURAL GAS CONSUMPTION, TRADE AND PROCESSING
1. World Developments
1-1 Natural Gas Consumption
World consumption of natural gas in 2007 rose by 3.1%, compared with its level in 2006. World consumption of natural gas totaled about 2,921.9 billion cubic meters in 2007, against about 2,834.4 billion in 2006. The share of natural gas in the world’s total commercial energy consumption rose from 23.6% in 2006 to 23.8% in 2007. Table (3-11) and Figure (3-12) show the distribution of world natural gas consumption by region in 2006 and 2007.
Most major regions of the world experienced growth in gas consumption at various rates in 2007. The lowest rate was 0.4%, recorded in Europe and Eurasia (including Europe, the CIS and Turkey). The highest rate was 7.2%, recorded in Africa. Total consumption of natural gas in Europe and Eurasia amounted to about 1155.7 billion cubic meters in 2007,
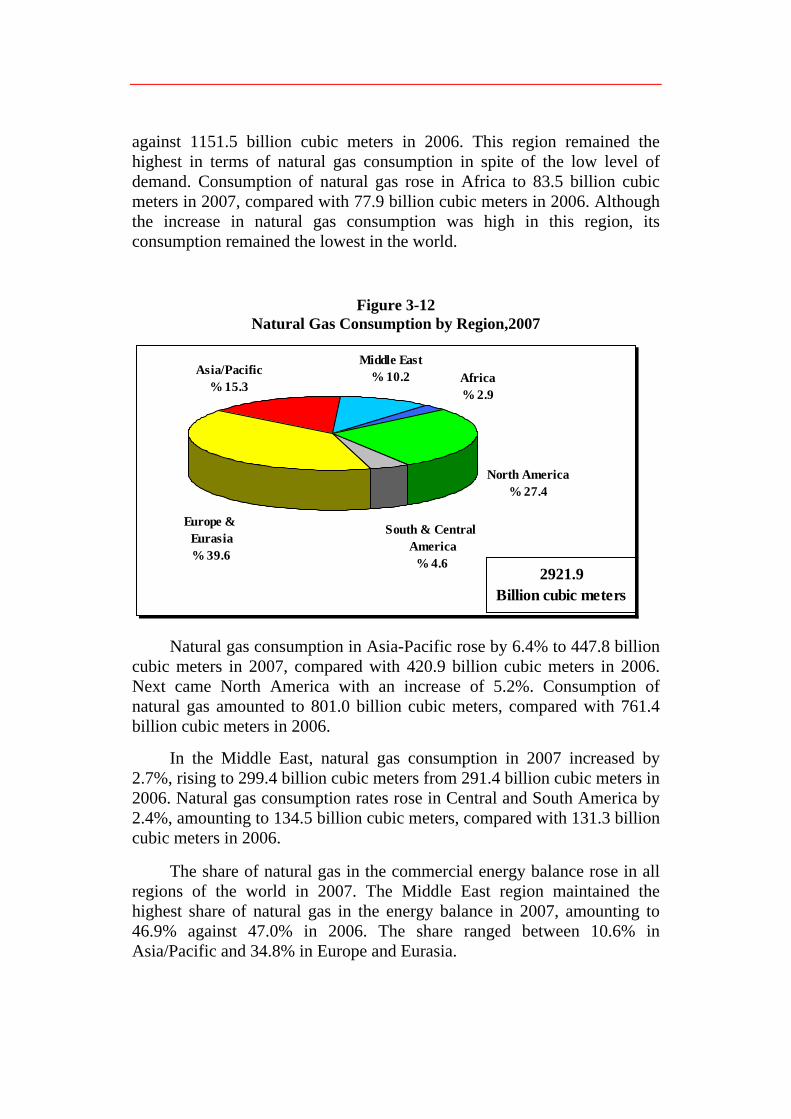
against 1151.5 billion cubic meters in 2006. This region remained the highest in terms of natural gas consumption in spite of the low level of demand. Consumption of natural gas rose in Africa to 83.5 billion cubic meters in 2007, compared with 77.9 billion cubic meters in 2006. Although the increase in natural gas consumption was high in this region, its consumption remained the lowest in the world.
Figure 3-12 Natural Gas Consumption by Region,2007
Middle East% 10.2Asia/Pacific
% 15.3
Europe & Eurasia% 39.6
South & Central America
% 4.6
Africa% 2.9
North America% 27.4
2921.9Billion cubic meters
Natural gas consumption in Asia-Pacific rose by 6.4% to 447.8 billion cubic meters in 2007, compared with 420.9 billion cubic meters in 2006. Next came North America with an increase of 5.2%. Consumption of natural gas amounted to 801.0 billion cubic meters, compared with 761.4 billion cubic meters in 2006.
In the Middle East, natural gas consumption in 2007 increased by 2.7%, rising to 299.4 billion cubic meters from 291.4 billion cubic meters in 2006. Natural gas consumption rates rose in Central and South America by 2.4%, amounting to 134.5 billion cubic meters, compared with 131.3 billion cubic meters in 2006.
The share of natural gas in the commercial energy balance rose in all regions of the world in 2007. The Middle East region maintained the highest share of natural gas in the energy balance in 2007, amounting to 46.9% against 47.0% in 2006. The share ranged between 10.6% in Asia/Pacific and 34.8% in Europe and Eurasia.

Table (3-12) and Figure (3-13) show the evolution of the share of natural gas in total commercial energy consumption by region in 2004-2007.
Figure 3-13 Share of Natural Gas in the Total Consumption of commercial Energy,
2004-2007 (%)
76.2
23.8
76.5
23.5
76.4
23.6
76.2
23.8
0102030405060708090
100
2004 2005 2006 2007
Other Energy Sources Natural Gas
1-2 Natural Gas Trade
The volume of natural gas exports worldwide increased by 3.7% in 2007, rising to 782.42 billion cubic meters compared with about 754.22 billion in 2006. These figures cover both gas exports via pipeline and LNG exports. Eurasia and other European countries topped the percentage increase in natural gas exporting of 70.5% with an increase of 5.3 billion cubic, as a result of the increase in their natural gas exports via pipeline to European market and Turkey. Qatar came second with an increase in exports 22.7% a 8.4 billion cubic meters. Nigeria came in third place with an increase in exports 20.4% a 3.58 billion cubic meters. Libya was fourth with an increase of 18.4% a 1.55 billion cubic meters.
US net imports of natural gas via pipeline in 2007 totaled about 108.9 billion cubic meters, which represented about 16.7% of its total consumption of natural gas. Canada remained the largest natural gas supplier to the USA. In 2007 the USA imported LNG from Algeria, Egypt, Equatorial Guinea, Nigeria, Qatar, and Trinidad and Tobago. LNG represented about 16.7% of total US natural gas imports (21.82 billion cubic meters) and about 3.3% of the US consumption of natural gas. US exports of natural gas in 2007 increased to 23.19 billion cubic meters, or 10.7% over the 2006 record of 20.94 billion. Its exports to Canada totaled

13.2 billion cubic meters and 8.81 billion to Mexico. Its exports of LNG to Japan totaled about 1.18 billion cubic meters.
Russia topped the world’s natural gas exporters, with a share of about 18.9% of world exports in 2007. Its natural gas exports via pipeline to most European countries totaled 147.53 billion cubic meters, which was 3.93 billion cubic meters less than that of 2006. Canada came second with 13.7%, followed by Norway with 11.0%, Algeria with 7.5%, the Netherlands with about 6.4%, Qatar with 5.8%, Indonesia with about 4.2% and Malaysia with about 4%. The exports of the aforementioned countries collectively constitute about 71.5% of total world exports of natural gas. See Table (3-13) and Figure (3-14).
Figure 3-14 Natural Gas Export Worldwide, 2007
Russia% 18.9
Rest of World% 29.0
Middle East% 9.3
Indonesia% 4.2
Algeria% 7.5Netherlands
% 6.4
Norway% 11.0
Canada% 13.7
782.4Billion cubic meters
The volume of natural gas exported by pipeline rose from about 537.06 billion cubic meters in 2006 to about 552.65 billion in 2007, or by 2.9%. The quantities of gas exported by tanker in the form of LNG also rose from 217.16 billion cubic meters to 229.77 billion, or by 5.8%. Pipeline exports accounted for 70.63% of total natural gas exports in 2007, which was slightly less than the percentage recorded in 2006 (71.21%).
Other exports in the form of LNG accounted for 29.37% of the total in 2007, against 28.79% recorded in 2006, as shown in Table (3-14) and Figure (3-15).

Natural gas exports from Arab states- either in the form of LNG or via pipeline-to international markets kept rising in 2007 for the thirteenth consecutive year, reaching 150.9 billion cubic meters compared with 144.1 billion in 2006, an increase of 4.7%. Algeria maintained the lion’s share of total Arab gas exports in 2007. Algerian exports amounted to 58.7 billion cubic meters, representing 38.9% of total Arab exports. Qatar came second with total exports of 45.61 billion cubic meters, or 30.2% of total Arab exports, then Egypt with 10.6%, Oman with 8.7%, Libya with 6.6%, and finally the UAE with 5%, as shown in Table (3-15) and Figure (3-16).
Figure 3-15 Natural Gas Export Worldwide, 2006-2007
71.21
28.79
70.63
29.37
0
20
40
60
80
100
2006 2007
by Pipeline as LNG
Figure 3-16 Arab Natural Gas Export, 2007
UAE% 5.0
Egypt% 10.6
Qatar% 30.2
Libya% 6.6
Oman% 8.7
Algeria% 38.9
150.9Billion cubic meters

1-3 World Natural Gas Prices Prices of natural gas-exported either in the form of LNG or via
pipeline-witnessed a remarkable increase in some major markets during 2007, compared with 2006. Prices of LNG transported to Japan increased about 8.3%, while average prices in the Canadian markets rose 5.8%, and in the markets of the EU countries and the US by 2.8%. At the same period, prices declined in the UK by 23.6%, as shown in Table (3-16) and Figure (3-17).
Figure 3-17 World Prices of Natural Gas, 2003-2007
(USD/Million BTU)
1.02.03.04.05.06.07.08.09.0
10.0
2002 2003 2004 2005 2006 2007
Japan European Union USA Canada UK
2. Arab Developments
2-1 Algeria Algeria is seeking to boost its exports of natural gas via pipeline to
Europe. It is currently implementing the Med gas project, which will supply Europe with natural gas via Spain. The project is expected to be completed by the end of 2009 and come on stream in 2010. Sonatrach is working to boost its exports of LNG to 85 billion cubic meters by early 2010. The company is constructing a 4.3 million tons/year LNG plant in Arzew, in Oran province.
The project for developing fields in the In Saleh area is aimed at saving natural gas for export purposes. The second stage of the project has started and its production capacity will amount to 9 billion cubic meters/year. In addition, the project is the first commercial model for implementing carbon dioxide capture and storage technology in an onshore field. Its storage capacity amounts to one million tons/year.
2-2 Bahrain
Bahrain is working on the development of its resources of oil and gas to meet the increasing local demand for natural gas. The National Oil and Gas Authority (NOGA) established a committee comprising representatives of ministries and industrial companies concerned with energy in Bahrain to design an intensified program that aims to preserve energy. The program includes a number of initiatives: development of basic legislation to preserve energy, encouraging the reduction of energy consumption, and increasing the capacity of energy efficiency of factory tools and equipments. The plan will be implemented in the next decade to save 280-300 million cubic feet/day of natural gas. Bahrain also seeks to support natural gas import projects to meet the growing needs of industrial development and maintain local production at acceptable and sustainable levels.
2-3 Egypt
Egypt is experiencing intensified activity in the exploration, drilling and development of natural gas fields, especially in the deep waters of the Mediterranean Sea. That followed an increase in the success rates of boosting its oil and gas reserve, maintaining production rates and boosting production to meet the growing demand of the local market and exports. The Mediterranean fields comprise 78% of Egypt’s natural gas reserves. Reports show that investments of about $6 billion were allotted to the projects scheduled to be carried out in this area until 2015.
In light of the ongoing search, development and carrying out of technical studies on the productive fields and the application of modern techniques in different production boosting methods, the recovery factor and oil and gas reserves have increased. Gas reserves that were added over the past ten years are estimated to be about three times those produced in the same period. This is a strong indicator that the activity would continue. The annual increase of natural gas reserves was 8.5% over the past ten years.
Production doubled to 5.5 billion cubic feet/day of the natural gas marketed in 2007/2008. At the same period, Egypt’s production of LPG rose to 3,598 tons/day to meet local demand and cut the import. Natural gas is being supplied to nearly 1.5 residential units and 83 factories. The capacity of natural gas transport grids rose from 8 million cubic meters/day in 1980 to about 160 million in early 2008. The total length of grid pipelines rose from 4,494 km to 16,820 km in the same period.
The 800-km, 30/32-inch Upper Egypt pipeline is an extension of the national gas grid. It is the longest pipeline in the grid and connects Bani Sweif in the north with Aswan in the south. It was built at a cost of
LE5 billion. The first three stages, totaling about 266 km long, have been implemented. Minya has been connected to the national gas grid and work is under way on the following stages, which involve extending the pipeline to Aswan. The project is expected to be completed in 2009. Egypt is one of the world’s top ten countries in converting vehicles to run on natural gas. In 2007/08 there were about 92,000 converted vehicles, 116 supply stations and 59 conversion centers. There are now seven companies that operate in this field.
Euro-Egyptian cooperation witnessed a significant development through the exchange of expertise in energy. This is in addition to strengthening cooperation with the Arab world’s eastern countries and their link with the European gas markets, which contributes to the achievement of economic integration between the two regions. The AGP is one of the fruits of such cooperation, which has enabled the EU to finance a number of huge projects to export natural gas and support the national gas grid via the European Investment Bank.
Egas and EGPC signed an agreement in principle on 7 April 2008 with the Jordanian-Egyptian company al-Fajr and the Jordanian Ministry of Energy and Mineral Resources to supply Jordan with more Egyptian natural gas in addition to the amount previously agreed upon in the gas purchase agreement.
Egypt and Lebanon concluded an agreement in principle on 23 April 2007 to supply Lebanon with natural gas. Egas and the Syrian Gas Company signed an agreement in principle on 11 May 2008 to transport/exchange Egyptian gas to Lebanon. A detailed gas sales and purchase agreement is currently being compiled. Gas is scheduled to be supplied to Lebanon in the first quarter in 2009.
2-4 Iraq
An industrial gas city is under construction in Northern Iraq. It is considered a leading and innovative project and aims to make the most of the local resources of gas. The project comprises the construction of over 20 types of different petrochemical industries and heavy industries in addition to several micro enterprises.
Iraq is working on the construction of a joint project with Shell to invest in associated natural gas that is being produced from the southern oil fields. It includes the gas that is being flared now, in addition to investing in all amounts of natural gas that will be produced in the future from the development of oil fields in the area.
2-5 Kuwait
Kuwait is witnessing significant activity to develop its large reserve of non-associated natural gas in the northern fields area, which is estimated at 35 trillion cubic feet, in addition to large amounts of condensates and light oil. The development plan involves the drilling of 20 wells and production of about 175 million cubic feet/day of gas and 50,000 b/d of light oil in the first stage. The second stage is scheduled to start in mid-2008 and continue until 2011 to boost the production capacity to 600 million cubic feet of natural gas and 165,000 b/d of light oil. This stage involves the drilling of 34 additional wells. The third stage will start in 2011 and be completed in 2015. The production capacity will amount to one billion cubic feet of natural gas and 350,000 b/d of light oil and condensates. It will involve drilling over 31 wells.
Kuwait is planning to import LNG from Qatar to meet the requirements of its power plants in peak times in summer. The project comprises the construction of facilities to import 500-750 million cubic feet/day of LNG with investments of up to $150 million. Kuwait hopes to start importing in mid-2009. Negotiations to reach a final agreement are still ongoing.
2-6 Libya
Libya and Egypt agreed to establish five joint ventures to carry out the projects of transport and distribution pipelines to houses and factories as well as the infrastructure of natural gas distribution in Libya based on the national plan. The plan comprises the implementation of 1000-km of pipelines to transport gas with investments of $1.4 billion for the first stage to be followed by laying other pipelines.
This is in addition to laying the pipeline grid to reach 120,000 consumers in the Green Mountain and Western Mountain areas. Libya also seeks to rehabilitate the LNG plant at El-Brega port and study the construction of another processing plant in light of the availability of new resources of natural gas.
2-7 Oman
Oman seeks to boost its LNG storage capacity and build more tanks. It aims to strengthen the LNG trade and supply the amounts required by international markets at peak times. Oman started to import Qatari gas in mid-2008 via the Dolphin project at a rate of 200 million cubic feet/day according to the agreement signed between Oman, Qatar and the UAE.

2-8 Qatar
Total production of natural gas in Qatar amounted to about 73.8 billion cubic meters in 2007. It is expected to amount to about 237.7 billion by 2013. LNG’s share amounts to 60%, the GTL industry to 10% and gas export via pipeline to 30%.
Three wells are currently being drilled from the production platforms of Barazan Project. The drilling of the rest of wells will be completed by 2010. The project aims to produce 1.7 billion cubic feet/day to meet the requirement of the local industry, power plants and desalination plants. The project is expected to be completed by 2013.
Qatar adopted a strategy of diversifying the means of production and exportation of natural gas, including gas export projects via pipeline. Natural gas exports via Dolphin Gas Project in Ras Laffan to the reception terminal at Taweelah via a 48-inch on-shore pipeline started in July 2007.
The project reached its maximum capacity of 2 billion cubic feet/day in February 2008. Dolphin Gas Project is a considerable strategic initiative on the level of Arab cooperation, especially among the GCC countries.
It aims to extract, process and produce natural gas from the Qatari North field and transport it via an on-shore pipeline to the UAE and Oman. Qatari natural gas started to be pumped to Oman in mid-2008 at a rate of 200 million cubic feet/day for 25 years according to the agreement concluded among the three countries.
Construction work on the Pearl GTL project continues in Ras Laffan according to the plan. It is 54% completed. The construction of the production train is expected to be completed and come on stream in 2010. The design capacity is about 70,000 b/d of liquids. One year later, the second identical production train will come on stream.
Qatar has been the world’s top LNG producer and exporter since 2006, with a production and exportation of 31 million tons/year of LNG. Total LNG exports are expected to double in 2009, amounting to 62 million tons/year with the operation of Trains 4 and 5 of Qatar Gas 2 project and Trains 6 and 7 of RasGas 3. Train 4 of Qatar Gas 2 came on stream in early October in 2008 with a production capacity of up to 7.8 million tons/year.
The first shipment of Qatari LNG is expected to be exported to the UK in early 2009. Train 5 of Qatar Gas 2 is also expected to come on stream in February 2009.
Qatar takes part in the construction of gas reception terminals in some countries in the world. Construction work was completed in the South

Hook port in the UK to receive and distribute the Qatari LNG. QP owns 70% of the 15.6 million tons/year LNG project, which is expected to come on stream in 2009.
Regarding LNG marine transportation, the first huge LNG Q-Max carrier was inaugurated. It is one of five huge carriers that are being constructed now for the Qatar Gas Transport Co. (Naqilat) to transport the Qatari LNG. The huge carrier is 80% larger than the standard ones. Its capacity is about 266,000 cubic meters.
2-9 Saudi Arabia
Al-Khursaniyah complex for crude oil and gas processing and production came on stream with a production capacity of 580 million cubic feet/day of natural gas and 290,000 b/d of condensates in addition to crude oil. The Kingdom is experiencing an intensive activity to boost natural gas production and investment through the development of gas fields to meet the growing demand from power and desalination plants and provide more petroleum products for export purposes.
2-10 Syria
The amounts of Egyptian natural gas being pumped to Syria via the Arab Gas Pipeline increased to 1.2 million cubic meters/day. The increase will continue gradually to reach the contracted amount agreed between the two countries, which is 2.5 million cubic meters/day. This would meet part of the power generation sector’s demand for natural gas especially since 1.5 million cubic meters/day will be added from the Abu Rabah field in Syria.
The Syrian Gas Company is constructing a 36-inch, 62-km pipeline between Aleppo and Kilis on the Syrian-Turkish border at a cost of up to €52 million, connecting the Syrian and Turkish grids as part of the AGP project.
The current stage of the AGP project comprises two parts. The first has been executed, comprising the construction of a 319-km pipeline from the Syrian Jordanian border to al-Rayan area to the east of Homs City. Deir Ali and Homs power plants were supplied with Egyptian gas in 2008. The second stage will be carried out in two phases.
The first involves the construction of pipeline from al-Rayan area to the Syrian Turkish border. The second comprises the construction of a 182-km pipeline from Furoqlos to the east of Homs to Aleppo. It will be carried out later. Moreover, Syria relies on the gas production from Palmyra gas fields to meet the growing local demand for energy. Two processing complexes with a capacity of 6 and 3.2 million cubic meters/day were constructed at a cost of $190 million and $160 million respectively. The two projects are expected to be completed by the end of 2009.

2-11 Tunisia
A mutual agreement was concluded with Egypt through the High Joint Committee to support and increase joint cooperation in research and exploration of oil and gas. It was agreed to establish a joint venture specialized in utilizing natural gas as an alternative fuel for vehicles in Tunisia as well as benefiting from the expertise of Egyptian companies in the field.
2-12 UAE
Dolphin Energy Ltd. is constructing a new pipeline from al-Taweelah Terminal to al-Fujairah, the UAE. The Emirate of Abu Dhabi is planning a large project to develop, produce and invest in sour gas at Shah Field. It would provide about one billion cubic feet/day of sour gas. It aims to save nearly 570 million cubic feet/day of dry and processed gas for the gas grids and gas liquefying plants. Moreover, a number of sulfur export facilities are being constructed at Ruwais Port.
2-13 Yemen
Yemen invests in natural gas, most of which is being re-injected in the oil fields to strengthen the oil production that declined recently. It is developing its natural gas reserves to supply gas to the liquefying plant, which is expected to be completed in 2009. Upon its construction, Yemen will join the LNG exporting countries. The plant comprises two production trains with a total production capacity of 6.7 million tons/year. The natural gas produced from the Mareb fields is processed in two gas complexes to dehydrate it and produce dry gas, which is transported via a 320-km pipeline to the liquefaction plant at Balhaf Bay.
3. World’s most important gas activities
The LNG industry faces many challenges as a result of huge projects, sophisticated programs and construction in remote areas, which requires more auxiliary facilities. Some projects take a long time to build, sometimes as much as five years. This is in addition to the unstable market, inflation, high prices of materials and equipment and the shortage of human resources specialized in the construction and management of such huge projects. The financial crisis of the second half of 2008 that hit most countries all over the world added more challenges and led to the decline of financial investments to build more gas liquefying plants. On the other hand, demand for natural gas has increased. LNG trade has maximized and led to the globalization of the local markets. LNG movement and prices have improved and commercial competition increased. The global natural gas trade is expected

to continue growing, by as much as 17% by 2015. LNG will account for about 84% if the increase. Exports are expected to rise to about 400 billion cubic meters in 2015.
World LNG production increased while construction work on natural gas liquefaction plants continues unabated. At the same time, there are plans to build more plants across the globe. The table below shows the capacity breakdown of existing LNG plants, those under construction and those in the pipeline:
Region
Total production
capacity (million tons/year)
Operational capacity and under construction (million tons/year)
Planned capacity (million tons/year)
Middle East 164 68.6 95.4
Asia-Pacific 182.1 90.5 91.6
Mediterranean Sea 64.7 37.9 26.8
Western Africa 82.8 24.6 58.2
America 38.2 21.3 16.9
North Europe 40.3 13.7 26.6
World total 572.1 256.6 315.5
The world witnessed an unprecedented expansion in the construction of LNG receiving terminals. Their total production capacity is higher than that of the gas liquefaction plants.
This situation is expected to provide higher flexibility in the world LNG trade and marketing. The table below shows the capacity breakdown of existing receiving terminals, those under construction and those in the pipeline:
Region Total production capacity
(billion cubic meters/year)
Operational capacity and under construction
(billion cubic meters/year)
Planned capacity (billion cubic meters/year)
Asia-Pacific 587.2 417.3 169.9
Europe 434.1 160 274.1 America 535.2 172 363.2 World Total 1556.5 749.3 807.2

Despite the availability of reserves required for the continued production and supply of natural gas worldwide, unconventional gas resources have started to emerge and take their share of gas production.
They include methane, which is produced from coal bed [CBM] and the gas from tight formations. Studies predict that the share of these resources will amount to about 69% of US production by 2020.
Major activities in the world natural gas industry are reviewed below:
• Russia, Kazakhstan and Turkmenistan agreed on a project to build the Caspian pipeline within the framework of developing the capacities of transporting natural gas in Central Asia. Uzbekistan subsequently joined them. The new pipeline will extend on the eastern shore of the Caspian Sea to transport natural gas to and across Russia. Its capacity amounts to about 20 billion cubic meters/year.
• India, one of the largest importers of natural gas, is adopting a strategy to diversify its sources of energy production. It has an extensive program to explore and develop gas fields. It faces challenges that prevent it from securing natural gas from the international markets via pipeline. Therefore, imports of LNG are expected to increase over the next decade to about 14 million tons/year by 2014.
• South Korea and Russia signed a MoU to import Russian natural gas starting in 2015 via a pipeline extending from the Russian production areas across North Korea to South Korea. The pipeline has a capacity of about 10 billion cubic meters/year and is proposed to be built over the next decade. The agreement includes the establishment of joint plants to process and liquefy gas. South Korea now purchases LNG from the Russian Sakhalin-2 project. Therefore, Russia’s supplies will cover about 20% of South Korea’s demand for gas. Most of South Korea’s imports of natural gas come from the Middle East and South-East Asia. Its consumption amounts to about 37 billion cubic meters/year, most of which is LNG.
• The European countries are keen to carry out the Nabucco gas pipeline project so as to diversify the sources of gas supplies to Europe. The project involves laying a 3300-km pipeline from Turkey to Austria with a capacity of about 31 billion cubic meters/year. Estimates of the cost of its construction rose nearly 60% over the initial estimates to about €7.9 billion. The growing demand for gas and high prices have kept the project within the economically profitable range.
• Iran plans to construct pipelines to export natural gas via Turkey to Europe. Natural gas will be exported via the 10 billion cubic meters/year Adriatic pipeline. Iran also seeks to export natural gas via the Nabucco gas pipeline. Switzerland signed an agreement with Iran to receive about 1.5 billion cubic meters/year of natural gas in 2009, rising to 5 billion in 2012 via pipeline grids in Turkey.
• The LNG industry and world trade witnessed a quantum leap in recent years. Total production since 1995 recorded an annual growth of 7%. It is expected to continue in the foreseeable future. The price of LNG continued to rise on international markets to high levels of about 10% and 20% more than the forecast rates in recent purchase contracts. A number of studies show that there will be a possible shortage of supplies by 2014.
PART ONE
TABLES OF CHAPTER THREE
ARAB AND WORLD DEVELOPMENTS IN PETROLEUM DOWNSTREAM INDUSTRIES

Table 3-1World Existing Topping Distillation Capacity by Region,
2007 and 2008(Million b/d)
2007 2008(%)
Change 2008/2007
Asia/Pacific 22.21 22.48 1.22
North America 20.95 20.95 0.00
Western Europe 14.87 14.91 0.27
Eastern Europe/CIS 10.34 10.34 0.00
Middle East 7.03 7.04 0.14
South America/Caribbean 6.60 6.60 0.00
Africa 3.27 3.28 0.31
Total 85.30 85.60 0.35
Note: Parentheses denote negative figures.
Source:- Oil & Gas Journal, 24 Dec. 2007 & 22 Dec. 2008.
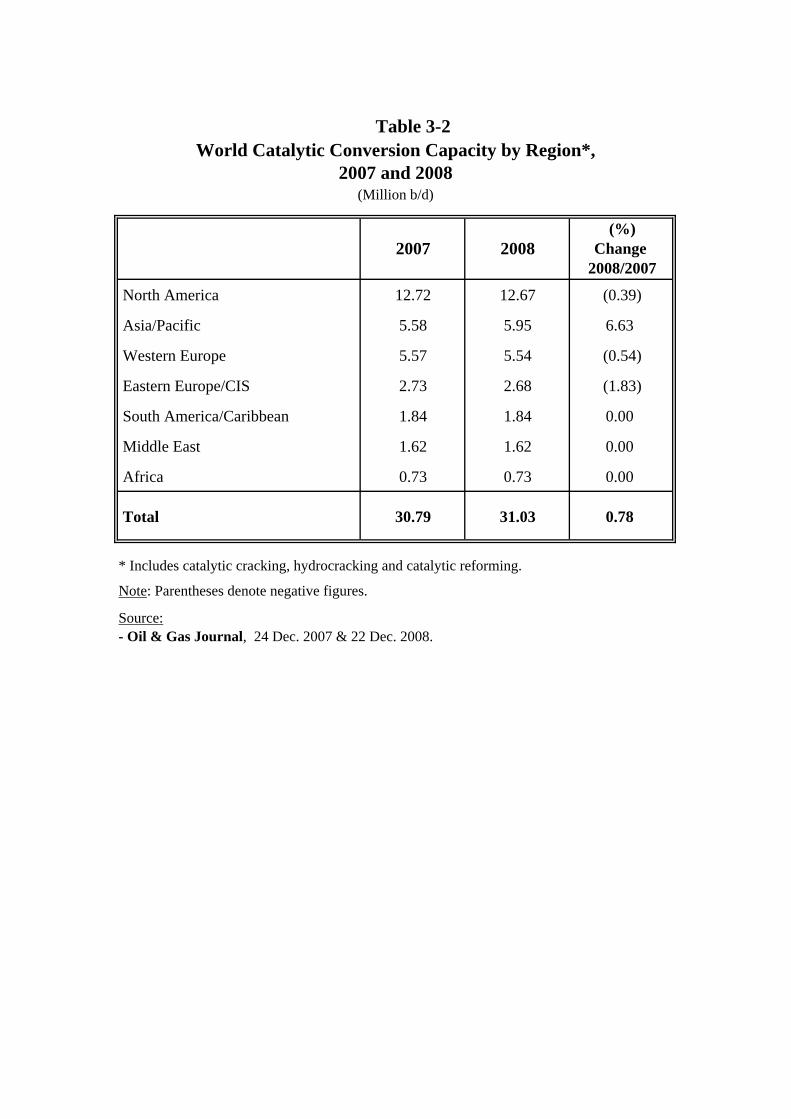
Table 3-2World Catalytic Conversion Capacity by Region*,
2007 and 2008(Million b/d)
2007 2008(%)
Change 2008/2007
North America 12.72 12.67 (0.39)
Asia/Pacific 5.58 5.95 6.63
Western Europe 5.57 5.54 (0.54)
Eastern Europe/CIS 2.73 2.68 (1.83)
South America/Caribbean 1.84 1.84 0.00
Middle East 1.62 1.62 0.00
Africa 0.73 0.73 0.00
Total 30.79 31.03 0.78
* Includes catalytic cracking, hydrocracking and catalytic reforming.
Note: Parentheses denote negative figures.
Source:- Oil & Gas Journal, 24 Dec. 2007 & 22 Dec. 2008.
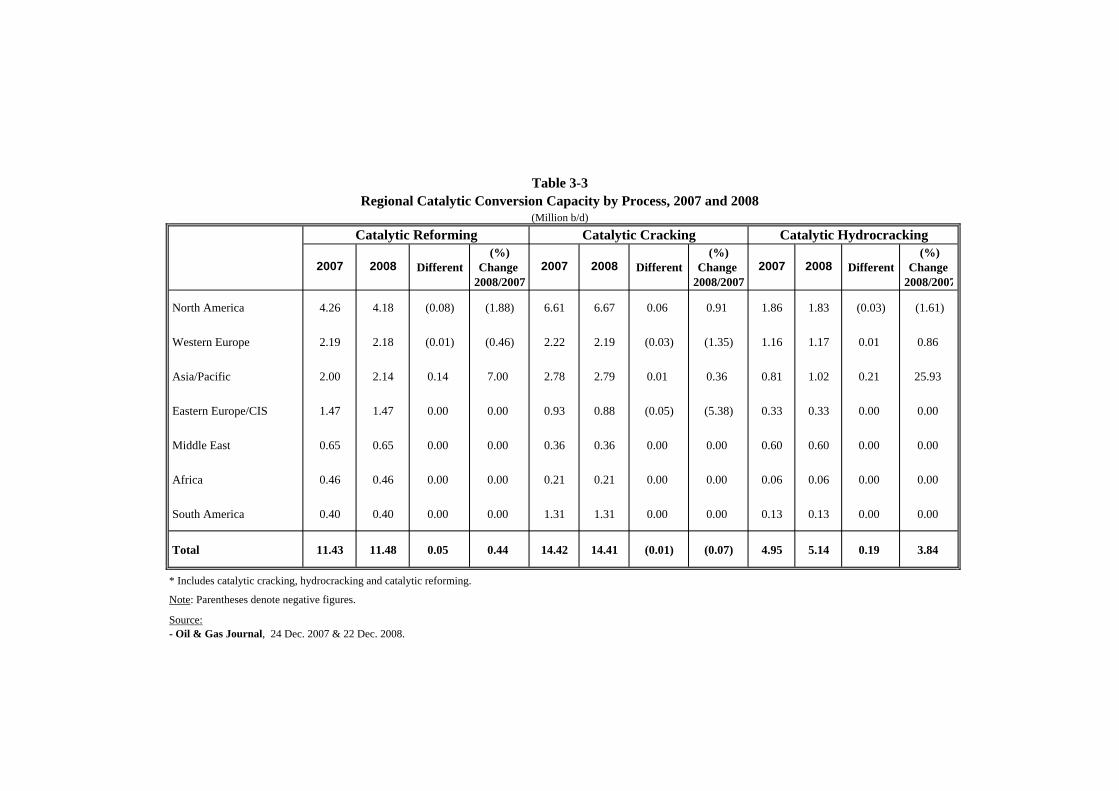
Table 3-3Regional Catalytic Conversion Capacity by Process, 2007 and 2008
(Million b/d)
2007 2008 Different(%)
Change 2008/2007
2007 2008 Different(%)
Change 2008/2007
2007 2008 Different(%)
Change 2008/2007
North America 4.26 4.18 (0.08) (1.88) 6.61 6.67 0.06 0.91 1.86 1.83 (0.03) (1.61)
Western Europe 2.19 2.18 (0.01) (0.46) 2.22 2.19 (0.03) (1.35) 1.16 1.17 0.01 0.86
Asia/Pacific 2.00 2.14 0.14 7.00 2.78 2.79 0.01 0.36 0.81 1.02 0.21 25.93
Eastern Europe/CIS 1.47 1.47 0.00 0.00 0.93 0.88 (0.05) (5.38) 0.33 0.33 0.00 0.00
Middle East 0.65 0.65 0.00 0.00 0.36 0.36 0.00 0.00 0.60 0.60 0.00 0.00
Africa 0.46 0.46 0.00 0.00 0.21 0.21 0.00 0.00 0.06 0.06 0.00 0.00
South America 0.40 0.40 0.00 0.00 1.31 1.31 0.00 0.00 0.13 0.13 0.00 0.00
Total 11.43 11.48 0.05 0.44 14.42 14.41 (0.01) (0.07) 4.95 5.14 0.19 3.84
* Includes catalytic cracking, hydrocracking and catalytic reforming.
Note: Parentheses denote negative figures.
Source:- Oil & Gas Journal, 24 Dec. 2007 & 22 Dec. 2008.
Catalytic Reforming Catalytic Cracking Catalytic Hydrocracking
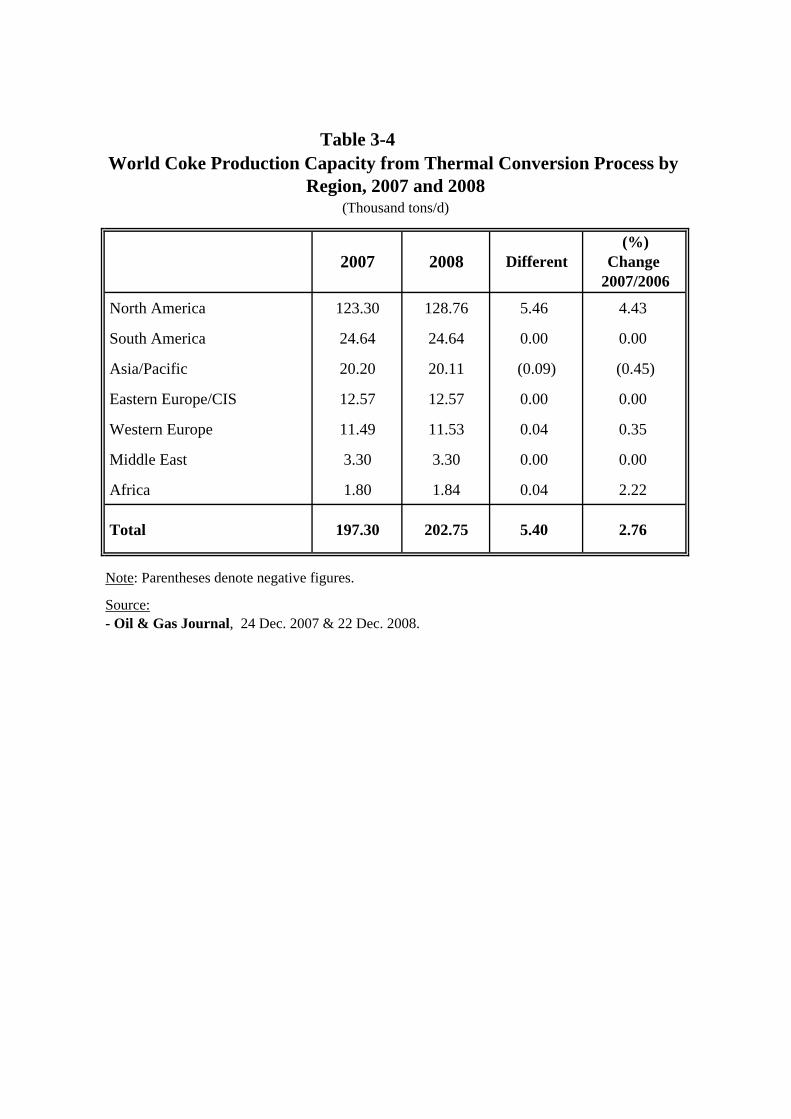
Table 3-4World Coke Production Capacity from Thermal Conversion Process by
Region, 2007 and 2008(Thousand tons/d)
2007 2008 Different(%)
Change 2007/2006
North America 123.30 128.76 5.46 4.43
South America 24.64 24.64 0.00 0.00
Asia/Pacific 20.20 20.11 (0.09) (0.45)
Eastern Europe/CIS 12.57 12.57 0.00 0.00
Western Europe 11.49 11.53 0.04 0.35
Middle East 3.30 3.30 0.00 0.00
Africa 1.80 1.84 0.04 2.22
Total 197.30 202.75 5.40 2.76
Note: Parentheses denote negative figures.
Source:- Oil & Gas Journal, 24 Dec. 2007 & 22 Dec. 2008.
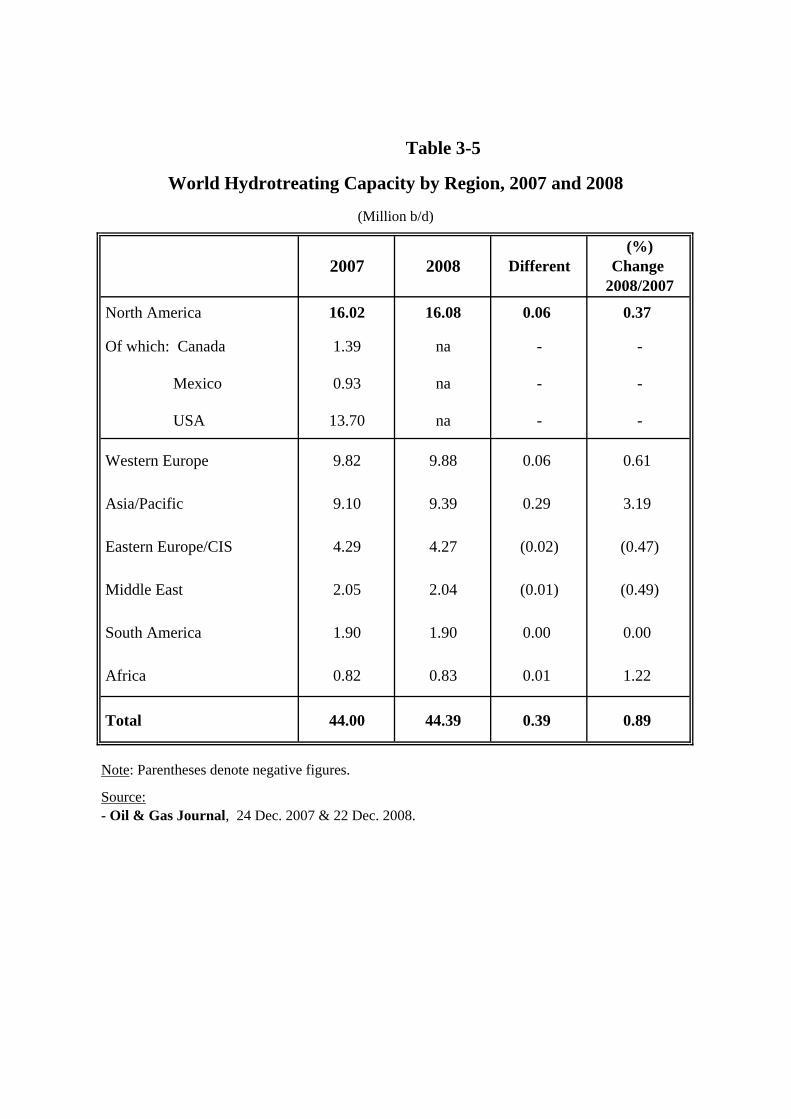
Table 3-5
World Hydrotreating Capacity by Region, 2007 and 2008
(Million b/d)
2007 2008 Different(%)
Change 2008/2007
North America 16.02 16.08 0.06 0.37
Of which: Canada 1.39 na - -
Mexico 0.93 na - -
USA 13.70 na - -
Western Europe 9.82 9.88 0.06 0.61
Asia/Pacific 9.10 9.39 0.29 3.19
Eastern Europe/CIS 4.29 4.27 (0.02) (0.47)
Middle East 2.05 2.04 (0.01) (0.49)
South America 1.90 1.90 0.00 0.00
Africa 0.82 0.83 0.01 1.22
Total 44.00 44.39 0.39 0.89
Note: Parentheses denote negative figures.
Source:- Oil & Gas Journal, 24 Dec. 2007 & 22 Dec. 2008.

Table 3-6Installed Refining Capacity in the Arab Countries,
2004-2008
Number ofRefineries
in 20072004 2005 2006 2007 2008
Algeria 5 513 450 450 463 463 Bahrain 1 280 255 249 249 249 Egypt 9 819 726 726 726 726 Iraq 10 570 597 597 597 597 Kuwait 3 930 889 889 889 889 Libya 5 380 380 378 378 378 Qatar 1 137 137 137 137 137 Saudi Arabia 8 1995 2095 2095 2095 2095 Syria 2 245 240 240 240 240 Tunisia 1 35 34 34 34 34 UAE 5 778 778 778 798 798
Total OAPEC 50 6682 6581 6573 6606 6606
Jordan 1 103 90 90 90 90 Lebanon* 2 - - - - - Mauritania 1 25 25 25 25 25 Morocco 2 165 155 155 155 155 Oman 2 80 85 85 222 222 Somalia 1 10 10 10 10 10 Sudan 3 93 122 122 147 147 Yemen 2 200 130 140 140 140 Total other Arab countries 14 676 617 627 789 789
Total Arab countries 64 7358 7198 7200 7395 7395
* The two refineries were shutdown after they sustained serious damage during the civil war.Source:- Oil & Gas Journal, 24 Dec. 2007 & 22 Dec. 2008.
(Thousand b/d)

Company Name Location Production Capacity(Thousand tons/Year)
Nova Chemicals Corporation Joffre, Alta , Canada 2812
Formosa Petrochemical Corporation Mailiao, Taiwan, China 2550
Arabian Petrochemical Company Jubail, Saudi Arabia 2250
Exxon Mobil Chemical Company Baytown, Tex 2197
Chevron Phillips Chemical Company Sweeny - Tex 1868
Dow Chemical Company Terneuzen, Netherlands 1800
Ineos Olefins & Polymers Chocolate Bayou, Tex 1752
Equistar Chemicals lp Channel view , Tex 1750
Yanbu Petrochemical Company Yanbu, Saudi Arabia 1705
Dow Chemical Company Freeport, Tex 1640
* As of Jan 1 ,2008.Source: - Oil & Gas Journal, 28 July 2008.
Top 10 Ethylene Complexes*
Table 3-7

Table 3-8World Ethylene Capacity by Region,
2006 and 2007
2006 2007 Different(%)
Change 2007/2006
North America 35688 35708 20.0 0.06
Asia/Pacific 31602 33002 1400.0 4.43
Western Europe 24438 24928 490.0 2.01
Middle East 10699 10644 (55.00) (0.51)
Eastern Europe/CIS 8462 8512 50.0 0.59
South America 5019 5084 65.0 1.30
Africa 1668 1698 30.0 1.80
Total 117575 119575 2000.0 1.70
Note: Parentheses denote negative figures.
Source:- Oil & Gas Journal, 16 July 2007 & 28 July 2008.
(Thousand tons at the beginning of the year)

Country 2006 2007 Different
Azerbaijan 330 330 0 Argentina 839 839 0 Spain 1430 1430 0 Australia 532 502 (30) Palestine 200 200 0 Germany 5557 5757 200 UAE 600 600 0 Indonesia 520 520 0 Uzbekistan 140 140 0 Ukraine 450 630 180 Iran 1214 1214 0 Italy 2170 2170 0 Brazil 3435 3500 65 Portugal 330 330 0 Belgium 2180 2460 280 Bulgaria 400 400 0 Poland 700 700 0 Thailand 2272 2272 0 Turkey 520 520 0 Czech Republic 485 485 0 Algeria 133 133 0 South Africa 585 585 0 Russia 3670 3490 (180) Russian Federation 193 193 0 Romania 844 844 0 Singapore 1940 1980 40 Slovak Republic 210 220 10
Cont./
World Ethylene Production Capacity by Country, Table 3-9
(Thousand tons /Year)
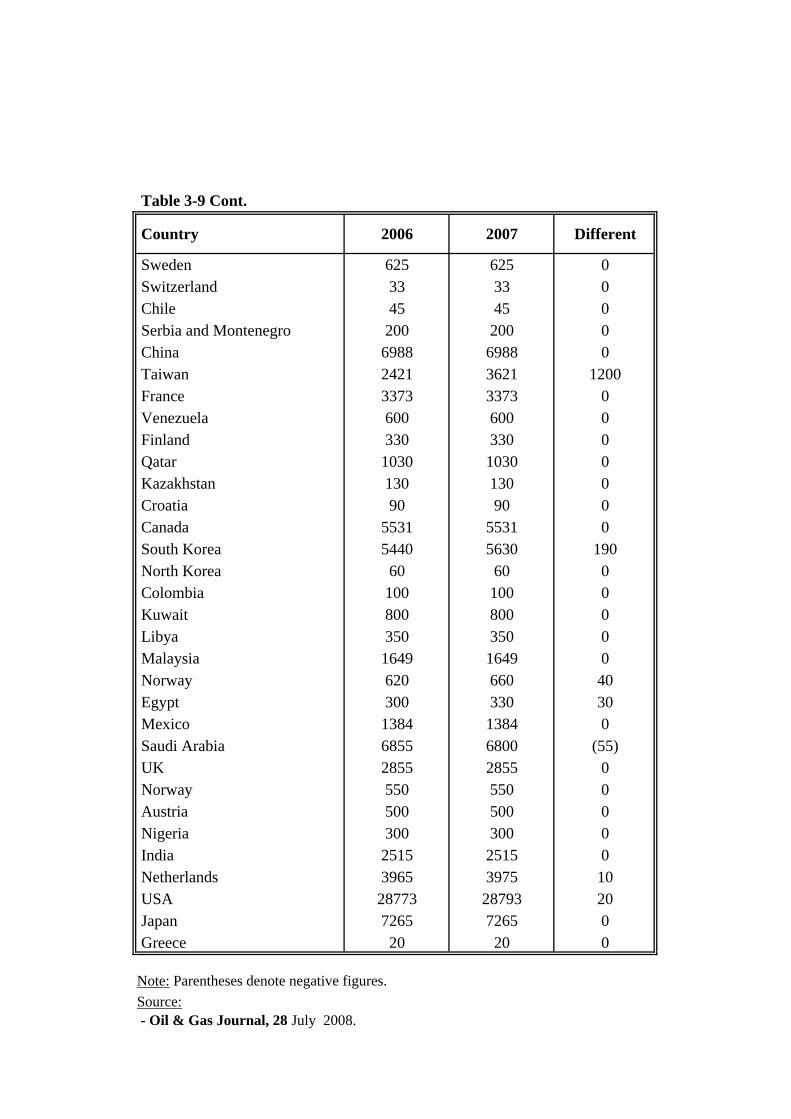
Table 3-9 Cont.
Country 2006 2007 Different
Sweden 625 625 0 Switzerland 33 33 0 Chile 45 45 0 Serbia and Montenegro 200 200 0 China 6988 6988 0 Taiwan 2421 3621 1200 France 3373 3373 0 Venezuela 600 600 0 Finland 330 330 0 Qatar 1030 1030 0 Kazakhstan 130 130 0 Croatia 90 90 0 Canada 5531 5531 0 South Korea 5440 5630 190 North Korea 60 60 0 Colombia 100 100 0 Kuwait 800 800 0 Libya 350 350 0 Malaysia 1649 1649 0 Norway 620 660 40 Egypt 300 330 30 Mexico 1384 1384 0 Saudi Arabia 6855 6800 (55) UK 2855 2855 0 Norway 550 550 0 Austria 500 500 0 Nigeria 300 300 0 India 2515 2515 0 Netherlands 3965 3975 10 USA 28773 28793 20 Japan 7265 7265 0 Greece 20 20 0
Note: Parentheses denote negative figures.Source: - Oil & Gas Journal, 28 July 2008.

of entireComplexes
With only Company Parties
interests
1 - Dow Chemical Co. 14 13155 10370
2 - Exxon Mobil Corp. 15 11470 8352
3 - Saudi Basic Industries Corp. 7 8940 7165
4 - Royal Dutch Shell Plc 10 8965 68401
5 - Lyondell Basell 7 5200 5200
6 - Ineos 4 4656 4286
7 - Formosa Petrochemical Corp. 2 4091 4091
8 - Sinopec 9 4375 4075
9 - Chevron Phillips Chemical Co. Lp 4 3956 3701
10 - Total As 9 5713 3422
* As of Jan 1 ,2008.Notes:1 - Includes Subsidiary Equistar Chemicals Lp.2 - Owner Ship : Chevron Texaco Corp. 50 %, ConocoPhillips 50 %.
Source: - Oil & Gas Journal, 28 July 2008.
Table 3-10
Production Capacity(Million tons/Year)
Company Name No. of Sites
Top 10 Ethylene Producers*

Table 3-11Consumption of Natural Gas by Region,
2006 and 2007(Billion cubic meters)
2006 2007(%)
Change 2007/2006
Europe & Eurasia* 1151.5 1155.7 0.4
North America 761.4 801.0 5.2
Asia/Pacific 420.9 447.8 6.4
Middle East 291.4 299.4 2.7
South & Central America 131.3 134.5 2.4
Africa 77.9 83.5 7.2
Total 2834.4 2921.9 3.1
* CIS , Europe and Turkey represented by Europe & Eurasia.
Source:- BP Statistical Review of World Energy, June 2008.

2004 2005 2006 2007
Middle East 45.2 44.3 47.0 46.9
Europe & Eurasia* 33.7 33.8 34.4 34.8
North America 25.4 24.9 24.8 25.7
South & Central America 22.0 22.3 22.2 21.9
Africa 19.8 20.3 21.4 21.8
Asia/Pacific 10.3 10.7 10.5 10.6
Total 23.8 23.5 23.6 23.8
* CIS , Europe and Turkey represented by Europe & Eurasia.Source:- BP Statistical Review of World Energy, June 2005 & June 2006 & June 2007 and June 2008.
Table 3-12
(%)
Share of Natural Gas in the Total Consumption of Commercial Energy by Region,
2004 - 2007
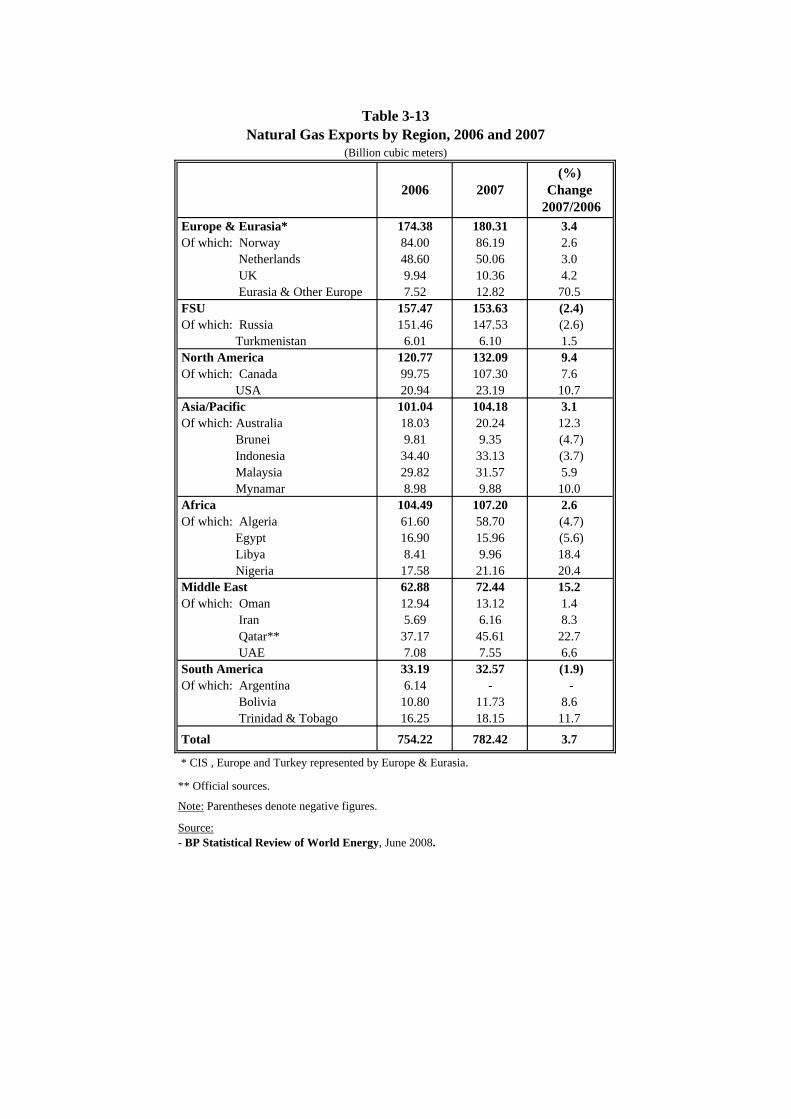
Table 3-13Natural Gas Exports by Region, 2006 and 2007
(Billion cubic meters)
2006 2007(%)
Change 2007/2006
Europe & Eurasia* 174.38 180.31 3.4 Of which: Norway 84.00 86.19 2.6 Netherlands 48.60 50.06 3.0 UK 9.94 10.36 4.2 Eurasia & Other Europe 7.52 12.82 70.5 FSU 157.47 153.63 (2.4) Of which: Russia 151.46 147.53 (2.6) Turkmenistan 6.01 6.10 1.5 North America 120.77 132.09 9.4 Of which: Canada 99.75 107.30 7.6 USA 20.94 23.19 10.7 Asia/Pacific 101.04 104.18 3.1 Of which: Australia 18.03 20.24 12.3 Brunei 9.81 9.35 (4.7) Indonesia 34.40 33.13 (3.7) Malaysia 29.82 31.57 5.9 Mynamar 8.98 9.88 10.0 Africa 104.49 107.20 2.6 Of which: Algeria 61.60 58.70 (4.7) Egypt 16.90 15.96 (5.6) Libya 8.41 9.96 18.4 Nigeria 17.58 21.16 20.4 Middle East 62.88 72.44 15.2 Of which: Oman 12.94 13.12 1.4 Iran 5.69 6.16 8.3 Qatar** 37.17 45.61 22.7 UAE 7.08 7.55 6.6 South America 33.19 32.57 (1.9) Of which: Argentina 6.14 - - Bolivia 10.80 11.73 8.6 Trinidad & Tobago 16.25 18.15 11.7
Total 754.22 782.42 3.7
* CIS , Europe and Turkey represented by Europe & Eurasia.
** Official sources.
Note: Parentheses denote negative figures.
Source:- BP Statistical Review of World Energy, June 2008.

2006 (%) 2007 (%)
A- Exports by Pipeline.
Europe 166.86 31.1 167.35 30.3
FSU 164.99 30.7 166.45 30.1
North America 119.05 22.2 130.91 23.7
Africa 46.54 8.7 45.58 8.2
South America 16.94 3.2 14.42 2.6
Asia/Pacific 15.59 2.9 17.06 3.1
Middle East 7.09 1.3 10.88 2.0
Total World Exports by Pipeline 537.06 100.0 552.65 100.0
B- Exports as LNG.
Europe - - 0.14 0.1
FSU - - - -
North America 1.72 0.8 1.18 0.5
Africa 57.95 26.7 61.62 26.8
South America 16.25 7.5 18.15 7.9
Asia/Pacific 85.45 39.3 87.12 37.9
Middle East 55.79 25.7 61.56 26.8
Total World Exports as LNG 217.16 100.0 229.77 100.0
Total World Exports 754.22 782.42
Exports by Pipeline/ Total Exports (%) 71.21 70.63
Exports as LNG/ Total Exports (%) 28.79 29.37
Source:- BP Statistical Review of World Energy, June 2008.
World Natural Gas Exports by Region,2006 and 2007(Billion cubic meters)
Table 3-14

2003 2004 2005 2006 2007
A- Exports by Pipeline.
Algeria 33.08 35.12 39.08 36.92 34.03
Libya - 0.50 4.49 7.69 9.20
Qatar* - - - - 3.77
UAE - - - - -
Oman 0.20 1.20 1.40 1.40 0.95
Egypt - 1.10 1.10 1.93 2.35
Total Arab Exports by Pipeline 33.28 37.92 46.07 47.94 50.30
B- Exports as LNG.
Algeria 28.00 25.75 25.68 24.68 24.67
Libya 0.75 0.63 0.87 0.72 0.76
Qatar* 19.19 24.06 32.38 37.17 41.84
UAE 7.11 7.38 7.14 7.08 7.55
Oman 9.21 9.03 9.22 11.54 12.17
Egypt - - 6.93 14.97 13.61
Total Arab Exports as LNG 64.26 66.85 82.22 96.16 100.60
Total Arab Exports 97.54 104.77 128.29 144.10 150.90
Exports by Pipeline/ Total Exports (%) 34.12 36.19 35.91 33.27 33.33
Exports as LNG/ Total Exports (%) 65.88 63.81 64.09 66.73 66.67
* Official sources.Source:- BP Statistical Review of World Energy, June 2004, June 2005, June 2006, June 2007 and June 2008.
Arab Natural Gas Exports,2003 and 2007
(Billion cubic meters)
Table 3-15
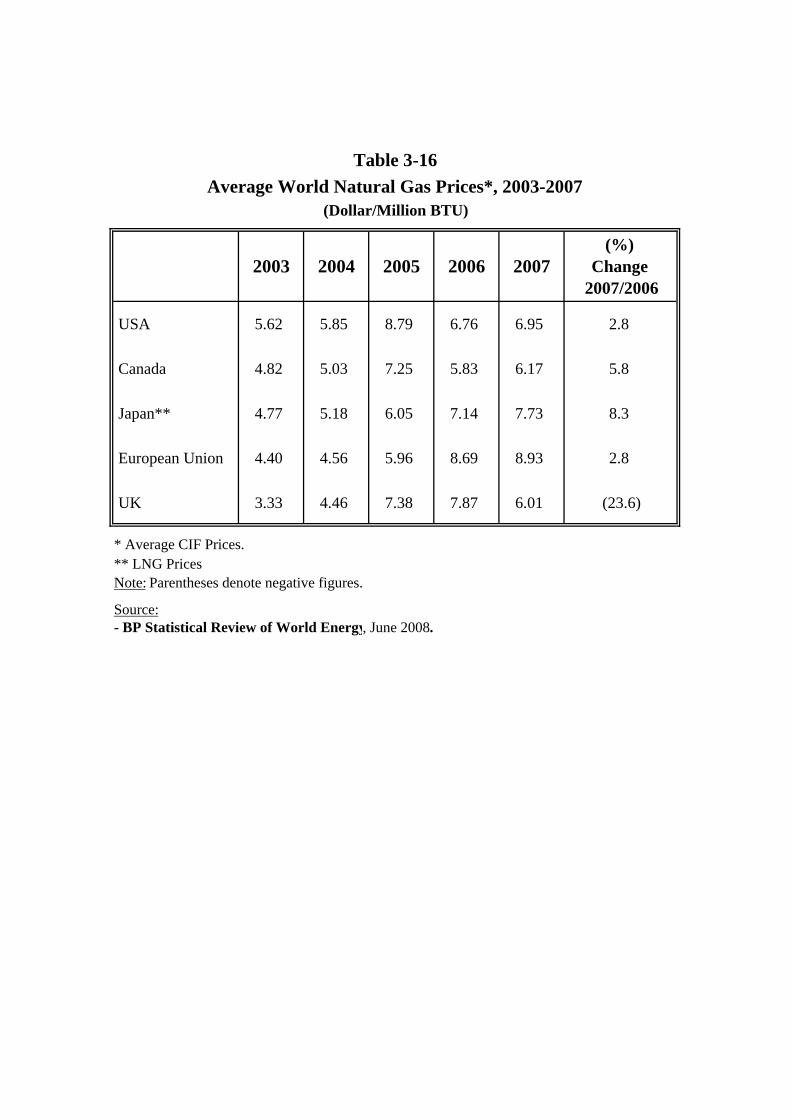
Average World Natural Gas Prices*, 2003-2007(Dollar/Million BTU)
2003 2004 2005 2006 2007(%)
Change 2007/2006
USA 5.62 5.85 8.79 6.76 6.95 2.8
Canada 4.82 5.03 7.25 5.83 6.17 5.8
Japan** 4.77 5.18 6.05 7.14 7.73 8.3
European Union 4.40 4.56 5.96 8.69 8.93 2.8
UK 3.33 4.46 7.38 7.87 6.01 (23.6)
* Average CIF Prices.** LNG PricesNote: Parentheses denote negative figures.
Source:- BP Statistical Review of World Energy, June 2008.
Table 3-16

PART TWO
OAPEC ACTIVITIES IN 2008
CHAPTER ONE
THE MINISTERIAL COUNCIL AND THE EXECUTIVE BUREAU
I. THE MINISTERIAL COUNCIL
The Ministerial Council of the Organization of Arab Petroleum Exporting Countries held its 80th meeting in Cairo, the Arab Republic of Egypt, on 26 May 2008. The meeting was at the level of Executive Bureau members representing the ministers and was chaired by H.E. Engineer Fathi Mohammad Al-Abbar, the representative of the Great Socialist People's Libyan Arab Jamahiriyah on the Executive Bureau, as the Council held its 81st meeting in Cairo - Arab Republic of Egypt on 29 November 2008, under the chairmanship of HE Dr. Shokri Mohammad Ghanim, the Secretary of the Management Committee of the National Oil Corporation in the Great Socialist People’s Libyan Arab Jamahiriyah, which had to chair the 2008 session.
With regard to resolutions adopted by the Ministerial Council in 2008, refer to the press releases issued after the two meetings, which are appended to this Report.
II. THE EXECUTIVE BUREAU
OAPEC’s Executive Bureau held its 120th meeting in Cairo, the Arab Republic of Egypt, on 24 May 2008 to compile the agenda for the 80th meeting of the Ministerial Council, and It held its 121st meeting in Cairo on 11 October 2008 to consider the 2008 draft budgets for the General Secretariat and Judicial Tribunal and to submit recommendations to the Ministerial Council’s 81st meeting. The Bureau also held its 122nd meeting in Cairo, the Arab Republic of Egypt, on 26 November 2008 for the preparation of the agenda for the aforementioned 81st meeting of the Ministerial Council.
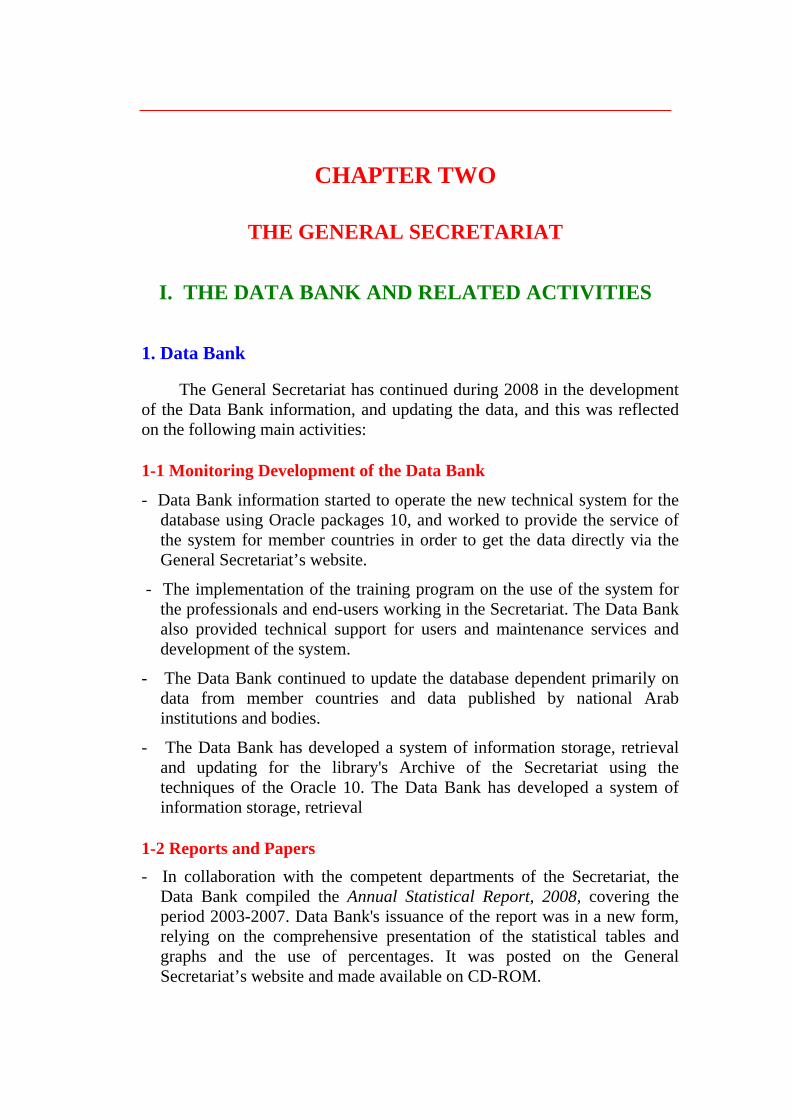
CHAPTER TWO
THE GENERAL SECRETARIAT
I. THE DATA BANK AND RELATED ACTIVITIES
1. Data Bank
The General Secretariat has continued during 2008 in the development of the Data Bank information, and updating the data, and this was reflected on the following main activities:
1-1 Monitoring Development of the Data Bank
- Data Bank information started to operate the new technical system for the database using Oracle packages 10, and worked to provide the service of the system for member countries in order to get the data directly via the General Secretariat’s website.
- The implementation of the training program on the use of the system for the professionals and end-users working in the Secretariat. The Data Bank also provided technical support for users and maintenance services and development of the system.
- The Data Bank continued to update the database dependent primarily on data from member countries and data published by national Arab institutions and bodies.
- The Data Bank has developed a system of information storage, retrieval and updating for the library's Archive of the Secretariat using the techniques of the Oracle 10. The Data Bank has developed a system of information storage, retrieval
1-2 Reports and Papers - In collaboration with the competent departments of the Secretariat, the
Data Bank compiled the Annual Statistical Report, 2008, covering the period 2003-2007. Data Bank's issuance of the report was in a new form, relying on the comprehensive presentation of the statistical tables and graphs and the use of percentages. It was posted on the General Secretariat’s website and made available on CD-ROM.
- Data Bank helped in the preparation of the annual report of the Secretary General’s 34th Annual Report, 2007, in Arabic and English. It was posted on the General Secretariat’s website and made available on CD-ROM.
- The Data Bank arranged the papers presented to the seminars and meetings organized by the General Secretariat and placed them on CD-ROM (CD-ROM).
- The Data Bank helped the relevant departments in the preparation of studies, papers and presentations undertook this year.
- The Data Bank compiled a publication of energy data by international grouping for 1970-2007, based on the British Petroleum Company’s database. The publication is updated annually, put on CD-ROM, and, in accordance with an agreement with BP, the distribution is limited to country-members.
- It published a booklet on energy data, including oil reserves, production, consumption, exports and imports using data provided by the Italian company ENI.
1-3 Other Activities - Updating General Secretariat’s website on a continuous basis. - Upgrading the hardware and software used in the Secretariat on a
permanent basis, and conducting maintenance of the computers and the internal network.
- Following-up the General Secretariat’s e-mail.
2. Information and Library Services
2-1 Bibliographical Services
The library started to broaden the base of bibliographic data based on the automated documentation system (Oracle) instead of system the old (CDS / ISIS). The library also continued to enter the data related to new books, documents, and Arabic and foreign articles and periodicals. The number of articles that have been entered to the database reached 1200, in addition to entering all Articles included in the General Secretariat’s quarterly journal "Oil and Arab Cooperation." Now any researcher will be able to access the library section on General Secretariat’s website and can get any required data.
The library also provides information retrieval for researchers from inside and outside the Secretariat, about 200 visitors over the past year have benefited from this service. In addition to the usual documentation service, this includes the preparation of the following:

- The bibliography for the quarterly journal Oil and Arab Cooperation, nos. 123-126.
- List of new books in the Library which distributed to all researchers in the General Secretariat.
- Preparation of periodic acquired recently by the library.
2-2 Indexing and Classification
The library continued to carry out the implementation of technical services related to the area of indexing and classification. All the data of references and books that reach out to the library was entered on the auto archive system. The Library’s total collection increased from 28,979 to 29,201 books and from 5500 to 5551 document.
2-3 Acquisition
The acquisition service Focused in 2008 on the following points:
- Follow-up subscriptions to Arabic and non-Arabic periodicals for the year 2008, as well as the publications of official bodies and government departments, institutions and oil companies in Arab countries.
- Providing the library with new books and references, and following-up the updating of the references and books through the acquisition of the new editions, whether in hard copy or electronic one.
- Monitoring the late arrival of local Arab and foreign periodicals.
- Downloading e-journals which are delivered via General Secretariat’s e-mail.
- Keeping up and arranging of electronic sources that the library receives.
2-4 Current Awareness and Lending
- General Services: the library continued to provide its visitors with different by responding to their queries, as well as providing them with photocopying service when it necessary.
- Lending: A total of 1550 books and periodicals were lent in year 2008.
- Binding: In 2008, the library bound 80 periodicals, 40 documents, and 20 books.
3. Studies, Papers, and Reports
3-1 Study on the "Features of Some Developments in the Petroleum-Drilling Domain”
The study addressed the most important developments in the field of petroleum wells drilling, as follows:
- Developments in the Drilling Bits. - Tubing Coiled Drilling. - Developments in the area of horizontal drilling. - Particle-Drilling Impact (PDI). - Under balanced Drilling. - Developments in drilling mud. - Drilling with casing lends. - Measurement While Drilling. - Drilling fluids and environmental impacts.
2-3 Study on "Options for Refining to Refine Heavy Crudes"
The study overviewed the evolution of the production of different types of crudes in different regions and in particular in OAPEC member Countries and the other Arab countries. It also covered the future prospects which underline the growing production of heavy crudes. In refining industry, the most important projects which aim to improve the added value of heavy crudes being implemented in member countries were discussed.
After reviewing the most important implications of refining the heavy crudes on operating conditions of the refinery’s units, and endangering the equipment to erosion and sediment solid Occlusions that hinder the process of heat exchange, the study addresses the most important techniques to improve the characteristics of these types of crudes, and transferred to consumable products. The pros and cons of each technology and its impact on the profitability of the refinery, and the quantity and quality of their finished products were tackled.
The study also shows the opportunities for the conduct of by-products that result from the refining of heavy crude such as petroleum coal, heavy and tar, by transferring them to synthetic gas that cab be used as fuel in a clean Cogeneration plants to produce steam and electricity or hydrogen for the refinery units with relatively low costs.

Given the high percentage of impurities in heavy and sour crudes, in particular nitrogen and sulfur compounds and minerals that lead to increased opportunities for the refinery to omit pollutants in all forms (gas, liquid and solids), the study reviews the environmental impact of refining the heavy crudes, the most important options available to mitigate the potential impacts on air, soil and surface and groundwater water resources.
The study concluded with some findings which reached through the analysis of the results of many practical cases that have been implemented in member countries and other regions of the world, as well as the most important recommendations that could enhance the ability of the Arab oil refineries to refine heavy crudes.
3-3 Paper Entitled “Natural Gas Supply and Demand Outlook to 2017”
The study was submitted to the 14th International Annual Forum fertilizer and Exhibition, which was held in Cairo - Arab Republic of Egypt, 5-7 February 2008. The paper discussed various uses of natural gas, and the main drivers behind its increased demand such as the availability, high efficiency use, and compatibility with growing global environmental commitments, as well as its economic advantage compared to other fuel types, thus increasing its contribution to the global primary energy mix. The paper reviewed the current situation of natural gas in different regions in terms of current and projected reserves, production, consumption, and trade movement between the different global markets. The paper pointed out that the Middle East region accounted for 40.5% of the total world reserves of natural gas which estimated at 181.5 trillion cubic meters at the beginning of 2007, followed by Europe and Eurasia which accounted for 35.3%, and the remaining (24.2%) was distributed between the rest of the world.
3-4 Paper Entitled “The Current And Future Role Of Improved Production of Petroleum In The Arab Countries”
It was submitted to the 10th session of the Mediterranean Petroleum Conference and Exhibition, which was held in Libya, 26-28 February 2008.
The paper identified the improved methods of oil recovery as the ways which can be used to extract additional quantities of oil from the oil field, above the quantities which produced by using the initial production methods, through the amendment of the reservoir natural forces.
The paper indicated that more than 25% of the geological reserves of a reservoir produced by using the methods of primary production, and by applying the improved production methods IOR, the factor of productivity

can raised by more than 35%, where the secondary production methods contributed to the production of 20 % of geological reserves, while enhanced methods of EOR contributed to the production of at least additional 10% of this geological reserves. This means an addition of about 273 billion barrels to the producible oil reserves, which is equal to about a quarter of the current world oil reserves.
The paper characterized the Arab countries as: a major oil reserves holder, diversity of reservoirs from a geological perspective, and existence of different types of crudes in these reservoirs. These factors combined encourage the use of improved recovery methods, and that some of these techniques can contribute in providing an opportunity to catch and store carbon dioxide in the Middle East and North Mediterranean Sea. This is consistent with the principle of the clean development mechanism contained in the Kyoto Protocol.
3-5 Paper Entitled “Investments in OAPEC Member Countries Refining Industry”
This paper was submitted to the Middle East Gasoline and Diesel Conference, which held in Doha, Qatar ,9-10 April 2008.
The paper dealt with the most important upgrading projects of existing oil refineries and the establishment of new ones in OAPEC member countries and other Arab countries. The following topics were discussed in details: - Motives behind the implementation of these projects, projected costs,
and difficulties in implementation. - Fluctuation of raw materials prices. - The risks resulting from uncertainties in identifying the expected growth
rates of demand for petroleum products during the life of the project. - The reluctance of environmental bodies to establish such projects as
polluting the environment.
The paper concluded by presenting the strategic plans adopted by member countries to meet those challenges, and mitigate the negative implications.
3-6 Paper Entitled “The Petrochemical Industry and its Status in The Arab Countries”
It was submitted to the 1st Arab Chemical and Petrochemical Industries Forum for the, which held in Damascus - Syrian Arab Republic, 28-29 April 2008, under the title "The Optimal Use of Petroleum
Hydrocarbons in Industry and Energy." The paper discussed the Arab and international developments in the petrochemical industry. It shed some light on the current status of the petrochemical industry in the Arab countries. It indicated that since 2004 the Arab petrochemical industry is witnessing a boom not seen since the late seventies, which lead to adopting ambitious expansion plans for the existing facilities, and building of new units. The new units are expected to start production at the end of 2008, which will result in raise the capacity of produced basic products.
3-7 Paper Entitled "Transportation Of Natural Gas And Its Uses In The Arab Countries"
This paper was submitted to the symposium on " Natural gas industry: present and future" organized by the General Secretariat in cooperation with the French Institute of Petroleum and held in Paris, 17-19 June 2008.
It reviewed the proven natural gas reserves in Arab countries world wide, and indicated that the reserves of the Arab countries, amounting to 54.7 billion cubic meters which accounted for 28.3% of the total world natural gas reserves. and indicated The distribution of these reserves between the Arab countries was also mentioned. In 2006, the production of marketed natural gas was approximately 387 billion cubic meters in Arab countries, equivalent to 13.1% of the total world gas marketed.
The paper reviewed the following: key consuming sectors of gas in the Arab countries, gas liquefaction units, the existing and under construction regional and interface gas pipelines, and finally gas exports from Arab countries.
The paper emphasized the potential of Arab countries to meet first the growing domestic demand, secondly their commitments in export, and finally in meeting a large part of the growth in world demand for gas.
3-8 Paper Entitled “Reducing the Environmental Impacts of Oil and Gas Exploration and Production Activities”
This paper was submitted to the Conference on "Developments in the techniques of exploration and production", which was held in Manama, Kingdom of Bahrain during the period 10-12 November 2008.
The paper pointed out that the exploration and production often lead to the creation of different effects, both on the environment, or economic status, social and even cultural. The reduction of pollution from an integrated concept of reducing or limiting the discharge of polluting substances in the air, water, or soil.
Most of the major sources of air pollution resulting from these processes may be referred to the discharge of gas, or burned at the torch, and outputs the burning of fuel in the engines, diesel engines or gas turbines, and the leakage of gas during loading, storage, and flying particles of soil caused by the movement of hydrocarbons through the establishment of facilities or because of traffic and traffic.
The most of the gas is carbon dioxide, CO2, carbon monoxide CO, methane CH4, and nitrogen N2, and a group of sulfur oxides SOx, and hydrogen gas Kipritid H2S, and a range of volatile organic compounds VOC.
Reflected the role of modern techniques in reducing the environmental impacts of exploration and production, through a variety of applications, such as the use of new types of shakers Vibroseis to reduce the use of dynamite in the seismic survey, and the expansion of the use of three-dimensional seismic 3D, and a four-dimensional 4D, which contribute to the identification of hoped for a more precise structures, and thereby reducing the necessary drilling operations, and the accompanying use of some materials may be inappropriate for the environment, and the application of modern drilling techniques such as horizontal drilling, drilling and multi-logs, and drilling thin (Slim Hole), which increases the efficiency of drilling operations, as well as the development of offshore drilling platforms to reduce the pollution of the seas and oceans, and the development of pipeline transport, tankers, maintenance and care.
3-9 Paper entitled: The Petroleum Industry in Reducing Climate Change
This paper was submitted to a panel discussion the Fourth International Conference on Research and development in the area of energy ICERD, which was organized by the University of Kuwait, in cooperation with other parts of the State of Kuwait during the period 17-19 November 2008.
Paper dealt with the causes of climate change and the role of emissions from petroleum industry, according to some consensus on that, and has played by the industry to reduce those impacts, also came to the point of view, on the other natural causes of climate change, and a cyclical natural phenomenon, not directly linked to the human being.
In spite of this, called the paper to follow-up to take precautionary measures, and to recognize that oil, "oil and gas," clean fuel, and environmental damage became known, and can reduce most of them.
3-10 Study Entitled “Fluctuations in Exchange Rates of US Dollar Against Other Major Currencies and Their Impact on Member Countries’ Oil Revenues “
Study aimed mainly to explore the impact of fluctuations in exchange rates of the dollar on the price of crude oil and therefore on oil revenues, during the last seven years, since the launching of the euro.
In this context, the study included four main parts:
Part I reviewed the developments in the exchange rates of the dollar against the broad basket of currencies (BBC) which include most trading partners of OPEC Member countries. It also discussed the various developments in oil prices in light of the different OPEC strategies and its implications on the nominal value of member countries oil exports. In the second part, developments in the U.S. dollar exchange rate against the euro up to the present time were reviewed, and then the fluctuations in oil prices and their impact on the value of oil exports of member countries were also tackled.
The third dealt with the geographical distribution of member countries imports from various international groups during the past 25 years, in order to see how the purchasing power of the barrel was affected from the decrease or increase in the exchange rates of the dollar against other currencies. The fourth and last part of the study was devoted to clarify the differences between nominal oil prices and the one adjusted to exchange rates to see and the implication of those differences on the value of oil exports of members’ countries.
The most important findings of the study were as follows:
1. The impact of the devaluation of the dollar on the member countries depends on the extent to which these countries linked with the American market and other markets such as the euro or the Asian region.
2. The differences between the nominal oil prices and the price-adjusted to dollar exchange rates are varied according to the chosen base year. Differences were in favor of price-adjusted to exchange rates if year 1980 was chosen as base year, if 2000 was chosen as a base year we will get a completely different picture.
3. The increase in the value of oil exports, which resulted from the substantial rise in prices and production has been overshadowed by the decline in the value of dollar against other major currencies (5.6% against the euro and 3.9% against the pound sterling).

3-11 Study Entitled “Development of Renewable Energy and Their Implications on World Oil Markets and Member Countries”
The study mainly aimed to shed light on the current developments and future prospects of world renewable energy sources and their possible implication on the oil markets and member countries. The study consists of four main parts:
The first part was devoted to review the different types of renewable energy sources (solar, wind, groundwater, hydro, biomass and biofuels) and their importance in the global energy market and their key uses.
The second part was allocated to deal with the usage of renewable energy in generation of electricity and heat sector, the focus on this sector was due to its growing importance in economic activity on one hand, and on energy world trade on the other.
The third part of the study devoted to address the production of bio-fuels (ethanol, which constitutes the largest part, and biodiesel), which concentrated mainly in the United States, Brazil, and the European Union.
The fourth and last part of the study addressed the implications of the development of renewable energy sources on the global oil market and member countries.
The most important findings of the study were:
1. The development of the renewable energy industry was dependent on the support and encourage of Governments in consuming countries, which was politically rather than economically oriented. One can justify that by the calls on the security of energy and environmental conservation.
2. The renewable energy industry, in particular, biofuels, has met in the past few years, increasing criticism, as has been called into question of the true extent of its contribution in the net energy volume and low greenhouse gas emissions compared with fossil fuels. It has also been warning that its competition with food may eventually lead to a rise in basic food prices, and could have negative effects on the world poorest countries, in particular, and on the stability and world peace in general.
3. The implications of developments of renewable energy on member countries will vary depending on circumstances, some member countries saw these rapid developments could affect at the end their petroleum revenues, while others regarded as an opportunity can be exploited.

3-12 Study Entitled “Development of Oil and Natural Gas Production in Sub-Sahara”
Study aims to shed light on the evolution of oil and gas industry in the countries of sub-Saharan Africa and their potential implications on member countries.
Part I reviews the African oil and natural gas reserves and their importance in world oil market. The main bulk of the African oil reserves (more than 93% of 2006 total) is concentrated in six countries - Libya (35.4%) and Nigeria (30.9%) and Algeria (10.5%), Angola (7.7%) and Sudan (5.5%) and Egypt (3.2 %). oil reserves of the continent increased from 59.9 billion barrels in 1990 to 117.2 billion barrels in 2006, an increase of less than 96% during that period to constitute 9.7% of total global reserves for the year.
On the other side, more than 91% of the African gas reserves are concentrated in four countries, Nigeria (36.7%), Algeria (31.7%), Egypt (13.7%), and Libya (9.3%). The reserves has increased from 8.07 trillion cubic meters in 1990 to 14.18 trillion cubic meters in 2006, an increase of 75.7% during that period to constitute 7.8% of total natural gas reserves in 2006.
The second part of the study addressed the factors influencing the development of oil and gas reserves in sub-Saharan African, including the continuing escalation of oil prices since 2004, and the increasing concerns about the global energy security and the adequacy of oil production capacities to meet the growing future needs.
The third part was devoted to review the development of oil and natural gas production in the south of the Sahara on country basis. In spite of the uncertain security situation and civil unrest, Nigeria has maintained its position as largest producer and exporter of oil in the region as well as the only exporter of natural gas up to 2006.
The fourth and last part of the study addressed the prospects for future supplies of oil and natural gas in the south of the Sahara and its possible implication on member countries, where total oil production from the region increased from 3.92 million b / d in 2000 to 5.4 million b / d in 2006, an increase of 38% during that period, which led to an increase in exports by about 28% during the same period.
One of the most important findings of the study:
1. The amplification of the possibilities of future prospects of sub-Sahara reserves in accordance with current situation of oil and gas industry in the region.

2. The oil supplies from the region may play important role in some markets, particularly the American market, but it can not be compared with the supply of the Middle East, and can not be considered as a substitute for it in any way.
3. In light of the expected growth in global oil demand until 2030, the additional production capacities in the future of sub-Saharan can be considered as complementary in nature rather than competitive one to member countries supply.
3-13 Study Entitled “Fluctuations in Oil Prices: Factors and Implications on Member Countries’ Oil Revenues. “
Study aims to review the ups and downs in oil prices during the past eight years, and discuss the key factors that have contributed to these fluctuations and their impact on oil revenues for the member countries.
The study was divided into three main parts, the first part dealt with the evolution of different crudes prices, and the degree of volatility experienced during the period 1990-2008. Crude oil prices were witnessed different periods, in some of them have seen a remarkable increase, while in other experienced a decrease in their levels depending on the prevailing factors in oil market in each period. Moreover, the different degree of volatility in oil prices from one period to another. In this section a statistical analysis conducted to determine the degree of volatility in oil prices and its differentiation from one period to another.
The second part dedicated to review the factors causing the fluctuations in oil prices. It’s well known that fluctuations are subject to a wide range of interrelated and changing factors at the same time. Some of these factors are visible while others are invisible and almost impossible to predict its occurrence, such as natural phenomena (hurricanes) that has been sweeping important regions in terms of oil production and refining, and geopolitical events in the major producing areas. But there have been key factors to consider their impact on oil prices, for instance global demand, the level of supplies, and OECD commercial oil stocks, and production spare capacity. In addition to the main factors that govern the behavior of oil prices, there are many short-term factors, which their impact on oil prices depends on the period that remains prevalent in the oil market. The fluctuations in oil prices have many implications on member countries and consuming countries, in particular, and on the oil industry in general.
The third and last part of the study devoted to trace the impact of fluctuations in oil prices and member countries’ oil revenues, and on the consuming countries, and finally on the activity of the major oil companies.

The most important findings of the study, were the following:
1 - The most important factor affecting oil prices is the level of demand, which rose by 1.6% to 87.1 million b / d in 2008.
2 - The bottlenecks in the refining sector, particularly in the United States of America, were one of the most important reasons behind the rise in oil prices.
3- The G7 has achieved higher returns compared to that of member countries. When the total tax return of G7 amounted to about 2310 billion dollars during the period 2002-2006 of, the volume of oil revenues for OAPEC member countries did not exceed 1205 billion dollars during the same period.
3-14 Study entitled “Sources of Energy in the Global Energy Balance: Current Situation and Future Prospects”
Study aims to identify the historical developments and future prospects of the main indicators in energy field (reserves, production and consumption of different sources of energy by regional groups). The study focuses on comparisons between energy supply and demand in 2030, and it provides an initial view about the possible trends of oil and natural gas exports from Arab countries in 2030.
Chapter I of the study dealt with major developments in energy field during the period 1980-2006 in terms of reserves, production and consumption of various sources of energy by different regional groupings. This chapter also shows the magnitude and direction of oil exports from Arab countries to different importing groups.
Chapter II discussed the future scenarios of energy demand until 2030, according to different sources, namely of the Organization of Petroleum Exporting Countries (OPEC), Energy Information Administration of the U.S. Department of Energy, and the International Energy Agency.
The third chapter deals with the future outlook of global energy supply and demand until 2030. It also sheds some light on outlook for energy production and consumption of different sources until 2030, in accordance with the regional groups with the focus on China and India. The chapter provides a comprehensive picture of the surplus/deficit in the production of oil, natural gas and coal, by countries and major groups.
Chapter IV reviews the recent trends and the future potential for oil and natural gas exports from Arab countries in 2030, followed by a summary and conclusions.
The most important findings of the study:
1 - Oil will continue to play an essential role in meeting the requirements of the world's energy, despite the decline in its share in energy mix in 2030 to about 31.5%. The share of natural gas will increase to 22.3% in 2030. Developing countries and will account for more than half of the total energy demand in 2030.
2 - There will be a significant shift in terms of the relative importance of regional groups in the demand for oil. The importance of developing countries will increase compared with a decline in the importance of devolved countries.
3 - Oil exports from the Middle East and North Africa is expected to continue mainly to China, India, North America and Europe. China, India and the industrialized countries in Asia and Pacific and European markets will also be source of natural gas from Arab countries.
3-15 Study Entitled “The Global Financial Crisis and Its Initial Potential Impact on the Petroleum Industry in The Arab Countries “
In line with the importance of the petroleum sector in the Arab economy, the study aims to review the initial rapid repercussions of the financial crisis on the world markets, focusing primarily on the potential repercussions on the Arab petroleum sector.
First Part of the study reviews the reality of the crisis (causes, developments and efforts to mitigate the impacts), highlighting the roots and main reasons behind the crisis, in terms of crisis escalation, spreading outside the U.S. market, stages of evolution, and the U.S. financial recovery plan. The second part represents the repercussions of the financial crisis and its implications on world oil markets. The third part of the study reviews the role of the Arab oil in the international oil market.
Part four dealt with the possible repercussions of the financial crisis on the Arab economy. The study concluded the following findings: - The impact of the crisis was clear in the sharp collapse of oil prices since
mid-July 2008. Prices showed an unprecedented downward acceleration till the month of December 2008, OPEC basket prices were down by more than $ 100 a barrel compared to July 2008.
- With the rapid pace of developments arising from the crisis, repeated cuts in forecasts of global economic growth rates, the emergence of the specter of economic stagnation which threatens the various world economies, the effects of the crisis emerged in the subsequent reduction to the expectations of the future global demand for oil.
- Oil prices rose during the first half of 2008, and fallen with higher rate during the second half of the year, the result was a decline in estimated Oil revenues of the Arab States for the second half of the year by about (69 billion dollars) from the levels estimated in the first half.
- Dangerous become, if the price continued to fall, and demand continued to decline, as it is expected that the decline in oil prices by one dollar Barrel will result a decline in Arab oil revenues by somewhere between four to ten billion dollars a year, with all other factors remain the same, which means increasing Pressure on government budgets and declining growth rates and tunnels and the disruption of the balance of payments. .
- Lower demand and the collapse of oil prices, will be reflected by supply cut by OPEC in the context of policy and objectives of the Organization in an attempt to rebalance the market, while NON OPEC producers continue to supply, which result in, Decline in the share of Arab countries in total world supply of oil, the transformation of its investments into surplus production capacities that is not required in the market, which is explained by apparently shelving the majority of petroleum investment projects in the Arab world .
II. ARAB AND INTERNATIONAL COOPERATION
1. Seminars and Meetings Organized by the General Secretariat
1-1 Seminar on " Natural Gas Industry: Present and Future"
Within the framework of implementing its 2008 plan, the General Secretariat, in association with l’Institut Français de Pétrole, held a seminar on " Natural Gas Industry: Present and Future," at IFP headquarters near Paris on 17-19 June, 2008.
The seminar was inaugurated by His Excellency Mr Ali Abbas, Naqi, OAPEC Secretary General, and Mr Olivier Appert, Chairman and Chief Executive Officer of l’Institut Français de Pétrole.
Some 120 experts and technicians interested in petroleum industries participated in the seminar’s activities, including 50 participants from the following OAPEC member countries: Algeria (1), Bahrain (2), Egypt (1), Iraq (2), Kuwait (10), Libya (8), Qatar (5), Saudi Arabia (18), Syria (2), UAE (1), and Tunisia (1), in addition to one participant from Oman (1), in addition to the Director of the Department of Technical Affairs of General Secretariat

There were seven technical sessions during which 28 papers were presented, including 12 papers from OAPEC member countries. The seminar concluded with a roundtable on ‘Gas Development: the Way Forward.’
The technical sessions focused on the following topics: • Natural gas industry in the Arab world and worldwide • Acid gases • NGLs industry • Natural gas treatment • Natural gas prospecting and production in difficult areas • Impact of gas production and uses on environment and techniques for
CO2 capture
The Chairman of Gaz de France, the Director of Gas Sweetening at Prosonat, the Deputy Director of Sustainable Development at IFP, and the Director of Technical Affairs at OAPEC attended the roundtable on ‘Gas Development: road to the future.’
Technical sessions focused on the following topics: - Arab and Global natural gas industry. - Acid gases. - The transportation and uses of gas. - Liquefaction of natural gas and GTL industry. - Treatment of natural gas. - Exploration of Natural gas and its production from difficult areas. - Environmental implication of gas production and consumption and CCS
techniques. The main speakers in the panel discussion on “the development of
gas: the road to the future” were the following: the President of gas-de-France, director of gas development program in Brosonat company, the Deputy Director of the Sustainable Development of the French Institute of Petroleum, and the Director of Technical Affairs of the Organization of Arab Petroleum Exporting Countries.
1-2 15th Coordination Meeting of Environment Experts in OAPEC Countries
In implementation of its 2008 Plan of Action, the General Secretariat convened the 15th Coordination meeting of Environment Experts in OAPEC Countries in Cairo, 15-16 October 2008.

His Excellency OAPEC’s Secretary General Mr. Ali Abbas Naqi opened the meeting by welcoming the participants. He noted the importance of the meeting, which the General Secretariat has held annually shortly before the Meetings of the Conference of the Parties to the United Nations Framework Convention on Climate Change, which was held in the city of Poznan – Poland, 1-12 December 2008. He noted that this meeting aims to discuss the topics that require a coordination among member countries, in order to be able to protect various interests.
Ms Rola Nasereddin, Environment Specialist - Department of Technical Affairs reviewed the latest developments in UNFCCC since the COP-13 in December 2007, as well as the initial program for the meetings held in Poznan - Poland late in 2008.
Participated in the meeting Experts from 9 member countries attended the meeting as follows : the United Arab Emirates (1), Kingdom of Bahrain (3), Republic of Algeria (1), Saudi Arabia (1), the Republic of Iraq (2), Qatar (2) , State of Kuwait (5), the Great Libyan Arab Jamahiriya (1), the Arab Republic of Egypt (4), Arab States League - the Technical Secretariat of the Council of Arab Ministers Responsible for the Environment (2), the Secretariat General of GCC (1), OPEC (1), in addition to OAPEC delegation (2).
Subsequently, discussions were held on coordinating positions in the next meetings of the Conference of the Parties in Poznan - Poland, the participants reached at the end to a number of recommendations.
1-3 8th Meeting of Working Group on Prospects for Cooperation in Natural Gas Investment in OAPEC Member Countries
In response to an invitation from Syria’s Ministry of Oil and Mineral Resources, and in implementation of its 2008 Program of Action and the recommendations of the seventh meeting of the Working Group on Prospects for Cooperation in Natural Gas Investment, the 8th meeting of the working group convened in Damascus, 27-29 October 2008.
The meeting was opened by His Excellency Engineer / Sufian Allaw, Minister of Oil and Mineral Resources of the Syrian Arab Republic by welcoming the participants and welcomed the convening of the meeting in the city of Damascus. Then he reviewed developments in Syrian natural gas industry and the projects being implemented and future projects, and wished the meeting success.
In his speech, HE Mr. Ali Abbas, Naqi, OAPEC Secretary General, noted the importance of the meeting and its timing when the world facing worst financial crisis causing oil prices to fluctuate sharply. He mentioned

that the purpose of the annual meetings is to address developments in the gas industry in each country, and to exchange of information, and to see the prospects for possible cooperation in the gas industry in the member countries.
After reviewing the background and objectives of the meeting and the recommendations of the seventh meeting, the agenda of the meeting focused on the following two major topics: 1. Developments in the natural gas industry in each country during the
period between the seventh and eighth meetings. 2. Supervision and control in gas networks.
Then His Excellency wished the participants success in achieving the objectives of the meeting, and a pleasant stay in Syria.
HE Dr. Eng / Hassan Zeinab, Associate Minister of Oil and Mineral Resources in Syria and the representative of the Syrian Arab Republic in the Executive Bureau, attended the opening ceremony and participated in the meeting, as well as His Excellency Mr. / Mohamed Ras El Kef, the representative of Republic of Algeria in the Executive Bureau, and the leaders of the governing bodies and directors of Syrian oil and gas companies. In addition to (25) experts from member countries participated in the meeting. Then the participants elected Dr. / Mohamed Mukhtar Lababidi, Director of Technical Affairs in the Secretariat as Chairman of the meeting.
Dr. Samir Mahmoud, an oil industry Expert in the Secretariat General, then reviewed the achievements made by the General Secretariat in following up recommendations of the 7th meeting, and the most important developments in the natural gas industry in the member countries.
The participants presented eleven papers on the two aforementioned topics, followed by thoroughly discussions and constructive questioning.
1-4 Conference on "Developments in Techniques of Exploration and Production" In response to an invitation from HE Dr. Abdul Hussain bin Ali
Mirza, Bahraini Minister of Oil and Gas Affairs and NOGA Chairman, under his patronage, the General Secretariat, in association with the National Oil and Gas Authority (NOGA), convened a conference on developments in techniques of oil exploration and production in Manama, 10-12 November 2008.
The conference aimed at highlighting the most significant developments in techniques of oil exploration and production, and focused on the following topics:

1. Processing and interpretation of seismic data. 2. Petroleum systems and modeling sedimentary basins. 3. Heavy oil. 4. Drilling and Geochemistry. 5. Re-exploration of the abandoning structures. 6. Mitigating the impact of oil discoveries and production on the
environment.
The conference also provided vivid examples and case studies from member countries oil industry.
The conference was opened by His Excellency Dr. Abdul Hussain bin Ali Mirza, Minister of oil and gas, and the head of the national oil and gas Affairs in the Kingdom of Bahrain, the sponsor of the conference, HE Mr. Ali Abbas, Naqi, OAPEC Secretary General, also spoke at the opening ceremony.
Eighty participants from member countries attended the meeting, as follows: the United Arab Emirates (7), Kingdom of Bahrain (35), Saudi Arabia (16), Syrian Arab Republic (2), Qatar (4), the State of Kuwait (6), Arab Republic of Egypt (7), in addition to the delegation of the Secretariat (5), and (12) from international companies such as: Gulfsands Syria, Shell E & P, IFP, Beicip-Franlab, EniRepSa, Kestrel-UK, WesternGeco.
The participants presented (28) papers in the context of the above-mentioned topics, including two papers submitted by the Secretariat which has received extensive discussion.
Participants expressed their gratitude to His Excellency, Dr. Abdul Hussain bin Ali Mirza, Minister of oil and gas, and the head of the National Oil and Gas Affairs in the Kingdom of Bahrain, for his sponsorship of the Conference and to the Secretariat of OAPEC for the organization of the Conference, and invited them to continue to be held periodically and alternately between the member countries.
2. Conferences, Seminars, and Meetings Attended by General Secretariat
2-1 Joint Kuwaiti-Japanese symposium on Fuel Cells Under the Rubric of "Research and Development and Applications of Fuel Cells and Hydrogen Production Technology"
In response to an invitation by Kuwait Institute for Scientific Research (KISER), the General Secretariat took part in Japan-Kuwait symposium on fuel cells, which was held with the theme of “ Research and Development

Applications in Fuel Cells and Hydrogen Production Technology”. The symposium was held in the symposium hall at the Petroleum Research and studies center in Al-Ahmadi on 24 January 2008.it was organized by KISER in association with Japanese Petroleum Institute, JPI, and Japan Cooperation Center for Petroleum JCCP.
Fifty participants from various institutions attended the symposium. There were specialists from KISER, the University of Kuwait, the Public Authority for Applied Education, a number of private universities, the Ministry of Electricity and Water, Kuwait Petroleum Corporation, the National Company for technology projects, in addition to a number of private sector companies.
Many experts in fuel cell research from Japanese companies and Japan Petroleum Institute, and researchers from the Japanese oil companies, and KISER have been invited to this symposium. They offer their expertise in the following fields:
- Developments in fuel cells which running on petroleum fuel used in running cogeneration systems for household.
- Development of catalysts in catalyst reforming. - Basic techniques of polymer electrolyte fuel cells.
2-2 14th International Annual Fertilizer Forum and Exhibition
The General Secretariat took part in the 14th International Annual Fertilizer Forum and Exhibition, held in Cairo, 5-7 February 2008.
A number of researchers and specialists on fertilizer industry participated at the forum, in addition to nearly 700 participants representing international and governmental organizations and bodies, specialized companies, and Arab and foreign research centers.
The forum discussed the most important regional and international developments in light of the trend toward producing bio-fuel (ethanol–bio-diesel) and its impact on the rise in demand for all types of fertilizers. It explored the supply/demand balance in the countries influencing the fertilizer trade. It also discussed freight shipping and its impact on the prices of fertilizer raw materials and products in light of the sharp rise in freight prices as a result of the rise in international energy prices.
The General Secretariat presented a paper entitled ‘The World Natural Gas Supply/Demand Balance and the Outlook to 2017.’

2-3 10th Mediterranean Petroleum Conference and Exhibition International Energy Foundation
In response to an invitation from the International Energy Foundation (IEF), OAPEC’s General Secretariat took part in the activities of the 10th session of the Mediterranean Petroleum Conference and Exhibition (MPC08), which was held in Libya, 26-28 February 2008.
The proceedings comprised eight sessions over three days. The main themes of the sessions focused on energy management and environmental affairs, development of human resources, oil price fluctuation and its impact on petroleum producing and consuming countries, petroleum reservoir management and petroleum information technology.
Over 30 lectures and scientific papers were presented at the symposium by Arab and non-Arab researchers representing various operating companies and government and private agencies. The General Secretariat presented a paper entitled ‘Current and Future Role of Improved Production of Petroleum in the Arab Countries.’
2-4 GCC Policy Development Meeting on Clean Fuels and Vehicles
Invited by the United Nations Environment Program/ESCWA, the General Secretariat took part at the GCC Policy Development Meeting on Clean Fuels and Vehicles, held in Manama, Bahrain, on 12-13 Mach 2008, under the auspice of His Excellency Dr. Abdul Hussein bin Ali Mirza, Minister of Oil and Gas Affairs and Chairman of the National Oil and Gas Authority, in presence of Dr. Mohammad bin Ibrahim Al Twaijri, Assistant Secretary General of the Arab League for Economic Affaris, and Dr. Habib Al Habr, Regional Director and Representative of UNEP/ESCWA.
The meeting aimed to: - Achieve a better understanding of the status of fuel and transportation of
the GCC countries, and existing opportunities and challenges for securing cleaner fuel and vehicles.
- Identify stakeholders in the current initiatives in the GCC countries. - Improve opportunities for sharing information and expertise among
experts and specialized people and establish a communication network and structure on fuel and vehicles and improve air quality.
About 70 participants from the GCC countries, Syria, Egypt, Jordan, Lebanon, and a number of regional organizations took part in the meeting. The participants came up with a road map on the gradual introduction of clean fuel and vehicles in the GCC countries.

2-5 Fourth Coordination Meeting of Oil Training Institute Officials in OAPEC Member Countries
In response to an invitation from the Libyan Oil Institute and Specific Training Center, and in conjunction with OAPEC’s General Secretariat, the fourth Coordination Meeting of Oil Training Institute Officials was held under the sponsorship of Libyan National Oil Corporation in Tripoli, 24-26 March 2008.
Twenty five specialists Participated in the meeting, as follows:
Democratic People's Republic of Algeria (3), Saudi Arabia (1), Syrian Arab Republic (2), the Republic of Iraq (4), Qatar (2), the State of Kuwait (1), the Great Libyan Arab Jamahiriya (10), Arab Republic of Egypt (1), Arabian Institute of oil training (1), in addition to the Libyan representative in the Executive Bureau of the Organization, and the Director of Technical Affairs in OAPEC as representative of His Excellency the Secretary-General on the Board of Trustees of the Arab training Institute.
H.E. Eng. Ahmed Aoun, a member of the Management Committee of National oil Corporation in the Libyan Jamahiriya, inaugurated the meeting on behalf of H.E. the Chairman of NOC Management Committee by welcoming the Participants and noted the importance of the meeting.
H.E. pointed the importance of efforts made by Libyan National Oil Corporation on the training of its technical personnel in the petroleum industry. He wished that the meeting will come out with recommendations that can be applied in practice, and help to make use of the capabilities available in member countries oil industry training field.
Dr.Mohamed Mukhtar Lababidi, Director of Technical Affairs Department in OAPEC and the representative of HE Mr. Ali Abbas, Naqi, OAPEC Secretary General, expressed the greetings of OAPEC Secretary General to the participants and his apology for not attending the meeting due to other engagements.
Dr. Lababidi welcomed the participants and wished them success in their meeting, and thanked the Libyan National Oil Corporation, Libyan Oil Institute, and Specific Training Center on the efforts made in preparing for this meeting and wished them a pleasant stay in Libya. Dr. Lababidi then reviewed the results of the previous meetings and the achieved steps namely, get acquainted with the officials of the Member countries, learning about what their capabilities and training institutes, and seeking access to effective cooperation and exchange of experts and trainees between member countries. Then the directors of Libyan Oil Institute, and Specific

Training Center, welcomed the participants and forward briefs about the Institute and the Center and their available capabilities and the role of the National Oil Corporation in this area.
The director of the Arab Petroleum Training Institute spoke about the contributions of the Institute and its activities and called for the need to return to its normal position in the framework of the organization.
After that there was an exchange of views and ideas among the participants about the possibility of activating the cooperation between training institutions in member countries and how to use them in scenarios and mechanisms that can be implemented in this regard.
A number of recommendations reached, and identified the following goals for implementation until the next meeting: • Establish a data base containing complete data on all the training institutes
in the country's oil members of the Organization, "OAPEC", will be prepared by the Institute of Arab oil to the training institutes to report to officials of the requested information until the middle of April - April 2008, God willing. The peace and Algeria and the Libyan delegation requested information on Mr. Director of the Institute of Arab oil to the training. As Mr. / President and Director of the Department of the skills of the Egyptian Company for oil and gas to provide some data on the company and some training institutes in Egypt.
• The exchange of trainers and trainees of all training institutes in the member countries of oil, on the basis of bilateral agreements or more.
2-6 6th Syrian International Oil and Gas Exhibition SYROIL 2008
In response to an invitation by H.E. the Syrian Minister of Petroleum and Mineral Resources, Sofian al-Alaw, H.E. Mr. Abbas Ali Naqqi, OAPEC’s Secretary General, and Dr. Mukhtar Al-Lababidi, Director of the Technical Affairs Department, attended the opening ceremony of the 6th Syrian International Oil and Gas Exhibition (SYROIL 2008) and seminar held in Damascus, 7-10 April 2008.
Delegations representing some Arab countries also attended the ceremony. There was one delegate from UAE, headed by H.E. Nasir Al-Sharhan, Deputy Minister of Energy, and another from Yemen, headed by H.E. Deputy Minister of Oil and Minerals and H.E. Ahmad Bin Hamad Al-Naemi, Director-General of APICORP.
Over 220 international and local petroleum companies representing 43 countries were present. A scientific seminar was held where many papers discussing the latest developments in the petroleum and gas industry were submitted

2-7 Middle East Gasoline and Diesel Conference 2008
The General Secretariat took part in the Middle East Gasoline and Diesel Conference (GDC 2008), held in Doha, Qatar, 9-10 April 2008, along with representatives of member countries and international petroleum companies.
At the opening session, the most important challenges encountering the refining industry in the Middle East and the world were discussed. It was followed by four sessions where 14 papers were submitted on the following topics: 1. Supply and demand for petroleum products in Middle East markets and
forecasts for international markets. 2. Trading oil products and their prices, refinery profits, and means of
bridging the supply-demand gap. 3. Standards, specifications and techniques of producing high quality
petroleum products. 4. Challenges to the gasoline and diesel markets, and future prospects.
In the end, a seminar was held on the most important challenges related to the security of diesel and gasoline supplies in the international markets, the role of the Arab region in stabilizing the markets of petroleum products, and the future of bi-fuel and its positive and negative impacts on world economics.
The General Secretariat submitted a paper entitled ‘Clean Fuel Projects in OAPEC Member Countries.’
2-8 First Arab Chemical and Petrochemical Industries Forum
In response to an invitation by Arab Union for chemical and petrochemical industries, the General Secretariat participated in the First Arab Forum for chemical and petrochemical industries, held on 28-29 April 2008, in Damascus - Syrian Arab Republic, under the title "The Optimal Use of Petroleum Hydrocarbons in industry and energy." The Forum was organized by Al-salam for International Conferences under the patronage of the Prime Minister of the Syrian Arab Republic, H.E Engineer Mohammad Naji al-Utri, , and the supervision and support of the Council of Arab Economic Unity.
The chairmen, Secretaries General, and representatives of Specialized Arab unions, participated in forum in addition to an elite group experts and industrialists concerned with chemical and petrochemical industries in a number of Arab countries, representatives of Arab, regional and

international organizations, representatives of oil, gas and chemical companies, and Arab and foreign businessmen investors. A number of research and working papers discussing various topics related to chemical and petrochemical industries were presented in the forum over three working sessions.
The General Secretariat presented a paper in this forum entitled ‘The Status of Petrochemical Industry in Arab countries’.
2-9 13th Meeting of the Climate Change Subcommittee
The General Secretariat took part in the 13th meeting of the Climate Change Subcommittee of the Permanent Arab Meteorology Committee of the Arab League Secretariat General, which was held in Cairo, 27-29 May 2008.
Dr. Sayd Fathi Khouli from Saudi Arabia, opened the meeting by welcoming participants and the audience and wished the meeting every success. He expressed the hope that important recommendations and decisions would be reached in order to activate the committee.
Then he referred to the Arab Ministerial Declaration on Climate Change, which issued at ninth session of the Council Arab Ministers Responsible for the Environment, stressing the need to adhere to one Arabian position towards the common topics to be addressed on the upcoming meetings of subsidiary bodies of the Convention and Protocol during the period 2-13 June 2008. Dr. Khouli stressed on the importance of good preparation for the Third World Climate Conference, which will be convened under the patronage of the International Meteorological Organization during the period 31st August to 4th September 2009, the organization's headquarters in Geneva - Switzerland.
Mr. Ashraf Nour Eddin, the representative of the Secretariat of the League of Arab States, spoke about the mechanisms established by the Council of Arab Ministers Responsible for Environmental Affairs for following-up the United Nations Framework Convention on Climate Change and the Kyoto Protocol, and mentioned the need for consolidating the vision about them in accordance with common Arab interests.
Among the participants of the meeting were representatives of meteorology facilities in Saudi Arabia, the Arab Republic of Egypt, the Republic of Tunisia, the Republic of Iraq, the State of Kuwait, State of Palestine, and the Republic of Yemen and the Hashemite Kingdom of Jordan. Participants discussed the issues listed on the committee’s agenda and made necessary recommendations.

2-10 Extraordinary Session of the Council of Arab Ministers Responsible for Environment Affairs (CAMRE)
In response to an invitation by the Arab League General Secretariat (Department of Environment, Housing and Sustainable Development - Technical Secretary of CAMRE), the General Secretariat took part in the extraordinary session’s meetings, held at the Arab League headquarters in Cairo, 19 July 2008. The meeting was held to prepare for the Arab economic, social and development summit, to be held in Kuwait in January 2009.
The Council’s extraordinary session’s meetings were preceded by preparatory expert meetings on 17-18 July 2008. An extraordinary meeting of the Executive Bureau was held in the evening of 19 July 2008. The heads and members of the Arab countries’ delegates attended the council meeting with the participation of relevant Arab and regional organizations.
The council meeting began with a speech by HRH Prince Turki bin Nasser bin Abdel-Aziz, General President of the Meteorology and Environment Protection Agency, Saudi Arabia, and Head of the Council’s Executive Bureau. His speech was followed by speeches by HE Maged George, Egypt’s Minister of State for Environment Affairs, and Ms Narmin Othman, Iraq’s Minister of Environment.
The Council discussed a number of proposed topics and agreed to raise them at the Arab economic, social and development summit, as follows: • Promoting coordination mechanism among the Arab agencies concerned
with natural disasters and emergencies • An integrated waste management program in Arab countries • Operation plan of Arab environment facility
The Council resolved to submit the Ministerial Declaration on climate change to the Arab summit for approval and commission the General Secretariat to circulate the Arab Framework Action Plan for addressing issues of climate change to the Arab countries in order to study and finalize it before presenting it to the forthcoming Arab summit.
2-11 30th Oxford Seminar
The 30th Oxford Seminar was held at St Catherine’s College, University of Oxford, on 21-31 July 2008 and titled ‘Energy Perspective: New Issues and Challenges”. It was organized by Mr. Robert Mabro, Dean of the Oxford Seminar and Mr. Nadir Sultan, Director of the Seminar. The

Oxford Energy Seminar has been held annually since its launch in 1979 under the auspice of St Catherine’s College, OPEC and OAPEC. The seminar aims to enhance professional capabilities of participants, presenting view points and share different opinions of energy producers and consumers. The seminar was attended by 61 participants from 22 different nationalities, representing producing and consuming countries as well as regional and international institutions and national and global oil companies.
Many specialists in oil industries and relevant fields delivered several lectures. They discussed all aspects related to energy issues and challenges, economic, political and environmental situations and oil and gas markets in the Arab countries, China, India, Iran, Russia, Europe and the USA.
The last day of the seminar was dedicated to celebrating the 30th anniversary of launching the seminar. A number of world-reknown officials in the oil industry attended the celebration.
2-12 14th Meeting of the Climate Change Subcommittee
The General Secretariat took part in the 14th meeting of the Climate Change Subcommittee of the Permanent Arab Meteorology Committee of the Arab League Secretariat General, which was held in Cairo- Arab Republic of Egypt, 11-13 October 2008.
Dr Samir bin Abdulilah Hassan Bukhari, Assistant Deputy for Meteorology at the Presidency of Meteorology and Environment in Saudi Arabia and Chairman of the Subcommittee for Climate Change, opened the meeting. He welcomed participants and wished the meeting every success. He expressed the hope that important recommendations and decisions would be reached in order to activate the committee.
Among the participants of the meeting were representatives of meteorology facilities in Saudi Arabia, the Arab Republic of Egypt, and the State of Qatar, and Kuwait, the Republic of Tunisia, and Algeria. Delegates from some Arab and regional organizations attended the meeting. Participants focused on the following:
- Preparation for the meetings of the Conference of the Parties' 14th Session (COP-14) and in the 4th session meeting of the Conference of the Parties serving as the meeting of the Parties to the Kyoto Protocol (CMP-4), as well as for meetings of Ad Hoc Working Group on Further Commitments for Annex-1 Parties under the Kyoto Protocol (AWG) and the Dialogue on Long-term Cooperative Action to Address Climate Change, Poznan - Poland, 1 - 12 December 2008.
- Arab preparation for the Third World Conference on Climate , which will convene under the patronage of the World Meteorological Organization during the period 31st August to 4th September 2009 in Geneva.
- Follow-up developments on the activities of the Intergovernmental Panel on Climate Change (IPCC).
2-13 OPEC's Coordination Meeting in Preparation for "COP-14, and CMP-4" Meetings. In response to an invitation by the Secretariat of the Organization of
Petroleum Exporting Countries, the General Secretariat participated in the coordination meeting of Climate Change, held in Vienna - Austria, on November 12, 2008, in preparation for the meetings of the Conference of the Parties COP-14 and the Conference of the Parties to the Convention serving as the meeting of the Parties to the Kyoto Protocol, CMP-4.
Mr. Hasan Qabazard, head of the Department of Research at OPEC opened the meeting welcoming the participants. He noted that the Secretariat has been holding such meetings in advance of the annual meeting of the Conference of the Parties to the United Nations Framework Convention on Climate Change, which will be held this year in the city of Poznan-Poland, 1-12 December 2008. He pointed out that this meeting aims at coordination among the member countries on the topics on the agenda of the meetings of Poland COP-14 and CMP-4.
Then Dr. Mahendra Shah, a senior specialist in the change of land and agriculture, the United Nations Coordinator on science and public relations, (International Institute for scientific applications and analysis), delivered a lecture on the importance of agriculture and the use of a forestation and reforestation to absorb greenhouse gases, the so-called sinks.
Mr. Ramiro Ramirez, a senior environmental policy analyst at the Organization of Petroleum Exporting Countries, reviewed the latest developments in the Convention and the Protocol, as well as some of the positions of industrial and developing countries on climate change.
Mr. Aiser Atyb then reviewed the position of the Kingdom of Saudi Arabia on most important issues on the agenda of the Conference of the Parties COP-14 and the Conference of the Parties to the Convention serving as the meeting of the Parties to the Kyoto Protocol, CMP-4, and noted the need to adhere to the principles of the Convention and the Protocol and the principle of common but differentiated responsibilities.
Nineteen specialists participated in the meeting, eight from OPEC member countries attended the meeting, as follows: Algeria (2), Saudi Arabia (3), Qatar (1), Kuwait (3), Ecuador (2), Indonesia (2), Iran (1),
Venezuela (4), in addition to the participation of the Secretariat - OAPEC - (1).
Subsequently, discussions were held on the coordination of positions in the next meetings of the Conference of the Parties in Poznan - Poland, the participants reached at the end to a number of recommendations.
2-14 Forty meeting of the Executive Office of the Council of Arab Ministers Responsible for the Environment
In response to an invitation by the Arab League General Secretariat (Technical Secretary of CAMRE), the General Secretariat took part in the 40th meeting of the Executive Office of the Council of Arab Ministers Responsible for the Environment Affairs, which held at the Arab League headquarters in Cairo, 13-14 November 2008 under the chairmanship of HH Royal Prince / Turki bin Nasser bin Abdulaziz, General President of the Meteorology and Environment Protection in Saudi Arabia. In the presence of representatives of Member countries in the Executive Office (the Hashemite Kingdom of Jordan, United Arab Emirates, Kingdom of Bahrain, the Democratic People's Republic of Algeria, Saudi Arabia, Syrian Arab Republic, Qatar and the Arab Republic of Egypt), and a number of representatives of Arab and regional organizations.
Participants discussed the items on the agenda, and reached the appropriate decisions, including the adoption of the recommendations of the Fifth Coordination Meeting of member countries experts on the environment held during the period 15-16 November 2008 to serve as a basis for negotiation and coordination between Arab delegations participating in the meetings of the Conference of the Parties COP-14) and (CMP-4 ) in Poznan - Poland in 1-12 December 2008.
2-15 Meetings of the Conference of the Parties (COP-14) and the Conference of the Parties Serving as the Meeting of the Parties to the Kyoto Protocol (CMP-4)
The General Secretariat took part in the meetings of the Conference of the Parties' 14th Session (COP-14) and in the 4th session meeting of the Conference of the Parties serving as the meeting of the Parties to the Kyoto Protocol (CMP-4). It participated in the meetings of the Working Group concerned the long-term cooperative action under the Convention (AWGLCA), the 6th session of the Ad-hoc Working Group on Further Commitments for Annex I Parties under the Kyoto Protocol (AWG), the 29th sessions of the Subsidiary Body for Implementation (SBI), and the 29th session the Subsidiary Body for Scientific and Technological Advice (SBSTA), in the city of Poznan - Poland, 1-12 December 2008.
A high-level meeting of ministers and delegation heads was held on 11-12 December 2008. Representatives from about 189 nations attended the conference, in addition to delegates of international and intergovernmental organizations, NGOs, and media organizations.
Indonesian State Minister for Environment Rachmat Witoelar inaugurated the meetings of COP-14 and CMP-4. He noted that these meetings will pave the way for Copenhagen meetings in order to reach agreement to commence negotiations to conclude a convention on climate change by 2009.
Minister for Environment of Poland Mr. Machig Novstki was elected president of COP-14 and CMP-4. He spoke on the importance of the meetings of Poznan, and called on States to cooperate in order to reach concrete results on the meetings. Then Polish Prime Minister Mr. Donald Duck spoke on the global economic crisis, which should not limit States to intensify their efforts to solve the problem of climate change, and urged States to global solidarity in order to achieve this goal.
UNFCCC Executive Secretary, Mr Yvo de Boer, noted in his speech to promote the provisions of the Convention and the Protocol, and focused on the importance of the meetings of the Working Group concerned the long-term cooperative action under the Convention (AWGLCA).
Among the many decisions taken at the conference were the Adaptation Fund, reactivation of the Bali Action Plan on Climate Change, the transfer and development of technology, and other items on the agenda.
The Secretary-General of the United Nations, Mr. Kyemon, the President of the Republic of Poland, and Presidents of some other countries attended the high-level meeting of ministers and delegations heads. The oil and environment ministers then delivered speeches, followed by the heads of international organizations and bodies talks. His Excellency the Secretary-General of OAPEC Mr. Ali Abbas Naqi delivered his speech, who noted the importance of continuing all Parties to develop and implement policies and measures to mitigate climate change according to their commitments under the Convention and the Kyoto Protocol. Effort to assess adverse effects of response measures on fossil fuel dependent economies should be considered of high importance when setting targets for emission reduction commitments for Annex I Parties beyond 2012, emphasizing that policies and measures to achieve these targets will not affect negatively the sustainable development in developing countries.
COP-15 and CMP-5 will be held in Poznan, Poland, 7-18 December 2009, in the city of Copenhagen – Denmark.
2-16 1st Conference on Arab-Sino Cooperation in Energy
The General Secretariat took part in the first Conference on Sino-Arab cooperation in the field of energy, which was held in Sanya, China, 9-11 January 2008. The conference was organized by the Chinese State Development and Reform Commission (SDRC) and the Arab League General Secretariat.
The Arab side was presented by delegations of energy authorities in the Arab countries, the Arab League General Secretariat, OAPEC, the Arab Atomic Energy Agency (AAEA) and representatives of energy companies. The Chinese side was presented by Chinese State Development and Reform Commission (SDRC), the Ministry of Foreign Affairs, the Ministry of Commerce, and representatives of energy companies.
A coordination meeting for the Arab side was held on 9 January 2008 before the conference proceedings, where Dr. Saleh Al Sada, Qatar’s Minister of State for energy and Industrial affairs, spoke about the importance of the conference for Sino-Arab cooperation in energy. He said the conference would draw up broad outlines for cooperation between the two sides, one of which has the capacity to export oil and natural gas, while the other enjoys strong economic growth that boost its need for energy.
One of the most important recommendations of the Conference was the willingness of both sides to continue supporting cooperation in existing projects, to exchange new technologies for use in developing projects, and to cooperate developing in the electric power generation industry by benefiting from China's expertise in this area. They also called for exchanging expertise, transferring of energy, and protecting the environment.
The General Secretariat submitted a paper entitled "Prospects for Sino-Arab cooperation in Oil and Natural Gas until 2030: Opportunities and Challenges"
2-17 Meeting of WEC Cleaner Fossil Fuels Systems Committee
In response to an invitation by Ms Barbara McKee, Chairman of the Cleaner Fossil Fuels Systems Committee (CFFS) of the World Energy Council, the General Secretariat took part in a workshop on “ The Power of CFFS in the Middle East: Cleaner Technology for Economic Growth and Improved Environment”, which held in Abu Dhabi, on 24 January 2008.
In addition to the committee members, other participants were experts and specialists on emission and carbon capture and storage techniques from the ministries of energy and oil companies of some Arab countries and

other international institutions such as the World Bank, Shell, and the World coal Institute. At three panel discussions, nine papers were submitted. The first discussed the Middle East needs for energy and the potential of CFFS. the second examined the economics, funding and carbon markets, while the third addressed the issue of technology, infrastructure and geology. The three panel discussions focused on carbon capture and storage.
The General Secretariat also took part in the CFFS Committee Meeting, which was held on the sidelines of the workshop on 25 January 2008. Attendance was restricted to committee members.
2-18 Meeting of 81st Session of Arab Economic and Social Council
The General Secretariat attended as an observer the meeting of the 81st Session of the Arab Economic and Social Council, which was held in Cairo, 10-13 February 2008.
The meeting was attended by delegations from all Arab countries except Djibouti, Federal Republic of Comoros and Somalia, in addition to envoys from 15 Arab organizations and institutions.
There are fourteen items on the meeting’s agenda including:
1. Arab League Secretary General’s Report
2. Developments of the Great Arab Free Trade Area—key topic
3. Economic and social digest of the Council on the summit level.
4. Preparation for the Arab Economic, Development and Social Summit
5. Establishment of an Arab satellite system to monitor the Earth.
6. Proposal to establish an Arab Ministerial Council for water.
7. Perception of economic and financial aspects of the Arab- Turkey Cooperation Forum.
8. A study on the Arab Fund for Technical Assistance to African Countries (AFTAAC)
9. Call for the adoption of Arabic as a working language in the WTO.
10. Study on the treatment of free zones products in the Arab countries.
11. The Arab Authority for Civil Aviation.

12. The establishment of the Arab parliament for children.
2-19 Experts’ Meeting and Meeting of Executive Bureau of Council of Arab Ministers Responsible for Electricity
In response to an invitation by the Arab League Secretariat General (Energy Dept. – Secretariat of the Council of Arab Ministers Responsible for Electricity), the General Secretariat took part in the experts’ meeting and the meeting of the Executive Bureau of the Council of the Arab Ministers Responsible for Electricity, held at the Arab League headquarters, 5-7 February 2008.
Experts from the member Arab countries— Algeria, Bahrain, Egypt, Jordan, Saudi Arabia, Sudan, Syria, and the UAE—participated in both meetings. Other participants included the Arab Industrial Development and Mining Organization (AIDMO), the Arab Atomic Energy Agency (AAEA), the Arab Union of Producers, Transporters and Distributors of Electricity (AUPTDE), ESCWA, OAPEC, and the GCC Standardization Organization. Members of the Executive Bureau also took part in the meetings.
The meetings discussed many items, notably: 1. Preparation for the Arab Economic, Development and Social Summit 2. Arab electricity interconnection 3. Peaceful uses of nuclear energy 4. New and renewable energy 5. Cooperation with countries and regional and international organizations
and authorities 6. Supporting the electricity sector in Iraq.
The meeting recommended that the Arab Electricity Interconnection Project will be one of the main projects to be discussed at the Arab Economic, Development and Social Summit. It asserted the need for Arab countries to contribute to the expense of the Arab electricity interconnection study by utilizing natural gas based on the Riyadh Summit in March 2007.
2-20 International Energy Forum meeting Atheist
In response to invitation from His Excellency the Minister of Economic Development of Italy Mr. Pier Luigi Bersáni, the General Secretariat took part in the 11th International Energy Forum, held in Rome, Italy, 20-22 April 2008.
The meeting is primarily aims to strengthen the dialogue between oil and natural gas producers and consumers and seeks to maintain the stability in world oil and natural gas markets.
The meeting was opened by His Excellency The Prime of Minister of Italy, and was attended by 74 countries, 30 international oil and gas companies, in addition to 15 international and regional organizations.
Over four working sessions, the meeting addressed the following key themes: - Enhancing the Availability of Energy Sources. - Ensuring Investment in the Energy Sector. - Towards a Sustainable Energy Future. - Global Energy Security and Dialogue.
Minister of Energy, Economy, Industry and Technology from producing and consuming countries and the heads of delegations delivered speeches at the meeting. they emphasized the importance of dialogue between producing and consuming countries in order to enhance transparency and maintain the stability in energy markets. They also called for strengthening investment in energy sector to meet the predicted increase in global oil demand. The 12th International Energy Forum will be held in Mexico in 2010. The Third International Energy Business Forum was held on the sidelines of the IEF. It address the following key themes: • Partnership in the Energy sector. • Investments in the Energy sector. • Reducing Market uncertainty. • Technology development and human resources.
2-21 Workshop on energy Poverty in Africa
In response to an invitation from H.E. Suleiman J. Al-Herbish, Director-General of the OPEC Fund for International Development (OFID), OAPEC’s General Secretariat took part in a workshop on ‘Energy Poverty in Africa,’ held in Abuja, Nigeria, 8-10 June 2008.
The workshop aimed to focus on the shortage of energy services in Africa and its impact on hindering economic and social development. The workshop addressed many issues, including: • Integration of electricity systems and its role in Africa’s development • Energy security in Africa and industrial development

• Development of sustainable energy facilities in Africa: funding and development policies
• Partnership between public and private sectors to reduce energy poverty in sub-Saharan Africa
Representatives of OFID, OPEC, ministries of energy and finance in Nigeria and some other African countries took part in the workshop, in addition to representatives of international and regional organizations such as the World Bank, the International Monetary Fund, and development and investment funds in OPEC member countries.
2-22 Meeting of Institutions Participating in the Joint Arab Economic Report, 2008
The Arab institutions taking part in compiling the Joint Arab Economic Report, 2008, met at the headquarters of the Arab Monetary Fund in Abu Dhabi, the UAE, from 22 to 26 June 2008. Representatives attended from the Arab League, the Arab Monetary Fund, the Arab Fund for Economic and Social Development, and the Organization of Arab Petroleum Exporting Countries.
The meeting dealt with several topics including statistical aspects of the report and reviewing in detail the initial drafts of the chapters that had been circulated to the participating institutions in preparation for an initial version that would be circulated on a limited basis to the participating institutions, the Economic and Social Council, the Council of Central Bank Governors, and Arab monetary institutions.
It was agreed that a preparatory meeting for the 2009 report would be held 21-23 December 2008 at the Arab Fund for Economic and Social Development headquarters in Kuwait. Each institution would draw up a detailed outlines of the chapters it compiles for circulation to all participating institutions one month before the meeting.
2-23 39th Meeting of the Higher Coordination Committee on Joint Arab Action
In response to an invitation by the Arab League General Secretariat (Department of Arab Organizations and Unions), the General Secretariat took part as an observer at the 39th Meeting of the Higher Coordination Committee on Joint Arab Action, held at the Arab League headquarters in Cairo, 3-6 July 2008.
The meeting was mainly to discuss preparations for the Arab economic, social and development summit.
Directors and secretaries general of the joint Arab action organizations took part in the meeting, as well as Ms Mervat al-Tilawi, General Coordinator of the economic, social and development summit.
The meeting was held at two levels. The first, on 3-4 July 2008, was for technical meetings related to the agenda items, in particular preparations for the Arab economic, social and development summit. The second, on 6 July 2008, was for the Higher Coordination Committee on Joint Arab Action, chaired by HE Amr Moussa, Arab League Secretary-General, to discuss the first meeting’s results and recommendations. The second meeting discussed the Secretariat General’s memoranda on developing the work of Arab specialized organizations, the committee’s brief, and the plan for developing and enhancing the administrative, financial and structural status of Arab organizations.
2-24 Meeting of Economic and Social Council (82nd Session)
The General Secretariat took part as an observer in the meetings of the Economic and Social Council at its 82nd ordinary session at the level of permanent envoys and senior officials, which was held in Cairo, Egypt, 24-26 August 2008.
The meeting was attended by delegations from all Arab countries, except Somalia and Djibouti, and representatives from 19 Arab and regional organizations and institutions. The meeting’s agenda included 13 themes, most important was the ‘Developments of the Greater Arab Free Trade Area (GAFTA)’. Other topics were as follows:
1. Amendment of the statutes of the Arab Investment Court
2. Amendment of the statutes of the Arab Tourism Ministers’ Council
3. Position of collective Arab agreements in economic fields.
4. Canceling Iraqi debts to Arab countries.
5. Impact of global price rise of basic foods on the standard of living of Arab citizens.
6. Establishment of Arab satellite systems to monitor the earth.
7. Establishment of an Arab ministerial council for water.
8. Establishment of an Arab ministerial council for immigration and migrant affairs.

2-25 Experts’ Meeting and Meeting of Executive Bureau of Council of Arab Ministers Responsible for Electricity
In response to an invitation by the Arab League Secretariat General (Energy Dept. – Secretariat of the Council of Arab Ministers Responsible for Electricity), the General Secretariat took part in the experts’ meeting and the meeting of the Executive Bureau of the Council of the Arab Ministers Responsible for Electricity, held at the Arab League headquarters, 14-15 October 2008.
Experts from the member Arab countries-Algeria, Bahrain, Egypt, Jordan, Saudi Arabia, Syria, and the UAE-participated in both meetings. Other participants included the Arab Industrial Development and Mining Organization (AIDMO), the Arab Atomic Energy Agency (AAEA), the Arab Union of Producers, Transporters and Distributors of Electricity (AUPTDE), the General Secretariat of seven link-the Secretariat of Maghreb Committee for electricity.
The meetings discussed many items, notably:
- Preparation for the Arab Economic, Development and Social Summit - Arab electricity interconnection - Peaceful uses of nuclear energy - New and renewable energy - Scientific Seminars of the Council - Cooperation with countries and regional and international organizations
and authorities
The meeting recommended that the Arab Electricity Interconnection Project will be one of the main projects to be discussed at the Arab Economic, Development and Social Summit after updating the parts approved by the working paper submitted in this context It asserted the need for preparing a comprehensive study of Arab Electricity Interconnection with reference to the terms of reference and recommendations of the Working Group, and invite the Arab countries that have not paid their contribution in the cost of study to expedite the payment of first installment by the end of December 2008.
2-26 2nd IEA Meeting on International Energy Statistics
The General Secretariat took part in the 3rd meeting on International Energy Statistics held by the International Energy Agency (IEA) in Paris,
28-30 October 2008. Twenty organizations and institutions working in energy statistics participated in the meeting.
His Excellency the Deputy Director-General of the International Energy Agency, inaugurated the meeting, welcoming the participating organizations. He highlighted the importance of cooperation among producers and consumers in general and in energy data in particular because of its importance of enhancing transparency.
The meeting discussed ways to improve energy statistics on one hand, and the terms and definitions related to energy sources particularly those associated with the joint oil data initiative (JODI) on the other hand. In this context, the definitions of products such as oil, gas and renewable energy, electric power were addressed first, and secondly the definitions of flows (supply, demand, consumption and inventory). In light of the debate on the subject, the terms and definitions that have been agreed upon will be circulated to the organizations.
2-27 Preliminary Meeting for Preparing the Joint Arab Economic Report, 2009
The General Secretariat took part in the preliminary meeting for preparing the Joint Arab Economic Report, 2009.
The meeting was held at the headquarters of Arab Fund for Economic and Social Development in Kuwait, 21-23 December 2008. Representatives from the Arab League, the Arab Monetary Fund and Arab Fund for Economic and Social Development, OAPEC participated in the meeting.
Four main items were discussed at the meeting. First was the Joint Arab Economic Report 2008, second was preparation of the 2009 report, third was statistical data for the 2009 report, and fourth was development of the report.
III. ENERGY RESOURCES MONITOR-ARAB AND INTERNATIONAL
In 2008 the General Secretariat continued to publish its quarterly bulletin entitled Energy Resources Monitor-Arab and International. The bulletin covers developments in oil and gas exploration activities in OAPEC and non-OAPEC Arab states, as well as other countries. It highlights new technologies based on data published in Arab and international periodicals.
IV. The Promotion OF SCIENTIFIC RESEARCH At the beginning of 2007 the General Secretariat announced the
research topic selected for OAPEC Award for Scientific Research 2008. It is ‘Carbon Dioxide Capture and Storage.’ The announcement was published in OAPEC’s Monthly Bulletin, OAPEC’s Journal "Oil and Arab Cooperation" and other collaborating periodicals. It also posted the announcement on OAPEC’s website and circulated to member countries, research centers, and universities. The deadline for submissions was 31 May 2008.
Pursuant to the provisions of OAPEC Award for Scientific Research, the Secretary-General of the Organization Mr. Ali Abbas Naqi issued resolution No. 15/2008 dated 13/05/2008 regarding the formation of the jury to assess the submitted researches for OAPEC scientific award in 2008 entitled " Carbon Dioxide Capture and Storage ", under his chairmanship and membership of: - Professor Farid bin Saeed Al-Asali- Petroleum Policy Adviser - Ministry
of Petroleum and Mineral Resources - Saudi Arabia - Dr. Zahra Al-Khatib - Director of Technology - Development of new
business and technical management - Shell Exploration and Production - Dubai - United Arab Emirates .
- Dr / Mohamed Mukhtar Lababidi - Director of the Department of Technical Affairs - OAPEC
- Dr / Jamil Mohamed Tahir - Director of economic management – OAPEC.
Jury met in Cairo on 14/10/2008 (Dr. Zahra Al-Khatib, the non-attendance, apologized for emergency reasons.
The Committee discussed the evaluation reports submitted by the gentlemen of arbitrators, and after exchanging views and considering the observations of Committee's members following findings: First prize value KD 5000 awarded and divided equally between: A) Research (8) submitted by Mr. Jamel Harbi from the Democratic
People’s Republic of Algeria.. entitled: "CO2 CAPTURE AND SEQUESTRATION" got 87 out of 100.
B) Research (3) submitted by Mr. Wisam Qassem Al Shaleji from the Republic of Iraq entitled " CAPTURING & STORAGING THE CARBON DIOXIDE GAS" Received 85 out of 100.
Second prize value KD 3000 awarded and divided equally between:

A) Research (14), submitted by Dr. Asma Ali Aba Hussein from the Kingdom of Bahrain entitled "OUTLOOK ON THE PROSPECTS FOR CARBON DIOXIDE CAPTURE AND STORAGE IN ARAB COUNTRIES", got 78 out of 100.
B) Research (2) submitted by Mr. Omar khaled Al Haj from the Syrian Arab Republic entitled " CARBON DIOXIDE CAPTURE AND STORAGE ", received 76 out of 100. The research topic for the OAPEC Scientific Award for the year 2010 is "Results of New Technologies Application in Petroleum Exploration and Production in Arab Countries, And Its Economics." as adopted at OAPEC's 121st Executive Bureau Meeting held in Cairo,12 October 2008.
It is noteworthy that the Ministerial Council of the Organization at its 78th meeting (representatives level) in Cairo on 28 May 2008 had passed a resolution to amend the value of first prize from (5000 KD) to become (7000 KD), and the second prize from (3000 KD) to (KD 5000) effective in 2010.
V. SUPPORTING ACTIVITIES 1. Media Activities
The General Secretariat continued its media activities in the following areas: 1-1 Editing, Printing, Publishing, and Distribution
The General Secretariat continued to publish OAPEC’s books and periodicals. This involved editing, proofreading, translation, design, printing, publishing, and distribution. Table (5-1) lists the books and periodicals published by the General Secretariat and the number of copies printed and distributed in 2008. 1-2 Press and Media
The General Secretariat issued several press releases on the Organization’s activities, such as meetings of the Ministerial Council and Executive Bureau. Some local and Arab newspapers published articles on the Organization’s activities and its role in coordinating the work of member countries and promoting joint Arab action according to Arab and international circumstances and developments. Moreover, the General Secretariat continued to monitor what local, Arab, and international newspapers publish on energy affairs and to archive important news and
features on oil, economics, the environment, and other topics of general interest to member countries.
1-3 33rd Arab Book Fair The General Secretariat participated in the 33rd Arab Book Fair, which
was held in Kuwait, 19-29 November 2008, sponsored by the General Secretariat of Kuwait’s National Council for Culture, Arts, and Letters.
Some 618 publishing houses from 13 Arab and 10 non-Arab countries took part in the fair, in addition to six Arab organizations. They included the Arab Center for Educational Research in the Gulf States (Kuwait), the Arabization Center for Medical Science, the Arab League, the Organization of Arab Petroleum Exporting Countries, Arab Book Federation (Syria), the Secretariat General of the Gulf Cooperation Council (Saudi Arabia), and the Arab Center for Research and Documentation (Lebanon).
2. Administrative and Financial Activities
2-1 Evolution of the Administrative Structure
At the end of 2008 there were 56 employees at the General Secretariat, of whom 24 were professional staff and 32 general staff. Table (5-2) shows the number of staff at the General Secretariat in the period 1968-2008.
2-2 Evolution of Actual Expenditure
The General Secretariat’s expenditure in 2008 totaled KD1,627,000.1 Table (5-3) shows the evolution of the General Secretariat’s actual expenditure in 1968-2008.

TABLES OF CHAPTER TWO
PART TWO

Title of Publication No. of Editions
No. of Copies
Total Copies Printed
Copies Distributed
Total Copies Distributed
Periodicals
- OAPEC Secretary General's Annual Report 2007 (Arabic) 1 800 800 790 790
- OAPEC Secretary General's Annual Report 2007 (English) 1 800 800 750 750
- OAPEC Annual Statistical Report 2008 1 300 300 200 200
- OAPEC Monthly Bulletin
* Arabic/English (1 - 12) 11 1200 13200 13000 13000
- Oil and Arab Cooperation : issues (124-127) 4 750 3000 550 2200
- Energy Resources Monitor - Arabic and International 4 300 1200 270 1080
Publication Issued and Distributed by the General Secretariat in 2007
Table 5-1

Year Professional Staff General Staff Total
1968 4 7 111969 10 14 241970 12 22 341971 10 23 331972 9 24 331973 11 23 341974 15 33 481975 31 48 791976 37 58 951977 40 70 1101978 41 71 1121979 45 79 1241980 51 81 1321981 47 87 1341982 44 90 1341983 51 88 1391984 49 86 1351985 50 82 1321986 43 75 1181987 24 51 751988 18 43 611989 23 39 621990 23 41 641991 22 39 611992 21 36 571993 22 33 551994 21 28 491995 21 29 501996 21 30 511997 19 32 511998 20 30 501999 17 36 532000 22 29 512001 21 31 522002 21 32 532003 22 30 522004 20 29 492005 22 29 512006 20 31 512007 22 31 532008 24 32 56
Table 5 - 2General Secretariat Employees, 1968 - 2008

Year Wages & Salaries
General Expenditure
Studies, Training & Information
Total
1968 9 18 - 271969 67 52 18 1371970 97 75 55 2271971 107 50 25 1821972 126 63 17 2061973 108 66 230 4041974 152 140 50 3421975 343 335 81 7591976 525 306 434 12651977 694 329 367 13901978 807 335 467 16091979 929 401 432 17621980 1133 415 437 19851981 1277 461 559 22971982 1546 527 588 26611983 1763 547 634 29441984 1812 515 508 28351985 1818 447 422 26871986 1697 413 286 23961987 1439 385 190 20141988 799 244 122 11651989 733 242 145 11201990 771 250 141 11621991 693 276 87 10561992 734 322 114 11701993 765 327 118 12101994 718 282 127 11271995 709 380 140 12291996 725 370 140 12351997 725 374 148 12471998 735 385 140 12601999 712 397 127 12362000 799 394 138 13312001 886 384 141 14112002 885 383 146 14142003 874 394 154 14222004 762 386 147 12952005 928 396 148 14722006 837 402 206 14452007 1007 437 183 16272008 1046 482 196 1724Total 33,292 13,387 8,808 55,487
Table 5 - 3General Secretariat Actual Expenditure by Budget Category,
1968 - 2008( Thousand Kuwaiti dinars )

CHAPTER THREE
OAPEC-SPONSORED VENTURES
OAPEC’s sponsored ventures continued in 2008 to optimize the investment opportunities in oil and gas markets, provided by the unprecedented rise in oil prices until the mid-2008, and accompanying availability of liquidity. This contributed to expanding their capacity and enhancing the effectiveness of their activity at various levels. It was not only the favorable situation of the oil market alone that made these ventures achieve positive results, but also the effectiveness of the administration. This enabled the OAPEC ventures to exploit their capabilities and expertise, in the face of competitions on one hand, and in dealing with global financial crisis, which has beset the world economy since the mid-2008 on the other hand.
That was evident during the second half of 2008, when the decline in global oil demand led to a sharp drop in oil prices. This caused a slowdown in the implementation of a number of oil projects, thereby forcing the petroleum exporting countries to reduce their output. Hence, in Experience management enabled the OAPEC ventures to address the real challenges.
Economic growth during the past five years (2004-2008) in member countries in particular and in the world as a whole, had reflected positively on OAPEC’s sponsored ventures, as they sought to reap the benefits of positive developments in the oil industry. It enabled them to strengthen their activities in the areas of their interest, namely investment in the energy sector (for APICORP) and maritime oil transport market (for Tanker Company), and building and ship repair (for ASRY), as well as in the drilling and geophysical exploration (for the subsidiaries of the oil company).
On the other hand, OAPEC’s sponsored ventures were not in a most to the negative effects of the geopolitical factors affecting the Arab region over the past few years. Such factors further contributed to slowing the
growth of some activities which were already facing local, regional or international obstacles.
In recent years, most OAPEC’s sponsored ventures have made every effort to take advantage of the available opportunities in order to exercise their activities and fulfill their assigned objectives. That was reflected in their achieving good corporate results.
The OAPEC ventures that faced geopolitical barriers preventing them from playing their desired role sought to overcome those difficulties in order to limit their negative impact. This was aided by the positive developments in the level of cooperation and coordination among OAPEC- sponsored companies, both in implementing some projects or in providing financial and technical support to each other. This despite the fact that OAPEC sponsored ventures operate independently each through its own board of directors which is responsible for taking decisions and setting development plans.
The ultimate goal of OAPEC- sponsored ventures is to work hard, compete, and maintain good results. The support of member countries for these ventures, is a major guarantee for success.
It is the hopeful OAPEC- sponsored ventures hopes that they receive more support through the opening of Arab markets for their activities, at least a competitive on basis, if not on a preferential basis of preference.
The following is a brief presentation on the activities of each venture:
MARITIME PETROLEUM TRANSPORT COMPANY (AMPTC)
The Arab Maritime Petroleum Transport Company (AMPTC) was established in Kuwait on 6 May 1972 and commenced its activities on January 1973, with an authorized capital of US$200 million and paid-up capital of US$150 million .
The shareholding in AMPTC are all member countries except Syria, and the objectives of the company are to own, operate and charter a fleet of crude oil and oil products tankers.

The Activities of AMPTC in 2007
As a result of the dedicated efforts of all employees, AMPTC was able to bring it’s relatively limited number fleet in optimal operating level in the global market of maritime oil transportation in 2007 and the first half of 2008, which characterized by fluctuations and highly competitive. AMPTC was able to achieve attractive, stable and persistent financial returns which have contributed firstly in repayment of the company’s obligations to financial institutions and creditor banks, and secondly in supporting and strengthening the financial position of the company.
AMPTC continued its following-up the construction of two liquefied gas carriers in Hyundai yard with capacities of 82 thousand cubic meters each, and two clean products carriers with capacities of 112 thousand tons each which will be delivered during the last quarter of 2008.
The company management is always keen to follow and apply all international laws and legislation related to management systems of the ships, limiting environmental contamination, and safety and quality systems to keep pace with international requirements of the International Maritime Organization (IMO) and the Organization for Standardization (ISO) in addition to the requirements of the major international oil companies such as the self-verification (TMSA). AMPTC was able to maximize the return on joint ventures with oil companies and authorities in member countries, which led to a good operating results during this period.
The charter rates were stable at acceptable levels for most carriers in 2007 and the second half of 2008, but these levels were less than the one achieved during the previous years. However, high demand for carriers during November and December 2007 had prompted charter rates to jump to high levels and thus maximize the returns of tankers owners which operate through time charter during that period. The first half of 2008 was characterized by the stability with existence of some temporary surges in charter rates.
It’s worth mentioning that the implementation, without exception, of strict new international legislation in regard to reducing the pollution and raising safety standards in high seas on one hand, and the insistence of oil importers to lease new and single-hull carriers on the other, led to a perfect balance between the supply and demand for carriers. This in turn led to stabilize charter rates at levels that enable its owners to achieve profits.

Moreover, AMPTC continued to implement its ambitious program that targeted the development and renewal of its fleet in order to be able to compete in the global maritime transport market. The company also has stepped up its contacts and visits to oil and gas marketing divisions within and outside the member countries, as well as with tenants. This done in order to familiarize them with what is being done in the field of construction of two liquefied gas and two clean products carriers with capacities of 82 thousand cubic meters each, and112 thousand tons for each respectively. By taking these steps, AMPTC is attempting to provide work opportunities of the tankers before the handover in the fourth quarter of 2008.
The company also continued its partnership with Saudi Aramco in implementation the contract related to carrying and providing gas to the Egyptian Authority and the Iraqi oil company SOMO. This partnership has good earnings which reflected positively on the financial position of the company.
The Company's Financial Results for 2007
At the end of 2007, the company was able to achieve net profit amounted to $40.627 million, the actual income generated from vessels rental reached $ 55.643 million, while the cost of operating the tankers (without depreciation) was $ 15.377 million. Total profits of the fleet operation, after depreciation, were $29.012 million, and profits of supply and transport liquefied gas to the Egyptian Authority for the oil company SOMO were $ 21.532 million.
As of 31/12/2007, the revenue not related to the fleet which include returns of deposits and current accounts in banks amounted to $2.417 million, while expenses relating to the operation of tankers which include the returns on loans financing amounted to $4.090 million.
Financial Results for the First Half of 2008
During the period January - September 2008, the financial results of the company show that the volume of financial activities in addition to the rights of the shareholders had reached $820 million, and achieved a net profit of $29 million.
II. THE ARAB SHIPBUILDING AND REPAIR YARD COMPANY (ASRY)
The Arab Shipbuilding and Repair Yard (ASRY) was established on 8th December 1973 with a fully paid-up capital of US$340 million (issued

and paid-up capital amounted to US$170 million). The objectives of ASRY cover building, repair and maintenance of all types of ships including tankers and other marine transport vessels that are related to the shipping of hydrocarbons. The headquarters of the company was located at Al-Manama, Bahrain with, Iraq, Kuwait, Libya, Bahrain, Qatar, Saudi Arabia, and UAE as shareholders.
The activities of ASRY in 2007
The year 2007 was a successful for ASRY, the company was able to achieve the best results in its history, and that’s due to the sincere efforts of its board, executive management and all staff in addition to its agents around the world.
Despite the fierce competition between the major ship repair yards and the entering of new yards in the Far East, the year 2007 was characterized by an abundance of repaired or booked oil tankers in ASRY yards, many of which were large-sized carriers.This will keep ASRY’s position as one of the largest companies in the world.
ASRY was able to achieve new revenues record which generated from repairing 145 ships compared to 139 ships in 2006. During the year ASRY received a total of 418 order compared to 462 in 2006. Throughout the year the company once again received a good treatment in the Arab market due mainly to the strong support received from the Kuwait Oil Tanker Company, National Drilling Company and National Petroleum Construction, both of Abu Dhabi, and Saudi Aramco and Bahraini Yukomarin. All these companies are greatly valued by ASRY.
During the year 2007 ASRY became able to strengthen its position in repairing the drilling rigs and offshore vessels, which serves the oil and gas industry via a series of important contracts. This includes the renewal and improvement of a major drilling platform "Albzum" of the National Drilling Company of Abu Dhabi and the platform ARB - 1 of Saudi Aramco. The company plans to expand its activity in this area by establishing a new section devoted to repair the offshore vessels and signing new contract with the British company, based in State of Qatar.
The number of offshore drilling rigs that have been repaired was 19 compared with 15 in 2006.
The work continued in the ambitious two new slipways project which cost about US$ 20 million, this project will enable ASRY to receive a greater number and different types of ships. These two new slipways are the largest in the Arab world and one of the largest in the world. The two slipways have entering into operation stage in June 2008, but the official
opening of the project was in October 2008. Further facilities have been built with cost of more than 3.2 million dollars. The Company's Financial Results for 2007
The actual results for 2007 are very encouraging as it hit the net operating income of U.S. $ 170 million, up 21% from 2006 levels, which amounted to US$140 million. The total operating profit reached US$ 45.6 million, compared with US$ 22.7 million in 2006. Net profit, after taking into account depreciation, reached US $ 39.3 million in 2007, a 137% over the previous year's profit of US $ 16.6 million.
The net sales in Arab market reached to US $85 million compared with US $79 million in 2006. ASRY achieved a net sales of US $80 in world market compared with $ 58 million in 2006.
Training
In 2007 the company has continued to implement its plans for the development of Arab employees, the objectives of those plans were to raise the Arabian employment rate, and to employ more Arab trainees, and to improve the quality of performance and skills development and promotion of its staff. The training included multiple aspects of the company needs in technical, administrative areas. The percentage of Arabization reached 56% in 2007.
The number of Arab employees increased from 779 to 801 employees. The number of permanent employees in the 31st of December 2007 was 1438 employees. The company also employed 124 temporary staff.
ASRY organized various training programs for senior and middle management supervisory. ASRY conducted 144 professional training courses and plenary sessions for its staff , over 1018 employees involved in these programs.
The Company's Activities in the First Half of 2008
There were 63 vessels repaired at the end of June 2008 compared with 72 for the same period of last year. The number of specifications received by the company during this period, came to 226 compared with 218 standard specification for the same period of 2007. Again the International markets have been successful over the first half of the year with 38 vessels repaired including 9 Greek ships, 10 Norwegian ships, 3 Brazilian vessels, 7 from U.S and 3 British ships.
Similarly, the Arab market had 25 vessels repaired. Among them, there were 12 Saudi Arabia, two ships each from Kuwait and UAE, and 9 Bahraini ships.
The outlook indicates a continuous of high work and good prices in the coming months, this will make ASRY enjoys more business and achieving good operational and financial results.
Financial Results for the First Half of 2008
In the first half of 2008, Net operating income amounted to US$ 105,707,000, compared with US$85,906,000 in the same period of 2007.
The company's operating profit amounted to US$ 37,076,000 compared with US $ 16,786,000 for the first half of 2007, and net profit (after taking into account depreciation) amounted of US$ 32,404,000 compared with US$13,756,000 in first six months of 2007.
III. THE ARAB PETROLEUM INVESTMENTS CORPORATION (APICORP)
The Arab Petroleum Investments Corporation was established in the city of Khobar, Saudi Arabia on 4 September 1974, with all OAPEC member countries as shareholders. The authorized capital of the Corporation was U.S. $ 1200 million, and fully paid-up capital of U.S. $ 550 million. The prime objective of APICORP is to participate in the equity, as well as the debt financing, of projects in the petroleum industry at large. These include all businesses which are based on the development, processing or transportation of the products of the oil and gas industry and its downstream derivatives.
The Activities of APICORP in 2007
Arab Petroleum Investment Corporation (APICORP) continued to intensify its following-up of the performance of existing projects in order to improve the revenue and strengthen their competitiveness on one hand, and to over come the exceptional difficult circumstances which faced in recent times on the other. APICORP also followed-up the projects under construction to make sure they completed within the specified time framework and at approved investment cost.
The company also continued its efforts to contribute in direct investment opportunities in the development of appropriate and economically viable long-term petroleum projects which need several years prior to the commencement of profits and cash flows that serve as a regular source of income for shareholders. Equity Contribution to Capital Projects
The company's efforts resulted in the addition of a new project to its portfolio investment in the first half of 2007. APICORP participated in the capital of Egyptian Agrium Nitrogen Products Company (EAgrium) with 7%.EAgrium project is under construction in the industrial city in Damietta port in the Arab Republic of Egypt. The project consists of two identical and integrated ammonia and Urea units.
APICORP adopted a new strategy which calls for the expanding of its activities in geographical terms, and in all industry sectors. The focus will be on oil service projects and Independent Power Generation Plants projects (IPP). APICORP will also search for promising investment opportunities outside areas of concentration (Saudi Arabia and Egypt) to include other countries in the Arabian Gulf region and Syria, Libya, and Algeria.
During the past year, a team from APICORP visited Libya, Algeria, and Oman to witness the developments and to identify sectors and projects that deserve attention.APICORP also looking forward to invest effectively in Iraq when security conditions improve. The developments in APICORP portfolio of investments contributions in 2007 and the first half of 2008 were as following: * The number of operating rigs in the Arab Drilling and workover
Company (ADWOC) increased to 17 rig after the purchase of two new rigs. The company was able to operate all rigs at maximum capacity (100%) through the yaer 2007. In the first quarter of 2008, new rig put into work and is expected the arrival of four additional chartered rigs to bring the total to 22 rigs in 2008.
* The Tankage Méditerranée (TANKMED) for the first time since the start of its activities in 1985, distributed profits (10% of the capital) to shareholders. TANKMED was able to fully recover the capital paid during 2007 and to be able to extinguish the equity loans by end of the year. The expansion project of TANKMED (addition of five storage tankers for white oil products with a total capacity of 104.6 thousand cubic meters and a cost of 18.4 million Tunisian dinars) is expected to be completed in early 2009.

* The withdrawal of the foreign partner (Halliburton for Petroleum Services) from The Arab Geophysical Exploration Services Company (AGESCO) and the transformation of its share to the other partners. AGESCO and its partners will endure any previous or future obligations associated with participation of Halliburton. As a result, the share of APICORP in AGESCO's capital jumped to 16.67%.
* The Saudi European Petrochemical Company (Ibn Zahr) is constructing a third polypropylene production line with a capacity of 500 thousand tons/year and a cost of $ 1.2 billion (including the production of propylene). It is expected to go on stream by the end of 2008. With this production line, Ibn Zuhr will be the largest PP producer in the Arab region, with a total capacity of 1.1 million tons/year.
* The sale of the entire remaining shares of Jordan Phosphate Mines Company before the end of 2007, APICORP has made capital gains amounted to 700 thousand dollars.
* Alexandria Carbon Black Company (ACBC) adopted a new expansion project (the production line VI) with capacity of 122 thousand tons per year at a total cost of about US$ 145 million.
* APICORP participated in the capital of Egyptian Agrium Nitrogen Products Company (EAgrium) with 7%.The Corporation was represented in the membership of company's Board Council.
* With regard to the Egyptian Bahraini Gas Derivatives Company (EBGDCO), a convention on the right to use the land and the terminal for exporting propane product has been signed by the Egyptian General Petroleum Corporation (EGPC), in April 2007. In November 2007, all the procedures and requirements for official registration of the company were completed, and as a result, the meeting of the Constituent Assembly of the company was held in February 2008. It was planned to award contracts for construction and design during the first quarter of 2008, but the claim of the Egyptian General Petroleum Corporation to change the price of gas feedstock has delayed the start of the project. The partners are expected to reach a new agreement on the price of gas feedstock with the Egyptian General Petroleum Corporation during the third quarter of 2008 in order to sign the finance agreement and to begin awarding contracts for the implementation and construction.
As a result of improved financial results for most of the contributions of the portfolio, the net book value of the APICORP investment portfolio reaches US$ 343.3 million at the end of 2007compared to $ 256.7 million at the end of 2006, an increase of 33.7%. The increase in net book value of the portfolio continued to stand at US$ 362.1 million at the end of June 2008.
Project and Trade Finance
2007 has set up another historical record for the project and trade finance activities at APICORP in terms of income, business volume and advisory and arranging mandates. In addition, the involvement and know-how in Islamic Finance has increased, both for project finance and trade finance.
The Corporation has closed in 2007, 28 transactions with underwriting and final take commitments amounting in aggregate to US$ 1.9 billion compared to 20 transactions and final take commitments amounting in aggregate to US$ 1.3 billion in 2006. The net income derived from the activity of project and trade finance for 2007 has reached US$ 23.9 million, after US$ 18.8 million in 2006.
It should be noted that the Corporation has participated in most of important financing operation in the Arab region during the year.
Financial Results for 2007
APICORP’s operations in 2007 reported a net income of US$79.74 million, which represents a 56% increase over the US$50.98 million reported in 2006. while total operations revenues , after deducting the cost of financing, amounted to US$ 94.20 million, compared with US$68.72 million in 2006.
On the recommendation of the Board of Directors at its meeting held in Bahrain, in April 2008, the General Assembly of APICORP has authorized the distribution of US$ 20 million as cash dividends to the shareholders for the year 2007 in support of the financial position of the Corporation. In addition, the Corporation transferred U.S $ 8.20 million to the Legal reserve and U.S $ 51.54 million to the Corporation's General reserve.
Assets, Liabilities and the Rights of Shareholders in the End of 2007
Total shareholder’s equity rose by 14% to US$1.02 billion, from US$ 896 million in 2006. Further, total assets also increased to US$ 3.573 billion in 2007, a 37% increase from the 2006 level of US$2.635 billion. The increase in income-producing assets accounted for the largest percentage of the increase in the volume of assets amounting to U.S. $ 3.511 million compared to $ 2.562 million dollars by the end of 2006, an increase of 37%.
On the liability side, the base of external funding jumped to U.S. $ 2.511 million by the end of 2007 compared to US$ 1.710 million by the end

of 2006. The increase in the external financing was mainly due to the access to more corporate deposits, in addition to the increase in long-term funding by U.S. $ 100 million.
Economic Studies and Researches
The Board of Directors, on its 6th April 2007 meeting, approved the establishment of a new Department of Economics and Research to cater for the economic research and studies that support the Corporation towards achieving its goals and objectives, further enhancing APICORP’s reputation as a leading source of research in the Middle East and the North African region.
The Department of Economic Studies and Research, which took over the functions of the Research Unit of the Department of Trade and project finance, conducted number of studies and research papers in the area of investment policies relating to the objectives and activities of the Corporation, and continued to prepare and distribute its monthly economic Bulletin, which became one of the reliable information and knowledge resources inside and outside the Corporation.
Information Systems Management
In the period from the beginning of 2007 until mid 2008, the Department of Information Systems developed and updated its operating systems and related infrastructure in order to upgrade their performance. It also applied the rules and procedures for the protection of information systems and equipment through the use of one-of-the-art systems based on the Bluecoat. Further the Department has been developing and upgrading of information systems to protect a network from the risks faced by institutions that rely on information technology in the performance of its core functions.
Personnel and Training in 2007
The Corporation continued to exert efforts to develop the skills and capabilities of its personnel. The Corporation plans to develop the skills of its current staff by their continuous participation in intensive and short courses in various fields, especially banking, petroleum, communication and computing in order to keep up with rapid technological changes. It also plans to train new Arab graduates who join the Corporation immediately after graduation both locally and abroad. Such training would enable them to acquire practical and applied knowledge in the fields in which the

Corporation participates. It would also complement the knowledge they acquired in their academic studies.
The Corporation had 114 employees, most of whom were Arab nationals. There were 82 Arab employees and 32 non-Arab employees. The year 2007 and the first half of 2008 witnessed an increase of non-Arab staff joining the Corporation.
Project and Trade Finance Activities in the First Half of 2008
Project and trade finance activities maintained its momentum in the first half of 2008. The Corporation participated in arranging loans totaling about US $13.2 billion, with its own arranging fee amounting to $750 million. The loans were granted to petroleum and petrochemicals projects in some countries holding shares in APICORP, namely Saudi Arabia, Qatar and Egypt and the United Arab Emirates. These projects included the purchase of oil and gas tankers, building petrochemical and aluminum plants, or for financing Arab oil exports to foreign countries.
Financial Results for the First Half of 2008
In the first six months of 2008, APICORP was able to achieve net income higher than the one achieved in the same period in 2007. This was due to unprecedented results of APICORP investment portfolio, where the size of dividends received was the highest since the founding of APICORP, coinciding with the rise in income loans and trade finance.
US$ Million Item Actual Estimates Actual 2008 2008 2007 Net revenues in the first six months 59.4 50.6 47.0
Total assets, deductions and shareholders’ equity as of 30 June 2008
As of 30 June 2008, the Corporation’s total assets amounted to $3,512 million, compared with $3,753 million as of 31 December 2007. This decline is attributable to the sale of part of securities portfolio to meet the obligations of financing the projects and the liquidity crisis in global financial markets. While the short-term sources of funding increased to U.S. $ 1,700 million compared to U.S $ 1.303 million in December 31, 2007, despite the current credit crisis. Shareholders’ equity also rose to U.S. $1,037 million, compared with U.S $1,020 million as of 31 December 2007.
IV. THE ARAB PETROLEUM SERVICES COMPANY (APSCO)
The Arab Petroleum Services Company (APSCO) was established on the 23th November 1975 as a holding company based in Tripoli, Libya, with all OAPEC member countries as shareholders. The company’s authorized capital was 100 million Libyan dinars (LYD), and subscribed and paid-up capital was LYD15 million. APSCO’s goal was to provide petroleum services which used to be monopolized by major oil companies that owns the techniques and expertise and possessed the skills in that field. APSCO’s is the sole owner of the Arab Well Logging Company (AWLCO), and is a 40% shareholder in both the Arab Drilling and Workover Company (ADWOC) and the Arab Geophysical Exploration Services Company (AGESCO).
The Activities of APSCO in 2007
APSCO decided to focus in the time being on improving and developing the activities of the existing specialized companies, namely:
1. Arab Drilling and Workover Company (ADWOC)
2. Arab Well Logging Company (AWLCO)
3. Arab Geophysical exploration Services Company (AGESCO)
As well as expanding through them and studying the possibility of opening branches for some of them in some member countries.
APSCO’s Financial Results in 2007
Total revenues of Arab Petroleum Services Company (APSCO) amounted to 3,998,980 Libyan Dinar in 2007. Net profit, after deducting administrative expenses of LYD 1,876,350, and deducting the amount of LYD 160,830 amendments of previous years, reached 1,970,800 Libyan Dinar. . This comprised 10% or LYD 1,970,800 in the legal reserve, and LYD 1,773,720 as retained profit. Total retained profits became 4,921,129 Libyan Dinar.
The Company's Activities in the First Half of 2008 APSCO continued to monitor and support its three affiliated
companies which are: Arab Drilling and Workover Company (ADWOC), Arab Well Logging Company (AWLCO) and the Arab Geophysical Exploration Services Company (AGESCO). APSCO
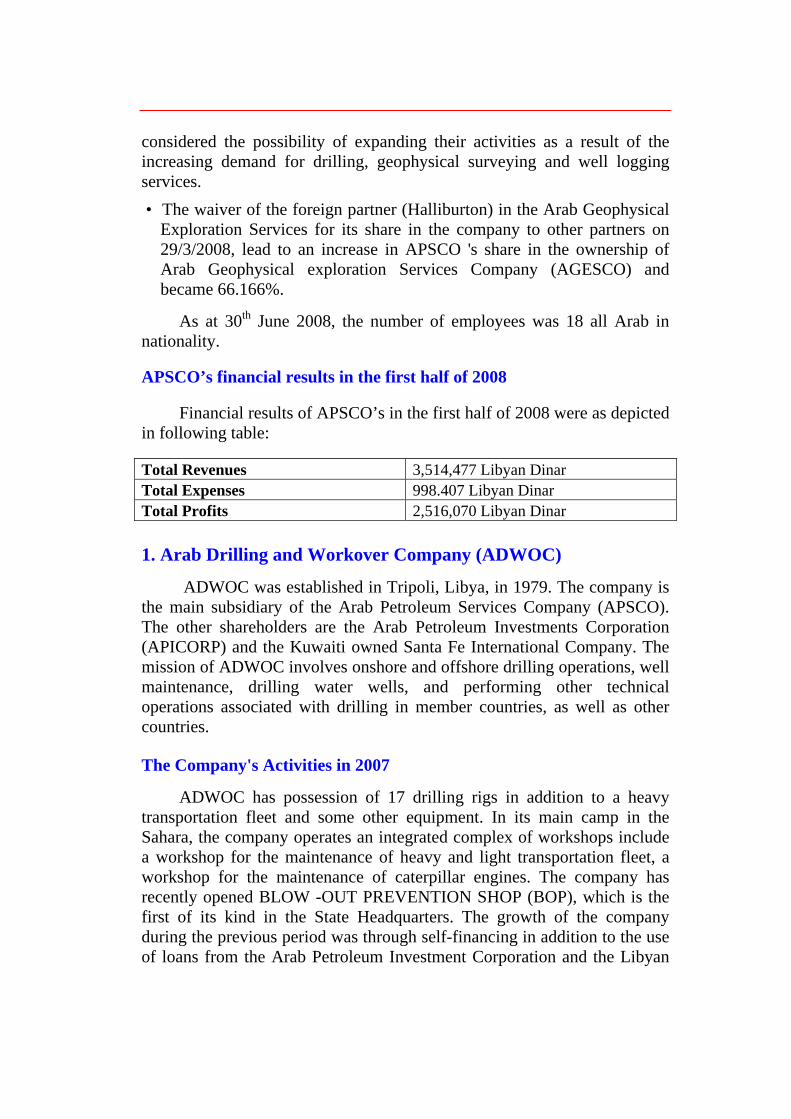
considered the possibility of expanding their activities as a result of the increasing demand for drilling, geophysical surveying and well logging services. • The waiver of the foreign partner (Halliburton) in the Arab Geophysical
Exploration Services for its share in the company to other partners on 29/3/2008, lead to an increase in APSCO 's share in the ownership of Arab Geophysical exploration Services Company (AGESCO) and became 66.166%.
As at 30th June 2008, the number of employees was 18 all Arab in nationality.
APSCO’s financial results in the first half of 2008
Financial results of APSCO’s in the first half of 2008 were as depicted in following table:
Total Revenues 3,514,477 Libyan Dinar Total Expenses 998.407 Libyan Dinar Total Profits 2,516,070 Libyan Dinar
1. Arab Drilling and Workover Company (ADWOC)
ADWOC was established in Tripoli, Libya, in 1979. The company is the main subsidiary of the Arab Petroleum Services Company (APSCO). The other shareholders are the Arab Petroleum Investments Corporation (APICORP) and the Kuwaiti owned Santa Fe International Company. The mission of ADWOC involves onshore and offshore drilling operations, well maintenance, drilling water wells, and performing other technical operations associated with drilling in member countries, as well as other countries.
The Company's Activities in 2007
ADWOC has possession of 17 drilling rigs in addition to a heavy transportation fleet and some other equipment. In its main camp in the Sahara, the company operates an integrated complex of workshops include a workshop for the maintenance of heavy and light transportation fleet, a workshop for the maintenance of caterpillar engines. The company has recently opened BLOW -OUT PREVENTION SHOP (BOP), which is the first of its kind in the State Headquarters. The growth of the company during the previous period was through self-financing in addition to the use of loans from the Arab Petroleum Investment Corporation and the Libyan
Arab Foreign Bank, both has contributed with number of loans that devoted to the purchase of new rigs and other equipment.
Since the establishment ADWOC has achieved a very good operation rate of its drilling rigs and in most cases amounted to more than 90%.
Training and Manpower
The number of employees in 2007 was 1298, the Arab employees constituted approximately 78% or 1016 employee. Foreign employees represented 4% of the Company’s overall workforce.
The Department of Training put into action a training plan for new trainees in order to meet the high and increasing demand for technical manpower and to meet the company's expansion plan in the future. Training Department has prepared a number of internal and external courses to familiarize the trainees with the nature of their work, especially in terms of safety precautions, and the development of a large number of drilling rigs' managers and in the field of contraception and control of the explosions on the wells. The number of trainees attending these sessions was 39.
Financial Results in 2007
The financial results of the company during the 2007 were better than expected. Net Profits in fiscal year ended in 31st December 2007 amounted at US$ 16,670,317. This level was higher than the expected in the budget (US$14,938,000) due to the rise of chartering prices and the entry of rig No. 19 to operation into operation.
The Company's Activities in the First Half of 2008
The first half of 2008 has witnessed increased activities exceeded ADWOC’s expectations, the operation rate of the rigs reached 100%. As a result of the lack of vacant rigs, ADWOC hold to a series of rental agreements of drilling rigs.
The first half of 2008 Also witnessed the entry of rig No. 20 into operation with a one-year contract and option of renewal with Vepa company (Heroj).
Financial Results in the First Half of 2008
The company has achieved an income of U.S. $ 51,755,097 during the first half of 2008, while expenditures amounted to U.S. $ 42,146,569; this led to achieving a net profit of U.S. $ 9,608,528.
Training During the First Half of 2008
During the first half of 2008 the company organized one session in controlling the eruption of wells (IWCF), 14 trainees (3 from ADWOC and 11 from Arabian Gulf for exploration) participated in this session, they granted certificates on how to deal with incidents of the eruption.
2- The ARAB WELL LOGGING COMPANY (AWLCO)
AWLCO was established in Baghdad, Iraq, on 24 March 1983 with an authorized capital of 7 million Iraqi dinars, with all OAPEC member countries as shareholders. The company is specialized in performing well logging and perforation operations, and other well-related technical operations necessary for discovery and development of oil fields. AWLCO owns two operation centers one in the southern Iraq and the other in the North. The Company's Activities in 2007 and the First Half of 2008
In 2007, AWLCO saw a significant improvement in all its technical and financial activities, and logging and perforation operations, compared with the previous years. This led to maintain the good pace of the company's revenues and the purchase of new logging and perforation equipment and tools and spare parts to sustain equipment, tools and vehicles. Maintenance and repair work were carried out for installations, workshops and work and accommodation sites. The logging and perforation operations reached 177 during 2007, and during the first half of 2008 AWLCO implemented 110 logging and perforation operations. As the coordination with the Iraqi oil ministry and North and South oil companies continued.
The company has approached a number of international companies specialized in the manufacture of machinery and equipment related to logging. The equipment that had been contracted in 2006 was received at the end of 2007.These equipment are under pilot testing in Iraq's fields.
The company has purchased from an international company an equipment and devices complement to the above equipment with the same method of financing of the other purchase (the profits generated from the surplus revenues from the implementation of logging and perforation operations). This is done after obtaining the approval of the Board of Directors on the amount of US $1,844,950. dollars. After studying the local market and the need for purchasing 2 logging trucks, the Company invited bids to purchase them. Bids were studied and analyzed. The Board of Directors approved the best quality and lowest bid with the amount of U.S.$536,000.
Training and Manpower

A number of the company's employees involved in training courses within the country, in addition to opportunities for training outside Iraq. As of 30/6/2008 the Company’s staff totaled 62 employees, including two Arab nationals (an Egyptian and another Sudanese) and the rest were Iraqis.
Financial Results in 2007 and the First Half of 2008
The balance sheet of AWLCO in 2007 showed that the revenues, excluding interests, amounted to US$3,152,459, while the total expenses totaled US$ 2,220,285.
In 2007 the company achieved a net profit of US$ 932.174. During the first half of 2008, the company's revenues, excluding interests, reached US$1,905,297, while the total expenses amounted to US $ 1,139,994 this led AWLCO to achieve a net profit of US $ 765.303. 3- The Arab Geophysical Exploration Services Company
(AGESCO)
The Arab Geophysical Exploration Services Company (AGESCO) was established in Tripoli, Libyan Arab Jamahiriya on 1984 with an authorized capital of 12 million Libyan dinars and a paid-up capital of 4 million dinars. The Arab Petroleum Services Company and Halliburton has an equal share of 40% in AGESCO, and the Arab Petroleum Investment Corporation (APICORP) and the Libyan National Oil Corporation with 10% each.
The Company's Activities in 2007 At the beginning of 2007, the three crews continued recording
operations of seismic surveys, where a Crew AG002 continued carrying out 3-D and 2-D seismic surveys with operations for TechCo Company in concession 81-2, the crew continued operations for the same company, carrying out a 2-D survey in concession 81-3. Later it moved to work for Verenex in block 47 carrying out a 3-D survey. By the end of 2007, the crew completed surveys covering a total of 1629.8 sq km and 2116.57 km in length.
Crew AG003 continued working for Arabian Gulf Oil Company in concession no NC-4. Later it moved to work for the same company in concession no NC-7 then continued its work in the concession NC-8 for the same the company. The crew completed surveys covering a total of 1,437.25 sq km of 3-D survey.
Crew (AG -004), joint venture between AGESCO and CCG, continued to work in block A177 for Chevron and recorded a total of 2471027 sq km of 3-D survey.
Financial Results in 2007
The company achieved an unprecedented profit since its establishment, This is due to crews’ development and supply with the best equipment which had a positive impact on revenues achieved from exploration operations, totaling LYD 67,049 and total expenses LYD 51.647. The net profit amounted to LYD 15.402.
Training and Manpower
The company pays a special attention to the training programs, through both the external sessions and local courses in workplace in various fields. At the end of 2007 the number of employees the company's was 673 workers, of whom 545 Libyan, 88 Arab nationalities, and 40 foreigners. The Company's Activities in the First Half of 2008
Crew AG-002 continued the implementation of its program of work in 2007 for Verenex in block 47 until April 9, 2008. Then AG-002 moved to work for (RWI) company in concession no NC -195. The crew completed 3-D survey covering a total of 271.92 sq km in mid of July. Later it moved to work for the Arabian Gulf Oil Company in concession NC -100, carrying out 3-D survey and is expected to complete the agreed program by mid of January 2009.
During the first half of 2008, Crew AG-002 carried out a total of 2150.50 km in length and completed a 3-D survey covering 282.68 square kilometers. Crew AG-003 has been carried out a total of 707.32 square kilometers in blocks NC -47, NC -8, and NC -131 for Arabian Gulf Oil Company during the report’s period. Financial results in the first half of 2008
Total net profit achieved in the first half of 2008 reached LYD 6,381,579, where monthly net profit exceeding one million dinars and this represents an excellent return compared to the capital invested. Training and Manpower
The company has continued to take the issue of training in different areas of work of particular importance. By attending external sessions which organized in some Arab and other countries. At the end of the first half of 2008 the number of employees in the company totaled 317including 41 foreign workers.

4 - Arab Company for Detergent Chemicals (ARADET)
The company was established in Iraq on 12 March 1981, with an authorized capital of $ 72 million Iraqi dinars, and subscribed and fully paid-up capital of 36 million Iraqi dinars. Equity in the company is held by three member countries (Iraq, Saudi Arabia and Kuwait), and (APICORP), the Arab Company for Mining – Jordan, and the Arab Investment Company.
The Company's Activities in 2007 ARADET was facing many problems in 2007 which reflected
negatively on the production process, includes: - The unstable security situation and not supplying company's with refined
products for many periods. - The deterioration of standard of raw and processed materials. - The constraints and deficiencies such as reconstruction levy on imports of
raw materials, spare parts and equipment. This violates the law of the founding of the company.
- High inflation of goods and services prices (by more than 50%). - High prices of raw materials from the North Refineries Company. - The shortage of staff due to the withdrawal of technical staff. Financial Results in 2007
Despite the support of the Ministry of Oil, the balance sheet of the company's showed net loss of US$1.38 million in 2007 compared to a loss of US$4.6 million in 2006. This was due to the allocation of expected loss in the company's deposits with the Bank Rafidain, London branch of US$ 1.019 million, and to the decline in production and sales of major products of the company. Manpower and Training
In 2007 the number of employees in the company totaled 317, thirty nine of them were working at the center of the company and (278) in the alkyl benzene complex. The company's staff holds short-term training courses in some technical areas for the new residents in the company's camp. A number of staff was participated in technical, administrative, accounting, IT courses, and others were sent to attend technical sessions and training programs in Jordan, Syria and the United Arab Emirates. The Company'sA in the First Half of 2008
The increase in the constraints and disadvantages faced by the company since 2007 reflected a negatively on the company's activity in the first half of 2008. The deteriorating security situation, frequent interruptions
of electricity, the disruption of flow of raw materials, delays in maintenance work in the alkylation and aromatics unit, reflected negatively on the operation of aromatics and alkyl benzene production lines. Financial Results in the First Half of 2008
During the first half of 2008, Accounts showed that the company had endured loss of US$ 2.364 million. After deducting the loss from the income of financial investments and other income which totaled of US$2.428 million, there is a net gain of US $ 68 thousand. Manpower and Training
As of 30/6/2008, the number of employees in the company totaled 317, among them 42 are working in company's center and (275) in alkyl benzene complex .The company continued to organize technical sessions at the work site, and participating in number of specialized courses in Bagdad, and sending many of its staff for training in Jordan, Syria, China and the United Arab Emirates.

APPENDICES
I. PRESS RELEASES OF OAPEC MINISTERIAL COUNCIL MEETINGS IN 2008
1- The 80th Meeting of OAPEC’s Council of Ministers The Organization of Arab Petroleum Exporting Countries (OAPEC)
held its 80th Ministerial Council meeting on May 26th in Cairo, Egypt. The meeting was held at the level of OAPEC’s Executive Bureau members who represented the ministers. It was presided over by H.E. Fathi Mohammed El-Abbar, representative of Libya, whose country chairs the current session (2008). H.E. El-Abbar welcomed H.E. Abbas Ali Naqi, who participated in the meeting for the first time as OAPEC’s Secretary General, and congratulated him on his appointment by the Ministerial Council whishing him success in his new position.
The Council approved the final accounts of the General Secretariat and the Judicial Tribunal for the year 2007 and reviewed the Secretariat’s activities since its last meeting one year ago.
OAPEC officials also reviewed the economic and technical studies carried out by the General Secretariat on matters related to the oil industry, energy, economy, and the environment. It also took note of the seminars and meetings the General Secretariat will organize or take part in during the current year.
The Council was also briefed on the General Secretariat’s other activities, including the preliminary preparations for the 9th Arab Energy Conference to be held in Doha, Qatar in 9-11 May 2010. The Council concluded its meeting by expressing its appreciation and gratitude to the Arab Republic of Egypt for providing all the necessary facilities that made the meeting a success.
2- The Eighty-First Meeting of OAPEC Council of Ministers The Organization of Arab Petroleum Exporting Countries held its 81st
Ministerial Meeting on Saturday 29th November 2008. The Meeting was headed by H.E. Dr. Shokri Mohammed Ghanem- Chairman of the Administration Committee of The National Oil Corporation in The Greater Socialist People’s Libyan Arab Jamahiriya.President of the Meeting.
H.E. the President of the Meeting welcomed their Excellencies the Ministers of Oil and Energy and expressed the Council’s appreciation to the Arab Republic of Egypt for its gracious hospitality. He emphasized the
importance of cooperation among member countries in various fields to achieve the Organizations’ objectives.
H.E. the President reviewed some of the current challenges facing the oil industry and the impact of low oil prices on OAPEC members. He also discussed the international financial crisis and its effect on the oil market and on oil exporting countries, and called for more coordination on all levels to overcome the impact of this crisis. The Council of Ministers discussed and adopted the following: • Approved OAPEC’s 2009 Budget (the General Secretariat and the
Judicial Board) amounting to K.D. 2,035,800(Two Million Thirty Five Thousand and Eight Hundred Kuwaiti Dinars).
• Approved the reappointment of Office of Al Buzei & Co. as OAPEC’s external auditors for the year 2009
• Announce the winners of OAPEC “2008 Award for Scientific Research”, according to the assessment of the Screening Committee, as follows: 009
First prize value KD 5000 awarded and divided equally between: 1. Mr. Jamel Harbi from the Democratic People’s Republic of Algeria. 2. Mr. Wisam Qassem Al Shaleji from the Republic of Iraq. Second prize value KD 3000 awarded and divided equally between: 1. Dr. Asma Ali Aba Hussein from the Kingdom of Bahrain. 2. Mr. Omar khaled Al Haj from the Syrian Arab Republic.
The value of the first prize will be increased to KD 7000/- and the second prize to KD 5000/- respectively effective 2010, in conformity with the Ministerial Council decision taken during its 78th meeting (representatives level) held in Cairo on 27/5/2007. • Approved the recommendations of Executives Bureau in the memoranda
pertaining to: the progress associated with OAPEC’s activities regarding the development of the Data Bank, follow–up of environmental issues, participation in, and organization of conferences, and studies carried out.
• Review a progress report on the preliminary preparations for the Ninth Arab Energy Conference, to be convened in Doha-Qatar in 9-11May 2010.
• Resolve to entrust the Republic of Iraq with the sponsorship of the Arab Petroleum Training Institute for a further year effective 1/1/2009.
• Review the Annual Report on the activities of OAPEC affiliated companies.
• Decided to convene the next Ministerial Meeting on 5 Dec 2009 in Cairo.
A telegram was sent by H.E. the President on behalf of their Excellencies the Ministers, and Heads of Delegation to H.H. Mohammed

Hosni Mubarak, President of The Arab Republic of Egypt, on the occasion of the event.

II. MEETINGS AND SEMINARS SPONSORED OR ATTENDED BY THE GENERAL SECRETARIAT,2008
Title Venue Date
January - 1st Conference on Arab-Sino Cooperation in
Energy - Joint Kuwaiti-Japanese symposium on fuel cells
under the rubric of "research and development and applications of fuel cells and hydrogen production technology"
- Meeting of WEC Cleaner Fossil Fuels Systems Committee
China
Kuwait
Abu Dhabi
9-11
24
24-25
February - 14th International Annual Fertilizer Forum and
exhibition - Experts’ Meeting and Meeting of Executive Bureau
of Council of Arab Ministers Responsible for Electricity
Cairo
Cairo
5-7
5-7 March - GCC Policy Development Meeting on Clean Fuels
and Vehicles
Bahrain
12-13
April - 6th Syrian International Oil and Gas Exhibition
SYROIL 2008 - Middle East Gasoline and Diesel Conference 2008 - 11th International Energy Forum meeting - First Arab Chemical and Petrochemical Industries
Forum
Damascus
Qatar Roma
Damascus
7-10
9-10 20-22 28-29
June - Workshop on energy Poverty in Africa - Seminar on " Natural Gas Industry: Present and
Future" - 38th Meeting of the Higher Coordination Committee
on Joint Arab Action
Nigeria
Paris
Cairo
8-10
17-19
5-6
July - Extraordinary Session of the Council of Arab
Ministers Responsible for Environment Affairs (CAMRE)
- 30th Oxford Seminar
Cairo Oxford
19 21-31

Title Venue Date
August - Meeting of 82nd Session of Arab Economic and
Social Council
Cairo
24-26
October - Alternatives of Oil and Gas conference - 14th Meeting of the Climate Change Subcommittee -121st OAPEC’s Executive Bureau meeting -8th Meeting of the Executive Office of the Council of
Arab Ministers Responsible for the Environment -15th Coordination Meeting of Environment Experts in
OAPEC Countries - 8th Meeting of Working Group on Prospects for
Cooperation in Natural Gas Investment in OAPEC Member Countries
New Delhi
Cairo Cairo
Cairo
Cairo
Damascus
3-4 11
11-12
14-15
15-16
27-29
November
- OPEC's Coordination Meeting in Preparation for "COP-14, and CMP-4" meetings
- Conference on "Developments in techniques of exploration and production"
- 20th World Energy Council Conference - 3rd International Congress for Chemistry and
Environment - 2nd IEA Meeting on International Energy Statistics - OPEC Meeting on Energy Data Statistics - 122nd OAPEC’s Executive Bureau meeting - Ministerial Council’s 81st meeting
Vienna
Bahrain
Rome
Kuwait Paris
Vienna Cairo Cairo
12
10-12
11-15 18-20 19-20 29-30 26-27
29
December
- Meetings of the Conference of the Parties (COP-14) and the Conference of the Parties serving as the meeting of the Parties to the Kyoto Protocol (CMP-4)
Poland
1-12