ORGANISMAL PERFORMANCE ASSAYS FOR DETECTING …
133
ORGANISMAL PERFORMANCE ASSAYS FOR DETECTING ADVERSE HEALTH IMPACTS OF NUTRITIONAL AND TOXIC EXPOSURES: CONSEQUENCES OF DIETARY FRUCTOSE by James S. Ruff A dissertation submitted to the faculty of The University of Utah in partial fulfillment of the requirements for the degree of Doctor of Philosophy Department of Biology The University of Utah August 2012
Transcript of ORGANISMAL PERFORMANCE ASSAYS FOR DETECTING …
ORGANISMAL PERFORMANCE ASSAYS FOR DETECTING ADVERSE HEALTH
IMPACTS OF NUTRITIONAL AND TOXIC EXPOSURES:
CONSEQUENCES OF DIETARY FRUCTOSE
by
James S. Ruff
A dissertation submitted to the faculty of The University of Utah
in partial fulfillment of the requirements for the degree of
Doctor of Philosophy
Department o f Biology
The University o f Utah
August 2012

Copyright © James S. Ruff 2012
All Rights Reserved
The U n i v e r s i t y of Ut ah G r a d u a t e S c h o o l
STATEMENT OF DISSERTATION APPROVAL
The dissertation of James S. Ruff
has been approved by the following supervisory committee members:
Wayne Potts Chair 05/11/2012Date Approved
Katherine Beals Member 05/11/2012Date Approved
David Carrier Member 05/11/2012
M. Denise Dearing Member 05/11/2012Date Approved
J. Gregory Lamb Member 05/11/2012Date Approved
and by Neil Vickers
the Department of Biology
Chair of
and by Charles A. Wight, Dean of The Graduate School.
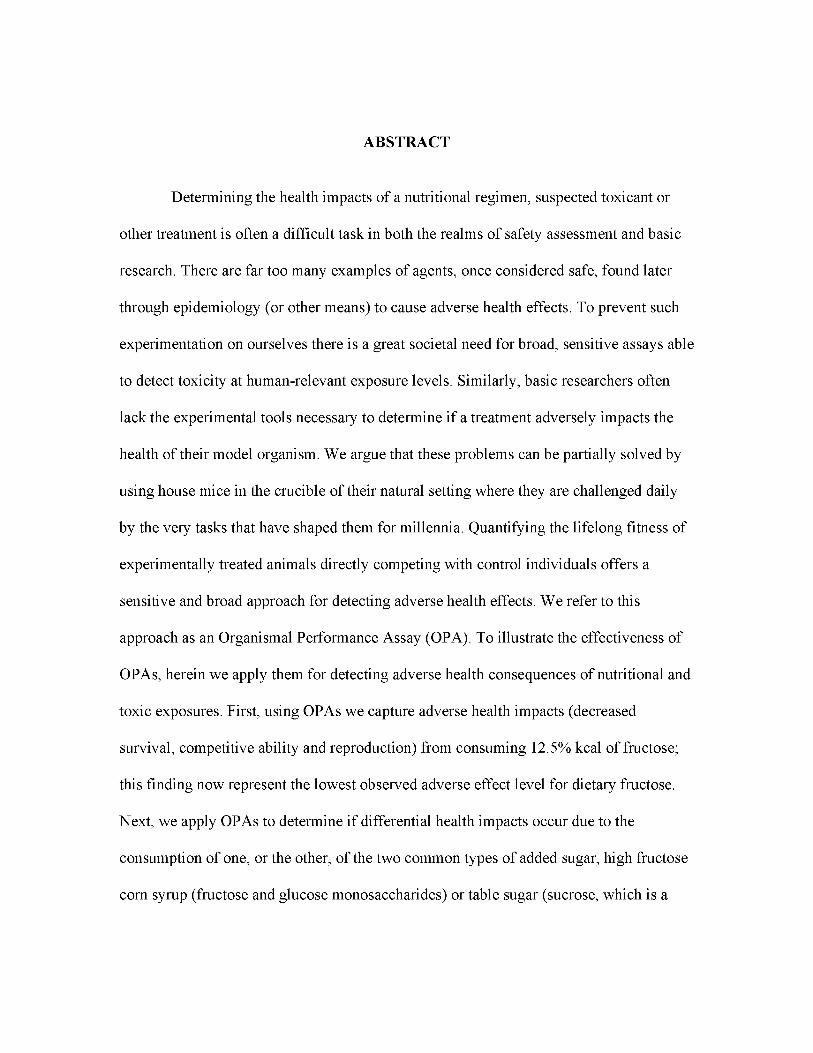
ABSTRACT
Determining the health impacts of a nutritional regimen, suspected toxicant or
other treatment is often a difficult task in both the realms of safety assessment and basic
research. There are far too many examples of agents, once considered safe, found later
through epidemiology (or other means) to cause adverse health effects. To prevent such
experimentation on ourselves there is a great societal need for broad, sensitive assays able
to detect toxicity at human-relevant exposure levels. Similarly, basic researchers often
lack the experimental tools necessary to determine if a treatment adversely impacts the
health of their model organism. We argue that these problems can be partially solved by
using house mice in the crucible of their natural setting where they are challenged daily
by the very tasks that have shaped them for millennia. Quantifying the lifelong fitness of
experimentally treated animals directly competing with control individuals offers a
sensitive and broad approach for detecting adverse health effects. We refer to this
approach as an Organismal Performance Assay (OPA). To illustrate the effectiveness of
OPAs, herein we apply them for detecting adverse health consequences of nutritional and
toxic exposures. First, using OPAs we capture adverse health impacts (decreased
survival, competitive ability and reproduction) from consuming 12.5% kcal of fructose;
this finding now represent the lowest observed adverse effect level for dietary fructose.
Next, we apply OPAs to determine if differential health impacts occur due to the
consumption of one, or the other, of the two common types of added sugar, high fructose
corn syrup (fructose and glucose monosaccharides) or table sugar (sucrose, which is a
disaccharide of fructose and glucose), and show that the high fructose corn syrup diet
increases mortality and decreases reproduction of female mice compared to sucrose,
providing the first experimental evidence that the two most common forms of caloric
sweeteners have differential health impacts. Next, we use OPAs to determine if an acute
exposure to 3mg/kg of amine-terminated generation seven poly amido-amine dendrimers,
the current maximum tolerated dose, is actually toxic and find that it is not. Finally, to
address the criticism that OPAs do not lead to the underlying mechanisms of observed
organismal outcomes, we illustrate the discovery of the molecular basis of the first
phenomenon revealed using OPAs, major histocompatibility complex (MHC)-based
mating preferences, which is done in the context of a review paper on the role of MHC
during social communication.
iv

To the faculty, staff and students of the University of Utah Department of Biology,
for fostering a collaborative and engaging environment.
ABSTRACT............................................................................................................................ Ill
LIST OF TABLES............................................................................................................... viii
LIST OF FIGURES............................................................................................................... ix
ACKNOWLEDGEMENTS...................................................................................................xi
Chapter
1 USING ORGANISMAL PERFORMANCE DURING NATURAL CHALLENGES TO DETECT ADVERSE HEALTH EFFECTS FROM ENVIORNMENTAL EXPOSURES...................................................................................................................1
A bstract.......................................................................................................................1Environmental impacts on disease.............................................................................2Organismal performance assays................................................................................4Applying OPAs to environmental exposures............................................................6From phenotype to mechanism..................................................................................8References....................................................................................................................9
2 HUMAN-RELEVANT LEVELS OF DIETARY FRUCTOSE DECREASE MOUSE COMPETITIVE ABILITY, SURVIVAL AND FITNESS........................................13
Summary paragraph..................................................................................................13Main body..................................................................................................................14Methods summary.....................................................................................................21References..................................................................................................................22Acknowledgements and contributions.................................................................... 23Supplementary methods........................................................................................... 28Supplementary references........................................................................................ 37
3 MODERATE LEVELS OF FRUCTOSE AND GLUCOSE MONOSACCHARIDES INCREASE DEATH RATES AND REDUCE FITNESS OF FEMALE MICE COMPARED TO THOSE FED SUCROSE............................................................... 45
TABLE OF CONTENTS
Abstract......................................................................................................................45Introduction............................................................................................................... 46Methods......................................................................................................................49Results........................................................................................................................56Discussion..................................................................................................................59Acknowledgements...................................................................................................62References..................................................................................................................63
4 ORGANISMAL PERFORMANCE ASSES SMENT OF AMINE-TERMINATED G7 PAMAM DENDRIMERS SUPPORTS THRESHOLD MODEL OF TOXICITY.....................................................................................................................75
Abstract......................................................................................................................75Introduction............................................................................................................... 76Methods......................................................................................................................78Results........................................................................................................................84Discussion..................................................................................................................85Acknowledgements...................................................................................................87References..................................................................................................................87
5 MHC SIGNALING DURING SOCIAL COMMUNICATION.................................96
Abstract......................................................................................................................97Introduction............................................................................................................... 98Signaling of MHC genotype: molecular mechanisms........................................... 98MHC as a signal in individual recognition...........................................................102MHC as a signal in kin recognition...................................................................... 105MHC as a signal of genetic compatibility in mate choice...................................109MHC and signals of quality in mate choice..........................................................112MHC evolution: what are the primordial functions?........................................... 113Conclusion.............................................................................................................. 114Acknowledgements.................................................................................................115References............................................................................................................... 115
vii
LIST OF TABLES
Table
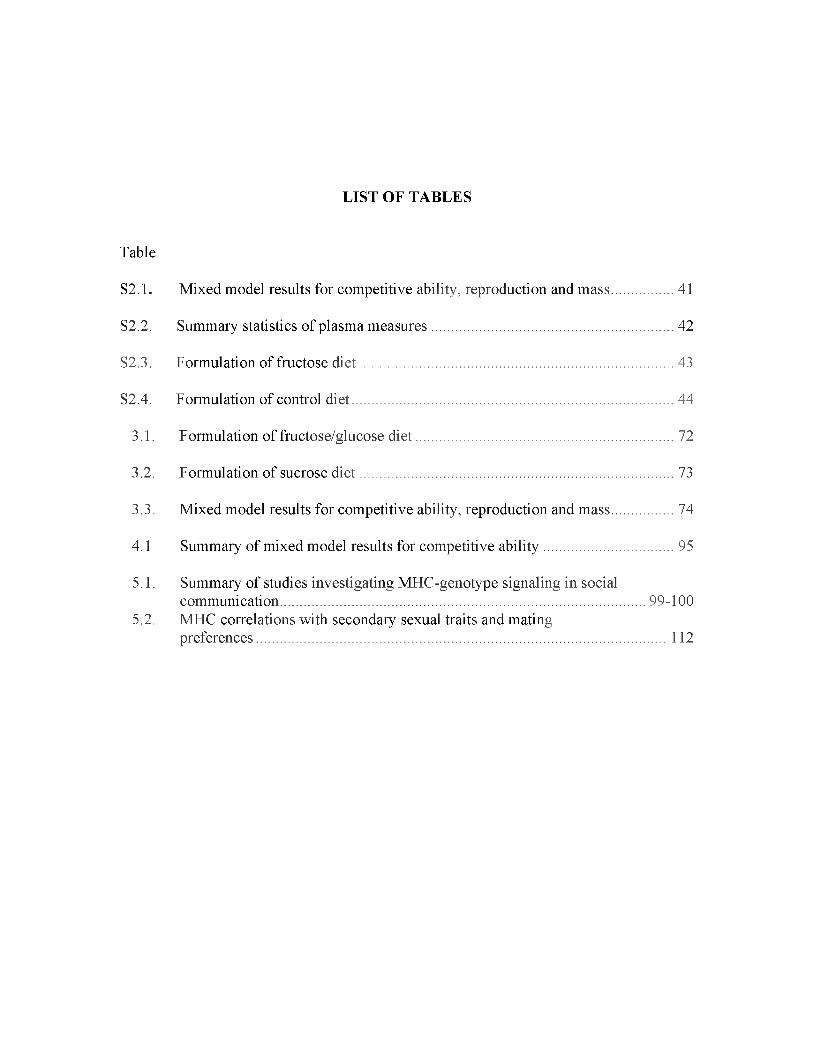
52.1. Mixed model results for competitive ability, reproduction and mass................41
52.2. Summary statistics of plasma measures............................................................... 42
52.3. Formulation of fructose diet..................................................................................43
52.4. Formulation of control diet.................................................................................... 44
3.1. Formulation of fructose/glucose diet................................................................... 72
3.2. Formulation of sucrose d iet..................................................................................73
3.3. Mixed model results for competitive ability, reproduction and mass................74
4.1 Summary of mixed model results for competitive ability..................................95
5.1. Summary of studies investigating MHC-genotype signaling in social communication................................................................................................99-100
5.2. MHC correlations with secondary sexual traits and matingpreferences........................................................................................................... 112
LIST OF FIGURES
Figure
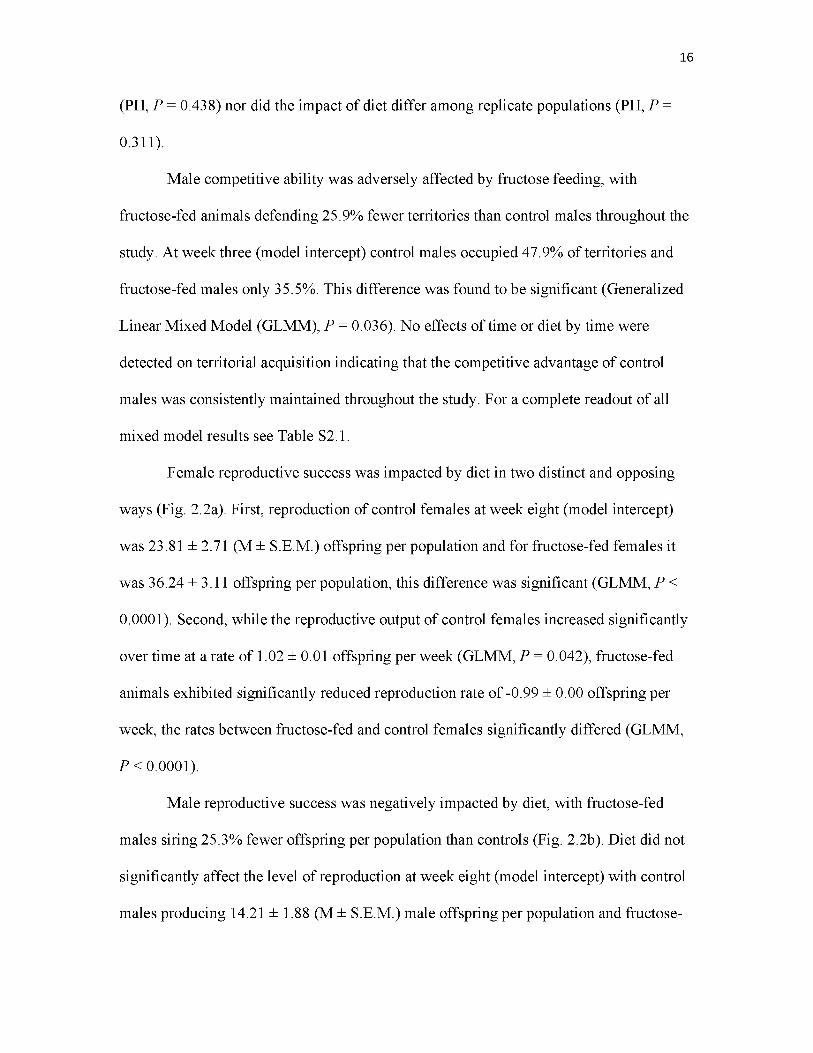
2.1 Survival of fructose-fed and control animals within OPA enclosures by sex ...... 25
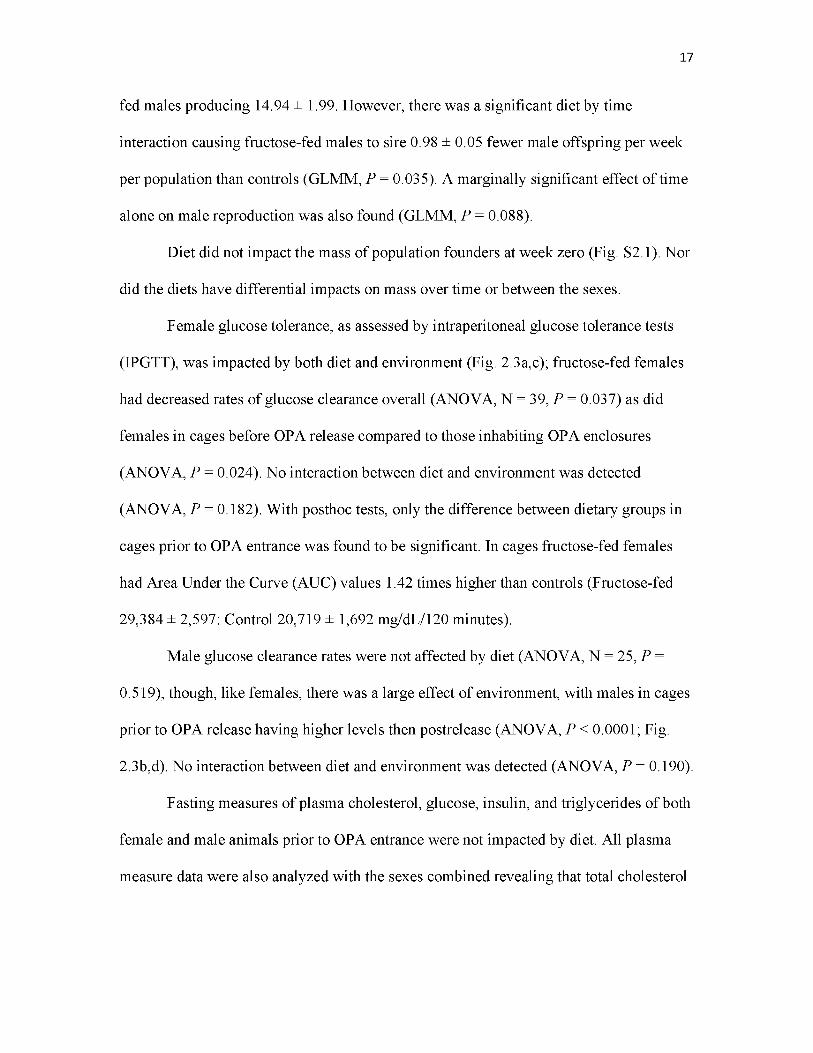
2.2 Reproduction of fructose-fed and control animals within OPA enclosures by sex 26
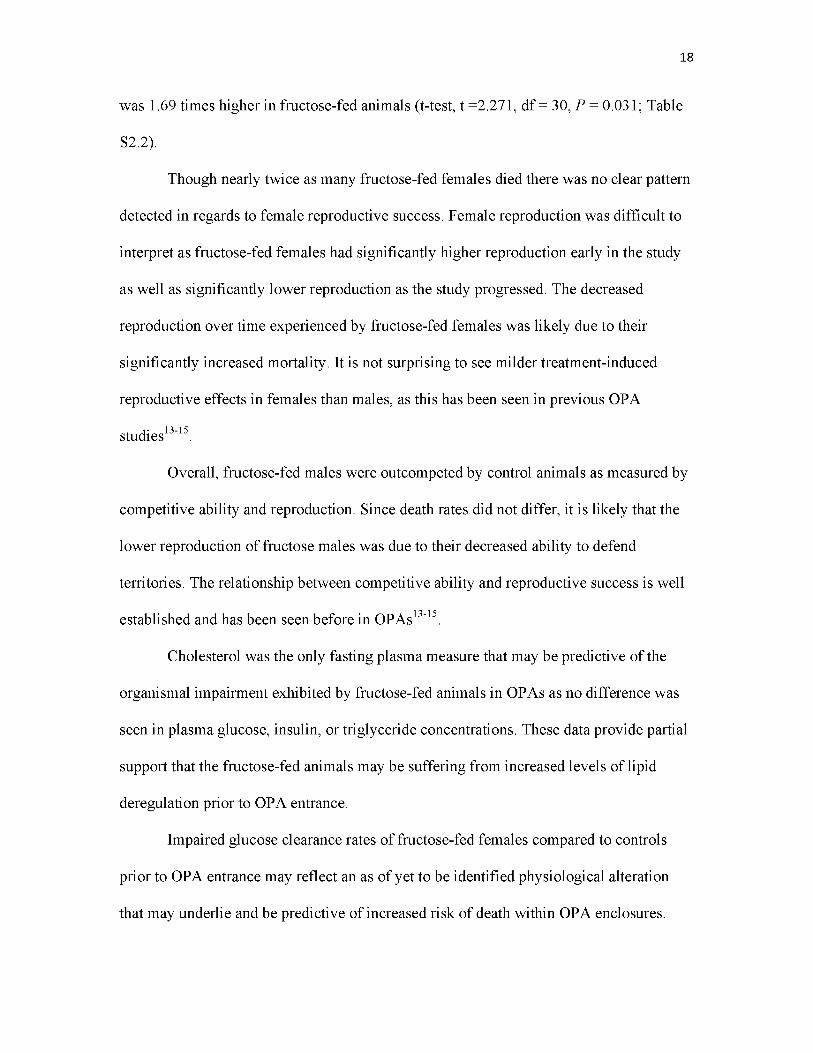
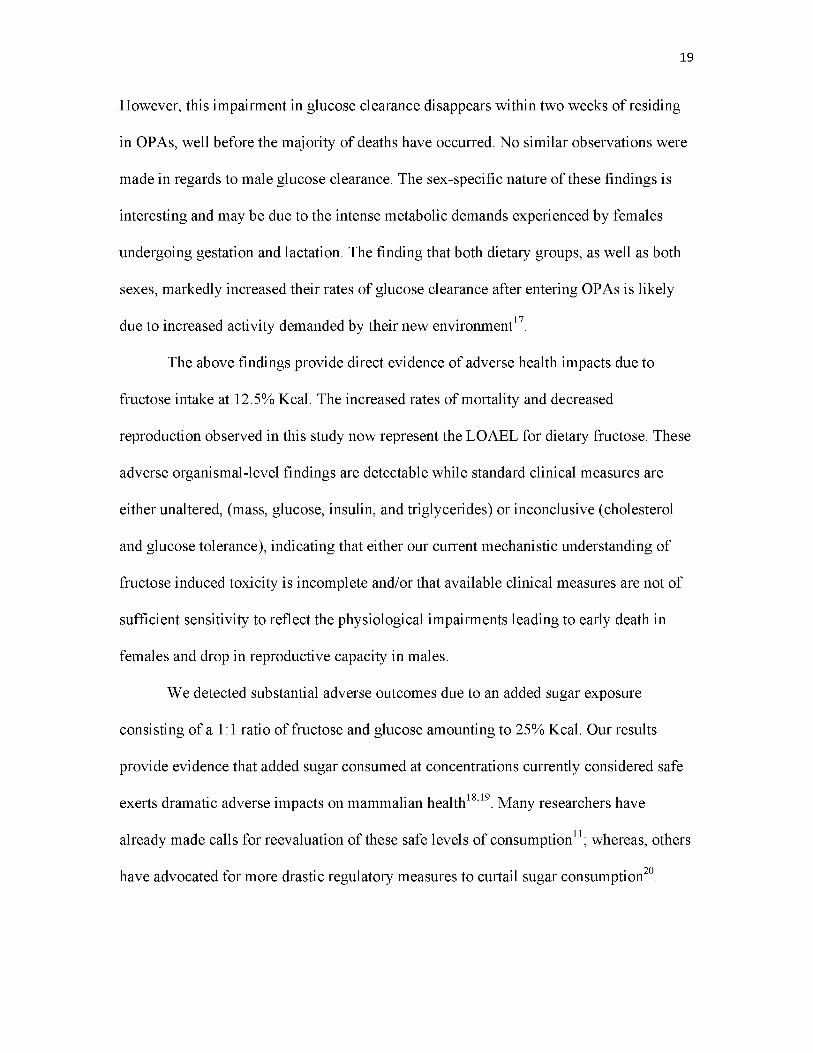
2.3 Glucose tolerance of female a,c, and male b,d, fructose-fed and control animals before and after OPA entrance as depicted by the glucose challenge time course plots a,b, and integrated area under the curve values c,d,......................................27
52.1 Body mass of OPA founders over time by sex.........................................................38
52.2 Relative fitness costs of published OPA studies.......................................................39
52.3 Photograph of OPA enclosure................................................................................... 40
3.1 Survival of fructose/glucose and sucrose animals within OPA enclosures by sex 67
3.2 Male competitive ability over tim e...........................................................................68
3.3 Cumulative reproductive success of OPA founders by sex....................................69
3.4 Body mass of fructose/glucose and sucrose animals within OPA enclosures by sex.............................................................................................................................. 70
3.5 Glucose tolerance curves of fructose/glucose-fed and sucrose-fed females prior to release in OPA enclosures....................................................................................... 71
4.1 Survival of treatment and control males.................................................................. 91
4.2 Male competitive ability over time...........................................................................92
4.3 Reproduction of treatment and control animals by sex ..........................................93
4.4 Mass of OPA founders at entrance and eight weeks later by sex.......................... 94

5.1 Possible phenotype matching systems using MHC-based odors andtheir effectiveness for the recognition of k in .........................................................107
x

ACKNOWLEDGEMENTS
I greatly thank my advisor Wayne Potts for supporting me throughout graduate
school and providing me with mentorship in all aspects of the scientific enterprise, as
well as far beyond. I am indebted to my advisory committee, Katherine Beals, David
Carrier, Denise Dearing, Gregory Lamb, and Wayne Potts for challenging me and
providing me with opportunity to grow as a scientist and teacher. I am thankful for the
many meaningful collaborative projects in which I engaged, specifically with David
Carrier, Lesley Chesson, Chris Cunningham, Jim Ehleringer, Sean Laverty, Jason
Kubinak and Mark Shigenaga. Likewise, I am grateful to Katherine Beals, Laurie Dizney,
Rick Graham, Jael Malenke, and Neil Vickers for allowing me to be an educator at this
university. The Potts lab family has been a continuous source of aid: lab manager Linda
Morrison has been an adoptive mother to me over the past ten years; Jason Kubinak and
Adam Nelson are the best colleagues, friends, and intellectual nemeses that one could
hope to find; Shannon Gaukler and Jeremy Gendelman are promising scientists and it has
been a privilege to work with them. Numerous undergraduates and high school students
contributed to my dissertation research. I am especially appreciative for the contributions
of Sara Hugentobler, Brad Schwartz, Mirtha Sosa, Amanda Suchy and Ruth Tanner. I
was also honored to be a member of and supported by both the TGLL (DGE 08-41233)
and WEST programs and I would like to particularly thank David Chapman, Don Feener
and Holly Godsey, for making these programs a success. Additionally, I was supported

by the Department of Biology and my work was supported by an NIH grant (RO1-
GM039578) to Wayne Potts. I owe a great deal to my fellow graduate students in my
cohort including Lesley Chesson, Chris Cunningham, Jennifer Koop, and Jessica Waite;
they are an amazing group of scientist who will do many great things. Finally, I am ever
grateful to my spouse Brit, my mother Janie and other family members (both furred and
feathered), who are the source of my confidence and inspiration.
xii
CHAPTER 1
USING ORGANISMAL PERFORMANCE DURING
NATURAL CHALLENGES TO DETECT
ADVERSE HEALTH EFFECTS
FROM ENVIORNMENTAL
EXPOSURES
Abstract
Determining the health impacts of a nutritional regimen, suspected toxicant or
other treatment is often a difficult task in both the realms of safety assessment and basic
research. There are far too many examples of agents, once considered safe, that are found
later through epidemiology to cause adverse health effects. To prevent such widespread
experimentation on ourselves and other animals there is a great societal need for broad,
sensitive assays able to detect toxicity at relevant exposure levels. Similarly, basic
researchers often lack the experimental tools necessary to determine if a treatment
adversely impacts the health of their model organism. Examples include geneticists who
knock-out genes and see no phenotype, or physiologists whose treatment causes
numerous changes in gene expression; although it is seldom clear if these changes are
adverse. We argue that these problems can be partially solved by using classic animal
models (e.g., house mice) in the crucible of their natural setting where they are
challenged daily by the very tasks that have shaped them for millennia. Quantifying the
lifelong fitness (and key components thereof) of experimentally treated animals directly
competing with control individuals appears to offer a sensitive and broad approach for
detecting adverse health effects.
Environmental impacts on disease
The importance of the role of the social and physical environment on the
induction and elucidation of human disease is well established. Examples are numerous
and include, but are not limited to, the role of stress in cardiovascular disease, mortality
due to heart malformations manifesting themselves during student athletics, and
asthmatic conditions brought on by exercise (1-3). The question begs itself, if we know
that the social and physical environment is key in both exacerbating and revealing human
diseases then why do we ignore the potential influences of environment when conducting
animal safety research?
Typically, animal subjects are maintained under artificial conditions that do not
reflect the natural environments that forged them into existence through natural selection.
In essence, to study animals in these conditions is akin to studying people in an asocial
environment in which they do not exert themselves, do not encounter hardships and have
ad libitum access to well formulated food. When a substance is declared safe, ideally it is
safe while practicing a typical vigorous, stressful lifestyle, not simply safe in a setting
devoid of challenge. Could the failure to provide natural or seminatural environments for
our laboratory animals increase the likelihood that they provide us with misinformation
concerning the adversity of experimental treatments?
When comparing concordance rates between human and animal studies a certain
degree of discrepancy is to be expected, but what is the cause of this disparity? Typically
2
this question is answered by species-based differences in genetics and physiology, and
though these differences are real it seems unlikely that they account for the entire
explanation. Currently, concordance rates for pharmaceutical safety assessment between
rodents and humans are 43% and when rodent plus a nonrodent models are combined
concordance increases to 71% (4). Pharmaceutical concordance rates are equally split
between false-negatives and false-positive and they are artificially low compared to other
environmental exposures as most overtly toxic substances are not considered as potential
therapeutic agents. Pharmaceutical concordance rates are arguably the best tracked, but
discrepancies in concordance exist in toxicology and nutrition as well. In toxicology they
are generally assumed to be approximately 80% for humans and rodents (5). When we
compare animal data to that generated from human studies we have changed two major
variables, one of course being the species, but the other is the environment in which that
organism dwells. Therefore, if we would like to increase the power and translatability of
animal research a key first step is recognizing and incorporating the role of a
representative natural environment.
For decades research groups studying animal behavior, ecology and evolution
have used seminatural environments in many animal model systems of biomedical
importance including macaques, mice, and pigs, but few researchers have used such
systems in the applied fields of biomedicine, nutrition, pharmaceutics and toxicology (6
10). There are notable examples, however, in the areas of feeding psychology and
addiction (11, 12). Though there is general applicability in creating more naturalistic
settings for many species, the specific alterations and considerations for any given
species will be unique. Therefore, though we advocate for numerous animal models to
3
4
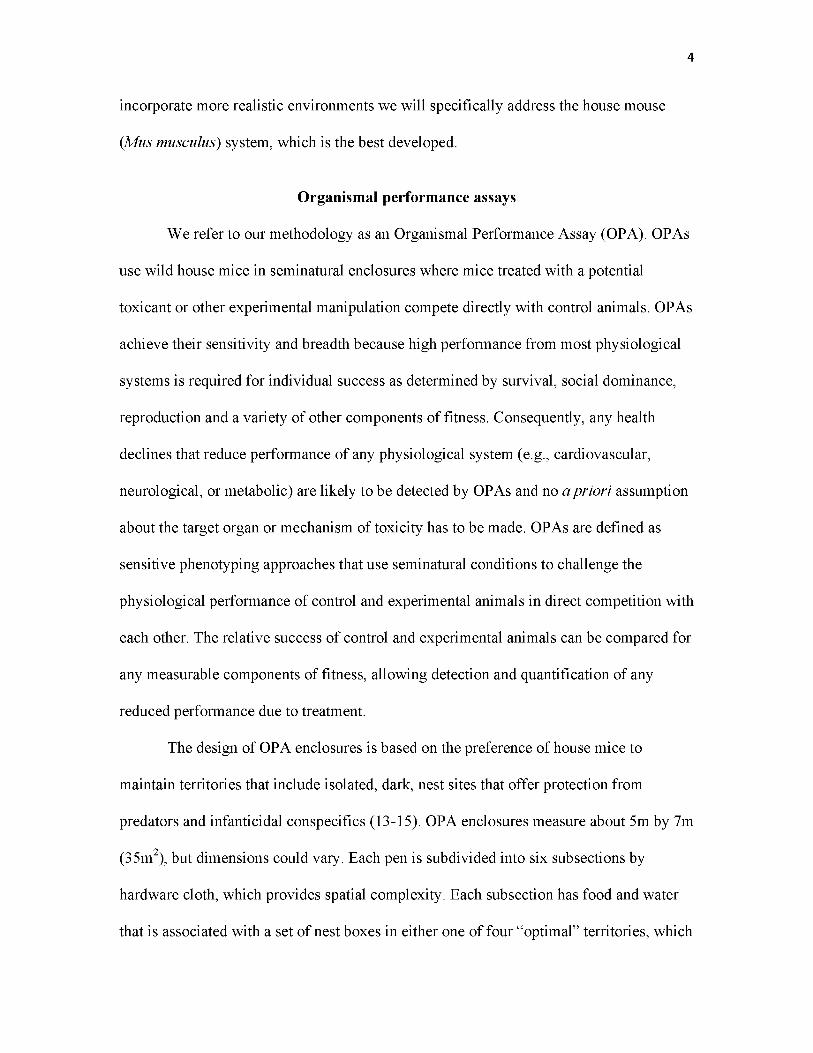
incorporate more realistic environments we will specifically address the house mouse
(Mus musculus) system, which is the best developed.
Organismal performance assays
We refer to our methodology as an Organismal Performance Assay (OPA). OPAs
use wild house mice in seminatural enclosures where mice treated with a potential
toxicant or other experimental manipulation compete directly with control animals. OPAs
achieve their sensitivity and breadth because high performance from most physiological
systems is required for individual success as determined by survival, social dominance,
reproduction and a variety of other components of fitness. Consequently, any health
declines that reduce performance of any physiological system (e.g., cardiovascular,
neurological, or metabolic) are likely to be detected by OPAs and no a priori assumption
about the target organ or mechanism of toxicity has to be made. OPAs are defined as
sensitive phenotyping approaches that use seminatural conditions to challenge the
physiological performance of control and experimental animals in direct competition with
each other. The relative success of control and experimental animals can be compared for
any measurable components of fitness, allowing detection and quantification of any
reduced performance due to treatment.
The design of OPA enclosures is based on the preference of house mice to
maintain territories that include isolated, dark, nest sites that offer protection from
predators and infanticidal conspecifics (13-15). OPA enclosures measure about 5m by 7m
(35m2), but dimensions could vary. Each pen is subdivided into six subsections by
hardware cloth, which provides spatial complexity. Each subsection has food and water
that is associated with a set of nest boxes in either one of four “optimal” territories, which
contain nest boxes in enclosed structures or two “suboptimal” territories with nest boxes
in the open. Together, the hardware fences and the two types of nest boxes create
environmental complexity in which mice establish nesting sites, territorial boundaries and
social hierarchies. OPA enclosures mimic habitat and social environments experienced
by mice in nature, and the population density is representative of measurements from
wild populations (16).
OPAs have been previously used to quantify adverse consequences associated
with cousin and sibling-level inbreeding as well as bearing the selfish genetic element
known as the t complex (17-19). The primary cause of inbreeding depression is
deleterious recessive alleles that are expressed at a higher rate in inbred individuals, and
though these negative consequences have been known for centuries actual fitness effects
were less clear (20). Two major studies were conducted on mice indicating that the
consequences of full-sibling mating are a 10% decline in litter size (21, 22). Further
studies were conducted on the surviving inbred offspring, but these mice performed
similar to outbred controls. We conducted OPAs on these seemingly normal inbred
progeny by competing them against outbred controls and discovered an additional 500%
decline in male reproduction (18). We have repeated these experiments at the level of
cousin unions and OPAs revealed that this level of inbreeding reduced male fitness by
34%, challenging clinical claims that health effects from cousin-level inbreeding are
tolerable (17, 23).
Since its discovery half a century ago, the mouse t complex has become a
textbook example of a selfish gene. Despite much success characterizing its underlying
genetics and transmission distortion effects, the population dynamics of this persistent
5
6
genetic polymorphism has remained paradoxical because population frequencies are far
lower than theoretical predictions would suggest (24). Thus, it is likely that some form of
selection is operating against the invasion and spread of t haplotypes among wild mouse
populations. We used OPAs to discover the missing phenotypes, which were
reproductive declines in both t bearing males and females. These reproductive defects
reduced t allele frequencies to 49% below transmission distortion expectations (19). In all
cases above, OPAs discovered large health declines associated with treatments that had
been missed for decades by researchers using conventional laboratory methods.
Applying OPAs to environmental exposures
The following chapters of this disseration represent the first application of OPAs
to detect and quantify health consequences of environmental expsoures. These exposures
include both nutrional and toxicological exposures. While previous OPA studies have
focused on genetic treatments such as the aformintioned inbreeding and t complex, the
application of this technigue is arugabley most needed in the fields of nutrition and
toxicology, where substances once considered safe, such as asbestos, DDT,
diethylstilbestrol, polycyclic aromatic hydrocarbons (from grilled meat), second-hand
smoke and trans fatty acids are often found to be detrimental to health after years of
human exposure (25-30). OPAs help us answer the simple but crucial question, does an
exposure at a given level make a mouse sick; if OPAs had been utilized to evaluate the
safety of the substances mentioned above, decades of human exposure and sickness could
have been avoided.
In the second chapter, OPAs are applied to dietary fructose to determine if a
human relevant exposure level decreases mouse health and performance. Though
association between human disease and fructose consumption are well established and
many mechanistic aspects of fructose toxicity have been elucidated at high dose levels,
no experimental characterization of adversity has been made at exposure levels that are
relevant to human consumption (31-37). Using OPAs, however, we determine that
fructose exposure at 12.5% kcal results in increased mortality, decreased competitive
ability and decreased reproductive success. The data within this chapter now represent
the lowest observed adverse effect level for dietary fructose, a level experienced by 13%
of Americans (37).
The third chapter focuses on using OPAs to determine if differential health
impacts are associated with eating high fructose corn syrup (HFCS) (fructose and glucose
monosaccharides) or table sugar (sucrose). To date, only two published rodent studies
have indicated that these sugars have different impacts; however, the studies used
exposure levels far beyond human relevance, and the differences described cannot readily
be concluded as adverse (38, 39). Using OPAs we capture clear evidence that an
exposure modeling HFCS is more detrimental than table sugar, as females fed a diet
modeling HFCS experience increased mortality and decreased reproduction.
Within the fourth chapter OPAs are applied to determine if the established
maximum tolerated dose of an engineered nanomaterial is actually toxic. Amine-
terminated generation seven poly amido-amine (PAMAM) dendrimers are known to be
toxic to mice at 10mg/kg body mass as they cause blood coagulation and death (40).
Based on this observation the maximum tolerated dose was established at 3/mg/kg. Using
OPAs we demonstrate that no adverse effects due to exposure are experienced from a
one-time injection at this dose.
7
8
From phenotype to mechanism
The fifth and final chapter is a published review illustrating how the initial
phenotype characterized using OPAs, mating preferences associated with the Major
histocompatibility complex (MHC), has helped lead to the discovery of the underlying
molecular mechanism of this phenomenon (41). MHC-based mating preferences were
first identified in mice using laboratory tests (42), but the illustration that these
preferences existed in naturalistic settings was first made in OPAs (43). This initial
discovery spurred further research and now MHC-based mating preferences have been
shown in over 20 species of vertebrates including amphibians, birds, fish, and reptiles
(44-47). Likewise, the initial OPA discovery illustrates a fascinating discovery that led
others to pursue its mechanistic underpinnings and it has now been shown that the
peptides known to bind to MHC molecules also bind neuronal receptors in the
vomeronasal organ (VNO) and the main olfactory epithelium (48, 49). Remarkably, the
VNO sensory receptors bind 10-mer peptides with the same rules used by MHC
molecules, where two of the peptides act as anchor positions for binding, while the other
eight amino acids are free to vary without affecting binding. This amazing case of
convergent evolution creates a seamless link between MHC-mediated immune
recognition and MHC-mediated olfactory behaviors. Similarly, detecting disease
phenotypes with OPAs offers a model system for discovery of mechanism that is
impossible when the disease state remains cryptic.
References
1. Dimsdale JE. Psychological stress and cardiovascular disease. J Am Coll Cardiol.2008 Apr 1;51(13):1237-46.
9
2. Lorvidhaya P, Stephen Huang SK. Sudden cardiac death in athletes. Cardiology. 2003; 100(4): 186-95.
3. Randolph C. An update on exercise-induced bronchoconstriction with and without asthma. Curr Allergy Asthma Rep. 2009 Nov;9(6):433-8.
4. Olson H, Betton G, Robinson D, Thomas K, Monro A, Kolaja G, et al. Concordance of the toxicity of pharmaceuticals in humans and in animals. Regul Toxicol Pharmacol. 2000 Aug;32(1):56-67.
5. Gad SC. Animal models in toxicology. 2nd ed. Boca Raton: CRC/Taylor & Francis; 2007.
6. Drickamer LC. Semi-natural and enclosed groups of Macaca mulatta: a behavioral comparison. Am J Phys Anthropol. 1973 Sep;39(2):249-54.
7. Mossman CA, Drickamer LC. Odor preferences of female house mice (Mus domesticus) in seminatural enclosures. J Comp Psychol. 1996 Jun;110(2):131-8.
8. Sherborne AL, Thom MD, Paterson S, Jury F, Ollier WE, Stockley P, et al. The genetic basis of inbreeding avoidance in house mice. Curr Biol. 2007 Dec 4;17(23):2061-6.
9. Firman RC. Polyandrous females benefit by producing sons that achieve high reproductive success in a competitive environment. Proc Biol Sci. 2011 Sep 22;278(1719):2823-31.
10. Stolba A, Wood-Gush DGM. The behavior of pigs in a semi-natural environment. Animal Production. 1989 1989;48(2):419-26.
11. Davis JF, Krause EG, Melhorn SJ, Sakai RR, Benoit SC. Dominant rats are natural risk takers and display increased motivation for food reward. Neuroscience. 2009 Aug 4;162(1):23-30.
12. Duncan EA, Tamashiro KL, Nguyen MM, Gardner SR, Woods SC, Sakai RR.The impact of moderate daily alcohol consumption on aggression and the formation of dominance hierarchies in rats. Psychopharmacology (Berl). 2006 Nov;189(1):83-94.
13. Hurst JL. Behavioral variation in wild house mice Mus-domesticus rutty a quantitative assessment of female social organization. Animal Behaviour. 1987 1987;35(6):1846-57.
14. Wolff RJ. Mating behavior and female choice: their relation to social structure in wild caught House mice (Mus musculusj housed in a semi-natural environment. J Zool. 1985;207:43-51.
10
15. Bourin M, Hascoet M. The mouse light/dark box test. European Journal of Pharmacology. 2003 28 February,;463(1-3):55-65.
16. Sage RD. Wild mice. In: Foster HL, Small JD, Fox JG, editors. The mouse in biomedical research. N.Y.: Academic Press; 1981. p. 40-90.
17. Ilmonen P, Penn DJ, Damjanovich K, Clarke J, Lamborn D, Morrison L, et al. Experimental infection magnifies inbreeding depression in house mice. Journal of Evolutionary Biology. 2008;21:834-41.
18. Meagher S, Penn DJ, Potts WK. Male-male competition magnifies inbreeding depression in wild house mice. Proc Natl Acad Sci USA. 2000;97(7):3324-9.
19. Carroll LS, Meagher S, Morrison L, Penn DJ, Potts WK. Fitness effects of a selfish gene are revealed in an ecological context. Evolution. 2004;58:1318-28.
20. Latter BD. Mutant alleles of small effect are primarily responsible for the loss of fitness with slow inbreeding in Drosophila melanogaster. Genetics. 1998; 148(3):1143-58.
21. Lynch CB. Inbreeding effects upon animals derived from a wild population of Mus musculus. Evolution. 1977;31:526-37.
22. Connor JL, Belucci MJ. Natural selection resisting inbreeding depression in captive wild house mice (Mus musculus). Evolution. 1979;33:929-40.
23. Bennett RI, Motulsky AG, Bittles A, Hudgins L, Uhrich S, Doyle DL, et al. Genetic counseling and screening of consanguineous couples and their offspring: recommendations of the national society of genetic counselors. Journal of Genetic Counseling. 2002;11(2):97-119.
24. Lewontin RC. The effect of differential viability on the population dynamics of t alleles in the house mouse. Evolution. 1968;22:262-73.
25. Addison J, McConnell EE. A review of carcinogenicity studies of asbestos and non-asbestos tremolite and other amphiboles. Regul Toxicol Pharmacol. 2007 Oct 11.
26. Rogan WJ, Chen A. Health risks and benefits of bis(4-chlorophenyl)-1,1,1- trichloroethane (DDT). Lancet. 2005 Aug 27-Sep 2;366(9487):763-73.
27. Heindel JJ. Role of exposure to environmental chemicals in the developmental basis of reproductive disease and dysfunction. Semin Reprod Med. 2006 Jul;24(3):168- 77.
28. Phillips DH. Polycyclic aromatic hydrocarbons in the diet. Mutat Res.1999 Jul 15;443(1-2):139-47.
11
29. Jauniaux E, Burton GJ. Morphological and biological effects of maternal exposure to tobacco smoke on the feto-placental unit. Early Hum Dev. 2007 Nov;83(11):699-706.
30. Remig V, Franklin B, Margolis S, Kostas G, Nece T, Street JC. Trans fats in America: a review of their use, consumption, health implications, and regulation. J Am Diet Assoc. 2010 Apr;110(4):585-92.
31. Fung TT, Malik V, Rexrode KM, Manson JE, Willett WC, Hu FB. Sweetened beverage consumption and risk of coronary heart disease in women. Am J Clin Nutr.2009 Apr;89(4):1037-42.
32. Ouyang X, Cirillo P, Sautin Y, McCall S, Bruchette JL, Diehl AM, et al. Fructose consumption as a risk factor for non-alcoholic fatty liver disease. J Hepatol. 2008 Jun;48(6):993-9.
33. Dhingra R, Sullivan L, Jacques PF, Wang TJ, Fox CS, Meigs JB, et al. Soft drink consumption and risk of developing cardiometabolic risk factors and the metabolic syndrome in middle-aged adults in the community. Circulation. 2007 Jul 31;116(5):480-8.
34. Bray GA, Nielsen SJ, Popkin BM. Consumption of high-fructose corn syrup in beverages may play a role in the epidemic of obesity. Am J Clin Nutr. 2004 Apr;79(4):537-43.
35. Gross LS, Li L, Ford ES, Liu S. Increased consumption of refined carbohydrates and the epidemic of type 2 diabetes in the United States: an ecologic assessment. Am J Clin Nutr. 2004 May;79(5):774-9.
36. Stanhope KL. Role of fructose-containing sugars in the epidemics of obesity and metabolic syndrome. Annu Rev Med. 2012;63:329-43.
37. Marriott BP, Olsho L, Hadden L, Connor P. Intake of added sugars and selected nutrients in the United States, National Health and Nutrition Examination Survey (NHANES) 2003-2006. Crit Rev Food Sci Nutr. 2010 Mar;50(3):228-58.
38. Thresher JS, Podolin DA, Wei Y, Mazzeo RS, Pagliassotti MJ. Comparison of the effects of sucrose and fructose on insulin action and glucose tolerance. Am J Physiol Regul Integr Comp Physiol. 2000 Oct;279(4):R1334-40.
39. Bocarsly ME, Powell ES, Avena NM, Hoebel BG. High-fructose corn syrup causes characteristics of obesity in rats: increased body weight, body fat and triglyceride levels. Pharmacol Biochem Behav. 2010 Nov;97(1):101-6.
12
40. Greish K, Thiagarajan G, Herd H, Price R, Bauer H, Hubbard D, et al. Size and surface charge significantly influence the toxicity of silica and dendritic nanoparticles. Nanotoxicology. 2011 Jul 28.
41. Ruff JS, Nelson AC, Kubinak JL, Potts WK. MHC signaling during social communication. In: Lopez-Larrea C, editor. Austin, Self and Nonself. Austin: Landes Bioscience; 2012. p. 290-313.
42. Yamazaki K, Boyse EA, Mike V, Thaler HT, Mathieson BJ, Abbott J, et al. Control of mating preferences in mice by genes in the major histocompatibility complex. J Exp Med. 1976;144:1324-35.
43. Potts WK, Manning CJ, Wakeland EK. Mating patterns in seminatural populations of mice influenced by MHC genotype. Nature. 1991;352:619-21.
44. Bos DH, Williams RN, Gopurenko D, Bulut Z, Dewoody J. Condition-dependent mate choice and a reproductive disadvantage for MHC-divergent male tiger salamanders. Molecular Ecology. 2009;18(15):3307-15.
45. Freeman-Gallant CR, Meguerdichian M, Wheelwright NT, Sollecito SV. Social pairing and female mating fidelity predicted by restriction fragment length polymorphism similarity at the major histocompatibility complex in a songbird. Molecular Ecology.2003 Nov;12(11):3077-83.
46. Reusch TB, Haberli MA, Aeschlimann PB, Milinski M. Female sticklebacks count alleles in a strategy of sexual selection explaining MHC polymorphism. Nature. 2001 Nov 15;414(6861):300-2.
47. Olsson M, Madsen T, Nordby J, Wapstra E, Ujvari B, Wittsell H. Major histocompatibility complex and mate choice in sand lizards. Proceedings of the Royal Society of London Series B-Biological Sciences. 2003 Nov 7;270:S254-S6.
48. Leinders-Zufall T, Brennan P, Widmayer P, S PC, Maul-Pavicic A, Jager M, et al. MHC class I peptides as chemosensory signals in the vomeronasal organ. Science. 2004 Nov 5;306(5698):1033-7.49. Spehr M, Kelliher KR, Li XH, Boehm T, Leinders-Zufall T, Zufall F. Essential role of the main olfactory system in social recognition of major histocompatibility complex peptide ligands. J Neurosci. 2006 Feb 15;26(7):1961-70.
CHAPTER 2
HUMAN-RELEVANT INTAKE OF DIETARY FRUCTOSE
DECREASES MOUSE COMPETITIVE ABILITY,
SURVIVAL AND REPRODUCTION
James S. Ruff1, Amanda K. Suchy1, 2, Sara A. Hugentobler1, Mirtha M. Sosa1, Bradley L.
Schwartz1, Linda C. Morrison1, Sin H. Gieng3, Mark K. Shigenaga3 & Wayne K. Potts1
1 Department of Biology, University of Utah, Salt Lake City, UT. 2 School of Life
Sciences, Arizona State University, Tempe, AZ. 3 Nutrition and Metabolism Center,
Children's Hospital Oakland Research Institute, Oakland, CA
Summary paragraph
Health impacts of fructose intake at human-relevant concentrations have been
difficult to study in rodent models, as unnaturally high doses have been required to
demonstrate disease phenotypes. Fructose has increased in the American diet by 50%
since the 1970s and over this same period the proportion of individuals suffering from
metabolic diseases has dramatically increased1. Fructose consumption has been indicated
as a factor in the development of cardiovascular disease, fatty liver, metabolic syndrome,
obesity, and type-2 diabetes2-6. However, rodent studies concerning health impacts of
fructose have exclusively focused on doses above 20% Kcal for liquid calories and 50%
for dry, and therefore largely characterize effects that are outside of the range of typical
human exposure7-10. Here we report data produced by a novel methodology referred to as
Organismal Performance Assays (OPAs), in which fructose-treated (12.5% Kcal) and
control mice compete in seminatural enclosures for territories, resources, and mates.
Within enclosures fructose-fed females experienced a two-fold increase in mortality
while males fed fructose controlled 26% fewer territories and produced 25% less
offspring. These findings represent the lowest observed adverse effect level (LOAEL)
reported to date for fructose and highlight that fructose-induced physiological impairment
can be substantial even when clinical endpoint measures are negative or inconclusive.
These and other data suggest that OPAs are an innovative technique for detecting
mammalian health decline and could have important utility in toxicity assessment of
dietary components, environmental exposures, pharmaceuticals and other treatments.
Main body
Mechanisms for how fructose contributes to obesity, de novo lipogenesis, lipid
deregulation and insulin resistance have been recently reviewed11. Support for these
mechanisms is seen in rodent models where high-levels of fructose consumption has been
shown to increase adiposity, levels of fasting cholesterol and triglycerides, impair glucose
tolerance and promote inflammation7-10. However, rodent studies evaluating health
impacts of fructose have exclusively focused on doses outside of the range of human
exposure.
To sensitively assess whether the consumption of fructose decreases mouse
health, as measured by survival, competitive ability and reproduction (common measures
of evolutionary fitness), at human-relevant concentrations we utilized a novel technique,
which we refer to as Organismal Performance Assays (OPAs). OPAs are sensitive
14
phenotyping approaches that use seminatural conditions to challenge the physiological
performance of control and experimental animals in direct competition with each other. It
is this competition that reveals performance differences between treatment and control
individuals. The relative success of control and experimental animals can be compared
for any measurable component of fitness. Though the OPA moniker has been recently
derived, the technique has been used to detect mating preferences due to major
histocompatibility genes and to quantify adverse consequences associated with cousin
and sibling-level inbreeding as well as costs of bearing a selfish genetic element12-15. In
all cases OPAs quantified substantial health impacts that had been missed by studies
using standard laboratory methodologies.
Here we use OPAs to test if fructose exposure at a concentration of 12.5% Kcal, a
level currently consumed by 13-25% of Americans, decreases mouse health1,16.
Additionally, we monitor common metabolic endpoints between experimental and
control animals to determine if established mechanisms correlate with whole organism
phenotypes observed in OPAs.
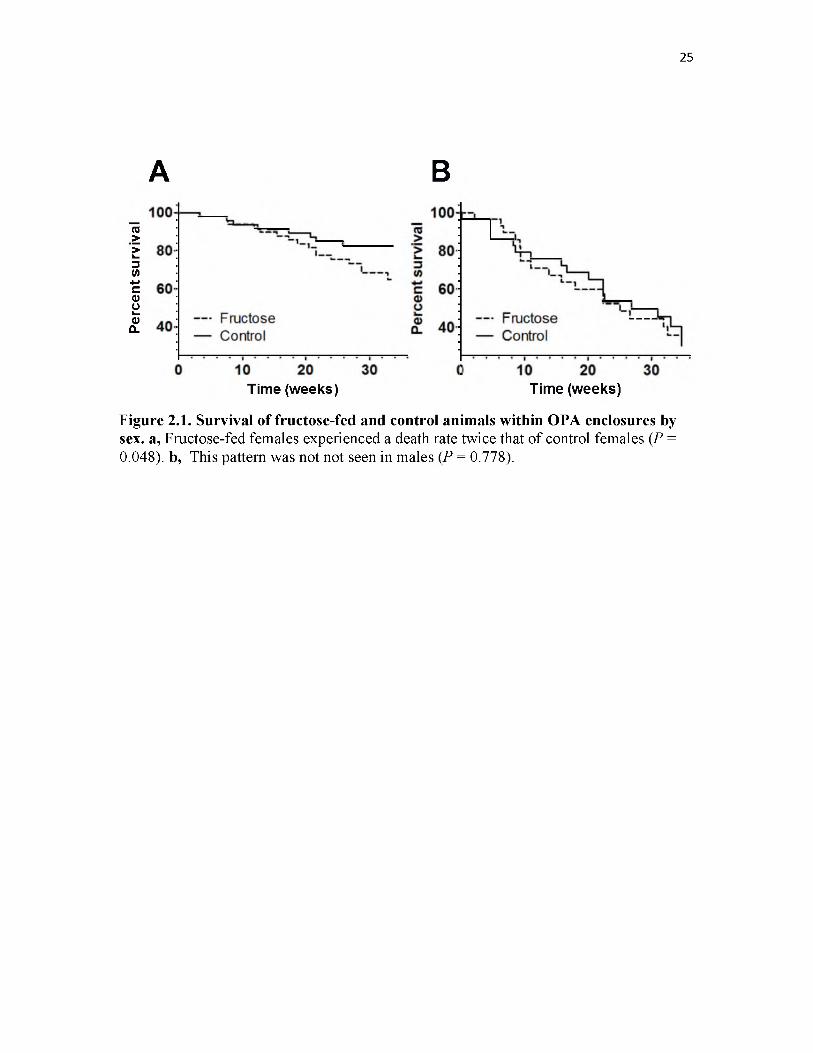
Survival of female animals within OPA enclosures was impacted by diet, with
fructose-fed females experiencing death rates 1.97 times higher than controls
(Proportional Hazards (PH), P = 0.048); Fig. 2.1a). There was no difference in survival
among replicate populations (PH, P = 0.351) nor did the impact of diet differ among
replicate populations (PH, P = 0.554).
In regards to male survival, no relationship between diet and survival was
detected (PH, P = 0.777); Fig. 2.1b). Survival did not differ among replicate populations
15
16
(PH, P = 0.438) nor did the impact of diet differ among replicate populations (PH, P =
0.311).
Male competitive ability was adversely affected by fructose feeding, with
fructose-fed animals defending 25.9% fewer territories than control males throughout the
study. At week three (model intercept) control males occupied 47.9% of territories and
fructose-fed males only 35.5%. This difference was found to be significant (Generalized
Linear Mixed Model (GLMM), P = 0.036). No effects of time or diet by time were
detected on territorial acquisition indicating that the competitive advantage of control
males was consistently maintained throughout the study. For a complete readout of all
mixed model results see Table S2.1.
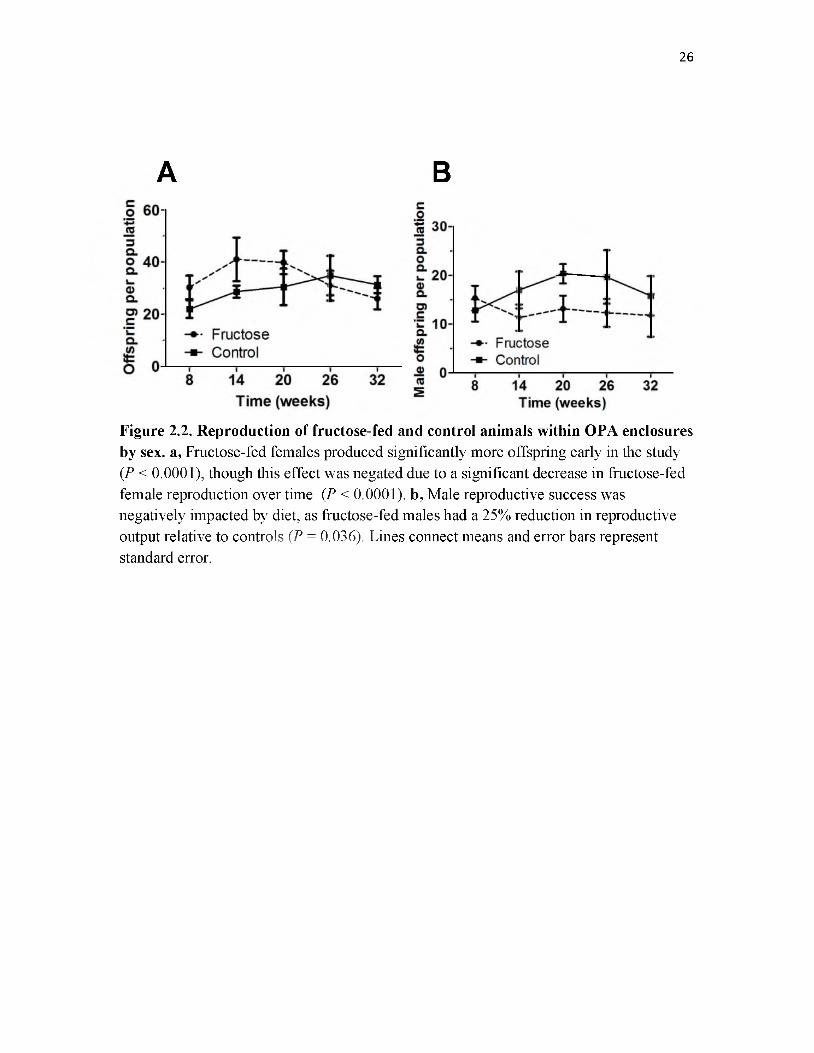
Female reproductive success was impacted by diet in two distinct and opposing
ways (Fig. 2.2a). First, reproduction of control females at week eight (model intercept)
was 23.81 ± 2.71 (M ± S.E.M.) offspring per population and for fructose-fed females it
was 36.24 ± 3.11 offspring per population, this difference was significant (GLMM, P <
0.0001). Second, while the reproductive output of control females increased significantly
over time at a rate of 1.02 ± 0.01 offspring per week (GLMM, P = 0.042), fructose-fed
animals exhibited significantly reduced reproduction rate of -0.99 ± 0.00 offspring per
week, the rates between fructose-fed and control females significantly differed (GLMM,
P < 0.0001).
Male reproductive success was negatively impacted by diet, with fructose-fed
males siring 25.3% fewer offspring per population than controls (Fig. 2.2b). Diet did not
significantly affect the level of reproduction at week eight (model intercept) with control
males producing 14.21 ± 1.88 (M ± S.E.M.) male offspring per population and fructose-
fed males producing 14.94 ± 1.99. However, there was a significant diet by time
interaction causing fructose-fed males to sire 0.98 ± 0.05 fewer male offspring per week
per population than controls (GLMM, P = 0.035). A marginally significant effect of time
alone on male reproduction was also found (GLMM, P = 0.088).
Diet did not impact the mass of population founders at week zero (Fig. S2.1). Nor
did the diets have differential impacts on mass over time or between the sexes.
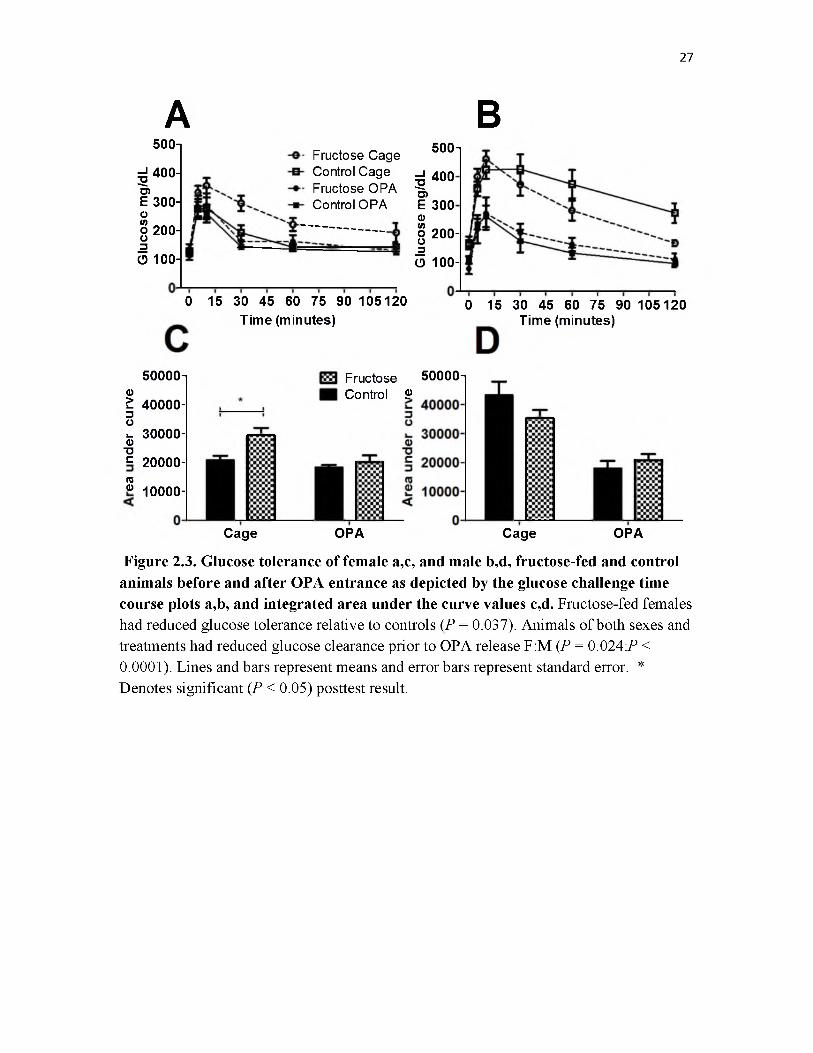
Female glucose tolerance, as assessed by intraperitoneal glucose tolerance tests
(IPGTT), was impacted by both diet and environment (Fig. 2.3a,c); fructose-fed females
had decreased rates of glucose clearance overall (ANOVA, N = 39, P = 0.037) as did
females in cages before OPA release compared to those inhabiting OPA enclosures
(ANOVA, P = 0.024). No interaction between diet and environment was detected
(ANOVA, P = 0.182). With posthoc tests, only the difference between dietary groups in
cages prior to OPA entrance was found to be significant. In cages fructose-fed females
had Area Under the Curve (AUC) values 1.42 times higher than controls (Fructose-fed
29,384 ± 2,597: Control 20,719 ± 1,692 mg/dL/120 minutes).
Male glucose clearance rates were not affected by diet (ANOVA, N = 25, P =
0.519), though, like females, there was a large effect of environment, with males in cages
prior to OPA release having higher levels then postrelease (ANOVA, P < 0.0001; Fig.
2.3b,d). No interaction between diet and environment was detected (ANOVA, P = 0.190).
Fasting measures of plasma cholesterol, glucose, insulin, and triglycerides of both
female and male animals prior to OPA entrance were not impacted by diet. All plasma
measure data were also analyzed with the sexes combined revealing that total cholesterol
17
was 1.69 times higher in fructose-fed animals (t-test, t =2.271, df = 30, P = 0.031; Table
S2.2).
Though nearly twice as many fructose-fed females died there was no clear pattern
detected in regards to female reproductive success. Female reproduction was difficult to
interpret as fructose-fed females had significantly higher reproduction early in the study
as well as significantly lower reproduction as the study progressed. The decreased
reproduction over time experienced by fructose-fed females was likely due to their
significantly increased mortality. It is not surprising to see milder treatment-induced
reproductive effects in females than males, as this has been seen in previous OPA
studies13-15.
Overall, fructose-fed males were outcompeted by control animals as measured by
competitive ability and reproduction. Since death rates did not differ, it is likely that the
lower reproduction of fructose males was due to their decreased ability to defend
territories. The relationship between competitive ability and reproductive success is well
established and has been seen before in OPAs13-15.
Cholesterol was the only fasting plasma measure that may be predictive of the
organismal impairment exhibited by fructose-fed animals in OPAs as no difference was
seen in plasma glucose, insulin, or triglyceride concentrations. These data provide partial
support that the fructose-fed animals may be suffering from increased levels of lipid
deregulation prior to OPA entrance.
Impaired glucose clearance rates of fructose-fed females compared to controls
prior to OPA entrance may reflect an as of yet to be identified physiological alteration
that may underlie and be predictive of increased risk of death within OPA enclosures.
18
However, this impairment in glucose clearance disappears within two weeks of residing
in OPAs, well before the majority of deaths have occurred. No similar observations were
made in regards to male glucose clearance. The sex-specific nature of these findings is
interesting and may be due to the intense metabolic demands experienced by females
undergoing gestation and lactation. The finding that both dietary groups, as well as both
sexes, markedly increased their rates of glucose clearance after entering OPAs is likely
due to increased activity demanded by their new environment17.
The above findings provide direct evidence of adverse health impacts due to
fructose intake at 12.5% Kcal. The increased rates of mortality and decreased
reproduction observed in this study now represent the LOAEL for dietary fructose. These
adverse organismal-level findings are detectable while standard clinical measures are
either unaltered, (mass, glucose, insulin, and triglycerides) or inconclusive (cholesterol
and glucose tolerance), indicating that either our current mechanistic understanding of
fructose induced toxicity is incomplete and/or that available clinical measures are not of
sufficient sensitivity to reflect the physiological impairments leading to early death in
females and drop in reproductive capacity in males.
We detected substantial adverse outcomes due to an added sugar exposure
consisting of a 1:1 ratio of fructose and glucose amounting to 25% Kcal. Our results
provide evidence that added sugar consumed at concentrations currently considered safe
exerts dramatic adverse impacts on mammalian health18,19. Many researchers have
already made calls for reevaluation of these safe levels of consumption11; whereas, others
have advocated for more drastic regulatory measures to curtail sugar consumption20.
19
Though OPAs detected profound differences in reproductive output and survival
between fructose-fed and control animals the results from our studies are likely
conservative. First, OPAs were terminated at 34 weeks because of the common, diet
independent, high-rates of male attrition; it is likely that if the study continued for the
entirety of the mouse lifespan that reproductive outputs between the treatments would
continue to diverge. Second, at the start of OPA assessment all animals were put on the
same fructose enriched diet, meaning that all of the adverse effects of the “fructose diet”
are a consequence of exposure prior to OPA entrance. Third, our fructose diet was based
on a modified chow and not a refined diet; meaning that our fructose-fed animals showed
impairment despite having the remainder of their diet being highly nutritive with
optimum mineral and vitamin composition.
Quantifying the ultimate negative impact on a mammal due to a treatment is a
difficult undertaking and requires long-term studies that follow subjects, as they inhabit a
relevant environment with associated stresses. Because of this, such studies have largely
fallen under the purview of human epidemiology or clinical trials. By directly assessing
the impacts of a treatment on the performance of house mice in OPAs we are capable of
bridging the environmental relevance and longitudinal nature of human studies with the
controllability and feasibility of animal models. These fructose data along with other
similar successes using OPAs suggest that this and similar approaches will be an
important tool in the detection and quantification of adversity caused by a wide array of
treatments13-15. Since output measures (survival, competitive ability and reproduction) are
similar across experiments, OPAs allow for the direct comparison of disparate treatments.
For example our data indicate that this fructose diet is as detrimental to male reproduction
20
21
as cousin-level inbreeding (Fig. S2.2). Currently, there is a great need for sensitive
toxicity assessment methods that work across a broad range of experimental
manipulations. This need is particularly strong for both pharmaceutical science where
73% of drugs that pass preclinical trials fail due to safety concerns and for toxicology,
where shockingly few compounds receive long-term testing21,22.
Methods summary
Wild derived house mice were exposed under caged conditions to either a diet
containing a 1:1 ratio of fructose and glucose monosaccharides amounting to 25% Kcal
from added sugar (fructose diet), or to a control diet (free of added-sugar) from weaning
through adulthood. Experimental and control animals (n=156) were then used to cofound
six independent OPA populations (Fig. S2.3). Once in OPAs, all mice were fed the
fructose diet. Populations were maintained for 32 weeks and differential performance
between control and experimental founders was monitored for survival, competitive
ability, and reproduction. Survival was ascertained by periodic checking for corpses,
competitive ability through the use of passive integrated transponder (PIT) tags and PIT
tag readers, and reproduction by genetically analyzing offspring produced within
enclosures. Founder mass was assessed over the course of the study. In an additional
population not used to assess any of the above endpoints, glucose tolerance was assessed
in individuals before OPA entrance and again two weeks after release. Fasting
cholesterol, glucose, insulin, and triglycerides, were also measured in a subset of animals
at the end of the dietary exposure.
1
2
3
4
5
6
7
8
9
10
11
12
13
22
References
Vos, M. B., Kimmons, J. E., Gillespie, C., Welsh, J. & Blanck, H. M. Dietary fructose consumption among US children and adults: the Third National Health and Nutrition Examination Survey. Medscape J Med 10, 160, (2008).
Fung, T. T. et al. Sweetened beverage consumption and risk of coronary heart disease in women. Am J Clin Nutr 89, 1037-1042, (2009).
Ouyang, X. et al. Fructose consumption as a risk factor for non-alcoholic fatty liver disease. J Hepatol 48, 993-999, (2008).
Dhingra, R. et al. Soft drink consumption and risk of developing cardiometabolic risk factors and the metabolic syndrome in middle-aged adults in the community. Circulation 116, 480-488, (2007).
Bray, G. A., Nielsen, S. J. & Popkin, B. M. Consumption of high-fructose corn syrup in beverages may play a role in the epidemic of obesity. Am J Clin Nutr 79, 537-543, (2004).
Gross, L. S., Li, L., Ford, E. S. & Liu, S. Increased consumption of refined carbohydrates and the epidemic of type 2 diabetes in the United States: an ecologic assessment. Am J Clin Nutr 79, 774-779, (2004).
Jurgens, H. et al. Consuming fructose-sweetened beverages increases body adiposity in mice. Obes Res 13, 1146-1156, (2005).
Kelley, G. L., Allan, G. & Azhar, S. High dietary fructose induces a hepatic stress response resulting in cholesterol and lipid dysregulation. Endocrinology 145, 548555, (2004).
Thresher, J. S., Podolin, D. A., Wei, Y., Mazzeo, R. S. & Pagliassotti, M. J. Comparison of the effects of sucrose and fructose on insulin action and glucose tolerance. Am J Physiol Regul Integr Comp Physiol 279, R1334-1340, (2000).
Bergheim, I. et al. Antibiotics protect against fructose-induced hepatic lipid accumulation in mice: role of endotoxin. J Hepatol 48, 983-992, (2008).
Stanhope, K. L. Role of fructose-containing sugars in the epidemics of obesity and metabolic syndrome. Annu Rev M ed 63, 329-343, (2012).
Potts, W. K., Manning, C. J. & Wakeland, E. K. Mating patterns in seminatural populations of mice influenced by MHC genotype. Nature 352, 619-621, (1991).
Ilmonen, P. et al. Experimental infection magnifies inbreeding depression in house mice. Journal o f Evolutionary Biology 21, 834-841, (2008).
23
14 Meagher, S., Penn, D. J. & Potts, W. K. Male-male competition magnifies inbreeding depression in wild house mice. Proc. Natl. Acad. Sci. U.S.A. 97, 33243329., (2000).
15 Carroll, L. S., Meagher, S., Morrison, L., Penn, D. J. & Potts, W. K. Fitness effects of a selfish gene are revealed in an ecological context. Evolution 58, 13181328, (2004).
16 Marriott, B. P., Olsho, L., Hadden, L. & Connor, P. Intake of added sugars and selected nutrients in the United States, National Health and Nutrition Examination Survey (NHANES) 2003-2006. Crit Rev Food Sci Nutr 50, 228-258, (2010).
17 Suzuki, M., Shindo, D., Kimura, M. & Waki, H. Effects of exercise, diet, and their combination on metabolic-syndrome-related parameters in OLETF rats. Int J Sport Nutr Exerc Metab 21, 222-232, (2011).
18 Naitonal Research Council. Dietary Reference Intakes for Energy, Carbohydrate, Fiber, Fat, Fatty Acids, Cholesterol, Protein, and Amino Acids (Macronutrients). (The National Academies Press, 2005).
19 Dietary Guidelines Advisory Committee. Report of the Dietary Guidelines Advisory Committee (DGAC) on the Dietary Guidelines for Americans, (2010).
21 Lipsky, M. S. & Sharp, L. K. From idea to market: the drug approval process. J Am BoardFam Pract 14, 362-367, (2001).
22 Nel, A., Xia, T., Madler, L. & Li, N. Toxic potential of materials at the nanolevel. Science 311, 622-627, (2006).
Acknowledgements and contributions
Acknowledgements
We thank D. Dearing and A. Torregrossa for aid in experimental design; S.
Laverty for statistical modeling assistance; and P. Ault, S. Ault, D. Pearson and R.
Tanner for help in data collection. This work was supported by NIH grant RO1-
GM039578 and was partially conducted while W.K.P was supported by NSF grant DEB
09-18969. J.S.R. was supported by an NSF GK-12 Educational Outreach Fellowship
(DGE 08-41233). M.M.S. was supported by the NSF funded Western Alliance to Expand
Student Opportunities (WAESO).
Author Contributions
J.S.R, M.K.S., and W.K.P designed the experiment. J.S.R., A.K.S, S.A.H,
M.M.S., B.L.S, and L.C.M. maintained OPA enclosures and collected the associated data.
J.S.R. and A.K.S collected plasma. S.H.G. obtained plasma measures. J.S.R analyzed
data and wrote the manuscript. All authors discussed results and commented on the
manuscript.
24
Per
cen
t su
rviv
al
25
A B
Time (weeks) Time (weeks)
Figure 2.1. Survival of fructose-fed and control animals within OPA enclosures by sex. a, Fructose-fed females experienced a death rate twice that of control females (P = 0.048). b, This pattern was not not seen in males (P = 0.778).
26
A B
Figure 2.2. Reproduction of fructose-fed and control animals within OPA enclosures by sex. a, Fructose-fed females produced significantly more offspring early in the study (P < 0.0001), though this effect was negated due to a significant decrease in fructose-fed female reproduction over time (P < 0.0001). b, Male reproductive success was negatively impacted by diet, as fructose-fed males had a 25% reduction in reproductive output relative to controls (P = 0.036). Lines connect means and error bars represent standard error.
A B
27
500n
^ 400-"5>E 300H o ino 200Ho _2O 100-
Fructose Cage Control Cage Fructose OPA Control OPA
500-I
^ 400O)E 300 o in o o _2O 100-
200 -
0 15 30 45 60 75 90 105120 Time (minutes)
0 15 30 45 60 75 90 105120 Time (minutes)
50000-1<u>L.3Oi_a>T3cTOa>
40000-
30000-
20000 -
10000 -
Fructose Control ?
50000-1
Cage OPA Cage OPA
Figure 2.3. Glucose tolerance of female a,c, and male b,d, fructose-fed and control animals before and after OPA entrance as depicted by the glucose challenge time course plots a,b, and integrated area under the curve values c,d. Fructose-fed females had reduced glucose tolerance relative to controls (P = 0.037). Animals of both sexes and treatments had reduced glucose clearance prior to OPA release F:M (P = 0.024P < 0.0001). Lines and bars represent means and error bars represent standard error. * Denotes significant (P < 0.05) posttest result.
Supplementary methods
Animals
Outbred, wild-derived house mice (Mus musculus) were used in this study, since
many laboratory strains do not possess the functional behaviors required for OPA
assessment1. Individuals in this study were from the 10th and 11th generation of the
colony originally described by Meagher et al.2. Before animals were released into OPA
enclosures they were housed according to standard protocols under a 12:12h light:dark
cycle with food and water available ad libitum. All protocols were approved by and
conducted under the animal care guidelines of the IACUC at the University of Utah.
Dietary exposure
Exposure to specified diets began at weaning and continued until animals were
released into OPA enclosures approximately 26 weeks later. At the time of weaning a
litter was split in half and assigned to either the treatment or control group. The Fructose
diet (TD.05668) (Harlan Teklad, Madison, WI) contained 25% Kcal from a 1:1 mixture
of fructose and glucose monosaccharides, and therefore has the same ratio of these
monosaccharides as sucrose and approximately that of the 55:41 ratio found in the high
fructose corn syrup (HFCS) used in soft drinks (or 42:53 ratio found in HFCS used in
many food preparations). The control diet (TD.05669) (Harlan Teklad, Madison, WI) is
identical except for the component coming from the fructose and glucose
monosaccharides is replaced by cornstarch and a small amount of raw fiber used to offset
mass differences (See Tables S2.3 and S2.4). Upon entrance into OPA enclosures all
individuals consume the fructose diet.
28
OPA enclosures
OPA enclosures are indoors, measure about 5m by 7m (35m2), and each pen is
subdivided into six subsections by hardware cloth, which provides spatial complexity
(Fig. S2.3). Each subsection has food and water that is associated with a set of nest boxes
in either one of four “optimal” territories, which contain nest boxes in enclosed structures
or two “suboptimal” territories with nest boxes in the open. Optimal nest boxes were
made of covered plastic storage bins (75 liter) with 5cm diameter entryways and
contained four standard mouse cages (also with 5cm entryways), bedding, and food. The
suboptimal nest boxes made of plastic planter boxes (61cm long by 15cm wide by 19cm
high) fitted with chicken-wire lids and 5cm circular entryways; food containers and one
gallon poultry waterers were adjacent to these nest boxes and both provided ad libitum
resource access. Together, the hardware fences and the two types of nest boxes created
environmental complexity in which mice established nesting sites, territorial boundaries,
and social hierarchies. OPA enclosures mimic habitat and social environment
experienced by mice in nature and the population density is representative of
measurements from wild populations3.
To assess impacts of fructose consumption on survival, competitive ability and
reproduction six OPA populations were founded by 22-28 individuals, 8-10 males and
14-18 females for a total of 156 individuals (58 male: 98 female). Equal numbers of
fructose-fed and control animals were represented for each sex within all populations. No
male individual was related at the cousin level or above to any other individual (male or
female) within a given population. Relatedness between female founders was also
avoided, though in several populations a single pair of sisters was included (a typical
29
condition in natural populations); when this was the case sister-pairs were balanced
across diets. Mean age of individuals at the time of population founding was 29.83 ± 3.60
(M ± S.D.) weeks for males and 30.64 ± 3.60 weeks for females. To prevent incidental
breeding before the establishment of male social territories, we released placeholder
(nonexperimental) females with the experimental males at the onset of each population.
After one week, the placeholder females were removed and the experimental females
were released into the enclosures marking the start (week one) of the OPA portion of the
study. Five of the six populations ran for 34 weeks, while the other replicate had to be
terminated early at 26 weeks due to attrition. A seventh population was established under
the same criteria above to collect blood samples from individuals under seminatural
conditions and ran for only six weeks. This seventh population was not used to assess
competitive ability, survival, or reproduction.
Male competitive ability
One week prior to entrance each founder was implanted with a unique passive
integrated transponder (PIT) tag (TX1400ST, BioMark, Boise ID). A set of PIT antennae
and readers (FS2001F-ISO, BioMark, Boise ID) were rotated through the six populations
at regular intervals throughout the study and placed at each of the optimal and suboptimal
feeders, and data were streamed to a computer equipped with data-logging software
(Minimon, Culver City, CA). Male social dominance was assigned when a male had
>75% of the PIT-tag reads at a single location over the course of a multi-day reader
session, and territories were designated as controlled by a fructose or control-fed male
based on the dietary exposure of the male controlling them. Female data were collected
30
but results are not reported here as not enough is known about female dominance
behavior to use it as a measure of performance.
Survivorship
Survivorship of population founders was determined by periodic checks in each
enclosure. Dead founders were identified by their PIT-tag ID or personalized ear punches
and removed from enclosures. Date of death was estimated based on three factors: date of
last check, the last date an animal was recorded at a feeding station, and the condition of
the corpse.
Reproductive success
Samples to determine the reproductive success of founders were gathered during
“pup sweeps” in which pups born during the previous cycle were removed from the
population, sacrificed and tissue samples taken for genetic analysis. The first sweep
occurred during week eight of the study and additional sweeps followed every six weeks.
This schedule prevented offspring born in the enclosures from breeding. In five of the six
populations five pup sweeps occurred while in the remaining replicate only four sweeps
were conducted. A total of 1,894 individual samples were collected with an average of
315.67 ± 65.54 (M ± S.D.) per population.
Population level reproductive success was determined for fructose and control
groups as described previously2. Briefly, in each competition enclosure male and female
founders of each treatment were categorized by a common allelic variant on the Y-
chromosome and mitochondrial genome, respectively. Allelic assignments were reversed
across populations to avoid possible confounding effects of allele types. We obtained
31
1836 (97% of total) mitochondrial and 870 Y- chromosome (92% of total assuming a
1:1sex ratio) genotypes.
Metabolic measures
In addition to OPA endpoints, traditional metabolic measures associated with
fructose-induced disease were taken including body mass, glucose tolerance, plasma
fasting cholesterol, glucose, insulin, and triglyceride concentrations. Body mass was
assessed in the 156 animals that founded the six OPA enclosures described above at the
time they were released into enclosures and at each of the pup sweeps, for a total of six
time points. Glucose tolerance was assessed in a different set of individuals composed of
24 females (16 fructose-fed and 8 controls) and 16 males (8 fructose-fed and 8 controls)
at two time points, prior to entrance into an OPA enclosure and again two weeks after
release. Finally, fasting concentrations of plasma cholesterol, glucose, insulin, and
triglycerides were assessed on a third set of 17 female (8 fructose-fed, 9 control) and 15
male (8 fructose-fed, 7 control) animals at the end of the dietary exposure period (i.e., the
time point that the OPA founders were released into enclosures).
Intraperitoneal Glucose Tolerance Tests (IPGTTs) were conducted by giving an
intraperitoneal injection of 1.5mg D-glucose/g body mass after an eight-hour fast. Blood
was collected from the retro-orbital sinus prior to glucose injection and 5, 10, 30, 60 and
120 minutes postinjection. This fast duration and bleeding technique were selected
because our wild-derived mice do not tolerate fasting or handling stress as well as
laboratory strains. Blood samples were immediately centrifuged at 10,000g for 10
minutes after which 8-10^l of plasma was decanted and flash frozen. Samples were
32
shipped on dry ice to the CHORI and glucose concentrations were assessed by the
hexokinase method4 .
Plasma samples for fasting cholesterol, glucose, insulin, and triglycerides were
collected and shipped in the same manner as those for IPGTT. Plasma glucose was
measured as described above. To determine plasma total cholesterol and triglyceride
concentrations, the Infinity Triglycerides or Cholesterol liquid stable reagent (Thermo
Scientific), respectively, were employed. Briefly, plasma or standards were added in
duplicate to a 96-well plate and the reagent was added and incubated at 37°C. Through a
series of reactions, a colored dye was formed in proportion to the concentration of
cholesterol or triglycerides and their levels were measured by the increase of absorbance
at 500 nm. Plasma insulin was determined using a direct sandwich ELISA (Mercodia,
Uppsala, Sweden). Briefly, plasma or standards were added to a detection antibody-
coated 96-well plate. After incubation together with a peroxidase conjugated detection
antibody, the substrate TMB was added and allowed to react and subsequently stopped
with H2SO4. A colored product was formed in proportion to the concentration of insulin
and its level was measured by the increase in absorbance at 450 nm. The homeostatic
model assessment of insulin resistance (HOMA-IR) was calculated by first multiplying
fasting insulin (mM) and glucose (mM) together, and then dividing by 22.55.
Statistical analysis
Survival. Survivorship of the 156 founders was analyzed by Cox proportional
hazard models with male and female animals assessed separately due to vastly different
mortality rates. Day one was defined as when animals entered OPA enclosures. A
multivariate model was used to assess the impacts of diet, population, and diet by
33
population. Individuals that survived the duration of the trial or that were removed from
the study were censored. In the male data set there were 34 events and 24 censorings
while in the female data set there were 24 events and 74 censorings.
Male competitive ability. To assess the main effects of diet and time (and a time
by diet interaction) on male competitive ability, we used a generalized linear mixed
model (GLMM) to predict the probability of ownership. As a territory can only be
defended or not, we used a binomial distribution with a logit link to assess the probability
of ownership. The numbers of territories controlled within populations by each dietary
treatment was assessed at multiple time points throughout the study for a total of 140
observations. The number of possible territories in each population is constant at six and
territories were occupied (by a mouse of either diet) or unoccupied. Time, diet and their
interaction were treated as fixed effects and population was modeled as a random effect
with a random intercept calculated for each.
Reproduction. As reproduction data are discrete counts, for each sex we modeled
offspring counts over time in a GLMM with a Poisson distribution and a logarithmic link.
The model assessed the main effects of diet and time and the interaction on population-
level reproduction across the six populations. Reproductive output of each dietary
treatment was measured five times (except for one population that was only measured
four times) at six-week intervals for a total of 58 observations. Time, diet and their
interaction were modeled as fixed effects and population was modeled as a random effect
with a random slope and intercept for females and only an intercept for males. The
intercept was set at week eight as this was the first time point for which data were
available and reproduction at week zero was biologically impossible. Male and female
34
reproduction data were analyzed separately as they were based on separate
measurements, with male reproduction being in terms of number of male offspring and
female reproduction in terms of total offspring.
Mass. A linear mixed-effects model (LMM) was used to assess the main effects
of diet, sex and time, as well as their respective interactions on the mass of the 156
population founders. As mass data are continuous, a normal distribution was assumed.
Diet, sex, time and their interaction were modeled as main fixed effects and individual
and population were modeled as random effects with a random intercept. The intercept
was set at week zero as this was the first time point for which data were available and
made biological sense. Founders were weighed at week zero and surviving individuals
were weighed across the five aforementioned pup sweeps for a total of 713 observations.
Due to nested random effects within the model degrees of freedom are not readily
calculable and therefore P values are not provided. The authors of the statistical package
suggest that estimates with |t| > 2 are deemed significantly different from zero.
IPGTT. The area under the curve (AUC) was calculated for plasma glucose
concentrations over time using the trapezoid rule. AUC values were calculated for all
individuals prior to OPA entrance and two weeks postrelease. Male and female data were
analyzed separately as sex has been shown to impact glucose tolerance6. AUC values
were compared across time points and dietary treatments using two-way analysis of
variance (ANOVA) with Bonferroni's posttests. Sample prior to OPA entrance was 23
females (15 fructose-fed and 8 controls) and 16 males (8 fructose-fed and 8 controls).
While the sample two weeks postentrance had 16 females (8 fructose-fed and 8 controls)
and 9 males (5 fructose-fed and 4 controls).
35
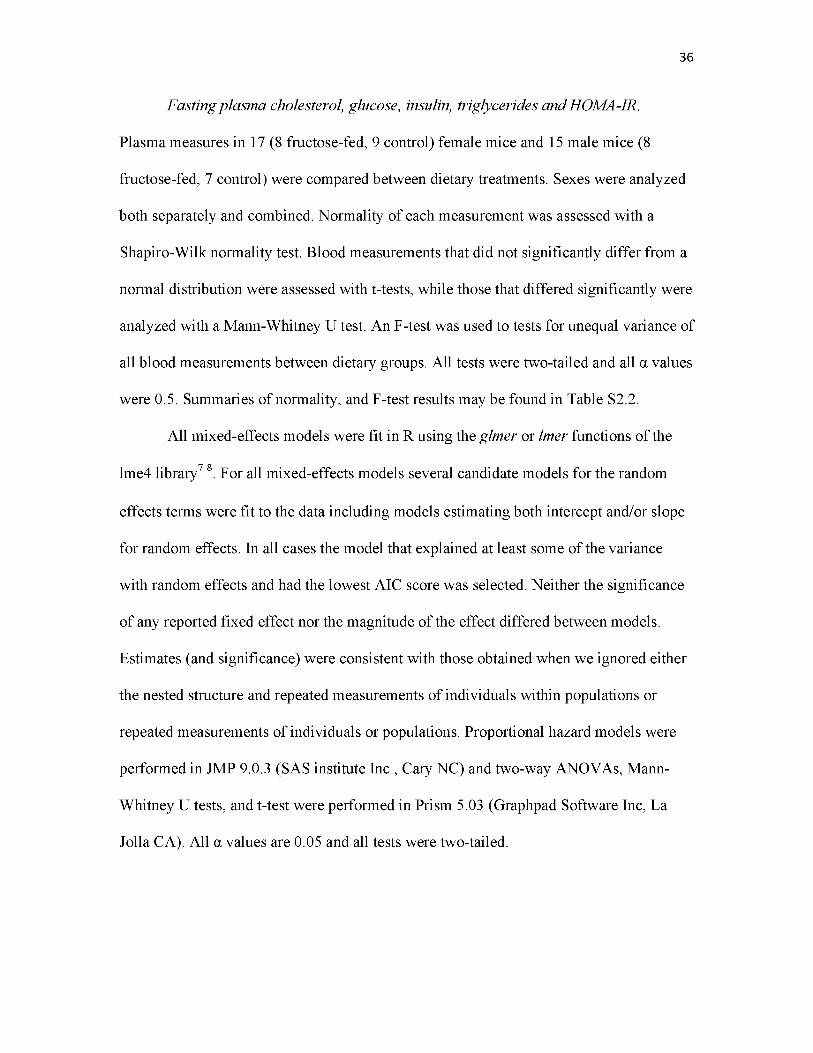
Fasting plasma cholesterol, glucose, insulin, triglycerides and HOMA-IR.
Plasma measures in 17 (8 fructose-fed, 9 control) female mice and 15 male mice (8
fructose-fed, 7 control) were compared between dietary treatments. Sexes were analyzed
both separately and combined. Normality of each measurement was assessed with a
Shapiro-Wilk normality test. Blood measurements that did not significantly differ from a
normal distribution were assessed with t-tests, while those that differed significantly were
analyzed with a Mann-Whitney U test. An F-test was used to tests for unequal variance of
all blood measurements between dietary groups. All tests were two-tailed and all a values
were 0.5. Summaries of normality, and F-test results may be found in Table S2.2.
All mixed-effects models were fit in R using the glmer or lmer functions of the
lme4 library7 8. For all mixed-effects models several candidate models for the random
effects terms were fit to the data including models estimating both intercept and/or slope
for random effects. In all cases the model that explained at least some of the variance
with random effects and had the lowest AIC score was selected. Neither the significance
of any reported fixed effect nor the magnitude of the effect differed between models.
Estimates (and significance) were consistent with those obtained when we ignored either
the nested structure and repeated measurements of individuals within populations or
repeated measurements of individuals or populations. Proportional hazard models were
performed in JMP 9.0.3 (SAS institute Inc., Cary NC) and two-way ANOVAs, Mann-
Whitney U tests, and t-test were performed in Prism 5.03 (Graphpad Software Inc, La
Jolla CA). All a values are 0.05 and all tests were two-tailed.
36
37
Supplem entary references
1 Manning, C. J., Potts, W. K., Wakeland, E. K. & Dewsbury, D. A. in Chemical Signals in Vertebrates Vol. VI (eds R.L. Doty & D. Muller-Schwarze) 229-235 (Plenum, 1992).
2 Meagher, S., Penn, D. J. & Potts, W. K. Male-male competition magnifies inbreeding depression in wild house mice. Proc. Natl. Acad. Sci. U.S.A. 97, 33243329., (2000).
3 Sage, R. D. in The Mouse in Biomedical Research Vol. I (eds H.L. Foster, J.D. Smalll, & J.G. Fox) 40-90 (Academic Press, 1981).
4 Slein, M. W. Methods o f Enzymatic Analysis. 117-123 (Academic Press, 1963).
5 Matthews, D. R. et al. Homeostasis model assessment: insulin resistance and beta-cell function from fasting plasma glucose and insulin concentrations in man. Diabetologia 28, 412-419, (1985).
6 Ayala, J. E. et al. Standard operating procedures for describing and performing metabolic tests of glucose homeostasis in mice. Dis ModelMech 3, 525-534, (2010).
7 R Development Core Team R: A language and environment for statistical computing (R Foundation for Statistical Computing, Vienna, Austria, 2012).
8 Bates, D., Maechler, M., & Bolker, B. lme4: Linear mixed-effects models using S4 classes v. R package version 0.999375-42 (2011).
9 Ilmonen, P. et al. Experimental infection magnifies inbreeding depression in house mice. Journal o f Evolutionary Biology 21, 834-841, (2008).
10 Carroll, L. S., Meagher, S., Morrison, L., Penn, D. J. & Potts, W. K. Fitness effects of a selfish gene are revealed in an ecological context. Evolution 58, 13181328, (2004).
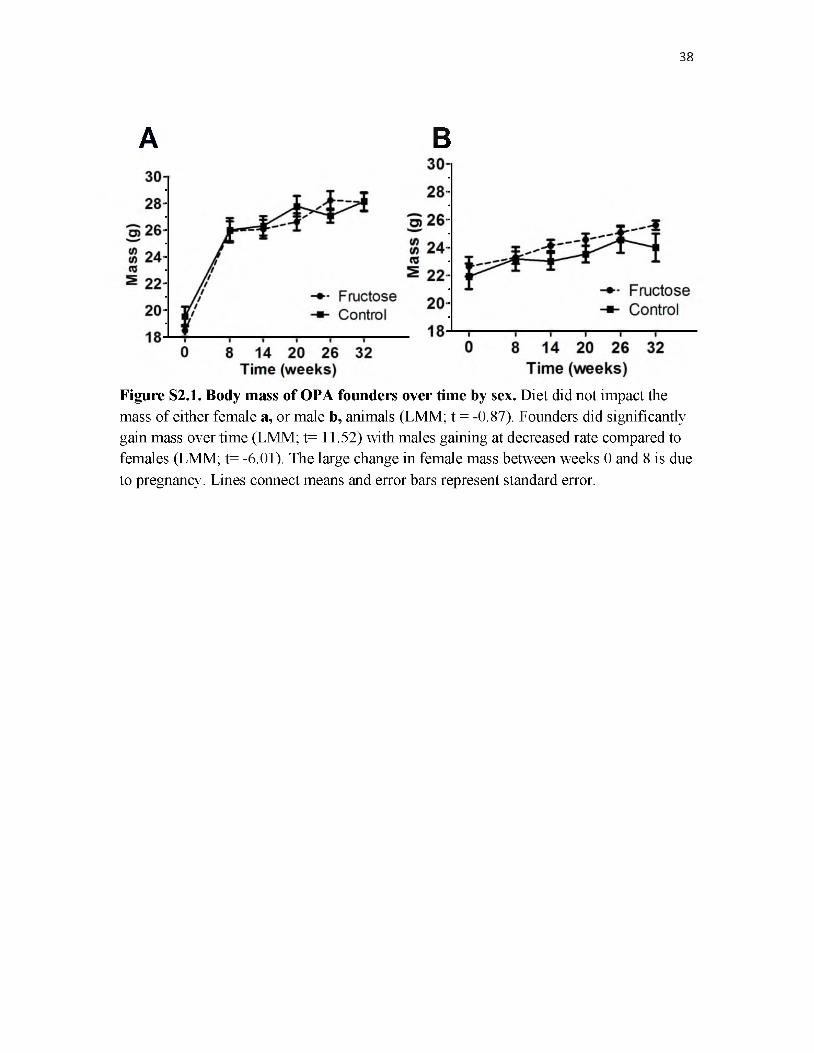
38
A B
Figure S2.1. Body mass of OPA founders over time by sex. Diet did not impact the mass of either female a, or male b, animals (LMM; t = -0.87). Founders did significantly gain mass over time (LMM; t= 11.52) with males gaining at decreased rate compared to females (LMM; t= -6.01). The large change in female mass between weeks 0 and 8 is due to pregnancy. Lines connect means and error bars represent standard error.
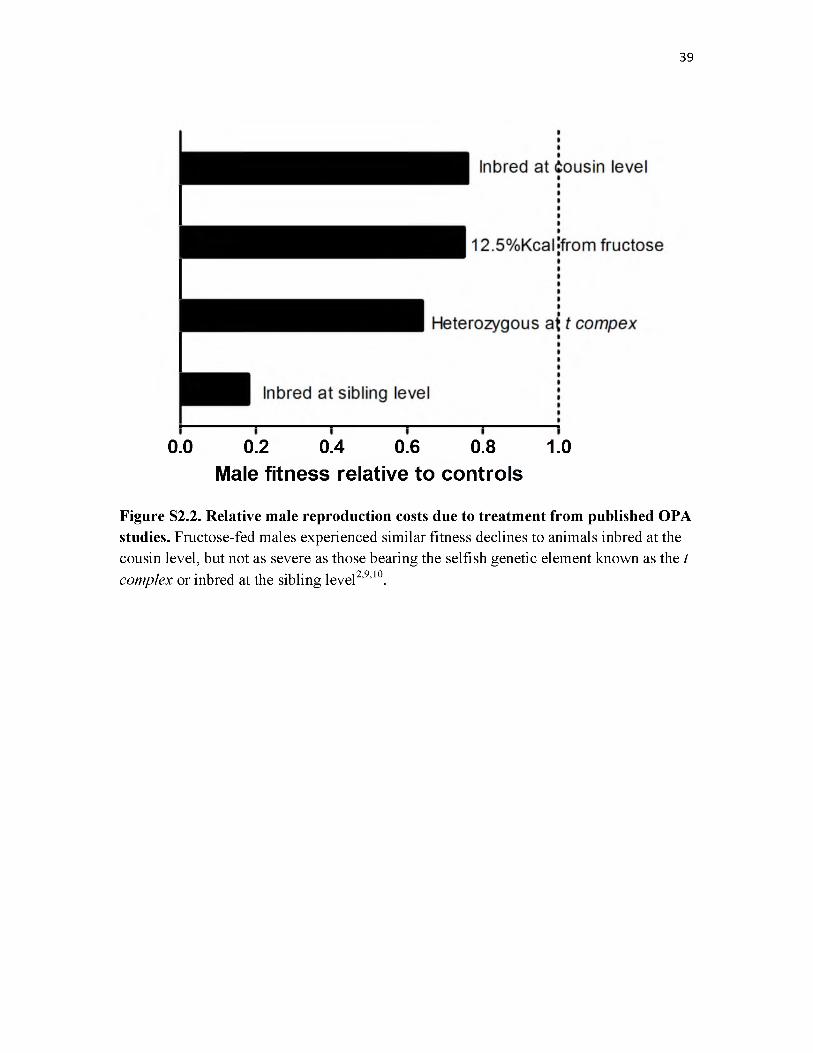
39
0.0 0.2 0.4 0.6 0.8 1.0 Male fitness relative to controls
Figure S2.2. Relative male reproduction costs due to treatment from published OPA studies. Fructose-fed males experienced similar fitness declines to animals inbred at the cousin level, but not as severe as those bearing the selfish genetic element known as the t complex or inbred at the sibling level2,9,10.
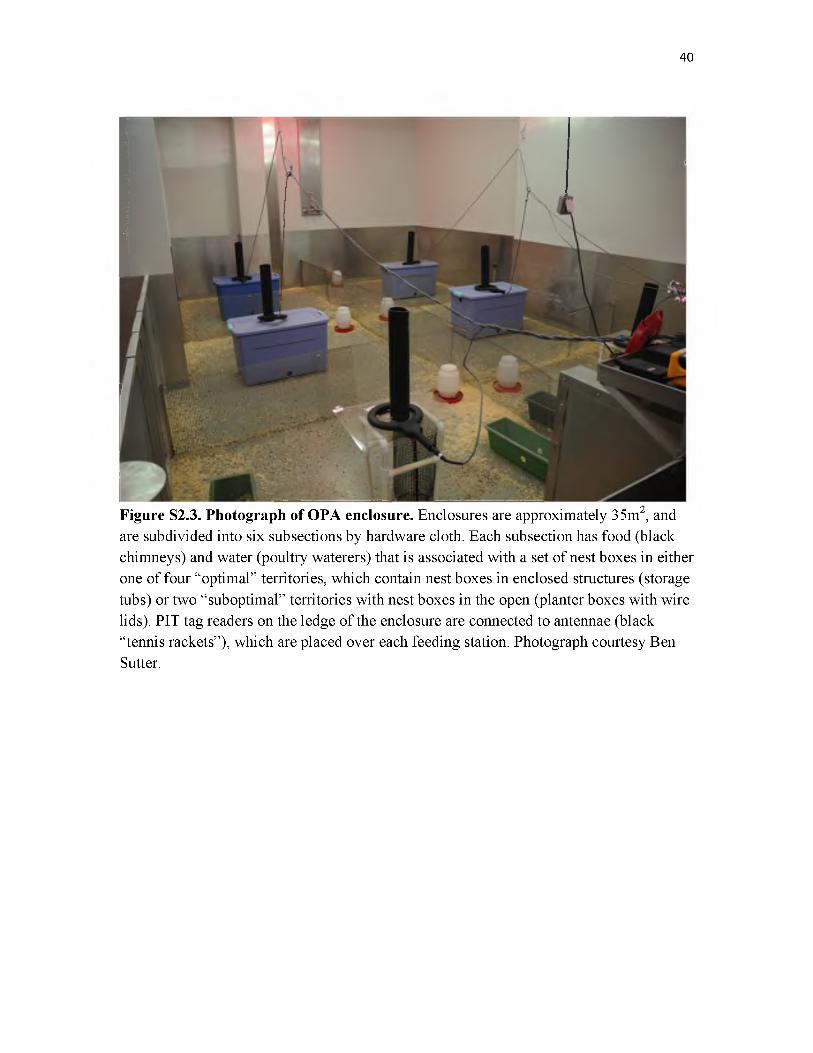
40
Figure S2.3. Photograph of OPA enclosure. Enclosures are approximately 35m2, and are subdivided into six subsections by hardware cloth. Each subsection has food (black chimneys) and water (poultry waterers) that is associated with a set of nest boxes in either one of four “optimal” territories, which contain nest boxes in enclosed structures (storage tubs) or two “suboptimal” territories with nest boxes in the open (planter boxes with wire lids). PIT tag readers on the ledge of the enclosure are connected to antennae (black “tennis rackets”), which are placed over each feeding station. Photograph courtesy Ben Sutter.
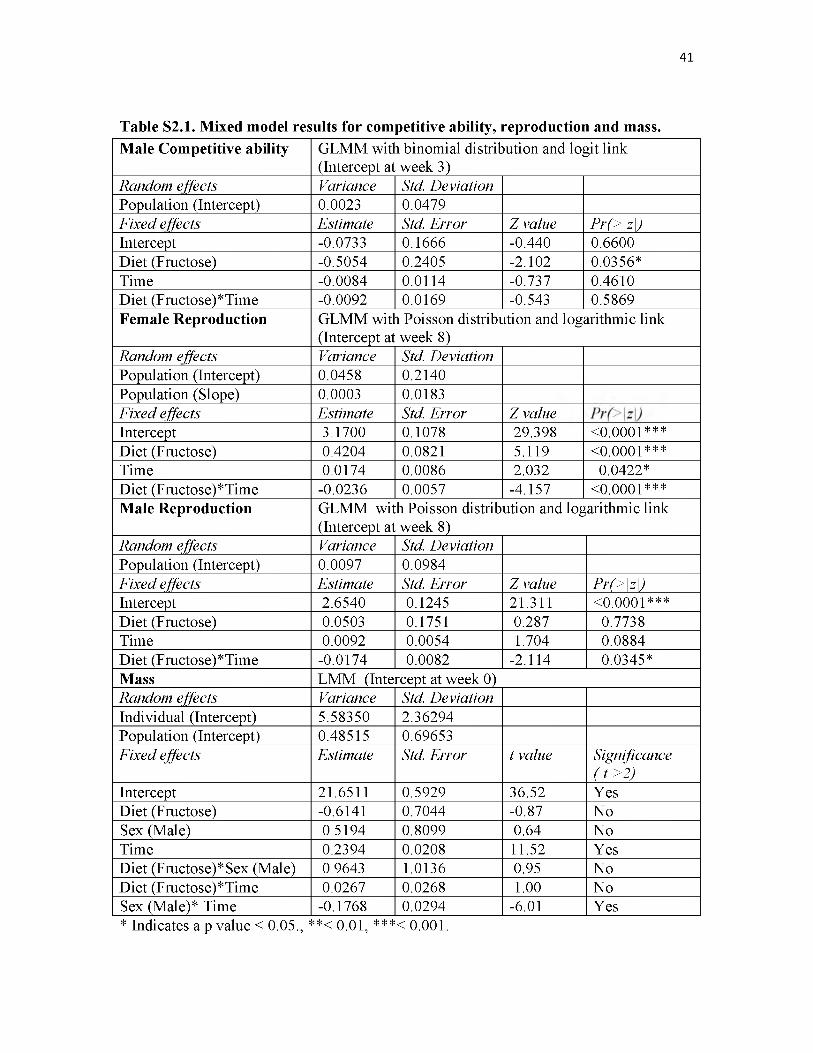
41
Table S2.1. Mixed model results for competitive ability, reproduction and mass.Male Competitive ability GLMM with binomial distribution and logit link
(Intercept at week 3)Random effects Variance Std. DeviationPopulation (Intercept) 0.0023 0.0479Fixed effects Estimate Std. Error Z value P r ^ ^ )Intercept -0.0733 0.1666 -0.440 0.6600Diet (Fructose) -0.5054 0.2405 -2.102 0.0356*Time -0.0084 0.0114 -0.737 0.4610Diet (Fructose)*Time -0.0092 0.0169 -0.543 0.5869Female Reproduction GLMM witl
(Intercept ati Poisson distribution and logarithmic link week 8)
Random effects Variance Std. DeviationPopulation (Intercept) 0.0458 0.2140Population (Slope) 0.0003 0.0183Fixed effects Estimate Std. Error Z valueIntercept 3.1700 0.1078 29.398 <0.0001***Diet (Fructose) 0.4204 0.0821 5.119 <0.0001***Time 0.0174 0.0086 2.032 0.0422*Diet (Fructose)*Time -0.0236 0.0057 -4.157 <0.0001***Male Reproduction GLMM with Poisson distribution and logarithmic link
(Intercept at week 8)Random effects Variance Std. DeviationPopulation (Intercept) 0.0097 0.0984Fixed effects Estimate Std. Error Z value P r ^ ^ )Intercept 2.6540 0.1245 21.311 <0.0001***Diet (Fructose) 0.0503 0.1751 0.287 0.7738Time 0.0092 0.0054 1.704 0.0884Diet (Fructose)*Time -0.0174 0.0082 -2.114 0.0345*Mass LMM (Intercept at week 0)Random effects Variance Std. DeviationIndividual (Intercept) 5.58350 2.36294Population (Intercept) 0.48515 0.69653Fixed effects Estimate Std. Error t value Significance
M>2)Intercept 21.6511 0.5929 36.52 YesDiet (Fructose) -0.6141 0.7044 -0.87 NoSex (Male) 0.5194 0.8099 0.64 NoTime 0.2394 0.0208 11.52 YesDiet (Fructose)*Sex (Male) 0.9643 1.0136 0.95 NoDiet (Fructose)*Time 0.0267 0.0268 1.00 NoSex (Male)* Time -0.1768 0.0294 -6.01 Yes* Indicates a p value < 0.05., **< 0.01, ***< 0.001.
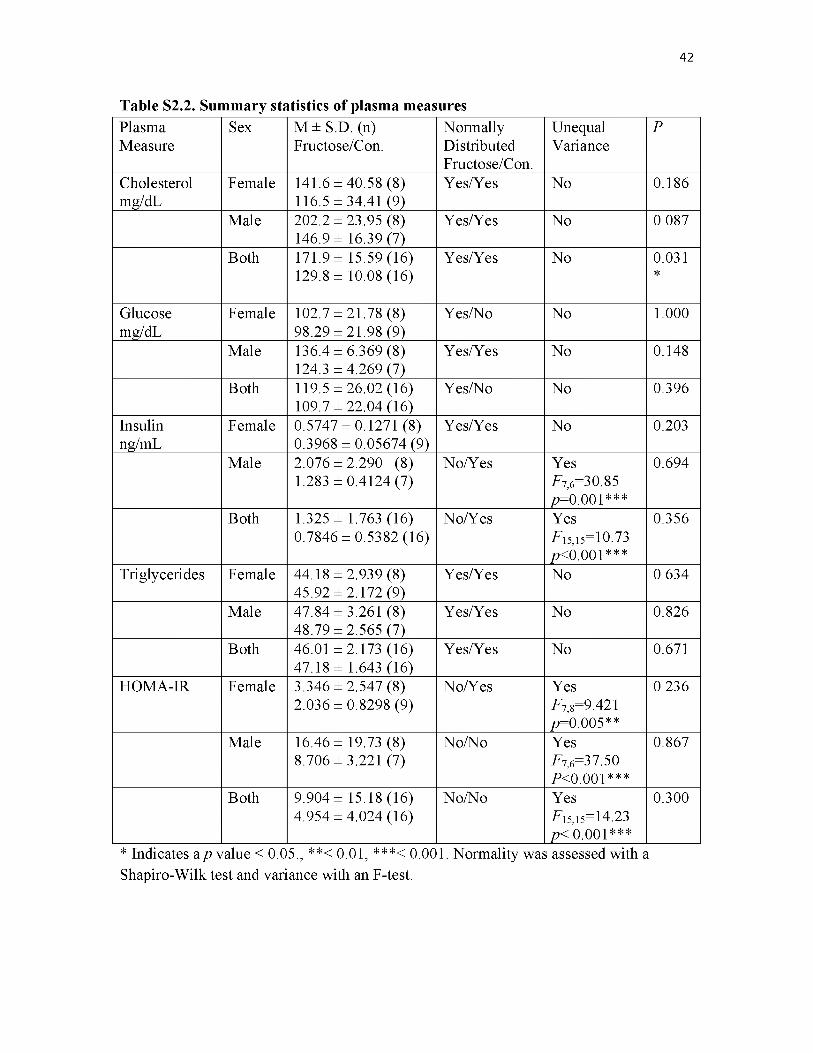
42
Table S2.2. Summary statistics of plasma measuresPlasmaMeasure
Sex M ± S.D. (n) Fructose/Con.
NormallyDistributedFructose/Con.
UnequalVariance
P
Cholesterolmg/dL
Female 141.6 ± 40.58 (8) 116.5 ± 34.41 (9)
Yes/Yes No 0.186
Male 202.2 ± 23.95 (8) 146.9 ± 16.39 (7)
Yes/Yes No 0.087
Both 171.9 ± 15.59 (16) 129.8 ± 10.08 (16)
Yes/Yes No 0.031*
Glucosemg/dL
Female 102.7 ± 21.78 (8) 98.29 ± 21.98 (9)
Yes/No No 1.000
Male 136.4 ± 6.369 (8) 124.3 ± 4.269 (7)
Yes/Yes No 0.148
Both 119.5 ± 26.02 (16) 109.7 ± 22.04 (16)
Yes/No No 0.396
Insulinng/mL
Female 0.5747 ± 0.1271 (8) 0.3968 ± 0.05674 (9)
Yes/Yes No 0.203
Male 2.076 ± 2.290 (8) 1.283 ± 0.4124 (7)
No/Yes YesFy,6=30.85p=0.001***
0.694
Both 1.325 ± 1.763 (16) 0.7846 ± 0.5382 (16)
No/Yes YesF15,15=10.73p<0.001***
0.356
Triglycerides Female 44.18 ± 2.939 (8) 45.92 ± 2.172 (9)
Yes/Yes No 0.634
Male 47.84 ± 3.261 (8) 48.79 ± 2.565 (7)
Yes/Yes No 0.826
Both 46.01 ± 2.173 (16) 47.18 ± 1.643 (16)
Yes/Yes No 0.671
HOMA-IR Female 3.346 ± 2.547 (8) 2.036 ± 0.8298 (9)
No/Yes YesFy,8=9.421p=0.005**
0.236
Male 16.46 ± 19.73 (8) 8.706 ± 3.221 (7)
No/No YesFy,6=37.50P<0.001***
0.867
Both 9.904 ± 15.18 (16) 4.954 ± 4.024 (16)
No/No YesF15,15=14.23 p< 0.001***
0.300
* Indicates a p value < 0.05., **< 0.01, ***< 0.001. Normality was assessed with a Shapiro-Wilk test and variance with an F-test.
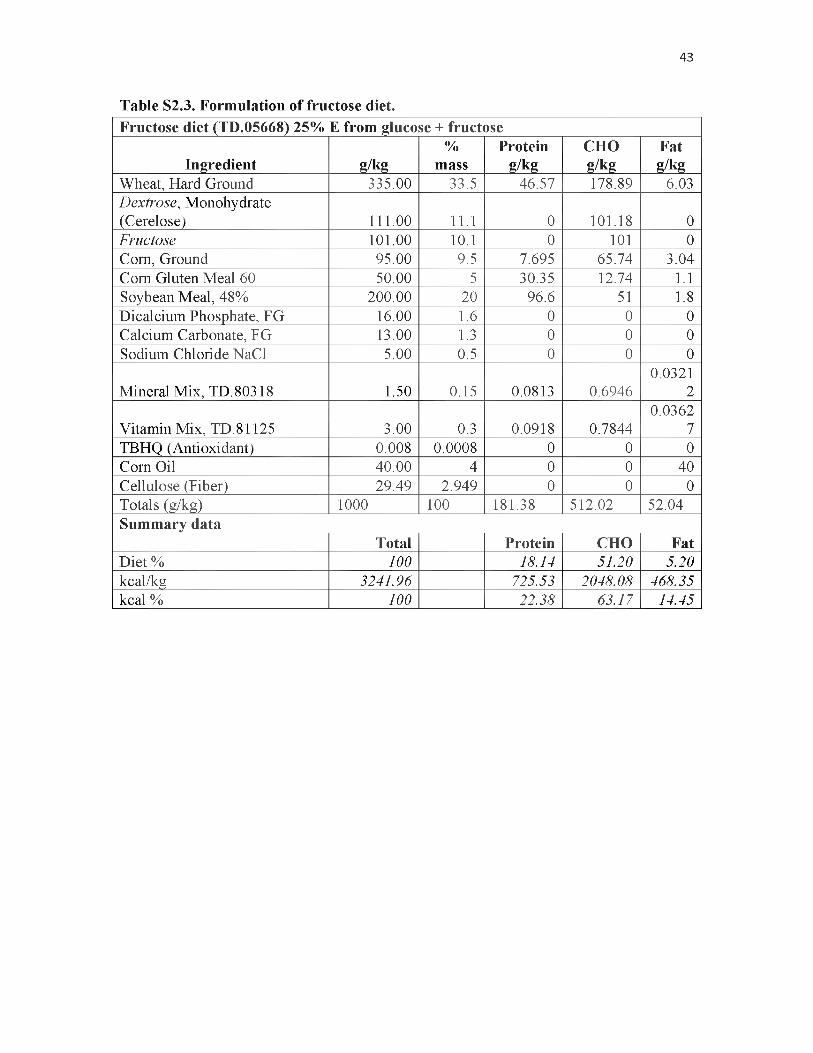
43
Table S2.3. Formulation of fructose diet.Fructose diet (TD.05668) 25% E from glucose + fructose
Ingredient g/kg%
massProtein
g/kgCHOg/kg
Fatg/kg
Wheat, Hard Ground 335.00 33.5 46.57 178.89 6.03Dextrose, Monohydrate (Cerelose) 111.00 11.1 0 101.18 0Fructose 101.00 10.1 0 101 0Corn, Ground 95.00 9.5 7.695 65.74 3.04Corn Gluten Meal 60 50.00 5 30.35 12.74 1.1Soybean Meal, 48% 200.00 20 96.6 51 1.8Dicalcium Phosphate, FG 16.00 1.6 0 0 0Calcium Carbonate, FG 13.00 1.3 0 0 0Sodium Chloride NaCl 5.00 0.5 0 0 0
Mineral Mix, TD.80318 1.50 0.15 0.0813 0.69460.0321
2
Vitamin Mix, TD.81125 3.00 0.3 0.0918 0.78440.0362
7TBHQ (Antioxidant) 0.008 0.0008 0 0 0Corn Oil 40.00 4 0 0 40Cellulose (Fiber) 29.49 2.949 0 0 0Totals (g/kg) 1000 100 181.38 512.02 52.04Summary data
Total Protein CHO FatDiet % 100 18.14 51.20 5.20kcal/kg 3241.96 725.53 2048.08 468.35kcal % 100 22.38 63.17 14.45
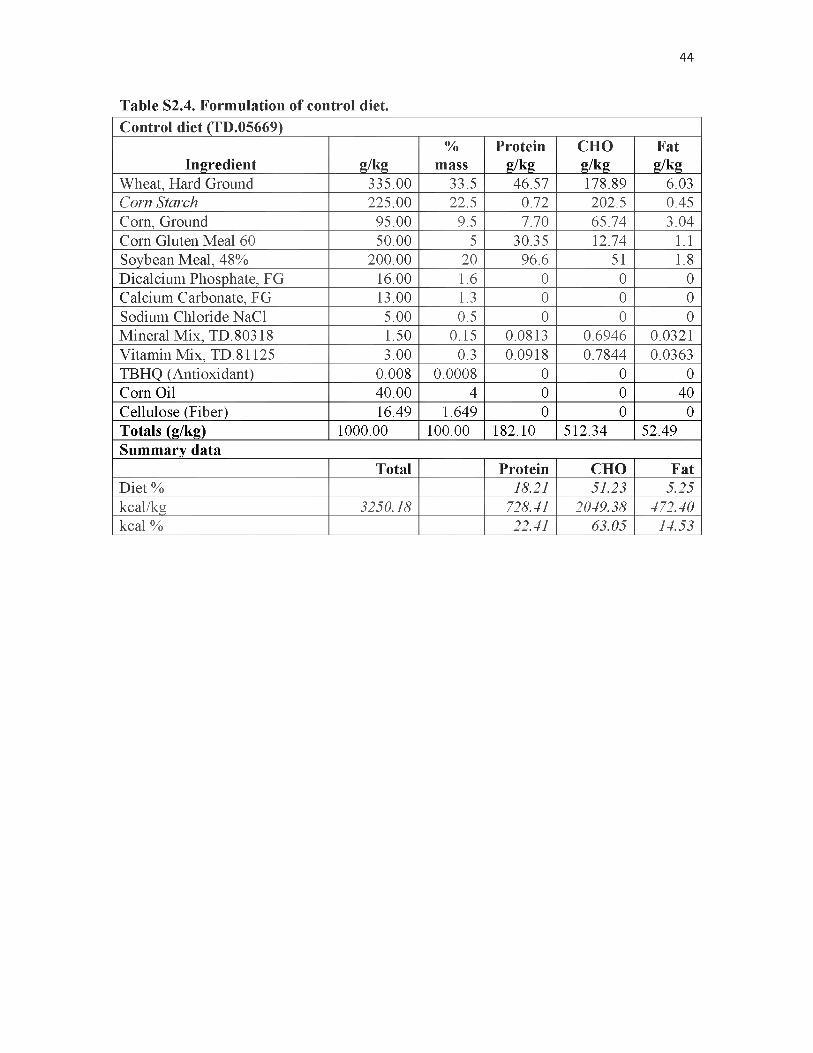
44
Table S2.4. Formulation of control diet.Control diet (TD.05669)
Ingredient g/kg%
massProtein
g/kgCHOg/kg
Fatg/kg
Wheat, Hard Ground 335.00 33.5 46.57 178.89 6.03Corn Starch 225.00 22.5 0.72 202.5 0.45Corn, Ground 95.00 9.5 7.70 65.74 3.04Corn Gluten Meal 60 50.00 5 30.35 12.74 1.1Soybean Meal, 48% 200.00 20 96.6 51 1.8Dicalcium Phosphate, FG 16.00 1.6 0 0 0Calcium Carbonate, FG 13.00 1.3 0 0 0Sodium Chloride NaCl 5.00 0.5 0 0 0Mineral Mix, TD.80318 1.50 0.15 0.0813 0.6946 0.0321Vitamin Mix, TD.81125 3.00 0.3 0.0918 0.7844 0.0363TBHQ (Antioxidant) 0.008 0.0008 0 0 0Corn Oil 40.00 4 0 0 40Cellulose (Fiber) 16.49 1.649 0 0 0Totals (g/kg) 1000.00 100.00 182.10 512.34 52.49Summary data
Total Protein CHO FatDiet % 18.21 51.23 5.25kcal/kg 3250.18 728.41 2049.38 472.40kcal % 22.41 63.05 14.53
CHAPTER 3
MODERATE LEVELS OF FRUCTOSE AND GLUCOSE
MONOSACCHARIDES INCREASE DEATH RATES
AND REDUCE FITNESS OF FEMALE MICE
COMPARED TO THOSE FED SUCROSE
Abstract
Intake of added sugar has been shown to correlate with the prevalence of many
human metabolic diseases and rodent models have characterized many aspects of the
resulting disease phenotypes. However, very little work has been done to address if
differential health impacts occur due to the consumption of one, or the other, of the two
common types of added sugar, high fructose corn syrup (fructose and glucose
monosaccharides) or table sugar (the disaccharide of sucrose, which is composed of
fructose and glucose monosaccharides). To address this question directly, we fed mice
either a diet containing an equal ratio of fructose and glucose monosaccharides or one
with an isocaloric amount of sucrose. Exposure lasted from weaning through adulthood,
and then animals of both treatments were released into seminatural enclosures where they
competed for territories, resources and reproduction. Here, we report that female mice fed
a diet containing an equal ratio of fructose and glucose monosaccharides experienced a
mortality rate 1.87 times higher and produced 26.4% fewer offspring than females fed the
sucrose diet. Interestingly, no differential performance was seen in male animals,
46
indicating a sex-specific outcome of exposure. This study provides the first experimental
evidence that fructose and glucose monosaccharides can be more deleterious to
mammalian health than the disaccharide sucrose.
Introduction
Added sugars are defined as sugars and syrups that are added to foods during
processing or preparation (1). The two most common forms of added sugar in the
American diet are table sugar (sucrose) and high fructose corn syrup (HFCS) (fructose
and glucose monosaccharides), which make up 44% and 42% of consumption annually
(2). HFCS comes in two main forms, one that is 42% and another that is 55% fructose,
with the remainder being glucose. Due to both varieties of HFCS being widely used, the
fructose to glucose ratio that is actually consumed is approximately 1:1 (3). Though
consumption of HFCS is high in the American population, globally its total consumption
is only 8% compared to sucrose (4).
Consumption of added sugar has been linked to numerous human disease states
and the rapid increase in the prevalence of these diseases is becoming one of the most
pressing health concerns world-wide as noncommunicable diseases now kill more people
globally than infectious disease (5). Specifically, through epidemiological studies, added
sugar consumption has been linked with cardiovascular disease, fatty liver disease,
metabolic syndrome, obesity and type-2 diabetes (3, 6-9). Diseases that impact 36%,
11%, 24%, 36% & 11% of American adults respectively (10-14).
The fructose portion of added sugar is suspected to be the detrimental component
and mechanisms for how it contributes to obesity; de novo lipogenesis, lipid deregulation
and insulin resistance have been recently reviewed (15). Support for these mechanisms
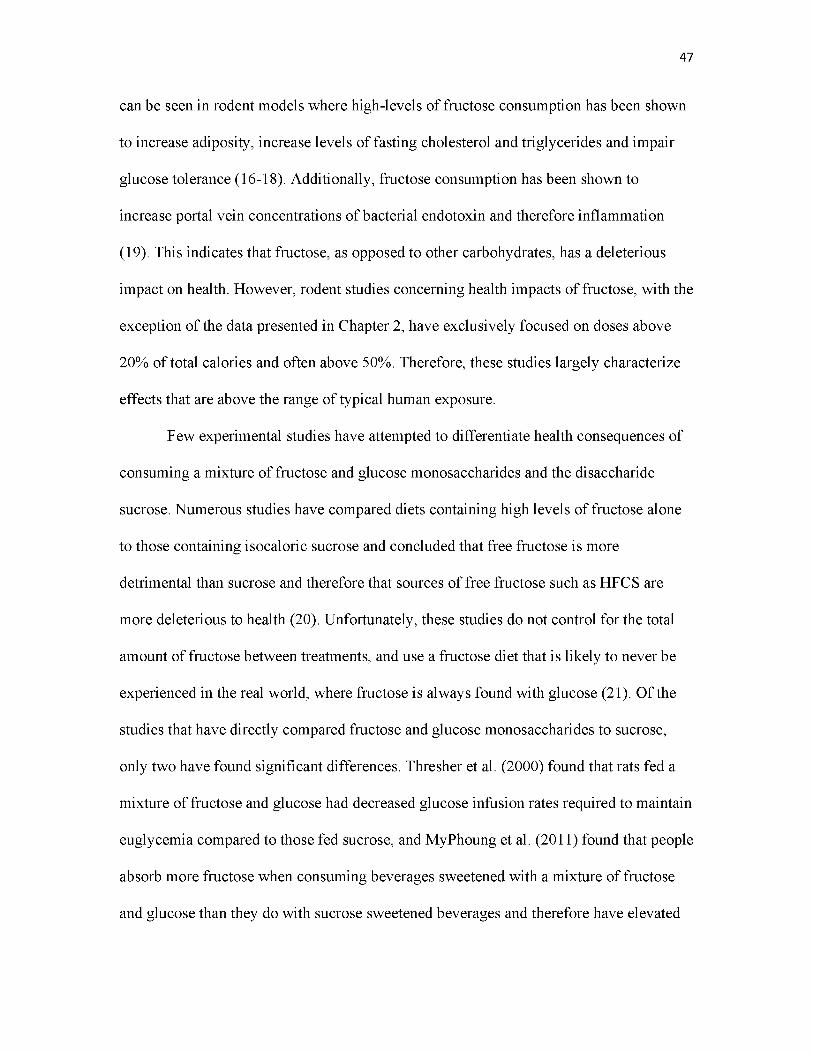
can be seen in rodent models where high-levels of fructose consumption has been shown
to increase adiposity, increase levels of fasting cholesterol and triglycerides and impair
glucose tolerance (16-18). Additionally, fructose consumption has been shown to
increase portal vein concentrations of bacterial endotoxin and therefore inflammation
(19). This indicates that fructose, as opposed to other carbohydrates, has a deleterious
impact on health. However, rodent studies concerning health impacts of fructose, with the
exception of the data presented in Chapter 2, have exclusively focused on doses above
20% of total calories and often above 50%. Therefore, these studies largely characterize
effects that are above the range of typical human exposure.
Few experimental studies have attempted to differentiate health consequences of
consuming a mixture of fructose and glucose monosaccharides and the disaccharide
sucrose. Numerous studies have compared diets containing high levels of fructose alone
to those containing isocaloric sucrose and concluded that free fructose is more
detrimental than sucrose and therefore that sources of free fructose such as HFCS are
more deleterious to health (20). Unfortunately, these studies do not control for the total
amount of fructose between treatments, and use a fructose diet that is likely to never be
experienced in the real world, where fructose is always found with glucose (21). Of the
studies that have directly compared fructose and glucose monosaccharides to sucrose,
only two have found significant differences. Thresher et al. (2000) found that rats fed a
mixture of fructose and glucose had decreased glucose infusion rates required to maintain
euglycemia compared to those fed sucrose, and MyPhoung et al. (2011) found that people
absorb more fructose when consuming beverages sweetened with a mixture of fructose
and glucose than they do with sucrose sweetened beverages and therefore have elevated
47
48
biomarkers associated with increased fructose consumption (e.g., higher blood pressure)
(3, 22). A third study concluded that a mixture of fructose and glucose caused increased
mass gain in male rats compared to sucrose, though this claim may be overstepping the
data as a direct statistical comparison between these dietary groups was not made (23).
To sensitively assess whether the consumption of fructose and glucose
monosaccharides decreases mouse health relative to the consumption of sucrose we
utilized a novel technique, which we refer to as Organismal Performance Assays (OPAs).
OPAs are defined as sensitive phenotyping approaches that use seminatural conditions to
challenge the physiological performance of differentially treated animals (i.e., treatment
and control) in direct competition with each other. The relative success of individuals in
each group can be compared for any fitness measures allowing detection and
quantification of any reduced performance due to treatment. Though the OPA moniker
has only recently been derived, the technique has been previously used to detect mating
preferences due to major histocompatibility genes and quantify adverse consequences
associated with cousin and sibling-level inbreeding as well as bearing the selfish genetic
element known as the t complex (24-27). In all cases OPAs detected and quantified
substantial health impacts that had been missed by previous studies that assessed animals
with standard laboratory methodologies.
Here we use OPAs to specifically test if a 1:1 ratio of fructose and glucose
monosaccharides (fructose/glucose) at a level of 25% kcal, a level currently consumed by
13% of Americans (28), decreases mouse health compared to consumption of an
isocaloric sucrose diet. OPA endpoint measures include survival, reproductive success
49
and male competitive ability. Additionally, we monitor mass and glucose tolerance of
animals to determine if these measures are predictive of OPA outcomes.
Methods
Animals
Outbred, wild-derived house mice (Mus musculus) were used in this study, as
many laboratory strains do not possess the natural and functional behaviors required for
OPA assessment (29). Individuals in this study were from the 10th and 11th generations of
the colony originally described by Meagher et al. (26). Consanguinity was assessed
during the 11th generation and found to be comparable to wild populations (30). Before
animals were released into OPA enclosures they were housed according to standard
protocols under a 12:12h light:dark cycle with food and water available ad libitum. All
protocols were approved by and conducted under the animal care guidelines of the
IACUC at the University of Utah.
Dietary exposure
Exposure to specified diets began at weaning and continued until animals were
released into OPA enclosures approximately 40 weeks later. At the time of weaning a
litter was split in half and each portion ascribed to either the fructose/glucose or sucrose
group. The fructose/glucose diet (TD.05668) (Harlan Teklad, Madison, WI) contained
25% kcal from a 1:1 mixture of fructose and glucose monosaccharides, and
approximately models high fructose corn syrup (HFCS). The sucrose diet (TD.05667)
(Harlan Teklad, Madison, WI) is identical except for the component coming from the
fructose/glucose monosaccharides is replaced by sucrose and has slightly less raw fiber
added to offset mass differences. For an exact makeup of each diet see Tables 3.1 and
3.2. Upon entrance into OPA enclosures all individuals consume the glucose/fructose
diet.
OPA enclosures
Indoor OPA enclosures measure 5m by 7m (35m2), and each pen is subdivided
into six subsections by hardware cloth, which provides spatial complexity. Each
subsection has food and water that is associated with a set of nest boxes in either one of
four “optimal” territories, which contain nest boxes in enclosed structures or two
“suboptimal” territories with nest boxes in the open. Optimal nesting structures were
made of covered, opaque plastic storage bins (75L) with 5cm diameter entryways and
contained four standard mouse cages (also with 5cm entryways), bedding and food. The
suboptimal nest box is made of plastic planter boxes (61cm long by 15cm wide by 19cm
high) fitted with chicken-wire lids and 5cm circular entryways; food containers and one-
gallon poultry waterers were adjacent to these nest boxes and both provided ad libitum
resource access. Together, the hardware fences and the two types of nest boxes created
environmental complexity in which mice established nesting sites, territorial boundaries,
and social hierarchies. OPA enclosures mimic habitat and social environments
experienced by mice in nature and the population density is representative of
measurements from wild populations (31).
To assess impacts of the consumption of differential forms of fructose on
survival, competitive ability and reproduction, six OPA populations were founded by 24
30 individuals, 8-10 males and 14-20 females for a total of 160 individuals (56 male:104
female). Equal numbers of fructose/glucose and sucrose-fed animals were represented in
50
each sex within all populations. No male individual was related at the cousin level or
above to any other individual (male or female) within a given population. Relatedness
between female founders was also avoided, though in several populations a single pair of
sisters was included; when this was the case, sister-pairs were balanced across diets.
Mean age of founders was 44.43 ± 5.69 (M ± S.D.) weeks for males and 44.28 ± 5.90
weeks for females. To prevent incidental breeding before the establishment of male social
territories, we released placeholder (nonexperimental) females with the experimental
males at the onset of each population to allow male territory formation prior to release of
experimental females. After one week, the placeholder females were removed and the
experimental females were released into the enclosures marking the start (week one) of
the study. The six populations ran for 32 weeks.
Survivorship
Survivorship of population founders was determined by periodic checks in each
enclosure. Dead founders were identified by their PIT-tag ID or unique ear punches and
removed from enclosures. Date of death was estimated based on three factors: date of last
check, the last date an animal was recorded at a feeding station, and the condition of the
corpse.
Reproductive success
Samples to determine the reproductive success of founders were gathered during
“pup sweeps” in which pups born during the previous cycle were removed from the
population, sacrificed and had tissue samples taken for genetic analysis. The first sweep
occurred during week eight of the study and additional sweeps followed every six weeks.
51
This schedule prevented offspring born in the enclosures from breeding. In all six of the
populations five pup sweeps occurred. A total of 1,397 individual samples were collected
with 235.83 ± 96.20 (M ± S.D.) per population.
Population level reproductive success was determined for fructose/glucose and
sucrose groups as described previously (26). Briefly, in each competition enclosure male
and female founders of each treatment were categorized by a common allelic variant on
the Y-chromosome and mitochondrial genome, respectively. Allelic assignments were
reversed across populations to avoid possible confounding effects of allele types. We
obtained 1,336 mitochondrial (95.63% of total) and 667 Y- chromosome (99.85% of total
assuming a 1:1sex ratio) genotypes.
Male competitive ability
One week prior to entrance, each founder was implanted with a unique passive
integrated transponder (PIT) tag (TX1400ST, BioMark, Boise ID). Individuals were
monitored until release and no redness, swelling, or noticeable infection around the
injection site was detected. A set of PIT antennae and readers (FS2001F-ISO, BioMark,
Boise ID) were rotated through the six populations throughout the study and placed at
each of the optimal and suboptimal feeders, and data were streamed to a computer
equipped with data-logging software (Minimon, Culver City, CA). Male social
dominance was assigned when a male had >75% of the PIT-tag reads at a single location
over the course of a multi-day reader session, and territories were designated as
controlled by a fructose/glucose-fed or sucrose-fed male based on the dietary exposure of
the male controlling them. Female data were collected, but results are not reported here as
52
not enough is known about female dominance behavior to use it as a measure of
performance.
Body mass
Body mass was assessed in the 160 animals that founded the six OPA populations
described above at the time they were released into populations and at each of the
aforementioned pup sweeps, for a total of six time points.
Glucose clearance
Intraperitoneal Glucose Tolerance Tests (IPGTT) were conducted on eight female
animals of each dietary treatment at the end of the exposure period by giving an
intraperitoneal injection of 1.5mg D-glucose/g body mass after an eight hour fast. Only
female animals were assessed as previous work on this population has shown that male
clearance rates are not impacted by this level of added sugar consumption compared to a
sugar-free control (Chapter 2). Blood was collected from the retro-orbital sinus prior to
glucose injection and at 5, 10, 30, 60 and 120 minutes postinjection. Fast duration and
bleeding technique were selected because our wild-derived mice do not tolerate fasting or
handling stress as well as laboratory strains. Blood samples were immediately centrifuged
at 10,000g for 10 minutes after which 8-10^l of plasma was decanted and flash frozen.
Samples were shipped on dry ice to the Children’s Hospital of Oakland Research
Institute, and glucose levels were assessed by the hexokinase method (32). Briefly,
plasma or glucose standard were added in duplicate to a 96-well plate and a glucose
reagent (Thermo Scientific, Middletown, VA) was added and incubated at 37°C. Through
53
a series of reactions NADH was formed in proportion to the concentration of glucose and
its level was measured by the increase of absorbance at 340 nm.
Statistical methods
Survival. Survivorship of the 160 founders was analyzed by Cox proportional
hazard models with male and female animals assessed separately due to vastly different
mortality rates. Day one was defined as when animals entered OPA enclosures and is
different by a week for males and females (see above). A multivariate model was used to
assess the impacts of diet, population and their interaction. Individuals that survived the
duration of the trial or that were removed from the study were censored. In the male data
set there were 32 events and 24 censorings, while in the female data set there were 40
events and 64 censorings.
Male competitive ability. To assess the main effects of diet and time (and a time
by diet interaction) on male competitive ability, we used a generalized linear mixed
model (GLMM) to predict the probability of ownership. As a territory can only be
defended or not, we used a binomial distribution with a logit link to estimate probability
of ownership (defense). The numbers of territories controlled within populations by each
dietary treatment was assessed at multiple time points throughout the study for a total of
112 observations. The number of territories in each population is constant at six, and
territories were occupied (by a mouse of either diet) or unoccupied. The intercept of the
model was set at week zero when males were released into the enclosures. Week, time,
diet and their interaction were treated as fixed effects and population was modeled as a
random effect with a random intercept calculated for each.
54
Reproduction. As reproduction data are discrete counts, for each sex we modeled
offspring counts over time in a GLMM with a Poisson distribution and a logarithmic link.
The model assessed the main effects of diet and time and the interaction on population-
level fitness across the six populations. Reproductive output of each dietary treatment
was measured five times at six-week intervals for a total of 60 observations. Time, diet
and their interaction were modeled as fixed effects and population was modeled as a
random effect with both a random slope and intercept calculated. The intercept was set at
week eight as this was the first time point for which data were available and reproduction
at week zero was biologically impossible. Male and female reproduction data were
analyzed separately as they were based on separate measurements, with male fitness
measured in terms of number of male offspring and female fitness in terms of total
offspring.
Mass. A linear mixed-effects model (LMM) was used to assess the main effects
of diet, sex and time, as well as their respective interactions on the mass of the 160
population founders. As mass data are continuous, a normal distribution was assumed.
Diet, sex, time and their interaction were modeled as main fixed effects and individual
and population were modeled as random effects with a random intercept. The intercept
was set at week zero as this was the first time point for which data were available and
made biological sense. Founders were weighed at week zero and surviving individuals
were weighed across the five aforementioned pup sweeps for a total of 706 observations.
IPGTT. The area under the curve (AUC) was calculated for plasma glucose levels
over time using the trapezoid rule. AUC values were calculated for eight individuals of
each treatment and comparisons were made between groups using a Mann Whitney U-
55
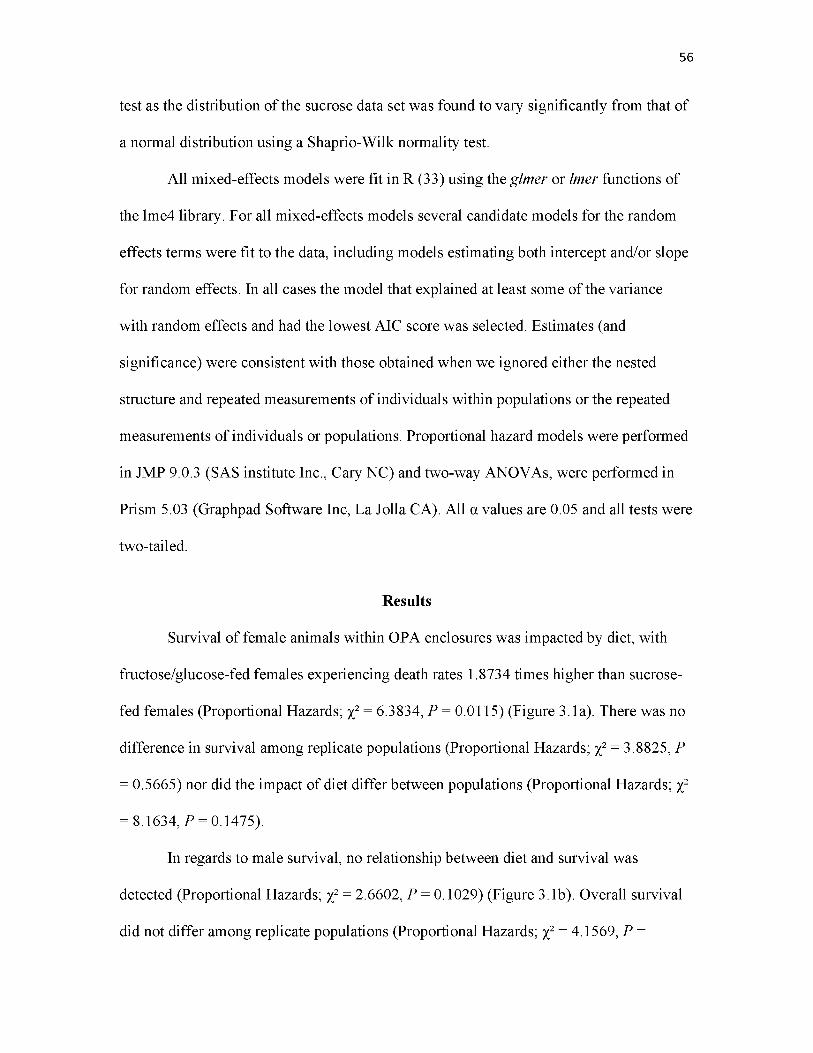
test as the distribution of the sucrose data set was found to vary significantly from that of
a normal distribution using a Shaprio-Wilk normality test.
All mixed-effects models were fit in R (33) using the glmer or Imer functions of
the lme4 library. For all mixed-effects models several candidate models for the random
effects terms were fit to the data, including models estimating both intercept and/or slope
for random effects. In all cases the model that explained at least some of the variance
with random effects and had the lowest AIC score was selected. Estimates (and
significance) were consistent with those obtained when we ignored either the nested
structure and repeated measurements of individuals within populations or the repeated
measurements of individuals or populations. Proportional hazard models were performed
in JMP 9.0.3 (SAS institute Inc., Cary NC) and two-way ANOVAs, were performed in
Prism 5.03 (Graphpad Software Inc, La Jolla CA). All a values are 0.05 and all tests were
two-tailed.
Results
Survival of female animals within OPA enclosures was impacted by diet, with
fructose/glucose-fed females experiencing death rates 1.8734 times higher than sucrose-
fed females (Proportional Hazards; x2 = 6.3834, P = 0.0115) (Figure 3.1a). There was no
difference in survival among replicate populations (Proportional Hazards; x2 = 3.8825, P
= 0.5665) nor did the impact of diet differ between populations (Proportional Hazards; x2
= 8.1634, P = 0.1475).
In regards to male survival, no relationship between diet and survival was
detected (Proportional Hazards; x2 = 2.6602, P = 0.1029) (Figure 3.1b). Overall survival
did not differ among replicate populations (Proportional Hazards; x2 = 4.1569, P =
56
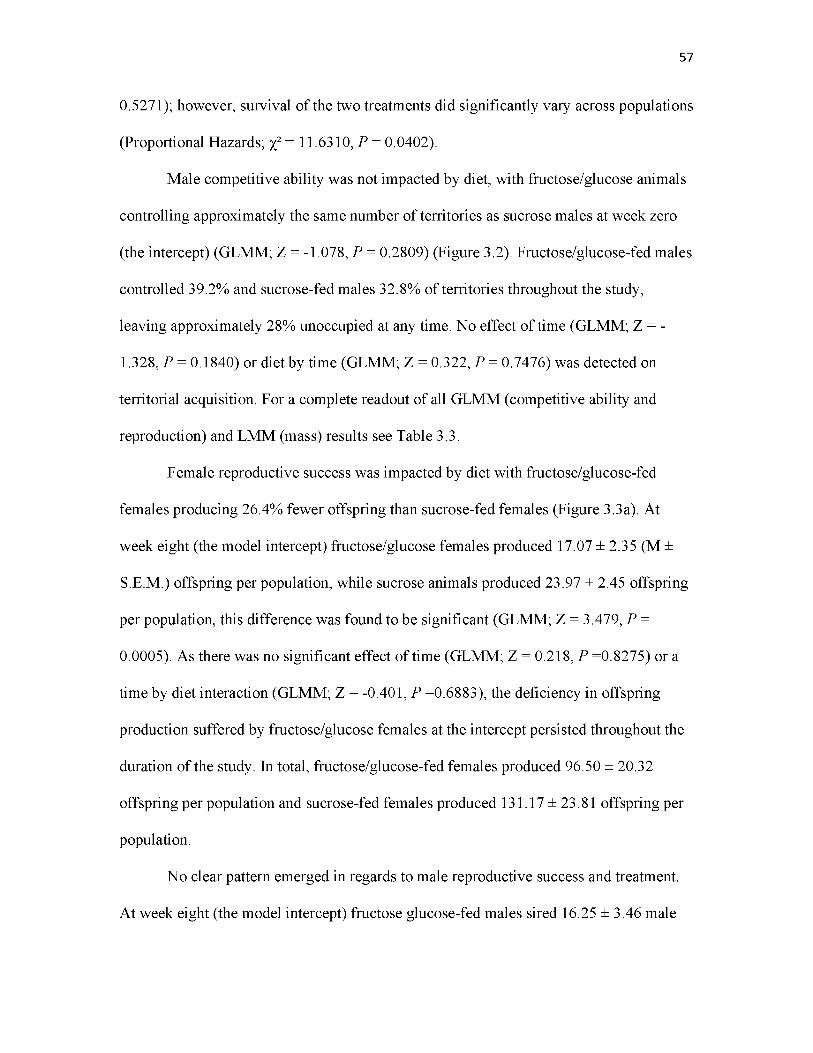
57
0.5271); however, survival of the two treatments did significantly vary across populations
(Proportional Hazards; %2 = 11.6310, P = 0.0402).
Male competitive ability was not impacted by diet, with fructose/glucose animals
controlling approximately the same number of territories as sucrose males at week zero
(the intercept) (GLMM; Z = -1.078, P = 0.2809) (Figure 3.2). Fructose/glucose-fed males
controlled 39.2% and sucrose-fed males 32.8% of territories throughout the study,
leaving approximately 28% unoccupied at any time. No effect of time (GLMM; Z = -
1.328, P = 0.1840) or diet by time (GLMM; Z = 0.322, P = 0.7476) was detected on
territorial acquisition. For a complete readout of all GLMM (competitive ability and
reproduction) and LMM (mass) results see Table 3.3.
Female reproductive success was impacted by diet with fructose/glucose-fed
females producing 26.4% fewer offspring than sucrose-fed females (Figure 3.3a). At
week eight (the model intercept) fructose/glucose females produced 17.07 ± 2.35 (M ±
S.E.M.) offspring per population, while sucrose animals produced 23.97 ± 2.45 offspring
per population, this difference was found to be significant (GLMM; Z = 3.479, P =
0.0005). As there was no significant effect of time (GLMM; Z = 0.218, P =0.8275) or a
time by diet interaction (GLMM; Z = -0.401, P =0.6883), the deficiency in offspring
production suffered by fructose/glucose females at the intercept persisted throughout the
duration of the study. In total, fructose/glucose-fed females produced 96.50 ± 20.32
offspring per population and sucrose-fed females produced 131.17 ± 23.81 offspring per
population.
No clear pattern emerged in regards to male reproductive success and treatment.
At week eight (the model intercept) fructose glucose-fed males sired 16.25 ± 3.46 male
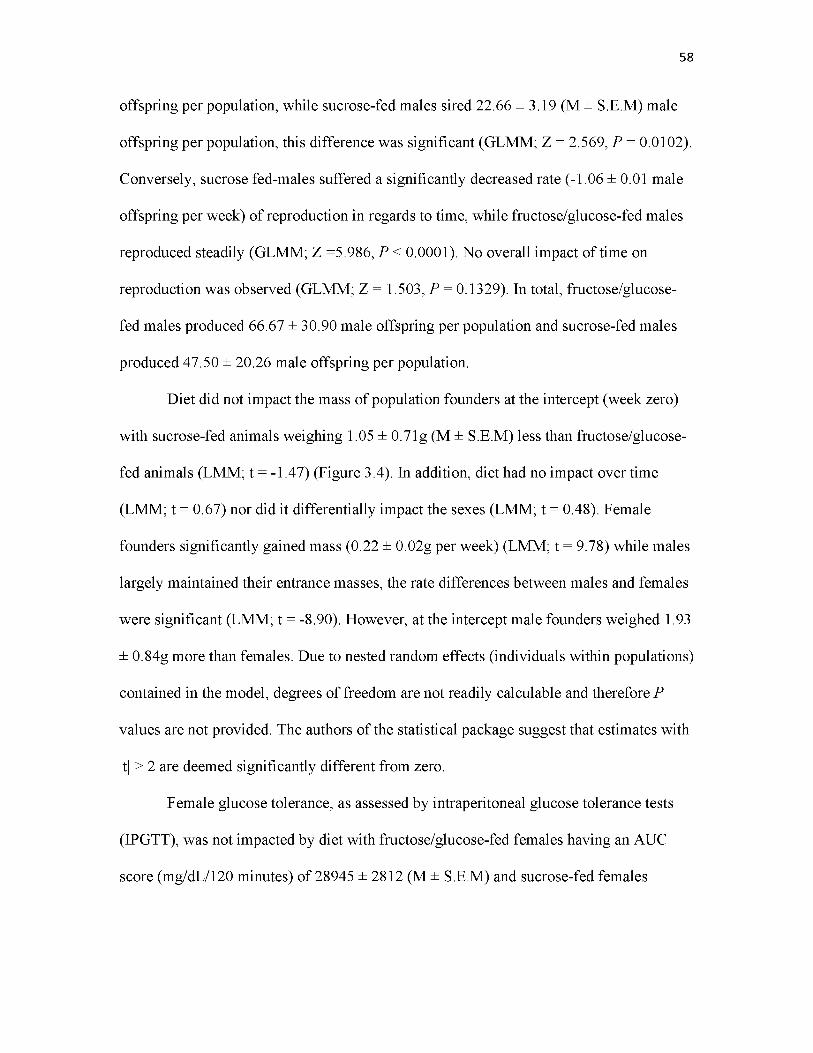
58
offspring per population, while sucrose-fed males sired 22.66 ± 3.19 (M ± S.E.M) male
offspring per population, this difference was significant (GLMM; Z = 2.569, P = 0.0102).
Conversely, sucrose fed-males suffered a significantly decreased rate (-1.06 ± 0.01 male
offspring per week) of reproduction in regards to time, while fructose/glucose-fed males
reproduced steadily (GLMM; Z =5.986, P < 0.0001). No overall impact of time on
reproduction was observed (GLMM; Z = 1.503, P = 0.1329). In total, fructose/glucose-
fed males produced 66.67 ± 30.90 male offspring per population and sucrose-fed males
produced 47.50 ± 20.26 male offspring per population.
Diet did not impact the mass of population founders at the intercept (week zero)
with sucrose-fed animals weighing 1.05 ± 0.71g (M ± S.E.M) less than fructose/glucose-
fed animals (LMM; t = -1.47) (Figure 3.4). In addition, diet had no impact over time
(LMM; t = 0.67) nor did it differentially impact the sexes (LMM; t = 0.48). Female
founders significantly gained mass (0.22 ± 0.02g per week) (LMM; t = 9.78) while males
largely maintained their entrance masses, the rate differences between males and females
were significant (LMM; t = -8.90). However, at the intercept male founders weighed 1.93
± 0.84g more than females. Due to nested random effects (individuals within populations)
contained in the model, degrees of freedom are not readily calculable and therefore P
values are not provided. The authors of the statistical package suggest that estimates with
|t| > 2 are deemed significantly different from zero.
Female glucose tolerance, as assessed by intraperitoneal glucose tolerance tests
(IPGTT), was not impacted by diet with fructose/glucose-fed females having an AUC
score (mg/dL/120 minutes) of 28945 ± 2812 (M ± S.E.M) and sucrose-fed females
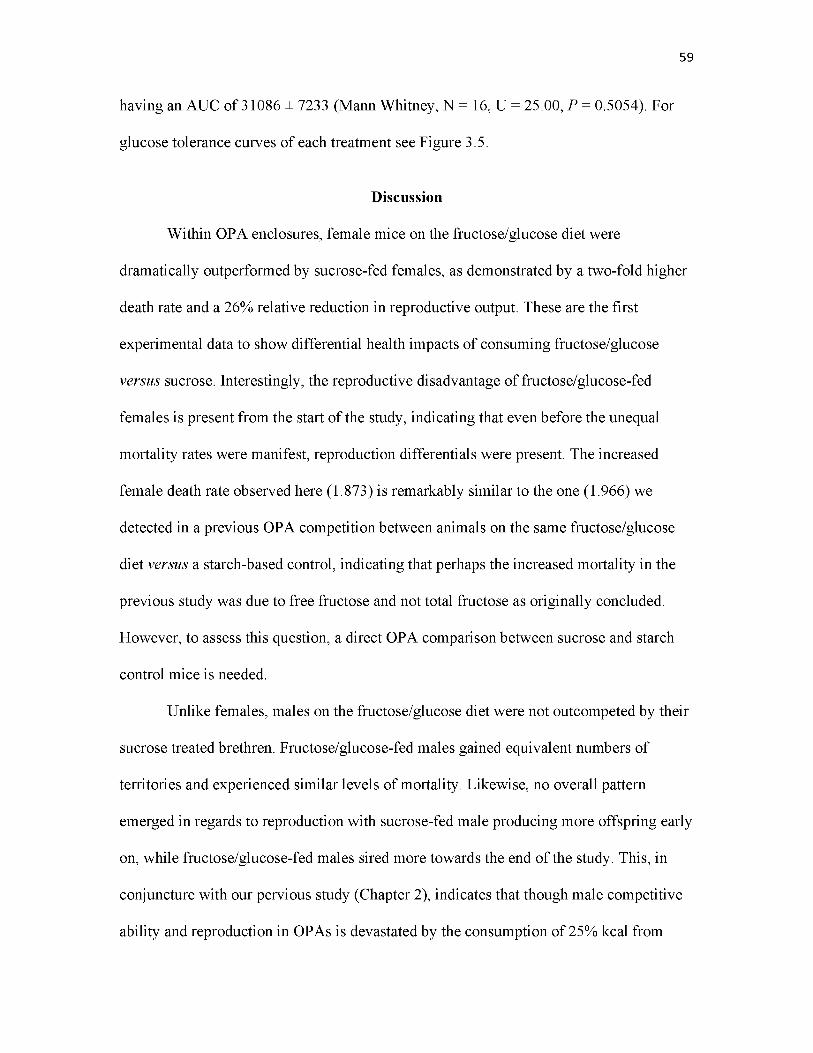
59
having an AUC of 31086 ± 7233 (Mann Whitney, N = 16, U = 25.00, P = 0.5054). For
glucose tolerance curves of each treatment see Figure 3.5.
Discussion
Within OPA enclosures, female mice on the fructose/glucose diet were
dramatically outperformed by sucrose-fed females, as demonstrated by a two-fold higher
death rate and a 26% relative reduction in reproductive output. These are the first
experimental data to show differential health impacts of consuming fructose/glucose
versus sucrose. Interestingly, the reproductive disadvantage of fructose/glucose-fed
females is present from the start of the study, indicating that even before the unequal
mortality rates were manifest, reproduction differentials were present. The increased
female death rate observed here (1.873) is remarkably similar to the one (1.966) we
detected in a previous OPA competition between animals on the same fructose/glucose
diet versus a starch-based control, indicating that perhaps the increased mortality in the
previous study was due to free fructose and not total fructose as originally concluded.
However, to assess this question, a direct OPA comparison between sucrose and starch
control mice is needed.
Unlike females, males on the fructose/glucose diet were not outcompeted by their
sucrose treated brethren. Fructose/glucose-fed males gained equivalent numbers of
territories and experienced similar levels of mortality. Likewise, no overall pattern
emerged in regards to reproduction with sucrose-fed male producing more offspring early
on, while fructose/glucose-fed males sired more towards the end of the study. This, in
conjuncture with our pervious study (Chapter 2), indicates that though male competitive
ability and reproduction in OPAs is devastated by the consumption of 25% kcal from
added sugar, the form of that added sugar, as either fructose and glucose
monosaccharides or the disaccharide sucrose, appears inconsequential; though this should
be confirmed with direct competition experiments.
The sex-specific nature of our OPA findings is surprising, but not unprecedented.
Twice our system has previously revealed a similar mortality pattern, the first being when
females harboring the selfish genetic element known as the t complex experienced an
increased risk of mortality while males with the t complex did not (27), and the second
being that females fed the fructose/glucose diet in a previous study had increased
mortality compared to controls while male animals showed no difference (Chapter 2). It
is fallacious to assume that experimental treatments will impact the sexes in exactly the
same way, as major differences in life histories of female and male mice are well
established. For example, a female mouse when pregnant consumes 18-25% more
calories than when she is not and therefore is likely to respond differentially to a
nutritional treatment than a male (34). Even without considering pregnancy status, sex-
specific differences are well established in metabolic processes such as the insulin
response for both mice and humans (35, 36). As its importance is being realized, sex-
specific reporting of results is becoming increasingly common in human studies and we
believe that the data herein also reflect its importance in animal models (37).
We found no evidence of differential mass gain or glucose tolerance between
animals fed the fructose/glucose and the sucrose diet. This finding is consistent with our
previous work in which animals fed the same fructose/glucose diet did not differ in mass
from those fed a starch-based control diet (Chapter 2), but it does stand in contrast to
conclusions reached by Bocarsly et al. (2010) possibly due to rat/mouse differences (23).
60
Interestingly, our mass data supports that house mice are sexually dimorphic, as males
were heavier than nonpregnant females. This observation is consistent with most data, but
recent investigations have revealed that some populations and age ranges of wild house
mice that are sexually monomorphic (38, 39). Glucose clearance rates did not differ
between females raised on either diet, indicating that glucose tolerance was not predictive
of the observed mortality and reproductive deficiency. Both the clearance rates of
fructose/glucose and sucrose-fed females were similar to those of female mice fed the
same fructose/glucose diet in Chapter 2. This observation is in line with data gathered by
Thresher and coworkers (2000), that showed overall glucose clearance rates did not differ
between these groups (3). The Thesher study did detect differences in the glucose
infusion rate required to maintain euglycemia; however, we did not assess that aspect of
glucose homeostasis.
The mechanistic cause of female mortality and reproductive impairment due to
the consumption of the fructose/glucose diet, as opposed to sucrose, is not known. We
directly tested for differences in glucose homeostasis and mass gain, two outcomes that
previously had been reported as being differentially impacted by similar diets, but no
differences emerged. We did not directly assess the rate of fructose uptake after
consumption, a third metric that has been shown to differ between similar diets in
humans, leaving the possibility that our fructose/glucose fed animals absorbed a higher
amount of fructose each time they fed over the feeding trial. If not due to an increase in
total fructose intake, then it seems likely that whatever mechanism is at play is taking
place at or prior to the absorption of these sugars by enterocytes, as the bond connecting
the monosaccharide components of sucrose is hydrolyzed at this time (40). Regardless of
61
what mechanism is contributing to the increased mortality and decreased reproduction of
females on the fructose/glucose diet, the organismal-level phenotype characterized herein
should greatly aid in its elucidation.
Though previous claims have been made that HFCS and sucrose are not
equivalent, this study provides the first clear experimental evidence that the consumption
of a 1:1 ratio of fructose and glucose monosaccharides can dramatically decrease
mammalian health compared to the intake of an isocaloric amount of sucrose. Moreover,
the fructose and glucose monosaccharide diet used in this study contains these added
sugars at levels that are consumed by 13% of the American population, indicating that
human health may also be at risk (28). Though many aspects of fructose toxicity have
been well described, there is still much that we can learn from the mouse, especially
when we take the crucial role of environment into account for elucidating and
exacerbating disease phenotypes.
Acknowledgements
I thank Wayne Potts, my Ph.D. advisor; Denise Dearing, Mark Shigenaga and
Ann-Marie Torregrossa for aid in experimental design; Sean Laverty for statistical
modeling assistance; Patricia Ault, Steven Ault, Megumi Hite, Sara Hugentobler, John
Lelis, Linda Morrison, Bradley Schwartz, Mirtha Sosa, Amanda Suchy, and Ruth Tanner
for help in data collection; and Sin Hoa Gieng for measuring plasma glucose. This work
was supported by NIH grant RO1-GM039578 to Wayne Potts and I was supported by an
NSF GK-12 Educational Outreach Fellowship (DGE 08-41233).
62
63
References
1. National Research Council. Dietary reference intakes for energy, carbohydrate, fiber, fat, fatty acids, cholesterol, protein, and amino acids (acronutrients): Washington DC.: The National Academies Press; 2005.
2. Marriott BP, Cole N, Lee E. National estimates of dietary fructose intake increased from 1977 to 2004 in the United States. J Nutr. 2009 Jun;139(6):1228S-35S.
3. Bray GA, Nielsen SJ, Popkin BM. Consumption of high-fructose corn syrup in beverages may play a role in the epidemic of obesity. Am J Clin Nutr. 2004 Apr;79(4):537-43.
4. Fereday N, Forber G, Girardello S, Midgley C, Nutt T, Powell N, et al. HFCS industry annual review-a year of changing expectations. Oxford, UK: LMC International Ltd.; 2007.
5. United Nations General Assembly. Prevention and control of non-communicable diseases a Report of the Secretary-General. 2011.
6. Fung TT, Malik V, Rexrode KM, Manson JE, Willett WC, Hu FB. Sweetened beverage consumption and risk of coronary heart disease in women. Am J Clin Nutr. 2009 Apr;89(4):1037-42.
7. Ouyang X, Cirillo P, Sautin Y, McCall S, Bruchette JL, Diehl AM, et al. Fructose consumption as a risk factor for non-alcoholic fatty liver disease. J Hepatol. 2008 Jun;48(6):993-9.
8. Dhingra R, Sullivan L, Jacques PF, Wang TJ, Fox CS, Meigs JB, et al. Soft drink consumption and risk of developing cardiometabolic risk factors and the metabolic syndrome in middle-aged adults in the community. Circulation. 2007 Jul 31;116(5):480- 8.
9. Gross LS, Li L, Ford ES, Liu S. Increased consumption of refined carbohydrates and the epidemic of type 2 diabetes in the United States: an ecologic assessment. Am J Clin Nutr. 2004 May;79(5):774-9.
10. Roger VL, Go AS, Lloyd-Jones DM, Benjamin EJ, Berry JD, Borden WB, et al. Executive summary: heart disease and stroke statistics--2012 update: a report from the American Heart Association. Circulation. 2012 Jan 3;125(1): 188-97.
11. Angulo P. Nonalcoholic fatty liver disease. N Engl J Med. 2002 Apr 18;346(16): 1221-31.
64
12. Ford ES, Giles WH, Dietz WH. Prevalence of the metabolic syndrome among US adults: findings from the third National Health and Nutrition Examination Survey. Jama. 2002 Jan 16;287(3):356-9.
13. Ogden CL, Carroll MD, Kit BK, Flegal KM. Prevalence of obesity in the United States 2009-2010. National Center for Health Statistics. Hyattsville, MD.. 2012.
14. Center for Disease Control and Prevention. National diabetes fact sheet: national estimates and general information on diabetes and prediabetes in the United States, 2011. In: Department of Health and Human Services Center for Disease Control and Prevention, editor. Atlanta, GA. 2011.
15. Stanhope KL. Role of fructose-containing sugars in the epidemics of obesity and metabolic syndrome. Annu Rev Med. 2012;63:329-43.
16. Jurgens H, Haass W, Castaneda TR, Schurmann A, Koebnick C, Dombrowski F, et al. Consuming fructose-sweetened beverages increases body adiposity in mice. Obes Res. 2005 Jul;13(7):1146-56.
17. Kelley GL, Allan G, Azhar S. High dietary fructose induces a hepatic stress response resulting in cholesterol and lipid dysregulation. Endocrinology. 2004 Feb;145(2):548-55.
18. Thresher JS, Podolin DA, Wei Y, Mazzeo RS, Pagliassotti MJ. Comparison of the effects of sucrose and fructose on insulin action and glucose tolerance. Am J Physiol Regul Integr Comp Physiol. 2000 0ct;279(4):R1334-40.
19. Bergheim I, Weber S, Vos M, Kramer S, Volynets V, Kaserouni S, et al. Antibiotics protect against fructose-induced hepatic lipid accumulation in mice: role of endotoxin. J Hepatol. 2008 Jun;48(6):983-92.
20. White JS. Straight talk about high-fructose corn syrup: what it is and what it ain't. Am J Clin Nutr. 2008 Dec;88(6):1716S-21S.
21. White JS. Weak association between sweeteners or sweetened beverages and diabetes. J Nutr. 2008 Jan;138(1):138; author reply 9.
22. Le MT, Frye RF, Rivard CJ, Cheng J, McFann KK, Segal MS, et al. Effects of high-fructose corn syrup and sucrose on the pharmacokinetics of fructose and acute metabolic and hemodynamic responses in healthy subjects. Metabolism. 2011 Dec 5.
23. Bocarsly ME, Powell ES, Avena NM, Hoebel BG. High-fructose corn syrup causes characteristics of obesity in rats: increased body weight, body fat and triglyceride levels. Pharmacol Biochem Behav. 2010 Nov;97(1):101-6.
65
24. Potts WK, Manning CJ, Wakeland EK. Mating patterns in seminatural populations of mice influenced by MHC genotype. Nature. 1991;352:619-21.
25. Ilmonen P, Penn DJ, Damjanovich K, Clarke J, Lamborn D, Morrison L, et al. Experimental infection magnifies inbreeding depression in house mice. Journal of Evolutionary Biology. 2008;21:834-41.
26. Meagher S, Penn DJ, Potts WK. Male-male competition magnifies inbreeding depression in wild house mice. Proc Natl Acad Sci USA. 2000;97(7):3324-9.
27. Carroll LS, Meagher S, Morrison L, Penn DJ, Potts WK. Fitness effects of a selfish gene are revealed in an ecological context. Evolution. 2004;58:1318-28.
28. Marriott BP, Olsho L, Hadden L, Connor P. Intake of added sugars and selected nutrients in the United States, National Health and Nutrition Examination Survey (NHANES) 2003-2006. Crit Rev Food Sci Nutr. 2010 Mar;50(3):228-58.
29. Manning CJ, Potts WK, Wakeland EK, Dewsbury DA. What's wrong with MHC mate choice experiments? In: Doty RL, Muller-Schwarze D, editors. Chemical signals in vertebrates. New York, N.Y.: Plenum; 1992. p. 229-35.
30. Cunningham CB, Ruff JS, Chase K, Potts WK, Carrier DR. Competitive ability in male house mice (Mus musculus): Heritability, influences of body size and litter demographics. In review.
31. Sage RD. Wild mice. In: Foster HL, Smalll JD, Fox JG, editors. The mouse in biomedical research. New York, N.Y.: Academic Press; 1981. p. 40-90.
32. Slein MW. Methods of enzymatic analysis. Bergmeyer HU, editor. New York, NY: Academic Press; 1963.
33. R Development Core Team. R: A language and environment for statistical computing. Vienna, Austria: R Foundation for Statistical Computing; 2012.
34. Gittleman JL, Thompson SD. Energy allocation in mammalian reproduction. American Zoologist. 1988 1988;28(3):863-76.
35. Ayala JE, Samuel VT, Morton GJ, Obici S, Croniger CM, Shulman GI, et al. Standard operating procedures for describing and performing metabolic tests of glucose homeostasis in mice. Dis Model Mech. 2010 Sep-0ct;3(9-10):525-34.
36. Mittendorfer B. Insulin resistance: sex matters. Curr Opin Clin Nutr Metab Care. 2005 Jul;8(4):367-72.
37. Institute of Medicine. Sex-specific reporting of scientific research: A workshop summary: The National Academies Press; 2012.
66
38. Dewsbury DA, Baumgerdner DJ, Evans RL, Webster DG. Sexual dimorphism for body mass in 13 taxa of muroid rodents under laboratory conditions. J Mammal. 1980 Feb;61(1):146-9.
39. Haisova-Slabova M, Munclinger P, Frynta D. Sexual size dimorphism in free- living populations of Mus musculus: Are male house mice bigger? Acta Zoologica Academiae Scientiarum Hungaricae. 2010;56(2):139-51.
40. Riby JE, Fujisawa T, Kretchmer N. Fructose absorption. Am J Clin Nutr. 1993 Nov;58(5 Suppl):748S-53S.
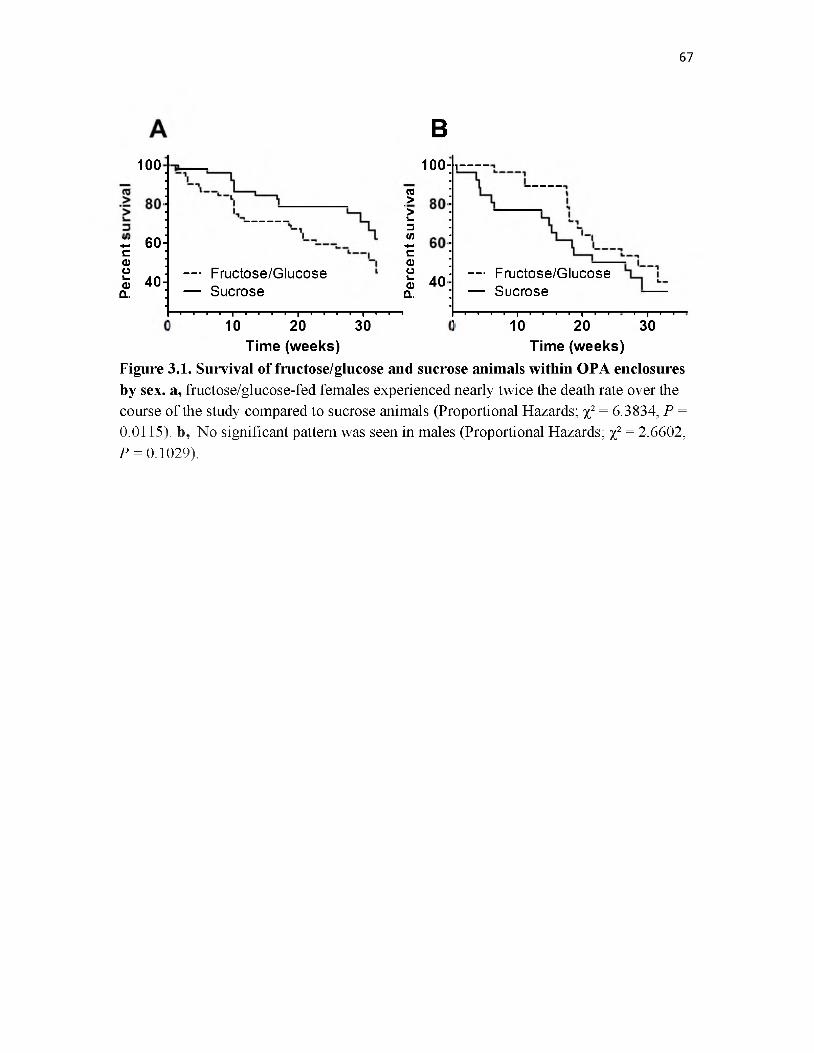
67
B100
Z 60-C<DOi .<Da.
40- — Fructose/G lucose— Sucrose
T--- I--- I--- I--- |--- I--- I--- I--- I--- |--- I--- I--- I--- I--- |--- I--- I--- I
100-1-------
re>■>i .3CO
+■»c<DOi .<Da.
40 — Fructose/G lucose— Sucrose
t -------i-------i------ i-------|------ i------ i-------i------ i------ |-------i-------r t ------ 1— i— r
3010 20 30 10 20Time (weeks) Time (weeks)
Figure 3.1. Survival of fructose/glucose and sucrose animals within OPA enclosures by sex. a, fructose/glucose-fed females experienced nearly twice the death rate over the course of the study compared to sucrose animals (Proportional Hazards; %2 = 6.3834, P = 0.0115). b, No significant pattern was seen in males (Proportional Hazards; X2 = 2.6602, P = 0.1029).
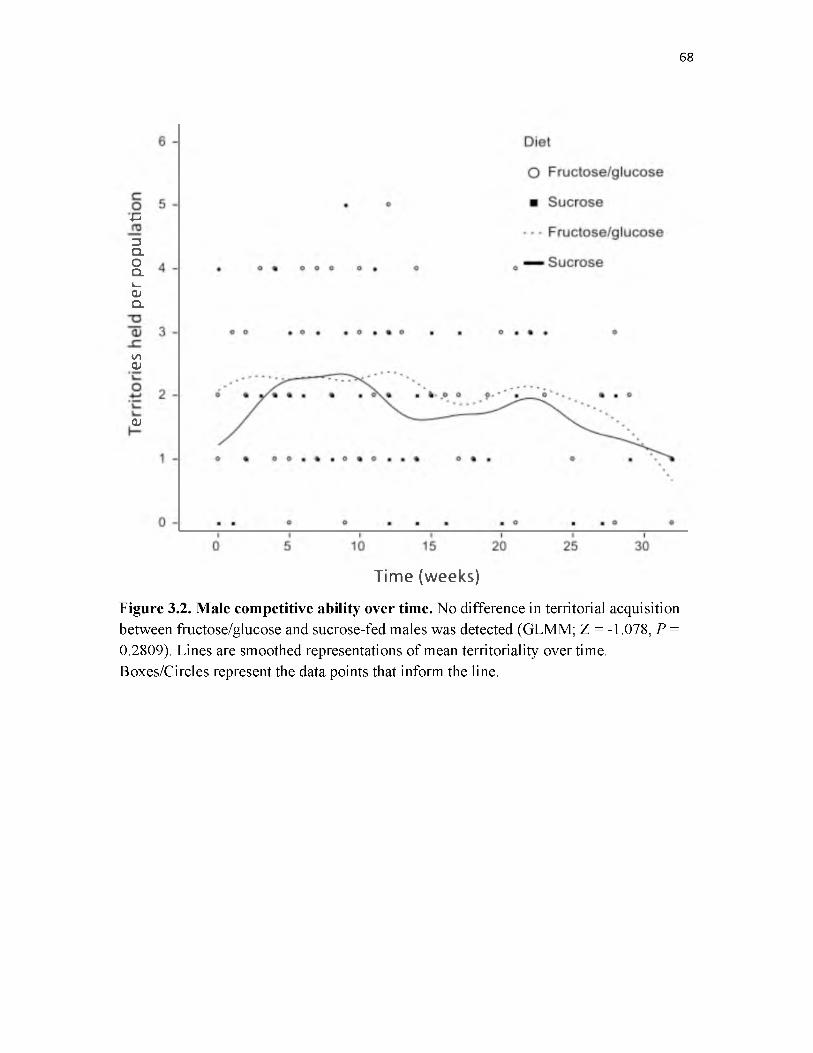
68
■P
"DQ .OQ.k_QJQ.
to<U
QJ
Time (weeks)
Figure 3.2. Male competitive ability over time. No difference in territorial acquisition between fructose/glucose and sucrose-fed males was detected (GLMM; Z = -1.078, P = 0.2809). Lines are smoothed representations of mean territoriality over time. Boxes/Circles represent the data points that inform the line.
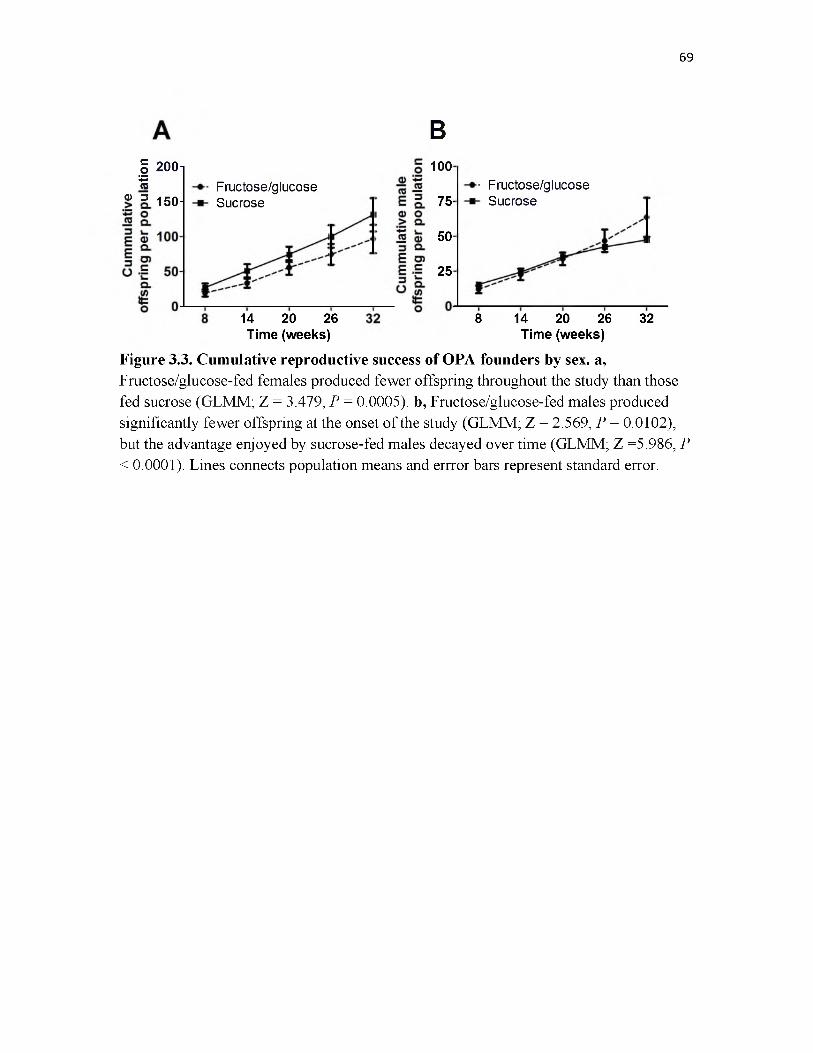
69
BJ 200n 13
0 3 150HFructose/glucoseSucrose
14 20 26 Time (weeks)
100
75-
50
25
Fructose/glucoseSucrose
8 14 20 26 Time (weeks)
32
Figure 3.3. Cum ulative reproductive success of OPA founders by sex. a, Fructose/glucose-fed females produced fewer offspring throughout the study than those fed sucrose (GLMM; Z = 3.479, P = 0.0005). b, Fructose/glucose-fed males produced significantly fewer offspring at the onset of the study (GLMM; Z = 2.569, P = 0.0102), but the advantage enjoyed by sucrose-fed males decayed over time (GLMM; Z =5.986, P < 0.0001). Lines connects population means and errror bars represent standard error.
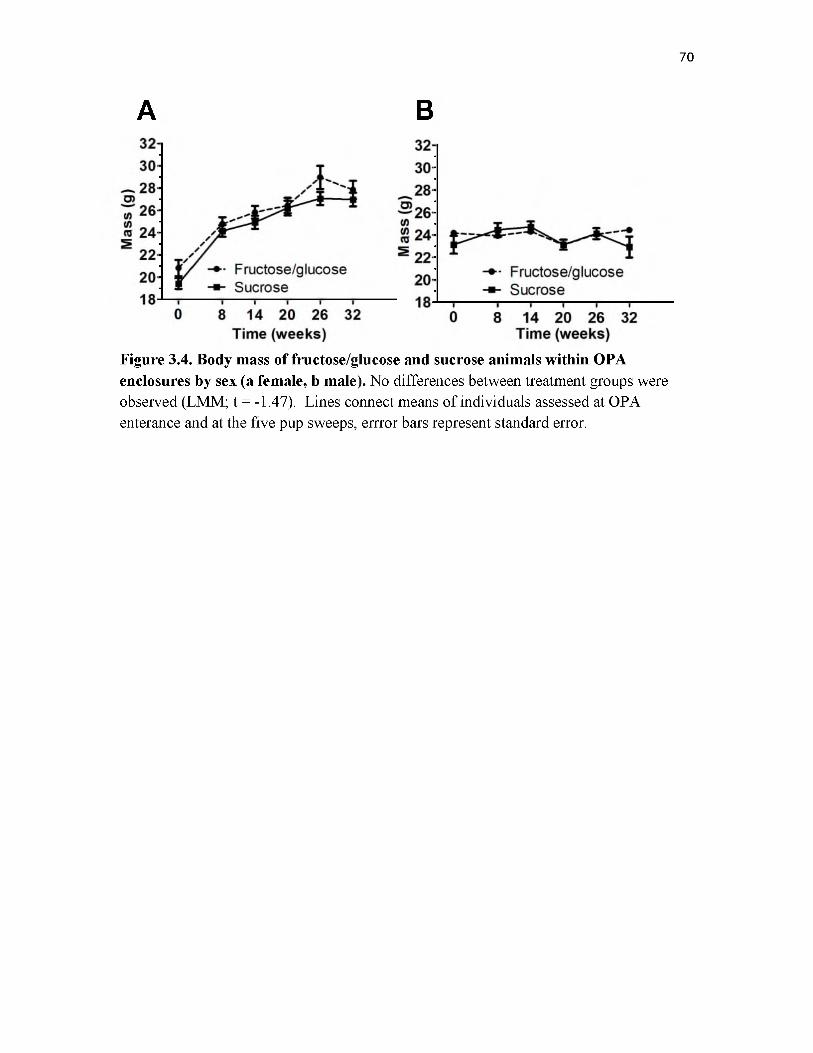
70
A B
Figure 3.4. Body mass of fructose/glucose and sucrose animals within OPAenclosures by sex (a female, b male). No differences between treatment groups were observed (LMM; t = -1.47). Lines connect means of individuals assessed at OPA enterance and at the five pup sweeps, errror bars represent standard error.
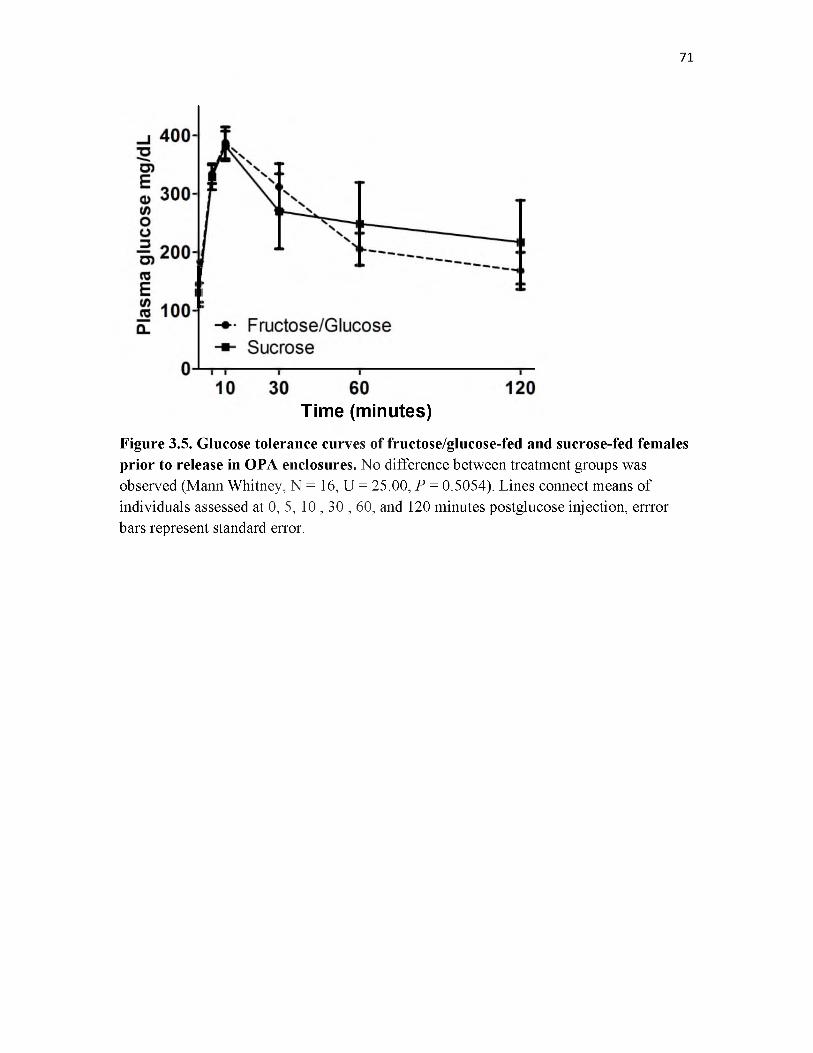
71
Time (minutes)
Figure 3.5. Glucose tolerance curves of fructose/glucose-fed and sucrose-fed females prior to release in OPA enclosures. No difference between treatment groups was observed (Mann Whitney, N = 16, U = 25.00, P = 0.5054). Lines connect means of individuals assessed at 0, 5, 10 , 30 , 60, and 120 minutes postglucose injection, errror bars represent standard error.
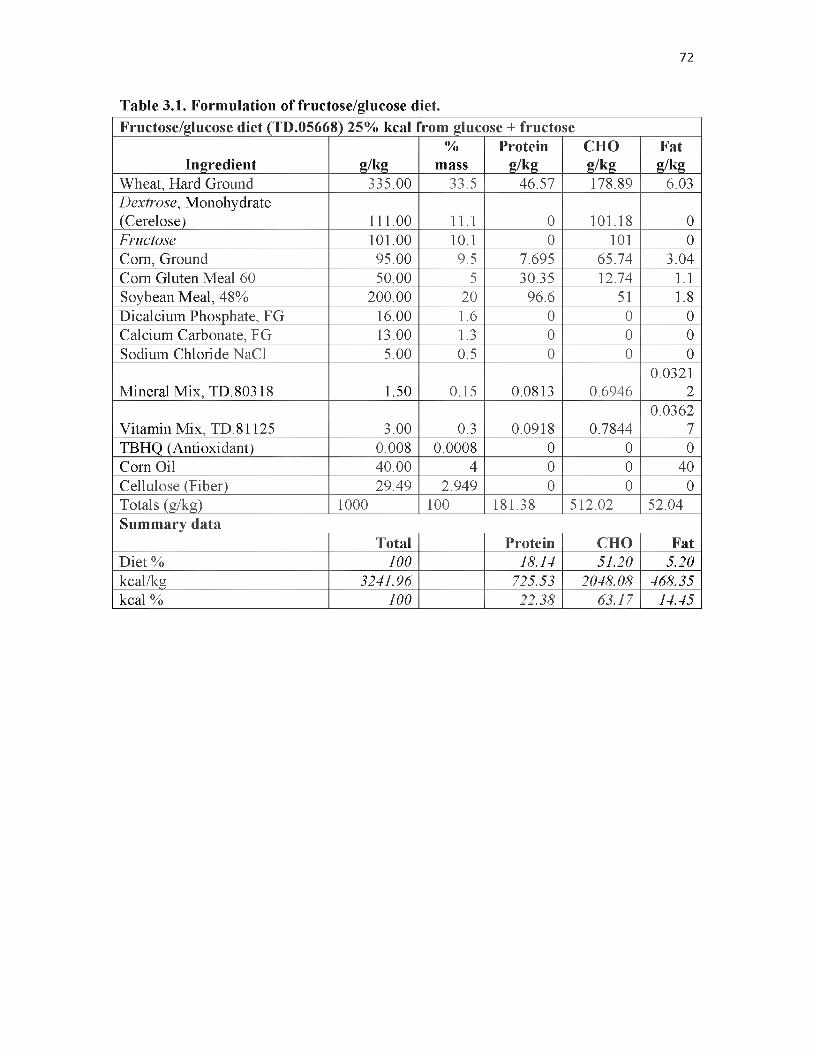
72
Table 3.1. Formulation of fructose/glucose diet.Fructose/glucose diet (TD.05668) 25% kcal rom glucose + fructose
Ingredient g/kg%
massProtein
g/kgCHOg/kg
Fatg/kg
Wheat, Hard Ground 335.00 33.5 46.57 178.89 6.03Dextrose, Monohydrate (Cerelose) 111.00 11.1 0 101.18 0Fructose 101.00 10.1 0 101 0Corn, Ground 95.00 9.5 7.695 65.74 3.04Corn Gluten Meal 60 50.00 5 30.35 12.74 1.1Soybean Meal, 48% 200.00 20 96.6 51 1.8Dicalcium Phosphate, FG 16.00 1.6 0 0 0Calcium Carbonate, FG 13.00 1.3 0 0 0Sodium Chloride NaCl 5.00 0.5 0 0 0
Mineral Mix, TD.80318 1.50 0.15 0.0813 0.69460.0321
2
Vitamin Mix, TD.81125 3.00 0.3 0.0918 0.78440.0362
7TBHQ (Antioxidant) 0.008 0.0008 0 0 0Corn Oil 40.00 4 0 0 40Cellulose (Fiber) 29.49 2.949 0 0 0Totals (g/kg) 1000 100 181.38 512.02 52.04Summary data
Total Protein CHO FatDiet % 100 18.14 51.20 5.20kcal/kg 3241.96 725.53 2048.08 468.35kcal % 100 22.38 63.17 14.45
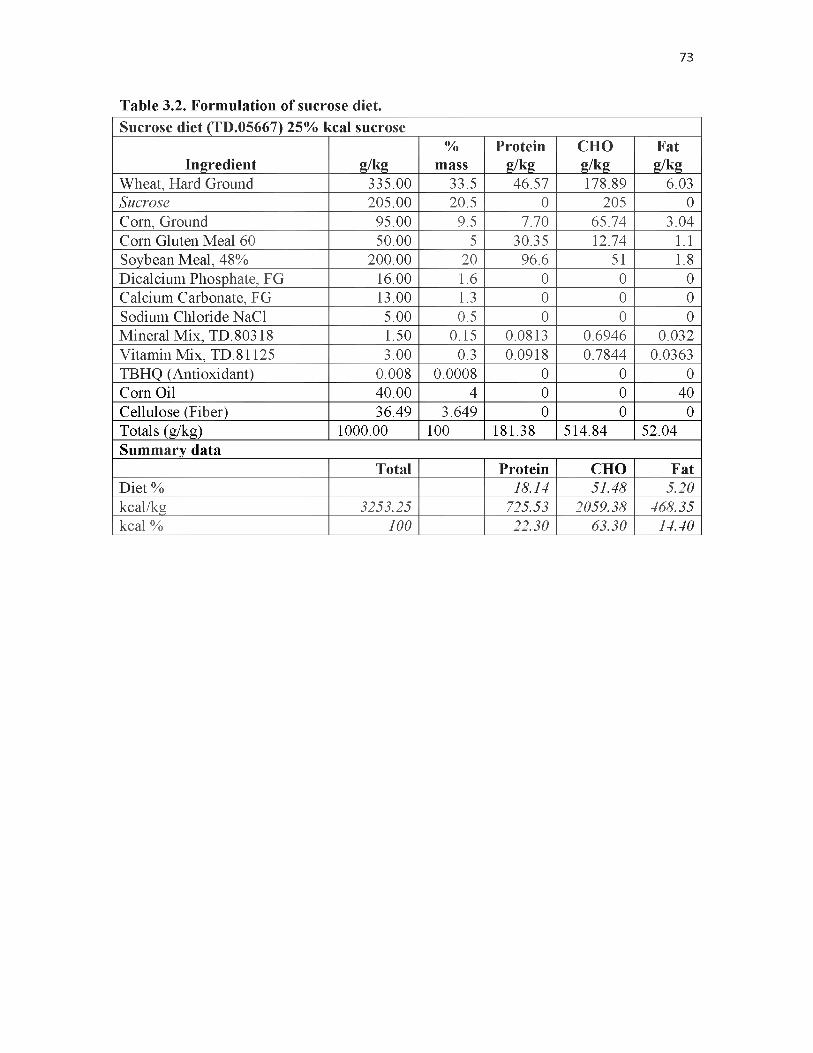
73
Table 3.2. Formulation of sucrose diet.Sucrose diet (TD.05667) 25% kcal sucrose
Ingredient g/kg%
massProtein
g/kgCHOg/kg
Fatg/kg
Wheat, Hard Ground 335.00 33.5 46.57 178.89 6.03Sucrose 205.00 20.5 0 205 0Corn, Ground 95.00 9.5 7.70 65.74 3.04Corn Gluten Meal 60 50.00 5 30.35 12.74 1.1Soybean Meal, 48% 200.00 20 96.6 51 1.8Dicalcium Phosphate, FG 16.00 1.6 0 0 0Calcium Carbonate, FG 13.00 1.3 0 0 0Sodium Chloride NaCl 5.00 0.5 0 0 0Mineral Mix, TD.80318 1.50 0.15 0.0813 0.6946 0.032Vitamin Mix, TD.81125 3.00 0.3 0.0918 0.7844 0.0363TBHQ (Antioxidant) 0.008 0.0008 0 0 0Corn Oil 40.00 4 0 0 40Cellulose (Fiber) 36.49 3.649 0 0 0Totals (g/kg) 1000.00 100 181.38 514.84 52.04Summary data
Total Protein CHO FatDiet % 18.14 51.48 5.20kcal/kg 3253.25 725.53 2059.38 468.35kcal % 100 22.30 63.30 14.40
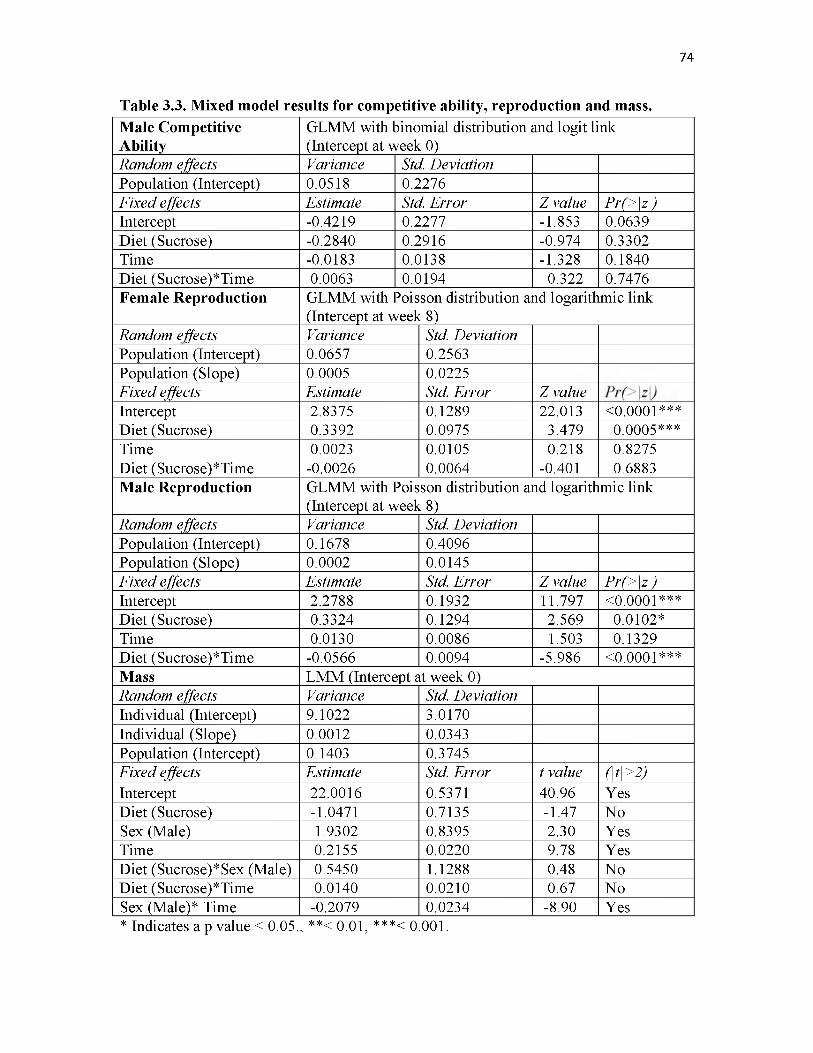
74
Table 3.3. Mixed model results for competitive ability, reproduction and mass.Male Competitive GLMM with binomial distribution and logit linkAbility (Intercept at week 0)Random effects Variance Std. DeviationPopulation (Intercept) 0.0518 0.2276Fixed effects Estimate Std. Error Z value P r ^ ^ )Intercept -0.4219 0.2277 -1.853 0.0639Diet (Sucrose) -0.2840 0.2916 -0.974 0.3302Time -0.0183 0.0138 -1.328 0.1840Diet (Sucrose)*Time 0.0063 0.0194 0.322 0.7476Female Reproduction GLMM with 3oisson distribution and logarithmic link
(Intercept at week 8)Random effects Variance Std. DeviationPopulation (Intercept) 0.0657 0.2563Population (Slope) 0.0005 0.0225Fixed effects Estimate Std. Error Z valueIntercept 2.8375 0.1289 22.013 <0.0001***Diet (Sucrose) 0.3392 0.0975 3.479 0.0005***Time 0.0023 0.0105 0.218 0.8275Diet (Sucrose)*Time -0.0026 0.0064 -0.401 0.6883Male Reproduction GLMM with Poisson distribution and logarithmic link
(Intercept at week 8)Random effects Variance Std. DeviationPopulation (Intercept) 0.1678 0.4096Population (Slope) 0.0002 0.0145Fixed effects Estimate Std. Error Z value P r ^ ^ )Intercept 2.2788 0.1932 11.797 <0.0001***Diet (Sucrose) 0.3324 0.1294 2.569 0.0102*Time 0.0130 0.0086 1.503 0.1329Diet (Sucrose)*Time -0.0566 0.0094 -5.986 <0.0001***Mass LMM (Intercept at week 0)Random effects Variance Std. DeviationIndividual (Intercept) 9.1022 3.0170Individual (Slope) 0.0012 0.0343Population (Intercept) 0.1403 0.3745Fixed effects Estimate Std. Error t value (W>2)Intercept 22.0016 0.5371 40.96 YesDiet (Sucrose) -1.0471 0.7135 -1.47 NoSex (Male) 1.9302 0.8395 2.30 YesTime 0.2155 0.0220 9.78 YesDiet (Sucrose)*Sex (Male) 0.5450 1.1288 0.48 NoDiet (Sucrose)*Time 0.0140 0.0210 0.67 NoSex (Male)* Time -0.2079 0.0234 -8.90 Yes* Indicates a p value < 0.05., **< 0.01, ***< 0.001.
CHAPTER 4
ORGANISMAL PERFORMANCE ASSESSMENT OF AMINE-
TERMINATED G7 PAMAM DENDRIMERS SUPPORTS
THRESHOLD MODEL OF TOXICITY
Abstract
Engineered nanomaterials and their possible applications are rapidly multiplying
and safety assessment of these compounds is failing to keep pace. One possible solution
is determining if certain physicochemical properties influence toxicity in predictable
ways. If so, toxicity could be predicted from structure and safety assessment could keep
up with engineering advances. Here we use Organismal Performance Assays (OPAs) to
determine if exposure to 3mg/kg amine-terminated G7 PAMAM dendrimers decreases
mouse health and performance in a seminatural environment. This dose is the calculated
maximum tolerated dose based on lethality due to blood coagulation at doses exceeding
10mg/kg. Within OPAs animals exposed to dendrimers did not experience increased
mortality or decreased reproduction and exposed males exhibited significantly greater
competitive ability and possessed 2.88 times more territories than control males. These
OPA results suggest that an acute exposure of 3mg/kg amine-terminated G7 PAMAM
dendrimers does not produce adverse mammalian health outcomes and that at levels
76
below those causing blood coagulation no other toxic mechanisms are associated with
exposure, at least as detectable with OPAs.
Introduction
The volume of engineered nanomaterials and their possible applications have
grown rapidly and though many benefits will come from this innovation, safety
assessment is failing to keep pace. One possible solution is discovering if certain
physicochemical properties (e.g., shape, size, surface area, and charge) influence toxicity
is predictable ways. If toxicity could be predicted from structure, then safety assessment
could keep up with advances in material science; but in order to insure accurate
predictions we must have broad, sensitive and functional assays able to detect toxicity at
the organismal level.
Size, surface properties and geometry of nanoparticles influence toxicity.
Nanoparticles smaller than 20nm can transit through blood vessel walls or cross the blood
brain barrier (1-3), while even smaller sized nanoparticles (~5nm) can be taken up by
cells (4). In the cases described above, smaller nanoparticles are more toxic to cells than
larger ones, but surface area is also highly important in regards to toxicity, with
increasing surface area causing increased toxicity (5, 6). Modification of a nanoparticle’s
surface allows the binding of a variety of chemical, molecular and biological entities.
Such manipulation can alter material properties concerning aggregation and solubility,
and subsequently cellular transport and toxicity. For example, attachment of hydrophilic
polymers, such as polyethylene glycol, to the surface of nanomaterials greatly increases
solubility and the evasion of the reticuloendothelial system (4, 7). Particle charge also
influences toxicity and the ability to traverse biological barriers (2, 8, 9), with cationic
77
particles being significantly more toxic than their anionic and neutral counterparts (10,
11).
Polyamidoamine (PAMAM) dendrimers are characterized by a unique tree-like
branching architecture and a compact spherical shape in solution (12-14). The
polydispersity values of PAMAM dendrimers range from ~ 1.000 - 1.005 verified by gel
electrophoresis and mass spectrometry (15). Surface groups of PAMAM dendrimers can
be cationic (e.g., amine terminated), anionic (e.g., carboxyl terminated) or neutral (e.g.,
hydroxyl). The high concentration of surface functionality and ability to manipulate this
functionality through simple organic reactions has led to several applications of
dendrimers in the coating of materials, electronics, and superconductors (16), as well as
in drug delivery, bioseparation and diagnostic imaging (17, 18).The unique spherical
shape, monodispersity and ability to incrementally increase size and number of surface
functional groups make these structures suitable candidates for evaluating the influence
of these physicochemical properties on their toxicity. Over the years Ghandehari and
coworkers have demonstrated that cytotoxicity, cellular transport, and subcellular fate of
PAMAM dendrimers can be modulated by controlling their size and surface properties
(11, 19).
Here, we specifically assess the toxicity of amine-terminated generation seven
(G7) PAMAM dendrimers at a dose of 3mg/kg body mass using organismal performance
assays (OPAs). This dose is considered the current maximum tolerated dose (MTD) and
is based on the observation that doses exceeding 10 mg/kg are lethal in mice, due to the
aggregation of the particles and the resulting coagulation of blood (20). OPA assessment
will determine if toxicity is present at the current MTD and, if present, will indicate that
78
the dendrimers may be promoting toxicity via an alternative mechanism as induced
coagulation at this dose was not detected previously (20).
OPAs are defined as sensitive phenotyping approaches that use seminatural
conditions to challenge the physiological performance of differentially treated animals
(i.e., treatment and control) in direct competition with each other. The relative success of
individuals in each group can be compared for any fitness measures allowing detection
and quantification of any reduced performance due to treatment. Though the OPA
moniker has only recently been derived, the technique has been previously used to detect
mating preferences due to major histocompatibility genes, quantify adverse consequences
associated with cousin and sibling-level inbreeding, and the selfish genetic element
known as the t complex (21-24). In all cases OPAs detected and quantified substantial
health impacts that had been missed by previous studies that assessed animals utilizing
standard laboratory methodologies.
Methods
Animals
Outbred, wild-derived house mice (Mus musculus) were used in this study, as
many laboratory strains do not possess the natural and functional behaviors required for
OPA assessment (25). Individuals in this study were from the 12th generation of the
colony originally described by Meagher et al. (23). Consanguinity was assessed during
the 11th generation and found to be comparable to wild populations (26). Before animals
were released into OPA enclosures they were housed according to standard protocols
under a 12:12h light:dark cycle with food and water available ad libitum. All protocols
were approved by and conducted under the animal care guidelines of the IACUC at the
University of Utah.
Dendrimer exposure
Exposure to dendrimers occurred intravenously through tail vein injection the day
of OPA release. The dendrimers were constructed in the Ghandehari laboratory at the
University of Utah and were suspended in sterile saline. Animals were weighed prior to
injection and dosed at a level of 3mg/kg body mass. Control animals were handled in an
identical matter except they were injected with only sterile saline.
OPA enclosures
Indoor OPA enclosures measure about 5m by 7m (35m2), and each pen is
subdivided into six subsections by hardware cloth, which provides spatial complexity.
Each subsection has food and water that is associated with a set of nest boxes in either
one of four “optimal” territories, which contain nest boxes in enclosed structures or two
“suboptimal” territories with nest boxes in the open. Optimal nesting structures were
made of covered, opaque plastic storage bins (75L) with 5cm diameter entryways and
contained four standard mouse cages (also with 5cm entryways), bedding and food. The
suboptimal nest boxes made of plastic planter boxes (61cm long by 15cm wide by 19cm
high) fitted with chicken-wire lids and 5cm circular entryways; food containers and one
gallon poultry waterers were adjacent to these nest boxes and both provided ad libitum
resource access. Together, the hardware fences and the two types of nest boxes created
environmental complexity in which mice established nesting sites, territorial boundaries,
and social hierarchies. OPA enclosures mimic habitat and social environments
79
experienced by mice in nature, and the population density is representative of
measurements from wild populations (27).
To assess impacts of amine-terminated G7 PAMAM dendrimer exposure at a
dose of 3mg/kg on survival, competitive ability and reproduction, two OPA populations
were founded by 10 males, and either 20 or 18 females, for a total of 58 individuals.
Equal numbers of treatment and control animals were represented in each sex within both
populations. No male individual was related at the cousin level or above to any other
individual (male or female) within a given population. Relatedness between female
founders was also avoided, though in each population a single pair of sisters was
included, with one sister belonging to the treatment group and the other belonging to the
control group. Mean age of founders was 18.44 ± 4.35 (M ± S.D.) weeks for males and
17.32 ± 4.55 weeks for females. Populations ran for a total of 18 weeks.
Survivorship
Survivorship of population founders was determined by periodic checks in each
enclosure. Dead founders were identified by their PIT-tag ID or personalized ear punches
and removed from enclosures. Date of death was estimated based on three factors: date of
last check, the last date an animal was recorded at a feeding station and the condition of
the corpse.
Reproductive success
Samples to determine the reproductive success of founders were gathered during
“pup sweeps” in which pups born during the previous cycle were removed from the
population, sacrificed and had tissue samples taken for genetic analysis. The first sweep
80
occurred during week eight and the second six weeks later. This schedule prevented
offspring born in the enclosures from breeding. A total of 260 individual samples were
collected between the populations.
Population level reproductive success was determined for treatment and control
groups as described previously (23). Briefly, in each competition enclosure founders of
each treatment group were chosen based on non-overlapping allelic assignments on the
mitochondrial genome and Y-chromosome. Allelic assignments were reversed across
populations to avoid possible confounding effects of allele types. In total we obtained 239
(91.9% of total) mitochondrial and 116 (89.2% of total assuming a 1:1 sex ratio) Y-
chromosome genotypes.
Male competitive ability
One week prior to entrance each founder was implanted with a unique passive
integrated transponder (PIT) tag (TX1400ST, BioMark, Boise ID). Individuals were
monitored until release and no redness, swelling or noticeable infection around the
injection site was detected. A set of PIT antennae and readers (FS2001F-ISO, BioMark,
Boise ID) were rotated between the populations throughout the study, placed at each of
the optimal and suboptimal feeders, and data were streamed to a computer equipped with
data-logging software (Minimon, Culver City, CA). Male social dominance was assigned
when a male had >75% of the PIT-tag reads at a single location over the course of a
multi-day reader session, and territories were designated as controlled by a treatment or
control male based on the exposure status of the male controlling them. Female data were
collected, but results are not reported here as not enough is known about female
dominance behavior to use it as a measure of performance.
81
Body mass
Body mass was assessed in the 58 animals that founded the OPA populations at
both the time they were released into populations and at the first pup sweep occurring
eight weeks later.
Statistical methods
Survival. Survivorship of the 58 founders was analyzed by Cox proportional
hazard models with male and female animals assessed separately due to vastly different
mortality rates. Day one was defined as when animals entered OPA enclosures and is
different by a week for males and females (see above). In the male data set there were 6
events and 14 censorings while in the female data no mortality was observed so data were
not analyzed.
Male competitive ability. To assess the main effects of diet and time (and a time
by diet interaction) on male competitive ability, we used a generalized linear mixed
model (GLMM) to predict the probability of ownership. As a territory can only be
defended or not, we used a binomial distribution with a logit link to estimate probability
of ownership (defense). The numbers of territories controlled within populations by the
treatment or control group was assessed at multiple time points throughout the study for a
total of 58 observations. The intercept was set at the time of OPA entrance, week zero.
The number of territories in each population is constant at six and territories were
occupied (by a mouse of either diet) or undefended. Time, diet and their interaction were
treated as fixed effects and population was modeled as a random effect with a random
intercept calculated for each.
82
Reproduction. Reproduction data were assessed using a Chi-square test with a
Yates' correction on the total reproductive output of the populations combined. The
number of expected events was determined by dividing the total number of offspring
successfully genotyped by two. Male and female data were analyzed separately as they
were ascertained with different genetic markers. Though the underlying assumption of
each event (offspring) being independent may have been violated, this approach is used
by other researchers using seminatural populations of mice to assess reproductive success
(28).
Mass. A two-way analysis of variance (ANOVA) was used to assess the effects of
exposure and time, as well as their interaction on the mass of the 58 population founders.
Male and female masss were assessed separately as sexual mass dimorphism is present in
our population (Chapter 3). All founders were weighed at the time of release and
surviving animals were weighed again at the first pup sweep for a total of 103
observations.
Mixed-effects models were fit in R (29) using the glmer functions of the lme4
library. For mixed-effects models several candidate models for the random effects terms
were fit to the data including models estimating both intercept and/or slope for random
effects. In all cases the model that explained at least some of the variance with random
effects and had the lowest AIC score was selected. Neither the significance of any
reported fixed effect nor the magnitude of the effect differed between models. Estimates
(and significance) were consistent with those obtained when we ignored either the nested
structure and repeated measurements of individuals within populations or repeated
measurements of individuals or populations. Proportional hazard models were performed
83
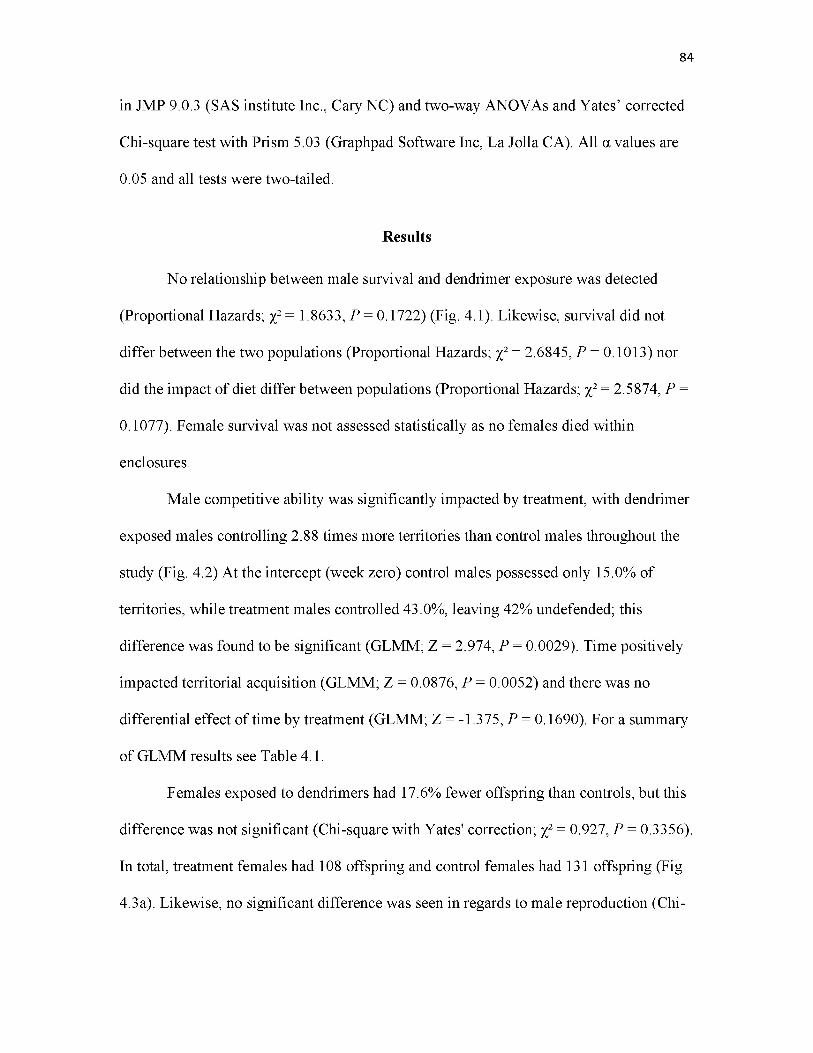
in JMP 9.0.3 (SAS institute Inc., Cary NC) and two-way ANOVAs and Yates’ corrected
Chi-square test with Prism 5.03 (Graphpad Software Inc, La Jolla CA). All a values are
0.05 and all tests were two-tailed.
Results
No relationship between male survival and dendrimer exposure was detected
(Proportional Hazards; x2 = 1.8633, P = 0.1722) (Fig. 4.1). Likewise, survival did not
differ between the two populations (Proportional Hazards; x2 = 2.6845, P = 0.1013) nor
did the impact of diet differ between populations (Proportional Hazards; x2 = 2.5874, P =
0.1077). Female survival was not assessed statistically as no females died within
enclosures.
Male competitive ability was significantly impacted by treatment, with dendrimer
exposed males controlling 2.88 times more territories than control males throughout the
study (Fig. 4.2) At the intercept (week zero) control males possessed only 15.0% of
territories, while treatment males controlled 43.0%, leaving 42% undefended; this
difference was found to be significant (GLMM; Z = 2.974, P = 0.0029). Time positively
impacted territorial acquisition (GLMM; Z = 0.0876, P = 0.0052) and there was no
differential effect of time by treatment (GLMM; Z = -1.375, P = 0.1690). For a summary
of GLMM results see Table 4.1.
Females exposed to dendrimers had 17.6% fewer offspring than controls, but this
difference was not significant (Chi-square with Yates' correction; x2 = 0.927, P = 0.3356).
In total, treatment females had 108 offspring and control females had 131 offspring (Fig
4.3a). Likewise, no significant difference was seen in regards to male reproduction (Chi-
84
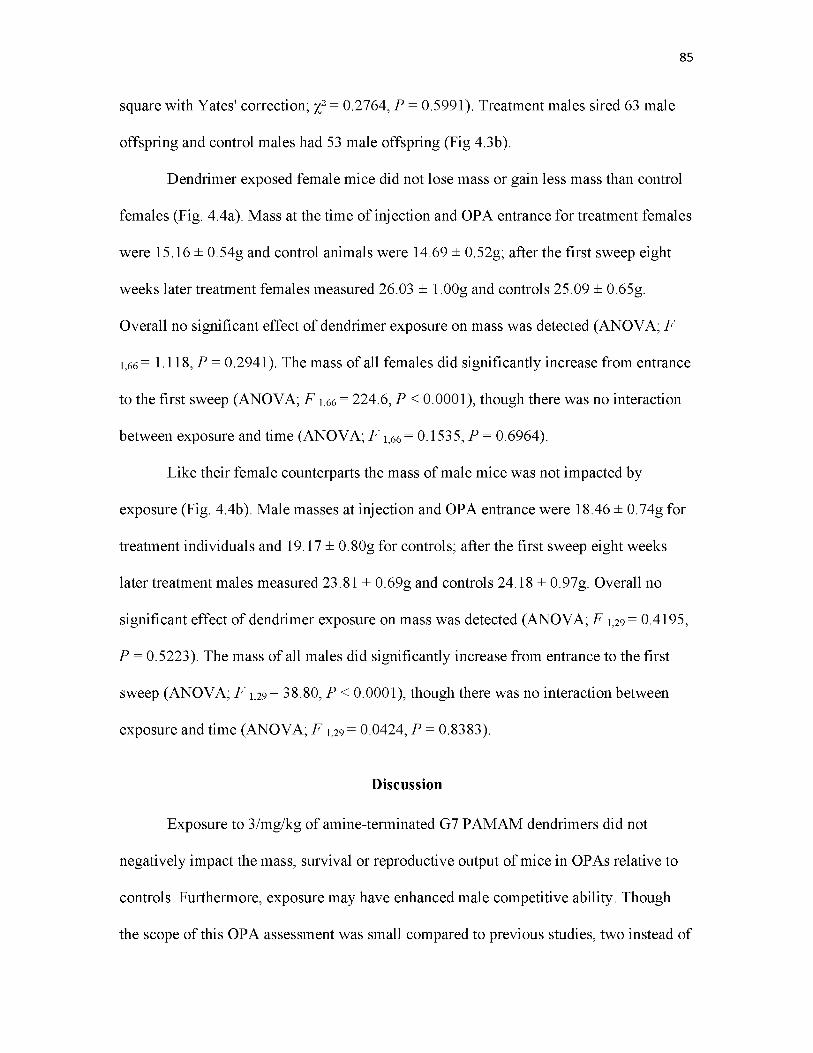
square with Yates' correction; %2 = 0.2764, P = 0.5991). Treatment males sired 63 male
offspring and control males had 53 male offspring (Fig 4.3b).
Dendrimer exposed female mice did not lose mass or gain less mass than control
females (Fig. 4.4a). Mass at the time of injection and OPA entrance for treatment females
were 15.16 ± 0.54g and control animals were 14.69 ± 0.52g; after the first sweep eight
weeks later treatment females measured 26.03 ± 1.00g and controls 25.09 ± 0.65g.
Overall no significant effect of dendrimer exposure on mass was detected (ANOVA; F
1,66 = 1.118, P = 0.2941). The mass of all females did significantly increase from entrance
to the first sweep (ANOVA; F 1,66 = 224.6, P < 0.0001), though there was no interaction
between exposure and time (ANOVA; F 1,66 = 0.15 3 5, P = 0.6964).
Like their female counterparts the mass of male mice was not impacted by
exposure (Fig. 4.4b). Male masses at injection and OPA entrance were 18.46 ± 0.74g for
treatment individuals and 19.17 ± 0.80g for controls; after the first sweep eight weeks
later treatment males measured 23.81 ± 0.69g and controls 24.18 ± 0.97g. Overall no
significant effect of dendrimer exposure on mass was detected (ANOVA; F 1,29 = 0.4195,
P = 0.5223). The mass of all males did significantly increase from entrance to the first
sweep (ANOVA; F 1,29 = 38.80, P < 0.0001), though there was no interaction between
exposure and time (ANOVA; F 1,29 = 0.0424, P = 0.8383).
Discussion
Exposure to 3/mg/kg of amine-terminated G7 PAMAM dendrimers did not
negatively impact the mass, survival or reproductive output of mice in OPAs relative to
controls. Furthermore, exposure may have enhanced male competitive ability. Though
the scope of this OPA assessment was small compared to previous studies, two instead of
85
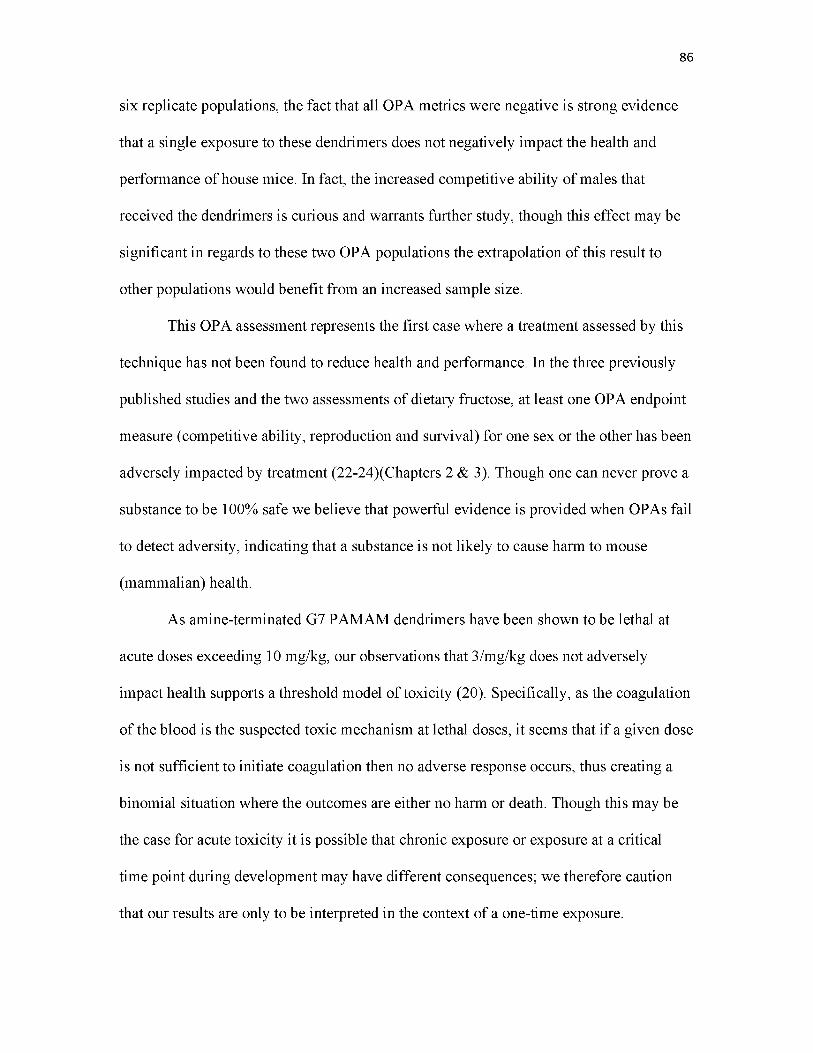
six replicate populations, the fact that all OPA metrics were negative is strong evidence
that a single exposure to these dendrimers does not negatively impact the health and
performance of house mice. In fact, the increased competitive ability of males that
received the dendrimers is curious and warrants further study, though this effect may be
significant in regards to these two OPA populations the extrapolation of this result to
other populations would benefit from an increased sample size.
This OPA assessment represents the first case where a treatment assessed by this
technique has not been found to reduce health and performance. In the three previously
published studies and the two assessments of dietary fructose, at least one OPA endpoint
measure (competitive ability, reproduction and survival) for one sex or the other has been
adversely impacted by treatment (22-24)(Chapters 2 & 3). Though one can never prove a
substance to be 100% safe we believe that powerful evidence is provided when OPAs fail
to detect adversity, indicating that a substance is not likely to cause harm to mouse
(mammalian) health.
As amine-terminated G7 PAMAM dendrimers have been shown to be lethal at
acute doses exceeding 10 mg/kg, our observations that 3/mg/kg does not adversely
impact health supports a threshold model of toxicity (20). Specifically, as the coagulation
of the blood is the suspected toxic mechanism at lethal doses, it seems that if a given dose
is not sufficient to initiate coagulation then no adverse response occurs, thus creating a
binomial situation where the outcomes are either no harm or death. Though this may be
the case for acute toxicity it is possible that chronic exposure or exposure at a critical
time point during development may have different consequences; we therefore caution
that our results are only to be interpreted in the context of a one-time exposure.
86
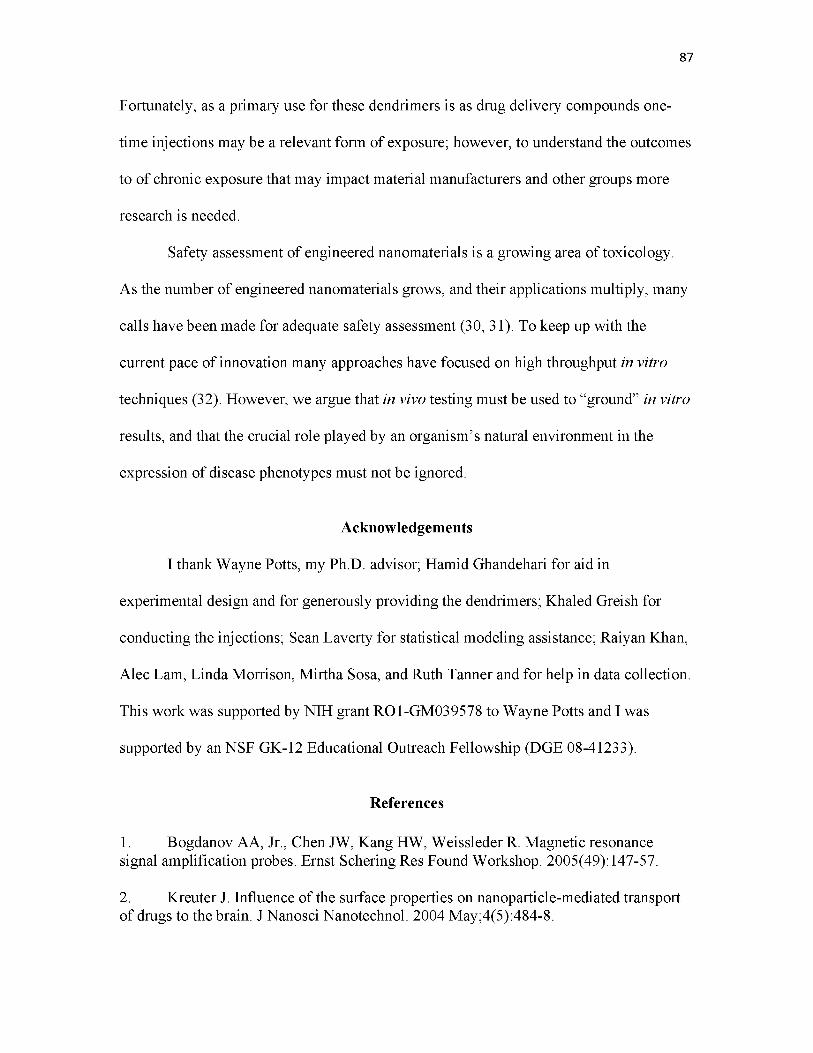
87
Fortunately, as a primary use for these dendrimers is as drug delivery compounds one
time injections may be a relevant form of exposure; however, to understand the outcomes
to of chronic exposure that may impact material manufacturers and other groups more
research is needed.
Safety assessment of engineered nanomaterials is a growing area of toxicology.
As the number of engineered nanomaterials grows, and their applications multiply, many
calls have been made for adequate safety assessment (30, 31). To keep up with the
current pace of innovation many approaches have focused on high throughput in vitro
techniques (32). However, we argue that in vivo testing must be used to “ground” in vitro
results, and that the crucial role played by an organism’s natural environment in the
expression of disease phenotypes must not be ignored.
Acknowledgements
I thank Wayne Potts, my Ph.D. advisor; Hamid Ghandehari for aid in
experimental design and for generously providing the dendrimers; Khaled Greish for
conducting the injections; Sean Laverty for statistical modeling assistance; Raiyan Khan,
Alec Lam, Linda Morrison, Mirtha Sosa, and Ruth Tanner and for help in data collection.
This work was supported by NIH grant R01-GM039578 to Wayne Potts and I was
supported by an NSF GK-12 Educational Outreach Fellowship (DGE 08-41233).
References
1. Bogdanov AA, Jr., Chen JW, Kang HW, Weissleder R. Magnetic resonance signal amplification probes. Ernst Schering Res Found Workshop. 2005(49): 147-57.
2. Kreuter J. Influence of the surface properties on nanoparticle-mediated transport of drugs to the brain. J Nanosci Nanotechnol. 2004 May;4(5):484-8.
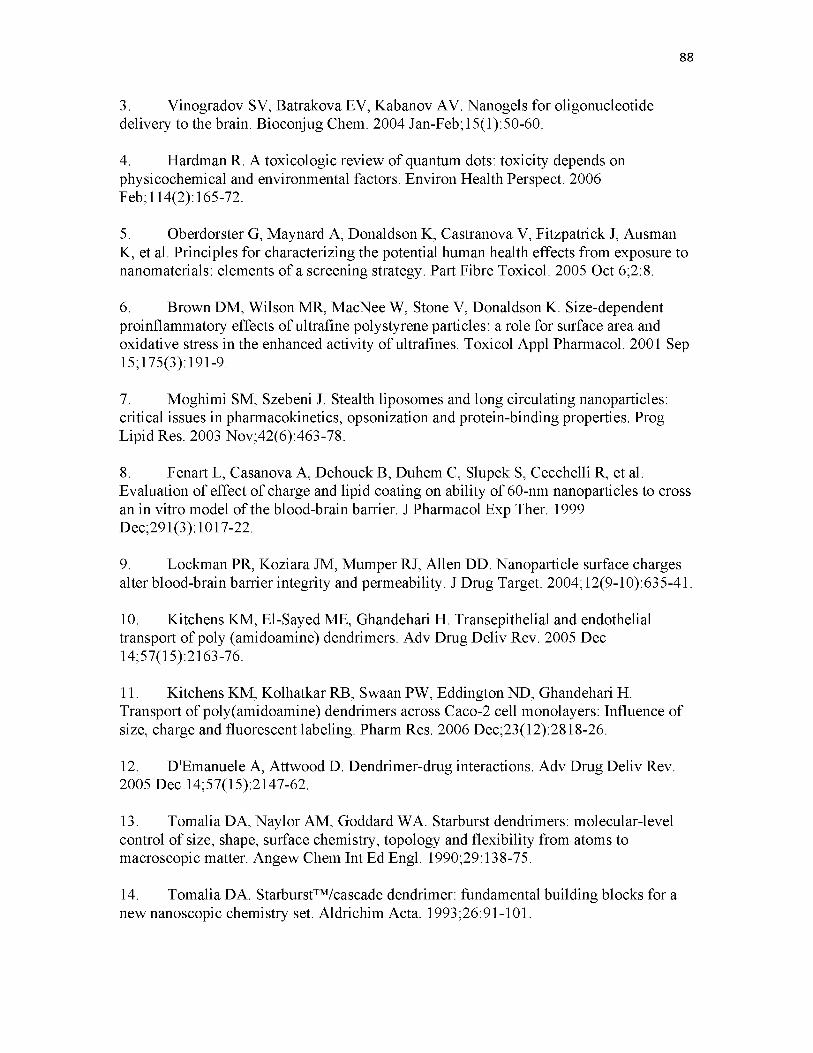
88
3. Vinogradov SV, Batrakova EV, Kabanov AV. Nanogels for oligonucleotide delivery to the brain. Bioconjug Chem. 2004 Jan-Feb;15(1):50-60.
4. Hardman R. A toxicologic review of quantum dots: toxicity depends on physicochemical and environmental factors. Environ Health Perspect. 2006 Feb;114(2):165-72.
5. Oberdorster G, Maynard A, Donaldson K, Castranova V, Fitzpatrick J, Ausman K, et al. Principles for characterizing the potential human health effects from exposure to nanomaterials: elements of a screening strategy. Part Fibre Toxicol. 2005 Oct 6;2:8.
6. Brown DM, Wilson MR, MacNee W, Stone V, Donaldson K. Size-dependent proinflammatory effects of ultrafine polystyrene particles: a role for surface area and oxidative stress in the enhanced activity of ultrafines. Toxicol Appl Pharmacol. 2001 Sep 15;175(3):191-9.
7. Moghimi SM, Szebeni J. Stealth liposomes and long circulating nanoparticles: critical issues in pharmacokinetics, opsonization and protein-binding properties. Prog Lipid Res. 2003 Nov;42(6):463-78.
8. Fenart L, Casanova A, Dehouck B, Duhem C, Slupek S, Cecchelli R, et al. Evaluation of effect of charge and lipid coating on ability of 60-nm nanoparticles to cross an in vitro model of the blood-brain barrier. J Pharmacol Exp Ther. 1999 Dec;291(3):1017-22.
9. Lockman PR, Koziara JM, Mumper RJ, Allen DD. Nanoparticle surface charges alter blood-brain barrier integrity and permeability. J Drug Target. 2004;12(9-10):635-41.
10. Kitchens KM, El-Sayed ME, Ghandehari H. Transepithelial and endothelial transport of poly (amidoamine) dendrimers. Adv Drug Deliv Rev. 2005 Dec 14;57(15):2163-76.
11. Kitchens KM, Kolhatkar RB, Swaan PW, Eddington ND, Ghandehari H. Transport of poly(amidoamine) dendrimers across Caco-2 cell monolayers: Influence of size, charge and fluorescent labeling. Pharm Res. 2006 Dec;23(12):2818-26.
12. D'Emanuele A, Attwood D. Dendrimer-drug interactions. Adv Drug Deliv Rev. 2005 Dec 14;57(15):2147-62.
13. Tomalia DA, Naylor AM, Goddard WA. Starburst dendrimers: molecular-level control of size, shape, surface chemistry, topology and flexibility from atoms to macroscopic matter. Angew Chem Int Ed Engl. 1990;29:138-75.
14. Tomalia DA. Starburst™/cascade dendrimer: fundamental building blocks for a new nanoscopic chemistry set. Aldrichim Acta. 1993;26:91-101.
89
15. Esfand R, Tomalia DA. Poly(amidoamine) (PAMAM) dendrimers: from biomimicry to drug delivery and biomedical applications. Drug Discov Today. 2001 Apr 1;6(8):427-36.
16. Service RF. Dendrimers: Dream molecules approach real applications. Science. 1995 Jan 27;267(5197):458-9.
17. Svenson S, Tomalia DA. Dendrimers in biomedical applications--reflections on the field. Adv Drug Deliv Rev. 2005 Dec 14;57(15):2106-29.
18. Wilbur DS, Pathare PM, Hamlin DK, Buhler KR, Vessella RL. Biotin reagents for antibody pretargeting. 3. Synthesis, radioiodination, and evaluation of biotinylated starburst dendrimers. Bioconjug Chem. 1998 Nov-Dec;9(6):813-25.
19. Sadekar S, Ghandehari H. Transepithelial transport and toxicity of PAMAM dendrimers: Implications for oral drug delivery. Adv Drug Deliv Rev. 2012 May 1;64(6):571-88.
20. Greish K, Thiagarajan G, Herd H, Price R, Bauer H, Hubbard D, et al. Size and surface charge significantly influence the toxicity of silica and dendritic nanoparticles. Nanotoxicology. 2011 Jul 28.
21. Potts WK, Manning CJ, Wakeland EK. Mating patterns in seminatural populations of mice influenced by MHC genotype. Nature. 1991;352:619-21.
22. Ilmonen P, Penn DJ, Damjanovich K, Clarke J, Lamborn D, Morrison L, et al. Experimental infection magnifies inbreeding depression in house mice. Journal of Evolutionary Biology. 2008;21:834-41.
23. Meagher S, Penn DJ, Potts WK. Male-male competition magnifies inbreeding depression in wild house mice. Proc Natl Acad Sci USA. 2000;97(7):3324-9.
24. Carroll LS, Meagher S, Morrison L, Penn DJ, Potts WK. Fitness effects of a selfish gene are revealed in an ecological context. Evolution. 2004;58:1318-28.
25. Manning CJ, Potts WK, Wakeland EK, Dewsbury DA. What's wrong with MHC mate choice experiments? In: Doty RL, Muller-Schwarze D, editors. Chemical Signals in Vertebrates. New York, N.Y.: Plenum; 1992. p. 229-35.
26. Cunningham CB, Ruff JS, Chase K, Potts WK, Carrier DR. Competitive ability in male house mice (Mus musculus): Heritability, influences of body size and litter demographics. In review.
27. Sage RD. Wild mice. In: Foster HL, Smalll JD, Fox JG, editors. The mouse in biomedical research. New York, N.Y.: Academic Press; 1981. p. 40-90.
90
28. Firman RC. Polyandrous females benefit by producing sons that achieve high reproductive success in a competitive environment. Proc Biol Sci. 2011 Sep 22;278(1719):2823-31.
29. R Core Development Team. R: A language and environment for statistical computing. Vienna, Austria: R Foundation for Statistical Computing; 2012.
30. Colvin VL. The potential environmental impact of engineered nanomaterials. Nat Biotechnol. 2003 Oct;21(10):1166-70.
31. Nel A, Xia T, Madler L, Li N. Toxic potential of materials at the nanolevel. Science. 2006 Feb 3;311(5761):622-7.
32. Damoiseaux R, George S, Li M, Pokhrel S, Ji Z, France B, et al. No time to lose-- high throughput screening to assess nanomaterial safety. Nanoscale. 2011 Apr;3(4):1345- 60.
91
100
£ 80-
ro>>
</>+->ca>oa>Q_
60-
40 -
. 1 . 1■ 1 ■ 1
: — Control; — Treatment
200 5 10 15 Time (weeks)
Figure 4.1. Survival of treatment and control males. Dendrimer exposure did not impact survival of male animals (Proportional Hazards; %2 = 1.8633, P = 0.1722). Female data are not shown, as there was no female mortality.
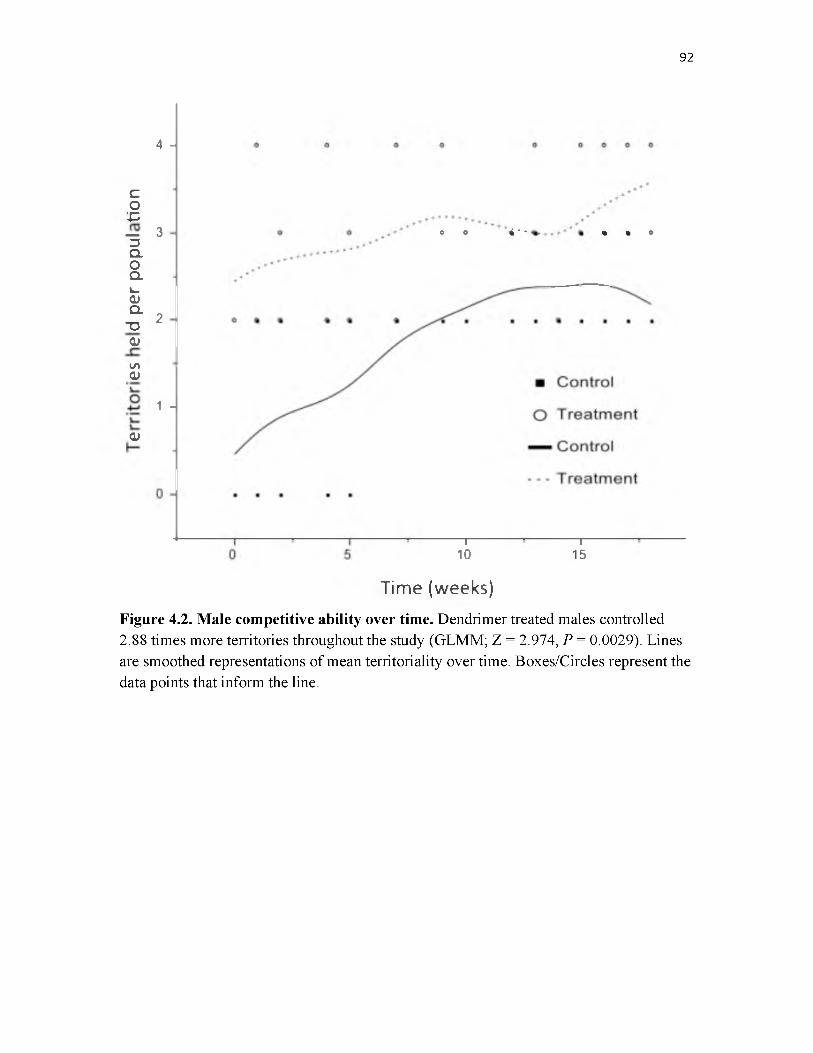
92
<U
4 -
CofZ— 33Q.OQ.k -O)
s *Of
i/><D
1 -
o s 4 * * ■
—r~10
• • o
—r~15
Time (weeks)
Figure 4.2. Male competitive ability over time. Dendrimer treated males controlled 2.88 times more territories throughout the study (GLMM; Z = 2.974, P = 0.0029). Lines are smoothed representations of mean territoriality over time. Boxes/Circles represent the data points that inform the line.
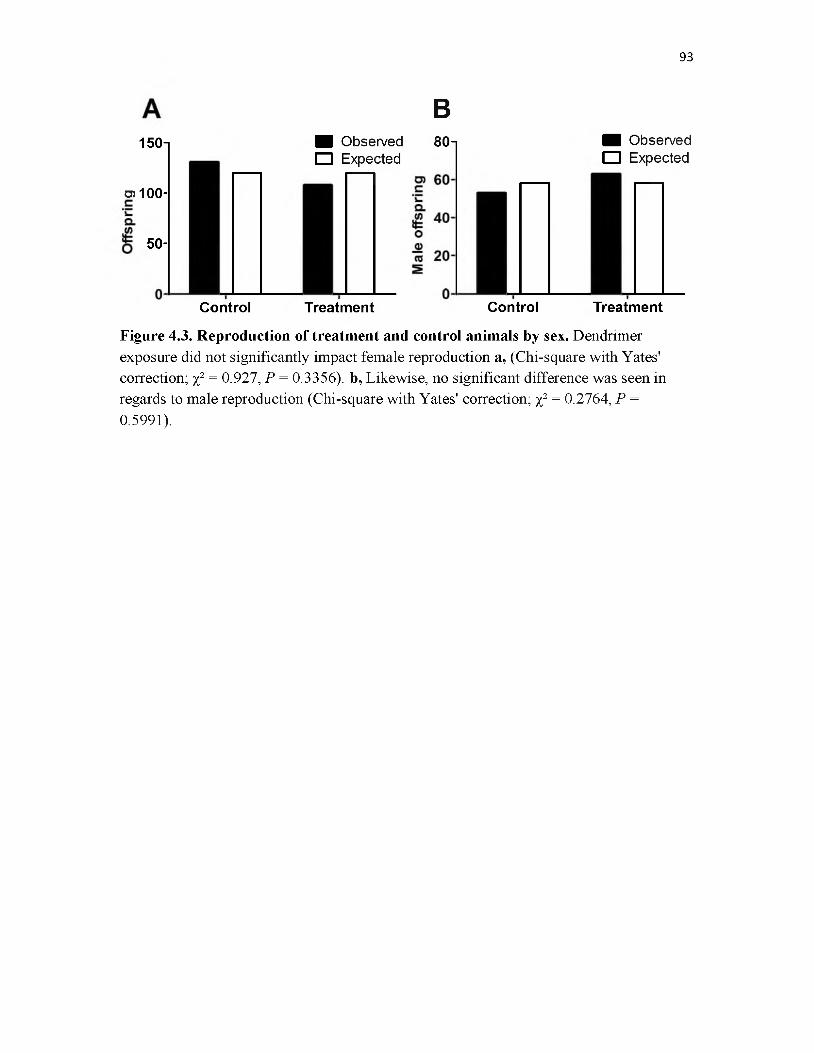
93
B150-1
ro 1 00 -
■ Observed □ Expected
80-1
50-
Control Treatment
■ Observed □ Expected
Control Treatment
Figure 4.3. Reproduction of treatment and control animals by sex. Dendrimer exposure did not significantly impact female reproduction a, (Chi-square with Yates' correction; %2 = 0.927, P = 0.3356). b, Likewise, no significant difference was seen in regards to male reproduction (Chi-square with Yates' correction; X2 = 0.2764, P = 0.5991).
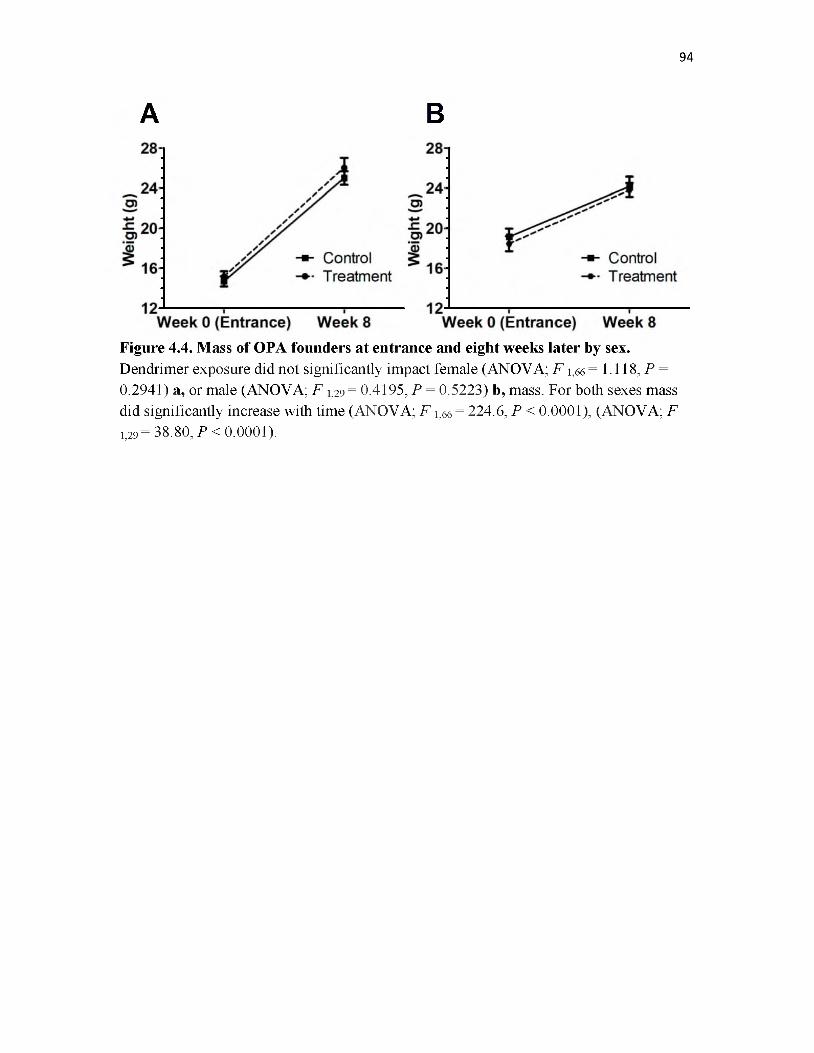
A B
94
Figure 4.4. Mass of OPA founders at entrance and eight weeks later by sex. Dendrimer exposure did not significantly impact female (ANOVA; F 1,66 = 1.118, P = 0.2941) a, or male (ANOVA; F 1,29 = 0.4195, P = 0.5223) b, mass. For both sexes mass did significantly increase with time (ANOVA; F 1,66 = 224.6, P < 0.0001), (ANOVA; F 1,29 = 38.80, P < 0.0001).
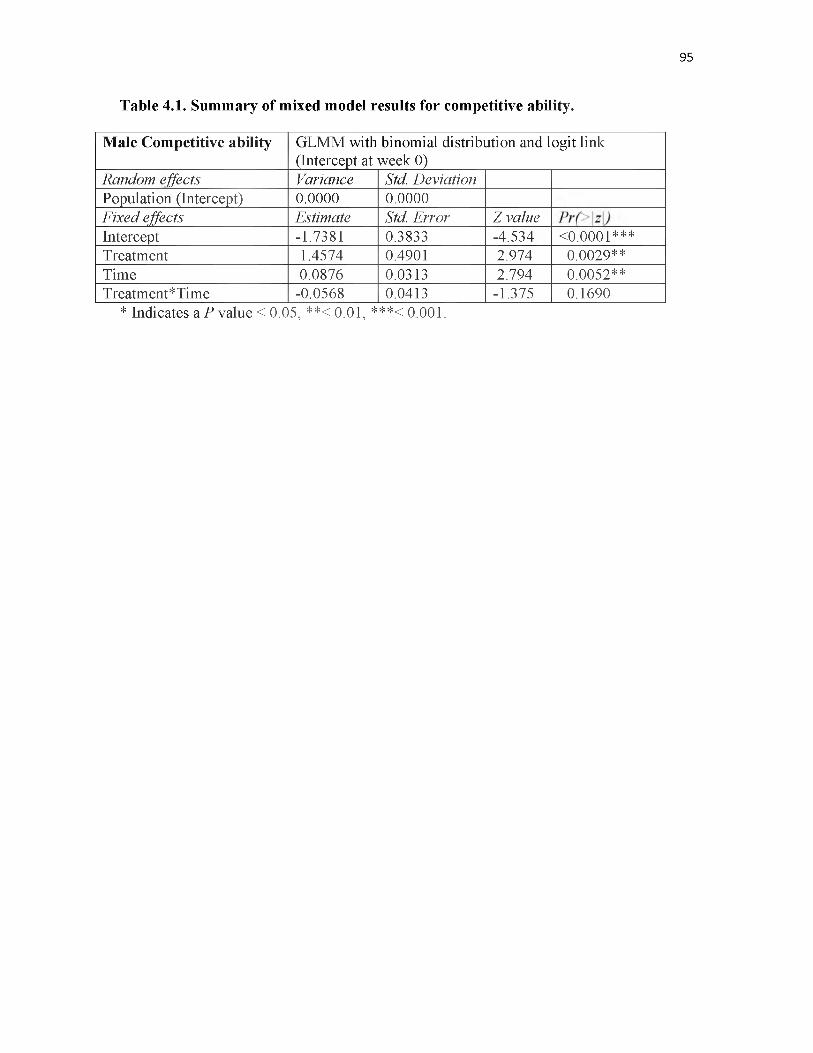
95
Table 4.1. Summary of mixed model results for competitive ability.
Male Competitive ability GLMM with binomial distribution and logit link (Intercept at week 0)
Random effects Variance Std. DeviationPopulation (Intercept) 0.0000 0.0000Fixed effects Estimate Std. Error Z valueIntercept -1.7381 0.3833 -4.534 <0.0001***Treatment 1.4574 0.4901 2.974 0.0029**Time 0.0876 0.0313 2.794 0.0052**Treatment*Time -0.0568 0.0413 -1.375 0.1690
* Indicates a P value < 0.05, **< 0.01, ***< 0.001.
CHAPTER 5
MHC SIGNALING DURING SOCIAL COMMUNICATION
Reprinted with gracious permission from Self and Non-self (ed. Lopez-Larrea C.), 2012,
pp 290-313, “MHC signaling during social communication,” Ruff J.S., Nelson A.C.,
Kubinak J.L., and Potts W.K, Landes Bioscience and Springer Science, Austin, TX, ©
2012.
97
CH APTER 17
MHC SIGNALING DURING SOCIAL COMMUNICATION
James S. Ruff,f* Adam C. Nelson,f Jason L. Kubinak and Wayne K. PottsD epartm ent o f Biology, University o f Utah, Salt Lake City, Utah, USA fThese authors contributed equally to this manuscript * Corresponding Author: Jam es S. R u f—Email: j.ru f@ utah.edu
Abstract: The major histocompatibility complex (MHC) has been known to play a critical role in immune recognition since the 1950s. It was a surprise, then, in the 1970s when the first report appeared indicating MHC might also function in social signaling. Since this seminal discovery, MHC signaling has been found throughout vertebrates and its known functions have expanded beyond mate choice to include a suite of behaviors from kin-biased cooperation, parent-progeny recognition to pregnancy block. The widespread occurrence o f MHC in social signaling has revealed conserved behavioral-genetic mechanisms that span vertebrates and includes humans. The identity o f the signal’s chemical constituents and the receptors responsible for the perception of the signal have remained elusive, but recent advances have enabled the identification of the key components o f the behavioral circuit. In this chapter we organize recent findings from the literature and discuss them in relation to four nonmutually exclusive models wherein MHC functions as a signal o f (i) individuality, (ii) relatedness, (iii) genetic compatibility and (iv) quality. We also synthesize current mechanistic studies, showing how knowledge about the molecular basis of MHC signaling can lead to elegant and informative experimental manipulations. Finally, we discuss current evidence relating to the primordial functions o f the MHC, including the possibility that its role in social signaling may be ancestral to its central role in adaptive immunity.
S e lf and Nonself, edited by Carlos Lopez-Larrea.©2012 Landes Bioscience and Springer Science+Business Media.
290
98
INTRODUCTION
MHC (also known as HLA in humans and H-2 in mice) signaling mediates both immune recognition during the adaptive immune response (discussed in the previous chapter) and social signaling that enhances both the recognition of optimal mates and kin-biased behaviors.1 Social signaling meditated by the MHC was first discovered in regards to mate preferences in laboratory mice (Mus musculus),2 a full three decades after the histocompatibility functions were described by George Snell.3 Thirty years later, social signaling via MHC has been described throughout vertebrates including mammals, birds, reptiles, amphibians and teleost fish (see Table 1). MHC social signaling has been identified in over 20 species of vertebrates and is likely the basis for a vertebrate-wide chemosensory communication system. The original observation of MHC disassortative mating preferences seems to be common, but not omnipresent in vertebrates;4 it by no means is the only behavior facilitated by MHC, nor is it the only type of observed MHC-based mate preference. MHC signaling also facilitates cooperative behavior with kin, parent-progeny recognition and pregnancy block. In the following sections we will present the current evidence for MHC as a signal of relatedness, individuality, genetic compatibility and quality. MHC-mediated behaviors are diverse and though general patterns exist within vertebrates, the exact function of MHC-based social signaling will be species specific and highly context dependant.
MHC SIGNALING D URING SOCIAL COM M UNICATION 291
SIGNALING OF MHC GENOTYPE: MOLECULAR MECHANISMS
For three decades after the discovery of MHC-mediated social singling in laboratory mice,2 the actual mechanism of howMHC genotype was perceived in conspecifics remained a mystery. Early on it was discovered that MHC genotype could be discriminated by chemical cues detected by the olfactory system. These studies showed that mice could discriminate MHC odortypes either through training5 or in the absence of training.6 However, the nature of the signaling odorants remained elusive. This mystery was at least partially solved by the discovery that peptides known to bind MHC molecules also bound receptors in the vomeronasal organ (VNO).7 It was later shown that a similar process was working in the main olfactory epithelium (MOE).8
The critical role of MHC-presented peptides during adaptive immune recognition is well established.9 MHC-bound peptides are presented at the cell surface for interrogation by T cells; when the peptides are of foreign origin (e.g., from a pathogen) an immune response is initiated. The majority of MHC alleles encode unique structural aspects of the peptide binding region of the molecule and these variants provide great specificity in the peptides they present. Because there is physical correspondence between MHC allelic variants and the anchor positions of the amino acid sequence of their bound peptides, it was hypothesized that MHC peptides could serve as ligands for odorant receptors that had similar binding specificity, thus allowing information about MHC genotype to be conveyed. Physiological recordings from vomeronasal sensory neurons (VSNs) stimulated with synthetic peptides proved this to be the case.7
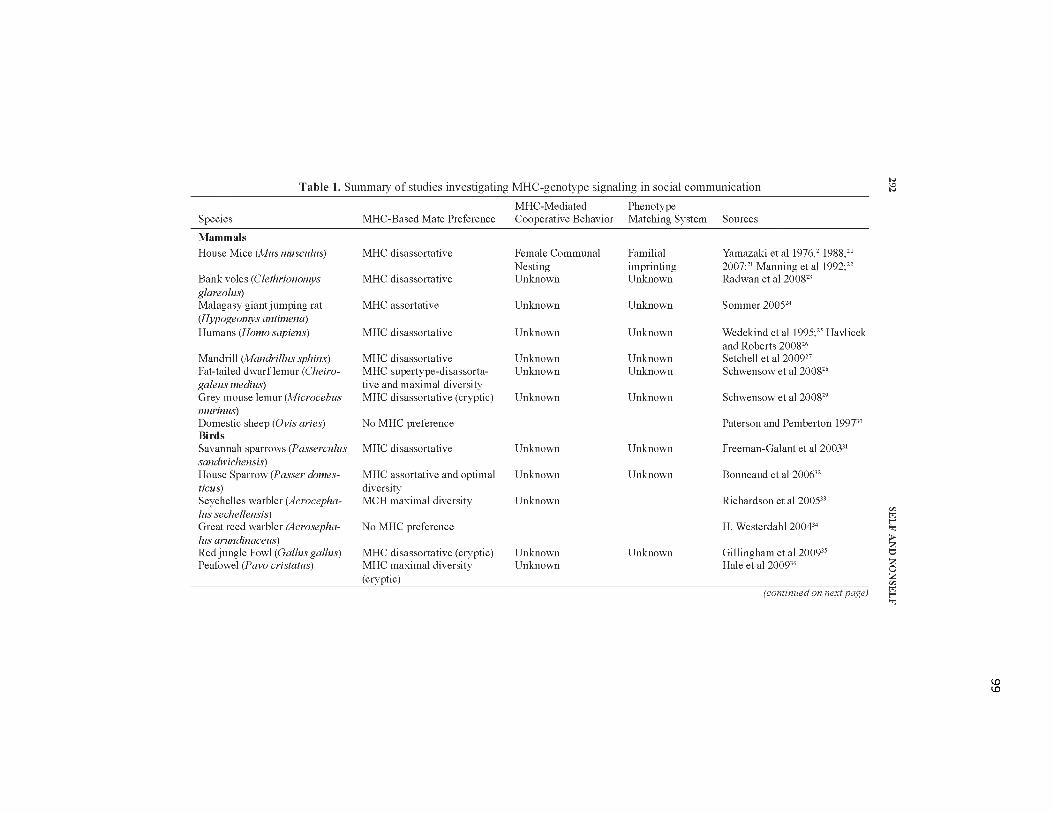
Table 1. Summary o f studies investigating MHC-genotype signaling in social communication
MHC-Mediated PhenotypeSpecies MHC-Based Mate Preference Cooperative Behavior Matching System Sources
M am m alsHouse Mice (Mus ntusculus) MHC disassortative Female Communal Familial Yamazaki et al 1976,2 1988,20
Nesting imprinting 2007;21 Manning et al 1992;22Bank voles (Clethriononiys MHC disassortative Unknown Unknown Radwan et al 200823glareolus)Malagasy giant jumping rat MHC assortative Unknown Unknown Sommer 20 0524(Hypogeontys antimena)Humans (Homo sapiens) MHC disassortative Unknown Unknown W edekind et al 1995;25 Havlicek
and Roberts 200826Mandrill (MandriUus sphinx) MHC disassortative Unknown Unknown Setchell et al 20 0927Fat-tailed dw arf lemur (Cheiro- MHC supertype-disassorta- Unknown Unknown Schwensow et al 200828galeus medius) tive and maximal diversityGrey mouse lemur (Microcebus MHC disassortative (cryptic) Unknown Unknown Schwensow et al 200829murinus)Domestic sheep (Ovis dries) No MHC preference Paterson and Pemberton 199730BirdsSavannah sparrows (Passerctihis MHC disassortative Unknown Unknown Freeman-Galant et al 200331sandwichensis)House Sparrow (Passer domes- MHC assortative and optimal Unknown Unknown Bonneaud et al 200632ticus) diversitySeychelles warbler (Acrocepha- MCH maximal diversity Unknown Richardson et al 200533his sechellensis)Great reed warbler (Acrosepha- No MHC preference H. W esterdahl 200434his arundinaceus)Red jungle Fowl (Galius gallus) MHC disassortative (cryptic) Unknown Unknown Gillingham et al 200935Peafowel (Perm cristatus) MHC maximal diversity
(cryptic)Unknown Hale et al 200936
(continued on next page)
IDID
292 SELF
AND N
ON
SE
LF
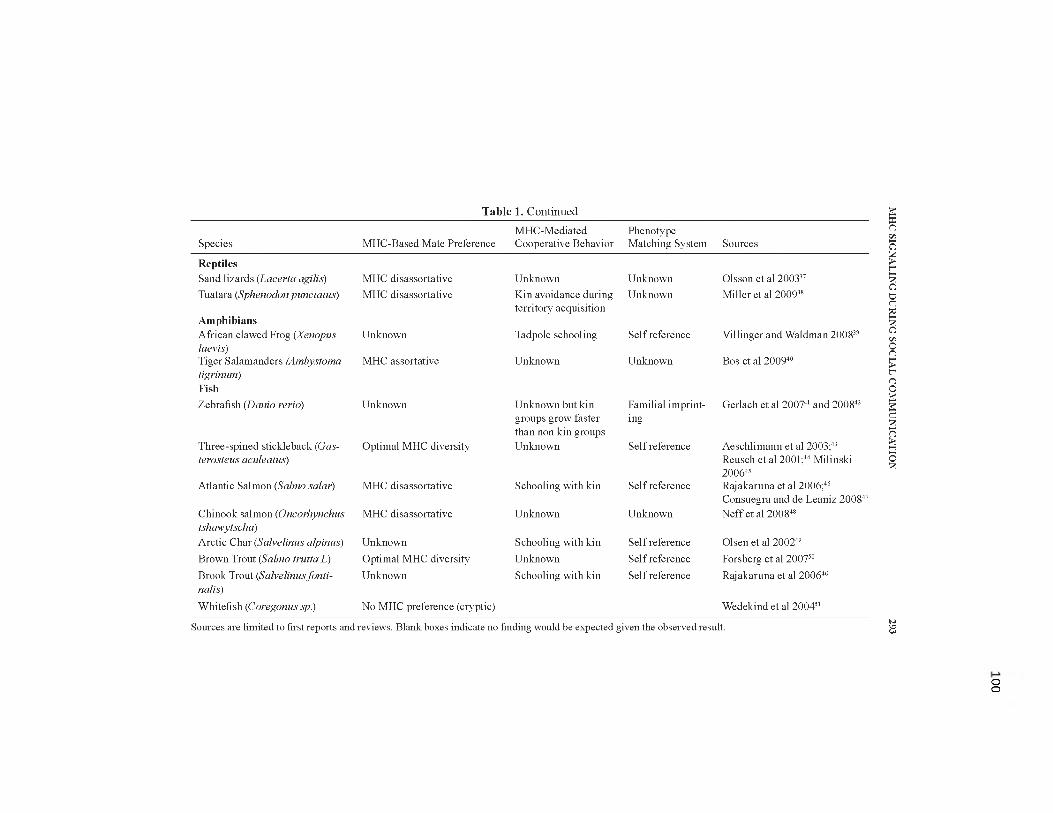
Table 1. Continued
Species MHC-Based Mate PreferenceMHC-Mediated Cooperative Behavior
Phenotype Matching System Sources
ReptilesSand lizards (Lacerta agilis) MHC disassortative Unknown Unknown Olsson et al 200337Tuatara (Sphenodon punctatus)
A m phibians
MHC disassortative Kin avoidance during territory acquisition
Unknown Miller et al 200938
African clawed Frog (Xenopus laevis)
Unknown Tadpole schooling Self reference Villinger and Waldman 200839
Tiger Salamanders (Ambystoma tigrinum)Fish
MHC assortative Unknown Unknown Bos et al 200940
Zebrafish (Dcmio rerio) Unknown Unknown but kin groups grow faster than non kin groups
Familial imprinting
Gerlach et al 200741 and 200842
Three-spined stickleback (Gas- terosteus aculeatus)
Optimal MHC diversity Unknown Self reference Aeschlimann et al 2003;43 Reusch et al 2001;44 Milinski 200645
Atlantic Salmon (Salmo salar) MHC disassortative Schooling with kin Self reference Rajakaruna et al 2006;46 Consuegra and de Leaniz 200847
Chinook salmon (Oncorhynchus tshawytscha)
MHC disassortative Unknown Unknown N eff et al 200848
Arctic Char (Salvelinus alpimts) Unknown Schooling with kin Self reference Olsen et al 200249
Brown Trout (Salmo truttaL) Optimal MHC diversity Unknown Self reference Forsberg et al 200750
Brook Trout (Salvelinus fonti- nalis)
Whitefish (Coregonus sp.)
Unknown
No MHC preference (cryptic)
Schooling with kin Self reference Rajakaruna et al 200646
W edekind et al 200451
Sources are limited to first reports and reviews. Blank boxes indicate no finding would be expected given the observed result.
oo
MHC
SIGN
ALIN
G
DU
RING
SO
CIA
L C
OM
MU
NIC
AT
ION
293
101
Detection of Peptides in the Olfactory System
The olfactory system of mammals is anatomically divided into two regions: the main olfactory epithelia (MOE) and the vomeronasal organ (VNO). Traditionally these two organs were viewed as functioning in largely non-overlapping modalities with the VNO being specialized for detection of nonvolatile small molecules and proteins that typically signaled the sexual and social status of conspecifics (pheromones), while the MOE was thought to specialize as a general detection system for volatile substances.
The initial experiments to determine if the olfactory system was capable of detecting peptides were conducted in the VNO ofmice. Leinders-Zufall and coworkers (2004) tested the hypothesis that dissociated MHC class I peptides could be detected in the VNO Two peptides known to be presented either by the H-2Db haplotype (AAPDNRETF) or H-2Kd haplotype (SYFPEITHI) were synthesized. These peptides were applied individually to ex-vivo preparations of mouse VNO. Both peptides activated a relatively specific subset of V2R-positive neurons in the basal zone of the VNO as revealed by extracellular field potential recordings and fluorescence imaging. The VSNs responded with high sensitivity at concentrations down to 10-12M.
As predicted by the hypothesis that peptides can signal MHC genotype, the peptide binding by the VSNs responded in an MHC allele-specific manner. Not only was the VSN response specific to the amino acid sequence of each peptide, but the pattern of specificity mimicked the binding properties of MHC molecules. Amino acid substitutions (underlined) at non-anchor positions (e.g., SYIPSAEKI) usually continued to stimulate the same neurons. In contrast, substitution of peptide anchor residues (underlined) with alanine (e.g., AAPDARETA or SAFPEITHA) abolished stimulation of these neurons. These VSN binding properties provide a neurophysiological basis for identifying the MHC genotype of individuals, because peptides are reverse-image “molds” of the antigen-binding site of MHC molecules. Thus, sensory receptors that detect peptides in an MHC-like fashion could in principle function as an MHC genotyping system.10 These results point to the structural importance of peptide anchor residues in binding VSN receptors and, given the similar binding properties of MHC molecules, reveal the convergent ligand-binding properties of these unrelated molecules.
The same lab group applied the same hypotheses to the MOE sensory neurons, traditionally viewed as generalist receptors of volatile chemosignals.8 Contrary to conventional wisdom, they discovered thatnonvolatile, fluorescent tagged MHC peptides gain access to the MOE without direct nasal contact to the peptide containing fluid. Most importantly, these peptides activated neurons at subnanomolar concentrations in an allele specific fashion, similar to the patterns found in the VNO. There are, however, some important physiological differences in peptide detection between the two olfactory organs.11 First, a different transduction mechanism is used in the MOE during recognition ofpeptides.12 Second, when anchor residues are substituted with alanine (eg. AAPDARETA and SAFPEITHA), olfactory sensory neurons (OSNs) cease firing at normal stimulation concentrations, butfiring resumes athigher concentrations. Third, MOE-dependent peptide recognition does not induce pregnancy block,13 despite normal MHC odor (mating) preferences. These experiments show that discrimination of MHC genotype by the two olfactory systems is achieved with separate neurological, physiological and behavioral response pathways.
If peptides are the odorants that allow MHC genotype to be discriminated, then experimental manipulation of peptides should alter behavioral responses in a fashion
294 SELF AND NONSELF
102
consistent with MHC-mediated behaviors. The findings that the MOE and the VNO can detect peptides in an MHC-like fashion stimulated research confirming that both mouse and stickleback fish (Gasterosteus aculeatus) behavior is manipulated by the addition of peptides. The experimental addition of peptides to an MHC similar odor source causes animals to respond as if it were an MHC dissimilar odor source for both mating- and odor-preferences814 and pregnancy block.7
Signaling of MHC Genotype without Peptides
Due to the general nonvolatility of peptides,1516 the question has remained whether peptides can explain all of the observed MHC-mediated behavioral patterns. This question was recently addressed by experimentally removing all o f the peptide components from the urine of two MHC-congenic strains of mice. Mice that had been trained to discriminate between the urine odors of these two strains could continue to discriminate using the peptide-free urine.17 These results suggest that nonpeptide volatile odorants also provide signals conveying MHC genotype information. However, odor-training experiments can introduce confounding behavioral artifacts18 and this result should be confirmed in a paradigm that does not use training. If these results are confirmed, making yet a third independent mechanism for identifying MHC genotype, it underscores the functional importance of this olfactory ability and the importance of the associated behavioral responses.
Though it has been shown that peptides signal MHC genotype in mammals (mice) and fish (sticklebacks), the utilization ofpeptides in other vertebrates is undocumented. It has been questioned weather olfaction can explain MHC-mediated behavior in birds whose olfactory prowess has long been questioned.19 No other mechanisms have been as thoroughly tested as peptide and volatile olfaction signaling of MHC genotype and more work is needed to test whether these mechanisms drive MHC mediated behavior in other taxa.
MHC SIGNALING D URING SOCIAL COM M UNICATION 295
MHC AS A SIGNAL IN INDIVIDUAL RECOGNITION
Individual recognition is an important component o f social behavior. Traits that specifically signal individual identity are predicted to be genetically determined, highly variable, cheap to produce (i.e., not condition-dependent) and signal variants are expected to have equal fitness at equilibrium (reviewed in Tibbetts and Dale 2007 ref. 52). MHC is an ideal candidate gene for understanding the mechanistic bases of individual recognition because it is a genetically determined trait associated with social behavior and is extremely variable (there are 109 MHC phenotypes in mice53). MHC was hypothesized to contribute to individual recognition as early as 1975.54 Since then, the concept ofindividual recognition has been invoked in many studies addressing MHC-associated cues in social signaling (e.g., ref. 17). However, many authors tacitly use different definitions of this term and do not distinguish between individual recognition in the strict sense52 and other forms of social recognition, which can include discrimination of familiar vs unfamiliar conspecifics, kin vs nonkin, same-genotype vs different-genotype and genetically compatible vs incompatible mates. We define individual recognition as being characterized by individual specificity in three elements o f social communication: signaling; signal perception and template matching by the signal receiver; and a functional response by the receiver.55 This definition includes any case where receivers have a template of a specific individual
103
based on a learned signal and differs from kin-recognition where the template is based on phenotype matching (see below). Here, we review studies that have sought to characterize individual-specific MHC odortypes, which have mainly focused on MHC-correlated volatile profiles and their relation to pregnancy block and scent marking.
MHC congenic strains of mice, which share the same background genome, but have unique MHC haplotypes, are a model system with which to understand behavioral responses to individuals of same- or different-haplotype at a single locus. One extrapolation from studies demonstrating MHC haplotype-dependent behavior17 in congenic strains is the possibility that, in outbred populations where MHC allelic polymorphism is likely to be very high, MHC phenotypes would be key mediators o f individual recognition. For example, it has long been understood that MHC congenic strains have unique volatile organic compound signatures that are used in chemical communication.15 More recently, several groups have identified suites of volatile organic compounds that are regulated by MHC odortypes.15,16,56 As predicted by a model of individual recognition, some of these suites are unaffected by environmental variation;57 furthermore, volatile profiles from MHC congenic mice activate overlapping but distinct subsets o f neurons in the mouse main olfactory bulb.58 The authors of such studies in congenic strains often conclude that the physiological machinery is in place for volatile profiles to mediate individual-specific behaviors (e.g., ref. 57). However, counter-part experiments using outbred wild mice in a more ecologically realistic setting are lacking. Given that some genotypes will inevitably be shared between individuals, more naturalistic work is needed to understand how these volatile signatures function as signals of individuality (as defined above) or as signals of relatedness or genotype.
Pregnancy Block
Pregnancy block, also known as the Bruce effect, occurs when recently mated female laboratory mice are exposed to the odors of an unfamiliar male.59 Upon exposure to an unfamiliar male odor, prolactin release from the anterior pituitary in the mated female is suppressed, resulting in pregnancy failure, reabsorption of the fetus and the onset of estrus.60 The signal responsible for pregnancy block is considered to be individual specific because the unfamiliar male and the mate both express odors capable of inducing pregnancy block. Thus, females have to learn the identity o f their mate (i.e., form a memory) in order to suppress pregnancy block upon perception of the mate’s odors.
Pregnancy block can be induced by the presence of an unfamiliar male or simply his soiled bedding or urine and direct physical contact with the odorant seems necessary.60 However, in at least one case volatiles alone (i.e., no direct contact) can induce pregnancy block.61 The memory developed during pregnancy block is dependent on activation of sensory neurons in the VNO; however, the specific chemical constituents that bind receptors in these neurons have proven difficult to find. Three different classes of molecules associated with individual odors have recently been investigated: MHC and MHC peptides, major urinary proteins (MUPs) and volatiles. Peele and colleagues recently investigated the relative roles of MUPs and volatiles.62 They found that low molecular weight fractionations (which excludes MUPs) from urine were more effective in blocking pregnancy than those of high molecular weight, suggesting a role of volatile compounds in the odor. However, the low molecular weight fraction from the unfamiliar male resulted in only 50% pregnancy block, as opposed to 90% pregnancy block via unfamiliar male whole urine. Moreover, a recent study called these findings into doubt by showing that,
296 SELF AND NONSELF
104
contrary to Hilda Bruce’s original finding, urine from castrated or juvenile males was sufficient to induce pregnancy block. These results suggest that, although volatiles can contribute to the occurrence of pregnancy block, they are not necessary to induce it.63
MHC-associated odors have also been shown to be sufficient to induce pregnancy block in several studies, implicating it’s involvement during individual recognition. These odors were originally observed to block pregnancy when unfamiliar males differing only at the MHC could induce pregnancy block.61 Since then, searches for an MHC-odortype mechanism have targeted MHC molecules themselves, MHC peptides and possible associated volatiles. MHC peptides were the first specific odorant found to induce pregnancy block7 (see above).
The finding that sensory neurons in the VNO respond selectively to MHC peptides was biologically validated by demonstrating the role of peptides in producing pregnancy block.7 As predicted, it was found that pregnancy block upon exposure to MHC peptides from an unfamiliar, MHC-dissimilar male was equally effective as exposure to whole urine from an unfamiliar, MHC-dissimilar male. In this case, the peptides had to be delivered on a urinary background (regardless o f whether the urine was from a familiar or unfamiliar male). A more recent study, however, found that peptides alone (administered more frequently than in ref. 7) were sufficient to induce pregnancy block.63 These studies show that the suite of peptides presented by an individual’s MHC molecules can, when excreted in urine, be used as odorants in chemical signaling. Because ofthe large diversity of MHC haplotypes in a population, there is potential for individual specific odortypes simply in excreted MHC peptides. Such odortypes are detectable by VSNs that have binding specificity for these peptides similar to that of MHC molecules.7 Where these peptide signals originate, however, remains to be found. Surprisingly, there is disagreement about whether peptides can be found in mouse urine.76064 Peptides have not been reported in other mediums of chemical communication such as saliva, tears, or skin excretions, but we are not aware of any directed searches for peptides in these secretions.
Although MHC peptides are clearly sufficient to induce pregnancy block in inbred mice, it should be noted that the experiments described above do not demonstrate individual recognition in a strict sense. Because peptides from an unfamiliar male with the same MHC genotype as the female’s mate would not be expected to induce pregnancy block, MHC peptides in the context of pregnancy block might be more likely to signal the presence of an unfamiliar male. If individuality is perceived during pregnancy block, it would likely be conveyed via coupling with sensory neurons activated by the urinary background and neurons in the VNO have been found to be capable of discriminating individual mice of the same laboratory strain.64 Finally, while pregnancy block provides an attractive system in which to test hypotheses concerning social signaling and behavior, the system is ultimately hindered by the fact that the adaptive significance of pregnancy block, which is only observed in certain laboratory strains of mice, has not been determined for natural populations. It has been suggested that the Bruce effect functions to prevent infanticide from males who have recently displaced the dominant, territorial male.4,65
Scent-Marking
In addition to the MHC, growing evidence indicates that major urinary proteins (MUPs) are another chemical signal critical to social communication and individual recognition in mice. MUPs are protein pheromones encoded by a polymorphic, multi-gene family. In a series of experiments, the laboratory of Jane Hurst has tested the relative
MHC SIGNALING D URING SOCIAL COM M UNICATION 297
105
roles of MUPs and MHC in individual recognition in mice using a scent-marking behavioral paradigm. First, it was shown that wild-derived males presented with a scent mark from another male expressing a different MUP-type will investigate and counter-mark the marks significantly more than the control.66 Second, it was shown that scent-marks associated with MHC haplotype (in MHC-congenic strains) were not necessary or sufficient to influence investigation time of male mice of congenic MHC strains. Rather, investigation time was increased only when the stimulus odor differed from the genomic background of the test animal.67 A third experiment tested whether wild female mice could discriminate between scent marks from congenic males whose MHC and MUP genotype were controlled. Results showed that females could discriminate between individual males only when the males differed with respect to MUP haplotype; females could not discriminate between individual males that had the same MUP haplotype and could not discriminate between males that had different MHC haplotypes.68 These three experiments indicate that, in the context of scent-marking and countermarking, MUP genotype and not MHC genotype, is the greatest determinant o f individuality in urinary odors. However, it should be noted that in light of previous research, it is anomalous that the mice in these experiments did not discriminate between urinary odors that differed with respect to MHC genotype.6768 Previous studies have documented the ability of either MHC-congenics (e.g., ref. 5) or wild-derived mice69 to distinguish urinary odors that only differed genetically at the MHC.
Because MUPs are likely to be polygenic, polymorphic signals only in a few rodent species it is unlikely that the functions discovered in M us will have generality across vertebrates. The results from the Hurst group studies suggest that there are key differences in signals that are conserved across taxa (e.g., MHC) and signals that are species-specific (e.g., MUPs) for the identification of individual conspecifics.68 They also reveal the curious finding that signals of individuality are limited to specific behavioral interactions.
Taken together, the individual recognition studies reviewed above show that MHC may play an important role in individual recognition in certain instances (for example in pregnancy block), but also indicate that they may not be used for individual recognition in the strict sense. Many of the studies focusing on individual recognition and the MHC have utilized congenic strains of mice, which provide a unique opportunity to study the role o f a single locus or haplotype in chemical communication. However, the use of inbred stains of animals may limit our broader understanding of behavior and ecology, as 60 years of domestication has modified their behavior.70 So, more studies will be needed to determine the role of MHC in individual recognition in outbred populations; we know of no such examples except for the aforementioned examples from the Hurst lab.
298 SELF AND NONSELF
MHC AS A SIGNAL IN KIN RECOGNITION
Kin recognition using polymorphic genetic systems allows individuals to engage in behaviors specific to kin or nonkin. An individual’s fitness is a product of both its own reproductive success (i.e., directfitness) and the reproductionofclose relatives (i.e., indirect fitness); thus, proper identification of kin facilitates cooperation (or at least decreased antagonism) with relatives and promotes behaviors that increase fitness.71 Additionally, recognition of kin allows for the prevention of inbreeding, and therefore reduces the homozygous expression of deleterious recessive alleles. In order for a genetic system to be used accurately to recognize kin, it must contain enough allelic polymorphism to allow
106
discrimination between related and unrelated individuals. Kin recognition systems that can discriminate among a range of different-degree relatives have been reported.72 MHC is the most polymorphic genetic system in vertebrates4 and has long been considered to play a role in kin recognition by mediating cooperation,1 parent-offspring identification73 and mating preferences that prevent inbreeding.74
Two major phenotype matching mechanisms exist for MHC-based kin recognition within vertebrates (Fig. 1). The first is a self reference system in which individuals use their own MHC odortype as a template to recognize other individuals as kin.39-43-46-49-50 The second is familial imprinting where individuals imprint upon the MHC odortypes of kin early in development and afterwards apply the learned MHC signals to unfamiliar individuals.204275 The degree to which familial imprinting and self reference systems identify kin differ remarkably (Fig. 1). Only familial imprinting systems can identify kin that do not share odortypes with a focal individual. However, the ability to recognize kin that do not share odortypes also allows for the false recognition of unrelated individuals as relatives; this could occur in mixed litters where odortypes produced by half siblings are based on haplotypes from an unrelated individual. Both phenotype matching systems can be used to identify kin through odortypes based on either specific MHC haplotypes (both haplotypes providing a specific odor) or by odortypes based on a blended odor of both haplotypes. For example self reference systems recognize either 25 or 75% of full siblings depending on whether specific haplotypes are recognized or only the genotypic odor of the blended haplotypes76 (Fig. 1). Currently few studies have been conducted to determine the specifics of phenotype matching systems used in nature and more research is needed to determine the relative prevalence of familial imprinting vs self reference systems and the nature of the odortypes (specific haplotypes or blended genotypes) used. Interestingly, the two systems most described in nature are familial imprinting on haplotypes and self reference based on blended genotype odors which are the best and worst of the theorized kin recognition systems respectively (Fig. 1). Regardless of the phenotype matching system used, kin recognition is likely one of the major functions of MHC-mediated signaling and the very existence of familial imprinting is evidence supporting this hypothesis because kin recognition is the only function that is enhanced by familial imprinting; self reference will be superior for functions involving genetic compatibility, individuality, or quality.65
Phenotype matching systems can identify more kin if multiple polymorphic unlinked loci are used, presuming a match at any locus is a signal of relatedness.77 Though the impact o f multiple unlinked loci has minimal impact on familial imprinting systems it has profound consequences on self reference systems, where multiple loci dramatically improve kin recognition (Fig. 1). Within both teleost fishes and amphibians, taxa where self reference systems are common, the MHC is not inherited as a single unit but rather as two or four separate unlinked loci.7879 Whether this is coincidence or represents evidence that the inefficiency of self reference systems favors translocations that breakup the MHC linkage group will await more phylogenetic data. W ithin both teleost fishes and amphibians it has been shown that MHC Class II genes are sufficient, but not necessary, for kin recognition. It has been proposed that other unlinked MHC genes provide additional information used in kin recognition.4649 Likewise, in house mice it has been observed that when MHC signals o f relatedness are controlled for, signals from a different polymorphic locus (MUPs, see below) can also be used as signals of relatedness. In nature, it is highly likely that both MUPs and MHC are utilized for kin recognition in tandem.80
MHC SIGNALING D URING SOCIAL COM M UNICATION 299
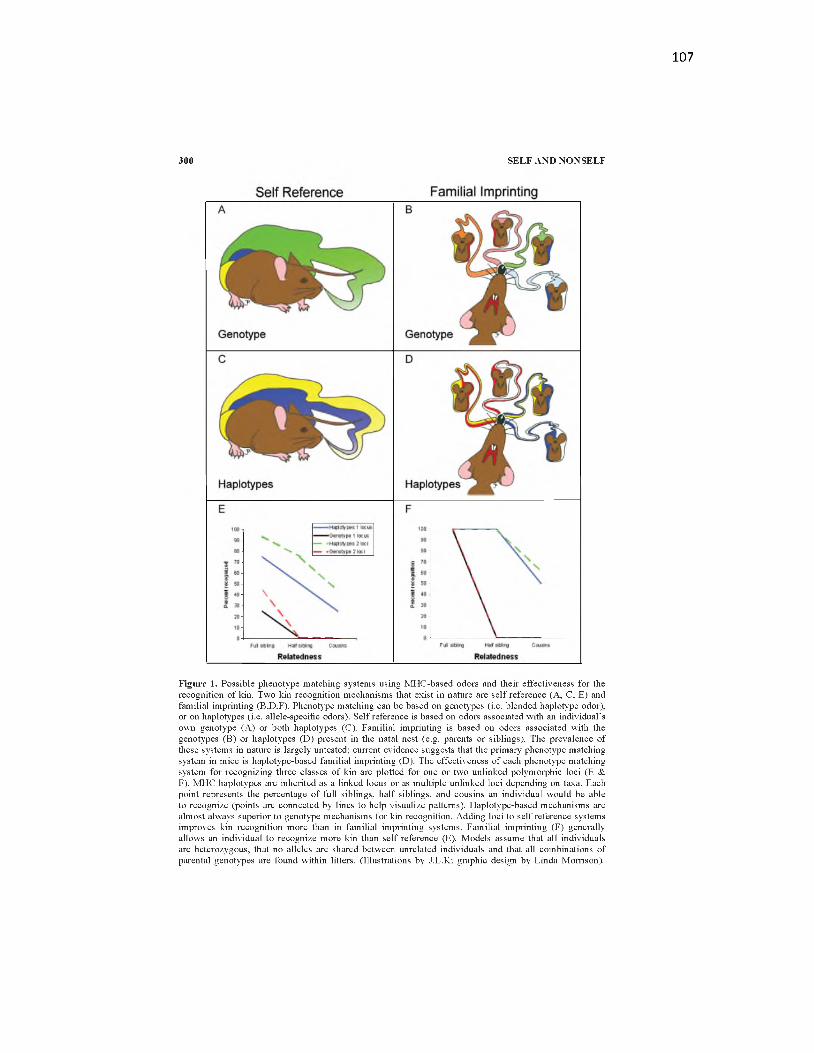
107
300 SELF AND NONSELF
Figure 1. Possible phenotype matching systems using M HC-based odors and their effectiveness for the recognition o f kin. Two kin recognition mechanisms that exist in nature are se lf reference (A, C, E) and familial imprinting (B,D,F). Phenotype matching can be based on genotypes (i.e. blended haplotype odor), or on haplotypes (i.e. allele-specific odors). Self reference is based on odors associated with an individual’s own genotype (A) or both haplotypes (C). Familial imprinting is based on odors associated with the genotypes (B) or haplotypes (D) present in the natal nest (e.g. parents or siblings). The prevalence of these systems in nature is largely untested; current evidence suggests that the primary phenotype matching system in mice is haplotype-based familial imprinting (D). The effectiveness o f each phenotype matching system for recognizing three classes o f kin are plotted for one or two unlinked polymorphic loci (E & F). M HC haplotypes are inherited as a linked locus or as multiple unlinked loci depending on taxa. Each point represents the percentage o f full siblings, half siblings, and cousins an individual would be able to recognize (points are connected by lines to help visualize patterns). Haplotype-based mechanisms are almost always superior to genotype mechanisms for kin recognition. Adding loci to self reference systems improves kin recognition more than in familial imprinting systems. Familial imprinting (F) generally allows an individual to recognize more kin than self reference (E). Models assume that all individuals are heterozygous, that no alleles are shared between unrelated individuals and that all combinations of parental genotypes are found within litters. (Illustrations by J.L.K; graphic design by Linda Morrison).
108
Cooperative Behavior
Proper identification ofkin canresult in cooperative behaviors between relatives; MHC mediated signaling has been shown to both promote cooperation and deter antagonism between individuals (Table 1). Schooling is an important cooperative behavior in fish and tadpoles that results in enhanced foraging and predator avoidance. Several salmonid species along with the African clawed frog (Xenopus laevis) have been shown to preferentially form schools with relatives that share MHC haplotypes39,46,49 and it has been previously shown that kin-based schools have higher survival rates and larger territories.81 A second MHC-mediated cooperative behavior has been documented in house mice; female mice communally nest and nurse offspring and it has been demonstrated that females preferentially nest with familiar sisters. When no familiar sisters are available, they preferentially nest with MHC-similar females.1 Finally, competition over territories is fierce in many species of vertebrates and can result in serious injury; evidence suggesting that MHC signaling prevents territorial competition between kin has recently been demonstrated in tuataras (Sphenodonpunctatus).38 Scores of other kin-based cooperative behaviors have been documented within vertebrates and it is quite probable that we have only just begun to document those that are mediated by MHC signaling; however, it is not our intent to imply that all cooperative behaviors will be MHC-mediated. In fact, the precision of kin recognition systems will be enhanced as more polymorphic systems are used in signaling.
Parent-Progeny Recognition
Parent-progeny recognition prevents the expense associated with parental investment into unrelated individuals. This is especially true under conditions of communal living or in systems that involve extra-pair matings. Under these circumstances an identification system that could ensure parental care was only provided to genetic offspring would be highly adaptive and many such systems have been documented.82 Female house mice nest communally and are therefore at risk of providing parental care to unrelated pups. Yamazaki and others73 showed that female house mice can identify pups with which they share an MHC haplotype from congenic pups (genetically identical individuals with the exception of MHC type). Pups at the age of 15-21 days were also capable of recognizing and preferring their parents bedding to that of a MHC dissimilar congenic individual. This preference was reversible by cross-fostering, again showing the role of familial imprinting within MHC signaling in house mice. Currently this study offers the only evidence that MHC-mediated signaling is involved in parent-progeny recognition and though it was conducted with inbred strains of mouse, it reveals the potential of MHC signaling in nature.
Inbreeding Avoidance
Degradation of fitness due to inbreeding is a result of increased homozygosity of deleterious recessive alleles that are identical by descent. These alleles combine more frequently when related individuals reproduce compared to outbred matings. Early assessment of the fitness costs of full-sibling level inbreeding within vertebrates (mice) have been conducted and early studies showed a 10% decline in litter size.83,84 However, these experiments only measured litter size reductions and they failed to assess the fitness
MHC SIGNALING D URING SOCIAL COM M UNICATION 301
109
consequences of the inbred progeny in their natural context. In an experiment where the fitness impacts of a single generation of full-sibling inbreeding were assessed under seminatural conditions, it was found that outbred male mice had five-fold higher fitness than inbred males, with the consequences effectively approaching lethality for inbred sons. Daughters suffered an additional 20% reduction in fitness compared to previous assessments.85 Likewise cousin-level inbreeding was shown to reduce male fitness by 34% and when the infectious agent Salmonella was present in the populations, the fitness decline in males was 57%.86 Since the true negative consequences of inbreeding were only revealed under direct competition within a seminatural environment, we now refer to this experimental system as a phenotron because it allows the observers “to see” the true fitness consequences (phenotype) of a treatment. Disassortative MHC-based mating preferences function as a mechanism of inbreeding avoidance due to their highly polymorphic nature. Only closely related individuals are likely to share MHC haplotypes; thus a mating preference for MHC-dissimilar individuals will decrease the likelihood of inbreeding. The extent to which inbreeding can be avoided is dictated by whether a self reference or familial imprinting mechanism is utilized by a particular species.76
An indirect piece o f evidence supporting MHC haplotype based familial imprinting and inbreeding avoidance within house mice has come from a study by Sherborne and colleagues.80 This experiment investigated the relative importance of MHC and MUPs in mediating inbreeding avoidance behavior and its conclusion was that MHC is not involved in inbreeding avoidance behavior. House mice were released into seminatural enclosures with only full-sibling and half-sibling counterparts; inbreeding avoidance was assessed by the proportion of full-sibling vs half-sibling matings and genetic analysis was used to determine if there was either an MHC or MUP-based signal mediating inbreeding avoidance. The data showed that although no full-sibling inbreeding avoidance occurred, mice sharing exact MUP genotypes avoided mating with each other. This led the authors to conclude that MUPs are exclusively responsible for inbreeding avoidance in house mice and that MHC plays no role. However, this conclusion is unwarranted due to a flaw in the experimental design. Specifically, prior to testing in seminatural enclosures, test animals had been caged (since birth) with other individuals that possessed MHC haplotypes that were present in the enclosures. This design unintentionally allowed MHC familial imprinting to occur on all of the tested haplotypes; thus, animals upon entering the enclosures found themselves surrounded by individuals that would all be recognized as relatives by MHC-based systems. This situation forced the mice to make mate choices based on other non MHC cues and they utilized MUPs, preferring to mate with individuals that did not share exact genotypes. These results suggest MUPs are utilized in mate choice, but contrary to the conclusions of the paper, the design does not allow for the exclusion of a role for MHC. Furthermore, MUP-based mating preferences are based on self reference and not familial imprinting,80 thus they do not offer the same protection against inbreeding that familial imprinted MHC preferences do.
302 SELF AND NONSELF
MHC AS A SIGNAL OF GENETIC COMPATIBILITY IN MATE CHOICE
Genetic compatibility, broadly defined, refers to the degree to which an organism’s genes, (both within and between haploid genomes), interact to increase or decrease fitness. Consequences of genetic incompatibility include inviable offspring (e.g. between species mating), severely reduced fitness (e.g. inbreeding), and incremental degradationoffitness
110
associated with the combination of incompatible alleles (e.g. MHC homozygosity). The fitness consequences of genetic compatibility might be so severe that finding a mate with the “right genes” to compliments one’s own genome provides more indirect benefits than finding the “best genes” within high quality individuals.87 In order to make MHC-based mate choice (or gamete fusion8889) decisions in regards to genetic compatibility, individuals must possess the means to assess their own MHC types (see section on phenotype matching systems above). MHC-mediated odors readily signal information about the genetic compatibility between mates, and MHC-disassortative mating preferences (Table 1) lead to the production of offspring with compatible genotypes both at the MHC and throughout the genome.76 The mechanisms of MHC-mediated genetic compatibility described below are MHC heterozygote advantage, offspring harboring different MHC genotypes than their parents (moving target) and the avoidance of inbreeding.
Heterozygote Advantage/Superiority
MHC-disassortative mate preferences by their very nature produce MHC heterozygous offspring, which are hypothesized to have superior immunocompetence.9091 Multiple lines of evidence now support the fitness-enhancing role of MHC-heterozygosity.92-98 It was initially argued that MHC heterozygotes would have an advantage (overdominance) because they could present a wider variety of peptide antigens to the immune system making them more likely than MHC-homozygotes to recognize and mount an immune response against disease-causing agents. However, this mechanistic hypothesis has largely been rejected since experimental infections with single pathogens reveal that heterozygotes do not generally have an advantage over both homozygotes.99 An alternative mechanism postulated that heterozygote advantage emerges over multiple infections because resistance is generally dominant and heterozygotes will benefit from the resistance profile of each allele, which masks some of the susceptibilities of each allele. This hypothesis was experimentally confirmed by laboratory-based experiments using coinfections with parasites having opposite MHC resistance/susceptibility profiles, which demonstrated that heterozygotes are more fit than either homozygote.99 Recent studies on wild salmon100 and vole101 populations demonstrate that MHC heterozygotes have increased fitness under natural conditions of multi-parasite infection as well. The fitness enhancing nature ofMHC heterozygote advantage in laboratory andnatural settings is an example of the adaptive significance ofM HC mediated signaling.
Moving Target
In addition to heterozygote advantage, selection could also favor MHC-disassortative mate preferences if the offspring genotype provided a moving target against pathogen adaptation, causing pathogens adapted to either parent to be at a disadvantage in progeny that are MHC-dissimilar to both parents.102 This hypothesis predicts that pathogens evolve to partially escape MHC-mediated immune recognition and that MHC-dissimilar offspring are more fit than their parents when challenged with parent-adapted pathogens. Like heterozygote advantage, mate choice decisions driven by moving target processes function to maximize genetic compatibility and are thus most effectively achieved using an MHC, self reference phenotype matching system.
Numerous examples highlight the capacity of pathogens to rapidly adapt to escape MHC-mediated immune recognition.103'110 There has been one experimental study designed
MHC SIGNALING D URING SOCIAL COM M UNICATION 303
111
to test the other prediction ofthe moving target hypothesis—that MHC-dissimilar offspring will be more fit than their parents when challenged with parent-adapted pathogens. MHC did influence the trajectory of adaptationby a fungal pathogen (Cryptococcus neoformans), but the large virulence increase in postpassage pathogen lines showed no specificity for the host MHC genotype of passage.111 The most likely explanation is that this pathogen is a generalist that infects most birds and mammals. The passages in mice therefore selected for adaptations to “mouseness”, which likely swamped any adaptations to MHC. Future passage studies should use pathogens specialized on the host o f passage.
There is anecdotal evidence from human studies demonstrating the importance of offspring genetic diversity in reducing the probability o f mother-to-child-transmission of chronic infectious disease agents (e.g., HIV-1112113), and suggest that there would be a significant selective advantage to mate choices that promoted genetic diversity in offspring. There is also evidence linking increased HLA dissimilarity between mother and offspring with significantly reduced chances of vertical transmission ofHIV-1114115). The extent o f pathogen adaptation during chronic infection of the parent and its impact on mother-to-child transmission dynamics was not addressed in the above studies. Despite this, they do support the possible role o f MHC- disassortative mate preferences in producing offspring of higher quality that are more resistant to infection by chronic parasites o f their parents.
Optimal MHC Heterozygosity
MHC-disassortative mate choice may carry a cost if maximal MHC diversity in offspring is not optimal. For instance, during the process of negative selection in the thymus, T cells with high affinity for MHC-peptide complexes are instructed to terminate themselves via apoptosis.9 It follows then that MHC diversity may have an upper limit beyond which the fitness benefit of having multiple ways to present peptides from foreign invaders is offset by the cost of an increasingly limited T-cell repertoire.116 If such a fitness cost exists, then it will have important implications on the evolution of MHC disassortative mating preferences. Indeed, it has been observed that individuals with intermediate versus maximal MHC diversity harbor lower parasite burdens in experimental infections.117 Additionally, it was recently shown that intermediate and not maximal levels o f MHC diversity lead to significantly higher lifetime reproductive success in stickleback offspring.118 Thus, it seems that maximum MHC diversity can be a costly trait.
If intermediate rather than maximal MHC diversity is optimal then an MHC-typing system could allow individuals to “optimize” the MHC diversity within their offspring. Studies with sticklebacks have shown that females are in fact capable of such quantitative estimates of MHC diversity (also known as allele counting).119 Additionally, by estimating the extent of intra-individual MHC class IIB allele diversity within a population, it was also demonstrated that individuals with intermediate rather than maximal MHC diversity were most frequent, indicating selection for intermediate levels of MHC diversity. Subsequent experimental findings in sticklebacks43 and brown trout50 suggest that much of the selection for individuals with intermediate MHC diversity derives from female preference for MHC-dissimilar mates. Together, these studies indicate that maximal MHC diversity is not always optimal and that female preference for MHC-dissimilar mates is a primary driving force behind selection for the production o f individuals with intermediate rather than maximal MHC diversity.
304 SELF AND NONSELF
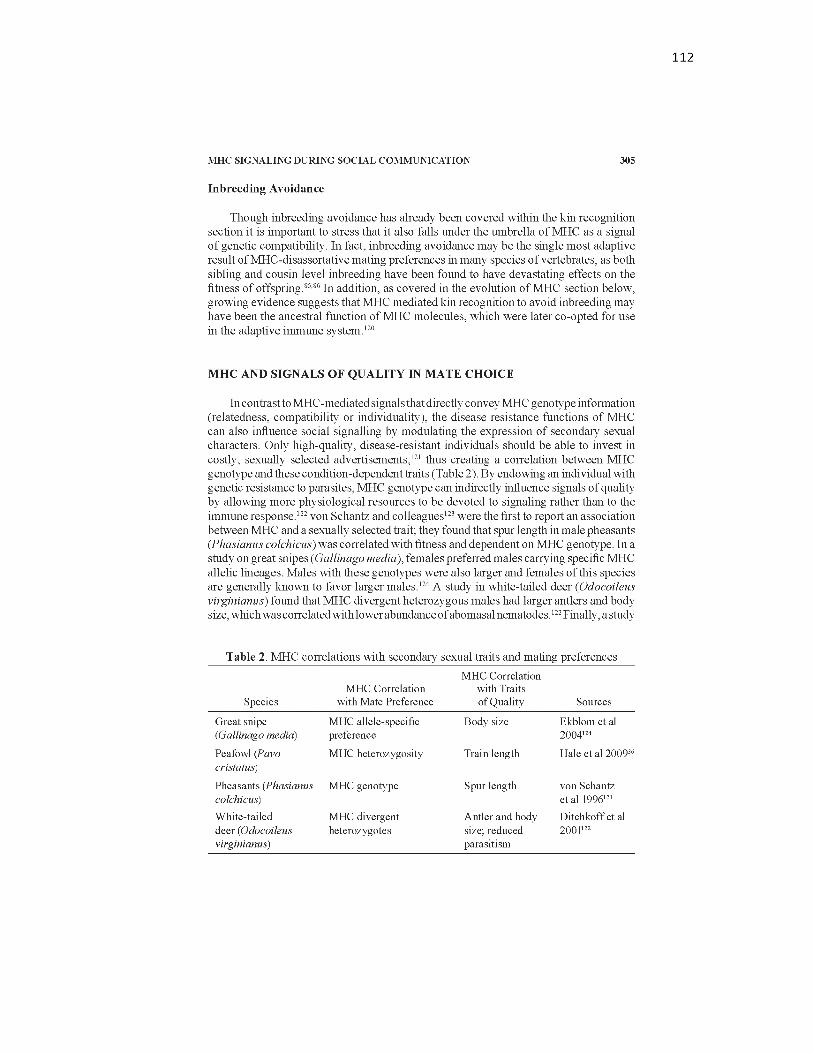
112
Inbreeding Avoidance
Though inbreeding avoidance has already been covered within the kin recognition section it is important to stress that it also falls under the umbrella of MHC as a signal of genetic compatibility. In fact, inbreeding avoidance may be the single most adaptive result of MHC-disassortative mating preferences in many species o f vertebrates, as both sibling and cousin level inbreeding have been found to have devastating effects on the fitness of offspring.85-86 In addition, as covered in the evolution of MHC section below, growing evidence suggests that MHC mediated kin recognition to avoid inbreeding may have been the ancestral function of MHC molecules, which were later co-opted for use in the adaptive immune system.120
MHC SIGNALING D URING SOCIAL COM M UNICATION 305
MHC AND SIGNALS OF QUALITY IN MATE CHOICE
In contrast to MHC-mediated signals that directly convey MHC genotype information (relatedness, compatibility or individuality), the disease resistance functions of MHC can also influence social signalling by modulating the expression of secondary sexual characters. Only high-quality, disease-resistant individuals should be able to invest in costly, sexually selected advertisements,121 thus creating a correlation between MHC genotype and these condition-dependent traits (Table 2). By endowing an individual with genetic resistance to parasites, MHC genotype can indirectly influence signals of quality by allowing more physiological resources to be devoted to signaling rather than to the immune response.122 von Schantz and colleagues123 were the first to report an association between MHC and a sexually selected trait; they found that spur length in male pheasants (Phasianus colchicus) was correlated with fitness and dependent on MHC genotype. In a study on great snipes (Gallinago media), females preferred males carrying specific MHC allelic lineages. Males with these genotypes were also larger and females of this species are generally known to favor larger males.124 A study in white-tailed deer (Odocoileus virginianus) found that MHC divergent heterozygous males had larger antlers and body size, which was correlated with lower abundance of abomasal nematodes.122 F inally, a study
Table 2. MHC correlations with secondary sexual traits and mating preferences
SpeciesMHC Correlation
with Mate Preference
MHC Correlation with Traits of Quality Sources
Great snipe MHC allele-specific Body size Ekblom et al(Gallinago media) preference 2004124
Peafowl (Pavo MHC heterozygosity Train length Hale et al 200936cristatus)
Pheasants (Phasianus MHC genotype Spur length von Schantzcolchicus) et al 1996123
W hite-tailed MHC divergent Antler and body Ditchkoff et aldeer (Odocoileus heterozygotes size; reduced 2001122virginianus) parasitism
113
on a canonical sexually selected trait, trains in male peacocks (Pavo cristatus), showed that the train length reflects genetic diversity at the MHC.36 The above examples show that MHC-genotype can influence the expression of secondary sexual traits that are used as signals of quality. However, MHC-genotype itself is not necessarily used in the signal.
An alternative way that MHC-genotype can indirectly influence the expression of secondary sexual characteristics is if MHC social signals are themselves costly to produce. This hypothesis has recently been tested by the laboratory of Manfred Milinski, which identified the first example of condition-dependent MHC signaling.125 They had previously shown that female three-spined sticklebacks prefer males with optimal, rather than maximal, MHC allelic differences (relative to her own genotype) and that this mate choice is mediated by excreted MHC peptides (discussed above).14,44 Now, they show that females do not send this signal at all and that, remarkably, males only send this signal when they are in the reproductive state. These data suggest that MHC signaling is not simply a byproduct of MHC-peptide presentation, but that it is actively regulated in a fashion consistent with it being a costly signal. The authors suggest that shedding MHC-peptide complexes will create localized deficiencies of this critical immunological component and therefore represents a trade off between immune defense and social signaling.125
MHC-mediated signals of quality may allow an individual to gain either direct benefits for themselves or indirect genetic benefits for their offspring. Avoidance of parasitism is perhaps the most likely direct benefit of MHC-mediated mate choice. Social behaviors are an opportunity for parasites to transmit to new hosts; in turn, hosts will gradually develop behavioral mechanisms to avoid parasites.126 Individuals o f a particular MHC-genotype may be resistant to local parasites at any given time and choosing such an individual as a mate would provide a direct benefit of reduced risk of parasitism. Although there are several examples of mate choice for parasite-free individuals,127-129 there are surprisingly few examples of studies that link MHC-dependent resistance to pathogens and subsequent mate choice.117
306 SELF AND NONSELF
MHC EVOLUTION: WHAT ARE THE PRIMORDIAL FUNCTIONS?
Since the immune recognition function of MHC genes in adaptive immunity was discovered far earlier than MHC-mediated behaviors, and since it was so central to the complex system of vertebrate adaptive immunity, it was initially assumed that MHC-mediated behaviors were a derived function. However, Brown argued that since kin-selected behaviors (inbreeding avoidance and kin-biased cooperation) are present in the ancestral lineages leading to vertebrates and that adaptive immunity is a derived character in vertebrates, it is most parsimonious to hypothesize that MHC-mediated kin recognition functions were primordial.74 This controversy continues to this day.
Boehm has recently written a tour-de-force, synthetic review that evaluates self and nonself recognition systems that exist across plants, fungi and animals, with a special emphasis onhow quality recognition is maintained in the face ofthe rapid diversification of these highly polymorphic systems.120 Quality control (the ability to accurately discriminate between self and nonself) is of particular importance in immune recognition systems that must achieve self tolerance to protect against auto-immune disease.120,130
Jawless fish are the one lineage of vertebrates that appear to have a non MHC based adaptive immune recognition system.131,132 A high diversity of lymphocyte receptors in this group is created by combinatorial assembly of receptor modules, but the critical difference
114
from other vertebrates is that there is no junctional diversity created by mutagenic joining mechanisms.133 Thus, the lymphocyte receptor repertoire forjawless fish is predictable and self tolerance could be achieved by Darwinian selection for self-compatible receptor modules.120 In contrast, jawed vertebrates achieve higher lymphocyte receptor diversity by the mutagenic VDJ combinatorial joining process, which creates the problem of unpredictable receptor specificities that can lead to auto-immunity. These potentially harmful receptors are eliminated during the evaluation of lymphocytes receptors in the thymus of jawed vertebrates. Boehm argues that it seems unlikely that an MHC-peptide presentation system could emerge de-novo to create the modern jawed vertebrate immune recognition system, which allows self-tolerance in the face of somatic generation of unpredictable lymphocyte receptors. It would be far more likely that a pre-existing MHC-peptide kin recognition system could be co-opted for immune recognition.120 Discovery of the MHC homologues and their function inj awless fish offers one ofthe most promising approaches for discriminating between these two hypotheses and identifying the primordial function of MHC genes. Tunicates (a close relative of vertebrates) have a highly polymorphic histocompatibility-type (fusion) locus that functions both in allo-recognition to control colony fusion and gamete fusion,134 at least in some species.135 It was thought that identifying the nature of this locus might clarify the early history of MHC genes. After a two-decade search the locus was identified to be a member of the immunoglobulin super family, but it appears to not have homology to MHC genes.136-138 These findings further focus the search for primordial MHC functions towardsj awless fish.
The facts that within vertebrates there are completely different mechanisms controlling adaptive immune recognition and that in tunicates histocompatibility functions are controlled by genes unrelated to vertebrate histocompatibility genes, highlight the evolutionary flexibility of how similar functions can be achieved through different genetic systems. It is currently difficult to discriminate between the different proposed primordial function o f MHC genes. However, the initial assumption that immune recognition must be the primordial function of MHC genes, should no longer be the default assumption.
MHC SIGNALING D URING SOCIAL COM M UNICATION 307
CONCLUSION
In this chapter we have demonstrated the significance ofM HC signaling in regards to four aspects o f social communication. First, studies in mice show that MHC peptides and to a lesser extent MHC-associated urinary odors, signal individuality in the context of pregnancy block. MHC does not signal individuality during mouse scent-marking, rather, a species specific signal (MUP) is used. Second, MHC as a signal o f relatedness is found across vertebrates (Table 1) and plays a role in cooperation, parent-offspring identification and inbreeding avoidance via two different phenotype matching mechanisms: self reference or familial imprinting. Third, MHC signals are used to determine the genetic compatibility of a potential mate and can result in the production of heterozygous offspring. In some animals, mate choice for MHC compatibility is so finely tuned that they can optimize the degree of MHC heterozygosity in their offspring. Fourth, information regarding MHC genotype can be signaled indirectly through correlated characters (Table 2) and a recent study demonstrated that, at least within one species, MHC signaling itself may be condition-dependent and therefore a signal of individual quality. Taken together, these studies suggest that MHC-mediated signaling is conserved across vertebrates, but takes on unique functions depending on the life-history of a given species.
115
Appreciating the distinction between both modes of phenotype matching (self reference and familial imprinting) is paramount in understanding the role MHC-mediated signaling plays in social communication. Though substantial overlap in functionality exists between these phenotype matching systems, there are tradeoffs. Self reference systems facilitate mating preferences that generate offspring with an immunological advantage by allowing the assessment of genetic compatibility. Familial imprinting systems of phenotype matching facilitate the identification of siblings, half-siblings and cousins; in species where either cooperative behavior or avoiding inbreeding is important (e.g., communal nesting species or species that live in high-density populations), a familial imprinting system provides an advantage over a self reference system because self/nonself discrimination is not required to increase indirect fitness. That these two systems are differentially utilized by different groups of vertebrates highlights the highly context-dependent nature of social signaling. It is important to note, however, that phenotype matching mechanisms have been described in a relatively small number of species (Table 1) and more studies are needed.
The remarkable fact that a single genetic system controls major components of both immune recognition and social recognition begs the question of which recognition system constituted the primordial function of MHC genes. The convergent evolution of similar peptide binding properties of MHC, VSN and OSN receptor molecules provides the molecular basis by which MHC genotype influences both immune and social recognition; it also implies that these distinct receptor families have responded to selective pressures that required information regarding MHC genotype (bound peptides) be associated with discriminatory sensory systems. Finally, the ubiquitous presence of various modes of self versus nonself discrimination across all three domains of life, coupled with the derived nature of the adaptive immune system in vertebrates, further suggests that MHC-mediated social signaling evolved for the purpose of discrimination between conspecifics and could represent the ancestral state. Tracing the function of MHC molecules across vertebrate evolution holds the greatest promise of resolving the relative importance of immune versus social communication in MHC evolution.
308 SELF AND NONSELF
ACKNOWLEDGMENTS
We thank Linda Morrison for assistance with Figure 1. This chapter was written while ACN, JLK and WKP were supported by National Science Foundation grants IOS 0909801, DEB 0910052 and DEB 0918969.
REFERENCES
1. M anning CJ, W akeland EK, Potts WK. Communal nesting patterns in mice implicate MHC genes in kinrecognition. Nature 1992; 360:581-583.
2. Yamazaki K, Boyse EA, Mike V et al. Control o f mating preferences in mice by genes in the majorhistocompatibility complex. J Exp M ed 1976; 144:1324-1335.
3. Snell GD. Methods for the study o f histocompatibility genes. J G enet 1948; 49:87-108.4. Piertney SB, Oliver MK. The evolutionary ecology o f the major histocompatibility complex. Heredity
2006; 96:7-21.5. Yamaguchi M, Yamazaki K, Beauchamp GK et al. Distinctive urinary odors governed by the major
histocompatibility locus o f the mouse. Proc Natl Acad Sci 1981; 78:5817-5820.6. Singh PB, Brown RE, Roser B. MHC antigens in urine as olfactory recognition cues. Nature 1987; 327:161-164.
116
7. Leinders-Zufall T, Brennan P, W idmayer P et al. M HC class I peptides as chemosensory signals in thevomeronasal organ. Science 2004; 306:1033-1037.
8. Spehr M, Kelliher KR, Li XH et al. Essential role o f the main olfactory system in social recognition o f majorhistocompatibility complex peptide ligands. J Neurosci 2006; 26:1961-1970.
9. M urphy KP, Travers P, Janeway C et al. Immunobiology. New York: Garland Science, 2008.10. Boehm T, Zufall F. MHC peptides and the sensory evaluation o f genotype. Trends Neurosci 2006; 29:100-107.11. Spehr M, Spehr J, Ukhanov K et al. Parallel processing o f social signals by the mammalian main and
accessory olfactory systems. Cell M ol Life Sci 2006; 63:1476-1484.12. Kelliher KR, Spehr M, Li XH et al. Pheromonal recognition memory induced by TRPC2-independent
vomeronasal sensing. Euro J Neuroscience 2006; 23:3385-3390.13. Kelliher KR, Spehr M, Li XH et al. Relative roles o f the main and accessory olfactory systems in behavioral
responses to MHC class I peptides: Bruce effect. Chem Senses 2005; 30:A18.14. Milinski M, Griffiths S, Wegner KM et al. Mate choice decisions o f stickleback females predictably modified
by M HC peptide ligands. Proc Natl Acad Sci USA 2005; 102:4414-4418.15. Singer AG, Beauchamp GK, Yamazaki K. Volatile signals o f the major histocompatibility complex in male
mouse urine. Proc Natl Acad Sci USA 1997; 94:2210-2214.16. Willse A, Belcher AM, Preti G et al. Identification o f major histocompatibility complex-regulated body
odorants by statistical analysis o f a comparative gas chromatography/mass spectrometry experiment. Anal Chem 2005; 77:2348-2361.
17. Kwak J, Opiekun MC, Matsumura K et al. Major histocompatibility complex-regulated odortypes: peptide-freeurinary volatile signals. Physiol Behav 2009; 96:184-188.
18. Carroll LS, Penn DJ, Potts WK. Discrimination o f M HC-derived odors by untrained mice is consistent withdivergence in peptide-binding region residues. Proc Natl Acad Sci U SA 2002; 99:2187-2192.
19. Zelano B, Edwards SV. An Mhc component to kin recognition and mate choice in birds: Predictions,progress and prospects. Am Nat 2002; 160:S225-S237.
20. Yamazaki K, Beauchamp GK, Kupniewski J et al. Familial imprinting determines H-2 selective matingpreferences. Science 1988; 240:1331-1332.
21. Yamazaki K, Beauchamp GK, Daisuke Y. Genetic Basis for M HC-Dependent M ate Choice. Adv Genet2007; 59:129-145.
22. Manning CJ, W akeland EK, Potts WK. Communal nesting patterns in mice implicate MHC genes in kinrecognition. Nature 1992b; 360:581-583.
23. Jacek R, Aleksandra T, Agnieszka K. M HC and Preferences for Male Odour in the Bank Vole. Ethology2008; 114:827-833.
24. Sommer S. Major histocompatibility complex and mate choice in a monogamous rodent. Behav EcolSociobiol 2005; 58:181-189.
25. Wedekind C, Seebeck T, Bettens F et al. M HC-dependent mate preferences in humans. Proc R Soc LondB 1995; 260:245-249.
26. Havlicek J, Roberts SC. M HC-correlated mate choice in humans: A review. Psychoneuroendocrinology2009; 34:497-512.
27. Setchell JM, Charpentier MJ, Abbott K M et al. Opposites attract: MHC-associated mate choice in apolygynous primate. J Evol Biol 2009; 23:136-148.
28. Schwensow N, Fietz J, Dausmann K et al. MHC-associated mating strategies and the importance o f overallgenetic diversity in an obligate pair-living primate. Evol Ecol 2008; 22:617-636.
29. Schwensow N, Eberle M, Sommer S. Compatibility counts: M HC-associated mate choice in a wildpromiscuous primate. Proc R Soc Lond B Biol Sci 2008; 275:555-564.
30. Paterson S, Pemberton JM. No evidence for major histocompatibility complex-dependent m ating patternsin a free-living ruminant population. Proc R Soc Lond B 1997; 264:1813-1819.
31. Freeman-Gallant CR, M eguerdichian M, W heelwright NT et al. Social pairing and female m ating fidelitypredicted by restriction fragment length polymorphism similarity at the major histocompatibility complex in a songbird. Mol Ecol 2003; 12:3077-3083.
32. Bonneaud C, Chastel O, Federici P et al. Complex M hc-based mate choice in a wild passerine. Proc BiolSci 2006; 273:1111-1116.
33. Richardson DS, Komdeur J, Burke T et al. M HC-based patterns o f social and extra-pair mate choice in theSeychelles warbler. Proc Biol Sci 2005; 272:759-767.
34. Westerdahl H. No evidence o f an M HC-based female mating preference in great reed warblers. M olecularEcology 2004; 13:2465-2470.
35. Gillingham MAF, Richardson DS, Lovlie H et al. Cryptic preference for M HC-dissimilar females in malered junglefowl, Gallus gallus. Proc R Soc Lond B Biol Sci 2009; 276:1083-1092.
36. Hale ML, Verduijn MH, M oller AP et al. Is the peacock’s train an honest signal o f genetic quality at themajor histocompatibility complex? J Evol Biol 2009; 22:1284-1294.
MHC SIGNALING D URING SOCIAL COM M UNICATION 309
117
310 SELF AND NONSELF
37. Olsson M, M adsen T, Nordby J et al. M ajor histocompatibility complex and mate choice in sand lizards.Proc R Soc Lond B Biol Sci 2003; 270:S254-S256.
38. M iller HC, M oore JA, Nelson NJ et al. Influence o f major histocompatibility complex genotype on matingsuccess in a free-ranging reptile population. Proc Biol Sci 2009; 276:1695-1704.
39. Villinger J, Waldman B. Self-referent MHC type matching in frog tadpoles. Proc Biol Sci 2008; 275:1225-1230.40. Bos DH, Williams RN, Gopurenko D et al. Condition-dependent mate choice and a reproductive disadvantage
for M HC-divergent male tiger salamanders. M olecular Ecology 2009; 18:3307-3315.41. GerlachG, Hodgins-Davis A, M acDonald B etal. Benefits o f kin association: related and familiar zebrafish
larvae (Danio rerio) show improved growth. Behav Ecol Sociobiol 2007; 61:1765-1770.42. Gerlach G, Hodgins-Davis A, Avolio C et al. Kin recognition in zebrafish: a 24-hour window for olfactory
imprinting. Proc Biol Sci 2008; 275:2165-2170.43. Aeschlimann PB, Haeberli MA, Reusch TBH et al. Female sticklebacks Gasterosteus aculeatus use self
reference to optimize M HC allele number during mate selection. 2003; 54:119-126.44. Reusch T, Haeberli M A, Aeschlimann PB et al. Female sticklebacks count alleles in a strategy o f sexual
selection explaining M HC polymorphism. Nature 2001; 414:300-302.45. M ilinski M. The major histocompatibility complex, sexual selection and mate choice. Annu Rev Ecol
Evol Syst 2006; 37:159-186.46. Rajakaruna RS, Brown JA, Kaukinen KH et al. M ajor histocompatibility complex and kin discrimination
in Atlantic salmon and brook trout. M ol Ecol 2006; 15:4569-4575.47. Consuegra S, Garcia de Leaniz C. M HC-mediated mate choice increases parasite resistance in salmon.
Proc Biol Sci 2008; 275:1397-1403.48. N eff BD, G arner SR, Heath JW et al. The M HC and nonrandom m ating in a captive population o f Chinook
salmon. Heredity 2008; 101:175-185.49. Olsen KH, Grahn M, Lohm J. Influence o f M HC on sibling discrimination in Arctic char, Salvelinus alpinus
(L.). J Chem Ecol 2002; 28:783-795.50. Forsberg LA, Dannewitz J, Petersson E et al. Influence o f genetic dissimilarity in the reproductive success
and mate choice o f brown trout—females fishing for optimal M HC dissimilarity. J Evol Biol 2007; 20:1859-1869.
51. Wedekind C, W alker M, Portmann J et al. M HC-linked susceptibility to a bacterial infection, but noM H C -linkedcrypticfem alechoiceinw hitefish . JE v o lB io l2 0 0 4 ; 17:11-18.
52. Tibbetts EA, Dale J. Individual recognition: it is good to be different. Trends Ecol Evol 2007; 22:529-537.53. Singh PB. Chemosensation and genetic individuality. Reproduction 2001; 121:529-539.54. Thomas L. Symbiosis as an immunologic problem. The immune system and infectious diseases. In: Neter
E, Milgrom F, eds. Fourth International Convocation o f Immunology. Basel: S. Karger; 1975:2-11.55. Tibbetts EA, Sheehan MJ, Dale J. A testable definition o f individual recognition. Trends Ecol Evol 2008;
23:356-356.56. Novotny MV, Soini HA, Koyama S et al. Chemical identification o f MHC-influenced volatile compounds
in m ouse urine. I: Quantitative proportions o f major chemosignals. J Chem Ecol 2007; 33:417-434.57. Kwak J, Willse A, Matsumura K et al. Genetically-based olfactory signatures persist despite dietary
variation. PLoS One 2008; 3:e3591.58. Schaefer ML, Young DA, RestrepoD. Olfactory fingerprints formajor histocompatibility complex-determined
body odors. J Neurosci 2001; 21:2481-2487.59. Bruce HM. An exteroceptive block to pregnancy in the mouse. Nature 1959; 164:105.60. Brennan PA. Outstanding issues surrounding vomeronasal mechanisms o f pregnancy block and individual
recognition in mice. Behav Brain Res 2009; 200:287-294.61. Yamazaki K, Beauchamp GK, Wysocki CJ et al. Recognition o f H-2 types in relation to the blocking of
pregnancy in mice. Science 1983b; 221:186-188.62. Peele P, Salazar I, M immack M et al. Low m olecular weight constituents o f male mouse urine mediate the
pregnancy block effect and convey information about the identity o f the mating male. Eur J Neurosci 2003; 18:622-628.
63. Thompson RN, M cM illon R, Napier A et al. Pregnancy block by M HC class I peptides is mediated via theproduction o f inositol 1,4,5-trisphosphate in the mouse vomeronasal organ. J Exp Biol 2007; 210:1406-1412.
64. He J, Ma L, Kim S et al. Encoding gender and individual information in the mouse vomeronasal organ.Science 2008; 320:535-538.
65. Slev PR, Nelson AC, Potts WK. Sensory neurons with M HC-like peptide binding properties: diseaseconsequences. Curr Opin Immunol 2006; 18:608-616.
66. Hurst JL, Payne CE, Nevison CM et al. Individual recognition in mice mediated by major urinary proteins.Nature 2001; 414:631-634.
67. Hurst JL, Thom MD, Nevison CM et al. MHC odours are not required or sufficient for recognition ofindividual scent owners. Proc Biol Sci 2005; 272:715-724.
118
MHC SIGNALING D URING SOCIAL COM M UNICATION 311
68. Cheetham SA, Thom MD, Jury F et al. The genetic basis o f individual-recognition signals in the mouse.Curr Biol 2007; 17:1771-1777.
69. Penn D, Potts W. Untrained mice distinguish MHC-determined odors. Physiol Behav 1998; 64:235-243.70. Manning CJ, Potts WK, Wakeland EK et al. W hat’s wrong with M HC mate choice experiments? In: Doty
RL, Muller-Schwarze D, eds. Chemical Signals in Vertebrates. Vol VI. New York: Plenum; 1992; 229-235.71. Hamilton WD. The genetical evolution o f social behaviour. I II J Theor Biol 1964; 7:1-52.72. Mateo JM. Kin-recognition abilities and nepotism as a function o f sociality. Proc Biol Sci 2002; 269:721-727.73. Yamazaki K, Beauchamp GK, Curran M et al. Parent-progeny recognition as a function o f MHC odortype
identity. Proc Natl Acad Sci U SA 2000; 97:10500-10502.74. Brown JL. Some paradoxical goals o f cells and organisms: the role o f the MHC. In: Pfaff DW, ed. Ethical
Questions in Brain and Behavior. New York: Springer Verlag; 1983; 111-124.75. Penn D, Potts W. MHC-disassortative mating preferences reversed by cross-fostering. Proc R Soc London
B 1998d; 265:1299-1306.76. Potts WK, W akeland EK. Evolution o f M HC genetic diversity: a tale o f incest, pestilence and sexual
preference. Trends Genet 1993; 9:408-412.77. Paterson S, Hurst JL. How effective is recognition o f siblings on the basis o f genotype? J Evol Biol 2009:
22:1875-1881.78. Sato A, Figueroa F, M urray BW et al. Nonlinkage o f major histocompatibility complex class I and class
II loci in bony fishes. Immunogenetics 2000; 51:108-116.79. Liu Y, Kasahara M, Rumfelt LL et al. Xenopus class II A genes: studies o f genetics, polymorphism and
expression. Dev Comp Immunol 2002; 26:735-750.80. Sherborne AL, Thom MD, Paterson S et al. The genetic basis o f inbreeding avoidance in house mice. Curr
Biol 2007; 17:2061-2066.81. Brown GE, Brown JA. Do kin always make better neighbours? The effects o f territory quality. Behavioral
Ecology and Sociobiology 1993; 33:225-231.82. Johnston RE, M uller-Schwartz D, Sorensen PW. Advances in Chemical Signals in Vertebrates: Klewer/
Plenum, New York; 1999.83. Lynch CB. Inbreeding effects upon animals derived from a wild population o f Mus musculus. Evolution
1977; 31:526-537.84. Connor JL, Belucci MJ. Natural selection resisting inbreeding depression in captive wild house mice (Mus
musculus). Evolution 1979; 33:929-940.85. M eagher S, Penn DJ, Potts WK. M ale-male competition magnifies inbreeding depression in wild house
mice. Proc Natl Acad Sci U SA 2000; 97:3324-3329.86. Ilmonen P, Penn DJ, Damjanovich K et al. Experimental infection magnifies inbreeding depression in
house mice. J Evol Biol 2008; 21:834-841.87. N eff BD, Pitcher TE. Genetic quality and sexual selection: an integrated framework for good genes and
compatible genes. Mol Ecol 2005; 14:19-38.88. Wedekind C, Chapuisat M, Macas E et al. Non-random fertilization in mice correlates with M HC and
something else. Heredity 1996; 77:400-409.89. Rulicke T, Chapuisat M, Homberger FR et al. MHC-genotype o f progeny influenced by parental infection.
Proc R Soc Lond B 1998; 265:711-716.90. Doherty PC, Zinkernagel RM. Enhanced immunological surveillance in mice heterozygous at the H-2 gene
complex. Nature 1975; 256:50-52.91. Hughes AL, Nei M. Pattern o f nucleotide substitution at major histocompatibity complex class I loci reveals
overdominant selection. Nature 1988; 335:167-170.92. Hill AV, Allsopp CE, Kwiatkowski D et al. Common west African HLA antigens are associated with
protection from severe malaria. Nature 1991; 352:595-600.93. Thursz MR, Thomas HC, Greenwood BM et al. Heterozygote advantage for HLA class-II type in hepatitis
B virus infection. N at G enet 1997; 17:11-12.94. Carrington M, Nelson GW, M artin M P et al. HLA and HIV-1: heterozygote advantage and B*35-Cw*04
disadvantage. Science 1999; 283:1748-1752.95. Arkush KD, Giese AR, Mendonca HL et al. Resistance to three pathogens in the endangered winter-run
chinook salmon (Oncorhynchus tshawytscha): effects o f inbreeding and major histocompatibility complex genotypes. Canadian Journal o f Fisheries and Aquatic Science 2002; 59:966-975.
96. Penn DJ, Damjanovich K, Potts WK. M HC heterozygosity confers a selective advantage against multiple-strain infections. Proc Natl Acad Sci USA 2002; 99:11260-11264.
97. Froeschke G, Sommer S. MHC class II DRB variability and parasite load in the striped mouse (Rhabdomyspumilio) in the Southern Kalahari. M ol Biol Evol 2005; 22:1254-1259.
98. Hraber P, Kuiken C, Yusim K. Evidence for human leukocyte antigen heterozygote advantage againsthepatitis C virus infection. Hepatology 2007; 46:1713-1721.
119
312 SELF AND NONSELF
99. M cClelland EE, Penn DJ, Potts WK. M ajor Histocompatibility Complex Heterozygote Superiority duringCoinfection. Infect Immun 2003; 71:2079-2086.
100. Kekalainen J, Vallunen JA, Primmer CR et al. Signals o f major histocompatibility complex overdominance in a w ild salmonid population. Proc Biol Sci 2009; 276:3133-3140.
101. Oliver MK, Telfer S, Piertney SB. M ajor histocompatibility complex (MHC) heterozygote superiority to natural multi-parasite infections in the water vole (Arvicola terrestris). Proc Biol Sci 2009; 276:1119-1128.
102. Penn D, Potts W. The evolution o f mating preferences and major histocompatibility genes. Am Nat 1999;153:145-164.
103. Bertoletti A, Sette A, Chisari FV et al. Natural variants o f cytotoxic epitopes are T-cell receptor antagonists for antiviral cytotoxic T-cells [see comments]. Nature 1994; 369:407-410.
104. Moskophidis D, Zinkernagel RM. Immunobiology o f cytotoxic T-cell escape mutants o f lymphocytic choriiomeningitis virus. J V iriol 1995; 69:2187-2193.
105. McM ichael AJ, Phillips RE. Escape o f human immunodeficiency virus from immune control. Annu Rev Immunol 1997; 15:271-296.
106. Jeffery KJ, Usuku K, Hall SE et al. HLA alleles determine human T-lymphotropic virus-I (HTLV-I) proviral load and the risk ofHTLV-I-associated myelopathy. Proc Natl Acad Sci U s A 1999; 96:3848-3853.
107. Allen TM, O ’Connor DH, JingP et al. Tat-specific cytotoxic T-lymphocytes select for SIV escape variants during resolution o f primary viraemia. Nature 2000; 407:386-390.
108. Bowen DG, Walker CM. Mutational escape from CD8+ T-cell immunity: HCV evolution, from chimpanzees to man. J Exp M ed 2005; 201:1709-1714.
109. Furukawa Y, Tara M, Izumo S et al. HTLV-I viral escape and host genetic changes in the development o f adult T-cell leukemia. Int J Cancer 2006; 118:381-387.
110. Goulder PJ, Watkins DI. HIV and SIV CTL escape: implications for vaccine design. N at Rev Immunol 2004; 4:630-640.
111. M cClelland EE, Granger DL, Potts WK. M HC-dependent susceptibility to Cryptococcus neoformans in mice. Infection and Immunity 2003; 71:4815-4817.
112. Buseyne F, Janvier G, Teglas JP et al. Impact o f heterozygosity for the chemokine receptor CCR5 32-bp-deleted allele onplasm a virus load and CD4 T-lymphocytes inperinatally human immunodeficiency virus-infected children at 8 years o f age. J Infect Dis 1998; 178:1019-1023.
113. Misrahi M, Teglas JP, N ’Go N et al. CCR5 chemokine receptor variant in HIV -1 mother-to-child transmission and disease progression in children. French Pediatric HIV Infection Study Group. Jama 1998; 279:277-280.
114. MacDonald KS, Embree J, Njenga S et al. M other-child class I HLA concordance increases perinatal human immunodeficiencyvirus type 1 transmission. J InfectD is 1998; 177:551-556.
115. Polycarpou A, Ntais C, Korber BT et al. Association between maternal and infant class I and II HLA alleles and o f their concordance with the risk o f perinatal HIV type 1 transmission. AIDS Res Hum Retroviruses 2002; 18:741-746.
116. WoelfingB, Traulsen A, M ilinskiM etal. Does intra-individualmajor histocompatibility complex diversity keep a golden mean? Philos Trans R Soc Lond B Biol Sci 2009; 364:117-128.
117. Wegner KM, Kalbe M, Kurtz J et al. Parasite selection for immunogenetic optimality. Science 2003; 301:1343.
118. Kalbe M, Eizaguirre C, Dankert I et al. Lifetime reproductive success is maximized with optimal major histocompatibility complex diversity. Proc Biol Sci 2009; 276:925-934.
119. Reusch TB, Haberli M A, Aeschlimann PB et al. Female sticklebacks count alleles in a strategy o f sexual selection explaining M HC polymorphism. Nature 2001; 414:300-302.
120. Boehm T. Quality control in self/nonself discrimination. Cell 2006; 125:845-858.121. Zahavi A. M ate selection-a selection for a handicap. J theor Biol 1975; 53:205-214.122. D itchkoff SS, Lochmiller RL, Masters RE et al. Major-histocompatibility-complex-associated variation
in secondary sexual traits o f white-tailed deer (Odocoileus virginianus): evidence for good-genes advertisement. Evolution 2001; 55:616-625.
123. Von-Schantz THWGGMGKP. M HC genotype and male ornamentation: genetic evidence for the Hamilton-Zuk model. Proc R Soc Lond B 1996; 263:265-271.
124. Ekblom R, Saether SA, Grahn M et al. M ajor histocompatibility complex variation and mate choice in a lekking bird, the great snipe (Gallinago media). Mol Ecol 2004; 13:3821-3828.
125. Milinski M, Griffiths SW, Reusch TB et al. Costly major histocompatibility complex signals produced only by reproductively active males, but not females, m ust be validated by a ‘maleness signal’ in three-spined sticklebacks. Proc Biol Sci 2009; 2010; 277:391-398.
126. Zuk M. The role o f parasites in sexual selection: current evidence and future directions. Adv Study Behav1992; 21:39-68.
127. Penn D, Potts WK. Chemical signals and parasite-mediated sexual selection. Trends Ecol Evol 1998;13:391-396.
120
M H C SIG N A L IN G D U R IN G S O C IA L C O M M U N IC A T IO N 313
128. Kavaliers M, Choleris E, Agmo A et al. Olfactory-mediated parasite recognition and avoidance: linking genes to behavior. Horm Behav 2004; 46:272-283.
129. M oller AP, Saino N. Parasites, immunology ofhosts and host sexual selection. J Parasitol 1994; 80:850-858.130. Boehm T. Co-evolution o f a primordial peptide-presentation system and cellular immunity. N at Rev
Immunol 2006; 6:79-84.131. Han BW, Herrin BR, Cooper MD et al. Antigen recognition by variable lymphocyte receptors. Science
2008; 321:1834-1837.132. Cooper M D, Alder MN. The evolution o f adaptive immune systems. Cell 2006; 124:815-822.133. Guo P, Hirano M, H errin BR et al. Dual nature o f the adaptive immune system in lampreys. Nature 2009;
459:796-801.134. Scofield VL, Schlumpberger JM, W estL A etal. Protochordate allorecognition is controlled by a Mhc-like
gene system. Nature 1982; 295:499-502.135. Grosberg RK, H art MW. M ate selection and the evolution o f highly polymorphic self/nonself recognition
genes. Science 2000; 289:2111-2114.136. De Tomaso AW, Nyholm SV, Palmeri KJ et al. Isolation and characterization o f a protochordate
histocompatibility locus. Nature 2005; 438:454-459.137. De Tomaso AW, Weissman IL. Evolution o f a protochordate allorecognition locus. Science 2004; 303:977.138. Khalturin K , Bosch TC. Self/nonself discrimination at the basis o f chordate evolution: limits on molecular
conservation. Curr Opin Immunol 2007; 19:4-9.