Organic matter stabilization in a Xanthic Ferralsol of … · Organic matter stabilization in a...
22
Ž . Geoderma 99 2001 147–168 www.elsevier.nlrlocatergeoderma Organic matter stabilization in a Xanthic Ferralsol of the central Amazon as affected by single trees: chemical characterization of density, aggregate, and particle size fractions Johannes Lehmann a, ) , Manoel da Silva Cravo b , Wolfgang Zech a a Institute of Soil Science and Soil Geography, UniÕersity of Bayreuth, UniÕersitatsstr. 30, D-95440 Bayreuth, Germany b Empresa Brasileira de Pesquisa Agropecuaria, 69011-970 Manaus, Brazil Received 23 August 1999; accepted 26 May 2000 Abstract Ž . Not only the amount of organic carbon in soil is important for soil organic matter SOM stability, but also its physical and chemical properties. The appropriate technique for the assessment of SOM dynamics can vary between soil types, and information about this is lacking for Ferralsols of the central Amazon basin. First, this work identified SOM pools which are sensitive to land-use changes on the terra firme in the central Amazon. In a second step, the effects of single trees on SOM properties were evaluated in a mixed tree crop plantation in comparison to secondary and primary forest sites. Thus, the processes of organic matter stabiliza- tion could be studied in the highly aggregated soils. A combination of aggregate and density fractionation was found to be most suitable for physical SOM characterization. The particulate Ž y3 . organic matter POM, density less than 1.6 Mg m varied by one order of magnitude between sites and could be used as a sensitive indicator of land-use changes. Aggregate stability was not related to SOM contents or bulk SOM properties. The incorporation of plant material into stable SOM, however, was enhanced by aggregation. Among aggregate separates, the fraction, 0.25–0.5 mm, showed single-tree effects the most. SOM replenishment was higher under tree species with low quality litter, i.e. high C-to-N and polyphenol-to-N ratios. High quality litter from a leguminous ground cover, however, showed low soil nitrogen and carbon replenishment but increased nitrogen concentrations in light fractions. Litter with a high quality may improve soil nitrogen availability but not amounts of total SOM, which could only be shown for low quality litter. The results indicate the importance of aggregation and POM dynamics for SOM stabiliza- ) Corresponding author. Fax: q 49-921-552-246. Ž . E-mail address: [email protected] J. Lehmann . 0016-7061r01r$ - see front matter q 2001 Elsevier Science B.V. All rights reserved. Ž . PII: S0016-7061 00 00070-7
Transcript of Organic matter stabilization in a Xanthic Ferralsol of … · Organic matter stabilization in a...

Ž .Geoderma 99 2001 147–168www.elsevier.nlrlocatergeoderma
Organic matter stabilization in a Xanthic Ferralsolof the central Amazon as affected by single trees:
chemical characterization of density, aggregate, andparticle size fractions
Johannes Lehmann a,), Manoel da Silva Cravo b, Wolfgang Zech a
a Institute of Soil Science and Soil Geography, UniÕersity of Bayreuth, UniÕersitatsstr. 30,D-95440 Bayreuth, Germany
b Empresa Brasileira de Pesquisa Agropecuaria, 69011-970 Manaus, Brazil
Received 23 August 1999; accepted 26 May 2000
Abstract
Ž .Not only the amount of organic carbon in soil is important for soil organic matter SOMstability, but also its physical and chemical properties. The appropriate technique for theassessment of SOM dynamics can vary between soil types, and information about this is lackingfor Ferralsols of the central Amazon basin. First, this work identified SOM pools which aresensitive to land-use changes on the terra firme in the central Amazon. In a second step, theeffects of single trees on SOM properties were evaluated in a mixed tree crop plantation incomparison to secondary and primary forest sites. Thus, the processes of organic matter stabiliza-tion could be studied in the highly aggregated soils. A combination of aggregate and densityfractionation was found to be most suitable for physical SOM characterization. The particulate
Ž y3.organic matter POM, density less than 1.6 Mg m varied by one order of magnitude betweensites and could be used as a sensitive indicator of land-use changes. Aggregate stability was notrelated to SOM contents or bulk SOM properties. The incorporation of plant material into stableSOM, however, was enhanced by aggregation. Among aggregate separates, the fraction, 0.25–0.5mm, showed single-tree effects the most. SOM replenishment was higher under tree species withlow quality litter, i.e. high C-to-N and polyphenol-to-N ratios. High quality litter from aleguminous ground cover, however, showed low soil nitrogen and carbon replenishment butincreased nitrogen concentrations in light fractions. Litter with a high quality may improve soilnitrogen availability but not amounts of total SOM, which could only be shown for low qualitylitter. The results indicate the importance of aggregation and POM dynamics for SOM stabiliza-
) Corresponding author. Fax: q49-921-552-246.Ž .E-mail address: [email protected] J. Lehmann .
0016-7061r01r$ - see front matter q2001 Elsevier Science B.V. All rights reserved.Ž .PII: S0016-7061 00 00070-7

( )J. Lehmann et al.rGeoderma 99 2001 147–168148
tion in the studied Xanthic Ferralsols of the central Amazon basin. q 2001 Elsevier Science B.V.All rights reserved.
Keywords: aggregate stability; ferralsol; humid tropics; nitrogen; physical fractionation; soilorganic matter
1. Introduction
In the humid tropics, high leaching rates can lead to large nutrient losses fromŽ .applied fertilizer in crop production systems Seyfried and Rao, 1991 . The
minimization of these unproductive nutrient losses and a closed nutrient cyclingare the precondition of sustainable land-use management. Adding to the problemof nutrient leaching, the Ferralsols of the central Amazon are characterized by
Ž .severe nutrient limitations Cravo and Smyth, 1997 . Therefore, nutrient conser-vation and the replenishment of nutrient contents are vital for crop production on
Ž .these soils. Increasing the soil organic matter SOM content is the key factorfor improving soil chemical fertility, first as a source of slow release of nutrientsand secondly, as a means of enhancing the soil cation exchange capacity in
Ž .order to reduce nutrient leaching Coleman et al., 1989 .Integrating trees into farmland and combining different tree species in
multi-strata agroforestry systems may increase SOM contents and improve soilnutrient availability as shown for single-tree influences on soil properties in
Ž .natural forest and savanna ecosystems Rhoades, 1997 . The effectiveness toreplenish SOM contents may vary between different tree species. Very little isknown about the potential of indigenous fruit trees to replenish SOM contents inagroforestry systems in comparison to secondary vegetation and primary forestin the central Amazon.
Not only the amount of organic carbon in soil is ecologically important forŽ .SOM stability, but also its physical Feller and Beare, 1997 and chemical
Ž .properties Zech et al., 1997 . Using particle size, aggregate and densityŽ .fractionation methods Tiessen and Stewart, 1983; Tisdall and Oades, 1982 ,
Ž .together with the analysis of the chemistry of SOM Degens, 1997 , profoundstatements can be made about SOM stability and dynamics. These techniquesusually indicate land-use changes more sensitively than bulk soil analyses as
Ž .shown in many studies from tropical and temperate soils Christensen, 1992 .The appropriate technique for the assessment of ecologically relevant SOMpools can vary between soils. Several studies are available for highly weathered
Ž .soils from semi-arid northeastern Brazil Shang and Tiessen, 1997 , the Brazil-Ž . Ž .ian Cerrado Neufeldt et al., 1999 , and Colombia Guggenberger et al., 1995 ,
but information on SOM pools is lacking for Ferralsols on the terra firme of thecentral Amazon basin.
Ž .The objectives of this study were i to identify SOM pools which areŽ .sensitive to land-use changes, ii to evaluate the effects of different trees on

( )J. Lehmann et al.rGeoderma 99 2001 147–168 149
Ž .SOM properties, and iii to characterize processes which are relevant to SOMstabilization in Xanthic Ferralsols on the terra firme of the central Amazon.
2. Materials and methods
This study was conducted on the SHIFT experimental fields at the EmbrapaŽ .Empresa Brasileira de Pesquisa Agropecuaria Amazonia Occidental station,´ ˆ
y1 Ž .near Manaus, Brazil. The average precipitation is 2503 mm year 1971–1993with a maximum between December and May. The natural vegetation is a
Ž .tropical rainforest. The soils are classified as Xanthic Ferralsols FAO, 1990and are clayey with over 80% clay, strongly aggregated, having medium organiccarbon and nitrogen contents of 28 and 2.3 mg gy1, respectively, medium to low
Ž . y1pH of 4.5–5.0 H 0 , low effective cation exchange capacity of 4.9 mmol kg2 c
and low base saturation of 33%.ŽThe investigated sites were soils under cupuacu Theobroma grandiflorum
Ž . . Ž .Willd. ex Spreng. K. Schum. , peachpalm Bactris gasipaes Kunth. managedŽ .for heart of palm production, Brazil nut Bertholletia excelsa Humb.&Bonpl. ,
Ž . Ž Ž . .annatto Bixa orellana L. and pueraria Pueraria phaseoloides Roxb. Benth.in an agroforestry system, and under peachpalm in monoculture. In Novemberand April, these sites were fertilized according to local recommendation with 95,
Ž .42, 42 and 85 g Nryear ammonium sulfate and plant for cupuacu, peachpalm,Brazil nut and annatto, respectively. Additionally, sites with spontaneous grami-
Ž .neous vegetation, in the secondary vegetation of vismia Vismia spp. and in theŽ . Žprimary forest under mata-mata Eschweilera spp. and bacaba Oenocarpus
. Ž .bacaba were chosen. Two topsoil samples 0–5 cm were taken at 50 cm fromthree individual trees of the same species in September 1997 and combined.From sites of cupuacu, peachpalm, pueraria, vismia and bacaba soil sampleswere obtained in three replicates using a completely randomized design, for theother species, samples were obtained only in one replicate. The soil sampleswere air-dried, separated from litter larger than 2 mm and sieved to pass 2 mm.
2.1. Soil fractionation
The soil samples were physically fractionated according to their particle size,aggregate size, and particle density. Aggregate size and density fractionationwas performed for all samples, particle size fractionation only for one replicate,for which samples of all sites were available. For the particle size separation,30 g fine earth were ultrasonically dispersed with an energy of 200 J mly1 usinga soil:water mixture of 1:5 and then sieved to yield the coarse sand fractionŽ . y12000–250 mm . After a subsequent sonication with 300 J ml , the fine sandfraction, 250–20 mm, was separated. The sonication energy was adjusted after
Ž .preliminary experiments to ensure complete dispersion after North, 1976

( )J. Lehmann et al.rGeoderma 99 2001 147–168150
without redistribution of organic carbon. Both fractions were dried at 408C forŽ .48 h. The silt and clay fractions -20 mm were not separated and were freeze
dried, because carbon redistribution could not be excluded during furtherfractionation. The mean recovery amounted to 87%. Two different methods ofaggregate fractionation were conducted in triplicate: dry and wet fractionationŽ .modified from Angers and Giroux, 1996 , the latter being combined with a
Ž .density fractionation Fig. 1 . First, 30 g soil was put on a cascade of sieves with1000-, 500-, 250- and 20-mm sieve openings, vertically shaken for 50 times,turned 908 and again shaken. Tests verified that after this procedure, onlyaggregates larger than the respective sieve opening size remained on the sieves,and the recovery was between 97% and 99%. The separates were weighed. Forthe combined aggregate and density fractionation, aggregates from the dryfractionation were combined and again put on the cascade of sieves but with the20-mm sieve removed. The cascade was installed in a Yoder apparatus inside a
Fig. 1. Sequence of dry and wet aggregate fractionation procedure coupled with a densityŽ .fractionation yielding five aggregate size classes and the particulate organic matter POM of soil
and the POM bound inside aggregates.

( )J. Lehmann et al.rGeoderma 99 2001 147–168 151
Ž .water bath Yoder, 1936 . The aggregates were slowly wetted from below. Thisprocedure could not completely exclude slaking and corresponded to the method
Ž .of wet sieving without pre-wetting, of Gijsman 1996 . The aggregates wereseparated using a 30-mm vertical displacement and 31 rpm for 30 min. Thesieves were removed from the water bath and transferred into a pan with a
Ž . y3sodium polytungstate SPT solution of 1.6 Mg m . The POM, which waslighter than 1.6 Mg my3, was washed with the SPT solution through a 250-mmsieve to separate POM and SPT. All aggregate fractions and POM were washedseveral times with deionized water to remove the SPT. The aggregates, whichpassed through the 250-mm sieve of the Yoder apparatus, were poured through a20-mm sieve. The remaining fraction, -20 mm, was flocculated with MgCl2
and allowed to settle before discarding the supernatant. All fractions were driedŽ .at 408C for 48 h and weighed recovery 95% . The aggregate fractions were
again fractionated in primary particles, POM and mineral matrix after sonica-tion, using the respective sieve and energy described above. Thus, the AtrueBamount of aggregates in the respective fractions could be determined excludingthe mineral particles, which would belong to the aggregate class because of theirsize alone. The primary particles were separated with the sieve of the respectivesize class, dried, weighed and discarded. The POM contained within the
Ž ).aggregates hereafter referred to as POM was separated from the aggregateŽ . )fractions with the SPT solution as described above Fig. 1 . POM and the
remaining soil were thoroughly washed with deionized water, dried, and weighed.Ž .The mean weighted diameter MWD was calculated from dry and wet
aggregate separates in order to get a parameter of aggregate size distributionŽ .from each sample Kemper and Rosenau, 1987 :
n
MWDs x w .Ý i iis1
The MWD and the ratio of MWD from wet and dry aggregate fractionationŽ .MWD -to-MWD were taken as a measure of aggregate stability.wet dry
2.2. Soil analyses
Carbon and nitrogen were analyzed by dry combustion with an automaticCrN-Analyzer. All carbon and nitrogen values of aggregate and density frac-
Ž . Ž .tions were calculated i as AcontentsB related to the fraction and ii asAamountsB related to the whole soil, taking into account the different sizes ofeach fraction. The lignin content and its stage of oxidative degradation wasdetermined in the bulk soil, the particle size fractions and all aggregate and
ŽPOM fractions with combined parallels using alkaline CuO oxidation Ertel and.Hedges, 1984 . A total of 500 mg of soil or 50 mg of POM was oxidized with
CuO and 2 M NaOH for 2 h at 1708C under a N atmosphere. The oxidation2
products were analyzed as trimethylsilyl derivates by capillary gas chromatogra-

( )J. Lehmann et al.rGeoderma 99 2001 147–168152
Ž .phy OV-1 column with a FID detector. The lignin contents were calculated asŽthe sum of the phenolic compounds vanillyl, syringyl and cumaryl compounds,
. Ž .VqSqC . The acid to aldehyde ratio ac-to-al indicates the extent of side-chain oxidation and was taken as an indicator of the degree of microbial
Ž . Ž .degradation of the lignin Ertel and Hedges, 1984 . Non-cellulosic NCS andŽ . Ž .cellulosic CS sugars were determined with the MBTH method Beudert, 1988
Ž .after sequential acid hydrolysis according to Miltner 1997 . Statistical analyseswere performed using linear regression and analyses of variance with a com-
Ž .pletely randomized design STATISTICA 5.0 . If effects were significant,Ž .means were compared to the least significant difference method LSD, p-0.05 .
3. Results and discussion
3.1. Weight, carbon and nitrogen distribution in SOM fractions
Most of the particles had clay and silt sizes, whereas only 20% and 10% ofŽ .the soil constituted of coarse and fine sand, respectively Fig. 3 . However,
when the aggregates were not disrupted but dry sieved, more than 80% of theŽsoil was larger than 250 mm 21% in the corresponding coarse sand size fraction
. Ž .with disruption and 38% in the 1–2 mm class Fig. 2 . Even with wet sieving,Ž .the aggregate separates larger than 250 mm amounted to 70% Fig. 3 . The
aggregate stability seemed to be very high in these soils compared to, e.g. a
Fig. 2. Aggregate size distribution of dry and wet fractionation without removal of primaryparticles as percentages of the whole soil from means of all sites in one replicate on the terra firme
Ž .near Manaus, Brazil ns10 ; means and standard errors.

( )J. Lehmann et al.rGeoderma 99 2001 147–168 153
Ž .Fig. 3. Average weight, carbon and nitrogen distribution in particle size left bar , density andŽ .aggregate size fractions right bar; wet fractionation of Ferralsols under different trees and cover
Ž . Ž . Žcrops in the central Amazon ns10 ; cS, coarse sand 0.25–2 mm ; fS, fine sand 0.02–0.25. Ž .mm ; SiqCl, silt and clay size fractions -0.02 mm ; aggregate sizes in millimeters; total bar
height denotes recovery.
Ž .Neufbois silty loam from Canada Angers and Giroux, 1996 . Even higheraggregate stability was described from a Ferralsol from Colombia, which had
Ž .only 10% of total soil in the aggregate fraction -250 mm Gijsman, 1996 .The carbon and nitrogen distribution across particle, density and aggregate
Žfractions shows this pattern even more strongly than the weight distribution Fig..3 : 68% of the organic C was found in clay and silt size separates, only 10% in
the coarse sand size fraction. When an aggregate fractionation was performed,however, less than 2% of the total soil carbon was found in the fraction -20mm, but more than 80% in aggregate fractions from 0.02 to 2 mm. The POMamounted to 15% of the soil organic carbon. The carbon distribution across
Ž . )aggregate separates changed i when primary particles and the POM wereŽ .separated or ii when merely the proportion of primary particles was deducted
Ž .Lehmann et al., 1998a . In both the actual separation of primary particles andthe calculation, the carbon distribution became more uniform between aggregate
Žseparates and increased only in the micro-aggregate fraction Lehmann et al.,. Ž1998a . This differed from the results of other authors Angers and Giroux,.1996 who found the same carbon distribution regardless of the separation of
primary particles.With our procedure of separating the primary particles with the sieve size of
the lower boundary of the respective aggregate class, the carbon contents onlyslightly decreased from larger to smaller aggregate fractions but increased in the
Ž .fraction 0.02–0.25 mm Table 1 . This is in contrast to results from a PeruvianAlisol with uniform carbon distribution between aggregate separates after cor-

()
J.Lehm
annet
al.rG
eoderma
992001
147–
168154
Table 1Carbon, nitrogen, lignin and carbohydrate contents in particle size, density, and aggregate size fractions of Ferralsols under different trees and cover
Ž .crops in the central Amazon ns10aSOM pools C N C-to-N VSC ac-to-al VSC-to-N CS NCS NCS-to-CS
y1 y1 y1 y1 y1w Ž .x Ž . Ž . Ž . Ž . Ž . Ž .fraction mm mg g mg g ratio mg g C Ratio ‰ mg g C mg g C ratio
Bulk soil 28.4 2.3 12.6 9.5 0.53 120 38.4 315 8.3
Particle size fractions:2–0.25 14.1 0.7 19.2 20.3 0.28 390 79.3 362 5.00.25–0.02 36.4 2.1 17.8 9.4 0.51 167 nd nd –-0.02 34.1 3.3 10.5 5.2 1.23 55 nd nd –
Density fraction:POM 299.2 12.4 24.6 15.6 0.31 384 26.4 252 9.6
Aggregate size fractions:2–1 26.4 2.3 11.6 13.9 0.48 161 nd nd –1–0.5 24.3 2.1 11.4 11.8 0.47 134 nd nd –0.5–0.25 27.4 2.9 9.4 7.8 0.67 73 nd nd –0.25–0.02 30.7 3.1 9.8 4.9 0.97 48 nd nd –-0.02 32.6 3.1 10.4 4.8 0.88 50 nd nd –
aVSC, lignin compounds; CS, cellulosic sugars; NCS, non-cellulosic sugars; ac-to-al ratio of acids to aldehydes of the vanillyl compounds.

( )J. Lehmann et al.rGeoderma 99 2001 147–168 155
Ž .recting for the sand content Elliott et al., 1991 . The increase of carbon in smallaggregate separates of our soils may indicate a relative carbon enrichment inmicro-aggregates as shown for a loamy but not a sandy Ferralsol from southern
Ž .Brazil Neufeldt et al., 1999 . These were also the same aggregate fractions,Žwhich showed the highest amounts of strongly humified, stable SOM see
.Section 3.2 .Ž .Gijsman 1996 found higher carbon contents and amounts with increasing
aggregate size, supporting the concept of SOM being the binding agent in largeŽ .aggregates Tisdall and Oades, 1982 . Our data do not confirm this hypothesis.
If this criterion is applied here, aggregates seemed not to be held togetherprimarily by organic matter in the studied Ferralsols.
3.2. Chemical properties of SOM pools
Ž .The lignin distribution Table 1 revealed that the coarse sand size fractionand POM mainly consisted of labile organic matter, i.e. weakly decomposed andhumified organic matter. High VSC contents and low ac-to-al ratios indicate low
Ž .oxidation of intact lignin Ertel and Hedges, 1984 . Furthermore, the aggregatefraction, 1–2 mm, also showed relatively high VSC contents compared to POMand the sand size separates. Therefore, undecomposed lignin was not only found
Ž .in POM as suggested by Metherell et al. 1993 but also in large aggregateseparates. With decreasing aggregate sizes, the VSC signatures decreased andthe ac-to-al ratios increased, indicating higher degrees of lignin decomposition
Žin smaller aggregate fractions. The same was found for the particle sizes Table. Ž1 , which is well documented for particle size fractions of tropical soils Bonde
et al., 1992; Guggenberger et al., 1995; Lehmann et al., 1998b; Koutika et al.,.1999 . The C-to-N ratios, however, were low in all aggregate classes in contrast
to particle size separates. Therefore, the aggregate fractions may have differedless among each other in their amount of microbial biomass than particle sizeseparates, and a large portion of POM was probably contained in the sand sizefraction. However, the aggregate separates were not simply differently sized anddevoid of POM, but also showed distinctly differing properties between eachother. Similar to the VSC contents, the ratios of VSC-to-N decreased towards
Ž .smaller aggregate sizes. Lehmann et al. 1998b showed that the polyphenol-to-Nratios of particle size separates changed more between size classes than theC-to-N ratios and sensitively indicated additions of organic material to soil.Therefore, weakly humified organic material similar to POM was bound inlarger aggregates in the studied Xanthic Ferralsol. This result was not an artifactby contamination with POM, since even the POM) was removed. However, theaverage particle size may have been different between aggregate fractions andmay invalidate the conclusion that humification progresses from larger tosmaller aggregate fractions, because larger particle size fractions usually containless humified organic matter. The high proportion of clay-associated carbon of

( )J. Lehmann et al.rGeoderma 99 2001 147–168156
70%, however, suggests that the chemical properties, even of clay-boundcarbon, were different between aggregate fractions.
The POM and the coarse sand size fraction had very similar carbon andŽ . Ž .nitrogen pool sizes Fig. 3 as well as ac-to-al and VSC-to-N ratios Table 1 .
The proportion of VSC lignin and carbohydrates of total carbon, however, washigher in the sand than in POM. This result has to be interpreted with caution, asthe extraction of the carbohydrates may be incomplete in pure plant material.
The aggregate fractionation revealed that the formation of water-stable aggre-gates increased the incorporation of fresh organic matter with high VSC valuesinto more stable organic matter associated with finer particle sizes. Therefore,soil aggregation was shown to be an important process for the stabilization ofSOM in the studied Ferralsols. The importance of micro-aggregation for SOM
Ž .stabilization was also stressed by Shang and Tiessen 1997 for semi-aridFerralsols in northeastern Brazil, but aggregate protection of SOM was muchweaker than in the studied central Amazonian Ferralsols.
3.3. SensitiÕe indicators of land-use changes
The carbon and nitrogen contents of POM and the coarse sand size fractiongenerally varied more between sites than other soil fractions, nitrogen slightly
Ž .less than carbon Table 2 . Therefore, POM and the coarse sand size fractioncan be used as sensitive indicators of single-tree effects on SOM. These
Table 2w Ž .xCoefficients of variation CV % standard deviation of mean of the carbon and nitrogen contents
in particle size, density, and aggregate size separates as indicators for the sensitivity of therespective organic matter pools of a Xanthic Ferralsol concerning land-use changes in the central
Ž .Amazon ns10
w Ž .xSOM pools fraction mm Carbon Nitrogen
Bulk soil 18 10
Particle size fractions:Ž .Coarse sand 2–0.25 67 49
Ž .Fine sand 0.25–0.02 45 46Ž .Siltqclay -0.02 17 16
Density fraction:POM 64 59
Aggregate size fractions:2–1 12 161–0.5 20 140.5–0.25 25 180.25–0.02 16 9-0.02 21 20

( )J. Lehmann et al.rGeoderma 99 2001 147–168 157
fractions were mainly constituted of weakly altered plant material as seen fromthe high proportion of intact lignin. Although POM amounted to only 15% of
Ž .the total soil organic carbon, it was significantly p-0.001; Table 3 related toŽ .total soil organic carbon. This did not hold for the sand fraction Table 3 . The
performed correlation seemed valid, because the relationship of POM with theŽ .remaining soil carbon pool excluding POM was significant p-0.05 , but not
coarse sand carbon and the sum of fine sand, silt, and clay carbon. Thus, thePOM fraction was a better indicator for SOM changes than the coarse sand sizefraction in the Ferralsols at our site. This may not only indicate that the effectsof trees on SOM were sensitively reflected by POM carbon contents but alsothat SOM replenishment was related to POM in a functional sense. Higheramounts of POM carbon resulted in a higher incorporation of organic matter intothe more stable SOM pools, which was promoted by the formation of aggre-gates.
Ž .Barrios et al. 1996 found the light fraction with a density of less than 1.13Mg my3 to be most suitable for detecting effects of land-use on SOM in an
Ž .Alfisol in Kenya. Guggenberger et al. 1995 , however, reported the sand sizeseparates to be a sensitive indicator of land-use change from native savanna topasture on a Ferralsol. Information on which method is better suited for differenttypes of organic matter input and for different soils, can rarely be drawn fromthe available literature because comparisons between methods have seldom been
Ž .done e.g. Shang and Tiessen, 1997 .
Table 3Correlation coefficients and levels of significance of the relationship between the organic matter
Ž .composition in the bulk soil, the POM, and the coarse sand size fraction with either i the ratio ofŽ .MWD from MWD -to-MWD or ii the bulk soil organic carbon content for a Xanthicwet dry
Ž .Ferralsol in the central Amazon ns25aFraction Soil compounds MWD -to-MWD Bulk soil Cwet dry
Bulk soil C amount 0.07 ns np)))CS 0.03 ns y0.65
NCS y0.36 ns y0.28 ns))VSC 0.39 ns 0.58)))POM C amount 0.06 ns 0.91
)CS 0.43 y0.29 nsNCS y0.30 ns y0.27 nsVSC 0.24 ns y0.28 ns
b Ž .Coarse sand 2–1 mm C amount 0.25 ns 0.58 nsVSC nd 0.09 ns
ns, Not significant; nd, not determined; and np, not performed interaction.aCS, cellulosic sugars; NCS, non-cellulosic sugars; VSC, lignin compounds.bns10.) p-0.05.) ) p-0.01.) ) ) p-0.001.
( )J. Lehmann et al.rGeoderma 99 2001 147–168158
Short-term effects of organic inputs are most likely to be found in the lightŽorganic matter fractions, and are minimal in stable SOM fractions Lehmann et
.al., 1998b . However, high inputs of organic matter can increase carbon contentsŽeven in clay size separates as shown with manure in Kenya Lehmann et al.,
. Ž .1997 and in Tanzania Solomon et al., 2000 or deplete them as shown from aŽ .Victorian grey clay in Australia Golchin et al., 1995 . In the different cultiva-
tion systems with an age of 4–5 years in our study, significant effects of thetrees on stable SOM were not expected. For the studied single-tree effects onSOM of the Ferralsols, the determination of the POM seemed to be sufficient foran estimation of SOM replenishment. An advantage of POM determinations arealso their easier analytical procedure than particle size fractionations in stronglyaggregated Ferralsols. The dispersion of aggregates for a particle size fractiona-tion without redistributing SOM may pose considerable difficulties and needs tobe verified for each analysis.
3.4. SOM and aggregate stability
The relationship of the organic compounds in physical SOM pools withaggregate stability was investigated to elucidate the driving forces of aggrega-tion and possible effects of trees. No positive relations could be found betweenorganic carbon contents in physical SOM pools and aggregate stability ex-
Žpressed as the reduction of MWD by wet sieving Table 3; only bulk soil, POM,.and coarse sand size fraction shown . A weak correlation was determined for the
Ž .CS sugar content of POM carbon and aggregate stability Table 3 . Polysaccha-Žrides may indeed act as a binding agent for clay minerals Chenu and Guerif,
.1991 . The differences of aggregate stability in the studied soils, however, weresmall and did not change due to the effect of single trees, not even incomparison to the primary forest sites. The aggregation seemed not to beincreased by an input of organic matter, which leads us to the conclusion thataggregation and organic matter were not related in the studied Ferralsols as
Ž .already assumed above. Golchin et al. 1995 , however, could demonstrate thatthe occluded POM) correlated with aggregate stability; this was not able to
Ž .explain the effects of trees on aggregation in our soils data not shown . Ourresults are also in contrast to reports from a Cerrado Ferralsol which showedsignificant and close relationships between SOM, POM, sugar contents and
Ž . Ž .aggregate stability Neufeldt et al., 1999 . Castro Filho et al. 1998 also found aclose relationship of soil organic carbon and aggregate stability in a Ferralsol ofthe Parana state. Over a wide range of soils, however, no consistent conclusionon the effects of SOM properties on aggregation could be gathered, as shown by
Ž .Feller and Beare 1997 .Apart from organic matter, Fe and Al complexation may also play an
important role in SOM stabilization within aggregates of Ferralsols in contrast toŽ . Ž .temperate soils Gijsman, 1996 . Oades and Waters 1991 even stated that

( )J. Lehmann et al.rGeoderma 99 2001 147–168 159
micro-aggregation of Ferralsols are generally controlled by oxides. Complexa-tion by oxides was not the main reason for the aggregation of Cerrado FerralsolsŽ .Neufeldt et al., 1999 but the soils in the central Amazon possess completelydifferent mineralogy and chemical properties than those of the Cerrado. Theycontain more kaolinite, have lower pH and higher Al saturation than Cerrado
Ž .Ferralsols Dematte and Dematte, 1993 . Aggregating effects of SOM may beˆ ˆlimited under low pH conditions and high Al saturation in the Amazon, whereasthe high contents of Fe and Al oxides in the Cerrado soils form strong
Ž .complexes with the SOM as described by Boudot et al. 1989 .
3.5. Single-tree effects on aggregation and sensitiÕe SOM pools
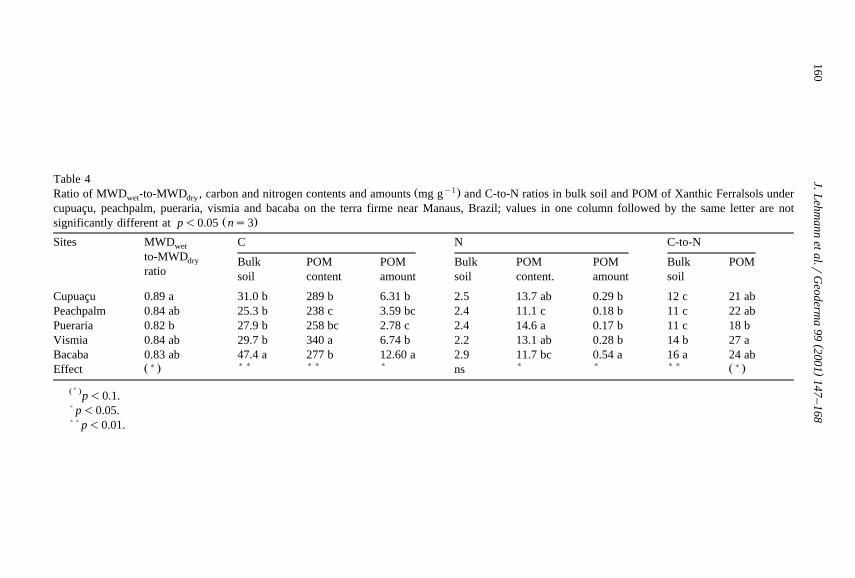
The aggregate stability was significantly higher in soils under cupuacu thanŽ .under pueraria, the other sites being in between Table 4 . As it was expected
from the results described above, high aggregate stability could not be explainedŽ . Ž .with any investigated physical Table 4 or chemical SOM pool Table 5 .
Ž .Castro Filho et al. 1998 concluded from long-term experiments in easternBrazil that litter input with high C-to-N ratios increased aggregate stability. Thiswould explain the higher aggregate stability of soils under cupuacu in compari-son to the other agroforestry species, but not in comparison to the fallow andprimary forest sites.
Bulk soil SOM was significantly higher in the primary forest under bacabaŽ .than at all other sites Table 4 . Differences in POM amounts were a lot clearer
than those in the bulk soil. Soils from bacaba sites had 4.5 times more POMthan soils under pueraria. Cupuacu was also more efficient in replenishing POM
Ž . Ž .pools than pueraria p-0.05 and peachpalm non-significant . The carboncontents of the aggregate fractions did not show the differences between sites as
Ž .clearly as the carbon contents of POM, but with the same trends Table 6 .Among the aggregate separates, the fraction, 0.25–0.5 mm, showed the single-tree effects the most, being also the fraction where carbon contents increased the
) Ž .most by separating POM and the primary particles Lehmann et al., 1998a .The bulk soil nitrogen contents were not significantly different between sites,
but single trees showed significant effects on POM nitrogen contents andŽ .amounts Table 4 . Soils under pueraria had high POM nitrogen contents, which
Ž .could be explained by its high foliar and root nitrogen contents Table 7 . Due tothe low amount of POM, however, the nitrogen amounts of pueraria soils werelow. On the other hand, the nitrogen contents in the fraction, 0.25–0.5 mm,were significantly higher under pueraria than at the other sites apart from bacabaŽ .Table 6 . The high quality of the pueraria litter with low C-to-N and polyphe-
Ž .nol-to-N ratios Table 7 probably led to a high carbon and nitrogen mineraliza-tion, which was the reason for the rapid incorporation of nitrogen into aggre-gates and the low total amount of POM under pueraria. The high nitrogencontent in the POM of the pueraria soils may explain the high nitrogen
()
J.Lehm
annet
al.rG
eoderma
992001
147–
168160
Table 4Ž y1.Ratio of MWD -to-MWD , carbon and nitrogen contents and amounts mg g and C-to-N ratios in bulk soil and POM of Xanthic Ferralsols underwet dry
cupuacu, peachpalm, pueraria, vismia and bacaba on the terra firme near Manaus, Brazil; values in one column followed by the same letter are notŽ .significantly different at p-0.05 ns3
Sites MWD C N C-to-Nwet
to-MWDdry Bulk POM POM Bulk POM POM Bulk POMratio soil content amount soil content. amount soil
Cupuacu 0.89 a 31.0 b 289 b 6.31 b 2.5 13.7 ab 0.29 b 12 c 21 abPeachpalm 0.84 ab 25.3 b 238 c 3.59 bc 2.4 11.1 c 0.18 b 11 c 22 abPueraria 0.82 b 27.9 b 258 bc 2.78 c 2.4 14.6 a 0.17 b 11 c 18 bVismia 0.84 ab 29.7 b 340 a 6.74 b 2.2 13.1 ab 0.28 b 14 b 27 aBacaba 0.83 ab 47.4 a 277 b 12.60 a 2.9 11.7 bc 0.54 a 16 a 24 ab
)) )) ) ) ) ))) )Ž . Ž .Effect ns
Ž) .p-0.1.) p-0.05.) ) p-0.01.

()
J.Lehm
annet
al.rG
eoderma
992001
147–
168161
Table 5Lignin, ac-to-al ratio, CS and NCS sugars in bulk soil and POM of Xanthic Ferralsols under cupuacu, peachpalm, pueraria, vismia and bacaba on the
Ž .terra firme near Manaus, Brazil; values in one column followed by the same letter are not significantly different at p-0.05 ns3a y1 a a y1 a y1Ž . Ž . Ž . Ž .Sites VSC mg g C ac-to-al ratio VSC-to-N ‰ CS mg g C NCS mg g C NCS-to-CS ratio
Bulk POM Bulk POM Bulk POM Bulk POM Bulk POM Bulk POM
Cupuacu 16.8 ab 30.9 ab 0.36 0.22 209 b 650 bc 45.6 a 29.1 a 263 181 c 5.9 c 6.2 bPeachpalm 18.2 ab 42.8 a 0.57 0.24 196 b 895 b 39.6 a 30.8 a 352 320 a 9.1 bc 11.0 aPueraria 14.8 b 29.2 ab 0.48 0.24 170 b 497 bc 38.4 a 25.5 ab 313 258 ab 8.7 bc 10.2 aVismia 16.1 ab 17.7 b 0.34 0.24 220 b 458 c 27.8 b 22.1 b 412 184 c 15.0 ab 8.3 abBacaba 25.2 a 43.4 a 0.37 0.25 407 a 1014 a 15.0 c 20.9 b 289 213 b 19.7 a 10.2 a
) )) ))) ) )) )) ) )Ž . Ž . Ž .Effect ns ns ns
ns, Not significant.aVSC, lignin compounds; CS, cellulosic sugars; NCS, non-cellulosic sugars; ac-to-al ratio of acids to aldehydes of the vanillyl compounds.Ž) .p-0.1.) p-0.05.) ) p-0.01.) ) ) p-0.001.

( )J. Lehmann et al.rGeoderma 99 2001 147–168162
Table 6Carbon and nitrogen contents of aggregate fractions with 2–1, 1–0.5, 0.5–0.25, 0.25–0.02 and-0.02 mm diameter of Xanthic Ferralsols under cupuacu, peachpalm, pueraria, vismia and
Ž .bacaba on the terra firme near Manaus, Brazil; means and level of significance ns3 ; values inone row followed by the same letter are not significantly different at p-0.05
Ž .Fraction mm Cupuacu Peachpalm Pueraria Vismia Bacaba Effect
Carbon 2–1 25.9 25.8 28.6 28.8 31.6 ns1–0.5 26.6 21.0 22.8 22.9 29.8 ns
))0.5–0.25 18.2 bc 16.0 bc 20.9 b 13.8 c 27.6 a)0.25–0.02 34.2 b 27.7 b 29.7 b 35.5 b 53.8 a
-0.02 37.7 29.4 33.6 38.2 38.9 nsNitrogen 2–1 2.43 2.44 2.77 2.56 2.62 ns
1–0.5 2.46 2.03 2.18 2.05 2.40 ns)0.5–0.25 1.76 ab 1.60 b 2.16 a 1.30 b 2.22 a
0.25–0.02 2.98 2.59 2.73 2.92 3.72 ns-0.02 3.55 3.05 3.62 3.39 3.48 ns
C-to-N ratio 2–1 10.7 10.6 10.3 11.2 12.0 ns)1–0.5 10.8 b 10.3 b 10.5 b 11.1 b 12.4 a)0.5–0.25 10.4 b 10.0 b 9.7 b 10.6 b 12.5 a))0.25–0.02 11.2 10.5 10.6 11.7 13.9
-0.02 10.6 9.6 9.3 11.3 11.2 ns
ns, Not significant.) Significant at p-0.05.) ) Significant at p-0.01.
mineralization rates under pueraria compared to soils under cupuacu and peach-Ž . 15palm measured at the same site E. Salazar, unpublished data . With N-labeled
Ž .leaves, Vanlauwe et al. 1998 could show that litter N of Leucaena leuco-cephala was mainly found in the light fraction of the sand size separates 53 days
Ž .after application 60% , but consecutively decreased and was mainly recoveredŽ .in the silt and clay fractions at 858 days after application 80% .
Table 7Nitrogen, polyphenol contents, C-to-N and polyphenol-to-N ratios of cupuacu, peachpalm, puer-
Ž .aria and vismia leaves and roots diameter -2 mm from 0–0.1-m depthy1 y1Ž . Ž .Sites N mg g Polyphenol mg g C-to-N ratio Polyphenol-to-N ratio
Cupuacu Leaves 17.7 10.0 28.3 0.57Roots 7.8 10.4 59.2 1.33
Peachpalm Leaves 39.2 11.3 11.8 0.29Roots 7.4 2.6 60.5 0.35
Pueraria Leaves 46.2 16.6 8.9 0.36Roots 13.4 3.0 33.4 0.22
Vismia Leaves 13.8 29.7 33.2 2.15Roots 9.7 19.6 46.3 2.02
( )J. Lehmann et al.rGeoderma 99 2001 147–168 163
The opposite was observed for bacaba at our site, where POM nitrogencontents were low but the amounts were high. The long-term organic matter andnitrogen input into the soils under primary forest increased carbon and nitrogencontents in bulk soil and POM amounts. Low litter quality may have promotedthe SOM accumulation in POM and the whole soil. Thus, soils under bacabapossessed high contents of unoxidized lignin together with high VSC-to-N and
ŽC-to-N ratios but low carbohydrate contents in POM and total SOM Tables 4.and 5 . This may serve as a way of nutrient preservation in order to release only
as many nutrients as needed for plant growth. That high amounts of mineralnitrogen were found in the subsoil of the primary forest sites compared to the
Ž .secondary forest Schroth et al., 1999 emphasizes the need for a temporarynutrient sink in SOM.
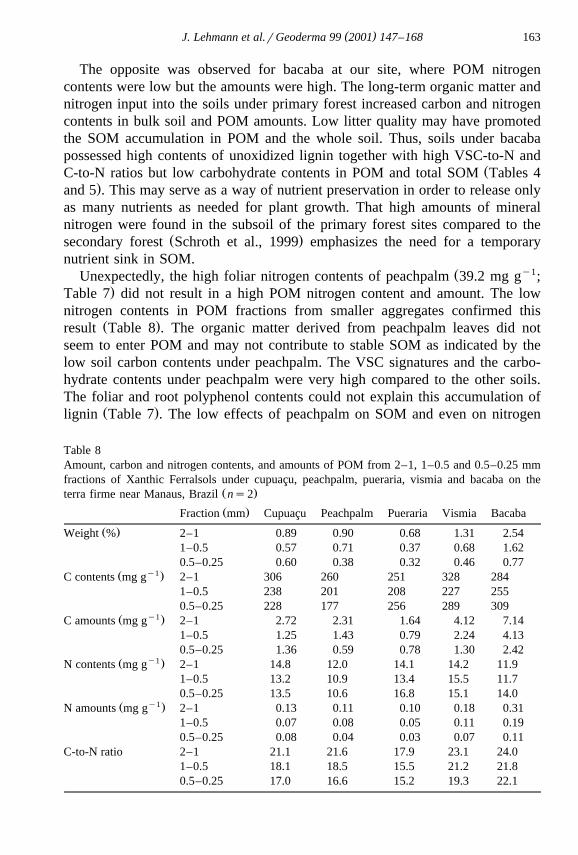
Ž y1Unexpectedly, the high foliar nitrogen contents of peachpalm 39.2 mg g ;.Table 7 did not result in a high POM nitrogen content and amount. The low
nitrogen contents in POM fractions from smaller aggregates confirmed thisŽ .result Table 8 . The organic matter derived from peachpalm leaves did not
seem to enter POM and may not contribute to stable SOM as indicated by thelow soil carbon contents under peachpalm. The VSC signatures and the carbo-hydrate contents under peachpalm were very high compared to the other soils.The foliar and root polyphenol contents could not explain this accumulation of
Ž .lignin Table 7 . The low effects of peachpalm on SOM and even on nitrogen
Table 8Amount, carbon and nitrogen contents, and amounts of POM from 2–1, 1–0.5 and 0.5–0.25 mmfractions of Xanthic Ferralsols under cupuacu, peachpalm, pueraria, vismia and bacaba on the
Ž .terra firme near Manaus, Brazil ns2
Ž .Fraction mm Cupuacu Peachpalm Pueraria Vismia Bacaba
Ž .Weight % 2–1 0.89 0.90 0.68 1.31 2.541–0.5 0.57 0.71 0.37 0.68 1.620.5–0.25 0.60 0.38 0.32 0.46 0.77
y1Ž .C contents mg g 2–1 306 260 251 328 2841–0.5 238 201 208 227 2550.5–0.25 228 177 256 289 309
y1Ž .C amounts mg g 2–1 2.72 2.31 1.64 4.12 7.141–0.5 1.25 1.43 0.79 2.24 4.130.5–0.25 1.36 0.59 0.78 1.30 2.42
y1Ž .N contents mg g 2–1 14.8 12.0 14.1 14.2 11.91–0.5 13.2 10.9 13.4 15.5 11.70.5–0.25 13.5 10.6 16.8 15.1 14.0
y1Ž .N amounts mg g 2–1 0.13 0.11 0.10 0.18 0.311–0.5 0.07 0.08 0.05 0.11 0.190.5–0.25 0.08 0.04 0.03 0.07 0.11
C-to-N ratio 2–1 21.1 21.6 17.9 23.1 24.01–0.5 18.1 18.5 15.5 21.2 21.80.5–0.25 17.0 16.6 15.2 19.3 22.1

( )J. Lehmann et al.rGeoderma 99 2001 147–168164
contents in POM may be explained by the low total amounts of leaf littercompared to pueraria, low nitrogen contents in roots and low root abundance at
Ž .the soil surface 0–5 cm producing small amounts of litter with low polyphe-Ž .nol-to-N ratios Table 7 .
The soil carbon replenishment under cupuacu was characterized by anenrichment of low degradable litter with low nitrogen contents and high C-to-Nand polyphenol-to-N ratios compared to the other agroforestry tree speciesŽ .Tables 5 and 7 . The POM lignin and plant-derived sugars also made up a largeproportion of the carbon, whereas the contents of microbially derived sugarswere lowest among all sites. In POM, as well as in the bulk soil, the ratio ofNCS-to-CS was lowest under cupuacu, indicating a low microbial degradation
Ž .of plant litter. Accordingly, McGrath 1998 found more than 60% of cupuacubut less than 30% of peachpalm litter undecomposed in a litterbag study after 1year.
High NCS-to-CS ratios were found in the bulk soils of the primary andsecondary forest sites indicating a high proportion of microbially derived sugars,
Ž .which hints at high microbial activity Table 5 . On the other hand, the C-to-Nratios were significantly higher than below the trees in the agroforestry systemsŽ .Table 4 , which would hint at low decomposition rates and an accumulation ofplant material. The low C-to-N ratios of soils in the agroforestry systemŽ .cupuacu, peachpalm, and pueraria were mainly caused by fertilization andbiological nitrogen fixation of the pueraria. The added fertilizer nitrogen did notlower the C-to-N ratios of the POM, whereas the fixed nitrogen of the puerariaactually decreased the POM C-to-N ratios. However, despite these nitrogenadditions to soil, more weakly decomposed plant material accumulated in theagroforestry system than in the primary and secondary forest sites, as seen fromthe NCS-to-CS ratios. One reason may be a lower soil fauna abundanceŽ .Rombke et al., 1999 in the agroforestry system than in the primary forest.¨
3.6. Processes of SOM replenishment in Ferralsols of the central Amazon
Partially decomposed leaves and roots become the POM. POM decomposi-tion and humification progressed from POM associated with large aggregates tothose associated with small aggregate fractions with decreasing C-to-N ratiosŽ .Table 8 . The carbon and nitrogen POM amounts generally decreased withdecreasing aggregate size. The POM associated with small aggregate separatesŽ .0.25–0.5 mm was largely humified plant material, whereas POM from large
Ž .aggregates 1–2 mm mainly consisted of leaf and root debris. In aggregateseparates smaller than 0.25 mm, no POM could be isolated.
Carbon or nitrogen distribution in different POM size fractions showed thesame differences between sites as whole POM contents. Differences in smaller
Ž .POM fractions 0.25–0.5 mm between sites should indicate different effects oftrees on stable SOM replenishment, whereas differences in larger POM fractions

( )J. Lehmann et al.rGeoderma 99 2001 147–168 165
rather indicate different tree effects on soil nutrient availability. For mostpurposes, a separation of whole POM will be sufficient to evaluate single-treeeffects on SOM.
During decomposition and humification, the added organic material wasincorporated into larger aggregates and successively into smaller aggregates,which was shown by soil chemical analyses. This result supports the hierarchical
Ž .model of aggregation of Tisdall and Oades 1982 , which could not be verifiedby using only the carbon distribution in aggregate separates. The strongly
Ž .humified POM is incorporated into the fraction 0.25–0.5 mm, since i it) Ž .contained the highest proportion of POM , ii no significant amounts of visible
Ž .POM smaller than 0.25 mm were found, and iii the smaller fraction, 0.02–0.25mm, showed the highest carbon contents of all aggregate fractions. This wasalso confirmed by the shift of the VSC values, ac-to-al, VSC-to-N and C-to-N
Ž .ratios from the aggregates 0.5–1 to 0.25–0.5 mm Table 1 .
4. Conclusions
Using aggregate fractionation, together with the chemical characterization ofSOM, the processes of incorporation of plant litter into stable SOM could besuccessfully studied in the strongly aggregated Ferralsols of the terra firme nearManaus. Thus, it could be shown that aggregation promoted the stabilization ofSOM, but differences in SOM amounts were not related to aggregate stability.The POM was an important and valid indicator of the effects of different organicinputs on SOM properties. It could be used for assessing the effects of singletrees on SOM of the studied Ferralsols. In the fraction 0.25–0.5 mm, stronglyhumified POM was incorporated into aggregates. This was the aggregatefraction most sensitive to land-use changes.
Cupuacu increased SOM contents in comparison to peachpalm or pueraria,which could be related to the low quality organic matter of cupuacu litter.Despite the similarly low foliar C-to-N ratios of peachpalm and pueraria,peachpalm did not replenish nitrogen contents of the labile SOM.
The investigation of factors controlling humification should be intensified.The relationship between aggregation and SOM is still poorly understood butcould yield relevant information about SOM stabilization in these stronglyaggregated soils.
Acknowledgements
We thank Gotz Schroth and Wulf Amelung for obtaining the samples, Anja¨Miltner, Eleini Catini, Frank v. Willert, Martin Braun and Anja Winkler for theirhelp in the laboratory. This work was funded by the German Ministry of

( )J. Lehmann et al.rGeoderma 99 2001 147–168166
Ž . ŽEducation, Science and Technology BMBF under the SHIFT program No..0339641 .
References
Angers, D.A., Giroux, M., 1996. Recently deposited organic matter in soil water-stable aggre-gates. Soil Sci. Soc. Am. J. 60, 1547–1551.
Barrios, E., Buresh, R.J., Sprent, J.I., 1996. Organic matter in soil particle size and densityfractions from maize and legume cropping systems. Soil Biol. Biochem. 28, 185–193.
Beudert, G., 1988. Mikromorphologische, naßchemische und 13C-NMR-spektroskopische Kennze-ichnung der organischen Substanz von Waldhumusprofilen nach Dichtefraktionierung.Bayreuther Bodenkundliche Berichte, Bayreuth, Germany vol. 8.
Bonde, T.A., Christensen, B.T., Cerri, C.C., 1992. Dynamics of soil organic matter as reflected bynatural 13C abundance in particle size fractions of forested and cultivated oxisol organic matter.Soil Biol. Biochem. 23, 275–277.
Boudot, J.-P., Bel Hadj, B.A., Steiman, R., Seigle-Murandi, F., 1989. Biodegradation of syntheticorgano-metallic complexes of iron and aluminium with selected metal to carbon ratios. SoilBiol. Biochem. 21, 961–966.
Castro Filho, C., Muzilli, O., Podanoschi, A.L., 1998. Estabilidade dos aggregados e sua relacao˜com teor de carbono organico num latossolo roxo distrofico, em funcao de sistemas de plantıo,ˆ ´ ˜ ´rotacoes de culturas e metodos de preparo das amostras. R. Bras. Ci. Solo 22, 527–538.˜ ´
Chenu, C., Guerif, J., 1991. Mechanical strength of clay minerals as influenced by an adsorbedpolysaccharide. Soil Sci. Soc. Am. J. 55, 1076–1080.
Christensen, B.T., 1992. Physical fractionation of soil and organic matter in primary particle sizeand density separates. Adv. Soil Sci. 20, 1–90.
Coleman, J., Oades, J.M., Uehara, G., 1989. Dynamics of Soil Organic Matter in TropicalEcosystems. Univ. Hawaii Press, Hawaii.
Cravo, M.S., Smyth, T.J., 1997. Manejo sustentado da fertilidade de um latossolo da amazoniaˆcentral sob cultivos successivos. R. Bras. Ci. Solo 21, 607–616.
Degens, B.P., 1997. Macro-aggregation of soils by biological bonding and binding mechanismsand the factors affecting these: a review. Aust. J. Soil Res. 35, 431–459.
Dematte, J.L.I., Dematte, J.A.M., 1993. Comparacoes entre as propriedades quımicas de solos dasˆ ˆ ˜ ´Ž .regioes da floresta Amazonica e do Cerrado do Brasil Central. Sci. Agric. Piracicaba, Braz.˜ ˆ
50, 272–286.Elliott, E.T., Palm, C.A., Reuss, D.E., Monz, C.A., 1991. Organic matter contained in soil
aggregates from a tropical chronosequence: correction for sand and light fraction. Agric.Ecosyst. Environ. 34, 443–451.
Ertel, J.R., Hedges, J.I., 1984. The lignin component of humic substances: distribution among soilsedimentary humic, fulvic and base-insoluble fractions. Geochim. Cosmochim. Acta 48,2065–2074.
FAO, 1990. Soil Map of the World, Revised Legend. FAO, Rome, Italy.Feller, C., Beare, M.H., 1997. Physical control of soil organic matter dynamics in the tropics.
Geoderma 79, 69–116.Gijsman, A.J., 1996. Soil aggregate stability and soil organic matter fractions under agropastoral
systems established in native savanna. Aust. J. Soil Res. 34, 891–907.Golchin, A., Clark, P., Oades, J.M., Skjemstad, J.O., 1995. The effects of cultivation on the
composition of organic matter and structural stability of soils. Aust. J. Soil Res. 33, 975–993.Guggenberger, G., Zech, W., Thomas, R.J., 1995. Lignin and carbohydrate alteration in particle

( )J. Lehmann et al.rGeoderma 99 2001 147–168 167
size separates of an oxisol under tropical pasture following native grassland. Soil Biol.Biochem. 27, 1629–1638.
Ž .Kemper, W.D., Rosenau, R.C., 1987. Aggregate stability and size distribution. In: Klute, A. Ed. ,Methods of Soil Analysis, Part 1: Agronomy Monograph, vol. 9, pp. 425–442, Madison.
Koutika, L.S., Andreux, F., Hassink, J., Chone, T., Cerri, C.C., 1999. Characterization of organicmatter in topsoils under rain forest and pasture in the eastern Amaon basin. Biol. Fertil. Soils29, 309–313.
Lehmann, J., Kuper, U., Zech, W., 1997. Organic matter properties of soils with varying land use¨Ž .in a semiarid tropical environment. In: Drozd, J., Gonet, S., Senesi, N., Weber, J. Eds. , The
Role of Humic Substances in the Ecosystems and Environment Protection. Polish Society ofHumic Substances, Wroclaw, pp. 399–406.
Lehmann, J., Cravo, M., Zech, W., 1998a. Determination of ecologically relevant pools for soilŽ .organic matter stability in terra firme oxisols. In: Lieberei, R., Bianchi, H., Voß, K. Eds. ,
Proceedings of the Third SHIFT-Workshop, Manaus 1998. GKSS, Geesthacht, pp. 441–452.Lehmann, J., Poidy, N., Schroth, G., Zech, W., 1998b. Short-term effects of soil amendment with
legume tree biomass on carbon and nitrogen in particle size separates in central Togo. SoilBiol. Biochem. 30, 1545–1552.
McGrath, D.A., 1998. Ecological sustainability in Amazonian agroforests: an on-farm study ofphosphorus and nitrogen dynamics following native forest conversion. PhD Thesis, Universityof Florida, Gainesville, USA.
Metherell, A.K., Harding, L.A., Cole, C.V., Parton, W.J., 1993. CENTURY soil organic mattermodel environment. Technical Documentation Agroecosystems Version 4.0. Great PlainsSystem Research Unit, Technical Report No. 4. Fort Collins, CO.
Miltner, A., 1997. Umsetzung organischer Bodensubstanz unter dem Einfluß von Mineralphasen.Bayreuther Bodenkundliche Berichte, Bayreuth, Germany vol. 52.
Neufeldt, H., Ayarza, M., Resck, D.V.S., Zech, W., 1999. Distribution of water-stable aggregatesand aggregating agents in Cerrado Oxisols. Geoderma 93, 85–99.
North, P.F., 1976. An absolute measurement of soil structural stability using ultrasound. J. SoilSci. 27, 451–459.
Oades, J.M., Waters, A.G., 1991. Aggregate hierarchy in soils. Aust. J. Soil Res. 29, 815–828.Rhoades, C.C., 1997. Single-tree influences on soil properties in agroforestry: lessons from natural
forests and savanna ecosystems. Agrofor. Syst. 35, 71–94.Rombke, J., Meller, M., Garcia, M., 1999. Earthworm densities in central Amazonian primary and¨
secondary forests and a polyculture forest plantation. Pedobiologia 43, 518–522.Schroth, G., da Silva, L., Seixas, R., Teixeira, W.G., Macedo, J.L.V., Zech, W., 1999. Subsoilˆ
accumulation of mineral nitrogen under polyculture and monoculture plantations, fallow andprimary forest in a ferralitic Amazonian upland soil. Agric. Ecosyst. Environ. 75, 109–120.
Seyfried, M.S., Rao, P.S.C., 1991. Nutrient leaching loss from two contrasting cropping systemsŽ .in the humid tropics. Trop. Agric. Trinidad 68, 9–18.
Shang, C., Tiessen, H., 1997. Organic matter lability in a tropical oxisol: evidence from shiftingcultivation, chemical oxidation, particle, density, and magnetic fractions. Soil Sci. 162,795–807.
Solomon, D., Lehmann, J., Zech, W., 2000. Land use effects on soil organic matter compositionof chromic Luvisols in the semi arid tropics: carbon, nitrogen, lignin and carbohydrates. Agric.Ecosyst. Environ. 78, 203–213.
Tiessen, H., Stewart, J.W.B., 1983. Particle-size fractions and their use in studies of soil organicmatter: II. Cultivation effects on organic matter composition in size fractions. Soil Sci. Soc.Am. J. 47, 509–513.
Tisdall, O.M., Oades, J.M., 1982. Organic matter and water-stable aggregates in soils. J. Soil Sci.33, 141–163.

( )J. Lehmann et al.rGeoderma 99 2001 147–168168
Vanlauwe, B., Sanginga, N., Merckx, R., 1998. Soil organic matter dynamics after addition ofnitrogen-15-labeled leucaena and dactyladenia residues. Soil Sci. Soc. Am. J. 62, 461–466.
Yoder, R.E., 1936. A direct method of aggregate analysis of soils and a study of the physicalnature of soil erosion losses. J. Am. Soc. Agron. 28, 337–351.
Zech, W., Senesi, N., Guggenberger, G., Kaiser, K., Lehmann, J., Miano, T.M., Miltner, A.,Schroth, G., 1997. Factors controlling humification and mineralization of soil organic matter inthe tropics. Geoderma 79, 117–161.