Oregon's Timber History
14
Historical Look at Oregon’s Wood Products Industry September 2017 Oregon Office of Economic Analysis
-
Upload
oregon-office-of-economic-analysis -
Category
Economy & Finance
-
view
4.156 -
download
0
Transcript of Oregon's Timber History

Historical Look at Oregon’s Wood Products Industry
September 2017
Oregon Office of Economic Analysis
Oregon Office of
Economic Analysis2
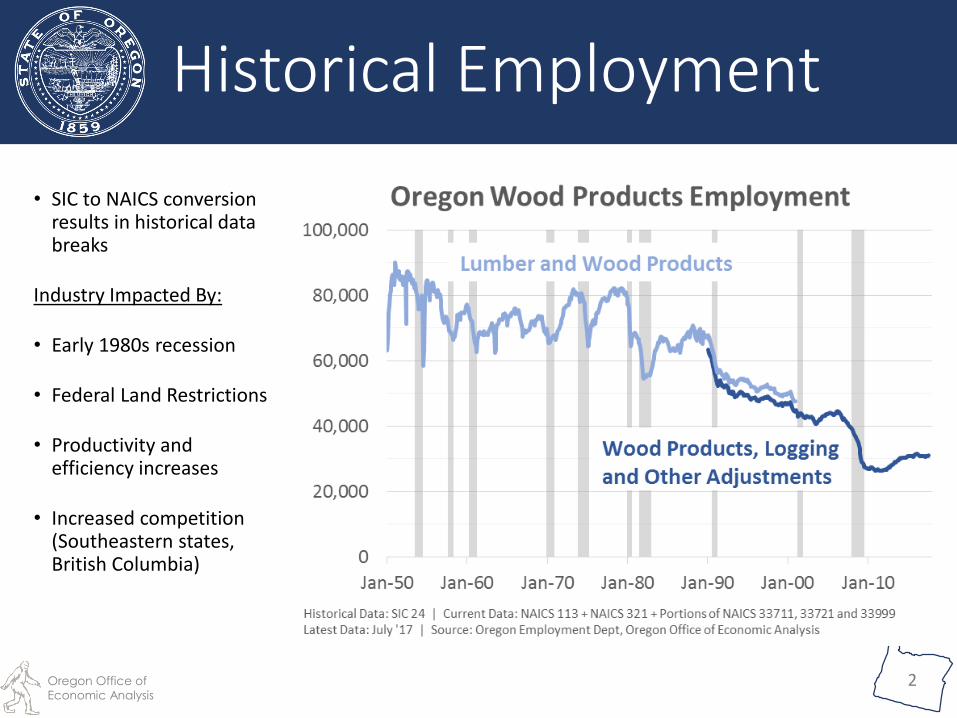
Historical Employment
• SIC to NAICS conversion results in historical data breaks
Industry Impacted By:
• Early 1980s recession
• Federal Land Restrictions
• Productivity and efficiency increases
• Increased competition (Southeastern states, British Columbia)

Oregon Office of
Economic Analysis3
Oregon Wood Products Employment
Data Not Perfectly Compatible: 1978 Lumber and Wood Products (SIC 24), 2015 Wood Products + Logging (NAICS 321, 113)Source: Oregon Employment Department, Oregon Office of Economic Analysis
1978: 81,400
500 - 1,000
> 5,000
3 – 5,000
1 - 3,000
200 - 500
< 200
No Data
2016: 29,000
Number of Jobs
County Employment

Oregon Office of
Economic Analysis4
Oregon Wood Products EmploymentShare of All Private Sector Jobs
Data Not Perfectly Compatible: 1978 Lumber and Wood Products (SIC 24), 2015 Wood Products + Logging (NAICS 321, 113)Source: Oregon Employment Department, Oregon Office of Economic Analysis
1978: 10.2%
> 33%
20 – 33%
10 – 20%
2 – 10%
< 2%
No Data
2016: 1.9%
Share of County Employment

Oregon Office of
Economic Analysis5
Share of State GDP
• Industry output has actually held steady since mid-1970s
• However, other Oregon industries(especially high tech) have grown substantially
• Thus, Wood Products’ share of state GDP continues to decline

Oregon Office of
Economic Analysis6
Harvest: Back to the Future
• Timber harvest increasedsubstantially beginning during the Great Depression
• Harvest levels held steady through the mid-70s
• Following federal restrictions, harvest declined dramatically in the 1990s

Oregon Office of
Economic Analysis7
Changes in Harvest
• Biggest change in Oregon’s timber harvest has been the decreased logging on federal lands, particularly since the late 1980s
• Private land harvests have fallen some over time
• Harvests on state and local lands has increased in recent decades, but remain a small portion of the market

8
Federal Payments to Counties Decline
• Since 1908
counties
received 25% of
sales
• Secure Rural
Schools and
Community Self-
Determination
Act of 2000
• Continued for 4
years at
declining levels,
included in
ARRA
Oregon Office of Economic Analysis
$0
$100
$200
$300
$400
$500
1986 1990 1994 1998 2002 2006 2010
Mill
ions
Fiscal Year
Timber Payments
OWL
25% Fund (FS)
Secure Rural Schools
Mineral
BLM
PILT
Chart not updated

Oregon Office of
Economic Analysis9
Flat Wages, Falling Premium
• Timber-related jobs used to be great,paying a 30%+ premium compared to the average industry
• Total industry wages accounted for 13% of statewide wages, approx. the same as High-Tech today
• Automation and industry decline led to stagnant wages
• Industry jobs today are middle-wage, not low-wage, but no wage premium remains relative to statewide average

Oregon Office of
Economic Analysis10
Increased Competition for Scarce Supply of Logs
• Chinese demand for NW logs didn’t really used to exist
• Following recession and Russian tariffs, Chinese sought out other log sources
• Impact raises log prices (good for landowners, bad for mills facing weak domestic housing demand for finished goods)
• Chinese demand has ebbed some, but remains
• Of course, would love to export finished lumber, not raw logs

Oregon Office of
Economic Analysis11
• In recent years, Pacific Northwest mill margins under pressure from both sides. High log prices due to low harvest levels and increased competition from China for raw logs. Weak domestic demand and increased Canadian exports hold down final prices.
• Under either a tariff or another softwood lumber agreement, it should help Pacific Northwest mills with pricing power• Better margins for mills, supporting their operation, but also higher
consumer prices
• Some of this pricing power will flow to land owners. At higher lumber prices, mills can afford to pay more for logs, thus raising or at least supporting log prices too.
• Higher log prices should result in higher private land harvest levels. Unclear how much. Economic impact likely smallish.
• The tariff (if it sticks) or a SLA may help Northwest mills some, but it cannot solve their biggest obstacle: raw logs
Canadian Tariff

Oregon Office of
Economic Analysis12
•During the 1940s-1970s the industry employed 70,000+ workers and paid 30% above the state average
•Events with significant impact:•Early 1980s recession, industry restructuring,
Federal Land restrictions, increased competition from Southeastern U.S. and British Columbia, increased productivity and mechanization
•Today there are about 30,000 jobs that pay the state average
Conclusion

Oregon Office of
Economic Analysis13
Finally, Quality of Life vs Economic Performance
• The Timber Belt suffered economic shock as bad as the Rust Belt, the Corn Belt or old textile mills across the South
• As jobs disappeared, people moved away from those other locations
• In the Timber Belt, people kept moving in
For more: https://oregoneconomicanalysis.com/2015/04/28/the-timber-belt/

Oregon Office of
Economic Analysis14
(503) 378-4052
www.OregonEconomicAnalysis.com
@OR_EconAnalysis
Questions and Contact