Oregon Smoke Management Annual Report · 1 OREGON DEPARTMENT OF FORESTRY SMOKE MANAGEMENT 2017...
26
Oregon Smoke Management Annual Report 2017 OREGON DEPARTMENT OF FORESTRY FIRE PROTECTION DIVISION SMOKE MANAGEMENT AND FUELS
Transcript of Oregon Smoke Management Annual Report · 1 OREGON DEPARTMENT OF FORESTRY SMOKE MANAGEMENT 2017...
Oregon Smoke Management Annual Report
2017
OREGON DEPARTMENT OF FORESTRY FIRE PROTECTION DIVISION
SMOKE MANAGEMENT AND FUELS
General File
1-2-5-910
OREGON SMOKE MANAGEMENT
ANNUAL REPORT
2017
Prepared By:
FIRE PROTECTION DIVISION
OREGON DEPARTMENT OF FORESTRY
2600 STATE STREET
SALEM, OREGON 97310
TABLE OF CONTENTS Page
2017 Summary .................................................................................................................................................................................. 1
Program Overview ............................................................................................................................................................................ 1
Program Summary ............................................................................................................................................................................ 1
Audits...................................................................................................................................................................................... 1
Meteorological Services .......................................................................................................................................................... 2
Program Accomplishment Data ........................................................................................................................................................ 2
Alternatives to Burning and Emission Reduction Techniques Tracking ................................................................................. 2
Prescribed Burning Statistics .................................................................................................................................................. 2
FIGURES
1 Smoke Management Regulated Areas..................................................................................................................................... 3
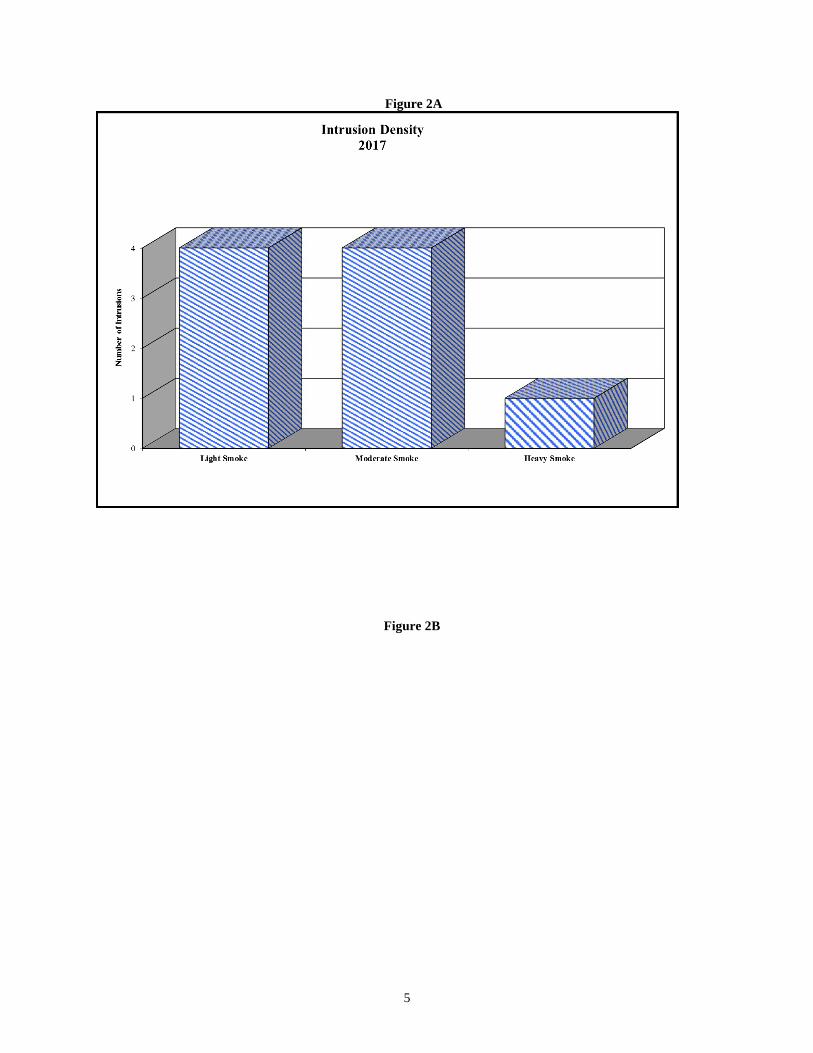
2A Intrusion Density .................................................................................................................................................................... 4
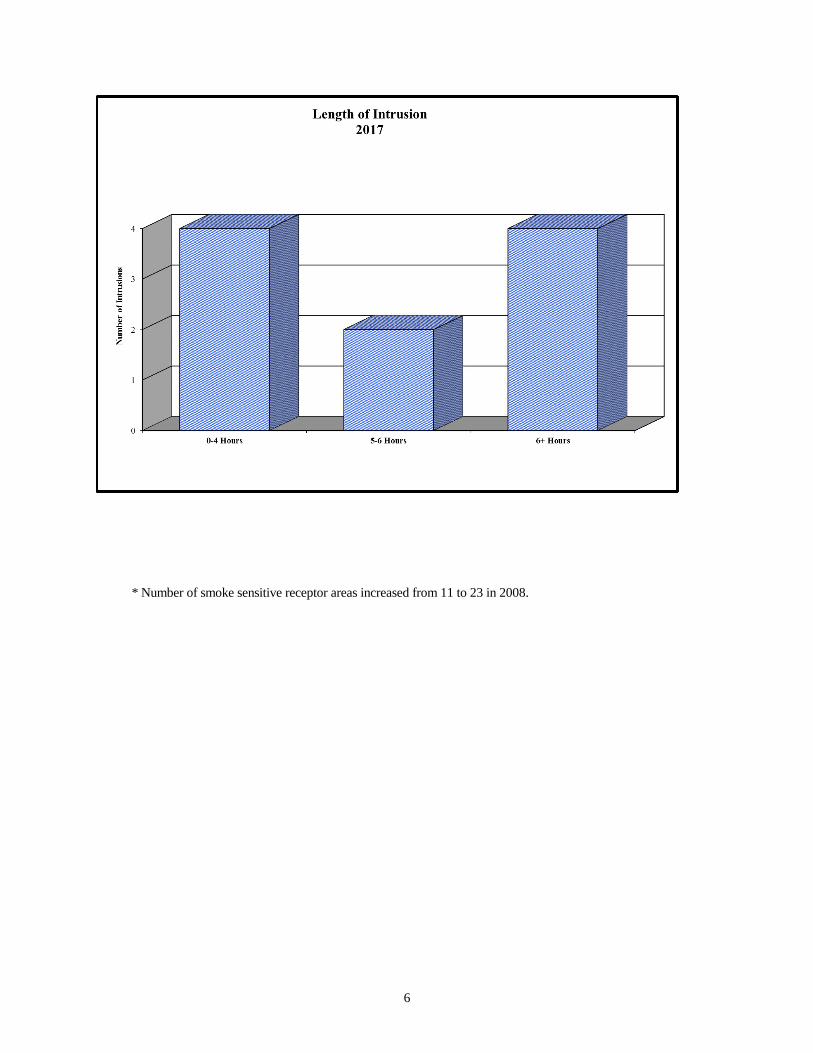
2B Length of Intrusion ................................................................................................................................................................. 4
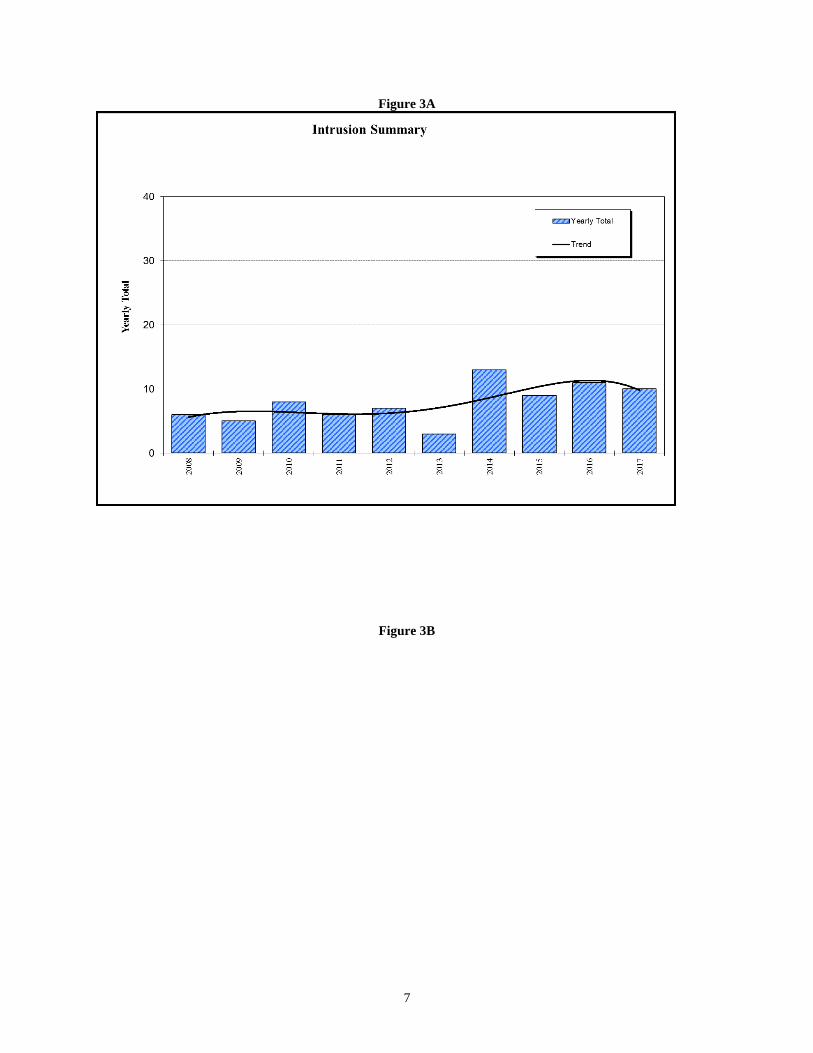
3A Intrusion Summary.................................................................................................................................................................. 5
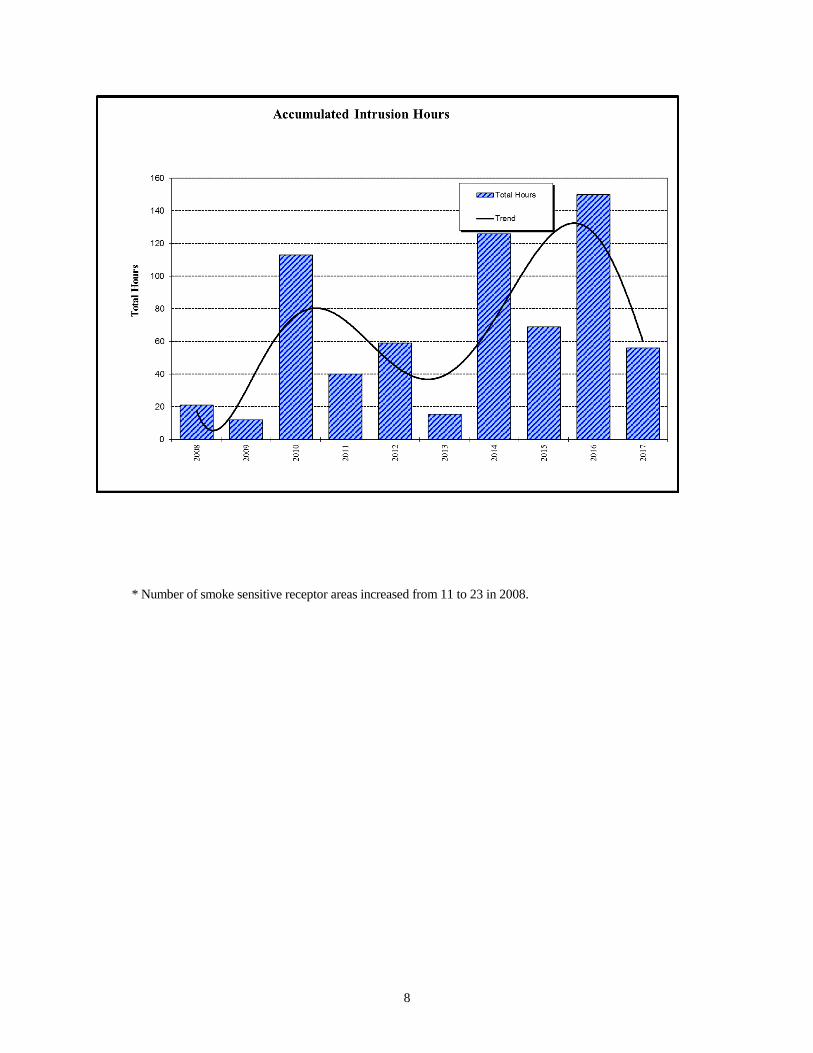
3B Accumulated Intrusion Hours ................................................................................................................................................. 5
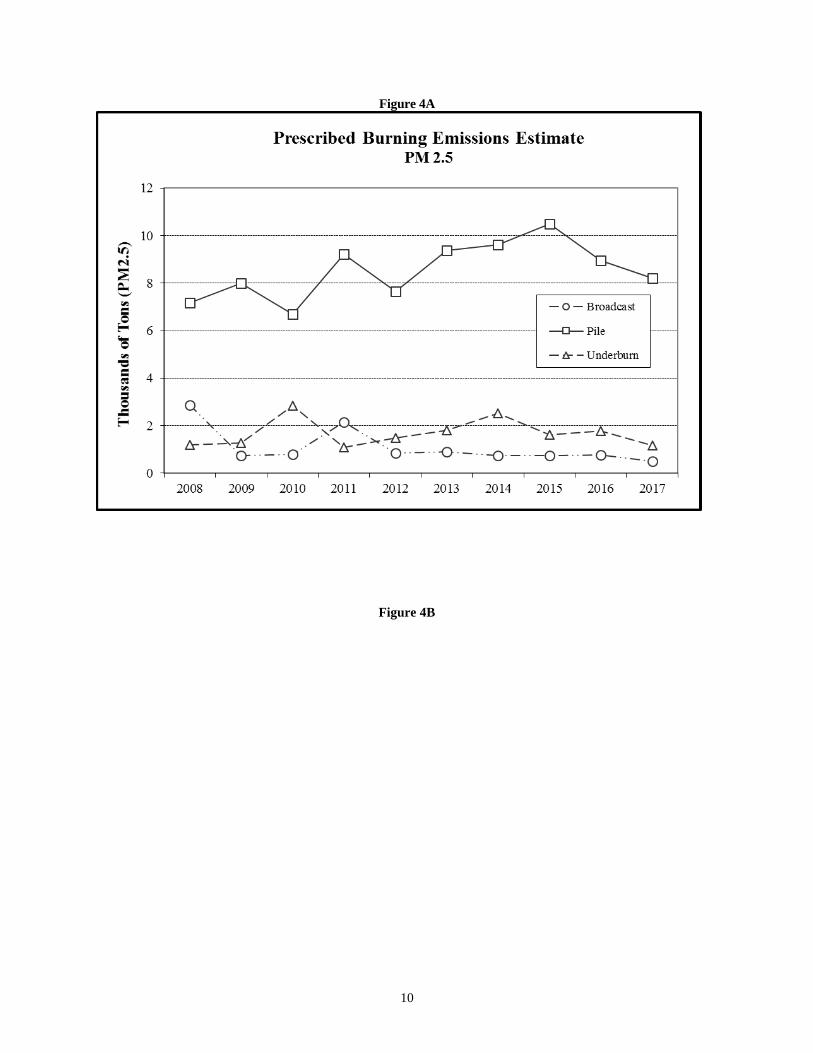
4A Prescribed Burning Emissions Estimate (PM2.5) ................................................................................................................... 7
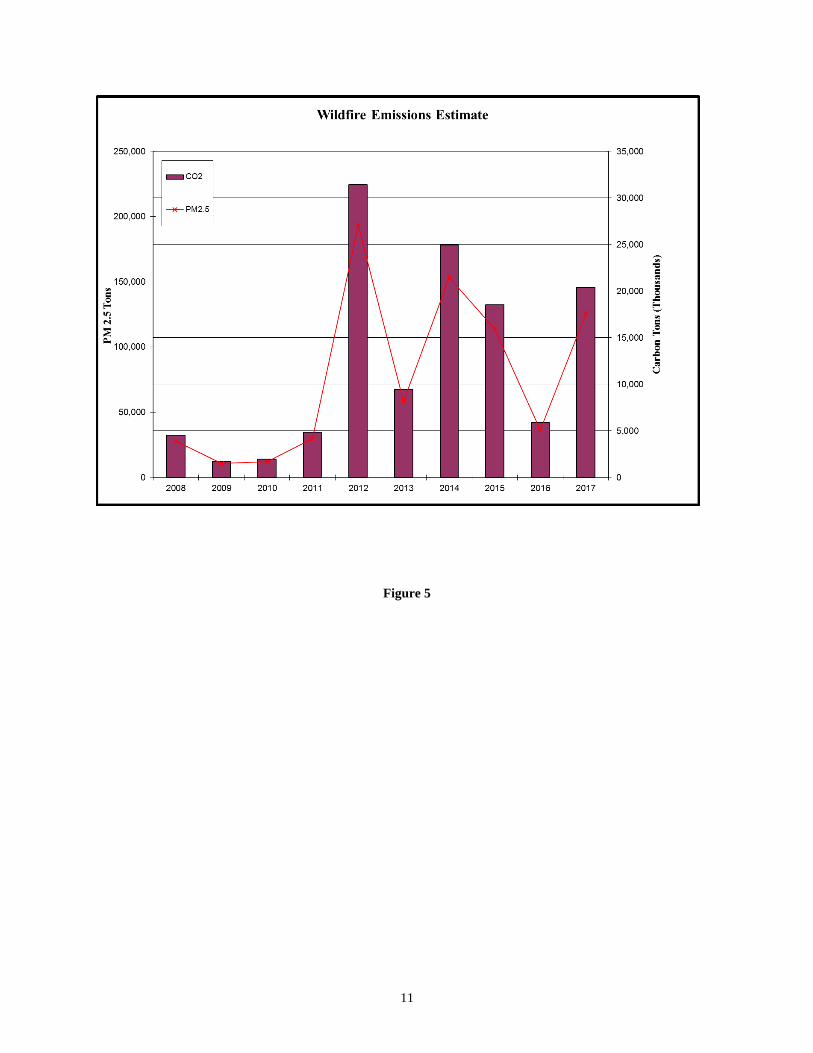
4B Wildfire Emissions Estimate (Carbon and PM2.5) ................................................................................................................. 7
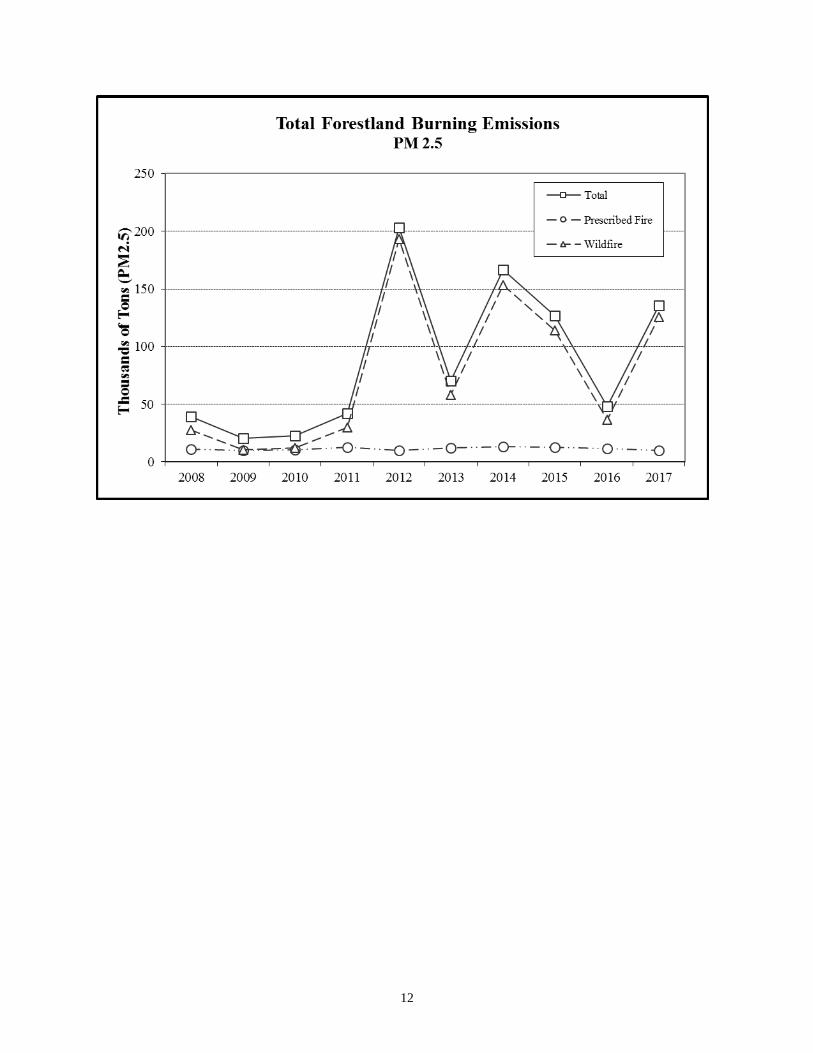
5 Total Forestland Burning Emissions (PM2.5) ........................................................................................................................ 8
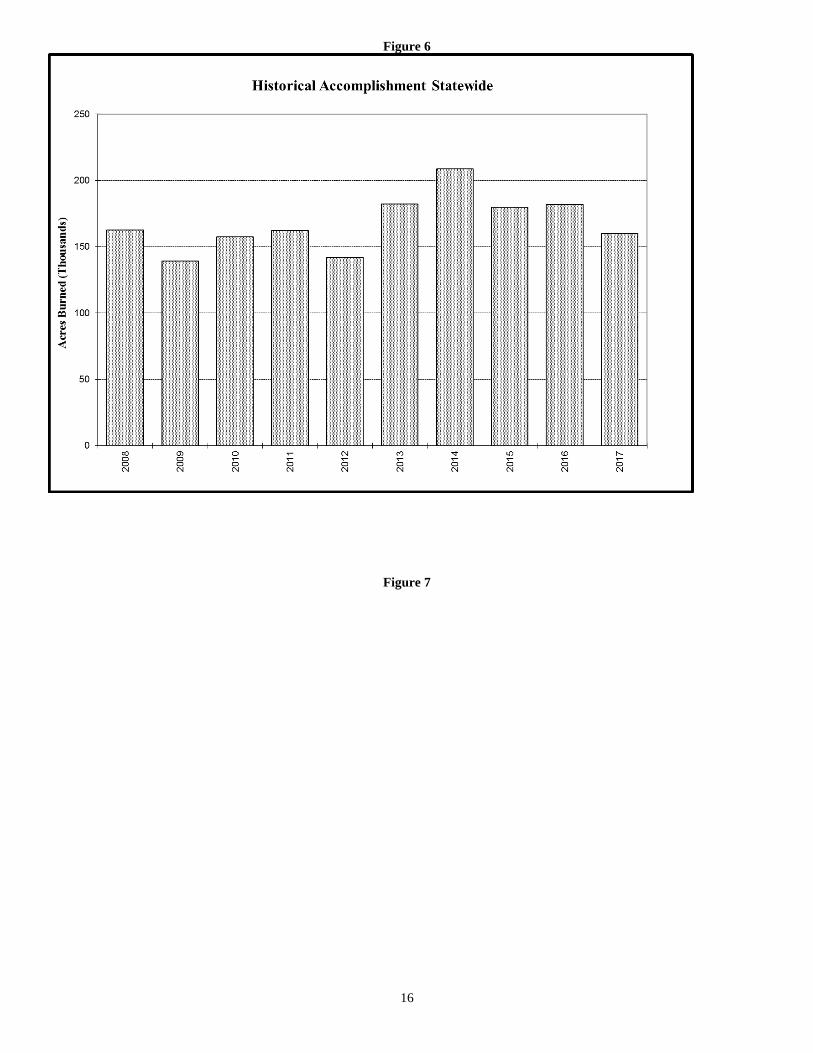
6 Historical Accomplishment -- Total Acres Burned (Statewide) ............................................................................................ 11
7 Historical Accomplishment -- Total Tons Burned (Statewide) ............................................................................................. 11
8 Monthly Prescribed Burn Acres Burned ............................................................................................................................... 12
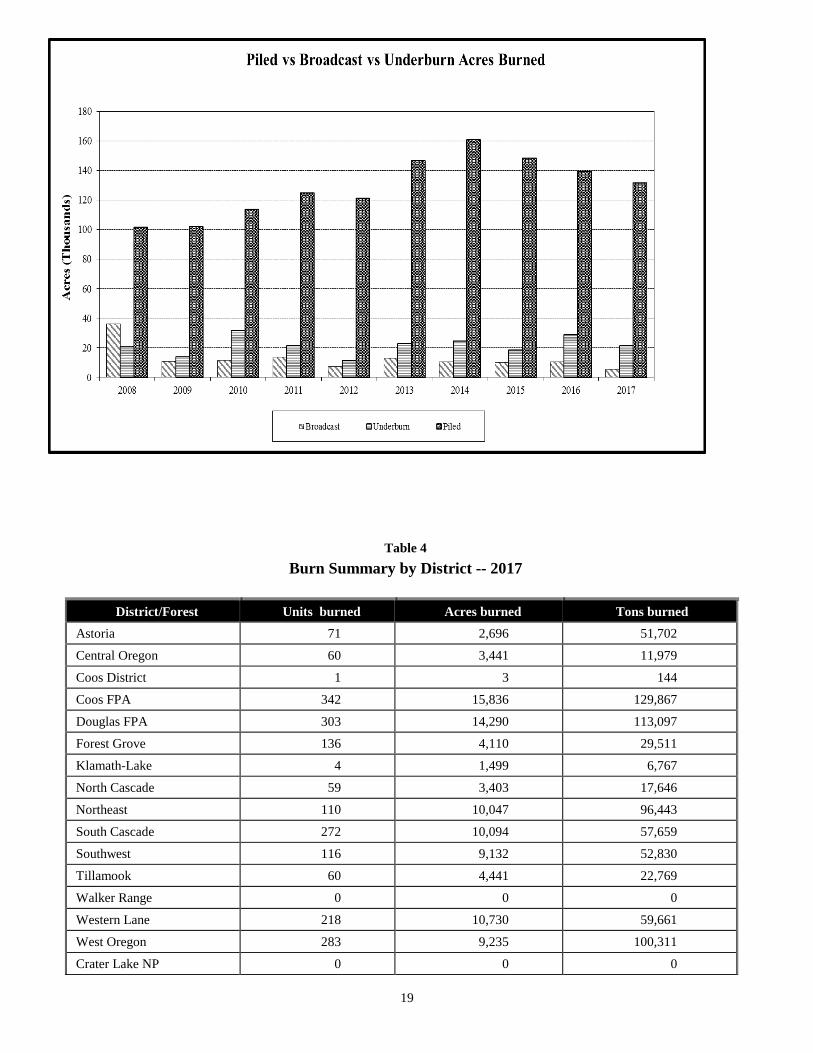
9 Piled vs Broadcast vs. Underburn Acres Burned ................................................................................................................. 12
TABLES
1 2008 - 2017 Accomplishment Summary ................................................................................................................................. 3
2 Smoke Intrusion Summary -- 2017 ......................................................................................................................................... 6
3A Broadcast Burning PM2.5 Emissions by District.................................................................................................................... 9
3B Pile Burning PM2.5 Emissions by District ............................................................................................................................. 9
3C Underburning PM2.5 Emissions by District ......................................................................................................................... 10
4 Burn Summary by District -- 2017 ........................................................................................................................................ 13
5 Tons Burned by Month by District -- 2017 ........................................................................................................................... 14
6 Acres Burned by Month by District -- 2017 ......................................................................................................................... 15
7 2017 Burn Data by Owner Type ........................................................................................................................................... 16
Fall burning in the southern Coast Range
1
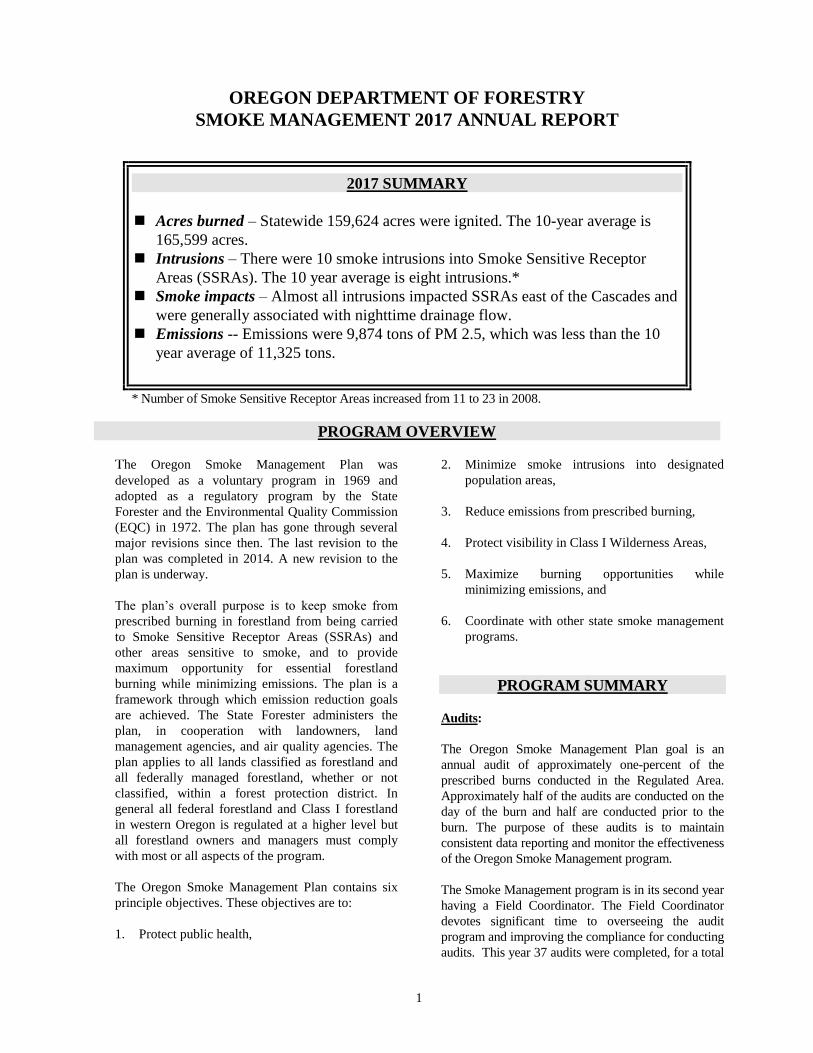
OREGON DEPARTMENT OF FORESTRY
SMOKE MANAGEMENT 2017 ANNUAL REPORT
2017 SUMMARY
Acres burned – Statewide 159,624 acres were ignited. The 10-year average is
165,599 acres.
Intrusions – There were 10 smoke intrusions into Smoke Sensitive Receptor
Areas (SSRAs). The 10 year average is eight intrusions.*
Smoke impacts – Almost all intrusions impacted SSRAs east of the Cascades and
were generally associated with nighttime drainage flow.
Emissions -- Emissions were 9,874 tons of PM 2.5, which was less than the 10
year average of 11,325 tons.
* Number of Smoke Sensitive Receptor Areas increased from 11 to 23 in 2008.
PROGRAM OVERVIEW
The Oregon Smoke Management Plan was
developed as a voluntary program in 1969 and
adopted as a regulatory program by the State
Forester and the Environmental Quality Commission
(EQC) in 1972. The plan has gone through several
major revisions since then. The last revision to the
plan was completed in 2014. A new revision to the
plan is underway.
The plan’s overall purpose is to keep smoke from
prescribed burning in forestland from being carried
to Smoke Sensitive Receptor Areas (SSRAs) and
other areas sensitive to smoke, and to provide
maximum opportunity for essential forestland
burning while minimizing emissions. The plan is a
framework through which emission reduction goals
are achieved. The State Forester administers the
plan, in cooperation with landowners, land
management agencies, and air quality agencies. The
plan applies to all lands classified as forestland and
all federally managed forestland, whether or not
classified, within a forest protection district. In
general all federal forestland and Class I forestland
in western Oregon is regulated at a higher level but
all forestland owners and managers must comply
with most or all aspects of the program.
The Oregon Smoke Management Plan contains six
principle objectives. These objectives are to:
1. Protect public health,
2. Minimize smoke intrusions into designated
population areas,
3. Reduce emissions from prescribed burning,
4. Protect visibility in Class I Wilderness Areas,
5. Maximize burning opportunities while
minimizing emissions, and
6. Coordinate with other state smoke management
programs.
PROGRAM SUMMARY
Audits:
The Oregon Smoke Management Plan goal is an
annual audit of approximately one-percent of the
prescribed burns conducted in the Regulated Area.
Approximately half of the audits are conducted on the
day of the burn and half are conducted prior to the
burn. The purpose of these audits is to maintain
consistent data reporting and monitor the effectiveness
of the Oregon Smoke Management program.
The Smoke Management program is in its second year
having a Field Coordinator. The Field Coordinator
devotes significant time to overseeing the audit
program and improving the compliance for conducting
audits. This year 37 audits were completed, for a total
2
of 17,291 audited tons. The audit breakout was 20
pre-burn audits and 17 burn-day audits. Forest
Service, BLM, state, and private units were audited.
Four of these audits were mutually agreed upon and
performed on non-regulated neighboring agencies in a
successful relationship building and information-
sharing visit. Trends show that reported tons are
generally lower than audited tons. The Smoke
Management Field Coordinator has been teaching
proper techniques to estimate fuel loading through on-
the-job training during site visits, burn boss refresher
training courses, and fuel load estimation briefing
papers. An entire series of video tutorials on how to do
a fuels transect, estimate tonnage, and tools to help
burners have also been created this year. In addition, a
simple fuel-loading calculator has made its debut.
Experimental use has been released to some users as
we upgrade to an even better version. It is anticipated
that this outreach and education effort will lead to
more precise fuel-load estimates.
Meteorological Services:
Oregon Department of Forestry meteorologists
originate three daily Smoke Management forecasts
and burning instructions for western Oregon, northeast
Oregon, and south-central Oregon. Through a
cooperative agreement with DEQ they are making the
open burning forecast for the Willamette Valley north
of Lane County throughout the year. In addition, ODF
provides the Department of Agriculture field burning
forecasts for the north Willamette Valley, Jefferson
County, and Union County during the summer field
burning season (July 1- October 15).
Other forecast services include weather support for
significant weather events (heavy rain, wind, etc.) and
for weather events that may increase the chances for
wildfire and its spread. In addition, the meteorologists
provide daily quality control for the National Fire
Danger Rating System.
PROGRAM ACCOMPLISHMENT
DATA
Alternatives to Burning and Emission Reduction
Techniques Tracking:
As part of a recommendation from the 2013 review of
the Smoke Management Plan, the program is tracking
acres of treated forestland where alternatives to
burning were employed instead of using prescribed
fire. In addition, emission-reduction techniques of
prescribed burn units are also tracked. See results:
Total statewide acres of alternatives to burning: 3,573
(minimal data provided by both federal and private
land managers).
Total statewide acres of using emission-reduction
techniques: 139,145.
Total statewide acres of covered piles: 13,748.
Alternative to burning techniques include: biomass
removal, scattering material, chipping, crushing,
firewood removal, non-treatment, or other techniques
for reducing fire hazard and/or creating planting spots
without using prescribed fire.
Emission-reduction techniques include: piling clean
piles instead of broadcast or under burning, use of
rapid ignition techniques, covering piles with
polyethylene to keep the piles dry, and other
techniques used to reduce particulate and gaseous
emissions while burning.
The goal is to demonstrate the program is not
exclusively focused on prescribed burning but all
treatment methods that most effectively reduce fire
hazard, maintain productive and resilient forests, and
keeps or improves air quality.
Prescribed Burning Statistics:
The following tables and figures provide detailed
information about the Smoke Management program.
The data details accomplishments for 2017 and
comparative information with previous years.
3
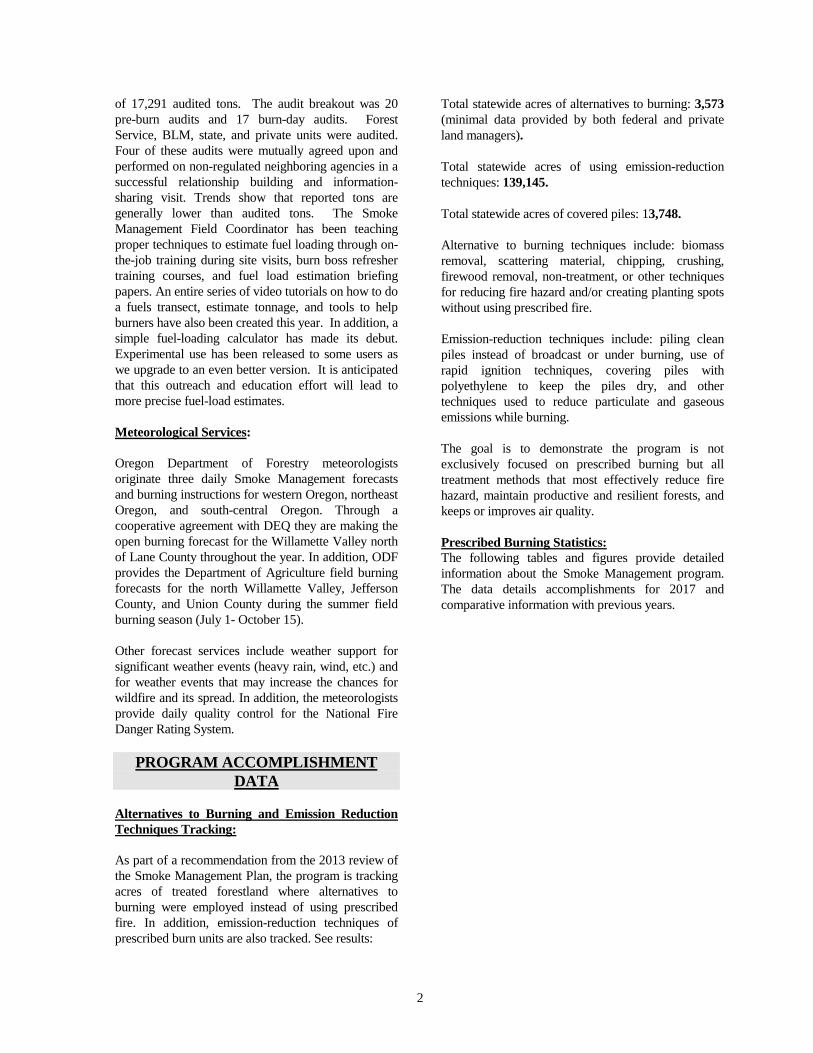
Figure 1
TABLE 1
2008-2017 ACCOMPLISHMENT SUMMARY
Year Total No. Units No. Units Burned Acres Burned Tons Burned No. Intrusions Unit/Intrusion %
2008 3,270 2,608 162,405 1,231,210 6* .23
2009 3,222 2,492 139,000 1,117,650 5 .20
2010 3,471 2,451 157,224 1,171,239 8 .33
2011 3,544 2,880 162,154 1,370,113 6 .21
2012 3,651 3,092 141,892 1,086,214 7 .23
2013 3,890 3,104 182,189 1,308,114 3 .10
2014 4,095 3,443 208,593 1,405,349 13 .38
2015 3,601 3,076 179,613 1,371,114 9 .29
2016 3,484 2,868 181,800 1,228,107 11 .38
2017 3,597 2,849 159,624 1,004,108 10 .35

4
Average 3,583 2,886 167,449 1,229,322 8 .27
* Number of smoke sensitive receptor areas increased from 11 to 23.
5
Figure 2A
Figure 2B
6
* Number of smoke sensitive receptor areas increased from 11 to 23 in 2008.
7
Figure 3A
Figure 3B
8
* Number of smoke sensitive receptor areas increased from 11 to 23 in 2008.
9
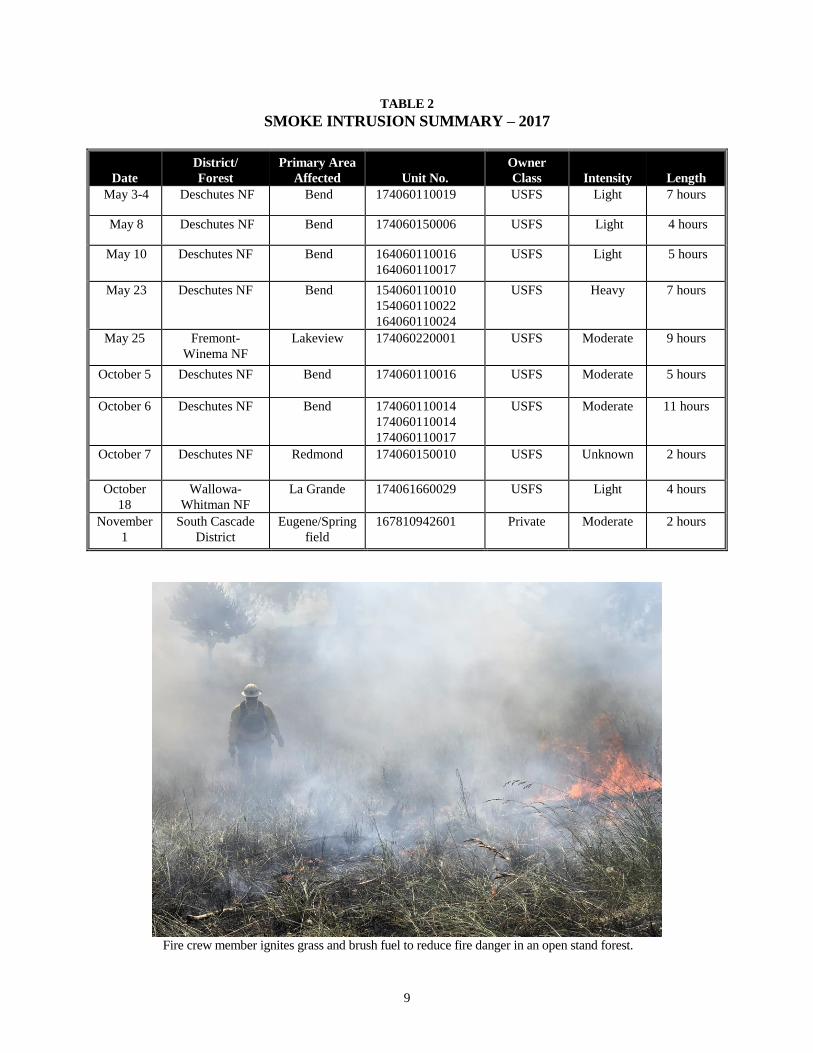
TABLE 2
SMOKE INTRUSION SUMMARY – 2017
Date
District/
Forest
Primary Area
Affected Unit No.
Owner
Class Intensity Length
May 3-4 Deschutes NF Bend 174060110019 USFS Light 7 hours
May 8 Deschutes NF Bend 174060150006 USFS Light 4 hours
May 10 Deschutes NF Bend 164060110016
164060110017
USFS Light 5 hours
May 23 Deschutes NF Bend 154060110010
154060110022
164060110024
USFS Heavy 7 hours
May 25 Fremont-
Winema NF
Lakeview 174060220001 USFS Moderate 9 hours
October 5 Deschutes NF Bend 174060110016 USFS Moderate 5 hours
October 6 Deschutes NF Bend 174060110014
174060110014
174060110017
USFS Moderate 11 hours
October 7 Deschutes NF Redmond 174060150010 USFS Unknown 2 hours
October
18
Wallowa-
Whitman NF
La Grande 174061660029 USFS Light 4 hours
November
1
South Cascade
District
Eugene/Spring
field
167810942601 Private Moderate 2 hours
Fire crew member ignites grass and brush fuel to reduce fire danger in an open stand forest.
10
Figure 4A
Figure 4B
11
Figure 5
12
13
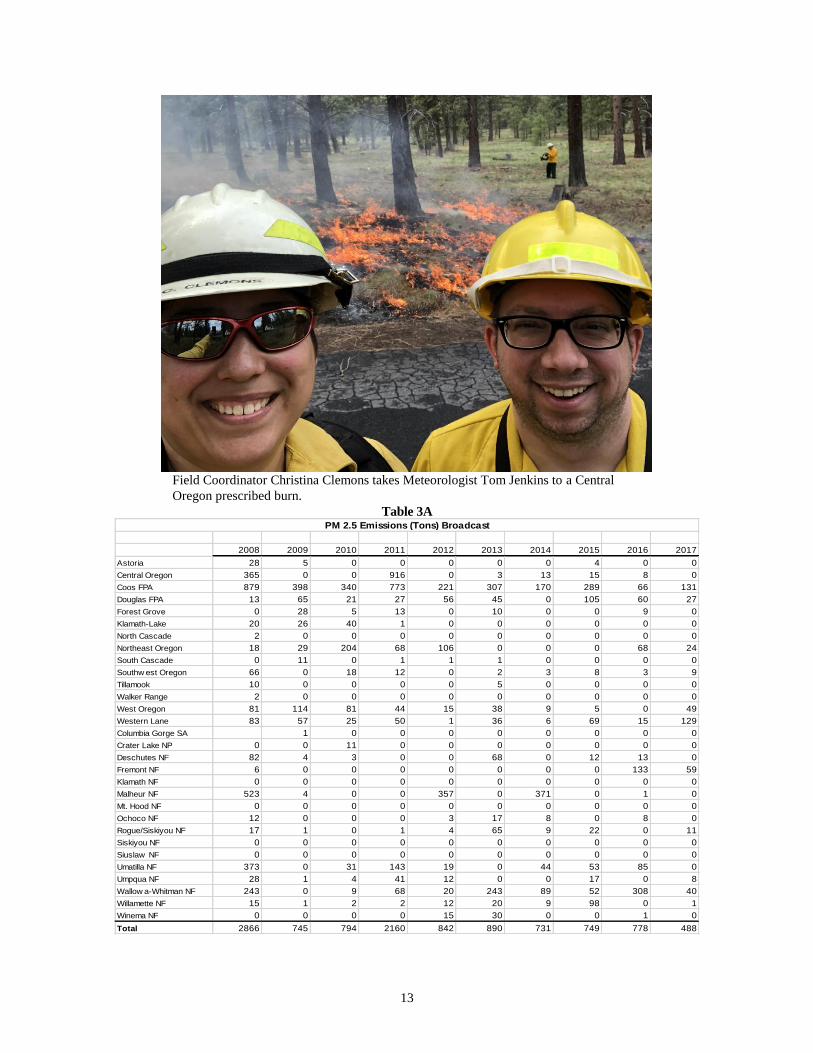
Field Coordinator Christina Clemons takes Meteorologist Tom Jenkins to a Central
Oregon prescribed burn.
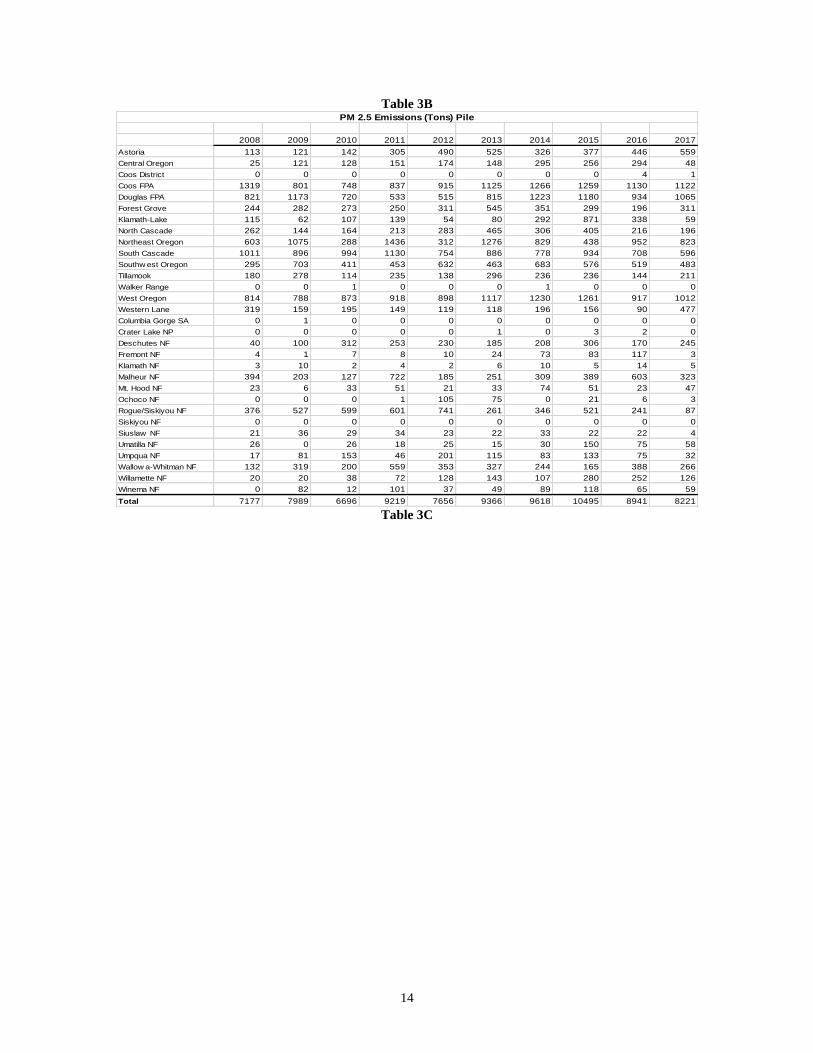
Table 3A
2008 2009 2010 2011 2012 2013 2014 2015 2016 2017
Astoria 28 5 0 0 0 0 0 4 0 0
Central Oregon 365 0 0 916 0 3 13 15 8 0
Coos FPA 879 398 340 773 221 307 170 289 66 131
Douglas FPA 13 65 21 27 56 45 0 105 60 27
Forest Grove 0 28 5 13 0 10 0 0 9 0
Klamath-Lake 20 26 40 1 0 0 0 0 0 0
North Cascade 2 0 0 0 0 0 0 0 0 0
Northeast Oregon 18 29 204 68 106 0 0 0 68 24
South Cascade 0 11 0 1 1 1 0 0 0 0
Southw est Oregon 66 0 18 12 0 2 3 8 3 9
Tillamook 10 0 0 0 0 5 0 0 0 0
Walker Range 2 0 0 0 0 0 0 0 0 0
West Oregon 81 114 81 44 15 38 9 5 0 49
Western Lane 83 57 25 50 1 36 6 69 15 129
Columbia Gorge SA 1 0 0 0 0 0 0 0 0
Crater Lake NP 0 0 11 0 0 0 0 0 0 0
Deschutes NF 82 4 3 0 0 68 0 12 13 0
Fremont NF 6 0 0 0 0 0 0 0 133 59
Klamath NF 0 0 0 0 0 0 0 0 0 0
Malheur NF 523 4 0 0 357 0 371 0 1 0
Mt. Hood NF 0 0 0 0 0 0 0 0 0 0
Ochoco NF 12 0 0 0 3 17 8 0 8 0
Rogue/Siskiyou NF 17 1 0 1 4 65 9 22 0 11
Siskiyou NF 0 0 0 0 0 0 0 0 0 0
Siuslaw NF 0 0 0 0 0 0 0 0 0 0
Umatilla NF 373 0 31 143 19 0 44 53 85 0
Umpqua NF 28 1 4 41 12 0 0 17 0 8
Wallow a-Whitman NF 243 0 9 68 20 243 89 52 308 40
Willamette NF 15 1 2 2 12 20 9 98 0 1
Winema NF 0 0 0 0 15 30 0 0 1 0
Total 2866 745 794 2160 842 890 731 749 778 488
PM 2.5 Emissions (Tons) Broadcast
14
Table 3B
2008 2009 2010 2011 2012 2013 2014 2015 2016 2017
Astoria 113 121 142 305 490 525 326 377 446 559
Central Oregon 25 121 128 151 174 148 295 256 294 48
Coos District 0 0 0 0 0 0 0 0 4 1
Coos FPA 1319 801 748 837 915 1125 1266 1259 1130 1122
Douglas FPA 821 1173 720 533 515 815 1223 1180 934 1065
Forest Grove 244 282 273 250 311 545 351 299 196 311
Klamath-Lake 115 62 107 139 54 80 292 871 338 59
North Cascade 262 144 164 213 283 465 306 405 216 196
Northeast Oregon 603 1075 288 1436 312 1276 829 438 952 823
South Cascade 1011 896 994 1130 754 886 778 934 708 596
Southw est Oregon 295 703 411 453 632 463 683 576 519 483
Tillamook 180 278 114 235 138 296 236 236 144 211
Walker Range 0 0 1 0 0 0 1 0 0 0
West Oregon 814 788 873 918 898 1117 1230 1261 917 1012
Western Lane 319 159 195 149 119 118 196 156 90 477
Columbia Gorge SA 0 1 0 0 0 0 0 0 0 0
Crater Lake NP 0 0 0 0 0 1 0 3 2 0
Deschutes NF 40 100 312 253 230 185 208 306 170 245
Fremont NF 4 1 7 8 10 24 73 83 117 3
Klamath NF 3 10 2 4 2 6 10 5 14 5
Malheur NF 394 203 127 722 185 251 309 389 603 323
Mt. Hood NF 23 6 33 51 21 33 74 51 23 47
Ochoco NF 0 0 0 1 105 75 0 21 6 3
Rogue/Siskiyou NF 376 527 599 601 741 261 346 521 241 87
Siskiyou NF 0 0 0 0 0 0 0 0 0 0
Siuslaw NF 21 36 29 34 23 22 33 22 22 4
Umatilla NF 26 0 26 18 25 15 30 150 75 58
Umpqua NF 17 81 153 46 201 115 83 133 75 32
Wallow a-Whitman NF 132 319 200 559 353 327 244 165 388 266
Willamette NF 20 20 38 72 128 143 107 280 252 126
Winema NF 0 82 12 101 37 49 89 118 65 59
Total 7177 7989 6696 9219 7656 9366 9618 10495 8941 8221
PM 2.5 Emissions (Tons) Pile
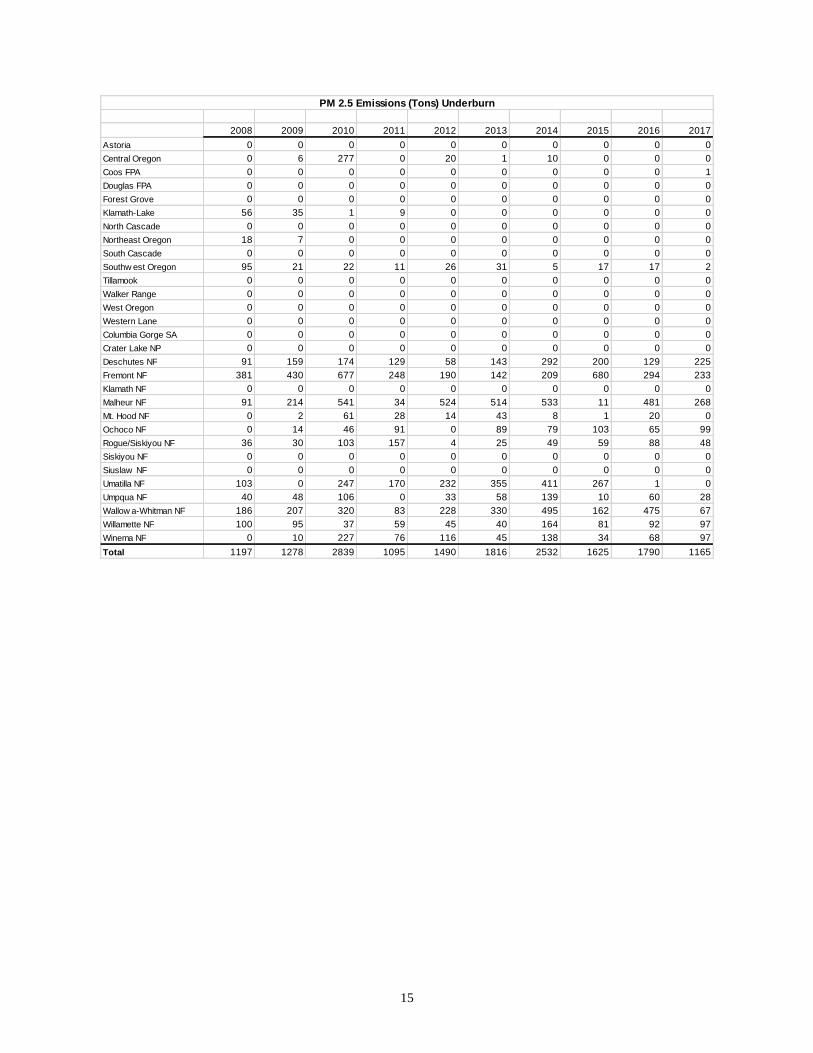
Table 3C
15
2008 2009 2010 2011 2012 2013 2014 2015 2016 2017
Astoria 0 0 0 0 0 0 0 0 0 0
Central Oregon 0 6 277 0 20 1 10 0 0 0
Coos FPA 0 0 0 0 0 0 0 0 0 1
Douglas FPA 0 0 0 0 0 0 0 0 0 0
Forest Grove 0 0 0 0 0 0 0 0 0 0
Klamath-Lake 56 35 1 9 0 0 0 0 0 0
North Cascade 0 0 0 0 0 0 0 0 0 0
Northeast Oregon 18 7 0 0 0 0 0 0 0 0
South Cascade 0 0 0 0 0 0 0 0 0 0
Southw est Oregon 95 21 22 11 26 31 5 17 17 2
Tillamook 0 0 0 0 0 0 0 0 0 0
Walker Range 0 0 0 0 0 0 0 0 0 0
West Oregon 0 0 0 0 0 0 0 0 0 0
Western Lane 0 0 0 0 0 0 0 0 0 0
Columbia Gorge SA 0 0 0 0 0 0 0 0 0 0
Crater Lake NP 0 0 0 0 0 0 0 0 0 0
Deschutes NF 91 159 174 129 58 143 292 200 129 225
Fremont NF 381 430 677 248 190 142 209 680 294 233
Klamath NF 0 0 0 0 0 0 0 0 0 0
Malheur NF 91 214 541 34 524 514 533 11 481 268
Mt. Hood NF 0 2 61 28 14 43 8 1 20 0
Ochoco NF 0 14 46 91 0 89 79 103 65 99
Rogue/Siskiyou NF 36 30 103 157 4 25 49 59 88 48
Siskiyou NF 0 0 0 0 0 0 0 0 0 0
Siuslaw NF 0 0 0 0 0 0 0 0 0 0
Umatilla NF 103 0 247 170 232 355 411 267 1 0
Umpqua NF 40 48 106 0 33 58 139 10 60 28
Wallow a-Whitman NF 186 207 320 83 228 330 495 162 475 67
Willamette NF 100 95 37 59 45 40 164 81 92 97
Winema NF 0 10 227 76 116 45 138 34 68 97
Total 1197 1278 2839 1095 1490 1816 2532 1625 1790 1165
PM 2.5 Emissions (Tons) Underburn
16
Figure 6
Figure 7
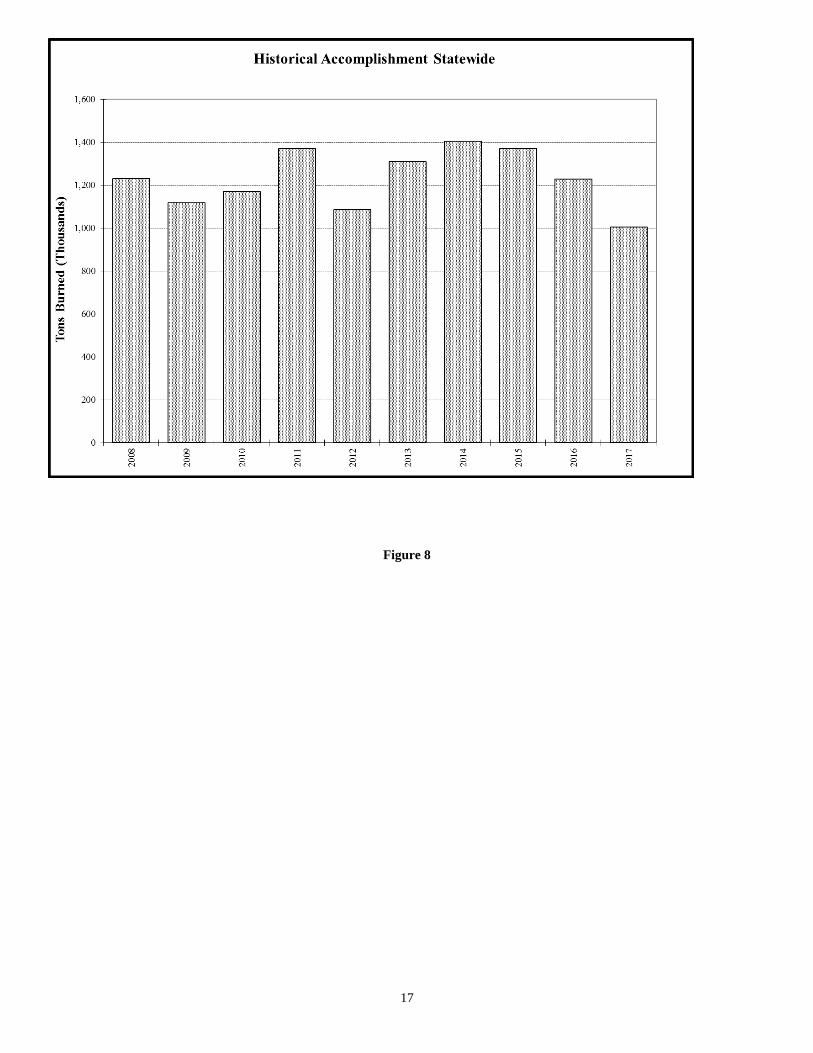
17
Figure 8
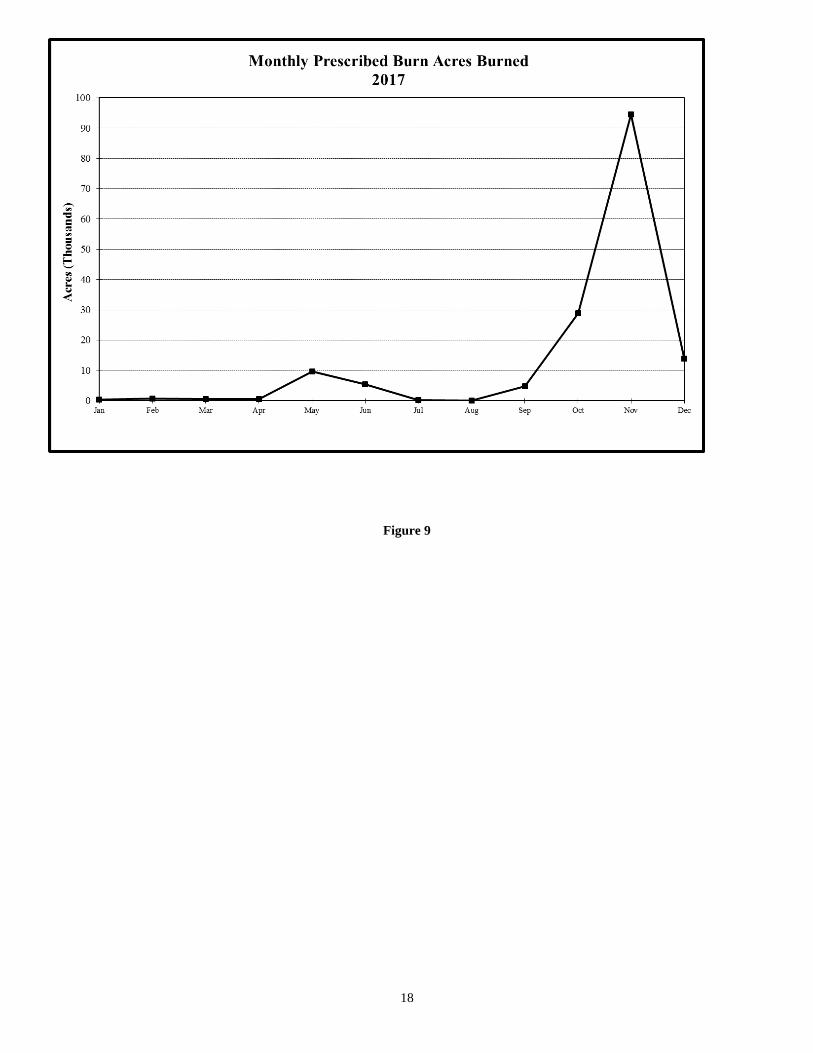
18
Figure 9
19
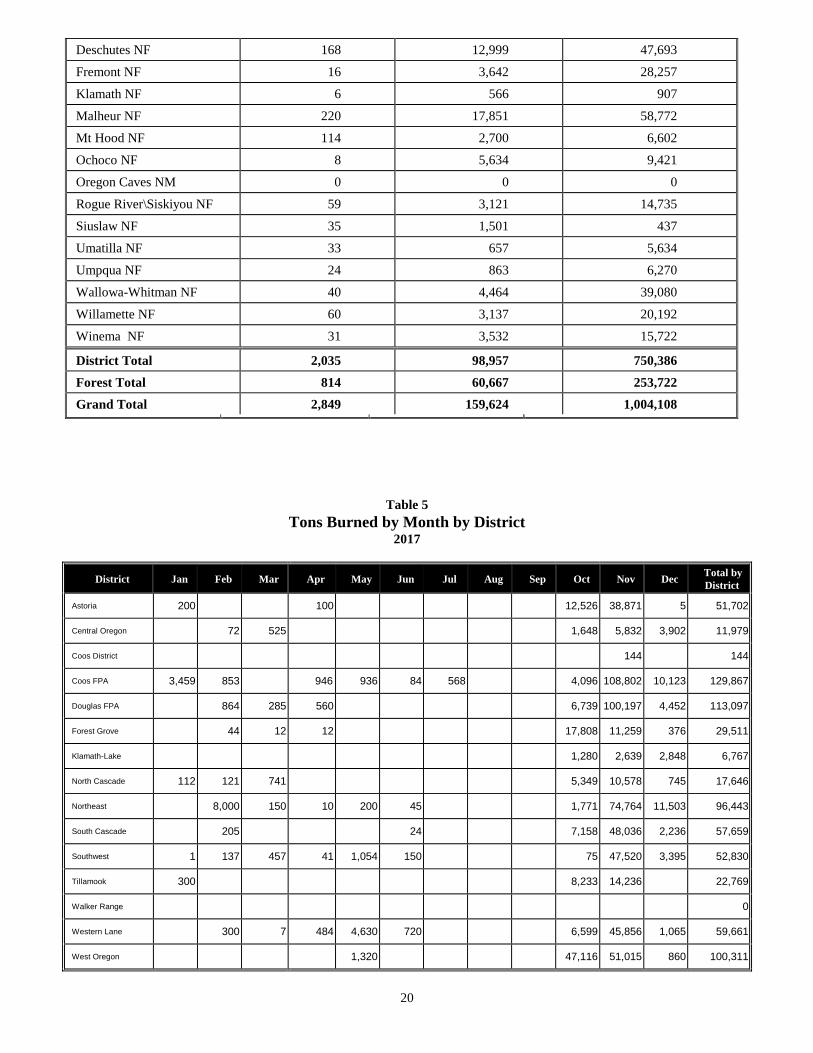
Table 4
Burn Summary by District -- 2017
District/Forest Units burned Acres burned Tons burned
Astoria 71 2,696 51,702
Central Oregon 60 3,441 11,979
Coos District 1 3 144
Coos FPA 342 15,836 129,867
Douglas FPA 303 14,290 113,097
Forest Grove 136 4,110 29,511
Klamath-Lake 4 1,499 6,767
North Cascade 59 3,403 17,646
Northeast 110 10,047 96,443
South Cascade 272 10,094 57,659
Southwest 116 9,132 52,830
Tillamook 60 4,441 22,769
Walker Range 0 0 0
Western Lane 218 10,730 59,661
West Oregon 283 9,235 100,311
Crater Lake NP 0 0 0
20
Deschutes NF 168 12,999 47,693
Fremont NF 16 3,642 28,257
Klamath NF 6 566 907
Malheur NF 220 17,851 58,772
Mt Hood NF 114 2,700 6,602
Ochoco NF 8 5,634 9,421
Oregon Caves NM 0 0 0
Rogue River\Siskiyou NF 59 3,121 14,735
Siuslaw NF 35 1,501 437
Umatilla NF 33 657 5,634
Umpqua NF 24 863 6,270
Wallowa-Whitman NF 40 4,464 39,080
Willamette NF 60 3,137 20,192
Winema NF 31 3,532 15,722
District Total 2,035 98,957 750,386
Forest Total 814 60,667 253,722
Grand Total 2,849 159,624 1,004,108
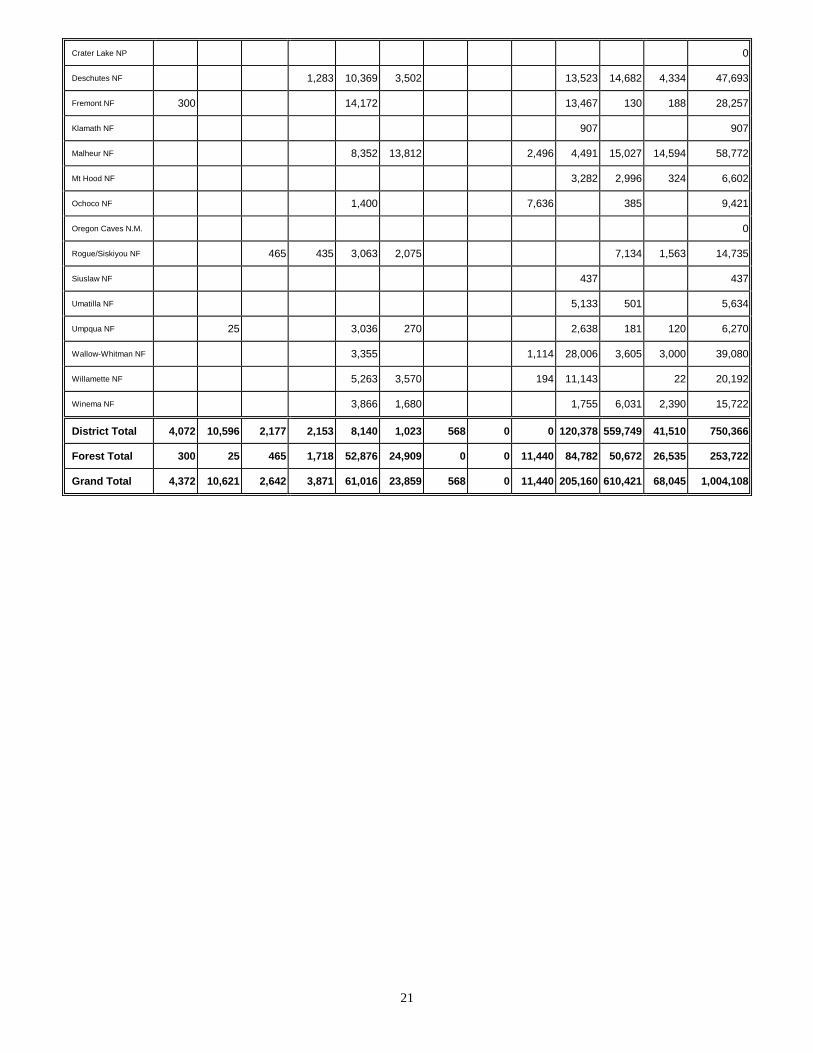
Table 5
Tons Burned by Month by District 2017
District Jan Feb Mar Apr May Jun Jul Aug Sep Oct Nov Dec Total by
District
Astoria 200 100 12,526 38,871 5 51,702
Central Oregon 72 525 1,648 5,832 3,902 11,979
Coos District 144 144
Coos FPA 3,459 853 946 936 84 568 4,096 108,802 10,123 129,867
Douglas FPA 864 285 560 6,739 100,197 4,452 113,097
Forest Grove 44 12 12 17,808 11,259 376 29,511
Klamath-Lake 1,280 2,639 2,848 6,767
North Cascade 112 121 741 5,349 10,578 745 17,646
Northeast 8,000 150 10 200 45 1,771 74,764 11,503 96,443
South Cascade 205 24 7,158 48,036 2,236 57,659
Southwest 1 137 457 41 1,054 150 75 47,520 3,395 52,830
Tillamook 300 8,233 14,236 22,769
Walker Range 0
Western Lane 300 7 484 4,630 720 6,599 45,856 1,065 59,661
West Oregon 1,320 47,116 51,015 860 100,311
21
Crater Lake NP 0
Deschutes NF 1,283 10,369 3,502 13,523 14,682 4,334 47,693
Fremont NF 300 14,172 13,467 130 188 28,257
Klamath NF 907 907
Malheur NF 8,352 13,812 2,496 4,491 15,027 14,594 58,772
Mt Hood NF 3,282 2,996 324 6,602
Ochoco NF 1,400 7,636 385 9,421
Oregon Caves N.M. 0
Rogue/Siskiyou NF 465 435 3,063 2,075 7,134 1,563 14,735
Siuslaw NF 437 437
Umatilla NF 5,133 501 5,634
Umpqua NF 25 3,036 270 2,638 181 120 6,270
Wallow-Whitman NF 3,355 1,114 28,006 3,605 3,000 39,080
Willamette NF 5,263 3,570 194 11,143 22 20,192
Winema NF 3,866 1,680 1,755 6,031 2,390 15,722
District Total 4,072 10,596 2,177 2,153 8,140 1,023 568 0 0 120,378 559,749 41,510 750,366
Forest Total 300 25 465 1,718 52,876 24,909 0 0 11,440 84,782 50,672 26,535 253,722
Grand Total 4,372 10,621 2,642 3,871 61,016 23,859 568 0 11,440 205,160 610,421 68,045 1,004,108
22
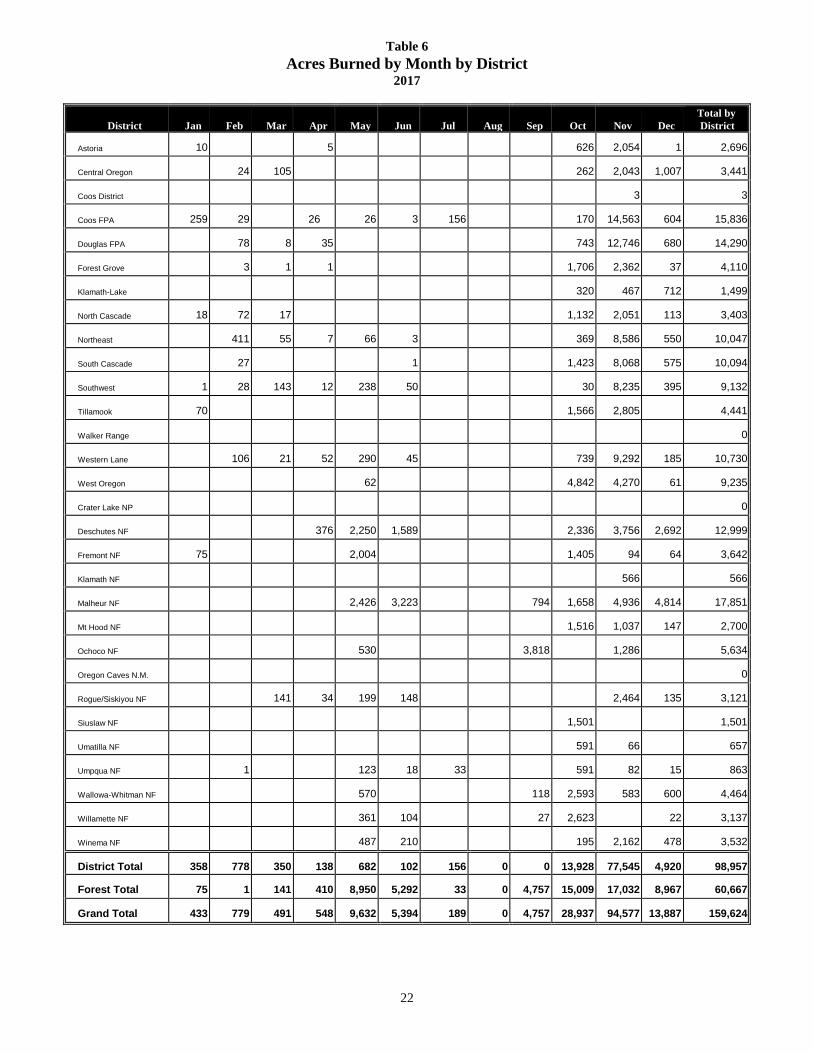
Table 6
Acres Burned by Month by District 2017
District Jan Feb Mar Apr May Jun Jul Aug Sep Oct Nov Dec
Total by
District
Astoria 10 5 626 2,054 1 2,696
Central Oregon 24 105 262 2,043 1,007 3,441
Coos District 3 3
Coos FPA 259 29 26 26 3 156 170 14,563 604 15,836
Douglas FPA 78 8 35 743 12,746 680 14,290
Forest Grove 3 1 1 1,706 2,362 37 4,110
Klamath-Lake 320 467 712 1,499
North Cascade 18 72 17 1,132 2,051 113 3,403
Northeast 411 55 7 66 3 369 8,586 550 10,047
South Cascade 27 1 1,423 8,068 575 10,094
Southwest 1 28 143 12 238 50 30 8,235 395 9,132
Tillamook 70 1,566 2,805 4,441
Walker Range 0
Western Lane 106 21 52 290 45 739 9,292 185 10,730
West Oregon 62 4,842 4,270 61 9,235
Crater Lake NP 0
Deschutes NF 376 2,250 1,589 2,336 3,756 2,692 12,999
Fremont NF 75 2,004 1,405 94 64 3,642
Klamath NF 566 566
Malheur NF 2,426 3,223 794 1,658 4,936 4,814 17,851
Mt Hood NF 1,516 1,037 147 2,700
Ochoco NF 530 3,818 1,286 5,634
Oregon Caves N.M. 0
Rogue/Siskiyou NF 141 34 199 148 2,464 135 3,121
Siuslaw NF 1,501 1,501
Umatilla NF 591 66 657
Umpqua NF 1 123 18 33 591 82 15 863
Wallowa-Whitman NF 570 118 2,593 583 600 4,464
Willamette NF 361 104 27 2,623 22 3,137
Winema NF 487 210 195 2,162 478 3,532
District Total 358 778 350 138 682 102 156 0 0 13,928 77,545 4,920 98,957
Forest Total 75 1 141 410 8,950 5,292 33 0 4,757 15,009 17,032 8,967 60,667
Grand Total 433 779 491 548 9,632 5,394 189 0 4,757 28,937 94,577 13,887 159,624
23
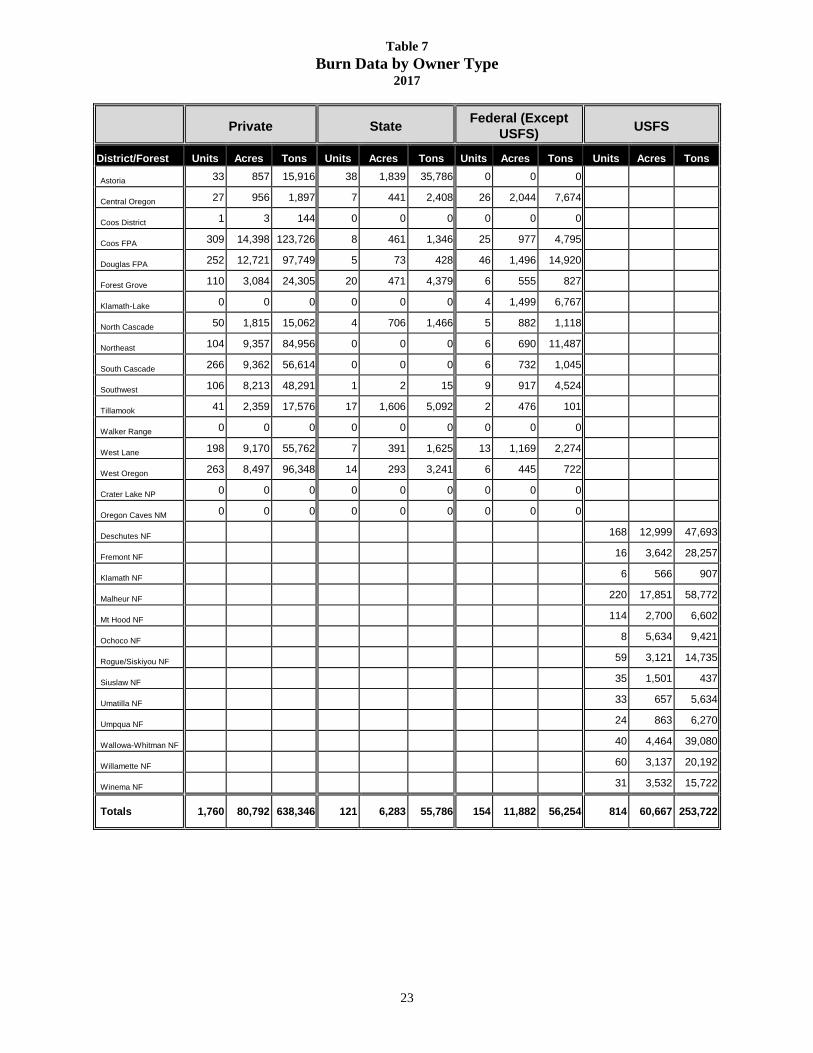
Table 7
Burn Data by Owner Type 2017
Private State
Federal (Except
USFS)
USFS
District/Forest Units Acres Tons Units Acres Tons Units Acres Tons Units Acres Tons
Astoria 33 857 15,916 38 1,839 35,786 0 0 0
Central Oregon 27 956 1,897 7 441 2,408 26 2,044 7,674
Coos District 1 3 144 0 0 0 0 0 0
Coos FPA 309 14,398 123,726 8 461 1,346 25 977 4,795
Douglas FPA 252 12,721 97,749 5 73 428 46 1,496 14,920
Forest Grove 110 3,084 24,305 20 471 4,379 6 555 827
Klamath-Lake 0 0 0 0 0 0 4 1,499 6,767
North Cascade 50 1,815 15,062 4 706 1,466 5 882 1,118
Northeast 104 9,357 84,956 0 0 0 6 690 11,487
South Cascade 266 9,362 56,614 0 0 0 6 732 1,045
Southwest 106 8,213 48,291 1 2 15 9 917 4,524
Tillamook 41 2,359 17,576 17 1,606 5,092 2 476 101
Walker Range 0 0 0 0 0 0 0 0 0
West Lane 198 9,170 55,762 7 391 1,625 13 1,169 2,274
West Oregon 263 8,497 96,348 14 293 3,241 6 445 722
Crater Lake NP 0 0 0 0 0 0 0 0 0
Oregon Caves NM 0 0 0 0 0 0 0 0 0
Deschutes NF 168 12,999 47,693
Fremont NF 16 3,642 28,257
Klamath NF 6 566 907
Malheur NF 220 17,851 58,772
Mt Hood NF 114 2,700 6,602
Ochoco NF 8 5,634 9,421
Rogue/Siskiyou NF 59 3,121 14,735
Siuslaw NF 35 1,501 437
Umatilla NF 33 657 5,634
Umpqua NF 24 863 6,270
Wallowa-Whitman NF 40 4,464 39,080
Willamette NF 60 3,137 20,192
Winema NF 31 3,532 15,722
Totals 1,760 80,792 638,346 121 6,283 55,786 154 11,882 56,254 814 60,667 253,722