Oregon Investment Council€¦ · Tom Lofton, Ben Mahon, Mike Mueller, Kevin Nordhill, ... Dykes...
95
Oregon Investment Council ~ Agenda ~ July 29, 2009 - 9:00 AM PERS Headquarters 11410 S.W. 68 th Parkway Tigard, OR 97223 Oregon Investment Council Katy Durant Chair Office of The State Treasurer Ben Westlund State Treasurer Ronald Schmitz Chief Investment Officer
Transcript of Oregon Investment Council€¦ · Tom Lofton, Ben Mahon, Mike Mueller, Kevin Nordhill, ... Dykes...

Oregon Investment
Council
~ Agenda ~ July 29, 2009 - 9:00 AM
PERS Headquarters
11410 S.W. 68th Parkway Tigard, OR 97223
Oregon Investment
Council
Katy Durant Chair
Office of The State Treasurer Ben Westlund State Treasurer
Ronald Schmitz Chief Investment Officer

OREGON INVESTMENT COUNCIL
2009 Meeting Schedule
Meetings Begin at 9:00 am
at PERS Headquarters Building
11410 SW 68th Parkway Tigard, OR 97223
January 28, 2009
February 25, 2009
April 17, 2009 Workshop
April 29, 2009
May 6, 2009 Telephonic Meeting
May 27, 2009
June 15, 2009 Telephonic Meeting
July 20, 2009 Workshop
July 29, 2009
September 30, 2009
October 28, 2009
December 2, 2009
OREGON INVESTMENT COUNCIL
Agenda
July 29, 2009 9:00 AM
PERS Headquarters
11410 S.W. 68th Parkway Tigard, Oregon
Time A. Action Items Presenter Tab
9:00-9:05 1. Review & Approval of Minutes Ron Schmitz 1 May 27, 2009 Chief Investment Officer June 15, 2009 July 20, 2009 9:05-9:45 2. Real Estate Annual Plan Brad Child 2 OPERF Real Estate Senior Investment Officer
Nori Gerardo Lietz Chief Strategist Private Real Estate, Partners Group Eliza Bailey Partners Group
9:45-10:00 3. Oregon Savings Growth Plan Consultant Mike Viteri 3 Investment Officer 10:00-10:30 4. Internal Equity Management Policies and Procedures Mike Viteri 4 OPERF Public Equity 10:30-10:45 ----------------Break---------------------
B. Information Items
10:45-11:00 5. Annual Audits Update Andrea Belz, CPA 5 Chief Audit Executive, OST 11:00-11:30 6. Annual Proxy Voting Update Jennifer Peet 6 Contracts & Corporate Governance Officer Robert McCormick Vice President of Proxy Research and Operations, Glass Lewis & Co.
Katy Durant Harry Demorest Ben Westlund Richard Solomon Keith Larson Paul Cleary Chair Vice-Chair State Treasurer Member Member PERS Director
(Ex-officio)

Katy Durant Harry Demorest Ben Westlund Richard Solomon Keith Larson Paul Cleary Chair Vice-Chair State Treasurer Member Member PERS Director
(Ex-officio)
11:30-11:45 7. Asset Allocations & NAV Updates Ron Schmitz 7 a. Oregon Public Employees Retirement Fund b. SAIF Corporation c. Common School Fund d. HIED Pooled Endowment Fund
8. Calendar—Future Agenda Items Ron Schmitz 8
9. Other Items Council Staff Consultants C. Public Comment Invited 15 Minutes

TAB 1 – REVIEW & APPROVAL OF MINUTES:
May 27, 2009
June 15, 2009
July 20, 2009

Oregon Investment Council MINUTES
May 27, 2009 Members Present: Ben Westlund, Paul Cleary, Harry Demorest, Katy Durant, Keith Larson, Dick
Solomon Staff Present: Josh Balloch, Brad Child, Natalya Cudahey, Michael Cutler, Stacey Dycus, Jay
Fewel, Sam Green, John Hershey, Brooks Hogle, Julie Jackson, Perrin Lim, Tom Lofton, Ben Mahon, Mike Mueller, Kevin Nordhill, Jen Peet, Ron Schmitz, James Sinks, Michael Viteri, Judy Whaley-Fultz
Consultants Present: Allan Emkin and Mike Moy from PCA, Nori Lietz from Partners Group, John
Meier and Mike Beasley from SIS, and David Fann from PCG Legal Counsel Present: D. Kevin Carlson, Oregon Department of Justice Ted Falk, Oregon Department of Justice Deena Bothello, Oregon Department of Justice The Oregon Investment Council was called to order at 9:04 a.m. by Katy Durant, Chair. IA. 9:04 a.m.: Review and Approval of Minutes MOTION: Ms. Durant brought approval of the April 17, April 29, and May 6, 2009 OIC minutes to the table. Mr. Solomon moved to approve the minutes. The motion was seconded by Mr. Demorest and passed by a vote of 4/0 (Treasurer Westlund had not yet arrived). 1B. Ratification of October 15, 2008 OIC Emergency Meeting Vote MOTION: Ms. Durant brought the ratification of the October 15, 2008 OIC meeting vote to the table. Mr. Solomon moved approval. The ratification was seconded by Mr. Demorest and passed by a vote of 4/0 (Treasurer Westlund had not yet arrived). II. 9:05 a.m.: Perspectives on the Current Market Howard Marks, Chairman, from Oaktree Capital Management gave his perspective on the current market. Mr. Marks talked about the “era of increasing willingness” (willingness to accept new paradigms, to forgo liquidity, to relax due diligence and forget to question skeptically are a few examples) that carried markets to higher highs and set the stage for a major correction of attitudes and behavior. Consumers, Corporations, Homeowners, Governments, and Investors all increased the use of credit, which accomplished the goal of expanding activity, but not without negative consequences. Mr. Marks went on to talk about leverage and how it does not make something a better investment, it merely magnifies both gains and losses. Mr. Marks also discussed how to “get out of this mess” and avoid negative consequences. The essential elements of recovery consist of delevering our economy at all levels, dealing with the related capital destruction, and restoring faith. There was a brief question and answer period following the presentation. III. 9:54 a.m.: AQR Capital Management-OPERF Opportunity Portfolio Staff and SIS recommended a commitment of $150 million to AQR/CNH subject to the negotiation of the requisite legal documents with staff working in concert with the Department of Justice. Staff and SIS have reviewed the AQR/CNH convertible arbitrage strategy and believes that it presents an attractive investment alternative for the Opportunity Portfolio. Staff and SIS believe this is an appropriate opportunity for the following reasons:
• The strategy captures the arbitrage opportunity between the convertible bond price and the underlying fundamental values while hedging the credit and interest rate risk of the portfolio and offers a more attractive risk/reward scenario than a long only strategy.
• The team has a successful history of managing dedicated convertible arbitrage strategies.
1 2009.05.27 OIC Minutes

• The firm has a long term relationship with the OIC and has an alignment of interest with clients through principal investments in their own funds.
John Hershey, Alternatives Investment Officer introduced Gregor Andrade and Michael Mendelson, with AQR Partners and Mark Mitchell with CHN. AQR/CHN offers four strategies that OPERF can choose from to best match its risk/return objectives to build a largely “buy and hold” portfolio. For all strategies, the expected time for the “cheapness factor” to return to “fair value” is approximately two years. Staff and SIS have focused primarily on the fully hedged/unlevered strategies that will remove some of the risks that are taken elsewhere in the portfolio. Convertible bonds are a combination of a bond and an equity option. As such, their trading price can be compared to the “theoretical” value of the option and the bond combined. The difference between the trading value and the theoretical value is known as a “cheapness” factor which can be positive (attractive) or negative (unattractive). For example, the median cheapness factor was - 3% for much of 2002-2003 (indicating the bonds traded at levels higher than their theoretical value). Conversely, the cheapness factor has been as high as a + 3% in 1998 and in 2000, which indicated bonds were trading at values below their intrinsic value. Typically, bonds trade “cheap” when liquidity premiums are particularly high. In 2007, the cheapness factor hovered around 0%. In 2008, after the Bear Stearns and Lehman Bros problems, the cheapness factor spiked to over 10%, higher than it’s even been. This spike resulted in convertible bonds losing 35.7% in 2008 when many investors were forced to sell their positions. While the cheapness factor has receded some from its highs, it is still very high based on historical prices. Mr. Demorest questioned what would happen if the cheapness factor goes away; we would need to reevaluate the strategy. There was a brief question and answer session following the presentation. Council asked Mr. Hershey to specifically tell them which strategy he is recommending for approval. Mr. Hershey recommended the fully hedged strategy where the best risk adjusted returns are apparent, with a modest amount of leverage (in the range of 1.0-1.5X). MOTION: Mr. Larson moved approval of the staff recommendation. Treasurer Westlund seconded the motion. The motion was passed by a vote of 4/1 with Mr. Solomon voting no. IV. 11:00 a.m.: Fischer Lynch Co-Investment Discussion/Negotiation of Investment Terms – Possible Executive Session The meeting did not go in to Executive Session. Staff and OIC Consultants discussed the current negotiation status with Fisher Lynch, vis-à-vis the recently adopted OIC Principles. There was discussion around fees and where specifically the disagreement was. Council did not vote on the staff recommendation-pending more information to come from Mike Beasley, SIS. V. 11:47 a.m.: Oak Hill Advisors LP & Fixed Income Recommendations-OPERF Fixed Income Staff recommended approval of: (1) a $1 billion commitment to Oak Hill Advisors, subject to the satisfactory negotiation of the required legal documents, working in concert with the DOJ; (2) the termination of Pyramis Global Advisors as a Core Plus fixed income manager; and (3) the revision to the core plus investment guidelines constraining below investment grade securities to 15%. Perrin Lim, Sr. Investment Officer gave some background on Oak Hill Advisors. Staff is extremely impressed with Oak Hill. They are a very experienced and deeply resourced investment manager of bank loans, high yield bonds and stressed/distressed investments with a close strategic relationship with Robert Bass, Oak Hill Capital Partners and other Oak Hill investment businesses. Oak Hill is one of OPERF’s strongest private equity relationships. In addition to prior meetings in Portland and NYC in 2008, staff and SIS conducted a due diligence meeting with OHA investment professionals on January 22, 2009. Mr. Lim introduced Glenn August, President and Senior Partner, and Bill Bohnsack, COO and Senior Partner from Oak Hill Advisors. The OHA investment process incorporates vigorous bottom-up, value oriented credit analysis, emphasizing careful consideration and understanding of relative value across industries and up and down company capital structures. As the current opportunities in the bank loan market are realized, staff foresees revisions to the investment guidelines to allow OHA to rotate additional exposure out of bank loans. Longer term,
2 2009.05.27 OIC Minutes

the mandate may well evolve to include other areas where OHA sees relative value, such as stressed/distressed and structured investments, subject to prior approval by the OIC. Mr. Lim and John Meier with SIS summarized each part of the staff recommendation and answered questions from the Council. MOTION: Mr. Demorest moved approval of all staff recommendations. Mr. Solomon seconded the motion. The motion passed by a vote of 5/0. VI. 12:24 p.m.: State Accident Insurance Fund Annual Update Mike Mueller, Deputy CIO introduced SAIF representatives Brenda Rocklin, President and CEO, Theresa McHugh, Vice President of Financial Operations, and Jerry Dykes, CFO. An overview of their handouts showed that there was a decrease in policy holders, a decrease in premium dollars they take in equaling about 8.5% and a decrease in surplus. Most of these decreases directly relate to the slowing economy. Mr. Dykes highlighted investment performance, including investment income which has steadily increased in 2008. There were some significant realized losses-the majority of that was for impaired bonds. Ms. McHugh talked about claim counts, which have steadily gone down since 2007. There has also been a shift in types of claims entered, with the more serious claim numbers staying about the same and all other claims going down. VII. 12:55 p.m.: External Public Equities Manager Recommendation Kevin Nordhill, Senior Public Equities Investment Officer and John Meier of SIS gave some background on why the changes to the public equities managers are warranted. After a brief question and answer period and some discussion, Mr. Nordhill brought the following recommendations to the Council:
• Adopt OIC Policy 4.05.01, the red-line changes to OIC Policy 4.01.18 and the Investment Objectives and
Policy Framework, and eliminate OIC Policies 4.05.11, 4.05.12, and 4.05.13. Re-number the existing OIC Policy 4.05.01 to 4.05.02.
• Terminate Goldman Sachs global equity mandate. • Terminate Franklin Portfolio Associates domestic equity mandate. • Terminate BGI U.S. and non-U.S. Alpha Tilts mandates (including the mandates for SAIF and the CSF
which will be indexed in the products with the same benchmarks). • Hire SSgA to manage a World ex-U.S. index fund. • Extend Next Century’s role to include a small cap growth allocation. • Rebalance assets from terminated managers to passive strategies.
MOTION: Mr. Solomon moved approval of all staff recommendations. Mr. Demorest seconded the motion. The motion passed by a vote of 5/0. VIII. 1:15 p.m.: Eudaimonia Asset Management Mr. Nordhill introduced Travis Prentice, President and Chief Investment Officer of Eudaimonia Asset Management. US Micro Cap securities present an attractive opportunity to capture an inefficient segment of the market. The Oregon Investment Council includes a micro cap manager in their portfolio and has benefited from this portion of the manager structure. Eudaimonia Asset Management offers the OIC an option for increasing their exposure to micro cap with a familiar team. Staff performed a variety of undertakings in determining the appropriateness in recommending this manager for funding, including on-site due diligence and one-on-one meetings with all investment professionals and compliance officers. After complete due diligence, staff recommended hiring Eudaimonia Asset Management for a Microcap Growth mandate and fund them with $50 million. Also, designate the Russell Microcap Growth index as the mandates benchmark and assign an excess return objective of 2.5 percent (net of fees). MOTION: Mr. Solomon moved approval of staff recommendation. Mr. Demorest seconded the motion. The motion passed by a vote of 5/0. IX. 1:30 p.m.: Shamrock Holdings-OPERF Opportunity Portfolio The OIC approved a $200 million commitment to the Shamrock Activist Value Fund, LP in April 2006 for the OPERF Opportunity Portfolio to pursue a concentrated, small cap public equity shareholder activist strategy. The original commitment (which began funding in August 2006), included a three year lock-up which expires in August
3 2009.05.27 OIC Minutes

2009. During that time there have been some management changes at Shamrock, which have impacted the confidence staff has with Shamrock. Staff believes there are other activist managers with a deeper team that might be worth considering. Given the change in portfolio manager, a lack of confidence in the current team, and the benefit of increased liquidity, staff recommends that the OIC authorize staff to begin an orderly redemption of its account as soon as the lock-up and terms of the contact allow. Staff recommended redeeming the Shamrock Activist Value Fund L.P. (“Shamrock”). MOTION: Mr. Demorest moved approval of the staff recommendation. Mr. Solomon seconded the motion. The motion was passed by a vote of 5/0. X. 1:32 p.m.: OPERF First Quarter Review Mike Beasley from Strategic Investment Solutions gave an update on the OPERF 1st quarter performance and the current market environment. XI. 1:45 p.m.: Asset Allocation and NAV Updates Mr. Schmitz reviewed the Asset Allocations and NAV’s for the period ended April 30, 2009. OPERF and SAIF are basically right on target; Real Estate, CSF and HIED are also within range. XII. 1:47 p.m.: Calendar – Future Agenda Items Mr. Schmitz highlighted future agenda topics. XIII. 1:50 p.m.: Other Business There was no other business discussed. 1:51 p.m.: Public Comments There were no public comments. The meeting adjourned at 1:51 p.m. Respectfully submitted,
Julie Jackson Executive Support Specialist
4 2009.05.27 OIC Minutes

RONALD D. SCHMITZ CHIEF INVESTMENT OFFICER INVESTMENT DIVISION
PHONE 503-378-4111 FAX 503-378-6772
STATE OF OREGON
OFFICE OF THE STATE TREASURER 350 WINTER STREET NE, SUITE 100
SALEM, OREGON 97301-3896
OREGON INVESTMENT COUNCIL JUNE 15, 2009
CONFERENCE CALL MEETING MINUTES
OIC Members Present: Ben Westlund, Paul Cleary, Harry Demorest, Katy Durant, Keith Larson, Dick Solomon
Staff Present: Darren Bond, Jay Fewel, Sam Green, Andy Hayes, Jennifer Peet, Ron Schmitz,
James Sinks, Michelle Winegar Consultants Present: David Fann, Sundeep Rana and Mike Krems from PCG Legal Counsel Present: D. Kevin Carlson, Oregon Department of Justice Ted Falk, Oregon Department of Justice Deena Bothello, Oregon Department of Justice KKR Staff Present: Scott Nuttall SEIU Reps Present: Linda Burgin and Dave Bolton The OIC meeting was called to order at 1:30 pm by Katy Durant, Chair. I. 1:32 pm KKR European Fund III Amendment and KKR European Fund II Annex Investment: Scott Nuttall with KKR gave a brief overview of the proposed KKR Annex Fund. Mr. Nuttall discussed the history of Fund II and Fund III and how and why they came up with the structure that they did. Concluding that the Annex Fund is really the consequence of all discussions; it was decided that they should do this as a rights offering to the Europe II investors, giving them the opportunity to protect their existing Fund II by shifting up to 15% of the Fund III commitment amount to the Annex Fund. There is no management fee associated with the Annex Fund and a 20% preferred return on individual Fund III portfolio companies. There was a brief question and answer session concluding with the motion. MOTION: Harry Demorest moved to divert 15% of our commitment to KKR Europe III to the KKR Europe II Annex Fund; Dick Solomon seconded the motion; the vote passed by a vote of 5/0. The meeting adjourned at 2:00 pm Respectfully Submitted,
Julie Jackson Executive Assistant

RONALD D. SCHMITZ CHIEF INVESTMENT OFFICER INVESTMENT DIVISION
PHONE 503-378-4111 FAX 503-378-6772
STATE OF OREGON
OFFICE OF THE STATE TREASURER 350 WINTER STREET NE, SUITE 100
SALEM, OREGON 97301-3896
OREGON INVESTMENT COUNCIL JULY 20, 2009
ENERGY INVESTING WORKSHOP MEETING MINUTES
OIC Members Present: Paul Cleary, Harry Demorest, Katy Durant, Dick Solomon, Ben Westlund
Staff Present: Darren Bond, Brad Child, Stacey Dycus, Jay Fewel, Sam Green, John
Hershey, Perrin Lim, Kevin Nordhill, Jennifer Peet, Ron Schmitz, Michael Selvaggio, James Sinks, Michael Viteri
Consultants Present: Eliza Bailey, Partners Group Legal Counsel Present: D. Kevin Carlson, Oregon Department of Justice Ted Falk, Oregon Department of Justice Deena Bothello, Oregon Department of Justice Guests Present: Ted Sickinger, the Oregonian Courtney Sherwood, Portland Business Journal The OIC meeting was called to order at 3:04 pm by Katy Durant, Chair. I. 3:05 pm Negotiation of Investment Agreements/Principles Discussion-Executive Session: Mr. Carlson (DOJ) read ORS 192.660(2)(f)(h)(j). The executive session, held pursuant to stated ORS, began at 3:07 pm. Quinn Moss, Partner with Orrick, Herrington & Sutcliffe LLP presented an update on the Private Partnership Investment Principles specific to OPERF. There was a brief question and answer period following the presentation. The meeting returned to public session at 4:39 pm II. 4:48 pm Energy Investing: Ron Schmitz introduced Howard Newman, Managing Director with Pine Brook Road Partners, LLC. Mr. Newman gave a brief history of his firm and their involvement with energy investing. Below is a summary of topics covered:
• Energy presents a wide range of investment opportunities. • Returns are supported by the need to attract new investment. • Volume growth, not price appreciation, is proper mindset. • Upstream sector remains attractive-especially oil exploration. • Natural gas requires a change in approach to be successful. • Infrastructure investing can be very attractive, but lower return area.

At the conclusion of Mr. Newman’s presentation, there was a brief question and answer period. The meeting adjourned at 5:48 pm Respectfully Submitted,
Julie Jackson Executive Assistant
Page 2

TAB 2 – REAL ESTATE ANNUAL REVIEW

OPERF Real Estate2008 Review & 2009 Overview

Feb 2007:Blackstone acquisition of EOP ($35 bn)
AAA Spreads
DJIA
Jan 2008:BofA buys Countrywide
Jul 2007:Bear Stearns subprime funds collapse
Mar 2008: Bear Stearns collapse
Jul 2008: FDIC seizes IndyMac
Nov 2008:Citi bailout #1
Sep 15, 2008:Lehman BK
Sep 7, 2008: Fannie, Freddie takeover
Feb 2009:Stimulus signed
Mar 23, 2009:PPIP announced
Jun-09
What Happened?
Oct 2008:TARP signed
Mar 3, 2009:TALF announced
May 26, 2009: S&P’s CMBS announcement
May 19, 2009: TALF Legacy program announced
DJIAAAA Spreads

It’s the Debt Stupid!!
No Debt – No Deals – No Market Value
Real Estate Recovery will lagEconomic Recovery and Return of the Debt Markets – As Always
July 29, 2009 Oregon Public Employees Retirement Fund 3
Presenter
Presentation Notes

New Issuance Has Ground to a Halt
New issuance of CMBS.
Domestic CMBS Issuance (in $ billions)

24-48 Months Ago 12 Months Ago Today
Term: 2 to 10 Years 3 to 5 Years Up to 3 Years
Loan to Value: 90% + available 60%-70% <60%
Debt Coverage: Based on pro-forma Based on in-place, contractual income
Based on T-12, with downward adjustments
Loan Spread: Little risk priced into deals 100bps-over Base Rate
Fear of declining asset values priced into deals 200bps-350bps over Base Rate
Banks required return factored into pricing; 350bps-500bps or higher over Base Rate
Sponsorship: Irrelevant Determining factor Existing relationships, strong track record
Underwriting: Poor - based requirement to sell loan
Stringent and detail oriented
Pessimistic case
Covenants: “Covenant light”financing
Focused on monitoring borrower performance
Partial to full recourse
Capital Availability: Plentiful Difficult to source Extremely scarce
2009 Lending Environment
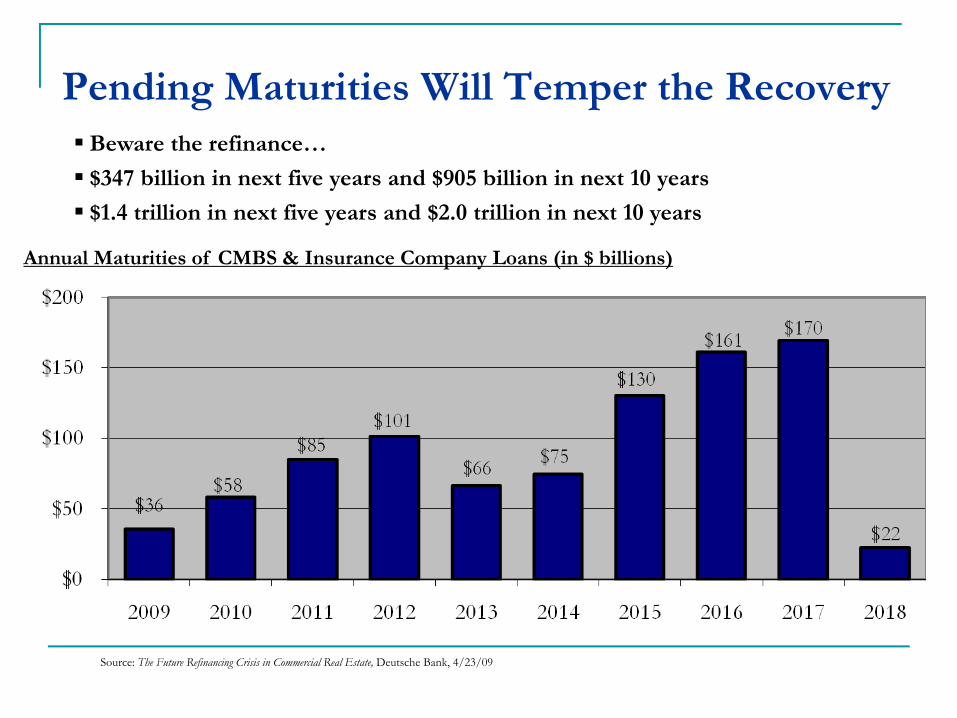
Pending Maturities Will Temper the RecoveryBeware the refinance…
$347 billion in next five years and $905 billion in next 10 years
$1.4 trillion in next five years and $2.0 trillion in next 10 years
Annual Maturities of CMBS & Insurance Company Loans (in $ billions)
Source: The Future Refinancing Crisis in Commercial Real Estate, Deutsche Bank, 4/23/09

Real Estate Market Overview –Deteriorating Fundamentals
Delinquency rates of mortgages have increased (with the economy).
Property fundamentals (and values) are deteriorating.
U.S. Office Vacancy
Unemployment
CMBS delinquency
16%
14%
12%
10%
8%
6%
4%
2%
0%

Location, Location, Location
Has become: Financing, Timing & Location
Financing: Supports Equity Values
Timing: Can you survive until demand returns?
Location: This is a Global Event Diversification didn’t helpWhere is Demand?
July 29, 2009 Oregon Public Employees Retirement Fund 8
Presenter
Presentation Notes

Real Estate Asset Values (all is not lost)
Time
PurchaseMarket
Adjustments
$$$
Sale
Valu
e
Cost Basis
Debt Balance
Presenter
Presentation Notes
July 29, 2009 Oregon Public Employees Retirement Fund 10
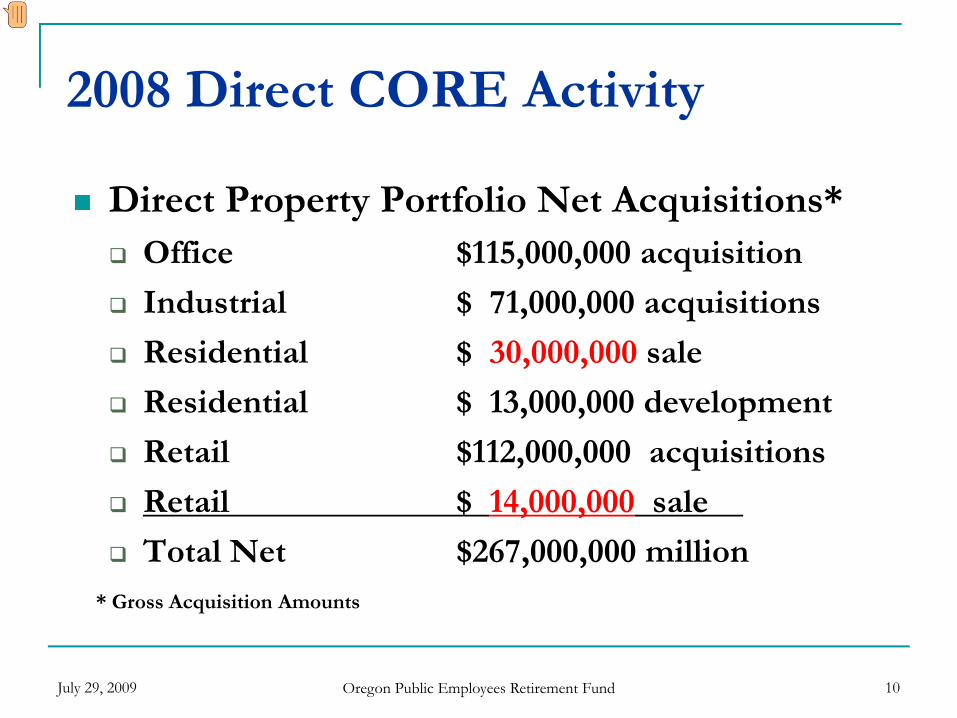
2008 Direct CORE Activity
Direct Property Portfolio Net Acquisitions*Office $115,000,000 acquisition
Industrial $ 71,000,000 acquisitions
Residential $ 30,000,000 sale
Residential $ 13,000,000 development
Retail $112,000,000 acquisitions
Retail $ 14,000,000 sale
Total Net $267,000,000 million* Gross Acquisition Amounts
Presenter
Presentation Notes

July 29, 2009 Oregon Public Employees Retirement Fund 11
Non-Mandate Program
No New Acquisitions in 2008
No Properties Declined for Conflict with Core
Existing Non-mandate Investments 12/31/08Lincoln Office $16 million NAV
Regency Retail $63 million NAV

2008 Portfolio Debt Limits
CORE Limit 50% of asset valueAggregate Debt at 12/31/08 less than 37%
Windsor Residential and Lincoln Industrial Portfolios have exceeded 50% limit as appraisal values have fallen. Aggregate debt is less than 55% in both cases.
Value-Added Limit 70%Aggregate Debt at 12/31/08 less than 63%
Guggenheim II, Rockwood VII, CBRE and Buchanan V Exceeded Debt limits due to value write-downs on collateral real estateGuggenheim Equity written to zero
July 29, 2009 Oregon Public Employees Retirement Fund 12

July 29, 2009 Oregon Public Employees Retirement Fund 13
Direct CORE Occupancy
Occupancy 12/31/07 12/31/08 6/30/09
Office 91.5% 92.8% 92.3%
Industrial 88.0% 92.6% 92.1%
Residential 95.8% 96.0% 97.9%
Retail 95.0% 94.0% 93.0%
Presenter
Presentation Notes

July 29, 2009 Oregon Public Employees Retirement Fund 14
2008 Fund Activity
2008 Fund CommitmentsCB Richard Ellis V $ 100,000,000Keystone Industrial II $ 100,000,000GI Partners III $ 200,000,000Guggenheim IIa * $ 100,000,000Starwood Hospitality II $ 100,000,000Rockwood VIII $ 100,000,000 Beacon VI $ 100,000,000 Aetos Asia III $ 100,000,000 Lone Star RE I $ 100,000,000Lone Star VI $ 500,000,000 Total 2008 Commitments $1,500,000,000Last New Deal Approved June 2008 (* Co-invest 10/08)
2008 Commitment Unfunded at 6/09 $1,000,000,000

July 29, 2009 Oregon Public Employees Retirement Fund 15
2009 Fund Activity – to date
2009 Fund Commitments
Western National $10,000,000Lehman Piece
Fortress III PIK $ 7,500,000Co-Investment
Starwood - SH Group $ 5,000,000
Total Commitments $22,500,000
Adjusting to the New OrderLone Star PendingDebt Deals Under Review
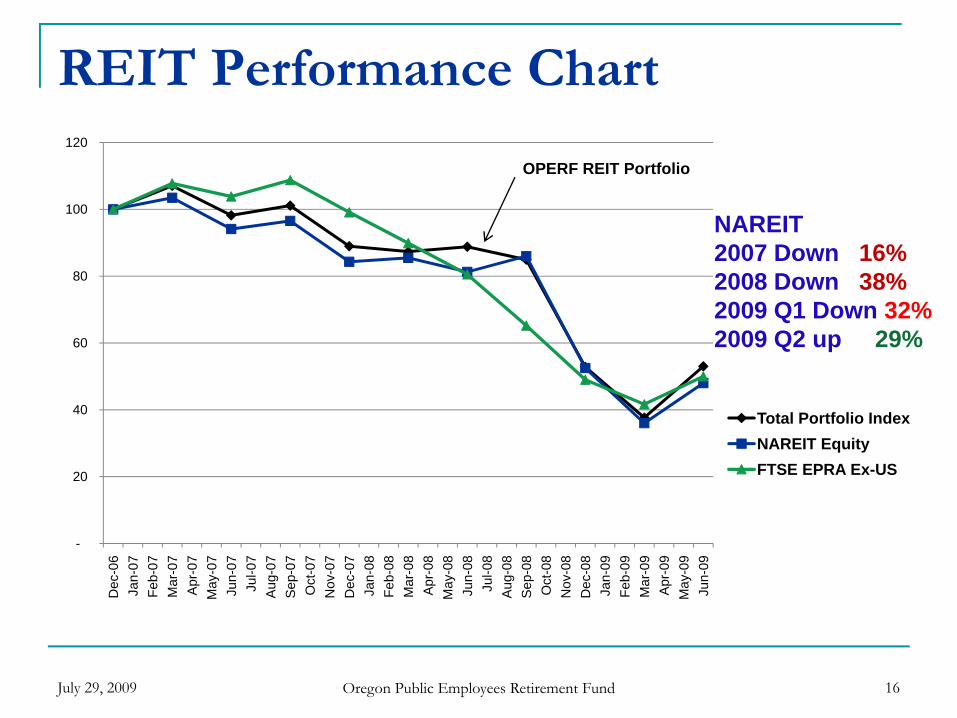
REIT Performance Chart
July 29, 2009 Oregon Public Employees Retirement Fund 16
-
20
40
60
80
100
120
Dec
-06
Jan-
07Fe
b-07
Mar
-07
Apr
-07
May
-07
Jun-
07Ju
l-07
Aug
-07
Sep
-07
Oct
-07
Nov
-07
Dec
-07
Jan-
08Fe
b-08
Mar
-08
Apr
-08
May
-08
Jun-
08Ju
l-08
Aug
-08
Sep
-08
Oct
-08
Nov
-08
Dec
-08
Jan-
09Fe
b-09
Mar
-09
Apr
-09
May
-09
Jun-
09
Total Portfolio IndexNAREIT EquityFTSE EPRA Ex-US
OPERF REIT Portfolio
NAREIT2007 Down 16%2008 Down 38%2009 Q1 Down 32%2009 Q2 up 29%

A Tale of Two Retail Mall REIT’sSimon vs General Growth
July 29, 2009 Oregon Public Employees Retirement Fund 17
$0
$20
$40
$60
$80
$100
$120
Simon Property (SPG) General Growth (GGP)
GGP Files BK

July 29, 2009 Oregon Public Employees Retirement Fund 18
May 2009 REIT Portfolio Rebalancing
Domestic Allocation Increased $200 Million $200 Million to LaSalle
Ex-US Allocation Increased $100 Million$100 Million to Morgan Stanley
May 2009 Flash Report Showed REIT’s at 18% of Real Estate Portfolio
Presenter
Presentation Notes

July 29, 2009 Oregon Public Employees Retirement Fund 19
What to Expect in 2009-10?Core Real Estate
Net Income weakening due to soft economyPricing and Deal Flow constrained due to lack of debt
REITsDomestic Prices will also hinge on debt availabilityWe still expect Global REIT investments to provide Diversification and growth particularly in Asia
Value Add & Opportunity FundsLooking for Distressed Sellers not Distressed PropertyWorking through the Pain
Presenter
Presentation Notes


July 29, 2009 Oregon Public Employees Retirement Fund 22
Global Investing

July 29, 2009 Oregon Public Employees Retirement Fund 23
New Investment in 2009-10
Core - Cash Flow OrientationDebt ProductsIndustrial Products“Trophy Office” and Class “A” Apartments
from distressed sellers
REITs – Prepare for RecoveryReview Structure of OPERF REIT Portfolio
Domestic Manager Performance & StrategyCORE, Retail Mall, Preferred Share
Structure Global Mandate versus Ex-US only
Presenter
Presentation Notes

July 29, 2009 Oregon Public Employees Retirement Fund 24
New Investment in 2009-10
Value Add and Opportunity FundsUtilize Unfunded Commitments - opportunisticallyRenew with Proven Producers (with discipline) New Debt StrategiesGlobal Value Add is a TargetSelective Secondary OpportunitiesOperating Platforms
In partnerships or “Club Deals”Narrow FocusFewer LP’s

TAB 3 – OREGON SAVINGS GROWTH PLAN CONSULTANT

Oregon Savings Growth Plan Investment Consultant Search
Recommendation Purpose To provide a summary of the search process for the Oregon Savings Growth Plan Investment Consultant RFP and to recommend a consultant to provide Investment and Plan Administration consulting services. Background The Oregon Growth Savings Plan (Plan or OGSP) is the State of Oregon’s 457 deferred compensation plan. It is a voluntary, supplemental retirement plan that provides eligible state and local government employees the opportunity to defer receipt of a portion of their current salary. These deferrals are invested in various investment vehicles until they are paid to the employee. Employees choosing to participate in the Plan build additional savings to supplement Social Security or other retirement benefits they may later receive. Generally, participants begin receiving payment from this Plan at retirement. Approximately 23,000 eligible employees participate in the Plan, which has assets totaling more than $862 million (as of June 30, 2009). Oversight of the Plan’s investment program is the responsibility of the Oregon Investment Council and is supported by Treasury staff. The Plan offers an array of eight investment options (Short-Term Fixed Option, Stable Value Option, Intermediate Bond Option, Large Company Value Stock Option, Stock Index Option, Large Company Growth Stock Option, International Stock Option, Small/Mid-Size Company Stock Option) and 10 Target Date Asset Allocations options. OSGP employs a mix of both passive and active management using both institutional commingled trust funds and mutual funds for each option. OSGP uses several managers currently engaged for OPERF. The benefits of this structure include: 1) Lower risk, as measured by tracking error, for each option through manager diversification; 2) More efficient and effective monitoring of managers by staff for those managers that also manage money for OPERF; and 3) Lower overall management fees. The average investment management fee/expense ratio for the entire OSGP is 24 basis points. In addition, the current administrative fee is 22 basis points and provides for the expenses of the recordkeeper (14 bps) and OSGP administration (8 bps). Oversight of the Plan’s non-investment related administrative program is the responsibility of the Oregon Public Employees Retirement Fund Board (OPERF Board) and is supported by the OSGP manager. Additional advice is provided by a seven member Deferred Compensation Advisory Committee, who advise and make recommendations to the OPERF Board concerning various activities such as:
• The OSGP fee structure and procedures; • State and federal legislative issues related to the administration of a deferred compensation plan; • The administration of the catch-up and the financial hardship provisions in Section 457 of the
Internal Revenue Code of 1986, as amended (Code); • Ways and means to inform and educate eligible employees about the Plan; • The expressed desires of eligible employees as to the Plan; • The actuarial characteristics of eligible employees.
At the February 26, 2009, OIC meeting, staff presented a review of the Plan and requested authorization to conduct a search for a full retainer consultant for the OSGP.

Discussion OST staff has historically provided all investment related advice and recommendations on the OSGP to the OIC. The OIC’s general consultant (SIS and previously Russell Consulting) has provided some limited advice regarding manager/fund replacements, however, consulting services for OSGP are not provided for in the contract. Additionally, the consulting advice that has been received has generally been limited to the institutional asset management universe, and has not focused on the mutual fund universe which constitutes the bulk of assets found within 457 plans. Given that there are over 25,000 different mutual funds available in the market place, staff feels that the OSGP would be better served by adding a consultant that has the expertise and resources to cover the mutual fund industry as well as the deferred compensation landscape as a whole. Given the level of uncertainty and volatility in the capital markets, which have been highlighted by some spectacular investment management failures, staff believes this is an appropriate time to obtain a full retainer consultant that would report to the OIC and provide investment consulting services on plan structure, managers searches, and brokerage window options, as well as provide plan administration advice and services regarding recordkeeping, technical/retirement services, and communications consulting to the OSGP manager. Staff has had numerous discussions with the OSGP Manager over the years about obtaining the services of full retainer consultant. Although cost has historically been a concern, the decision as to who would retain and monitor the consulting relationship has also been unclear (OIC or PERS). The OSGP is now at a size where the existing administrative fee on assets can support the cost of a full retainer consultant. Staff has met with Paul Cleary and the OSGP Manager specifically on this issue, and they support using the administrative fees for this purpose. Staff, with the aid of the Department of Justice, constructed a request for proposal (RFP) that was ultimately released on May 21, 2009. A total of seven consulting firms tendered responses to the RFP. An evaluation team comprised of Tom Lofton (OST – Investment Officer), Jen Peet (OST – Contracts and Governance Officer), Michael Viteri (OST –Investment Officer), Gay Lynn Bath (OSGP - Plan Manager), and Jason Evers (Deferred Compensation Advisory Committee Chair) each completed an independent scoring assessment of the seven responses to the RFP. Three semi-finalists were invited to interview with the evaluation team which took place on July 13, 2009. All semi-finalists consultants have significant experience with defined contribution plans, and specifically with 457 plans. The three semi-finalist firms were all deemed very capable of providing the desired consulting services. Staff checked numerous references for all three semi-finalists, all of which came back positive. The evaluation team was unanimous in its recommendation to hire Arnerich Massena who proposed the most favorable fee proposal. Recommendation Staff recommends the OIC hire Arnerich Massena to provide consulting services on the OSGP, subject to successful negotiation of the contract.

TAB 4 – INTERNAL EQUITY MANAGEMENT
POLICIES AND PROCEDURES

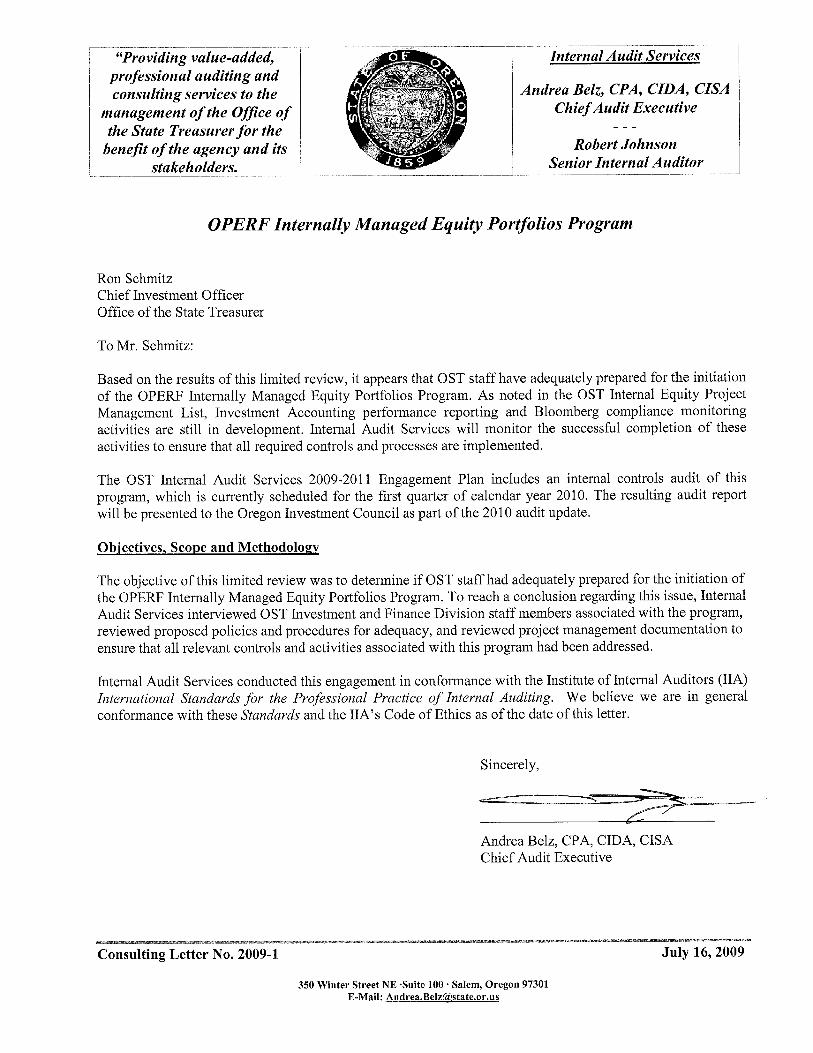
OPERF Internally Managed Equity Portfolios
Purpose Staff is seeking final OIC approval for the initiation of internally managed equity index funds. Background At the December 5, 2008, OIC meeting, staff and SIS presented the rationale for implementation of internally managed equity index funds. Staff also provided a brief presentation on the recommended mandates, benchmark selection and portfolio strategies that would be utilized in managing the index funds. Although the Office of the State Treasurer (OST) staff has managed the Oregon Short Term Fund (OSTF) and various other fixed income portfolios internally for decades, it wasn’t until 2005 that Oregon law was amended, allowing OST authority to internally manage publicly traded equity securities. The general motivation for public pension plans to manage equities in-house is best explained in an e-mail from Allan Emkin (PCA Consulting) to OST staff, where he stated:
“A number of other large public funds have started to increase their internal management of assets. This is being driven by two major factors: 1) Costs, manager fees, transaction costs, custody, etc; 2) Dissatisfaction with traditional active equity managers, especially in the large capitalization U.S. market. This has been an evolutionary process. The most common areas of internal management (other than cash) have been fixed income and domestic equity indexation”.
The benefits of managing equity index funds internally include: • Improved staff knowledge of equity markets, trading practices, and risk model platforms; • Improved revenue sharing and control of collateral reinvestment risk in securities lending
programs; • Improved corporate governance due to direct ownership of shares in the index portfolio; • More efficient management of total plan cash flows as it pertains to OPERF benefit
payments, private equity and real estate draw downs (externally managed funds have lengthy notification deadlines);
• Opportunities to add value by taking minor but controlled tilts away from the index.
The task of initiating internally managed equity index funds does not come without hurdles or risks, which include:
• Requires adequately trained/skilled staff [mitigant: existing staff with requisite skills and experience];
• Need to develop appropriate portfolio, trading, back-office, and compliance functions [mitigant: Similar systems and processes in place for OSTF, easily adapted to equity portfolios];

• Portfolio management staff may leave [mitigant: Staff to be cross-trained to minimize “Key man” risk and assets can simply be transferred to an external index fund provider];
• Portfolio may underperform specified benchmarks over the long-term [mitigant: OIC can terminate internal equity portfolios and move assets to an external index fund provider].
The proposed internal equity index fund mandates include a $400 million allocation to the S&P 500 index fund and a $100 million allocation to the S&P 400 index fund (mid cap). The rationale for managing S&P index-based mandates is due to the fact that OST staff has an eight year track record of managing multi-billion dollar S&P equity index mandates at a previous public fund pension plan. The S&P indexes differ from the Russell indexes, in that names are added and deleted continuously throughout the year. Russell rebalances their indexes annually. The more frequent and smaller composition changes provided by the S & P indexes allow more opportunity to add value by taking minor, but controlled, short-term tilts away from the index. Composition changes within the indexes typically occur as a result of market developments (mergers, acquisitions, bankruptcies), corporate actions (spin-offs, dividends, stock splits), or companies’ desire to issue/buy-back stock into/from the marketplace. Given the supply and demand pressures that occur around index composition changes, alpha can be added to a portfolio by trading ahead of, or after, an index change. The OIC authorized staff to pursue implementation of internal management of U.S. equity index funds and recommended that staff return to the OIC to demonstrate that all systems, processes, policies and procedures are complete prior to seeking final permission to initiate managing the proposed index funds.
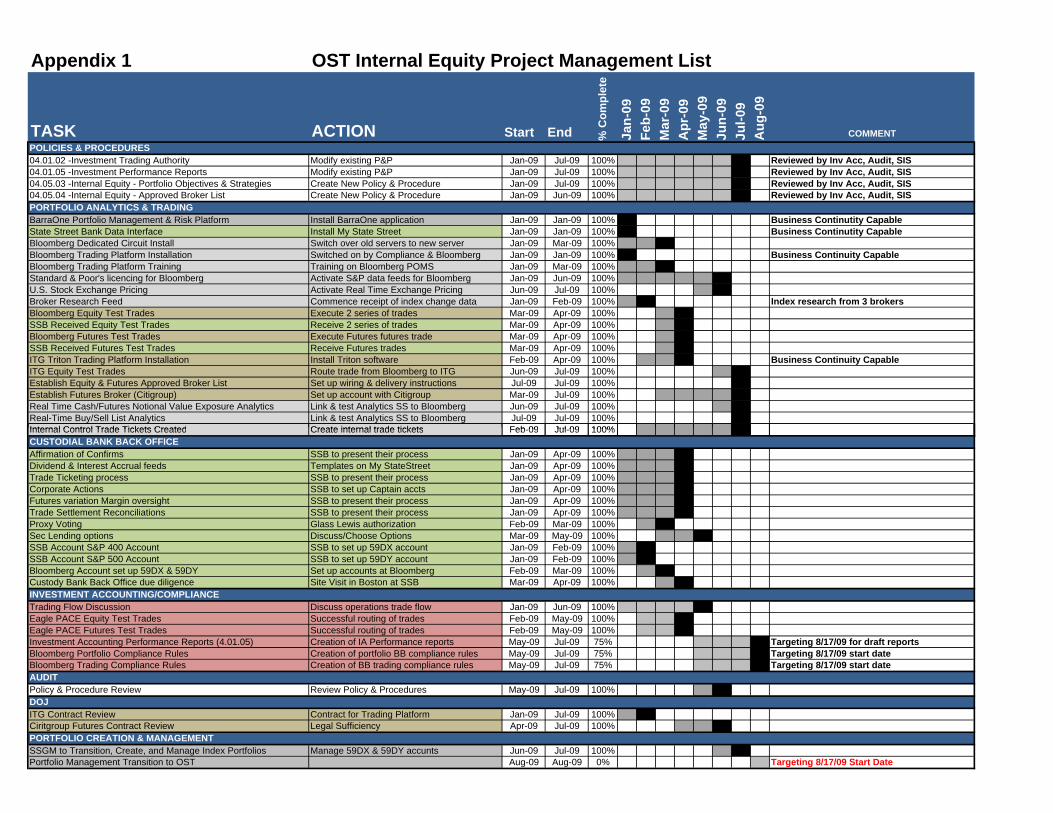
Discussion Many of the controls and critical resources needed to manage equity assets were already in place, and have been used to manage the OSTF for years. The Policies and Procedures, trading order management systems, custody bank back-office functionality, and Investment Accounting reconciliation/compliance processes that are in place to manage and monitor the OSTF, were simply duplicated and modified to fit the needs of internal equity management. The attached Gantt chart (Appendix 1) lists the activities and timelines necessary to build out the OST internal equity management infrastructure. Appendix 2 contains a trade flow process chart which illustrates how the sub-components of the internal equity management infrastructure interact. The following subject header paragraphs provide a brief description of each of the sub-components of the internal equity infrastructure build-out and are included (and color-coded) in both the Gantt and Trade Flow Process charts. Policies & Procedures- Two existing OIC Policies and Procedures (04.01.02-Investment Trading Authority; 04.01.05-Investment Performance Reports) and the OIC Statement of Fund Governance for OPERF were modified to include language relating to the internally managed equity portfolios. Additionally, two new OIC Policies and Procedures were created: Internal Equity - Portfolio Objectives & Strategies (04.05.03) and Internal Equity - Approved Broker List (04.05.04). All proposed policies and procedures have been reviewed and edited by OST Investment Accounting, OST Internal Audit and SIS Consulting. The following is a brief summary of the proposed policies and changes that follow this write up:

1. 4.01.02: Modified to provide OST staff authority to negotiate and execute trades in
public equities and public equities futures contracts; 2. 4.01.05: Modified to include OST Investment Accounting reporting on internally
managed equity portfolios (purchases/sales, gains/losses) and broker usage reports; 3. 4.05.03 Internal Equity-Portfolio Objectives & Strategies: New policy which provides
for performance objectives, permitted holdings, absolute restrictions, and trade ticketing procedures with respect to the internally managed equity portfolios;
4. 4.05.04 Internal Equity-Approved Broker List: New policy which provides for the selection and retention criteria of public equity security and futures brokers; and
5. Statement of Fund Governance: Modified to add language for internal equity management.
Portfolio Management and Trading Platforms- Bloomberg, which has been in place at OST for 19 years, provides market news, pricing, security analytics, trade routing, trade ticketing reconciliation functionality, and compliance monitoring (reconciliation and compliance used by OST Investment Accounting). All OST investment staff has access to Bloomberg platforms. Bloomberg is a crucial tool utilized for the management of the OSTF and will be likewise used for management of the internal equity program. BarraOne Equity Portfolio and Risk Management system was acquired and installed in late 2008 to assist in the oversight of external equity managers and will be used to manage portfolios and control risk on the internally managed equity index funds. ITG’s trading platform (called Triton) is a robust trading platform that provides trade analytics and execution services and was installed in April 2009. Although ITG is a broker, the Triton trading system is a broker neutral platform (meaning that trades can be routed to brokers other than ITG). Custodial Bank- State Street Bank (SSB) has been providing back-office functionality to the OSTF for several years. Portfolio management for the OSTF and the internal equity program is facilitated by MyStateStreet, a web-based data interface that provides numerous custody holdings and accruals reports. Back-office functionality provided by SSB includes, but is not limited to, corporate action processing, trade affirmation and settlement, and performance measurement. Investment Accounting- OST Investment Accounting has been providing portfolio compliance (facilitated through Bloomberg), portfolio holdings reports, trade reporting, and brokerage usage reports (facilitated through Investment Accountings record keeping program Eagle/Pace) for the OSTF, and is duplicating and modifying its processes to accommodate internal equity management. Portfolio and trading compliance rules are scheduled to be gradually phased in and “turned on” after internal portfolio management “goes live” to ensure that the programmed rules function as expected. OST Internal Audit is aware of the timing of the phased compliance rules and is comfortable with the controls and processes that are currently in place (see Appendix 3). At the May 27, 2009, meeting, the OIC approved several changes to the public equity asset class which included the consolidation of OIC Policies that defined the strategic role of the Domestic Equity Fund (DEF), the International Equity Fund (IEF) and the Global Equity Fund (GEF) into one Public Equity Fund policy. The OIC also authorized several manager terminations and

increased the allocation to passive index strategies, including the new S&P 500 and S&P 400 index funds. Staff engaged State Street Global Markets (SSgM) to manage all of the asset transition activity. SSgM created both S&P index portfolios and are managing them until the OIC gives staff final approval to manage the portfolios internally. In summary, all Policies and Procedures (if approved), portfolio management and trading systems, back office functionality, and compliance and reconciliation capabilities are currently in place. The S&P 500 and S&P 400 index funds have already been constructed with the recommended allocations of $400 million and $100 million, respectively, and staff is ready to commence the internally managed index program. Recommendation
• Adopt the red-line changes to OIC Policies 4.01.02; 04.01.05; and the OIC Statement of Fund Governance for OPERF.
• Adopt new OIC Policies 04.05.03 and 04.05.04. • Authorize staff to commence management of the internal equity index funds.
rol Ti d b 09 l 09 100%
Appendix 1 OST Internal Equity Project Management List
TASK ACTION Start End
o%
Cm
plet
e
Jan-
09Fe
9b-
0M
ar-0
9A
pr-0
9M
ay-0
9Ju
n-09
Jul-0
9A
ug-0
9
COMMENT POLICIES & PROCEDURES
04.01.02 -Investment Trading Authority Modify existing P&P Jan-09 Jul-09 100% Reviewed by Inv Acc, Audit, SIS04.01.05 -Investment Performance Reports Modify existing P&P Jan-09 Jul-09 100% Reviewed by Inv Acc, Audit, SIS04.05.03 -Internal Equity - Portfolio Objectives & Strategies Create New Policy & Procedure Jan-09 Jul-09 100% Reviewed by Inv Acc, Audit, SIS04.05.04 -Internal Equity - Approved Broker List Create New Policy & Procedure Jan-09 Jun-09 100% Reviewed by Inv Acc, Audit, SISPORTFOLIO ANALYTICS & TRADING BarraOne Portfolio Management & Risk Platform Install BarraOne application Jan-09 Jan-09 100% Business Continutity CapableState Street Bank Data Interface Install My State Street Jan-09 Jan-09 100% Business Continutity CapableBloomberg Dedicated Circuit Install Switch over old servers to new server Jan-09 Mar-09 100%Bloomberg Trading Platform Installation Switched on by Compliance & Bloomberg Jan-09 Jan-09 100% Business Continuity CapableBloomberg Trading Platform Training Training on Bloomberg POMS Jan-09 Mar-09 100%Standard & Poor's licencing for Bloomberg Activate S&P data feeds for Bloomberg Jan-09 Jun-09 100%U.S. Stock Exchange Pricing Activate Real Time Exchange Pricing Jun-09 Jul-09 100%Broker Research Feed Commence receipt of index change data Jan-09 Feb-09 100% Index research from 3 brokersBloomberg Equity Test Trades Execute 2 series of trades Mar-09 Apr-09 100%SSB Received Equity Test Trades Receive 2 series of trades Mar-09 Apr-09 100%Bloomberg Futures Test Trades Execute Futures futures trade Mar-09 Apr-09 100%SSB Received Futures Test Trades Receive Futures trades Mar-09 Apr-09 100%ITG Triton Trading Platform Installation Install Triton software Feb-09 Apr-09 100% Business Continuity CapableITG Equity Test Trades Route trade from Bloomberg to ITG Jun-09 Jul-09 100% Establish Equity & Futures Approved Broker List Set up wiring & delivery instructions Jul-09 Jul-09 100% Establish Futures Broker (Citigroup) Set up account with Citigroup Mar-09 Jul-09 100%Real Time Cash/Futures Notional Value Exposure Analytics Link & test Analytics SS to Bloomberg Jun-09 Jul-09 100%Real-Time Buy/Sell List Analytics Link & test Analytics SS to Bloomberg Jul-09 Jul-09 100%Internal Control Trade Tickets CreatedInternal Cont Trade ckets Create Create internal tradeCreate internal trade ticketicketsts Feb 09 Jul 09 100%Fe - Ju -CUSTODIAL BANK BACK OFFICEAffirmation of Confirms SSB to present their process Jan-09 Apr-09 100%Dividend & Interest Accrual feeds Templates on My StateStreet Jan-09 Apr-09 100%Trade Ticketing process SSB to present their process Jan-09 Apr-09 100%Corporate Actions SSB to set up Captain accts Jan-09 Apr-09 100%Futures variation Margin oversight SSB to present their process Jan-09 Apr-09 100%Trade Settlement Reconciliations SSB to present their process Jan-09 Apr-09 100%Proxy Voting Glass Lewis authorization Feb-09 Mar-09 100%Sec Lending options Discuss/Choose Options Mar-09 May-09 100%SSB Account S&P 400 Account SSB to set up 59DX account Jan-09 Feb-09 100%SSB Account S&P 500 Account SSB to set up 59DY account Jan-09 Feb-09 100%Bloomberg Account set up 59DX & 59DY Set up accounts at Bloomberg Feb-09 Mar-09 100%Custody Bank Back Office due diligence Site Visit in Boston at SSB Mar-09 Apr-09 100%INVESTMENT ACCOUNTING/COMPLIANCETrading Flow Discussion Discuss operations trade flow Jan-09 Jun-09 100%Eagle PACE Equity Test Trades Successful routing of trades Feb-09 May-09 100%Eagle PACE Futures Test Trades Successful routing of trades Feb-09 May-09 100%Investment Accounting Performance Reports (4.01.05) Creation of IA Performance reports May-09 Jul-09 75% Targeting 8/17/09 for draft reportsBloomberg Portfolio Compliance Rules Creation of portfolio BB compliance rules May-09 Jul-09 75% Targeting 8/17/09 start dateBloomberg Trading Compliance Rules Creation of BB trading compliance rules May-09 Jul-09 75% Targeting 8/17/09 start dateAUDITPolicy & Procedure Review Review Policy & Procedures May-09 Jul-09 100% DOJITG Contract Review Contract for Trading Platform Jan-09 Jul-09 100% Ciritgroup Futures Contract Review Legal Sufficiency Apr-09 Jul-09 100% PORTFOLIO CREATION & MANAGEMENTSSGM to Transition, Create, and Manage Index Portfolios Manage 59DX & 59DY accunts Jun-09 Jul-09 100% Portfolio Management Transition to OST Aug-09 Aug-09 0% Targeting 8/17/09 Start Date

Appendix 2 Trade Flow Process
OST MANAGED EQUITY PORTFOLIOSMyStateStreet S&P Index Changes BarraOne OST Analytics Bloomberg
Download holdings Brokerage Research Generate Trade Lists Real-time Trade Lists Pricing ConnectivityCorporate Actions Manage Risk Real-Time Futures Exposure Market Information
Custody Bank Back Office INV ACC COMPLIANCE SCREEN INV ACC RECONCILIATIONDTC Confirm/Affirm Bloomberg Order Management System EAGLE PACE Record KeepingTrade reconciliation Inv Acc Trading compliance SSB Reconciliation
Performance Measurement Bloomberg Trade Routing Inv Acc Portfolio Compliance
TRADING PLATFORMITG Inc Pre & Post Trade Analytics
ITG Inc Trade & ExecutionTrade Routing & Fills from other Brokers
Trade Execution Approved Broker List Execution

Page 1 of 1 Revised 4/20077/2009
OFFICE OF THE STATE TREASURER Investment Manual Policies and Procedures Activity Reference: 4.01.02 FUNCTION: General Policies and Procedures ACTIVITY: Investment Trading Authority POLICY: As delegated by the Treasurer, a Senior Investment Officer (including the
Chief Investment Officer and the Deputy Chief Investment Officer) has full authority to purchase or sell investments within the asset class for which the investment officer has responsibility, except as otherwise noted in the Policies and Procedures manuals. In exercising this delegated authority, Investment Officers and Investment Division staff are to invest funds managed as a prudent investor would do, under the circumstances then prevailing and in light of the purposes, terms, distribution requirements and laws governing each investment fund. (ORS 293.726)
PROCEDURES: 1. Short Term Investments. The Short Term Investment Officer may negotiate and
execute trades under the general guidance of the Senior Fixed Income Investment Officer. The Investment Analyst may trade under the guidance of the Senior Fixed Income Investment Officer or the Short Term Investment Officer. See also Policy 4.03.02.
2. Fixed Income Investments. The Short Term Investment Officer may negotiate and
execute trades under the general guidance of the Senior Fixed Income Investment Officer. The Short Term Investment Officer may not trade, without specific permission, in securities issued by an entity other than one which has issued securities already held in Oregon's fixed income portfolio. The Investment Analyst may trade under the specific direction of the Senior Fixed Income Investment Officer or the Short Term Investment Officer. Such trading will usually be limited to "swapping" one US Treasury security for another which has a different maturity date in order to take advantage of interest rate spreads.
3. Real Estate Investments. See Policy 4.04.01. 4. Equity Investments. The Equity Investment Officers may negotiate and execute
trades in public equities and public equity futures contracts under the general guidance of the Chief Investment Officer. The Equity Investment Officers may make recommendations and reports to the Council regarding the retention of investment management firms. The OIC maintains the authority to hire and dismiss investment management firms at will. The Equity Investment Officers and the Investment Analyst both have authority to review investment management firm transactions for contract compliance and consistency with the philosophy and expertise of those firms. While legally permissible, the OIC has not granted the Office of the State Treasurer Investment Division staff the authority to invest directly in equity securities.
5. Private Equity Investments. See Policy 4.06.01. SAMPLE FORMS, DOCUMENTS, OR REPORTS (Attached): None

Page 1 of 1 Revised July 20094/2007
OFFICE OF THE STATE TREASURER Investment Manual Policies and Procedures Activity Reference: 4.01.05 FUNCTION: General Policies and Procedures ACTIVITY: Investment Performance Reports POLICY: Performance and activity of the investment funds shall be reported in a manner
consistent with the asset class, this may include monthly reporting. The Office of the State Treasurer (OST) shall produce an Annual Report, including a section on the investment funds.
PROCEDURES: 1. Short-Term Investments. Each month, OST prepares a summary of the OSTF holdings and a
portfolio compliance report. The information is posted to OST’s website monthly. The master custodian provides the monthly performance of the OSTF, OST’s Finance Division determines the interest credited to customer accounts. An annual financial report is prepared by OST and is audited by the Secretary of State’s Audits Division.
2. Fixed Income Investments. Investment Accounting distributes a monthly trade report to the
Treasurer, the Deputy Treasurer, and to the Chief Investment Officer. The report includes summaries of internally managed security purchases, sales, and gains/(losses). The Fixed Income section also receives a report from Investment Accounting on broker usage (distribution) which is used by the Fixed Income section to create a broker usage report that is delivered to the Chief Investment Officer, the Deputy Chief Investment Officer, the Treasurer, the Deputy State Treasurer, and other investment division staff.
The report is accompanied, upon request, by a full portfolio of fixed income securities held by OST on
behalf of the investment funds. In addition, the state’s custodian provides monthly and quarterly performance information relative to agreed upon benchmarks.
3. Real Estate Investments. A performance reporting firm hired by OST prepares quarterly reports on
holdings and performance relative to benchmarks. This comprehensive report includes market value and performance information relative to OPERF’s entire real estate portfolio and is distributed to OIC members and OST staff, as requested. In addition, the real estate advisors, and the OIC’s real estate consultant, provide quarterly reports to members of the OIC and OST staff.
4. Equity Investments. The state’s custodian prepares monthly and quarterly performance reports
which include equity investments. The reports list the market value of the current holdings managed by each investment management firm and performance relative to OIC assigned benchmarks. Reports are distributed to OIC members, the Treasurer, the Deputy Treasurer, the Chief Investment Officer, and Investment Division staff. The OIC’s full service consultant provides, generally quarterly, a comprehensive review at an OIC meeting.
Investment Accounting distributes a monthly trade report to the State Treasurer, the Deputy Treasurer,
and to the Chief Investment Officer. The report includes summaries of internally managed security purchases, sales, and gains/(losses). The Public Equity section also receives a report from Investment Accounting on broker usage (distribution) which is used by the Public Equity section to create a broker usage report that is delivered to the Chief Investment Officer, the Deputy Chief Investment Officer, the Treasurer, the Deputy State Treasurer, and other investment division staff.
5. Private Equity Investments. Private Equity investments are reviewed by the Senior Equity
Investment Officer, the Private Equity Investment Officer, and the Chief Investment Officer, on a

OST Investment Manual Activity Reference: 4.01.05
Page 2 of 2 Revised July 2009/2007
continuing basis. The Private Equity consultant hired by the OIC reports on the holdings, investments, and performance of the private equity funds on a quarterly basis. At least annually, a complete overview of the portfolio is presented to the OIC by the OIC designated consultant.
SAMPLE FORMS, DOCUMENTS, OR REPORTS (Attached) None

OFFICE OF THE STATE TREASURER Investment Manual Policies and Procedures Activity Reference: 4.05.03 FUNCTION: Equity Investments ACTIVITY: Internal Equity – Portfolio Objectives & Strategies POLICY: All internal equity investments shall be authorized by a public equity
investment officer, authorization shall be documented, and shall be in accordance with portfolio guidelines established by the Oregon Investment Council.
PURPOSE
The purpose of this policy is to specify the portfolio strategies staff is authorized to manage internally and to define the tolerable risk, performance objectives, and permitted investments.
POLICY OBJECTIVES & STRATEGIES
S&P 500 Index Strategy 1. The objective of the S&P 500 Index portfolio is to closely match the S&P 500 Total
Return Index performance through a full replication strategy. 2. The S&P 500 Index Portfolio is expected to outperform the S&P 500 Total Return Index
by approximately 5 basis points annualized over a market cycle with an expected tracking error of 10 basis points.
S&P 400 Index Strategy 1. The objective of the S&P 400 Index portfolio is to closely match the S&P 400 Total
Return Index performance through a full replication strategy. 2. The S&P 400 Index Portfolio is expected to outperform the S&P 400 Total Return Index
by 10 basis points annualized over a market cycle with an expected tracking error below 30 basis points.
PERMITTED HOLDINGS S&P 500 Index Strategy 1. Securities contained in the S&P 500 Index. 2. Securities reasonably expected to be part of the S&P 500 Index at some future date. 3. Securities that have recently been a member of the S&P 500 Index. 4. Exchange Traded Funds (ETFs) which replicate the S&P 500 Index such as: iShares S&P
500 Index Fund (Ticker: IVV) or Spyders (Ticker: SPDR). 5. S&P 500 Index Futures (Large Contracts and Mini’s). 6. U.S. Treasury Bills or other acceptable cash equivalents utilized for equity futures
collateral. S&P 400 Index Strategy 1. Securities contained in the S&P 400 Index. 2. Securities reasonably expected to be part of the S&P 400 Index at some future date.
New July 2009

OFFICE OF THE STATE TREASURER Investment Manual Policies and Procedures Activity Reference: 4.05.03
2 New July 2009
3. Securities that have recently been a member of the S&P 400 Index. 4. Exchange Traded Funds (ETFs) which replicate the S&P 400 Index such as: iShares S&P
400 Index Fund (Ticker: IJH). 5. S&P 400 Index Futures (Large Contracts and Mini’s). 6. U.S. Treasury Bills or other acceptable cash equivalents utilized for equity futures
collateral. ABSOLUTE RESTRICTIONS The Internal Public Equity Portfolios may not purchase the following investments or types of
investments without the specific advanced approval of the Chief Investment Officer and the Oregon Investment Council:
1. Short sales of securities. 2. Margin purchases or other use of lending or borrowing money or leverage to create
positions greater than 100% of the market value of assets under management. 3. Commodities. 4. Non-U.S. dollar denominated fixed income securities issued by entities incorporated or
chartered outside of the United States. PROCEDURES:
1. All trades are entered into an Order Management System (OMS) such as Bloomberg POMS and are authorized by the signature (electronic or handwritten) of a Public Equity Investment Officer. The Public Equity Investment Officer shall act in accordance with established procedures and internal controls for the operation of the investment program consistent with this policy. The Senior Public Equity Investment Officer will review trades initiated by members of the Public Equity team. The Chief Investment Officer will review trades initiated by the Senior Public Equity Investment Officer.
SAMPLE FORMS, DOCUMENTS, OR REPORTS (Attached):

OFFICE OF THE STATE TREASURER Investment Manual Policies and Procedures Activity Reference: 4.05.04 FUNCTION: Equity Investments ACTIVITY: Internal Equity – Approved Broker List POLICY: OST staff shall maintain a list of acceptable brokers with whom equity
security trades may be executed for the internally managed portfolios. Only brokers with adequate financial resources that exhibit the ability to provide “best execution” shall be eligible for the Approved Broker list. All trades for the internally managed equity portfolios shall be executed through brokers on the Approved Broker list. Additions to the Approved Broker List shall be approved by the Chief Investment Officer.
PURPOSE
To establish the criteria for the selection and retention of brokers to act as authorized agents or principals in executing trades on behalf of the Oregon Public Employees Retirement Fund (OPERF).
ACCEPTABLE BROKER CRITERIA
1. Brokers must supply OST with three years of audited financial statements. Brokers on the Approved Broker list shall supply audited financial statements annually, as soon as they become available.
2. Brokers must not be under review for serious wrongdoing (penalties for which the
brokerage firm faces severe impairment of its abilities to conduct future business) nor under suspension by the Securities and Exchange Commission (SEC), Financial Industry Regulatory Authority (FINRA- Created in July 2007 through the consolidation of NASD and the member regulation, enforcement and arbitration functions of the New York Stock Exchange), U.S. Commodity Futures Trading Commission (CFTC), or other U.S. securities regulatory body.
3. Brokerage firms shall not have conflicts of interests due to direct familial relationships
between a supervisory or contact/executing broker and any direct relative of any OST Investment Division staff member.
4. The contact broker must have serviced an institutional client with over $1 billion of
equity assets and supply at least one reference to that relationship. 5. OST staff must be satisfied that the broker has the capability to execute trades in a
competent manner.
New July 2009
OFFICE OF THE STATE TREASURER Investment Manual Policies and Procedures Activity Reference: 4.05.04
2 Created January 5, 2009
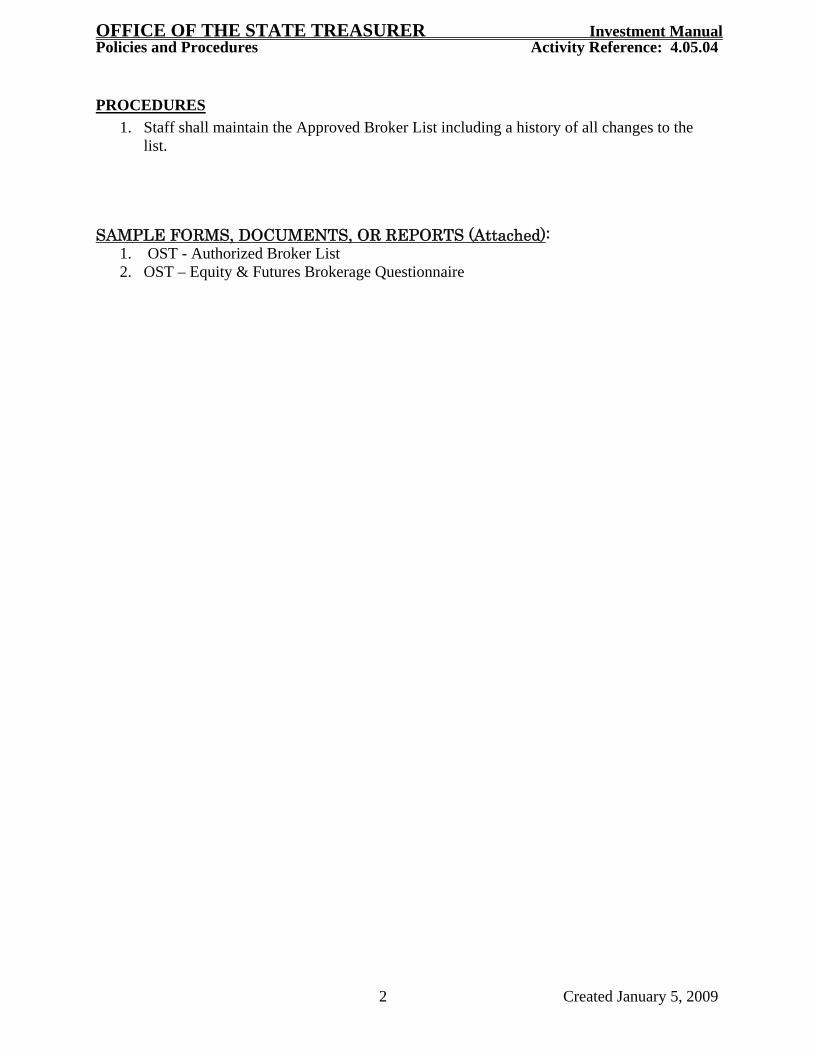
PROCEDURES 1. Staff shall maintain the Approved Broker List including a history of all changes to the
list. SAMPLE FORMS, DOCUMENTS, OR REPORTS (Attached):
1. OST - Authorized Broker List 2. OST – Equity & Futures Brokerage Questionnaire
1
Oregon Investment Council
Statement of
Fund Governance for the
Oregon Public Employees Retirement Fund
Adopted: February 27, 2002 Revised: April 28, 2004, January 18, 2006, May 31, 2006, July 29, 2009

2
Contents
1. Purpose 2. Guiding Principles 3. Investment Decisions Retained by Council 4. Investment Decisions Delegated to Treasury Staff 5. Investment Decisions Delegated to Investment Professionals 6. Effective Council Oversight Glossary of Selected Terms Terms highlighted in italics are explained in the glossary.

3
1.0 Purpose 1.1 This statement summarizes the governance structure established by the Oregon
Investment Council (the “Council”) to ensure the prudent, effective and efficient management of the assets of the Oregon Public Employees Retirement Fund (OPERF).
1.2 The Council approved this governance structure after careful consideration of alternative approaches to governing a very large and growing pension fund within an increasingly complex financial and investment environment.
1.3 The Statement has been prepared with five audiences in mind: 1) incumbent, new and prospective Council members; 2) Treasury staff; 3) OPERF active and retired members; 4) Oregon State Legislature and Governor; and 5) agents engaged by the Council to manage and administer OPERF assets.
1.4 The Statement summarizes more detailed policies and procedures documents prepared and maintained by Treasury staff, and numerous other documents that govern the day-to-day management of OPERF assets.
1.5 The Council regularly assesses the continued suitability of the OPERF governance structure, initiates change as necessary, and updates this Statement accordingly.
2.0 Guiding Principles 2.1 Three principles guided the Council’s development of the OPERF governance
structure: (a) To fulfill its role as governing fiduciary, the Council retains responsibility
for investment decisions. In accordance with ORS 293.721, the general duty of the Council “is to make the moneys as productive as possible,” subject to the standard of judgment and care in ORS 293.726. In addition, the “. . . assets of [OPERF] may not be diverted or otherwise put to any use that is not for the exclusive benefit of members and their beneficiaries” (ORS 238.660(2)).
(b) To ensure OPERF assets are prudently, profitably, and efficiently managed on a day-to-day basis, the Council has chosen to delegate the management and implementation of specified Council investment policies to qualified managing and operating fiduciaries. Such delegation is consistent with ORS 293.726(4)(b), which states the Council must “act with prudence in deciding whether and how to delegate authority and in the selection and supervision of agents.” Council delegates have the training, expertise, experience, tools and time to cost-effectively implement Council policies.
(c) To ensure effective oversight of delegates, the Council requires timely performance reports that reveal if delegates have complied with their mandates and guidelines, and indicate how assets under their care have performed relative to established investment objectives.
3.0 Investment Decisions Retained by the Council

4
3.1 The Council approves the following investment policies: (a) Total fund investment objective; (b) Target asset allocation policy; (c) Asset mix policy re-balancing ranges; (d) Asset class structural tilts; (e) Active management exposure within each asset class; (f) Manager structure within each asset class; and, (g) Retaining, terminating and replacing investment managers within each asset
class. 3.2 Before approving or amending policy decisions, the Council seeks advice,
guidance and recommendations from Treasury staff, Council-retained investment consultants, investment managers and other experts or sources as considered prudent by the Council.
3.3 Private equity investment commitments in first-time funds exceeding $100 million, or exceeding 200% increases in follow-on partnerships, must be brought to the Council for approval.
3.4 Real estate investment commitments in first-time funds exceeding $100 million, or exceeding 200% increases in follow-on partnerships or core managers, must be brought to the Council for approval.
4.0 Investment Decisions Delegated to Treasury Staff 4.1 The Council has delegated to qualified Treasury staff the following investment
management and implementation decisions: (a) Re-balancing of total fund, asset class and manager exposures to ensure
OPERF assets are within the total fund, asset class strategy and manager structure guidelines approved by the Council. Re-balancing activity is included as an information item in the Treasury staff’s monthly report to the Council.
(b) Recommending retaining, terminating and replacing investment managers within each asset class. Before recommending a manager change, Treasury staff will satisfy the Council that the manager change is supported by a satisfactory level of analysis and due diligence. This will include: documenting the reasons for the manager change, a list of the managers considered, the expected improvement in performance attributable to the change, how the manager complements the existing portfolio, verification that the change complies with the asset class strategy and manager structure approved by the Council, and access to all supporting working papers and reports. One or more Council members may elect to work with Treasury staff when manager issues are being examined.
(b)(c) The Equity Investment Officers may negotiate and execute trades in public equities and public equity futures contracts under the general guidance of the Chief Investment Officer for specific strategies defined in OIC Policy.

5
(c)(d) Preparing, negotiating and executing investment manager mandates, guidelines and fee agreements.
(d)(e) Overseeing individual investment managers to ensure their portfolios comply with their respective portfolio mandates and guidelines.
(e)(f) Providing oversight of the master custodian to ensure that the Fund’s rights to pursue securities class action litigation are appropriately protected.
4.2 In making these decisions, Treasury staff seeks the advice, guidance and recommendations from Council-retained investment consultants, investment managers and other experts and sources as considered prudent by Treasury Staff.
5.0 Investment Decisions Delegated to Investment Professionals 5.1 The Council has delegated to qualified investment managers the buying and
selling of individual securities and/or other investments authorized under the portfolio management guidelines approved by the Council.
5.2 The Council has delegated to a qualified independent third-party the voting of shareholder proxies that accompany the securities and/or investments held by the portfolio with oversight by Treasury staff and in accordance with Council voting guidelines.
6.0 Effective Council Oversight 6.1 The Council approves the criteria for monitoring and evaluating the impact of
different investment decisions on total fund, asset class, and manager level performance. Performance is monitored and evaluated with respect to investment risks taken, and investment returns earned.
6.2 Investment risks are monitored and evaluated quarterly by comparing total fund, asset class and manager holdings to the risk characteristics of suitable benchmarks. Additionally, the tracking error of the public asset classes and the total fund is monitored and reported to the Council, quarterly.
6.3 Investment returns are monitored monthly, and evaluated quarterly by comparing total fund, asset class and manager level returns against suitable benchmarks. Quarterly attribution reports identify the impact that Council, Treasury staff, and investment manager decisions have had on total fund, asset class and manager level returns over different time horizons.
6.4 Before approving or amending the criteria for monitoring and evaluating investment decisions, the Council seeks advice, guidance and recommendations from Treasury staff, Council-retained investment consultants, investment managers and other experts and sources as considered prudent by the Council.
Glossary
Benchmark: A standard by which investment performance can be measured and evaluated. For example, the performance of US equity managers is often measured and

6
evaluated relative to the benchmark performance of the Russell 3000 Index.
Governing, managing and operating fiduciaries. Terminology increasingly used in the pension field to distinguish between the governance, management and operations functions in a pension fund. The governance function is mission choice, funding and investment policy decisions, organizational design decisions, the monitoring of organizational effectiveness, and communication of results to stakeholders. This is the domain of governing fiduciaries. Management acts as advisors to the governing fiduciaries, devises strategies for achieving the fund mission and implementing the policies in a cost-effective manner, and organizes and monitors fund operations. This is the domain of managing fiduciaries. Finally, fund operations in the form of portfolio management, risk monitoring, and information system management and reporting are delegated to operating fiduciaries either inside or outside the pension fund organization. See Ambachtsheer, K. P. and D. Don Ezra, Pension Fund Excellence, Wiley, 1998, “Mapping the Road to Excellence”, chapter 3.
Investment Objectives: The investment objectives of OPERF are summarized in the Statement of Investment Objectives and Policy Framework for the Oregon Public Employees Retirement Fund.
Oregon Investment Council (OIC): Oregon Revised Statute (ORS) 293.706 establishes the OIC, which consists of five voting members, four of whom are subject to Senate confirmation (the Treasurer serves by position, and is not subject to confirmation). One member of the OIC is a public member who serves on the Public Employees Retirement Board. Three members, who are qualified by training and experience in the field of investment or finance, are appointed by the Governor, one member is the State Treasurer. In addition, the Director of the Public Employees Retirement System is an ex-officio member of the OIC. ORS 293.721 and 293.726 establish the investment objectives and standard of judgment and care for the OIC: Moneys in the investment funds shall be invested and reinvested to achieve the investment objective of the investment funds, which is to make the moneys as productive as possible, subject to the prudent investor standard.
Oregon Public Employees Retirement Fund (OPERF): Holds the assets of beneficiaries of the Oregon Public Employees Retirement System (PERS). PERS is a statewide-defined benefit retirement plan for units of state government, political subdivisions, community colleges, and school districts. PERS is administered under ORS chapter 238 and Internal Revenue Code 401(a) by the Public Employees Retirement Board (PERB). For state agencies, community colleges, and school districts, PERS is a cost-sharing, multiple-employer system. It is an agent multiple-employer system for political subdivisions. Participation by state government units, school districts, and community colleges is mandatory. Participation by most political subdivisions is optional but irrevocable if elected. All system assets accumulated for the payment of benefits may legally be used to pay benefits to any of the plan members or beneficiaries of the system. PERS is responsible for administrating the management of the plan’s liability and participant benefits.
Return: The gain or loss in value of an investment over a given period of time, expressed as a percentage of the original amount invested. For example, an initial investment of

7
$100 that grows to $105 over one year has earned a 5% return.
Risk: A statistical measure of the possibility of losing or not gaining value. May also be expressed as the probability of not achieving an expected outcome.
Tracking Error: When using an indexing or any other benchmarking strategy the amount by which the performance of the portfolio differed from that of the benchmark. In reality, no indexing strategy can perfectly match the performance of the index or benchmark, and the tracking error quantifies the degree to which the strategy differed from the index or benchmark. Usually defined as the standard deviation of returns relative to a pre-specified benchmark.
- end -

TAB 5 – ANNUAL AUDITS UPDATE

Office of the State Treasurer Audits Update
Purpose To provide the Oregon Investment Council with an update of the investment-related audit engagements completed by OST’s Internal Audit Services during the past year. Background Oregon Revised Statute (ORS) 293.776 states “The Oregon Investment Council shall provide for an examination and audit of the investment funds investment program, and for submission to the council of a report based on the examination and audit, at least once every four years and at other times as the council may require. The examination and audit, and the report based thereon, shall include an evaluation of current investment funds investment policies and practices and of specific investments of the investment funds in relation to the objective set forth in ORS 293.721, the standard set forth in ORS 293.726 and other criteria as may be appropriate, and recommendations relating to the investment funds investment policies and practices and to specific investments of the investment funds as are considered necessary or desirable. The council shall make copies of the report or a summary thereof available for distribution to interested persons.” Investment Policy 04.01.12 addresses this requirement as follows:
On an annual basis: The Office of the State Treasurer’s Internal Audit Services will perform an audit of the internal control structure over one of the major asset classes (i.e., Real Estate, Fixed Income, Public Equities, Private Equities, Opportunity Portfolio, or Short-term Investments) for each year ended June 30. The audit shall be performed in accordance with professional auditor’s standards approved by OST’s Audit Committee. At least once every four years: The Office of the State Treasurer (OST) will obtain the services of a qualified consultant to perform a procedural (operational) review of the investment portfolio (or area) and its practices as compared and contrasted to the investment portfolio practices of similarly managed investments in the private and public sectors.
Annual Internal Control Audits Beginning with fiscal year 1993, OST began a process of annually reviewing the internal controls of one of the major assets classes. The reviews performed to date are summarized below: Year Ended Area Firm June-1993 Equities KPMG June-1994 Real Estate KPMG June-1995 OSTF KPMG June-1996 Fixed Income KPMG June-1997 Alternative Equities KPMG

June-1998 Equities Deloitte & Touche June-1999 Real Estate Deloitte & Touche June-2000 OSTF Deloitte & Touche June-2001 Fixed Income Deloitte & Touche June-2002 Alternative Equities Deloitte & Touche June-2003 Public Equities Internal Audit Services June-2004 Real Estate Internal Audit Services June-2005 Short Term/Fixed Income Internal Audit Services June-2006 Private Equity Internal Audit Services June-2007 Real Estate Internal Audit Services June-2008 Public Equities Internal Audit Services
The Public Equity Internal Controls Audit report was issued by Internal Audit Services on March 31, 2009. All audit findings related to the Public Equity asset class have been resolved as of June 30, 2009. Operational Review In 2008 OST obtained the services of Ernst & Young to perform an operational review of the Oregon Public Employees’ Retirement Fund (OPERF) investment portfolio. A report addressing the firm’s findings was issued in December of 2008. OST staff are currently working to resolve two of the issues identified within this report, and expect to complete this work by the end of the calendar year. Other Investment-Related Audit Engagements The Investment Valuation and Financial Reporting Audit report was issued by Internal Audit Services on December 8, 2008. The objectives of this engagement were to identify opportunities to strengthen the control structure over investment valuation and financial reporting, and to perform limited testing of June 30, 2008, investment portfolio balances to determine if current controls were operating as designed. All audit findings related to this report have been resolved as of June 30, 2009. The Internal Controls Audit of Investment Portfolios Audit report was issued by Internal Audit Services on March 31, 2009. The objectives of this engagement were to: 1) Evaluate the control structure in place at OST over the Deferred Compensation Investment Program, the Common School Fund, the State Accident Insurance Fund, the Oregon University System Fund, and the Oregon Growth Account (OGA)(a fund over which the OIC does not have authority) and determine OST’s level of compliance with Investment Policy requirements related to these portfolios; and to 2) Evaluate the control structure in place at CTC Consulting, the OGA Board’s consultant, over the services they provide to the Board and the OGA portfolio. OST staff are currently working to resolve one remaining finding identified within this report, and expect to complete this work by the end of September. The Office of the Secretary of State Audits Division issued a management letter addressing their review of internal controls over financial reporting for the Office of the State Treasurer for the year ended June 30, 2008, on February 24, 2009. OST staff have made progress in resolving the finding noted within this letter, and expect to complete their work by the end of the calendar year. Recommendation None

TAB 6 – ANNUAL PROXY VOTING UPDATE

2008-09 Proxy Voting Summary and Current Issues Purpose To provide a summary of the votes Glass, Lewis and Co. cast on the OIC’s behalf for the period July 1, 2008 to June 30, 2009, and to provide a review of the recent proxy voting season and current issues. Background At the September 27, 2006 OIC meeting, the Council voted to retain Glass, Lewis and Co. as its proxy voting agent, and to follow Glass Lewis’ standard Proxy Paper Policy Guidelines. Glass Lewis replaced Institutional Shareholder Services (ISS), initially retained by the OIC in 2003 (the same year Glass Lewis was founded). Glass Lewis describes their proxy voting service as follows:
• The research is fully independent and objective; we are not in the business of providing consulting services to public companies and can therefore focus solely on the best interests of investors;
• The focus of the research is the economic and financial consequences of voting and therefore on improving medium- to long-term value and mitigating risk at public companies;
• Our approach to corporate governance is to look at each company individually and determine what is in the best interests of the shareholders of each particular company; we do not believe there is one answer that applies to every company;
• The research team is highly professional, with more than 70% of our research analysts holding graduate degrees in fields relevant to our research;
• Our research analysts are available to clients for questions or assistance on specific companies or meetings or for general corporate governance topics;
• We have a global presence, with research offices in Asia, Australia, North America and Europe; and
• Our research on proxies covers more than just corporate governance -- we analyze accounting, executive compensation, compliance with regulation and law, risks and risk disclosure, litigation and other matters that reflect on the quality of board oversight and company transparency.
The information for this presentation relates generally to Glass Lewis’ standard proxy voting policy. A summary of their Guidelines is available upon request. Information This report includes a comprehensive summary of the votes Glass Lewis cast on the OIC’s behalf for the fiscal year ended June 30, 2009. This report is included in accordance with OIC policy 4.05.06 (attached) that requires “Treasury staff [to] provide a . . . proxy voting summary to the OIC.” Staff Recommendation None. Information only.

Page 1 of 1 Revised 9/2006 Reviewed 4/2007
OFFICE OF THE STATE TREASURER Investment Manual Policies and Procedures Activity Reference: 4.05.06 FUNCTION: Equity Investments ACTIVITY: Exercise of Voting Rights Accompanying Equity Securities POLICY: The Council recognizes that the quality of corporate governance can affect
the long-term value of investments. In general, the equity markets are highly efficient; therefore, the OIC’s corporate governance philosophy anticipates that the OIC and Office of the State Treasurer (OST) staff possess no knowledge not shared by the market. The OIC therefore avoids attempts to micromanage companies in which the Fund has voting power, since boards of directors are elected to represent shareholders at this level. The OIC strives instead to ensure that corporations follow practices that advance economic value and allow the market to place a proper value on Fund assets.
The OIC recognizes that voting rights have economic value and must be
treated as such. The voting rights obtained through the holdings of the OPERF domestic and international equity portfolios shall be exercised by an independent third party specializing in proxy research and voting (“vendor”) in accordance with their independent voting standards which they may revise, at their sole discretion, from time to time. Such vendor shall always vote shares as a fiduciary, based solely on the ultimate economic value of OPERF’s investment.
BACKGROUND:
According to the CFA Institute (formerly, the Association for Investment Management and Research (AIMR)):
Corporate governance can be generally defined as the system by which corporations are directed and controlled. Common stock shareholders have the power through voting rights to influence the management of a corporation. Actively exercising these rights through corporate governance may be an effective way of enhancing portfolio value. Not exercising these rights ignores a valuable ownership right that could be managed for the benefit of the portfolio . . . In many instances, security holders and account owners delegate their right to vote proxies to professionals who manage their investments. Investment managers must, therefore, adopt procedures to ensure that proxy issues are sufficiently noted, analyzed, and considered to meet the managers’ fiduciary duty to their clients. Investment managers have an incumbent responsibility to be thoroughly familiar with the issues that arise in proxies . . . proxies have economic value and must be voted in the interest of the ultimate shareholder or plan beneficiary. Standards of Practices Handbook, 1999.
PROCEDURES:
1. Vendor shall keep a record of how proxies are voted and why.
Such records may be subject to review by OST staff or other designated representatives of the OIC.
2. OST staff shall provide a calendar year-end (or more frequently if requested by the OIC)
proxy voting summary to the OIC.

OFFICE OF THE STATE TREASURER Investment Manual Policies and Procedures Activity Reference: 4.05.06
Page 2 of 2 Revised 9/2006 Reviewed 4/2007
3. Vendor shall provide any new or revised proxy voting policies or guidelines to OST staff upon their implementation.
4. Commingled and passive account managers employed by the OIC shall vote their proxies
independent of the OIC’s vendor, but as a fiduciary in the best interest of plan participants. 5. In accordance with the vendor agreement, and the timelines therein, the OIC reserves the
right to vote proxies directly.
SAMPLE FORMS, DOCUMENTS, OR REPORTS (Attached): None
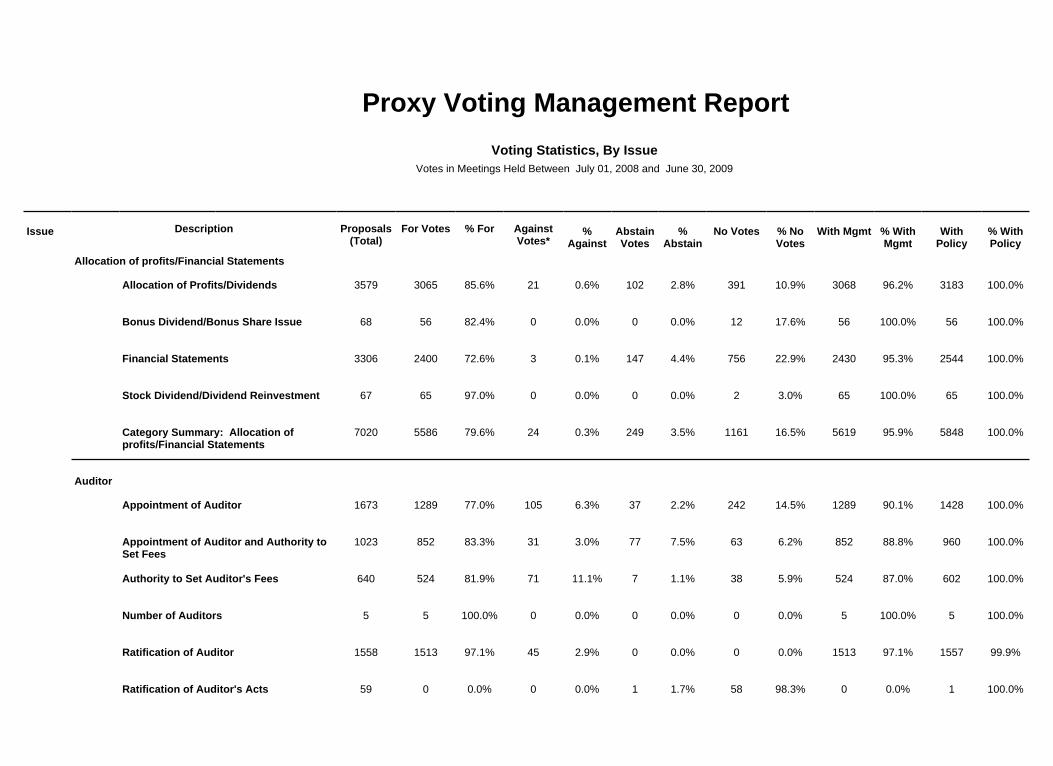
Authority to Set Auditor's Fees 640 524 81.9% 71 11.1% 7 1.1% 38 5.9% 524 87.0% 602 100.0%
Number of Auditors 5 5 100.0% 0 0.0% 0 0.0% 0 0.0% 5 100.0% 5 100.0%
Appointment of Auditor 1673 1289 77.0% 105 6.3% 37 2.2% 242 14.5% 1289 90.1% 1428 100.0%
Appointment of Auditor and Authority to Set Fees
1023 852 83.3% 31 3.0% 77 7.5% 63 6.2% 852 88.8% 960 100.0%
Ratification of Auditor's Acts 59 0 0.0% 0 0.0% 1 1.7% 58 98.3% 0 0.0% 1 100.0%
Ratification of Auditor 1558 1513 97.1% 45 2.9% 0 0.0% 0 0.0% 1513 97.1% 1557 99.9%
Auditor
Category Summary: Allocation of profits/Financial Statements
7020 5586 79.6% 24 0.3% 249 3.5% 1161 16.5% 5619 95.9% 5848 100.0%
Stock Dividend/Dividend Reinvestment 67 65 97.0% 0 0.0% 0 0.0% 2 3.0% 65 100.0% 65 100.0%
Bonus Dividend/Bonus Share Issue 68 56 82.4% 0 0.0% 0 0.0% 12 17.6% 56 100.0% 56 100.0%
Allocation of Profits/Dividends 3579 3065 85.6% 21 0.6% 102 2.8% 391 10.9% 3068 96.2% 3183 100.0%
Financial Statements 3306 2400 72.6% 3 0.1% 147 4.4% 756 22.9% 2430 95.3% 2544 100.0%
Allocation of profits/Financial Statements
Voting Statistics, By IssueVotes in Meetings Held Between July 01, 2008 and June 30, 2009
Proxy Voting Management Report
Issue Description Proposals (Total)
For Votes % For Against Votes*
% Against
Abstain Votes
% Abstain
No Votes % No Votes
With Mgmt % With Mgmt
With Policy
% With Policy

Issue Description Proposals (Total)
For Votes % For Against Votes
% Against
Abstain Votes
% Abstain
No Votes % No Votes
With Mgmt % With Mgmt
With Policy
% With Policy
Misc. Management Proposal Regarding Board
343 176 51.3% 19 5.5% 25 7.3% 123 35.9% 194 88.2% 220 100.0%
Election of Supervisory Board 1067 785 73.6% 151 14.2% 9 0.8% 122 11.4% 786 83.2% 938 100.0%
Election of Statutory Auditors 2009 1330 66.2% 563 28.0% 30 1.5% 86 4.3% 1330 69.2% 1923 100.0%
Number of Statutory Auditors 1 1 100.0% 0 0.0% 0 0.0% 0 0.0% 1 100.0% 1 100.0%
Category Summary: Board 45071 36672 81.4% 6125 13.6% 703 1.6% 1571 3.5% 36827 84.7% 43479 100.0%
Removal/Resignation of Director 40 24 60.0% 5 12.5% 0 0.0% 11 27.5% 29 100.0% 29 100.0%
Removal of Director(s) 3 1 33.3% 2 66.7% 0 0.0% 0 0.0% 3 100.0% 3 100.0%
Election of Shareholder Representatives 341 321 94.1% 0 0.0% 8 2.3% 12 3.5% 321 97.6% 329 100.0%
Board Size 159 149 93.7% 0 0.0% 5 3.1% 5 3.1% 149 96.8% 154 100.0%
Authorization of Board to Set Board Size 11 9 81.8% 2 18.2% 0 0.0% 0 0.0% 9 81.8% 11 100.0%
Authority to Fill Director Vacancy w/out Shareholder Approval
1 1 100.0% 0 0.0% 0 0.0% 0 0.0% 1 100.0% 1 100.0%
Change in Board Size 18 18 100.0% 0 0.0% 0 0.0% 0 0.0% 18 100.0% 18 100.0%
Election of Directors (Slate) 4075 3262 80.0% 620 15.2% 68 1.7% 125 3.1% 3262 82.6% 3944 99.8%
Election of Directors 36864 30520 82.8% 4753 12.9% 546 1.5% 1045 2.8% 30649 85.6% 35811 100.0%
Election of Board Committee Members 139 75 54.0% 10 7.2% 12 8.6% 42 30.2% 75 77.3% 97 100.0%
Board
Category Summary: Auditor 4958 4183 84.4% 252 5.1% 122 2.5% 401 8.1% 4183 91.8% 4553 100.0%

Issue Description Proposals (Total)
For Votes % For Against Votes
% Against
Abstain Votes
% Abstain
No Votes % No Votes
With Mgmt % With Mgmt
With Policy
% With Policy
Increase in Authorized Common Stock 50 30 60.0% 20 40.0% 0 0.0% 0 0.0% 30 60.0% 50 100.0%
Increase in Authorized Preferred Stock 7 7 100.0% 0 0.0% 0 0.0% 0 0.0% 7 100.0% 7 100.0%
Increase in Authorized Capital 981 661 67.4% 209 21.3% 7 0.7% 104 10.6% 661 75.4% 874 99.7%
Increase in/Authorization of Preferred Stock
9 0 0.0% 9 100.0% 0 0.0% 0 0.0% 0 0.0% 9 100.0%
Reduction in Authorized Capital (INACTIVE)
8 8 100.0% 0 0.0% 0 0.0% 0 0.0% 8 100.0% 8 100.0%
Issuance of Repurchased Shares 258 258 100.0% 0 0.0% 0 0.0% 0 0.0% 258 100.0% 258 100.0%
Limit to Capital Increase 158 113 71.5% 45 28.5% 0 0.0% 0 0.0% 113 71.5% 151 95.6%
Decrease in Authorized Common Stock 2 2 100.0% 0 0.0% 0 0.0% 0 0.0% 2 100.0% 2 100.0%
Amendment to Authorized Preferred Stock
8 8 100.0% 0 0.0% 0 0.0% 0 0.0% 8 100.0% 8 100.0%
Authority to Create Preferred Stock 20 19 95.0% 1 5.0% 0 0.0% 0 0.0% 19 95.0% 20 100.0%
Elimination of Dual Class Stock 1 1 100.0% 0 0.0% 0 0.0% 0 0.0% 1 100.0% 1 100.0%
Amendment to Authorized Common Stock
1 1 100.0% 0 0.0% 0 0.0% 0 0.0% 1 100.0% 1 100.0%
Authority to Issue Preferred Stock 83 62 74.7% 1 1.2% 11 13.3% 9 10.8% 62 83.8% 74 100.0%
Cancellation of Authorized Stock 586 489 83.4% 0 0.0% 4 0.7% 93 15.9% 489 99.2% 493 100.0%
Creation of New Share Class 16 16 100.0% 0 0.0% 0 0.0% 0 0.0% 16 100.0% 16 100.0%
Authority to Repurchase Shares 2069 1745 84.3% 86 4.2% 23 1.1% 215 10.4% 1745 94.1% 1851 100.0%
Cancellation of Authorized Preferred Stock
2 2 100.0% 0 0.0% 0 0.0% 0 0.0% 2 100.0% 2 100.0%
Change in Authorized Capital Stock

Issue Description Proposals (Total)
For Votes % For Against Votes
% Against
Abstain Votes
% Abstain
No Votes % No Votes
With Mgmt % With Mgmt
With Policy
% With Policy
Delisting 14 14 100.0% 0 0.0% 0 0.0% 0 0.0% 14 100.0% 14 100.0%
Elimination of Cumulative Voting 5 5 100.0% 0 0.0% 0 0.0% 0 0.0% 5 100.0% 5 100.0%
Amendment to Shareholder Rights' Plan 14 11 78.6% 3 21.4% 0 0.0% 0 0.0% 11 78.6% 14 100.0%
Amendment to Share Class Rights 8 8 100.0% 0 0.0% 0 0.0% 0 0.0% 8 100.0% 8 100.0%
Opting into State Takeover Law 3 3 100.0% 0 0.0% 0 0.0% 0 0.0% 3 100.0% 3 100.0%
Misc. Proposal Regarding Antitakeover Devices
66 0 0.0% 41 62.1% 0 0.0% 25 37.9% 0 0.0% 41 100.0%
Elimination of Supermajority Requirement
32 32 100.0% 0 0.0% 0 0.0% 0 0.0% 32 100.0% 32 100.0%
End to Supermajority Voting Requirement
1 1 100.0% 0 0.0% 0 0.0% 0 0.0% 1 100.0% 1 100.0%
Adoption of Majority Vote for Election of Directors
39 39 100.0% 0 0.0% 0 0.0% 0 0.0% 39 100.0% 39 100.0%
Adoption of Advance Notice Requirement 11 6 54.5% 5 45.5% 0 0.0% 0 0.0% 6 54.5% 11 100.0%
Amendment to Poison Pill 3 0 0.0% 3 100.0% 0 0.0% 0 0.0% 0 0.0% 3 100.0%
Adoption of Poison Pill 2 0 0.0% 2 100.0% 0 0.0% 0 0.0% 0 0.0% 2 100.0%
Amendment to Classified Board 1 1 100.0% 0 0.0% 0 0.0% 0 0.0% 1 100.0% 1 100.0%
Adoption of Supermajority Requirement 2 2 100.0% 0 0.0% 0 0.0% 0 0.0% 2 100.0% 2 100.0%
Adoption of Shareholder Rights' Plan 133 19 14.3% 113 85.0% 1 0.8% 0 0.0% 19 14.3% 133 100.0%
Change in Governance Structure
Category Summary: Change in Authorized Capital Stock
4261 3422 80.3% 371 8.7% 45 1.1% 423 9.9% 3422 89.2% 3825 99.7%
Reduction in Authorized Capital if Shares Repurchased (INACTIVE)
2 0 0.0% 0 0.0% 0 0.0% 2 100.0% 0 0.0% 0 0.0%

Issue Description Proposals (Total)
For Votes % For Against Votes
% Against
Abstain Votes
% Abstain
No Votes % No Votes
With Mgmt % With Mgmt
With Policy
% With Policy
Adoption of Employee Stock Purchase Plan
44 44 100.0% 0 0.0% 0 0.0% 0 0.0% 44 100.0% 44 100.0%
Adoption of Equity Compensation Plan 177 123 69.5% 54 30.5% 0 0.0% 0 0.0% 123 69.5% 177 100.0%
Adoption of Deferred Compensation Plan 2 2 100.0% 0 0.0% 0 0.0% 0 0.0% 2 100.0% 2 100.0%
Adoption of Director Equity Compensation Plan
22 21 95.5% 0 0.0% 0 0.0% 1 4.5% 21 100.0% 21 100.0%
Adoption of Restricted Stock Plan 1 1 100.0% 0 0.0% 0 0.0% 0 0.0% 1 100.0% 1 100.0%
Advisory Vote on Executive Compensation
87 78 89.7% 8 9.2% 1 1.1% 0 0.0% 78 89.7% 87 100.0%
Amendment to Bonus/162(m) Plan 56 56 100.0% 0 0.0% 0 0.0% 0 0.0% 56 100.0% 56 100.0%
Compensation
Category Summary: Change to Investment Policy
7 7 100.0% 0 0.0% 0 0.0% 0 0.0% 7 100.0% 7 100.0%
Amendment to Investment Policy/Restrictions
7 7 100.0% 0 0.0% 0 0.0% 0 0.0% 7 100.0% 7 100.0%
Change to Investment Policy
Requirement for Partial Takeover Bids 3 3 100.0% 0 0.0% 0 0.0% 0 0.0% 3 100.0% 3 100.0%
Restoration of Right to Call a Special Meeting
6 6 100.0% 0 0.0% 0 0.0% 0 0.0% 6 100.0% 6 100.0%
Reincorporation 35 35 100.0% 0 0.0% 0 0.0% 0 0.0% 35 100.0% 35 100.0%
Repeal of Classified Board 17 17 100.0% 0 0.0% 0 0.0% 0 0.0% 17 100.0% 17 100.0%
Category Summary: Change in Governance Structure
461 266 57.7% 169 36.7% 1 0.2% 25 5.4% 266 61.0% 436 100.0%
Waiving of Mandatory Takeover Requirement
65 64 98.5% 1 1.5% 0 0.0% 0 0.0% 64 98.5% 65 100.0%
Supermajority Voting Requirement 1 0 0.0% 1 100.0% 0 0.0% 0 0.0% 0 0.0% 1 100.0%
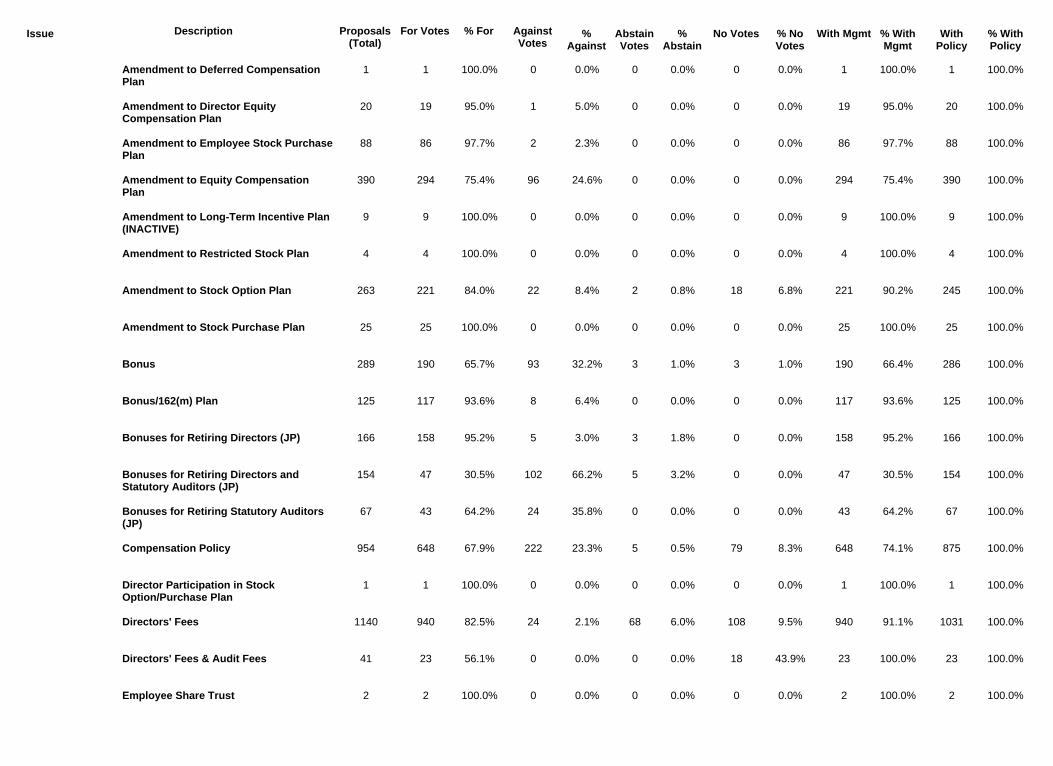
Issue Description Proposals (Total)
For Votes % For Against Votes
% Against
Abstain Votes
% Abstain
No Votes % No Votes
With Mgmt % With Mgmt
With Policy
% With Policy
Compensation Policy 954 648 67.9% 222 23.3% 5 0.5% 79 8.3% 648 74.1% 875 100.0%
Director Participation in Stock Option/Purchase Plan
1 1 100.0% 0 0.0% 0 0.0% 0 0.0% 1 100.0% 1 100.0%
Bonuses for Retiring Statutory Auditors (JP)
67 43 64.2% 24 35.8% 0 0.0% 0 0.0% 43 64.2% 67 100.0%
Bonuses for Retiring Directors (JP) 166 158 95.2% 5 3.0% 3 1.8% 0 0.0% 158 95.2% 166 100.0%
Bonuses for Retiring Directors and Statutory Auditors (JP)
154 47 30.5% 102 66.2% 5 3.2% 0 0.0% 47 30.5% 154 100.0%
Employee Share Trust 2 2 100.0% 0 0.0% 0 0.0% 0 0.0% 2 100.0% 2 100.0%
Directors' Fees 1140 940 82.5% 24 2.1% 68 6.0% 108 9.5% 940 91.1% 1031 100.0%
Directors' Fees & Audit Fees 41 23 56.1% 0 0.0% 0 0.0% 18 43.9% 23 100.0% 23 100.0%
Amendment to Equity Compensation Plan
390 294 75.4% 96 24.6% 0 0.0% 0 0.0% 294 75.4% 390 100.0%
Amendment to Long-Term Incentive Plan (INACTIVE)
9 9 100.0% 0 0.0% 0 0.0% 0 0.0% 9 100.0% 9 100.0%
Amendment to Employee Stock Purchase Plan
88 86 97.7% 2 2.3% 0 0.0% 0 0.0% 86 97.7% 88 100.0%
Amendment to Deferred Compensation Plan
1 1 100.0% 0 0.0% 0 0.0% 0 0.0% 1 100.0% 1 100.0%
Amendment to Director Equity Compensation Plan
20 19 95.0% 1 5.0% 0 0.0% 0 0.0% 19 95.0% 20 100.0%
Bonus 289 190 65.7% 93 32.2% 3 1.0% 3 1.0% 190 66.4% 286 100.0%
Bonus/162(m) Plan 125 117 93.6% 8 6.4% 0 0.0% 0 0.0% 117 93.6% 125 100.0%
Amendment to Stock Purchase Plan 25 25 100.0% 0 0.0% 0 0.0% 0 0.0% 25 100.0% 25 100.0%
Amendment to Restricted Stock Plan 4 4 100.0% 0 0.0% 0 0.0% 0 0.0% 4 100.0% 4 100.0%
Amendment to Stock Option Plan 263 221 84.0% 22 8.4% 2 0.8% 18 6.8% 221 90.2% 245 100.0%

Issue Description Proposals (Total)
For Votes % For Against Votes
% Against
Abstain Votes
% Abstain
No Votes % No Votes
With Mgmt % With Mgmt
With Policy
% With Policy
Authority to Give Guarantees 13 11 84.6% 0 0.0% 2 15.4% 0 0.0% 11 84.6% 13 100.0%
Approval of Borrowing 6 4 66.7% 0 0.0% 2 33.3% 0 0.0% 4 66.7% 6 100.0%
Amendment to Terms of Debt Instruments
2 1 50.0% 0 0.0% 1 50.0% 0 0.0% 1 50.0% 2 100.0%
Financing Transaction
Supervisory Board/ Corp Assembly Fees 99 61 61.6% 8 8.1% 0 0.0% 30 30.3% 61 88.4% 69 100.0%
Stock Purchase Plan 131 117 89.3% 1 0.8% 1 0.8% 12 9.2% 117 98.3% 119 100.0%
Exchange/Reprice Options 1 0 0.0% 1 100.0% 0 0.0% 0 0.0% 0 0.0% 1 100.0%
Category Summary: Compensation 7375 5729 77.7% 1064 14.4% 147 2.0% 435 5.9% 5744 82.8% 6933 99.9%
Stock Option Plan for Overseas Employees
42 42 100.0% 0 0.0% 0 0.0% 0 0.0% 42 100.0% 42 100.0%
Miscellaneous Proposal Regarding Executive Pay
3 3 100.0% 0 0.0% 0 0.0% 0 0.0% 3 100.0% 3 100.0%
Option Exchange/Repricing 27 6 22.2% 21 77.8% 0 0.0% 0 0.0% 6 22.2% 27 100.0%
Misc. Proposal Regarding Compensation 70 47 67.1% 0 0.0% 6 8.6% 17 24.3% 46 88.5% 53 100.0%
Issuance of Bonds with Warrants to Employees
6 1 16.7% 0 0.0% 0 0.0% 5 83.3% 1 100.0% 1 100.0%
Long-Term Incentive Plan (INACTIVE) 3 3 100.0% 0 0.0% 0 0.0% 0 0.0% 3 100.0% 3 100.0%
Stock Option Grants 546 311 57.0% 195 35.7% 0 0.0% 40 7.3% 311 61.5% 506 100.0%
Stock Option Plan 926 758 81.9% 110 11.9% 21 2.3% 37 4.0% 770 86.6% 889 100.0%
Statutory Auditors' Fees 44 37 84.1% 2 4.5% 2 4.5% 3 6.8% 38 92.7% 40 97.6%
Related Party Transactions 1349 1190 88.2% 65 4.8% 30 2.2% 64 4.7% 1193 92.8% 1280 99.7%
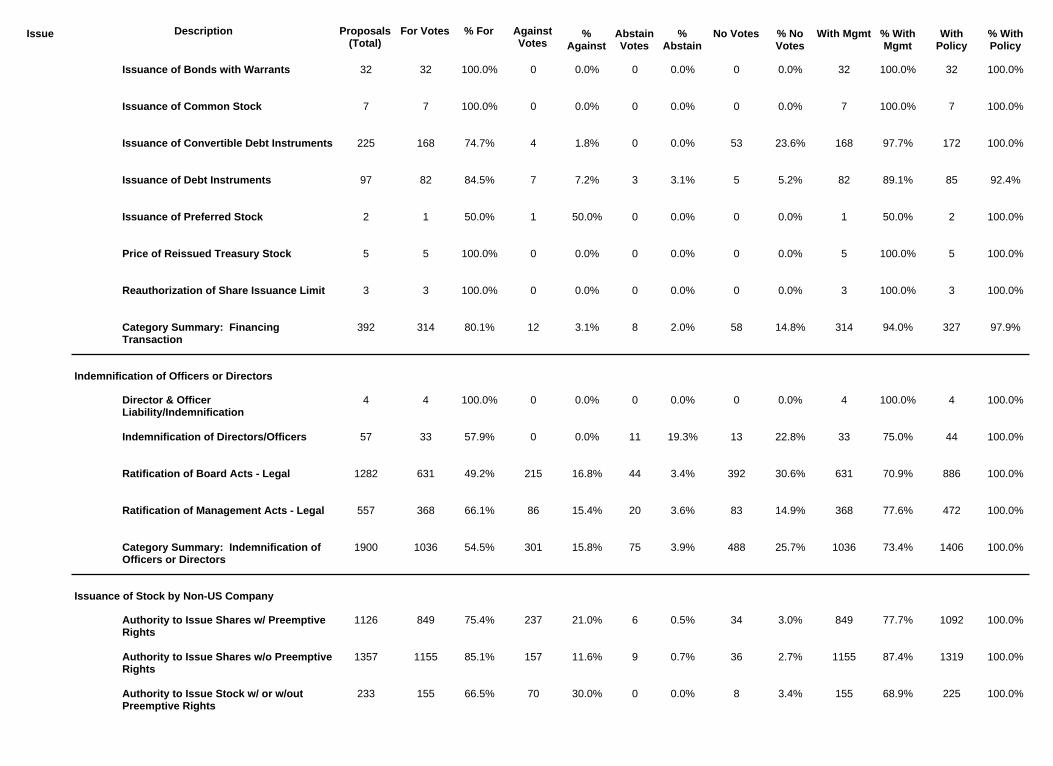
Issue Description Proposals (Total)
For Votes % For Against Votes
% Against
Abstain Votes
% Abstain
No Votes % No Votes
With Mgmt % With Mgmt
With Policy
% With Policy
Authority to Issue Shares w/o Preemptive Rights
1357 1155 85.1% 157 11.6% 9 0.7% 36 2.7% 1155 87.4% 1319 100.0%
Authority to Issue Shares w/ Preemptive Rights
1126 849 75.4% 237 21.0% 6 0.5% 34 3.0% 849 77.7% 1092 100.0%
Authority to Issue Stock w/ or w/out Preemptive Rights
233 155 66.5% 70 30.0% 0 0.0% 8 3.4% 155 68.9% 225 100.0%
Issuance of Stock by Non-US Company
Ratification of Board Acts - Legal 1282 631 49.2% 215 16.8% 44 3.4% 392 30.6% 631 70.9% 886 100.0%
Indemnification of Directors/Officers 57 33 57.9% 0 0.0% 11 19.3% 13 22.8% 33 75.0% 44 100.0%
Category Summary: Indemnification of Officers or Directors
1900 1036 54.5% 301 15.8% 75 3.9% 488 25.7% 1036 73.4% 1406 100.0%
Ratification of Management Acts - Legal 557 368 66.1% 86 15.4% 20 3.6% 83 14.9% 368 77.6% 472 100.0%
Director & Officer Liability/Indemnification
4 4 100.0% 0 0.0% 0 0.0% 0 0.0% 4 100.0% 4 100.0%
Indemnification of Officers or Directors
Issuance of Debt Instruments 97 82 84.5% 7 7.2% 3 3.1% 5 5.2% 82 89.1% 85 92.4%
Issuance of Convertible Debt Instruments 225 168 74.7% 4 1.8% 0 0.0% 53 23.6% 168 97.7% 172 100.0%
Issuance of Bonds with Warrants 32 32 100.0% 0 0.0% 0 0.0% 0 0.0% 32 100.0% 32 100.0%
Issuance of Common Stock 7 7 100.0% 0 0.0% 0 0.0% 0 0.0% 7 100.0% 7 100.0%
Issuance of Preferred Stock 2 1 50.0% 1 50.0% 0 0.0% 0 0.0% 1 50.0% 2 100.0%
Category Summary: Financing Transaction
392 314 80.1% 12 3.1% 8 2.0% 58 14.8% 314 94.0% 327 97.9%
Reauthorization of Share Issuance Limit 3 3 100.0% 0 0.0% 0 0.0% 0 0.0% 3 100.0% 3 100.0%
Price of Reissued Treasury Stock 5 5 100.0% 0 0.0% 0 0.0% 0 0.0% 5 100.0% 5 100.0%

Issue Description Proposals (Total)
For Votes % For Against Votes
% Against
Abstain Votes
% Abstain
No Votes % No Votes
With Mgmt % With Mgmt
With Policy
% With Policy
Elect Individuals to Adjust the Vote (INACTIVE)
1 0 0.0% 0 0.0% 0 0.0% 1 100.0% 0 0.0% 0 0.0%
Misc. Management Proposal 172 92 53.5% 9 5.2% 9 5.2% 62 36.0% 92 83.6% 110 100.0%
Authorization of Legal Formalities 30 26 86.7% 0 0.0% 0 0.0% 4 13.3% 26 100.0% 26 100.0%
Authorization of Charitable Donations 53 11 20.8% 0 0.0% 3 5.7% 39 73.6% 11 78.6% 14 100.0%
Opening (INACTIVE) 6 4 66.7% 0 0.0% 0 0.0% 2 33.3% 4 100.0% 4 100.0%
Misc. Proposal Regarding the Board 1 0 0.0% 1 100.0% 0 0.0% 0 0.0% 1 100.0% 1 100.0%
Misc. Proposal 3 3 100.0% 0 0.0% 0 0.0% 0 0.0% 2 66.7% 3 100.0%
Misc. Proposal Regarding Capital 312 205 65.7% 55 17.6% 3 1.0% 49 15.7% 205 77.9% 263 100.0%
Approve Minutes (INACTIVE) 1 1 100.0% 0 0.0% 0 0.0% 0 0.0% 1 100.0% 1 100.0%
Amendment to Par Value 18 7 38.9% 0 0.0% 0 0.0% 11 61.1% 7 100.0% 7 100.0%
Approval of Political Donation 266 260 97.7% 0 0.0% 5 1.9% 1 0.4% 260 98.1% 265 100.0%
Mgmt Proposal Regarding Misc.
Issuance of Stock w/out Preemptive Rights
90 79 87.8% 8 8.9% 0 0.0% 3 3.3% 79 90.8% 87 100.0%
Issuance of Stock w/ Preemptive Rights 61 51 83.6% 0 0.0% 0 0.0% 10 16.4% 51 100.0% 51 100.0%
Issuance of Stock w/ or w/out Preemptive Rights
33 31 93.9% 1 3.0% 0 0.0% 1 3.0% 31 96.9% 32 100.0%
Category Summary: Issuance of Stock by Non-US Company
2953 2369 80.2% 476 16.1% 15 0.5% 93 3.1% 2369 82.8% 2858 100.0%
Issuance of Warrants w/o Preemptive Rights
51 48 94.1% 2 3.9% 0 0.0% 1 2.0% 48 96.0% 50 100.0%
Issuance of Warrants w/ Preemptive Rights
2 1 50.0% 1 50.0% 0 0.0% 0 0.0% 1 50.0% 2 100.0%

Issue Description Proposals (Total)
For Votes % For Against Votes
% Against
Abstain Votes
% Abstain
No Votes % No Votes
With Mgmt % With Mgmt
With Policy
% With Policy
Amend Articles, Constitution, Bylaws - Bundled
944 632 66.9% 235 24.9% 3 0.3% 74 7.8% 632 72.6% 867 100.0%
Adoption of New Articles 319 221 69.3% 91 28.5% 7 2.2% 0 0.0% 221 69.3% 319 100.0%
Amendments to Articles (Technical) 1294 1144 88.4% 20 1.5% 4 0.3% 126 9.7% 1143 97.9% 1167 100.0%
Other Amendment to Charter
Declaration of Material Interest 1 0 0.0% 1 100.0% 0 0.0% 0 0.0% 0 0.0% 0 0.0%
Miscellaneous - Resident Status 10 5 50.0% 0 0.0% 5 50.0% 0 0.0% 10 100.0% 10 100.0%
OTHER 848 738 87.0% 94 11.1% 4 0.5% 12 1.4% 738 88.3% 828 100.0%
Category Summary: Miscellenous 859 743 86.5% 95 11.1% 9 1.0% 12 1.4% 748 88.4% 838 100.0%
Miscellenous
Routine Meeting Item 1713 1240 72.4% 0 0.0% 84 4.9% 389 22.7% 1288 98.4% 1321 100.0%
Stock Split 11 11 100.0% 0 0.0% 0 0.0% 0 0.0% 11 100.0% 11 100.0%
Right to Adjourn Meeting 92 83 90.2% 7 7.6% 0 0.0% 2 2.2% 83 92.2% 89 98.9%
Reduction in Share Premium Account 27 27 100.0% 0 0.0% 0 0.0% 0 0.0% 27 100.0% 27 100.0%
Reverse Stock Split 22 21 95.5% 0 0.0% 0 0.0% 1 4.5% 21 100.0% 21 100.0%
Use/Transfer of Reserves 73 56 76.7% 0 0.0% 1 1.4% 16 21.9% 56 98.2% 57 100.0%
Category Summary: Mgmt Proposal Regarding Misc.
3023 2048 67.7% 262 8.7% 108 3.6% 605 20.0% 2097 87.4% 2414 100.0%
Transact Other Business 176 1 0.6% 144 81.8% 3 1.7% 28 15.9% 2 1.4% 148 100.0%
Transaction of Other Business 46 0 0.0% 46 100.0% 0 0.0% 0 0.0% 0 0.0% 46 100.0%

Issue Description Proposals (Total)
For Votes % For Against Votes
% Against
Abstain Votes
% Abstain
No Votes % No Votes
With Mgmt % With Mgmt
With Policy
% With Policy
SHP Minimum Stock Ownership by Directors or Executives
2 0 0.0% 2 100.0% 0 0.0% 0 0.0% 2 100.0% 2 100.0%
SHP: Board
Category Summary: SHP: Auditor 6 0 0.0% 6 100.0% 0 0.0% 0 0.0% 6 100.0% 6 100.0%
SHP Regarding Limitations on Auditor Services
6 0 0.0% 6 100.0% 0 0.0% 0 0.0% 6 100.0% 6 100.0%
SHP: Auditor
Technical Amendments to Charter/Bylaw 17 15 88.2% 2 11.8% 0 0.0% 0 0.0% 15 88.2% 17 100.0%
Category Summary: Other Amendment to Charter
4772 3217 67.4% 767 16.1% 68 1.4% 720 15.1% 3218 79.4% 4046 100.0%
Amendments to Articles (Undisclosed) 1 0 0.0% 0 0.0% 1 100.0% 0 0.0% 0 0.0% 1 100.0%
Amendments to Articles - Relocation of Corporate Headquarters (INACTIVE)
3 3 100.0% 0 0.0% 0 0.0% 0 0.0% 3 100.0% 3 100.0%
Amendments to Articles, Constitution, Bylaws
2093 1116 53.3% 404 19.3% 53 2.5% 520 24.8% 1116 70.9% 1571 100.0%
Amendments to Articles - Dividend Distribution Rules (INACTIVE)
2 2 100.0% 0 0.0% 0 0.0% 0 0.0% 2 100.0% 2 100.0%
Amendments to Articles - Change in Company Name (INACTIVE)
15 15 100.0% 0 0.0% 0 0.0% 0 0.0% 15 100.0% 15 100.0%
Amendments to Articles - Change in Company Purpose (INACTIVE)
3 3 100.0% 0 0.0% 0 0.0% 0 0.0% 3 100.0% 3 100.0%
Amendments to Charter/Bylaw - Bundled 17 15 88.2% 2 11.8% 0 0.0% 0 0.0% 15 88.2% 17 100.0%
Misc. Charter Amendments 16 16 100.0% 0 0.0% 0 0.0% 0 0.0% 16 100.0% 16 100.0%
Misc. Bylaw Amendments 2 2 100.0% 0 0.0% 0 0.0% 0 0.0% 2 100.0% 2 100.0%
Company Name Change 8 8 100.0% 0 0.0% 0 0.0% 0 0.0% 8 100.0% 8 100.0%
Misc. Article Amendments 38 25 65.8% 13 34.2% 0 0.0% 0 0.0% 27 71.1% 38 100.0%

Issue Description Proposals (Total)
For Votes % For Against Votes
% Against
Abstain Votes
% Abstain
No Votes % No Votes
With Mgmt % With Mgmt
With Policy
% With Policy
SHP Regarding Advisory Vote on Compensation (Say on Pay)
249 243 97.6% 6 2.4% 0 0.0% 0 0.0% 6 2.4% 249 100.0%
SHP Regarding Allowing Shareholders to Vote on [Some Aspect] of Compensation
35 13 37.1% 22 62.9% 0 0.0% 0 0.0% 22 62.9% 35 100.0%
SHP Advisory Vote on Compensation Report (Say on Pay)
93 77 82.8% 0 0.0% 0 0.0% 16 17.2% 2 2.6% 77 100.0%
SHP Pay for [superior] Performance 8 0 0.0% 8 100.0% 0 0.0% 0 0.0% 8 100.0% 8 100.0%
SHP Regarding Compensation Consultants
7 7 100.0% 0 0.0% 0 0.0% 0 0.0% 0 0.0% 7 100.0%
SHP: Compensation
Category Summary: SHP: Board 422 109 25.8% 299 70.9% 13 3.1% 1 0.2% 303 72.1% 420 99.8%
SHP Regarding Amendments to Board Procedures
1 0 0.0% 1 100.0% 0 0.0% 0 0.0% 0 0.0% 1 100.0%
SHP Regarding Removal of Director(s) 71 1 1.4% 62 87.3% 8 11.3% 0 0.0% 63 88.7% 71 100.0%
SHP Regarding Election of Dissident Supervisory Board Member(s)
5 0 0.0% 0 0.0% 5 100.0% 0 0.0% 0 0.0% 4 80.0%
SHP Regarding Independent Board Chairman/Seperation of Chair and CEO
72 72 100.0% 0 0.0% 0 0.0% 0 0.0% 0 0.0% 72 100.0%
SHP Regarding Election of Dissident Board Member(s)
60 16 26.7% 43 71.7% 0 0.0% 1 1.7% 43 72.9% 59 100.0%
SHP Regarding Board Composition 99 0 0.0% 99 100.0% 0 0.0% 0 0.0% 99 100.0% 99 100.0%
SHP Regarding Board Independence 38 6 15.8% 32 84.2% 0 0.0% 0 0.0% 32 84.2% 38 100.0%
SHP Regarding Nominating a Lead Director
6 6 100.0% 0 0.0% 0 0.0% 0 0.0% 0 0.0% 6 100.0%
SHP Regarding Nominating Committee 4 4 100.0% 0 0.0% 0 0.0% 0 0.0% 4 100.0% 4 100.0%
SHP Regarding Limit on Board Memberships
49 0 0.0% 49 100.0% 0 0.0% 0 0.0% 49 100.0% 49 100.0%
SHP Regarding Misc. Board Issue 15 4 26.7% 11 73.3% 0 0.0% 0 0.0% 11 73.3% 15 100.0%

Issue Description Proposals (Total)
For Votes % For Against Votes
% Against
Abstain Votes
% Abstain
No Votes % No Votes
With Mgmt % With Mgmt
With Policy
% With Policy
SHP Regarding Formation of Environmental Committee of the Board
5 0 0.0% 5 100.0% 0 0.0% 0 0.0% 5 100.0% 5 100.0%
SHP Regarding Formation of Environmental/Social Committee of the Board
8 0 0.0% 8 100.0% 0 0.0% 0 0.0% 8 100.0% 8 100.0%
SHP Regarding Eliminating Mercury Pollution from the Hospital Waste Stream
1 0 0.0% 1 100.0% 0 0.0% 0 0.0% 1 100.0% 1 100.0%
SHP Regarding Adoption of Comprehensive Recycling Strategies
7 0 0.0% 7 100.0% 0 0.0% 0 0.0% 7 100.0% 7 100.0%
SHP Regarding Bioengineering / Nanotechnology Safety
9 0 0.0% 9 100.0% 0 0.0% 0 0.0% 9 100.0% 9 100.0%
SHP Regarding Oil&Gas Transparency Initiative
9 0 0.0% 9 100.0% 0 0.0% 0 0.0% 9 100.0% 9 100.0%
SHP Regarding Misc. Energy/Environmental Issues
20 0 0.0% 20 100.0% 0 0.0% 0 0.0% 20 100.0% 20 100.0%
SHP Regarding Misc. Environmental Issue
49 8 16.3% 35 71.4% 0 0.0% 6 12.2% 35 81.4% 43 100.0%
SHP: Environment
SHP Regarding Opposition to/Change in Executive Compensation
23 6 26.1% 17 73.9% 0 0.0% 0 0.0% 17 73.9% 23 100.0%
SHP Regarding Performance-Based Equity Compensation
2 2 100.0% 0 0.0% 0 0.0% 0 0.0% 0 0.0% 2 100.0%
SHP Regarding Golden Parachutes 2 2 100.0% 0 0.0% 0 0.0% 0 0.0% 0 0.0% 2 100.0%
SHP Regarding Misc. Compensation 8 0 0.0% 8 100.0% 0 0.0% 0 0.0% 8 100.0% 8 100.0%
SHP Regarding Disclosure of Executive Compensation
4 0 0.0% 4 100.0% 0 0.0% 0 0.0% 4 100.0% 4 100.0%
Category Summary: SHP: Compensation 543 385 70.9% 142 26.2% 0 0.0% 16 2.9% 144 27.3% 527 100.0%
SHP Regarding Report on Ratio Between CEO and Employee Pay
10 0 0.0% 10 100.0% 0 0.0% 0 0.0% 10 100.0% 10 100.0%
SHP Regarding Restricting Executive Compensation
91 35 38.5% 56 61.5% 0 0.0% 0 0.0% 56 61.5% 91 100.0%
SHP Regarding Stock Option Policy 11 0 0.0% 11 100.0% 0 0.0% 0 0.0% 11 100.0% 11 100.0%
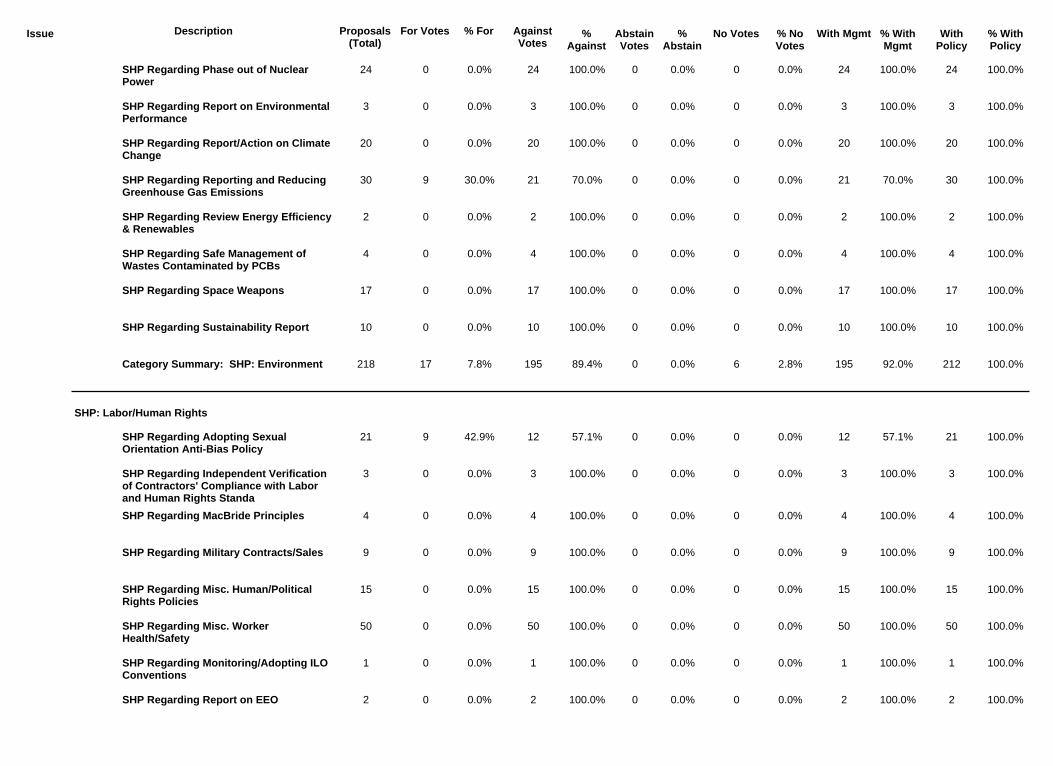
Issue Description Proposals (Total)
For Votes % For Against Votes
% Against
Abstain Votes
% Abstain
No Votes % No Votes
With Mgmt % With Mgmt
With Policy
% With Policy
SHP Regarding Military Contracts/Sales 9 0 0.0% 9 100.0% 0 0.0% 0 0.0% 9 100.0% 9 100.0%
SHP Regarding Misc. Human/Political Rights Policies
15 0 0.0% 15 100.0% 0 0.0% 0 0.0% 15 100.0% 15 100.0%
SHP Regarding MacBride Principles 4 0 0.0% 4 100.0% 0 0.0% 0 0.0% 4 100.0% 4 100.0%
SHP Regarding Adopting Sexual Orientation Anti-Bias Policy
21 9 42.9% 12 57.1% 0 0.0% 0 0.0% 12 57.1% 21 100.0%
SHP Regarding Independent Verification of Contractors' Compliance with Labor and Human Rights Standa
3 0 0.0% 3 100.0% 0 0.0% 0 0.0% 3 100.0% 3 100.0%
SHP Regarding Report on EEO 2 0 0.0% 2 100.0% 0 0.0% 0 0.0% 2 100.0% 2 100.0%
SHP Regarding Misc. Worker Health/Safety
50 0 0.0% 50 100.0% 0 0.0% 0 0.0% 50 100.0% 50 100.0%
SHP Regarding Monitoring/Adopting ILO Conventions
1 0 0.0% 1 100.0% 0 0.0% 0 0.0% 1 100.0% 1 100.0%
SHP: Labor/Human Rights
SHP Regarding Reporting and Reducing Greenhouse Gas Emissions
30 9 30.0% 21 70.0% 0 0.0% 0 0.0% 21 70.0% 30 100.0%
SHP Regarding Review Energy Efficiency & Renewables
2 0 0.0% 2 100.0% 0 0.0% 0 0.0% 2 100.0% 2 100.0%
SHP Regarding Report on Environmental Performance
3 0 0.0% 3 100.0% 0 0.0% 0 0.0% 3 100.0% 3 100.0%
SHP Regarding Report/Action on Climate Change
20 0 0.0% 20 100.0% 0 0.0% 0 0.0% 20 100.0% 20 100.0%
SHP Regarding Phase out of Nuclear Power
24 0 0.0% 24 100.0% 0 0.0% 0 0.0% 24 100.0% 24 100.0%
Category Summary: SHP: Environment 218 17 7.8% 195 89.4% 0 0.0% 6 2.8% 195 92.0% 212 100.0%
SHP Regarding Safe Management of Wastes Contaminated by PCBs
4 0 0.0% 4 100.0% 0 0.0% 0 0.0% 4 100.0% 4 100.0%
SHP Regarding Space Weapons 17 0 0.0% 17 100.0% 0 0.0% 0 0.0% 17 100.0% 17 100.0%
SHP Regarding Sustainability Report 10 0 0.0% 10 100.0% 0 0.0% 0 0.0% 10 100.0% 10 100.0%

Issue Description Proposals (Total)
For Votes % For Against Votes
% Against
Abstain Votes
% Abstain
No Votes % No Votes
With Mgmt % With Mgmt
With Policy
% With Policy
SHP Regarding Improving in Disclosure 10 8 80.0% 2 20.0% 0 0.0% 0 0.0% 2 20.0% 10 100.0%
SHP Regarding Eliminating Supermajority Provisions
19 19 100.0% 0 0.0% 0 0.0% 0 0.0% 0 0.0% 19 100.0%
SHP Regarding Cumulative Voting 111 111 100.0% 0 0.0% 0 0.0% 0 0.0% 0 0.0% 111 100.0%
SHP Regarding Increase in Dividend/Redistribution of Profits
28 0 0.0% 28 100.0% 0 0.0% 0 0.0% 28 100.0% 28 100.0%
SHP Regarding Majority Vote for Election of Directors
30 30 100.0% 0 0.0% 0 0.0% 0 0.0% 2 6.7% 30 100.0%
SHP: Shareholder Rights
SHP Regarding Misc. Capital Issue 14 5 35.7% 9 64.3% 0 0.0% 0 0.0% 2 14.3% 14 100.0%
Category Summary: SHP: Restructuring 14 5 35.7% 9 64.3% 0 0.0% 0 0.0% 2 14.3% 14 100.0%
SHP: Restructuring
SHP: Misc. Issues 8 0 0.0% 8 100.0% 0 0.0% 0 0.0% 8 100.0% 8 100.0%
Category Summary: SHP: Misc. Issues 246 12 4.9% 232 94.3% 2 0.8% 0 0.0% 103 41.9% 150 61.0%
SHP Regarding Misc. Issue 238 12 5.0% 224 94.1% 2 0.8% 0 0.0% 95 39.9% 142 59.7%
SHP: Misc. Issues
SHP Regarding Reviewing Operations in Burma/The Sudan
7 0 0.0% 7 100.0% 0 0.0% 0 0.0% 7 100.0% 7 100.0%
SHP Regarding Review of Global Labor Practices
4 0 0.0% 4 100.0% 0 0.0% 0 0.0% 4 100.0% 4 100.0%
SHP Regarding Reviewing Operations' Impact on Local Groups
13 0 0.0% 13 100.0% 0 0.0% 0 0.0% 13 100.0% 13 100.0%
SHP Regarding Reporting on Company's Compliance with International Human Rights Standards
22 4 18.2% 18 81.8% 0 0.0% 0 0.0% 18 81.8% 22 100.0%
Category Summary: SHP: Labor/Human Rights
151 13 8.6% 138 91.4% 0 0.0% 0 0.0% 138 91.4% 151 100.0%

Issue Description Proposals (Total)
For Votes % For Against Votes
% Against
Abstain Votes
% Abstain
No Votes % No Votes
With Mgmt % With Mgmt
With Policy
% With Policy
SHP Regarding Fair Lending Policy 14 0 0.0% 14 100.0% 0 0.0% 0 0.0% 14 100.0% 14 100.0%
SHP Regarding Misc. Social Issue 80 9 11.3% 71 88.8% 0 0.0% 0 0.0% 71 88.8% 80 100.0%
SHP Regarding Animal Welfare 34 0 0.0% 34 100.0% 0 0.0% 0 0.0% 34 100.0% 34 100.0%
SHP Regarding Disclosure of Prior Government Service
14 0 0.0% 14 100.0% 0 0.0% 0 0.0% 14 100.0% 14 100.0%
SHP Regarding Reviewing Charitable Spending
11 0 0.0% 11 100.0% 0 0.0% 0 0.0% 11 100.0% 11 100.0%
Category Summary: SHP: Social Issues 272 83 30.5% 189 69.5% 0 0.0% 0 0.0% 196 72.1% 272 100.0%
SHP Regarding Tobacco/Alcohol 15 0 0.0% 15 100.0% 0 0.0% 0 0.0% 15 100.0% 15 100.0%
SHP Regarding Reviewing Political Spending or Lobbying
104 74 71.2% 30 28.8% 0 0.0% 0 0.0% 37 35.6% 104 100.0%
SHP: Social Issues
SHP Regarding Reincorporation 31 0 0.0% 31 100.0% 0 0.0% 0 0.0% 31 100.0% 31 100.0%
SHP Regarding Right to Call a Special Meeting
152 108 71.1% 44 28.9% 0 0.0% 0 0.0% 44 28.9% 152 100.0%
SHP Regarding Redemption of / Shareholder Vote on Poison Pills
7 7 100.0% 0 0.0% 0 0.0% 0 0.0% 0 0.0% 7 100.0%
SHP Regarding Misc. Board/Shareholder Rights Issue
4 2 50.0% 2 50.0% 0 0.0% 0 0.0% 2 50.0% 4 100.0%
SHP Regarding Misc. Meeting/Voting Issue
17 9 52.9% 7 41.2% 1 5.9% 0 0.0% 7 41.2% 16 100.0%
SHP Reimbursement of Solicitation Expenses
2 2 100.0% 0 0.0% 0 0.0% 0 0.0% 0 0.0% 2 100.0%
Category Summary: SHP: Shareholder Rights
448 328 73.2% 119 26.6% 1 0.2% 0 0.0% 125 27.9% 447 100.0%
SHP Regarding Sale of the Company or Assets
5 0 0.0% 5 100.0% 0 0.0% 0 0.0% 5 100.0% 5 100.0%
SHP Regarding the Declassification of the Board
32 32 100.0% 0 0.0% 0 0.0% 0 0.0% 4 12.5% 32 100.0%

Issue Description Proposals (Total)
For Votes % For Against Votes
% Against
Abstain Votes
% Abstain
No Votes % No Votes
With Mgmt % With Mgmt
With Policy
% With Policy
Intra-company Contracts/Control Agreements
271 248 91.5% 14 5.2% 6 2.2% 3 1.1% 248 92.5% 268 100.0%
Divestiture/Spin-off 59 40 67.8% 0 0.0% 3 5.1% 16 27.1% 40 93.0% 43 100.0%
Property Purchase 2 2 100.0% 0 0.0% 0 0.0% 0 0.0% 2 100.0% 2 100.0%
Merger/Acquisition 365 297 81.4% 7 1.9% 18 4.9% 43 11.8% 297 92.2% 319 99.1%
Liquidation 1 0 0.0% 1 100.0% 0 0.0% 0 0.0% 0 0.0% 1 100.0%
Misc. Proposal Regarding Restructuring 94 75 79.8% 4 4.3% 3 3.2% 12 12.8% 75 91.5% 82 100.0%
Sale of Assets 1 1 100.0% 0 0.0% 0 0.0% 0 0.0% 1 100.0% 1 100.0%
Category Summary: Strategic Transaction or Restructuring
860 709 82.4% 29 3.4% 31 3.6% 91 10.6% 709 92.2% 766 99.6%
Joint Venture/Strategic Alliance 4 3 75.0% 0 0.0% 1 25.0% 0 0.0% 3 75.0% 4 100.0%
Property Sale 11 9 81.8% 0 0.0% 0 0.0% 2 18.2% 9 100.0% 9 100.0%
Restructuring/Capitalization 51 33 64.7% 3 5.9% 0 0.0% 15 29.4% 33 91.7% 36 100.0%
Restructuring/Reorganization 1 1 100.0% 0 0.0% 0 0.0% 0 0.0% 1 100.0% 1 100.0%
Strategic Transaction or Restructuring
Authority to Trade in Company Stock 202 90 44.6% 37 18.3% 0 0.0% 75 37.1% 90 70.9% 127 100.0%
Amendments to Articles - Repurchase Shares (INACTIVE)
2 2 100.0% 0 0.0% 0 0.0% 0 0.0% 2 100.0% 2 100.0%
Share Repurchase 1 1 100.0% 0 0.0% 0 0.0% 0 0.0% 1 100.0% 1 100.0%
Category Summary: Stock Buyback 205 93 45.4% 37 18.0% 0 0.0% 75 36.6% 93 71.5% 130 100.0%
Stock Buyback

Issue Description Proposals (Total)
For Votes % For Against Votes
% Against
Abstain Votes
% Abstain
No Votes % No Votes
With Mgmt % With Mgmt
With Policy
% With Policy
*For election of directors proposals, this column includes votes withheld as well as votes against.

TAB 7 – ASSET ALLOCATIONS AND
NAV UPDATES

Asset Allocations at June 30, 2009Variable Fund Total Fund
OPERF Policy Target $ Thousands Pre-Overlay Overlay Net Position Actual $ Thousands $ Thousands
Public Equity 41-51% 46% 16,986,830 38.2% 1,517,360 18,504,190 41.6% 803,597 19,307,787 Private Equity 12-20% 16% 8,175,609 18.4% 8,175,609 18.4% 8,175,609 Total Equity 57-67% 62% 25,162,439 56.5% 1,517,360 26,679,799 59.9% 27,483,396 Opportunity Portfolio 943,707 2.1% 943,707 2.1% 943,707 Fixed Income 22-32% 27% 11,821,033 26.6% 234,370 12,055,403 27.1% 12,055,403
Real Estate 8-14% 11% 4,821,474 10.8% - 4,821,474 10.8% 4,821,474
Cash* 0-3% 0% 1,759,108 4.0% (1,751,730) 7,378 0.0% 11,468 18,846
TOTAL OPERF 100% 44,507,761$ 100.0% -$ 44,507,761$ 100.0% 815,065$ 45,322,826$
*Includes cash held in the policy implementation overlay program.
SAIF Policy Target $ Thousands Actual
Domestic Equity & Private Equity 7-13% 10.0% $362,086 10.0%BGI Alpha Tilts 3-7% 5.0% 169,889 4.7%Total Equity 10-20% 15.0% 531,975 14.7%
Fixed Income 80-90% 85.0% 3,061,569 84.8%
Cash 0-5% 0% 16,707 0.5%
Regular Account
TOTAL SAIF 100% $3,610,251 100.0%
CSF Policy Target $ Thousands Actual
Domestic Equities 25-35% 30% $264,030 32.5%International Equities 25-35% 30% 298,729 36.8%Private Equity 0-12% 10% 16,514 2.0%Total Equity 65-75% 70% 579,273 71.3%
Fixed Income 25-35% 30% 231,289 28.5%
Cash 0-3% 0% 1,436 0.2%
TOTAL CSF $811,998 100.0%
HIED Policy Target $ Thousands Actual
Domestic Equities 25-35% 30% $14,240 26.0%International Equities 25-35% 30% 17,305 31.6%Private Equity 0-10% 10% 5,589 10.2%Total Equity 65-75% 70% 37,134 67.7%
Fixed Income 25-35% 30% 13,959 25.5%
Cash 0-3% 0% 3,755 6.8%
TOTAL HIED $54,848 100.0%

46%
16%
27%
11%
0%
42%
18%
27%
11%
0%0%5%
10%15%20%25%30%35%40%45%50%
Public Equity Private Equity Fixed Income Real Estate Cash*
OPERF Asset Allocation
Target
Actual
10% 5%15%
85%
0%10% 5%
15%
85%
0%0%
10%20%30%40%50%60%70%80%90%
Domestic Equity & Private Equity
BGI Alpha Tilts Total Equity Fixed Income Cash
SAIF Asset Allocation
Target
Actual
CSF Asset Allocation
46%
16%
27%
11%
0%
42%
18%
27%
11%
0%0%5%
10%15%20%25%30%35%40%45%50%
Public Equity Private Equity Fixed Income Real Estate Cash*
OPERF Asset Allocation
Target
Actual
10% 5%15%
85%
0%10% 5%
15%
85%
0%0%
10%20%30%40%50%60%70%80%90%
Domestic Equity & Private Equity
BGI Alpha Tilts Total Equity Fixed Income Cash
SAIF Asset Allocation
Target
Actual
30% 30%
10%
30%
0%
33%37%
2%
28%
0%0%5%
10%15%20%25%30%35%40%
Domestic Equities
International Equities
Private Equity Fixed Income Cash
CSF Asset Allocation
Target
Actual
30% 30%
10%
30%
0%
26%
32%
10%
25%
7%
0%5%
10%15%20%25%30%35%
Domestic Equities International Equities
Private Equity Fixed Income Cash
HIED Asset Allocation
Target
Actual
TAB 7 - Asset Allocation, 2009.06.30.xls

56,052 56,933
57,686
59,019 59,959
60,705 61,074 60,942
62,073
63,628 64,583 64,285
63,535 63,316
65,587
66,836
64,968 64,870
62,161 61,692
61,221
63,093 63,403
60,717
59,493 58,652
54,378 55,000
60,000
65,000
70,000
OPERF NAVThree years ending June 2009
($ in Millions)
47,915
46,052 45,796 44,113
42,070 41,521
43,954
46,119 45,323
35,000
40,000
45,000
50,000
Jul-0
6
Aug
-06
Sep
-06
Oct
-06
Nov
-06
Dec
-06
Jan-
07
Feb-
07
Mar
-07
Apr
-07
May
-07
Jun-
07
Jul-0
7
Aug
-07
Sep
-07
Oct
-07
Nov
-07
Dec
-07
Jan-
08
Feb-
08
Mar
-08
Apr
-08
May
-08
Jun-
08
Jul-0
8
Aug
-08
Sep
-08
Oct
-08
Nov
-08
Dec
-08
Jan-
09
Feb-
09
Mar
-09
Apr
-09
May
-09
Jun-
09

3,279 3,339 3,386
3,464
3,514 3,483
3,515 3,558 3,539
3,607 3,582
3,551 3,574
3,603
3,659
3,731 3,737
3,674 3,693 3,651 3,638
3,689 3,656
3,611 3,598 3,622
3,418
3,180
3,256
3,476
3,401
3,294
3,345
3,446
3,545 3,610
3,300
3,500
3,700
3,900
ons
SAIF NAV Three years ending June 2009
($ in Millions)
2,500
2,700
2,900
3,100
Jul-0
6
Aug
-06
Sep
-06
Oct
-06
Nov
-06
Dec
-06
Jan-
07
Feb-
07
Mar
-07
Apr
-07
May
-07
Jun-
07
Jul-0
7
Aug
-07
Sep
-07
Oct
-07
Nov
-07
Dec
-07
Jan-
08
Feb-
08
Mar
-08
Apr
-08
May
-08
Jun-
08
Jul-0
8
Aug
-08
Sep
-08
Oct
-08
Nov
-08
Dec
-08
Jan-
09
Feb-
09
Mar
-09
Apr
-09
May
-09
Jun-
09
Mill
io

1,000
1,028 1,045
1,083
1,119 1,109
1,123 1,138
1,148
1,185
1,209
1,169 1,153 1,152
1,187
1,226
1,196
1,153
1,100 1,089 1,081
1,118 1,129
1,063
1,006 999
899
1,000
1,100
1,200
1,300
Mill
ions
CSF NAVThree years ending June 2009
($ in Millions)
899
781 765 765
725
678
720
780
835
812
600
700
800
900
Jul-0
6
Aug
-06
Sep
-06
Oct
-06
Nov
-06
Dec
-06
Jan-
07
Feb-
07
Mar
-07
Apr
-07
May
-07
Jun-
07
Jul-0
7
Aug
-07
Sep
-07
Oct
-07
Nov
-07
Dec
-07
Jan-
08
Feb-
08
Mar
-08
Apr
-08
May
-08
Jun-
08
Jul-0
8
Aug
-08
Sep
-08
Oct
-08
Nov
-08
Dec
-08
Jan-
09
Feb-
09
Mar
-09
Apr
-09
May
-09
Jun-
09

TAB 8 – CALENDAR – FUTURE AGENDA ITEMS

2009 OIC Forward Agenda Topics
September 30: Lone Star VII—Real Estate
CEM Annual Review CSF Annual Review October 28: Opportunity Portfolio Annual Review Fixed Income Structure December 2: OPERF Private Equity Annual Plan
HIED Annual Review SAIF Asset/Liability Recommendations OPERF 3rd Quarter Performance Review
Jan/Feb 2010: Asset Liability Study