Oregon Department of Transportation - Oregon State...
622
ODOT Quality Assurance Program Oregon Department of Transportation Manual of Field Test Procedures INTRODUCTION PURPOSE This manual is designed to be used by Contractor and Agency technicians for the sampling and testing of construction materials, and to determine their conformance to ODOT specifications. Included herein are the Test Procedures, the Quality Assurance Program, report forms and examples, and the Field Tested Materials Acceptance Guide, to be used by field personnel for guidance, reference and instruction. FORMAT This Manual is divided into four main sub-sections: (1) Test Procedures (2) Quality Assurance Program (3) Report Forms and Examples (4) Field Tested Materials Acceptance Guide The process control and acceptance test procedures in this manual are to be used for testing construction materials on ODOT projects. English and Metric unit designations are not direct conversions, use the appropriate designation identified by the Project contract documents. Test results and supporting data shall conform to the following rounding convention, based on the significant digit requirement of the contract specifications or test procedure reporting criteria. • The final significant digit will not be changed when the succeeding digit is less than 5. • The final significant digit will be increased by one when the succeeding digit is 5 or greater. All field test procedures in this manual have ODOT, AASHTO or WAQTC references. Some field test procedures have been written as Field Operating Procedures, e.g. "FOP for AASHTO T-”. FOP’s conform to the approved AASHTO or other test methods, but may eliminate some of the verbiage and/or combine several test methods to help reduce testing time. If there is a conflict between the FOP and the AASHTO test procedure due to errors or omissions, the AASHTO test procedure will hold precedence over the FOP. The yellow sheet addendums included with the FOP’s are utilized to identify preferred methods or modifications observed by the Oregon Department of Transportation. 1 Revised October 2006
Transcript of Oregon Department of Transportation - Oregon State...
ODOT Quality Assurance Program
Oregon Department of Transportation Manual of Field Test Procedures
INTRODUCTION
PURPOSE This manual is designed to be used by Contractor and Agency technicians for the sampling and testing of construction materials, and to determine their conformance to ODOT specifications. Included herein are the Test Procedures, the Quality Assurance Program, report forms and examples, and the Field Tested Materials Acceptance Guide, to be used by field personnel for guidance, reference and instruction. FORMAT This Manual is divided into four main sub-sections:
(1) Test Procedures
(2) Quality Assurance Program
(3) Report Forms and Examples
(4) Field Tested Materials Acceptance Guide The process control and acceptance test procedures in this manual are to be used for testing construction materials on ODOT projects. English and Metric unit designations are not direct conversions, use the appropriate designation identified by the Project contract documents. Test results and supporting data shall conform to the following rounding convention, based on the significant digit requirement of the contract specifications or test procedure reporting criteria. • The final significant digit will not be changed when the succeeding digit is less than 5. • The final significant digit will be increased by one when the succeeding digit is 5 or greater. All field test procedures in this manual have ODOT, AASHTO or WAQTC references. Some field test procedures have been written as Field Operating Procedures, e.g. "FOP for AASHTO T-”. FOP’s conform to the approved AASHTO or other test methods, but may eliminate some of the verbiage and/or combine several test methods to help reduce testing time. If there is a conflict between the FOP and the AASHTO test procedure due to errors or omissions, the AASHTO test procedure will hold precedence over the FOP. The yellow sheet addendums included with the FOP’s are utilized to identify preferred methods or modifications observed by the Oregon Department of Transportation.
1 Revised October 2006
ODOT Quality Assurance Program
HOW TO USE THIS MANUAL This Manual of Field Test Procedures is used in conjunction with the contract plans, specifications, and the Construction Manual. It defines the requirements of ODOT's Quality Assurance Program. The sampling and testing requirements and test procedures for most work items can be found in this Manual. Testing requirements for other materials will be specified in the contract plans and specifications. Section 1 - Test Procedures: This section includes procedures for all regular field test procedures required by the ODOT specifications. Section 2 - Quality Assurance Program: This section includes ODOT's Quality Assurance Program Manual, which includes the Technician Certification and Laboratory Certification programs. It also includes information on Independent Assurance parameters, random sampling, sampling programs at commercial aggregate sources, and verifying Contractor Quality Control test results. Section 3 - Report Forms and Examples: This section includes copies of ODOT forms that are used to submit samples to ODOT's Central Materials Laboratory (ODOT-CML), and forms that can be used for field test results. It also includes completed examples of the forms and instructions for obtaining electronic versions of the forms. Section 4:
Subsection A – Source Review/Product Compliance Testing Requirements: This subsection describes the testing requirements and frequencies for raw and processed aggregate material. Specific test requirements are included in the Field Tested Materials Acceptance Guide (FTMAG) in subsection 4(D). Subsection B - Small Quantity Schedule: This subsection describes the criteria under which small amounts of materials can be accepted, without testing, upon satisfaction of the stated criteria. Subsection C – Material Sampling Requirements: This subsection provides the requirements for sample sizes, types of containers, labeling, and other necessary information for samples that will be sent to the ODOT-CML or other laboratories for testing. Subsection D - Field Tested Materials Acceptance Guide: This subsection lists the required tests that are to be performed for construction materials. It also outlines the frequencies at which the tests shall be performed, and the certified technician who shall perform them. The Definition of Visual field acceptance at the Project Managers level is also defined in this section.
2 Revised October 2006
ODOT Quality Assurance Program
ACRONYMS AND DEFINITIONS Following are common acronyms and definitions found in this manual. Other acronyms and definitions may be found in Section 00110 of the Standard Specifications. AASHTO - The American Association of State Highway and Transportation Officials AC - Asphalt Concrete ASTM - The American Society for Testing and Materials ODOT-CML - The ODOT Central Materials Laboratory located at 800 Airport Road SE in Salem Certified Laboratory - A Quality Control or Quality Assurance laboratory that possesses a valid certification, as described in Section 2 of this Manual, issued by the ODOT-CML indicating that the laboratory had proper, calibrated equipment at the time of the inspection. Certified Technician - A technician who is certified to perform a specific material test(s) and who possesses a valid certification, as described in Section 2 of this Manual, issued by the ODOT-CML. The certification indicates their knowledge of, and ability to perform, the required test procedures, and to correctly prepare the test reports. CGC - Commercial Grade Concrete (MSC – Minor Structure Concrete) CAC – Certification Advisory Committee EAC - Emulsified Asphalt Concrete FHWA - The Federal Highway Administration FOP - Field Operating Procedure. FOP’s conform to approved test methods, but may eliminate some of the verbiage and/or combine several test methods to reduce testing time. FTMAG – Field Tested Materials Acceptance Guide HMAC - Hot Mixed Asphalt Concrete or HMA (Hot Mixed Asphalt) IA - Independent Assurance. See Section 2 for definition JMF - Job Mix Formula for asphalt concrete MDT – Maximum Density Test (Use 62.4 (1000) for unit conversion) MSE – Mechanically Stabilized Earth MFTP - Manual of Field Test Procedures (this manual) MAMD - Moving Average Maximum Density
3 Revised October 2006
ODOT Quality Assurance Program
ODOT - The Oregon Department of Transportation PCC - Portland Cement Concrete PM - Project Manager (Agency/Owner’s Contract Administrator) QA - Quality Assurance - generally refers to the Quality Assurance Program (See Section 2). QAC - Quality Assurance Coordinator. See Section 2 (Quality Assurance Program). QAE - Quality Assurance Engineer QAT - Quality Assurance Technician. See Section 2 (Quality Assurance Program). QC - Quality Control QCCS - Quality Control Compliance Specialist (Agency or Contract Administrator performing the role of the QCCS). See Section 2 (Quality Assurance Program). QPL - Qualified Products List Random Sample – A sample of construction material taken at a random time or location. The sampling shall be performed according to a random number scheme. See Section 2 for further discussion. Random Number – A randomly selected number used to calculate a sampling time or location. See Section 2 for discussion on selection and usage. RAP - Reclaimed Asphalt Concrete Pavement Specifications- Special Provisions, Plans & Drawings, Supplemental Specifications and Standard Specifications. WAQTC - Western Alliance for Quality Transportation Construction
4 Revised October 2006
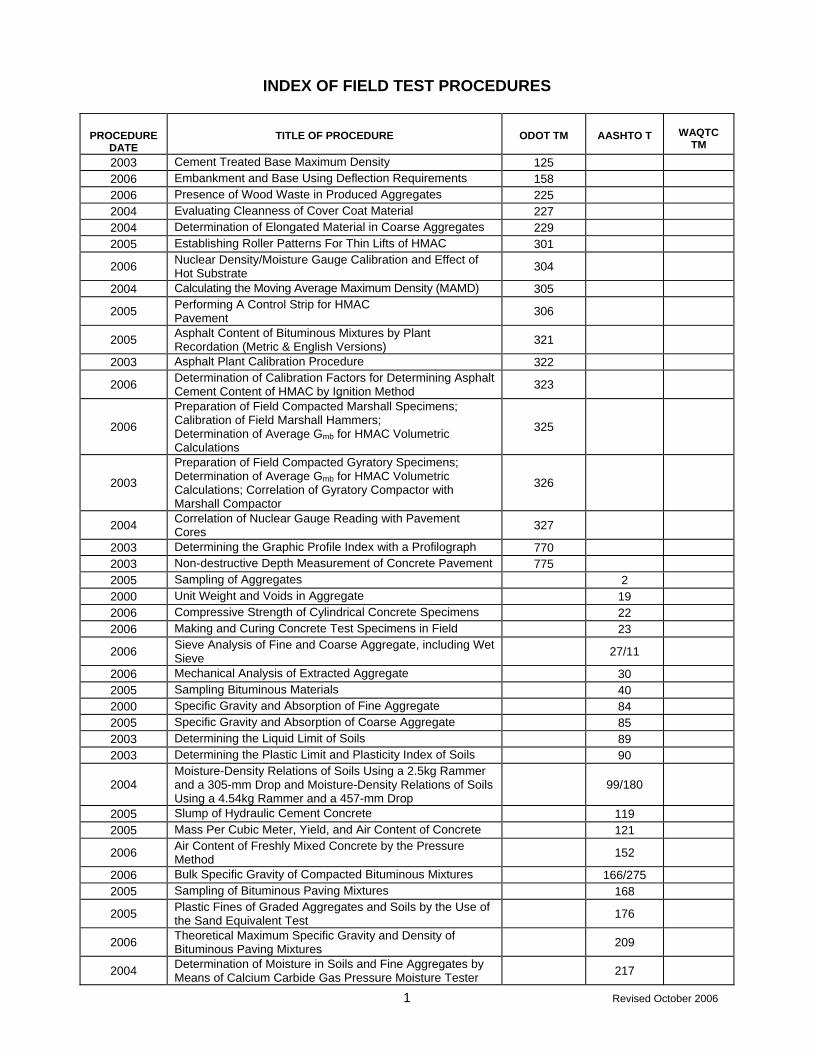
INDEX OF FIELD TEST PROCEDURES
PROCEDURE
DATE
TITLE OF PROCEDURE
ODOT TM
AASHTO T
WAQTC
TM 2003 Cement Treated Base Maximum Density 125 2006 Embankment and Base Using Deflection Requirements 158 2006 Presence of Wood Waste in Produced Aggregates 225 2004 Evaluating Cleanness of Cover Coat Material 227 2004 Determination of Elongated Material in Coarse Aggregates 229 2005 Establishing Roller Patterns For Thin Lifts of HMAC 301 2006 Nuclear Density/Moisture Gauge Calibration and Effect of
Hot Substrate 304
2004 Calculating the Moving Average Maximum Density (MAMD) 305 2005 Performing A Control Strip for HMAC
Pavement 306
2005 Asphalt Content of Bituminous Mixtures by Plant Recordation (Metric & English Versions) 321
2003 Asphalt Plant Calibration Procedure 322 2006 Determination of Calibration Factors for Determining Asphalt
Cement Content of HMAC by Ignition Method 323
2006
Preparation of Field Compacted Marshall Specimens; Calibration of Field Marshall Hammers; Determination of Average Gmb for HMAC Volumetric Calculations
325
2003
Preparation of Field Compacted Gyratory Specimens; Determination of Average Gmb for HMAC Volumetric Calculations; Correlation of Gyratory Compactor with Marshall Compactor
326
2004 Correlation of Nuclear Gauge Reading with Pavement Cores 327
2003 Determining the Graphic Profile Index with a Profilograph 770 2003 Non-destructive Depth Measurement of Concrete Pavement 775 2005 Sampling of Aggregates 2 2000 Unit Weight and Voids in Aggregate 19 2006 Compressive Strength of Cylindrical Concrete Specimens 22 2006 Making and Curing Concrete Test Specimens in Field 23 2006 Sieve Analysis of Fine and Coarse Aggregate, including Wet
Sieve 27/11
2006 Mechanical Analysis of Extracted Aggregate 30 2005 Sampling Bituminous Materials 40 2000 Specific Gravity and Absorption of Fine Aggregate 84 2005 Specific Gravity and Absorption of Coarse Aggregate 85 2003 Determining the Liquid Limit of Soils 89 2003 Determining the Plastic Limit and Plasticity Index of Soils 90
2004 Moisture-Density Relations of Soils Using a 2.5kg Rammer and a 305-mm Drop and Moisture-Density Relations of Soils Using a 4.54kg Rammer and a 457-mm Drop
99/180
2005 Slump of Hydraulic Cement Concrete 119 2005 Mass Per Cubic Meter, Yield, and Air Content of Concrete 121 2006 Air Content of Freshly Mixed Concrete by the Pressure
Method 152
2006 Bulk Specific Gravity of Compacted Bituminous Mixtures 166/275 2005 Sampling of Bituminous Paving Mixtures 168 2005 Plastic Fines of Graded Aggregates and Soils by the Use of
the Sand Equivalent Test 176
2006 Theoretical Maximum Specific Gravity and Density of Bituminous Paving Mixtures 209
2004 Determination of Moisture in Soils and Fine Aggregates by Means of Calcium Carbide Gas Pressure Moisture Tester 217
1 Revised October 2006
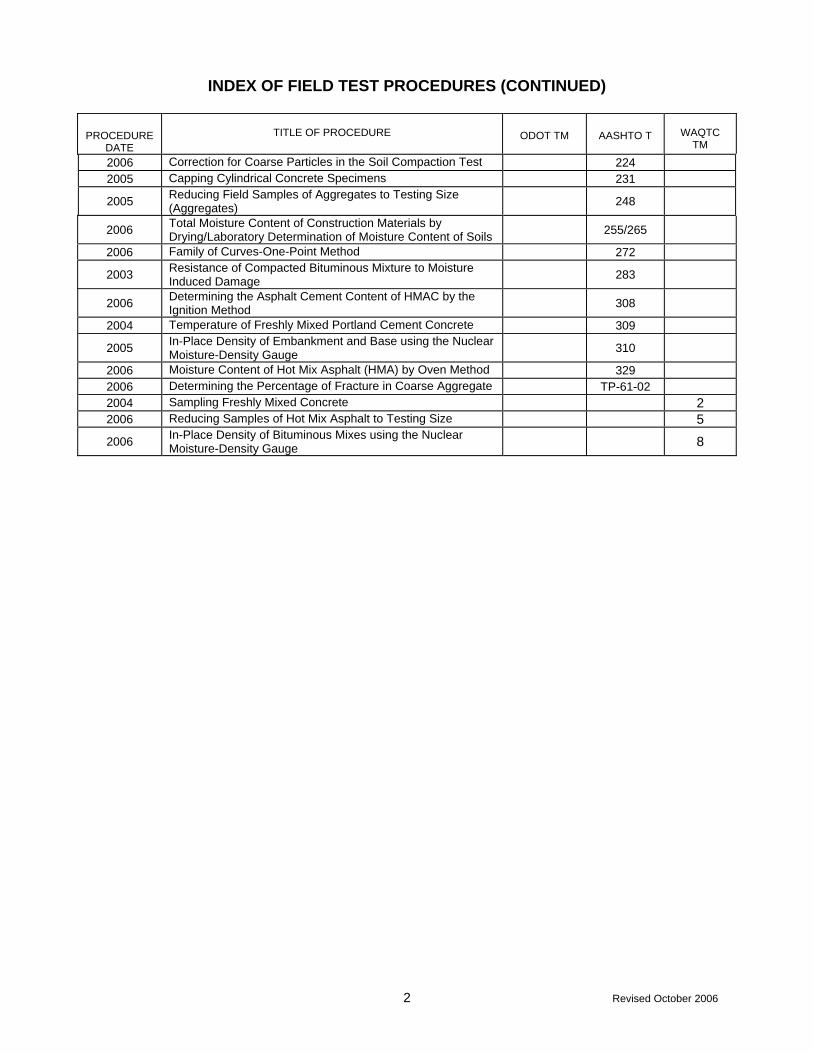
INDEX OF FIELD TEST PROCEDURES (CONTINUED)
PROCEDURE
DATE
TITLE OF PROCEDURE
ODOT TM
AASHTO T
WAQTC
TM
2006 Correction for Coarse Particles in the Soil Compaction Test 224 2005 Capping Cylindrical Concrete Specimens 231 2005 Reducing Field Samples of Aggregates to Testing Size
(Aggregates) 248
2006 Total Moisture Content of Construction Materials by Drying/Laboratory Determination of Moisture Content of Soils
255/265
2006 Family of Curves-One-Point Method 272 2003 Resistance of Compacted Bituminous Mixture to Moisture
Induced Damage 283
2006 Determining the Asphalt Cement Content of HMAC by the Ignition Method
308
2004 Temperature of Freshly Mixed Portland Cement Concrete 309 2005 In-Place Density of Embankment and Base using the Nuclear
Moisture-Density Gauge 310
2006 Moisture Content of Hot Mix Asphalt (HMA) by Oven Method 329 2006 Determining the Percentage of Fracture in Coarse Aggregate TP-61-02 2004 Sampling Freshly Mixed Concrete 2 2006 Reducing Samples of Hot Mix Asphalt to Testing Size 5 2006 In-Place Density of Bituminous Mixes using the Nuclear
Moisture-Density Gauge 8
2 Revised October 2006
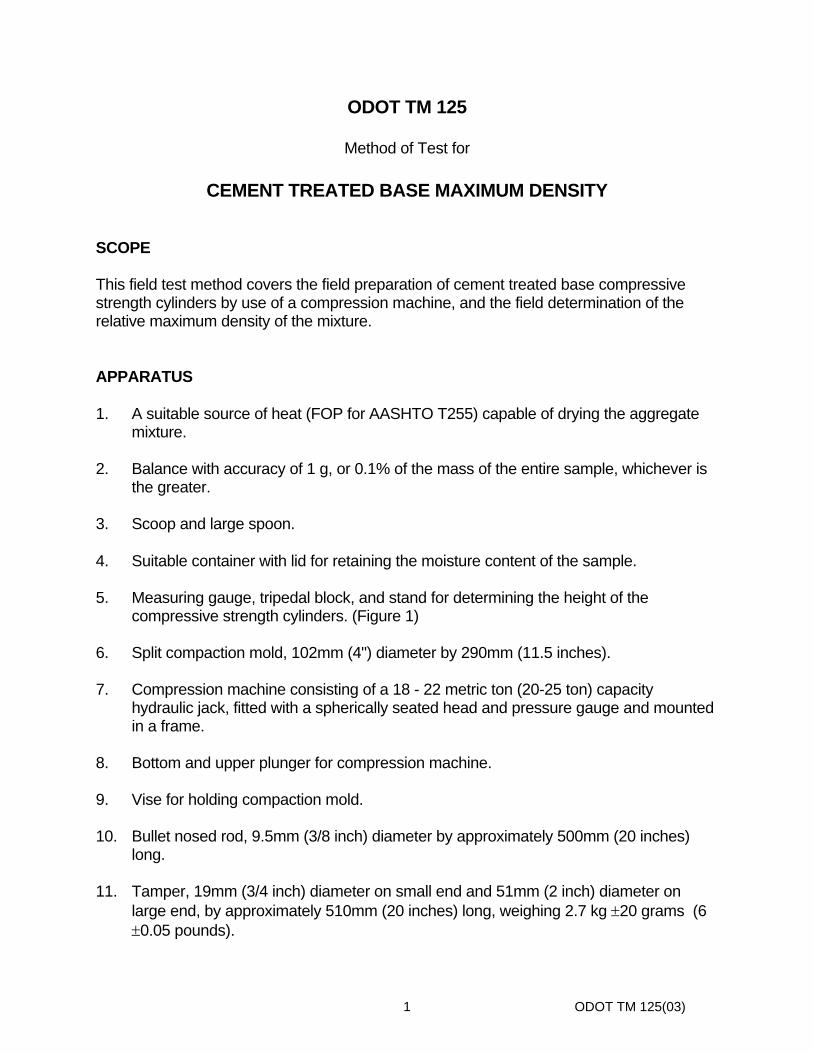
ODOT TM 125 Method of Test for CEMENT TREATED BASE MAXIMUM DENSITY SCOPE This field test method covers the field preparation of cement treated base compressive strength cylinders by use of a compression machine, and the field determination of the relative maximum density of the mixture. APPARATUS 1. A suitable source of heat (FOP for AASHTO T255) capable of drying the aggregate
mixture. 2. Balance with accuracy of 1 g, or 0.1% of the mass of the entire sample, whichever is
the greater. 3. Scoop and large spoon. 4. Suitable container with lid for retaining the moisture content of the sample. 5. Measuring gauge, tripedal block, and stand for determining the height of the
compressive strength cylinders. (Figure 1) 6. Split compaction mold, 102mm (4") diameter by 290mm (11.5 inches). 7. Compression machine consisting of a 18 - 22 metric ton (20-25 ton) capacity
hydraulic jack, fitted with a spherically seated head and pressure gauge and mounted in a frame.
8. Bottom and upper plunger for compression machine. 9. Vise for holding compaction mold. 10. Bullet nosed rod, 9.5mm (3/8 inch) diameter by approximately 500mm (20 inches)
long. 11. Tamper, 19mm (3/4 inch) diameter on small end and 51mm (2 inch) diameter on
large end, by approximately 510mm (20 inches) long, weighing 2.7 kg ±20 grams (6 ±0.05 pounds).
1 ODOT TM 125(03)
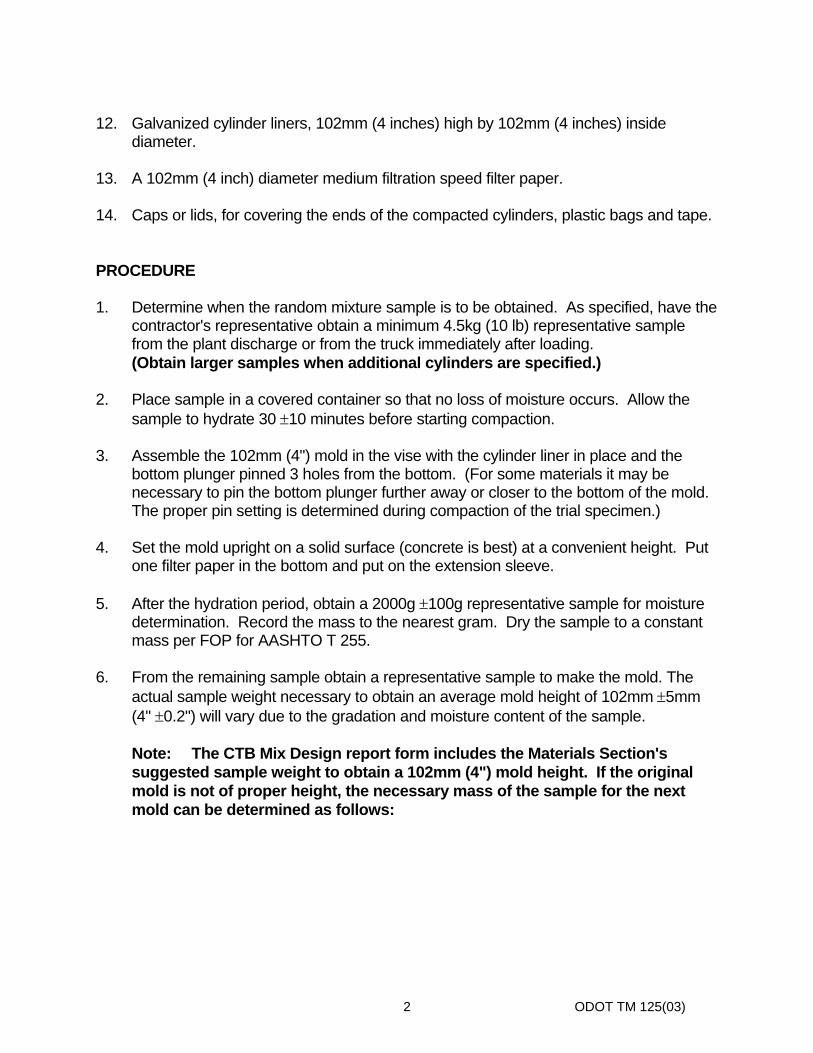
12. Galvanized cylinder liners, 102mm (4 inches) high by 102mm (4 inches) inside
diameter. 13. A 102mm (4 inch) diameter medium filtration speed filter paper. 14. Caps or lids, for covering the ends of the compacted cylinders, plastic bags and tape. PROCEDURE 1. Determine when the random mixture sample is to be obtained. As specified, have the
contractor's representative obtain a minimum 4.5kg (10 lb) representative sample from the plant discharge or from the truck immediately after loading.
(Obtain larger samples when additional cylinders are specified.) 2. Place sample in a covered container so that no loss of moisture occurs. Allow the
sample to hydrate 30 ±10 minutes before starting compaction. 3. Assemble the 102mm (4") mold in the vise with the cylinder liner in place and the
bottom plunger pinned 3 holes from the bottom. (For some materials it may be necessary to pin the bottom plunger further away or closer to the bottom of the mold. The proper pin setting is determined during compaction of the trial specimen.)
4. Set the mold upright on a solid surface (concrete is best) at a convenient height. Put
one filter paper in the bottom and put on the extension sleeve. 5. After the hydration period, obtain a 2000g ±100g representative sample for moisture
determination. Record the mass to the nearest gram. Dry the sample to a constant mass per FOP for AASHTO T 255.
6. From the remaining sample obtain a representative sample to make the mold. The
actual sample weight necessary to obtain an average mold height of 102mm ±5mm (4" ±0.2") will vary due to the gradation and moisture content of the sample.
Note: The CTB Mix Design report form includes the Materials Section's
suggested sample weight to obtain a 102mm (4") mold height. If the original mold is not of proper height, the necessary mass of the sample for the next mold can be determined as follows:
2 ODOT TM 125(03)
Necessary Mass = (A x B) C Where: A = Initial specimen mass. B = Necessary height. C = Initial specimen height. 7. Weight the sample to the nearest gram and record the weight. Spoon approximately
1/2 the sample into the mold and cover the sample container with a damp cloth. Rod forcefully 30 times around the edge of the mold with a 9.5mm (3/8") bullet nosed rod to prevent rock pockets. Tamp with the 19mm (3/4") end of the tamper for 50 blows.
When tamping, simply lift the tamper up about 100mm (4") and let it drop on the
sample. Guide the tamper over the entire surface of the specimen. The compactive effort should be provided by the mass of the tamper. Avoid a smoothly compacted surface because it will result in a compaction plane in the specimen when the next layer is tamped, and will prevent the two layers from bonding.
8. Place the remaining portion of the sample in the mold. Care must be taken to include
the entire prepared sample, since the initial mass is used in calculations for density. Rod the sample forcefully 30 times around the edge of the mold with the 9.5mm (3/8") bullet nosed rod to prevent rock pockets. Tamp the second lift using 100 blows with the 19mm (3/4") small end of the tamper as in 7. Level off the top of the compacted specimen by tamping lightly with the 51mm (2") large end of the tamper in order to provide a smooth surface and an even plane at right angles to the axis of the mold. After tamping is complete remove the extension sleeve, brush down the sides of the mold and put on the top filter paper.
9. Place the top plunger in position, then place the entire assembly on the hydraulic jack
in the compression frame. If necessary, place one or more of the spacing rings between the top plunger and the top of the frame to prevent excessive travel of the jack. Remove the pin that holds the bottom in place and gradually apply a total load of 1111kn (25,000 lbs) (12-1/2 tons). Use 1 minute to attain the first 89 kn (20,000 lbs.) (approximately 5,000 pounds each 15 seconds), 1/2 minute for the next 22kn (5,000 lbs) (2-1/2 tons), and hold at 1111kn (25,000 lbs) (12-1/2 tons) for 1 minute. Release the load slowly to prevent damage to the gauge. Remove the mold from the jack frame (hold the bottom plunger, so it does not fall out and cause injury), place the mold in the vise (if equipped), take out the plungers, open the mold and remove the specimen with the cylinder liner and 2 filter papers.
10. Wipe any free water from the outside of the cylinder liner. 11. Gently remove the filter papers. Clean any adhering material from the mold and filter
paper and place on top of the compacted sample. Determine and record to the
3 ODOT TM 125(03)
nearest gram the mass of the compacted sample and liner. Calculate the wet mass of the compacted sample without liner.
12. Measure the height using the tripedal block, to the nearest 0.25mm (0.01") and
record. If the height is not 102mm ±5mm (4" ±0.2"), return to step 1., obtain another material sample and repeat the test procedure.
Note: Be sure to calibrate the measuring device using the tripedal block. 13. If the compacted sample will be submitted for seven day compressive strength
testing, seal the sample as soon as possible after fabrication to prevent moisture loss. Cover the ends of the cylinder liner with metal or plastic lids and tape or with approximately 98mm (3-7/8") diameter plastic circles and tape (Wide masking or electrical tape is satisfactory). Write the sample identification information on the liner. Place the samples in plastic bags to further prevent moisture loss.
14. After the moisture sample from step 5. has dried, determine the dry mass and record
to the nearest gram. Then calculate and record the percentage of moisture as follows: % Moisture = (Wet Wt. - Dry Wt.) X 100 Dry Wt. 15. Calculate the dry mass of the density sample used in step 7. Dry Mass = (Wet Mass/(% Moisture from step 3.N.1 + 100)) X 100 16. Calculate and report the maximum density of the compacted sample in kg/m3 (lb/ft3).
Metric Max Dry Density (kg/m³) = Dry mass of sample (g) x 122.4 Sample Height (mm) Note: The constant 122.4 converts the density to kilograms per cubic meter
when the height is entered in millimeters and dry weight is in grams. It assumes a nominal cylinder diameter of 102mm (4.00"). If the diameter varies significantly ±2.5mm (±0.1 inch) from this value, the constant should be recalculated.
4 ODOT TM 125(03)
English Max Dry Density (lbs/cf) = Dry mass of sample (g) x 0.303 Sample Height (inches) Note: The constant 0.303 converts the density to pounds per cubic foot when
the height is entered in inches and dry weight is in grams. It assumes a nominal cylinder diameter of 102mm (4.00"). If the diameter varies significantly ±2.5mm (±0.1 inch) from this value, the constant should be recalculated.
17. Moving Average Maximum Density (MAMD) - The maximum density used to
calculate the percent of compaction during field placement of CTB (AASHTO T-310) is the MAMD. The MAMD is computed as follows:
The initial MAMD is the average of the Maximum Density reported by the laboratory for the mix design and the maximum density of the first sublot tested. After the next density test the average is calculated from the lab density, the density of the first sublot and the density of the sublot just tested. The MAMD is carried forward by averaging each density test result with the previous 4, or less if less are available. For example, after the 5th field test, the lab maximum density is dropped from the calculation and the four previous field test results are used with test #5 to calculate the average. As more test results are accumulated the earlier ones are not used so that only the last four results are averaged with the current result.
REPORT Report on form 734-2091.
5 ODOT TM 125(03)

THIS PAGE INTENTIONALLY LEFT BLANK
6 ODOT TM 125(03)
ODOT TM 158
Method of Test for
IN-PLACE DENSITY OF EMBANKMENT AND BASE USING
DEFLECTION REQUIREMENTS SCOPE This procedure covers the visual determination of density and relative compaction of soil, soil-aggregate mixes and base aggregate in accordance with ODOT TM 158. This field operating procedure may be used in conjunction with AASHTO T310. DEFINITIONS Yielding – giving under pressure, flexible Deflection – Up to maximum deviation of 12.5mm (1/2”) in a localized area directly under the test vehicle tire. Reaction – A movement back to a former or less advanced condition Pumping – Vertical displacement of the top surface of the compacted layer, not directly under the vehicles tires. Loaded Haul Vehicle – Water truck or Construction material haul unit i.e. belly bump, end dump or similar GVW – Gross Vehicle Weight PROCEDURE The compacted layer will be observed for deflection by using a loaded haul vehicle, loaded to the vehicles maximum highway legal (GVW). The vehicle will be driven at a speed of 1 – 2 m/s (2 – 4 miles/hour) over the entire compacted layer. There shall be no yielding, deflection, reaction, or pumping of the ground surface (as defined above) observed under the moving vehicle’s tires. It may be required that testing be performed under the observation of the Engineer.
1 ODOT TM 158(06)
REPORT Results shall be reported on standard form (1793S & 1793B) or other form approved by the agency. Include the following information: • Location of test & Represented Area, elevation of surface, and thickness of layer
tested • Visual description of material tested • Description of the equipment used to perform the test • Name and signature of the technician conducting the test
1 ODOT TM 158(06)
ODOT TM 225
Method of Test for PRESENCE OF WOOD WASTE IN PRODUCED AGGREGATES SCOPE This method of test covers a procedure for determining the presence of wood waste or other deleterious materials in produced aggregates. APPARATUS 1. Sample splitter or a canvas suitable for splitting a sample. 2. Balance or scale sensitive to 0.1 g and having the capacity to meet required minimum
masses. 3. Oven or microwave - Operated per FOP for AASHTO T255. 4. Container - The container shall be of a size to permit covering the sample with 75mm
to 100mm (3" to 4") of water. 5. Sieve - 425 μm (No. 40). 6. Spoon. SAMPLE 1. The sample shall be obtained as per FOP for AASHTO T2. 2. The sample shall be split per FOP for AASHTO T248. 3. Size of sample shall conform to FOP for AASHTO T27. PREPARATION OF SAMPLE Dry the sample to a constant mass per FOP for AASHTO T255/265. If the sample appears to contain wood or other deleterious materials, use caution during the drying the process. A controlled oven maintained at a temperature of 110 ±5ºC (230 ±9ºF) should be utilized.
1 ODOT TM 225(06)
Note: The samples are normally wet sieved to check material passing the 75 μm (No. 200) sieve. While washing the materials, the procedure covered in Section 5 can be done. If you do this be sure to put the wood waste back into the dried aggregate prior to weighing and calculating the percent passing 75 μm (No. 200). PROCEDURE 1. Record the sample dry mass the sample to the nearest 0.1 g. 2. Place the dried sample into the container and cover with water to a height of 75mm to
100mm (3" to 4"). 3. Agitate the sample with the spoon. 4. Spoon or decant off any floating material over the 425 μm (No. 40) sieve. 5. Put the floating material into a container (suitable for the drying method being used)
and dry per FOP for AASHTO T255. 6. Record the wood waste mass to the nearest 0.1 g by weighing the container and its
contents and subtracting the tare mass. CALCULATIONS AND REPORTS contaminant mass 1. Wood Waste (nearest 0.01%) = -------------------------------- x 100 sample mass 2. Report on form 734-1792.
2 ODOT TM 225(06)
ODOT TM 227 Method of Test for
EVALUATING CLEANNESS OF COVER COAT MATERIAL SCOPE The cleanness test indicates the relative amount, fineness, and character of clay-like materials present on aggregate as coatings or otherwise. APPARATUS 1. Funnel to hold nested 2.36mm (No. 8) (or 2.00mm (No. 10)) and 75 μm (No. 200)
sieves at the large end and necked down to rest in a 500 ml graduate at the small end.
2. Plastic wide-mouth 3.8 L (one gallon) jars with lids and rubber gaskets. 3. Sand equivalent cylinder, rubber stopper, and timing device. These items are
standard sand equivalent equipment. 4. Graduated glass or plastic cylinders of 10 ml and 500 ml capacities. 5. Sieves. 75 μm (No. 200) and a 2.36mm (No. 8) (or 2.00mm (No. 10)), full height. 6. A balance or scale sensitive to 0.1 g. 7. Sand equivalent stock solution. 8. Splitter. Any device may be used which will divide the sample into representative
portions. However, the riffle-type splitter is preferable to hand-quartering. 9. Syringe or spray attachment. 10. Forced draft, ventilated, or convection oven capable of maintaining a temperature of
110±5°C (230±9°F).
1 ODOT TM227 (04)
CONTROL 1. Temperature of the wash solution shall be maintained within the range of 18°-28° C
(64°-82° F) during performance of this test. 2. Use distilled or demineralized water for performance of the cleanness test. This is
necessary because the test results are affected by certain minerals dissolved in water.
PREPARATION OF SAMPLE 1. Split a representative portion of the sample large enough to yield 1000 g ±50 g of
material (FOP for AASHTO T248). 2. The cover coat material must be tested in oven dry condition (FOP for AASHTO
T255). Drying temperature shall not exceed 110°C (230°F). Cool cover coat material to room temperature for testing.
PROCEDURE 1. Place the sand equivalent cylinder on a work table which will not be subjected to
vibrations during the sedimentation phase of the test. 2. Pour 7 ml of the STOCK SOLUTION into the sand equivalent cylinder. 3. Nest the two sieves in the large funnel which in turn rests in the 500 ml graduate.
The 2.36mm (No. 8) (or 2.00mm (No. 10)) sieve serves only to protect the 75 μm (No. 200) sieve.
4. Place the prepared sample in the 3.8 L (one gallon) jar. Add only enough water to
completely cover the aggregate, and cap tightly. Note: Do not add too much water at the beginning of the test, as only 500 ml
is allowed after the final rinsing. 5. Begin agitation after one minute has elapsed from the introduction of the water. The
agitation procedure is described as follows: 5.1 While holding the jar vertically with both hands, the washing shall be done with an
arm motion that causes the jar to rotate in a circle with approximately a 150mm (6") radius. The jar may be held either by the sides or by the top and bottom, whichever is more convenient.
2 ODOT TM227 (04)
Note: The jar itself does not turn on its vertical axis. The jar's vertical axis describes a circle with a 150mm (6") radius, as near as possible.
5.2 Continue this agitation at the rate of two complete rotations per second for one
minute. 6. At the end of the agitation period, empty the contents of the jar over the nested
2.36mm (No. 8) (or 2.00mm (No. 10)) and 75 μm (No. 200) sieves. 7. Use the syringe or spray attachment and carefully wash out the jar, pouring the
wash water over the nested sieves. Continue to wash the aggregate in the sieves until the graduate is filled to the 500 ml mark.
8. Remove the funnel and nested sieves from the graduate. Bring all solids in the
wash water into suspension by capping the graduate with the palm of the hand and turning the cylinder upside down and right side up 10 times through 180°, as rapidly as possible.
9. Immediately pour the thoroughly mixed liquid into the sand equivalent cylinder until
the 380mm (15”) mark is reached. 10. Place the stopper in the end of the cylinder, and prepare to mix the contents
immediately. 11. Mix the contents of the cylinder by alternately turning the cylinder upside down and
right side up, allowing the bubble to completely traverse the length of the cylinder. Repeat this cycle 10 times in approximately 35 seconds. A complete cycle is from right side up to upside down and back to right side up.
11.1 At the completion of the mixing process, place the cylinder on the work table and
remove the stopper. Allow the cylinder to stand undisturbed for 20 minutes. Then immediately read and record to the nearest 2.5mm (0.1 inch), the height of the column of sediment.
12. Two unusual conditions may be encountered during this phase of the test. 12.1 A clearly defined line of demarcation may not form in the specified 20 minutes. If
this happens, allow the cylinder to stand until one forms, then immediately read and record.
12.2 The liquid immediately above the line of demarcation may still be cloudy at the end
of the 20 minutes. The line, although distinct, may appear to be in the sediment column itself. Read and use the line of demarcation after the end of the 20 minute period.
3 ODOT TM227 (04)
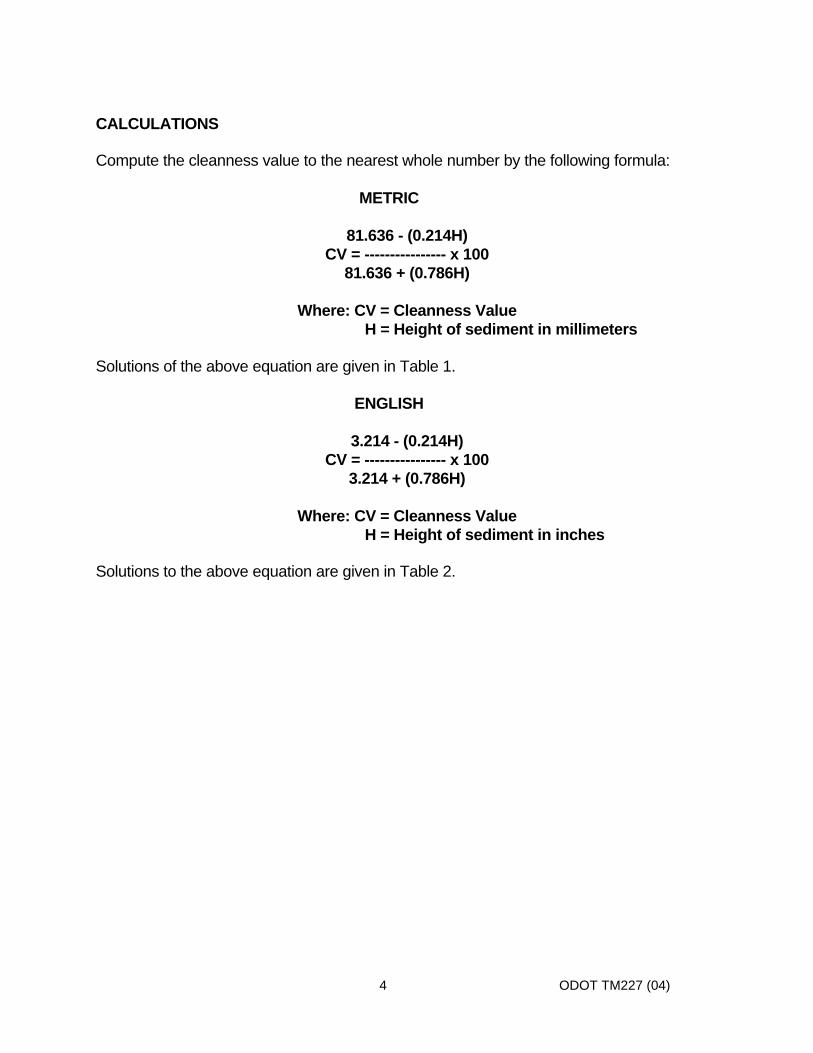
CALCULATIONS Compute the cleanness value to the nearest whole number by the following formula:
METRIC
81.636 - (0.214H) CV = ---------------- x 100 81.636 + (0.786H) Where: CV = Cleanness Value H = Height of sediment in millimeters Solutions of the above equation are given in Table 1.
ENGLISH
3.214 - (0.214H) CV = ---------------- x 100 3.214 + (0.786H) Where: CV = Cleanness Value H = Height of sediment in inches Solutions to the above equation are given in Table 2.
4 ODOT TM227 (04)

TABLE 1
5 ODOT TM227 (04)

TABLE 2
6 ODOT TM227 (04)
ODOT TM 229 Method of Test for
DETERMINATION OF FLAT and ELONGATED MATERIAL IN COARSE AGGREGATES
SCOPE This procedure covers the determination of the percentage, by mass, of flat and elongated particles in coarse aggregates for comparison with specification limits. Flat and elongated particles of aggregates, for some construction applications, may interfere with consolidation and result in harsh, difficult to place materials and a potentially unstable mixture. For purposes of this test procedure, the term “Elongated Pieces” in applicable specifications shall be taken to be equivalent to the term “Flat and Elongated Particles” used in this test method. APPARATUS 1. Balance or scale: Capacity sufficient for the principle sample mass, accurate to 0.1
percent of the sample mass or readable to 0.1 g. 2. Sieves, meeting requirements of AASHTO M 92. 3. Proportional Caliper Device, meeting the requirements of ASTM D 4791 and
approved by the Agency. TERMINOLOGY Flat and Elongated Particles - Those aggregate particles having a ratio of length to thickness greater than a specified value. SAMPLING AND SAMPLE PREPARATION 1. Sample the aggregate in accordance with AASHTO T 2. 2. Dry the sample sufficiently to obtain separation of coarse and fine material and sieve
in accordance with AASHTO T 27 over the 4.75mmmm (No. 4) sieve. Discard the material passing the specified sieve.
1 ODOT TM 229(04)
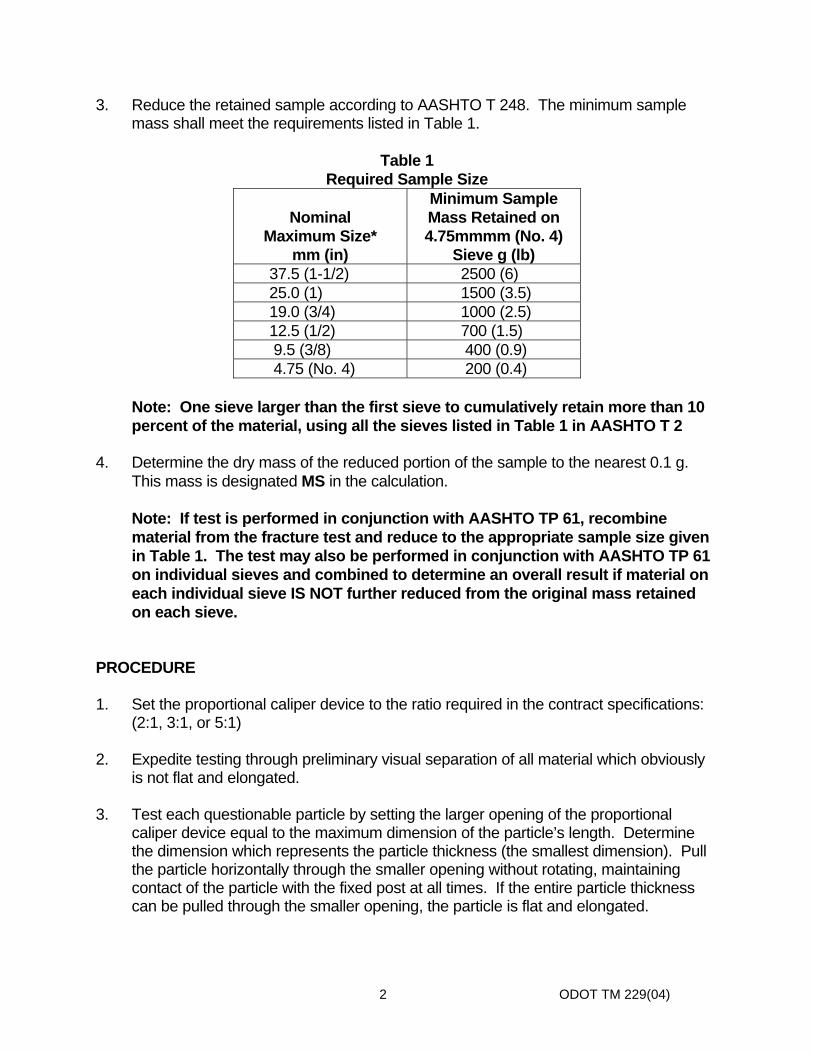
3. Reduce the retained sample according to AASHTO T 248. The minimum sample mass shall meet the requirements listed in Table 1.
Table 1
Required Sample Size
Nominal Maximum Size*
mm (in)
Minimum Sample Mass Retained on 4.75mmmm (No. 4)
Sieve g (lb) 37.5 (1-1/2) 2500 (6) 25.0 (1) 1500 (3.5) 19.0 (3/4) 1000 (2.5) 12.5 (1/2) 700 (1.5) 9.5 (3/8) 400 (0.9) 4.75 (No. 4) 200 (0.4)
Note: One sieve larger than the first sieve to cumulatively retain more than 10 percent of the material, using all the sieves listed in Table 1 in AASHTO T 2
4. Determine the dry mass of the reduced portion of the sample to the nearest 0.1 g.
This mass is designated MS in the calculation.
Note: If test is performed in conjunction with AASHTO TP 61, recombine material from the fracture test and reduce to the appropriate sample size given in Table 1. The test may also be performed in conjunction with AASHTO TP 61 on individual sieves and combined to determine an overall result if material on each individual sieve IS NOT further reduced from the original mass retained on each sieve.
PROCEDURE 1. Set the proportional caliper device to the ratio required in the contract specifications:
(2:1, 3:1, or 5:1) 2. Expedite testing through preliminary visual separation of all material which obviously
is not flat and elongated. 3. Test each questionable particle by setting the larger opening of the proportional
caliper device equal to the maximum dimension of the particle’s length. Determine the dimension which represents the particle thickness (the smallest dimension). Pull the particle horizontally through the smaller opening without rotating, maintaining contact of the particle with the fixed post at all times. If the entire particle thickness can be pulled through the smaller opening, the particle is flat and elongated.
2 ODOT TM 229(04)
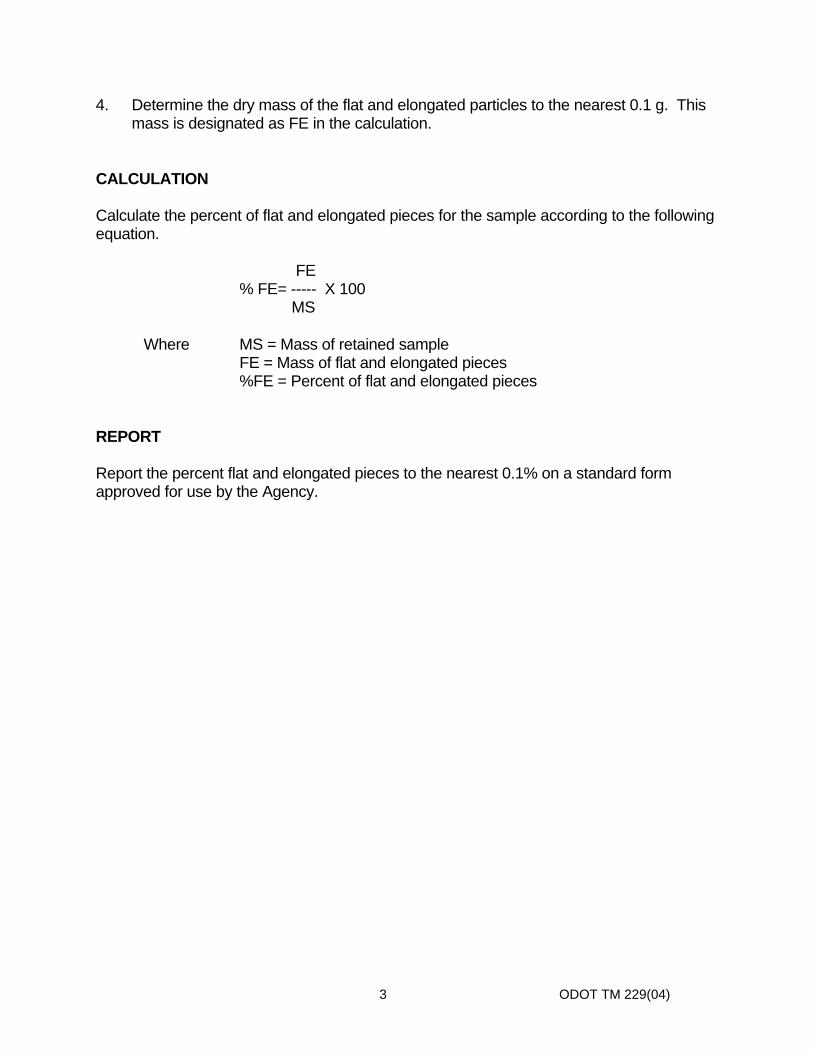
4. Determine the dry mass of the flat and elongated particles to the nearest 0.1 g. This mass is designated as FE in the calculation.
CALCULATION Calculate the percent of flat and elongated pieces for the sample according to the following equation. FE % FE= ----- X 100 MS Where MS = Mass of retained sample FE = Mass of flat and elongated pieces %FE = Percent of flat and elongated pieces REPORT Report the percent flat and elongated pieces to the nearest 0.1% on a standard form approved for use by the Agency.
3 ODOT TM 229(04)

THIS PAGE INTENTIONALLY LEFT BLANK
4 ODOT TM 229(04)
1 ODOT TM 301(05)
ODOT TM 301 Method of Test For ESTABLISHING ROLLER PATTERNS FOR THIN LIFTS OF HMAC SCOPE This method is a procedure which provides a method to establish the roller patterns and number of passes required to achieve a maximum density for the JMF, paving conditions, and equipment on the project. This method is used with the same rollers and materials to be used throughout the project. Changes in materials, rolling equipment or weather conditions may require establishment of new roller patterns. This procedure is used when required by the specifications to determine the optimum rolling pattern for HMAC placed in lifts with a nominal thickness less than 50 mm (2 in). DEFINITIONS In-Place Density - the density of a bituminous mixture as it exists in the pavement. The in-place density will be determined using a Nuclear Moisture-Density Gauge according to WAQTC TM 8 unless otherwise specified. Evaluation Point - a testing point selected within the roller pattern and used to determine the increasing in-place densities of the pavement with successive roller passes. Roller Pass - the passing of a roller over an area (roller width) one time. Roller Coverage - the rolling of the entire width of pavement one time, including roller overlaps. Breakdown Rolling - constitutes the first roller coverage on the mixture after it is placed. Intermediate Rolling - constitutes all rolling following the breakdown rolling, prior to the temperature of the mixture lowering to 80-Degree C (180 °F). Optimum Rolling Pattern – the combination of rollers, temperatures, and roller passes which results in the maximum achievable density for the JMF, paving conditions, and equipment on the project. Finish Rolling - constitutes the roller coverage, after the intermediate rolling, required to bring the mixture to a smooth, tight surface, while the mixture is warm enough to permit the removal of any roller marks.
2 ODOT TM 301(05)
APPARATUS 1. A nuclear density gauge meeting the apparatus requirements of TM-8. 2. Transport case for properly shipping and housing the gauge and tools. 3. Instruction manuals for the specific make and model of the gauge. 4. A suitable thermometer for measuring the temperature of the paved surface. DETERMINING OPTIMUM ROLLING PATTERN 1. An optimum rolling pattern shall be established when required by the specifications. 2. Two evaluation points shall be selected within the section being paved. The
evaluation points must be at least 15 meters (50 feet) from a transverse joint; no closer than 0.6 meters (1 ft) from the edge of the panel being placed, and in an area that is representative of the overall material and conditions of placement. The two evaluation points shall be located at the same station, but must be at least 1 meter (3 ft) apart transversely. Make sure the evaluation points are not located where the roller passes overlap.
3. After each roller pass over the evaluation points, the nuclear gauge is used in the
backscatter position to determine the in-place density with a 15-second count. Each un-sanded evaluation point is carefully marked so the subsequent tests are made in exactly the same positions and locations.
4. For each roller used and each pass over each evaluation point, record the type of
roller, surface temperature, density in-place (15 second reading), direction of travel, and whether in vibratory or static mode. Average the readings from the two evaluation points after each pass.
5. Continue compacting and testing each evaluation point after each roller pass until the
average of the readings from the two evaluation points does not increase. (The average of the two readings may decrease or level off to indicate this.)
6. The optimum rolling pattern consists of one less than the number of passes
necessary to reach the point at which density does not increase as established in Step 5.
7. Any finish rolling necessary to remove roller marks will be in addition to the required
number of passes for the optimum rolling pattern.
3 ODOT TM 301(05)
REPORT The report shall be made on a form approved by the Agency and shall include the following:
• Make and serial number of nuclear gauge
• Name of the Certified Technician
• For each pass for each evaluation point record the type of roller, surface temperature, density in-place (15 second reading), direction of travel, and whether in vibratory or static mode.
• The average density of the two evaluation points for each pass.
• Lift thickness of layer tested.
• Level and type of HMAC material
• Optimum Roller Pattern

4 ODOT TM 301(05)
THIS PAGE INTENTIONALLY LEFT BLANK

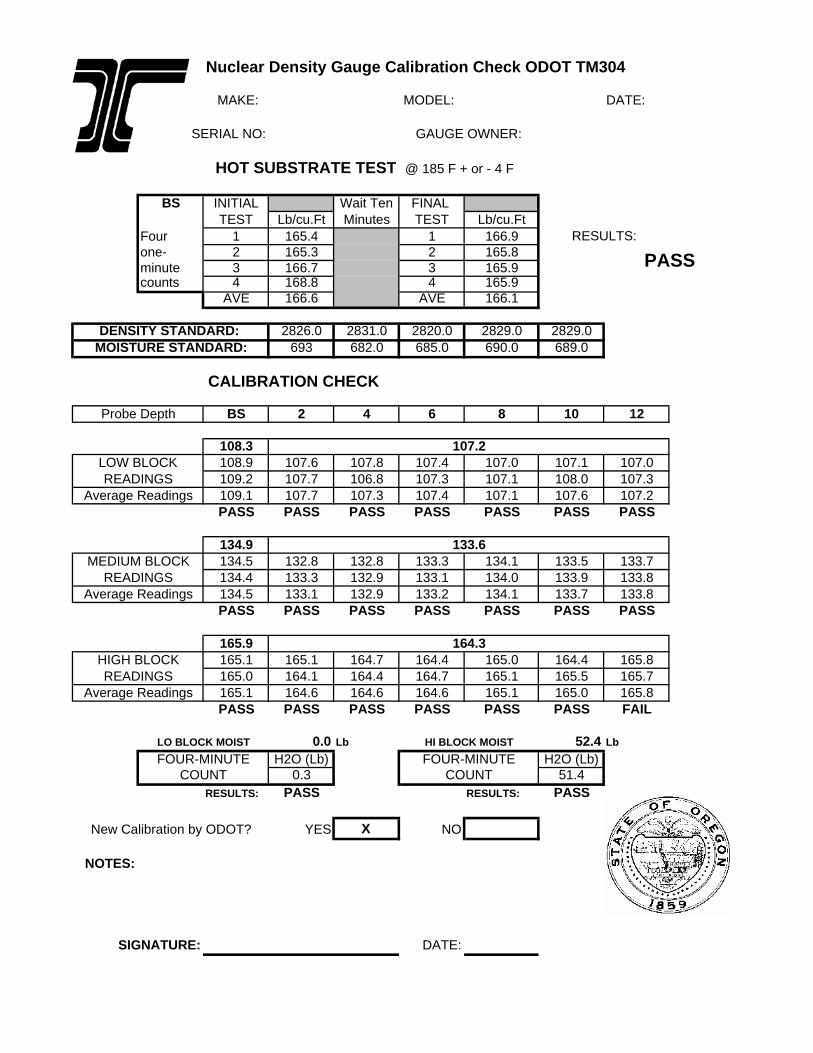
ODOT TM 304
Method of Test for NUCLEAR DENSITY/MOISTURE GAUGE CALIBRATION AND AFFECT OF HOT SUBSTRATE SCOPE Determination of the accuracy and/ or to calibrate a Nuclear Density/Moisture Gauge and determine the effect of high temperatures, such as that found in Asphalt Concrete Pavements, on the proper functioning of the Nuclear Gauge. A Nuclear Density/Moisture Gauge calibration check and Hot Substrate Test shall be performed every 12 months or any time the calibration of the gauge is in question. APPARATUS 1. A Nuclear Gauge capable of making moisture and density determinations. The
Gauge shall be so constructed to be licensable in accordance with applicable health and safety standards, established by the State Health Division. A copy of the owner’s Radioactive Materials License and a copy of the most current leak test results will accompany the Nuclear Gauge. The Nuclear Gauge shall be in good operating condition.
2. A carrying /transport case. 3. Instruction manual, supplied by the gauge manufacturer, describing the operating
procedures for the model of gauge being used. 4. A reference standard block for obtaining standard counts and checking gauge
operation. 5. Logbook for recording daily counts obtained on the reference block. 6. Calibration tables, as required, for determining the moisture content and the density
from calculated count ratios. 7. Calibration blocks of approximate densities 1717kg/m3 (107.2 PCF), 2140kg/m3
(133.6 PCF), and 2631kg/m3 (164.3 PCF) large enough to represent an infinite below surface volume to the gauge.
8. A High Moisture Calibration Block. Made of suitable material, which will produce a
moisture reading of 839kg/m3 (52.4PCF).
1 ODOT TM 304(06)
9. Surface temperature measuring device, capable of a range from -100 C to 1500 C (00 to 3000 F) readable to 20 C (50 F).
10. Hot plate device consisting of an aluminum block, of adequate size, that fits on an
electric hot plate mounted on a dolly. The electric hot plate requires a 120 volt, 60 hertz power source.
Note: ODOT uses an aluminum block 41cm (16in) x 46cm (18in) x 16cm (6.3in).
NUCLEAR DENSITY GAUGE PREPARATION 1. Gauge shall be placed in a temperature controlled area for no less than 4 hours, to
assure component parts are at a room temperature of 160C (600F) to 240C (750F). 2. Turn the gauge on and allow it to warm up for a minimum of 10 minutes. 3. Place the Standard count block in the center of the middle calibration block. With
the standard count block in this position, perform five standard counts in accordance with the manufacturer's guidelines. Record the standard counts on the Nuclear Density Gauge Calibration Check Sheet and, check that the variances between counts are within the manufacturer’s guidelines. If the variances between counts are within the manufacturer’s guidelines go to No 5.
4. If, the variances between counts are not within the manufacturer’s guidelines.
4.1 Continue performing standard counts in accordance with the manufacturer's
guidelines. Record and check each standard count for compliance with manufacturer’s guidelines. No more than two additional standard counts should be performed.
4.2 If the manufacturer’s guidelines are met, go to No. 5. 4.3 If the manufacturer’s guidelines not are met within two additional standard counts
or the additional standard counts continue to show variances outside the manufacturer’s guidelines, contact the gauge owner, inform them of the problem and arrange for the return of the gauge.
. 5. Set the gauge to take one-minute counts.
2 ODOT TM 304(06)
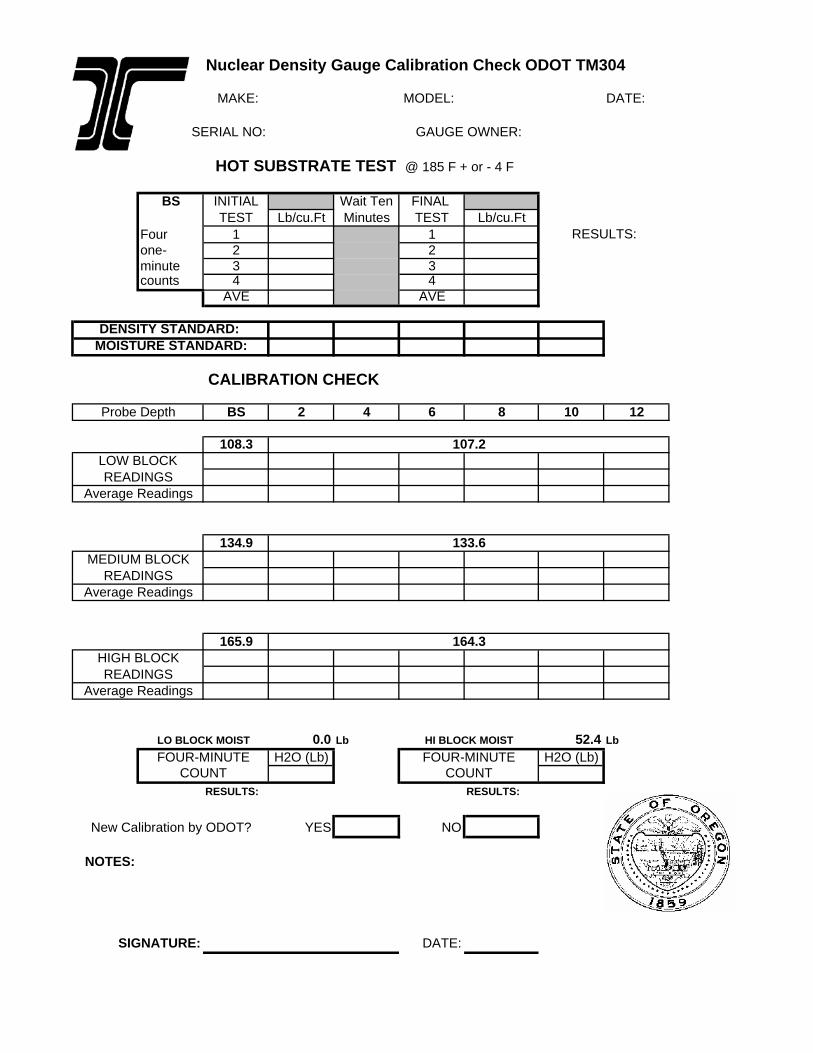
NUCLEAR DENSITY GAUGE HOT SUBSTRATE TEST
1. Plug in or turn on the heating device for the aluminum block. Heat the block to 850C +- 20C or 1850F +- 40F and check the temperature by using a surface thermometer. (Heating of the block usually takes 4 to 6 hours.)
2. With the gauge at room temperature of 160C (600F) to 240C (750F) and the block at 850C
(1850F). Place the gauge on the block, immediately move the source into the backscatter position and start a one-minute count.
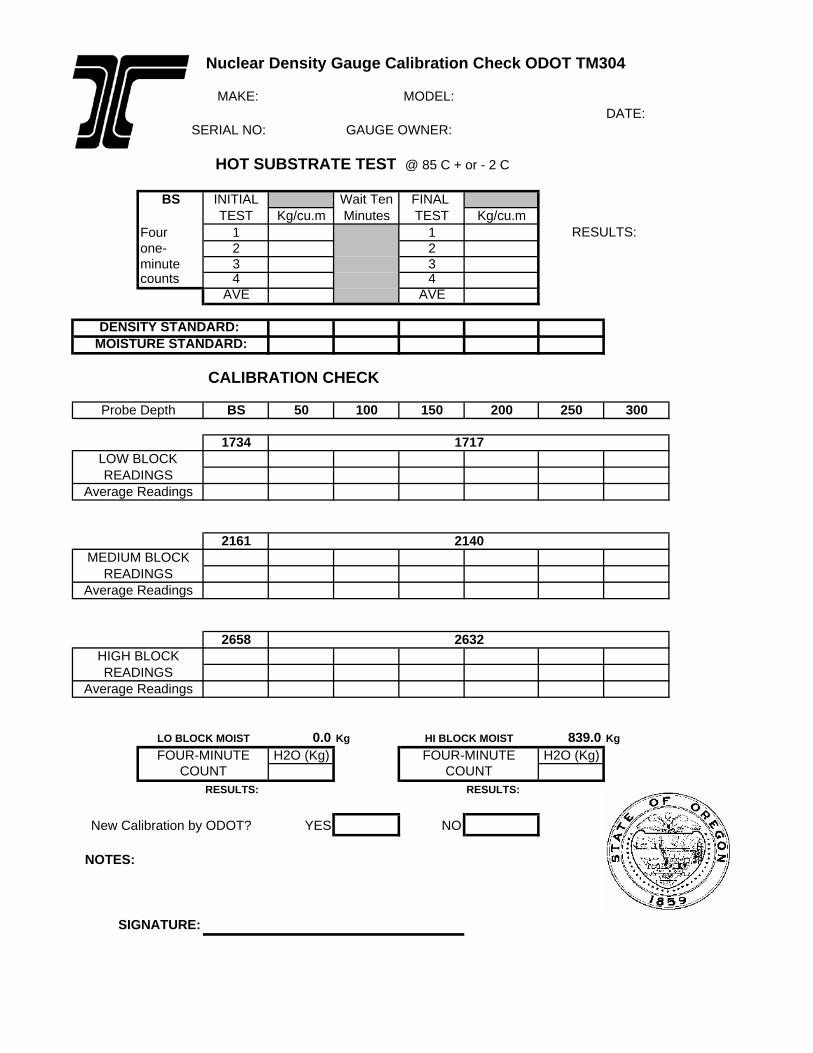
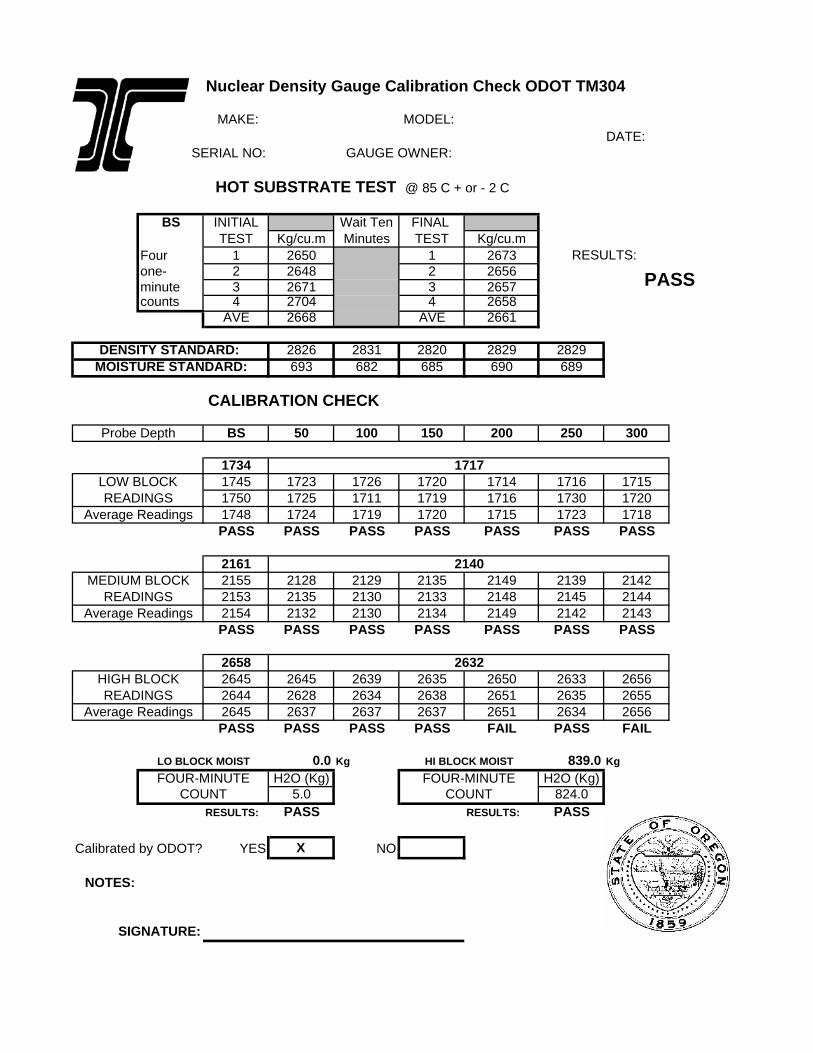
3. Record the first wet density in the “Initial Test” column of the Hot Substrate Test portion of
the Nuclear Density Gauge Calibration Check Sheet and immediately start a second one-minute count. Continue taking one-minute counts and recording wet densities until there are a total of four.
4. Leave the gauge on the block for 10 minutes. 5. At the conclusion of the 10-minute waiting period, immediately start a one-minute count.
Record the wet density in the “Final Test” column of the Hot Substrate Test portion of the Nuclear Calibration Check Sheet and immediately start a second one-minute count. Continue taking one-minute counts and recording wet densities until there is a total of four. Remove the gauge from the block to cool.
6. If, at anytime during the test, the gauge display fogs or becomes unreadable due to
moisture, the gauge fails this test. Input no data on the Nuclear Density Gauge Calibration Check Sheet and put an explanation of why the gauge failed in the “Remarks” section, then sign and date the sheet. Contact the gauge owner and arrange for it’s return. A copy of the Nuclear Density Gauge Calibration Check Sheet shall be made available to the gauge owner.
7. Average the “Initial test” column and average the “Final test” column. Compare the Initial
test average to the Final test average. If the averaged densities are within 16 kg/m3 (1.0 lbs/ft3) the gauge passes this test. If the averaged densities are not within 16 kg/m3 (1.0 lbs/ft3) the gauge fails.
8. If the results “Pass”, indicate the result on the Nuclear Density Gauge Calibration Check
Sheet under “Hot Substrate Results”. Allow the gauge to cool to room temperature and then proceed with the calibration check.
9. If the results “Fail”, indicate the result on the Nuclear Density Gauge Calibration Check
Sheet under “Hot Substrate Results”, then sign and date it. If an ODOT Quality Assurance Program Inspection Tag is currently on the gage, remove it from the gage and place it with Nuclear Density Gauge Calibration Check Sheet in your records. Inform the owner of the failure and arrange for the return of the gauge. A copy of the Nuclear Density Gauge Calibration Check Sheet shall be made available to the gauge owner.
3 ODOT TM 304(06)
NUCLEAR DENSITY/MOISTURE GAUGE ANNUAL CHECK OF ACCURACY FOR GAUGES WITH INTERNAL COMPUTERS 1. The calibration blocks shall be located in accordance with the manufacturer's
recommendations, and no other unshielded Nuclear gauge shall be within 15 meters (50 feet) during annual check of accuracy or calibration. An example of a the Nuclear Density Gauge Calibration Check sheet is enclosed with this procedure
2. Block Values used by ODOT.
Back Scatter Direct Transmission Low Density 1735 kg/m3(108.3 PCF) 1717 kg/m3 (107.2PCF) Medium Density 2161 kg/m3 (134.9PCF) 2140 kg/m3(133.6PCF) High Density 2657 kg/m3 (165.9PCF) 2632 kg/m3 (164.3PCF)
3. With the gauge at room temperature 160C (600F) to 240C (750F). Locate the gauge
on the Low-Density block so the edge of the gauge closes to the probe is 2.5cm (1 inch) from the edge of the transmission hole and the gauge is in the center of the block. The gauge shall not be placed on the block in such a manner so that it covers the transmission hole during backscatter reading. Move the handle into the backscatter position. Perform two one-minute counts and record the wet density results.
4. Repeat this process on the Medium and High Density blocks. 5. Locate the source rod in the 50mm(two inch) direct transmission position and seat in
the transmission hole of the Low density block. Perform two one-minute counts and record the wet densities.
6. Repeat the counting and recording procedures for all depth increments to the
maximum depth on the Low, Medium, and High Density Blocks. 7. Average each individual depth’s results and compare the averaged result with the
respective block densities listed above. If this is an annual check then the averaged results must be within ± 16kg/m3 (1.0 lbs/ft3) on the low and Medium Density blocks and ± 24kg/m3 (1.5 lbs/ft3) on the High Density Block of the values given in No. 2 or the gauge fails and must be recalibrated, go to the Nuclear Density/Moisture Gauge Calibration Procedure section later in this chapter. If this is a check of a gauge recalibrated in accordance with the Nuclear Density/Moisture Gauge Calibration Procedure section then the results are all to be within the within ± 16kg/m3 (1.0 lbs/ft3) of the values given in No. 2 above. If the above parameters are met, continue to No. 8 below. If the above parameters are not met the gauge must be recalibrated in accordance with the Nuclear Density/Moisture Gauge Calibration Procedure section.
4 ODOT TM 304(06)
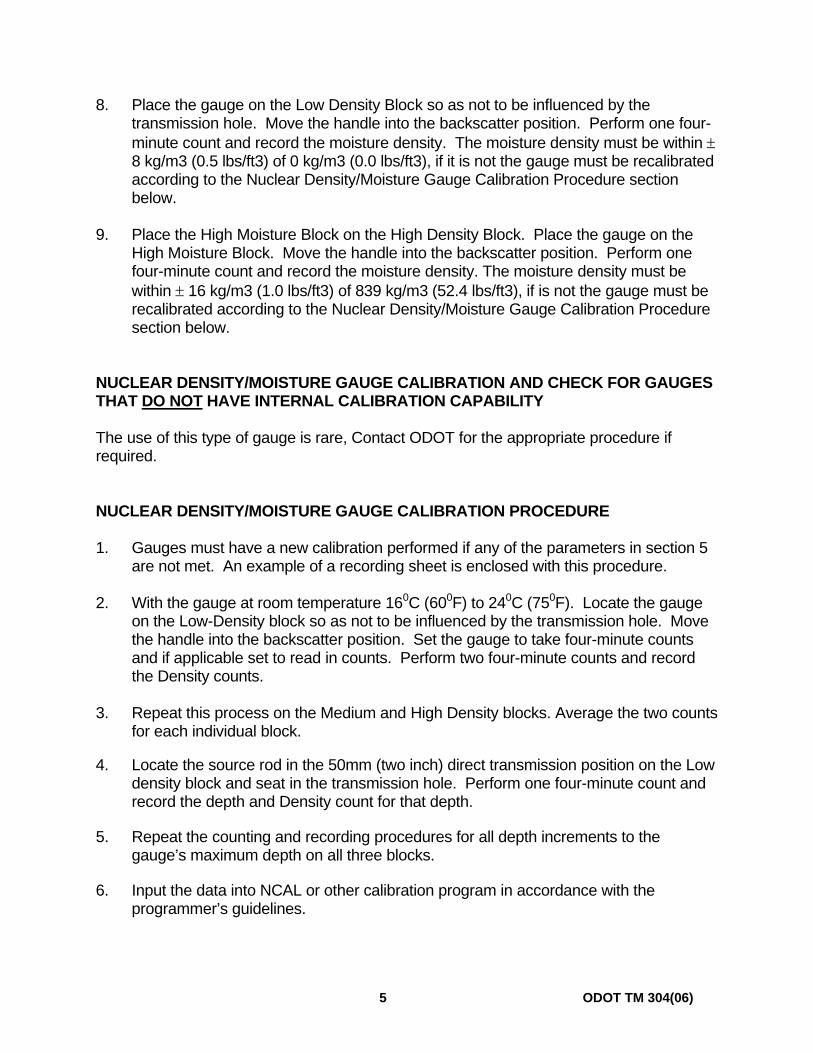
8. Place the gauge on the Low Density Block so as not to be influenced by the transmission hole. Move the handle into the backscatter position. Perform one four-minute count and record the moisture density. The moisture density must be within ± 8 kg/m3 (0.5 lbs/ft3) of 0 kg/m3 (0.0 lbs/ft3), if it is not the gauge must be recalibrated according to the Nuclear Density/Moisture Gauge Calibration Procedure section below.
9. Place the High Moisture Block on the High Density Block. Place the gauge on the
High Moisture Block. Move the handle into the backscatter position. Perform one four-minute count and record the moisture density. The moisture density must be within ± 16 kg/m3 (1.0 lbs/ft3) of 839 kg/m3 (52.4 lbs/ft3), if is not the gauge must be recalibrated according to the Nuclear Density/Moisture Gauge Calibration Procedure section below.
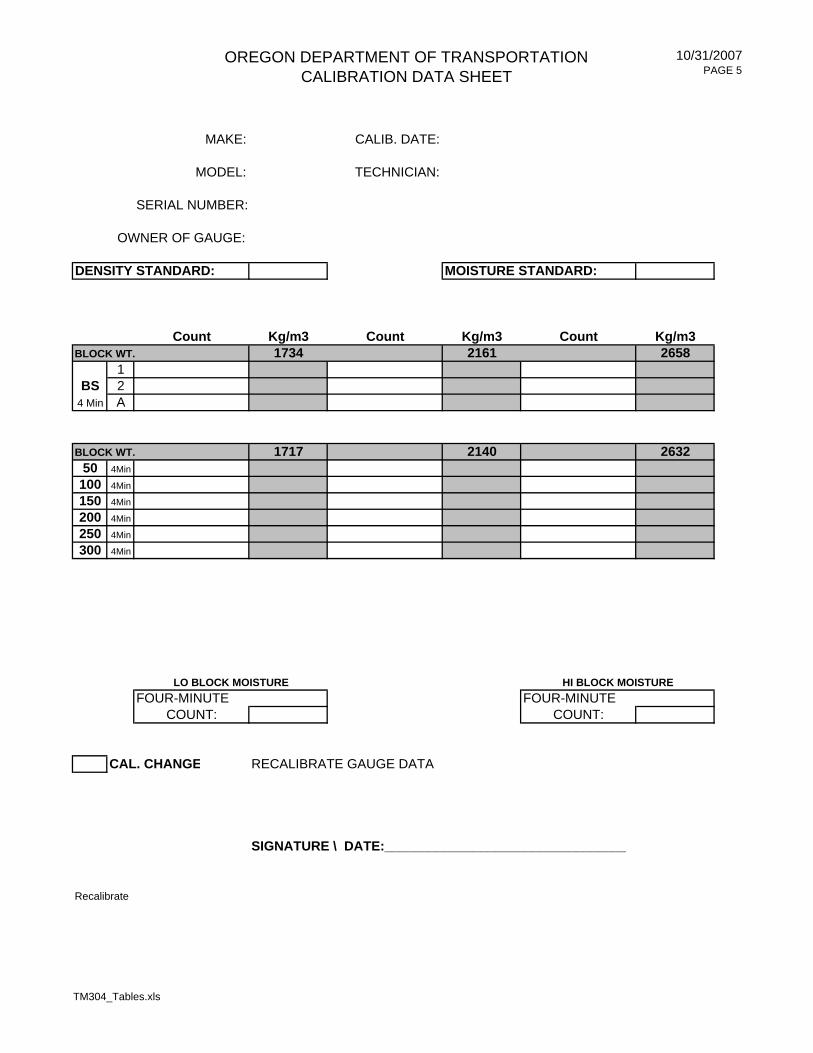
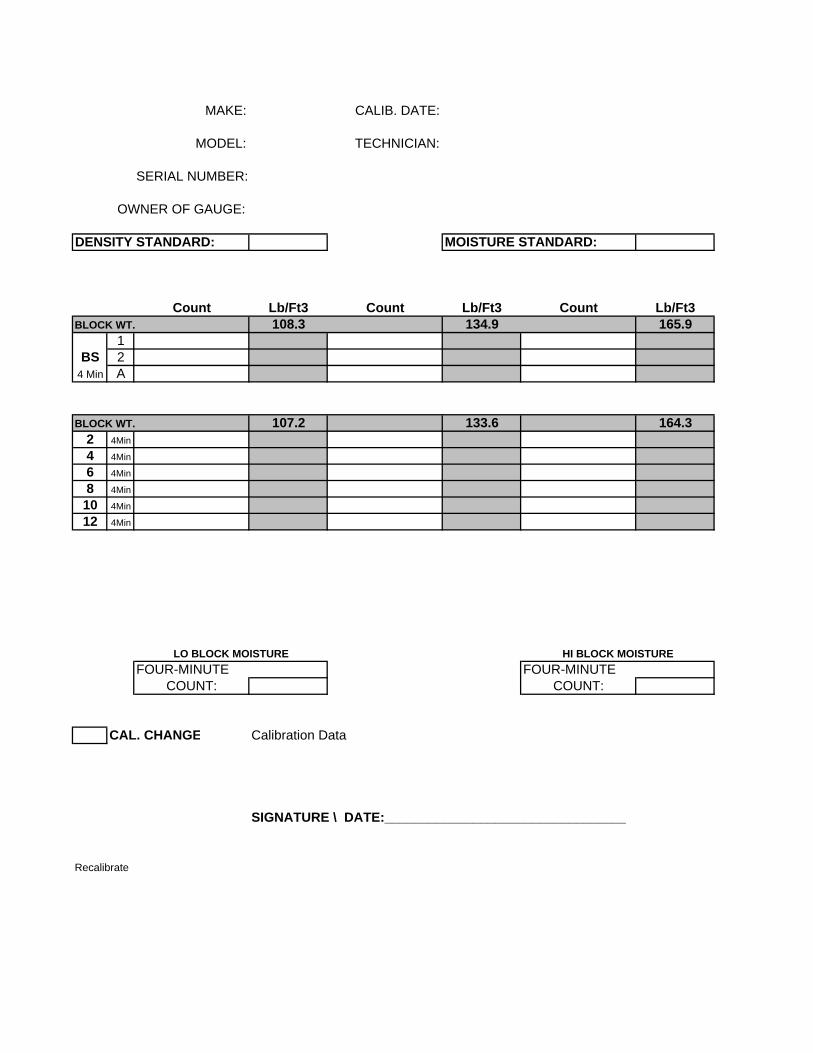
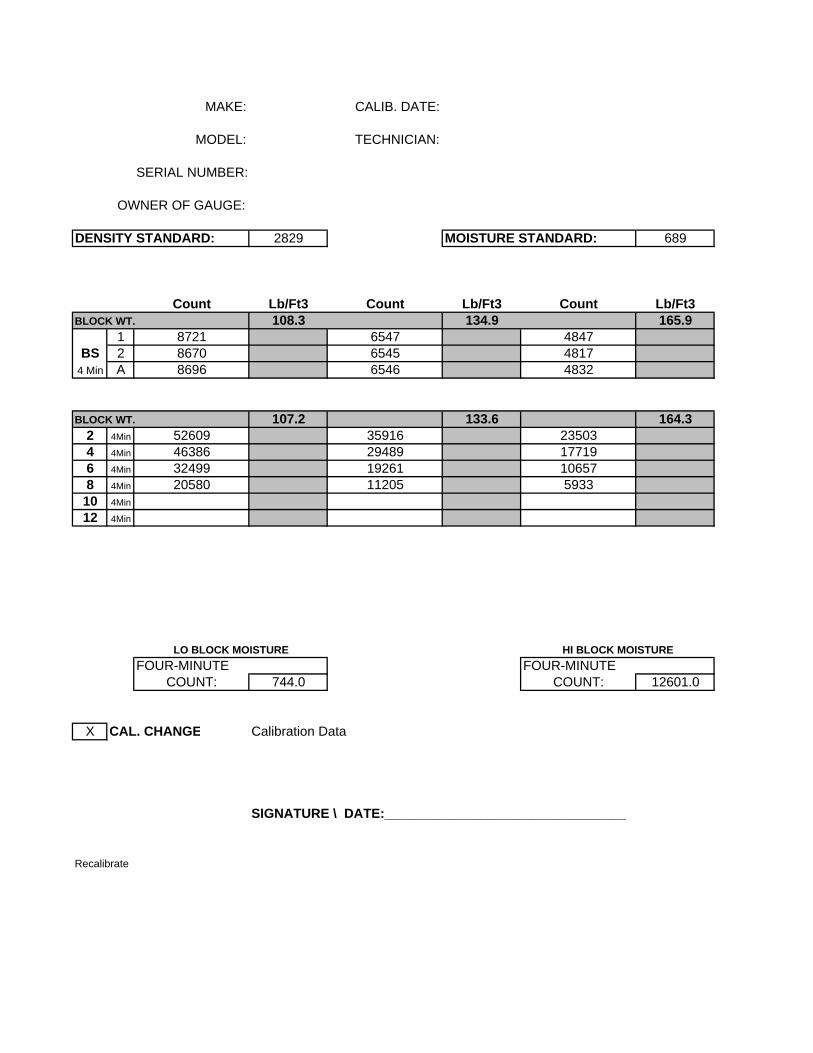
NUCLEAR DENSITY/MOISTURE GAUGE CALIBRATION AND CHECK FOR GAUGES THAT DO NOT HAVE INTERNAL CALIBRATION CAPABILITY The use of this type of gauge is rare, Contact ODOT for the appropriate procedure if required. NUCLEAR DENSITY/MOISTURE GAUGE CALIBRATION PROCEDURE 1. Gauges must have a new calibration performed if any of the parameters in section 5
are not met. An example of a recording sheet is enclosed with this procedure. 2. With the gauge at room temperature 160C (600F) to 240C (750F). Locate the gauge
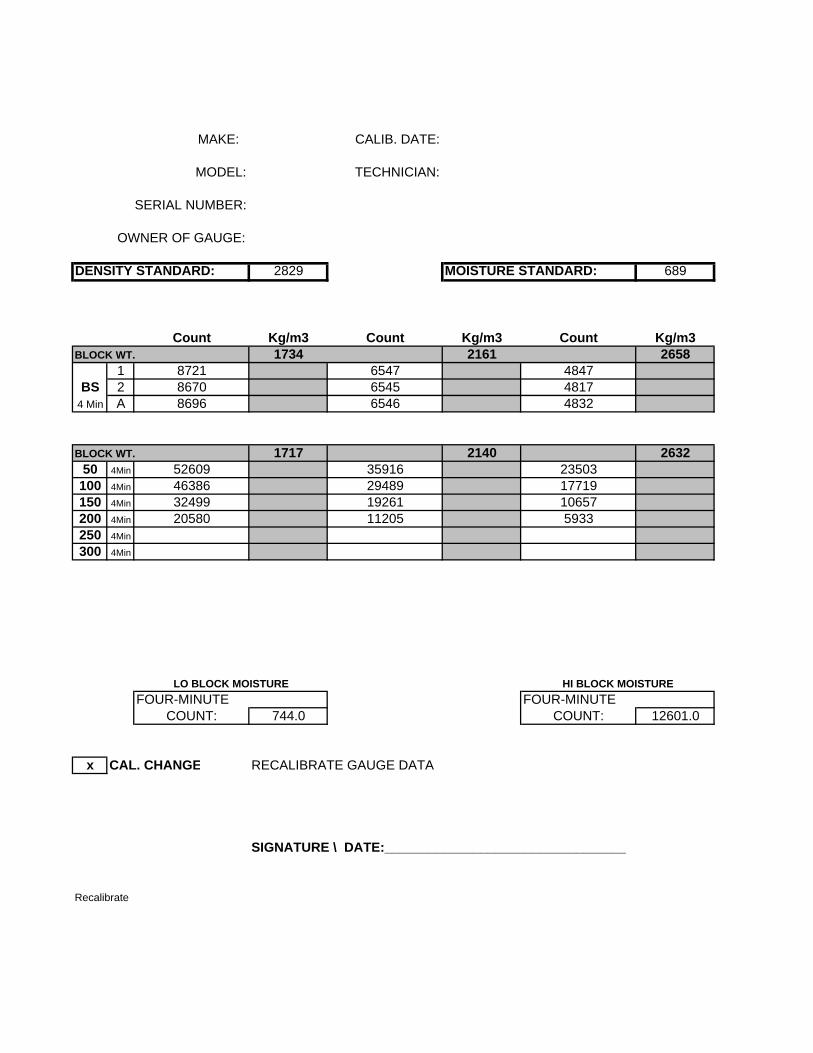
on the Low-Density block so as not to be influenced by the transmission hole. Move the handle into the backscatter position. Set the gauge to take four-minute counts and if applicable set to read in counts. Perform two four-minute counts and record the Density counts.
3. Repeat this process on the Medium and High Density blocks. Average the two counts
for each individual block. 4. Locate the source rod in the 50mm (two inch) direct transmission position on the Low
density block and seat in the transmission hole. Perform one four-minute count and record the depth and Density count for that depth.
5. Repeat the counting and recording procedures for all depth increments to the
gauge’s maximum depth on all three blocks. 6. Input the data into NCAL or other calibration program in accordance with the
programmer’s guidelines.
5 ODOT TM 304(06)
Note: must use the averaged backscatter counts that have been rounded to the nearest whole number when entering into NCAL.
Note: when counts are to large to enter into NCAL, all counts, including
standard counts must be divided by ten.
7. Print out the new constants.
8. Before the new constants are entered into the gauge, record the constants currently being used by the gauge.
9. Input the new constants in the gauge in accordance with the manufacturer’s
recommendations. 10. With the new constants in the gauge, the gauge must be checked for accuracy.
Perform the accuracy check in accordance with the Nuclear Density/Moisture Gauge Annual Check of Accuracy for Gauges with Internal Computers section above.
11. For gauges calibrated by ODOT:
11.1 Upon successful completion of the accuracy check, record in a log the manufacturer
and model of the gauge, the serial number, and the owner of the gauge. 11.2 Complete the Nuclear Density Gauge Calibration Check Sheet. Make a copy of the
Check Sheet, which is to be kept with the gauge. 11.3 Contact the owner and arrange for the return of the gauge.
GAUGES CALIBRATED BY OTHERS
1. All gages must be verified by ODOT in accordance with the Nuclear Density/Moisture Gauge Annual Check of Accuracy for Gauges with Internal Computers section above.
2. Upon successful verification by ODOT, record in a log the manufacturer and model of
the gauge, the serial number, and the owner of the gauge. 3. A copy of the calibration and ODOT verification is to be kept with the gauge. 4. Arrange for the return of the gauge.
6 ODOT TM 304(06)
REPORT Each work sheet shall include:
• Manufacturer and model number of gauge • Serial number of gauge • Gauge owner • Date of calibration check • Name of technician performing calibration check • Block densities to the nearest 1 Kg/m3 or 0.1 lbs/ft3 • Moisture Block densities to the nearest 0.1 Kg/m3 or 0.1 lbs/ft3 • Gauge, wet density readings to the nearest 1 Kg/m3 or 0.1 lbs/ft3 • Moisture reading check to the nearest 0.1 Kg/m3 or 0.1 lbs/ft3 • Signature of technician performing calibration check
FILE A file should be generated (electronic or paper) for each gauge checked. This file should at a minimum contain the following information:
• Initial check documentation report
Worksheet from the Report section above.
• If calibration was performed: Initial check documentation report Generated Constants Check documentation report Worksheet from the Report section above
The work sheets included with this test method are available in an Excel format. Contact the closes Quality Assurance Coordinator to your location.
7 ODOT TM 304(06)

THIS PAGE INTENTIONALLY LEFT BLANK
8 ODOT TM 304(06)
Nuclear Density Gauge Calibration Check ODOT TM304
MAKE: MODEL: DATE:
SERIAL NO:
@ 85 C + or - 2 C
BS INITIAL Wait Ten FINAL TEST Kg/cu.m Minutes TEST Kg/cu.m
Four 1 1one- 2 2minute 3 3counts 4 4
AVE AVE
BS 50 100 150 200 250 300
1734
2161
2658
0.0 Kg 839.0 KgH2O (Kg) H2O (Kg)
RESULTS: RESULTS:
YES NO
NOTES:
COUNTCOUNT
Average Readings
HIGH BLOCK
Average ReadingsREADINGS
2632
MEDIUM BLOCKREADINGS
Average Readings
HOT SUBSTRATE TEST
GAUGE OWNER:
SIGNATURE:
LO BLOCK MOISTFOUR-MINUTE FOUR-MINUTE
CALIBRATION CHECK
READINGSLOW BLOCK
New Calibration by ODOT?
RESULTS:
1717
2140
HI BLOCK MOIST
MOISTURE STANDARD:DENSITY STANDARD:
Probe Depth
Nuclear Density Gauge Calibration Check ODOT TM304
MAKE: MODEL: DATE:
SERIAL NO:
@ 85 C + or - 2 C
BS INITIAL Wait Ten FINAL TEST Kg/cu.m Minutes TEST Kg/cu.m
Four 1 2650 1 2673one- 2 2648 2 2656minute 3 2671 3 2657counts 4 2704 4 2658
AVE 2668 AVE 2661
2826 2831 2820 2829 2829693 682 685 690 689
BS 50 100 150 200 250 300
17341745 1723 1726 1720 1714 1716 17151750 1725 1711 1719 1716 1730 17201748 1724 1719 1720 1715 1723 1718PASS PASS PASS PASS PASS PASS PASS
21612155 2128 2129 2135 2149 2139 21422153 2135 2130 2133 2148 2145 21442154 2132 2130 2134 2149 2142 2143PASS PASS PASS PASS PASS PASS PASS
26582645 2645 2639 2635 2650 2633 26562644 2628 2634 2638 2651 2635 26552645 2637 2637 2637 2651 2634 2656PASS PASS PASS PASS FAIL PASS FAIL
0.0 Kg 839.0 KgH2O (Kg) H2O (Kg)
5.0 824.0RESULTS: PASS RESULTS: PASS
Calibrated by ODOT? YES X NO
NOTES:
GAUGE OWNER:
HOT SUBSTRATE TEST
RESULTS:
PASS
MOISTURE STANDARD:
CALIBRATION CHECK
DENSITY STANDARD:
Probe Depth
1717LOW BLOCKREADINGS
Average Readings
2140MEDIUM BLOCK
READINGSAverage Readings
2632HIGH BLOCKREADINGS
Average Readings
LO BLOCK MOIST HI BLOCK MOISTFOUR-MINUTE FOUR-MINUTE
COUNT COUNT
SIGNATURE:
OREGON DEPARTMENT OF TRANSPORTATIONCALIBRATION DATA SHEET
10/31/2007PAGE 5
MAKE: CALIB. DATE:
MODEL: TECHNICIAN:
SERIAL NUMBER:
DENSITY STANDARD: MOISTURE STANDARD:
Count Kg/m3 Count Kg/m3 Count Kg/m3BLOCK WT. 1734 2161 2658
1BS 2
4 Min A
BLOCK WT. 1717 2140 263250 4Min
100 4Min
150 4Min
200 4Min
250 4Min
300 4Min
COUNT: COUNT:
CAL. CHANGE RECALIBRATE GAUGE DATA
SIGNATURE \ DATE:_________________________________
Recalibrate
OWNER OF GAUGE:
HI BLOCK MOISTUREFOUR-MINUTE FOUR-MINUTE
LO BLOCK MOISTURE
TM304_Tables.xls
MAKE: CALIB. DATE:
MODEL: TECHNICIAN:
DENSITY STANDARD: 2829 MOISTURE STANDARD: 689
Count Kg/m3 Count Kg/m3 Count Kg/m3BLOCK WT. 1734 2161 2658
1 8721 6547 4847BS 2 8670 6545 4817
4 Min A 8696 6546 4832
BLOCK WT. 1717 2140 263250 4Min 52609 35916 23503100 4Min 46386 29489 17719150 4Min 32499 19261 10657200 4Min 20580 11205 5933250 4Min
300 4Min
COUNT: 744.0 COUNT: 12601.0
x CAL. CHANGE RECALIBRATE GAUGE DATA
SIGNATURE \ DATE:_________________________________
Recalibrate
FOUR-MINUTE FOUR-MINUTE
SERIAL NUMBER:
OWNER OF GAUGE:
LO BLOCK MOISTURE HI BLOCK MOISTURE
Nuclear Density Gauge Calibration Check ODOT TM304
MAKE: MODEL: DATE:
SERIAL NO:
@ 185 F + or - 4 F
BS INITIAL Wait Ten FINAL TEST Lb/cu.Ft Minutes TEST Lb/cu.Ft
Four 1 1one- 2 2minute 3 3counts 4 4
AVE AVE
BS 2 4 6 8 10 12
108.3
134.9
165.9
0.0 Lb 52.4 LbH2O (Lb) H2O (Lb)
RESULTS: RESULTS:
YES NO
NOTES:
DATE:
COUNT COUNT
SIGNATURE:
New Calibration by ODOT?
Average Readings
LO BLOCK MOIST HI BLOCK MOISTFOUR-MINUTE FOUR-MINUTE
Average Readings
164.3HIGH BLOCKREADINGS
Average Readings
133.6MEDIUM BLOCK
READINGS
Probe Depth
107.2LOW BLOCKREADINGS
DENSITY STANDARD: MOISTURE STANDARD:
CALIBRATION CHECK
GAUGE OWNER:
HOT SUBSTRATE TEST
RESULTS:
Nuclear Density Gauge Calibration Check ODOT TM304
MAKE: MODEL: DATE:
SERIAL NO:
@ 185 F + or - 4 F
BS INITIAL Wait Ten FINAL TEST Lb/cu.Ft Minutes TEST Lb/cu.Ft
Four 1 165.4 1 166.9one- 2 165.3 2 165.8minute 3 166.7 3 165.9counts 4 168.8 4 165.9
AVE 166.6 AVE 166.1
2826.0 2831.0 2820.0 2829.0 2829.0693 682.0 685.0 690.0 689.0
BS 2 4 6 8 10 12
108.3108.9 107.6 107.8 107.4 107.0 107.1 107.0109.2 107.7 106.8 107.3 107.1 108.0 107.3109.1 107.7 107.3 107.4 107.1 107.6 107.2PASS PASS PASS PASS PASS PASS PASS
134.9134.5 132.8 132.8 133.3 134.1 133.5 133.7134.4 133.3 132.9 133.1 134.0 133.9 133.8134.5 133.1 132.9 133.2 134.1 133.7 133.8PASS PASS PASS PASS PASS PASS PASS
165.9165.1 165.1 164.7 164.4 165.0 164.4 165.8165.0 164.1 164.4 164.7 165.1 165.5 165.7165.1 164.6 164.6 164.6 165.1 165.0 165.8PASS PASS PASS PASS PASS PASS FAIL
0.0 Lb 52.4 LbH2O (Lb) H2O (Lb)
0.3 51.4RESULTS: PASS RESULTS: PASS
YES X NO
NOTES:
DATE:SIGNATURE:
New Calibration by ODOT?
COUNT COUNT
Average Readings
LO BLOCK MOIST HI BLOCK MOISTFOUR-MINUTE FOUR-MINUTE
Average Readings
164.3HIGH BLOCKREADINGS
Average Readings
133.6MEDIUM BLOCK
READINGS
Probe Depth
107.2LOW BLOCKREADINGS
PASS
DENSITY STANDARD: MOISTURE STANDARD:
CALIBRATION CHECK
GAUGE OWNER:
HOT SUBSTRATE TEST
RESULTS:
MAKE: CALIB. DATE:
MODEL: TECHNICIAN:
SERIAL NUMBER:
DENSITY STANDARD: MOISTURE STANDARD:
Count Lb/Ft3 Count Lb/Ft3 Count Lb/Ft3BLOCK WT. 108.3 134.9 165.9
1BS 2
4 Min A
BLOCK WT. 107.2 133.6 164.32 4Min
4 4Min
6 4Min
8 4Min
10 4Min
12 4Min
COUNT: COUNT:
CAL. CHANGE Calibration Data
SIGNATURE \ DATE:_________________________________
Recalibrate
OWNER OF GAUGE:
LO BLOCK MOISTURE HI BLOCK MOISTUREFOUR-MINUTE FOUR-MINUTE
MAKE: CALIB. DATE:
MODEL: TECHNICIAN:
SERIAL NUMBER:
DENSITY STANDARD: 2829 MOISTURE STANDARD: 689
Count Lb/Ft3 Count Lb/Ft3 Count Lb/Ft3BLOCK WT. 108.3 134.9 165.9
1 8721 6547 4847BS 2 8670 6545 4817
4 Min A 8696 6546 4832
BLOCK WT. 107.2 133.6 164.32 4Min 52609 35916 235034 4Min 46386 29489 177196 4Min 32499 19261 106578 4Min 20580 11205 593310 4Min
12 4Min
COUNT: 744.0 COUNT: 12601.0
X CAL. CHANGE Calibration Data
SIGNATURE \ DATE:_________________________________
Recalibrate
OWNER OF GAUGE:
LO BLOCK MOISTURE HI BLOCK MOISTUREFOUR-MINUTE FOUR-MINUTE
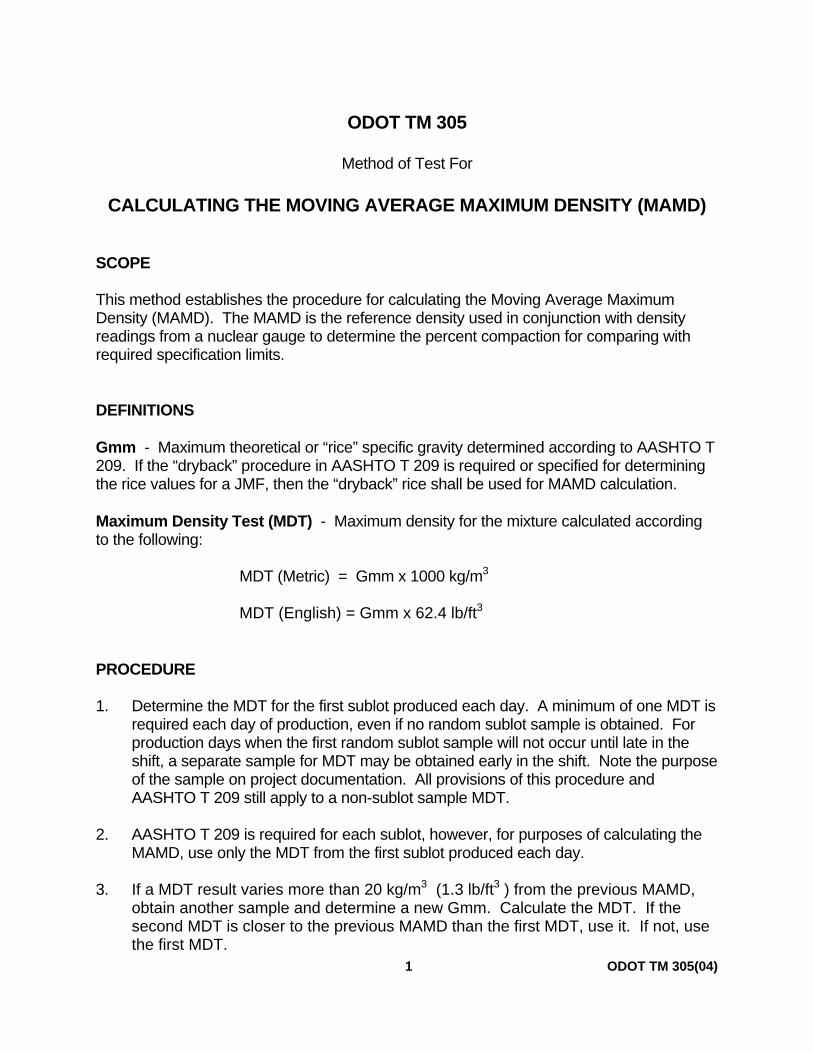
1 ODOT TM 305(04)
ODOT TM 305 Method of Test For CALCULATING THE MOVING AVERAGE MAXIMUM DENSITY (MAMD) SCOPE This method establishes the procedure for calculating the Moving Average Maximum Density (MAMD). The MAMD is the reference density used in conjunction with density readings from a nuclear gauge to determine the percent compaction for comparing with required specification limits. DEFINITIONS Gmm - Maximum theoretical or “rice” specific gravity determined according to AASHTO T 209. If the “dryback” procedure in AASHTO T 209 is required or specified for determining the rice values for a JMF, then the “dryback” rice shall be used for MAMD calculation. Maximum Density Test (MDT) - Maximum density for the mixture calculated according to the following: MDT (Metric) = Gmm x 1000 kg/m3 MDT (English) = Gmm x 62.4 lb/ft3 PROCEDURE 1. Determine the MDT for the first sublot produced each day. A minimum of one MDT is
required each day of production, even if no random sublot sample is obtained. For production days when the first random sublot sample will not occur until late in the shift, a separate sample for MDT may be obtained early in the shift. Note the purpose of the sample on project documentation. All provisions of this procedure and AASHTO T 209 still apply to a non-sublot sample MDT.
2. AASHTO T 209 is required for each sublot, however, for purposes of calculating the
MAMD, use only the MDT from the first sublot produced each day. 3. If a MDT result varies more than 20 kg/m3 (1.3 lb/ft3 ) from the previous MAMD,
obtain another sample and determine a new Gmm. Calculate the MDT. If the second MDT is closer to the previous MAMD than the first MDT, use it. If not, use the first MDT.
2 ODOT TM 305(04)
4. Any MDT representing rejected materials will not be included in the MAMD
calculation. Obtain a sample representing nonrejected material to determine the daily MDT.
5. Calculate the MAMD as follows: 5.1 The initial MAMD is the MDT for the first production day. 5.2 The next MAMD is the average of the MDT’s from the first two production days. 5.3 The next MAMD is the average of the MDT’s from the first three production days. 5.4 The next MAMD is the average of the MDT’s from the first four production days. 5.5 For the fifth day, the MAMD is the average of the MDT’s for the first 5 production
days. 5.6 For future production days, the MAMD is the average of the MDT for that day and the
MDT’s from the previous 4 production days. 6. A new MAMD must be started when a new JMF is used. A JMF adjustment is not
considered a new JMF. 7. A change in Lots due to a change in the minimum required compaction or due to a
change in the test procedure used to determine asphalt content does not require a new MAMD calculation to be started.
REPORT Report MAMD to the nearest whole kg/m3 (nearest 0.1 lb/ft3). Document MAMD calculations on Form 734-2050
3 ODOT TM 305(04)
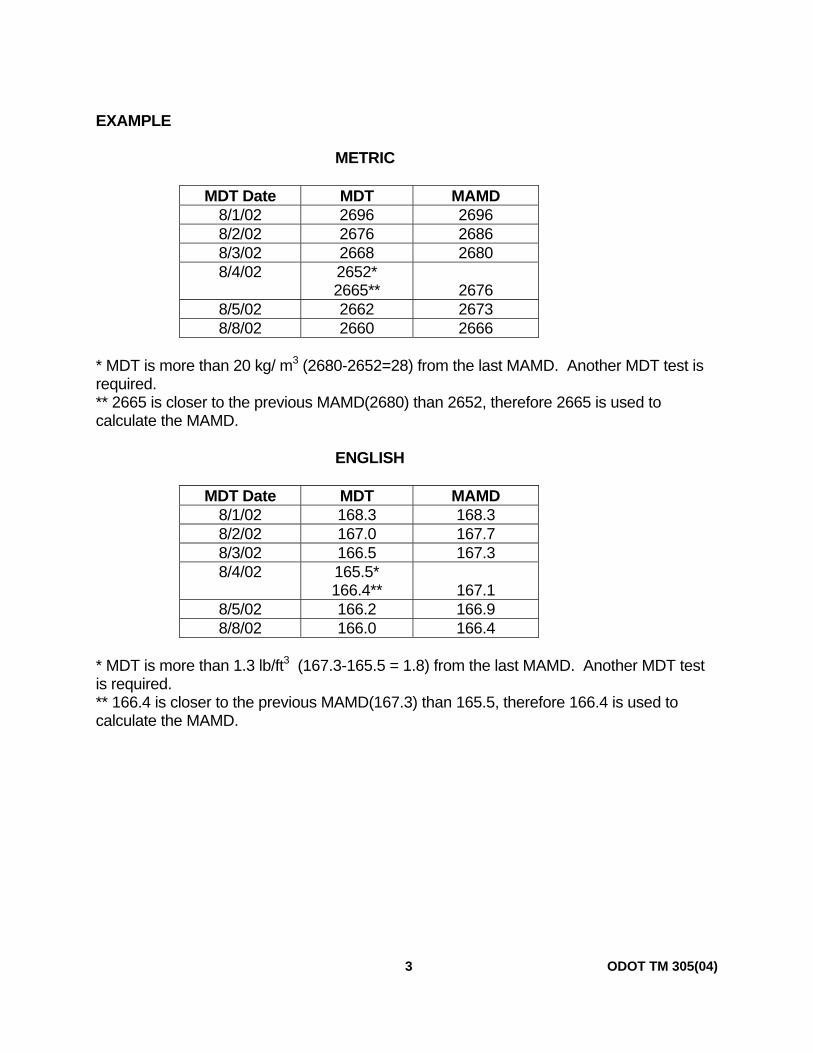
EXAMPLE METRIC
MDT Date MDT MAMD 8/1/02 2696 2696 8/2/02 2676 2686 8/3/02 2668 2680 8/4/02 2652*
2665**
2676 8/5/02 2662 2673 8/8/02 2660 2666
* MDT is more than 20 kg/ m3 (2680-2652=28) from the last MAMD. Another MDT test is required. ** 2665 is closer to the previous MAMD(2680) than 2652, therefore 2665 is used to calculate the MAMD. ENGLISH
MDT Date MDT MAMD 8/1/02 168.3 168.3 8/2/02 167.0 167.7 8/3/02 166.5 167.3 8/4/02 165.5*
166.4**
167.1 8/5/02 166.2 166.9 8/8/02 166.0 166.4
* MDT is more than 1.3 lb/ft3 (167.3-165.5 = 1.8) from the last MAMD. Another MDT test is required. ** 166.4 is closer to the previous MAMD(167.3) than 165.5, therefore 166.4 is used to calculate the MAMD.

4 ODOT TM 305(04)
THIS PAGE INTENTIONALLY LEFT BLANK
ODOT TM 306
Method of Test For
PERFORMING A CONTROL STRIP FOR HMAC PAVEMENT
SCOPE A control strip is a field procedure, which provides data to establish roller patterns, which will achieve a maximum density. The method is designed to use the same compaction equipment and materials throughout the project. Changes in materials, compaction equipment, or weather conditions, may require a new roller pattern or verification of the adequacy of the roller pattern being used. This procedure is used to determine the optimum rolling pattern for HMAC.
DEFINITIONS In-Place Density - The density of the compacted bituminous mixture as it exists in the pavement. The in-place density will be determined, in accordance with WAQTC TM 8, using a Nuclear Moisture-Density Gauge unless otherwise specified. Control Strip Length – This is equal to the length of the rolling pattern being used for compaction of a section of pavement that has been placed to the specified width and thickness. Maximum length shall not exceed 150 m (500’). Initial Point - A testing point selected within the control strip and used to determine the increasing in-place densities of the pavement with successive roller passes. Roller Pass - The passing of a roller over an area (roller width) one time. Roller Coverage - The rolling of the entire width of pavement one time, including roller overlaps. Breakdown Rolling - The first roller coverages on the mixture after it is placed. Intermediate Rolling - All rolling following the breakdown rolling, until the temperature of the mixture cools to a temperature at which it can be finish rolled.. Finish Rolling - All rolling after the intermediate rolling that is required to bring the mixture to a smooth surface and remove any roller marks.
1 ODOT TM 306(05)
APPARATUS 1. A nuclear density gauge meeting the apparatus requirements of TM-8. 2. Transport case for properly shipping and housing the gauge and tools. 3. Instruction manuals for the specific make and model of the gauge. 4. Filler material and tools to process the filler material. 5. A suitable thermometer for measuring the temperature of the paved surface. PERFORMING CONTROL STRIP 1. A control strip shall be constructed when required by the specifications and within the first
200 Mg (200 ton)of production unless otherwise approved by the Engineer. If a uniform rolling pattern cannot be established in a reasonable manner to complete a control strip the first day of placing HMAC, contact the Engineer.
2. The control strip shall meet the following conditions:
• Match the length of the rolling pattern with a maximum length of 150 m (500 ft) • Part of the roadway • Placed to the specified width and thickness of roadway design • Composed of the same materials as the rest of the lift • Compacted with the same equipment as the rest of the lift
3. An Initial Point is selected within the control strip. The initial point must be at least 15m
(50 ft) from either end of the control strip, no closer than 0.6m (2 ft) from the edge of the control strip, and in an area that is representative of the overall material and condition of the control strip.
4. After each roller pass over the initial point the nuclear gauge is used in the backscatter position to determine the in-place density, with a 15 second count. The un-sanded initial point is carefully marked so that subsequent tests are made in exactly the same position and location.
5. For each roller used and each pass over the initial point record the type of roller, surface
temperature, density in-place (15 second reading), direction of travel, and whether vibratory or static mode. The information is recorded on the Control Strip Method of Compaction Testing, Form 734-2084.
6. Continue compaction and testing after each roller pass, until the density readings taken at
the initial point do not increase. (The density readings may decrease or level off to indicate this.)
2 ODOT TM 306(05)
7. The density of the initial point is then tested according to WAQTC TM 8. The density
readings are recorded. 7.1 If the density of the initial point meets the minimum specified density continue with step 8.
For Control Strips constructed at the beginning of production of a JMF, use the MDT from the JMF until the first MDT from produced mix is available. Use the first MDT from produced mix as the MAMD (per ODOT TM 305) after it is available. Control Strips constructed at all other times, use the current MAMD.
7.2 If the initial point does not meet minimum specified density, adjustments to the rolling
pattern or compaction equipment must be made. After the adjustments have been made, a new control strip area is selected and tested starting with step 1.
8. Select five test locations at random stations within the control strip (Random Stations per
Form 734-1972 or other approved method). The transverse locations shall be at:
• 0.3 m (1 ft) from left edge of panel • Midpoint of left half of panel • Center of panel • Midpoint of right half of panel • 0.3 m (1 ft) from right edge of panel
Test the five random locations according to WAQTC TM 8. The initial point shall not be used as one of the five random tests. The results of the density tests are recorded to the nearest kg/m3 .or 0.1 #/cf.
9. The Control Strip is valid only if the following conditions are met: 9.1 The individual densities of the five random test locations from Step 8 are within ±1.5 % of
the average compaction of the five random tests. 9.2 The average density of the five random test locations is no less than the minimum
specified compaction required. 10. Immediately inform the CAT II of the results of the control strip. If any of the density test
locations are over 95% compaction (based on MAMD) inform the Project Manager or designated representative and the paving contractor’s representative.
11. Any points used to develop the control strip are not allowed to be used as sublot quality
control/acceptance tests. REPORT The report shall be made on the Control Strip Method of Compaction Testing, Form 734-2084.
3 ODOT TM 306(05)

THIS PAGE INTENTIONALLY LEFT BLANK
4 ODOT TM 306(05)
ODOT TM 321 (Metric)
Method of Test for
ASPHALT CONTENT OF BITUMINOUS MIXTURES BY PLANT RECORDATION
SCOPE This method contains the procedures for determining the asphalt content, RAP content, lime content, mineral filler content, fiber content, and liquid additive content of HMAC and EAC mixtures produced by batch, drum, or other acceptable mixing plants. Use of this method is contingent on consistent agreement between the plant recording equipment (meters and/or scales) and a physical inventory of the materials used. If the agreement between the inventory and plant recording equipment does not exist, the inventory data will be used to adjust the recordation data for acceptance.
SIGNIFICANCE AND USE This method can be used to determine the asphalt content of a mixture at any point in time for determining the acceptance of a product and to determine partial payment for the product. It can be applied to batch, drum, or other acceptable plants and for all asphalt mixture constituents, including percent of RAP, percent of Lime, percent of mineral filler, percent of fiber, percent of liquid additive, and any other additives.
PROCEDURES 1. HMAC WITHOUT RAP - DRUM PLANTS 1.1 General The quantity of dry aggregate (after adding lime, if appropriate) as measured by
the belt scale and the amount of asphalt as measured by the plant meter system for a predetermined period of time are used to determine the percentage of asphalt being added to the mixture. The quantity of lime, mineral filler, fibers, liquid additive, or any other additive as measured by an appropriate meter for a predetermined period of time are used to determine the percentage of the appropriate constituent in the mixture.
For Commercial HMAC Plants where the procedures described herein are
deemed impractical the following process shall be used:
1 ODOT TM 321(05M)
a) The HMAC supplier will submit, in writing, a plan for verifying and
documenting calibration of all appropriate meters on a daily basis. b) The Engineer and Region Quality Assurance Coordinator shall review, work
with the supplier to modify if necessary, and approve the proposed plan. c) The supplier will perform the agreed upon process for ODOT contracts.
1.2 Plant Calibration 1.2.1 Standard Drum Plants
Calibrate the plant aggregate belt scales, asphalt meter, and any other scales or meters according to ODOT TM 322 prior to the beginning of paving. Make the results of the calibration available at the asphalt plant for review by the Engineer. Recalibrate the plant when the comparison of the recordation data and plant inventory is outside the limits established in this procedure.
1.2.2 Drum Plants Equipped with Calibration Tank on Load Cells
Plants that have the capability of producing for short periods of time from a calibration tank which can be weighed using load cells or a scale are not required to conduct the meter calibration in ODOT TM 322. Calibrate the weighing device using the standard required for plant scale calibration.
1.2.3 Storage of Mixture in Silo’s
Develop a system to determine the quantity of mixture in the silos at the beginning and end of the day if any. This value will be used to adjust the total weight of mixture produced in a day.
1.3 Daily Total Requirements 1.3.1 Belt Scale and Meter Totalizers Record the asphalt, aggregate, lime (if appropriate), mineral filler (if
appropriate), fiber (if appropriate), liquid additive (if appropriate), or any other additive totalizer readings at the beginning and the end of each days production. Record the plant setting for aggregate moisture used throughout the day. This data will be used to determine the total quantity of material produced for comparison with the plant inventory data.
2 ODOT TM 321(05M)
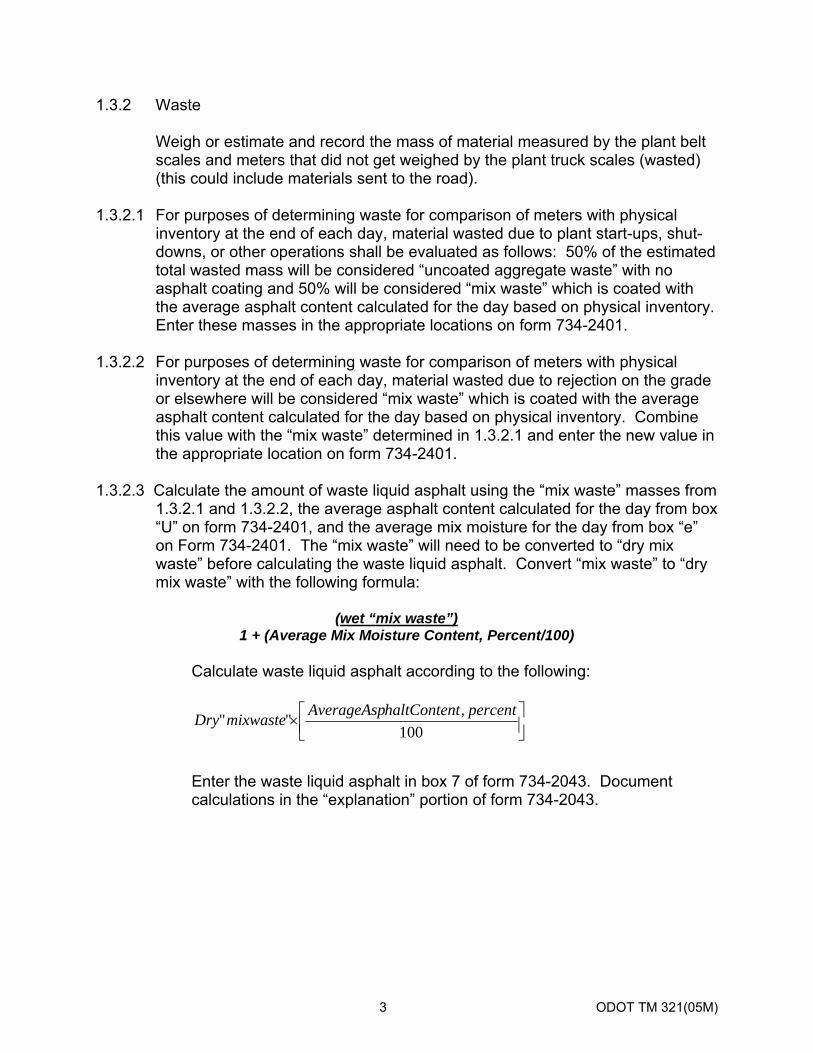
1.3.2 Waste Weigh or estimate and record the mass of material measured by the plant belt
scales and meters that did not get weighed by the plant truck scales (wasted) (this could include materials sent to the road).
1.3.2.1 For purposes of determining waste for comparison of meters with physical
inventory at the end of each day, material wasted due to plant start-ups, shut-downs, or other operations shall be evaluated as follows: 50% of the estimated total wasted mass will be considered “uncoated aggregate waste” with no asphalt coating and 50% will be considered “mix waste” which is coated with the average asphalt content calculated for the day based on physical inventory. Enter these masses in the appropriate locations on form 734-2401.
1.3.2.2 For purposes of determining waste for comparison of meters with physical
inventory at the end of each day, material wasted due to rejection on the grade or elsewhere will be considered “mix waste” which is coated with the average asphalt content calculated for the day based on physical inventory. Combine this value with the “mix waste” determined in 1.3.2.1 and enter the new value in the appropriate location on form 734-2401.
1.3.2.3 Calculate the amount of waste liquid asphalt using the “mix waste” masses from
1.3.2.1 and 1.3.2.2, the average asphalt content calculated for the day from box “U” on form 734-2401, and the average mix moisture for the day from box “e” on Form 734-2401. The “mix waste” will need to be converted to “dry mix waste” before calculating the waste liquid asphalt. Convert “mix waste” to “dry mix waste” with the following formula:
(wet “mix waste”) 1 + (Average Mix Moisture Content, Percent/100) Calculate waste liquid asphalt according to the following:
⎥⎦⎤
⎢⎣⎡×
100,"" percentthaltContenAverageAspmixwasteDry
Enter the waste liquid asphalt in box 7 of form 734-2043. Document calculations in the “explanation” portion of form 734-2043.
3 ODOT TM 321(05M)
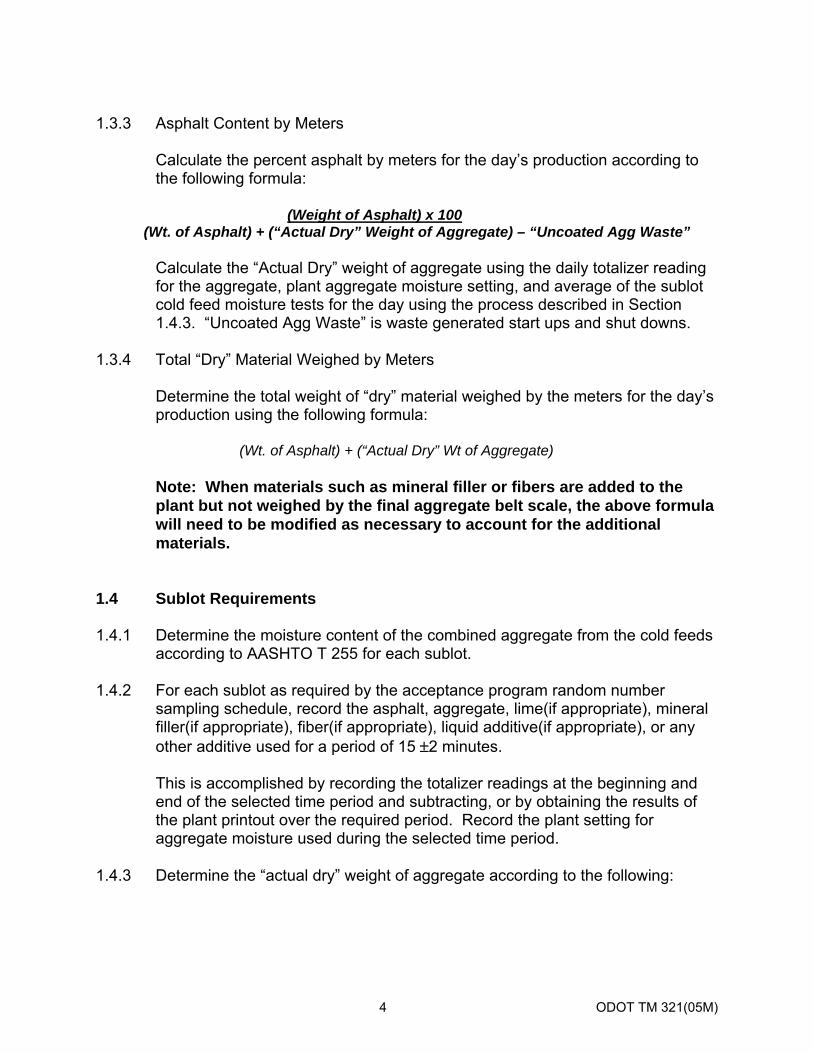
1.3.3 Asphalt Content by Meters
Calculate the percent asphalt by meters for the day’s production according to the following formula:
(Weight of Asphalt) x 100
(Wt. of Asphalt) + (“Actual Dry” Weight of Aggregate) – “Uncoated Agg Waste”
Calculate the “Actual Dry” weight of aggregate using the daily totalizer reading for the aggregate, plant aggregate moisture setting, and average of the sublot cold feed moisture tests for the day using the process described in Section 1.4.3. “Uncoated Agg Waste” is waste generated start ups and shut downs.
1.3.4 Total “Dry” Material Weighed by Meters
Determine the total weight of “dry” material weighed by the meters for the day’s production using the following formula:
(Wt. of Asphalt) + (“Actual Dry” Wt of Aggregate)
Note: When materials such as mineral filler or fibers are added to the plant but not weighed by the final aggregate belt scale, the above formula will need to be modified as necessary to account for the additional materials.
1.4 Sublot Requirements 1.4.1 Determine the moisture content of the combined aggregate from the cold feeds
according to AASHTO T 255 for each sublot. 1.4.2 For each sublot as required by the acceptance program random number
sampling schedule, record the asphalt, aggregate, lime(if appropriate), mineral filler(if appropriate), fiber(if appropriate), liquid additive(if appropriate), or any other additive used for a period of 15 ±2 minutes.
This is accomplished by recording the totalizer readings at the beginning and end of the selected time period and subtracting, or by obtaining the results of the plant printout over the required period. Record the plant setting for aggregate moisture used during the selected time period.
1.4.3 Determine the “actual dry” weight of aggregate according to the following:
4 ODOT TM 321(05M)
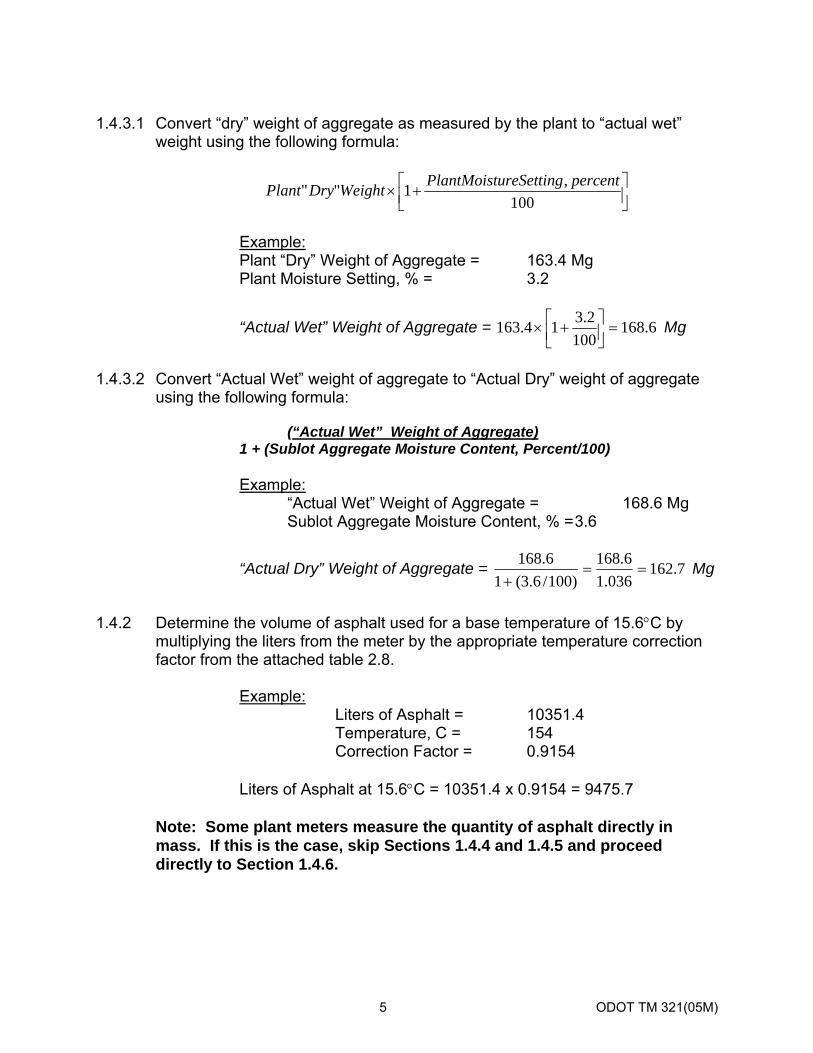
1.4.3.1 Convert “dry” weight of aggregate as measured by the plant to “actual wet”
weight using the following formula:
⎥⎦⎤
⎢⎣⎡ +×
100,1"" percentureSettingPlantMoistWeightDryPlant
Example:
Plant “Dry” Weight of Aggregate = 163.4 Mg Plant Moisture Setting, % = 3.2
“Actual Wet” Weight of Aggregate = 6.168100
2.314.163 =⎥⎦⎤
⎢⎣⎡ +× Mg
1.4.3.2 Convert “Actual Wet” weight of aggregate to “Actual Dry” weight of aggregate
using the following formula: (“Actual Wet” Weight of Aggregate) 1 + (Sublot Aggregate Moisture Content, Percent/100)
Example: “Actual Wet” Weight of Aggregate = 168.6 Mg Sublot Aggregate Moisture Content, % = 3.6
“Actual Dry” Weight of Aggregate = 7.162036.1
6.168)100/6.3(1
6.168==
+ Mg
1.4.2 Determine the volume of asphalt used for a base temperature of 15.6°C by
multiplying the liters from the meter by the appropriate temperature correction factor from the attached table 2.8.
Example:
Liters of Asphalt = 10351.4 Temperature, C = 154 Correction Factor = 0.9154
Liters of Asphalt at 15.6°C = 10351.4 x 0.9154 = 9475.7
Note: Some plant meters measure the quantity of asphalt directly in mass. If this is the case, skip Sections 1.4.4 and 1.4.5 and proceed directly to Section 1.4.6.
5 ODOT TM 321(05M)
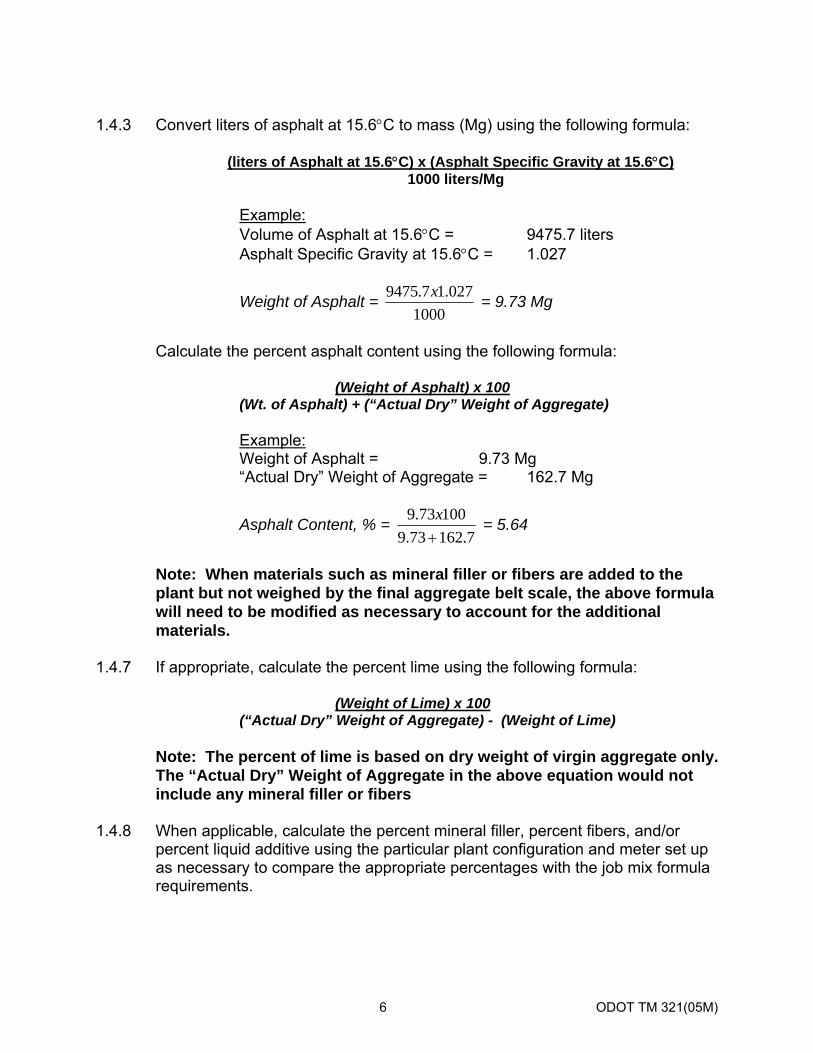
1.4.3 Convert liters of asphalt at 15.6°C to mass (Mg) using the following formula:
(liters of Asphalt at 15.6°C) x (Asphalt Specific Gravity at 15.6°C)
1000 liters/Mg Example:
Volume of Asphalt at 15.6°C = 9475.7 liters Asphalt Specific Gravity at 15.6°C = 1.027
Weight of Asphalt = 1000
027.17.9475 x = 9.73 Mg
Calculate the percent asphalt content using the following formula:
(Weight of Asphalt) x 100
(Wt. of Asphalt) + (“Actual Dry” Weight of Aggregate)
Example: Weight of Asphalt = 9.73 Mg “Actual Dry” Weight of Aggregate = 162.7 Mg
Asphalt Content, % = 7.16273.9
10073.9+x = 5.64
Note: When materials such as mineral filler or fibers are added to the
plant but not weighed by the final aggregate belt scale, the above formula will need to be modified as necessary to account for the additional materials.
1.4.7 If appropriate, calculate the percent lime using the following formula:
(Weight of Lime) x 100 (“Actual Dry” Weight of Aggregate) - (Weight of Lime)
Note: The percent of lime is based on dry weight of virgin aggregate only.
The “Actual Dry” Weight of Aggregate in the above equation would not include any mineral filler or fibers
1.4.8 When applicable, calculate the percent mineral filler, percent fibers, and/or
percent liquid additive using the particular plant configuration and meter set up as necessary to compare the appropriate percentages with the job mix formula requirements.
6 ODOT TM 321(05M)
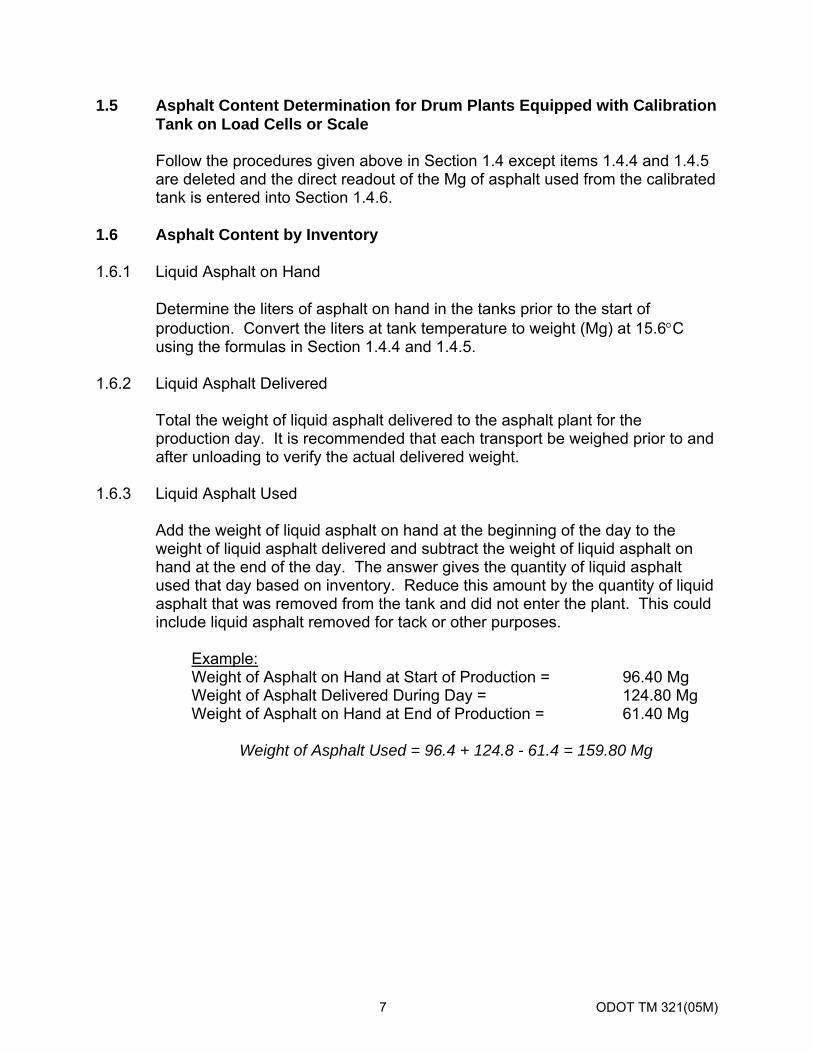
1.5 Asphalt Content Determination for Drum Plants Equipped with Calibration Tank on Load Cells or Scale
Follow the procedures given above in Section 1.4 except items 1.4.4 and 1.4.5
are deleted and the direct readout of the Mg of asphalt used from the calibrated tank is entered into Section 1.4.6.
1.6 Asphalt Content by Inventory 1.6.1 Liquid Asphalt on Hand
Determine the liters of asphalt on hand in the tanks prior to the start of production. Convert the liters at tank temperature to weight (Mg) at 15.6°C using the formulas in Section 1.4.4 and 1.4.5.
1.6.2 Liquid Asphalt Delivered
Total the weight of liquid asphalt delivered to the asphalt plant for the production day. It is recommended that each transport be weighed prior to and after unloading to verify the actual delivered weight.
1.6.3 Liquid Asphalt Used
Add the weight of liquid asphalt on hand at the beginning of the day to the weight of liquid asphalt delivered and subtract the weight of liquid asphalt on hand at the end of the day. The answer gives the quantity of liquid asphalt used that day based on inventory. Reduce this amount by the quantity of liquid asphalt that was removed from the tank and did not enter the plant. This could include liquid asphalt removed for tack or other purposes.
Example:
Weight of Asphalt on Hand at Start of Production = 96.40 Mg Weight of Asphalt Delivered During Day = 124.80 Mg Weight of Asphalt on Hand at End of Production = 61.40 Mg
Weight of Asphalt Used = 96.4 + 124.8 - 61.4 = 159.80 Mg
7 ODOT TM 321(05M)
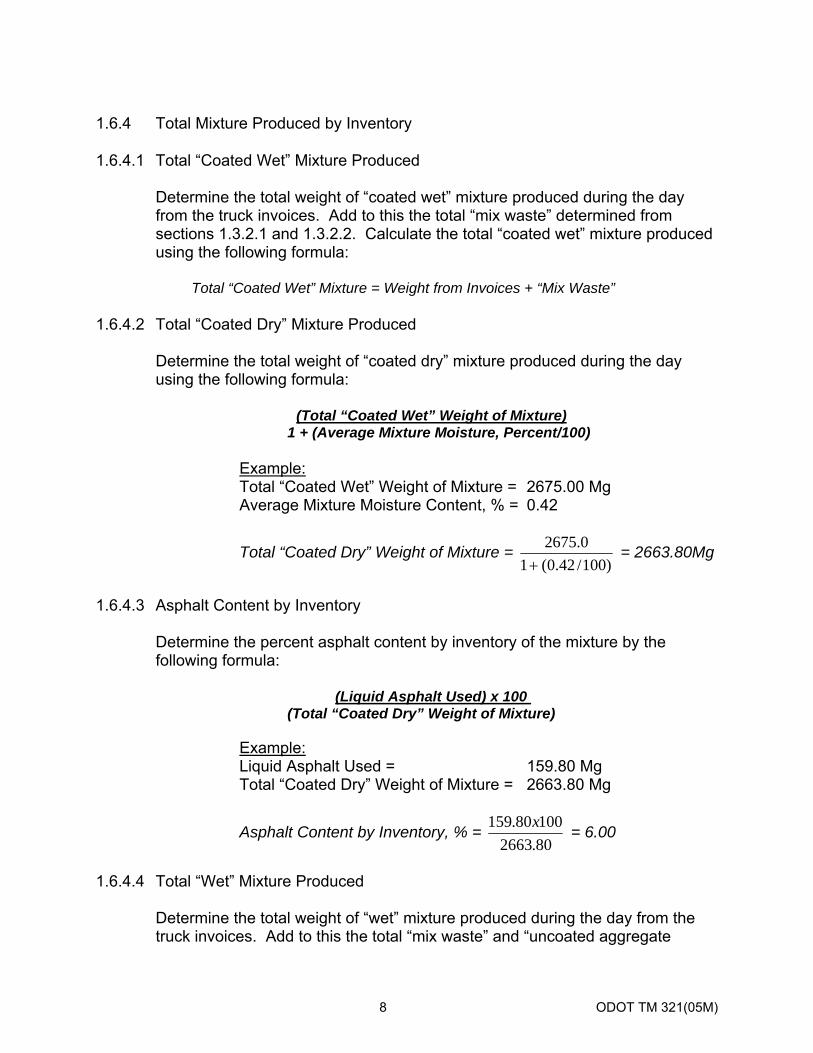
1.6.4 Total Mixture Produced by Inventory
1.6.4.1 Total “Coated Wet” Mixture Produced
Determine the total weight of “coated wet” mixture produced during the day from the truck invoices. Add to this the total “mix waste” determined from sections 1.3.2.1 and 1.3.2.2. Calculate the total “coated wet” mixture produced using the following formula:
Total “Coated Wet” Mixture = Weight from Invoices + “Mix Waste” 1.6.4.2 Total “Coated Dry” Mixture Produced
Determine the total weight of “coated dry” mixture produced during the day using the following formula:
(Total “Coated Wet” Weight of Mixture) 1 + (Average Mixture Moisture, Percent/100)
Example:
Total “Coated Wet” Weight of Mixture = 2675.00 Mg Average Mixture Moisture Content, % = 0.42
Total “Coated Dry” Weight of Mixture = )100/42.0(1
0.2675+
= 2663.80Mg
1.6.4.3 Asphalt Content by Inventory
Determine the percent asphalt content by inventory of the mixture by the following formula:
(Liquid Asphalt Used) x 100 (Total “Coated Dry” Weight of Mixture)
Example: Liquid Asphalt Used = 159.80 Mg Total “Coated Dry” Weight of Mixture = 2663.80 Mg
Asphalt Content by Inventory, % = 80.266310080.159 x = 6.00
1.6.4.4 Total “Wet” Mixture Produced
Determine the total weight of “wet” mixture produced during the day from the truck invoices. Add to this the total “mix waste” and “uncoated aggregate
8 ODOT TM 321(05M)
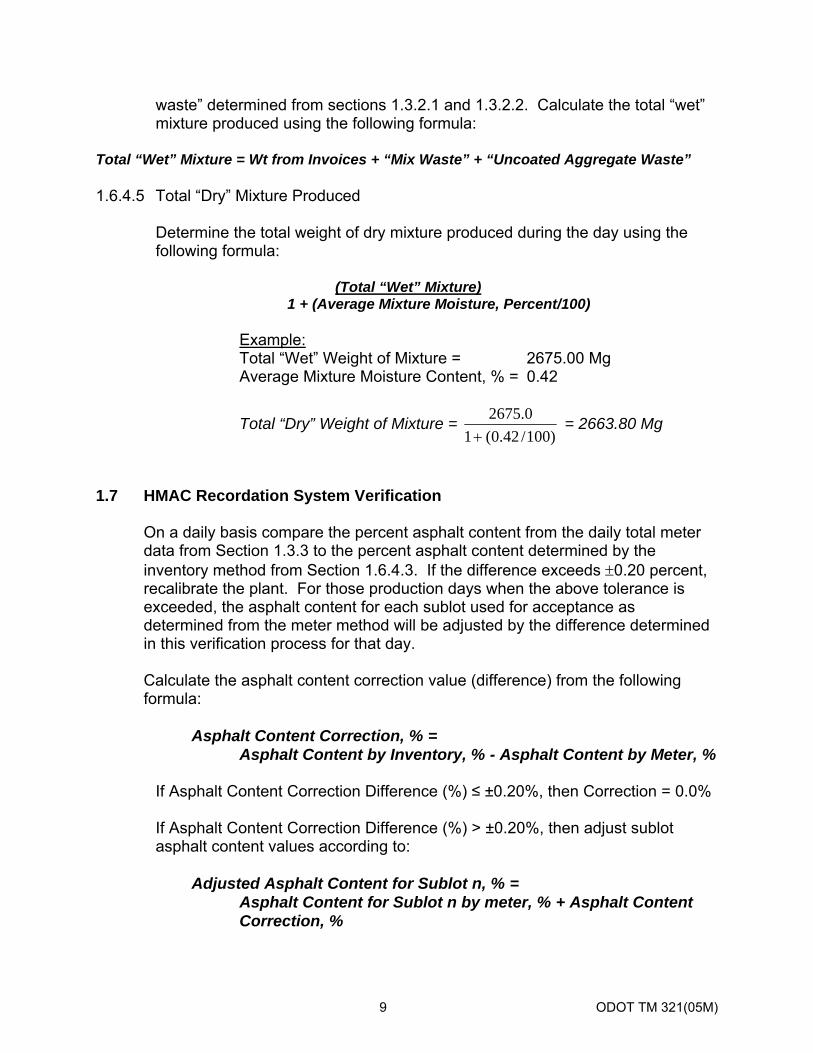
waste” determined from sections 1.3.2.1 and 1.3.2.2. Calculate the total “wet” mixture produced using the following formula:
Total “Wet” Mixture = Wt from Invoices + “Mix Waste” + “Uncoated Aggregate Waste” 1.6.4.5 Total “Dry” Mixture Produced
Determine the total weight of dry mixture produced during the day using the following formula:
(Total “Wet” Mixture) 1 + (Average Mixture Moisture, Percent/100)
Example:
Total “Wet” Weight of Mixture = 2675.00 Mg Average Mixture Moisture Content, % = 0.42
Total “Dry” Weight of Mixture = )100/42.0(1
0.2675+
= 2663.80 Mg
1.7 HMAC Recordation System Verification
On a daily basis compare the percent asphalt content from the daily total meter data from Section 1.3.3 to the percent asphalt content determined by the inventory method from Section 1.6.4.3. If the difference exceeds ±0.20 percent, recalibrate the plant. For those production days when the above tolerance is exceeded, the asphalt content for each sublot used for acceptance as determined from the meter method will be adjusted by the difference determined in this verification process for that day.
Calculate the asphalt content correction value (difference) from the following formula:
Asphalt Content Correction, % = Asphalt Content by Inventory, % - Asphalt Content by Meter, %
If Asphalt Content Correction Difference (%) ≤ ±0.20%, then Correction = 0.0% If Asphalt Content Correction Difference (%) > ±0.20%, then adjust sublot asphalt content values according to:
Adjusted Asphalt Content for Sublot n, % =
Asphalt Content for Sublot n by meter, % + Asphalt Content Correction, %
9 ODOT TM 321(05M)
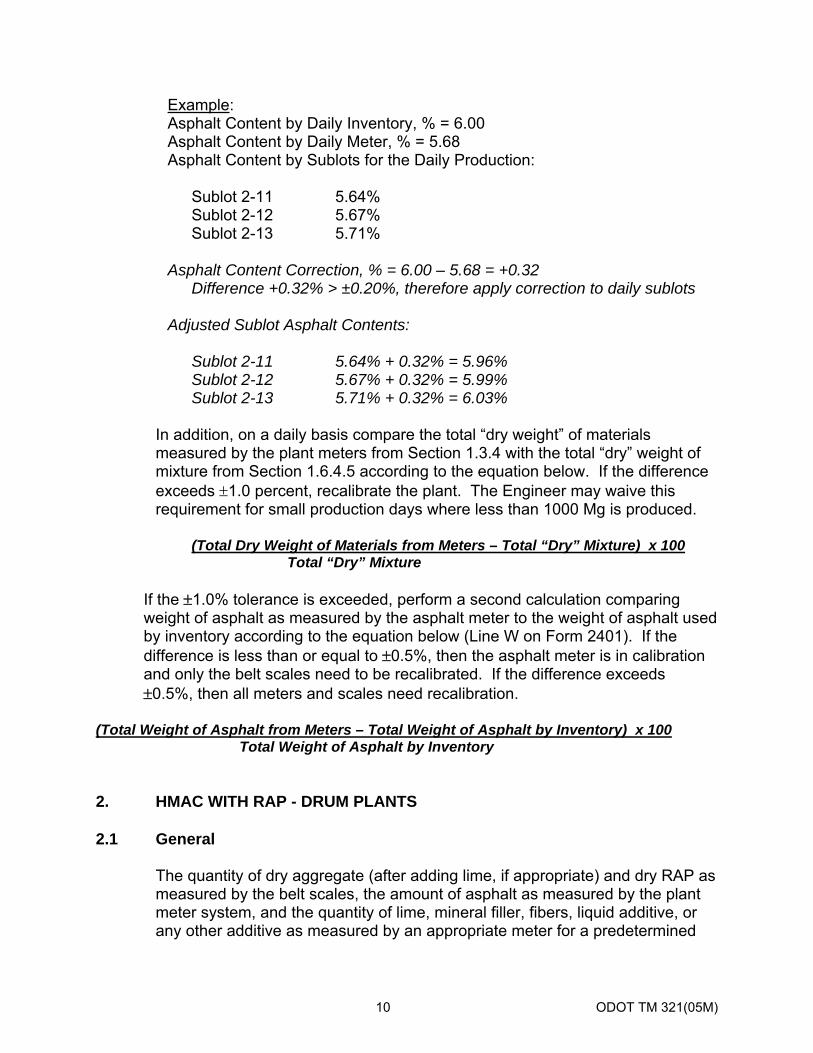
Example: Asphalt Content by Daily Inventory, % = 6.00 Asphalt Content by Daily Meter, % = 5.68 Asphalt Content by Sublots for the Daily Production: Sublot 2-11 5.64% Sublot 2-12 5.67% Sublot 2-13 5.71% Asphalt Content Correction, % = 6.00 – 5.68 = +0.32 Difference +0.32% > ±0.20%, therefore apply correction to daily sublots Adjusted Sublot Asphalt Contents: Sublot 2-11 5.64% + 0.32% = 5.96% Sublot 2-12 5.67% + 0.32% = 5.99% Sublot 2-13 5.71% + 0.32% = 6.03%
In addition, on a daily basis compare the total “dry weight” of materials measured by the plant meters from Section 1.3.4 with the total “dry” weight of mixture from Section 1.6.4.5 according to the equation below. If the difference exceeds ±1.0 percent, recalibrate the plant. The Engineer may waive this requirement for small production days where less than 1000 Mg is produced.
(Total Dry Weight of Materials from Meters – Total “Dry” Mixture) x 100 Total “Dry” Mixture
If the ±1.0% tolerance is exceeded, perform a second calculation comparing weight of asphalt as measured by the asphalt meter to the weight of asphalt used by inventory according to the equation below (Line W on Form 2401). If the difference is less than or equal to ±0.5%, then the asphalt meter is in calibration and only the belt scales need to be recalibrated. If the difference exceeds ±0.5%, then all meters and scales need recalibration.
(Total Weight of Asphalt from Meters – Total Weight of Asphalt by Inventory) x 100 Total Weight of Asphalt by Inventory 2. HMAC WITH RAP - DRUM PLANTS 2.1 General
The quantity of dry aggregate (after adding lime, if appropriate) and dry RAP as measured by the belt scales, the amount of asphalt as measured by the plant meter system, and the quantity of lime, mineral filler, fibers, liquid additive, or any other additive as measured by an appropriate meter for a predetermined
10 ODOT TM 321(05M)
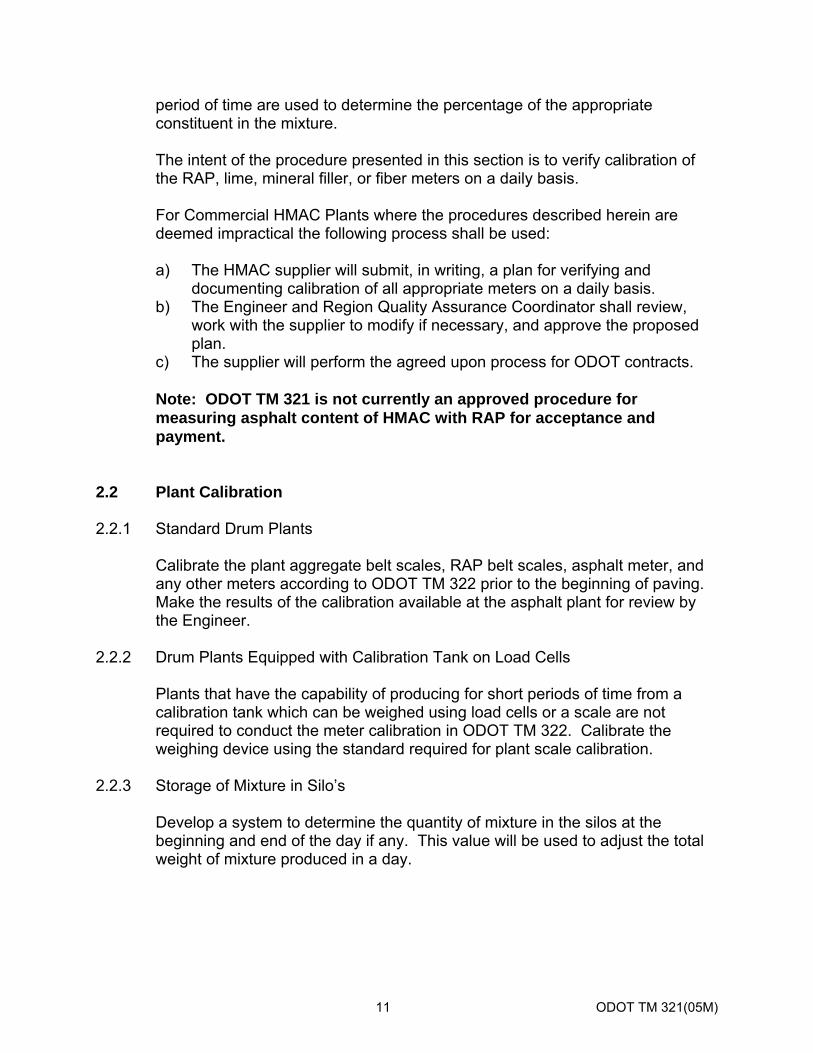
period of time are used to determine the percentage of the appropriate constituent in the mixture. The intent of the procedure presented in this section is to verify calibration of the RAP, lime, mineral filler, or fiber meters on a daily basis.
For Commercial HMAC Plants where the procedures described herein are deemed impractical the following process shall be used: a) The HMAC supplier will submit, in writing, a plan for verifying and
documenting calibration of all appropriate meters on a daily basis. b) The Engineer and Region Quality Assurance Coordinator shall review,
work with the supplier to modify if necessary, and approve the proposed plan.
c) The supplier will perform the agreed upon process for ODOT contracts. Note: ODOT TM 321 is not currently an approved procedure for measuring asphalt content of HMAC with RAP for acceptance and payment.
2.2 Plant Calibration 2.2.1 Standard Drum Plants
Calibrate the plant aggregate belt scales, RAP belt scales, asphalt meter, and any other meters according to ODOT TM 322 prior to the beginning of paving. Make the results of the calibration available at the asphalt plant for review by the Engineer.
2.2.2 Drum Plants Equipped with Calibration Tank on Load Cells
Plants that have the capability of producing for short periods of time from a calibration tank which can be weighed using load cells or a scale are not required to conduct the meter calibration in ODOT TM 322. Calibrate the weighing device using the standard required for plant scale calibration.
2.2.3 Storage of Mixture in Silo’s
Develop a system to determine the quantity of mixture in the silos at the beginning and end of the day if any. This value will be used to adjust the total weight of mixture produced in a day.
11 ODOT TM 321(05M)
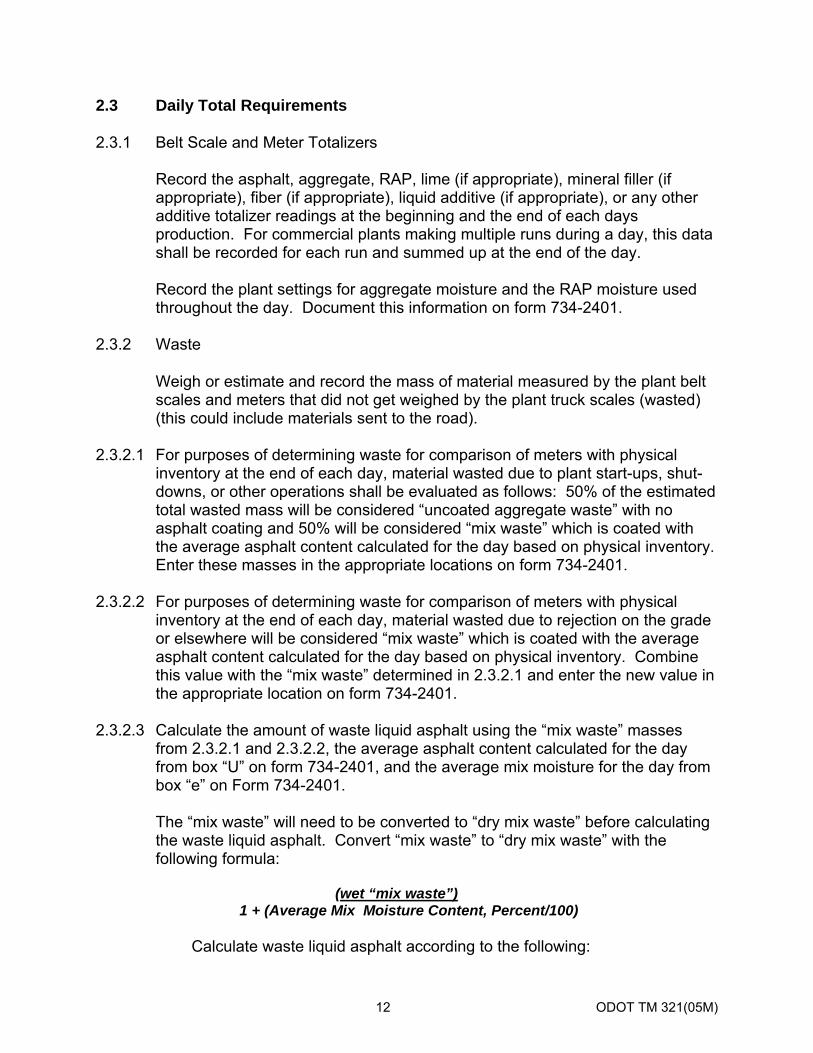
2.3 Daily Total Requirements
2.3.1 Belt Scale and Meter Totalizers
Record the asphalt, aggregate, RAP, lime (if appropriate), mineral filler (if appropriate), fiber (if appropriate), liquid additive (if appropriate), or any other additive totalizer readings at the beginning and the end of each days production. For commercial plants making multiple runs during a day, this data shall be recorded for each run and summed up at the end of the day.
Record the plant settings for aggregate moisture and the RAP moisture used throughout the day. Document this information on form 734-2401.
2.3.2 Waste
Weigh or estimate and record the mass of material measured by the plant belt scales and meters that did not get weighed by the plant truck scales (wasted) (this could include materials sent to the road).
2.3.2.1 For purposes of determining waste for comparison of meters with physical
inventory at the end of each day, material wasted due to plant start-ups, shut-downs, or other operations shall be evaluated as follows: 50% of the estimated total wasted mass will be considered “uncoated aggregate waste” with no asphalt coating and 50% will be considered “mix waste” which is coated with the average asphalt content calculated for the day based on physical inventory. Enter these masses in the appropriate locations on form 734-2401.
2.3.2.2 For purposes of determining waste for comparison of meters with physical
inventory at the end of each day, material wasted due to rejection on the grade or elsewhere will be considered “mix waste” which is coated with the average asphalt content calculated for the day based on physical inventory. Combine this value with the “mix waste” determined in 2.3.2.1 and enter the new value in the appropriate location on form 734-2401.
2.3.2.3 Calculate the amount of waste liquid asphalt using the “mix waste” masses
from 2.3.2.1 and 2.3.2.2, the average asphalt content calculated for the day from box “U” on form 734-2401, and the average mix moisture for the day from box “e” on Form 734-2401.
The “mix waste” will need to be converted to “dry mix waste” before calculating the waste liquid asphalt. Convert “mix waste” to “dry mix waste” with the following formula:
(wet “mix waste”) 1 + (Average Mix Moisture Content, Percent/100) Calculate waste liquid asphalt according to the following:
12 ODOT TM 321(05M)
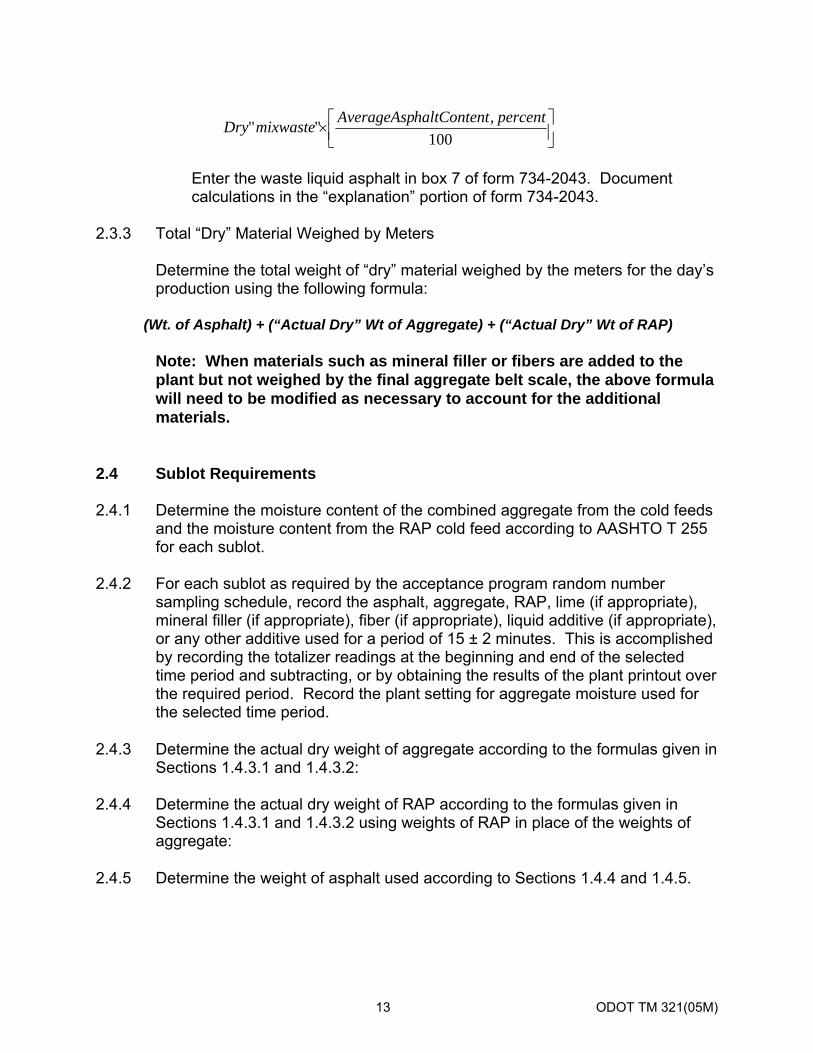
⎥⎦⎤
⎢⎣⎡×
100,"" percentthaltContenAverageAspmixwasteDry
Enter the waste liquid asphalt in box 7 of form 734-2043. Document calculations in the “explanation” portion of form 734-2043.
2.3.3 Total “Dry” Material Weighed by Meters
Determine the total weight of “dry” material weighed by the meters for the day’s production using the following formula:
(Wt. of Asphalt) + (“Actual Dry” Wt of Aggregate) + (“Actual Dry” Wt of RAP)
Note: When materials such as mineral filler or fibers are added to the plant but not weighed by the final aggregate belt scale, the above formula will need to be modified as necessary to account for the additional materials.
2.4 Sublot Requirements 2.4.1 Determine the moisture content of the combined aggregate from the cold feeds
and the moisture content from the RAP cold feed according to AASHTO T 255 for each sublot.
2.4.2 For each sublot as required by the acceptance program random number
sampling schedule, record the asphalt, aggregate, RAP, lime (if appropriate), mineral filler (if appropriate), fiber (if appropriate), liquid additive (if appropriate), or any other additive used for a period of 15 ± 2 minutes. This is accomplished by recording the totalizer readings at the beginning and end of the selected time period and subtracting, or by obtaining the results of the plant printout over the required period. Record the plant setting for aggregate moisture used for the selected time period.
2.4.3 Determine the actual dry weight of aggregate according to the formulas given in
Sections 1.4.3.1 and 1.4.3.2: 2.4.4 Determine the actual dry weight of RAP according to the formulas given in
Sections 1.4.3.1 and 1.4.3.2 using weights of RAP in place of the weights of aggregate:
2.4.5 Determine the weight of asphalt used according to Sections 1.4.4 and 1.4.5.
13 ODOT TM 321(05M)
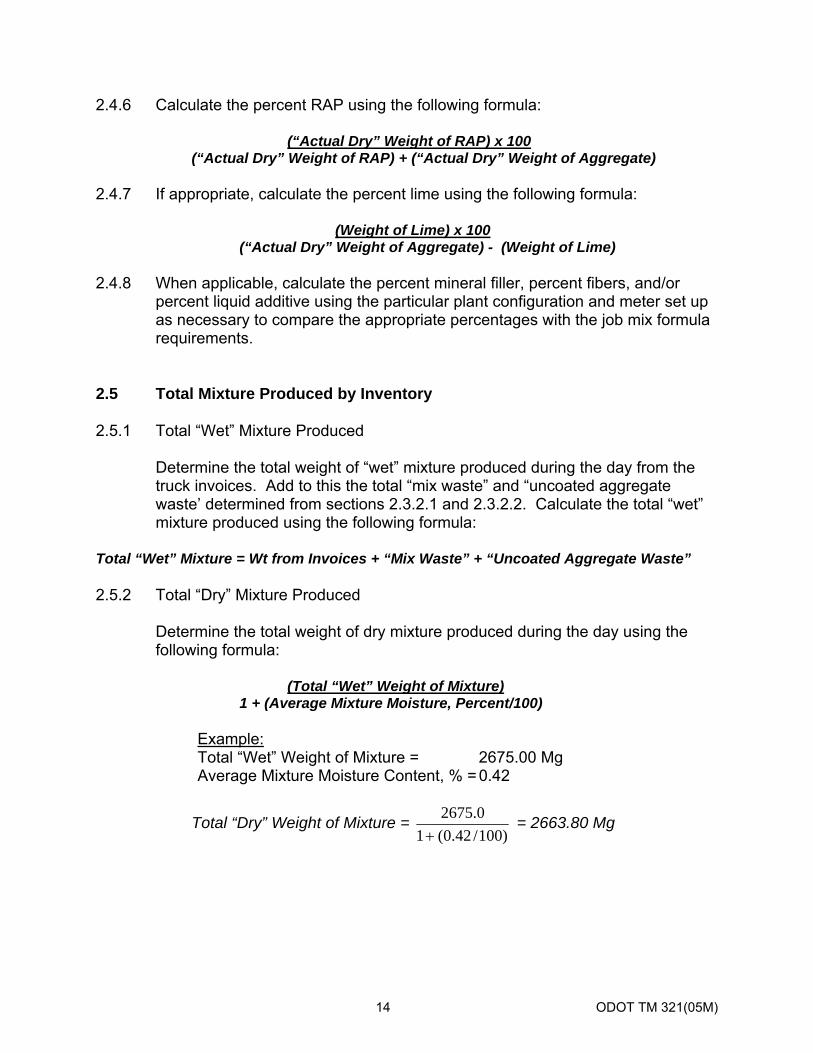
2.4.6 Calculate the percent RAP using the following formula: (“Actual Dry” Weight of RAP) x 100(“Actual Dry” Weight of RAP) + (“Actual Dry” Weight of Aggregate)
2.4.7 If appropriate, calculate the percent lime using the following formula:
(Weight of Lime) x 100 (“Actual Dry” Weight of Aggregate) - (Weight of Lime)
2.4.8 When applicable, calculate the percent mineral filler, percent fibers, and/or
percent liquid additive using the particular plant configuration and meter set up as necessary to compare the appropriate percentages with the job mix formula requirements.
2.5 Total Mixture Produced by Inventory
2.5.1 Total “Wet” Mixture Produced
Determine the total weight of “wet” mixture produced during the day from the truck invoices. Add to this the total “mix waste” and “uncoated aggregate waste’ determined from sections 2.3.2.1 and 2.3.2.2. Calculate the total “wet” mixture produced using the following formula:
Total “Wet” Mixture = Wt from Invoices + “Mix Waste” + “Uncoated Aggregate Waste” 2.5.2 Total “Dry” Mixture Produced
Determine the total weight of dry mixture produced during the day using the following formula:
(Total “Wet” Weight of Mixture) 1 + (Average Mixture Moisture, Percent/100)
Example: Total “Wet” Weight of Mixture = 2675.00 Mg Average Mixture Moisture Content, % = 0.42
Total “Dry” Weight of Mixture = )100/42.0(1
0.2675+
= 2663.80 Mg
14 ODOT TM 321(05M)
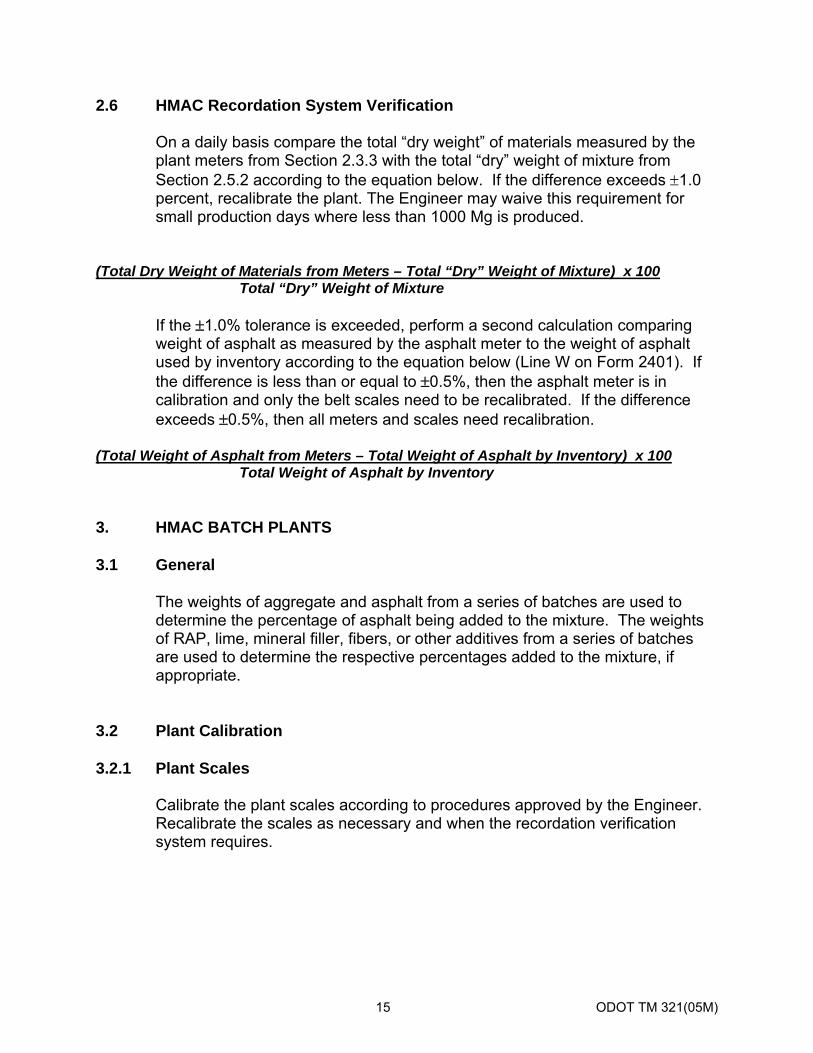
2.6 HMAC Recordation System Verification
On a daily basis compare the total “dry weight” of materials measured by the plant meters from Section 2.3.3 with the total “dry” weight of mixture from Section 2.5.2 according to the equation below. If the difference exceeds ±1.0 percent, recalibrate the plant. The Engineer may waive this requirement for small production days where less than 1000 Mg is produced.
(Total Dry Weight of Materials from Meters – Total “Dry” Weight of Mixture) x 100 Total “Dry” Weight of Mixture
If the ±1.0% tolerance is exceeded, perform a second calculation comparing weight of asphalt as measured by the asphalt meter to the weight of asphalt used by inventory according to the equation below (Line W on Form 2401). If the difference is less than or equal to ±0.5%, then the asphalt meter is in calibration and only the belt scales need to be recalibrated. If the difference exceeds ±0.5%, then all meters and scales need recalibration.
(Total Weight of Asphalt from Meters – Total Weight of Asphalt by Inventory) x 100 Total Weight of Asphalt by Inventory
3. HMAC BATCH PLANTS 3.1 General
The weights of aggregate and asphalt from a series of batches are used to determine the percentage of asphalt being added to the mixture. The weights of RAP, lime, mineral filler, fibers, or other additives from a series of batches are used to determine the respective percentages added to the mixture, if appropriate.
3.2 Plant Calibration 3.2.1 Plant Scales
Calibrate the plant scales according to procedures approved by the Engineer. Recalibrate the scales as necessary and when the recordation verification system requires.
15 ODOT TM 321(05M)
3.2.2 Storage of Mixture in Silo’s
Develop a system to determine the quantity of mixture in the silos at the beginning and end of the day if any. This value will be used to adjust the total weight of mixture produced in a day.
3.3 Asphalt Content Determination for Batch Plants 3.3.1 Determine the total weight of asphalt, aggregate, RAP (if appropriate), mineral
filler (if appropriate), fibers (if appropriate), and lime (if appropriate) used in the mixture by accumulating the batch weights for the production day. This data will be used to determine the total quantity of material produced for comparison with the plant inventory data. Reduce the quantity of asphalt, aggregate, RAP, and lime as appropriate by the quantity of material which was measured by the plant and did not get weighed by the plant truck scales (wasted) (this could include materials sent to the road).
3.3.2 For each asphalt content determination as required by the acceptance program
random number sampling schedule, accumulate the total quantity of asphalt, aggregate, RAP(if appropriate), and lime(if appropriate) used for 15 ±2 consecutive batches.
3.3.3 Determine the weight of dry aggregate and dry RAP (if appropriate) by using
the following formula: (Total Weight of Aggregate) 1 + (Mixture Moisture Content, Percent/100)
Example: Weight of Wet Aggregate = 151.6 Mg Mix Moisture Content, % = 0.42
Weight of Dry Aggregate = 97.1500042.1
6.151)100/42.0(1
6.151==
+Mg
3.3.4 Calculate the percent asphalt content using the formula in Section 1.4.6.
Calculate the percent RAP and percent lime, if appropriate, using the formulas in Sections 2.4.6 and 2.4.7 respectively.
3.4 HMAC Recordation System Verification
On a daily basis compare the percent asphalt content from the daily accumulated scale data to the percent asphalt content determined by the HMAC inventory method using the formulas in Section 1.6.4. If the difference
16 ODOT TM 321(05M)
exceeds ±0.20 percent, recalibrate the plant. For those production days when the above tolerance is exceeded, the asphalt content used for acceptance as determined from the meter method will be adjusted by the difference determined in this verification process for that day.
4. EAC PLANTS 4.1 General
The quantity of dry aggregate, as measured by the belt scale, and the amount of emulsified asphalt measured by the plant metering system for a predetermined period of time are used to determine the percentage of emulsified asphalt being added to the dry aggregates. Minor variations will be allowed in this method for a particular type of plant operation as appropriate with the approval of the Engineer.
4.2 Plant Calibration
Calibrate the plant aggregate belt scales and asphalt meter according to ODOT TM 322 prior to the beginning of paving. Make the results of the calibration available at the EAC plant for review by the Engineer. Recalibrate the plant when the comparison of the recordation data and plant inventory is outside the limits established in this procedure.
4.3 Daily Total Requirements
4.3.1 Belt Scale and Meter Totalizers
Record the asphalt and aggregate totalizer readings at the beginning and the end of each day’s production. Record the plant setting for aggregate moisture used throughout the day. This data will be used to determine the total quantity of material produced for comparison with the plant inventory data.
4.3.2 Waste
Weigh or estimate and record the mass of material measured by the plant belt scales and meters that did not get weighed by the plant truck scales (wasted) (this could include materials sent to the road).
4.3.2.1 For purposes of determining waste for comparison of meters with physical
inventory at the end of each day, material wasted due to plant start-ups, shut-downs, or other operations shall be evaluated as follows: 50% of the estimated total wasted mass will be considered “uncoated aggregate waste” with no asphalt coating and 50% will be considered “mix waste” which is coated with
17 ODOT TM 321(05M)
the average asphalt content calculated for the day based on physical inventory. Enter these masses in the appropriate locations on form 734-2401.
4.3.2.2 For purposes of determining waste for comparison of meters with physical
inventory at the end of each day, material wasted due to rejection on the grade or elsewhere will be considered “mix waste” which is coated with the average asphalt content calculated for the day based on physical inventory. Combine this value with the “mix waste” determined in 4.3.2.1 and enter the new value in the appropriate location on form 734-2401.
4.3.2.3 Calculate the amount of waste liquid asphalt using the “mix waste” masses from
Sections 4.3.2.1 and 4.3.2.2 and the average asphalt content calculated for the day from box “U” on form 734-2401. Enter the waste emulsified asphalt in box 7 of form 734-2043. Document calculations in the “explanation” portion of form 734-2043.
4.3.3 Asphalt Content by Meters
Calculate the percent emulsified asphalt by meters for the day’s production according to the following formula:
(Weight of Asphalt) x 100
(“Actual Dry” Weight of Aggregate) – “Uncoated Agg Waste”
Calculate the “Actual Dry” weight of aggregate using the daily totalizer readings for the aggregate, plant aggregate moisture setting, and average of the sublot aggregate cold feed moisture tests for the day using the process described in Section 4.4.3.
4.4 Sublot Requirements 4.4.1 Determine the moisture content of the combined aggregate from the cold feeds
according to AASHTO T 255 for each sublot. 4.4.2 For each sublot as required by the acceptance program random number
sampling schedule, record the asphalt and aggregate used for a period of 15 ±2 minutes. This is accomplished by recording the totalizer readings at the beginning and end of the selected time period and subtracting, or by obtaining the results of the plant printout over the required period. Record the plant setting for aggregate moisture used for the selected time period.
18 ODOT TM 321(05M)
4.4.3 Determine the “actual dry” weight of aggregate according to the following:
4.4.3.1 Convert “dry” weight of aggregate as measured by the plant to “actual wet” weight using the following formula:
⎥⎦⎤
⎢⎣⎡ +×
100,1"" percentureSettingPlantMoistWeightDryPlant
Example: Plant “Dry” Weight of Aggregate = 163.4 Mg Plant Moisture Setting, % = 3.2
“Actual Wet” Weight of Aggregate = 6.168100
2.314.163 =⎥⎦⎤
⎢⎣⎡ +× Mg
4.4.3.2 Convert “Actual Wet” weight of aggregate to “Actual Dry” weight of aggregate
using the following formula: (“Actual Wet” Weight of Aggregate) 1 + (Sublot Aggregate Moisture Content, Percent/100) Example: “Actual Wet” Weight of Aggregate = 168.6 Mg Sublot Aggregate Moisture Content, % = 3.6
“Actual Dry” Weight of Aggregate = 7.162036.1
6.168)100/6.3(1
6.168==
+ Mg
4.4.4 Determine the volume of emulsified asphalt used for a base temperature of
15.6°C by multiplying the liters from the meter by the appropriate temperature correction factor from attached Table B.1.
Example: Liters of Asphalt = 9691.3 Temperature, C = 65 Correction Factor = 0.97775
Liters of Asphalt at 15.6°C = 9691.3 x 0.97775 = 9475.7
Note: Some plant meters measure the quantity of asphalt directly in mass. If this is the case, skip Sections 4.4.5 and 4.4.6 and proceed directly to Section 4.4.7.
19 ODOT TM 321(05M)
4.4.5 Convert liters of emulsified asphalt at 15.6°C to Mg using the following formula:
(liters of Asphalt at 15.6°C) x (Asphalt Specific Gravity at 15.6°C) 1000 liters/Mg
Example: Volume of Asphalt at 15.6°C = 9475.7 liters Asphalt Specific Gravity at 15.6°C = 1.027
Weight of Asphalt = 1000
027.17.9475 x = 9.73 Mg
4.4.6 Calculate the percent asphalt content using the following formula:
(Weight of Asphalt) x 100
(“Actual Dry” Wt. Of Aggregate) Example: Weight of Asphalt = 9.73 Mg “Actual Dry” Weight of Aggregate = 158.33 Mg
Asphalt Content, % = 33.15810073.9 x = 6.15
4.5 Asphalt Content by Inventory 4.5.1 Emulsified Asphalt on Hand
Determine the liters of asphalt on hand in the tanks prior to the start of production. Convert the liters at tank temperature to weight (Mg) at 15.6°C using the formulas in Section 4.4.4 and 4.4.5.
4.5.2 Emulsified Asphalt Delivered
Total the weight of liquid asphalt delivered to the asphalt plant for the production day. It is recommended that each transport be weighed prior to and after unloading to verify the actual delivered weight.
4.5.3 Emulsified Asphalt Used
Add the weight of emulsified asphalt on hand at the beginning of the day to the weight of emulsified asphalt delivered and subtract the weight of emulsified asphalt on hand at the end of the day. The answer gives the quantity of emulsified asphalt used that day based on inventory.
20 ODOT TM 321(05M)
Reduce this amount by the quantity of emulsified asphalt that was removed from the tank and did not enter the plant. This could include liquid asphalt removed for tack or other purposes.
Example:
Weight of Asphalt on Hand at Start of Production = 96.40 Mg Weight of Asphalt Delivered During Day = 124.80 Mg Weight of Asphalt on Hand at End of Production = 61.40 Mg
Weight of Asphalt Used = 96.4 + 124.8 - 61.4 = 159.80 Mg 4.5.4 Total Mixture Produced by Inventory
4.5.4.1 Total “Wet” Mixture Produced
Determine the total weight of “wet” mixture produced during the day from the truck invoices. Add to this the total “mix waste” determined from Sections 4.3.2.1 an 4.3.2.2. Calculate the total “wet” mixture produced using the following formula:
Total “Wet” Mixture = Weight from Invoices + “Mix Waste” 4.5.4.2 Total “Dry Aggregate” from Mixture Produced
Determine the total “Dry Aggregate” from the mixture produced for the day from the following formula:
(Total “Wet” Mixture – Emulsified Asphalt Used) 1 + (Average Aggregate Moisture Content, Percent/100) 4.5.4.3 Asphalt Content by Inventory
Determine the percent asphalt content by inventory of the mixture by the following formula:
(Emulsified Asphalt Used) x 100
Total “Dry Aggregate” from Mixture Produced
Example: Emulsified Asphalt Used = 159.80 Mg Total “Dry Aggregate” from Mixture Produced = 2663.80 Mg
Asphalt Content by Inventory, % = 80.15980.2663
10080.159−x = 6.38
21 ODOT TM 321(05M)
4.6 EAC Recordation System Verification
On a daily basis compare the percent asphalt content from the meter data from Section 4.3.3 to the percent asphalt content determined by the inventory method from Section 4.5.4.3. If the difference exceeds ±0.20 percent, recalibrate the plant. For those production days when the above tolerance is exceeded, the asphalt content for each sublot used for acceptance as determined from the meter method will be adjusted by the difference determined in this verification process for that day. Calculate the asphalt content correction value (difference) from the following formula:
Asphalt Content Correction, % = Asphalt Content by Inventory, % - Asphalt Content by Meter, %
If Asphalt Content Correction Difference (%) ≤ ±0.20%, then Correction = 0.0% If Asphalt Content Correction Difference (%) > ±0.20%, then adjust sublot asphalt content values according to:
Adjusted Asphalt Content for Sublot n, % =
Asphalt Content for Sublot n by meter, % + Asphalt Content Correction, %
Example: Asphalt Content by Daily Inventory, % = 6.38 Asphalt Content by Daily Meter, % = 6.17 Asphalt Content by Sublots for the Daily Production: Sublot 2-4 6.15% Sublot 2-5 6.18% Sublot 2-6 6.17% Asphalt Content Correction, % = 6.38 - 6.17 = +0.21 Difference +0.21% > ±0.20%, therefore apply correction to daily sublots Adjusted Sublot Asphalt Contents: Sublot 2-4 6.15% + 0.21% = 6.36% Sublot 2-5 6.18% + 0.21% = 6.39% Sublot 2-6 6.17% + 0.21% = 6.38%
22 ODOT TM 321(05M)
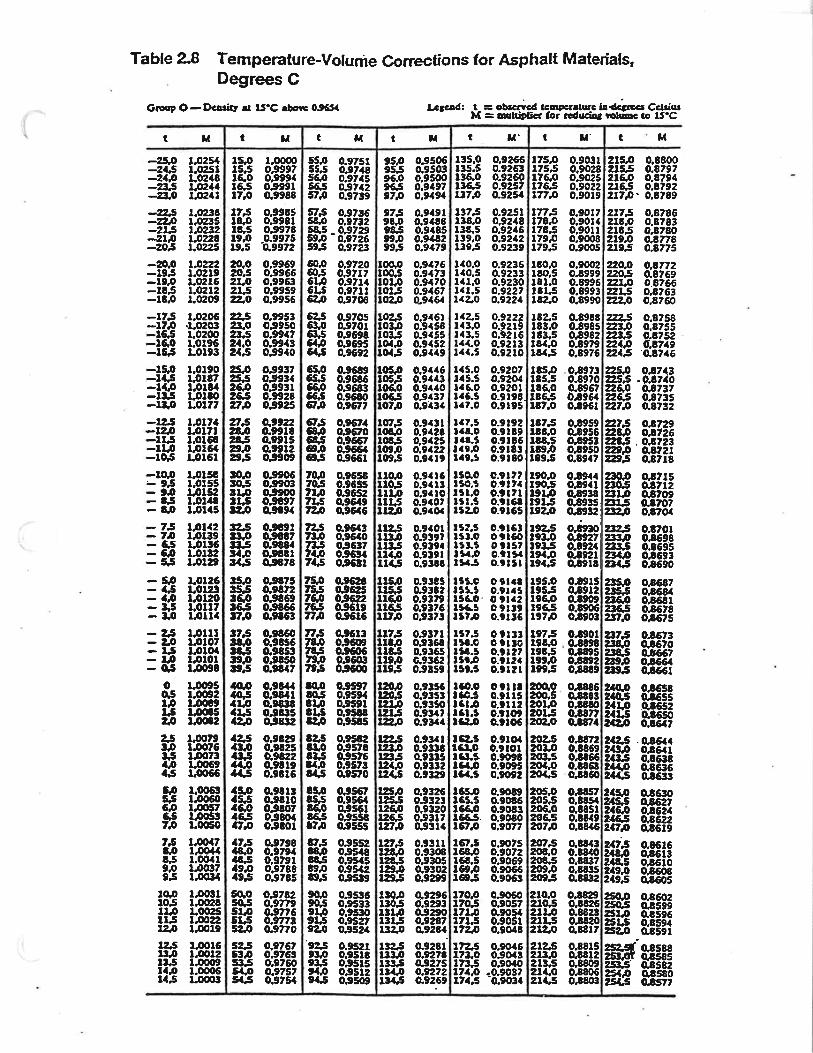
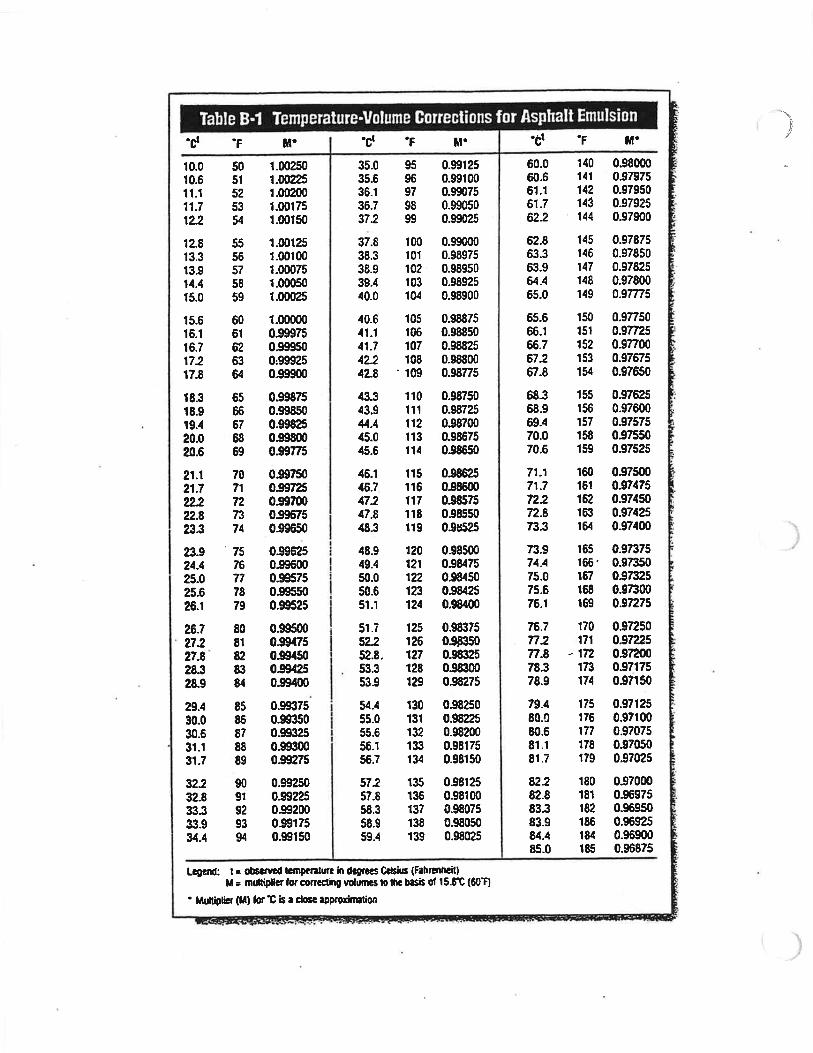
ODOT TM 321 (English)
Method of Test for
ASPHALT CONTENT OF BITUMINOUS MIXTURES BY PLANT RECORDATION
SCOPE This method contains the procedures for determining the asphalt content, RAP content, lime content, mineral filler content, fiber content, and liquid additive content of HMAC and EAC mixtures produced by batch, drum, or other acceptable mixing plants. Use of this method is contingent on consistent agreement between the plant recording equipment (meters and/or scales) and a physical inventory of the materials used. If the agreement between the inventory and plant recording equipment does not exist, the inventory data will be used to adjust the recordation data for acceptance.
SIGNIFICANCE AND USE This method can be used to determine the asphalt content of a mixture at any point in time for determining the acceptance of a product and to determine partial payment for the product. It can be applied to batch, drum, or other acceptable plants and for all asphalt mixture constituents, including percent of RAP, percent of Lime, percent of mineral filler, percent of fiber, percent of liquid additive, and any other additives.
PROCEDURES 1. HMAC WITHOUT RAP - DRUM PLANTS 1.1 General
The quantity of dry aggregate (after adding lime, if appropriate) as measured by the belt scale and the amount of asphalt as measured by the plant meter system for a predetermined period of time are used to determine the percentage of asphalt being added to the mixture. The quantity of lime, mineral filler, fibers, liquid additive, or any other additive as measured by an appropriate meter for a predetermined period of time are used to determine the percentage of the appropriate constituent in the mixture. For Commercial HMAC Plants where the procedures described herein are deemed impractical the following process shall be used:
1 ODOT TM 321(05E)
a) The HMAC supplier will submit, in writing, a plan for verifying and documenting calibration of all appropriate meters on a daily basis.
b) The Engineer and Region Quality Assurance Coordinator shall review, work with the supplier to modify if necessary, and approve the proposed plan.
c) The supplier will perform the agreed upon process for ODOT contracts. 1.2 Plant Calibration 1.2.1 Standard Drum Plants
Calibrate the plant aggregate belt scales, asphalt meter, and any other scales or meters according to ODOT TM 322 prior to the beginning of paving. Make the results of the calibration available at the asphalt plant for review by the Engineer. Recalibrate the plant when the comparison of the recordation data and plant inventory is outside the limits established in this procedure.
1.2.2 Drum Plants Equipped with Calibration Tank on Load Cells
Plants that have the capability of producing for short periods of time from a calibration tank which can be weighed using load cells or a scale are not required to conduct the meter calibration in ODOT TM 322. Calibrate the weighing device using the standard required for plant scale calibration.
1.2.3 Storage of Mixture in Silo’s
Develop a system to determine the quantity of mixture in the silos at the beginning and end of the day if any. This value will be used to adjust the total weight of mixture produced in a day.
1.3 Daily Total Requirements
1.3.1 Belt Scale and Meter Totalizers Record the asphalt, aggregate, lime (if appropriate), mineral filler (if
appropriate), fiber (if appropriate), liquid additive(if appropriate), or any other additive totalizer readings at the beginning and the end of each days production. Record the plant setting for aggregate moisture used throughout the day. This data will be used to determine the total quantity of material produced for comparison with the plant inventory data.
2 ODOT TM 321(05E)
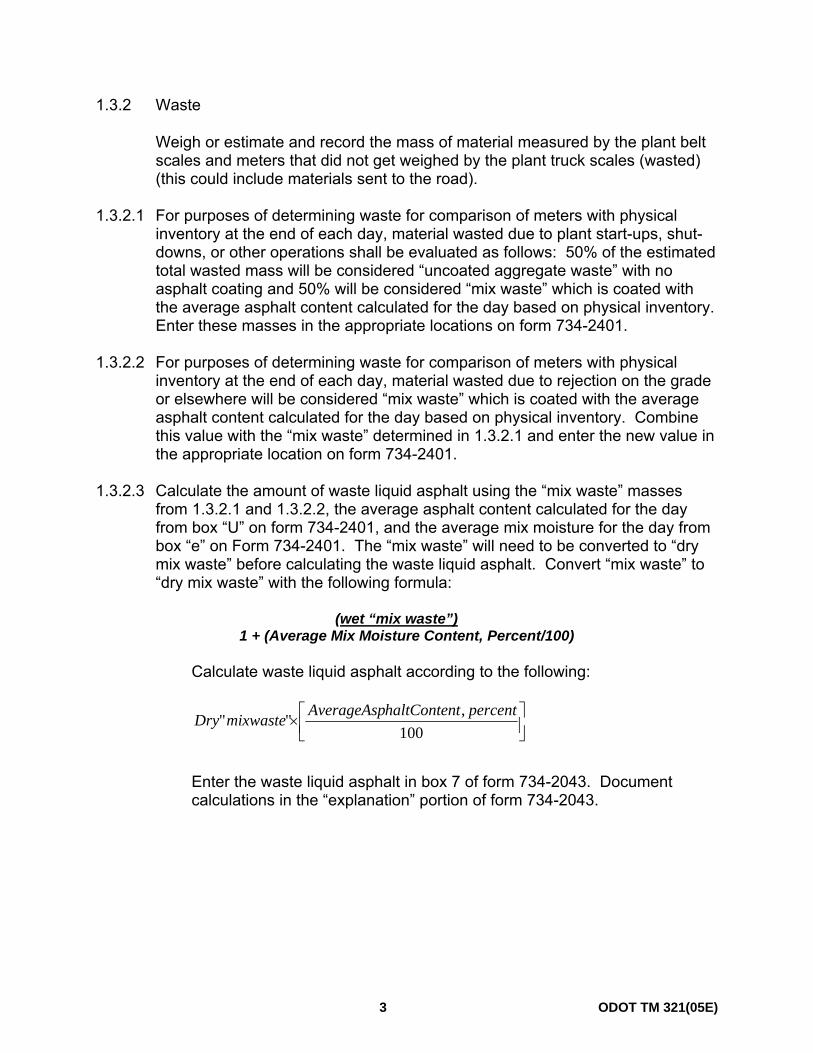
1.3.2 Waste Weigh or estimate and record the mass of material measured by the plant belt
scales and meters that did not get weighed by the plant truck scales (wasted) (this could include materials sent to the road).
1.3.2.1 For purposes of determining waste for comparison of meters with physical
inventory at the end of each day, material wasted due to plant start-ups, shut-downs, or other operations shall be evaluated as follows: 50% of the estimated total wasted mass will be considered “uncoated aggregate waste” with no asphalt coating and 50% will be considered “mix waste” which is coated with the average asphalt content calculated for the day based on physical inventory. Enter these masses in the appropriate locations on form 734-2401.
1.3.2.2 For purposes of determining waste for comparison of meters with physical
inventory at the end of each day, material wasted due to rejection on the grade or elsewhere will be considered “mix waste” which is coated with the average asphalt content calculated for the day based on physical inventory. Combine this value with the “mix waste” determined in 1.3.2.1 and enter the new value in the appropriate location on form 734-2401.
1.3.2.3 Calculate the amount of waste liquid asphalt using the “mix waste” masses
from 1.3.2.1 and 1.3.2.2, the average asphalt content calculated for the day from box “U” on form 734-2401, and the average mix moisture for the day from box “e” on Form 734-2401. The “mix waste” will need to be converted to “dry mix waste” before calculating the waste liquid asphalt. Convert “mix waste” to “dry mix waste” with the following formula:
(wet “mix waste”) 1 + (Average Mix Moisture Content, Percent/100) Calculate waste liquid asphalt according to the following:
⎥⎦⎤
⎢⎣⎡×
100,"" percentthaltContenAverageAspmixwaste Dry
Enter the waste liquid asphalt in box 7 of form 734-2043. Document calculations in the “explanation” portion of form 734-2043.
3 ODOT TM 321(05E)
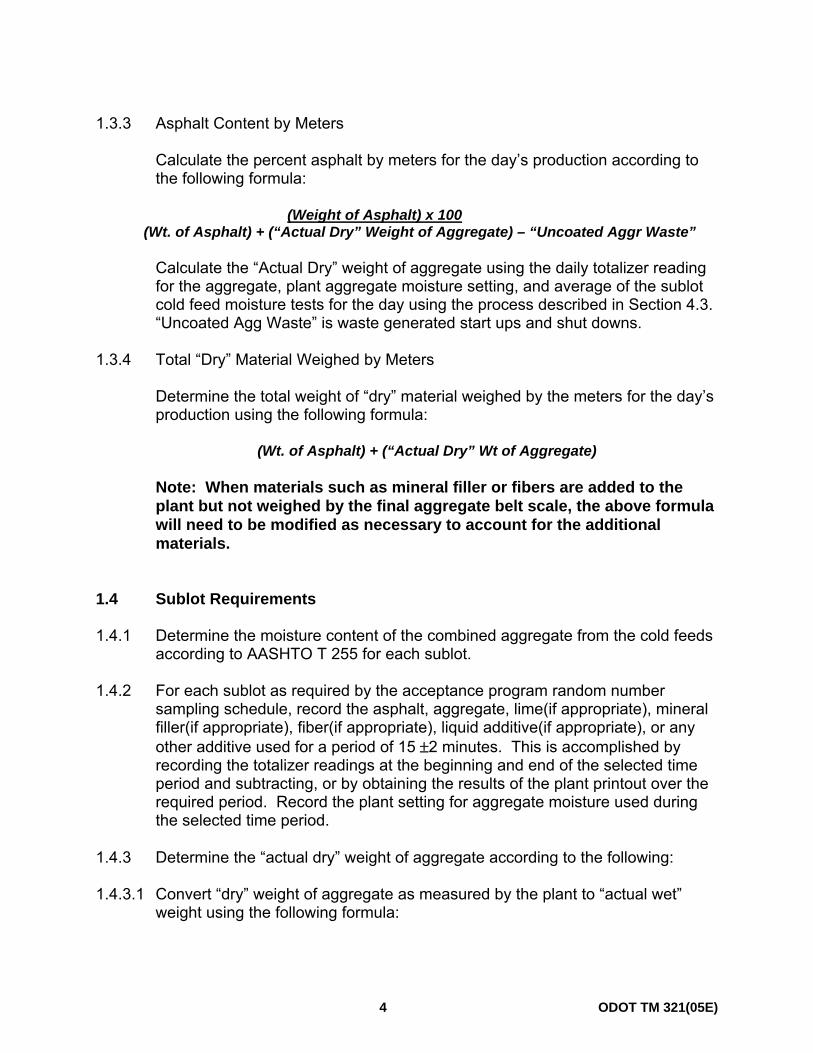
1.3.3 Asphalt Content by Meters
Calculate the percent asphalt by meters for the day’s production according to the following formula:
(Weight of Asphalt) x 100
(Wt. of Asphalt) + (“Actual Dry” Weight of Aggregate) – “Uncoated Aggr Waste”
Calculate the “Actual Dry” weight of aggregate using the daily totalizer reading for the aggregate, plant aggregate moisture setting, and average of the sublot cold feed moisture tests for the day using the process described in Section 4.3. “Uncoated Agg Waste” is waste generated start ups and shut downs.
1.3.4 Total “Dry” Material Weighed by Meters
Determine the total weight of “dry” material weighed by the meters for the day’s production using the following formula:
(Wt. of Asphalt) + (“Actual Dry” Wt of Aggregate)
Note: When materials such as mineral filler or fibers are added to the plant but not weighed by the final aggregate belt scale, the above formula will need to be modified as necessary to account for the additional materials.
1.4 Sublot Requirements 1.4.1 Determine the moisture content of the combined aggregate from the cold feeds
according to AASHTO T 255 for each sublot. 1.4.2 For each sublot as required by the acceptance program random number
sampling schedule, record the asphalt, aggregate, lime(if appropriate), mineral filler(if appropriate), fiber(if appropriate), liquid additive(if appropriate), or any other additive used for a period of 15 ±2 minutes. This is accomplished by recording the totalizer readings at the beginning and end of the selected time period and subtracting, or by obtaining the results of the plant printout over the required period. Record the plant setting for aggregate moisture used during the selected time period.
1.4.3 Determine the “actual dry” weight of aggregate according to the following: 1.4.3.1 Convert “dry” weight of aggregate as measured by the plant to “actual wet”
weight using the following formula:
4 ODOT TM 321(05E)
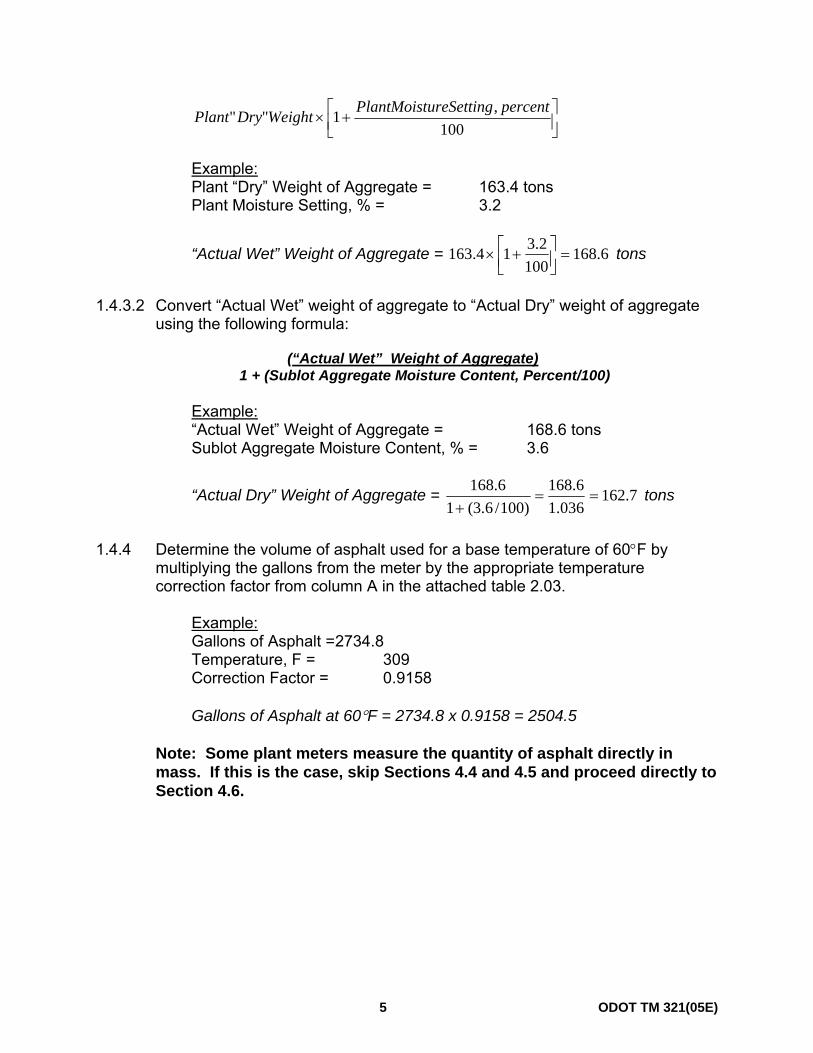
⎥⎦⎤
⎢⎣⎡ +×
100,1"" percentureSettingPlantMoistWeightDryPlant
Example: Plant “Dry” Weight of Aggregate = 163.4 tons Plant Moisture Setting, % = 3.2
“Actual Wet” Weight of Aggregate = 6.168100
2.314.163 =⎥⎦⎤
⎢⎣⎡ +× tons
1.4.3.2 Convert “Actual Wet” weight of aggregate to “Actual Dry” weight of aggregate
using the following formula: (“Actual Wet” Weight of Aggregate) 1 + (Sublot Aggregate Moisture Content, Percent/100) Example: “Actual Wet” Weight of Aggregate = 168.6 tons Sublot Aggregate Moisture Content, % = 3.6
“Actual Dry” Weight of Aggregate = 7.162036.1
6.168)100/6.3(1
6.168==
+ tons
1.4.4 Determine the volume of asphalt used for a base temperature of 60°F by
multiplying the gallons from the meter by the appropriate temperature correction factor from column A in the attached table 2.03.
Example: Gallons of Asphalt = 2734.8 Temperature, F = 309 Correction Factor = 0.9158
Gallons of Asphalt at 60°F = 2734.8 x 0.9158 = 2504.5
Note: Some plant meters measure the quantity of asphalt directly in mass. If this is the case, skip Sections 4.4 and 4.5 and proceed directly to Section 4.6.
5 ODOT TM 321(05E)
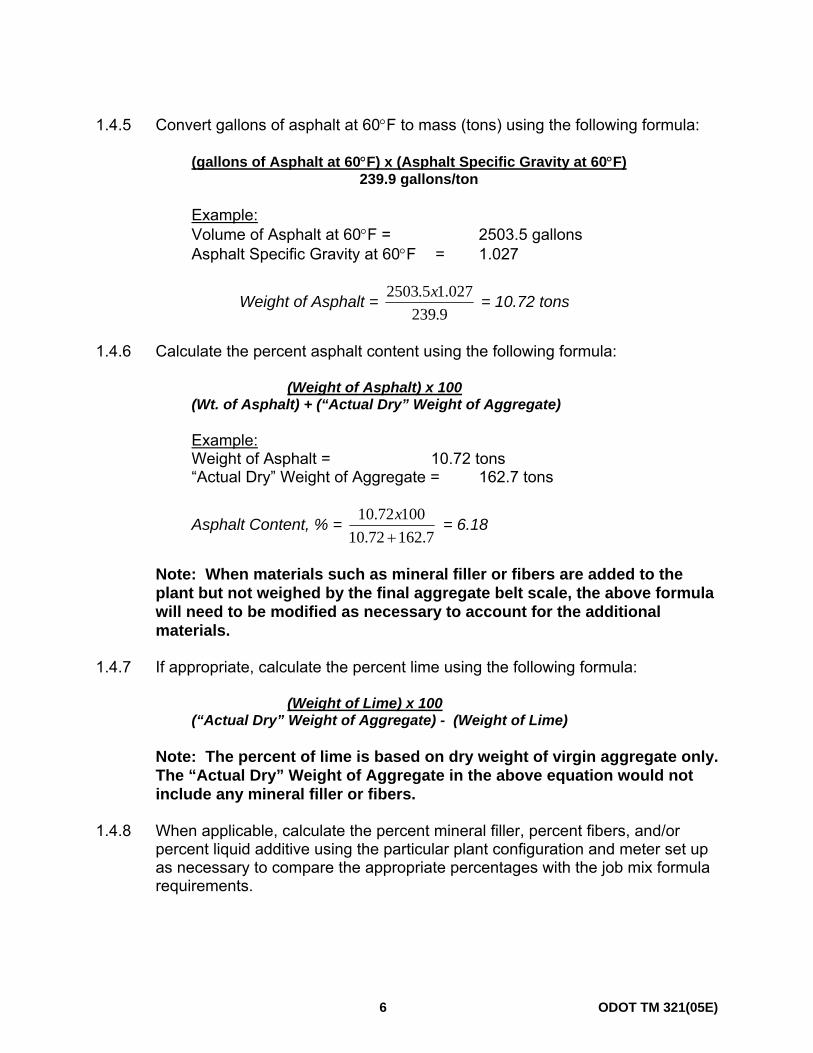
1.4.5 Convert gallons of asphalt at 60°F to mass (tons) using the following formula:
(gallons of Asphalt at 60°F) x (Asphalt Specific Gravity at 60°F) 239.9 gallons/ton Example: Volume of Asphalt at 60°F = 2503.5 gallons Asphalt Specific Gravity at 60°F = 1.027
Weight of Asphalt = 9.239
027.15.2503 x = 10.72 tons
1.4.6 Calculate the percent asphalt content using the following formula:
(Weight of Asphalt) x 100
(Wt. of Asphalt) + (“Actual Dry” Weight of Aggregate) Example: Weight of Asphalt = 10.72 tons “Actual Dry” Weight of Aggregate = 162.7 tons
Asphalt Content, % = 7.16272.10
10072.10+x = 6.18
Note: When materials such as mineral filler or fibers are added to the plant but not weighed by the final aggregate belt scale, the above formula will need to be modified as necessary to account for the additional materials.
1.4.7 If appropriate, calculate the percent lime using the following formula:
(Weight of Lime) x 100(“Actual Dry” Weight of Aggregate) - (Weight of Lime)
Note: The percent of lime is based on dry weight of virgin aggregate only. The “Actual Dry” Weight of Aggregate in the above equation would not include any mineral filler or fibers.
1.4.8 When applicable, calculate the percent mineral filler, percent fibers, and/or
percent liquid additive using the particular plant configuration and meter set up as necessary to compare the appropriate percentages with the job mix formula requirements.
6 ODOT TM 321(05E)
1.5 Asphalt Content Determination for Drum Plants Equipped with Calibration Tank on Load Cells or Scale
Follow the procedures given above in Section 1.4 except items 1.4.4 and 1.4.5 are deleted and the direct readout of the tons of asphalt used from the calibrated tank is entered into Section 1.4.6.
1.6 Asphalt Content by Inventory 1.6.1 Liquid Asphalt on Hand
Determine the gallons of asphalt on hand in the tanks prior to the start of production. Convert the gallons at tank temperature to weight (tons) at 60°F using the formulas in Section 1.4.4 and 1.4.5.
1.6.2 Liquid Asphalt Delivered
Total the weight of liquid asphalt delivered to the asphalt plant for the production day. It is recommended that each transport be weighed prior to and after unloading to verify the actual delivered weight.
1.6.3 Liquid Asphalt Used
Add the weight of liquid asphalt on hand at the beginning of the day to the weight of liquid asphalt delivered and subtract the weight of liquid asphalt on hand at the end of the day. The answer gives the quantity of liquid asphalt used that day based on inventory. Reduce this amount by the quantity of liquid asphalt that was removed from the tank and did not enter the plant. This could include liquid asphalt removed for tack or other purposes.
Example:
Weight of Asphalt on Hand at Start of Production = 96.40 tons Weight of Asphalt Delivered During Day = 124.80 tons Weight of Asphalt on Hand at End of Production = 61.40 tons
Weight of Asphalt Used = 96.4 + 124.8 - 61.4 = 159.80 tons
7 ODOT TM 321(05E)
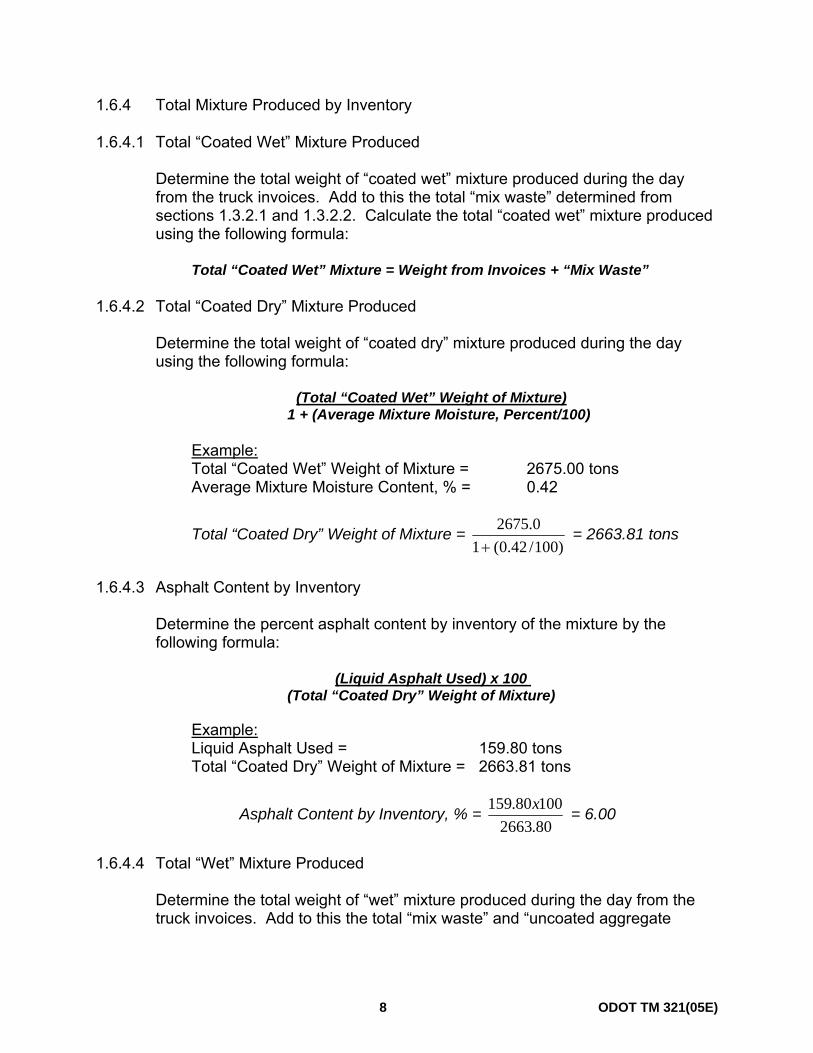
1.6.4 Total Mixture Produced by Inventory
1.6.4.1 Total “Coated Wet” Mixture Produced
Determine the total weight of “coated wet” mixture produced during the day from the truck invoices. Add to this the total “mix waste” determined from sections 1.3.2.1 and 1.3.2.2. Calculate the total “coated wet” mixture produced using the following formula:
Total “Coated Wet” Mixture = Weight from Invoices + “Mix Waste” 1.6.4.2 Total “Coated Dry” Mixture Produced
Determine the total weight of “coated dry” mixture produced during the day using the following formula:
(Total “Coated Wet” Weight of Mixture) 1 + (Average Mixture Moisture, Percent/100)
Example:
Total “Coated Wet” Weight of Mixture = 2675.00 tons Average Mixture Moisture Content, % = 0.42
Total “Coated Dry” Weight of Mixture = )100/42.0(1
0.2675+
= 2663.81 tons
1.6.4.3 Asphalt Content by Inventory
Determine the percent asphalt content by inventory of the mixture by the following formula:
(Liquid Asphalt Used) x 100 (Total “Coated Dry” Weight of Mixture)
Example: Liquid Asphalt Used = 159.80 tons Total “Coated Dry” Weight of Mixture = 2663.81 tons
Asphalt Content by Inventory, % = 80.266310080.159 x = 6.00
1.6.4.4 Total “Wet” Mixture Produced
Determine the total weight of “wet” mixture produced during the day from the truck invoices. Add to this the total “mix waste” and “uncoated aggregate
8 ODOT TM 321(05E)
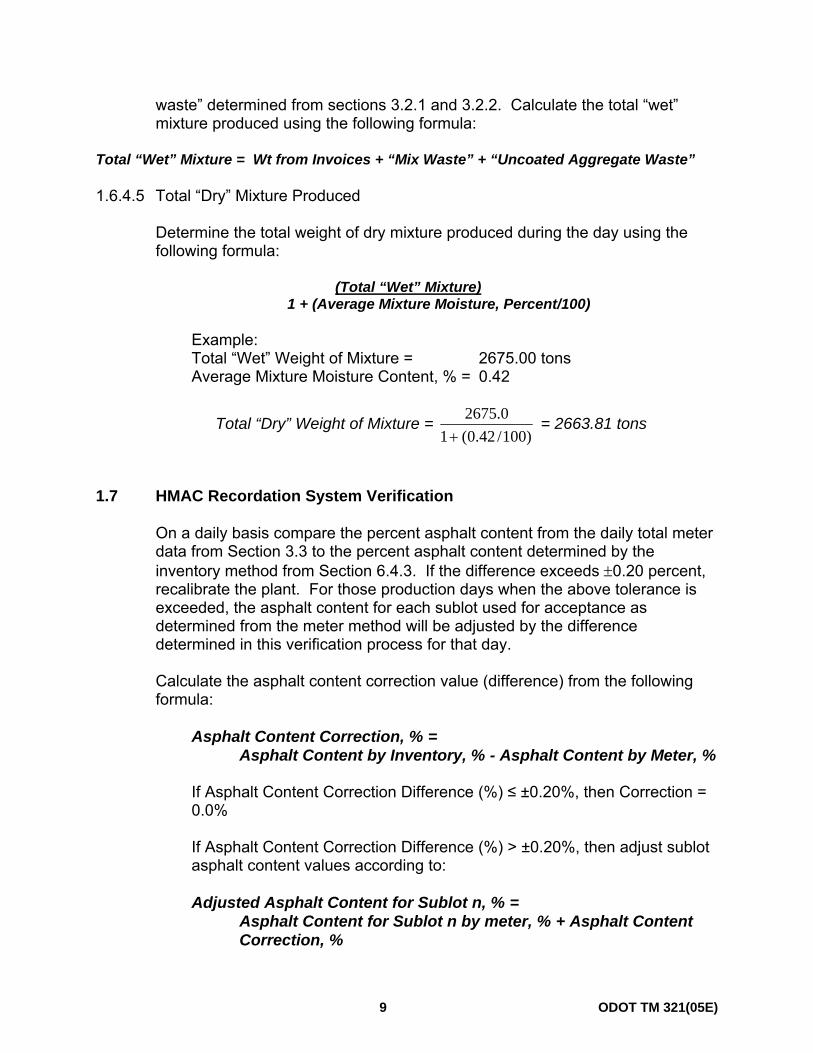
waste” determined from sections 3.2.1 and 3.2.2. Calculate the total “wet” mixture produced using the following formula:
Total “Wet” Mixture = Wt from Invoices + “Mix Waste” + “Uncoated Aggregate Waste” 1.6.4.5 Total “Dry” Mixture Produced
Determine the total weight of dry mixture produced during the day using the following formula:
(Total “Wet” Mixture) 1 + (Average Mixture Moisture, Percent/100)
Example: Total “Wet” Weight of Mixture = 2675.00 tons Average Mixture Moisture Content, % = 0.42
Total “Dry” Weight of Mixture = )100/42.0(1
0.2675+
= 2663.81 tons
1.7 HMAC Recordation System Verification
On a daily basis compare the percent asphalt content from the daily total meter data from Section 3.3 to the percent asphalt content determined by the inventory method from Section 6.4.3. If the difference exceeds ±0.20 percent, recalibrate the plant. For those production days when the above tolerance is exceeded, the asphalt content for each sublot used for acceptance as determined from the meter method will be adjusted by the difference determined in this verification process for that day.
Calculate the asphalt content correction value (difference) from the following formula:
Asphalt Content Correction, % = Asphalt Content by Inventory, % - Asphalt Content by Meter, %
If Asphalt Content Correction Difference (%) ≤ ±0.20%, then Correction = 0.0%
If Asphalt Content Correction Difference (%) > ±0.20%, then adjust sublot
asphalt content values according to: Adjusted Asphalt Content for Sublot n, % = Asphalt Content for Sublot n by meter, % + Asphalt Content
Correction, %
9 ODOT TM 321(05E)
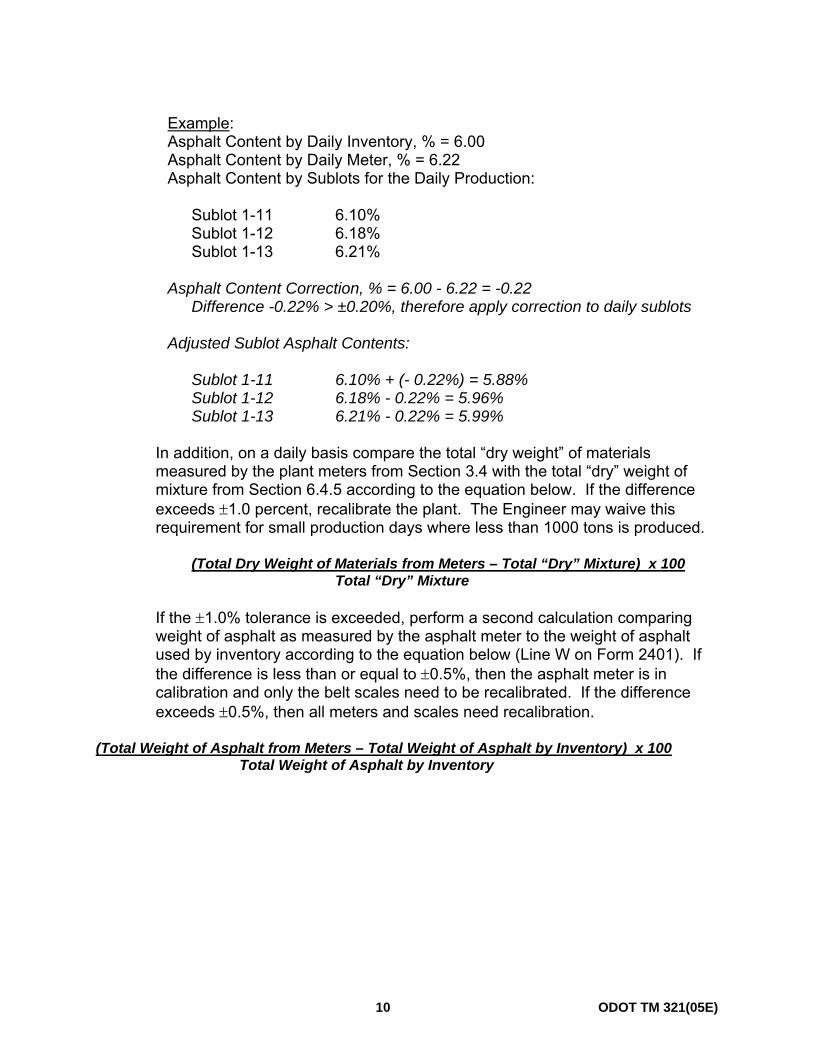
Example: Asphalt Content by Daily Inventory, % = 6.00 Asphalt Content by Daily Meter, % = 6.22 Asphalt Content by Sublots for the Daily Production: Sublot 1-11 6.10% Sublot 1-12 6.18% Sublot 1-13 6.21% Asphalt Content Correction, % = 6.00 - 6.22 = -0.22 Difference -0.22% > ±0.20%, therefore apply correction to daily sublots Adjusted Sublot Asphalt Contents: Sublot 1-11 6.10% + (- 0.22%) = 5.88% Sublot 1-12 6.18% - 0.22% = 5.96% Sublot 1-13 6.21% - 0.22% = 5.99%
In addition, on a daily basis compare the total “dry weight” of materials measured by the plant meters from Section 3.4 with the total “dry” weight of mixture from Section 6.4.5 according to the equation below. If the difference exceeds ±1.0 percent, recalibrate the plant. The Engineer may waive this requirement for small production days where less than 1000 tons is produced.
(Total Dry Weight of Materials from Meters – Total “Dry” Mixture) x 100 Total “Dry” Mixture
If the ±1.0% tolerance is exceeded, perform a second calculation comparing weight of asphalt as measured by the asphalt meter to the weight of asphalt used by inventory according to the equation below (Line W on Form 2401). If the difference is less than or equal to ±0.5%, then the asphalt meter is in calibration and only the belt scales need to be recalibrated. If the difference exceeds ±0.5%, then all meters and scales need recalibration.
(Total Weight of Asphalt from Meters – Total Weight of Asphalt by Inventory) x 100 Total Weight of Asphalt by Inventory
10 ODOT TM 321(05E)
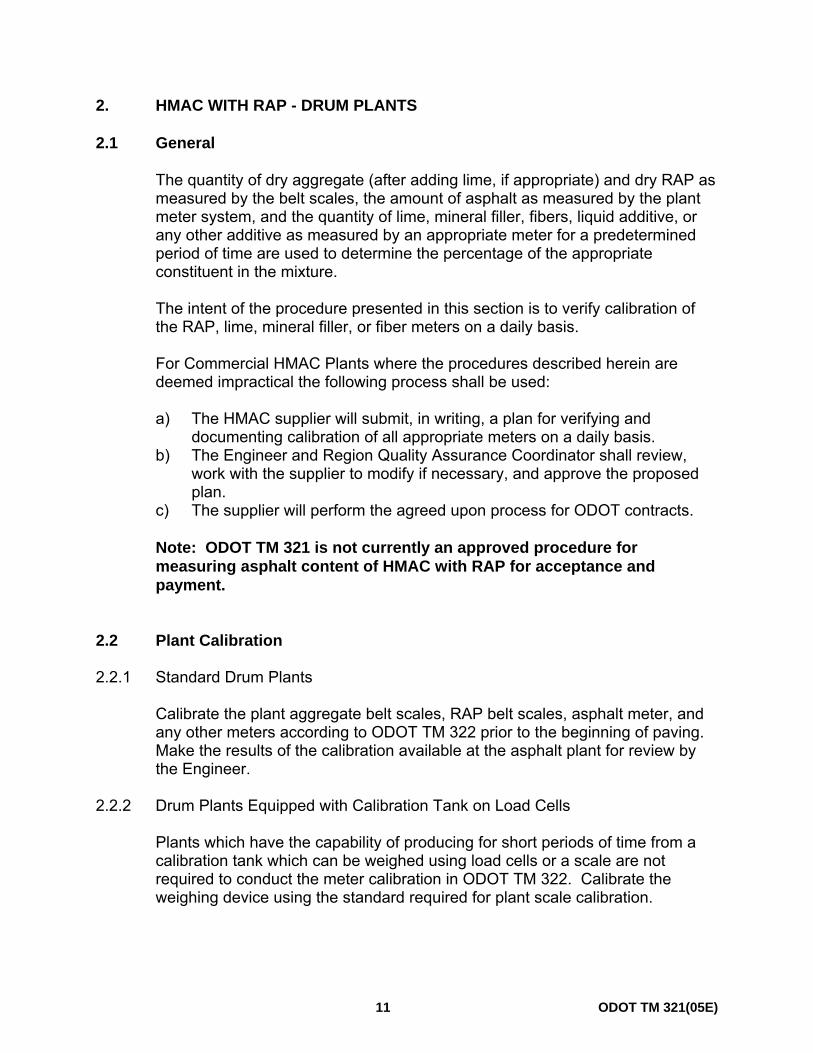
2. HMAC WITH RAP - DRUM PLANTS 2.1 General
The quantity of dry aggregate (after adding lime, if appropriate) and dry RAP as measured by the belt scales, the amount of asphalt as measured by the plant meter system, and the quantity of lime, mineral filler, fibers, liquid additive, or any other additive as measured by an appropriate meter for a predetermined period of time are used to determine the percentage of the appropriate constituent in the mixture. The intent of the procedure presented in this section is to verify calibration of the RAP, lime, mineral filler, or fiber meters on a daily basis. For Commercial HMAC Plants where the procedures described herein are deemed impractical the following process shall be used: a) The HMAC supplier will submit, in writing, a plan for verifying and
documenting calibration of all appropriate meters on a daily basis. b) The Engineer and Region Quality Assurance Coordinator shall review,
work with the supplier to modify if necessary, and approve the proposed plan.
c) The supplier will perform the agreed upon process for ODOT contracts. Note: ODOT TM 321 is not currently an approved procedure for measuring asphalt content of HMAC with RAP for acceptance and payment.
2.2 Plant Calibration 2.2.1 Standard Drum Plants
Calibrate the plant aggregate belt scales, RAP belt scales, asphalt meter, and any other meters according to ODOT TM 322 prior to the beginning of paving. Make the results of the calibration available at the asphalt plant for review by the Engineer.
2.2.2 Drum Plants Equipped with Calibration Tank on Load Cells
Plants which have the capability of producing for short periods of time from a calibration tank which can be weighed using load cells or a scale are not required to conduct the meter calibration in ODOT TM 322. Calibrate the weighing device using the standard required for plant scale calibration.
11 ODOT TM 321(05E)
2.2.3 Storage of Mixture in Silo’s
Develop a system to determine the quantity of mixture in the silos at the beginning and end of the day if any. This value will be used to adjust the total weight of mixture produced in a day.
2.3 Daily Total Requirements
2.3.1 Belt Scale and Meter Totalizers
Record the asphalt, aggregate, RAP, lime (if appropriate), mineral filler (if appropriate), fiber (if appropriate), liquid additive (if appropriate), or any other additive totalizer readings at the beginning and the end of each days production. For commercial plants making multiple runs during a day, this data shall be recorded for each run and summed up at the end of the day. Record the plant settings for aggregate moisture and the RAP moisture used throughout the day. Document this information on form 734-2401.
2.3.2 Waste
Weigh or estimate and record the mass of material measured by the plant belt scales and meters that did not get weighed by the plant truck scales (wasted) (this could include materials sent to the road).
2.3.2.1 For purposes of determining waste for comparison of meters with physical
inventory at the end of each day, material wasted due to plant start-ups, shut-downs, or other operations shall be evaluated as follows: 50% of the estimated total wasted mass will be considered “uncoated aggregate waste” with no asphalt coating and 50% will be considered “mix waste” which is coated with the average asphalt content calculated for the day based on physical inventory. Enter these masses in the appropriate locations on form 734-2401.
2.3.2.2 For purposes of determining waste for comparison of meters with physical
inventory at the end of each day, material wasted due to rejection on the grade or elsewhere will be considered “mix waste” which is coated with the average asphalt content calculated for the day based on physical inventory. Combine this value with the “mix waste” determined in 1.3.2.1 and enter the new value in the appropriate location on form 734-2401.
2.3.2.3 Calculate the amount of waste liquid asphalt using the “mix waste” masses
from 1.3.2.1 and 1.3.2.2, the average asphalt content calculated for the day from box “U” on form 734-2401, and the average mix moisture for the day from box “e” on Form 734-2401.
12 ODOT TM 321(05E)
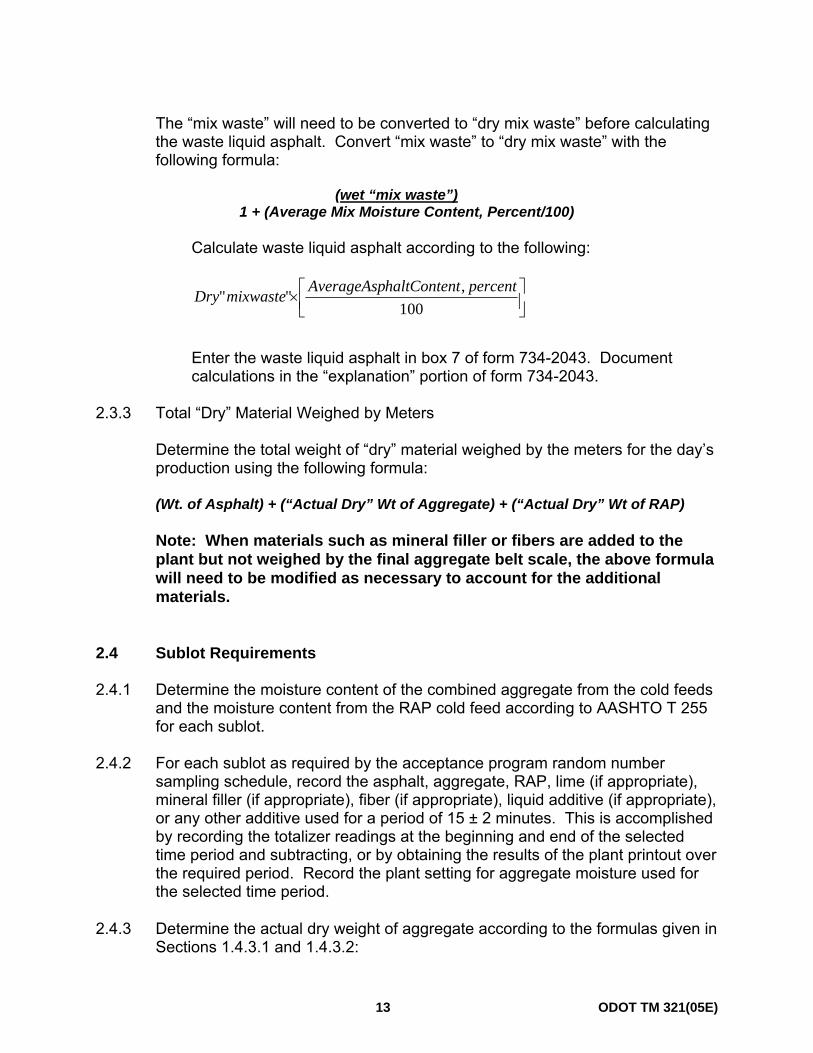
The “mix waste” will need to be converted to “dry mix waste” before calculating the waste liquid asphalt. Convert “mix waste” to “dry mix waste” with the following formula:
(wet “mix waste”) 1 + (Average Mix Moisture Content, Percent/100) Calculate waste liquid asphalt according to the following:
⎥⎦⎤
⎢⎣⎡×
100,"" percentthaltContenAverageAspmixwaste Dry
Enter the waste liquid asphalt in box 7 of form 734-2043. Document calculations in the “explanation” portion of form 734-2043.
2.3.3 Total “Dry” Material Weighed by Meters
Determine the total weight of “dry” material weighed by the meters for the day’s production using the following formula:
(Wt. of Asphalt) + (“Actual Dry” Wt of Aggregate) + (“Actual Dry” Wt of RAP)
Note: When materials such as mineral filler or fibers are added to the plant but not weighed by the final aggregate belt scale, the above formula will need to be modified as necessary to account for the additional materials.
2.4 Sublot Requirements 2.4.1 Determine the moisture content of the combined aggregate from the cold feeds
and the moisture content from the RAP cold feed according to AASHTO T 255 for each sublot.
2.4.2 For each sublot as required by the acceptance program random number
sampling schedule, record the asphalt, aggregate, RAP, lime (if appropriate), mineral filler (if appropriate), fiber (if appropriate), liquid additive (if appropriate), or any other additive used for a period of 15 ± 2 minutes. This is accomplished by recording the totalizer readings at the beginning and end of the selected time period and subtracting, or by obtaining the results of the plant printout over the required period. Record the plant setting for aggregate moisture used for the selected time period.
2.4.3 Determine the actual dry weight of aggregate according to the formulas given in
Sections 1.4.3.1 and 1.4.3.2:
13 ODOT TM 321(05E)
2.4.4 Determine the actual dry weight of RAP according to the formulas given in
Sections 1.4.3.1 and 1.4.3.2 using weights of RAP in place of the weights of aggregate:
2.4.5 Determine the weight of asphalt used according to Sections 1.4.4 and 1.4.5.
2.4.6 Calculate the percent RAP using the following formula:
(“Actual Dry” Weight of RAP) x 100(“Actual Dry” Weight of RAP) + (“Actual Dry” Weight of Aggregate)
2.4.7 If appropriate, calculate the percent lime using the following formula:
(Weight of Lime) x 100 (“Actual Dry” Weight of Aggregate) - (Weight of Lime)
2.4.8 When applicable, calculate the percent mineral filler, percent fibers, and/or
percent liquid additive using the particular plant configuration and meter set up as necessary to compare the appropriate percentages with the job mix formula requirements.
2.5 Total Mixture Produced by Inventory
2.5.1 Total “Wet” Mixture Produced
Determine the total weight of “wet” mixture produced during the day from the truck invoices. Add to this the total “mix waste” and “uncoated aggregate waste’ determined from sections 1.3.2.1 and 1.3.2.2 of the previous section. Calculate the total “wet” mixture produced using the following formula:
Total “Wet” Mixture = Wt from Invoices + “Mix Waste” + “Uncoated Aggregate Waste” 2.5.2 Total “Dry” Mixture Produced
Determine the total weight of dry mixture produced during the day using the following formula:
(Total “Wet” Weight of Mixture) 1 + (Average Mixture Moisture, Percent/100)
Example: Total “Wet” Weight of Mixture = 2675.00 tons Average Mixture Moisture Content, % = 0.42
14 ODOT TM 321(05E)
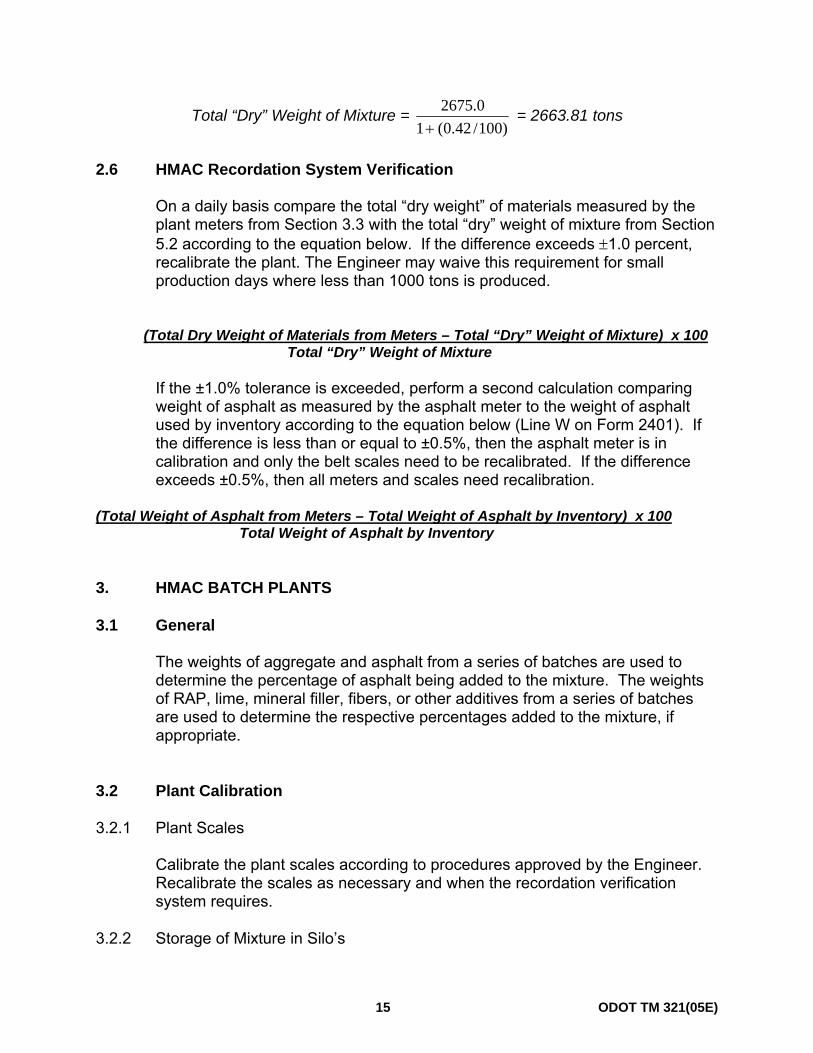
Total “Dry” Weight of Mixture = )100/42.0(1
0.2675+
= 2663.81 tons
2.6 HMAC Recordation System Verification
On a daily basis compare the total “dry weight” of materials measured by the plant meters from Section 3.3 with the total “dry” weight of mixture from Section 5.2 according to the equation below. If the difference exceeds ±1.0 percent, recalibrate the plant. The Engineer may waive this requirement for small production days where less than 1000 tons is produced.
(Total Dry Weight of Materials from Meters – Total “Dry” Weight of Mixture) x 100 Total “Dry” Weight of Mixture
If the ±1.0% tolerance is exceeded, perform a second calculation comparing weight of asphalt as measured by the asphalt meter to the weight of asphalt used by inventory according to the equation below (Line W on Form 2401). If the difference is less than or equal to ±0.5%, then the asphalt meter is in calibration and only the belt scales need to be recalibrated. If the difference exceeds ±0.5%, then all meters and scales need recalibration.
(Total Weight of Asphalt from Meters – Total Weight of Asphalt by Inventory) x 100 Total Weight of Asphalt by Inventory
3. HMAC BATCH PLANTS 3.1 General
The weights of aggregate and asphalt from a series of batches are used to determine the percentage of asphalt being added to the mixture. The weights of RAP, lime, mineral filler, fibers, or other additives from a series of batches are used to determine the respective percentages added to the mixture, if appropriate.
3.2 Plant Calibration 3.2.1 Plant Scales
Calibrate the plant scales according to procedures approved by the Engineer. Recalibrate the scales as necessary and when the recordation verification system requires.
3.2.2 Storage of Mixture in Silo’s
15 ODOT TM 321(05E)
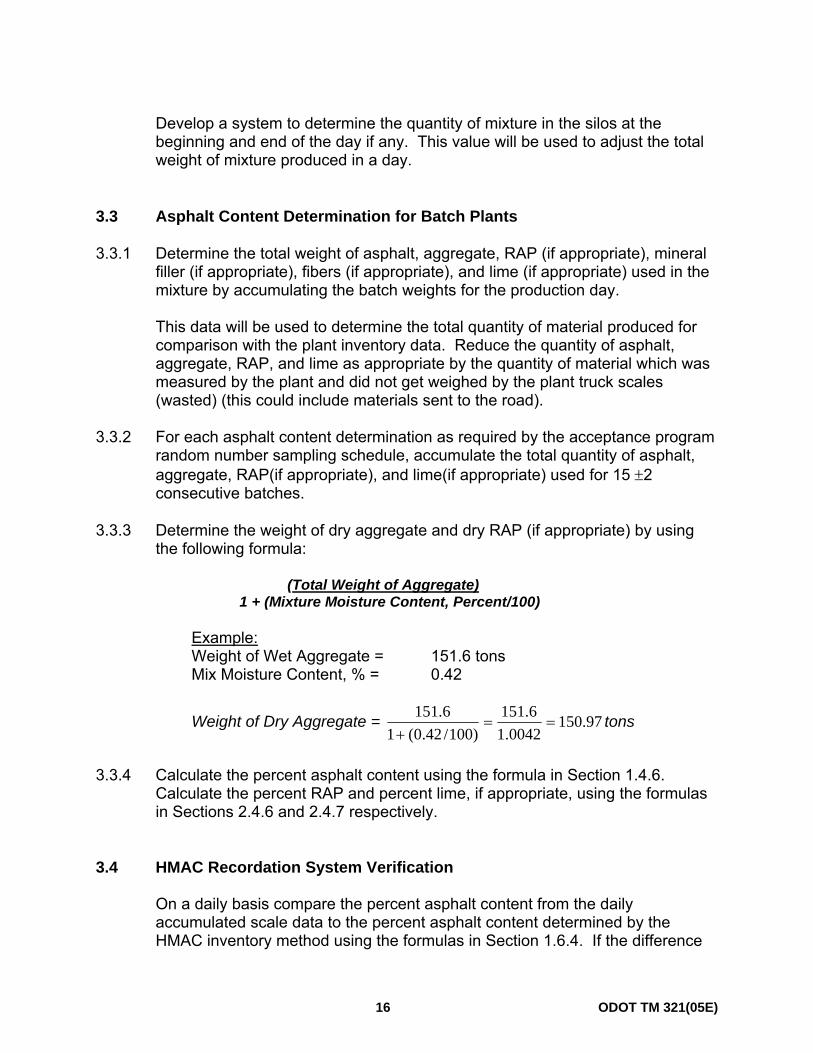
Develop a system to determine the quantity of mixture in the silos at the beginning and end of the day if any. This value will be used to adjust the total weight of mixture produced in a day.
3.3 Asphalt Content Determination for Batch Plants 3.3.1 Determine the total weight of asphalt, aggregate, RAP (if appropriate), mineral
filler (if appropriate), fibers (if appropriate), and lime (if appropriate) used in the mixture by accumulating the batch weights for the production day.
This data will be used to determine the total quantity of material produced for comparison with the plant inventory data. Reduce the quantity of asphalt, aggregate, RAP, and lime as appropriate by the quantity of material which was measured by the plant and did not get weighed by the plant truck scales (wasted) (this could include materials sent to the road).
3.3.2 For each asphalt content determination as required by the acceptance program
random number sampling schedule, accumulate the total quantity of asphalt, aggregate, RAP(if appropriate), and lime(if appropriate) used for 15 ±2 consecutive batches.
3.3.3 Determine the weight of dry aggregate and dry RAP (if appropriate) by using
the following formula: (Total Weight of Aggregate) 1 + (Mixture Moisture Content, Percent/100)
Example: Weight of Wet Aggregate = 151.6 tons Mix Moisture Content, % = 0.42
Weight of Dry Aggregate = 97.1500042.1
6.151)100/42.0(1
6.151==
+tons
3.3.4 Calculate the percent asphalt content using the formula in Section 1.4.6.
Calculate the percent RAP and percent lime, if appropriate, using the formulas in Sections 2.4.6 and 2.4.7 respectively.
3.4 HMAC Recordation System Verification
On a daily basis compare the percent asphalt content from the daily accumulated scale data to the percent asphalt content determined by the HMAC inventory method using the formulas in Section 1.6.4. If the difference
16 ODOT TM 321(05E)
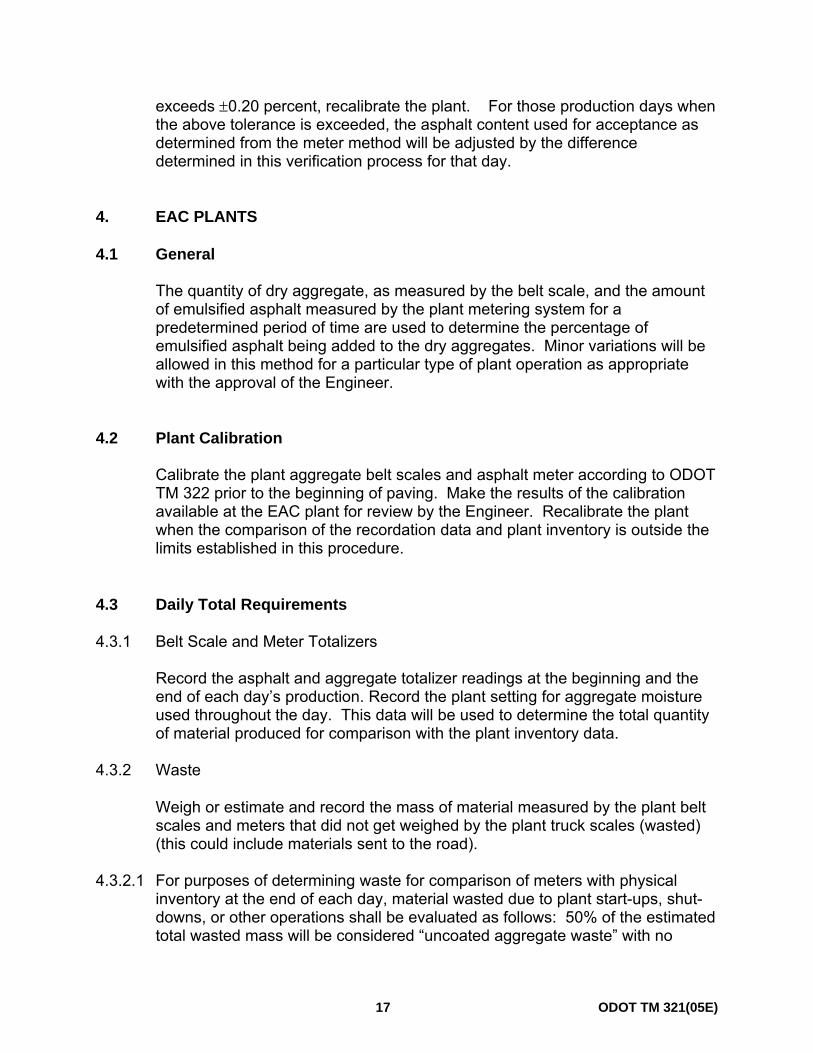
exceeds ±0.20 percent, recalibrate the plant. For those production days when the above tolerance is exceeded, the asphalt content used for acceptance as determined from the meter method will be adjusted by the difference determined in this verification process for that day.
4. EAC PLANTS 4.1 General
The quantity of dry aggregate, as measured by the belt scale, and the amount of emulsified asphalt measured by the plant metering system for a predetermined period of time are used to determine the percentage of emulsified asphalt being added to the dry aggregates. Minor variations will be allowed in this method for a particular type of plant operation as appropriate with the approval of the Engineer.
4.2 Plant Calibration
Calibrate the plant aggregate belt scales and asphalt meter according to ODOT TM 322 prior to the beginning of paving. Make the results of the calibration available at the EAC plant for review by the Engineer. Recalibrate the plant when the comparison of the recordation data and plant inventory is outside the limits established in this procedure.
4.3 Daily Total Requirements
4.3.1 Belt Scale and Meter Totalizers
Record the asphalt and aggregate totalizer readings at the beginning and the end of each day’s production. Record the plant setting for aggregate moisture used throughout the day. This data will be used to determine the total quantity of material produced for comparison with the plant inventory data.
4.3.2 Waste
Weigh or estimate and record the mass of material measured by the plant belt scales and meters that did not get weighed by the plant truck scales (wasted) (this could include materials sent to the road).
4.3.2.1 For purposes of determining waste for comparison of meters with physical
inventory at the end of each day, material wasted due to plant start-ups, shut-downs, or other operations shall be evaluated as follows: 50% of the estimated total wasted mass will be considered “uncoated aggregate waste” with no
17 ODOT TM 321(05E)
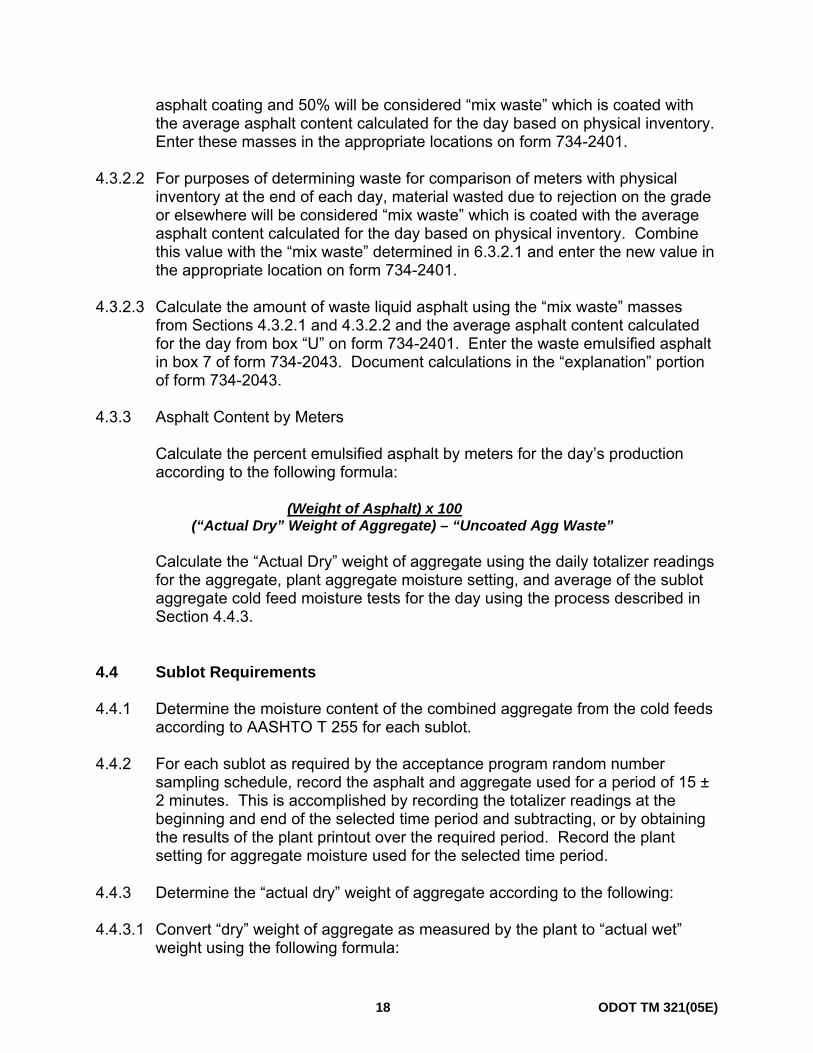
asphalt coating and 50% will be considered “mix waste” which is coated with the average asphalt content calculated for the day based on physical inventory. Enter these masses in the appropriate locations on form 734-2401.
4.3.2.2 For purposes of determining waste for comparison of meters with physical
inventory at the end of each day, material wasted due to rejection on the grade or elsewhere will be considered “mix waste” which is coated with the average asphalt content calculated for the day based on physical inventory. Combine this value with the “mix waste” determined in 6.3.2.1 and enter the new value in the appropriate location on form 734-2401.
4.3.2.3 Calculate the amount of waste liquid asphalt using the “mix waste” masses
from Sections 4.3.2.1 and 4.3.2.2 and the average asphalt content calculated for the day from box “U” on form 734-2401. Enter the waste emulsified asphalt in box 7 of form 734-2043. Document calculations in the “explanation” portion of form 734-2043.
4.3.3 Asphalt Content by Meters
Calculate the percent emulsified asphalt by meters for the day’s production according to the following formula:
(Weight of Asphalt) x 100
(“Actual Dry” Weight of Aggregate) – “Uncoated Agg Waste”
Calculate the “Actual Dry” weight of aggregate using the daily totalizer readings for the aggregate, plant aggregate moisture setting, and average of the sublot aggregate cold feed moisture tests for the day using the process described in Section 4.4.3.
4.4 Sublot Requirements 4.4.1 Determine the moisture content of the combined aggregate from the cold feeds
according to AASHTO T 255 for each sublot. 4.4.2 For each sublot as required by the acceptance program random number
sampling schedule, record the asphalt and aggregate used for a period of 15 ± 2 minutes. This is accomplished by recording the totalizer readings at the beginning and end of the selected time period and subtracting, or by obtaining the results of the plant printout over the required period. Record the plant setting for aggregate moisture used for the selected time period.
4.4.3 Determine the “actual dry” weight of aggregate according to the following:
4.4.3.1 Convert “dry” weight of aggregate as measured by the plant to “actual wet”
weight using the following formula:
18 ODOT TM 321(05E)
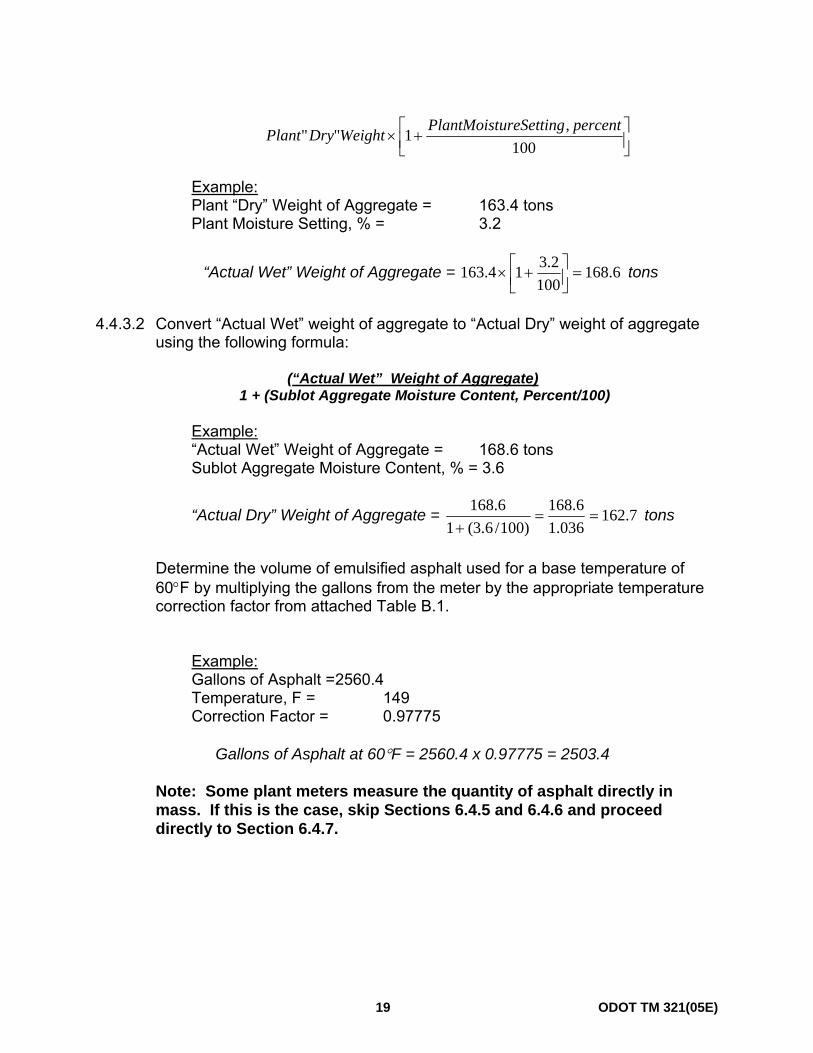
⎥⎦⎤
⎢⎣⎡ +×
100,1"" percentureSettingPlantMoistWeightDryPlant
Example: Plant “Dry” Weight of Aggregate = 163.4 tons Plant Moisture Setting, % = 3.2
“Actual Wet” Weight of Aggregate = 6.168100
2.314.163 =⎥⎦⎤
⎢⎣⎡ +× tons
4.4.3.2 Convert “Actual Wet” weight of aggregate to “Actual Dry” weight of aggregate
using the following formula: (“Actual Wet” Weight of Aggregate) 1 + (Sublot Aggregate Moisture Content, Percent/100) Example: “Actual Wet” Weight of Aggregate = 168.6 tons Sublot Aggregate Moisture Content, % = 3.6
“Actual Dry” Weight of Aggregate = 7.162036.1
6.168)100/6.3(1
6.168==
+ tons
Determine the volume of emulsified asphalt used for a base temperature of 60°F by multiplying the gallons from the meter by the appropriate temperature correction factor from attached Table B.1.
Example: Gallons of Asphalt = 2560.4 Temperature, F = 149 Correction Factor = 0.97775
Gallons of Asphalt at 60°F = 2560.4 x 0.97775 = 2503.4
Note: Some plant meters measure the quantity of asphalt directly in mass. If this is the case, skip Sections 6.4.5 and 6.4.6 and proceed directly to Section 6.4.7.
19 ODOT TM 321(05E)
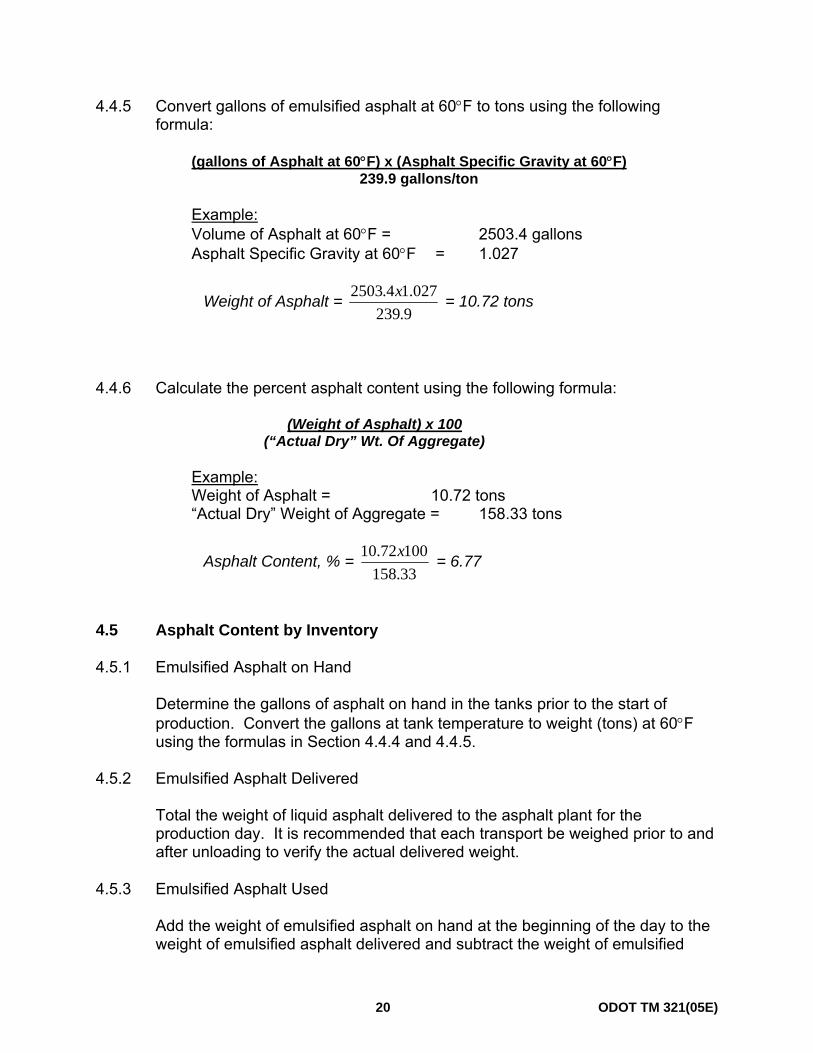
4.4.5 Convert gallons of emulsified asphalt at 60°F to tons using the following formula:
(gallons of Asphalt at 60°F) x (Asphalt Specific Gravity at 60°F)
239.9 gallons/ton Example: Volume of Asphalt at 60°F = 2503.4 gallons Asphalt Specific Gravity at 60°F = 1.027
Weight of Asphalt = 9.239
027.14.2503 x = 10.72 tons
4.4.6 Calculate the percent asphalt content using the following formula: (Weight of Asphalt) x 100
(“Actual Dry” Wt. Of Aggregate) Example: Weight of Asphalt = 10.72 tons “Actual Dry” Weight of Aggregate = 158.33 tons
Asphalt Content, % = 33.15810072.10 x = 6.77
4.5 Asphalt Content by Inventory 4.5.1 Emulsified Asphalt on Hand
Determine the gallons of asphalt on hand in the tanks prior to the start of production. Convert the gallons at tank temperature to weight (tons) at 60°F using the formulas in Section 4.4.4 and 4.4.5.
4.5.2 Emulsified Asphalt Delivered
Total the weight of liquid asphalt delivered to the asphalt plant for the production day. It is recommended that each transport be weighed prior to and after unloading to verify the actual delivered weight.
4.5.3 Emulsified Asphalt Used
Add the weight of emulsified asphalt on hand at the beginning of the day to the weight of emulsified asphalt delivered and subtract the weight of emulsified
20 ODOT TM 321(05E)
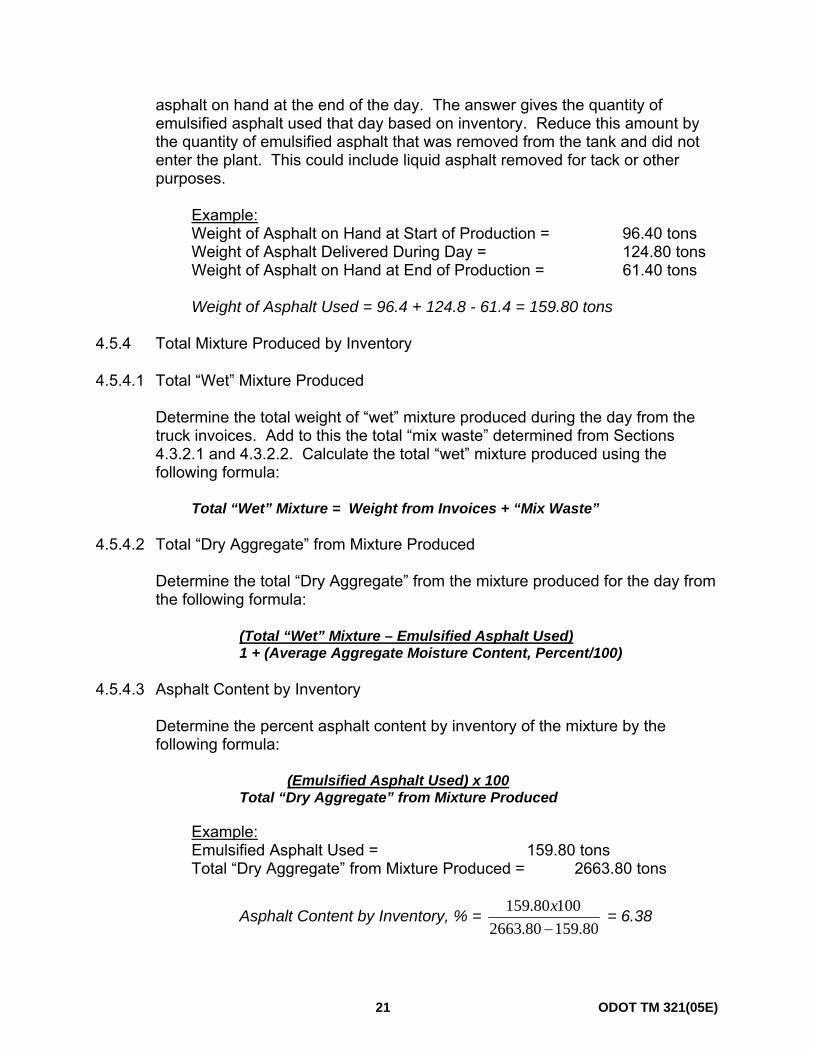
asphalt on hand at the end of the day. The answer gives the quantity of emulsified asphalt used that day based on inventory. Reduce this amount by the quantity of emulsified asphalt that was removed from the tank and did not enter the plant. This could include liquid asphalt removed for tack or other purposes.
Example:
Weight of Asphalt on Hand at Start of Production = 96.40 tons Weight of Asphalt Delivered During Day = 124.80 tons Weight of Asphalt on Hand at End of Production = 61.40 tons
Weight of Asphalt Used = 96.4 + 124.8 - 61.4 = 159.80 tons
4.5.4 Total Mixture Produced by Inventory
4.5.4.1 Total “Wet” Mixture Produced
Determine the total weight of “wet” mixture produced during the day from the truck invoices. Add to this the total “mix waste” determined from Sections 4.3.2.1 and 4.3.2.2. Calculate the total “wet” mixture produced using the following formula:
Total “Wet” Mixture = Weight from Invoices + “Mix Waste”
4.5.4.2 Total “Dry Aggregate” from Mixture Produced
Determine the total “Dry Aggregate” from the mixture produced for the day from the following formula:
(Total “Wet” Mixture – Emulsified Asphalt Used) 1 + (Average Aggregate Moisture Content, Percent/100) 4.5.4.3 Asphalt Content by Inventory
Determine the percent asphalt content by inventory of the mixture by the following formula:
(Emulsified Asphalt Used) x 100
Total “Dry Aggregate” from Mixture Produced
Example: Emulsified Asphalt Used = 159.80 tons Total “Dry Aggregate” from Mixture Produced = 2663.80 tons
Asphalt Content by Inventory, % = 80.15980.2663
10080.159−x = 6.38
21 ODOT TM 321(05E)
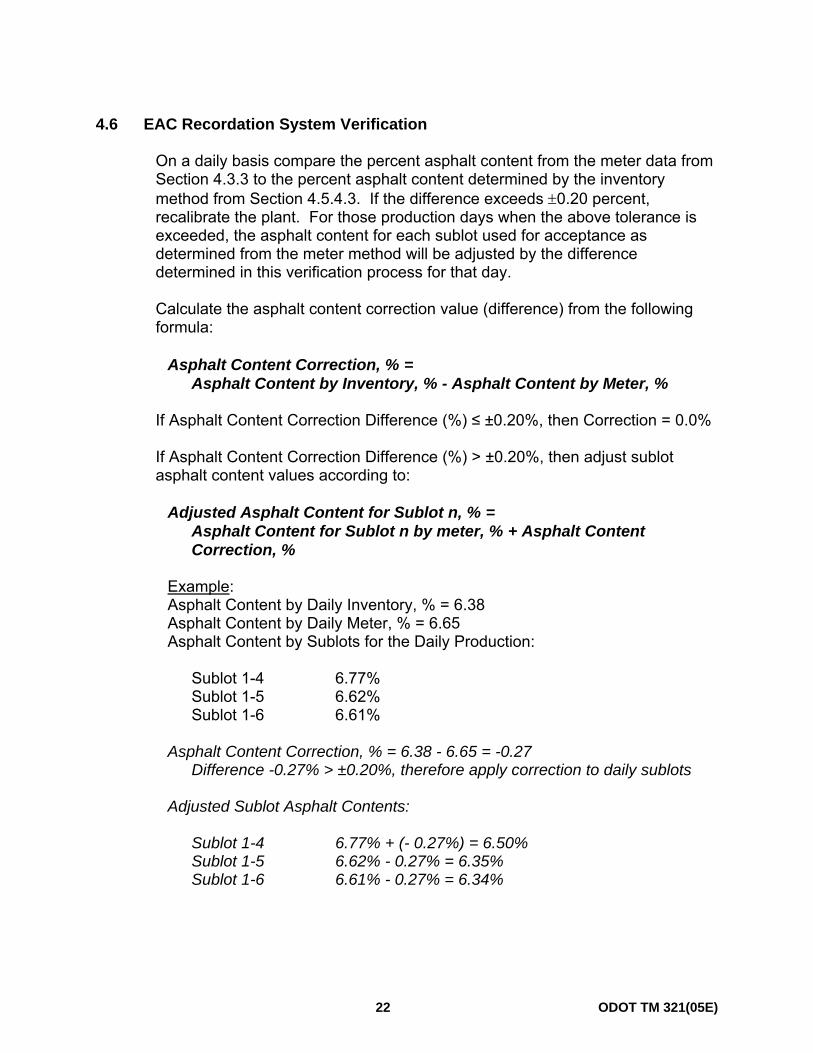
4.6 EAC Recordation System Verification
On a daily basis compare the percent asphalt content from the meter data from Section 4.3.3 to the percent asphalt content determined by the inventory method from Section 4.5.4.3. If the difference exceeds ±0.20 percent, recalibrate the plant. For those production days when the above tolerance is exceeded, the asphalt content for each sublot used for acceptance as determined from the meter method will be adjusted by the difference determined in this verification process for that day. Calculate the asphalt content correction value (difference) from the following formula:
Asphalt Content Correction, % =
Asphalt Content by Inventory, % - Asphalt Content by Meter, %
If Asphalt Content Correction Difference (%) ≤ ±0.20%, then Correction = 0.0% If Asphalt Content Correction Difference (%) > ±0.20%, then adjust sublot asphalt content values according to:
Adjusted Asphalt Content for Sublot n, % =
Asphalt Content for Sublot n by meter, % + Asphalt Content Correction, %
Example: Asphalt Content by Daily Inventory, % = 6.38 Asphalt Content by Daily Meter, % = 6.65 Asphalt Content by Sublots for the Daily Production: Sublot 1-4 6.77% Sublot 1-5 6.62% Sublot 1-6 6.61% Asphalt Content Correction, % = 6.38 - 6.65 = -0.27 Difference -0.27% > ±0.20%, therefore apply correction to daily sublots Adjusted Sublot Asphalt Contents: Sublot 1-4 6.77% + (- 0.27%) = 6.50% Sublot 1-5 6.62% - 0.27% = 6.35% Sublot 1-6 6.61% - 0.27% = 6.34%
22 ODOT TM 321(05E)
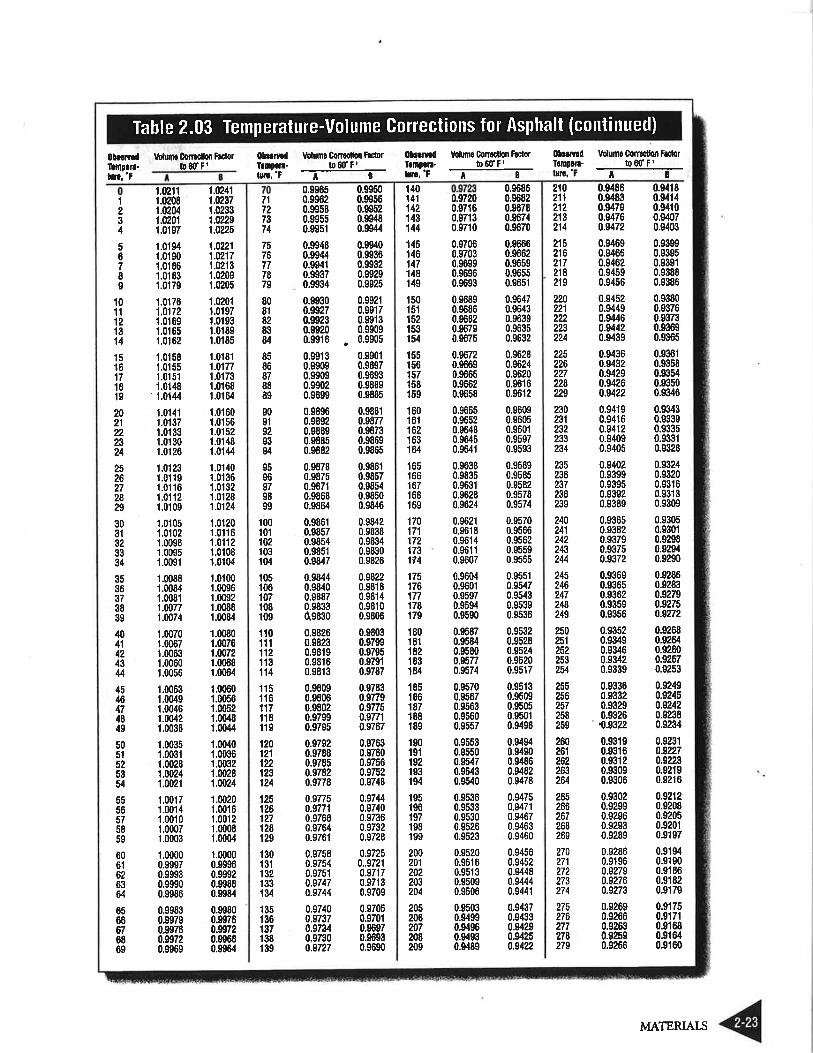
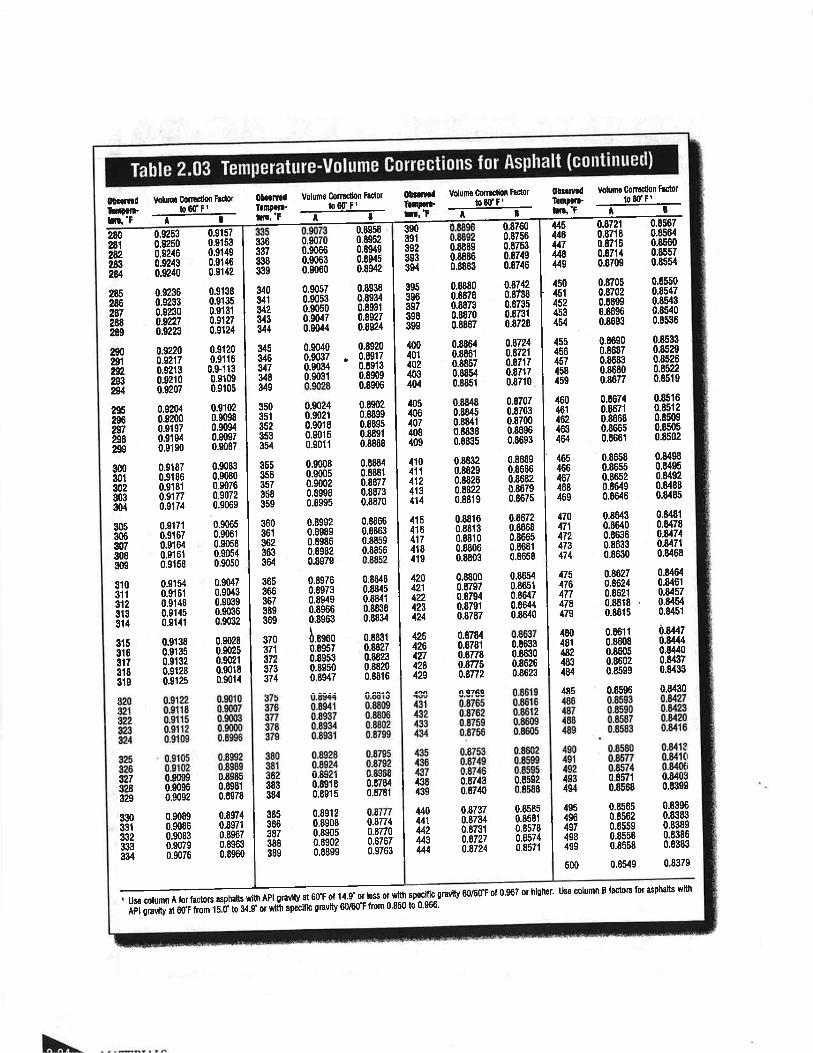
ODOT TM 322 Method of Test for ASPHALT CONCRETE PLANT CALIBRATION PROCEDURE FOR:
Hot Mix Asphalt Concrete (HMAC) and
Emulsified Asphalt Concrete (EAC) SCOPE This test method is established to specify procedures for calibrating the weighing and measuring devices used in the asphalt materials processing plant. Plant calibration is required in order to accept asphalt content, RAP content, liquid additives content, hydrated lime content, mineral filler content, or fiber content by meter reading as allowed or required in the specifications, special provisions, or by Contract Change Order. CALIBRATION PROCEDURE 1. General Perform the plant calibration procedures described herein for each weighing or
measuring device used to proportion each size of aggregate, asphalt cement, RAP, and any other liquid or dry additives used in the asphalt plant. Submit copies of appropriate forms fully documenting all readings, measurements, and calculations to the Engineer for review and approval prior to starting production.
In lieu of using the ODOT TM 322 procedures described herein, the Contractor may
submit in writing prior to start of production, accompanied by appropriate forms, an alternative procedure for plant calibration. If approved by the Engineer, the alternative plant calibration procedures may be used.
2. Scale Specifications Provide scales meeting the requirements of applicable specifications.
1 ODOT TM 322(03)
3. Asphalt Meter Calibration The asphalt meter can be checked by two methods: Alternate I: a. Weigh the delivery truck or trailer on the platform scales. b. Record the asphalt meter reading. c. Off-load the truck or trailer through the asphalt meter into the storage tank. d. Record the meter reading and determine quantity using the meter calibration
factor previously established by the contractor. e. Weigh the empty truck or trailer. f. Record the temperature of the delivered asphalt. g. Use the appropriate conversion factor to convert the delivered asphalt to
liters (gallons) if the meter measurement is in volume. h. Determine percent of error between weighed material and measured
material through meter. i. The asphalt meter result shall be within 0.5 percent for HMAC plants and 1.0
percent for EAC plants of the known liters or Mg (gallons or tons). If not, recalibrate the meter.
Alternate II: a. Weigh a container or tank truck such as an asphalt distributor truck capable
of holding a minimum of 4000 liters (1000 gallons). b. Record the plant asphalt meter reading. c. Pump a minimum of 4000 liters (1000 gallons) through the meter into the
container or truck. d. Record the plant asphalt meter reading (mass or volume). If the plant meters
measure volume, calculate the liters (gallons) delivered to the truck using the meter calibration factor previously established by the contractor.
e. Weigh the container or truck. f. Record the asphalt temperature.
2 ODOT TM 322(03)
g. Convert the gross weight of the asphalt to liters (gallons) if the meter
measurement is in volume. h. Compare the weighed material to the quantity delivered through the asphalt
meter. i. The asphalt meter result shall be within 0.5 percent for HMAC plants and 1.0
percent for EAC plants of the known liters or Mg(gallons or tons). If not, recalibrate the meter.
4. Virgin Aggregate Belt Scale Calibration Warm up the conveyor belt scale by operating for at least 30 minutes. Make a zero-
load check run of empty belt while operating. Alternate I: a. Empty all aggregate bins and conveyors. b. Weigh a minimum of 7 Mg (8 tons) of aggregate. c. Pass the weighed material over the recorded belt scale. d. Repeat this process twice:
For HMAC plants, perform the process once with the plant set at low Mg (tons) per hour production and once with the plant set at high Mg (tons) per hour production.
For EAC plants, set the plant at the planned production rate for both cycles.
e. Depending on the type of belt scale totalizer used, time the passage of the
material and multiply by the belt scale factor (Mg/hr)(tons/hr), or record the belt totalizer before and after passage of the material.
f. Compare the belt scale reading to the weight of material. g. The belt scale results shall be within 0.5 percent for HMAC plant and 1.0
percent for EAC plants of the known amount. If not, recalibrate the belt scale.
3 ODOT TM 322(03)
Alternate II: a. Record the belt scale totalizer reading. If there is no totalizer, begin timing
belt passage. b. For HMAC plants, operate the conveyor with aggregates: 1. 4 minutes at low Mg (tons) per hour production 2. 2 minutes at high Mg (tons) per hour production
c. For EAC plants, operate the conveyor with aggregates for 2 to 6 minutes at
the planned production rate (time is determined by how long it takes to fill one or more haul vehicles).
d. Divert this material into a truck or portable container. e. Determine gross weight of material on the platform scale. f. Depending on the type of belt scale totalizer used, stop timing the passage of
the material and multiply by the belt scale factor (Mg/hr) (tons/hr), or record the belt totalizer after passage of the material.
g. Compare the belt scale quantity to weighed quantity. The belt scale results
shall be within 0.5 percent for HMAC plants and 1.0 percent for EAC plants of the known amount. If not, recalibrate the belt scale.
5. RAP Belt Scale Calibration
Follow the procedure for the virgin aggregate belt scale calibration (Section 4). Compare the RAP belt scale quantity to weighed quantity. The belt scale results shall be within 0.5 percent of the known amount. If not, recalibrate the RAP belt scale.
6. Liquid Additives Calibration Follow the procedure for asphalt meter calibration (Section 3), only substitute an
appropriate sized container or liters (gallons) of additive for testing. The plant device results shall be within 0.5 percent of the known amount. If not,
recalibrate the meter.
4 ODOT TM 322(03)
7. Mineral Filler or Hydrated Lime Additive Follow the procedure for virgin aggregate belt scale calibration (Section 4), except
apply the procedure to the vane feeder, belt scale, or other metering device as appropriate, and weigh out a minimum of 45 kg (100 lb) of mineral filler or lime into an appropriate sized container .
The plant device results shall be within 0.5 percent of the known amount. If not,
recalibrate the device. 8. Fiber Additives
Calibrate the metering system for fiber additives according to the fiber additive equipment manufacturer’s recommendation. Provide documentation of the procedure to the Engineer.
5 ODOT TM 322(03)

THIS PAGE INTENTIONALLY LEFT BLANK
6 ODOT TM 322(03)
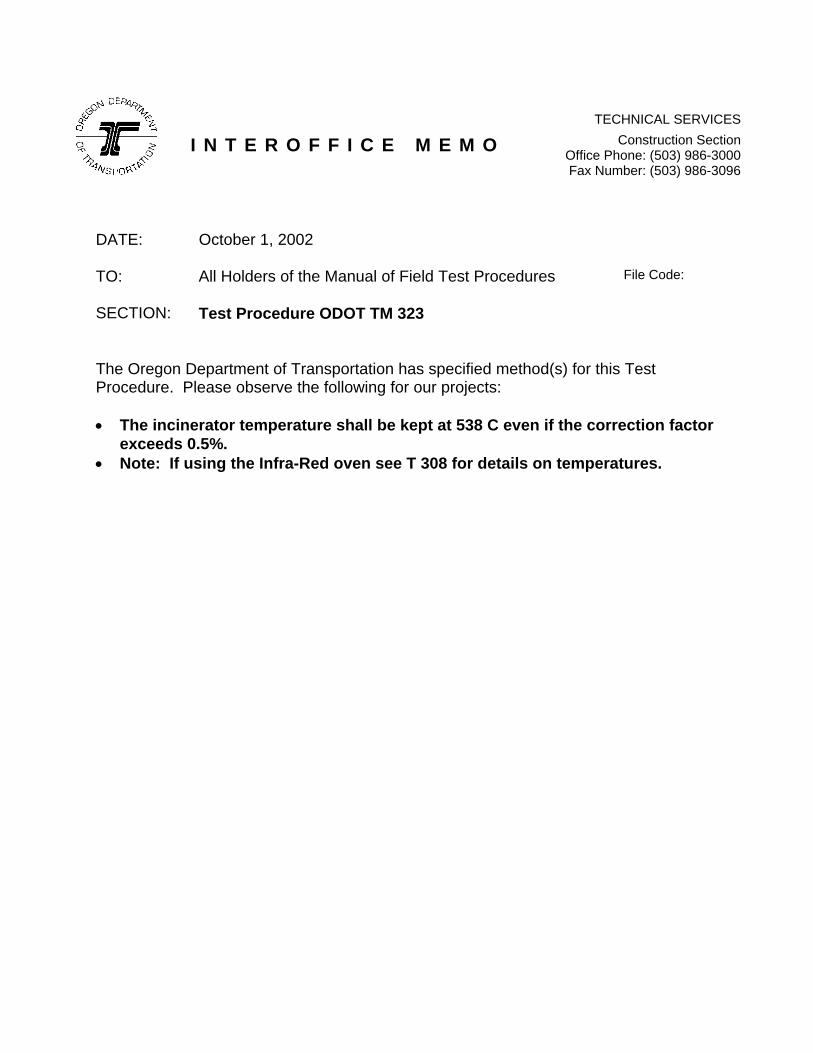
I N T E R O F F I C E M E M OTECHNICAL SERVICES
Construction Section Office Phone: (503) 986-3000 Fax Number: (503) 986-3096
DATE: October 1, 2002 TO: All Holders of the Manual of Field Test Procedures File Code: SECTION: Test Procedure ODOT TM 323
The Oregon Department of Transportation has specified method(s) for this Test Procedure. Please observe the following for our projects: • The incinerator temperature shall be kept at 538 C even if the correction factor
exceeds 0.5%. • Note: If using the Infra-Red oven see T 308 for details on temperatures.

ODOT TM 323
DETERMINATION OF CALIBRATION FACTORS For
DETERMINING THE ASPHALT BINDER CONTENT OF HOT MIX ASPHALT BY THE IGNITION METHOD
SCOPE This test method covers the determination of a Calibration Factor (CF) used in determining asphalt binder content of HMAC paving mixtures with or without RAP by the ignition method according to AASHTO T308. This test method also includes determination of gradation correction factors. The values stated in metric units are to be regarded as the standard. This method may involve hazardous materials, operations, and equipment. This method does not purport to address all of the safety problems associated with its use. It is the responsibility of whoever uses this method to consult and establish appropriate safety and health practices and determine the applicability of regulatory limitations prior to use. REFERENCED DOCUMENTS AASHTO T308 Determining the Asphalt Binder Content of Hot Mix Asphalt
(HMA) by the Ignition Method
AASHTO T30 Mechanical Analysis of Extracted Aggregate
ODOT Contractor Mix Design Guidelines for Asphalt Concrete SUMMARY OF TEST METHOD Four samples of HMAC with a known asphalt content and gradation are batched. The asphalt in two, possibly four of the samples is incinerated according to AASHTO T308 and the asphalt binder content is calculated. The difference between the known asphalt binder content and calculated asphalt binder content is determined for each sample. The average of the difference is the Calibration Factor (CF) applied to production tests according to AASHTO T308. The gradations of the incinerated samples are determined and compared with an unincinerated “blank” sample.
1 ODOT TM 322(03)
Establish a Calibration Factor (CF) for each JMF. This procedure must be performed for every ignition furnace on a project for each JMF before any acceptance or verification testing is completed. The laboratory which develops the JMF for a project will provide properly batched samples to each of the field QC and QA laboratories and to the ODOT Central Laboratory for use in calculating a Calibration Factor (CF) and gradation correction factors. An alternate laboratory may provide the required calibration samples if approved by the Engineer. A new calibration factor is required if the source or grade of the asphalt cement changes, if the source of RAP changes, if a different ignition furnace is used, or for a new JMF. A new calibration factor shall be determined for each JMF prior to its first use every calendar year. Calibration factors for a JMF shall be “transferred” from project to project during a calendar year, unless one of the above conditions applies.
APPARATUS Supply apparatus as required by AASHTO T308. Use the same ignition furnace for the calibration that will be used for production testing. CALIBRATION SAMPLE PREPARATION – NON RAP MIXTURES 1. Sample the aggregate, mineral filler, lime, fibers, and other appropriate additives
to be used for the calibration specimens from material designated for use on the project. Use the brand and grade of asphalt cement designated for the JMF.
2. Prepare five calibration mixture samples at the JMF asphalt binder content and
gradation and with the appropriate proportions of mineral filler, lime, fibers or any other additive. Batch the specimens according to standard industry procedures, modified as follows: • Batch each sample separately and according to the tolerances in Section 4. • Provide sample sizes meeting the requirements of AASHTO T308 • Mix and discard the first of the five samples. The purpose of this sample is to
“butter” the mixing bowl. • For the remaining four (or more) samples, tare the mixing bowl and weigh the
mixing bowl again after the mixture is removed from the bowl. The empty bowl must be within +/- 1 gram of the previous tare weight.
• Individually identify each calibration sample and supply documentation showing the actual weights of aggregate, asphalt cement, mineral filler, lime, fibers or any other additive for each sample and resultant actual calculated asphalt binder content for each sample. Also provide documentation for each sample verifying that the empty bowl weight after mixing is within ±1 gram of
ODOT TM 323(06) 2
the empty bowl weight prior to mixing. An example batch form is provided at the end of this procedure.
Note: Errors in batching or failure to take great care in ensuring that all sample material is removed from the mixing bowl can result in significant errors in the Calibration Factor.
These errors can affect the statistical pay factor for the Contractor and the quantity of asphalt binder the Agency pays for. Every effort should be taken to ensure that batching and mixing errors are minimized. The amount of lime in a calibration sample can substantially effect the calibration factor, so extra care shall be taken to ensure the proper amount is batched.
3. An additional “blank” specimen with the same gradation, but with no asphalt shall
be batched. This “blank” sample will be used to establish correction factors for the aggregate gradations. The “blank” sample is not burned.
4. Batch the “blank sample” according to the JMF target values and within the
following tolerances:
Sieve Size Allowable Difference
Larger than 2.36 mm (No. 8) ±3.0% Size 2.36 mm (No. 8) ±2.0% Larger than 75 μm (No. 200) and smaller than 2.36 mm (No. 8) ±1.0% Size 75 μm (No. 200) and smaller ±0.5%
CALIBRATION SAMPLE PREPARATION - RAP MIXTURES
If allowed by the Engineer, the percentage of asphalt binder in RAP (Pbr) and RAP gradation may be determined by an alternative method. If an alternative method is allowed, skip to No. 7. 1. Sample the aggregate, RAP, mineral filler, lime, fibers, and other appropriate
additives to be used for the calibration specimens from material designated for use on the project. Use the brand and grade of asphalt cement designated for the JMF.
2. Test a minimum of five 100% RAP samples. Batch the samples according to standard industry practices with a sample size appropriate for AASHTO T308. Note that for infra red furnaces, the higher set temperature “burn profile” may be necessary to provide complete combustion of the sample.
ODOT TM 323(06) 3
3. Test each sample of 100% RAP according to AASHTO T308 Method A or Method B (with a 60 minute burn time) to determine the binder content of each.
4. Determine the average total percent loss of the five samples. Subtract 0.5%
from the average total percent loss. 0.5% will be the standard Calibration Factor for 100% RAP material by definition, since it is difficult and time consuming to determine the mix calibration factor for 100% RAP. See the Calculations section below for example calculations.
5. The value determined in No. 4 will be considered the percentage of asphalt
binder in the RAP (Pbr).
6. Perform sieve analysis on the incinerated RAP samples according to AASHTO T30. Average the five gradations. This average gradation will be considered the gradation for the 100% RAP material.
7. Prepare five calibration mixture samples at the JMF asphalt binder content and
gradation with the appropriate proportions of RAP, mineral filler, lime, fibers or any other additive. Batch the specimens according to standard industry procedures, modified as given below. The actual asphalt binder content used to calculate the Calibration Factor will be a combination of Pbr and the virgin asphalt binder added. • Batch each sample separately. The batching of the virgin aggregate shall
meet the tolerances outlined in No. 4 of the previous section. • Provide sample sizes meeting the requirements of AASHTO T308 • Mix and discard the first of the five samples. The purpose of this sample is to
“butter” the mixing bowl. • For the remaining four (or more) samples, tare the mixing bowl and weigh the
mixing bowl again after the mixture is removed from the bowl. The empty bowl must be within ±1 gram of the previous tare weight.
• Individually identify each calibration sample and supply documentation showing the actual weights of aggregate, RAP, asphalt cement, mineral filler, lime, fibers or any other additive for each sample and resultant actual calculated asphalt binder content for each sample. Also provide documentation for each sample verifying that the empty bowl weight after mixing is within ±1 gram of the empty bowl weight prior to mixing. An example batch form is provided at the end of this procedure.
Note: Errors in batching or failure to take great care in ensuring that all sample material is removed from the mixing bowl can result in significant errors in the Calibration Factor. These errors can effect the statistical pay factor for the Contractor and the quantity of asphalt binder the Agency pays for. Every effort should be taken to ensure that batching and mixing errors are minimized. The amount of lime in a
ODOT TM 323(06) 4
calibration sample can substantially affect the calibration factor, so extra care shall be taken to ensure the proper amount is batched.
8. For the “blank” sample, virgin aggregate (including mineral filler, lime, fibers or
any other additive) and RAP material in the proper proportions will be provided separately. The virgin aggregate shall be batched within the tolerances of No 4 of the previous section. Incinerate the RAP material provided for the “blank” sample according to AASHTO T308 Method A or Method B (with a 60-minute burn time). Gradations for the residual aggregate from the RAP and the virgin aggregate (including mineral filler, lime, fibers or any other additive) may be determined separately according to AASHTO T 30 and combined mathematically or the residual aggregate from the RAP and the virgin aggregate (including mineral filler, lime, fibers or any other additive) may be combined and the gradation determined according to AASHTO T 30.
CALIBRATION PROCEDURE (RAP and NON-RAP MIXTURES) 1. Freshly mixed samples may be tested immediately. Cooled calibration samples
must be preheated to 171 ±5°C(C (340 ±9°F) for 120 ±5 minutes to remove moisture.
2. Test two of the samples according to AASHTO T308 Method A or Method B (with
a 60 minute burn time) to determine the binder content of each. The method used for calibration must be used for production testing.
3. If the difference between the binder contents of the two samples exceeds 0.15
percent, perform two additional tests and, from the four tests, discard the high and low result. Determine the Calibration Factor from the two original or remaining results, as appropriate. Calculate the difference between the actual and measured binder contents for each sample.
The Calibration Factor (CF) is the average of the differences expressed in percent by mass of the HMAC mix. See the Calculations section below for example calculations.
4. Perform sieve analysis for the two incinerated aggregate samples used to
calculate the Calibration Factor according to AASHTO T30. Average the two results. Perform sieve analysis for the “blank” sample according to AASHTO T30.
5. Determine the difference in gradation between the “blank” sample and the
average of the two incinerated calibration samples. The gradation correction factor for each sieve size is the difference between the result from the “blank” sample and the average of the two incinerated calibration samples to the nearest 0.1%. See Section 8 for example calculations.
ODOT TM 323(06) 5
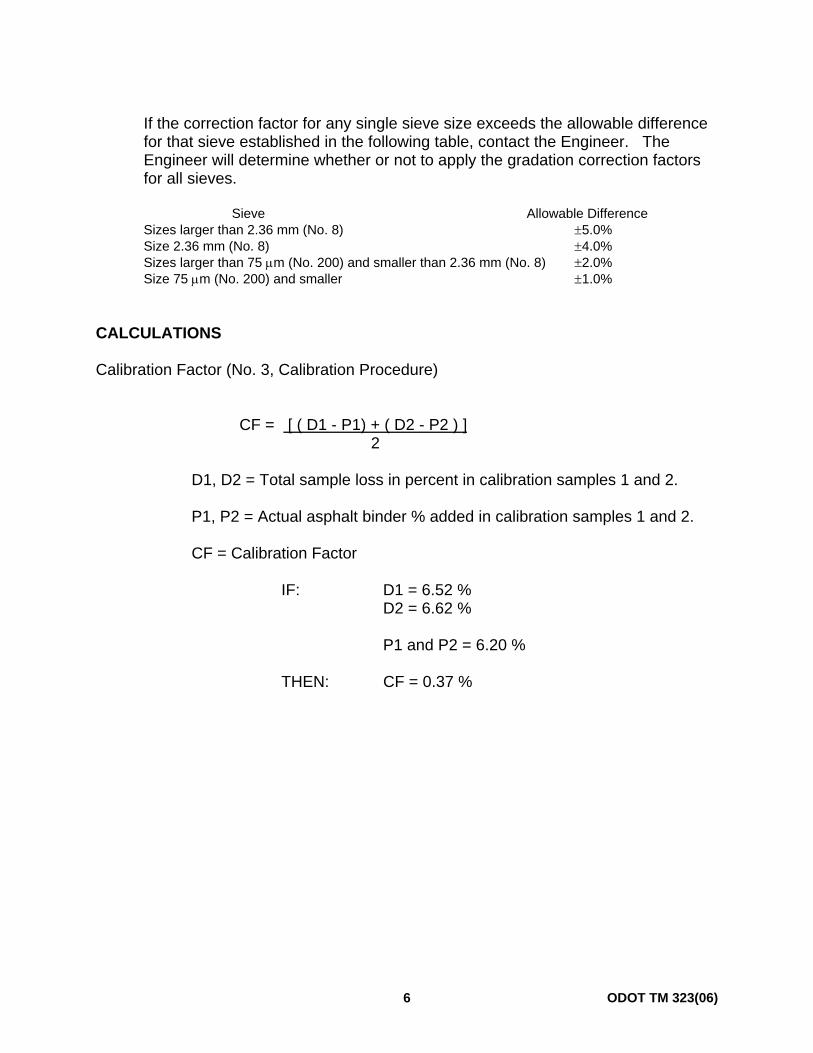
If the correction factor for any single sieve size exceeds the allowable difference for that sieve established in the following table, contact the Engineer. The Engineer will determine whether or not to apply the gradation correction factors for all sieves.
Sieve Allowable Difference Sizes larger than 2.36 mm (No. 8) ±5.0% Size 2.36 mm (No. 8) ±4.0% Sizes larger than 75 μm (No. 200) and smaller than 2.36 mm (No. 8) ±2.0% Size 75 μm (No. 200) and smaller ±1.0%
CALCULATIONS
Calibration Factor (No. 3, Calibration Procedure)
CF = [ ( D1 - P1) + ( D2 - P2 ) ] 2 D1, D2 = Total sample loss in percent in calibration samples 1 and 2.
P1, P2 = Actual asphalt binder % added in calibration samples 1 and 2.
CF = Calibration Factor
IF: D1 = 6.52 % D2 = 6.62 % P1 and P2 = 6.20 % THEN: CF = 0.37 %
ODOT TM 323(06) 6
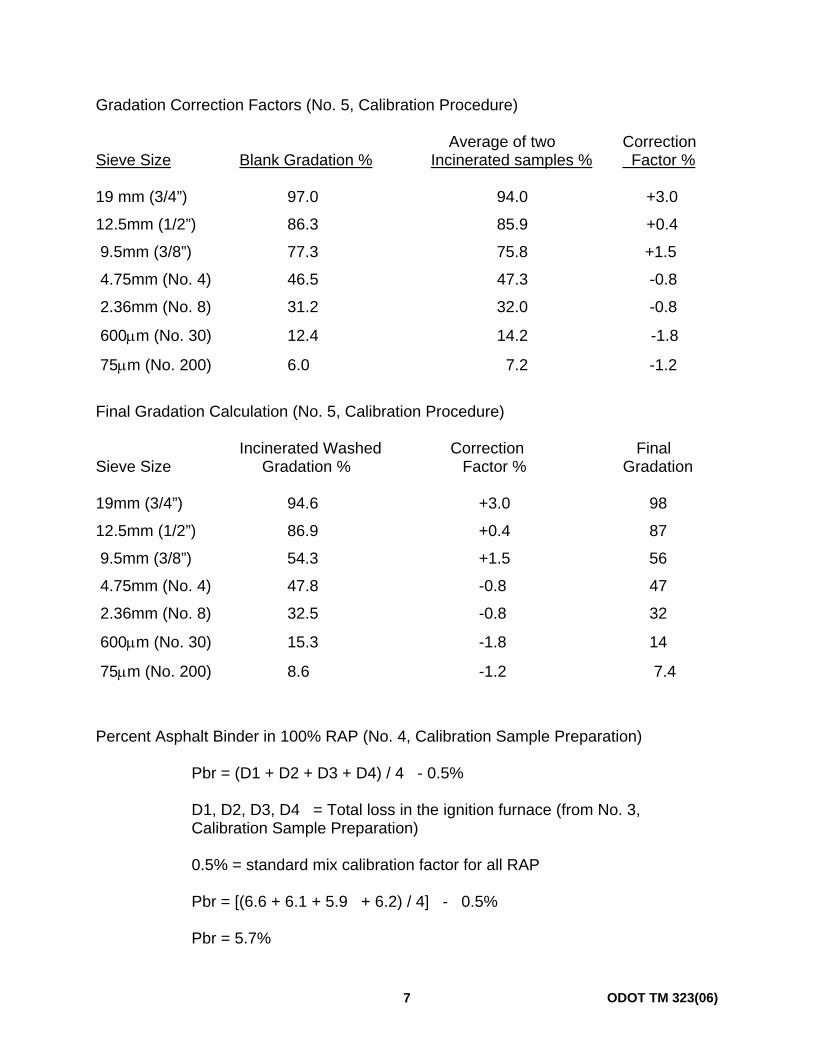
Gradation Correction Factors (No. 5, Calibration Procedure) Average of two Correction Sieve Size Blank Gradation % Incinerated samples % Factor %
19 mm (3/4”) 97.0 94.0 +3.0
12.5mm (1/2”) 86.3 85.9 +0.4
9.5mm (3/8”) 77.3 75.8 +1.5
4.75mm (No. 4) 46.5 47.3 -0.8
2.36mm (No. 8) 31.2 32.0 -0.8
600μm (No. 30) 12.4 14.2 -1.8
75μm (No. 200) 6.0 7.2 -1.2
Final Gradation Calculation (No. 5, Calibration Procedure) Incinerated Washed Correction Final Sieve Size Gradation % Factor % Gradation
19mm (3/4”) 94.6 +3.0 98
12.5mm (1/2”) 86.9 +0.4 87
9.5mm (3/8”) 54.3 +1.5 56
4.75mm (No. 4) 47.8 -0.8 47
2.36mm (No. 8) 32.5 -0.8 32
600μm (No. 30) 15.3 -1.8 14
75μm (No. 200) 8.6 -1.2 7.4
Percent Asphalt Binder in 100% RAP (No. 4, Calibration Sample Preparation)
Pbr = (D1 + D2 + D3 + D4) / 4 - 0.5%
D1, D2, D3, D4 = Total loss in the ignition furnace (from No. 3, Calibration Sample Preparation)
0.5% = standard mix calibration factor for all RAP Pbr = [(6.6 + 6.1 + 5.9 + 6.2) / 4] - 0.5% Pbr = 5.7%
ODOT TM 323(06) 7

THIS PAGE INTENTIONALLY LEFT BLANK
ODOT TM 323(06) 8
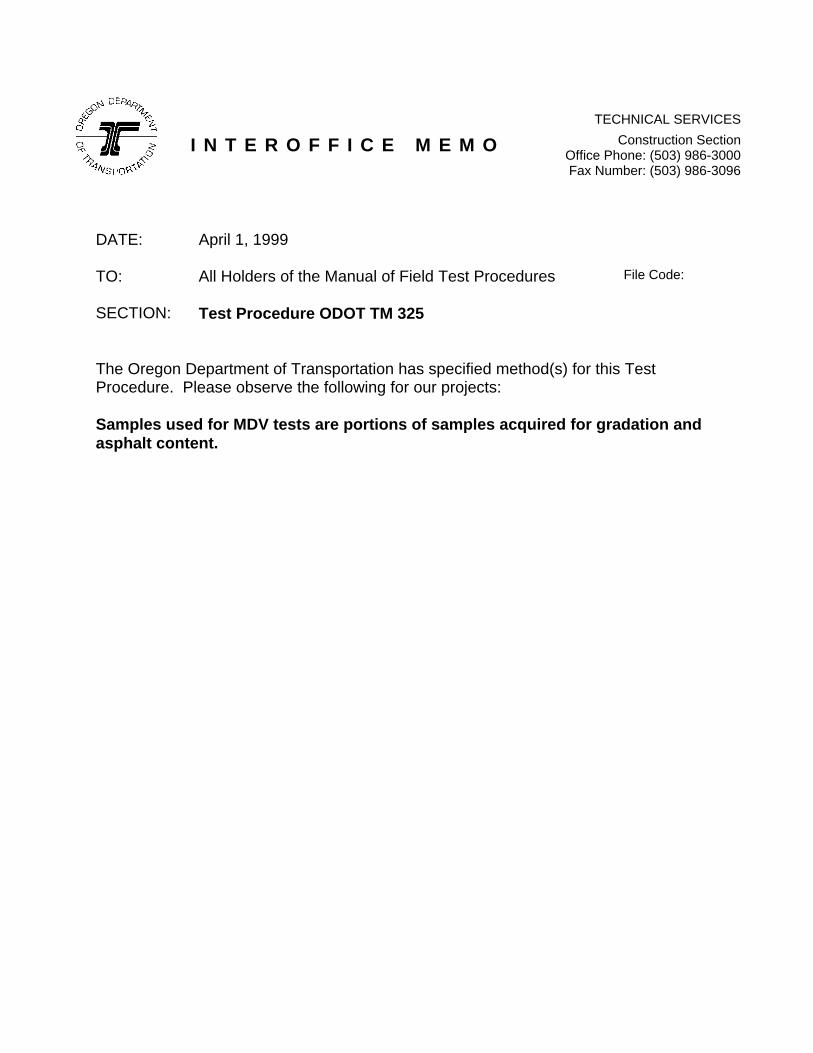
I N T E R O F F I C E M E M OTECHNICAL SERVICES
Construction Section Office Phone: (503) 986-3000 Fax Number: (503) 986-3096
DATE: April 1, 1999 TO: All Holders of the Manual of Field Test Procedures File Code: SECTION: Test Procedure ODOT TM 325
The Oregon Department of Transportation has specified method(s) for this Test Procedure. Please observe the following for our projects: Samples used for MDV tests are portions of samples acquired for gradation and asphalt content.

ODOT TM 325
Method of Test for
PREPARATION OF FIELD COMPACTED MARSHALL SPECIMENS CALIBRATION OF FIELD MARSHALL HAMMERS
DETERMINATION OF AVERAGE Gmb FOR HMAC VOLUMETRIC CALCULATIONS
SCOPE This method covers preparation of field compacted Marshall specimens. This method is for use with mixtures containing asphalt cement and aggregate up to 25.4mm (1 in) maximum size.
AASHTO T 245-94, AASHTO T 168, and AASHTO T 166 procedures will be referenced as noted. SIGNIFICANCE AND USE Marshall specimens are used to measure the Bulk Specific Gravity (Gmb) of a compacted AC mixture. The Gmb is used to calculate the volumetric properties of a compacted AC mixture. APPARATUS 1. Specimen Mold Assembly - Mold cylinders 101.6mm (4 in) in diameter by 76.2mm
(3 in.) in height, base plates, and extension collars shall conform to the details shown in Figure 1 of AASHTO T 245-94. Six mold cylinders are recommended.
2. Specimen Extractor - A steel disk, not less than 100mm (3.95 in) and 13mm (1/2
in) thick attached to a hydraulic jack and holder (or other equipment approved by the Engineer which will not damage the sample) will be used to extrude the sample.
3. Compaction Hammer - The compaction hammer shall have a flat, circular tamping
face and a 4536 ± 9 g (10 ±0.02 lb) sliding weight with a free fall of 457.2 ±1.524mm (18 ±0.06 in). Details for the hammer shall conform to Figure 2 of AASHTO T 245-94.
A mechanically operated hammer may be used provided it has been properly calibrated to the hammer used to develop the JMF, as per the Calibration of the Marshall Hammer section of this test method.
1 ODOT TM 325(03)
A guide device used to hold a hand hammer vertical will not be allowed. Locate the compaction hammer (and pedestal) in an enclosed location which is sheltered from wind and other weather elements.
4. Compaction Pedestal - The compaction pedestal shall consist of a 203.2 by 203.2
by 457.2mm (8 by 8 by 18 in) wooden post capped with a 304.8 by 304.8 by 25.4mm (12 by 12 by 1 in) steel plate. The wooden post shall be oak, pine, or other wood having an average dry weight of 0.67 to 0.77 g/cc (42 to 48 pcf). The wooden post shall be secured by four angle brackets to a solid concrete slab. The steel cap shall be firmly fastened to the post. The pedestal assembly shall be installed so that the post is plumb and the cap is level.
5. Concrete Slab - The hammer pedestal shall be bolted to a concrete slab weighing
approximately 90 kg (100 lb) with minimum dimensions of 300 by 600 by 200mm (12 by 24 by 8 in), which shall be placed on the ground. If mounted on a trailer floor, it shall be further supported by a load transfer device, between the underside of the floor and the ground, which is acceptable to the Engineer.
6. Specimen Mold Holder - A specimen mold holder shall be mounted on the
compaction pedestal so as to center the compaction mold over the center of the post. It shall hold the compaction mold, collar, and base plate securely in place during compaction of the specimen.
7. Ovens and Hot Plates - Provide an oven capable of heating the AC mixture,
compaction molds, and other equipment to the required temperatures. Provide a hot plate, hot sand bath, or other suitable device for heating the compaction hammer to the required temperature.
8. Thermometers - Provide thermometers with a range from 9.9 to 204ºC (50 to
400°F) with a sensitivity of 2.8ºC (5°F) required. 9. Balance or Scale - Provide a balance or scale capable of at least 2 kg sensitive to
0.1 g. 10. Containers - Provide gill-type tins or other metal containers for heating the AC
mixture. 11. Gloves - Provide gloves for handling hot equipment. 12. Misc. Tools - Provide steel spatulas, spoons, scoops, etc. for spading and handling
the AC mixture and marking crayons for identifying samples. Some kind of funnel for transferring AC mixture from containers into molds is also suggested.
ODOT TM 325(03) 2
PROCEDURE
1. At least one hour prior to compacting Marshall specimens, place all specimen mold assemblies (mold, extension collar, and base plate), sample tins, scoop/spoons, and spatula in a 160 ± 10ºC (320 ± 20°F) oven. Butter the sample tins prior to placing in the oven. Heat the hammer foot on a hot plate, hot sand bath, or other approved device to a temperature of 95 to 150ºC (200 to 300°F).
2. Obtain a 5000 g sample of AC mixture from a bituminous mixture sample obtained
as per AASHTO T 168. (Note: This sample is in addition to mix required for other quality control testing)
3. Quarter the sample per AASHTO T248 (or WAQTC TM 5 if required by the
Agency)to obtain four specimens. 4. Weigh approximately 1200 ± g into a buttered sample tin, cover and place in oven.
Repeat for the additional three tins of mixture. The goal is to end up with a compacted sample which is 63.5 ± 2.5mm (2.5 ±0.1 in) thick. Compacted samples outside the thickness tolerance will be discarded. 1200 g should be close for combined aggregate bulk specific gravities (Gsb) between 2.600 and 2.700. Adjustments to the 1200 g sample weight for aggregate Gsb’s outside this range will need to be made. The combined aggregate specific gravity (Gsb) may be found on the JMF. Adjust the specimen weights for future tests as necessary to obtain the desired thickness based on resultant thickness from the current test.
Note: Another potential source for an initial weight to obtain the required thickness will be from the calibration samples which will be compacted before the project begins. (See the Calibration of the Marshall Hammer section). The technician may also consider fabricating trial samples during production prior to a required random QC sample to determine the appropriate mass to obtain the desired thickness.
4.1 Oven Temperature - The temperature of the oven should be set such that the
samples, when compacted, reach a temperature within the “Placement Temperature” range given on the project JMF.
Note: Maintaining required mix temperature is of critical importance in preparing Marshall specimens. Every effort should be made during the procedure to minimize heat loss to the sample and to maintain the required minimum temperature. Loss of heat may result in significant additional time required to heat the sample to proper temperature. Variability in compaction temperatures between specimens can result in unacceptable variability in Gmb test results.
4.2 Mixture Aging (to allow for asphalt absorption and control compaction
temperature)–Bring the four samples to the “Placement Temperature” range by
ODOT TM 325(03) 3
uniform heating in an oven. The samples shall be aged for a time period such that they are ready to compact approximately one hour from the time they are sampled. A sample to be tested for maximum specific gravity (Gmm) according to AASHTO T209 should be aged for the same period of time.
5. After the aging time to reach the one hour criteria has expired, check the
temperature of the material in a tin. If it is within the “Placement Temperature” range, proceed with remaining steps. If it is too cool, continue heating to get the required temperature. Specimens must be compacted within three hours of sampling or they will be discarded.
6. Place a paper disk in the bottom of a heated specimen mold assembly (base plate,
specimen mold, & extension collar). Place a funnel, or other device, on top of the mold to minimize loss of material outside of the mold assembly. Introduce one full tin of mixture into the mold, scraping the tin to get loose particles into the sample. Remove funnel.
7. Spade the mixture vigorously with a heated spatula 15 times around the perimeter
and 10 times over the interior of the sample. If the spading process creates a segregated sample, reduce the effort applied to the spatula. Smooth the surface of the mixture to a slightly mounded shape. Place a paper disk on top of the mixture.
8. Measure the temperature of the mixture in the mold. If it is within the required
temperature range, compact immediately. If too hot, allow sufficient time to cool to the required temperature range. Do not allow the thermometer to touch the mold. Document the temperature at which each specimen is compacted.
9. Place the mold assembly on the compaction pedestal in the mold holder and apply
the number of blows required by the JMF with a free fall of 457.2mm (18 in) at a rate of about one blow per second for a hand hammer. During compaction, the operator shall hold the axis of the compaction hammer by hand as nearly perpendicular to the base of the mold assembly as possible.
10. Remove the base plate and collar, reverse the mold, and re-assemble the mold
assembly. Apply the same number of compaction blows to the opposite face of the specimen.
11. After compaction is complete, remove the extension collar, base plate, and paper
disks and place the mold with the compacted mixture on its side and cool at room temperature or in front of a cooling fan for a minimum of 20 minutes or until it can be handled comfortably without gloves (whichever is longer). It is important to remove the paper disks as soon as possible because removal is very difficult after the specimens have cooled.
ODOT TM 325(03) 4
12. After cooling, put the extension collar on the forming mold and extrude the specimen using a hydraulic jack and holder (or other approved equipment). Pounding out the specimen with the Marshall hammer will not be allowed.
13. Smooth rough edges with spatula, place flat side down on a smooth and level
surface, properly identify, and cool to room temperature. DETERMINATION OF AVERAGE Gmb FOR SUBLOT OR HCF Determine the Gmb for each of the four (or six if a hammer calibration) compacted specimens according to AASHTO T 166. Determine the average Gmb for the four (or six if a hammer calibration) specimens. If one or more of the individual specimen Gmb deviates by more than ±0.015 from the average, discard the individual Gmb that deviates the most first, and recompute the average based on the remaining three (or five if a hammer calibration) specimens. If the Gmb of one of the remaining three specimens deviates by more than ±0.015 from the average, then the entire set of results are considered suspect and a new set of specimens must be made. (For a hammer calibration, an additional sample may be discarded. A minimum of four of the original six samples is required for a valid hammer calibration.) Multiply the average Gmb value for each sublot by the Hammer Calibration Factor (HCF) and Reheat Correction Factor (RCF) determined according to the Calibration of the Marshall Hammer and the Reheat Correction Factor sections of this test method. Calculate the “Corrected” Gmb for each sublot as follows:
Corrected Gmb = Average Gmb x HCF x RCF
HMAC volumetric calculations for each MDV test should be completed using the “Corrected” Gmb. CALIBRATION OF THE MARSHALL HAMMER Marshall hammers in QC and QA field laboratories shall be calibrated to the compactor used to develop the mixture design. A new calibration will be required if a field hammer location is changed.
Recalibrate the hammer for each QC and QA laboratory location when there is a continued bias in the data.
1. Obtain samples for calibration of the QC and QA field hammers from the mixture
design laboratory. Sufficient material for six specimens will be required. Each calibration sample will be batched at the JMF target gradation and asphalt content.
ODOT TM 325(03) 5
2. Prepare six specimens with each field hammer. Compute the average bulk specific gravity (Gmb) for each field hammer according to the Determination of Average Gmb for Sublot or HCF section of this test method. A minimum of four samples for each hammer are required for a valid calibration. If the average field Gmb is within 0.005 of the design Gmb, a hammer calibration factor need not be used. A new hammer calibration may be required if the average field Gmb differs from the design Gmb by more than 0.030. Notify the Agency and initiate an investigation for determining the reason for the large variance.
3. Calculate the hammer calibration factor (HCF) using the following equation.
(Calculate to five decimal places) HCF = Design Hammer Gmb Average Field Hammer Gmb
The Design Hammer Gmb (from Marshall, Hveem, or SHRP Gyratory) will be reported on the JMF.
REHEAT CORRECTION FACTOR
If QA samples are being transported to a different location, reheated, and then compacted, the Engineer may request that the QC laboratory develop a Reheat Correction Factor (RCF) in an attempt to resolve potential differences in test results between the QC and QA laboratories. The RCF may then be applied to any samples that are allowed to cool to ambient temperature and then reheated.
1. The Engineer will designate a retained sample to be tested. 2. Cool the sample to ambient air temperature, and leave overnight. 3. Heat the sample in a 110ºC oven for two hours, quarter for testing, and prepare
four samples according to the Procedure section of this test method. 4. Compute the average bulk specific gravity (Gmb) according to Determination of
Average Gmb for Sublot or HCF section of this test method. A minimum of three samples are required for a valid calibration. If the “reheated” Gmb is within 0.005 of the “unreheated” Gmb, a RCF need not be used.
5. Calculate the reheat correction factor (RCF) using the following equation.
(Calculate to three decimal places) RCF = Average “unreheated” Gmb Average “reheated” Gmb
ODOT TM 325(03) 6
ODOT TM 326
Method of Test for
PREPARATION OF FIELD COMPACTED GYRATORY SPECIMENS DETERMINATION OF AVERAGE Gmb FOR
HMAC VOLUMETRIC CALCULATIONS
SCOPE This method covers preparation of field compacted specimens using the Superpave™ gyratory compactor. This method conforms, in general, to AASHTO T 312 supplemented herein to conform to Oregon Quality Assurance program standard practices.
AASHTO T 312 is presented in Appendix A of this procedure. SIGNIFICANCE AND USE Gyratory specimens are used to measure the Bulk Specific Gravity (Gmb) of a compacted HMAC mixture. The Gmb is used to calculate the volumetric properties of a compacted HMAC mixture. APPARATUS Provide apparatus meeting the requirements of Section 4 of AASHTO T 312. In addition, provide the following:
1. Containers – Provide shallow, flat metal pans large enough to accommodate a
5,000 gram sample for evenly heating the HMAC mixture. 2. Thermometers – Thermometers must be capable of reading to the nearest 2°C
(2°F) or finer. 3. Funnel - A funnel or other device for transferring AC mixture from containers into
molds is suggested. The device must not cause segregated specimens. 4. Oven – Forced air, ventilated, or convection oven capable of maintaining the
temperature surrounding the sample at 163 ±5°C (325 ±9°F).
ODOT TM 326(03) 1
STANDARDIZATION Standardize the gyratory compactor according to Section 6 of AASHTO T 312.
Verify calibration of the ram pressure, angle of gyration, gyration frequency, and specimen height measurement system using procedures and at frequencies recommended by the manufacturer. Provide a log book with each compactor documenting calibrations and calibration checks performed and make it available for review by Agency representatives. The log book shall contain the brand, model, and serial number of the compactor. As a minimum, the log book shall also include the types of calibration checks performed, results of the checks, actions taken to correct problems, date performed, and the name of the technician performing the procedures. The load cell provided by the manufacturer for standardization must be checked on an annual basis with a traceable device according to the ODOT Laboratory Certification Program. The angle of gyration shall be based on external measurements and the calibration verified according to the manufacturer’s recommendations. . Note: ODOT will be initiating a process for calibrating the angle of gyration based on internal measurements according to AASHTO PP48 in the near future. PREPARATION OF APPARATUS Prepare apparatus for use according to Section 7 of AASHTO T 312 modified as necessary per the manufacturer’s recommendations. Specimen height must be recorded according to the requirements of Section 4.1.1 of AASHTO T 312.
The number of gyrations required (Ndesign) will be provided on the Job Mix Formula (JMF). TEST PROCEDURE
1. At least one hour prior to compacting specimens, place all specimen mold
assemblies, sample container, scoop/spoons, etc. in an oven and heat to within the placement temperature range given on the JMF.
2. Two gyratory specimens are required per Mix Design Verification test. Obtain a
10000 g sample (enough to make 2 specimens) of HMAC mixture from a bituminous mixture sample obtained per AASHTO T 168. (Note: This sample is in addition to mix required for other quality control testing)
The sample size for each specimen must be sufficient to produce compacted specimens with a final height between 110 mm and 120 mm. Specimens with heights outside this range will be discarded and not used for volumetric
ODOT TM 326(03) 2
calculations. The sample size may be given on the JMF. If not, the sample size may be estimated by the following:
Sample Size (grams) = Gmb x 2026 1.03
Where: Gmb = bulk specific gravity at the JMF targets given on the JMF
3. Reduce the sample according to WAQTC TM 5to obtain the desired specimen sample sizes.
4. Weigh the appropriate sample size into a shallow, flat, metal container and place in
oven. Repeat for the second specimen.
4.1 Oven Temperature - The temperature of the oven should be set such that the samples, when compacted, reach a temperature within the “Placement Temperature” range given on the project JMF.
Note: Maintaining required mix temperature is of critical importance in preparing gyratory specimens. Every effort should be made during the procedure to minimize heat loss to the sample and to maintain the required minimum temperature. Loss of heat may result in significant additional time required to heat the sample to proper temperature. Variability in compaction temperatures between specimens can result in unacceptable variability in Gmb test results.
4.2 Mixture Aging (to allow for asphalt absorption and to heat to compaction
temperature) – Bring the two samples to the “Placement Temperature” range by uniform heating in an oven. The samples should be aged for a time period such that they are ready to compact approximately 1 hour from the time they are sampled. A sample to be tested for maximum specific gravity (Gmm) according to AASHTO T209 should be aged for the same period of time, unless altered per the yellow sheet provisions of AASHTO T209. The aging time may be increased or decreased to better reflect the actual HMAC storage time and haul time if approved by the Engineer.
5. After the aging time to reach the 1 hour criteria has expired, check the temperature
of the material at several locations in the container. If it is within the “Placement Temperature” range, proceed with remaining steps. If it is too cool, continue heating to get the required temperature. Samples must be compacted within 3 hours of sampling or they will be discarded.
Note: Temperature differences within a sample can cause variable results. Select containers that will evenly heat the material to minimize temperature variability within a sample.
ODOT TM 326(03) 3
6. Load each sample into a mold and recheck the temperature of the mix in the center of the mold to ensure that is in the proper range. Take care not to segregate the samples when loading material into the mold. Compact with Ndesign gyrations according to Section 9 of AASHTO T 312. Take care not to deform the specimen when extruding the sample and removing it from the compactor.
Note: It may be necessary to partially extrude the specimen from the mold and allow it to cool for a few minutes prior to removing the it from the mold. Some mixes may deform or fall apart, especially at lower gyrations, if removed too hot resulting in erroneous measurements.
7. Place flat side down on a smooth and level surface, properly identify, and cool until
the specimen reaches room temperature. 8. Determine the bulk specific gravity of each specimen according to AASHTO T166. REPORTING For each MDV test performed with a gyratory compactor, provide the following to the Agency:
• The specimen height for each compacted specimen. • The time at which each sample was obtained and compacted. • Provide Gmb calculations for each sample. • Calculate the average of the two sample Gmb’s. The average will be used for
volumetric calculations. • Volumetric calculations on a form approved by the Agency.
PROCEDURE FOR PRODUCTION VERIFICATION (QA) SAMPLES This section covers procedures required for gyratory compaction of verification samples split and performed by the Contractor QC lab and Agency QA lab. The Contractor and Agency will perform ODOT TM 326 and the process described in this section for all verification samples obtained during the time Mix Design Verification (MDV) testing is being performed. Differences of ±0.020 or more between QC and QA laboratory AASHTO T166 average Gmb’s on a split sample should be investigated as it is anticipated that the results between compactors should be within this range. Contact the ODOT Region QAC or ODOT Pavement Quality Engineer for troubleshooting assistance. 1. Perform applicable portions of Sections 4, 5, and 6 of this procedure, supplemented
as follows:
ODOT TM 326(03) 4
1.1 Obtain sufficient material such that each laboratory can compact two specimens.
1.2 Reduce samples to the appropriate mass and place in containers immediately after sampling.
1.3 Allow each sample to cool to ambient temperature for a minimum of 12 hours. An
alternative procedure for curing and compacting the samples will be allowed if agreed upon by the Contractor and the Region Quality Assurance Coordinator.
1.4 Heat the specimens to the appropriate temperature for compaction. Each
specimen shall be in the oven no longer than 4 hours (3 hours if not reheated). Try to stagger the samples so they each spend approximately the same amount of time in the oven. Cure an AASHTO T209 sample in the oven the same length of time as the gyratory specimens.
2. Provide documentation to the Agency according to the Reporting section of this
procedure.
ODOT TM 326(03) 5

THIS PAGE INTENTIONALLY LEFT BLANK
ODOT TM 326(03) 6

APPENDIX A
AASHTO T 312
ODOT TM 326(03) 7

ODOT TM 326(03) 8
Preparing and Determining the Density of Hot-Mix Asphalt (HMA) Specimens by Means of the Superpave Gyratory
Compactor
AASHTO Designation: T 312-04 AASHTO TEST METHODS CANNOT BE INCLUDED ON ODOT’S WEBSITE DUE TO COPYRIGHT INFRINGEMENT. TO GET COPIES OF THE TEST METHODS, YOU CAN ORDER A HARD COPY OF ODOT’S MANUAL OF FIELD TEST PROCEDURES OR YOU CAN ORDER THE LATEST STANDARD SPECIFICATIONS FOR TRANSPORTATION MATERIALS AND METHODS OF SAMPLING AND TESTING FROM AASHTO. ORDERING INSTRUCTIONS ARE GIVEN BELOW: To order ODOT’s Manual of Field Test Procedures, use the following web address: http://www.odot.state.or.us/ffp/cs/opo/contractor_plans/ManualSubmitOrder.htm To order AASHTO’s Standard Specifications for Transportation Materials and Methods of Sampling and Testing, use the following web address: https://bookstore.transportation.org/
ODOT TM 326(03) 9

THIS PAGE INTENTIONALLY LEFT BLANK
ODOT TM 326(03) 10
ODOT TM 327
Method of Test for
CORRELATION OF NUCLEAR GAUGE READINGS WITH PAVEMENT CORES
SCOPE This method covers the correlation of nuclear gauge readings with corresponding 150mm ±6mm. (6 ±0.25 in) diameter cores removed from the roadway. The nuclear gauge readings are compared with the cores removed from the roadway and a correlation is established for future density testing. SIGNIFICANCE AND USE The Bulk Specific Gravity (Gmb) of the core is determined according to AASHTO T-166 and compared with the nuclear gauge readings. Since the Bulk Specific Gravity (Gmb) of the core is a physical measurement, it is considered a more accurate means of determining the density of the in-place HMAC. Taking a ratio of the core value’s to the corresponding gauge value’s a correlation can be established. With the correlation, all gauge readings will be adjusted to match the in-place density based on the cores. The core correlation is gauge specific and must be obtained before traffic is allowed on the pavement. (Note: All gauges that will be used on the project should be correlated to the core locations prior to removal). APPARATUS 1. Core Removal Equipment – Pavement test specimens shall be removed with a core
drill. 2. Core Bit – The core bit shall have an inside diameter of 150mm ±6mm. (6 ±0.25 in) 3. Separation Equipment – Cores shall be separated with a saw that provides a clean
smooth plane representing the layer to be measured.
STANDARDIZATION AND CALIBRATION Ensure the gauge meets the calibration or verification of calibration according to the requirements of ODOT TM-304. Perform the Standard count check according to manufacturer’s recommendation and according to the guidelines set in WAQTC TM-8.
ODOT TM 327(04) 1
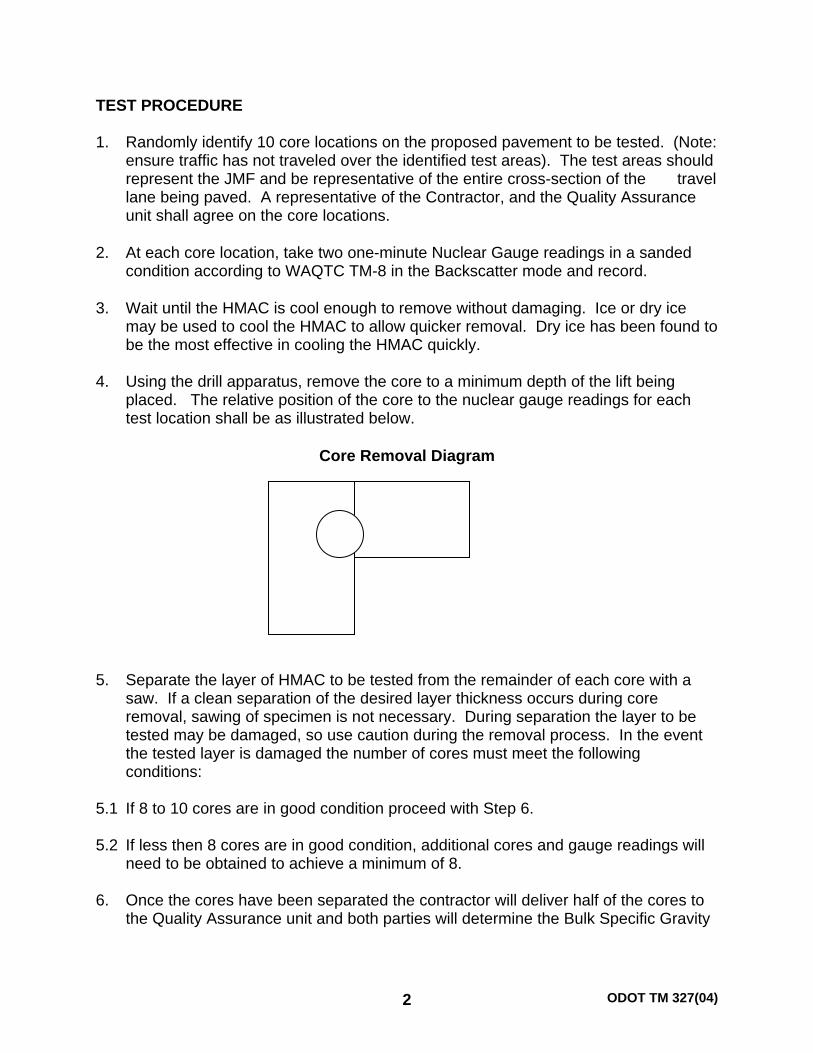
TEST PROCEDURE
1. Randomly identify 10 core locations on the proposed pavement to be tested. (Note: ensure traffic has not traveled over the identified test areas). The test areas should represent the JMF and be representative of the entire cross-section of the travel lane being paved. A representative of the Contractor, and the Quality Assurance unit shall agree on the core locations.
2. At each core location, take two one-minute Nuclear Gauge readings in a sanded
condition according to WAQTC TM-8 in the Backscatter mode and record. 3. Wait until the HMAC is cool enough to remove without damaging. Ice or dry ice
may be used to cool the HMAC to allow quicker removal. Dry ice has been found to be the most effective in cooling the HMAC quickly.
4. Using the drill apparatus, remove the core to a minimum depth of the lift being
placed. The relative position of the core to the nuclear gauge readings for each test location shall be as illustrated below.
Core Removal Diagram
5. Separate the layer of HMAC to be tested from the remainder of each core with a
saw. If a clean separation of the desired layer thickness occurs during core removal, sawing of specimen is not necessary. During separation the layer to be tested may be damaged, so use caution during the removal process. In the event the tested layer is damaged the number of cores must meet the following conditions:
5.1 If 8 to 10 cores are in good condition proceed with Step 6. 5.2 If less then 8 cores are in good condition, additional cores and gauge readings will
need to be obtained to achieve a minimum of 8. 6. Once the cores have been separated the contractor will deliver half of the cores to
the Quality Assurance unit and both parties will determine the Bulk Specific Gravity
ODOT TM 327(04) 2

of the provided set according to AASHTO T-166/275. The specific method of AASHTO T 166 to be used will be agreed upon by both QA and QC labs.
7. Prior to the bulking operation measure and record each specimen’s thickness to the
nearest mm or 1/8”. Once the bulking process is completed both parties will provide nuclear gauge readings and bulk specific gravity test results to the Project Manager for determination of the correlation factor.
8. Calculate the Ratio of the Core to Nuclear Gauge Average Reading at each location
using the following formula:
RATIO = Core (Density) / Nuclear (Reading)
Example METRIC ENGLISH Core Density (2243 kg/cu m) Core Density (140.0 pcf) Nuclear Average Reading (2298 kg/cu m) Nuclear Average Reading (143.4 pcf) 2243 / 2298 = 0.9761 140.0/143.4 = 0.9763
Note: All ratios are carried to 4 decimal places. 9. The calculation process is performed on all cores and nuclear readings and
evaluated according to the following: 9.1 If 9 or 10 ratios are available throw out the high and low values and average the
remaining. 9.2 If 8 are available, average all ratios.
The correlation factor is determined by averaging the ratios and rounding to 4 decimal places.
REPORTING For each nuclear to core correlation performed, provide the following information to the Agency:
• The date the cores were obtained • The lift of HMAC being evaluated • Type of HMAC being evaluated • Mix Design Lab Number • Nuclear Gauge Serial Number, Make & Model • Average thickness of each core (to the nearest mm or 1/8”)
ODOT TM 327(04) 3

• Average Nuclear Density reading at each core location • Core density value and the following T-166/275 information: Mass of core in air,
Mass of core in water & SSD mass of core • Correlation Factor • Document who performed the CDT, CAT-1 and QCCS work. • ODOT form 2327-01 is available to perform the correlation calculations.
ODOT TM 327(04) 4
ODOT TM 770 Method of Test for DETERMINING THE GRAPHIC PROFILE INDEX WITH A CALIFORNIA TYPE PROFILOGRAPH
OR AN INERTIAL LASER PROFILOMETER
SCOPE This test method describes the procedure for checking the horizontal and vertical accuracy of the plotter and for determining the profile index from profilograms of pavement made with the California Type Profilograph. A procedure used to locate individual deviations is also included. Profilograms generated from Profilometers employing an accelerometer established inertial profiling reference and a laser height sensing instrument may also be evaluated using the procedures described herein. The profilogram is recorded on a horizontal scale of 1:300 and vertical scale of 1:1. The determination of the Profile Index involves measuring "scallops" that appear outside a "blanking" band. The determination of individual high areas involves the use of a special template. An alternative horizontal scale may be used when the calculations are performed by analysis software. EQUIPMENT 1 California Profilograph 1.1 The profilograph shall be the California Type, computerized or not computerized,
complete with recorder for determining the profile index of highway pavements. 1.2 The equipment consists of a steerable metal frame 7.62m (25 ft) in length supported
at both ends by wheel assemblies consisting of six wheels each. 1.3 A rubber tired profile wheel approximately 0.5m (1.5 ft.) in diameter and which may
be retracted when not in use, is attached at mid-frame. The profile wheel is connected to a mid-frame mounted strip-chart recorder containing rollers for chart paper, recording pen and events marker. The recorder will record the profile of the pavement surface on a horizontal scale of 1:300 and a vertical scale of 1:1. A storage case for the recorder shall be provided.
1 ODOT TM 770(03)
2. Profilometers 2.1 The profilometer shall employ an accelerometer established inertial profiling
reference and a laser height sensing instrument to produce a true profile of the pavement surface.
2.2 The device must be capable of reporting elevations with a resolution of 0.1mm (0.004 in) or finer at an interval of 150mm (6 in) or less. The device must provide a means to calibrate and measure the horizontal distance travelled.
2.3 The device must be equipped with software capable of generating the equivalent California Type Profilograph plot (profilogram) and values as well as the locations of bumps and dips.
CALIBRATION TESTS Perform all calibrations and calibration verifications in the presence of a representative of the Agency. Provide documentation to the Agency that the calibration tests have been successfully completed. 1. Calibration Frequency 1.1 California Profilograph
The profilograph shall be calibrated at the beginning of each day's use and after each time the profilograph is disassembled and reassembled. Both the vertical and horizontal accuracy of the profilogram shall be checked.
1.2 Profilometer
Perform horizontal and vertical calibration of the profilometer at the frequency recommended by the manufacturer or at any time test results are questionable. It is recommended that the horizontal calibration be checked once per day.
2. Vertical Calibration 2.1 California Profilograph 2.1.1 Set the profilograph in a stationary position on a reasonably smooth and level
surface. 2.1.2 Check the tire pressure of the profile wheel if an inflatable tire is used. It should be
172 kPa.
2 ODOT TM 770(03)
2.1.3 Place a 600mm x 900mm x 3mm (24 in x 36 in x 1/8 in) steel or aluminum plate or 6mm (1/4 in) plywood underneath the recording wheel. This will eliminate the unevenness of the surface under the wheel.
2.1.4 Mark where the recording pen is located on the vertical scale. For computerized
profilographs, follow the manufacturer’s instructions. 2.1.5 Slide the 12.5mm (1/2 in) thick calibration block, as detailed below, underneath the
recording wheel in a manner that will result in an accurate motion of the recording pen.
2.1.6 Mark the new position of the recording pen and measure the distance between the
two marks. For computerized profilographs, follow the manufacturer’s instructions. 2.1.7 The distance should be 12.5mm ±1.5mm (1/2 ±1/16 in). 2.1.8 If the distance is not within these limits, adjust the plotter to the required vertical
accuracy prior to use. Follow the manufacturer's recommendation for vertical adjustment.
2.2 Profilometer
Perform vertical calibration of profilometers according to the manufacturer’s recommendations.
3. Horizontal Calibration 3.1 California Profilograph
3.1.1 Measure and mark off a straight distance of 200m (0.1 mile) on a reasonably level
paved surface. 3.1.2 Place the center of the profile wheel on the zero mark. Mark where the recording
pen is located on the horizontal scale. For computerized profilographs, follow the manufacturer’s instructions. Operate the profilograph over the marked distance to the 200m (0.1 mile) mark. Stop with the center of the profile wheel on the 200m (0.1 mile) mark.
3.1.3 The horizontal graph line should be 667mm long ±4mm (21.12 in ±0.16 in). 3.1.4 If the horizontal graph line is not within these limits, adjust the plotter to the required
horizontal accuracy prior to use. Follow the manufacturer's recommendation for horizontal adjustment.
3 ODOT TM 770(03)
Note: Air moisture and tension on the paper roll can affect the horizontal distance.
3.2 Profilometer
3.2.1 Measure and mark off a straight distance of 200m (0.1 mile) on a reasonably level
paved surface.
3.2.2 Perform horizontal measurement calibration according to the manufacturer’s recommendations. Note the air pressures in the tires on the vehicle when the horizontal calibration is performed. Check the pressures as necessary during the day to ensure the tire pressure is maintained. If the tire pressure changes, adjust the pressure or recalibrate the horizontal measurement. Tire pressure will influence the horizontal distance measured by the profilometer.
4. Calibration Verification
Before performing smoothness measurements on the project, verify the calibration of the California-type profilograph or Laser Profilometer by running the machine twice over a 200m (0.1 mile) section of pavement with repeating results. The calibration shall be considered acceptable when the difference in Profile Index between consecutive test runs is 5mm/km (0.3 in/mile) or less. Provide documentation to the Engineer verifying that the calibration and test runs have been successfully completed. A fogline or other straight line on a relatively smooth pavement surface is suggested for performing this check.
TESTING 1. Operate the profiling device to provide complete graphic profiles at all locations
required by the contract specification. 2. Operate the profiling device either in the direction of vehicle travel or the direction of
placement as determined by the Engineer. 3. Operate the California Profilograph along the specified wheelpaths and other
locations at a speed not greater than three miles per hour. Do not tow the profilograph. Operate the Profilometer along the specified wheelpaths and other locations at speeds recommended by the manufacturer. Take care to keep the device as parallel as possible to centerline.
4 ODOT TM 770(03)

4. Mark on the profile chart the appropriate identification for each profile. For example;
northbound, outside travel lane, right wheelpath could be identified as NG-OL-R. Include project identification on the outside of the rolls.
5. Mark and identify the project stationing on the profiles at the frequency they are
available. As a minimum, identify the location of milepost markers in addition to available stationing. Initial and date the beginning and ending stations of each day's run on the profilogram.
6. Identify on the profiles any areas excluded by specification. 7. The project stationing is referenced on the profile chart at the frequency they are
available by marking a line on the chart at a known station and writing the station on the chart. As a minimum, reference the location of milepost markers. The beginning and ending stations of each day's run is initialed on the profilogram. The stationing is checked every mile and the chart paper or horizontal location is reset if out of tolerance.
DETERMINATION OF THE PROFILE INDEX 1. General
Before beginning the profile index counts, profiles are divided into 200m (0.1 mile) segments and into partial segments as required by the contract specifications. Profilometers and Computerized Profilographs automatically perform the calculations presented below. It will not be necessary to recompute the Profile Index from these devices unless the results are in question.
2. Profile Index Equipment – Manual Trace
The only special equipment needed to determine the profile index is a plastic scale 45mm (1.70 in) wide and 667mm (21.12 in) long representing a pavement length of 200m (0.1 mile) at a scale of 1:300. Near the center of the scale is an opaque blanking band 5mm (0.2 in) wide extending the entire length of the plastic scale. On either side of this blanking band are parallel scribed lines 1mm (0.1 in) apart. These lines serve as a convenient scale to measure deviations called "scallops" of the profile above and below the blanking band.
5 ODOT TM 770(03)
3. Method of Counting for Profile Index 3.1 Place the plastic scale over the profile in such a way as to "blank out" as much of
the profile as possible. When this is done, scallops above and below the blanking band will be approximately balanced.
3.2 For short radius super elevated curves it is necessary to shift the scale to blank out the central portion of the trace. When such conditions occur, the profile is broken into short sections and the blanking band repositioned on each section while counting.
3.3 Beginning at the right end of the scale, measure and total the height of all the
scallops appearing both above and below the blanking band, measuring each scallop to the nearest 1mm (0.05 in). Write this total on the profile sheet near the left end of the scale together with a small mark to align the scale when moving to the next section. Short portions of the profile line may be visible outside the blanking band, but unless they project 1mm (0.05 in) or more and extend longitudinally for 0.6m (2 ft) (2mm (0.1 in) on the profilogram) or more, they are not included in the count.
3.4 When scallops occurring in the first 200m (0.1 mile) section are totaled, slide the
scale to the left, aligning the right end of the scale with the small mark previously made and proceed with the counting in the same manner.
4 Calculation of the Profile Index The profile index is the inches per mile in excess of the 5mm (0.2 in) blanking band. The formulas for converting counts to profile index is as follows: Total Count (mm) x 1000m/km Profile Index = ---------------------------------------------------------------------------------------- Length (m) of Full 200m Segment or of Partial _____* m Segment * Report to nearest whole meter
Total Count x 0.10 Profile Index = ---------------------------------------------------------------------------------------- Length of Full 0.1 mile Segment or of Partial _____* mile Segment * Report to nearest 0.1 mile
6 ODOT TM 770(03)
DETERMINATION OF INDIVIDUAL DEVIATIONS IN EXCESS OF 9mm Profilometers and Computerized Profilographs automatically perform the calculations presented below. It will not be necessary to recompute the individual deviations from these devices unless the results are in question. 1. Equipment – Manual Trace
The only special equipment needed is a plastic template having a line 25mm (1 in) long scribed on one face with a small hole or scribed mark at either end and a slot 9mm (0.36 in) from and parallel to the scribed line. (25mm line (1 in) corresponds to a horizontal distance of 7.5m (25 ft) on the horizontal scale of the profilogram.)
2. Procedure 2.1 At each prominent peak or high point on the profile trace, place the template so that
the small holes or scribe marks at each end of the scribed line intersect the profile trace to form a chord across the base of the peak or indicated bump. The line on the template does not need to be horizontal. With a sharp pencil draw a line using the narrow slot in the template as a guide. Any portion of the trace extending above this line will indicate the approximate length and height of the deviation in excess of 9mm (0.36 in).
2.2 There may be instances where the distance between easily recognizable low points
is less than 25mm (7.5m) (1 in (25 ft)). In such cases a shorter chord length shall be used in making the scribed line on the template tangent to the trace at the low points. It is the intent, however, that the baseline for measuring the height of bumps will be as nearly 7.5m (25mm) (25 ft (1 in)) as possible, but in no case to exceed this value. When the distance between prominent low points is greater than 7.5m (25mm) (25 ft (1 in)), make the ends of the scribed line intersect the profile trace when the template is in a nearly horizontal position.
7 ODOT TM 770(03)

THIS PAGE INTENTIONALLY LEFT BLANK
8 ODOT TM 770(03)
1 ODOT TM 775(03)
ODOT TM 775 Method of Test for
NON-DESTRUCTIVE DEPTH MEASUREMENT OF PORTLAND CEMENT CONCRETE PAVEMENT
SCOPE This method uses a probe and ring device to measure the thickness of freshly placed portland cement concrete pavement. APPARATUS 1. Probe – A 6 mm (1/4 in) rod graduated in 2 mm (0.1 in) increments capable of
measuring depths from 200 mm (8 in) to 350 mm (14 in). 2. Ring Device - A 150 mm (6 in) diameter sliding ring that is capable of being locked to
the probe. PROCEDURE 1. Determine random sample locations according to current Agency procedures 2. While holding onto the ring device, insert the probe into the freshly placed concrete
pavement. Adjust the rod slightly as necessary to ensure that the probe makes contact with the underlying base material.
3. Slowly release the ring device until it comes to rest against the pavement surface.
The ring must be uniformly seated for its entire circumference on the surface or the probe is not perpendicular to the surface.
4. Lock the ring device to the probe in this position. 5. Remove the apparatus and read the depth at the top of the ring device. 6. Document results according to Agency procedures.

2 ODOT TM 775(03)
THIS PAGE INTENTIONALLY LEFT BLANK
I N T E R O F F I C E M E M OTECHNICAL SERVICES
Construction Section Office Phone: (503) 986-3000 Fax Number: (503) 986-3096
DATE: October 1, 2001 TO: All Holders of the Manual of Field Test Procedures File Code: SECTION: Test Procedure AASHTO T-2
The Oregon Department of Transportation has specified method(s) for this Test Procedure. Please observe the following for our projects: Under Procedure, Section A Method B (From the Belt Discharge) when sampling from a conveyor belt, the device shall consist of a container of sufficient size to intercept the entire cross section of the discharge stream and hold the material without overflowing.

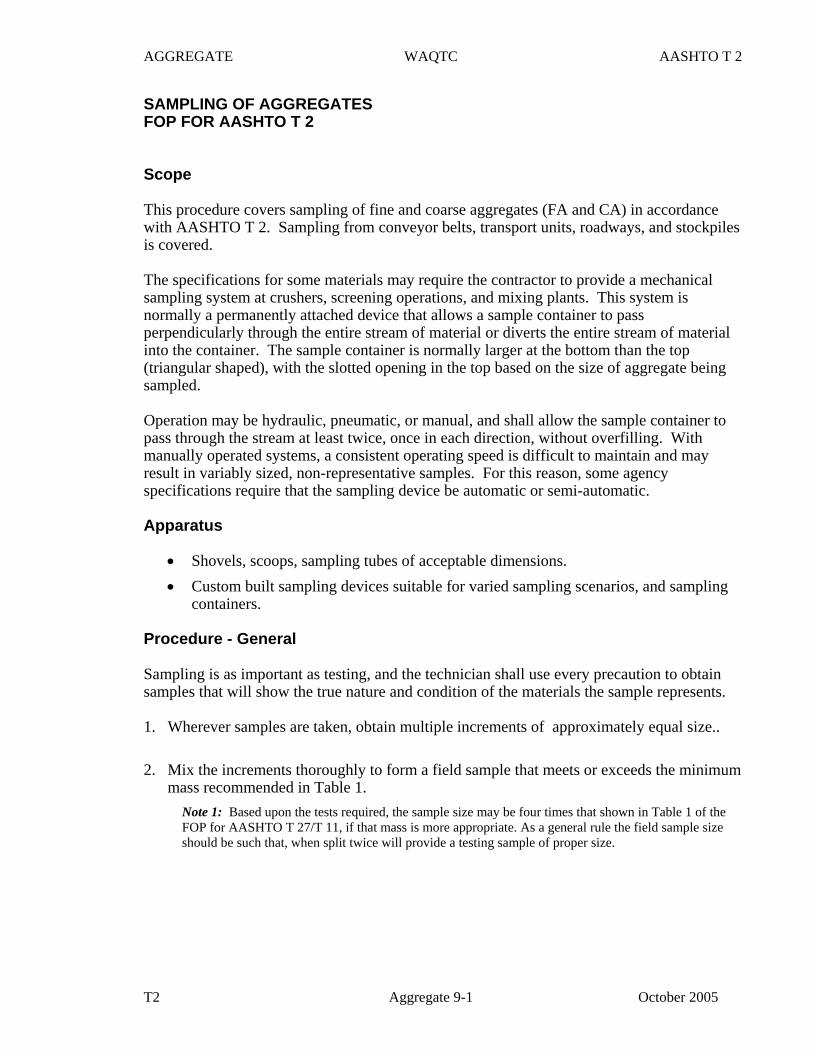
AGGREGATE WAQTC AASHTO T 2
SAMPLING OF AGGREGATES FOP FOR AASHTO T 2 Scope This procedure covers sampling of fine and coarse aggregates (FA and CA) in accordance with AASHTO T 2. Sampling from conveyor belts, transport units, roadways, and stockpiles is covered. The specifications for some materials may require the contractor to provide a mechanical sampling system at crushers, screening operations, and mixing plants. This system is normally a permanently attached device that allows a sample container to pass perpendicularly through the entire stream of material or diverts the entire stream of material into the container. The sample container is normally larger at the bottom than the top (triangular shaped), with the slotted opening in the top based on the size of aggregate being sampled. Operation may be hydraulic, pneumatic, or manual, and shall allow the sample container to pass through the stream at least twice, once in each direction, without overfilling. With manually operated systems, a consistent operating speed is difficult to maintain and may result in variably sized, non-representative samples. For this reason, some agency specifications require that the sampling device be automatic or semi-automatic. Apparatus
• Shovels, scoops, sampling tubes of acceptable dimensions. • Custom built sampling devices suitable for varied sampling scenarios, and sampling
containers. Procedure - General Sampling is as important as testing, and the technician shall use every precaution to obtain samples that will show the true nature and condition of the materials the sample represents. 1. Wherever samples are taken, obtain multiple increments of approximately equal size.. 2. Mix the increments thoroughly to form a field sample that meets or exceeds the minimum
mass recommended in Table 1. Note 1: Based upon the tests required, the sample size may be four times that shown in Table 1 of the FOP for AASHTO T 27/T 11, if that mass is more appropriate. As a general rule the field sample size should be such that, when split twice will provide a testing sample of proper size.
T2 Aggregate 9-1 October 2005
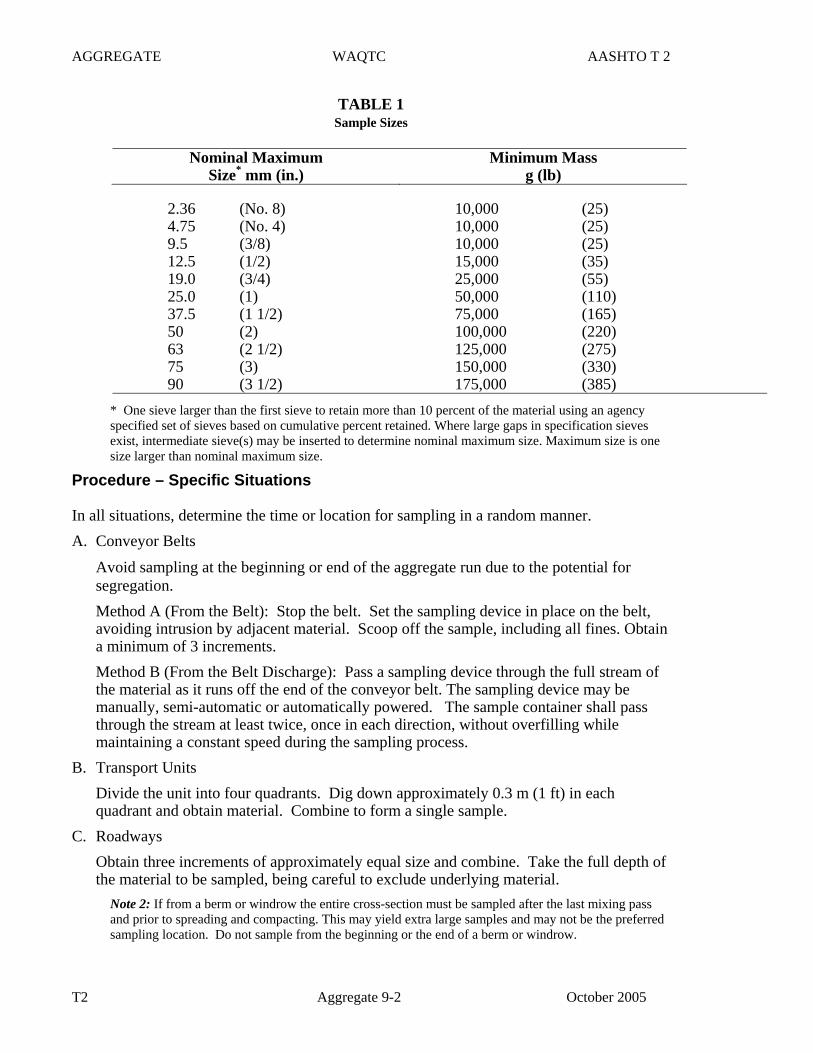
AGGREGATE WAQTC AASHTO T 2
TABLE 1 Sample Sizes
Nominal Maximum
Size* mm (in.) Minimum Mass
g (lb)
2.36 (No. 8) 10,000 (25) 4.75 (No. 4) 10,000 (25) 9.5 (3/8) 10,000 (25) 12.5 (1/2) 15,000 (35) 19.0 (3/4) 25,000 (55) 25.0 (1) 50,000 (110) 37.5 (1 1/2) 75,000 (165) 50 (2) 100,000 (220) 63 (2 1/2) 125,000 (275) 75 (3) 150,000 (330) 90 (3 1/2) 175,000 (385)
* One sieve larger than the first sieve to retain more than 10 percent of the material using an agency specified set of sieves based on cumulative percent retained. Where large gaps in specification sieves exist, intermediate sieve(s) may be inserted to determine nominal maximum size. Maximum size is one size larger than nominal maximum size.
Procedure – Specific Situations In all situations, determine the time or location for sampling in a random manner. A. Conveyor Belts
Avoid sampling at the beginning or end of the aggregate run due to the potential for segregation. Method A (From the Belt): Stop the belt. Set the sampling device in place on the belt, avoiding intrusion by adjacent material. Scoop off the sample, including all fines. Obtain a minimum of 3 increments. Method B (From the Belt Discharge): Pass a sampling device through the full stream of the material as it runs off the end of the conveyor belt. The sampling device may be manually, semi-automatic or automatically powered. The sample container shall pass through the stream at least twice, once in each direction, without overfilling while maintaining a constant speed during the sampling process.
B. Transport Units Divide the unit into four quadrants. Dig down approximately 0.3 m (1 ft) in each quadrant and obtain material. Combine to form a single sample.
C. Roadways Obtain three increments of approximately equal size and combine. Take the full depth of the material to be sampled, being careful to exclude underlying material.
Note 2: If from a berm or windrow the entire cross-section must be sampled after the last mixing pass and prior to spreading and compacting. This may yield extra large samples and may not be the preferred sampling location. Do not sample from the beginning or the end of a berm or windrow.
T2 Aggregate 9-2 October 2005
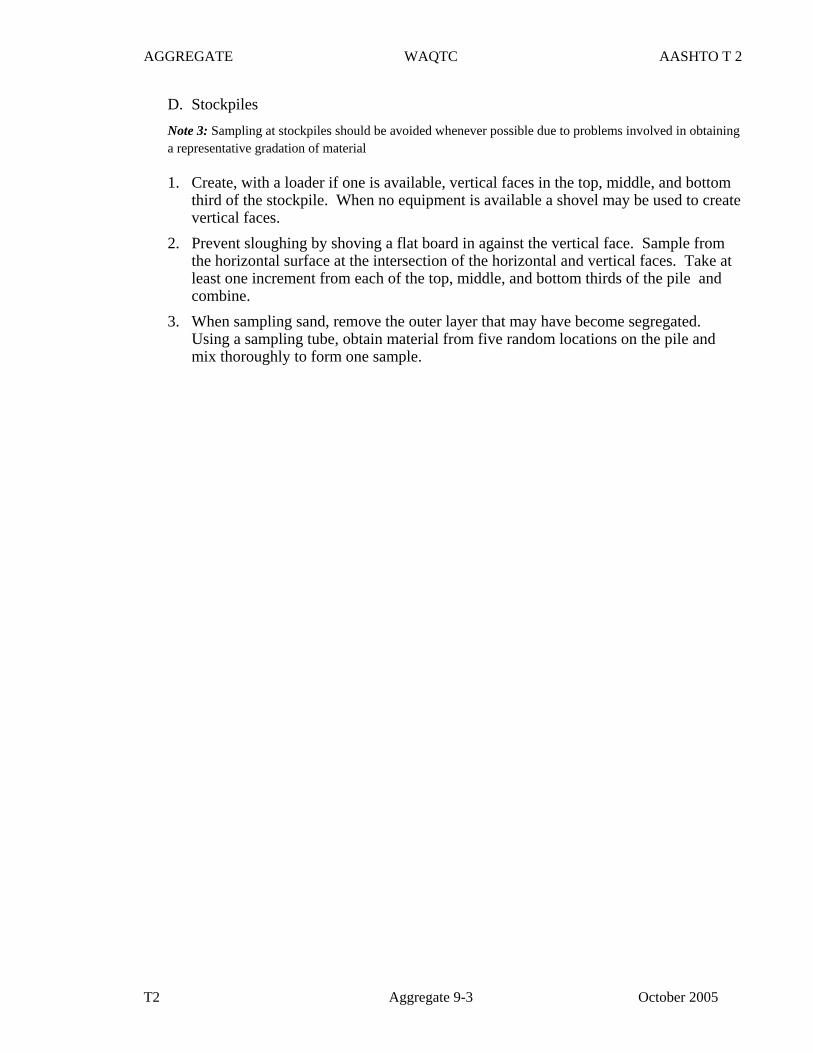
AGGREGATE WAQTC AASHTO T 2
D. Stockpiles Note 3: Sampling at stockpiles should be avoided whenever possible due to problems involved in obtaining a representative gradation of material 1. Create, with a loader if one is available, vertical faces in the top, middle, and bottom
third of the stockpile. When no equipment is available a shovel may be used to create vertical faces.
2. Prevent sloughing by shoving a flat board in against the vertical face. Sample from the horizontal surface at the intersection of the horizontal and vertical faces. Take at least one increment from each of the top, middle, and bottom thirds of the pile and combine.
3. When sampling sand, remove the outer layer that may have become segregated. Using a sampling tube, obtain material from five random locations on the pile and mix thoroughly to form one sample.
T2 Aggregate 9-3 October 2005

AGGREGATE WAQTC AASHTO T 2
THIS PAGE INTENTIONALLY LEFT BLANK
T2 Aggregate 9-4 October 2005

Bulk Density (“Unit Weight”) and Voids in Aggregate
AASHTO Designation: T 19/T 19M-00 ASTM Designation: C29/C 29M-97
AASHTO TEST METHODS CANNOT BE INCLUDED ON ODOT’S WEBSITE DUE TO COPYRIGHT INFRINGEMENT. TO GET COPIES OF THE TEST METHODS, YOU CAN ORDER A HARD COPY OF ODOT’S MANUAL OF FIELD TEST PROCEDURES OR YOU CAN ORDER THE LATEST STANDARD SPECIFICATIONS FOR TRANSPORTATION MATERIALS AND METHODS OF SAMPLING AND TESTING FROM AASHTO. ORDERING INSTRUCTIONS ARE GIVEN BELOW: To order ODOT’s Manual of Field Test Procedures, use the following web address: http://www.odot.state.or.us/ffp/cs/opo/contractor_plans/ManualSubmitOrder.htm To order AASHTO’s Standard Specifications for Transportation Materials and Methods of Sampling and Testing, use the following web address: https://bookstore.transportation.org/


Compressive Strength of Cylindrical Concrete Specimens
AASHTO Designation: T 22-06 ASTM Designation: C39-04a
AASHTO TEST METHODS CANNOT BE INCLUDED ON ODOT’S WEBSITE DUE TO COPYRIGHT INFRINGEMENT. TO GET COPIES OF THE TEST METHODS, YOU CAN ORDER A HARD COPY OF ODOT’S MANUAL OF FIELD TEST PROCEDURES OR YOU CAN ORDER THE LATEST STANDARD SPECIFICATIONS FOR TRANSPORTATION MATERIALS AND METHODS OF SAMPLING AND TESTING FROM AASHTO. ORDERING INSTRUCTIONS ARE GIVEN BELOW: To order ODOT’s Manual of Field Test Procedures, use the following web address: http://www.odot.state.or.us/ffp/cs/opo/contractor_plans/ManualSubmitOrder.htm To order AASHTO’s Standard Specifications for Transportation Materials and Methods of Sampling and Testing, use the following web address: https://bookstore.transportation.org/

I N T E R O F F I C E M E M OTECHNICAL SERVICES
Construction Section Office Phone: (503) 986-3000 Fax Number: (503) 986-3096
DATE: October 15, 2004 TO: All Holders of the Manual of Field Test Procedures File Code: SECTION: Test Procedure AASHTO T 23
The Oregon Department of Transportation has specified method(s) for this Test Procedure. Please observe the following for our projects: • Use Method 1, cure in a cooler with controlled water temperature. See test
procedure for temperature requirements. • Use a high/low temperature-recording device to monitor temperature during
curing process. Record the high/low temperature range during the cure process on agency approved form.
• Delete Bullet 4 under Procedure – Transporting Specimens. • Under Procedure for Making Cylinders—Rodding step 3, the use of a mallet
meeting the requirements under apparatus may be used for single-use plastic molds conforming to AASHTO M-205.
• Under Procedure-Making Cylinders-Internal Vibration add the following: After
vibration of each layer tap the side of the mold at least 10 times.

ODOT TM 323(06) 2
CONCRETE WAQTC AASHTO T 23
METHOD OF MAKING AND CURING CONCRETE TEST SPECIMENS IN THE FIELD FOP FOR AASHTO T 23 Scope This procedure covers the method for making, initially curing, and transporting concrete test specimens in the field in accordance with AASHTO T 23. Apparatus and Test Specimens • Concrete cylinder molds: Conforming to AASHTO M 205 with a length equal to twice
the diameter. Standard specimens shall be 150 mm (6 in.) by 300 mm (12 in.) cylinders. Mold diameter must be at least three times maximum aggregate size unless wet sieving is conducted according to the FOP for WAQTC TM 2. Agency specifications may allow cylinder molds of 100 mm (4 in.) by 200 mm (8 in.) size when the nominal maximum aggregate size does not exceed 25 mm (1 in.).
• Beam molds: Rectangular in shape with ends and sides at right angles to each other. Must be sufficiently rigid to resist warpage. Surfaces must be smooth. Molds shall produce length no more than 1.6 mm (1/16”) shorter than that required (greater length is allowed). Maximum variation from nominal cross section shall not exceed 3.2 mm (1/8 in.). Ratio of width to depth may not exceed 1.5; the smaller dimension must be at least 3 times maximum aggregate size. Unless otherwise noted in specifications, beam molds for casting specimens in the field shall result in specimens having width and depth of not less than 150 mm (6 inches). Specimens shall be cast and hardened with the long axes horizontal.
• Standard tamping rod: 16 mm (5/8 in.) diameter and approximately 600 mm (24 in.) long, having a hemispherical tip for preparing 150mm (6 in.) x 300 mm (12 in.) cylinders.
• Small tamping rod: 10 mm (3/8 in.) diameter and approximately 305 mm (12 in.) long, having a hemispherical tip for preparing 100 mm (4 in.) x 200 mm (8 in.) cylinders.
• Vibrator: At least 7000 vibrations per minute, diameter no more than ¼ the diameter or width of the mold and at least 75 mm (3 in.) longer than the section being vibrated for use with low slump concrete.
• Scoop • Trowel or Float • Mallet: With a rubber or rawhide head having a mass of 0.57 ± 0.23 kg (1.25 ±0.5 lb.). • Rigid base plates and cover plates: metal, glass, or plywood. • Initial Curing Facilities: Temperature controlled curing box or enclosure capable of
maintaining the required range of 16 to 27°C (60 to 80°F) during the entire initial curing period (for concrete with compressive strength of 40 Mpa (6000 psi) or more, the temperature shall be 20 to 26°C (68 to 78oF). As an alternative, sand or earth for initial cylinder protection may be used provided that the required temperature range is maintained and the specimens are not damaged.
T23_short Concrete 14-1 October 2006
CONCRETE WAQTC AASHTO T 23
• Thermometer: Capable of registering both maximum and minimum temperatures during the initial cure.
Procedure – Making Specimens – General
1. Obtain the sample according with the FOP for WAQTC TM 2. Wet Sieving per the FOP for WAQTC TM 2 is required when concrete contains aggregate with a nominal maximum size greater than 50 mm (2 in.) for specimens with a 150 mm (6 in.) diameter, or greater than 25 mm (1 in.) for specimen’s with a 100 mm (4 in.) diameter. Sieve the sample for 150 mm (6 in.) diameter specimens over the 37.5mm (1½ in.) sieve and for 100 mm (4 in.) diameter specimens, sieve over the 25mm (1 in.).
2. Remix the sample after transporting to testing location. 3. Begin making specimens within 15 minutes of obtaining the sample. 4. Set molds upright on a level rigid base in a location free from vibration and relatively
close to where they will be stored.
5. Fill molds in the required number of layers attempting to exactly fill the mold on the final layer. Add or remove concrete prior to completion of consolidation to avoid a deficiency or excess of concrete.
6. There are two methods of consolidating the concrete – rodding and internal vibration. If the slump is greater than 25 mm (1 in.), consolidation may be by rodding or vibration. When the slump is 25 mm (1 in.) or less, consolidate the sample by internal vibration. Agency specifications may dictate when rodding or vibration will be used.
Procedure – Making Cylinders – Rodding 1. For the standard 150 mm (6 in.) by 300 mm (12 in.) specimen, fill each mold in three
approximately equal layers, moving the scoop or trowel around the perimeter of the mold to evenly distribute the concrete. For the 100 mm (4 in.) by 200 mm (8 in.) specimen, fill the mold in two layers. When filling the final layer, slightly overfill the mold.
2. Consolidate each layer with 25 strokes of the appropriate tamping rod, using the rounded end. Distribute strokes evenly over the cross section of the concrete. Rod the first layer throughout its depth without forcibly hitting the bottom. For subsequent layers, rod the layer throughout its depth penetrating approximately 25 mm (1 in.) into the underlying layer.
3. After rodding each layer, tap the sides of each mold 10 to 15 times with the mallet (reusable steel molds) or lightly with the open hand (single-use light-gauge molds).
4. Strike off the surface of the molds with tamping rod, or straightedge and begin initial curing.
Note 1: Floating or troweling is permitted instead of striking off with rod or straightedge
Procedure – Making Cylinders – Internal Vibration
T23_short Concrete 14-2 October 2006
CONCRETE WAQTC AASHTO T 23
1. Fill the mold in two layers. 2. Insert the vibrator at the required number of different points for each layer (two points for
150 mm (6 in.) diameter cylinders; one point for 100 mm (4 in.) diameter cylinders). When vibrating the bottom layer, do not let the vibrator touch the bottom or sides of the mold. When vibrating the top layer, the vibrator shall penetrate into the underlying layer approximately 25 mm (1 in.)
3. Remove the vibrator slowly, so that no air pockets are left in the material. Note 2: Continue vibration only long enough to achieve proper consolidation of the concrete. Over vibration
may cause segregation and loss of appreciable quantities of intentionally entrained air.
4. Strike off the surface of the molds with tamping rod, or straightedge and begin initial curing.
Procedure – Making Flexural Beams – Rodding
1. Fill the mold in two approximately equal layers with the second layer slightly overfilling the mold.
2. Consolidate each layer with the tamping rod once for every 1300 mm2 (2 in2) using the rounded end. Rod each layer throughout its depth taking care to not forcibly strike the bottom of the mold when compacting the first layer. Rod the second layer throughout its depth, penetrating approximately 25 mm (1”) into the lower layer.
3. After rodding each layer, strike the mold 10 to 15 times with the mallet and spade along the sides and end using a trowel.
4. Strike off to a flat surface using a float or trowel and begin initial curing. Procedure – Making Flexural Beams – Vibration
1. Fill the mold to overflowing in one layer.
2. Consolidate the concrete by inserting the vibrator vertically along the centerline at intervals not exceeding 150 mm (6 in.). Take care to not over vibrate, and withdraw the vibrator slowly to avoid large voids. Do not contact the bottom or sides of the mold with the vibrator.
3. After vibrating, strike the mold 10 to 15 times with the mallet.
4. Strike off to a flat surface using a float or trowel and begin initial curing. Procedure – Initial Curing
• When moving cylinder specimens made with single use molds support the bottom of the mold with trowel, hand, or other device.
T23_short Concrete 14-3 October 2006
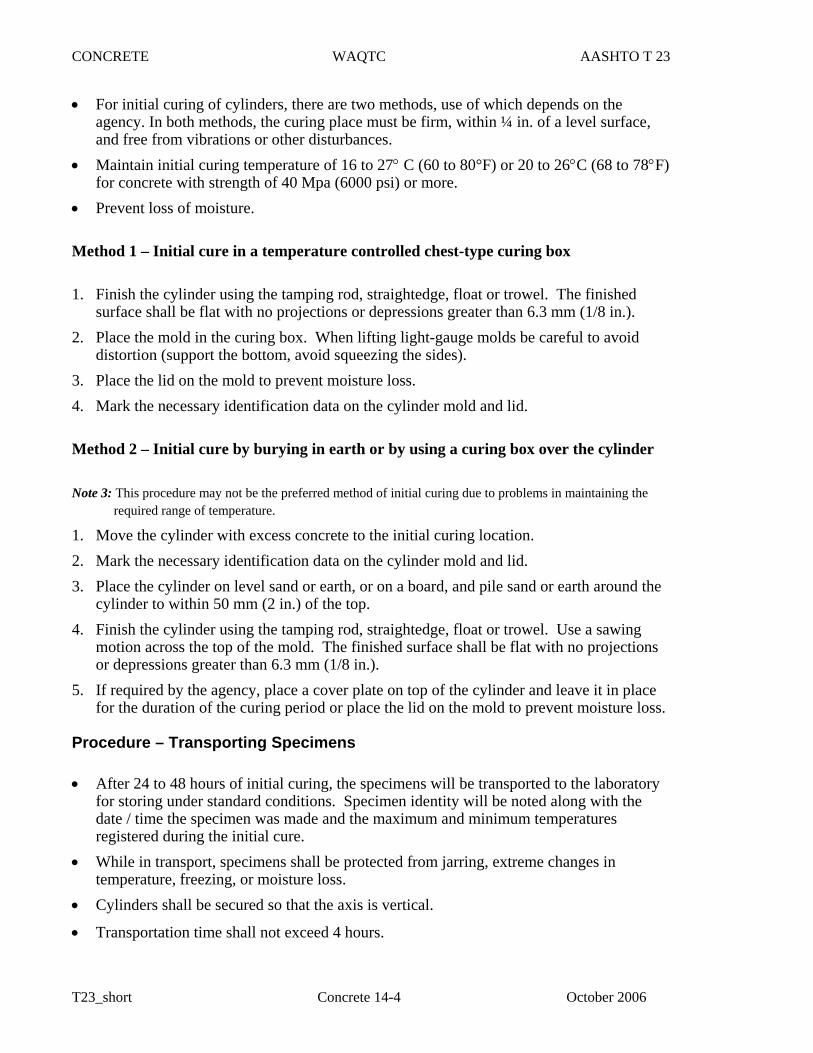
CONCRETE WAQTC AASHTO T 23
• For initial curing of cylinders, there are two methods, use of which depends on the agency. In both methods, the curing place must be firm, within ¼ in. of a level surface, and free from vibrations or other disturbances.
• Maintain initial curing temperature of 16 to 27° C (60 to 80°F) or 20 to 26°C (68 to 78°F) for concrete with strength of 40 Mpa (6000 psi) or more.
• Prevent loss of moisture. Method 1 – Initial cure in a temperature controlled chest-type curing box 1. Finish the cylinder using the tamping rod, straightedge, float or trowel. The finished
surface shall be flat with no projections or depressions greater than 6.3 mm (1/8 in.). 2. Place the mold in the curing box. When lifting light-gauge molds be careful to avoid
distortion (support the bottom, avoid squeezing the sides). 3. Place the lid on the mold to prevent moisture loss. 4. Mark the necessary identification data on the cylinder mold and lid. Method 2 – Initial cure by burying in earth or by using a curing box over the cylinder Note 3: This procedure may not be the preferred method of initial curing due to problems in maintaining the
required range of temperature.
1. Move the cylinder with excess concrete to the initial curing location. 2. Mark the necessary identification data on the cylinder mold and lid. 3. Place the cylinder on level sand or earth, or on a board, and pile sand or earth around the
cylinder to within 50 mm (2 in.) of the top. 4. Finish the cylinder using the tamping rod, straightedge, float or trowel. Use a sawing
motion across the top of the mold. The finished surface shall be flat with no projections or depressions greater than 6.3 mm (1/8 in.).
5. If required by the agency, place a cover plate on top of the cylinder and leave it in place for the duration of the curing period or place the lid on the mold to prevent moisture loss.
Procedure – Transporting Specimens
• After 24 to 48 hours of initial curing, the specimens will be transported to the laboratory for storing under standard conditions. Specimen identity will be noted along with the date / time the specimen was made and the maximum and minimum temperatures registered during the initial cure.
• While in transport, specimens shall be protected from jarring, extreme changes in temperature, freezing, or moisture loss.
• Cylinders shall be secured so that the axis is vertical.
• Transportation time shall not exceed 4 hours.
T23_short Concrete 14-4 October 2006
CONCRETE WAQTC AASHTO T 23
Final Curing
• For all specimens (cylinders or beams) final curing must be started within 30 minutes of mold removal. Temperature shall be maintained at 23° ±2°C (73 ±3°F). Free moisture must be present on the surfaces of the specimens during the entire curing period. Curing may be accomplished in a moist room or water tank conforming to M 201.
• For cylinders, during the final 3 hours prior to testing the temperature requirement may be waived, but free moisture must be maintained on specimen surfaces at all times until tested.
• Final curing of beams must include immersing in lime-saturated water for at least 20 hours prior to testing.
Report • Report on standard agency forms.
• Pertinent placement information for identification of project, element(s) represented, etc.
• Date and Time molded.
• Test ages.
• Slump, Air Content, & Density
• Temperature (concrete, initial cure max. & min., and ambient).
• Method of initial curing.
• Other information as required by agency such as concrete supplier, truck number, invoice number, water added, etc.
T23_short Concrete 14-5 October 2006

CONCRETE WAQTC AASHTO T 23
THIS PAGE INTENTIONALLY LEFT BLANK
T23_short Concrete 14-6 October 2006
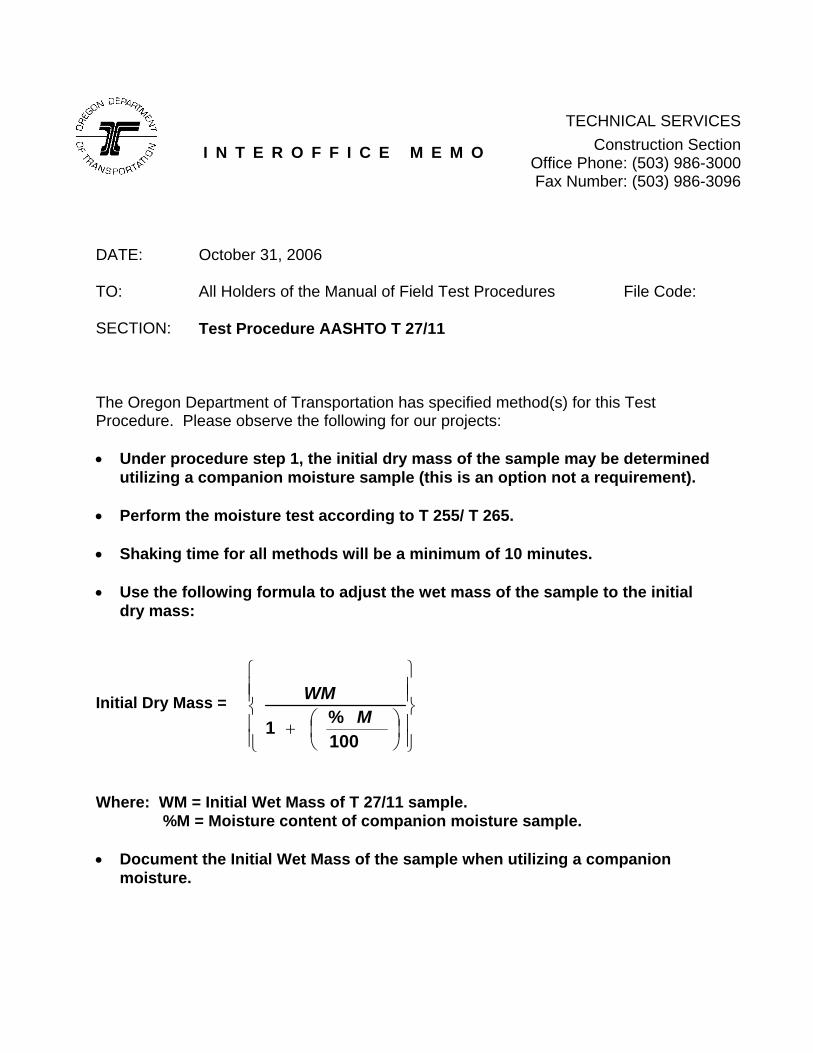
I N T E R O F F I C E M E M O
TECHNICAL SERVICESConstruction Section
Office Phone: (503) 986-3000Fax Number: (503) 986-3096
DATE: October 31, 2006 TO: All Holders of the Manual of Field Test Procedures File Code: SECTION: Test Procedure AASHTO T 27/11
The Oregon Department of Transportation has specified method(s) for this Test Procedure. Please observe the following for our projects: • Under procedure step 1, the initial dry mass of the sample may be determined
utilizing a companion moisture sample (this is an option not a requirement). • Perform the moisture test according to T 255/ T 265. • Shaking time for all methods will be a minimum of 10 minutes. • Use the following formula to adjust the wet mass of the sample to the initial
dry mass:
Initial Dry Mass =
⎪⎪⎭
⎪⎪⎬
⎫
⎪⎪⎩
⎪⎪⎨
⎧
⎟⎠⎞
⎜⎝⎛+
100%1 M
WM
Where: WM = Initial Wet Mass of T 27/11 sample. %M = Moisture content of companion moisture sample. • Document the Initial Wet Mass of the sample when utilizing a companion
moisture.

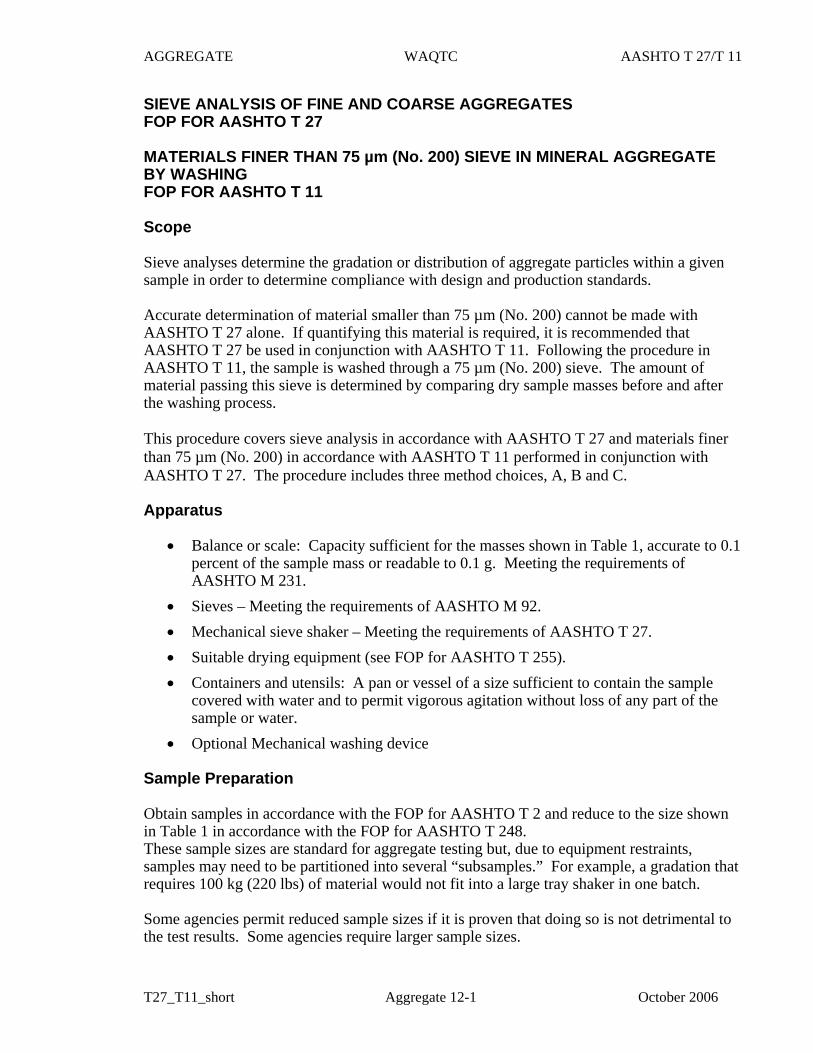
AGGREGATE WAQTC AASHTO T 27/T 11
SIEVE ANALYSIS OF FINE AND COARSE AGGREGATES FOP FOR AASHTO T 27 MATERIALS FINER THAN 75 µm (No. 200) SIEVE IN MINERAL AGGREGATE BY WASHING FOP FOR AASHTO T 11 Scope Sieve analyses determine the gradation or distribution of aggregate particles within a given sample in order to determine compliance with design and production standards. Accurate determination of material smaller than 75 µm (No. 200) cannot be made with AASHTO T 27 alone. If quantifying this material is required, it is recommended that AASHTO T 27 be used in conjunction with AASHTO T 11. Following the procedure in AASHTO T 11, the sample is washed through a 75 µm (No. 200) sieve. The amount of material passing this sieve is determined by comparing dry sample masses before and after the washing process. This procedure covers sieve analysis in accordance with AASHTO T 27 and materials finer than 75 µm (No. 200) in accordance with AASHTO T 11 performed in conjunction with AASHTO T 27. The procedure includes three method choices, A, B and C. Apparatus
• Balance or scale: Capacity sufficient for the masses shown in Table 1, accurate to 0.1 percent of the sample mass or readable to 0.1 g. Meeting the requirements of AASHTO M 231.
• Sieves – Meeting the requirements of AASHTO M 92. • Mechanical sieve shaker – Meeting the requirements of AASHTO T 27. • Suitable drying equipment (see FOP for AASHTO T 255). • Containers and utensils: A pan or vessel of a size sufficient to contain the sample
covered with water and to permit vigorous agitation without loss of any part of the sample or water.
• Optional Mechanical washing device Sample Preparation Obtain samples in accordance with the FOP for AASHTO T 2 and reduce to the size shown in Table 1 in accordance with the FOP for AASHTO T 248. These sample sizes are standard for aggregate testing but, due to equipment restraints, samples may need to be partitioned into several “subsamples.” For example, a gradation that requires 100 kg (220 lbs) of material would not fit into a large tray shaker in one batch. Some agencies permit reduced sample sizes if it is proven that doing so is not detrimental to the test results. Some agencies require larger sample sizes.
T27_T11_short Aggregate 12-1 October 2006
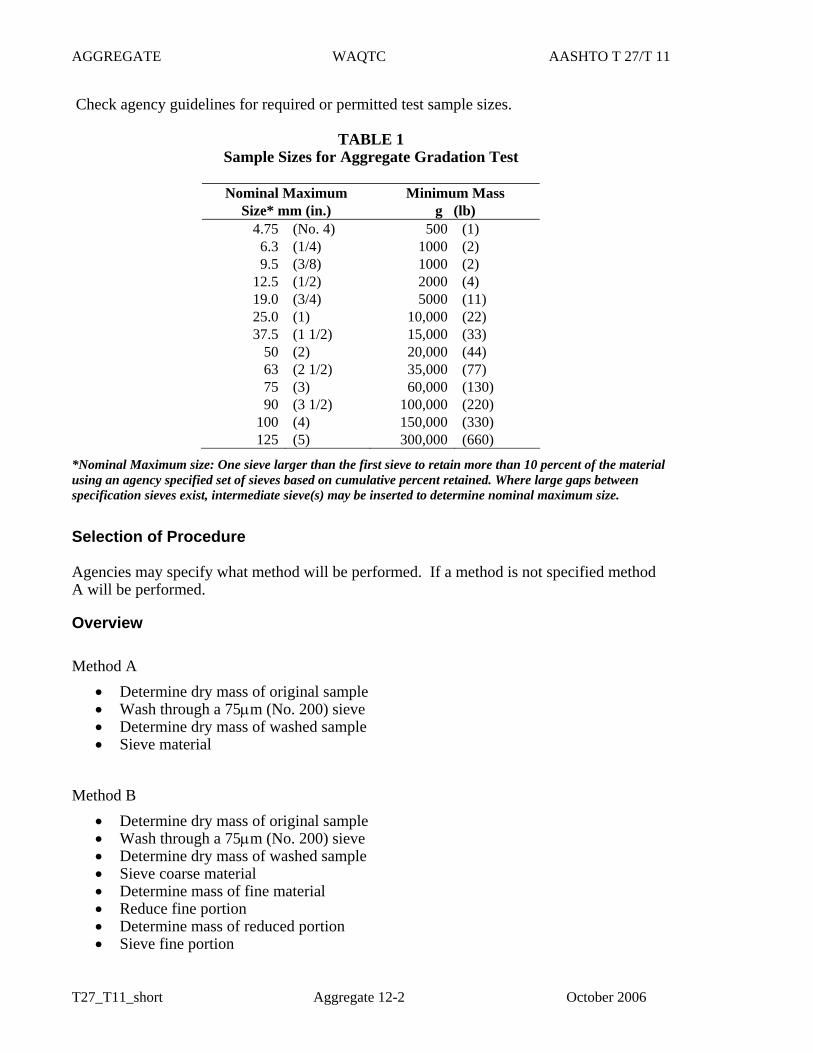
AGGREGATE WAQTC AASHTO T 27/T 11
Check agency guidelines for required or permitted test sample sizes.
TABLE 1 Sample Sizes for Aggregate Gradation Test
Nominal Maximum
Size* mm (in.) Minimum Mass
g (lb) 4.75 (No. 4) 500 (1)
6.3 (1/4) 1000 (2) 9.5 (3/8) 1000 (2)
12.5 (1/2) 2000 (4) 19.0 (3/4) 5000 (11) 25.0 (1) 10,000 (22) 37.5 (1 1/2) 15,000 (33)
50 (2) 20,000 (44) 63 (2 1/2) 35,000 (77) 75 (3) 60,000 (130) 90 (3 1/2) 100,000 (220)
100 (4) 150,000 (330) 125 (5) 300,000 (660)
*Nominal Maximum size: One sieve larger than the first sieve to retain more than 10 percent of the material using an agency specified set of sieves based on cumulative percent retained. Where large gaps between specification sieves exist, intermediate sieve(s) may be inserted to determine nominal maximum size.
Selection of Procedure Agencies may specify what method will be performed. If a method is not specified method A will be performed.
Overview Method A
• Determine dry mass of original sample • Wash through a 75μm (No. 200) sieve • Determine dry mass of washed sample • Sieve material
Method B
• Determine dry mass of original sample • Wash through a 75μm (No. 200) sieve • Determine dry mass of washed sample • Sieve coarse material • Determine mass of fine material • Reduce fine portion • Determine mass of reduced portion • Sieve fine portion
T27_T11_short Aggregate 12-2 October 2006
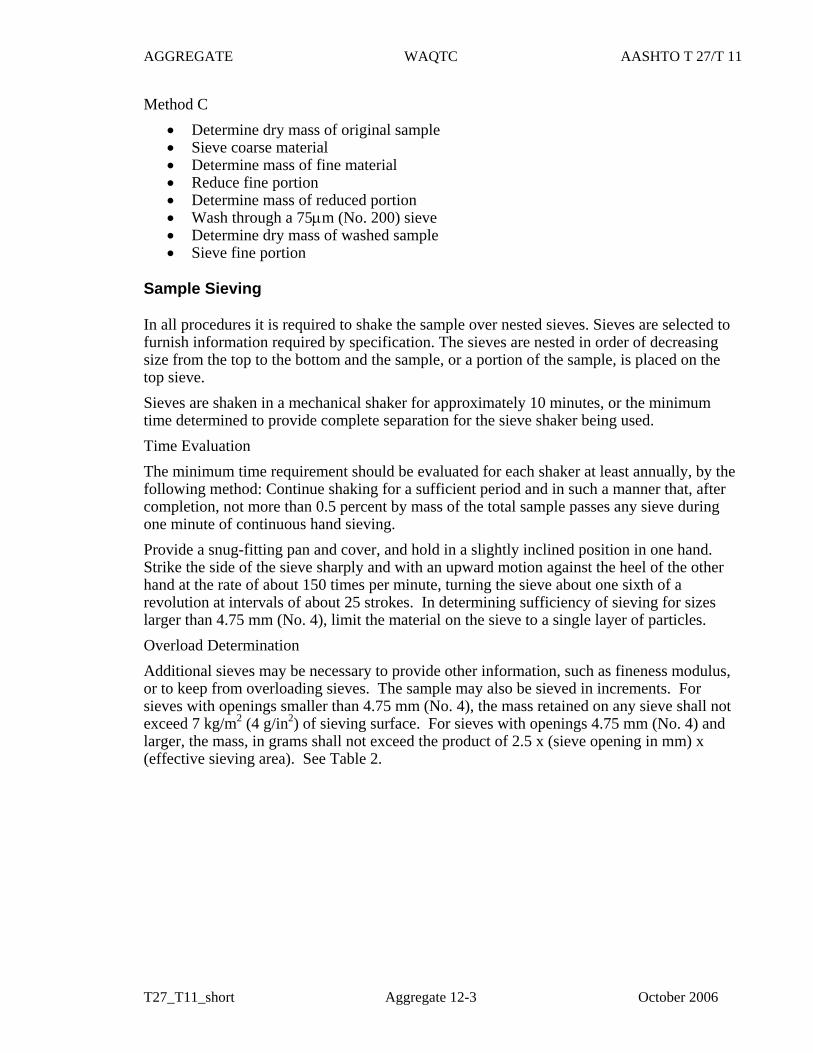
AGGREGATE WAQTC AASHTO T 27/T 11
Method C • Determine dry mass of original sample • Sieve coarse material • Determine mass of fine material • Reduce fine portion • Determine mass of reduced portion • Wash through a 75μm (No. 200) sieve • Determine dry mass of washed sample • Sieve fine portion
Sample Sieving In all procedures it is required to shake the sample over nested sieves. Sieves are selected to furnish information required by specification. The sieves are nested in order of decreasing size from the top to the bottom and the sample, or a portion of the sample, is placed on the top sieve. Sieves are shaken in a mechanical shaker for approximately 10 minutes, or the minimum time determined to provide complete separation for the sieve shaker being used. Time Evaluation The minimum time requirement should be evaluated for each shaker at least annually, by the following method: Continue shaking for a sufficient period and in such a manner that, after completion, not more than 0.5 percent by mass of the total sample passes any sieve during one minute of continuous hand sieving. Provide a snug-fitting pan and cover, and hold in a slightly inclined position in one hand. Strike the side of the sieve sharply and with an upward motion against the heel of the other hand at the rate of about 150 times per minute, turning the sieve about one sixth of a revolution at intervals of about 25 strokes. In determining sufficiency of sieving for sizes larger than 4.75 mm (No. 4), limit the material on the sieve to a single layer of particles. Overload Determination Additional sieves may be necessary to provide other information, such as fineness modulus, or to keep from overloading sieves. The sample may also be sieved in increments. For sieves with openings smaller than 4.75 mm (No. 4), the mass retained on any sieve shall not exceed 7 kg/m2 (4 g/in2) of sieving surface. For sieves with openings 4.75 mm (No. 4) and larger, the mass, in grams shall not exceed the product of 2.5 x (sieve opening in mm) x (effective sieving area). See Table 2.
T27_T11_short Aggregate 12-3 October 2006
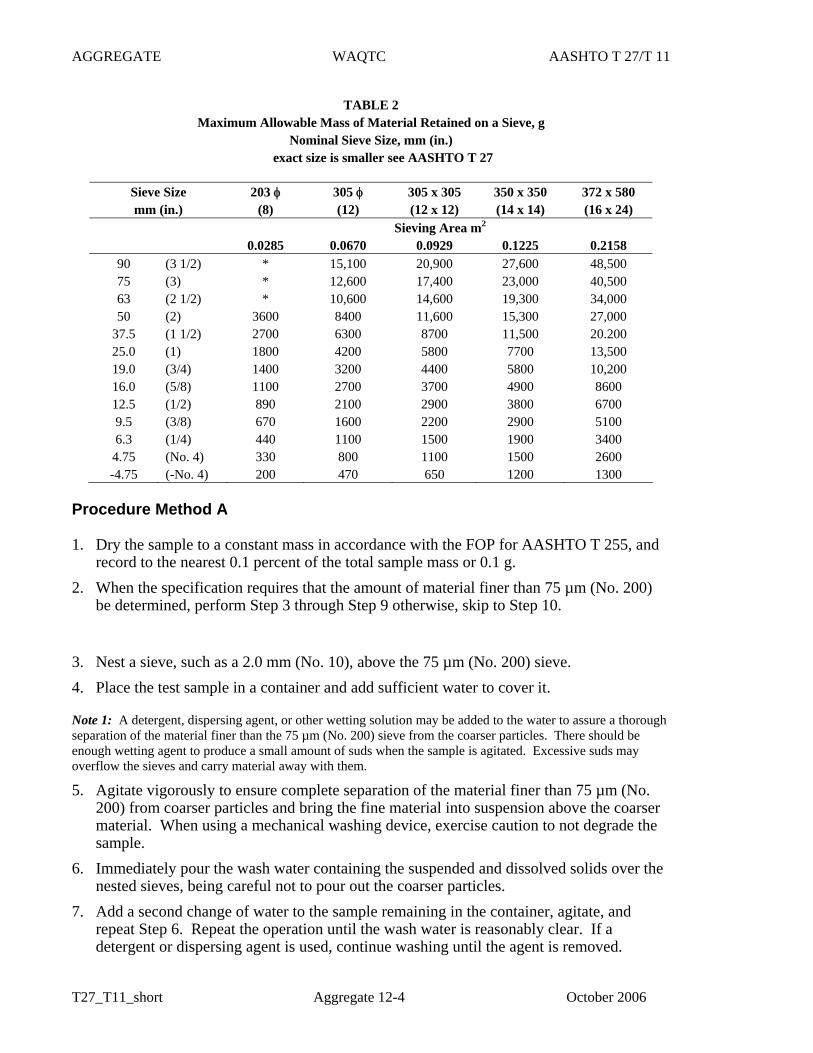
AGGREGATE WAQTC AASHTO T 27/T 11
TABLE 2 Maximum Allowable Mass of Material Retained on a Sieve, g
Nominal Sieve Size, mm (in.) exact size is smaller see AASHTO T 27
Sieve Size 203 φ mm (in.) (8)
305 φ (12)
305 x 305 (12 x 12)
350 x 350 (14 x 14)
372 x 580 (16 x 24)
Sieving Area m2
0.0285 0.0670 0.0929 0.1225 0.2158 90 (3 1/2) * 15,100 20,900 27,600 48,500 75 (3) * 12,600 17,400 23,000 40,500 63 (2 1/2) * 10,600 14,600 19,300 34,000 50 (2) 3600 8400 11,600 15,300 27,000
37.5 (1 1/2) 2700 6300 8700 11,500 20.200 25.0 (1) 1800 4200 5800 7700 13,500 19.0 (3/4) 1400 3200 4400 5800 10,200 16.0 (5/8) 1100 2700 3700 4900 8600 12.5 (1/2) 890 2100 2900 3800 6700 9.5 (3/8) 670 1600 2200 2900 5100 6.3 (1/4) 440 1100 1500 1900 3400
4.75 (No. 4) 330 800 1100 1500 2600 -4.75 (-No. 4) 200 470 650 1200 1300
Procedure Method A 1. Dry the sample to a constant mass in accordance with the FOP for AASHTO T 255, and
record to the nearest 0.1 percent of the total sample mass or 0.1 g. 2. When the specification requires that the amount of material finer than 75 µm (No. 200)
be determined, perform Step 3 through Step 9 otherwise, skip to Step 10.
3. Nest a sieve, such as a 2.0 mm (No. 10), above the 75 µm (No. 200) sieve. 4. Place the test sample in a container and add sufficient water to cover it.
Note 1: A detergent, dispersing agent, or other wetting solution may be added to the water to assure a thorough separation of the material finer than the 75 µm (No. 200) sieve from the coarser particles. There should be enough wetting agent to produce a small amount of suds when the sample is agitated. Excessive suds may overflow the sieves and carry material away with them.
5. Agitate vigorously to ensure complete separation of the material finer than 75 µm (No. 200) from coarser particles and bring the fine material into suspension above the coarser material. When using a mechanical washing device, exercise caution to not degrade the sample.
6. Immediately pour the wash water containing the suspended and dissolved solids over the nested sieves, being careful not to pour out the coarser particles.
7. Add a second change of water to the sample remaining in the container, agitate, and repeat Step 6. Repeat the operation until the wash water is reasonably clear. If a detergent or dispersing agent is used, continue washing until the agent is removed.
T27_T11_short Aggregate 12-4 October 2006
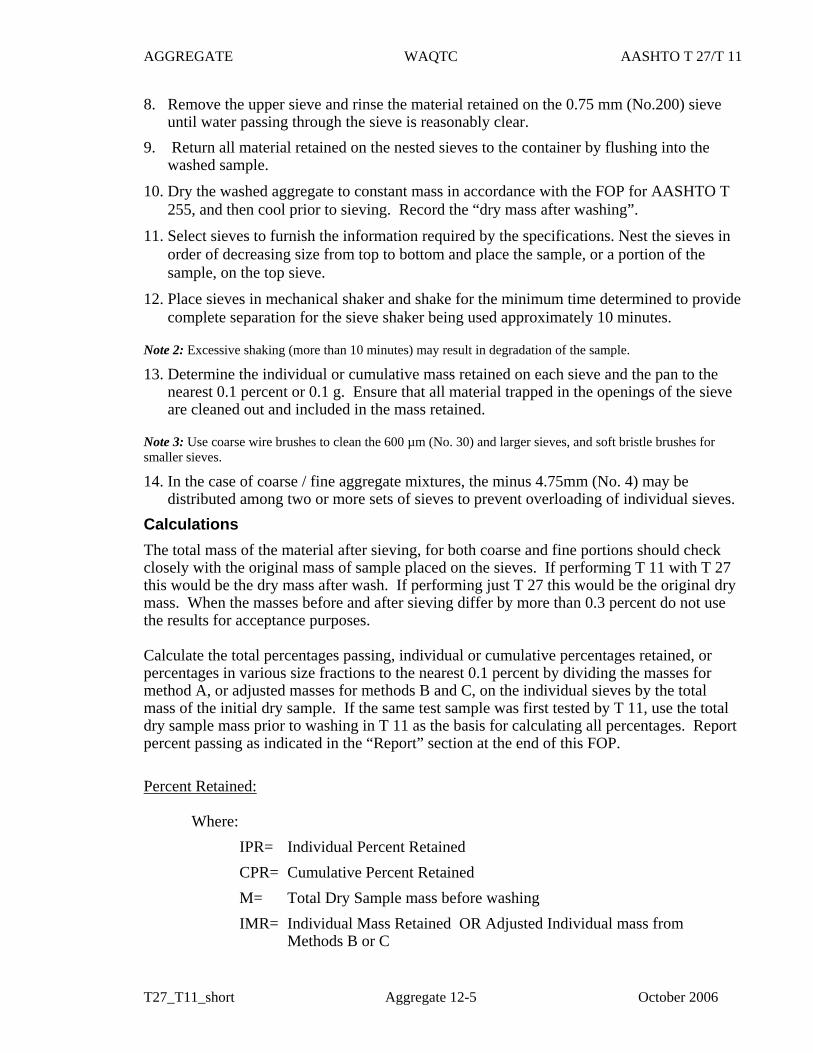
AGGREGATE WAQTC AASHTO T 27/T 11
8. Remove the upper sieve and rinse the material retained on the 0.75 mm (No.200) sieve until water passing through the sieve is reasonably clear.
9. Return all material retained on the nested sieves to the container by flushing into the washed sample.
10. Dry the washed aggregate to constant mass in accordance with the FOP for AASHTO T 255, and then cool prior to sieving. Record the “dry mass after washing”.
11. Select sieves to furnish the information required by the specifications. Nest the sieves in order of decreasing size from top to bottom and place the sample, or a portion of the sample, on the top sieve.
12. Place sieves in mechanical shaker and shake for the minimum time determined to provide complete separation for the sieve shaker being used approximately 10 minutes.
Note 2: Excessive shaking (more than 10 minutes) may result in degradation of the sample.
13. Determine the individual or cumulative mass retained on each sieve and the pan to the nearest 0.1 percent or 0.1 g. Ensure that all material trapped in the openings of the sieve are cleaned out and included in the mass retained.
Note 3: Use coarse wire brushes to clean the 600 µm (No. 30) and larger sieves, and soft bristle brushes for smaller sieves.
14. In the case of coarse / fine aggregate mixtures, the minus 4.75mm (No. 4) may be distributed among two or more sets of sieves to prevent overloading of individual sieves.
Calculations The total mass of the material after sieving, for both coarse and fine portions should check closely with the original mass of sample placed on the sieves. If performing T 11 with T 27 this would be the dry mass after wash. If performing just T 27 this would be the original dry mass. When the masses before and after sieving differ by more than 0.3 percent do not use the results for acceptance purposes. Calculate the total percentages passing, individual or cumulative percentages retained, or percentages in various size fractions to the nearest 0.1 percent by dividing the masses for method A, or adjusted masses for methods B and C, on the individual sieves by the total mass of the initial dry sample. If the same test sample was first tested by T 11, use the total dry sample mass prior to washing in T 11 as the basis for calculating all percentages. Report percent passing as indicated in the “Report” section at the end of this FOP. Percent Retained:
Where: IPR= Individual Percent Retained CPR= Cumulative Percent Retained M= Total Dry Sample mass before washing
IMR= Individual Mass Retained OR Adjusted Individual mass from Methods B or C
T27_T11_short Aggregate 12-5 October 2006
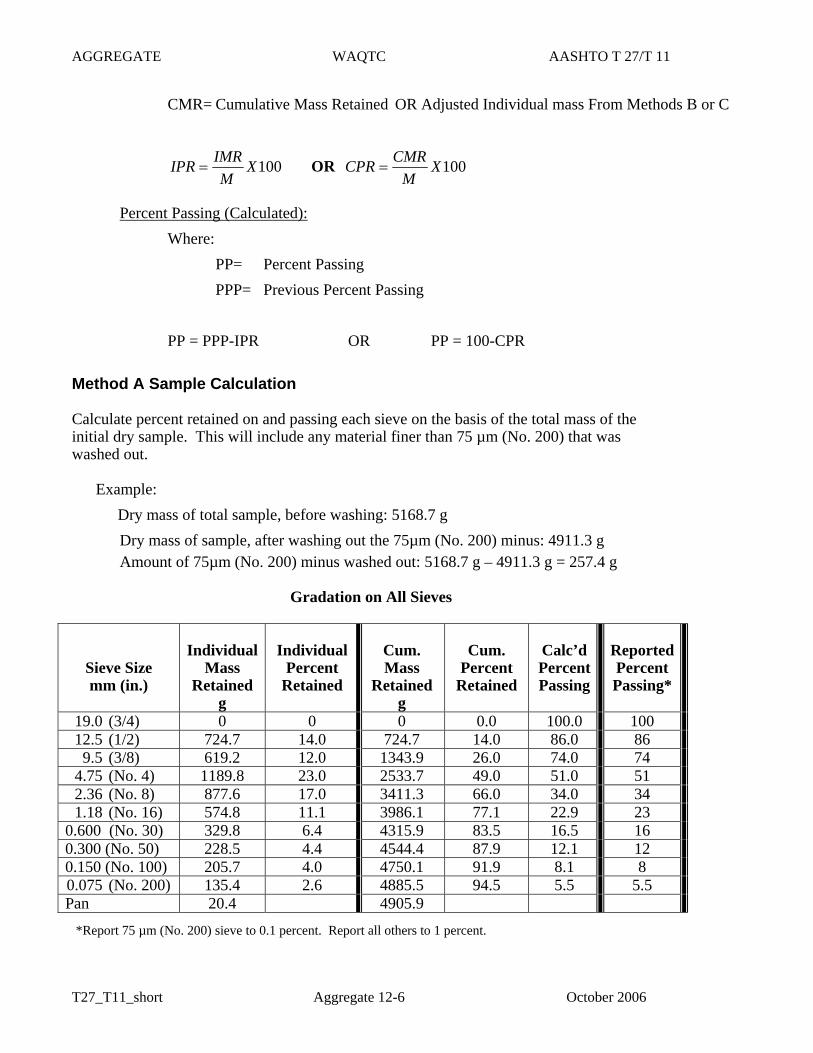
AGGREGATE WAQTC AASHTO T 27/T 11
CMR= Cumulative Mass Retained OR Adjusted Individual mass From Methods B or C
100XM
IMRIPR = OR 100XM
CMRCPR =
Percent Passing (Calculated): Where: PP= Percent Passing PPP= Previous Percent Passing PP = PPP-IPR OR PP = 100-CPR
Method A Sample Calculation Calculate percent retained on and passing each sieve on the basis of the total mass of the initial dry sample. This will include any material finer than 75 µm (No. 200) that was washed out.
Example:
Dry mass of total sample, before washing: 5168.7 g Dry mass of sample, after washing out the 75µm (No. 200) minus: 4911.3 g Amount of 75µm (No. 200) minus washed out: 5168.7 g – 4911.3 g = 257.4 g
Gradation on All Sieves
Sieve Size mm (in.)
Individual
Mass Retained
g
Individual
Percent Retained
Cum. Mass
Retained g
Cum.
Percent Retained
Calc’d Percent Passing
ReportedPercent Passing*
19.0 (3/4) 0 0 0 0.0 100.0 100 12.5 (1/2) 724.7 14.0 724.7 14.0 86.0 86 9.5 (3/8) 619.2 12.0 1343.9 26.0 74.0 74 4.75 (No. 4) 1189.8 23.0 2533.7 49.0 51.0 51 2.36 (No. 8) 877.6 17.0 3411.3 66.0 34.0 34 1.18 (No. 16) 574.8 11.1 3986.1 77.1 22.9 23 0.600 (No. 30) 329.8 6.4 4315.9 83.5 16.5 16 0.300 (No. 50) 228.5 4.4 4544.4 87.9 12.1 12 0.150 (No. 100) 205.7 4.0 4750.1 91.9 8.1 8 0.075 (No. 200) 135.4 2.6 4885.5 94.5 5.5 5.5 Pan 20.4 4905.9
*Report 75 µm (No. 200) sieve to 0.1 percent. Report all others to 1 percent.
T27_T11_short Aggregate 12-6 October 2006
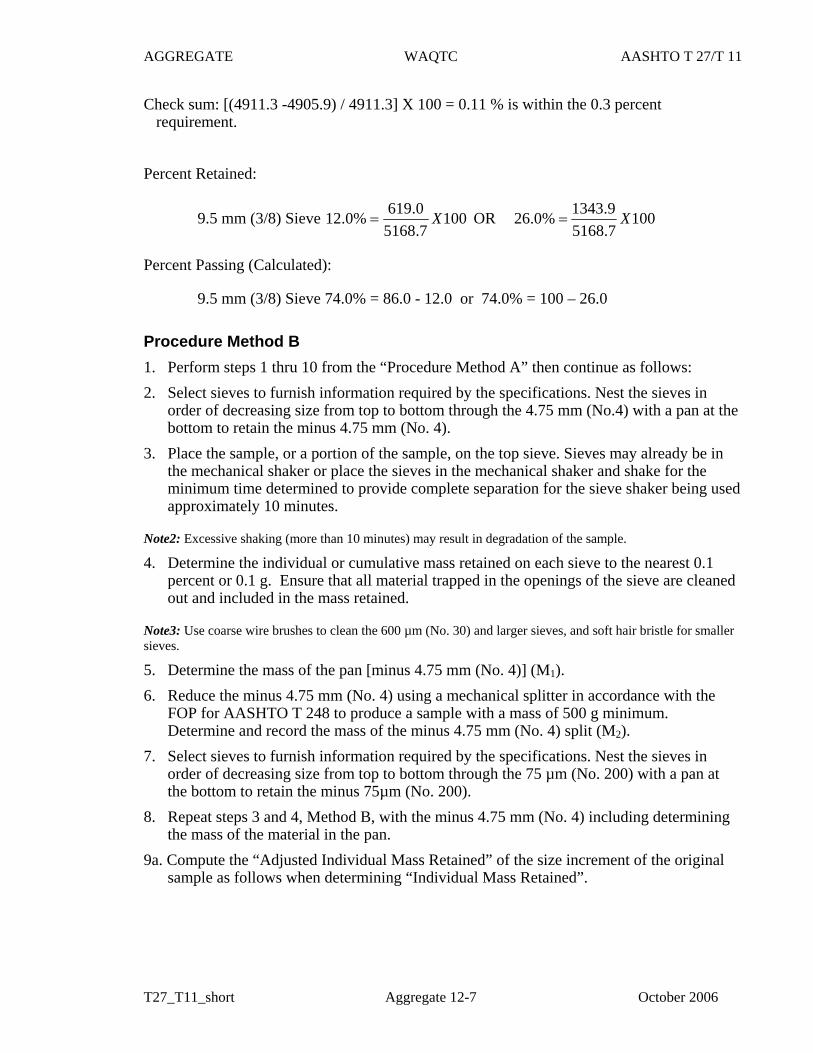
AGGREGATE WAQTC AASHTO T 27/T 11
Check sum: [(4911.3 -4905.9) / 4911.3] X 100 = 0.11 % is within the 0.3 percent requirement.
Percent Retained:
9.5 mm (3/8) Sieve 1007.51680.619%0.12 X= OR 100
7.51689.1343%0.26 X=
Percent Passing (Calculated):
9.5 mm (3/8) Sieve 74.0% = 86.0 - 12.0 or 74.0% = 100 – 26.0 Procedure Method B 1. Perform steps 1 thru 10 from the “Procedure Method A” then continue as follows: 2. Select sieves to furnish information required by the specifications. Nest the sieves in
order of decreasing size from top to bottom through the 4.75 mm (No.4) with a pan at the bottom to retain the minus 4.75 mm (No. 4).
3. Place the sample, or a portion of the sample, on the top sieve. Sieves may already be in the mechanical shaker or place the sieves in the mechanical shaker and shake for the minimum time determined to provide complete separation for the sieve shaker being used approximately 10 minutes.
Note2: Excessive shaking (more than 10 minutes) may result in degradation of the sample.
4. Determine the individual or cumulative mass retained on each sieve to the nearest 0.1 percent or 0.1 g. Ensure that all material trapped in the openings of the sieve are cleaned out and included in the mass retained.
Note3: Use coarse wire brushes to clean the 600 µm (No. 30) and larger sieves, and soft hair bristle for smaller sieves.
5. Determine the mass of the pan [minus 4.75 mm (No. 4)] (M1). 6. Reduce the minus 4.75 mm (No. 4) using a mechanical splitter in accordance with the
FOP for AASHTO T 248 to produce a sample with a mass of 500 g minimum. Determine and record the mass of the minus 4.75 mm (No. 4) split (M2).
7. Select sieves to furnish information required by the specifications. Nest the sieves in order of decreasing size from top to bottom through the 75 µm (No. 200) with a pan at the bottom to retain the minus 75µm (No. 200).
8. Repeat steps 3 and 4, Method B, with the minus 4.75 mm (No. 4) including determining the mass of the material in the pan.
9a. Compute the “Adjusted Individual Mass Retained” of the size increment of the original sample as follows when determining “Individual Mass Retained”.
T27_T11_short Aggregate 12-7 October 2006
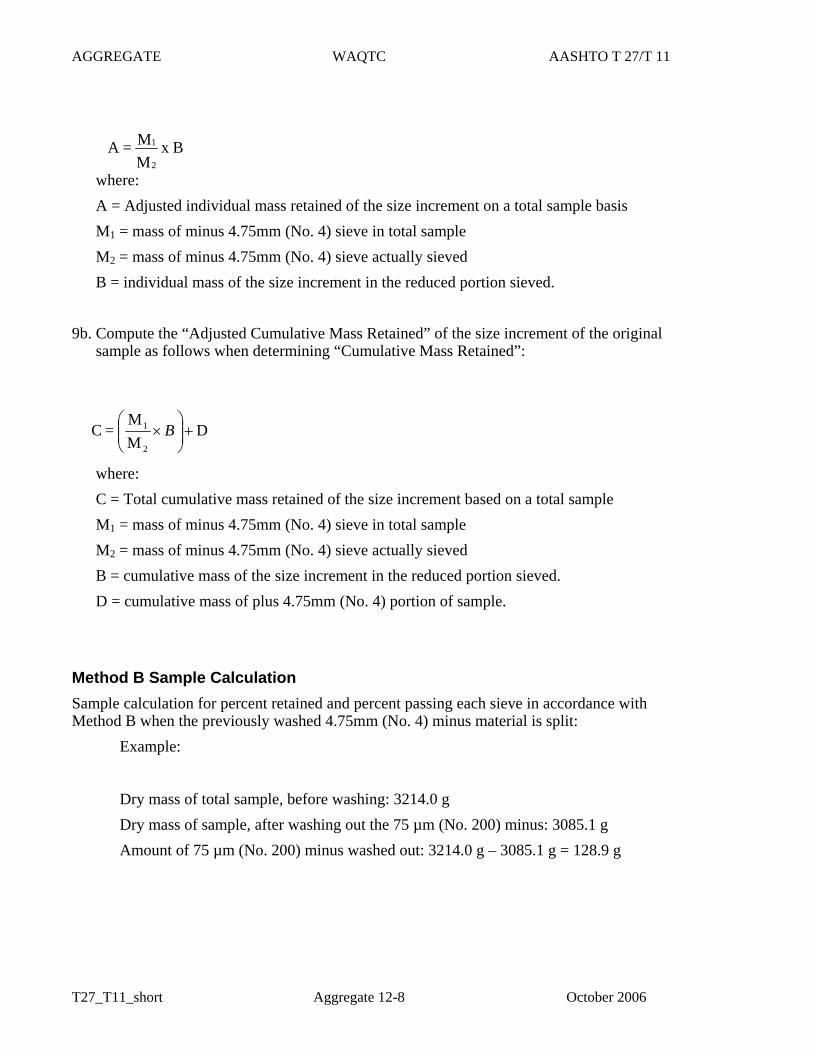
AGGREGATE WAQTC AASHTO T 27/T 11
where:
B x MM =A
2
1
A = Adjusted individual mass retained of the size increment on a total sample basis M1 = mass of minus 4.75mm (No. 4) sieve in total sample M2 = mass of minus 4.75mm (No. 4) sieve actually sieved B = individual mass of the size increment in the reduced portion sieved.
9b. Compute the “Adjusted Cumulative Mass Retained” of the size increment of the original sample as follows when determining “Cumulative Mass Retained”:
DMM
= C2
1 +⎟⎟⎠
⎞⎜⎜⎝
⎛×B
where: C = Total cumulative mass retained of the size increment based on a total sample M1 = mass of minus 4.75mm (No. 4) sieve in total sample M2 = mass of minus 4.75mm (No. 4) sieve actually sieved B = cumulative mass of the size increment in the reduced portion sieved. D = cumulative mass of plus 4.75mm (No. 4) portion of sample.
Method B Sample Calculation Sample calculation for percent retained and percent passing each sieve in accordance with Method B when the previously washed 4.75mm (No. 4) minus material is split:
Example: Dry mass of total sample, before washing: 3214.0 g Dry mass of sample, after washing out the 75 µm (No. 200) minus: 3085.1 g Amount of 75 µm (No. 200) minus washed out: 3214.0 g – 3085.1 g = 128.9 g
T27_T11_short Aggregate 12-8 October 2006
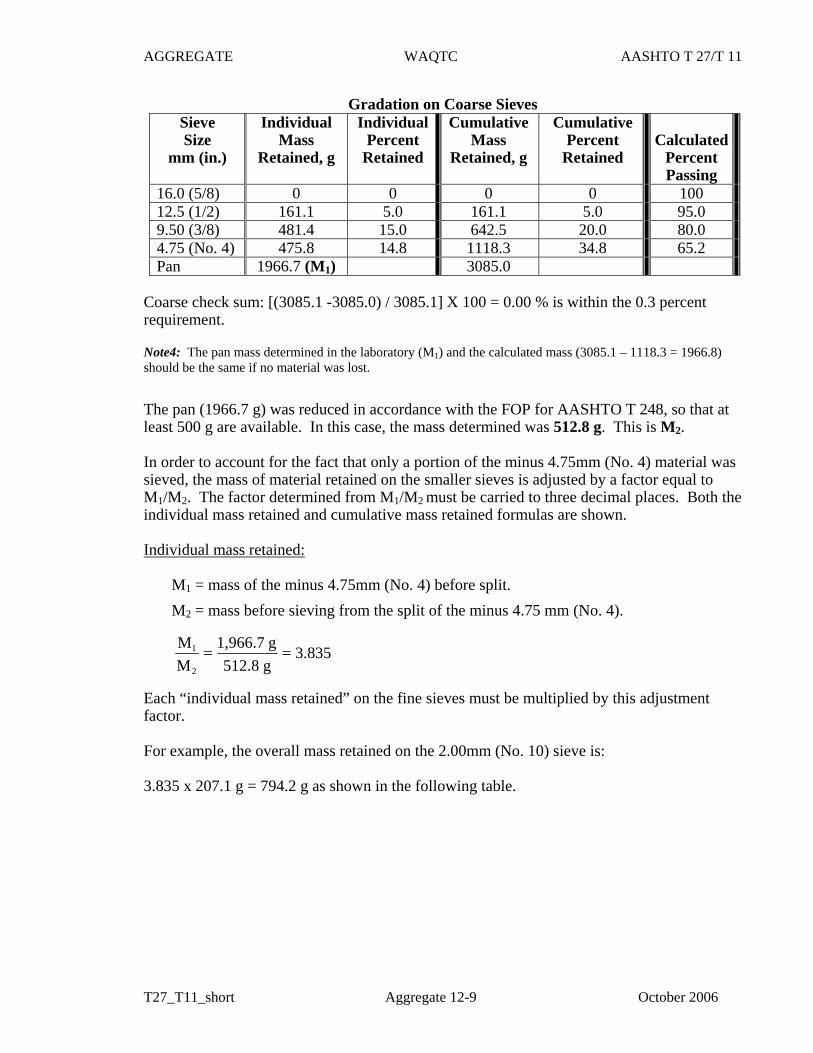
AGGREGATE WAQTC AASHTO T 27/T 11
Gradation on Coarse Sieves Sieve Size
mm (in.)
Individual Mass
Retained, g
IndividualPercent
Retained
Cumulative Mass
Retained, g
Cumulative Percent
Retained
Calculated
Percent Passing
16.0 (5/8) 0 0 0 0 100 12.5 (1/2) 161.1 5.0 161.1 5.0 95.0 9.50 (3/8) 481.4 15.0 642.5 20.0 80.0 4.75 (No. 4) 475.8 14.8 1118.3 34.8 65.2 Pan 1966.7 (M1) 3085.0
Coarse check sum: [(3085.1 -3085.0) / 3085.1] X 100 = 0.00 % is within the 0.3 percent requirement.
Note4: The pan mass determined in the laboratory (M ) and the calculated mass (3085.1 – 1118.3 = 1966.8) should be the same if no material was lost.
1
The pan (1966.7 g) was reduced in accordance with the FOP for AASHTO T 248, so that at least 500 g are available. In this case, the mass determined was 512.8 g. This is M2.
In order to account for the fact that only a portion of the minus 4.75mm (No. 4) material was sieved, the mass of material retained on the smaller sieves is adjusted by a factor equal to M1/M2. The factor determined from M1/M2 must be carried to three decimal places. Both the individual mass retained and cumulative mass retained formulas are shown.
Individual mass retained:
M1 = mass of the minus 4.75mm (No. 4) before split. M2 = mass before sieving from the split of the minus 4.75 mm (No. 4).
3.835g 512.8 g 1,966.7
M M
2 1 = =
Each “individual mass retained” on the fine sieves must be multiplied by this adjustment factor. For example, the overall mass retained on the 2.00mm (No. 10) sieve is: 3.835 x 207.1 g = 794.2 g as shown in the following table.
T27_T11_short Aggregate 12-9 October 2006
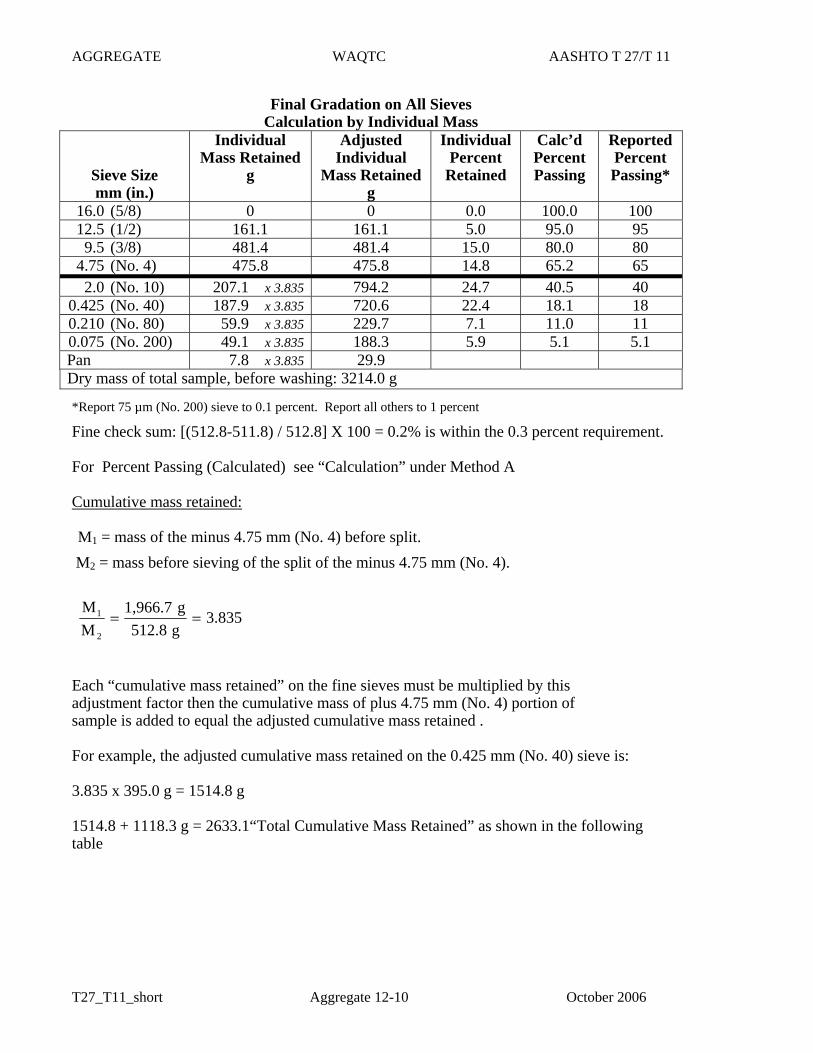
AGGREGATE WAQTC AASHTO T 27/T 11
Final Gradation on All Sieves Calculation by Individual Mass
Sieve Size mm (in.)
Individual Mass Retained
g
Adjusted Individual
Mass Retained g
Individual Percent
Retained
Calc’d Percent Passing
Reported Percent Passing*
16.0 (5/8) 0 0 0.0 100.0 100 12.5 (1/2) 161.1 161.1 5.0 95.0 95 9.5 (3/8) 481.4 481.4 15.0 80.0 80 4.75 (No. 4) 475.8 475.8 14.8 65.2 65 2.0 (No. 10) 207.1 x 3.835 794.2 24.7 40.5 40 0.425 (No. 40) 187.9 x 3.835 720.6 22.4 18.1 18 0.210 (No. 80) 59.9 x 3.835 229.7 7.1 11.0 11 0.075 (No. 200) 49.1 x 3.835 188.3 5.9 5.1 5.1 Pan 7.8 x 3.835 29.9 Dry mass of total sample, before washing: 3214.0 g
*Report 75 µm (No. 200) sieve to 0.1 percent. Report all others to 1 percent
Fine check sum: [(512.8-511.8) / 512.8] X 100 = 0.2% is within the 0.3 percent requirement. For Percent Passing (Calculated) see “Calculation” under Method A Cumulative mass retained: M1 = mass of the minus 4.75 mm (No. 4) before split.
M2 = mass before sieving of the split of the minus 4.75 mm (No. 4).
3.835g512.8g1,966.7
MM
2
1 == Each “cumulative mass retained” on the fine sieves must be multiplied by this adjustment factor then the cumulative mass of plus 4.75 mm (No. 4) portion of sample is added to equal the adjusted cumulative mass retained . For example, the adjusted cumulative mass retained on the 0.425 mm (No. 40) sieve is: 3.835 x 395.0 g = 1514.8 g 1514.8 + 1118.3 g = 2633.1“Total Cumulative Mass Retained” as shown in the following table
T27_T11_short Aggregate 12-10 October 2006
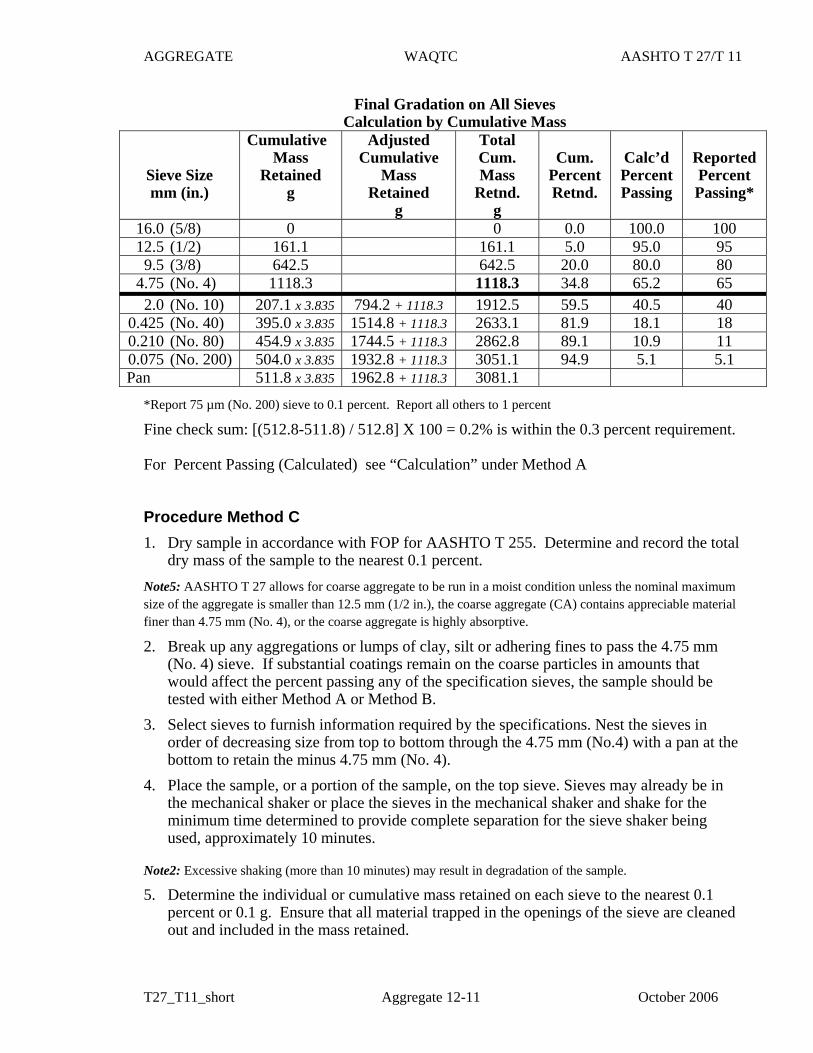
AGGREGATE WAQTC AASHTO T 27/T 11
Final Gradation on All Sieves Calculation by Cumulative Mass
Sieve Size mm (in.)
Cumulative Mass
Retained g
Adjusted Cumulative
Mass Retained
g
Total Cum. Mass
Retnd. g
Cum.
Percent Retnd.
Calc’d Percent Passing
Reported Percent Passing*
16.0 (5/8) 0 0 0.0 100.0 100 12.5 (1/2) 161.1 161.1 5.0 95.0 95 9.5 (3/8) 642.5 642.5 20.0 80.0 80 4.75 (No. 4) 1118.3 1118.3 34.8 65.2 65 2.0 (No. 10) 207.1 x 3.835 794.2 + 1118.3 1912.5 59.5 40.5 40 0.425 (No. 40) 395.0 x 3.835 1514.8 + 1118.3 2633.1 81.9 18.1 18 0.210 (No. 80) 454.9 x 3.835 1744.5 + 1118.3 2862.8 89.1 10.9 11 0.075 (No. 200) 504.0 x 3.835 1932.8 + 1118.3 3051.1 94.9 5.1 5.1 Pan 511.8 x 3.835 1962.8 + 1118.3 3081.1
*Report 75 µm (No. 200) sieve to 0.1 percent. Report all others to 1 percent
Fine check sum: [(512.8-511.8) / 512.8] X 100 = 0.2% is within the 0.3 percent requirement. For Percent Passing (Calculated) see “Calculation” under Method A Procedure Method C 1. Dry sample in accordance with FOP for AASHTO T 255. Determine and record the total
dry mass of the sample to the nearest 0.1 percent. Note5: AASHTO T 27 allows for coarse aggregate to be run in a moist condition unless the nominal maximum size of the aggregate is smaller than 12.5 mm (1/2 in.), the coarse aggregate (CA) contains appreciable material finer than 4.75 mm (No. 4), or the coarse aggregate is highly absorptive.
2. Break up any aggregations or lumps of clay, silt or adhering fines to pass the 4.75 mm (No. 4) sieve. If substantial coatings remain on the coarse particles in amounts that would affect the percent passing any of the specification sieves, the sample should be tested with either Method A or Method B.
3. Select sieves to furnish information required by the specifications. Nest the sieves in order of decreasing size from top to bottom through the 4.75 mm (No.4) with a pan at the bottom to retain the minus 4.75 mm (No. 4).
4. Place the sample, or a portion of the sample, on the top sieve. Sieves may already be in the mechanical shaker or place the sieves in the mechanical shaker and shake for the minimum time determined to provide complete separation for the sieve shaker being used, approximately 10 minutes.
Note2: Excessive shaking (more than 10 minutes) may result in degradation of the sample.
5. Determine the individual or cumulative mass retained on each sieve to the nearest 0.1 percent or 0.1 g. Ensure that all material trapped in the openings of the sieve are cleaned out and included in the mass retained.
T27_T11_short Aggregate 12-11 October 2006
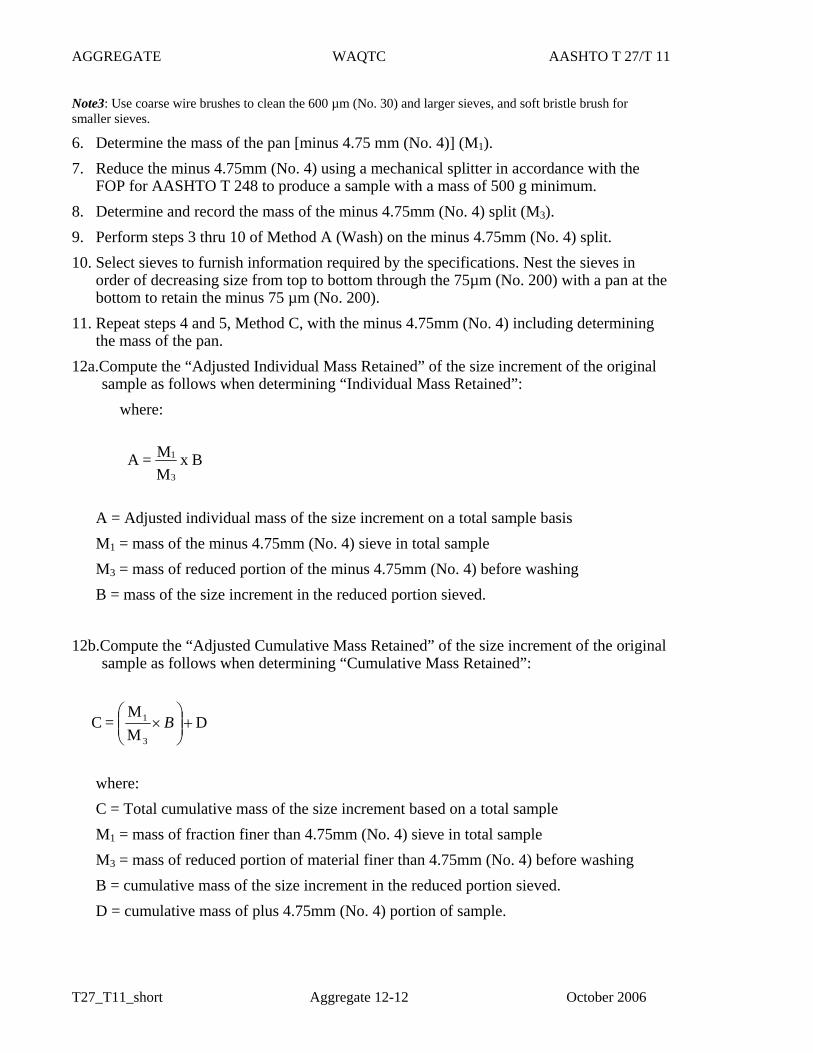
AGGREGATE WAQTC AASHTO T 27/T 11
Note3: Use coarse wire brushes to clean the 600 µm (No. 30) and larger sieves, and soft bristle brush for smaller sieves.
6. Determine the mass of the pan [minus 4.75 mm (No. 4)] (M1). 7. Reduce the minus 4.75mm (No. 4) using a mechanical splitter in accordance with the
FOP for AASHTO T 248 to produce a sample with a mass of 500 g minimum. 8. Determine and record the mass of the minus 4.75mm (No. 4) split (M3). 9. Perform steps 3 thru 10 of Method A (Wash) on the minus 4.75mm (No. 4) split. 10. Select sieves to furnish information required by the specifications. Nest the sieves in
order of decreasing size from top to bottom through the 75µm (No. 200) with a pan at the bottom to retain the minus 75 µm (No. 200).
11. Repeat steps 4 and 5, Method C, with the minus 4.75mm (No. 4) including determining the mass of the pan.
12a.Compute the “Adjusted Individual Mass Retained” of the size increment of the original sample as follows when determining “Individual Mass Retained”:
where:
B x MM =A
3
1
A = Adjusted individual mass of the size increment on a total sample basis M1 = mass of the minus 4.75mm (No. 4) sieve in total sample M3 = mass of reduced portion of the minus 4.75mm (No. 4) before washing B = mass of the size increment in the reduced portion sieved.
12b.Compute the “Adjusted Cumulative Mass Retained” of the size increment of the original
sample as follows when determining “Cumulative Mass Retained”:
DMM
= C3
1 +⎟⎟⎠
⎞⎜⎜⎝
⎛×B
where: C = Total cumulative mass of the size increment based on a total sample M1 = mass of fraction finer than 4.75mm (No. 4) sieve in total sample M3 = mass of reduced portion of material finer than 4.75mm (No. 4) before washing B = cumulative mass of the size increment in the reduced portion sieved. D = cumulative mass of plus 4.75mm (No. 4) portion of sample.
T27_T11_short Aggregate 12-12 October 2006
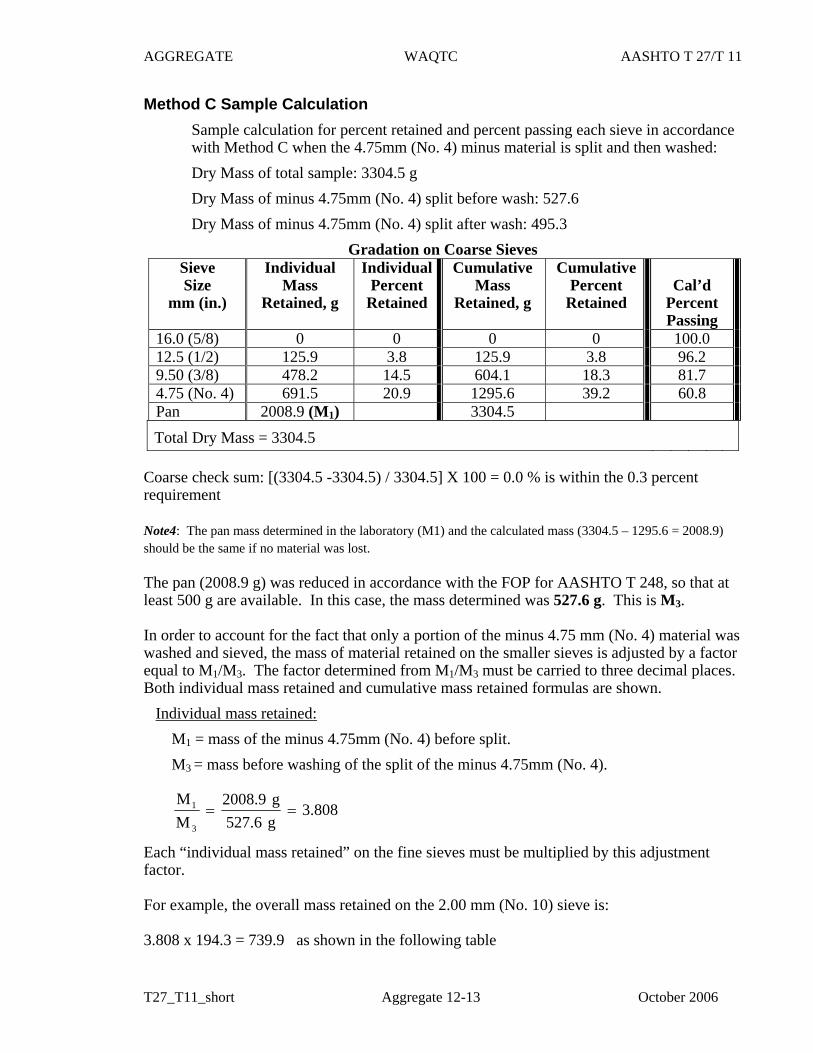
AGGREGATE WAQTC AASHTO T 27/T 11
Method C Sample Calculation Sample calculation for percent retained and percent passing each sieve in accordance with Method C when the 4.75mm (No. 4) minus material is split and then washed: Dry Mass of total sample: 3304.5 g Dry Mass of minus 4.75mm (No. 4) split before wash: 527.6 Dry Mass of minus 4.75mm (No. 4) split after wash: 495.3
Gradation on Coarse Sieves Sieve Size
mm (in.)
Individual Mass
Retained, g
IndividualPercent
Retained
Cumulative Mass
Retained, g
Cumulative Percent
Retained
Cal’d
Percent Passing
16.0 (5/8) 0 0 0 0 100.0 12.5 (1/2) 125.9 3.8 125.9 3.8 96.2 9.50 (3/8) 478.2 14.5 604.1 18.3 81.7 4.75 (No. 4) 691.5 20.9 1295.6 39.2 60.8 Pan 2008.9 (M1) 3304.5 Total Dry Mass = 3304.5
Coarse check sum: [(3304.5 -3304.5) / 3304.5] X 100 = 0.0 % is within the 0.3 percent requirement Note4: The pan mass determined in the laboratory (M1) and the calculated mass (3304.5 – 1295.6 = 2008.9) should be the same if no material was lost.
The pan (2008.9 g) was reduced in accordance with the FOP for AASHTO T 248, so that at least 500 g are available. In this case, the mass determined was 527.6 g. This is M3.
In order to account for the fact that only a portion of the minus 4.75 mm (No. 4) material was washed and sieved, the mass of material retained on the smaller sieves is adjusted by a factor equal to M1/M3. The factor determined from M1/M3 must be carried to three decimal places. Both individual mass retained and cumulative mass retained formulas are shown.
Individual mass retained: M1 = mass of the minus 4.75mm (No. 4) before split. M3 = mass before washing of the split of the minus 4.75mm (No. 4).
3.808
g527.6g2008.9
MM
3
1 == Each “individual mass retained” on the fine sieves must be multiplied by this adjustment factor. For example, the overall mass retained on the 2.00 mm (No. 10) sieve is: 3.808 x 194.3 = 739.9 as shown in the following table
T27_T11_short Aggregate 12-13 October 2006
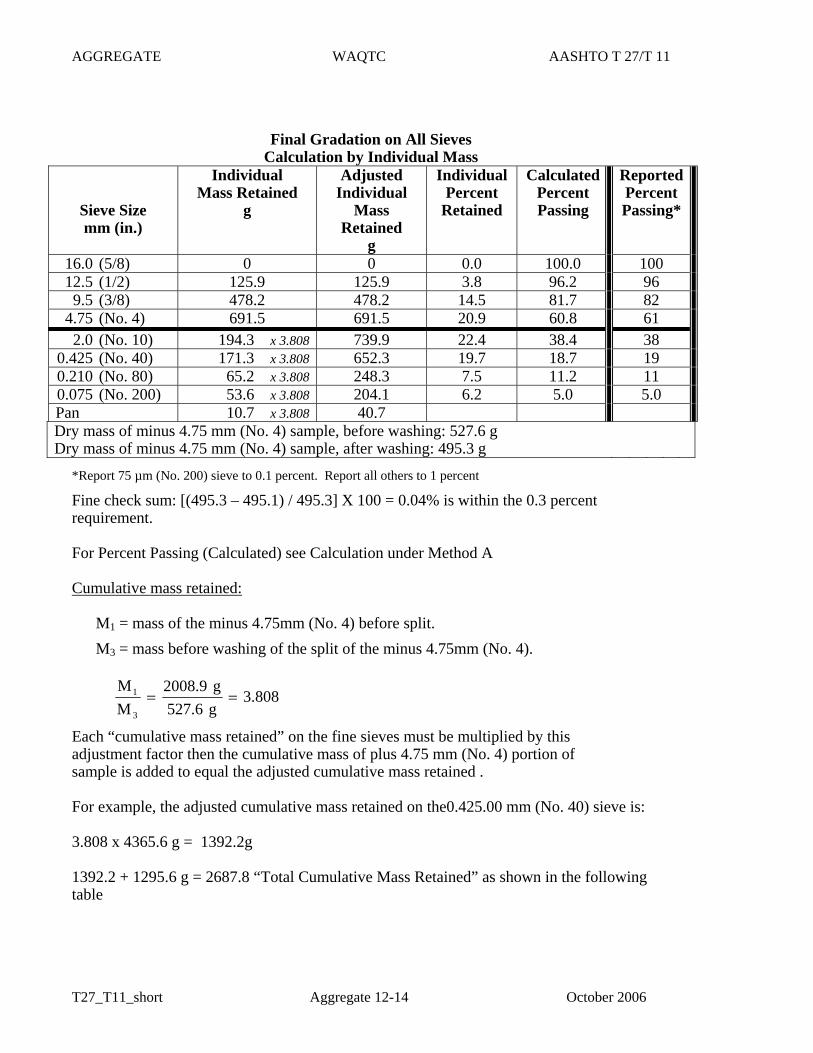
AGGREGATE WAQTC AASHTO T 27/T 11
Final Gradation on All Sieves Calculation by Individual Mass
Sieve Size mm (in.)
Individual Mass Retained
g
Adjusted Individual
Mass Retained
g
Individual Percent
Retained
Calculated Percent Passing
ReportedPercent Passing*
16.0 (5/8) 0 0 0.0 100.0 100 12.5 (1/2) 125.9 125.9 3.8 96.2 96 9.5 (3/8) 478.2 478.2 14.5 81.7 82 4.75 (No. 4) 691.5 691.5 20.9 60.8 61 2.0 (No. 10) 194.3 x 3.808 739.9 22.4 38.4 38 0.425 (No. 40) 171.3 x 3.808 652.3 19.7 18.7 19 0.210 (No. 80) 65.2 x 3.808 248.3 7.5 11.2 11 0.075 (No. 200) 53.6 x 3.808 204.1 6.2 5.0 5.0 Pan 10.7 x 3.808 40.7 Dry mass of minus 4.75 mm (No. 4) sample, before washing: 527.6 g Dry mass of minus 4.75 mm (No. 4) sample, after washing: 495.3 g
*Report 75 µm (No. 200) sieve to 0.1 percent. Report all others to 1 percent Fine check sum: [(495.3 – 495.1) / 495.3] X 100 = 0.04% is within the 0.3 percent requirement. For Percent Passing (Calculated) see Calculation under Method A Cumulative mass retained:
M1 = mass of the minus 4.75mm (No. 4) before split. M3 = mass before washing of the split of the minus 4.75mm (No. 4).
3.808g527.6g2008.9
MM
3
1 == Each “cumulative mass retained” on the fine sieves must be multiplied by this adjustment factor then the cumulative mass of plus 4.75 mm (No. 4) portion of sample is added to equal the adjusted cumulative mass retained . For example, the adjusted cumulative mass retained on the0.425.00 mm (No. 40) sieve is: 3.808 x 4365.6 g = 1392.2g 1392.2 + 1295.6 g = 2687.8 “Total Cumulative Mass Retained” as shown in the following table
T27_T11_short Aggregate 12-14 October 2006
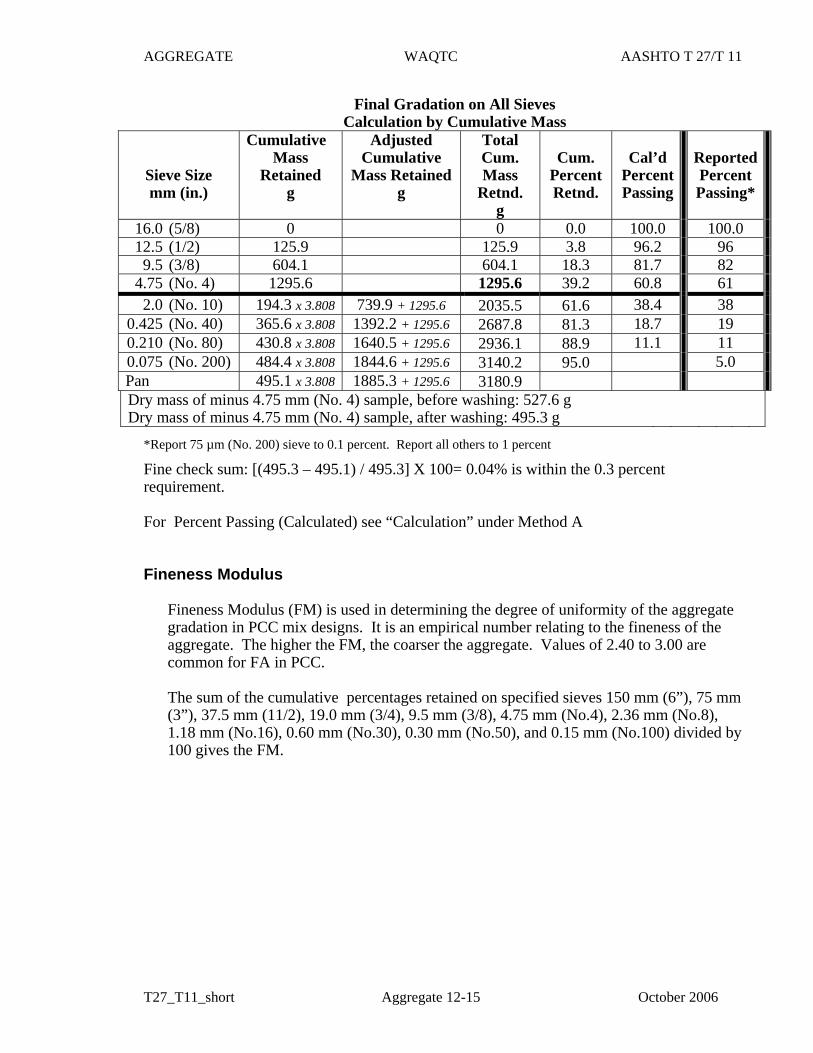
AGGREGATE WAQTC AASHTO T 27/T 11
Final Gradation on All Sieves Calculation by Cumulative Mass
Sieve Size mm (in.)
Cumulative Mass
Retained g
Adjusted Cumulative
Mass Retained g
Total Cum. Mass
Retnd. g
Cum.
Percent Retnd.
Cal’d
PercentPassing
ReportedPercent Passing*
16.0 (5/8) 0 0 0.0 100.0 100.0 12.5 (1/2) 125.9 125.9 3.8 96.2 96 9.5 (3/8) 604.1 604.1 18.3 81.7 82 4.75 (No. 4) 1295.6 1295.6 39.2 60.8 61 2.0 (No. 10) 194.3 x 3.808 739.9 + 1295.6 2035.5 61.6 38.4 38 0.425 (No. 40) 365.6 x 3.808 1392.2 + 1295.6 2687.8 81.3 18.7 19 0.210 (No. 80) 430.8 x 3.808 1640.5 + 1295.6 2936.1 88.9 11.1 11 0.075 (No. 200) 484.4 x 3.808 1844.6 + 1295.6 3140.2 95.0 5.0 Pan 495.1 x 3.808 1885.3 + 1295.6 3180.9 Dry mass of minus 4.75 mm (No. 4) sample, before washing: 527.6 g Dry mass of minus 4.75 mm (No. 4) sample, after washing: 495.3 g
*Report 75 µm (No. 200) sieve to 0.1 percent. Report all others to 1 percent
Fine check sum: [(495.3 – 495.1) / 495.3] X 100= 0.04% is within the 0.3 percent requirement. For Percent Passing (Calculated) see “Calculation” under Method A Fineness Modulus
Fineness Modulus (FM) is used in determining the degree of uniformity of the aggregate gradation in PCC mix designs. It is an empirical number relating to the fineness of the aggregate. The higher the FM, the coarser the aggregate. Values of 2.40 to 3.00 are common for FA in PCC. The sum of the cumulative percentages retained on specified sieves 150 mm (6”), 75 mm (3”), 37.5 mm (11/2), 19.0 mm (3/4), 9.5 mm (3/8), 4.75 mm (No.4), 2.36 mm (No.8), 1.18 mm (No.16), 0.60 mm (No.30), 0.30 mm (No.50), and 0.15 mm (No.100) divided by 100 gives the FM.
T27_T11_short Aggregate 12-15 October 2006
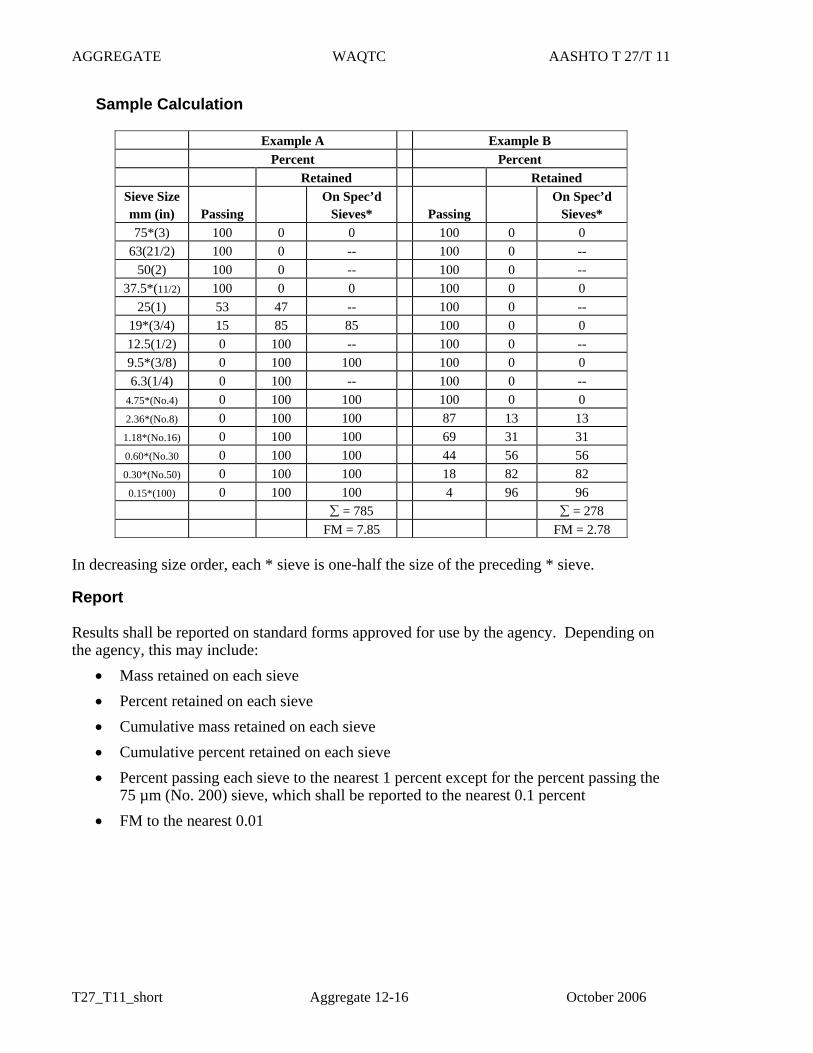
AGGREGATE WAQTC AASHTO T 27/T 11
Sample Calculation
Example A Example B Percent Percent Retained Retained
Sieve Size mm (in)
Passing
On Spec’d Sieves*
Passing
On Spec’d Sieves*
75*(3) 100 0 0 100 0 0 63(21/2) 100 0 -- 100 0 --
50(2) 100 0 -- 100 0 -- 37.5*(11/2) 100 0 0 100 0 0
25(1) 53 47 -- 100 0 -- 19*(3/4) 15 85 85 100 0 0 12.5(1/2) 0 100 -- 100 0 -- 9.5*(3/8) 0 100 100 100 0 0 6.3(1/4) 0 100 -- 100 0 --
4.75*(No.4) 0 100 100 100 0 0 2.36*(No.8) 0 100 100 87 13 13 1.18*(No.16) 0 100 100 69 31 31 0.60*(No.30 0 100 100 44 56 56 0.30*(No.50) 0 100 100 18 82 82 0.15*(100) 0 100 100 4 96 96
∑ = 785 ∑ = 278 FM = 7.85 FM = 2.78
In decreasing size order, each * sieve is one-half the size of the preceding * sieve. Report Results shall be reported on standard forms approved for use by the agency. Depending on the agency, this may include:
• Mass retained on each sieve • Percent retained on each sieve • Cumulative mass retained on each sieve • Cumulative percent retained on each sieve • Percent passing each sieve to the nearest 1 percent except for the percent passing the
75 µm (No. 200) sieve, which shall be reported to the nearest 0.1 percent • FM to the nearest 0.01
T27_T11_short Aggregate 12-16 October 2006
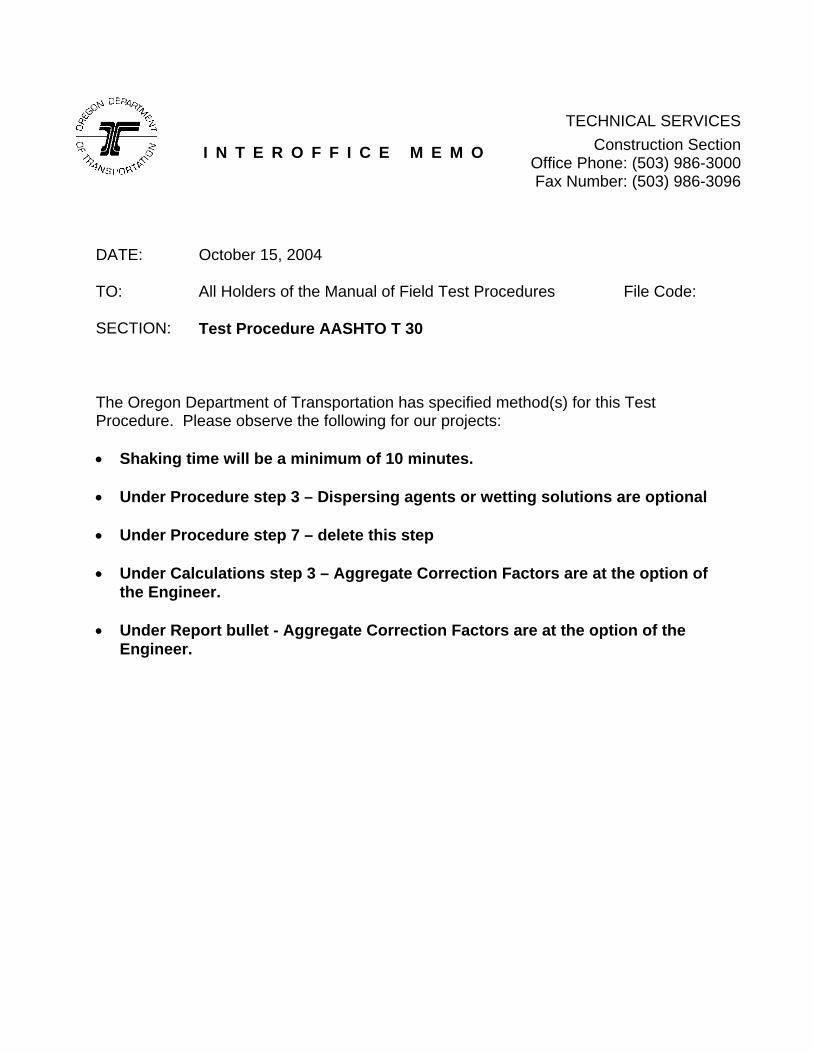
I N T E R O F F I C E M E M O
TECHNICAL SERVICESConstruction Section
Office Phone: (503) 986-3000Fax Number: (503) 986-3096
DATE: October 15, 2004 TO: All Holders of the Manual of Field Test Procedures File Code: SECTION: Test Procedure AASHTO T 30
The Oregon Department of Transportation has specified method(s) for this Test Procedure. Please observe the following for our projects: • Shaking time will be a minimum of 10 minutes. • Under Procedure step 3 – Dispersing agents or wetting solutions are optional • Under Procedure step 7 – delete this step • Under Calculations step 3 – Aggregate Correction Factors are at the option of
the Engineer. • Under Report bullet - Aggregate Correction Factors are at the option of the
Engineer.

ASPHALT WAQTC AASHTO T 30
MECHANICAL ANALYSIS OF EXTRACTED AGGREGATE FOP FOR AASHTO T 30 Scope This procedure covers mechanical analysis of aggregate recovered from bituminous mix samples in accordance with AASHTO T 30. This FOP utilizes the aggregate recovered from the ignition oven used in AASHTO T 308. AASHTO T 30 was developed for analysis of extracted aggregate and, thus, includes references to extracted bitumen and filter element, which do not apply in this FOP. Sieve analyses determine the gradation or distribution of aggregate particles within a given sample in order to determine compliance with design and production standards. Apparatus • Balance or scale: capacity sufficient for the sample mass, accurate to 0.1 percent of the
sample mass or readable to 0.1 g • Sieves • Mechanical sieve shaker • Suitable drying equipment (see FOP for AASHTO T 255) • Containers and utensils – a pan or vessel of a size sufficient to contain the sample
covered with water and to permit vigorous agitation without loss of any part of the sample or water
Sample Sieving In all procedures it is required to shake the sample over nested sieves. Sieves are selected to furnish information required by specification. The sieves are nested in order of decreasing size from the top to the bottom and the sample, or a portion of the sample, is placed on the top sieve. Sieves are shaken in a mechanical shaker for approximately 10 minutes, or the minimum time determined to provide complete separation for the sieve shaker being used. Time Evaluation The minimum time requirement should be evaluated for each shaker at least annually, by the following method: Continue shaking for a sufficient period and in such a manner that, after completion, not more than 0.5 percent by mass of the total sample passes any sieve during one minute of continuous hand sieving. Provide a snug-fitting pan and cover, and hold in a slightly inclined position in one hand. Strike the side of the sieve sharply and with an upward motion against the heel of the other hand at the rate of about 150 times per minute, turning the sieve about one sixth of a revolution at intervals of about 25 strokes. In determining sufficiency of sieving for sizes larger than 4.75 mm (No. 4), limit the material on the sieve to a single layer of particles.
T30_short Asphalt 20-1 October 2006
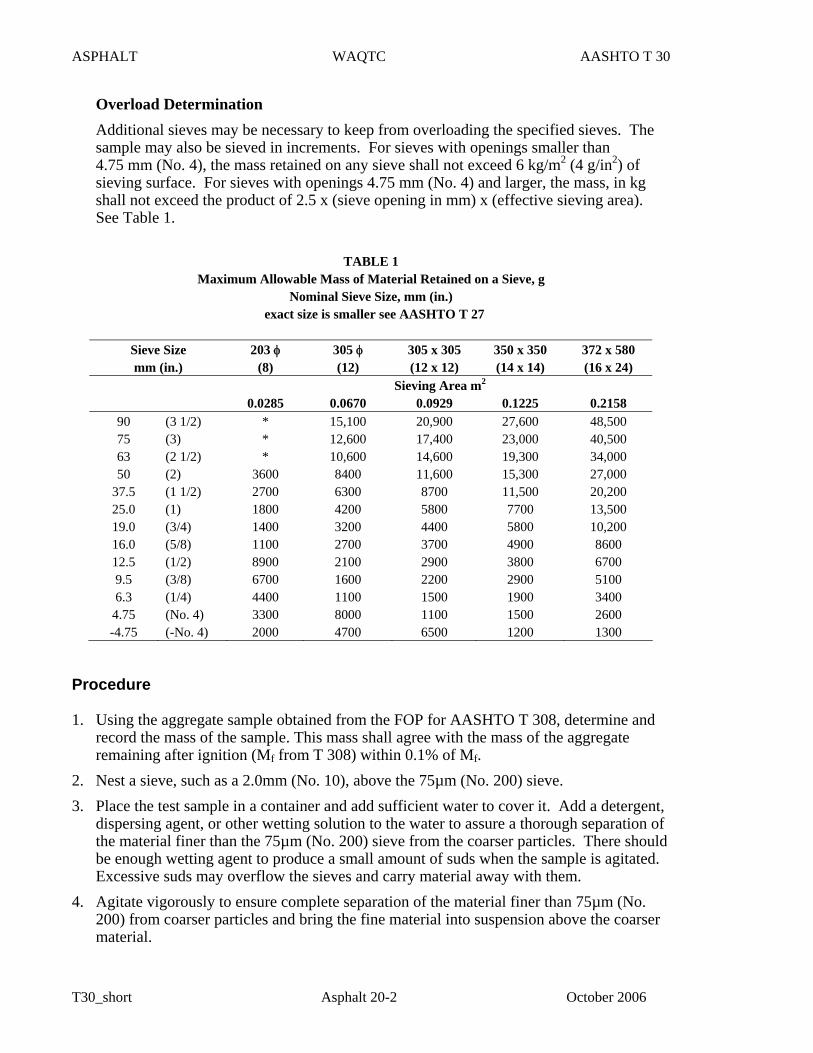
ASPHALT WAQTC AASHTO T 30
Overload Determination Additional sieves may be necessary to keep from overloading the specified sieves. The sample may also be sieved in increments. For sieves with openings smaller than 4.75 mm (No. 4), the mass retained on any sieve shall not exceed 6 kg/m2 (4 g/in2) of sieving surface. For sieves with openings 4.75 mm (No. 4) and larger, the mass, in kg shall not exceed the product of 2.5 x (sieve opening in mm) x (effective sieving area). See Table 1.
TABLE 1
Maximum Allowable Mass of Material Retained on a Sieve, g Nominal Sieve Size, mm (in.)
exact size is smaller see AASHTO T 27
Sieve Size mm (in.)
203 φ (8)
305 φ (12)
305 x 305 (12 x 12)
350 x 350 (14 x 14)
372 x 580 (16 x 24)
Sieving Area m2
0.0285 0.0670 0.0929 0.1225 0.2158 90 (3 1/2) * 15,100 20,900 27,600 48,500 75 (3) * 12,600 17,400 23,000 40,500 63 (2 1/2) * 10,600 14,600 19,300 34,000 50 (2) 3600 8400 11,600 15,300 27,000
37.5 (1 1/2) 2700 6300 8700 11,500 20,200 25.0 (1) 1800 4200 5800 7700 13,500 19.0 (3/4) 1400 3200 4400 5800 10,200 16.0 (5/8) 1100 2700 3700 4900 8600 12.5 (1/2) 8900 2100 2900 3800 6700 9.5 (3/8) 6700 1600 2200 2900 5100 6.3 (1/4) 4400 1100 1500 1900 3400
4.75 (No. 4) 3300 8000 1100 1500 2600 -4.75 (-No. 4) 2000 4700 6500 1200 1300
Procedure 1. Using the aggregate sample obtained from the FOP for AASHTO T 308, determine and
record the mass of the sample. This mass shall agree with the mass of the aggregate remaining after ignition (Mf from T 308) within 0.1% of Mf.
2. Nest a sieve, such as a 2.0mm (No. 10), above the 75µm (No. 200) sieve. 3. Place the test sample in a container and add sufficient water to cover it. Add a detergent,
dispersing agent, or other wetting solution to the water to assure a thorough separation of the material finer than the 75µm (No. 200) sieve from the coarser particles. There should be enough wetting agent to produce a small amount of suds when the sample is agitated. Excessive suds may overflow the sieves and carry material away with them.
4. Agitate vigorously to ensure complete separation of the material finer than 75µm (No. 200) from coarser particles and bring the fine material into suspension above the coarser material.
T30_short Asphalt 20-2 October 2006
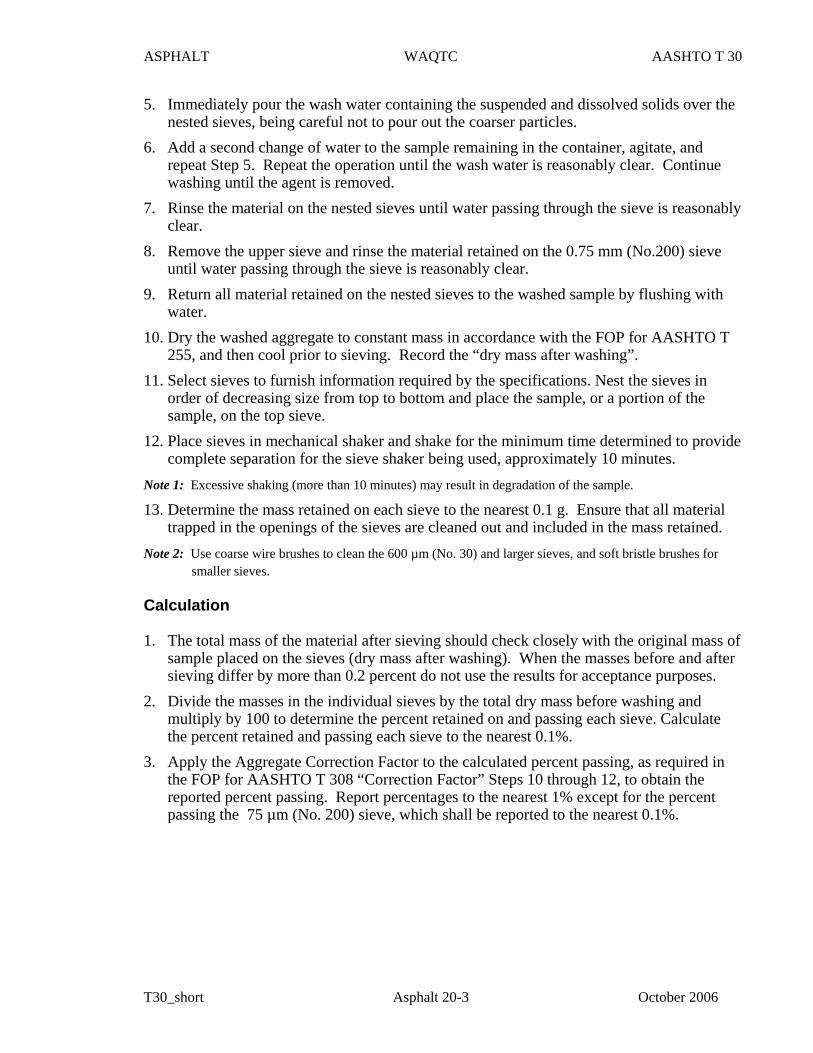
ASPHALT WAQTC AASHTO T 30
5. Immediately pour the wash water containing the suspended and dissolved solids over the nested sieves, being careful not to pour out the coarser particles.
6. Add a second change of water to the sample remaining in the container, agitate, and repeat Step 5. Repeat the operation until the wash water is reasonably clear. Continue washing until the agent is removed.
7. Rinse the material on the nested sieves until water passing through the sieve is reasonably clear.
8. Remove the upper sieve and rinse the material retained on the 0.75 mm (No.200) sieve until water passing through the sieve is reasonably clear.
9. Return all material retained on the nested sieves to the washed sample by flushing with water.
10. Dry the washed aggregate to constant mass in accordance with the FOP for AASHTO T 255, and then cool prior to sieving. Record the “dry mass after washing”.
11. Select sieves to furnish information required by the specifications. Nest the sieves in order of decreasing size from top to bottom and place the sample, or a portion of the sample, on the top sieve.
12. Place sieves in mechanical shaker and shake for the minimum time determined to provide complete separation for the sieve shaker being used, approximately 10 minutes.
Note 1: Excessive shaking (more than 10 minutes) may result in degradation of the sample. 13. Determine the mass retained on each sieve to the nearest 0.1 g. Ensure that all material
trapped in the openings of the sieves are cleaned out and included in the mass retained. Note 2: Use coarse wire brushes to clean the 600 µm (No. 30) and larger sieves, and soft bristle brushes for
smaller sieves. Calculation 1. The total mass of the material after sieving should check closely with the original mass of
sample placed on the sieves (dry mass after washing). When the masses before and after sieving differ by more than 0.2 percent do not use the results for acceptance purposes.
2. Divide the masses in the individual sieves by the total dry mass before washing and multiply by 100 to determine the percent retained on and passing each sieve. Calculate the percent retained and passing each sieve to the nearest 0.1%.
3. Apply the Aggregate Correction Factor to the calculated percent passing, as required in the FOP for AASHTO T 308 “Correction Factor” Steps 10 through 12, to obtain the reported percent passing. Report percentages to the nearest 1% except for the percent passing the 75 µm (No. 200) sieve, which shall be reported to the nearest 0.1%.
T30_short Asphalt 20-3 October 2006
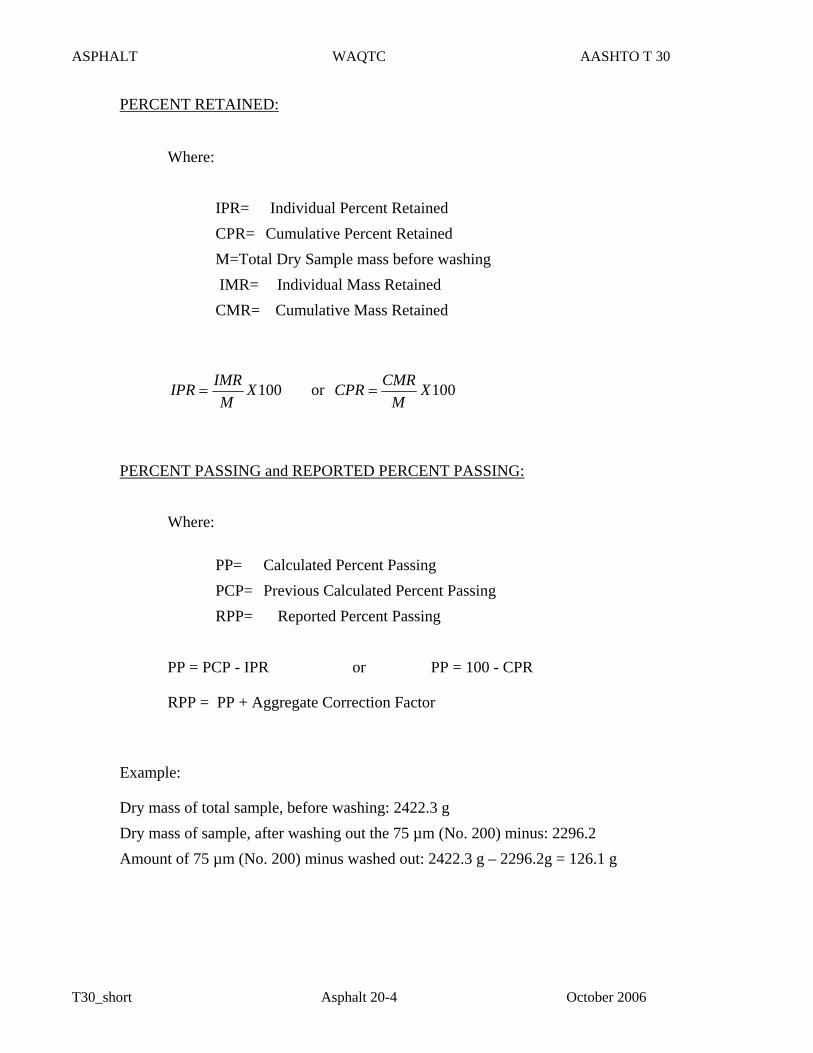
ASPHALT WAQTC AASHTO T 30
PERCENT RETAINED: Where: IPR= Individual Percent Retained CPR= Cumulative Percent Retained M=Total Dry Sample mass before washing IMR= Individual Mass Retained CMR= Cumulative Mass Retained
100XM
IMRIPR = or 100XM
CMRCPR =
PERCENT PASSING and REPORTED PERCENT PASSING:
Where: PP= Calculated Percent Passing PCP= Previous Calculated Percent Passing RPP= Reported Percent Passing PP = PCP - IPR or PP = 100 - CPR RPP = PP + Aggregate Correction Factor Example:
Dry mass of total sample, before washing: 2422.3 g Dry mass of sample, after washing out the 75 µm (No. 200) minus: 2296.2 Amount of 75 µm (No. 200) minus washed out: 2422.3 g – 2296.2g = 126.1 g
T30_short Asphalt 20-4 October 2006

ASPHALT WAQTC AASHTO T 30
Percent Retained 75 µm / No. 200
1003.2422
5.63%6.2 X= or 1003.24226.2289%5.95 X=
Percent Passing 5.5% = 8.1 - 2.6 or 5.5% = 100 - 94.5
Reported Percent Passing 4.9% = 5.5 + (-0.6)
Gradation on All Screens
Sieve Size mm (in.)
Mass Retained
g
Percent
Retained
Cumulative
Mass Retained
g
Cum.
Percent Retained
Calc’d Percent Passing
Agg. Corr.FactorFromT-308
ReportedPercent Passing
19.0 (3/4) 0.0 0.0 0 100.0 100 12.5 (1/2) 346.9 14.3 346.9 14.3 85.7 86 9.5 (3/8) 207.8 8.6 554.7 22.9 77.1 77 4.75 (No. 4) 625.4 25.8 1180.1 48.7 51.3 51 2.36 (No. 8) 416.2 17.2 1596.3 65.9 34.1 34 01.18 (No. 16) 274.2 11.3 1870.5 77.2 22.8 23 0.600 (No. 30) 152.1 6.3 2022.6 83.5 16.5 16 0.300 (No. 50) 107.1 4.4 2129.7 87.9 12.1 12 0.150 (No. 100) 96.4 4.0 2226.1 91.9 8.1 8 0.075 (No. 200) 63.5 2.6 2289.6 94.5 5.5 -0.6 4.9 Pan 5.7 2295.3
Check sum: 2296.2 –2295.3 / 2296.2 X 100 = 0.04 % is within the 0.2 percent requirement Report Results shall be reported on standard forms approved for use by the agency. Depending on the agency, this may include:
• Mass retained on each sieve • Percent retained on each sieve • Cumulative mass retained on each sieve
T30_short Asphalt 20-5 October 2006

ASPHALT WAQTC AASHTO T 30
• Cumulative percent retained on each sieve • Calculated Percent passing each sieve to 0.1% • Aggregate Correction Factor for each sieve from AASHTO T 308 • Reported Percent passing
Report percentages to the nearest 1 percent except for the percent passing the 75 µm (No. 200) sieve, which shall be reported to the nearest 0.1 percent.
T30_short Asphalt 20-6 October 2006
ASPHALT WAQTC AASHTO T 40
SAMPLING BITUMINOUS MATERIALS FOP FOR AASHTO T 40 Scope The procedure covers obtaining samples of liquid bituminous materials in accordance with AASHTO T 40. Sampling of solid and semi-solid bituminous materials – included in AASHTO T 40 – is not covered here.
Agencies may be more specific on exactly who samples, where to sample, and what type of sampling device to use. Procedure 1. Coordinate sampling with contractor or supplier. 2. Use appropriate safety equipment and precautions for hot liquids. 3. Allow a minimum of 4 L (1 gal) to flow before obtaining a sample(s). 4. Obtain samples of:
• Asphalt binder from Hot Mix Asphalt (HMA) Plant from the line between the storage tank and the mixing plant while the plant is in operation, or from the delivery truck.
• Cutback and Emulsified asphalt from distributor spray bar or application device; or from the delivery truck before it is pumped into the distributor. Sample emulsified asphalt at delivery or prior to dilution.
Containers Sample containers must be new, and the inside may not be washed or rinsed. The outside may be wiped with a clean, dry cloth. All samples shall be put in 1 L (1 qt) containers and properly identified on the outside of the container with contract number, date sampled, data sheet number, brand and grade of material, and sample number. Include lot and sublot numbers when appropriate. • Emulsified asphalt: Use wide-mouth plastic jars with screw caps. Protect the samples
from freezing since water is a part of the emulsion. The sample container should be completely filled to minimize a skin formation on the sample.
• Asphalt binder and Cutbacks: Use metal cans. Note: The sample container shall not be submerged in solvent, nor shall it be wiped with a solvent saturated cloth. If cleaning is necessary, use a clean dry cloth.
T40_short Asphalt 19-1 October 2005

ASPHALT WAQTC AASHTO T 40
THIS PAGE INTENTIONALLY LEFT BLANK
T40_short Asphalt 19-2 October 2005

Specific Gravity and Absorption of Fine Aggregate
AASHTO Designation: T 84-00 ASTM Designation: C 128-97
AASHTO TEST METHODS CANNOT BE INCLUDED ON ODOT’S WEBSITE DUE TO COPYRIGHT INFRINGEMENT. TO GET COPIES OF THE TEST METHODS, YOU CAN ORDER A HARD COPY OF ODOT’S MANUAL OF FIELD TEST PROCEDURES OR YOU CAN ORDER THE LATEST STANDARD SPECIFICATIONS FOR TRANSPORTATION MATERIALS AND METHODS OF SAMPLING AND TESTING FROM AASHTO. ORDERING INSTRUCTIONS ARE GIVEN BELOW: To order ODOT’s Manual of Field Test Procedures, use the following web address: http://www.odot.state.or.us/ffp/cs/opo/contractor_plans/ManualSubmitOrder.htm To order AASHTO’s Standard Specifications for Transportation Materials and Methods of Sampling and Testing, use the following web address: https://bookstore.transportation.org/

EMBANKMENT AND BASE WAQTC AASHTO T 85 IN-PLACE DENSITY SPECIFIC GRAVITY AND ABSORPTION OF COARSE AGGREGATE FOP FOR AASHTO T 85 Scope This procedure covers the determination of specific gravity and absorption of coarse aggregate in accordance with AASHTO T 85. Specific gravity may be expressed as bulk specific gravity (Gsb), bulk specific gravity, saturated surface dry (Gsb SSD), or apparent specific gravity (Gsa). Gsb and absorption are based on aggregate after 15 hours soaking in water. This procedure is not intended to be used with lightweight aggregates. Terminology Absorption – the increase in the mass of aggregate due to water being absorbed into the pores of the material, but not including water adhering to the outside surface of the particles, expressed as a percentage of the dry mass. The aggregate is considered “dry” when it has been maintained at a temperature of 110 ±5°C (230 ±9°F) for sufficient time to remove all uncombined water. Saturated Surface Dry (SSD) – condition of an aggregate particle when the permeable voids are filled with water, but no water is present on exposed surfaces. Specific Gravity – the ratio of the mass, in air, of a volume of a material to the mass of the same volume of gas-free distilled water at a stated temperature. Apparent Specific Gravity (Gsa)– the ratio of the mass, in air, of a volume of the impermeable portion of aggregate to the mass of an equal volume of gas-free distilled water at a stated temperature. Bulk Specific Gravity (Gsb)– the ratio of the mass, in air, of a volume of aggregate (including the permeable and impermeable voids in the particles, but not including the voids between particles) to the mass of an equal volume of gas-free distilled water at a stated temperature. Bulk Specific Gravity (SSD) (Gsb SSD)– the ratio of the mass, in air, of a volume of aggregate, including the mass of water within the voids filled to the extent achieved by submerging in water for approximately 15 hours (but not including the voids between particles), to the mass of an equal volume of gas-free distilled water at a stated temperature. Apparatus
• Balance or scale with a capacity of 5 kg, sensitive to 1 g. Meeting the requirements of AASHTO M 231.
• Sample container, wire basket of 3.35 mm (No. 6) or smaller mesh, with a capacity of 4 to 7 L (1 to 2 gal) to contain aggregate with a nominal maximum size of 37.5 mm (1 1/2 in.) or smaller; larger basket for larger aggregates.
• Water tank, watertight and large enough to completely immerse aggregate and basket, equipped with an overflow valve to keep water level constant.
T85_short E&B/ID 20-1 October 2005
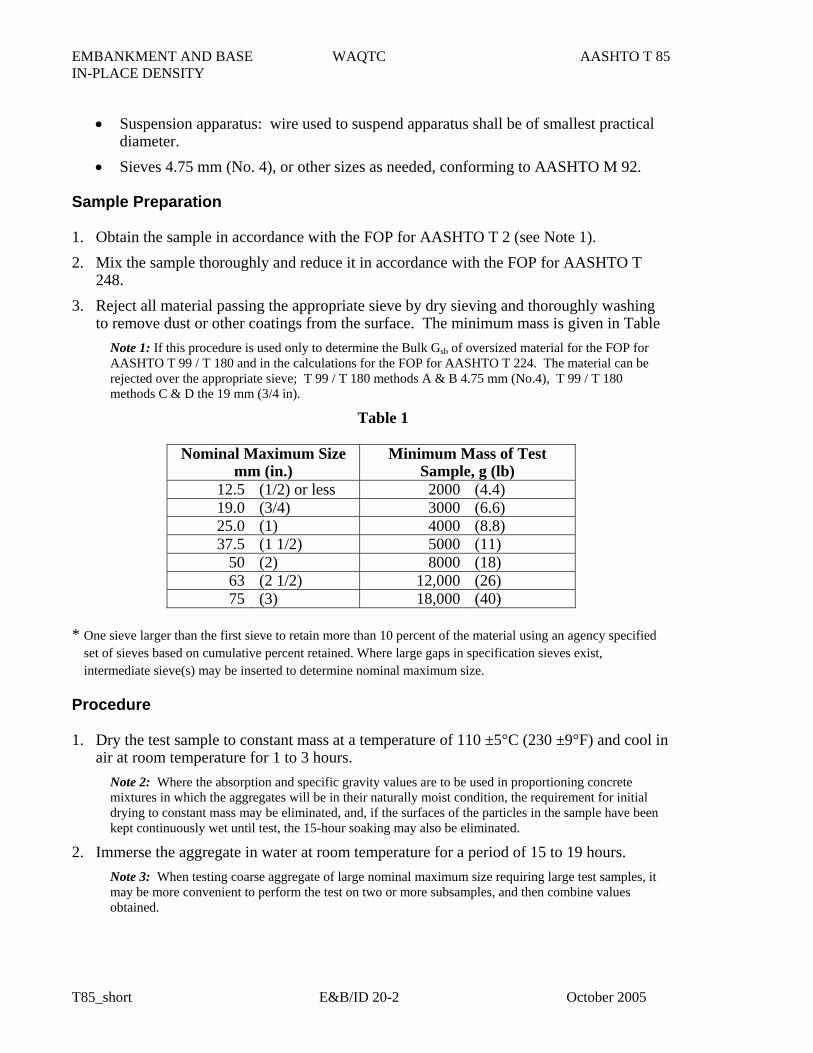
EMBANKMENT AND BASE WAQTC AASHTO T 85 IN-PLACE DENSITY
• Suspension apparatus: wire used to suspend apparatus shall be of smallest practical diameter.
• Sieves 4.75 mm (No. 4), or other sizes as needed, conforming to AASHTO M 92. Sample Preparation 1. Obtain the sample in accordance with the FOP for AASHTO T 2 (see Note 1). 2. Mix the sample thoroughly and reduce it in accordance with the FOP for AASHTO T
248. 3. Reject all material passing the appropriate sieve by dry sieving and thoroughly washing
to remove dust or other coatings from the surface. The minimum mass is given in Table Note 1: If this procedure is used only to determine the Bulk Gsb of oversized material for the FOP for AASHTO T 99 / T 180 and in the calculations for the FOP for AASHTO T 224. The material can be rejected over the appropriate sieve; T 99 / T 180 methods A & B 4.75 mm (No.4), T 99 / T 180 methods C & D the 19 mm (3/4 in).
Table 1
Nominal Maximum Size mm (in.)
Minimum Mass of Test Sample, g (lb)
12.5 (1/2) or less 2000 (4.4) 19.0 (3/4) 3000 (6.6) 25.0 (1) 4000 (8.8) 37.5 (1 1/2) 5000 (11)
50 (2) 8000 (18) 63 (2 1/2) 12,000 (26) 75 (3) 18,000 (40)
* One sieve larger than the first sieve to retain more than 10 percent of the material using an agency specified
set of sieves based on cumulative percent retained. Where large gaps in specification sieves exist, intermediate sieve(s) may be inserted to determine nominal maximum size.
Procedure 1. Dry the test sample to constant mass at a temperature of 110 ±5°C (230 ±9°F) and cool in
air at room temperature for 1 to 3 hours. Note 2: Where the absorption and specific gravity values are to be used in proportioning concrete mixtures in which the aggregates will be in their naturally moist condition, the requirement for initial drying to constant mass may be eliminated, and, if the surfaces of the particles in the sample have been kept continuously wet until test, the 15-hour soaking may also be eliminated.
2. Immerse the aggregate in water at room temperature for a period of 15 to 19 hours. Note 3: When testing coarse aggregate of large nominal maximum size requiring large test samples, it may be more convenient to perform the test on two or more subsamples, and then combine values obtained.
T85_short E&B/ID 20-2 October 2005
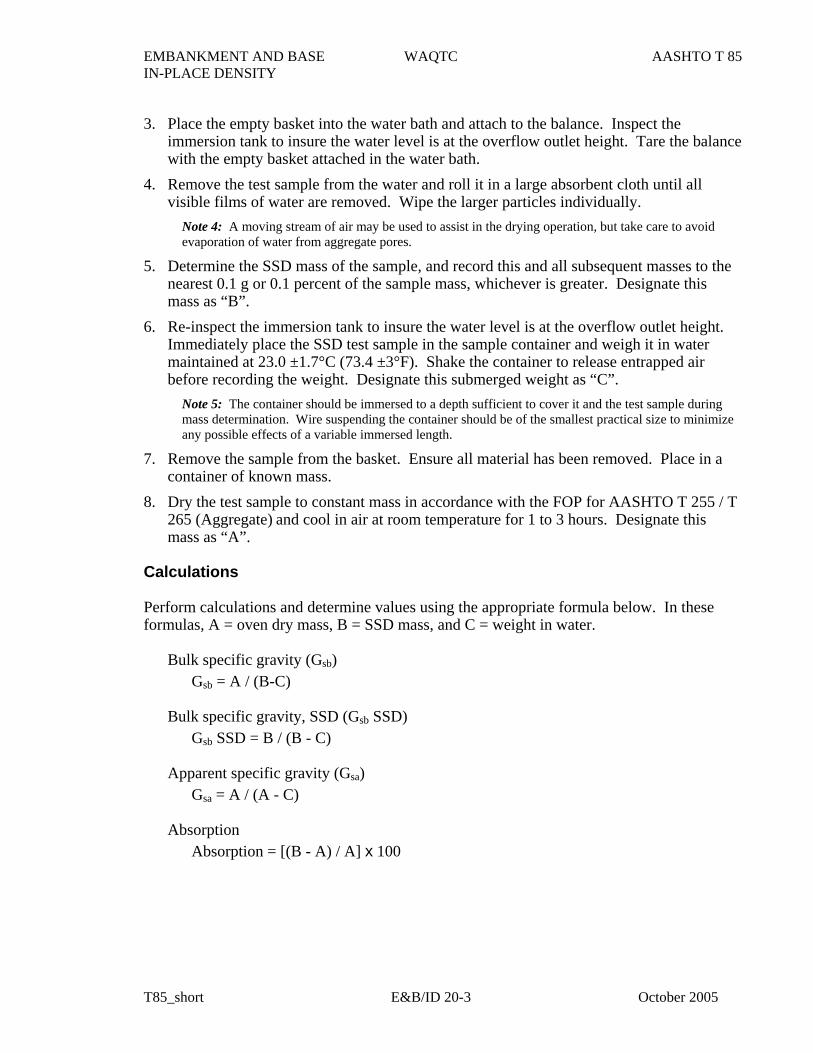
EMBANKMENT AND BASE WAQTC AASHTO T 85 IN-PLACE DENSITY 3. Place the empty basket into the water bath and attach to the balance. Inspect the
immersion tank to insure the water level is at the overflow outlet height. Tare the balance with the empty basket attached in the water bath.
4. Remove the test sample from the water and roll it in a large absorbent cloth until all visible films of water are removed. Wipe the larger particles individually.
Note 4: A moving stream of air may be used to assist in the drying operation, but take care to avoid evaporation of water from aggregate pores.
5. Determine the SSD mass of the sample, and record this and all subsequent masses to the nearest 0.1 g or 0.1 percent of the sample mass, whichever is greater. Designate this mass as “B”.
6. Re-inspect the immersion tank to insure the water level is at the overflow outlet height. Immediately place the SSD test sample in the sample container and weigh it in water maintained at 23.0 ±1.7°C (73.4 ±3°F). Shake the container to release entrapped air before recording the weight. Designate this submerged weight as “C”.
Note 5: The container should be immersed to a depth sufficient to cover it and the test sample during mass determination. Wire suspending the container should be of the smallest practical size to minimize any possible effects of a variable immersed length.
7. Remove the sample from the basket. Ensure all material has been removed. Place in a container of known mass.
8. Dry the test sample to constant mass in accordance with the FOP for AASHTO T 255 / T 265 (Aggregate) and cool in air at room temperature for 1 to 3 hours. Designate this mass as “A”.
Calculations Perform calculations and determine values using the appropriate formula below. In these formulas, A = oven dry mass, B = SSD mass, and C = weight in water.
Bulk specific gravity (Gsb) Gsb = A / (B-C)
Bulk specific gravity, SSD (Gsb SSD)
Gsb SSD = B / (B - C)
Apparent specific gravity (Gsa) Gsa = A / (A - C)
Absorption
Absorption = [(B - A) / A] x 100
T85_short E&B/ID 20-3 October 2005
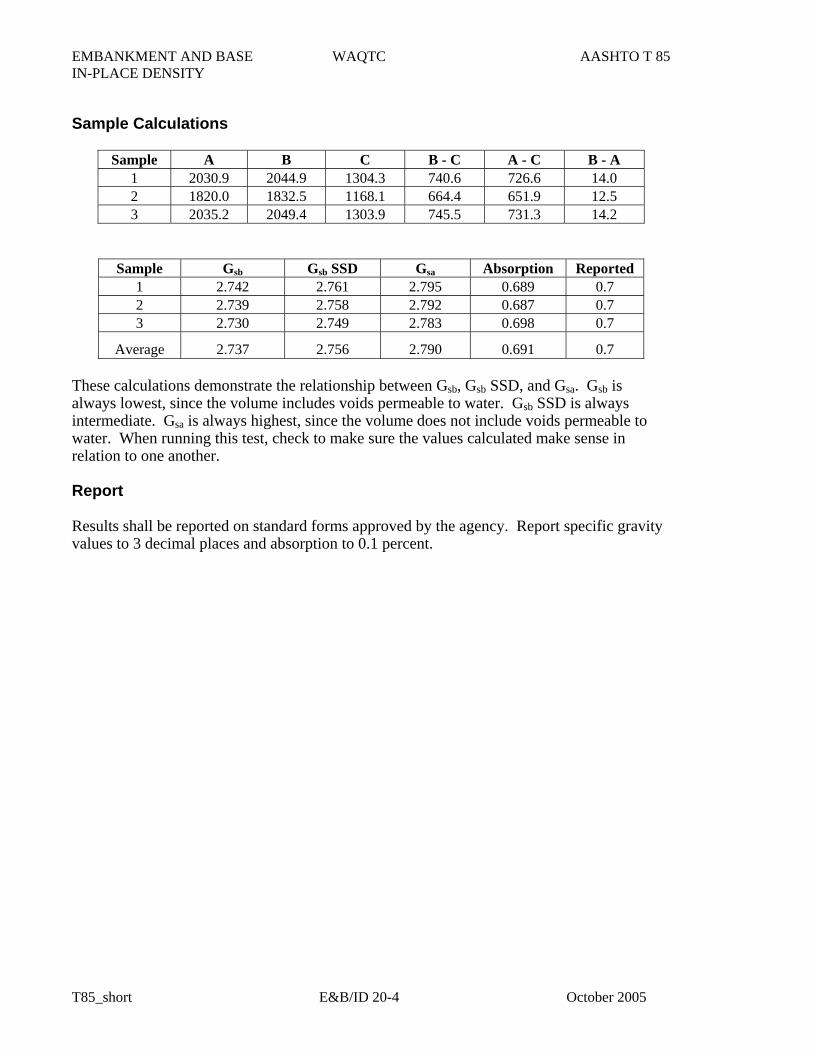
EMBANKMENT AND BASE WAQTC AASHTO T 85 IN-PLACE DENSITY Sample Calculations
Sample A B C B - C A - C B - A 1 2030.9 2044.9 1304.3 740.6 726.6 14.0 2 1820.0 1832.5 1168.1 664.4 651.9 12.5 3 2035.2 2049.4 1303.9 745.5 731.3 14.2
Sample Gsb Gsb SSD Gsa Absorption Reported 1 2.742 2.761 2.795 0.689 0.7 2 2.739 2.758 2.792 0.687 0.7 3 2.730 2.749 2.783 0.698 0.7
Average 2.737 2.756 2.790 0.691 0.7 These calculations demonstrate the relationship between Gsb, Gsb SSD, and Gsa. Gsb is always lowest, since the volume includes voids permeable to water. Gsb SSD is always intermediate. Gsa is always highest, since the volume does not include voids permeable to water. When running this test, check to make sure the values calculated make sense in relation to one another. Report Results shall be reported on standard forms approved by the agency. Report specific gravity values to 3 decimal places and absorption to 0.1 percent.
T85_short E&B/ID 20-4 October 2005
EMBANKMENT AND BASE WAQTC AASHTO T 89 IN-PLACE DENSITY DETERMINING THE LIQUID LIMIT OF SOILS FOP FOR AASHTO T 89 Scope This procedure covers the determination of the liquid limit of a soil in accordance with AASHTO T 89. It is used in conjunction with AASHTO T 90, Determining the Plastic Limit and Plasticity Index of Soils. The three values are used for soil classification and other purposes. Apparatus
• Dish: preferably unglazed porcelain or similar mixing dish, about 115 mm (4.5 in.) in diameter.
• Spatula: having a blade 75 to 100 mm (3 to 4 in.) long and about 20 mm (3/4 in.) wide.
• Liquid Limit Device: manually or mechanically operated, consisting of a brass cup, carriage, and base plate.
• Grooving Tool: used to cut the soil in the liquid limit device cup. • Gauge: part of the grooving tool or a separate metal bar, 10.0 ±0.2 mm (0.394 ±0.008
in.) thick and approximately 50 mm (2 in.) long. • Containers: corrosion resistant, suitable for repeated heating and cooling, having
close fitting lids to prevent the loss of moisture. One container is needed for each moisture content determination.
• Balance: conforming to AASHTO M 231, class G1, sensitive to 0.01 g with a 1200 g capacity.
• Oven: thermostatically controlled, capable of maintaining temperatures of 110 ±5°C (230 ±9°F).
• Graduated cylinders for measuring distilled or demineralized water. Adjustment of Liquid Limit Device The liquid limit device shall be inspected to determine that the device is in good working order; that the pin connecting the cup is not worn to permit side play; that the screws connecting the cup to the hanger are tight; that the points of contact on the cup and base are not excessively worn; that the lip of the cup is not excessively worn; and that a groove has not been worn in the cup. The grooving tool shall be inspected to determine that the critical dimensions are correct.
Note 1: Wear is considered excessive when the point of contact on the cup or base exceeds approximately 13 mm (0.5 in.) in diameter, or when any point on the rim of the cup is worn to approximately 1/2 the original thickness. A slight groove in the center of the cup is not objectionable. If the groove becomes pronounced, the cup shall be replaced. A base that is excessively worn may be refinished as long as it is maintained within the tolerances specified.
T89_short E&B/ID 22-1 October 2003
EMBANKMENT AND BASE WAQTC AASHTO T 89 IN-PLACE DENSITY Adjust the height of drop of the cup so that the point on the cup that comes in contact with the base rises to a height of 10.0 ±0.2 mm (0.394 ±0.008 in.).
Note 2: Check the height of the drop, before each new sample, by turning the crank at two revolutions per second while holding the gauge in position against the cup. If a ringing or clicking sound is heard without the cup rising from the gauge, the adjustment is correct. If no ringing is heard or if the cup rises from gauge, readjust the height of the drop. If the cup rocks on the gauge during this checking operation, the cam follower pivot is excessively worn and should be replaced.
Sample Samples must be prepared per AASHTO T 87 or T 146. Obtain a sample with a mass of about 100 g taken from the portion of the material passing the 0.425 mm (No. 40) sieve. The mass required depends upon the method chosen. Method A (multi-point method) requires approximately 100 g. Method B (single point method) requires approximately 50 g. Procedure – Method A (Multi-Point) 1. Place the sample in the dish and thoroughly mix with 15 to 20 mL of distilled or
demineralized water by alternately and repeatedly stirring, kneading, and chopping with a spatula. Further additions of water shall be in increments of 1 to 3 mL. Each increment shall be thoroughly mixed with the soil before another increment is added. Once testing has begun, no additional dry soil should be added to the moistened soil. The cup of the Liquid Limit device shall not be used for mixing soil and water. If too much water is added, the sample shall either be discarded or mixed and kneaded until natural evaporation lowers the moisture content.
Note 3: Some soils are slow to absorb water. It is possible to add water so fast that a false LL value is obtained. This can be avoided by allowing more mixing and/or time. Also, tap water may be used for routine testing if comparative tests indicate no differences in results between using tap water and distilled or demineralized water.
2. Add sufficient water to form a uniform mass of a stiff consistency. 3. Place enough material in the cup so that, when squeezed and spread with the spatula, the
soil will rest in the cup above the spot where the cup rests on the base and will be 10 mm thick at the point of maximum thickness. Use as few strokes of the spatula as possible, taking care to prevent the entrapment of air bubbles in the sample.
4. Divide the soil in the cup with a firm stroke of the grooving tool. Avoid tearing of the sides of the groove or slipping of the soil cake on the cup. Up to six strokes are permitted. The depth of the groove should be increased with each stroke, and only the last stroke should scrape the bottom of the cup.
5. Lift and drop the cup by turning the crank at a rate of approximately two revolutions per second until the two halves of the soil pat come together along a distance of about 13 mm (0.5 in.). Do not hold the base while the crank is turned. Record the number of shocks required to close the groove.
Note 4: Some soils tend to slide on the cup instead of flowing. If this occurs, water should be added, the sample remixed, and the procedure repeated. If the soil continues to slide on the cup, the test is not applicable and a note should be made that the liquid limit could not be determined.
T89_short E&B/ID 22-2 October 2003
EMBANKMENT AND BASE WAQTC AASHTO T 89 IN-PLACE DENSITY 6. Obtain a moisture content sample by slicing through the soil pat perpendicularly with the
spatula and through the center of the groove. Place it into a suitable container for subsequent moisture determination.
7. Determine the moisture content of the moisture content sample in accordance with the FOP for AASHTO T 255/T 265 (Soil).
8. Place the soil remaining in the cup back in the mixing dish and add 1 to 3 mL of water, or use previously prepared portions to which sufficient water has been added to result in a more fluid condition.
9. Repeat Steps 3 through 8, a minimum of two times. The object is to have a determination in all three shock ranges 25-35, 20-30, & 15-25.
Flow Curve – Method A Prepare a flow curve on a semi-logarithmic graph with moisture content on the arithmetic vertical axis and the number of shocks on the logarithmic horizontal axis. The flow curve is a straight line drawn as closely as possible through three or more plotted points. Liquid Limit – Method A Determine the liquid limit. The moisture content at the intersection of the flow curve and the 25 shock line is the liquid limit. Procedure – Method B (Single-Point) 1. Place the sample in the dish and thoroughly mix with 8 to 10 mL of distilled or
demineralized water, and following the mixing procedure in Method A, Step 1. 2. Follow the procedure in Method A except that the soil pat should be prepared with water
to produce a consistency that will close the two halves of the soil pat at least 13 mm (0.5 in.) within 22 to 28 shocks of the cup. Note: Groove closures occurring between 15 and 40 blows may be accepted if variations of ±5 percent of the true liquid limit are tolerable.
3. Return the soil remaining in the cup to the mixing dish and, without adding any additional water, repeat Step 2. If the closure again occurs within the acceptable range, obtain a moisture content specimen.
4. Determine the moisture content of the moisture content sample in accordance with the FOP for AASHTO T 255/T 265 (Soil).
T89_short E&B/ID 22-3 October 2003
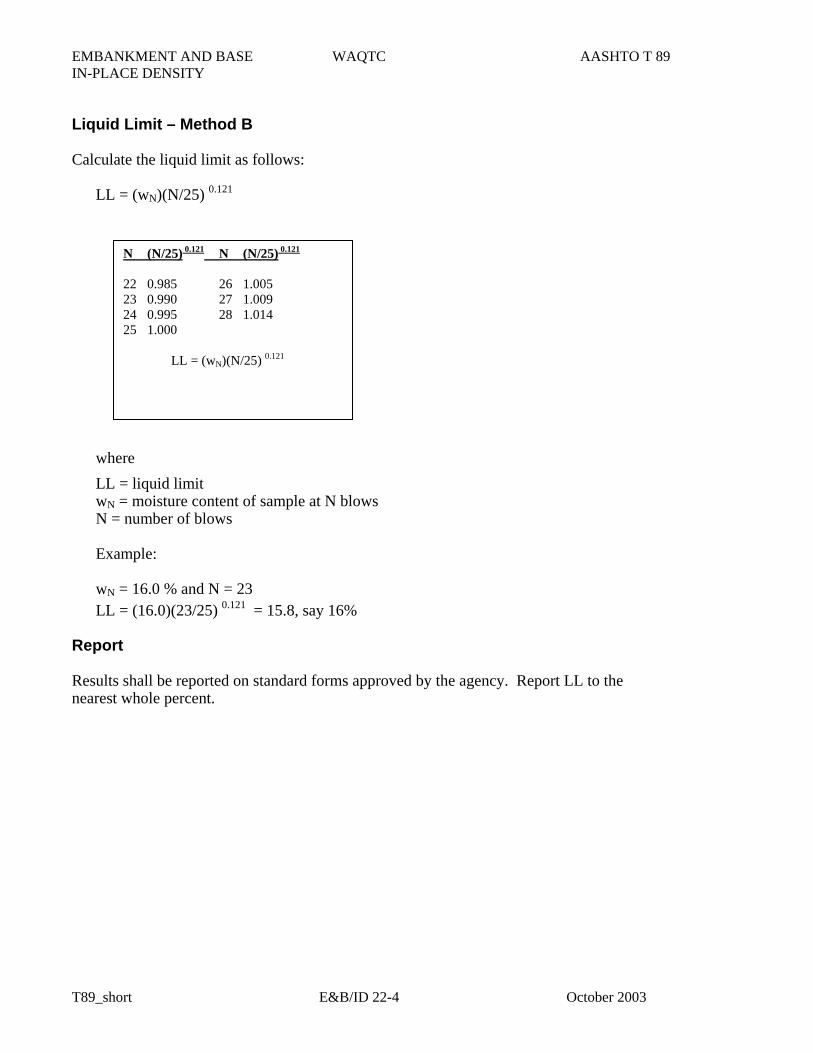
EMBANKMENT AND BASE WAQTC AASHTO T 89 IN-PLACE DENSITY Liquid Limit – Method B Calculate the liquid limit as follows:
LL = (wN)(N/25) 0.121
N (N/25) 0.121 N (N/25) 0.121
22 0.985 26 1.005 23 0.990 27 1.009 24 0.995 28 1.014 25 1.000
LL = (wN)(N/25) 0.121
where LL = liquid limit wN = moisture content of sample at N blows N = number of blows Example: wN = 16.0 % and N = 23 LL = (16.0)(23/25) 0.121 = 15.8, say 16%
Report Results shall be reported on standard forms approved by the agency. Report LL to the nearest whole percent.
T89_short E&B/ID 22-4 October 2003
EMBANKMENT AND BASE WAQTC AASHTO T 90 IN-PLACE DENSITY DETERMINING THE PLASTIC LIMIT AND PLASTICITY INDEX OF SOILS FOP FOR AASHTO T 90 Scope This procedure covers the determination of the plastic limit and plasticity index of soil in accordance with AASHTO T 90. It is used in conjunction with AASHTO T 89, Determining the Liquid Limit of Soils. The three values are used for soil classification and other purposes. This FOP will cover the hand rolling method only. If the plastic limit device method is approved by the agency see AASHTO T 90 for that procedure. Apparatus
• Dish: preferably unglazed porcelain or similar mixing dish, about 115 mm (4.5 in.) in diameter.
• Spatula: having a blade 75 to 100 mm (3 to 4 in.) long and about 20 mm (3/4 in.) wide.
• Rolling Surface: a ground glass plate or piece of smooth, unglazed paper. • Containers: corrosion resistant, suitable for repeated heating and cooling, having
close fitting lids to prevent the loss of moisture. One container is needed for each moisture content determination.
• Balance: conforming to AASHTO M 231, class G1, sensitive to 0.01 g with a 1200 g capacity.
• Oven: thermostatically controlled, capable of maintaining temperatures of 110 ±5°C (230 ±9°F)
Sample The plastic limit procedure is often run in conjunction with the liquid limit procedure. If this is the case, the plastic limit sample should be obtained from the soil prepared for the liquid limit test at any point in the process at which the soil is plastic enough to be easily shaped into a ball without sticking to the fingers excessively when squeezed. Obtain approximately 8 g of soil to run the plastic limit test. If the plastic limit only is to be determined, the sample must be prepared per AASHTO T 87 or T 146. Obtain about 20 g of material passing the 0.425 mm (No. 40) sieve. Mix the soil with distilled or demineralized water until the mass becomes plastic enough to be easily shaped into a ball. Obtain approximately 8 g of soil to run the plastic limit test.
Note 1: Tap water may be used for routine testing if comparative tests indicate no differences in results between using tap water and distilled or demineralized water.
Procedure (Hand Rolling Method) 1. From the sample pull a 1.5 to 2 g mass.
T90_short E&B/ID 23-1 October 2003
EMBANKMENT AND BASE WAQTC AASHTO T 90 IN-PLACE DENSITY 2. Squeeze and form the test sample into an ellipsoidal-shape mass. 3. Roll this mass between the fingers or palm and the rolling surface with just sufficient
pressure to roll the mass into a thread of uniform diameter along its length. Roll out between 80 and 90 strokes per minute, counting a stroke as one back and forth motion. The sample must be rolled into the 3 mm (1/8 in.) thread in no longer than 2 minutes.
4. Break the thread into six or eight pieces when the diameter of the thread reaches 3 mm
(1/8 in.). 5. Squeeze the pieces together between the thumbs and fingers of both hands into an
ellipsoidal-shape mass and reroll. 6. Continue this process of alternately rolling to a thread 3 mm (1/8 in.) in diameter, cutting
into pieces, gathering together, kneading and rerolling until the thread crumbles under the pressure required for rolling and the soil can no longer be rolled into a thread.
Note 2: Crumbling may occur when the thread has a diameter greater than 3 mm (1/8 in.). This shall be considered a satisfactory end point, provided the soil has been previously rolled into a thread 3 mm (1/8 in.) in diameter. The crumbling will manifest itself differently with various types of soil. Some soils fall apart in many pieces; others form an outside tubular layer that splits at both ends; splitting progresses toward the middle, and the thread falls apart in small platy particles. Heavy clay requires much pressure to deform the thread, particularly as it approaches the plastic limit, and the thread breaks into a series of barrel-shaped segments each 6 to 9 mm (1/4 to 3/8 in.) long. At no time shall the tester attempt to produce failure at exactly 3 mm (1/8 in.) diameter. It is permissible, however, to reduce the total amount of deformation for feebly plastic soils by making the initial diameter of the ellipsoidal-shaped mass nearer to the required 3 mm (1/8 in.) final diameter.
7. Gather the portions of the crumbled soil together and place in a suitable, tared container & cover.
8. Repeat steps one through seven until 8 g of sample have been tested and placed in the covered container.
9. Determine the moisture content of the sample in accordance with the FOP for T 255/T 265.
Plastic Limit The moisture content, as determined in Step 9 above, is the Plastic Limit. It is advisable to run several trials on the same material to ensure a proper determination of the Plastic Limit of the soil.
T90_short E&B/ID 23-2 October 2003
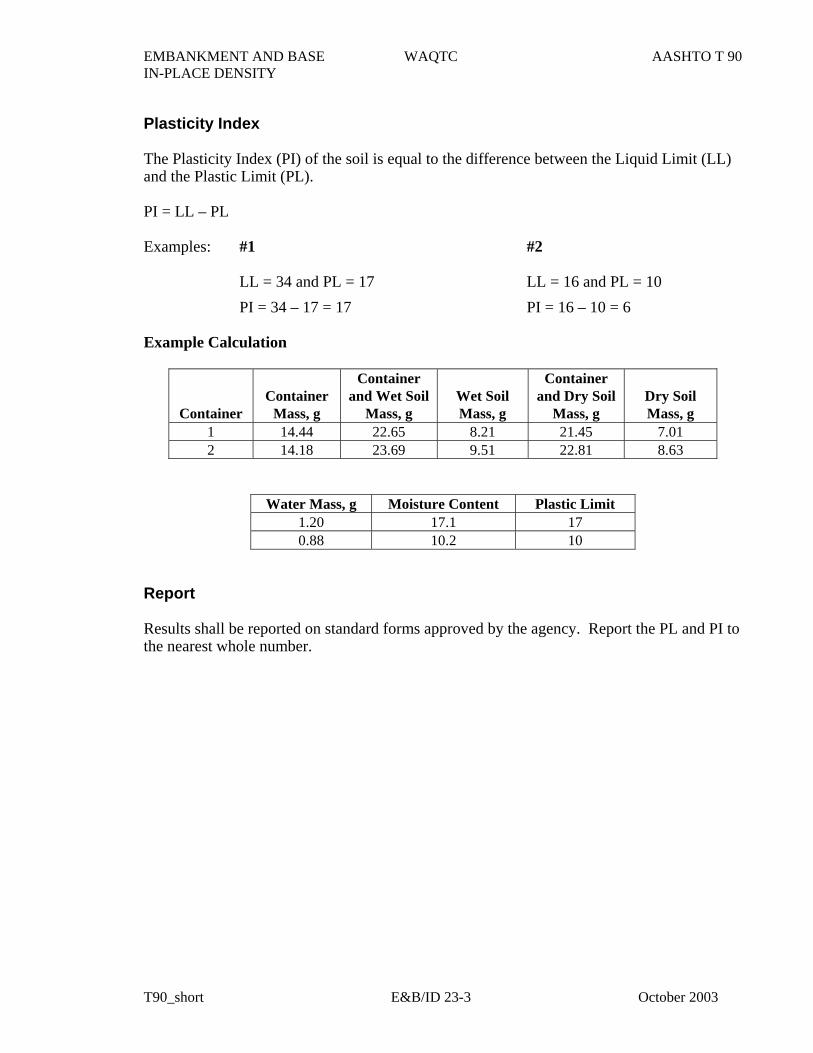
EMBANKMENT AND BASE WAQTC AASHTO T 90 IN-PLACE DENSITY Plasticity Index The Plasticity Index (PI) of the soil is equal to the difference between the Liquid Limit (LL) and the Plastic Limit (PL). PI = LL – PL Examples: #1 #2
LL = 34 and PL = 17 LL = 16 and PL = 10 PI = 34 – 17 = 17 PI = 16 – 10 = 6
Example Calculation
Container
Container
Mass, g
Container and Wet Soil
Mass, g
Wet Soil Mass, g
Container and Dry Soil
Mass, g
Dry Soil Mass, g
1 14.44 22.65 8.21 21.45 7.01 2 14.18 23.69 9.51 22.81 8.63
Water Mass, g Moisture Content Plastic Limit 1.20 17.1 17 0.88 10.2 10
Report Results shall be reported on standard forms approved by the agency. Report the PL and PI to the nearest whole number.
T90_short E&B/ID 23-3 October 2003

EMBANKMENT AND BASE WAQTC AASHTO T 90 IN-PLACE DENSITY
THIS PAGE INTENTIONALLY LEFT BLANK
T90_short E&B/ID 23-4 October 2003
I N T E R O F F I C E M E M O
TECHNICAL SERVICESConstruction Section
Office Phone: (503) 986-3000Fax Number: (503) 986-3096
DATE: October 17, 2005 TO: All Holders of the Manual of Field Test Procedures File Code: SECTION: Test Procedure AASHTO T 99 and T 180
The Oregon Department of Transportation has specified method(s) for this Test Procedure. Please observe the following for our projects: • Methods B & C are not allowed on ODOT contracts. • Use Methods A or D based on the following criteria:
1. The soil or soil/aggregate mixture will first be analyzed according to Method A. If the amount of material retained on the 4.75mm (No. 4) screen exceeds 40% then use Method D.
2. If the amount of material retained on the 19.00mm (3/4”) screen exceeds
30% then the material is non-density testable and should be evaluated according to the appropriate specifications contained in the project contract documents.
• Under Section Apparatus, Balances or Scales for the standard or modified
proctor, change the 20-kg requirement to 12-kg minimum with a sensitivity of 5g or better.
Observe the following for graded aggregates: •
•
Material for each individual point is brought to needed moisture content leaving approximately 1% between points. Moisture content of individual points will be determined using the entire molded sample.

ODOT TM 323(06) 2
EMBANKMENT AND BASE WAQTC AASHTO T 99/T 180 IN-PLACE DENSITY
T99_T180 E&B/ID 18-1 October 2004
MOISTURE-DENSITY RELATIONS OF SOILS: USING A 2.5-kg (5.5-lb) RAMMER AND A 305 mm (12-in.) DROP FOP FOR AASHTO T 99 USING A 4.54-kg (10-lb) RAMMER AND A 457 mm (18-in.) DROP FOP FOR AASHTO T 180 Scope This procedure covers the determination of the moisture-density relations of soils and soil-aggregate mixtures in accordance with two similar test methods:
• AASHTO T 99 methods A, B, C & D • AASHTO T 180 methods A, B, C & D
This test method applies to soil mixtures having 40% or less retained on the 4.75 mm (No 4) sieve for methods A or B, or, 30 % or less retained on the 19mm (¾”) with methods C or D. The retained material is defined as oversize (coarse) material. If no minimum percentage is specified 5% will be used. Samples that contain oversize (coarse) that meet percent retained criteria should be corrected by using the FOP for AASHTO T 224. Samples of soil or soil-aggregate mixture are prepared at several moisture contents and compacted into molds of specified size using manual or mechanical rammers delivering a specified quantity of compactive energy. The moist masses of the compacted samples are divided by the volume of the mold to determine moist density values. Moisture contents of the compacted samples are determined and used to obtain the dry density values of the same samples. Maximum dry density and optimum moisture content for the soil or soil-aggregate mixture is determined by plotting the relationship between dry density and moisture content. Apparatus
• Mold – Cylindrical, made of metal and having the dimensions shown in Table 1 or Table 2. It shall include a detachable collar and a base plate to which the mold can be fastened. If permitted by the agency, the mold may be of the “split” type, consisting of two half-round sections, which can be securely locked in place to form a cylinder.
• Rammer –Manually or mechanically operated rammers as detailed in Table 1 or Table 2. A manually operated rammer shall be equipped with a guide-sleeve to control the path and height of drop. The guide-sleeve shall have at least four vent holes no smaller then 9.5 mm (3/8 in.) diameter, spaced approximately 90 degrees apart and approximately 19 mm (3/4 in.) from each end. A mechanically operated rammer will uniformly distribute blows over the sample and will be calibrated with several soil types, and be adjusted, if necessary, to give the same moisture-density results as with the manually operated rammer. For additional information concerning calibration, see AASHTO T 99 and T 180.
• Sample Extruder – A jack, lever frame, or other device for extruding compacted specimens from the mold quickly and with little disturbance.
• Balance(s) or scale(s) of the capacity and sensitivity required for the procedure used by the agency.
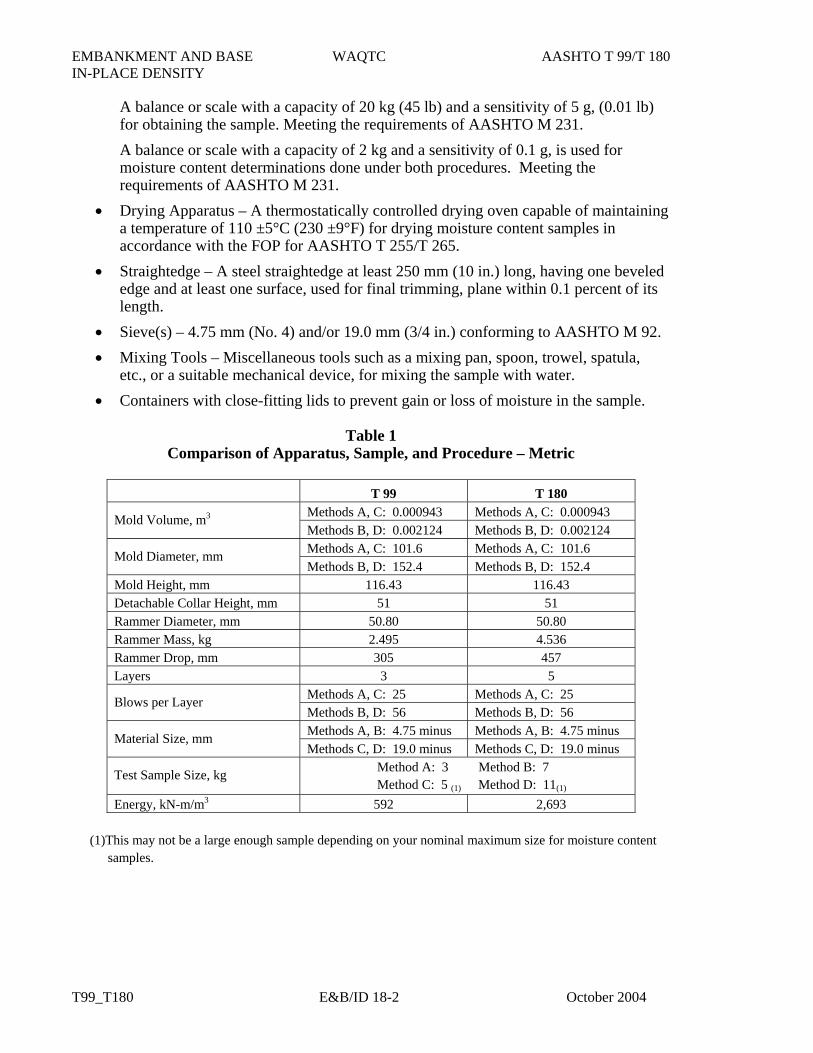
EMBANKMENT AND BASE WAQTC AASHTO T 99/T 180 IN-PLACE DENSITY
T99_T180 E&B/ID 18-2 October 2004
A balance or scale with a capacity of 20 kg (45 lb) and a sensitivity of 5 g, (0.01 lb) for obtaining the sample. Meeting the requirements of AASHTO M 231. A balance or scale with a capacity of 2 kg and a sensitivity of 0.1 g, is used for moisture content determinations done under both procedures. Meeting the requirements of AASHTO M 231.
• Drying Apparatus – A thermostatically controlled drying oven capable of maintaining a temperature of 110 ±5°C (230 ±9°F) for drying moisture content samples in accordance with the FOP for AASHTO T 255/T 265.
• Straightedge – A steel straightedge at least 250 mm (10 in.) long, having one beveled edge and at least one surface, used for final trimming, plane within 0.1 percent of its length.
• Sieve(s) – 4.75 mm (No. 4) and/or 19.0 mm (3/4 in.) conforming to AASHTO M 92. • Mixing Tools – Miscellaneous tools such as a mixing pan, spoon, trowel, spatula,
etc., or a suitable mechanical device, for mixing the sample with water. • Containers with close-fitting lids to prevent gain or loss of moisture in the sample.
Table 1
Comparison of Apparatus, Sample, and Procedure – Metric
T 99 T 180 Methods A, C: 0.000943 Methods A, C: 0.000943 Mold Volume, m3 Methods B, D: 0.002124 Methods B, D: 0.002124 Methods A, C: 101.6 Methods A, C: 101.6 Mold Diameter, mm Methods B, D: 152.4 Methods B, D: 152.4
Mold Height, mm 116.43 116.43 Detachable Collar Height, mm 51 51 Rammer Diameter, mm 50.80 50.80 Rammer Mass, kg 2.495 4.536 Rammer Drop, mm 305 457 Layers 3 5
Methods A, C: 25 Methods A, C: 25 Blows per Layer Methods B, D: 56 Methods B, D: 56 Methods A, B: 4.75 minus Methods A, B: 4.75 minus Material Size, mm Methods C, D: 19.0 minus Methods C, D: 19.0 minus
Test Sample Size, kg Method A: 3 Method B: 7 Method C: 5 (1) Method D: 11(1)
Energy, kN-m/m3 592 2,693
(1)This may not be a large enough sample depending on your nominal maximum size for moisture content samples.
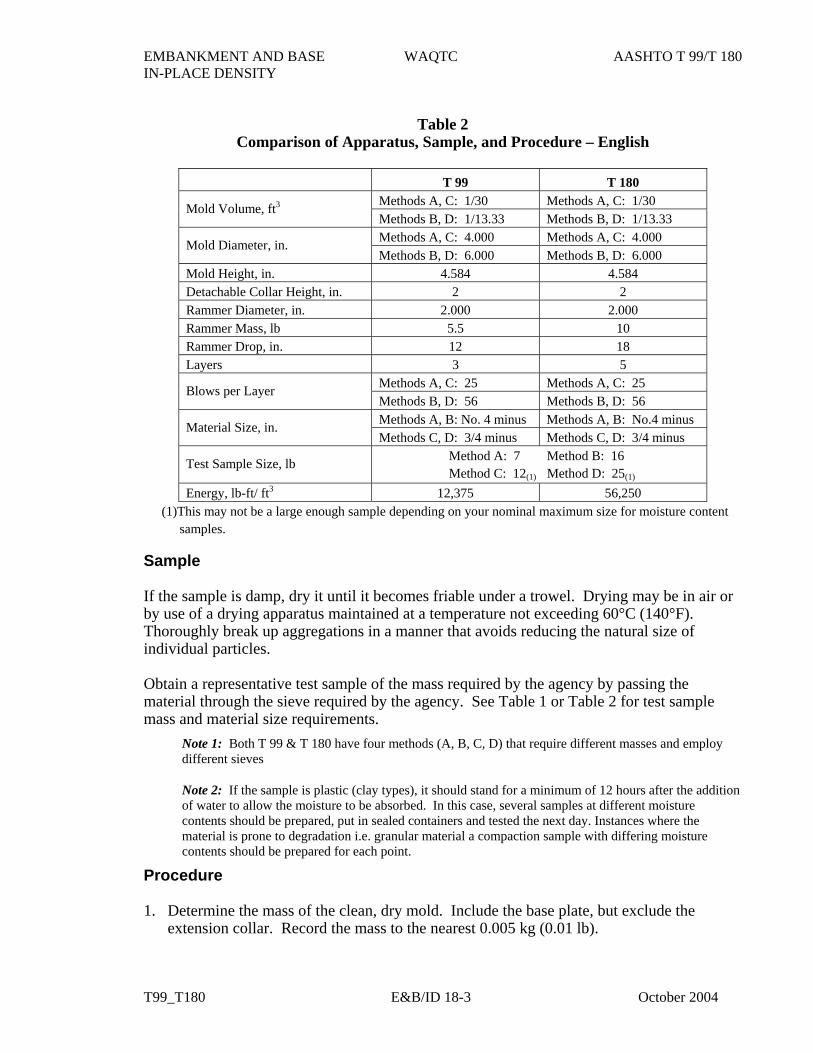
EMBANKMENT AND BASE WAQTC AASHTO T 99/T 180 IN-PLACE DENSITY
T99_T180 E&B/ID 18-3 October 2004
Table 2
Comparison of Apparatus, Sample, and Procedure – English
T 99 T 180 Methods A, C: 1/30 Methods A, C: 1/30 Mold Volume, ft3 Methods B, D: 1/13.33 Methods B, D: 1/13.33 Methods A, C: 4.000 Methods A, C: 4.000 Mold Diameter, in. Methods B, D: 6.000 Methods B, D: 6.000
Mold Height, in. 4.584 4.584 Detachable Collar Height, in. 2 2 Rammer Diameter, in. 2.000 2.000 Rammer Mass, lb 5.5 10 Rammer Drop, in. 12 18 Layers 3 5
Methods A, C: 25 Methods A, C: 25 Blows per Layer Methods B, D: 56 Methods B, D: 56 Methods A, B: No. 4 minus Methods A, B: No.4 minus Material Size, in. Methods C, D: 3/4 minus Methods C, D: 3/4 minus
Test Sample Size, lb Method A: 7 Method B: 16 Method C: 12(1) Method D: 25(1)
Energy, lb-ft/ ft3 12,375 56,250 (1)This may not be a large enough sample depending on your nominal maximum size for moisture content
samples. Sample If the sample is damp, dry it until it becomes friable under a trowel. Drying may be in air or by use of a drying apparatus maintained at a temperature not exceeding 60°C (140°F). Thoroughly break up aggregations in a manner that avoids reducing the natural size of individual particles. Obtain a representative test sample of the mass required by the agency by passing the material through the sieve required by the agency. See Table 1 or Table 2 for test sample mass and material size requirements.
Note 1: Both T 99 & T 180 have four methods (A, B, C, D) that require different masses and employ different sieves
Note 2: If the sample is plastic (clay types), it should stand for a minimum of 12 hours after the addition of water to allow the moisture to be absorbed. In this case, several samples at different moisture contents should be prepared, put in sealed containers and tested the next day. Instances where the material is prone to degradation i.e. granular material a compaction sample with differing moisture contents should be prepared for each point.
Procedure 1. Determine the mass of the clean, dry mold. Include the base plate, but exclude the
extension collar. Record the mass to the nearest 0.005 kg (0.01 lb).
EMBANKMENT AND BASE WAQTC AASHTO T 99/T 180 IN-PLACE DENSITY
T99_T180 E&B/ID 18-4 October 2004
2. Thoroughly mix the selected representative sample with sufficient water to dampen it to approximately 4 to 6 percentage points below optimum moisture content. See note 2.
3. Form a specimen by compacting the prepared soil in the mold (with collar attached) in
approximately equal layers. For each layer, spread the loose material uniformly in the mold. Lightly tamp the fluffy material with the manual rammer or other similar device. This establishes a firm surface on which to hold the rammer sleeve. Compact each layer with uniformly distributed blows from the rammer. See Table 1 for mold size, number of layers, number of blows, and rammer specification for the various test methods. Use the method specified by the agency. If material that has not been compacted remains adjacent to the walls of the mold and extends above the compacted surface, trim it down.
Note 3: During compaction, the mold shall rest firmly on a dense, uniform, rigid, and stable foundation or base. This base shall remain stationary during the compaction process.
4. Remove the extension collar. Avoid shearing off the sample below the top of the mold. A rule of thumb is that the material compacted in the mold should not be over 6 mm (¼ in) above the top of the mold once the collar has been removed.
5. Trim the compacted soil even with the top of the mold with the beveled edge of the
straightedge. 6. Determine the mass of the mold and wet soil in kg to the nearest 0.005 kg (0.01 lb) or
better. 7. Determine the wet mass of the sample by subtracting the mass in Step 1 from the mass in
Step 6. 8. Calculate the wet density as indicated below under “Calculations.” 9. Extrude the material from the mold. For soils and soil aggregate mixtures slice vertically
through the center and take a representative moisture content sample from one of the cut faces insuring that all layers are represented. For granular materials a vertical face will not exist. Take a representative sample. This sample must meet the sample size requirements of the test method to be used to determine moisture content.
Note 4: When developing a curve for free-draining soils, such as uniform sands and gravels, where seepage occurs at the bottom of the mold and base plate, taking a representative moisture content from the mixing bowl may be preferred in order to determine the amount of moisture available for compaction.
10. Determine the moisture content of the sample in accordance with the FOP for AASHTO T 255/T 265.
11. Thoroughly break up the remaining portion of the molded specimen until it will again
pass through the sieve, as judged by eye, and add to the remaining portion of the sample being tested. See note 2.
12. Add sufficient water to increase the moisture content of the remaining soil by
approximately 1 to 2 percentage points and repeat the above procedure.
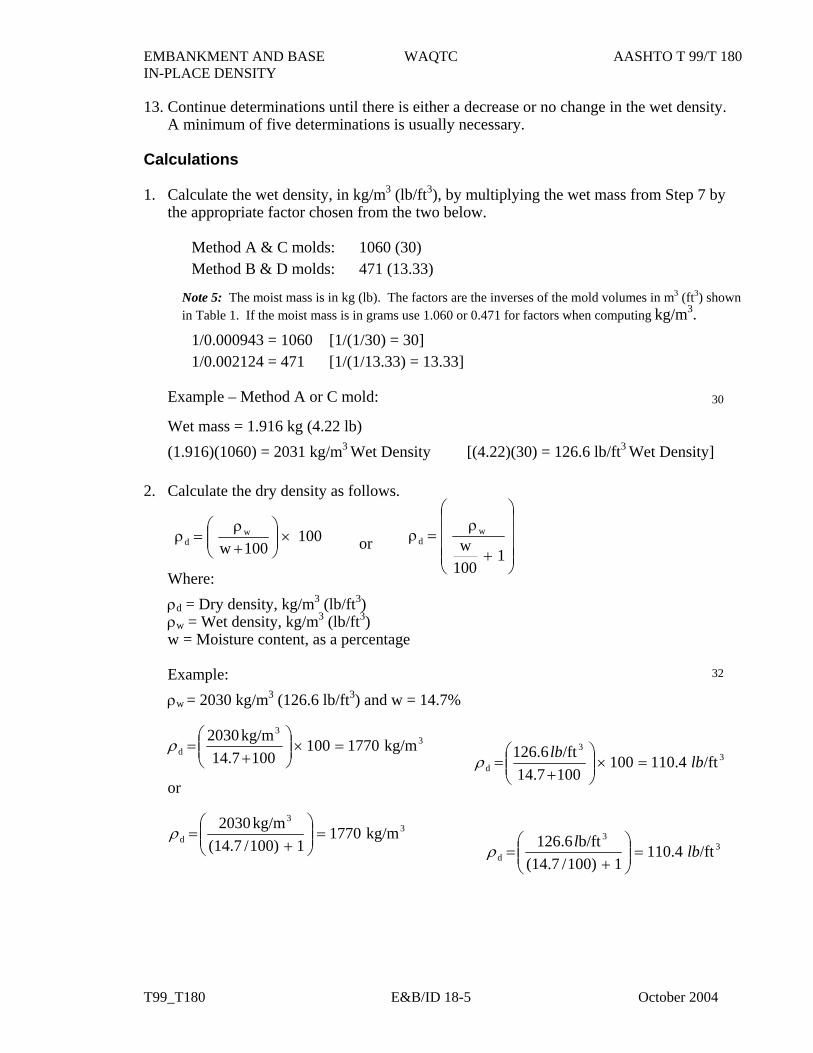
EMBANKMENT AND BASE WAQTC AASHTO T 99/T 180 IN-PLACE DENSITY
T99_T180 E&B/ID 18-5 October 2004
13. Continue determinations until there is either a decrease or no change in the wet density. A minimum of five determinations is usually necessary.
Calculations 1. Calculate the wet density, in kg/m3 (lb/ft3), by multiplying the wet mass from Step 7 by
the appropriate factor chosen from the two below.
Method A & C molds: 1060 (30) Method B & D molds: 471 (13.33)
Note 5: The moist mass is in kg (lb). The factors are the inverses of the mold volumes in m3 (ft3) shown in Table 1. If the moist mass is in grams use 1.060 or 0.471 for factors when computing kg/m3.
1/0.000943 = 1060 [1/(1/30) = 30] 1/0.002124 = 471 [1/(1/13.33) = 13.33]
Example – Method A or C mold:
Wet mass = 1.916 kg (4.22 lb) (1.916)(1060) = 2031 kg/m3 Wet Density [(4.22)(30) = 126.6 lb/ft3 Wet Density]
2. Calculate the dry density as follows.
or
Where: ρd = Dry density, kg/m3 (lb/ft3) ρw = Wet density, kg/m3 (lb/ft3) w = Moisture content, as a percentage
Example: ρw = 2030 kg/m3 (126.6 lb/ft3) and w = 14.7%
or
30
100100ww
d ×⎟⎟⎠
⎞⎜⎜⎝
⎛+ρ
=ρ
33
d kg/m177010010014.7
kg/m2030=×⎟⎟
⎠
⎞⎜⎜⎝
⎛+
=ρ
⎟⎟⎟⎟
⎠
⎞
⎜⎜⎜⎜
⎝
⎛
+
ρ=ρ
1100w
wd
33
d kg/m17701100)/(14.7
kg/m2030=⎟⎟
⎠
⎞⎜⎜⎝
⎛+
=ρ
32
33
d /ft4.11010010014.7/ft126.6 lblb
=×⎟⎟⎠
⎞⎜⎜⎝
⎛+
=ρ
33
d /ft110.41100)/(14.7
b/ft6.126 lbl=⎟⎟
⎠
⎞⎜⎜⎝
⎛+
=ρ
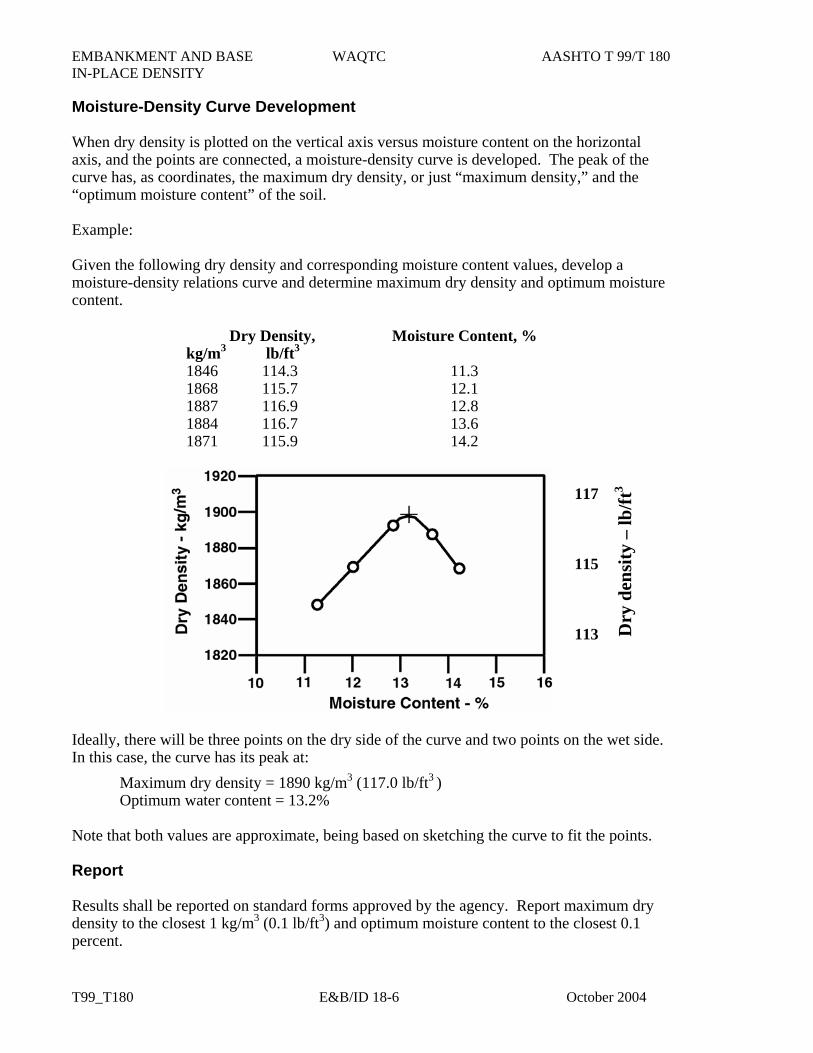
EMBANKMENT AND BASE WAQTC AASHTO T 99/T 180 IN-PLACE DENSITY
T99_T180 E&B/ID 18-6 October 2004
Moisture-Density Curve Development When dry density is plotted on the vertical axis versus moisture content on the horizontal axis, and the points are connected, a moisture-density curve is developed. The peak of the curve has, as coordinates, the maximum dry density, or just “maximum density,” and the “optimum moisture content” of the soil. Example: Given the following dry density and corresponding moisture content values, develop a moisture-density relations curve and determine maximum dry density and optimum moisture content.
Dry Density, kg/m3 lb/ft3
Moisture Content, %
1846 114.3 11.3 1868 115.7 12.1 1887 116.9 12.8 1884 116.7 13.6 1871 115.9 14.2
117 115 113 Ideally, there will be three points on the dry side of the curve and two points on the wet side. In this case, the curve has its peak at:
Maximum dry density = 1890 kg/m3 (117.0 lb/ft3 ) Optimum water content = 13.2%
Note that both values are approximate, being based on sketching the curve to fit the points. Report Results shall be reported on standard forms approved by the agency. Report maximum dry density to the closest 1 kg/m3 (0.1 lb/ft3) and optimum moisture content to the closest 0.1 percent.
Dry
den
sity
– lb
/ft3
CONCRETE WAQTC AASHTO T 119
T119_short Concrete 11-1 October 2005
SLUMP OF HYDRAULIC CEMENT CONCRETE FOP FOR AASHTO T 119 Scope This procedure provides instructions for determining the slump of hydraulic cement concrete in accordance with AASHTO T 119. It is not applicable to non-plastic and non-cohesive concrete. With concrete using 37.5mm (1½ in.) or larger aggregate, the +37.5mm (1½ in.) aggregate must be removed in accordance with the FOP for WAQTC TM 2. Apparatus • Mold: The metal mold shall be provided with foot pieces and handles. The mold must be
constructed without a seam. The interior of the mold shall be relatively smooth and free from projections such as protruding rivets. The mold shall be free from dents. A mold that clamps to a rigid nonabsorbent base plate is acceptable provided the clamping arrangement is such that it can be fully released without movement of the mold.
• Mold: Other than metal must conform to AASHTO T 119 Sections 5.1.1.1 & 5.1.1.2. • Tamping rod: 16 mm (5/8 in.) diameter and approximately 600 mm (24 in.) long, having
a hemispherical tip. (Hemispherical means “half a sphere”; the tip is rounded like half of a ball.)
• Scoop • Tape measure or ruler with at least 5 mm or 1/8 in. graduations • Base: Flat, rigid, non-absorbent moistened surface on which to set the slump cone Procedure 1. Obtain the sample in accordance with FOP for WAQTC TM 2. If any aggregate 37.5mm
(1½ in.) or larger aggregate is present, aggregate must be removed in accordance with the Wet Sieving portion of the FOP for WAQTC TM 2.
Note 1: Testing shall begin within five minutes of obtaining the sample.
2. Dampen the inside of the cone and place it on a dampened, rigid, nonabsorbent surface that is level and firm.
3. Stand on both foot pieces in order to hold the mold firmly in place. 4. Fill the cone 1/3 full by volume, to a depth of approximately 67 mm (2 5/8 in.) by depth. 5. Consolidate the layer with 25 strokes of the tamping rod, using the rounded end.
Distribute the strokes evenly over the entire cross section of the concrete. For this bottom layer, incline the rod slightly and make approximately half the strokes near the perimeter, and then progress with vertical strokes, spiraling toward the center.
6. Fill the cone 2/3 full by volume, to a depth of approximately 155 mm (6 1/8 in.) by depth.
CONCRETE WAQTC AASHTO T 119
T119_short Concrete 11-2 October 2005
7. Consolidate this layer with 25 strokes of the tamping rod, just penetrating into the bottom layer. Distribute the strokes evenly.
8. Fill the cone to overflowing. 9. Consolidate this layer with 25 strokes of the tamping rod, just penetrating into the second
layer. Distribute the strokes evenly. If the concrete falls below the top of the cone, stop, add more concrete, and continue rodding for a total of 25 strokes. Keep an excess of concrete above the top of the mold at all times. Distribute strokes evenly as before.
10. Strike off the top surface of concrete with a screeding and rolling motion of the tamping rod.
11. Clean overflow concrete away from the base of the mold. 12. Remove the mold from the concrete by raising it carefully in a vertical direction. Raise
the mold 300 mm (12 in.) in 5 ±2 seconds by a steady upward lift with no lateral or torsional motion being imparted to the concrete. The entire operation from the start of the filling through removal of the mold shall be carried out without interruption and shall be completed within an elapsed time of 2 1/2 minutes. Immediately measure the slump by:
13. Invert the slump cone and set it next to the specimen. 14. Lay the tamping rod across the mold so that it is over the test specimen. 15. Measure the distance between the bottom of the rod and the displaced original center of
the top of the specimen to the nearest 5 mm (1/4 in.).
Note 2: If a decided falling away or shearing off of concrete from one side or portion of the mass occurs, disregard the test and make a new test on another portion of the sample. If two consecutive tests on a sample of concrete show a falling away or shearing off of a portion of the concrete from the mass of the specimen, the concrete probably lacks the plasticity and cohesiveness necessary for the slump test to be applicable.
Report Results shall be reported on standard forms approved for use by the agency. Record the slump to the nearest 5 mm (1/4 in.).
I N T E R O F F I C E M E M O
TECHNICAL SERVICESConstruction Section
Office Phone: (503) 986-3000Fax Number: (503) 986-3096
DATE: October 1, 2001 TO: All Holders of the Manual of Field Test Procedures File Code: SECTION: Test Procedure AASHTO T 121
The Oregon Department of Transportation has specified method(s) for this Test Procedure. Please observe the following for our projects: • Calibrate the measuring bowl according to the procedure described under
Calibration of Measuring Bowl AASHTO T 152.
• When performing the Cement Content Calculation, if Fly Ash is used, add the Fly Ash amount to the Cement amount and divide by the batch yield.
• Microsilica Concrete (MC) – Microsilica (also know as silica fume) is supplied
as a powder or mixed with water, called a “slurry”. In either case, include the weight of microsilica with the batch weights.
• When performing the Cement Content Calculation, include the dry microsilica
with the cement. • If the microsilica is in a slurry form, you must calculate how much dry
microsilica is in each liter or (gallon) of slurry based on the information supplied by the manufacturer.

THIS PAGE INTENTIONALLY LEFT BLANK
CONCRETE WAQTC AASHTO T 121
T121_short Concrete 12-1 October 2005
DENSITY (UNIT WEIGHT), YIELD, AND AIR CONTENT (GRAVIMETRIC) OF CONCRETE FOP FOR AASHTO T 121 Scope This procedure covers the determination of density, or unit weight, of freshly mixed concrete in accordance with AASHTO T 121. It also provides formulas for calculating the volume of concrete produced from a mixture of known quantities of component materials, and provides a method for calculating cement content& cementitious material content – the mass of cement or cementitious material per unit volume of concrete. A procedure for calculating water/cement ratio is also covered. Apparatus • Measure: May be the bowl portion of the air meter used for determining air content
under the FOP for AASHTO T 152. Otherwise, it shall be a metal cylindrical container meeting the requirements of AASHTO T 121. The capacity and dimensions of the measure shall conform to those specified in Table 1.
• Balance or scale: Accurate to 0.3 percent of the test load at any point within the range of use.
• Tamping Rod: 16 mm (5/8 in.) diameter and approximately 600 mm (24 in.) long, having a hemispherical tip. (Hemispherical means “half a sphere”; the tip is rounded like half of a ball.)
• Vibrator: 7000 vibrations per minute, 19 to 38 mm (3/4 to 1 1/2 in.) in diameter, and the length of the shaft shall be at least 610 mm (24in).
• Scoop • Strike-off Plate: A flat rectangular metal plate at least 6 mm (1/4 in.) thick or a glass or
acrylic plate at least 12 mm (1/2 in.) thick, with a length and width at least 50 mm (2 in.) greater than the diameter of the measure with which it is to be used. The edges of the plate shall be straight and smooth within tolerance of 1.5 mm (1/16 in.).
• Mallet: With a rubber or rawhide head having a mass of 0.57 ±0.23 kg (1.25 ±0.5 lb) for use with measures of 0.014 m3 (1/2 ft3 ) or less, or having a mass of 1.02 ±0.23 kg (2.25 ±0.5 lb) for use with measures of 0.028 m3 (1 ft3).
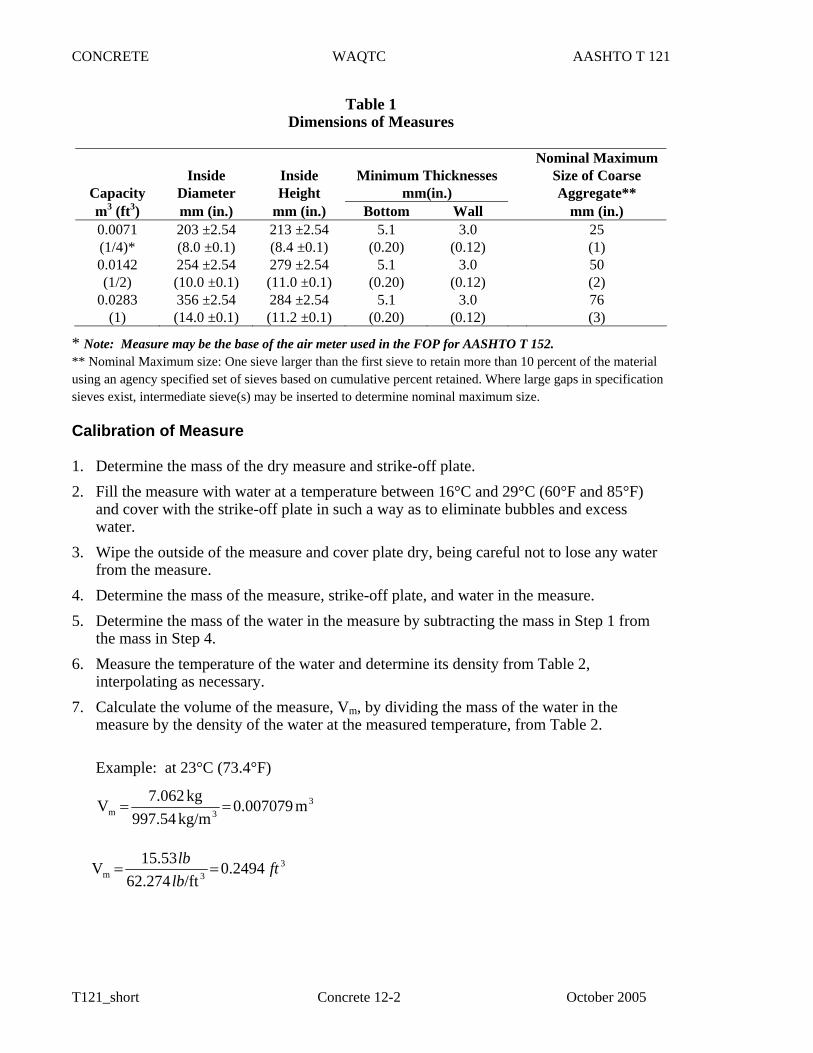
CONCRETE WAQTC AASHTO T 121
T121_short Concrete 12-2 October 2005
Table 1 Dimensions of Measures
Capacity
Inside
Diameter
Inside Height
Minimum Thicknesses
mm(in.)
Nominal Maximum Size of Coarse Aggregate**
m3 (ft3) mm (in.) mm (in.) Bottom Wall mm (in.) 0.0071 (1/4)*
203 ±2.54 (8.0 ±0.1)
213 ±2.54 (8.4 ±0.1)
5.1 (0.20)
3.0 (0.12)
25 (1)
0.0142 (1/2)
254 ±2.54 (10.0 ±0.1)
279 ±2.54 (11.0 ±0.1)
5.1 (0.20)
3.0 (0.12)
50 (2)
0.0283 (1)
356 ±2.54 (14.0 ±0.1)
284 ±2.54 (11.2 ±0.1)
5.1 (0.20)
3.0 (0.12)
76 (3)
* Note: Measure may be the base of the air meter used in the FOP for AASHTO T 152. ** Nominal Maximum size: One sieve larger than the first sieve to retain more than 10 percent of the material using an agency specified set of sieves based on cumulative percent retained. Where large gaps in specification sieves exist, intermediate sieve(s) may be inserted to determine nominal maximum size. Calibration of Measure 1. Determine the mass of the dry measure and strike-off plate. 2. Fill the measure with water at a temperature between 16°C and 29°C (60°F and 85°F)
and cover with the strike-off plate in such a way as to eliminate bubbles and excess water.
3. Wipe the outside of the measure and cover plate dry, being careful not to lose any water from the measure.
4. Determine the mass of the measure, strike-off plate, and water in the measure. 5. Determine the mass of the water in the measure by subtracting the mass in Step 1 from
the mass in Step 4. 6. Measure the temperature of the water and determine its density from Table 2,
interpolating as necessary. 7. Calculate the volume of the measure, Vm, by dividing the mass of the water in the
measure by the density of the water at the measured temperature, from Table 2.
Example: at 23°C (73.4°F)
33m m0.007079
kg/m997.54kg7.062V ==
33m 0.2494
/ft62.27415.53V ft
lblb
==
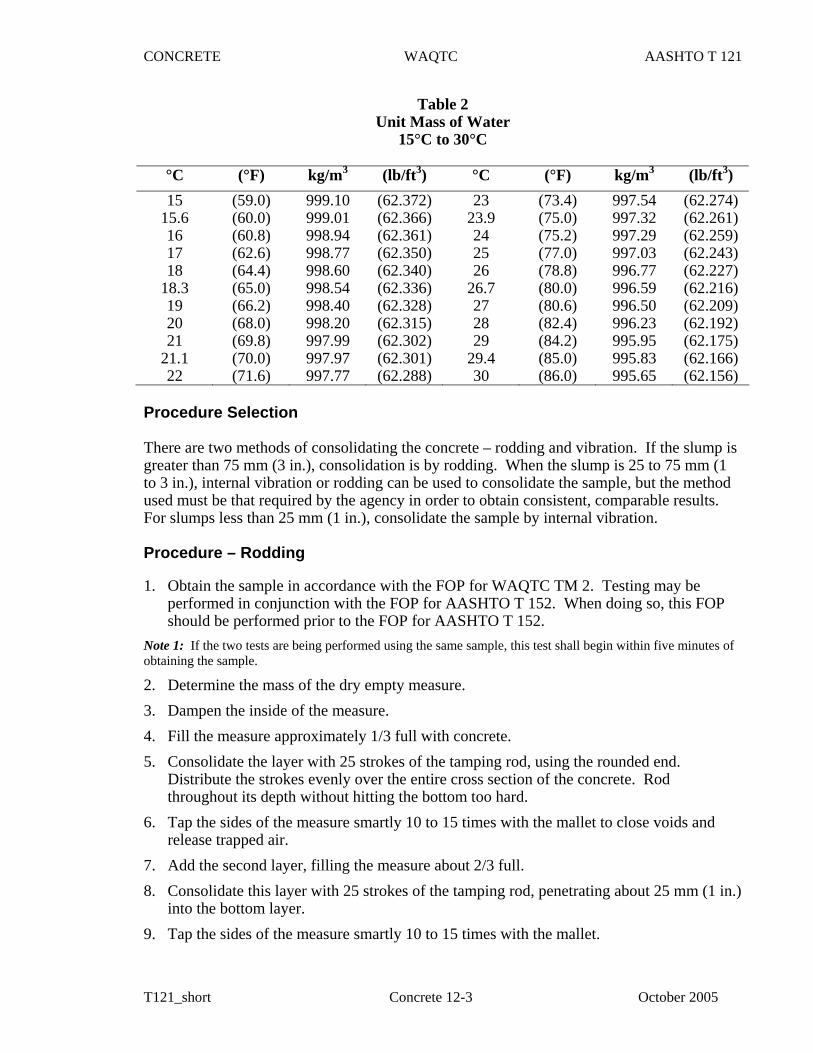
CONCRETE WAQTC AASHTO T 121
T121_short Concrete 12-3 October 2005
Table 2 Unit Mass of Water
15°C to 30°C
°C (°F) kg/m3 (lb/ft3) °C (°F) kg/m3 (lb/ft3) 15 (59.0) 999.10 (62.372) 23 (73.4) 997.54 (62.274)
15.6 (60.0) 999.01 (62.366) 23.9 (75.0) 997.32 (62.261) 16 (60.8) 998.94 (62.361) 24 (75.2) 997.29 (62.259) 17 (62.6) 998.77 (62.350) 25 (77.0) 997.03 (62.243) 18 (64.4) 998.60 (62.340) 26 (78.8) 996.77 (62.227)
18.3 (65.0) 998.54 (62.336) 26.7 (80.0) 996.59 (62.216) 19 (66.2) 998.40 (62.328) 27 (80.6) 996.50 (62.209) 20 (68.0) 998.20 (62.315) 28 (82.4) 996.23 (62.192) 21 (69.8) 997.99 (62.302) 29 (84.2) 995.95 (62.175)
21.1 (70.0) 997.97 (62.301) 29.4 (85.0) 995.83 (62.166) 22 (71.6) 997.77 (62.288) 30 (86.0) 995.65 (62.156)
Procedure Selection There are two methods of consolidating the concrete – rodding and vibration. If the slump is greater than 75 mm (3 in.), consolidation is by rodding. When the slump is 25 to 75 mm (1 to 3 in.), internal vibration or rodding can be used to consolidate the sample, but the method used must be that required by the agency in order to obtain consistent, comparable results. For slumps less than 25 mm (1 in.), consolidate the sample by internal vibration. Procedure – Rodding 1. Obtain the sample in accordance with the FOP for WAQTC TM 2. Testing may be
performed in conjunction with the FOP for AASHTO T 152. When doing so, this FOP should be performed prior to the FOP for AASHTO T 152.
Note 1: If the two tests are being performed using the same sample, this test shall begin within five minutes of obtaining the sample.
2. Determine the mass of the dry empty measure. 3. Dampen the inside of the measure. 4. Fill the measure approximately 1/3 full with concrete. 5. Consolidate the layer with 25 strokes of the tamping rod, using the rounded end.
Distribute the strokes evenly over the entire cross section of the concrete. Rod throughout its depth without hitting the bottom too hard.
6. Tap the sides of the measure smartly 10 to 15 times with the mallet to close voids and release trapped air.
7. Add the second layer, filling the measure about 2/3 full. 8. Consolidate this layer with 25 strokes of the tamping rod, penetrating about 25 mm (1 in.)
into the bottom layer. 9. Tap the sides of the measure smartly 10 to 15 times with the mallet.
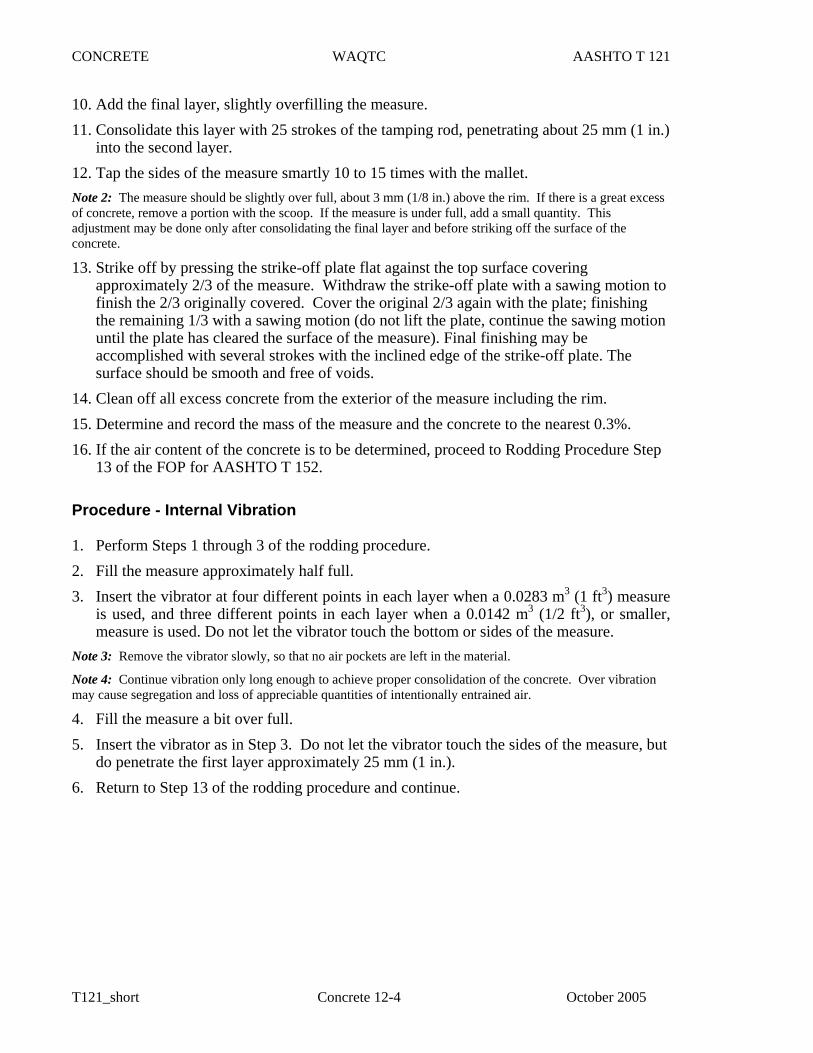
CONCRETE WAQTC AASHTO T 121
T121_short Concrete 12-4 October 2005
10. Add the final layer, slightly overfilling the measure. 11. Consolidate this layer with 25 strokes of the tamping rod, penetrating about 25 mm (1 in.)
into the second layer. 12. Tap the sides of the measure smartly 10 to 15 times with the mallet. Note 2: The measure should be slightly over full, about 3 mm (1/8 in.) above the rim. If there is a great excess of concrete, remove a portion with the scoop. If the measure is under full, add a small quantity. This adjustment may be done only after consolidating the final layer and before striking off the surface of the concrete.
13. Strike off by pressing the strike-off plate flat against the top surface covering approximately 2/3 of the measure. Withdraw the strike-off plate with a sawing motion to finish the 2/3 originally covered. Cover the original 2/3 again with the plate; finishing the remaining 1/3 with a sawing motion (do not lift the plate, continue the sawing motion until the plate has cleared the surface of the measure). Final finishing may be accomplished with several strokes with the inclined edge of the strike-off plate. The surface should be smooth and free of voids.
14. Clean off all excess concrete from the exterior of the measure including the rim. 15. Determine and record the mass of the measure and the concrete to the nearest 0.3%. 16. If the air content of the concrete is to be determined, proceed to Rodding Procedure Step
13 of the FOP for AASHTO T 152. Procedure - Internal Vibration 1. Perform Steps 1 through 3 of the rodding procedure. 2. Fill the measure approximately half full. 3. Insert the vibrator at four different points in each layer when a 0.0283 m3 (1 ft3) measure
is used, and three different points in each layer when a 0.0142 m3 (1/2 ft3), or smaller, measure is used. Do not let the vibrator touch the bottom or sides of the measure.
Note 3: Remove the vibrator slowly, so that no air pockets are left in the material.
Note 4: Continue vibration only long enough to achieve proper consolidation of the concrete. Over vibration may cause segregation and loss of appreciable quantities of intentionally entrained air.
4. Fill the measure a bit over full. 5. Insert the vibrator as in Step 3. Do not let the vibrator touch the sides of the measure, but
do penetrate the first layer approximately 25 mm (1 in.). 6. Return to Step 13 of the rodding procedure and continue.
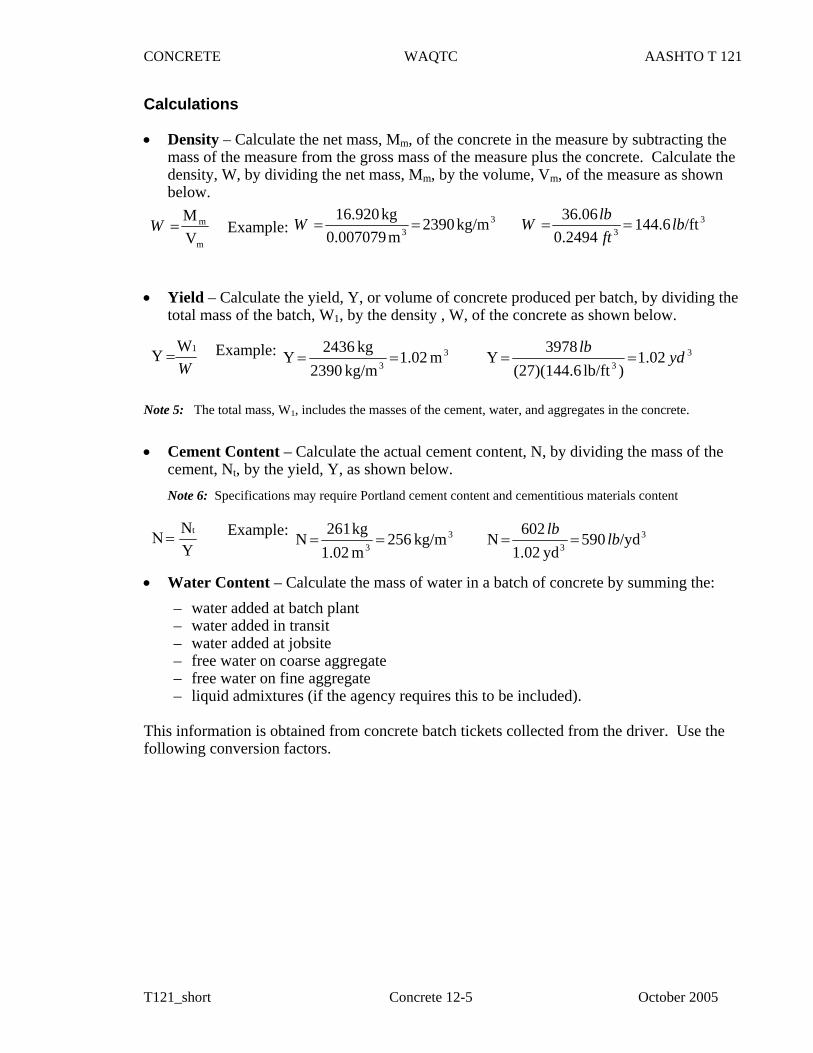
CONCRETE WAQTC AASHTO T 121
T121_short Concrete 12-5 October 2005
Calculations • Density – Calculate the net mass, Mm, of the concrete in the measure by subtracting the
mass of the measure from the gross mass of the measure plus the concrete. Calculate the density, W, by dividing the net mass, Mm, by the volume, Vm, of the measure as shown below. Example:
• Yield – Calculate the yield, Y, or volume of concrete produced per batch, by dividing the
total mass of the batch, W1, by the density , W, of the concrete as shown below. Example: Note 5: The total mass, W1, includes the masses of the cement, water, and aggregates in the concrete.
• Cement Content – Calculate the actual cement content, N, by dividing the mass of the
cement, Nt, by the yield, Y, as shown below. Note 6: Specifications may require Portland cement content and cementitious materials content Example: • Water Content – Calculate the mass of water in a batch of concrete by summing the:
– water added at batch plant – water added in transit – water added at jobsite – free water on coarse aggregate – free water on fine aggregate – liquid admixtures (if the agency requires this to be included).
This information is obtained from concrete batch tickets collected from the driver. Use the following conversion factors.
m
m
VM
=W 33 kg/m2390
m0.007079kg16.920
==W
W1WY = 3
3 m1.02kg/m2390
kg2436Y ==
YNΝ t
= 33 kg/m256
m1.02kg261
N ==
33 /ft6.144
0.249436.06 lb
ftlbW ==
33 1.02)lb/ft(27)(144.6
3978Y yd
lb==
33 /yd590
yd1.02602
N lblb
==
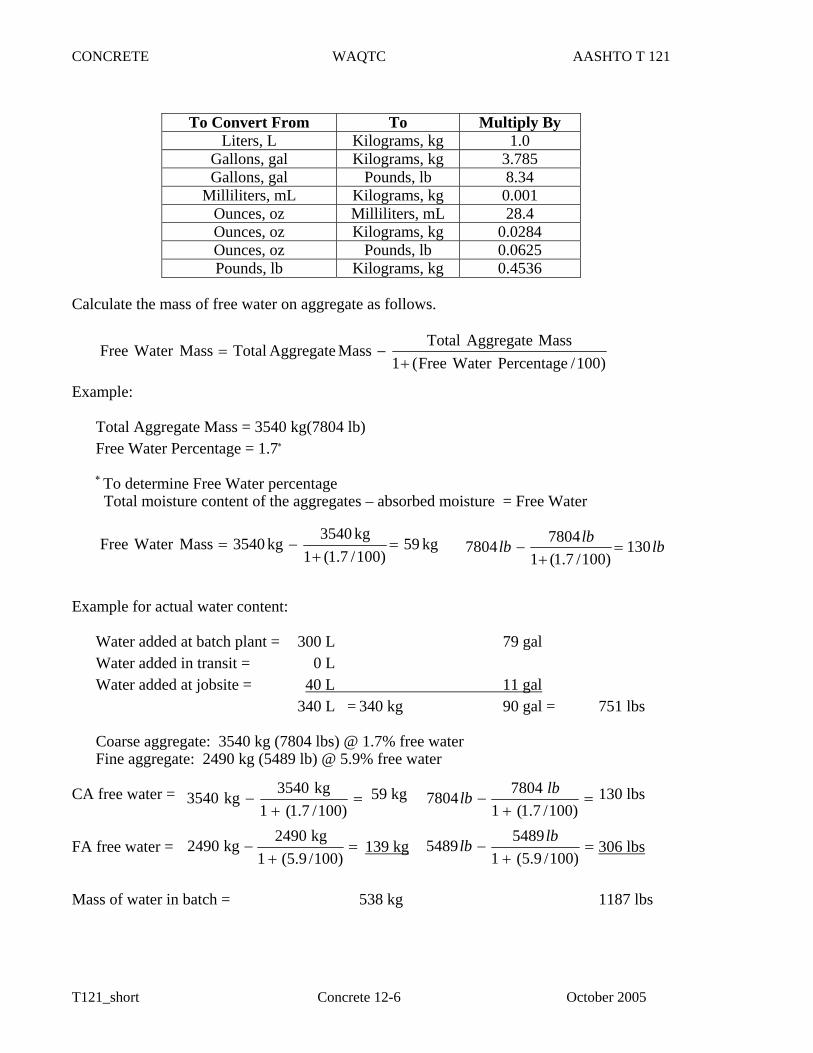
CONCRETE WAQTC AASHTO T 121
T121_short Concrete 12-6 October 2005
To Convert From To Multiply By
Liters, L Kilograms, kg 1.0 Gallons, gal Kilograms, kg 3.785 Gallons, gal Pounds, lb 8.34
Milliliters, mL Kilograms, kg 0.001 Ounces, oz Milliliters, mL 28.4 Ounces, oz Kilograms, kg 0.0284 Ounces, oz Pounds, lb 0.0625 Pounds, lb Kilograms, kg 0.4536
Calculate the mass of free water on aggregate as follows. Example:
Total Aggregate Mass = 3540 kg(7804 lb) Free Water Percentage = 1.7∗ ∗ To determine Free Water percentage Total moisture content of the aggregates – absorbed moisture = Free Water
Example for actual water content:
Water added at batch plant = 300 L 79 gal Water added in transit = 0 L Water added at jobsite = 40 L 11 gal 340 L = 340 kg 90 gal = 751 lbs
Coarse aggregate: 3540 kg (7804 lbs) @ 1.7% free water Fine aggregate: 2490 kg (5489 lb) @ 5.9% free water
CA free water = 59 kg 130 lbs
FA free water = 139 kg 306 lbs
Mass of water in batch = 538 kg 1187 lbs
)100/PercentageWaterFree(1MassAggregateTotalMassAggregateTotalMassWaterFree
+−=
kg59)100/7.1(1
kg3540kg3540MassWaterFree =+
−=
=+
−)100/7.1(1
kg3540kg3540
=+
−)100/9.5(1
kg2490kg2490
lblblb 130)100/7.1(1
78047804 =+
−
=+
−)100/7.1(1
78047804 lblb
=+
−)100/9.5(1
54895489 lblb
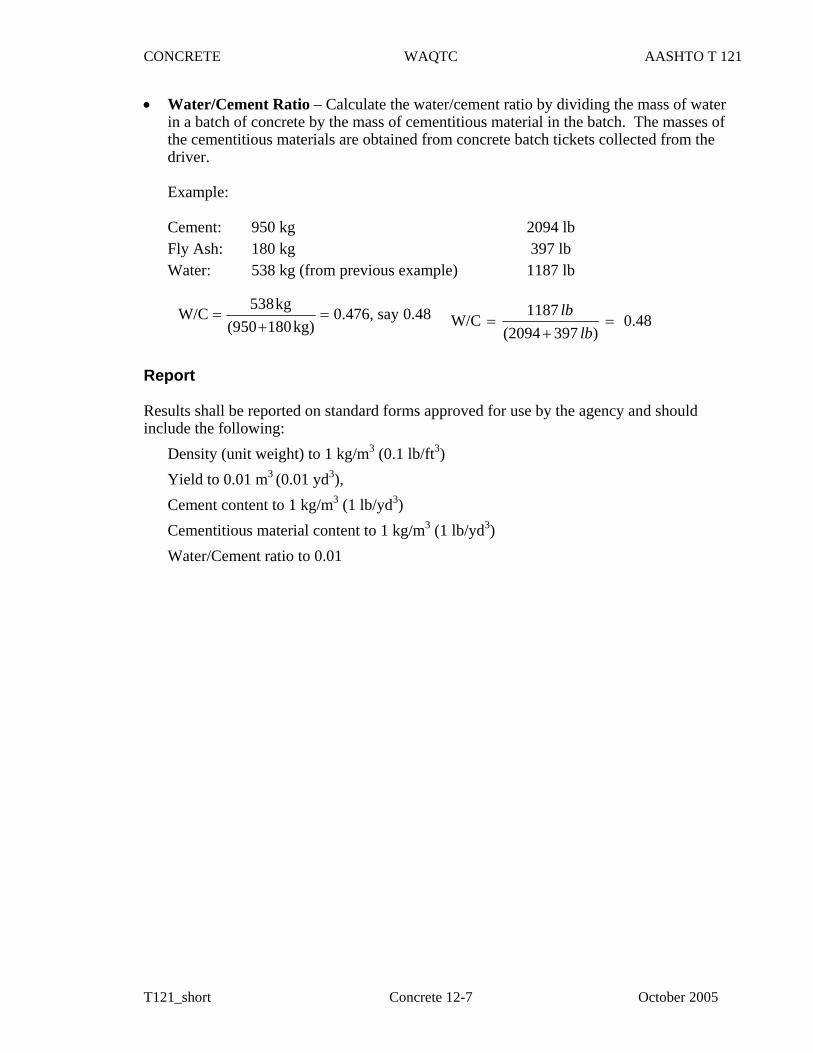
CONCRETE WAQTC AASHTO T 121
T121_short Concrete 12-7 October 2005
• Water/Cement Ratio – Calculate the water/cement ratio by dividing the mass of water in a batch of concrete by the mass of cementitious material in the batch. The masses of the cementitious materials are obtained from concrete batch tickets collected from the driver.
Example: Cement: 950 kg 2094 lb Fly Ash: 180 kg 397 lb Water: 538 kg (from previous example) 1187 lb
Report Results shall be reported on standard forms approved for use by the agency and should include the following:
Density (unit weight) to 1 kg/m3 (0.1 lb/ft3) Yield to 0.01 m3 (0.01 yd3), Cement content to 1 kg/m3 (1 lb/yd3) Cementitious material content to 1 kg/m3 (1 lb/yd3) Water/Cement ratio to 0.01
0.48say0.476,kg)180(950
kg538W/C =+
= 0.48)397(2094
1187W/C =
+=
lblb

CONCRETE WAQTC AASHTO T 121
T121_short Concrete 12-8 October 2005
THIS PAGE INTENTIONALLY LEFT BLANK
I N T E R O F F I C E M E M O
TECHNICAL SERVICESConstruction Section
Office Phone: (503) 986-3000Fax Number: (503) 986-3096
DATE: October 15, 2004 TO: All Holders of the Manual of Field Test Procedures File Code: SECTION: Test Procedure AASHTO T 152
The Oregon Department of Transportation has specified method(s) for this Test Procedure. Please observe the following for our projects: • As a minimum calibrate the air meter gauge every three months and whenever
test results are suspect. Perform calibration according to the procedure described under Calibration of Air Meter Gauge. Maintain records with the air meter as described in the calibration procedure (See note 4).
• An Aggregate Correction Factor is not required for Air Content Determination.

ODOT TM 323(06) 2
CONCRETE WAQTC AASHTO T 152
T152_short Concrete 13-1 October 2006
AIR CONTENT OF FRESHLY MIXED CONCRETE BY THE PRESSURE METHOD FOP FOR AASHTO T 152 Scope This procedure covers determination of the air content in freshly mixed Portland Cement Concrete containing dense aggregates in accordance with AASHTO T 152, Type B meter. It is not for use with lightweight or highly porous aggregates. This procedure includes calibration of the Type B air meter gauge, and two methods for calibrating the gauge are presented. Concrete containing aggregate that is 37.5 mm (1 ½”) or larger must be wet sieved. Sieve a sufficient amount of the sample over the 37.5 mm (1 ½”) sieve in accordance with the wet sieving portion of the FOP for WAQTC TM 2. Apparatus • Air meter: Type B, as described in AASHTO T 152 • Balance or scale: Accurate to 0.3 percent of the test load at any point within the range of
use (for Method 1 calibration only) • Tamping rod: 16 mm (5/8 in.) diameter and approximately 600 mm (24 in.) long, having
a hemispherical tip. (Hemispherical means “half a sphere”; the tip is rounded like half of a ball.)
• Vibrator: 7000 vibrations per minute, 19 to 38 mm (0.75 to 1.50 in.) in diameter, at least 75 mm (3 in.) longer than the section being vibrated for use with low slump concrete
• Scoop • Container for water: rubber syringe (may also be a squeeze bottle) • Strike-off bar: Approximately 300 mm x 22 mm x 3 mm (12 in. x 3/4 in. x 1/8 in.) • Strike-off Plate: A flat rectangular metal plate at least 6 mm (1/4 in.) thick or a glass or
acrylic plate at least 12 mm (1/2 in.) thick, with a length and width at least 50 mm (2 in.) greater than the diameter of the measure with which it is to be used. The edges of the plate shall be straight and smooth within tolerance of 1.5 mm (1/16 in.).
Note 1: Use either the strike-off bar or strike-off plate; both are not required.
• Mallet: With a rubber or rawhide head having a mass of 0.57 ±0.23 kg (1.25 ±0.5 lb) Calibration of Air Meter Gauge
Note 2: There are two methods for calibrating the air meter, mass or volume.
1. Screw the short piece of straight tubing into the threaded petcock hole on the underside of the cover. Determine the mass of the dry, empty air meter bowl and cover assembly (Mass Method only).
2. Fill the bowl nearly full with water.
CONCRETE WAQTC AASHTO T 152
T152_short Concrete 13-2 October 2006
3. Clamp the cover on the bowl with the tube extending down into the water. Mark the petcock with the tube attached for future reference.
4. Add water through the petcock having the pipe extension below until all air is forced out the other petcock. Rock the meter slightly until all air is expelled through the petcock.
5. Wipe off the air meter bowl and cover assembly, and determine the mass of the filled unit (Mass Method only).
6. Pump up the air pressure to a little beyond the predetermined initial pressure indicated on the gauge. Wait a few seconds for the compressed air to cool, and then stabilize the gauge hand at the proper initial pressure by pumping up or relieving pressure, as needed.
7. Close both petcocks and immediately open the main air valve exhausting air into the bowl. Wait a few seconds until the meter needle stabilizes. The gauge should now read 0 percent. If two or more tests show a consistent variation from 0 percent in the result, change the initial pressure line to compensate for the variation, and use the newly established initial pressure line for subsequent tests.
8. Determine which petcock has the straight tube attached to it. Attach the curved tube to external portion of the same petcock.
9. Pump air into the air chamber. Open the petcock with the curved tube attached to it. Open the main air valve for short periods of time until 5 percent of water by mass or volume has been removed from the air meter. Remember to open both petcocks to release the pressure in the bowl and drain the water in the curved tube back into the bowl. To determine the mass of the water to be removed, subtract the mass found in Step 1 from the mass found in Step 5. Multiply this value by 0.05. This is the mass of the water that must be removed. To remove 5 percent by volume, remove water until the external calibration vessel is level full.
Note3: Many air meters are supplied with a calibration vessel(s) of known volume that are used for this purpose. Calibration vessel(s) should be brass, not plastic, and must be protected from crushing or denting. If an external calibration vessel is used, confirm what percentage volume it represents for the air meter being used. Vessels commonly represent 5 percent volume, but they are for specific size meters. This should be confirmed by mass.
10. Remove the curved tube. Pump up the air pressure to a little beyond the predetermined initial pressure indicated on the gauge. Wait a few seconds for the compressed air to cool, and then stabilize the gauge hand at the proper initial pressure by pumping up or relieving pressure, as needed.
11. Close both petcocks and immediately open the main air valve exhausting air into the bowl. Wait a few seconds until the meter needle is stabilized. The gauge should now read 5.0 ±0.1 percent. If the gauge is outside that range, the meter needs adjustment. The adjustment could involve adjusting the starting point so that the gauge reads 5.0 ±0.1 percent when this calibration is run, or could involve moving the gauge needle to read 5.0 percent. Any adjustment should comply with the manufacturer’s recommendations.
Note 4: Calibration shall be performed at the frequency required by the agency. Record the date of the calibration, the calibration results, and the name of the technician performing the calibration in the log book kept with each air meter.
CONCRETE WAQTC AASHTO T 152
T152_short Concrete 13-3 October 2006
12. When the gauge hand reads correctly at 5.0 percent, additional water may be withdrawn in the same manner to check the results at other values such as 10 percent or 15 percent.
13. If an internal calibration vessel is used follow steps 1 thru 8 to set initial reading.
14. Release pressure from the bowl and remove cover. Place the internal calibration vessel into the bowl. This will displace 5 percent of the water in the bowl. (See AASHTO 152 for more information on internal calibration vessels.)
15. Place the cover back on the bowl and add water through the petcock until all the air has been expelled.
16. Pump up the air pressure chamber to the initial pressure. Wait a few seconds for the compressed air to cool, and then stabilize the gauge hand at the proper initial pressure by pumping up or relieving pressure, as needed.
17. Close both petcocks and immediately open the main air valve exhausting air into the bowl. Wait a few seconds until the meter needle stabilizes. The gauge should now read 5 percent.
Note 5: Remove the extension tubing from threaded petcock hole in the underside of the cover before
starting the test procedure. Procedure Selection There are two methods of consolidating the concrete – rodding and vibration. If the slump is greater than 75 mm (3 in.), consolidation is by rodding. When the slump is 25 to 75 mm (1 to 3 in.), internal vibration or rodding can be used to consolidate the sample, but the method used must be that required by the agency in order to obtain consistent, comparable results. For slumps less than 25 mm (1 in.), consolidate the sample by internal vibration. Procedure – Rodding 1. Obtain the sample in accordance with the FOP for WAQTC TM 2. If any aggregate
37.5mm (1½ in.) or larger is present, aggregate must be removed in accordance with the Wet Sieving portion of the FOP for WAQTC TM 2. Note 6: Testing shall begin within five minutes of obtaining the sample.
2. Dampen the inside of the air meter bowl and place on a firm level surface. 3. Fill the bowl approximately 1/3 full with concrete. 4. Consolidate the layer with 25 strokes of the tamping rod, using the rounded end.
Distribute the strokes evenly over the entire cross section of the concrete. Rod throughout its depth without hitting the bottom too hard.
5. Tap the sides of the bowl smartly 10 to 15 times with the mallet to close voids and release trapped air.
6. Add the second layer, filling the bowl about 2/3 full. 7. Consolidate this layer with 25 strokes of the tamping rod, penetrating about 25 mm (1 in.)
into the bottom layer.
CONCRETE WAQTC AASHTO T 152
T152_short Concrete 13-4 October 2006
8. Tap the sides of the bowl 10 to 15 times with the mallet. 9. Add the final layer, slightly overfilling the bowl. 10. Consolidate this layer with 25 strokes of the tamping rod, penetrating about 25 mm (1 in.)
into the second layer. 11. Tap the sides of the bowl smartly 10 to 15 times with the mallet.
Note 7: The bowl should be slightly over full, about 3 mm (1/8 in.) above the rim. If there is a great excess of concrete, remove a portion with the trowel or scoop. If the bowl is under full, add a small quantity. This adjustment may be done only after consolidating the final layer and before striking off the surface of the concrete.
12. Strike off the surface of the concrete and finish it smoothly with a sawing action of the strike-off bar or plate, using great care to leave the bowl just full. The surface should be smooth and free of voids.
13. Clean the top flange of the bowl to ensure a proper seal. 14. Moisten the inside of the cover and check to see that both petcocks are open and the main
air valve is closed. 15. Clamp the cover on the bowl. 16. Inject water through a petcock on the cover until water emerges from the petcock on the
other side. 17. Jar and or rock the air meter gently until no air bubbles appear to be coming out of the
second petcock. The petcock expelling water should be higher than the petcock where water is being injected. Return the air meter to a level position and verify that water is present in both petcocks.
18. Close the air bleeder valve and pump air into the air chamber until the needle goes past the initial pressure determined for the gauge. Allow a few seconds for the compressed air to cool.
19. Tap the gauge gently with one hand while slowly opening the air bleeder valve until the needle rests on the initial pressure. Close the air bleeder valve.
20. Close both petcocks. 21. Open the main air valve. 22. Tap the sides of the bowl smartly with the mallet. 23. With the main air valve open, lightly tap the gauge to settle the needle, and then read the
air content to the nearest 0.1 percent. 24. Release or close the main air valve. 25. Open both petcocks to release pressure, remove the concrete, and thoroughly clean the
cover and bowl with clean water. 26. Open the main air valve to relieve the pressure in the air chamber. Procedure - Internal Vibration
CONCRETE WAQTC AASHTO T 152
T152_short Concrete 13-5 October 2006
1. Obtain the sample in accordance with the FOP for WAQTC TM 2. If any aggregate 37.5mm (1½ in.) or larger is present, aggregate must be removed in accordance with the Wet Sieving portion of the FOP for WAQTC TM 2.
2. Dampen the inside of the air meter bowl and place on a firm level surface. 3. Fill the bowl approximately half full. 4. Insert the vibrator at three different points. Do not let the vibrator touch the bottom or
sides of the bowl.
Note 8: Remove the vibrator slowly, so that no air pockets are left in the material.
Note 9: Continue vibration only long enough to achieve proper consolidation of the concrete. Over vibration may cause segregation and loss of appreciable quantities of intentionally entrained air.
5. Fill the bowl a bit over full. 6. Insert the vibrator as in Step 4. Do not let the vibrator touch the sides of the bowl, and
penetrate the first layer approximately 25 mm (1 in.). 7. Return to Step 12 of the rodding procedure and continue. Report • Results shall be reported on standard forms approved for use by the agency. • Record the percent of air to the nearest 0.1 percent. • Some agencies require an aggregate correction factor in order to determine total % entrained air. Total % entrained air = Gauge reading – aggregate correction factor from mix design (See AASHTO T 152 for more information.)

CONCRETE WAQTC AASHTO T 152
T152_short Concrete 13-6 October 2006
THIS PAGE INTENTIONALLY LEFT BLANK
I N T E R O F F I C E M E M O
TECHNICAL SERVICESConstruction Section
Office Phone: (503) 986-3000Fax Number: (503) 986-3096
DATE: October 31, 2006 TO: All Holders of the Manual of Field Test Procedures File Code: SECTION: Test Procedure AASHTO T 166/275
The Oregon Department of Transportation has specified method(s) for this Test Procedure. Please observe the following for our projects:
• Absorption Calculations are not required.
• When performing the Bulk Specific Gravity determination for the Core Correlation process (ODOT TM-327), use Method A. Method C is required for dry mass determination.
• When performing the Bulk Specific Gravity determination for Lab
Fabricated Gyratory Specimens, use Method A. The Method C option is not allowed.
• When performing the Bulk Specific Gravity determination for Cores
removed for “density acceptance” purposes, use Method A. The Method C option is not allowed.

ODOT TM 323(06) 2
ASPHALT WAQTC AASHTO T 166/T 275
T166_T275_short Asphalt 17-1 October 2006
BULK SPECIFIC GRAVITY OF COMPACTED HOT MIX ASPHALT USING SATURATED SURFACE-DRY SPECIMENS FOP FOR AASHTO T 166 BULK SPECIFIC GRAVITY OF COMPACTED BITUMINOUS MIXTURES USING PARAFFIN-COATED SPECIMENS FOP FOR AASHTO T 275 Scope This procedure covers the determination of bulk specific gravity (Gmb) of compacted Hot Mix Asphalt (HMA) using three methods – A, B, and C – in accordance with AASHTO T 166. These three methods are for use on specimens not having open or inter-connecting voids and/or absorbing more than 2.0 percent water by volume. A fourth and fifth method – D & E – in accordance with AASHTO T 275 and covering specimens having open or interconnecting voids and/or absorbing more than 2.0 percent water by volume is also included. Overview
• Method A Suspension • Method B Volumeter • Method C Rapid test for A or B • Method D Suspension for coated specimen • Method E Volumeter for coated specimen
Test Specimens Test specimens may be either laboratory-molded or from HMA pavement. For specimens it is recommended that the diameter be equal to four times the maximum size of the aggregate and the thickness be at least one and one half times the maximum size. Apparatus – Method A (Suspension) • Balance or scale: 5 kg capacity, readable to 0.1 g, fitted with a suitable suspension
apparatus and holder to permit weighing the specimen while suspended in water and conforming to AASHTO M 231.
• Suspension apparatus: Wire of the smallest practical size and constructed to permit the container to be fully immersed.
• Water bath: For immersing the specimen in water while suspended under the balance or scale, and equipped with an overflow outlet for maintaining a constant water level.
• Towel: Damp towel used for surface drying specimens. • Oven: Capable of maintaining a temperature of 110 ±5°C (230 ±9°F) for drying the
specimens to a constant mass.
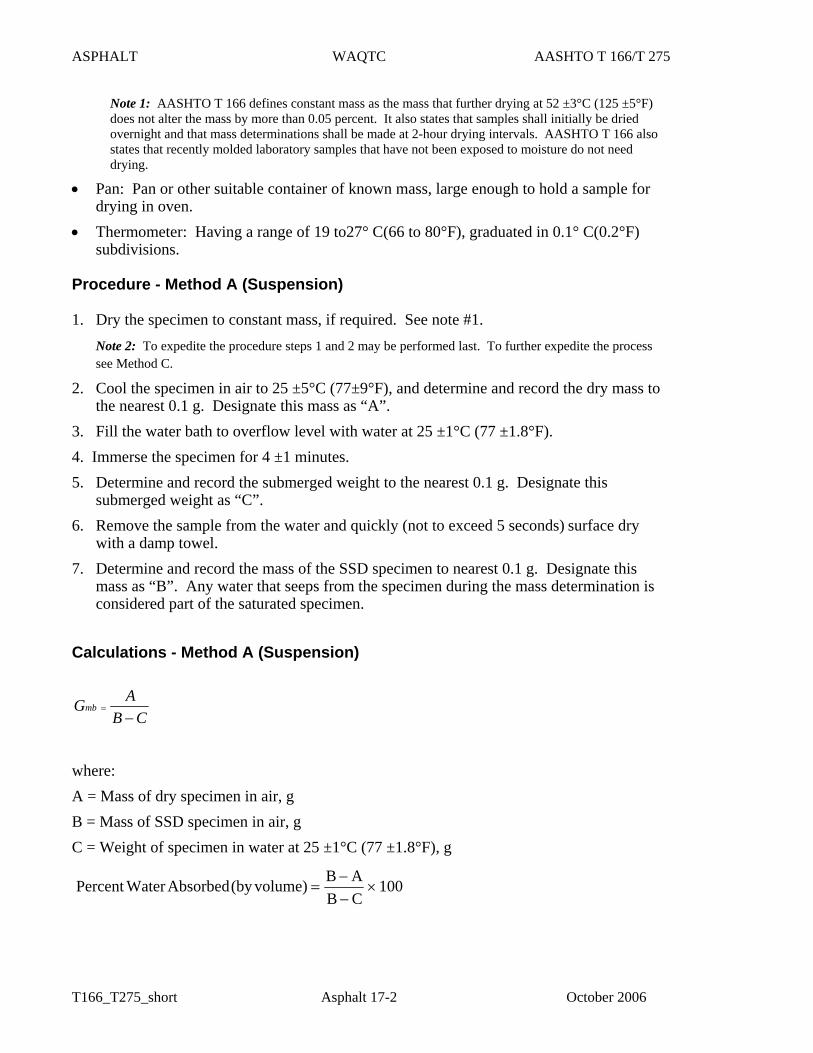
ASPHALT WAQTC AASHTO T 166/T 275
T166_T275_short Asphalt 17-2 October 2006
Note 1: AASHTO T 166 defines constant mass as the mass that further drying at 52 ±3°C (125 ±5°F) does not alter the mass by more than 0.05 percent. It also states that samples shall initially be dried overnight and that mass determinations shall be made at 2-hour drying intervals. AASHTO T 166 also states that recently molded laboratory samples that have not been exposed to moisture do not need drying.
• Pan: Pan or other suitable container of known mass, large enough to hold a sample for drying in oven.
• Thermometer: Having a range of 19 to27° C(66 to 80°F), graduated in 0.1° C(0.2°F) subdivisions.
Procedure - Method A (Suspension) 1. Dry the specimen to constant mass, if required. See note #1.
Note 2: To expedite the procedure steps 1 and 2 may be performed last. To further expedite the process see Method C.
2. Cool the specimen in air to 25 ±5°C (77±9°F), and determine and record the dry mass to the nearest 0.1 g. Designate this mass as “A”.
3. Fill the water bath to overflow level with water at 25 ±1°C (77 ±1.8°F). 4. Immerse the specimen for 4 ±1 minutes. 5. Determine and record the submerged weight to the nearest 0.1 g. Designate this
submerged weight as “C”. 6. Remove the sample from the water and quickly (not to exceed 5 seconds) surface dry
with a damp towel. 7. Determine and record the mass of the SSD specimen to nearest 0.1 g. Designate this
mass as “B”. Any water that seeps from the specimen during the mass determination is considered part of the saturated specimen.
Calculations - Method A (Suspension)
CBAGmb−
=
where: A = Mass of dry specimen in air, g B = Mass of SSD specimen in air, g C = Weight of specimen in water at 25 ±1°C (77 ±1.8°F), g
100CBABvolume)(byAbsorbedWaterPercent ×
−−
=
ASPHALT WAQTC AASHTO T 166/T 275
T166_T275_short Asphalt 17-3 October 2006
Apparatus – Method B (Volumeter) • Balance or scale: 5 kg capacity, readable to 0.1 g and conforming to AASHTO M 231. • Water bath: thermostatically controlled to 25 ±0.5°C (77±0.9°F). • Thermometer: Range of 19 to 27°C (66 to 80°F), and graduated in 0.1°C (0.2°F)
subdivisions. • Volumeter: Calibrated to 1200 mL or appropriate capacity for test sample and having a
tapered lid with a capillary bore. • Oven: Capable of maintaining a temperature of 110 ±5°C (230 ±9°F) for drying the
specimens to a constant mass. • Pan: Pan or other suitable container of known mass, large enough to hold a sample for
drying in oven. • Towel: Damp towel used for surface drying specimens. Procedure - Method B (Volumeter) 1. Dry the specimen to constant mass, if required. See note 1.
Note 2: To expedite the procedure steps 1 and 2 may be performed last. To further expedite the process see Method C.
2. Cool the specimen in air to 25 ±5°C (77±9°F), and determine and record the dry mass to the nearest 0.1 g. Designate this mass as “A”.
3. Immerse the specimen in the temperature controlled water bath for at least 10 minutes. 4. Fill the volumeter with distilled water at 25 ±1°C (77 ±1.8°F) making sure some water
escapes through the capillary bore of the tapered lid. Wipe the volumeter dry. Determine the mass of the volumeter to the nearest 0.1 g. Designate this mass as “D”.
5. Remove the specimen from the water bath and quickly surface dry with a damp towel. 6. Determine and record the mass of the SSD specimen to the nearest 0.1 g. Designate this
mass as “B”. Any water that seeps from the specimen during the mass determination is considered part of the saturated specimen.
7. Place the specimen in the volumeter and let stand 60 seconds. 8. Bring the temperature of the water to 25 ±1°C (77 ±1.8°F), and cover the volumeter
making sure some water escapes through the capillary bore of the tapered lid. 9. Wipe the volumeter dry. 10. Determine and record the mass of the volumeter and specimen to the nearest 0.1 g.
Designate this mass as “E”.
Note 3: Method B is not acceptable for use with specimens that have more than 6 % air voids.
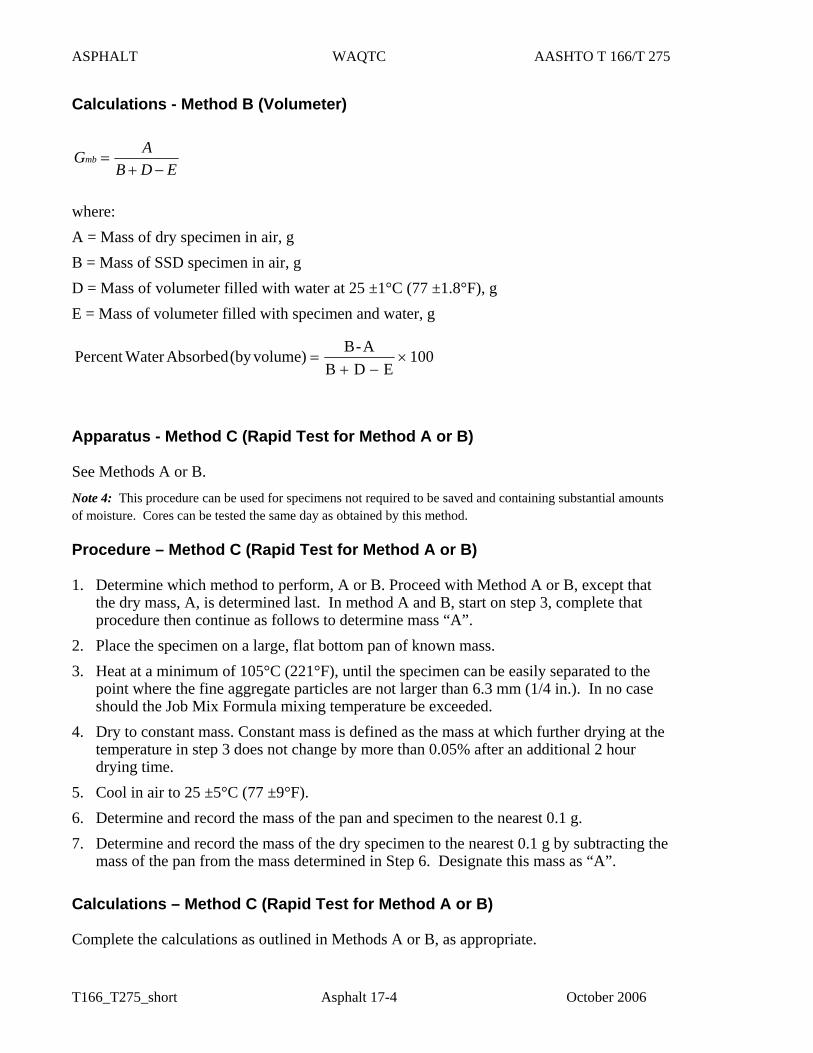
ASPHALT WAQTC AASHTO T 166/T 275
T166_T275_short Asphalt 17-4 October 2006
Calculations - Method B (Volumeter)
EDBAGmb−+
=
where: A = Mass of dry specimen in air, g B = Mass of SSD specimen in air, g D = Mass of volumeter filled with water at 25 ±1°C (77 ±1.8°F), g E = Mass of volumeter filled with specimen and water, g Apparatus - Method C (Rapid Test for Method A or B) See Methods A or B. Note 4: This procedure can be used for specimens not required to be saved and containing substantial amounts of moisture. Cores can be tested the same day as obtained by this method. Procedure – Method C (Rapid Test for Method A or B) 1. Determine which method to perform, A or B. Proceed with Method A or B, except that
the dry mass, A, is determined last. In method A and B, start on step 3, complete that procedure then continue as follows to determine mass “A”.
2. Place the specimen on a large, flat bottom pan of known mass. 3. Heat at a minimum of 105°C (221°F), until the specimen can be easily separated to the
point where the fine aggregate particles are not larger than 6.3 mm (1/4 in.). In no case should the Job Mix Formula mixing temperature be exceeded.
4. Dry to constant mass. Constant mass is defined as the mass at which further drying at the temperature in step 3 does not change by more than 0.05% after an additional 2 hour drying time.
5. Cool in air to 25 ±5°C (77 ±9°F). 6. Determine and record the mass of the pan and specimen to the nearest 0.1 g. 7. Determine and record the mass of the dry specimen to the nearest 0.1 g by subtracting the
mass of the pan from the mass determined in Step 6. Designate this mass as “A”. Calculations – Method C (Rapid Test for Method A or B) Complete the calculations as outlined in Methods A or B, as appropriate.
100EDB
A-Bvolume)(byAbsorbedWaterPercent ×−+
=
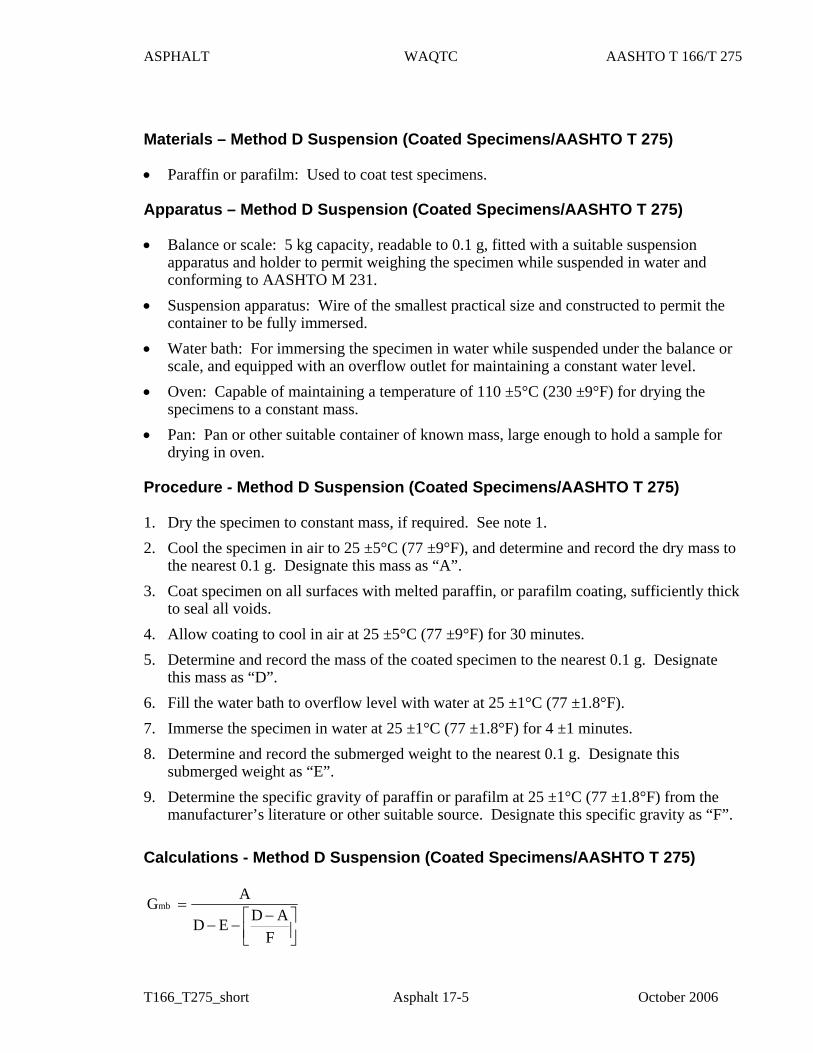
ASPHALT WAQTC AASHTO T 166/T 275
T166_T275_short Asphalt 17-5 October 2006
Materials – Method D Suspension (Coated Specimens/AASHTO T 275) • Paraffin or parafilm: Used to coat test specimens. Apparatus – Method D Suspension (Coated Specimens/AASHTO T 275) • Balance or scale: 5 kg capacity, readable to 0.1 g, fitted with a suitable suspension
apparatus and holder to permit weighing the specimen while suspended in water and conforming to AASHTO M 231.
• Suspension apparatus: Wire of the smallest practical size and constructed to permit the container to be fully immersed.
• Water bath: For immersing the specimen in water while suspended under the balance or scale, and equipped with an overflow outlet for maintaining a constant water level.
• Oven: Capable of maintaining a temperature of 110 ±5°C (230 ±9°F) for drying the specimens to a constant mass.
• Pan: Pan or other suitable container of known mass, large enough to hold a sample for drying in oven.
Procedure - Method D Suspension (Coated Specimens/AASHTO T 275) 1. Dry the specimen to constant mass, if required. See note 1. 2. Cool the specimen in air to 25 ±5°C (77 ±9°F), and determine and record the dry mass to
the nearest 0.1 g. Designate this mass as “A”. 3. Coat specimen on all surfaces with melted paraffin, or parafilm coating, sufficiently thick
to seal all voids. 4. Allow coating to cool in air at 25 ±5°C (77 ±9°F) for 30 minutes. 5. Determine and record the mass of the coated specimen to the nearest 0.1 g. Designate
this mass as “D”. 6. Fill the water bath to overflow level with water at 25 ±1°C (77 ±1.8°F). 7. Immerse the specimen in water at 25 ±1°C (77 ±1.8°F) for 4 ±1 minutes. 8. Determine and record the submerged weight to the nearest 0.1 g. Designate this
submerged weight as “E”. 9. Determine the specific gravity of paraffin or parafilm at 25 ±1°C (77 ±1.8°F) from the
manufacturer’s literature or other suitable source. Designate this specific gravity as “F”. Calculations - Method D Suspension (Coated Specimens/AASHTO T 275)
⎥⎦⎤
⎢⎣⎡ −
−−=
FADED
AGmb
ASPHALT WAQTC AASHTO T 166/T 275
T166_T275_short Asphalt 17-6 October 2006
where: A = Mass of dry specimen in air, g D = Mass of specimen with paraffin coating in air, g E = Weight of specimen with paraffin coating in water, g F = Specific gravity of paraffin or parafilm at 25 ±1°C (77 ±1.8°F) Apparatus – Method E Volumeter (Coated Specimens/AASHTO T 275) • Balance or scale: 5 kg capacity, readable to 0.1 g and conforming to AASHTO M 231. • Water bath: thermostatically controlled to 25 ±0.5°C (77±0.9°F). • Thermometer: Range of 19 to 27°C (66 to 80°F), and graduated in 0.1°C (0.2°F)
subdivisions. • Volumeter: Calibrated to 1200 mL or appropriate capacity for test sample and having a
tapered lid with a capillary bore. • Oven: Capable of maintaining a temperature of 110 ±5°C (230 ±9°F) for drying the
specimens to a constant mass. • Pan: Pan or other suitable container of known mass, large enough to hold a sample for
drying in oven. • Towel: Damp towel used for surface drying specimens. Procedure - Method E Volumeter (Coated Specimens/AASHTO T 275) 1. Dry the specimen to constant mass, if required. See note 1. 2. Cool the specimen in air to 25 ±5°C (77±9°F), and determine and record the dry mass to
the nearest 0.1 g. Designate this mass as “A”. 3. Coat the specimen all surfaces with paraffin, or parafilm coating, sufficiently thick to seal
all voids. 4. Allow coating to cool in air at 25 ±5°C (77 ±9°F) for 30 minutes. 5. Determine and record the mass of the coated specimen to the nearest 0.1g. Designate this
mass as “C”. 6. Fill the volumeter with distilled water at 25 ±1°C (77 ±1.8°F) and place the coated
specimen in the volumeter. 7. Bring the temperature of the water to 25 ±1°C (77 ±1.8°F), and cover the volumeter
making sure some water escapes through the capillary bore of the tapered lid. 8. Wipe the volumeter dry. 9. Determine and record the mass of the volumeter and specimen to the nearest 0.1 g.
Designate this mass as “E”. 10. Determine the specific gravity of paraffin or parafilm at 25 ±1°C (77 ±1.8°F) from the
manufacturer’s literature or other suitable source. Designate this specific gravity as “F”.
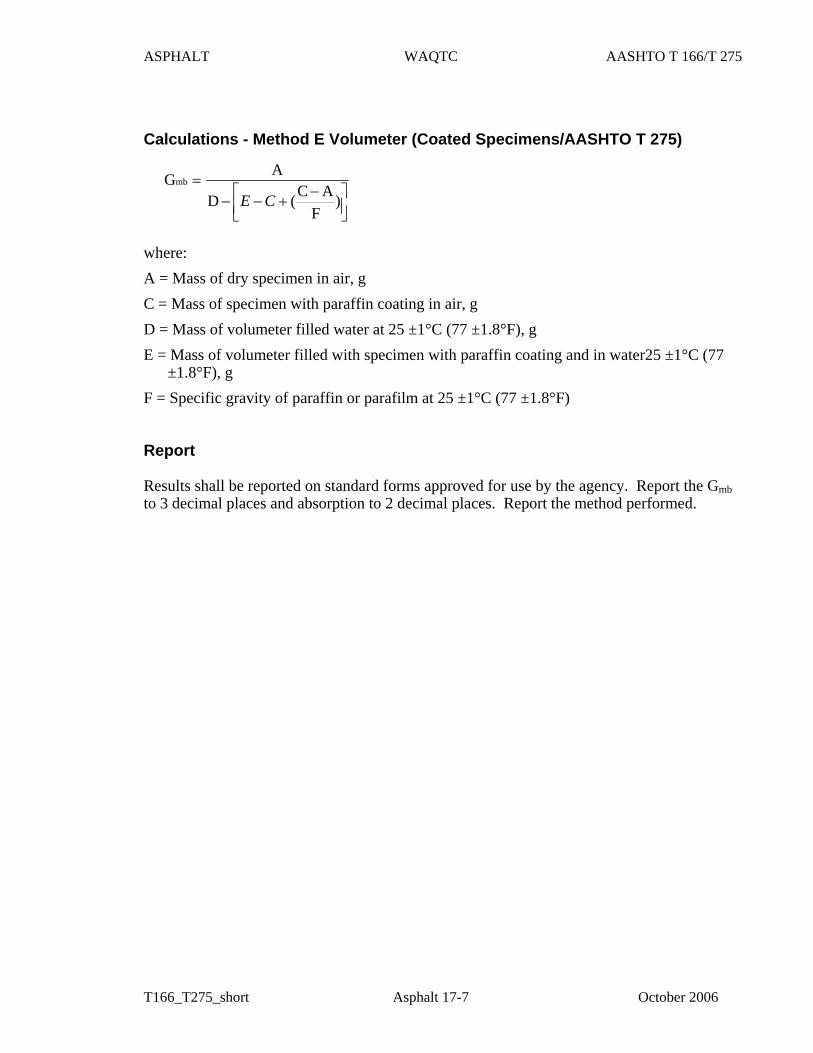
ASPHALT WAQTC AASHTO T 166/T 275
T166_T275_short Asphalt 17-7 October 2006
Calculations - Method E Volumeter (Coated Specimens/AASHTO T 275) where: A = Mass of dry specimen in air, g C = Mass of specimen with paraffin coating in air, g D = Mass of volumeter filled water at 25 ±1°C (77 ±1.8°F), g E = Mass of volumeter filled with specimen with paraffin coating and in water25 ±1°C (77
±1.8°F), g F = Specific gravity of paraffin or parafilm at 25 ±1°C (77 ±1.8°F) Report Results shall be reported on standard forms approved for use by the agency. Report the Gmb to 3 decimal places and absorption to 2 decimal places. Report the method performed.
⎥⎦⎤
⎢⎣⎡ −
+−−=
)F
AC(D
AGmb
CE

ASPHALT WAQTC AASHTO T 166/T 275
T166_T275_short Asphalt 17-8 October 2006
THIS PAGE INTENTIONALLY LEFT BLANK
I N T E R O F F I C E M E M O
TECHNICAL SERVICESConstruction Section
Office Phone: (503) 986-3000Fax Number: (503) 986-3096
DATE: November 1, 2003 TO: All Holders of the Manual of Field Test Procedures File Code: SECTION: Test Procedure AASHTO T 168
The Oregon Department of Transportation has specified method(s) for this Test Procedure. Please observe the following for our projects: Sampling of mixture will conform to the following: • Drum Plants – attached mechanical sampling devices • Batch Plants – from trucks at plant

ODOT TM 323(06) 2
ASPHALT WAQTC AASHTO T 168
T168-short Asphalt 12-1 October 2005
SAMPLING OF BITUMINOUS PAVING MIXTURES FOP FOR AASHTO T 168 Scope This procedure covers the sampling of bituminous paving mixtures from HMA plants, haul units, and roadways in accordance with AASHTO T 168. Sampling is as important as testing, and every precaution must be taken to obtain a truly representative sample. The sampling of aggregate used in bituminous paving mixtures shall be in accordance with the FOP for AASHTO T 2. Apparatus • Flat-bottomed scoop 150 x 400 x 100 mm (6 x 16 x 4 in.) if sampling from a roadway • Shovel • Sample containers: such as cardboard boxes, metal cans, stainless steel bowls, or other
agency-approved containers • Template to match conveyor belt shape • Scoops, trowels, or other equipment to obtain mix • Sampling plate: heavy gauge metal plate 380 mm x 380 mm (15 in x 15 in) minimum 8
gauge thick with a wire attached to one corner long enough to reach from the center of the paver to the outside of the farthest auger extension. Holes ¼” in diameter should be provided in each corner.
• Cookie cutter sampling device: A 330 mm (13 in.) square sampling template, constructed from 75 mm x 50 mm x 3 mm (3 in. x 2 in. x 1/8 in.) formed steel angle with two 100mm x 150 mm x 9 mm (4 in. x 6 in. x 3/8 in.) handles. See diagram. Note 1: Sampling Plate and Cookie cutter may be sized appropriately to accommodate sample size requirements.
General Comments
1. Samples of mix upon which acceptance or rejection is based shall be selected at random, and may be obtained by, or under the observation of, the purchaser or authorized representative. Note 2: Care shall be taken to prevent contamination of bituminous mixes by dust or other foreign matter, and to avoid segregation of aggregate and bituminous materials.
2. Some agencies require mechanical sampling devices for hot mix asphalt (HMA) and cold feed aggregate on some projects. These are normally permanently attached devices that allow a sample container to pass perpendicularly through the entire stream of material or divert the entire stream of material into the container. Operation may be hydraulic, pneumatic, or manual and allows the sample container to pass through the stream twice, once in each direction, without overfilling. Special caution is necessary with manually operated systems since a consistent speed is difficult to maintain and non-representative samples may result. Check agency requirements for the specifics of required sampling systems.
ASPHALT WAQTC AASHTO T 168
T168-short Asphalt 12-2 October 2005
Sample Size Sample size depends on the test methods specified by the agency for acceptance. Check agency requirement for the size required. Sampling • General
1. The material shall be inspected to determine variations. The seller shall provide equipment for safe and appropriate sampling including sampling devices on plants, when required.
2. Place dense graded mixture samples in cardboard boxes, stainless steel bowls or other agency approved containers. Place open graded mixture samples in stainless steel bowls. Do not put open graded mixture samples in boxes until they have cooled to the point that bituminous material will not migrate from the aggregate.
3. Sampling from the Roadway will require the contractor to repair the sampled location.
• Sampling from a Conveyor Belt
1. Stop the conveyor belt. 2. Select at least three areas of approximately equal size on the belt for sampling. 3. Insert template, the shape of which conforms to the shape of the belt, in each of the
locations to be sampled. 4. Obtain three approximately equal increments of material that will form a sample of
the required size when combined. 5. Scoop all material between template into a suitable container.
• Attached Sampling Devices 1. When using an attached sampling device, pass the container twice through the
material perpendicularly without overfilling the container. 2. Repeat until proper sample size has been obtained.
• Sampling from Haul Units 1. Obtain samples in four approximately equal increments from haul units. 2. Obtain each increment from approximately 300 mm (12 in.) below the surface, in
each of the four quadrants of the load.
3. Combine the increments to form a sample of the required size. • Sampling from a Roadway Prior to Compaction (Scoop Method)
1. Obtain samples in approximately equal increments, after placement and prior to rolling, using the scoop.
2. Make a vertical face with the shovel about 750 mm (30 in.) parallel with centerline.
ASPHALT WAQTC AASHTO T 168
T168-short Asphalt 12-3 October 2005
3. Pull the material back approximately 450 mm (18 in.). 4. Place the scoop on the pavement or base as flat as possible at one side of the vertical
face and fill the scoop. Make sure that sufficient pressure is exerted on the scoop to remove all of the material to its full depth.
5. Close the lid and remove the scoop when it is full. 6. Repeat Steps 2 through 5 to obtain the required sample size.
• Sampling from Roadway Prior to Compaction (Plate Method)
Plate Method using the “ cookie cutter” sampling device.
There are two conditions that will be encountered when sampling Hot Mix Asphalt (HMA) from the roadway prior to compaction. The two conditions are:
1. Laying HMA on grade, or untreated base material requires Method 1.
2. Laying HMA on existing asphalt or laying a second lift of HMA requires Method 2.
.SAFETY:
Sampling is performed behind the paving machine and in front of the breakdown roller. For safety, the roller must remain at least 3 m (10 ft) behind the sampling operation until the sample has been taken and the hole filled with loose HMA.
Method 1 requires a plate to be placed in the roadway in front of the paving operation and therefore there is always concern with moving, operating equipment. It is safest to stop the paving train while a plate is installed in front of the paver. When this is not possible the following safety rules must be followed.
1. The plate placing operation must be at least 3 m (10 ft) in front of the paver or pickup device. The technician placing the plate must have eye contact and communication with the paving machine operator. If eye contact cannot be maintained at all time, a third person must be present to provide communication between the operator and the technician.
2. No technician is to be between the asphalt supply trucks and the paving machine. The exception to this rule is if the supply truck is moving forward creating a windrow, in which case the technician must be at least 3m (10 ft) behind the truck.
3. At any time the Engineer feels that the sampling technique is creating an unsafe condition, the operation is to be halted until it is made safe or the paving operation will be stopped while the plate is being placed.
Method 1 - Obtaining a Sample on Untreated Base: 1. Following the safety rules detailed above, the technician is to;
a. Smooth out a location in front of the paver at least 0.5 m (2 ft) inside the edge of the mat
ASPHALT WAQTC AASHTO T 168
T168-short Asphalt 12-4 October 2005
b. Lay the plate down diagonally with the direction of travel, keeping it flat and tight to the base with the lead corner facing the paving machine
2. Secure the plate in place by driving a nail through the hole in the lead corner of the plate.
3. Pull the wire, attached to the outside corner of the plate, taut past the edge of the HMA mat and secure with a nail.
4. Let the paving operation proceed over the plate and wire. Immediately proceed with the sampling.
5. Using the exposed end of the wire, pull the wire up through the fresh HMA to locate the corner of the plate. Place the “cookie cutter” sample device, just inside the end of the wire; align the cutter over the plate. Press “cookie cutter” device down through the HMA to the plate.
6. Using a small square tipped shovel and/or scoop, carefully remove all the HMA from inside of the cutter and place in a sample container.
7. Remove the sample cutter and the plate from the roadway. The hole made from the sampling must be filled with loose HMA.
Method 2 - Obtaining a Sample on Asphalt Surface: 1. After the paving machine has passed the sampling point, immediately place the
“cookie cutter” sampling device on the location to be sampled. Push the cutter down through the HMA until it is flat against the underlying asphalt mat.
2. Using a small square tipped shovel and/or scoop, carefully remove all the HMA from inside of the cutter and place in a sample container. The hole made from sampling must filled with loose HMA.
Identification and Shipping 1. Identify sample containers as required by the agency. 2. Ship samples in containers that will prevent loss, contamination, or damage.
I N T E R O F F I C E M E M O
TECHNICAL SERVICESConstruction Section
Office Phone: (503) 986-3000Fax Number: (503) 986-3096
DATE: October 31, 2006 TO: All Holders of the Manual of Field Test Procedures File Code: SECTION: Test Procedure AASHTO T 176
The Oregon Department of Transportation has specified method(s) for this Test Procedure. Please observe the following for our projects: • Under Procedure, delete the Caution statement in reference to manually-
operated shaker method and hand method.

ODOT TM 323(06) 2
AGGREGATE WAQTC AASHTO T 176
T176_short Aggregate 14-1 October 2005
PLASTIC FINES IN GRADED AGGREGATES AND SOILS BY THE USE OF THE SAND EQUIVALENT TEST FOP FOR AASHTO T 176 Scope This procedure covers the determination of plastic fines in accordance with AASHTO T 176. It serves as a rapid test to show the relative proportion of fine dust or clay-like materials in fine aggregates (FA) and soils. Apparatus See AASHTO T 176 for a detailed listing of sand equivalent apparatus. Note that the siphon tube and blow tube may be glass or stainless steel as well as copper. • Graduated plastic cylinder. • Rubber stopper. • Irrigator tube. • Weighted foot assembly having a mass of 1000 ±5g. There are two models of the
weighted foot assembly. The older model has a guide cap that fits over the upper end of the graduated cylinder and centers the rod in the cylinder. It is read using a slot in the centering screws. The newer model has a sand reading indicator 254 mm (10 in.) above this point and is preferred for testing clay-like materials.
• Siphon assembly: The siphon assembly will be fitted to a 4 L (1 gal) bottle of working calcium chloride solution placed on a shelf 915 ±25 mm (36 ±1 in.) above the work surface.
• Measuring can having a capacity of 85 ±5mL (3 oz.). • Funnel with a wide-mouth for transferring sample into graduated cylinder. • Quartering cloth – 600 mm (2 ft) square nonabsorbent cloth, such as plastic or oilcloth. • Mechanical splitter – see FOP for AASHTO T 248. • Strike off bar – A straight edge or spatula. • Clock or watch reading in minutes and seconds. • Manually operated sand equivalent shaker capable of producing an oscillating motion at a
rate of 100 complete cycles in 45 ±5 seconds, with a hand assisted half stroke length of 127 ±5 mm (5 ±0.2 in.). It may be held stable by hand during the shaking operation. It is recommended that this shaker be fastened securely to a firm and level mount, by bolts or clamps, if a large number of determinations are to be made.
• Mechanical shaker – See AASHTO T 176 for equipment and procedure. • Oven capable of maintaining a temperature of 110 ±5°C (230 ±9°F). • Thermometer – Calibrated liquid-in-glass or electronic digital type designed for total
immersion and accurate to 0.1°C (0.2°F).
AGGREGATE WAQTC AASHTO T 176
T176_short Aggregate 14-2 October 2005
Materials • Stock calcium chloride solution: Obtain commercially prepared calcium chloride stock
solution meeting AASHTO requirements. • Working calcium chloride solution: Dilute one 3 oz measuring can (85 ±5 mL) of stock
calcium chloride solution to 3.8 L (1 gal) with distilled or demineralized water. (The graduated cylinder filled to 111.8 mm [4.4 in.] contains 88 mL.)
Note 1: Mix the working solution thoroughly. Add 85mL (3oz) of stock solution to a clean, empty 3.8L (1qt) jug add approximately one 1L (1qt) and agitate vigorously for 2 or 3 minutes. Add the remainder of the water in approximately 1L (1qt) increments repeating the agitation process.
Note 2: Tap water may be used if it is proven not to be detrimental to the test and if it is allowed by the agency.
Note 3: The shelf life of the working solution is approximately 30 days. Working solutions more than 30 days old shall be discarded.
Control The temperature of the working solution should be maintained at 22 ±3°C (72 ±5°F) during the performance of the test. If field conditions preclude the maintenance of the temperature range, reference samples should be submitted to the Central/Regional Laboratory, as required by the agency, where proper temperature control is possible. Samples that meet the minimum sand equivalent requirement at a working solution temperature outside of the temperature range need not be subject to reference testing. Sample Preparation 1. Obtain the sample in accordance with FOP for AASHTO T 2 and reduce in accordance
with FOP for AASHTO T 248. 2. Prepare sand equivalent test samples from the material passing the 4.75 mm (No. 4)
sieve. If the material is in clods, break it up and rescreen it over a 4.75 mm (No. 4) sieve. All fines shall be cleaned from particles retained on the 4.75 mm (No. 4) sieve and included with the material passing that sieve.
3. Split or quarter 1000 to 1500 g of material from the portion passing the 4.75 mm (No. 4) sieve. Use extreme care to obtain a truly representative portion of the original sample.
Note 4: Experiments show that, as the amount of material being reduced by splitting or quartering is decreased, the accuracy of providing representative portions is reduced. It is imperative that the sample be split or quartered carefully. When it appears necessary, dampen the material before splitting or quartering to avoid segregation or loss of fines.
Note 5: All tests including Reference Tests will be performed utilizing Alternative Method No. 2 as described in AASHTO T 176 unless specifications call for oven dry samples.
AGGREGATE WAQTC AASHTO T 176
T176_short Aggregate 14-3 October 2005
4. The sample must have the proper moisture content to achieve reliable results. This condition is determined by tightly squeezing a small portion of the thoroughly mixed sample in the palm of the hand. If the cast that is formed permits careful handling without breaking, the correct moisture content has been obtained.
Note 6: Clean sands having little 75 µm (No. 200) such as sand for Portland Cement Concrete (PCC) may not form a cast.
If the material is too dry, the cast will crumble and it will be necessary to add water and remix and retest until the material forms a cast. When the moisture content is altered to provide the required cast, the altered sample should be placed in a pan, covered with a lid or with a damp cloth that does not touch the material, and allowed to stand for a minimum of 15 minutes. Samples that have been sieved without being air-dried and still retain enough natural moisture are exempted from this requirement. If the material shows any free water, it is too wet to test and must be drained and air dried. Mix frequently to ensure uniformity. This drying process should continue until squeezing provides the required cast.
5. Place the sample on the quartering cloth and mix by alternately lifting each corner of the
cloth and pulling it over the sample toward the diagonally opposite corner, being careful to keep the top of the cloth parallel to the bottom, thus causing the material to be rolled. When the material appears homogeneous, finish the mixing with the sample in a pile near the center of the cloth.
6. Fill the measuring can by pushing it through the base of the pile while exerting pressure
with the hand against the pile on the side opposite the measuring can. As the can is moved through the pile, hold enough pressure with the hand to cause the material to fill the tin to overflowing. Press firmly with the palm of the hand, compacting the material and placing the maximum amount in the can. Strike off the can level full with the straight edge or spatula.
7. When required, repeat steps (5) and (6) to obtain additional samples. Procedure 1. Start the siphon by forcing air into the top of the solution bottle through the tube while
the pinch clamp is open.
2. Siphon 101.6 ±2.5 mm (4 ±0.1 in.) of working calcium chloride solution into the plastic cylinder. Pour the prepared test sample from the measuring can into the plastic cylinder using the funnel to avoid spilling. Tap the bottom of the cylinder sharply on the heel of the hand several times to release air bubbles and to promote thorough wetting of the sample.
3. Allow the wetted sample to stand undisturbed for 10 ±1 minutes. At the end of the 10-minute period, stopper the cylinder and loosen the material from the bottom by simultaneously partially inverting and shaking the cylinder.
AGGREGATE WAQTC AASHTO T 176
T176_short Aggregate 14-4 October 2005
4. After loosening the material from the bottom of the cylinder, shake the cylinder and contents by any one of the following methods: a. Mechanical Method – Place the stoppered cylinder in the mechanical shaker, set the
timer, and allow the machine to shake the cylinder and contents for 45 ±1 seconds. Caution: The next two methods – manually-operated shaker method and hand method –
require that the operator meet certain qualifications. See AASHTO T 176 for a full description.
b. Manually-operated Shaker Method – Secure the stoppered cylinder in the three
spring clamps on the carriage of the manually-operated sand equivalent shaker and set the stroke counter to zero. Stand directly in front of the shaker and force the pointer to the stroke limit marker painted on the backboard by applying an abrupt horizontal thrust to the upper portion of the right hand spring strap. Remove the hand from the strap and allow the spring action of the straps to move the carriage and cylinder in the opposite direction without assistance or hindrance. Apply enough force to the right hand spring steel strap during the thrust portion of each stroke to move the pointer to the stroke limit marker by pushing against the strap with the ends of the fingers to maintain a smooth oscillating motion. The center of the stroke limit marker is positioned to provide the proper stroke length and its width provides the maximum allowable limits of variation. Proper shaking action is accomplished when the tip of the pointer reverses direction within the marker limits. Proper shaking action can best be maintained by using only the forearm and wrist action to propel the shaker. Continue shaking for 100 strokes.
c. Hand Method – Hold the cylinder in a horizontal position and shake it vigorously in
a horizontal linear motion from end to end. Shake the cylinder 90 cycles in approximately 30 seconds using a throw of 229 mm ±25 mm (9 ±1 in.). A cycle is defined as a complete back and forth motion. To properly shake the cylinder at this speed, it will be necessary for the operator to shake with the forearms only, relaxing the body and shoulders.
5. Set the cylinder upright on the work table and remove the stopper.
6. Insert the irrigator tube in the cylinder and rinse material from the cylinder walls as the irrigator is lowered. Force the irrigator through the material to the bottom of the cylinder by applying a gentle stabbing and twisting action while the working solution flows from the irrigator tip. Work the irrigator tube to the bottom of the cylinder as quickly as possible, since it becomes more difficult to do this as the washing proceeds. This flushes the fine material into suspension above the coarser sand particles. Continue to apply a stabbing and twisting action while flushing the fines upward until the cylinder is filled to the 381 mm (15 in.) mark. Then raise the irrigator slowly without shutting off the flow so that the liquid level is maintained at about 381 mm (15 in.) while the irrigator is being withdrawn. Regulate the flow just before the irrigator is entirely withdrawn and adjust the final level to 381 mm (15 in.).
AGGREGATE WAQTC AASHTO T 176
T176_short Aggregate 14-5 October 2005
Note 7: Occasionally the holes in the tip of the irrigator tube may become clogged by a particle of sand. If the obstruction cannot be freed by any other method, use a pin or other sharp object to force it out, using extreme care not to enlarge the size of the opening. Also, keep the tip sharp as an aid to penetrating the sample.
7. Allow the cylinder and contents to stand undisturbed for 20 minutes ±15 seconds. Start timing immediately after withdrawing the irrigator tube.
Note 8: Any vibration or movement of the cylinder during this time will interfere with the normal settling rate of the suspended clay and will cause an erroneous result.
8. Clay and Sand Readings a. At the end of the 20-minute sedimentation period, read and record the level of the top
of the clay suspension. This is referred to as the clay reading.
Note 9: If no clear line of demarcation has formed at the end of the 20-minute sedimentation period, allow the sample to stand undisturbed until a clay reading can be obtained, then immediately read and record the level of the top of the clay suspension and the total sedimentation time. If the total sedimentation time exceeds 30 minutes, rerun the test using three individual samples of the same material. Read and record the clay column height of the sample requiring the shortest sedimentation period only. Once a sedimentation time has been established, subsequent tests will be run using that time. The time will be recorded along with the test results on all reports.
b. After the clay reading has been taken, place the weighted foot assembly over the cylinder and gently lower the assembly until it comes to rest on the sand. Do not allow the indicator to hit the mouth of the cylinder as the assembly is being lowered. Subtract 254 mm (10 in.) from the level indicated by the extreme top edge of the indicator and record this value as the sand reading.
c. If clay or sand readings fall between 2.5 mm (0.1 in.) graduations, record the level of the higher graduation as the reading. For example, a clay reading that appears to be 7.95 would be recorded as 8.0; a sand reading that appears to be 3.22 would be recorded as 3.3.
d. If two Sand Equivalent (SE) samples are run on the same material and the second varies by more than ±4 points, based on the first cylinder reading, additional tests shall be run.
e. If three or more Sand Equivalent (SE) samples are run on the same material, average the readings. If an individual reading varies by more than ±4 points, based on the average cylinder reading, additional tests shall be run.
Calculations 1. Calculate the SE to the nearest 0.1 using the following formula: SE =
For Example: Sand Reading = 3.3 and Clay Reading = 8.0
SE =
341.or41.251008.03.3
=×
100ReadingClayReadingSand
×
AGGREGATE WAQTC AASHTO T 176
T176_short Aggregate 14-6 October 2005
Note 10: This example reflects the use of equipment made with English units. At this time, equipment made with metric units is not available.
2. Report the SE as the next higher whole number. In the example above, the 41.3 would be reported as 42. An SE of 41.0 would be reported as 41.
3. In determining the average of the two samples, raise each calculated SE value to the next
higher whole number before averaging. For example, calculated values of 41.3 and 42.8 would be reported as 42 and 43, respectively. Then average the two values:
If the average value is not a whole number, raise it to the next higher whole number – in this case: 43.
Report
Results shall be reported on standard forms approved for use by the agency.
Report results to the whole number.
42.52
4342=
+
I N T E R O F F I C E M E M O
TECHNICAL SERVICESConstruction Section
Office Phone: (503) 986-3000Fax Number: (503) 986-3096
DATE: October 31, 2006 TO: All Holders of the Manual of Field Test Procedures File Code: SECTION: Test Procedure AASHTO T 209
The Oregon Department of Transportation has specified method(s) for this Test Procedure. Please observe the following for our projects: • Use the flask method.
• Under apparatus delete Bleeder valve and replace with, inline bleeder valve capable of regulating the vacuum between 25 & 30mm of mercury.
• A mechanical agitation device is required. • The test sample will be cured for a minimum of 1 hr and a maximum of 3 hrs
according to the placement temperature range shown on the Mix Design. If the total time of storage and haul is less than 1 hour as determined by the Region QAC, Contractor CAT II and Project Manager then the test sample shall not be cured.
• Under the Procedure- (Flask) Delete step 12B, 13B and Note 3 and replace with the
following: Fill the flask with 25.0oC ±1.0ºC (77.0oF +- 1.8oF) water and allow to stand for 10 ±1 minutes.
• Under Procedure – (Flask) Delete step 14B and replace with the following: The
water temperature upon finishing filling the flask shall be at 25.0ºC ± 1.0 ºC (77.0oF +- 1.8oF). Place the cover or a glass plate on the flask, and eliminate all air from the flask. The use of the temperature correction tables will not be allowed (The R Value under Calculation = 1.000).
• Use the procedure for Mixtures Containing Uncoated Porous Aggregate
(“dryback” procedure) if the asphalt absorption (Pba) reported on the Mix Design is 1.2% or greater or if the mix design report indicates the “dryback” procedure was used for the mix design calculations. Use the results of the “dryback” procedure on all MDV and MAMD calculations. (See Next Page)
ODOT TM 323(06) 2
• Test Procedure AASHTO T 209 Continued • For each sublot of HMAC produced, calculate the Pba and maintain a running
average of 4 asphalt absorptions during HMAC production. The Pba computation will be considered part of the required MDV testing. If the running average of four asphalt absorptions (Pba) is 1.2% or greater at any time during production and the procedure for Mixtures Containing Uncoated Porous Aggregate (“dryback” procedure) is not already being used, then use the “dryback” procedure on the remainder of the JMF production and apply to all MDV and MAMD calculations. A new lot will be started when the dryback procedure is initiated.
ASPHALT WAQTC AASHTO T 209
T209_short Asphalt 16-1 October 2006
THEORETICAL MAXIMUM SPECIFIC GRAVITY AND DENSITY OF HOT MIX ASPHALT PAVING MIXTURES FOP FOR AASHTO T 209 Scope This procedure covers the determination of the maximum specific gravity (Gmm) of uncompacted Hot Mix Asphalt (HMA) paving mixtures in accordance with AASHTO T 209. Two methods using two different containers – bowl and flask – are covered. Specimens prepared in the laboratory shall be cured according to agency standards. Apparatus • Balance or scale: 10,000 g capacity, readable to 0.1 g • Container: A glass, metal, or plastic bowl or volumetric flask capable of holding a
2,000 g sample and withstanding a partial vacuum • Container cover: A glass plate or a metal or plastic cover with a vented opening. • Vacuum Lid: A transparent lid with a suitable vacuum connection. The vacuum opening
to be covered with a fine wire mesh • Vacuum pump or water aspirator: Capable of evacuating air from the container to a
residual pressure of 4.0 kPa (30 mm Hg). • Manometer or Vacuum gauge: Traceable to NIST and capable of measuring residual
pressure down to 4.0 kPa (30 mm Hg) or less. • Water bath: A constant-temperature water bath (optional) • Thermometers: Calibrated liquid-in-glass, or electronic digital total immersion type,
accurate to 0.5°C (0.9°F) • Bleeder valve to adjust vacuum. • Timer Calibration of Flask Use a volumetric flask that is calibrated to accurately determine the mass of water, at 25 ±0.5°C (77 ±0.9°F), in the flask. The volumetric flask shall be calibrated periodically in conformance with procedures established by the agency. Test Sample Preparation 1. Obtain samples in accordance with the FOP for AASHTO T 168 and reduce according to
the FOP for WAQTC TM 5. 2. Test sample size shall conform to the requirements of Table 1. Samples larger than the
capacity of the container may be tested in two or more increments. Results will be combined and averaged. If the increments have a specific gravity difference greater than 0.018 for the bowl method and 0.011 for the flask method the test must be re-run.
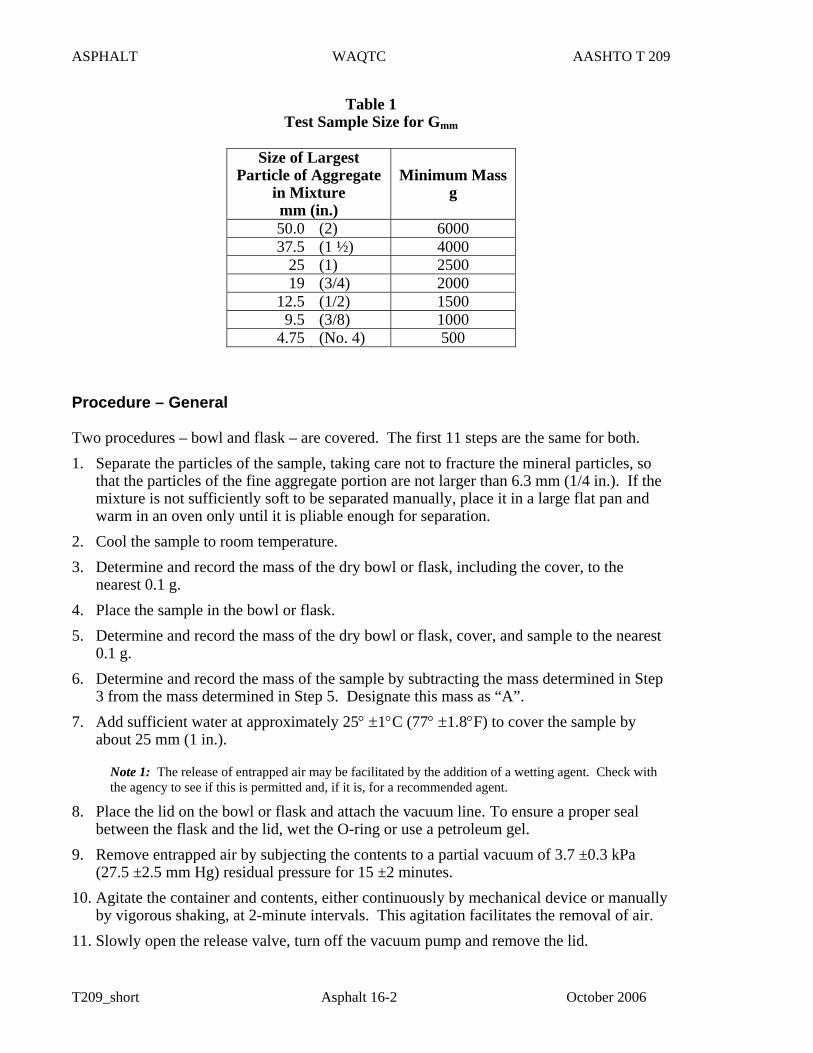
ASPHALT WAQTC AASHTO T 209
T209_short Asphalt 16-2 October 2006
Table 1 Test Sample Size for Gmm
Size of Largest
Particle of Aggregate in Mixture mm (in.)
Minimum Mass
g
50.0 (2) 6000 37.5 (1 ½) 4000
25 (1) 2500 19 (3/4) 2000
12.5 (1/2) 1500 9.5 (3/8) 1000
4.75 (No. 4) 500
Procedure – General Two procedures – bowl and flask – are covered. The first 11 steps are the same for both. 1. Separate the particles of the sample, taking care not to fracture the mineral particles, so
that the particles of the fine aggregate portion are not larger than 6.3 mm (1/4 in.). If the mixture is not sufficiently soft to be separated manually, place it in a large flat pan and warm in an oven only until it is pliable enough for separation.
2. Cool the sample to room temperature. 3. Determine and record the mass of the dry bowl or flask, including the cover, to the
nearest 0.1 g. 4. Place the sample in the bowl or flask. 5. Determine and record the mass of the dry bowl or flask, cover, and sample to the nearest
0.1 g. 6. Determine and record the mass of the sample by subtracting the mass determined in Step
3 from the mass determined in Step 5. Designate this mass as “A”. 7. Add sufficient water at approximately 25° ±1°C (77° ±1.8°F) to cover the sample by
about 25 mm (1 in.).
Note 1: The release of entrapped air may be facilitated by the addition of a wetting agent. Check with the agency to see if this is permitted and, if it is, for a recommended agent.
8. Place the lid on the bowl or flask and attach the vacuum line. To ensure a proper seal between the flask and the lid, wet the O-ring or use a petroleum gel.
9. Remove entrapped air by subjecting the contents to a partial vacuum of 3.7 ±0.3 kPa (27.5 ±2.5 mm Hg) residual pressure for 15 ±2 minutes.
10. Agitate the container and contents, either continuously by mechanical device or manually by vigorous shaking, at 2-minute intervals. This agitation facilitates the removal of air.
11. Slowly open the release valve, turn off the vacuum pump and remove the lid.
ASPHALT WAQTC AASHTO T 209
T209_short Asphalt 16-3 October 2006
Procedure – Bowl 12A. Suspend and immerse the bowl and contents in water at 25 ±1.0°C (77 ±1.8°F) for
10 ±1 minutes. The holder shall be immersed sufficiently to cover it and the bowl. 13A. Determine and record the submerged weight of the bowl and contents to the nearest
0.1 g. 14A. Empty and re-submerge the bowl following step 12A to determine the submerged
weight of the bowl to the nearest 0.1 g. 15A. Determine and record the submerged weight of the sample the nearest 0.1 g by
subtracting the submerged weight of the bowl from the submerged weight determined in Step 13A. Designate this submerged weight as “C”.
Procedure – Flask
Note 2: Stabilize the temperature of the flask and contents to 25 ±1°C (77 ±1.8°F) and determine final mass of the flask, cover, de-aired water, and sample within 10 ±1 minutes of completing Step 11.
12B. Fill the flask with water and adjust the temperature to 25 ±1°C (77 ±1.8°F). 13B. Stabilize the temperature of the flask and contents in a water bath so that final
temperature is within 25 ±1°C (77 ±1.8°F). Note 3: In lieu of placing the flask in the water bath, determine the temperature of the water in the flask and make the appropriate density correction using Table 2 when the temperature is outside 25 ±1°C (77 ±1.8°F).
14B. Finish filling the flask, place the cover or a glass plate on the flask, and eliminate all air from the flask. Note 4: When using the metal flask and cover, place the cover on the flask and push down slowly, forcing excess water out of the hole in the center of the cover. Use care when filling flask to avoid reintroducing air into the water.
15B. Towel dry the outside of the flask and cover. 16B. Determine and record the mass of the flask, cover, de-aired water, and sample to the
nearest 0.1 g. within 10 ±1 minutes of completion of Step 11. Designate this mass as “E”.
167B. Mass “D”, the mass of the flask and water, is determined during the Calibration of Flask procedure.
Procedure – Mixtures Containing Uncoated Porous Aggregate If the pores of the aggregates are not thoroughly sealed by a bituminous film, they may become saturated with water during the vacuuming procedure, resulting in an error in maximum density. To determine if this has occurred, complete the general procedure and then:
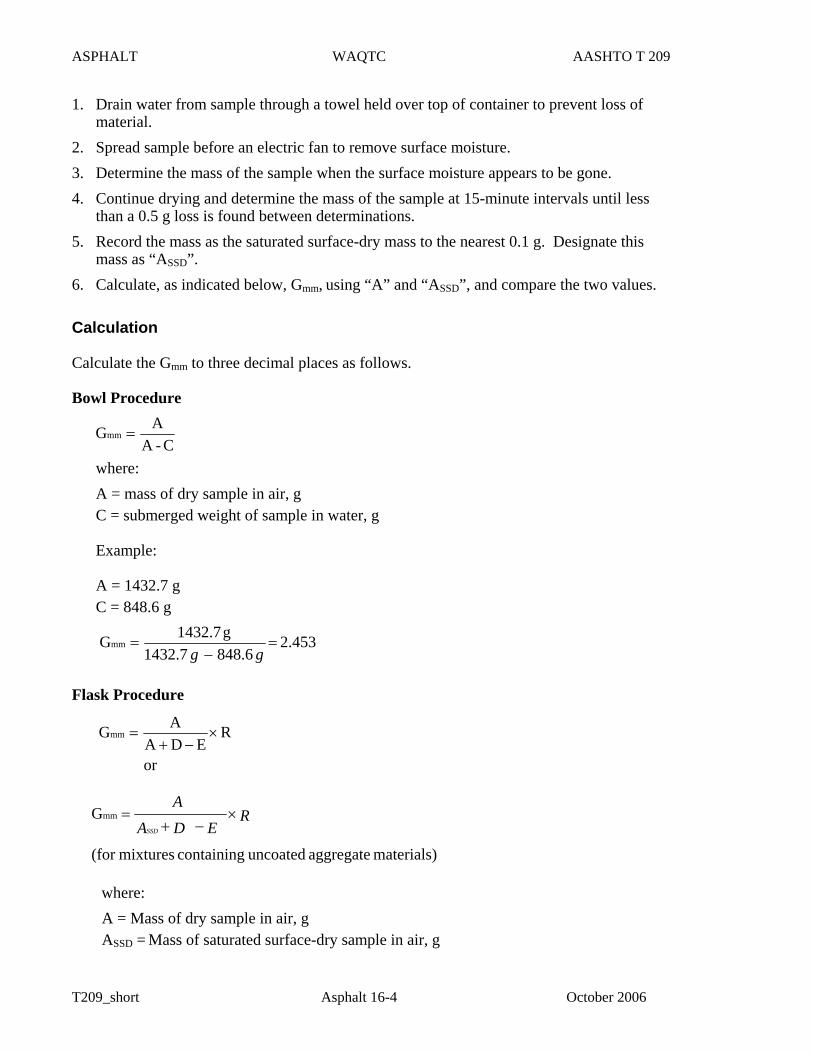
ASPHALT WAQTC AASHTO T 209
T209_short Asphalt 16-4 October 2006
1. Drain water from sample through a towel held over top of container to prevent loss of material.
2. Spread sample before an electric fan to remove surface moisture. 3. Determine the mass of the sample when the surface moisture appears to be gone. 4. Continue drying and determine the mass of the sample at 15-minute intervals until less
than a 0.5 g loss is found between determinations. 5. Record the mass as the saturated surface-dry mass to the nearest 0.1 g. Designate this
mass as “ASSD”. 6. Calculate, as indicated below, Gmm, using “A” and “ASSD”, and compare the two values. Calculation Calculate the Gmm to three decimal places as follows. Bowl Procedure
where: A = mass of dry sample in air, g C = submerged weight of sample in water, g Example: A = 1432.7 g C = 848.6 g
Flask Procedure or
where: A = Mass of dry sample in air, g ASSD = Mass of saturated surface-dry sample in air, g
REDA
AGmm ×−+
=
C-AAGmm =
453.26.8487.1432
g1432.7Gmm =−
=gg
materials) aggregate uncoated containing mixtures(for
Gmm REDA
A
SSD
×−+
=
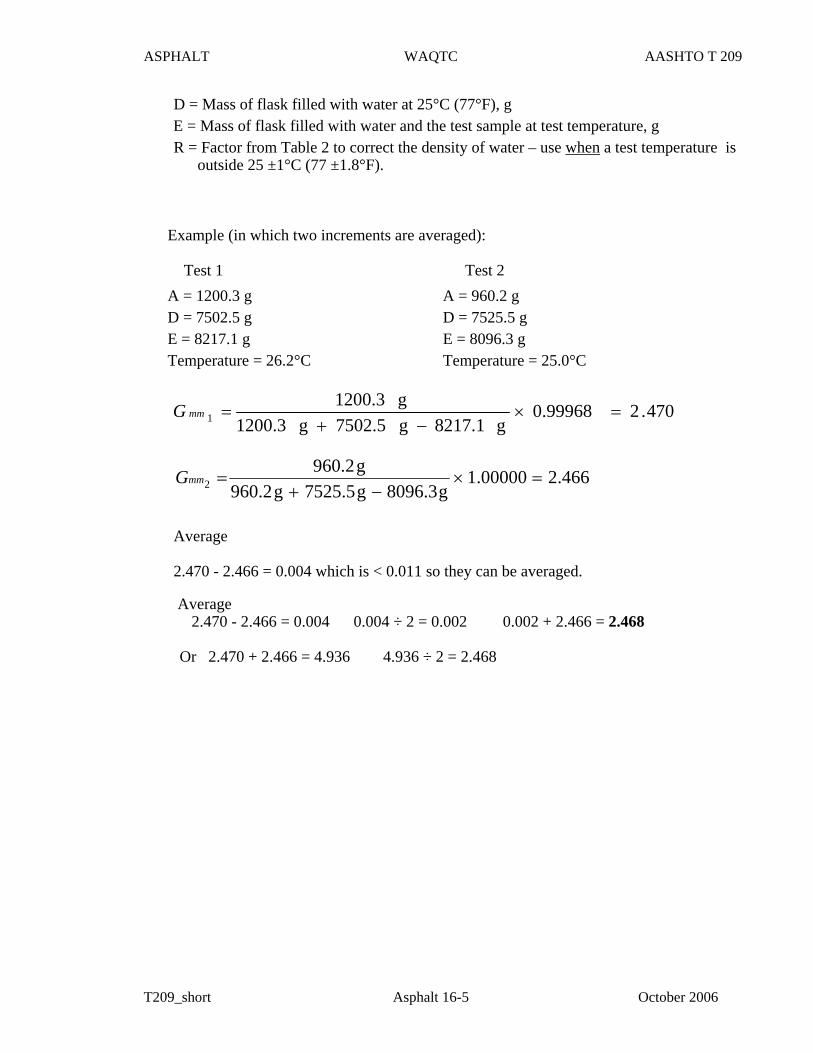
ASPHALT WAQTC AASHTO T 209
T209_short Asphalt 16-5 October 2006
D = Mass of flask filled with water at 25°C (77°F), g E = Mass of flask filled with water and the test sample at test temperature, g R = Factor from Table 2 to correct the density of water – use when a test temperature is
outside 25 ±1°C (77 ±1.8°F).
Example (in which two increments are averaged): Test 1 Test 2 A = 1200.3 g A = 960.2 g D = 7502.5 g D = 7525.5 g E = 8217.1 g E = 8096.3 g Temperature = 26.2°C Temperature = 25.0°C
Average
2.470 - 2.466 = 0.004 which is < 0.011 so they can be averaged.
Average 2.470 - 2.466 = 0.004 0.004 ÷ 2 = 0.002 0.002 + 2.466 = 2.468
Or 2.470 + 2.466 = 4.936 4.936 ÷ 2 = 2.468
470.20.99968g8217.1g7502.5g1200.3
g1200.31 =×
−+=mmG
466.200000.1g3.0968g5.5257g2.609
g2.6092 =×
−+=mmG
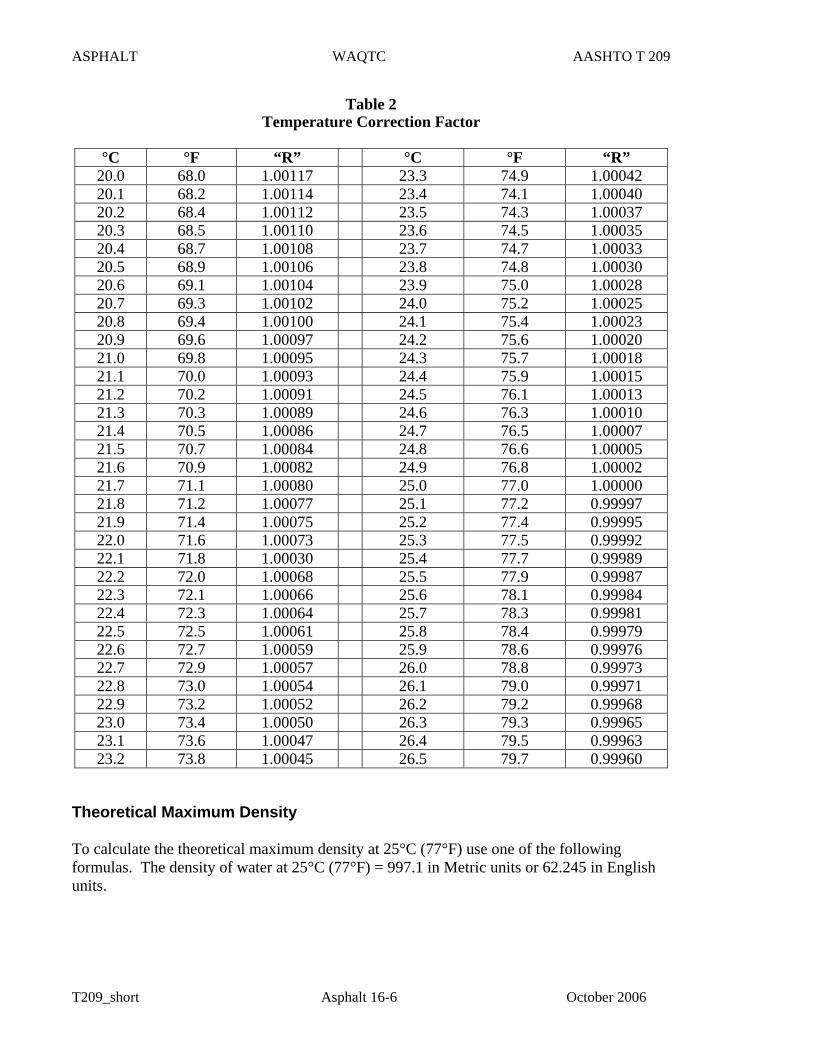
ASPHALT WAQTC AASHTO T 209
T209_short Asphalt 16-6 October 2006
Table 2 Temperature Correction Factor
°C °F “R” °C °F “R”
20.0 68.0 1.00117 23.3 74.9 1.00042 20.1 68.2 1.00114 23.4 74.1 1.00040 20.2 68.4 1.00112 23.5 74.3 1.00037 20.3 68.5 1.00110 23.6 74.5 1.00035 20.4 68.7 1.00108 23.7 74.7 1.00033 20.5 68.9 1.00106 23.8 74.8 1.00030 20.6 69.1 1.00104 23.9 75.0 1.00028 20.7 69.3 1.00102 24.0 75.2 1.00025 20.8 69.4 1.00100 24.1 75.4 1.00023 20.9 69.6 1.00097 24.2 75.6 1.00020 21.0 69.8 1.00095 24.3 75.7 1.00018 21.1 70.0 1.00093 24.4 75.9 1.00015 21.2 70.2 1.00091 24.5 76.1 1.00013 21.3 70.3 1.00089 24.6 76.3 1.00010 21.4 70.5 1.00086 24.7 76.5 1.00007 21.5 70.7 1.00084 24.8 76.6 1.00005 21.6 70.9 1.00082 24.9 76.8 1.00002 21.7 71.1 1.00080 25.0 77.0 1.00000 21.8 71.2 1.00077 25.1 77.2 0.99997 21.9 71.4 1.00075 25.2 77.4 0.99995 22.0 71.6 1.00073 25.3 77.5 0.99992 22.1 71.8 1.00030 25.4 77.7 0.99989 22.2 72.0 1.00068 25.5 77.9 0.99987 22.3 72.1 1.00066 25.6 78.1 0.99984 22.4 72.3 1.00064 25.7 78.3 0.99981 22.5 72.5 1.00061 25.8 78.4 0.99979 22.6 72.7 1.00059 25.9 78.6 0.99976 22.7 72.9 1.00057 26.0 78.8 0.99973 22.8 73.0 1.00054 26.1 79.0 0.99971 22.9 73.2 1.00052 26.2 79.2 0.99968 23.0 73.4 1.00050 26.3 79.3 0.99965 23.1 73.6 1.00047 26.4 79.5 0.99963 23.2 73.8 1.00045 26.5 79.7 0.99960
Theoretical Maximum Density To calculate the theoretical maximum density at 25°C (77°F) use one of the following formulas. The density of water at 25°C (77°F) = 997.1 in Metric units or 62.245 in English units.
ASPHALT WAQTC AASHTO T 209
T209_short Asphalt 16-7 October 2006
Theoretical maximum density kg/m3 = Gmm x 997.1 kg/ m3 2.468 x 997.1 kg/ m3 = 2461 kg/ m3 or Theoretical maximum density lb/ft3 = Gmm x 62.245 lb/ft3 2.468 x 62.245 lb/ft3 = 153.6 lb/ft3 Report Results shall be reported on standard forms approved for use by the agency. Report Gmm to three decimal places. Report the theoretical maximum density to1 kg/m3 (0.1 lb/ft3).

ASPHALT WAQTC AASHTO T 209
T209_short Asphalt 16-8 October 2006
THIS PAGE INTENTIONALLY LEFT BLANK
I N T E R O F F I C E M E M O
TECHNICAL SERVICESConstruction Section
Office Phone: (503) 986-3000Fax Number: (503) 986-3096
DATE: October 1, 2001 TO: All Holders of the Manual of Field Test Procedures File Code: SECTION: Test Procedure AASHTO T 217
The Oregon Department of Transportation has specified method(s) for this Test Procedure. Please observe the following for our projects: • Procedure- Addendum to step 5, Rotate the vessel for 30 seconds, rest for 30
seconds and repeat until gauge dial reflects no further increase. A minimum of 3 rotations (3 minutes) is required.
• Procedure- Addendum to step 9, Use the following equation in lieu of the
conversion curve to calculate the moisture content based on the dry weight of material. See form 3468.
• % Moisture based on Dry = 100 X Reading Gauge Moisture % - 100
Reading Gauge Moisture %
• Reporting- Report moisture to the nearest 0.1%.

ODOT TM 323(06) 2
EMBANKMENT AND BASE WAQTC AASHTO T 217 IN-PLACE DENSITY
T217_short E&B/ID 17-1 October 2004
DETERMINATION OF MOISTURE IN SOILS BY MEANS OF CALCIUM CARBIDE GAS PRESSURE MOISTURE TESTER FOP FOR AASHTO T 217 Scope This procedure uses a calcium carbide gas pressure moisture tester to determine the moisture content of soils in accordance with AASHTO T 217. This FOP does not apply to the Super 200 D tester (see AASHTO 217). CAUTION: This procedure involves a potentially dangerous chemical reaction. When calcium carbide reacts with water, acetylene gas is produced. Breathing the acetylene gas and running the test where potential for sparks or other ignition might cause a fire must be avoided. Apparatus
• Calcium carbide gas pressure moisture tester. • Balance or scale, conforming to the requirements for AASHTO M 231 and having a
capacity of 2 kg and sensitive to 0.1 g. Most testers include a balance built into the transportation container.
• Cleaning brush and cloth. • Scoop (or cap built into unit) for putting the soil sample into the pressure chamber.
Some testers include a cap built into the unit. • Steel balls, 31.75 mm (1.25”)
Material • Calcium carbide reagent meeting the requirements of AASHTO T 217.
Note 1: Check the manufacturer’s recommendations for maximum storage life and replacement, and storage requirements.
Procedure 1. With the moisture tester in a horizontal position place three scoops, approximately 24 g,
of calcium carbide, into the body. 2. Place two steel balls into the body of the tester with the calcium carbide. 3. Obtain a sample of soil of the wet mass specified by the manufacturer, using the balance
built into the unit, and place the soil into the cap of the tester. Note 2: This method shall not be used on granular material having particles large enough to affect the accuracy of the test. In general, no + 4.75 mm (No.4) material.
EMBANKMENT AND BASE WAQTC AASHTO T 217 IN-PLACE DENSITY
T217_short E&B/ID 17-2 October 2004
Note 3: If the anticipated moisture content exceeds the capacity of the instrument being used, then one-half of the specified soil mass should be placed into the unit, and the resulting gauge reading multiplied by two.
4. With the instrument in a horizontal position, so that calcium carbide does not come into contact with the soil, seat the cap on the body and tighten down on the clamp, thereby sealing the tester.
5. Turn the unit to vertical and allow the soil to fall from the cap into the pressure vessel.
Shake the instrument horizontally with a rotating motion in order to avoid damaging the instrument. Do not allow the steel balls to hit the cap or the bottom of the pressure vessel. Shake the instrument vigorously for 60 seconds then rest for 30 seconds. Continue shaking and resting cycles for up to 180 seconds in shaking cycles or until no further reaction occurs.
6. Allow time for the dissipation of the heat generated by the chemical reaction. 7. When the gauge needle stops moving, take a reading while holding the unit in a
horizontal position at eye level. 8. Record the sample mass and the gauge reading. 9. Position the unit so that the cap is away from the user and slowly loosen the clamp to
release the gas from the pressure chamber. Inspect the sample inside the pressure chamber. If it is not completely pulverized, a new sample must be obtained and tested after the instrument has been thoroughly cleaned.
Moisture Determination 1. The tester determines moisture content based on the wet mass of the soil. Moisture
content based on the dry mass of soil is obtained from a conversion chart or curve supplied with each tester. See Figure 1 for curve from AASHTO T 217.
Note 4: Check the accuracy of the gauge and the conversion chart or curve periodically, in accordance with agency requirements, by testing samples of a known moisture content. Develop correction factors, if necessary.
Example: Gauge reading: 18.5 Conversion from chart: 22.6 Recorded % moisture: 23%
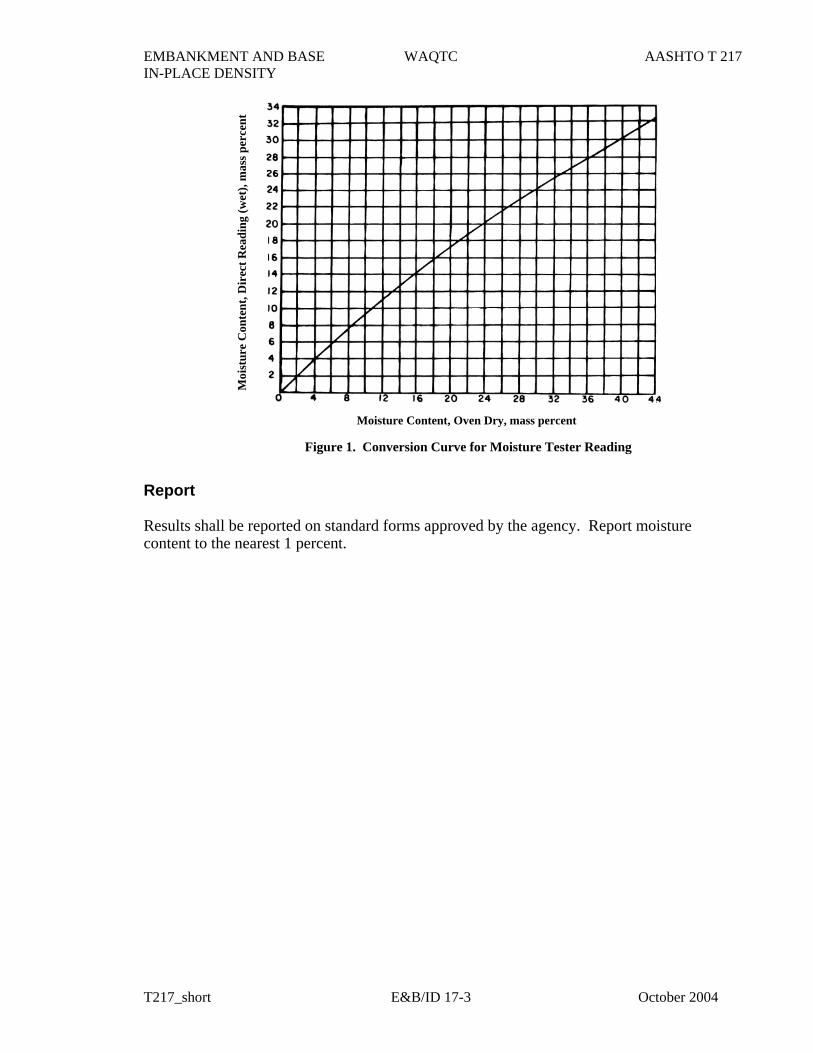
EMBANKMENT AND BASE WAQTC AASHTO T 217 IN-PLACE DENSITY
T217_short E&B/ID 17-3 October 2004
Report Results shall be reported on standard forms approved by the agency. Report moisture content to the nearest 1 percent.
Figure 1. Conversion Curve for Moisture Tester Reading
Moi
stur
e C
onte
nt, D
irec
t Rea
ding
(wet
), m
ass p
erce
nt
Moisture Content, Oven Dry, mass percent

EMBANKMENT AND BASE WAQTC AASHTO T 217 IN-PLACE DENSITY
T217_short E&B/ID 17-4 October 2004
THIS PAGE INTENTIONALLY LEFT BLANK
I N T E R O F F I C E M E M O
TECHNICAL SERVICESConstruction Section
Office Phone: (503) 986-3000Fax Number: (503) 986-3096
DATE: October 17, 2005 TO: All Holders of the Manual of Field Test Procedures File Code: SECTION: Test Procedure AASHTO T 224
The Oregon Department of Transportation has specified method(s) for this Test Procedure. Please observe the following for our projects: Earthwork and Aggregate Applications: • Less than 10% plus 4.75 mm (No. 4) (Method A), no coarse particle correction
is required. • 10%-- 40% plus 4.75 mm (No. 4) (Method A), a coarse particle correction is
required. • Over 40% plus 4.75 mm (No. 4) (Method A), re-screen material and perform
T 99 method D. • Less than 10% plus 19.00 mm (3/4 in.) (Method D), no coarse particle
correction is required. • 10%-- 30% plus 19.00 mm (3/4 in.) (Method D), a coarse particle correction is
required. • Over 30% plus 19.00 mm (3/4 in.) (Method D), the material is non-density
testable and should be evaluated according to the earthwork or appropriate aggregate specifications contained in the project contract documents.
• Percentage of coarse particles can be determined in the wet state. Aggregate • If during crushing operations process control data is available for the 4.75 mm
(No. 4) and/or 19.00 mm (3/4 in.) screen use the average values to compute the coarse particle correction.

ODOT TM 323(06) 2
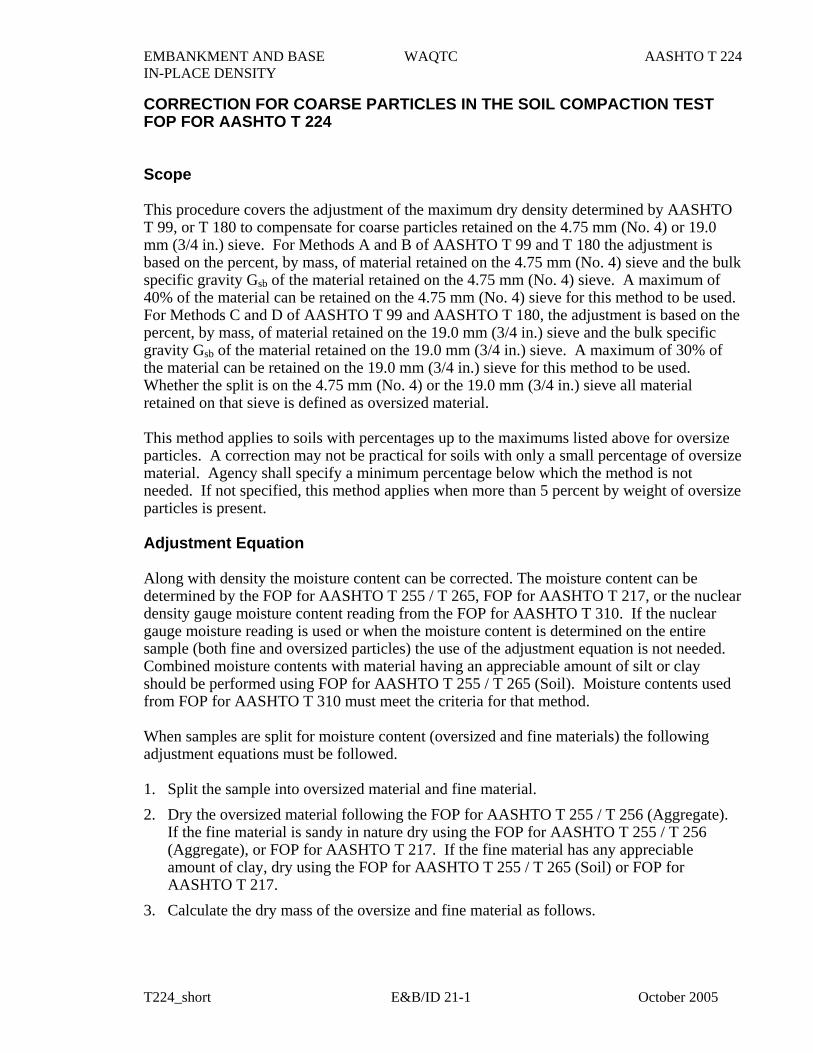
EMBANKMENT AND BASE WAQTC AASHTO T 224 IN-PLACE DENSITY
T224_short E&B/ID 21-1 October 2005
CORRECTION FOR COARSE PARTICLES IN THE SOIL COMPACTION TEST FOP FOR AASHTO T 224 Scope This procedure covers the adjustment of the maximum dry density determined by AASHTO T 99, or T 180 to compensate for coarse particles retained on the 4.75 mm (No. 4) or 19.0 mm (3/4 in.) sieve. For Methods A and B of AASHTO T 99 and T 180 the adjustment is based on the percent, by mass, of material retained on the 4.75 mm (No. 4) sieve and the bulk specific gravity Gsb of the material retained on the 4.75 mm (No. 4) sieve. A maximum of 40% of the material can be retained on the 4.75 mm (No. 4) sieve for this method to be used. For Methods C and D of AASHTO T 99 and AASHTO T 180, the adjustment is based on the percent, by mass, of material retained on the 19.0 mm (3/4 in.) sieve and the bulk specific gravity Gsb of the material retained on the 19.0 mm (3/4 in.) sieve. A maximum of 30% of the material can be retained on the 19.0 mm (3/4 in.) sieve for this method to be used. Whether the split is on the 4.75 mm (No. 4) or the 19.0 mm (3/4 in.) sieve all material retained on that sieve is defined as oversized material. This method applies to soils with percentages up to the maximums listed above for oversize particles. A correction may not be practical for soils with only a small percentage of oversize material. Agency shall specify a minimum percentage below which the method is not needed. If not specified, this method applies when more than 5 percent by weight of oversize particles is present. Adjustment Equation Along with density the moisture content can be corrected. The moisture content can be determined by the FOP for AASHTO T 255 / T 265, FOP for AASHTO T 217, or the nuclear density gauge moisture content reading from the FOP for AASHTO T 310. If the nuclear gauge moisture reading is used or when the moisture content is determined on the entire sample (both fine and oversized particles) the use of the adjustment equation is not needed. Combined moisture contents with material having an appreciable amount of silt or clay should be performed using FOP for AASHTO T 255 / T 265 (Soil). Moisture contents used from FOP for AASHTO T 310 must meet the criteria for that method. When samples are split for moisture content (oversized and fine materials) the following adjustment equations must be followed. 1. Split the sample into oversized material and fine material. 2. Dry the oversized material following the FOP for AASHTO T 255 / T 256 (Aggregate).
If the fine material is sandy in nature dry using the FOP for AASHTO T 255 / T 256 (Aggregate), or FOP for AASHTO T 217. If the fine material has any appreciable amount of clay, dry using the FOP for AASHTO T 255 / T 265 (Soil) or FOP for AASHTO T 217.
3. Calculate the dry mass of the oversize and fine material as follows.
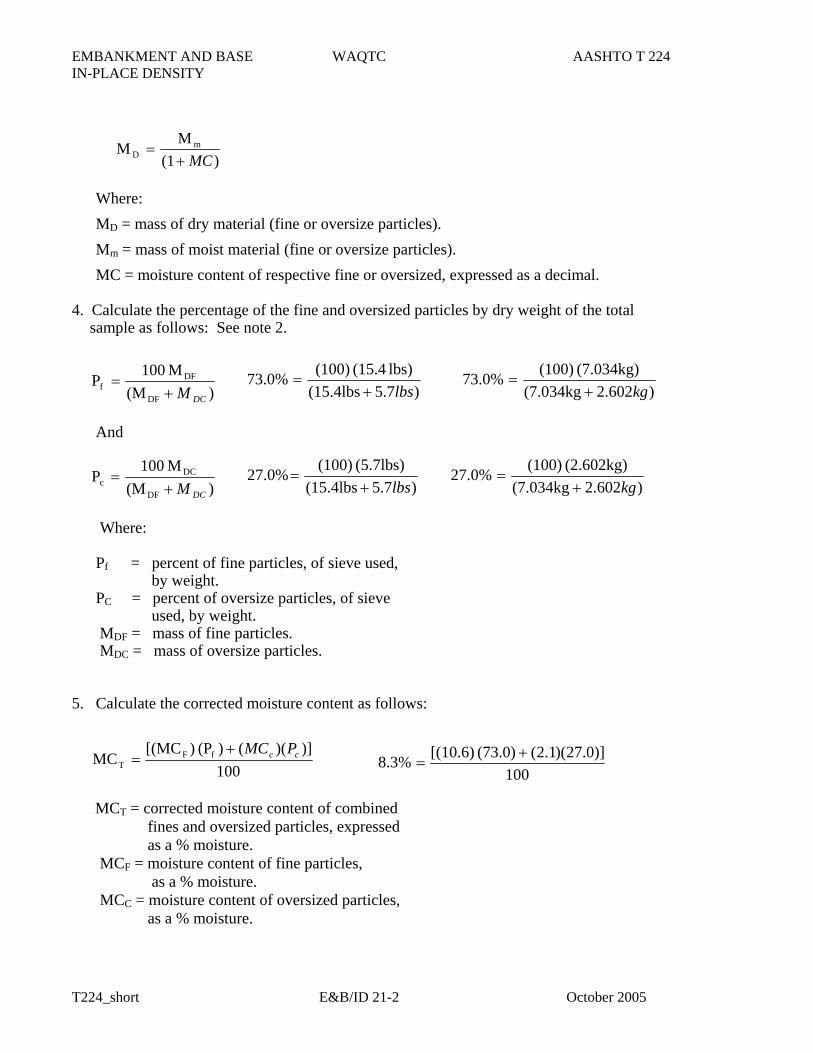
EMBANKMENT AND BASE WAQTC AASHTO T 224 IN-PLACE DENSITY
T224_short E&B/ID 21-2 October 2005
Where: MD = mass of dry material (fine or oversize particles). Mm = mass of moist material (fine or oversize particles). MC = moisture content of respective fine or oversized, expressed as a decimal.
4. Calculate the percentage of the fine and oversized particles by dry weight of the total
sample as follows: See note 2.
And
Where: Pf = percent of fine particles, of sieve used, by weight. PC = percent of oversize particles, of sieve used, by weight. MDF = mass of fine particles. MDC = mass of oversize particles. 5. Calculate the corrected moisture content as follows:
MCT = corrected moisture content of combined fines and oversized particles, expressed as a % moisture. MCF = moisture content of fine particles, as a % moisture. MCC = moisture content of oversized particles, as a % moisture.
)(1M
M mD MC+=
) (MM 100P
DF
DFf
DCM+=
) (MM 100
DCc
DCM+=
100)])(()(P )[(MC
MC fFT
cc PMC+=
100)]0.27)(1.2()(73.0 [(10.6)8.3% +
=
)7.5 (15.4lbslbs) (15.4 (100)73.0%lbs+
=
)7.5 (15.4lbs(5.7lbs) (100)27.0%
lbs+=
)602.2 (7.034kg(2.602kg) (100)27.0%
kg+=
)602.2 (7.034kg(7.034kg) (100)73.0%
kg+=
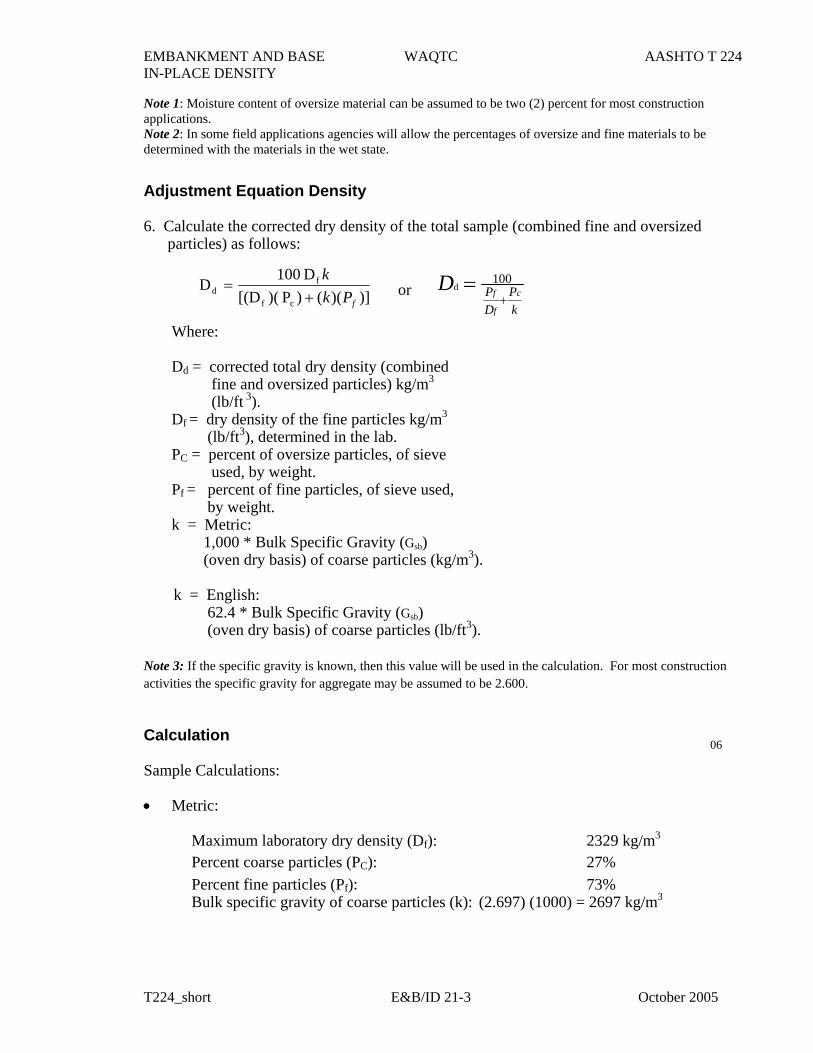
EMBANKMENT AND BASE WAQTC AASHTO T 224 IN-PLACE DENSITY
T224_short E&B/ID 21-3 October 2005
Note 1: Moisture content of oversize material can be assumed to be two (2) percent for most construction applications. Note 2: In some field applications agencies will allow the percentages of oversize and fine materials to be determined with the materials in the wet state.
Adjustment Equation Density 6. Calculate the corrected dry density of the total sample (combined fine and oversized
particles) as follows: Where: Dd = corrected total dry density (combined fine and oversized particles) kg/m3 (lb/ft 3). Df = dry density of the fine particles kg/m3 (lb/ft3), determined in the lab. PC = percent of oversize particles, of sieve used, by weight. Pf = percent of fine particles, of sieve used, by weight. k = Metric:
1,000 * Bulk Specific Gravity (Gsb) (oven dry basis) of coarse particles (kg/m3).
k = English:
62.4 * Bulk Specific Gravity (Gsb) (oven dry basis) of coarse particles (lb/ft3). Note 3: If the specific gravity is known, then this value will be used in the calculation. For most construction activities the specific gravity for aggregate may be assumed to be 2.600.
Calculation Sample Calculations: • Metric:
Maximum laboratory dry density (Df): 2329 kg/m3 Percent coarse particles (PC): 27% Percent fine particles (Pf): 73% Bulk specific gravity of coarse particles (k): (2.697) (1000) = 2697 kg/m3
06
)])(()P )([(DD 100D
cf
fd
fPkk
+= or
kP
DP c
f
fD+
= 100d
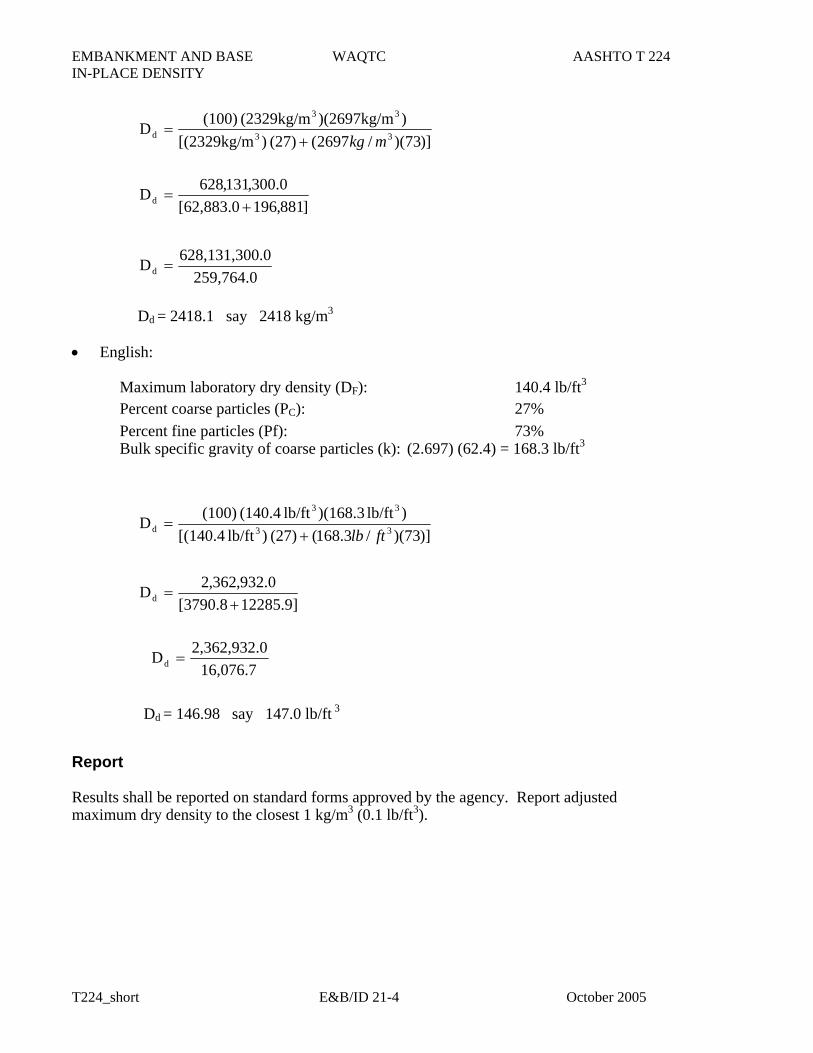
EMBANKMENT AND BASE WAQTC AASHTO T 224 IN-PLACE DENSITY
T224_short E&B/ID 21-4 October 2005
Dd = 2418.1 say 2418 kg/m3
• English:
Maximum laboratory dry density (DF): 140.4 lb/ft3 Percent coarse particles (PC): 27% Percent fine particles (Pf): 73% Bulk specific gravity of coarse particles (k): (2.697) (62.4) = 168.3 lb/ft3
Dd = 146.98 say 147.0 lb/ft 3
Report Results shall be reported on standard forms approved by the agency. Report adjusted maximum dry density to the closest 1 kg/m3 (0.1 lb/ft3).
)]73)(/2697((27) )[(2329kg/m))(2697kg/m(2329kg/m (100)D 33
33
d mkg+=
]881,196[62,883.00.300,131,628Dd +
=
259,764.00.0628,131,30Dd =
)]73)(/3.168((27) )lb/ft [(140.4)lb/ft )(168.3lb/ft (140.4 (100)D 33
33
d ftlb+=
]9.12285[3790.80.932,362,2Dd +
=
16,076.702,362,932.Dd =

Capping Cylindrical Concrete Specimens
AASHTO Designation: T 231-03 ASTM Designation: C 617-98
AASHTO TEST METHODS CANNOT BE INCLUDED ON ODOT’S WEBSITE DUE TO COPYRIGHT INFRINGEMENT. TO GET COPIES OF THE TEST METHODS, YOU CAN ORDER A HARD COPY OF ODOT’S MANUAL OF FIELD TEST PROCEDURES OR YOU CAN ORDER THE LATEST STANDARD SPECIFICATIONS FOR TRANSPORTATION MATERIALS AND METHODS OF SAMPLING AND TESTING FROM AASHTO. ORDERING INSTRUCTIONS ARE GIVEN BELOW: To order ODOT’s Manual of Field Test Procedures, use the following web address: http://www.odot.state.or.us/ffp/cs/opo/contractor_plans/ManualSubmitOrder.htm To order AASHTO’s Standard Specifications for Transportation Materials and Methods of Sampling and Testing, use the following web address: https://bookstore.transportation.org/

I N T E R O F F I C E M E M O
TECHNICAL SERVICESConstruction Section
Office Phone: (503) 986-3000Fax Number: (503) 986-3096
DATE: October 15, 2004 TO: All Holders of the Manual of Field Test Procedures File Code: SECTION: Test Procedure AASHTO T 248
The Oregon Department of Transportation has specified method(s) for this Test Procedure. Please observe the following for our projects: • Method A (Mechanical Splitter) – Checking of the splitting bias is required.

ODOT TM 323(06) 2
AGGREGATE WAQTC AASHTO T 248
T248_short Aggregate 10-1 October 2005
REDUCING SAMPLES OF AGGREGATES TO TESTING SIZE FOP FOR AASHTO T 248 Scope This procedure covers the reduction of samples to the appropriate size for testing in accordance with AASHTO T 248. Techniques are used that minimize variations in characteristics between test samples and field samples. Method A (Mechanical Splitter) and Method B (Quartering) are covered. This procedure applies to fine aggregate (FA), coarse aggregate (CA), and mixes of the two, and may also be used on soils. Samples of fine aggregates that are drier than the saturated surface dry (SSD) condition shall be reduced by a mechanical splitter according to Method A. Samples of FA that are at SSD or wetter than SSD shall be reduced by Method B, or the entire sample may be dried to the SSD condition, using temperatures that do not exceed those specified for any of the tests contemplated, and then reduced to test sample size using Method A. Samples of CA or mixtures of FA and CA may be reduced by either method. As a quick determination, if the fine aggregate will retain its shape when molded with the hand it is wetter that SSD. Apparatus Method A – Mechanical Splitter Splitter chutes:
• Even number of equal width chutes • Discharge alternately to each side • Minimum of 8 chutes for CA, 12 chutes for FA • Width
- Minimum 50 percent larger than largest particle - A maximum chute width of 19 mm (3/4 in.) for dry fine aggregate passing 9.5
mm (3/8 in.) sieve Splitter receptacles:
• Capable of holding two halves of the sample following splitting. • Hopper or straightedge pan width equal to or slightly less than the overall width of
the assembly of chutes. • Capable of feeding the splitter at a controlled rate.
The splitter and accessory equipment shall be so designed that the sample will flow smoothly without restriction or loss of material. Method B – Quartering
• Straightedge scoop, shovel, or trowel • Broom or brush • Canvas or plastic sheet, approximately 2 by 3 m (6 by 9 ft)
AGGREGATE WAQTC AASHTO T 248
T248_short Aggregate 10-2 October 2005
Sample Preparation If the FA sample is wetter than the SSD condition and Method A – Mechanical Splitter is to be used, dry the material using temperatures not exceeding those specified for any of the tests contemplated for the sample. Note 1: It may be undesirable to split some FA / CA mixtures that are over SSD condition using Method A. Procedure Method A – Mechanical Splitter Place the sample in the hopper or pan and uniformly distribute it from edge to edge so that approximately equal amounts flow through each chute. The rate at which the sample is introduced shall be such as to allow free flowing through the chutes into the hoppers below. Split the sample from one of the two hoppers as many times as necessary to reduce the sample to the size specified for the intended test. The portion of the material collected in the other receptacle may be reserved for reduction in size for other tests. As a check for effective splitting determine the mass of each part of the split. If the ratio of the two masses differs by more than 5 percent, corrective action must be taken. Calculation Splitter check: 5127 total sample mass Splitter pan #1: 2583 Splitter pan #2: 2544
25832544 X100 = 98.5 100-98.5 = 1.5%
Method B – Quartering Use either of the following two procedures or a combination of both. Procedure # 1: Quartering on a clean, hard, level surface: 1. Place the sample on a hard, clean, level surface where there will be neither loss of
material nor the accidental addition of foreign material. 2. Mix the material thoroughly by turning the entire sample over a minimum of three times.
With the last turning, shovel the entire sample into a conical pile by depositing each shovelful on top of the preceding one.
3. Flatten the conical pile to a uniform thickness and diameter by pressing down with a shovel. The diameter should be four to eight times the thickness.
4. Divide the flattened pile into four approximately equal quarters with a shovel or trowel. 5. Remove two diagonally opposite quarters, including all fine material, and brush the
cleared spaces clean.
AGGREGATE WAQTC AASHTO T 248
T248_short Aggregate 10-3 October 2005
6. Successively mix and quarter the remaining material until the sample is reduced to the desired size.
7. The final test sample consists of two diagonally opposite quarters. Procedure # 2: Quartering on a canvas or plastic sheet: 1. Place the sample on the sheet. 2. Mix the material thoroughly by turning the entire sample over a minimum of three times.
Lift each corner of the sheet and pulling it over the sample toward the diagonally opposite corner, causing the material to be rolled. With the last turning, form a conical pile.
3. Flatten the conical pile to a uniform thickness and diameter by pressing down with a shovel. The diameter should be four to eight times the thickness.
4. Divide the flattened pile into four approximately equal quarters with a shovel or trowel, or, insert a stick or pipe beneath the sheet and under the center of the pile, then lift both ends of the stick, dividing the sample into two roughly equal parts. Remove the stick leaving a fold of the sheet between the divided portions. Insert the stick under the center of the pile at right angles to the first division and again lift both ends of the stick, dividing the sample into four roughly equal quarters.
5. Remove two diagonally opposite quarters, being careful to clean the fines from the sheet. 6. Successively mix and quarter the remaining material until the sample size is reduced to
the desired size. 7. The final test sample consists of two diagonally opposite quarters.

AGGREGATE WAQTC AASHTO T 248
T248_short Aggregate 10-4 October 2005
THIS PAGE INTENTIONALLY LEFT BLANK
EMBANKMENT AND BASE WAQTC AASHTO T 255/T265 IN-PLACE DENSITY
TOTAL EVAPORABLE MOISTURE CONTENT OF AGGREGATE BY DRYING FOP FOR AASHTO T 255 LABORATORY DETERMINATION OF MOISTURE CONTENT OF SOILS FOP FOR AASHTO T 265 Scope This procedure covers the determination of moisture content of aggregate and soil in accordance with AASHTO T 255 and AASHTO T 265. It may also be used for other construction materials. Apparatus • Balance or scale: capacity sufficient for the principle sample mass, accurate to 0.1
percent of sample mass or readable to 0.1 g. Meeting the requirements of AASHTO M 231.
• Containers, capable of being sealed • Suitable drying containers • Microwave safe containers • Thermometer reading to 205 ±6°C (400 ±10°F) • Heat source , controlled
− Forced draft oven − Ventilated / convection oven
• Heat source, uncontrolled − Microwave oven (600 watts minimum) − Infrared heater, hot plate, fry pan, or any other device/method that will dry the sample
without altering the material being dried • Utensils such as spoons • Hot pads or gloves Sample Preparation For aggregate, select the proper sample size based on Table 1 or other information that may be specified by the agency. Obtain the sample in accordance with the FOP for AASHTO T 2. Immediately seal or cover samples to prevent any change in moisture content.
T255_T265_short E&B/ID 16-1 October 2006
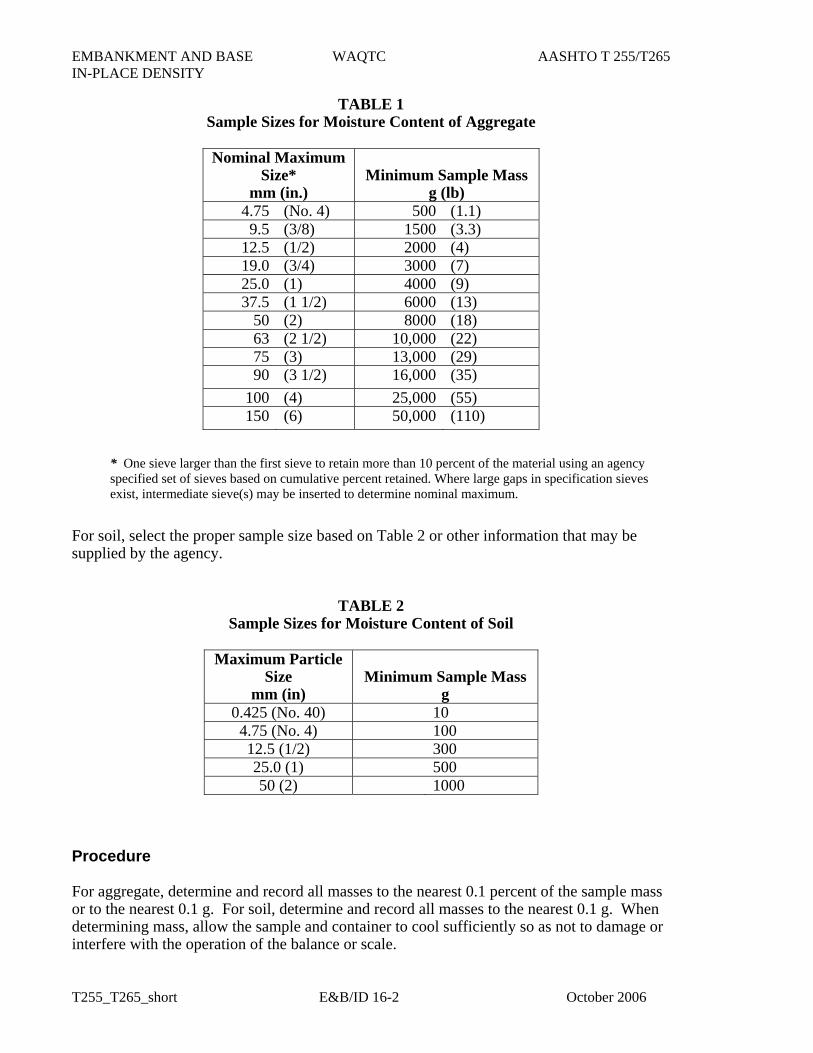
EMBANKMENT AND BASE WAQTC AASHTO T 255/T265 IN-PLACE DENSITY
TABLE 1 Sample Sizes for Moisture Content of Aggregate
Nominal Maximum
Size* mm (in.)
Minimum Sample Mass
g (lb) 4.75 (No. 4) 500 (1.1) 9.5 (3/8) 1500 (3.3)
12.5 (1/2) 2000 (4) 19.0 (3/4) 3000 (7) 25.0 (1) 4000 (9) 37.5 (1 1/2) 6000 (13)
50 (2) 8000 (18) 63 (2 1/2) 10,000 (22) 75 (3) 13,000 (29) 90 (3 1/2) 16,000 (35)
100 (4) 25,000 (55) 150 (6) 50,000 (110)
* One sieve larger than the first sieve to retain more than 10 percent of the material using an agency specified set of sieves based on cumulative percent retained. Where large gaps in specification sieves exist, intermediate sieve(s) may be inserted to determine nominal maximum.
For soil, select the proper sample size based on Table 2 or other information that may be supplied by the agency.
TABLE 2 Sample Sizes for Moisture Content of Soil
Maximum Particle
Size mm (in)
Minimum Sample Mass
g 0.425 (No. 40) 10 4.75 (No. 4) 100 12.5 (1/2) 300 25.0 (1) 500 50 (2) 1000
Procedure For aggregate, determine and record all masses to the nearest 0.1 percent of the sample mass or to the nearest 0.1 g. For soil, determine and record all masses to the nearest 0.1 g. When determining mass, allow the sample and container to cool sufficiently so as not to damage or interfere with the operation of the balance or scale.
T255_T265_short E&B/ID 16-2 October 2006
EMBANKMENT AND BASE WAQTC AASHTO T 255/T265 IN-PLACE DENSITY
1. Determine and record the mass of the container. 2. Place the wet sample in the container, and record the total mass of the container and wet
sample. 3. Determine the wet mass of the sample by subtracting the mass in Step 1 from the mass in
Step 2. 4. Dry the sample to a constant mass in accordance with the directions given under
Directions for Drying below. Measures will be taken to protect the scale from excessive heat while determining constant mass.
5. Allow the sample to cool and record the total mass of the container and dry sample. 6. Determine the dry mass of the sample by subtracting the mass in Step 1 from the mass in
Step 5. Directions for Drying Aggregate
• Controlled (Forced Draft, Ventilated or Convection Oven)
1. Spread sample in the container. 2. Dry to constant mass at 110 ±5°C (230 ±9°F). Constant mass has been reached when
there is less than a 0.10 percent change after an additional 30 minutes of drying.
• Uncontrolled Where close control of temperature is not required (such as with aggregate not altered by higher temperatures, or with aggregate that will not be used in further tests, or where precise information is not required), higher temperatures or other suitable heat sources, may be used. Other heat sources may include microwaves, hot plates, or heat lamps.
─ Microwave Oven 1. Heap sample in pile in the center of the container and cover. This cover must
allow moisture to escape. 2. Dry to constant mass. Constant mass has been reached when there is less than a
0.10 percent change after at least an additional 10 minutes of drying. Caution: Some minerals in the sample may cause the aggregate to overheat altering the aggregate gradation.
─ Hot plates, heat lamps, etc. 1. Spread sample in container. 2. Stir the sample frequently to avoid localized overheating and aggregate fracturing. 3. Dry to a constant mass. Constant mass has been reached when there is less than a
0.10 percent change after at least an additional 20 minutes of drying.
T255_T265_short E&B/ID 16-3 October 2006
EMBANKMENT AND BASE WAQTC AASHTO T 255/T265 IN-PLACE DENSITY
Directions for Drying Soil • Oven (Preferably Forced Draft/Air)
1. Place sample in container. 2. Dry to constant mass at 110 ±5°C (230 ±9°F). Constant mass has been reached when
there is no change after an additional 1 hour of drying. A sample dried overnight (15 to 16 hours) is sufficient in most cases.
Note 1: Soils containing gypsum or significant amounts of organic material require special drying. For reliable moisture contents dry these soils at 60°C (140°F). For more information see AASHTO T 265, Note 2.
Calculation Constant Mass for Aggregates:
Calculate constant mass using the following formula:
100% xChange MpMnMp−=
Where: Mp = previous mass measurement Mn = new mass measurement
Example: Mass of container: 1232.1 g Mass of container& sample after first drying cycle: 2637.2 g Mass, Mp, of possibly dry sample: 2637.2 g - 1232.1 g = 1405.1 g Mass of container and dry sample after second drying cycle: 2634.1 g
Mass, Mn, of dry sample: 2634.1 g - 1232.1 g = 1402.0 g
100%22.0 1.14050.14021.1405 x−=
0.22% is not less than 0.10% so continue to dry it
Mass of container and dry sample after third drying cycle: 2633.0 g Mass, Mn, of dry sample: 2633.0 g - 1232.1 g = 1400.9 g
100%08.0 0.14029.14000.1402 x−=
0.08% is less than 0.10% constant mass has been reached for an aggregate, but continue drying for soil.
T255_T265_short E&B/ID 16-4 October 2006
EMBANKMENT AND BASE WAQTC AASHTO T 255/T265 IN-PLACE DENSITY
Moisture Content Aggregate and Soils:
Calculate the moisture content, as a percent, using the following formula:
100M
MM
D
DW ×−
=w Where:
w = moisture content, percent MW = wet mass MD = dry mass Example: Mass of container: 1232.1 g Mass of container and wet sample: 2764.7 g Mass, MW, of wet sample: 2764.7 g - 1232.1 g = 1532.6 g Mass of container and dry sample (COOLED): 2633.1 g Mass, MD, of dry sample: 2633.1 g - 1232.1 g = 1401.0 g
9.4%torounded9.39%100g1401.0g131.6100
g1401.0g1401.0g1532.6w =×=×
−=
Report Results shall be reported on standard forms approved for use by the agency. Include:
• MW, wet mass • MD, dry mass • w, moisture content to nearest 0.1 percent
T255_T265_short E&B/ID 16-5 October 2006

EMBANKMENT AND BASE WAQTC AASHTO T 255/T265 IN-PLACE DENSITY
THIS PAGE INTENTIONALLY LEFT BLANK
T255_T265_short E&B/ID 16-6 October 2006
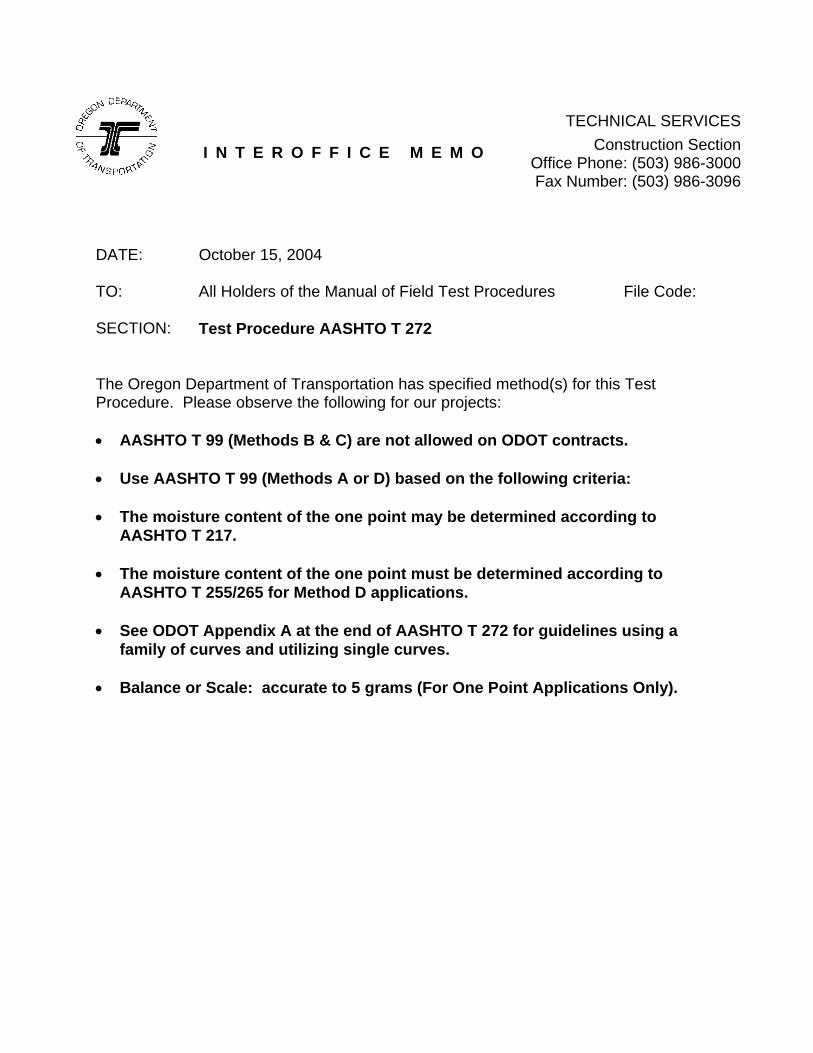
I N T E R O F F I C E M E M O
TECHNICAL SERVICESConstruction Section
Office Phone: (503) 986-3000Fax Number: (503) 986-3096
DATE: October 15, 2004 TO: All Holders of the Manual of Field Test Procedures File Code: SECTION: Test Procedure AASHTO T 272
The Oregon Department of Transportation has specified method(s) for this Test Procedure. Please observe the following for our projects: • AASHTO T 99 (Methods B & C) are not allowed on ODOT contracts. • Use AASHTO T 99 (Methods A or D) based on the following criteria: • The moisture content of the one point may be determined according to
AASHTO T 217. • The moisture content of the one point must be determined according to
AASHTO T 255/265 for Method D applications. • See ODOT Appendix A at the end of AASHTO T 272 for guidelines using a
family of curves and utilizing single curves. • Balance or Scale: accurate to 5 grams (For One Point Applications Only).

ODOT TM 323(06) 2
EMBANKMENT AND BASE WAQTC AASHTO T 272 IN-PLACE DENSITY
T272_short E&B/ID 19-1 October 2006
FAMILY OF CURVES – ONE-POINT METHOD FOP FOR AASHTO T 272 Scope This procedure provides for a rapid determination of the maximum density and optimum moisture content of a soil sample utilizing a family of curves and a one-point determination in accordance with AASHTO T 272. This procedure is related to AASHTO T 99, and AASHTO T 180. One-point determinations are made by compacting the soil in a mold of a given size with a specified rammer dropped from a specified height. Four alternate methods – A, B, C, D – are used and correspond to the methods described in AASHTO T 99 or T 180. The method used in AASHTO T 272 must match the method used in AASHTO T 99 or T 180. Apparatus See the FOP for AASHTO T 99 and T 180. Sample Sample size determined according to the FOP for AASHTO T 310. In cases where the existing family can not be used a completely new curve will need to be developed and the sample size will be determined by the FOP for AASHTO T 99 and T 180. Procedure See the FOP for AASHTO T 99 and T 180. Calculations See the FOP for AASHTO T 99 and T 180. Maximum Dry Density and Optimum Moisture Content Determination 1. If the moisture-density one-point falls on one of the curves in the family of curves, the
maximum dry density and optimum moisture content defined by that curve shall be used. 2. If the moisture-density one-point falls within the family of curves but not on an existing
curve, a new curve shall be drawn through the plotted single point parallel and in character with the nearest existing curve in the family of curves. The maximum dry density and optimum moisture content as defined by the new curve shall be used.
Note 1: If the one-point plotted within or on the family of curves does not fall in the 80 to 100 percent of optimum moisture content, compact another specimen, using the same material, at an adjusted moisture content that will place the one point within this range.
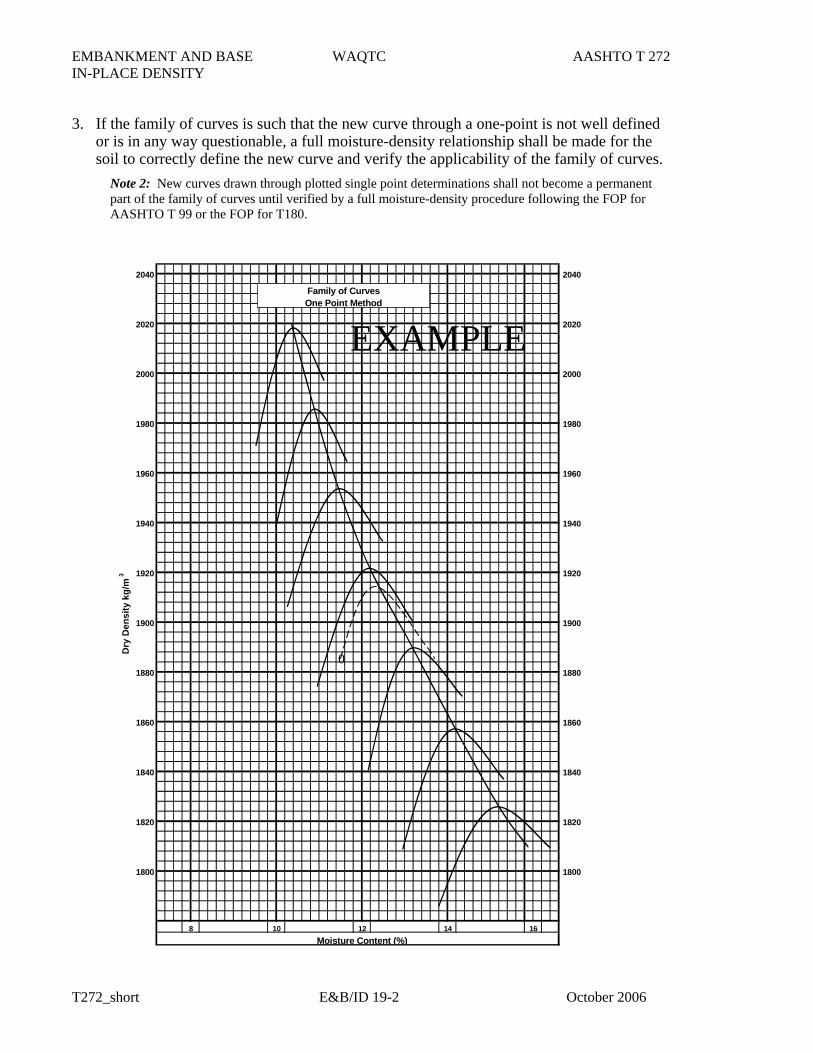
EMBANKMENT AND BASE WAQTC AASHTO T 272 IN-PLACE DENSITY
T272_short E&B/ID 19-2 October 2006
EXAMPLE
3. If the family of curves is such that the new curve through a one-point is not well defined or is in any way questionable, a full moisture-density relationship shall be made for the soil to correctly define the new curve and verify the applicability of the family of curves.
Note 2: New curves drawn through plotted single point determinations shall not become a permanent part of the family of curves until verified by a full moisture-density procedure following the FOP for AASHTO T 99 or the FOP for T180.
0
1840
1880
1820
16Moisture Content (%)
8 10 12 14
D
ry D
ensi
ty k
g/m
3
2000
2020
1980
1860
1900
1920
1940
1960
1800
1820
1880
1860
1900
1800
2040 2040
2020
2000
1980
1960
1940
1920
1840
Family of CurvesOne Point Method
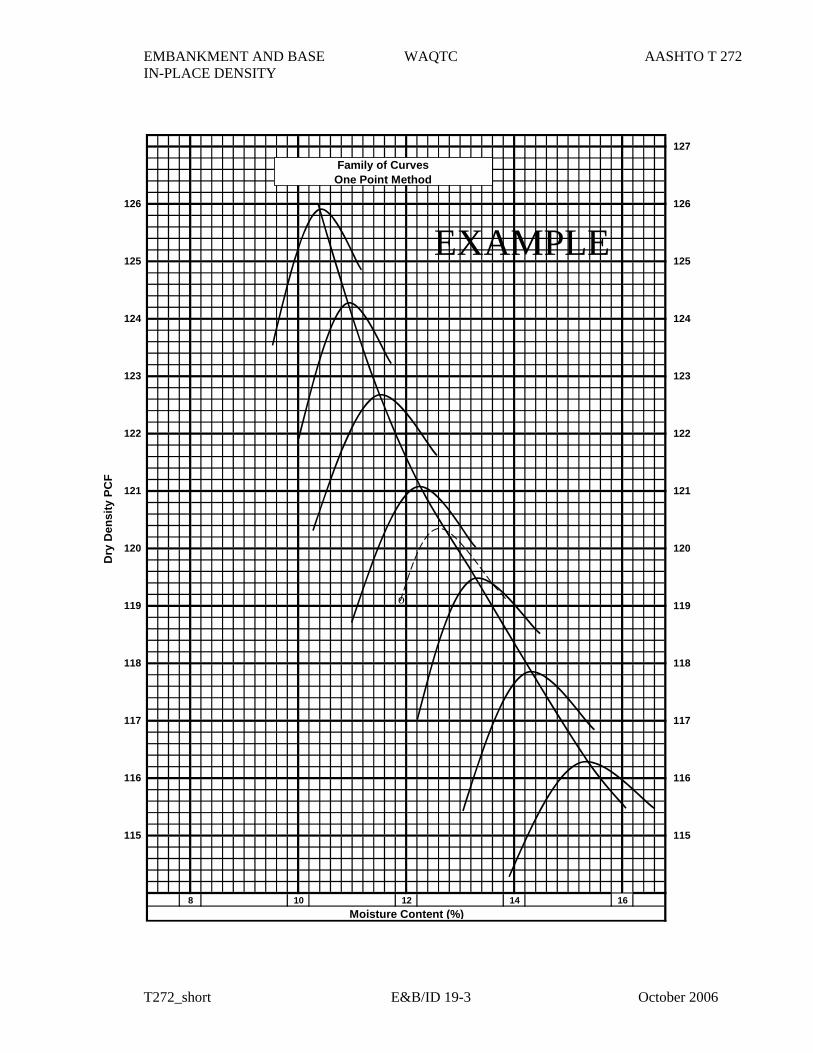
EMBANKMENT AND BASE WAQTC AASHTO T 272 IN-PLACE DENSITY
T272_short E&B/ID 19-3 October 2006
EXAMPLE
o
115
127
126
125
124
123
122
121
117
116
119
118
120
D
ry D
ensi
ty P
CF
125
126
124
118
120
121
122
123
115
117
119
116
Moisture Content (%)168 10 12 14
Family of CurvesOne Point Method
EMBANKMENT AND BASE WAQTC AASHTO T 272 IN-PLACE DENSITY
T272_short E&B/ID 19-4 October 2006
Example A moisture-density procedure (AASHTO T 99 or AASHTO T 180) was run. A dry density of 1885 kg/m3 and a corresponding moisture content of 11.5 percent percent moisture were determined. This point was plotted on the appropriate family between two previously developed curves. For the English units family curve example the dry density and a corresponding moisture content were 119.1 lb/ft3 at 11.9. The “dashed” curve beginning at the moisture-density one-point was sketched between the two existing curves. A maximum dry density of 1915 kg/m3 and a corresponding optimum moisture content of 12.4 or 120.4 lb/ft3 and 12.7 percent moisture were estimated. Report Results shall be reported on standard forms approved by the agency. Report maximum dry density to the closest 1 kg/m3 (0.1 lb/ft3) and optimum moisture content to the closest 0.1 percent.
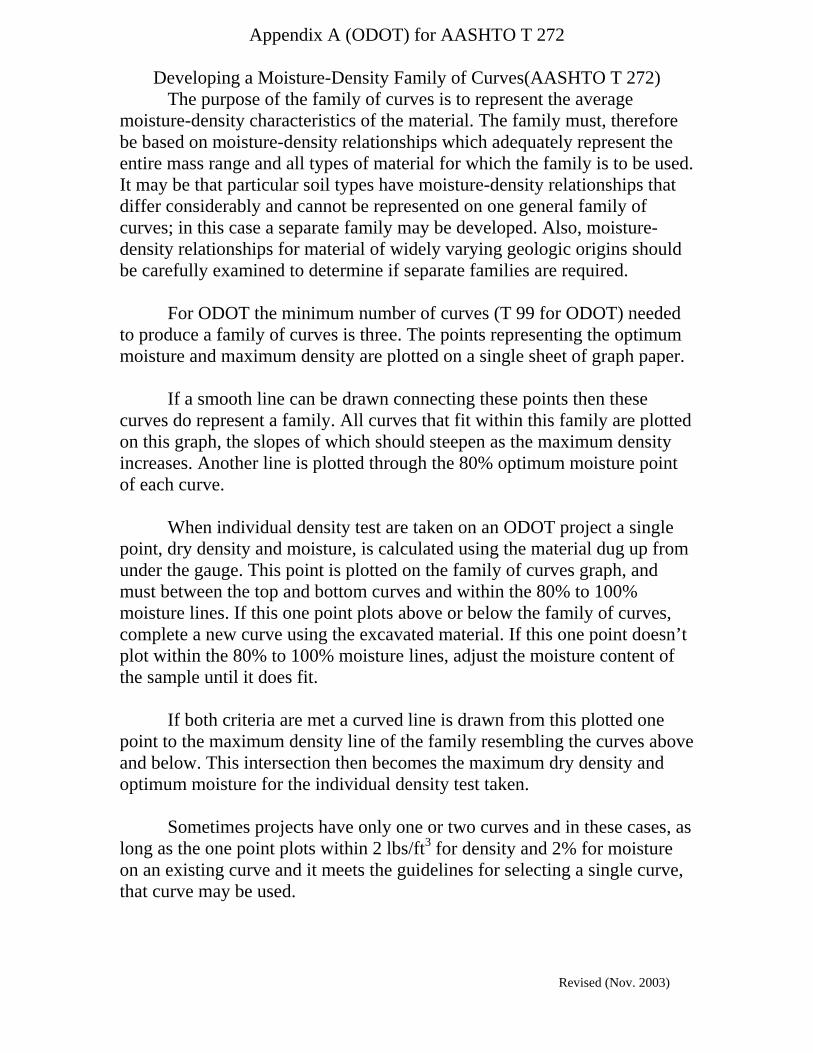
Revised (Nov. 2003)
Appendix A (ODOT) for AASHTO T 272
Developing a Moisture-Density Family of Curves(AASHTO T 272) The purpose of the family of curves is to represent the average moisture-density characteristics of the material. The family must, therefore be based on moisture-density relationships which adequately represent the entire mass range and all types of material for which the family is to be used. It may be that particular soil types have moisture-density relationships that differ considerably and cannot be represented on one general family of curves; in this case a separate family may be developed. Also, moisture-density relationships for material of widely varying geologic origins should be carefully examined to determine if separate families are required. For ODOT the minimum number of curves (T 99 for ODOT) needed to produce a family of curves is three. The points representing the optimum moisture and maximum density are plotted on a single sheet of graph paper.
If a smooth line can be drawn connecting these points then these curves do represent a family. All curves that fit within this family are plotted on this graph, the slopes of which should steepen as the maximum density increases. Another line is plotted through the 80% optimum moisture point of each curve. When individual density test are taken on an ODOT project a single point, dry density and moisture, is calculated using the material dug up from under the gauge. This point is plotted on the family of curves graph, and must between the top and bottom curves and within the 80% to 100% moisture lines. If this one point plots above or below the family of curves, complete a new curve using the excavated material. If this one point doesn’t plot within the 80% to 100% moisture lines, adjust the moisture content of the sample until it does fit. If both criteria are met a curved line is drawn from this plotted one point to the maximum density line of the family resembling the curves above and below. This intersection then becomes the maximum dry density and optimum moisture for the individual density test taken. Sometimes projects have only one or two curves and in these cases, as long as the one point plots within 2 lbs/ft3 for density and 2% for moisture on an existing curve and it meets the guidelines for selecting a single curve, that curve may be used.
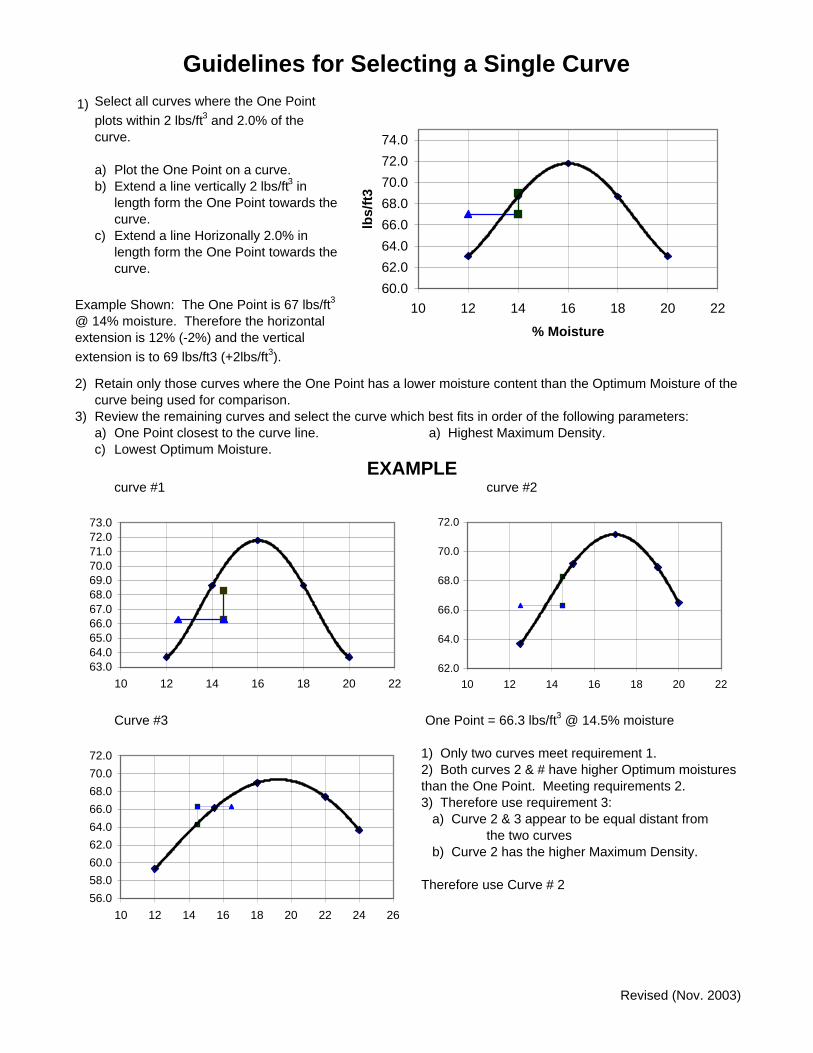
Guidelines for Selecting a Single Curve1)
a)b)
c)
2)
3)a)c)
curve #1 curve #2
Curve #3
1) Only two curves meet requirement 1.
3) Therefore use requirement 3: a) Curve 2 & 3 appear to be equal distant from
the two curves b) Curve 2 has the higher Maximum Density.
Therefore use Curve # 2
2) Both curves 2 & # have higher Optimum moistures than the One Point. Meeting requirements 2.
Extend a line vertically 2 lbs/ft3 in length form the One Point towards the curve.Extend a line Horizonally 2.0% in length form the One Point towards the curve.
Example Shown: The One Point is 67 lbs/ft3
@ 14% moisture. Therefore the horizontal extension is 12% (-2%) and the vertical extension is to 69 lbs/ft3 (+2lbs/ft3).
One Point = 66.3 lbs/ft3 @ 14.5% moisture
Lowest Optimum Moisture.EXAMPLE
Retain only those curves where the One Point has a lower moisture content than the Optimum Moisture of the curve being used for comparison.
a) Highest Maximum Density.Review the remaining curves and select the curve which best fits in order of the following parameters:
One Point closest to the curve line.
Select all curves where the One Point plots within 2 lbs/ft3 and 2.0% of the curve.
Plot the One Point on a curve.
60.062.064.066.068.070.072.074.0
10 12 14 16 18 20 22
% Moisture
lbs/
ft3
63.064.065.066.067.068.069.070.071.072.073.0
10 12 14 16 18 20 2262.0
64.0
66.0
68.0
70.0
72.0
10 12 14 16 18 20 22
56.058.060.062.064.066.068.070.072.0
10 12 14 16 18 20 22 24 26
Revised (Nov. 2003)
I N T E R O F F I C E M E M O
TECHNICAL SERVICESConstruction Section
Office Phone: (503) 986-3000Fax Number: (503) 986-3096
DATE: October 31, 2006 TO: All Holders of the Manual of Field Test Procedures File Code: SECTION: Test Procedure AASHTO T 283
The Oregon Department of Transportation has specified method(s) for this Test Procedure. Please observe the following for our projects: Preparation of Lab-Mixed, Lab Compacted Specimens • Section 6.4, Do not perform the 2-hr cooling and 16-hr loose mix curing required by
this section. After mixing place mixture in the specified pans and follow the steps in Section 6.5.
• Section 6.5, Compact each specimen to the required air void range. • Section 6.6, Delete requirement for storage of 24 +/- 3 hours at room temperature.
Instead, allow the compacted specimens to completely cool to room temperature (no longer than 24 hours). Then proceed to Section 9.
Preparation of Field-Mixed, Lab compacted Specimens
• Section 7.5, Delete requirement for storing specimens at 24 +/- 3 hours at room
temperature. Instead allow compacted specimens too completely cool to room temperature (no longer than 24 hours). Then proceed to Section 9.
Grouping of test Specimens for Conditioning • Test Sample with 6 Specimens:
1. Of the initial 6 specimens; select the specimen with highest air voids and the specimen with the lowest air voids and designate them “Wet”
2. Of the remaining 4 specimens; select the specimen with highest air voids and the specimen with the lowest air voids and designate them “Dry”
(See Next Page)
ODOT TM 323(06) 2
Test Procedure AASHTO T 283 Continued
3. Of the remaining 2 specimens; select the specimen with the lowest air voids and designate it “Wet”. The remaining specimen is designated “Dry”
• Test Sample with 8 Specimens:
1. Of the initial 8 specimens; select the specimen with highest air voids and the specimen with the lowest air voids and designate them “Wet”
2. Of the remaining 6 specimens; select the specimen with highest air voids and the specimen with the lowest air voids and designate them “Dry”
3. Of the remaining 4 specimens; select the specimen with highest air voids and the specimen with the lowest air voids and designate them “Wet”
4. The remaining 2 specimens are designated “Dry” All Specimens • Section 10.3.7, Delete this section. Freeze-thaw conditioning is not required.

Resistance of Compacted Asphalt Mixtures to Moisture-Induced Damage
AASHTO Designation: T 283-03
AASHTO TEST METHODS CANNOT BE INCLUDED ON ODOT’S WEBSITE DUE TO COPYRIGHT INFRINGEMENT. TO GET COPIES OF THE TEST METHODS, YOU CAN ORDER A HARD COPY OF ODOT’S MANUAL OF FIELD TEST PROCEDURES OR YOU CAN ORDER THE LATEST STANDARD SPECIFICATIONS FOR TRANSPORTATION MATERIALS AND METHODS OF SAMPLING AND TESTING FROM AASHTO. ORDERING INSTRUCTIONS ARE GIVEN BELOW: To order ODOT’s Manual of Field Test Procedures, use the following web address: http://www.odot.state.or.us/ffp/cs/opo/contractor_plans/ManualSubmitOrder.htm To order AASHTO’s Standard Specifications for Transportation Materials and Methods of Sampling and Testing, use the following web address: https://bookstore.transportation.org/

THIS PAGE INTENTIONALLY LEFT BLANK
I N T E R O F F I C E M E M O
TECHNICAL SERVICESConstruction Section
Office Phone: (503) 986-3000Fax Number: (503) 986-3096
DATE: October 31, 2005 TO: All Holders of the Manual of Field Test Procedures File Code: SECTION: Test Procedure AASHTO T 308
The Oregon Department of Transportation has specified method(s) for this Test Procedure. Please observe the following for our projects:
• Under Apparatus, Method A and Method B – An ignition furnace using Infra-Red elements is allowed. An Infra-Red furnace is not required to maintain a 578°C temperature.
• When using the Infra-Red furnace, for Methods A and B for step 1 the 538°C does not apply.
• Under Test Procedures, Method A and Method B steps 1, when a furnace using Infra-Red elements is used, turn on and warm up the furnace for a minimum of 30 minutes before performing a test. Also, for Infra-Red furnaces use the same “burn profile” for the production samples as used for the calibration samples. This is normally the default burn profile setting.
• All other requirements of the test procedure apply to the Infra-Red furnace. • For Test Procedure Method A and Method B, external scale measurements
taken at approximately the same temperature (+- 10C (25F) are required for the initial and final mass determinations. Loss from the printed tickets shall not be used.
• Delete Correction Factors Section. Perform calibration of Ignition Furnace according to ODOT TM 323.
• For Test Procedure Method B, replace step 7, 45 min burn time with 60 minute burn time. Delete steps 10 thru 14.
• Compute the percent binder based on the following calculations and conditions: (See Next Page)
(Continued)
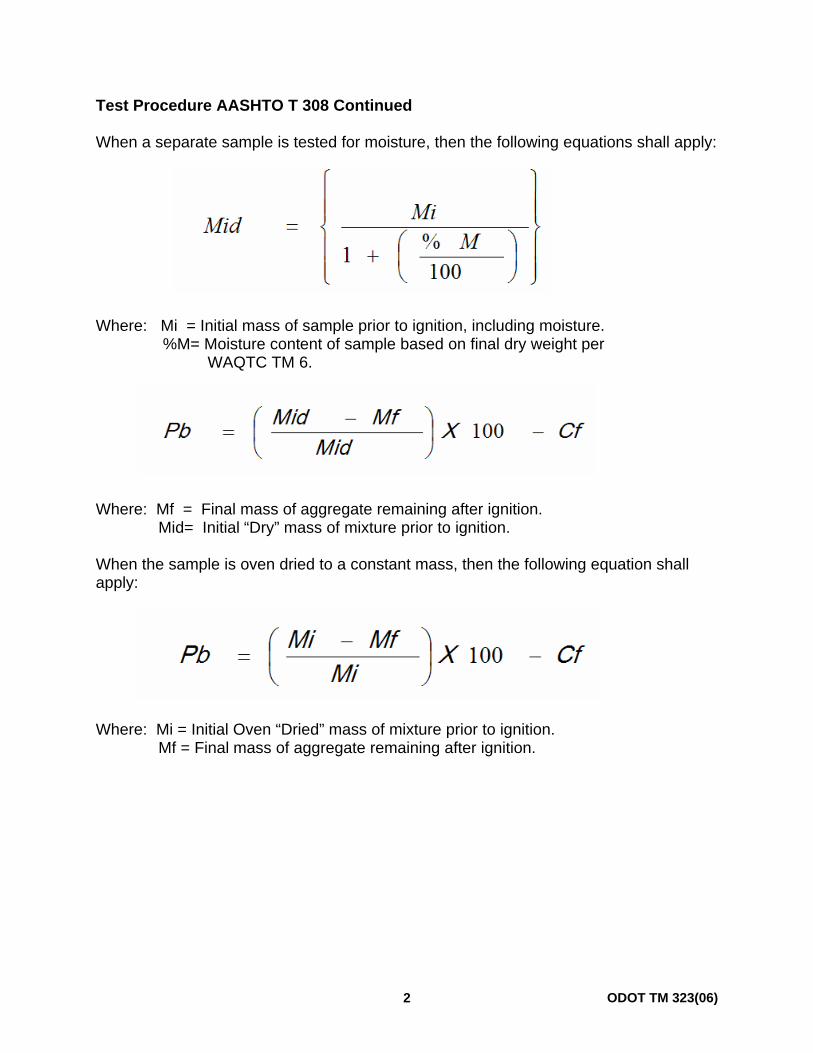
ODOT TM 323(06) 2
Test Procedure AASHTO T 308 Continued When a separate sample is tested for moisture, then the following equations shall apply: Where: Mi = Initial mass of sample prior to ignition, including moisture. %M= Moisture content of sample based on final dry weight per WAQTC TM 6. Where: Mf = Final mass of aggregate remaining after ignition. Mid= Initial “Dry” mass of mixture prior to ignition. When the sample is oven dried to a constant mass, then the following equation shall apply: Where: Mi = Initial Oven “Dried” mass of mixture prior to ignition. Mf = Final mass of aggregate remaining after ignition.
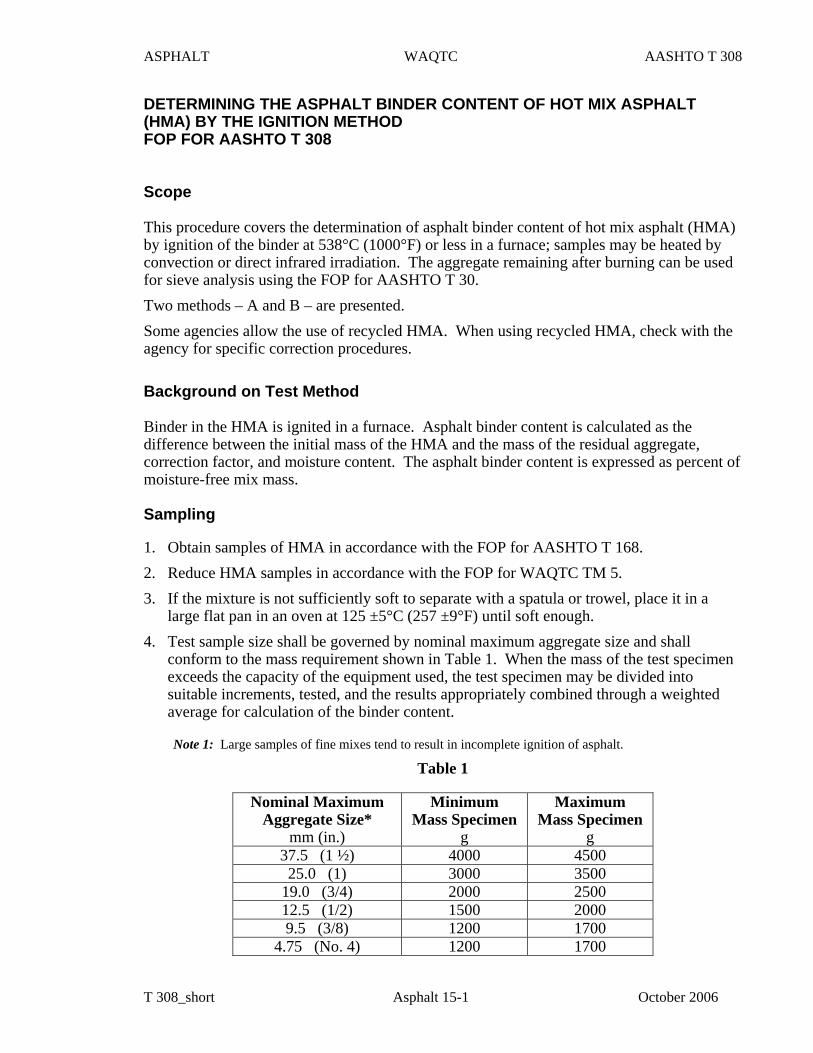
ASPHALT WAQTC AASHTO T 308
T 308_short Asphalt 15-1 October 2006
DETERMINING THE ASPHALT BINDER CONTENT OF HOT MIX ASPHALT (HMA) BY THE IGNITION METHOD FOP FOR AASHTO T 308 Scope This procedure covers the determination of asphalt binder content of hot mix asphalt (HMA) by ignition of the binder at 538°C (1000°F) or less in a furnace; samples may be heated by convection or direct infrared irradiation. The aggregate remaining after burning can be used for sieve analysis using the FOP for AASHTO T 30. Two methods – A and B – are presented. Some agencies allow the use of recycled HMA. When using recycled HMA, check with the agency for specific correction procedures. Background on Test Method Binder in the HMA is ignited in a furnace. Asphalt binder content is calculated as the difference between the initial mass of the HMA and the mass of the residual aggregate, correction factor, and moisture content. The asphalt binder content is expressed as percent of moisture-free mix mass. Sampling 1. Obtain samples of HMA in accordance with the FOP for AASHTO T 168. 2. Reduce HMA samples in accordance with the FOP for WAQTC TM 5. 3. If the mixture is not sufficiently soft to separate with a spatula or trowel, place it in a
large flat pan in an oven at 125 ±5°C (257 ±9°F) until soft enough. 4. Test sample size shall be governed by nominal maximum aggregate size and shall
conform to the mass requirement shown in Table 1. When the mass of the test specimen exceeds the capacity of the equipment used, the test specimen may be divided into suitable increments, tested, and the results appropriately combined through a weighted average for calculation of the binder content.
Note 1: Large samples of fine mixes tend to result in incomplete ignition of asphalt.
Table 1
Nominal Maximum Aggregate Size*
mm (in.)
Minimum Mass Specimen
g
Maximum Mass Specimen
g 37.5 (1 ½) 4000 4500 25.0 (1) 3000 3500
19.0 (3/4) 2000 2500 12.5 (1/2) 1500 2000 9.5 (3/8) 1200 1700
4.75 (No. 4) 1200 1700
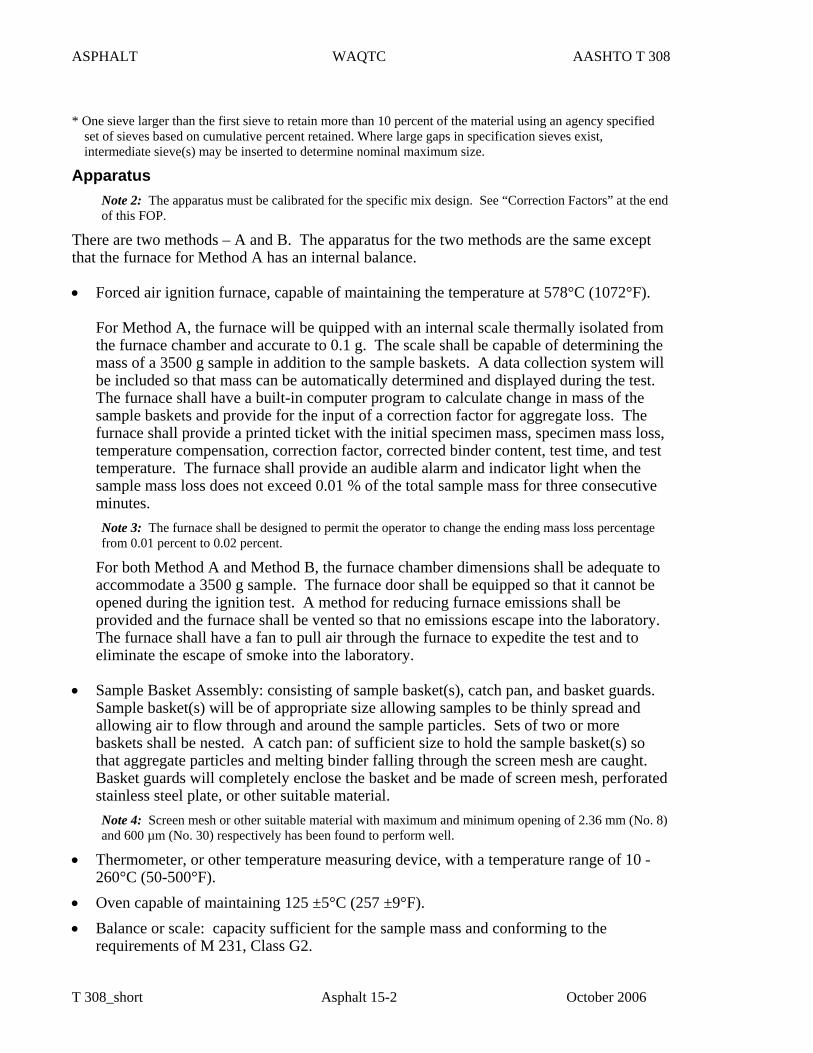
ASPHALT WAQTC AASHTO T 308
T 308_short Asphalt 15-2 October 2006
* One sieve larger than the first sieve to retain more than 10 percent of the material using an agency specified
set of sieves based on cumulative percent retained. Where large gaps in specification sieves exist, intermediate sieve(s) may be inserted to determine nominal maximum size.
Apparatus Note 2: The apparatus must be calibrated for the specific mix design. See “Correction Factors” at the end of this FOP.
There are two methods – A and B. The apparatus for the two methods are the same except that the furnace for Method A has an internal balance. • Forced air ignition furnace, capable of maintaining the temperature at 578°C (1072°F).
For Method A, the furnace will be quipped with an internal scale thermally isolated from the furnace chamber and accurate to 0.1 g. The scale shall be capable of determining the mass of a 3500 g sample in addition to the sample baskets. A data collection system will be included so that mass can be automatically determined and displayed during the test. The furnace shall have a built-in computer program to calculate change in mass of the sample baskets and provide for the input of a correction factor for aggregate loss. The furnace shall provide a printed ticket with the initial specimen mass, specimen mass loss, temperature compensation, correction factor, corrected binder content, test time, and test temperature. The furnace shall provide an audible alarm and indicator light when the sample mass loss does not exceed 0.01 % of the total sample mass for three consecutive minutes. Note 3: The furnace shall be designed to permit the operator to change the ending mass loss percentage from 0.01 percent to 0.02 percent.
For both Method A and Method B, the furnace chamber dimensions shall be adequate to accommodate a 3500 g sample. The furnace door shall be equipped so that it cannot be opened during the ignition test. A method for reducing furnace emissions shall be provided and the furnace shall be vented so that no emissions escape into the laboratory. The furnace shall have a fan to pull air through the furnace to expedite the test and to eliminate the escape of smoke into the laboratory.
• Sample Basket Assembly: consisting of sample basket(s), catch pan, and basket guards. Sample basket(s) will be of appropriate size allowing samples to be thinly spread and allowing air to flow through and around the sample particles. Sets of two or more baskets shall be nested. A catch pan: of sufficient size to hold the sample basket(s) so that aggregate particles and melting binder falling through the screen mesh are caught. Basket guards will completely enclose the basket and be made of screen mesh, perforated stainless steel plate, or other suitable material. Note 4: Screen mesh or other suitable material with maximum and minimum opening of 2.36 mm (No. 8) and 600 µm (No. 30) respectively has been found to perform well.
• Thermometer, or other temperature measuring device, with a temperature range of 10 -260°C (50-500°F).
• Oven capable of maintaining 125 ±5°C (257 ±9°F). • Balance or scale: capacity sufficient for the sample mass and conforming to the
requirements of M 231, Class G2.
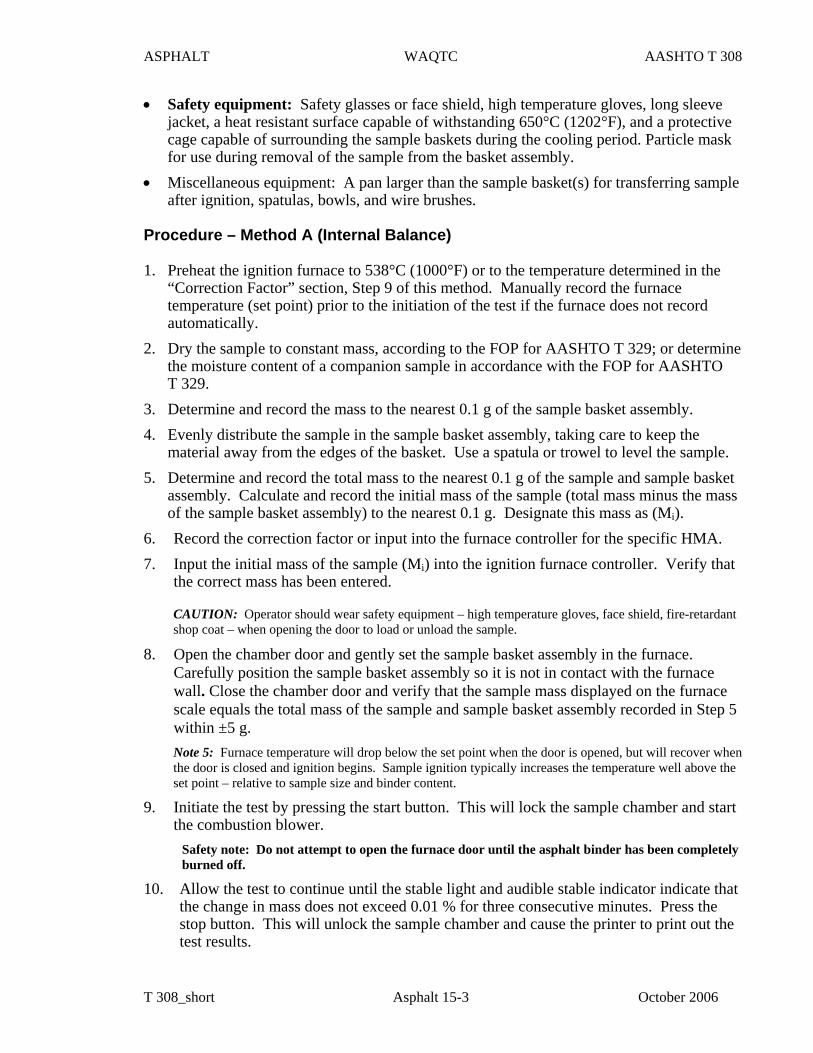
ASPHALT WAQTC AASHTO T 308
T 308_short Asphalt 15-3 October 2006
• Safety equipment: Safety glasses or face shield, high temperature gloves, long sleeve jacket, a heat resistant surface capable of withstanding 650°C (1202°F), and a protective cage capable of surrounding the sample baskets during the cooling period. Particle mask for use during removal of the sample from the basket assembly.
• Miscellaneous equipment: A pan larger than the sample basket(s) for transferring sample after ignition, spatulas, bowls, and wire brushes.
Procedure – Method A (Internal Balance) 1. Preheat the ignition furnace to 538°C (1000°F) or to the temperature determined in the
“Correction Factor” section, Step 9 of this method. Manually record the furnace temperature (set point) prior to the initiation of the test if the furnace does not record automatically.
2. Dry the sample to constant mass, according to the FOP for AASHTO T 329; or determine the moisture content of a companion sample in accordance with the FOP for AASHTO T 329.
3. Determine and record the mass to the nearest 0.1 g of the sample basket assembly. 4. Evenly distribute the sample in the sample basket assembly, taking care to keep the
material away from the edges of the basket. Use a spatula or trowel to level the sample. 5. Determine and record the total mass to the nearest 0.1 g of the sample and sample basket
assembly. Calculate and record the initial mass of the sample (total mass minus the mass of the sample basket assembly) to the nearest 0.1 g. Designate this mass as (Mi).
6. Record the correction factor or input into the furnace controller for the specific HMA. 7. Input the initial mass of the sample (Mi) into the ignition furnace controller. Verify that
the correct mass has been entered.
CAUTION: Operator should wear safety equipment – high temperature gloves, face shield, fire-retardant shop coat – when opening the door to load or unload the sample.
8. Open the chamber door and gently set the sample basket assembly in the furnace. Carefully position the sample basket assembly so it is not in contact with the furnace wall. Close the chamber door and verify that the sample mass displayed on the furnace scale equals the total mass of the sample and sample basket assembly recorded in Step 5 within ±5 g. Note 5: Furnace temperature will drop below the set point when the door is opened, but will recover when the door is closed and ignition begins. Sample ignition typically increases the temperature well above the set point – relative to sample size and binder content.
9. Initiate the test by pressing the start button. This will lock the sample chamber and start the combustion blower.
Safety note: Do not attempt to open the furnace door until the asphalt binder has been completely burned off.
10. Allow the test to continue until the stable light and audible stable indicator indicate that the change in mass does not exceed 0.01 % for three consecutive minutes. Press the stop button. This will unlock the sample chamber and cause the printer to print out the test results.
ASPHALT WAQTC AASHTO T 308
T 308_short Asphalt 15-4 October 2006
Note 6: An ending mass loss percentage of 0.02 may be used, if allowed by the agency, when aggregate that exhibits an excessive amount of loss during ignition testing is used.
11. Open the chamber door, remove the sample basket assembly, and place on the cooling plate or block. Place the protective cage over the sample basket assembly and allow it to cool to room temperature (approximately 30 minutes).
12. Determine and record the total after ignition mass to the nearest 0.1 g. Calculate and record the mass of the sample, after ignition (total after ignition mass minus the mass of the sample basket assembly) to the nearest 0.1 g. Designate this mass as Mf.
13. Use the asphalt binder content percentage from the printed ticket. If the sample was not oven dried and a moisture content percentage has been determined, subtract the moisture content from the printed ticket asphalt binder content and report the difference as the corrected asphalt binder content. Pb = BC – M –Cf (if not input in the furnace controller) where: Pb = the corrected asphalt binder content as a percent by mass of the HMA BC = asphalt binder content shown on printed ticket M = percent moisture content as determined by the FOP for AASHTO T 329 Cf = correction factor as a percent by mass of the HMA sample
14. Asphalt binder content percentage can also be calculated using the formula from “Method B” Step 16.
Procedure – Method B (External Balance) 1. Preheat the ignition furnace to 538°C (1000°F) or to the temperature determined in the
“Correction Factor” section Step 9. Manually record the furnace temperature (set point) prior to the initiation of the test if the furnace does not record automatically.
2. Dry the sample to constant mass, according to the FOP for AASHTO T 329; or determine the moisture content of a companion sample in accordance with the FOP for AASHTO T 329.
3. Determine and record the mass to the nearest 0.1 g of the sample basket assembly. 4. Place the sample basket(s) in the catch pan. Evenly distribute the sample in the sample
basket(s), taking care to keep the material away from the edges of the basket. Use a spatula or trowel to level the sample.
5. Determine and record the total mass to the nearest 0.1 g of the sample and sample basket assembly. Calculate and record the initial mass of the sample (total mass minus the mass of the sample basket assembly) to the nearest 0.1 g. Designate this mass as (Mi ).
6. Record the correction factor for the specific HMA. 7. Open the chamber door and gently set the sample basket assembly in the furnace.
Carefully position the sample basket assembly so it is not in contact with the furnace wall. Burn the HMA sample in the furnace for 45 minutes or the length of time determined in “Correction Factor” section.
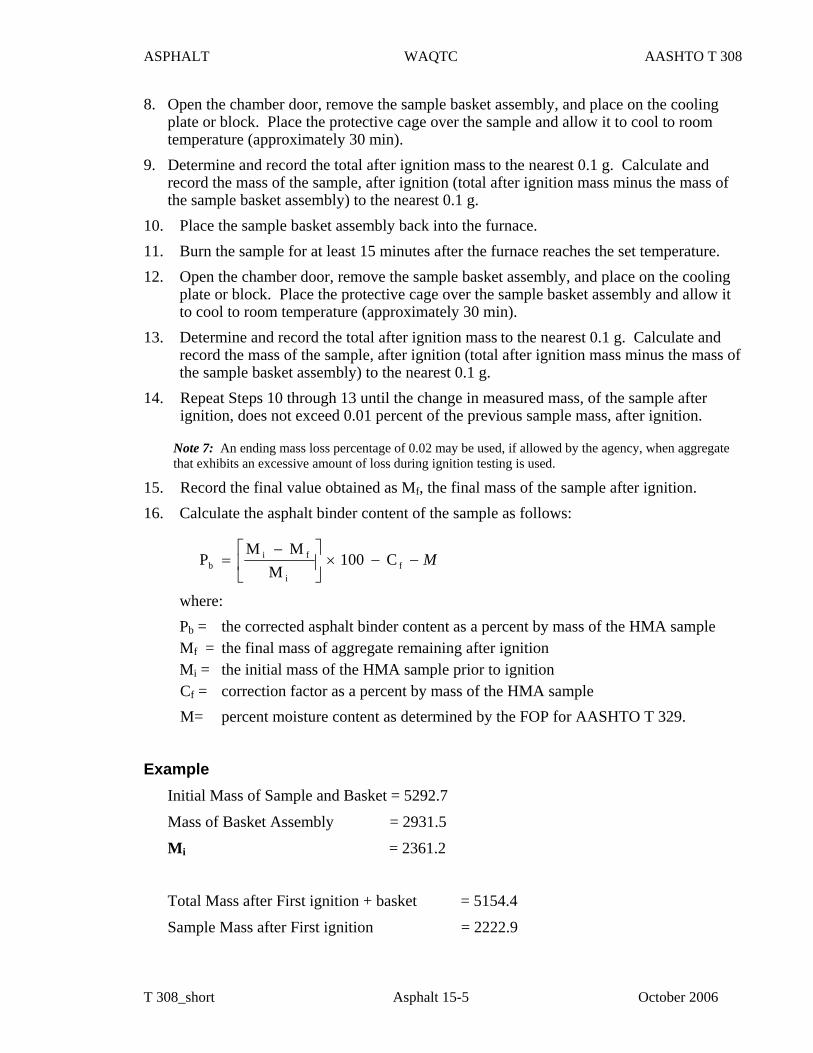
ASPHALT WAQTC AASHTO T 308
T 308_short Asphalt 15-5 October 2006
8. Open the chamber door, remove the sample basket assembly, and place on the cooling plate or block. Place the protective cage over the sample and allow it to cool to room temperature (approximately 30 min).
9. Determine and record the total after ignition mass to the nearest 0.1 g. Calculate and record the mass of the sample, after ignition (total after ignition mass minus the mass of the sample basket assembly) to the nearest 0.1 g.
10. Place the sample basket assembly back into the furnace. 11. Burn the sample for at least 15 minutes after the furnace reaches the set temperature. 12. Open the chamber door, remove the sample basket assembly, and place on the cooling
plate or block. Place the protective cage over the sample basket assembly and allow it to cool to room temperature (approximately 30 min).
13. Determine and record the total after ignition mass to the nearest 0.1 g. Calculate and record the mass of the sample, after ignition (total after ignition mass minus the mass of the sample basket assembly) to the nearest 0.1 g.
14. Repeat Steps 10 through 13 until the change in measured mass, of the sample after ignition, does not exceed 0.01 percent of the previous sample mass, after ignition.
Note 7: An ending mass loss percentage of 0.02 may be used, if allowed by the agency, when aggregate that exhibits an excessive amount of loss during ignition testing is used.
15. Record the final value obtained as Mf, the final mass of the sample after ignition. 16. Calculate the asphalt binder content of the sample as follows:
where: Pb = the corrected asphalt binder content as a percent by mass of the HMA sample Mf = the final mass of aggregate remaining after ignition Mi = the initial mass of the HMA sample prior to ignition Cf = correction factor as a percent by mass of the HMA sample M= percent moisture content as determined by the FOP for AASHTO T 329.
Example Initial Mass of Sample and Basket = 5292.7
Mass of Basket Assembly = 2931.5
Mi = 2361.2
Total Mass after First ignition + basket = 5154.4
Sample Mass after First ignition = 2222.9
M−−×⎥⎦
⎤⎢⎣
⎡ −= f
i
fib C100
MMM
P
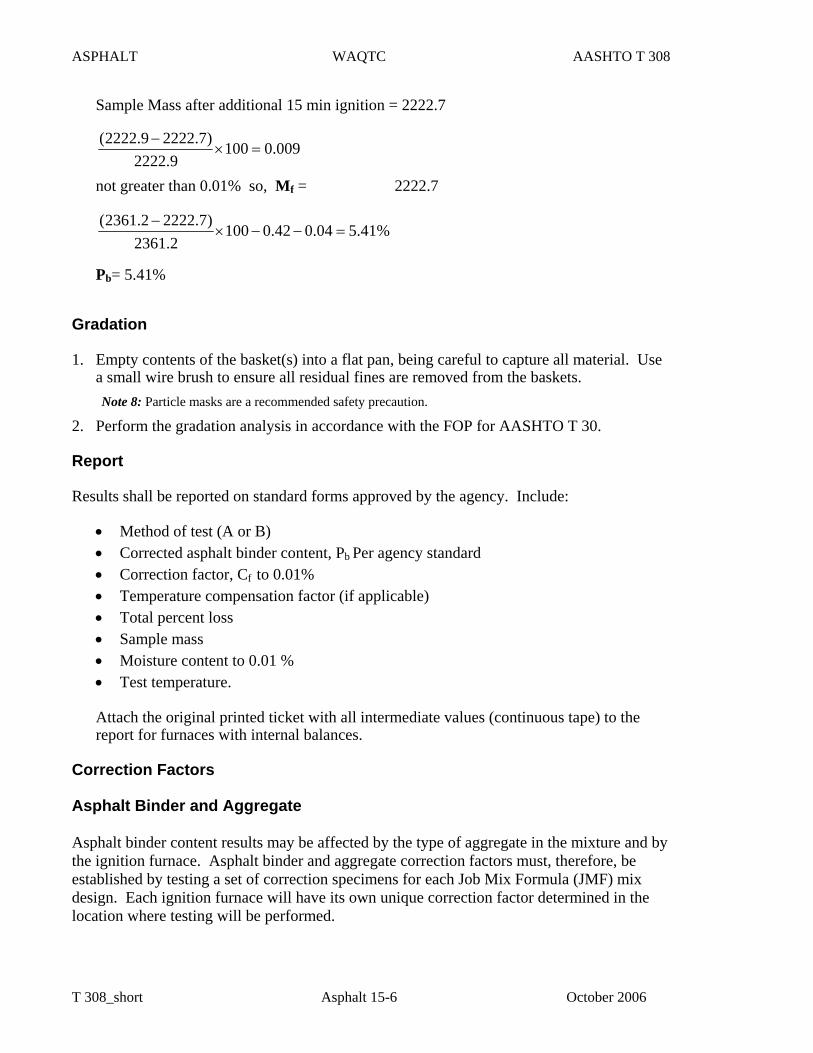
ASPHALT WAQTC AASHTO T 308
T 308_short Asphalt 15-6 October 2006
Sample Mass after additional 15 min ignition = 2222.7
009.01009.2222
)7.22229.2222(=×
−
not greater than 0.01% so, Mf = 2222.7
%41.504.042.01002.2361
)7.22222.2361(=−−×
−
Pb= 5.41%
Gradation 1. Empty contents of the basket(s) into a flat pan, being careful to capture all material. Use
a small wire brush to ensure all residual fines are removed from the baskets. Note 8: Particle masks are a recommended safety precaution.
2. Perform the gradation analysis in accordance with the FOP for AASHTO T 30. Report Results shall be reported on standard forms approved by the agency. Include:
• Method of test (A or B) • Corrected asphalt binder content, Pb Per agency standard • Correction factor, Cf to 0.01% • Temperature compensation factor (if applicable) • Total percent loss • Sample mass • Moisture content to 0.01 % • Test temperature.
Attach the original printed ticket with all intermediate values (continuous tape) to the report for furnaces with internal balances.
Correction Factors Asphalt Binder and Aggregate
Asphalt binder content results may be affected by the type of aggregate in the mixture and by the ignition furnace. Asphalt binder and aggregate correction factors must, therefore, be established by testing a set of correction specimens for each Job Mix Formula (JMF) mix design. Each ignition furnace will have its own unique correction factor determined in the location where testing will be performed.
ASPHALT WAQTC AASHTO T 308
T 308_short Asphalt 15-7 October 2006
This procedure must be performed before any acceptance testing is completed, and repeated each time there is a change in the mix ingredients or design. Any changes greater than 5% in stockpiled aggregate proportions should require a new correction factor.
All correction samples will be prepared by a central / regional laboratory unless otherwise directed. Asphalt binder correction factor: A correction factor must be established by testing a set of correction specimens for each Job Mix Formula (JMF). Certain aggregate types may result in unusually high correction factors (> 1.0%). Such mixes should be corrected and tested at a lower temperature as described below. Aggregate correction factor: Due to potential aggregate breakdown during the ignition process, a correction factor will need to be determined for the following conditions:
a. Aggregates that have a proven history of excessive breakdown b. Aggregate from an unknown source.
This correction factor will be used to adjust the acceptance gradation test results obtained according to the FOP for AASHTO T 30.
Procedure
1. Obtain samples of aggregate in accordance with the FOP for AASHTO T 2.
2. Obtain samples of asphalt binder in accordance with the FOP for AASHTO T 40.
Note #9: Include other additives that may be required by the JMF.
3. Prepare an initial, or “butter,” mix at the design asphalt binder content. Mix and discard the butter mix prior to mixing any of the correction specimens to ensure accurate asphalt content.
4. Prepare two correction specimens at the JMF design asphalt binder content. Aggregate used for correction specimens shall be sampled from material designated for use on the project. An agency approved method will be used to combine aggregate. An additional “blank” specimen shall be batched and tested for aggregate gradation in accordance with the FOP for AASHTO T 30. The gradation from the “blank” shall fall within the agency specified mix design tolerances.
5. Place the freshly mixed specimens directly into the sample basket assembly. If mixed specimens are allowed to cool prior to placement in the sample basket assembly, the specimens must be dried to constant mass according to the FOP for AASHTO T 329. Do not preheat the sample basket assembly.
6. Test the specimens in accordance with Method A or Method B of the procedure.
7. Once both of the correction specimens have been burned, determine the asphalt binder content for each specimen by calculation or from the printed oven tickets, if available.
8. If the difference between the asphalt binder contents of the two specimens exceeds 0.15%, repeat with two more specimens and, from the four results, discard the high and low result. Determine the correction factor from the two original or remaining
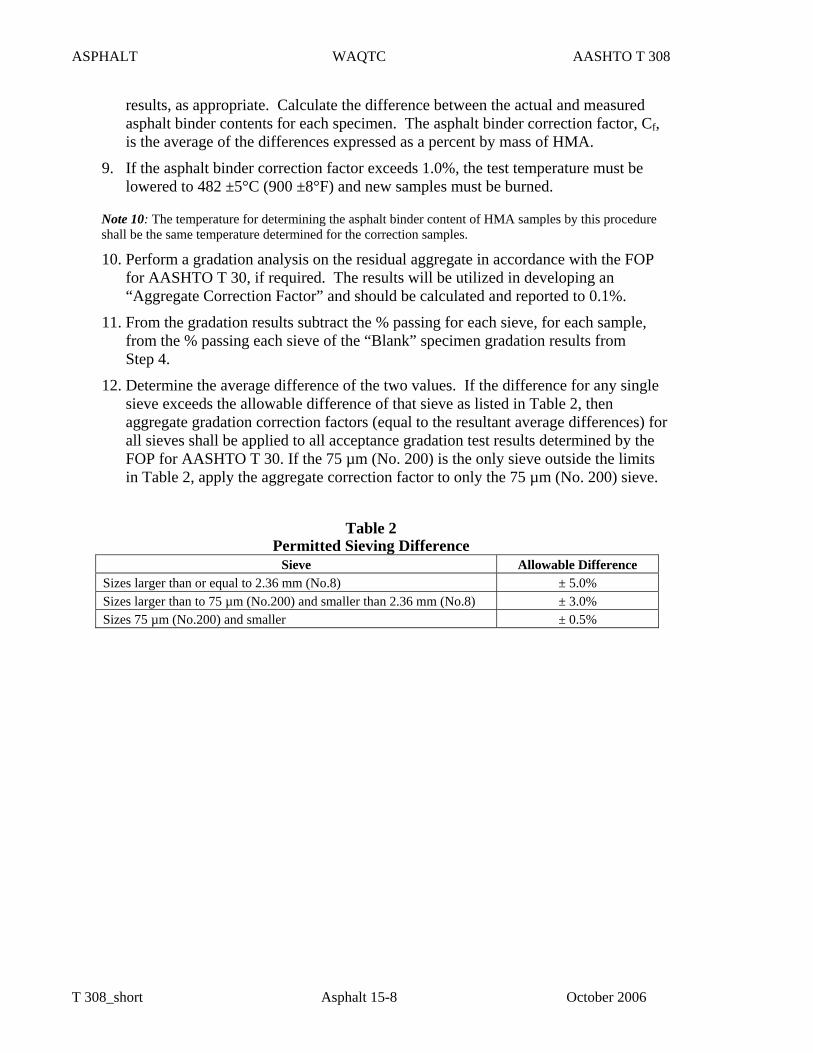
ASPHALT WAQTC AASHTO T 308
T 308_short Asphalt 15-8 October 2006
results, as appropriate. Calculate the difference between the actual and measured asphalt binder contents for each specimen. The asphalt binder correction factor, Cf, is the average of the differences expressed as a percent by mass of HMA.
9. If the asphalt binder correction factor exceeds 1.0%, the test temperature must be lowered to 482 ±5°C (900 ±8°F) and new samples must be burned.
Note 10: The temperature for determining the asphalt binder content of HMA samples by this procedure shall be the same temperature determined for the correction samples.
10. Perform a gradation analysis on the residual aggregate in accordance with the FOP for AASHTO T 30, if required. The results will be utilized in developing an “Aggregate Correction Factor” and should be calculated and reported to 0.1%.
11. From the gradation results subtract the % passing for each sieve, for each sample, from the % passing each sieve of the “Blank” specimen gradation results from Step 4.
12. Determine the average difference of the two values. If the difference for any single sieve exceeds the allowable difference of that sieve as listed in Table 2, then aggregate gradation correction factors (equal to the resultant average differences) for all sieves shall be applied to all acceptance gradation test results determined by the FOP for AASHTO T 30. If the 75 µm (No. 200) is the only sieve outside the limits in Table 2, apply the aggregate correction factor to only the 75 µm (No. 200) sieve.
Table 2 Permitted Sieving Difference
Sieve Allowable Difference Sizes larger than or equal to 2.36 mm (No.8) ± 5.0% Sizes larger than to 75 µm (No.200) and smaller than 2.36 mm (No.8) ± 3.0% Sizes 75 µm (No.200) and smaller ± 0.5%
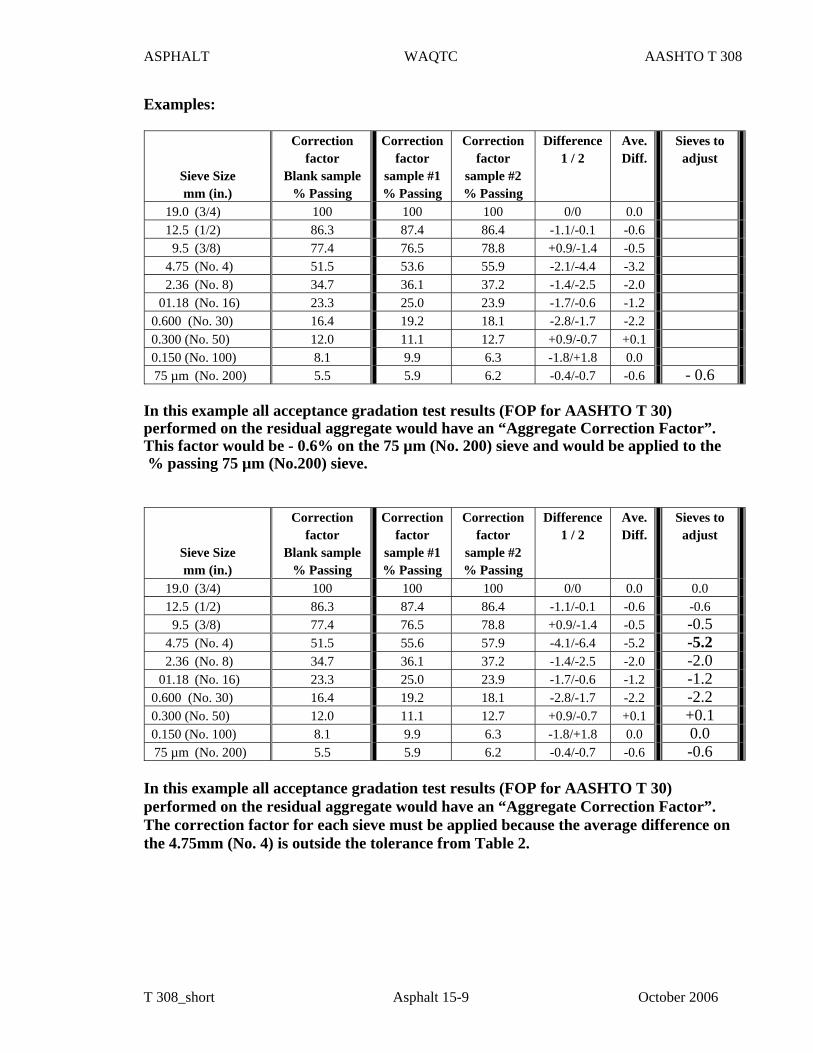
ASPHALT WAQTC AASHTO T 308
T 308_short Asphalt 15-9 October 2006
Examples:
Sieve Size mm (in.)
Correction factor
Blank sample % Passing
Correction factor
sample #1 % Passing
Correction factor
sample #2 % Passing
Difference 1 / 2
Ave. Diff.
Sieves to adjust
19.0 (3/4) 100 100 100 0/0 0.0 12.5 (1/2) 86.3 87.4 86.4 -1.1/-0.1 -0.6 9.5 (3/8) 77.4 76.5 78.8 +0.9/-1.4 -0.5 4.75 (No. 4) 51.5 53.6 55.9 -2.1/-4.4 -3.2 2.36 (No. 8) 34.7 36.1 37.2 -1.4/-2.5 -2.0 01.18 (No. 16) 23.3 25.0 23.9 -1.7/-0.6 -1.2 0.600 (No. 30) 16.4 19.2 18.1 -2.8/-1.7 -2.2 0.300 (No. 50) 12.0 11.1 12.7 +0.9/-0.7 +0.1 0.150 (No. 100) 8.1 9.9 6.3 -1.8/+1.8 0.0 75 µm (No. 200) 5.5 5.9 6.2 -0.4/-0.7 -0.6 - 0.6
In this example all acceptance gradation test results (FOP for AASHTO T 30) performed on the residual aggregate would have an “Aggregate Correction Factor”. This factor would be - 0.6% on the 75 µm (No. 200) sieve and would be applied to the % passing 75 µm (No.200) sieve.
Sieve Size mm (in.)
Correction factor
Blank sample % Passing
Correction factor
sample #1 % Passing
Correction factor
sample #2 % Passing
Difference 1 / 2
Ave. Diff.
Sieves to adjust
19.0 (3/4) 100 100 100 0/0 0.0 0.0 12.5 (1/2) 86.3 87.4 86.4 -1.1/-0.1 -0.6 -0.6 9.5 (3/8) 77.4 76.5 78.8 +0.9/-1.4 -0.5 -0.5 4.75 (No. 4) 51.5 55.6 57.9 -4.1/-6.4 -5.2 -5.2 2.36 (No. 8) 34.7 36.1 37.2 -1.4/-2.5 -2.0 -2.0 01.18 (No. 16) 23.3 25.0 23.9 -1.7/-0.6 -1.2 -1.2 0.600 (No. 30) 16.4 19.2 18.1 -2.8/-1.7 -2.2 -2.2 0.300 (No. 50) 12.0 11.1 12.7 +0.9/-0.7 +0.1 +0.1 0.150 (No. 100) 8.1 9.9 6.3 -1.8/+1.8 0.0 0.0 75 µm (No. 200) 5.5 5.9 6.2 -0.4/-0.7 -0.6 -0.6
In this example all acceptance gradation test results (FOP for AASHTO T 30) performed on the residual aggregate would have an “Aggregate Correction Factor”. The correction factor for each sieve must be applied because the average difference on the 4.75mm (No. 4) is outside the tolerance from Table 2.

ASPHALT WAQTC AASHTO T 308
T 308_short Asphalt 15-10 October 2006
THIS PAGE INTENTIONALLY LEFT BLANK
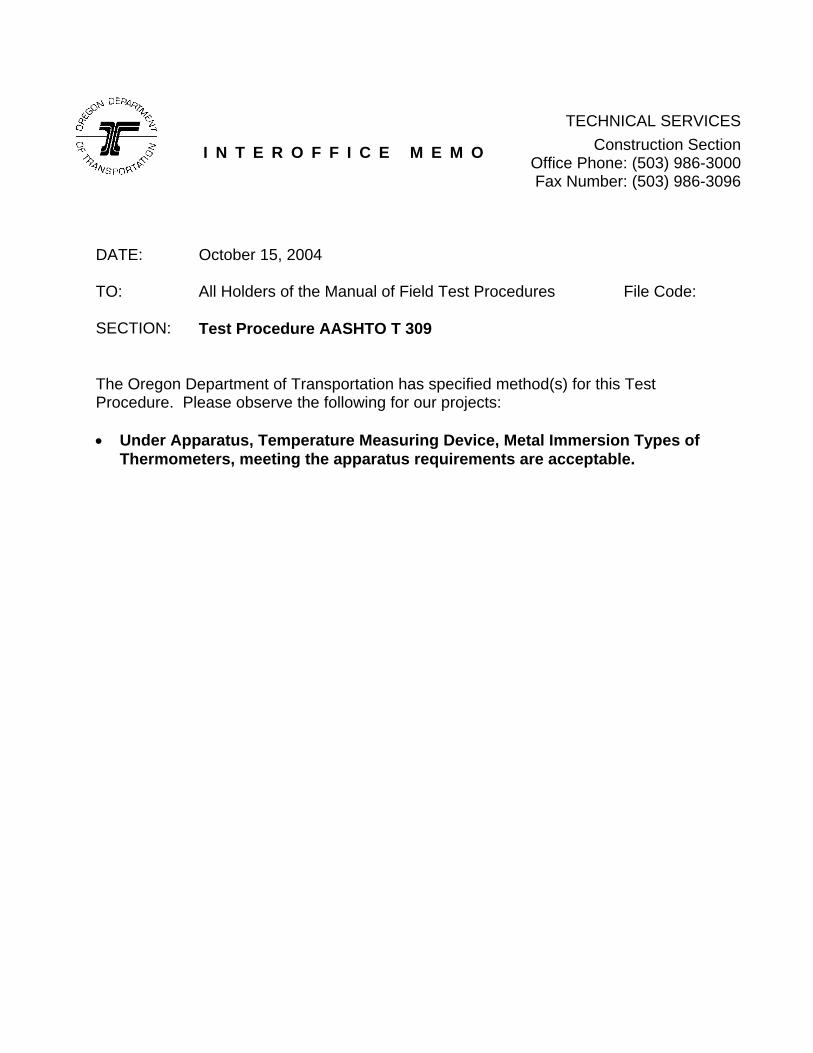
I N T E R O F F I C E M E M O
TECHNICAL SERVICESConstruction Section
Office Phone: (503) 986-3000Fax Number: (503) 986-3096
DATE: October 15, 2004 TO: All Holders of the Manual of Field Test Procedures File Code: SECTION: Test Procedure AASHTO T 309
The Oregon Department of Transportation has specified method(s) for this Test Procedure. Please observe the following for our projects: • Under Apparatus, Temperature Measuring Device, Metal Immersion Types of
Thermometers, meeting the apparatus requirements are acceptable.
CONCRETE WAQTC AASHTO T 309
T 309_short Concrete 10-1 October 2004
TEMPERATURE OF FRESHLY MIXED PORTLAND CEMENT CONCRETE FOP FOR AASHTO T 309 Scope This procedure covers the determination of the temperature of freshly mixed portland cement concrete in accordance with AASHTO T 309. Apparatus • Container — The container shall be made of nonabsorptive material and large enough to
provide at least 75 mm (3 in.) of concrete in all directions around the sensor; concrete cover must also be a least three times the nominal maximum size of the coarse aggregate.
• Temperature Measuring Device — The temperature measuring device shall be calibrated and capable of measuring the temperature of the freshly mixed concrete to ±0.5°C (±1°F) throughout the temperature range likely to be encountered. Partial immersion liquid-in-glass thermometers (and possibly other types) shall have a permanent mark to which the device must be immersed without applying a correction factor.
• Reference Temperature Measuring Device — The reference temperature measuring device shall be a liquid-in-glass thermometer readable to 0.2°C (0.5°F) that has been verified and calibrated. The calibration certificate or report indicating conformance to the requirements of ASTM E 77 shall be available for inspection.
Calibration of Temperature Measuring Device Each thermometer shall be verified for accuracy annually and whenever there is a question of accuracy. Calibration shall be performed by comparing readings on the temperature measuring device with another calibrated instrument at two temperatures at least 15°C or 27°F apart. Sample Locations and Times The temperature of freshly mixed concrete may be measured in the transporting equipment, in forms, or in sample containers, provided the sensor of the temperature measuring device has at least 75 mm (3 in.) of concrete cover in all direction around it. Complete the temperature measurement of the freshly mixed concrete within 5 minutes of obtaining the sample. Concrete containing aggregate of a nominal maximum size greater than 75 mm (3 in.) may require up to 20 minutes for the transfer of heat from the aggregate to the mortar after batching. Procedure 1. Dampen the sample container.
CONCRETE WAQTC AASHTO T 309
T 309_short Concrete 10-2 October 2004
2. Obtain the sample in accordance with the FOP for WAQTC TM 2. 3. Place sensor of the temperature measuring device in the freshly mixed concrete so that it
has at least 75 mm (3 in.) of concrete cover in all directions around it. 4. Gently press the concrete in around the sensor of the temperature measuring device at the
surface of the concrete so that air cannot reach the sensor. 5. Leave the sensor of the temperature measuring device in the freshly mixed concrete for a
minimum of two minutes, or until the temperature reading stabilizes. 6. Complete the temperature measurement of the freshly mixed concrete within 5 minutes of
obtaining the sample. 7. Read and record the temperature to the nearest 0.5°C (1°F). Report Results shall be reported on standard forms approved for use by the agency. Record the measured temperature of the freshly mixed concrete to the nearest 0.5°C (1°F).

THIS PAGE INTENTIONALLY LEFT BLANK

CONCRETE WAQTC AASHTO T 309
T 309_short Concrete 10-1 October 2004
TEMPERATURE OF FRESHLY MIXED PORTLAND CEMENT CONCRETE FOP FOR AASHTO T 309 Scope This procedure covers the determination of the temperature of freshly mixed portland cement concrete in accordance with AASHTO T 309. Apparatus • Container — The container shall be made of nonabsorptive material and large enough to
provide at least 75 mm (3 in.) of concrete in all directions around the sensor; concrete cover must also be a least three times the nominal maximum size of the coarse aggregate.
• Temperature Measuring Device — The temperature measuring device shall be calibrated and capable of measuring the temperature of the freshly mixed concrete to ±0.5°C (±1°F) throughout the temperature range likely to be encountered. Partial immersion liquid-in-glass thermometers (and possibly other types) shall have a permanent mark to which the device must be immersed without applying a correction factor.
• Reference Temperature Measuring Device — The reference temperature measuring device shall be a liquid-in-glass thermometer readable to 0.2°C (0.5°F) that has been verified and calibrated. The calibration certificate or report indicating conformance to the requirements of ASTM E 77 shall be available for inspection.
Calibration of Temperature Measuring Device Each thermometer shall be verified for accuracy annually and whenever there is a question of accuracy. Calibration shall be performed by comparing readings on the temperature measuring device with another calibrated instrument at two temperatures at least 15°C or 27°F apart. Sample Locations and Times The temperature of freshly mixed concrete may be measured in the transporting equipment, in forms, or in sample containers, provided the sensor of the temperature measuring device has at least 75 mm (3 in.) of concrete cover in all direction around it. Complete the temperature measurement of the freshly mixed concrete within 5 minutes of obtaining the sample. Concrete containing aggregate of a nominal maximum size greater than 75 mm (3 in.) may require up to 20 minutes for the transfer of heat from the aggregate to the mortar after batching. Procedure 1. Dampen the sample container.
CONCRETE WAQTC AASHTO T 309
T 309_short Concrete 10-2 October 2004
2. Obtain the sample in accordance with the FOP for WAQTC TM 2. 3. Place sensor of the temperature measuring device in the freshly mixed concrete so that it
has at least 75 mm (3 in.) of concrete cover in all directions around it. 4. Gently press the concrete in around the sensor of the temperature measuring device at the
surface of the concrete so that air cannot reach the sensor. 5. Leave the sensor of the temperature measuring device in the freshly mixed concrete for a
minimum of two minutes, or until the temperature reading stabilizes. 6. Complete the temperature measurement of the freshly mixed concrete within 5 minutes of
obtaining the sample. 7. Read and record the temperature to the nearest 0.5°C (1°F). Report Results shall be reported on standard forms approved for use by the agency. Record the measured temperature of the freshly mixed concrete to the nearest 0.5°C (1°F).
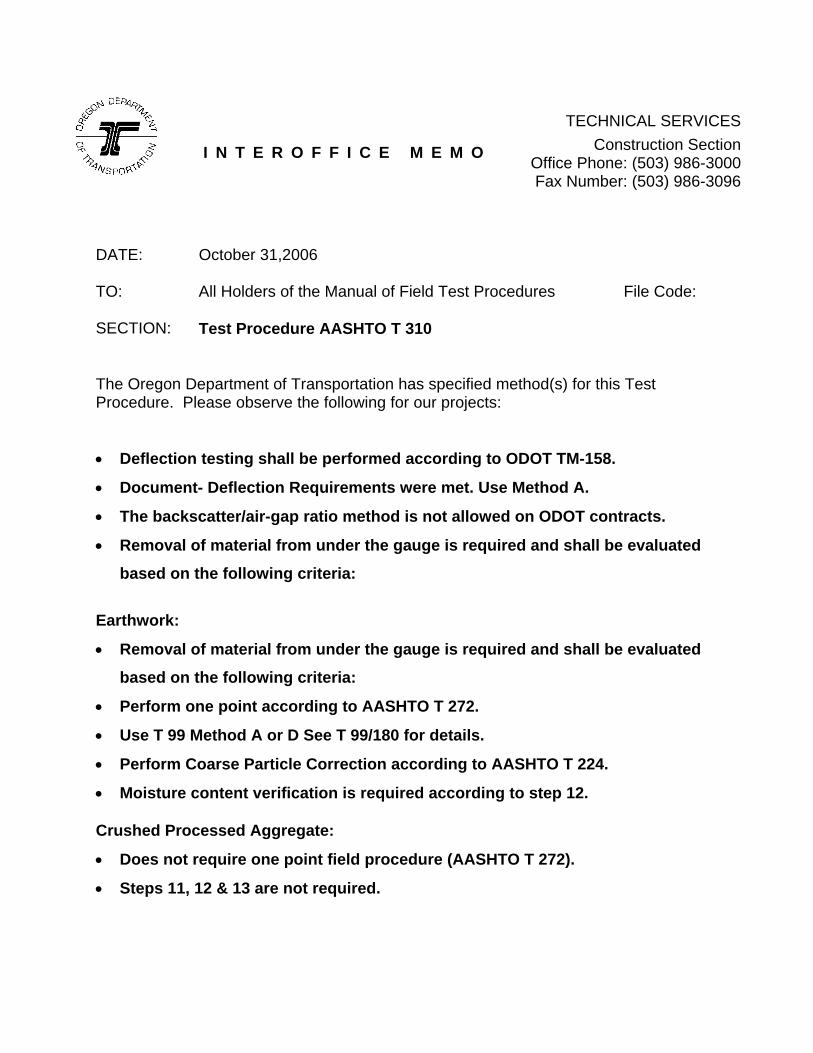
I N T E R O F F I C E M E M O
TECHNICAL SERVICESConstruction Section
Office Phone: (503) 986-3000Fax Number: (503) 986-3096
DATE: October 31,2006 TO: All Holders of the Manual of Field Test Procedures File Code: SECTION: Test Procedure AASHTO T 310
The Oregon Department of Transportation has specified method(s) for this Test Procedure. Please observe the following for our projects: • Deflection testing shall be performed according to ODOT TM-158.
• Document- Deflection Requirements were met. Use Method A.
• The backscatter/air-gap ratio method is not allowed on ODOT contracts.
• Removal of material from under the gauge is required and shall be evaluated
based on the following criteria:
Earthwork:
• Removal of material from under the gauge is required and shall be evaluated
based on the following criteria:
• Perform one point according to AASHTO T 272.
• Use T 99 Method A or D See T 99/180 for details.
• Perform Coarse Particle Correction according to AASHTO T 224.
• Moisture content verification is required according to step 12. Crushed Processed Aggregate:
• Does not require one point field procedure (AASHTO T 272).
• Steps 11, 12 & 13 are not required.

THIS PAGE INTENTIONALLY LEFT BLANK
EMBANKMENT AND BASE WAQTC AASHTO T 310 IN-PLACE DENSITY
T310_short E&B/ID 25-1 October 2005
IN-PLACE DENSITY AND MOISTURE CONTENT OF SOIL AND SOIL-AGGREGATE BY NUCLEAR METHODS (SHALLOW DEPTH) FOP FOR AASHTO T 310 Scope This procedure covers the determination of density, moisture content, and relative compaction of soil, aggregate, and soil-aggregate mixes in accordance with AASHTO T 310. This field operating procedure is derived from AASHTO T 310. The nuclear moisture-density gauge is used in the direct transmission mode. Apparatus • Nuclear density gauge with the factory matched standard reference block. • Drive pin, guide/scraper plate, and hammer for testing in direct transmission mode. • Transport case for properly shipping and housing the gauge and tools. • Instruction manual for the specific make and model of gauge. • Radioactive materials information and calibration packet containing:
− Daily Standard Count Log. − Factory and Laboratory Calibration Data Sheet. − Leak Test Certificate. − Shippers Declaration for Dangerous Goods. − Procedure Memo for Storing, Transporting and Handling Nuclear Testing Equipment. − Other radioactive materials documentation as required by local regulatory
requirements. • Sealable airtight containers and utensils for moisture content determinations. Radiation Safety
This method does not purport to address all of the safety problems associated with its use. This test method involves potentially hazardous materials. The gauge utilizes radioactive materials that may be hazardous to the health of the user unless proper precautions are taken. Users of this gauge must become familiar with the applicable safety procedures and governmental regulations. All operators will be trained in radiation safety prior to operating nuclear density gauges. Some agencies require the use of personal monitoring devices such as a thermoluminescent dosimeter or film badge. Effective instructions together with routine safety procedures such as source leak tests, recording and evaluation of personal monitoring device data, etc., are a recommended part of the operation and storage of this gauge.
EMBANKMENT AND BASE WAQTC AASHTO T 310 IN-PLACE DENSITY
T310_short E&B/ID 25-2 October 2005
Calibration Calibrate the nuclear gauge as required by the agency. This calibration may be performed
by the agency using manufacturer’s recommended procedures or by other facilities approved by the agency. Verify or re-establish calibration curves, tables, or equivalent coefficients every 12 months.
Standardization 1. Turn the gauge on and allow it to stabilize (approximately 10 to 20 minutes) prior to
standardization. Leave the power on during the day’s testing. 2. Standardize the nuclear gauge at the construction site at the start of each day’s work and
as often as deemed necessary by the operator or agency. Daily variations in standard count shall not exceed the daily variations established by the manufacturer of the gauge. If the daily variations are exceeded after repeating the standardization procedure, the gauge should be repaired and or recalibrated.
3. Record the standard count for both density and moisture in the Daily Standard Count Log. The exact procedure for standard count is listed in the manufacturer’s Operators Manual.
Note 1: New standard counts may be necessary more than once a day. See agency requirements.
Overview There are two methods for determining in-place density of soil / soil aggregate mixtures. See agency requirements for method selection.
• Method A Single Direction • Method B Two Direction
Procedure 1. Select a test location(s) randomly and in accordance with agency requirements. Test
sites should be relatively smooth and flat and meet the following conditions: a. At least 10 m (30 ft) away from other sources of radioactivity b. At least 3 m (10 ft) away from large objects c. The test site should be at least 150 mm (6 in.) away from any vertical
projection, unless the gauge is corrected for trench wall effect. 2. Remove all loose and disturbed material, and remove additional material as necessary to
expose the top of the material to be tested. 3. Prepare a flat area sufficient in size to accommodate the gauge. Plane the area to a
smooth condition so as to obtain maximum contact between gauge and the material being tested. For Method B, the flat area must be sufficient to permit rotating the gauge 90 or 180 degrees about the source rod.
EMBANKMENT AND BASE WAQTC AASHTO T 310 IN-PLACE DENSITY
T310_short E&B/ID 25-3 October 2005
4. Fill in surface voids beneath the gauge with native fines passing the 4.75 mm (No. 4) sieve or finer. Smooth the surface with the guide plate or other suitable tool. The depth of the native fines filler should not exceed approximately 3 mm (1/8 in.).
5. Make a hole perpendicular to the prepared surface using the guide plate and drive pin. The hole shall be at least 50 mm (2 in.) deeper than the desired probe depth, and shall be aligned such that insertion of the probe will not cause the gauge to tilt from the plane of the prepared area. Remove the drive pin by pulling straight up and twisting the extraction tool.
6. Place the gauge on the prepared surface so the source rod can enter the hole without disturbing loose material.
7. Insert the probe in the hole and lower the source rod to the desired test depth using the handle and trigger mechanism.
8. Seat the gauge firmly by partially rotating it back and forth about the source rod. Ensure the gauge is seated flush against the surface by pressing down on the gauge corners, and making sure that the gauge does not rock.
9. Pull gently on the gauge to bring the side of the source rod nearest to the scaler/detector firmly against the side of the hole.
10. Perform one of the following per agency requirements: a. Method A Single Direction: Take a test consisting of the average of two, one
minute readings, and record both density and moisture data. The two wet density readings should be within 32 kg/m3 (2 lb/ft3) of each other. The average of the two wet densities and moisture contents will be used to compute dry density.
b. Method B Two Direction: Take a one-minute reading and record both density and moisture data. Rotate the gauge 90 degrees or 180, pivoting it around the source rod. Reseat the gauge by pulling gently on the gauge to bring the side of the source rod nearest to the scaler/detector firmly against the side of the hole and take one-minute reading. (In trench locations, rotate the gauge 180 degrees for the second test.) Some agencies require multiple one-minute readings in both directions. Analyze the density and moisture data. A valid test consists of wet density readings in both gauge positions that are within 50 kg/m3 (3 lb/ft3). If the tests do not agree within this limit, move to a new location. The average of the wet density and moisture contents will be used to compute dry density.
11. If required by the agency, obtain a representative sample of the material, 4 kg (9 lb) minimum, from directly beneath the gauge full depth of material tested. This sample will be used to verify moisture content and / or identify the correct density standard. Immediately seal the material to prevent loss of moisture. The material tested by direct transmission can be approximated by a cylinder of soil approximately 300 mm (12 in.) in diameter directly beneath the centerline of the radioactive source and detector. The height of the cylinder will be approximately the depth of measurement. When organic material or large aggregate is removed during this operation, disregard the test information and move to a new test site.
EMBANKMENT AND BASE WAQTC AASHTO T 310 IN-PLACE DENSITY
T310_short E&B/ID 25-4 October 2005
12. To verify the moisture content from the nuclear gauge, determine the moisture content with a representative portion of the material using the FOP for AASHTO T 255/T 265 or the FOP for AASHTO T 217. If the moisture content from the nuclear gauge is within ±1% the nuclear gauge readings can be accepted. Retain the remainder of the sample at its original moisture content for a one-point compaction test under the FOP for AASHTO T 272, or for gradation, if required.
Note 2: Example: A Gauge reading of 16.8% moisture and an oven dry of 17.7% are within the ±1% requirements. Moisture correlation curves will be developed according to agency guidelines. These curves should be reviewed and possibly redeveloped every 90 days.
13. Determine the dry density by one of the following. a. From nuclear gauge readings, compute by subtracting the mass (weight) of the
water (kg/m3 or lb/ft3) from the wet density (kg/m3 or lb/ft3) or compute using the % moisture by dividing wet density from the nuclear gauge by 1 + moisture content expressed as a decimal.
b. When verification is required and the nuclear gauge readings cannot be accepted, the moisture content is determined by the FOP for AASHTO T 255/T 265 or the FOP for AASHTO T 217, compute dry density by dividing wet density from the nuclear gauge by 1 + moisture content expressed as a decimal.
Percent Compaction • Percent compaction is determined by comparing the in-place dry density as determined
by this procedure to the appropriate agency density standard. For soil or soil-aggregate mixes, these are moisture-density curves developed using the FOP for AASHTO T 99/ T 180. When using curves developed by the FOP for AASHTO T 99 / T 180, it may be necessary to use the FOP for AASHTO T 224 and FOP for AASHTO T 272 to determine maximum density and moisture determinations. For coarse granular materials, the density standard may be density-gradation curves developed using a vibratory method such as AKDOT&PF’s ATM 212, ITD’s T 74, WSDOT’s TM 606, or WFLHD’s Humphrys.
See appropriate agency policies for use of density standards.
Calculation
Wet Density readings from gauge: 1963 kg/m3 (121.6 lb/ft3) 1993 kg/m3 (123.4 lb/ft3) Ave: 1978 kg/m3 (122.5 lb/ft3) Moisture readings from gauge: 14.2% & 15.4% = Ave 14.8% Moisture content from the FOP’s for AASHTO T 255/ T 265 or T 217: 15.9% Moisture content is greater than 1% different so the gauge moisture cannot be used.
EMBANKMENT AND BASE WAQTC AASHTO T 310 IN-PLACE DENSITY
T310_short E&B/ID 25-5 October 2005
Calculate the dry density as follows:
Where: ρd = Dry density, kg/m3 (lb/ft3) ρw = Wet density, kg/m3 (lb/ft3) w = Moisture content from the FOP’s for AASHTO T 255 / T 265 or T 217, as a
percentage
Corrected for moisture Dry Density: 1707 kg/m3 (105.7 lb/ft3) Report Results shall be reported on standard forms approved by the agency. Include the following information: • Location of test, elevation of surface, and thickness of layer tested. • Visual description of material tested. • Make, model and serial number of the nuclear moisture-density gauge. • Wet density. • Moisture content as a percent, by mass, of dry soil mass. • Dry density. • Standard density. • Percent compaction. • Name and signature of operator.
100100ww
d ×⎟⎟⎠
⎞⎜⎜⎝
⎛+
=ρ
ρ
⎟⎟⎟⎟
⎠
⎞
⎜⎜⎜⎜
⎝
⎛
+=
1100
wd w
ρρor
⎟⎟⎟⎟
⎠
⎞
⎜⎜⎜⎜
⎝
⎛
+=
1100
9.15/5.122/1978 33
dftlbormkgρ100
10015.9/5.122/1978 33
d ×⎟⎟⎠
⎞⎜⎜⎝
⎛+
=ftlbormkgρ

EMBANKMENT AND BASE WAQTC AASHTO T 310 IN-PLACE DENSITY
T310_short E&B/ID 25-6 October 2005
THIS PAGE INTENTIONALLY LEFT BLANK
I N T E R O F F I C E M E M O
TECHNICAL SERVICESConstruction Section
Office Phone: (503) 986-3000Fax Number: (503) 986-3096
DATE: October 31,2006 TO: All Holders of the Manual of Field Test Procedures File Code: SECTION: Test Procedure AASHTO T 329
The Oregon Department of Transportation has specified method(s) for this Test Procedure. Please observe the following for our projects:
• RAP moisture content shall be determined by this test method. • Report RAP moisture content to the nearest 0.1%.

ODOT TM 323(06) 2
ASPHALT WAQTC AASHTO T 329
T 329_short Asphalt 14-1 October 2006
MOISTURE CONTENT OF HOT MIX ASPHALT (HMA) BY OVEN METHOD FOP FOR AASHTO T 329 Scope This procedure covers the determination of moisture content of HMA in accordance with AASHTO T 329. Background on Test Method A test sample of HMA is dried in an oven. The moisture content is calculated by one of two methods depending upon agency standards. • When asphalt binder content is reported as a percent of the initial mass of HMA, moisture
content is reported as a percent of the initial, moist mass of mix. • When asphalt binder content is reported as a percent of the mass of aggregate, moisture
content is reported as a percent of the final, dry mass of mix. Apparatus • Balance or scale: 2 kg capacity, readable to 0.1 g conforming to AASHTO M 231. • Forced Draft, Ventilated, or Convection Oven: Capable of maintaining the temperature
surrounding the sample at 163 ±14°C (325 ±25°F). • Sample Container: Clean, dry, not affected by heat and of sufficient size to contain a test
sample without danger of spilling. • Thermometer or other suitable device with a temperature range of 10-260°C (50-500°F). Sample The test sample shall be obtained in accordance with AASHTO T 168, and reduced in accordance with WAQTC TM 5. The size of the test sample shall be a minimum of 1000 g. Procedure 1. Set the oven to a minimum of 105°C (221°F) but in no case should the Job Mix Formula
(JMF) mixing temperature be exceeded. 2. Determine and record the mass of the sample container including release media to the
nearest 0.1 g. 3. Place the test sample in the sample container. 4. Determine and record the temperature of the test sample. 5. Determine and record the total mass of the sample container and test sample to the
nearest 0.1 g.
ASPHALT WAQTC AASHTO T 329
T 329_short Asphalt 14-2 October 2006
6. Calculate the initial, moist mass (Mi) of the test sample by subtracting the mass of the sample container determined in Step 2 from total mass of the sample container and the test sample determined in Step 5.
7. Dry the test sample to a constant mass in the sample container. Note 1: Constant mass shall be defined as the mass at which further drying does not alter the mass by more than 0.05 percent. The sample shall be initially dried 90 minutes, and its mass determined at that time and at 30-minute intervals after that until a constant mass is reached.
8. Cool the sample container and test sample to ±7°C (15°F)of the temperature determined in Step 4.
9. Determine and record the total mass of the sample container and test sample to the nearest 0.1 g.
Note 2: Do not attempt to remove the test sample from the sample container for the purposes of determining mass.
10. Calculate the final, dry mass (Mf) of the test sample by subtracting the mass of the sample container determined in Step 2 from the total mass of the sample container and the test sample determined in Step 9.
Note 3: Moisture content and the number of samples in the oven will affect the rate of drying at any given time. Placing wet samples in the oven with nearly dry samples could affect the drying process.
Calculations Constant Mass:
Calculate constant mass using the following formula:
100% ×−
=p
np
MMM
Change
Where: Mp = previous mass measurement Mn = new mass measurement
Example: Mass of container: 232.6 g Mass of container after first drying cycle: 1361.8 g Mass, Mp, of possibly dry sample: 1361.8 g – 232.6 g = 1129.2 g Mass of container and dry sample after second drying cycle: 1360.4 g
Mass, Mn, of dry sample: 1360.4 g – 232.6 g = 1127.8 g
1002.1129
8.11272.1129%12.0 ×−
=
0.12% is not less than 0.05% so continue drying
Mass of container and dry sample after third drying cycle: 1359.9 g Mass, Mn, of dry sample: 1359.9g – 232.6g = 1127.3g
ASPHALT WAQTC AASHTO T 329
T 329_short Asphalt 14-3 October 2006
1008.1127
3.11278.1127%04.0 ×−
=
0.04% is less than 0.05% constant mass has been reached This mass becomes the Dry mass (Mf) for calculating the moisture content.
Moisture Content: Calculate the moisture content, as a percent, using one of the following two formulas. Percent of Initial, Moist Mass:
Where: Mi = initial, moist mass Mf = final, dry mass
Example: Mi = 1134.9 g Mf = 1127.3 g
Percent of Final, Dry Mass:
Where: Mi = initial, moist mass Mf = final, dry mass
Example: Mi = 1134.9 g Mf = 1127.3 g
Report Results shall be reported on standard forms approved for use by the agency. Report the moisture content to 0.01 percent.
010M
MMContentMoisture
f
fi ×−
=
%67.0,674.0100g3.1127
g.31127g1134.9ContentMoisture say=×−
=
010M
MMContentMoisture
i
fi ×−
=
%67.0,670.0100g9.1134
g3.1127g1134.9ContentMoisture say=×−
=

ASPHALT WAQTC AASHTO T 329
T 329_short Asphalt 14-4 October 2006
THIS PAGE INTENTIONALLY LEFT BLANK
I N T E R O F F I C E M E M O
TECHNICAL SERVICESConstruction Section
Office Phone: (503) 986-3000Fax Number: (503) 986-3096
DATE: October 15, 2004 TO: All Holders of the Manual of Field Test Procedures File Code: SECTION: Test Procedure AASHTO TP 61
The Oregon Department of Transportation has specified method(s) for this Test Procedure. Please observe the following for our projects: • Follow Method 2 (Individual Sieve Fracture Determination) for HMAC
aggregates. • Under Method 2, step c splitting or quartering is an option not a requirement.

ODOT TM 323(06) 2
AGGREGATE WAQTC AASHTO TP 61
TP61_short Aggregate 13-1 October 2006
DETERMINING THE PERCENTAGE OF FRACTURE IN COARSE AGGREGATE FOP FOR AASHTO TP 61 Scope This procedure covers the determination of the percentage, by mass, of a coarse aggregate (CA) sample that consists of fractured particles meeting specified requirements in accordance with AASHTO TP 61. In this procedure, a sample of aggregate is screened on the sieve separating CA and fine aggregate (FA). This sieve will be identified in the agency’s specifications, but might be the 4.75 mm (No. 4) sieve. CA particles are visually evaluated to determine conformance to the specified fracture. The percentage of conforming particles, by mass, is calculated for comparison to the specifications. Apparatus • Balance or scale: Capacity sufficient for the principle sample mass, accurate to
0.1 percent of the sample mass or readable to 0.1 g. Meets the requirements of AASHTO M 231
• Sieves, meeting requirements of AASHTO M 92. • Splitter, meeting the requirements of FOP for AASHTO T 248. Terminology 1. Fractured Face – An angular, rough, or broken surface of an aggregate particle created by
crushing or by other means. A face is considered a “Fractured Face” whenever one-half or more of the projected area, when viewed normal to that face, is fractured with sharp and well defined edges. This excludes small nicks.
2. Fractured particle – A particle of aggregate having at least the minimum number of fractured faces specified. (This is usually one or two.)
Sampling and Sample Preparation 1. Sample and reduce the aggregate in accordance with the FOPs for AASHTO T 2 and T
248. 2. When the specifications list only a total fracture percentage, the sample shall be prepared
in accordance with Method 1. When the specifications require that the fracture be counted and reported on each sieve, the sample shall be prepared in accordance with Method 2.
3. Method 1 - Combined Fracture Determination
a. Dry the sample sufficiently to obtain a clean separation of FA and CA material in the sieving operation.
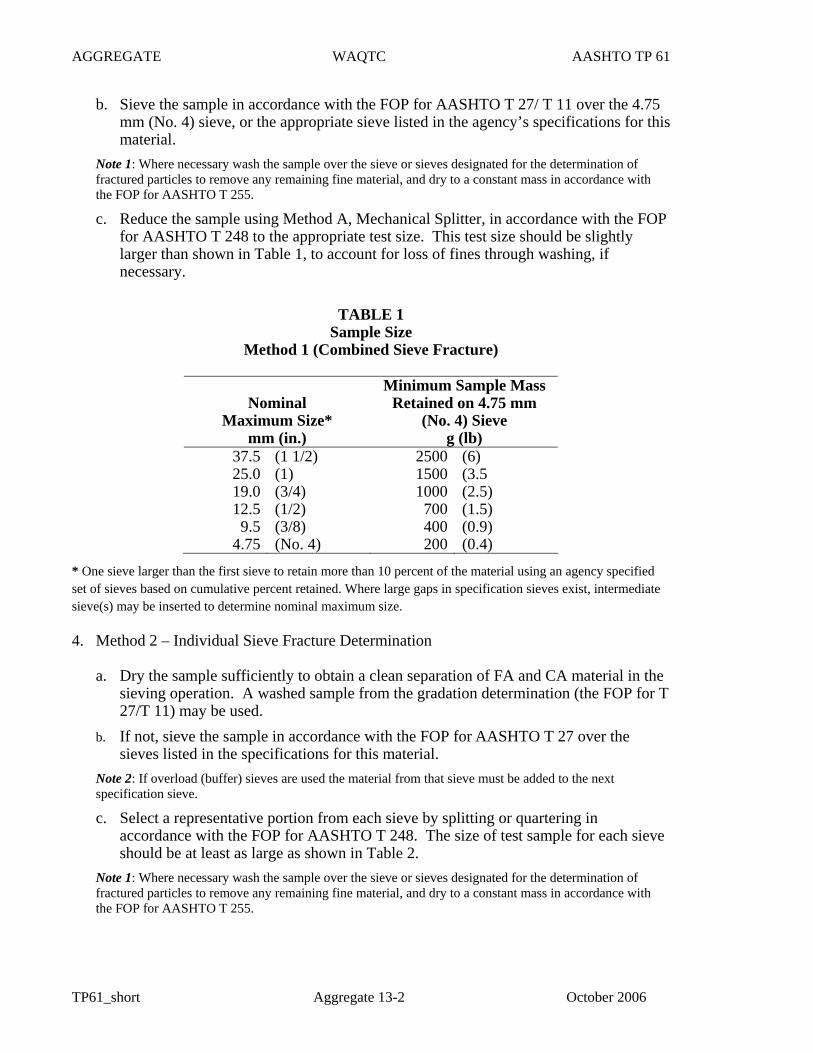
AGGREGATE WAQTC AASHTO TP 61
TP61_short Aggregate 13-2 October 2006
b. Sieve the sample in accordance with the FOP for AASHTO T 27/ T 11 over the 4.75 mm (No. 4) sieve, or the appropriate sieve listed in the agency’s specifications for this material.
Note 1: Where necessary wash the sample over the sieve or sieves designated for the determination of fractured particles to remove any remaining fine material, and dry to a constant mass in accordance with the FOP for AASHTO T 255.
c. Reduce the sample using Method A, Mechanical Splitter, in accordance with the FOP for AASHTO T 248 to the appropriate test size. This test size should be slightly larger than shown in Table 1, to account for loss of fines through washing, if necessary.
TABLE 1
Sample Size Method 1 (Combined Sieve Fracture)
Nominal Maximum Size*
mm (in.)
Minimum Sample Mass Retained on 4.75 mm
(No. 4) Sieve g (lb)
37.5 (1 1/2) 2500 (6) 25.0 (1) 1500 (3.5 19.0 (3/4) 1000 (2.5) 12.5 (1/2) 700 (1.5) 9.5 (3/8) 400 (0.9)
4.75 (No. 4) 200 (0.4) * One sieve larger than the first sieve to retain more than 10 percent of the material using an agency specified set of sieves based on cumulative percent retained. Where large gaps in specification sieves exist, intermediate sieve(s) may be inserted to determine nominal maximum size. 4. Method 2 – Individual Sieve Fracture Determination
a. Dry the sample sufficiently to obtain a clean separation of FA and CA material in the sieving operation. A washed sample from the gradation determination (the FOP for T 27/T 11) may be used.
b. If not, sieve the sample in accordance with the FOP for AASHTO T 27 over the sieves listed in the specifications for this material.
Note 2: If overload (buffer) sieves are used the material from that sieve must be added to the next specification sieve.
c. Select a representative portion from each sieve by splitting or quartering in accordance with the FOP for AASHTO T 248. The size of test sample for each sieve should be at least as large as shown in Table 2.
Note 1: Where necessary wash the sample over the sieve or sieves designated for the determination of fractured particles to remove any remaining fine material, and dry to a constant mass in accordance with the FOP for AASHTO T 255.
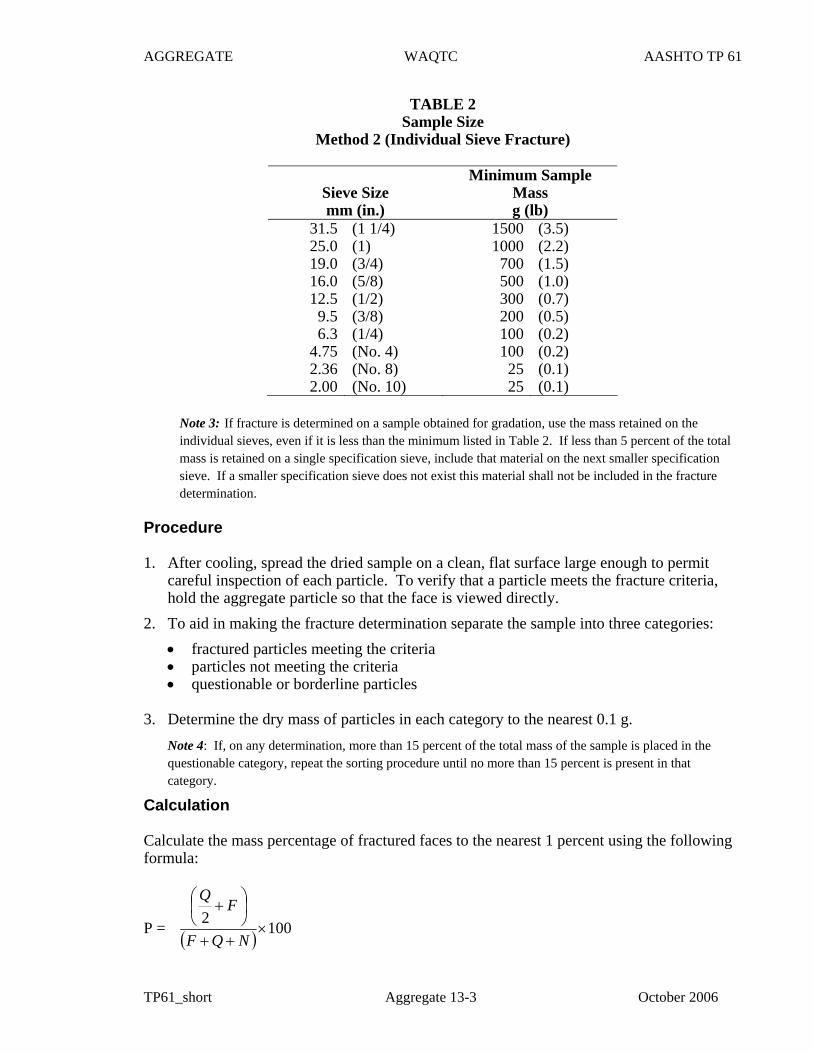
AGGREGATE WAQTC AASHTO TP 61
TP61_short Aggregate 13-3 October 2006
TABLE 2 Sample Size
Method 2 (Individual Sieve Fracture)
Sieve Size mm (in.)
Minimum Sample Mass g (lb)
31.5 (1 1/4) 1500 (3.5) 25.0 (1) 1000 (2.2) 19.0 (3/4) 700 (1.5) 16.0 (5/8) 500 (1.0) 12.5 (1/2) 300 (0.7) 9.5 (3/8) 200 (0.5) 6.3 (1/4) 100 (0.2)
4.75 (No. 4) 100 (0.2) 2.36 (No. 8) 25 (0.1) 2.00 (No. 10) 25 (0.1)
Note 3: If fracture is determined on a sample obtained for gradation, use the mass retained on the individual sieves, even if it is less than the minimum listed in Table 2. If less than 5 percent of the total mass is retained on a single specification sieve, include that material on the next smaller specification sieve. If a smaller specification sieve does not exist this material shall not be included in the fracture determination.
Procedure 1. After cooling, spread the dried sample on a clean, flat surface large enough to permit
careful inspection of each particle. To verify that a particle meets the fracture criteria, hold the aggregate particle so that the face is viewed directly.
2. To aid in making the fracture determination separate the sample into three categories: • fractured particles meeting the criteria • particles not meeting the criteria • questionable or borderline particles
3. Determine the dry mass of particles in each category to the nearest 0.1 g.
Note 4: If, on any determination, more than 15 percent of the total mass of the sample is placed in the questionable category, repeat the sorting procedure until no more than 15 percent is present in that category.
Calculation Calculate the mass percentage of fractured faces to the nearest 1 percent using the following formula:
P = ( ) 1002×
++
⎟⎠⎞
⎜⎝⎛ +
NQF
FQ
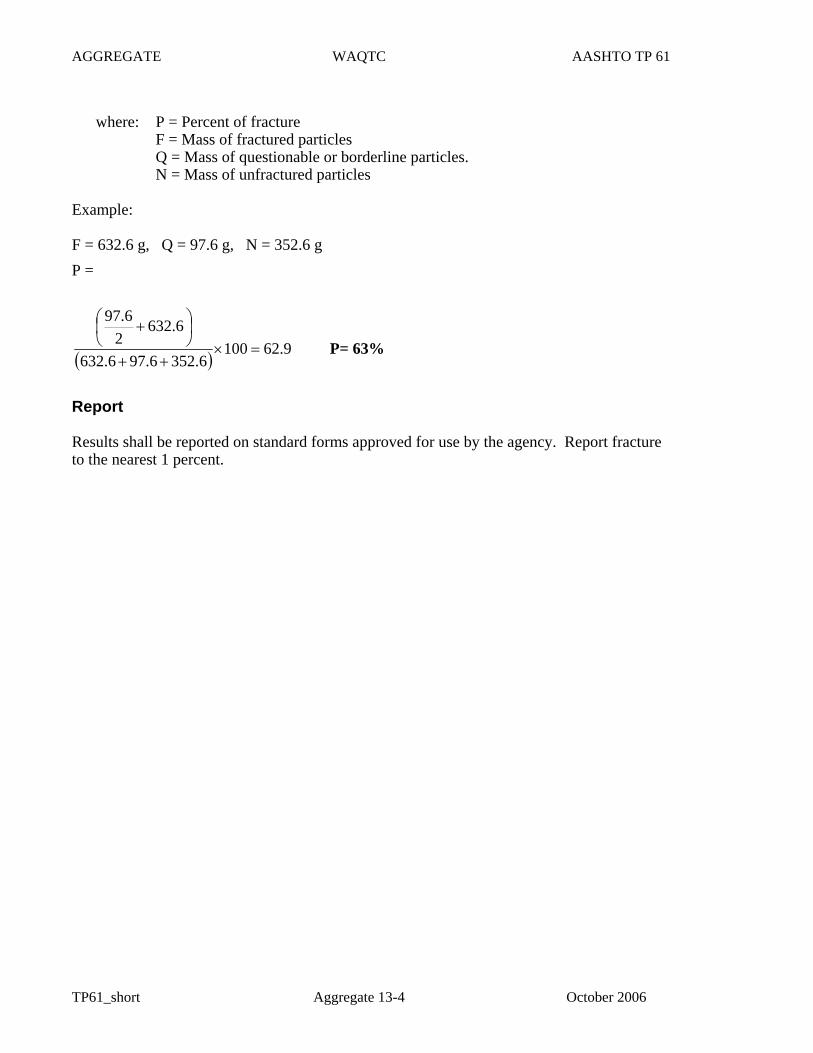
AGGREGATE WAQTC AASHTO TP 61
TP61_short Aggregate 13-4 October 2006
where: P = Percent of fracture F = Mass of fractured particles Q = Mass of questionable or borderline particles. N = Mass of unfractured particles Example: F = 632.6 g, Q = 97.6 g, N = 352.6 g P =
( ) 9.621006.3526.976.632
6.6322
6.97
=×++
⎟⎠⎞
⎜⎝⎛ +
P= 63%
Report Results shall be reported on standard forms approved for use by the agency. Report fracture to the nearest 1 percent.
CONCRETE WAQTC WAQTC TM 2
SAMPLING FRESHLY MIXED CONCRETE FOP FOR WAQTC TM 2 Scope This method covers procedures for obtaining representative samples of fresh concrete delivered to the project site and on which tests are to be performed to determine compliance with quality requirements of the specifications under which concrete is furnished. The method includes sampling from stationary, paving and truck mixers, and from agitating and non-agitating equipment used to transport central mixed concrete. Sampling concrete may involve hazardous materials, operations, and equipment. This standard does not purport to address all of the safety problems associated with its use. It is the responsibility of the user of this standard to establish appropriate safety and health practices. This method also covers the procedure for preparing a sample of concrete for further testing where it is necessary to remove aggregate larger than the designated size for the test method being performed. The removal of large aggregate particles is accomplished by wet sieving. Apparatus • Wheelbarrow • Cover for wheelbarrow (plastic, canvas, or burlap) • Buckets • Shovel • Cleaning equipment: including scrub brush, rubber gloves, water • Apparatus for wet sieving including a sieve or sieves conforming to AASHTO M92 of
suitable size and conveniently arranged and supported so that the sieve can be shaken rapidly by hand.
Procedure 1. Use every precaution in order to obtain samples representative of the true nature and
condition of the concrete being placed being careful not to obtain samples from the very first or very last portions of the batch. The size of the sample will be 1.5 times the volume of concrete required for the specified testing, but not less than 0.03 m3 (1 ft3).
Note 1: Sampling should normally be performed as the concrete is delivered from the mixer to the conveying vehicle used to transport the concrete to the forms; however, specifications may require other points of sampling, such as at the discharge of a concrete pump.
• Sampling from stationary mixers, except paving mixers
Sample the concrete after a minimum of 1/2 m3 (1/2 yd3) of concrete has been discharged. Perform sampling by passing a receptacle completely through the discharge stream, or by completely diverting the discharge into a sample container. Take care not to restrict the flow of concrete from the mixer, container, or transportation unit so as to cause segregation. These requirements apply to both tilting and nontilting mixers.
WAQTC_TM2_short Concrete 9-1 October 2004
CONCRETE WAQTC WAQTC TM 2
• Sampling from paving mixers
Sample after the contents of the paving mixer have been discharged. Obtain material from at least five different locations in the pile and combine into one test sample. Avoid contamination with subgrade material or prolonged contact with absorptive subgrade. To preclude contamination or absorption by the subgrade, the concrete may be sampled by placing a shallow container on the subgrade and discharging the concrete across the container.
• Sampling from revolving drum truck mixers or agitators Sample the concrete after a minimum of 1/2 m3 (1/2 yd3) of concrete has been discharged. Do not obtain samples until after all of the water has been added to the mixer. Do not obtain samples from the very first or last portions of the batch discharge. Sample by repeatedly passing a receptacle through the entire discharge stream or by completely diverting the discharge into a sample container. Regulate the rate of discharge of the batch by the rate of revolution of the drum and not by the size of the gate opening.
• Sampling from open-top truck mixers, agitators, non-agitating equipment or other types of open-top containers Sample by whichever of the procedures described above is most applicable under the given conditions.
• Sampling from pump or conveyor placement systems
Sample after a minimum of 1/2 m3 (1/2 yd3) of concrete has been discharged. Do not obtain samples until after all of the pump slurry has been eliminated. Sample by repeatedly passing a receptacle through the entire discharge system or by completely diverting the discharge into a sample container. Do not lower the pump arm from the placement position to ground level for ease of sampling, as it may modify the air content of the concrete being sampled. Do not obtain samples from the very first or last portions of the batch discharge.
2. Transport samples to the place where fresh concrete tests are to be performed and specimens are to be molded. They shall then be combined and remixed with a shovel the minimum amount necessary to ensure uniformity. Protect the sample from direct sunlight, wind, rain, and sources of contamination.
3. Complete test for temperature and start tests for slump and air content within 5 minutes of obtaining the sample. Complete tests as expeditiously as possible. Start molding specimens for strength tests within 15 minutes of obtaining the sample.
Wet Sieving When required for slump testing, air content testing or molding test specimens the concrete sample shall be wet-sieved, after transporting but prior to remixing, by the following.
1. Place the sieve designated by the test procedure over dampened sample container.
WAQTC_TM2_short Concrete 9-2 October 2004
CONCRETE WAQTC WAQTC TM 2
2. Pass the concrete over the designated sieve. Do not overload the sieve (one particle thick).
3. Shake or vibrate the sieve until no more material passes the sieve. A horizontal back and forth motion is preferred.
4. Discard oversize material including all adherent mortar.
5. Repeat until sample of sufficient size is obtained. Mortar adhering to the wet-sieving equipment shall be included with the sample.
6. Remix the sample with a shovel the minimum amount necessary to ensure uniformity.
Note 2: Wet-sieving is not allowed for samples being utilized for density determinations according to the FOP for AASHTO T 121.
WAQTC_TM2_short Concrete 9-3 October 2004

CONCRETE WAQTC WAQTC TM 2
THIS PAGE INTENTIONALLY LEFT BLANK
WAQTC_TM2_short Concrete 9-4 October 2004
I N T E R O F F I C E M E M O
TECHNICAL SERVICESConstruction Section
Office Phone: (503) 986-3000Fax Number: (503) 986-3096
DATE: November 1, 2003 TO: All Holders of the Manual of Field Test Procedures File Code: SECTION: Test Procedure WAQTC TM 5
The Oregon Department of Transportation has specified method(s) for this Test Procedure. Please observe the following for our projects:
• Under Procedure, Method A is not allowed, use Methods B or C for reducing HMAC samples or a combination of both methods can be utilized.
• If the sample as placed on the table initially is uniform as determined by the
technician, then mixing of the sample is not necessary.

ODOT TM 323(06) 2
ASPHALT WAQTC WAQTC TM 5
REDUCING SAMPLES OF HOT MIX ASPHALT TO TESTING SIZE FOP FOR WAQTC TM 5 Significance Samples of bituminous paving mixes taken in accordance with AASHTO T 168 are composites and are large to increase the likelihood that they are representative of the product being tested. Materials sampled in the field need to be reduced to appropriate sizes for testing. As a general rule, field samples should be of a size that splitting once will result in the required test sample size. It is extremely important that the procedure used to reduce the field sample not modify the material properties. Scope This method covers the procedure reducing samples of Hot Mixed Asphalt (HMA). The samples are to be acquired in accordance with AASHTO T 168 and the increments placed in an agency approved suitable container. The sample is to be representative of the average of the HMA being produced. Apparatus
• Flat-bottom scoop, • Non-stick splitting surface such as metal, paper, or heat-resistant plastic, • Large spatulas, trowels, metal straightedge or 12 in. dry wall taping knife, sheet metal
quartering device, • Thermostatically controlled oven capable of maintaining a temperature of at least
110°C (230°F) or high enough to heat the material to a pliable condition for splitting, • Miscellaneous equipment including trowel(s), spatula(s), hot plate, non-asbestos heat-
resistant gloves or mittens, pans, buckets, and cans. Sample Preparation The sample must be warm enough to separate. If not, warm in an oven until it is sufficiently soft to mix and separate easily. Do not exceed either the temperature or time limits specified in the test method(s) to be performed. Overview
• Large Samples • Method A: Loaf (Incremental) method • Method B: Quartering by apex • Method C: Quartering
Procedure
TM5_short Asphalt 13-1 October 2006
ASPHALT WAQTC WAQTC TM 5
Large Samples, samples over 35 kg (75 lb) 1. Heat the trowel(s), spatula(s), and splitting apparatus to approximately 110°C (230°F). 2. Place the sample on a surface where there will be neither loss of material nor the
accidental addition of foreign material. The surface may be covered with heavy paper or other suitable material. Remove the sample from the agency approved container by dumping into a conical pile.
3. Mix the material thoroughly by turning the entire sample over a minimum of four times.
With the last turning, form the entire sample into a conical pile. Mixing may be accomplished by turning the pile with a heated spatula or by rolling the material over with paper or other material used for the rolling surface. Make a visual observation to determine that the material is homogenous.
Note 1: Some HMA mixes are prone to segregation and manipulation of the material should be minimized. 4. Flatten the conical pile to a uniform thickness and diameter by pressing down with a hot
spatula or trowel. The diameter should be four to eight times the thickness. 5. Divide the flattened pile into four approximately equal quarters with a heated spatula,
trowel, flat metal plate, or sheet metal quartering splitter.
6. With the quartering device in place remove each quarter of the material and place in agency approved containers for testing, storage or shipment. Mark containers per the Sample Identification section.
7. Pay particular attention that excessive amounts of materials are not left on the splitting surface or splitting equipment.
8. When further reduction of the HMA is to be done at this time, reduce by using methods
A, B, and C. A combination of the reduction methods may be used if allowed by the agency.
Reduction to Test Size
Method A (Loaf / Incremental method)
1. Place the sample on a surface where there will be neither loss of material nor the accidental addition of foreign material. The surface may be covered with heavy paper, or other suitable material. Remove the sample from the agency approved containers by dumping into a conical pile.
2. Mix the sample thoroughly by turning the entire sample over a minimum of four times. Alternately lift each corner of the paper and pull it over the sample diagonally toward the opposite corner causing the material to be rolled. With the last turning, lift both opposite corners to form a conical pile. Make a visual observation to determine that the material is homogenous.
3. Grasp the paper, roll the material into a loaf and flatten the top.
TM5_short Asphalt 13-2 October 2006
ASPHALT WAQTC WAQTC TM 5
4. Pull the paper so at least ¼ of the length of the loaf is off the edge of the counter. Allow this material to drop into a container to be saved. As an alternate, using a straight edge, slice off approximately ¼ of the length of the loaf and place in a container to be saved.
5. Pull additional material (loaf) off the edge of the counter and drop the appropriate size sample into a sample pan or container. As an alternate, using a straight edge, slice off an appropriate size sample from the length of the loaf and place in a sample pan or container.
6. Repeat step 5 until the proper size sample has been acquired. Step 5 is to be repeated until all the samples for testing have been obtained.
Note 2 - When reducing the sample to test size it is advisable to take several small increments determining the mass each time until the proper minimum size is achieved. Unless the sample size is grossly in excess of the minimum or exceeds the maximum test size use the sample as reduced for the test.
Method B (Quartering by apex) 1. Place the sample on a surface where there will be neither loss of material nor the
accidental addition of foreign material. The surface may be covered with heavy paper, or other suitable material. Remove the sample from the containers by dumping into a conical pile.
2. Mix the sample thoroughly by turning the entire sample over a minimum of four times. Alternately lift each corner of the paper and pull it over the sample diagonally toward the opposite corner causing the material to be rolled. With the last turning, lift both opposite corners to form a conical pile. Make a visual observation to determine that the material is homogenous.
3. Flatten the conical pile to a uniform thickness and diameter by pressing down with a hot spatula or trowel. The diameter should be four to eight times the thickness.
4. Quarter the flattened pile using a quartering device or straightedge.
5. With the quartering device in place using a straightedge (taping knife) slice through the quarter of the HMA from the apex of the quarter to the outer edge. Pull or drag the material from the quarter holding one edge of the straightedge (taping knife) in contact with the quartering device. Two straight edges may be used in lieu of the quartering device.
6. Slide or scoop the material into a sample pan. Repeat step 5 removing a similar amount of material from the opposite quarter. Step 5 is to be repeated until all the samples for testing have been obtained.
Note 3- When reducing the sample to test size it is advisable to take several small increments determining the mass each time until the proper minimum size is achieved. Unless the sample size is grossly in excess of the minimum or exceeds the maximum test size use the sample as reduced for the test.
TM5_short Asphalt 13-3 October 2006
ASPHALT WAQTC WAQTC TM 5
Method C (Quartering) 1. Place the sample on a surface where there will be neither loss of material nor the
accidental addition of foreign material. The surface may be covered with heavy paper, or other suitable material. Remove the sample from the containers by dumping into a conical pile.
2. Mix the sample thoroughly by turning the entire sample over a minimum of four times. Alternately lift each corner of the paper and pull it over the sample diagonally toward the opposite corner causing the material to be rolled. With the last turning, lift both opposite corners to form a conical pile. Make a visual observation to determine that the material is homogenous.
3. Flatten the conical pile to a uniform thickness and diameter by pressing down with a hot spatula or trowel. The diameter should be four to eight times the thickness.
4. Quarter the flattened pile using a quartering device or straightedge.
5. Remove the opposite quarters saving the material for future use.
6. Repeat step 2 through 5 until the proper size sample has been achieved.
7. When additional test specimens are required, dump the removed material into a conical pile as in step 1 and repeat steps 2 through 6. This process may be repeated until sample has been reduced to testing size for all tests.
Sample Identification 1. Identify the sample as required by the agency.
2. Samples shall be submitted in agency approved containers and secured to prevent contamination and spillage.
3. The exact disposition of each quarter of the original field sample shall be determined by the agency.
TM5_short Asphalt 13-4 October 2006
I N T E R O F F I C E M E M O
TECHNICAL SERVICESConstruction Section
Office Phone: (503) 986-3000Fax Number: (503) 986-3096
DATE: October 17, 2005 TO: All Holders of the Manual of Field Test Procedures File Code: SECTION: Test Procedure WAQTC TM 8
The Oregon Department of Transportation has specified method(s) for this Test Procedure. Please observe the following for our projects: • For core correlation use the procedure shown in ODOT TM-327 and utilize
form 734-2327 for data collection. • Use the Backscatter Method, for ODOT contracts. • Under Backscatter Method, Step 1, filler material is defined as material
passing the No. 8 sieve or smaller and from the fines used to produce the Job Mix Formula.

ODOT TM 323(06) 2
ASPHALT WAQTC WAQTC TM8
IN-PLACE DENSITY OF BITUMINOUS MIXES USING THE NUCLEAR MOISTURE-DENSITY GAUGE FOP FOR WAQTC TM 8 Scope This test method describes a test procedure for determining the density of bituminous mixes by means of a nuclear gauge employing either direct transmission or backscatter methods. Correlation with densities determined under the FOP for AASHTO T 166 is required by some agencies. Apparatus • Nuclear density gauge with the factory matched standard reference block. • Drive pin, guide/scraper plate, and hammer for testing in direct transmission mode. • Transport case for properly shipping and housing the gauge and tools. • Instruction manual for the specific make and model of gauge. • Radioactive materials information and calibration packet containing:
− Daily Standard Count Log − Factory and Laboratory Calibration Data Sheet − Leak Test Certificate − Shippers Declaration for Dangerous Goods − Procedure Memo for Storing, Transporting and Handling Nuclear Testing Equipment − Other radioactive materials documentation as required by local regulatory
requirements. Material • Filler material: Fine graded sand from the source used to produce the asphalt pavement
or other agency approved materials. Radiation Safety
This method does not purport to address all of the safety problems associated with its use. This test method involves potentially hazardous materials. The gauge utilizes radioactive materials that may be hazardous to the health of the user unless proper precautions are taken. Users of this gauge must become familiar with the applicable safety procedures and governmental regulations. All operators will be trained in radiation safety prior to operating nuclear density gauges. Some agencies require the use of personal monitoring devices such as a thermoluminescent dosimeter or film badge. Effective instructions together with routine safety procedures such as source leak tests, recording and evaluation of personal monitoring device data, etc., are a recommended part of the operation and storage of this gauge.
WAQTC_TM8_short Asphalt 18-1 October 2006
ASPHALT WAQTC WAQTC TM8
Calibration Calibrate the nuclear gauge as required by the agency. This calibration may be performed
by the agency using manufacturer’s recommended procedures or by other facilities approved by the agency. Verify or re-establish calibration curves, tables, or equivalent coefficients every 12 months.
Standardization 1. Turn the gauge on and allow it to stabilize (approximately 10 to 20 minutes) prior to
standardization. Leave the power on during the day’s testing. 2. Standardize the nuclear gauge at the construction site at the start of each day’s work and
as often as deemed necessary by the operator or agency. Daily variations in standard count shall not exceed the daily variations established by the manufacturer of the gauge. If the daily variations are exceeded after repeating the standardization procedure, the gauge should be repaired and or recalibrated.
3. Record the standard count for both density and moisture in the Daily Standard Count Log. The exact procedure for standard count is listed in the manufacturer’s Operators Manual.
Note 1: New standard counts may be necessary more than once a day. See agency requirements. Test Site Location 1. Select a test location(s) randomly and in accordance with agency requirements. Test
sites should be relatively smooth and flat and meet the following conditions: a. At least 10 m (30 ft) away from other sources of radioactivity b. At least 3 m (10 ft) away from large objects c. If the gauge will be closer than 600 mm (24 in.) to any vertical mass, or less
than 300 mm (12 in.) from a vertical pavement edge, use the gauge manufacturer’s correction procedure.
Overview There are two methods for determining in-place density of HMA. See agency requirements for method selection.
• Direct Transmission • Backscatter
WAQTC_TM8_short Asphalt 18-2 October 2006
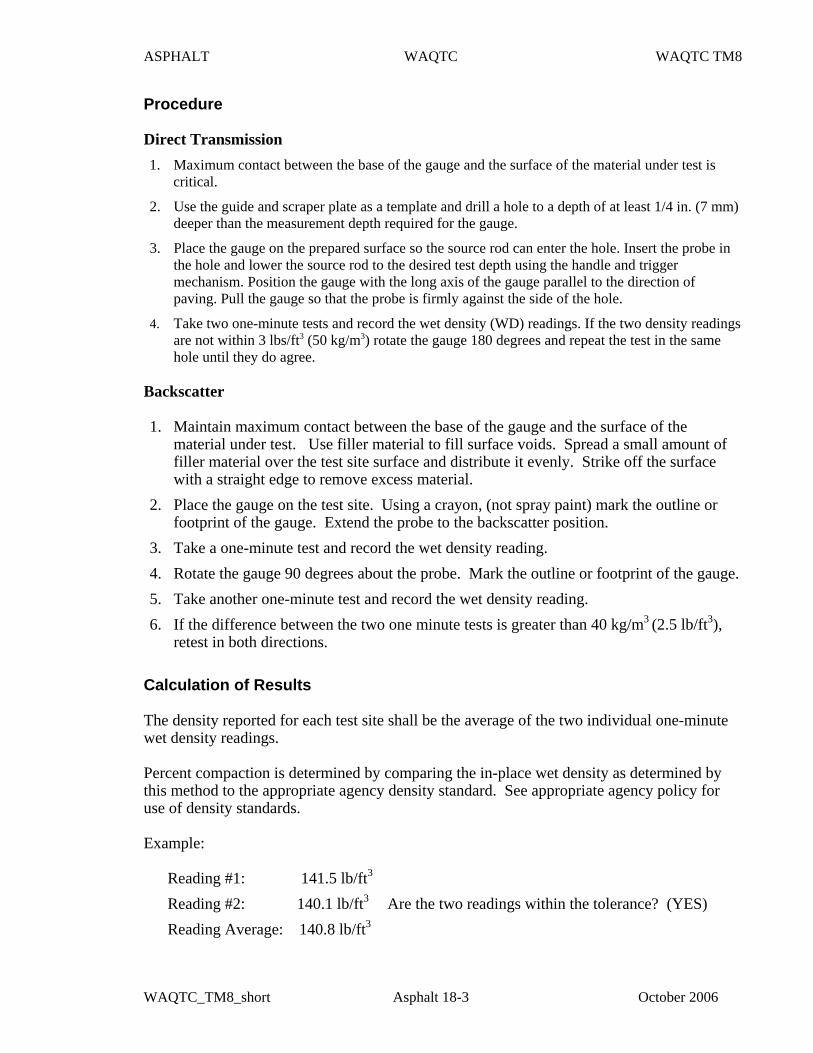
ASPHALT WAQTC WAQTC TM8
Procedure Direct Transmission 1. Maximum contact between the base of the gauge and the surface of the material under test is
critical.
2. Use the guide and scraper plate as a template and drill a hole to a depth of at least 1/4 in. (7 mm) deeper than the measurement depth required for the gauge.
3. Place the gauge on the prepared surface so the source rod can enter the hole. Insert the probe in the hole and lower the source rod to the desired test depth using the handle and trigger mechanism. Position the gauge with the long axis of the gauge parallel to the direction of paving. Pull the gauge so that the probe is firmly against the side of the hole.
4. Take two one-minute tests and record the wet density (WD) readings. If the two density readings are not within 3 lbs/ft3 (50 kg/m3) rotate the gauge 180 degrees and repeat the test in the same hole until they do agree.
Backscatter 1. Maintain maximum contact between the base of the gauge and the surface of the
material under test. Use filler material to fill surface voids. Spread a small amount of filler material over the test site surface and distribute it evenly. Strike off the surface with a straight edge to remove excess material.
2. Place the gauge on the test site. Using a crayon, (not spray paint) mark the outline or footprint of the gauge. Extend the probe to the backscatter position.
3. Take a one-minute test and record the wet density reading. 4. Rotate the gauge 90 degrees about the probe. Mark the outline or footprint of the gauge. 5. Take another one-minute test and record the wet density reading. 6. If the difference between the two one minute tests is greater than 40 kg/m3 (2.5 lb/ft3),
retest in both directions. Calculation of Results The density reported for each test site shall be the average of the two individual one-minute wet density readings. Percent compaction is determined by comparing the in-place wet density as determined by this method to the appropriate agency density standard. See appropriate agency policy for use of density standards. Example: Reading #1: 141.5 lb/ft3
Reading #2: 140.1 lb/ft3 Are the two readings within the tolerance? (YES) Reading Average: 140.8 lb/ft3
WAQTC_TM8_short Asphalt 18-3 October 2006
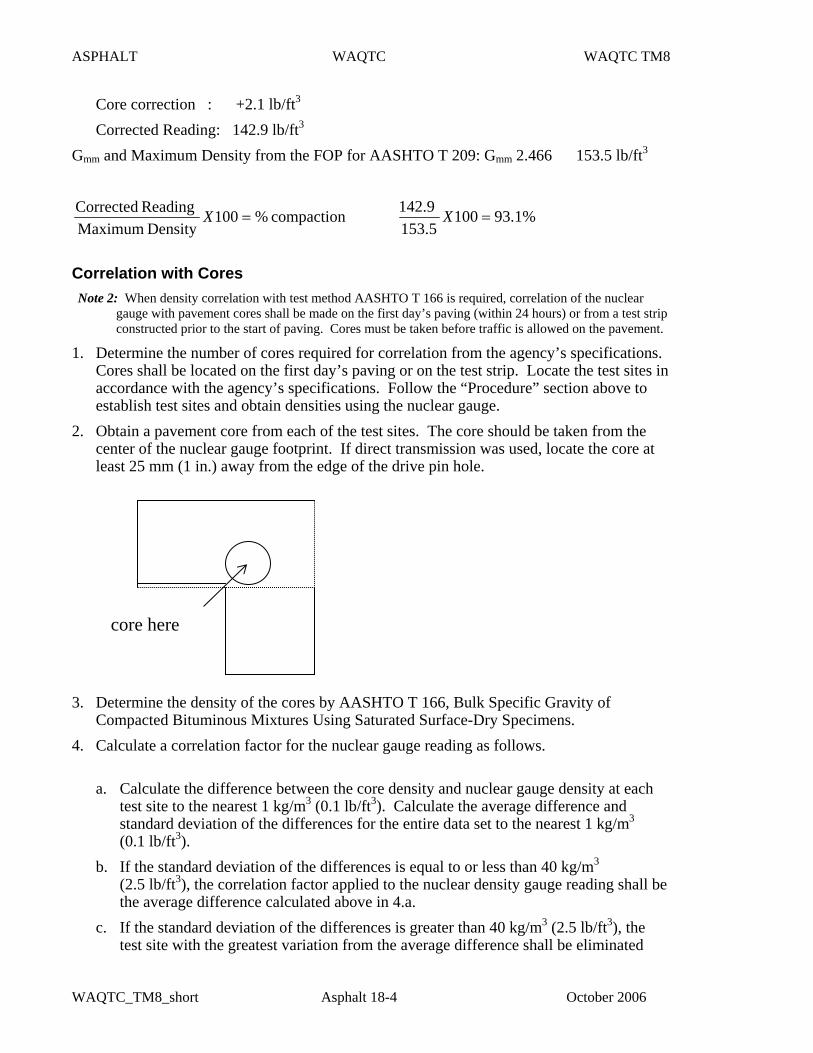
ASPHALT WAQTC WAQTC TM8
Core correction : +2.1 lb/ft3
Corrected Reading: 142.9 lb/ft3
Gmm and Maximum Density from the FOP for AASHTO T 209: Gmm 2.466 153.5 lb/ft3
compaction %100Density Maximum
Reading Corrected=X %1.93100
153.5 142.9
=X
Correlation with Cores Note 2: When density correlation with test method AASHTO T 166 is required, correlation of the nuclear
gauge with pavement cores shall be made on the first day’s paving (within 24 hours) or from a test strip constructed prior to the start of paving. Cores must be taken before traffic is allowed on the pavement.
1. Determine the number of cores required for correlation from the agency’s specifications. Cores shall be located on the first day’s paving or on the test strip. Locate the test sites in accordance with the agency’s specifications. Follow the “Procedure” section above to establish test sites and obtain densities using the nuclear gauge.
2. Obtain a pavement core from each of the test sites. The core should be taken from the center of the nuclear gauge footprint. If direct transmission was used, locate the core at least 25 mm (1 in.) away from the edge of the drive pin hole.
core here
3. Determine the density of the cores by AASHTO T 166, Bulk Specific Gravity of
Compacted Bituminous Mixtures Using Saturated Surface-Dry Specimens. 4. Calculate a correlation factor for the nuclear gauge reading as follows.
a. Calculate the difference between the core density and nuclear gauge density at each test site to the nearest 1 kg/m3 (0.1 lb/ft3). Calculate the average difference and standard deviation of the differences for the entire data set to the nearest 1 kg/m3 (0.1 lb/ft3).
b. If the standard deviation of the differences is equal to or less than 40 kg/m3 (2.5 lb/ft3), the correlation factor applied to the nuclear density gauge reading shall be the average difference calculated above in 4.a.
c. If the standard deviation of the differences is greater than 40 kg/m3 (2.5 lb/ft3), the test site with the greatest variation from the average difference shall be eliminated
WAQTC_TM8_short Asphalt 18-4 October 2006
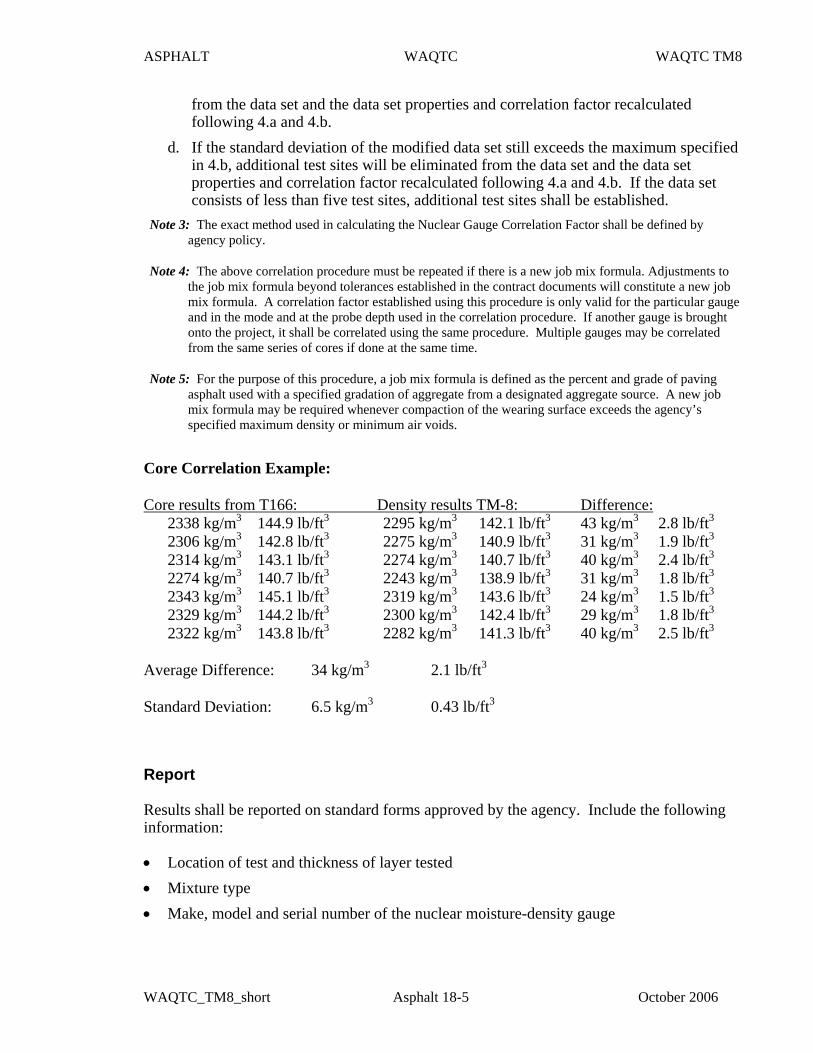
ASPHALT WAQTC WAQTC TM8
from the data set and the data set properties and correlation factor recalculated following 4.a and 4.b.
d. If the standard deviation of the modified data set still exceeds the maximum specified in 4.b, additional test sites will be eliminated from the data set and the data set properties and correlation factor recalculated following 4.a and 4.b. If the data set consists of less than five test sites, additional test sites shall be established.
Note 3: The exact method used in calculating the Nuclear Gauge Correlation Factor shall be defined by agency policy.
Note 4: The above correlation procedure must be repeated if there is a new job mix formula. Adjustments to the job mix formula beyond tolerances established in the contract documents will constitute a new job mix formula. A correlation factor established using this procedure is only valid for the particular gauge and in the mode and at the probe depth used in the correlation procedure. If another gauge is brought onto the project, it shall be correlated using the same procedure. Multiple gauges may be correlated from the same series of cores if done at the same time.
Note 5: For the purpose of this procedure, a job mix formula is defined as the percent and grade of paving asphalt used with a specified gradation of aggregate from a designated aggregate source. A new job mix formula may be required whenever compaction of the wearing surface exceeds the agency’s specified maximum density or minimum air voids.
Core Correlation Example: Core results from T166: Density results TM-8: Difference: 2338 kg/m3 144.9 lb/ft3 2295 kg/m3 142.1 lb/ft3 43 kg/m3 2.8 lb/ft3
2306 kg/m3 142.8 lb/ft3 2275 kg/m3 140.9 lb/ft3 31 kg/m3 1.9 lb/ft3
2314 kg/m3 143.1 lb/ft3 2274 kg/m3 140.7 lb/ft3 40 kg/m3 2.4 lb/ft3
2274 kg/m3 140.7 lb/ft3 2243 kg/m3 138.9 lb/ft3 31 kg/m3 1.8 lb/ft3
2343 kg/m3 145.1 lb/ft3 2319 kg/m3 143.6 lb/ft3 24 kg/m3 1.5 lb/ft3
2329 kg/m3 144.2 lb/ft3 2300 kg/m3 142.4 lb/ft3 29 kg/m3 1.8 lb/ft3
2322 kg/m3 143.8 lb/ft3 2282 kg/m3 141.3 lb/ft3 40 kg/m3 2.5 lb/ft3
Average Difference: 34 kg/m3 2.1 lb/ft3
Standard Deviation: 6.5 kg/m3 0.43 lb/ft3
Report Results shall be reported on standard forms approved by the agency. Include the following information: • Location of test and thickness of layer tested • Mixture type • Make, model and serial number of the nuclear moisture-density gauge
WAQTC_TM8_short Asphalt 18-5 October 2006

ASPHALT WAQTC WAQTC TM8
• Mode of measurement, depth, calculated wet density of each measurement and any adjustment data
• Standard density • Percent compaction and/or percent air voids • Name and signature of operator
WAQTC_TM8_short Asphalt 18-6 October 2006

QQUUAALLIITTYY AASSSSUURRAANNCCEE PPRROOGGRRAAMM
(Revised October, 2006)
TABLE OF CONTENTS I. Overview…………………………………………………………..1
II. Roles and Responsibilities ………………………………………...5
III. Laboratory Certification Program …………………………………7
IV. Technician Certification Program ….……………………………..10
APPENDIXES A. On Site Laboratory Inspection Criteria …………………………….. 19 B. Proficiency Sample Program ………………………………………. 24 C. Product Specific QC/QA Testing Plan .…………………………….. 26 D. ODOT Approved Commercial Aggregate Product Program ..……… 46 E. Troubleshooting Guide ………………..……………………………. 48 F. Technician Complaint Process………………………………………. 58 G. Contractor Quality Control Plan……………………..……………….61
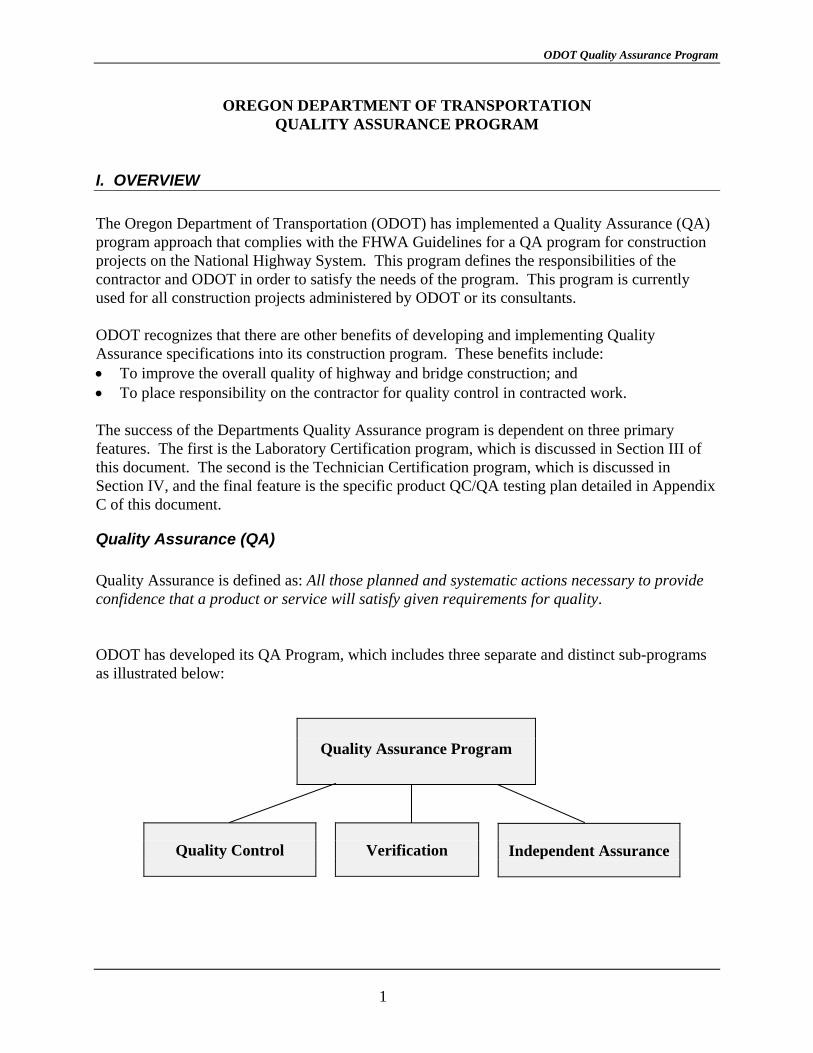
ODOT Quality Assurance Program
OREGON DEPARTMENT OF TRANSPORTATION QUALITY ASSURANCE PROGRAM
I. OVERVIEW The Oregon Department of Transportation (ODOT) has implemented a Quality Assurance (QA) program approach that complies with the FHWA Guidelines for a QA program for construction projects on the National Highway System. This program defines the responsibilities of the contractor and ODOT in order to satisfy the needs of the program. This program is currently used for all construction projects administered by ODOT or its consultants. ODOT recognizes that there are other benefits of developing and implementing Quality Assurance specifications into its construction program. These benefits include: • To improve the overall quality of highway and bridge construction; and • To place responsibility on the contractor for quality control in contracted work. The success of the Departments Quality Assurance program is dependent on three primary features. The first is the Laboratory Certification program, which is discussed in Section III of this document. The second is the Technician Certification program, which is discussed in Section IV, and the final feature is the specific product QC/QA testing plan detailed in Appendix C of this document.
Quality Assurance (QA) Quality Assurance is defined as: All those planned and systematic actions necessary to provide confidence that a product or service will satisfy given requirements for quality. ODOT has developed its QA Program, which includes three separate and distinct sub-programs as illustrated below:
Quality Assurance Program
Verification
Quality Control
Independent Assurance
1
ODOT Quality Assurance Program
Quality Control (QC) Quality Control is defined as: All contractor/vendor operational techniques and activities that are performed or conducted to fulfill the contract requirements. The contractor is responsible for providing quality control sampling and testing, furnishing material of the quality specified, and furnishing QL levels during aggregate production, when required. The contractor’s Quality Control technician must perform or observe the sampling and testing operation. The certified technician shall sign all testing documentation, even if the testing was observed. Contractor quality control tests will be used for acceptance only if verified by tests performed by an independent group (Region QA). Small quantities of some materials may be accepted when requested by the contractor and approved by the Project Manager (see Section 4(B) of MFTP). NOTE: ODOT will perform testing for all source/compliance tests and those non-field tested items associated with construction products (e.g. asphalt’s, emulsions, tack, water, cement, lime, etc.).
Verification Verification is defined as: Sampling and testing performed to validate the quality of the product. Verification samples are taken randomly (minimum ten-percent of specified quality control frequency) and tested by an independent group (Region QA) to verify that products meet required specification(s). Quality Control samples shall not be used for verification.
Independent Assurance Independent Assurance is defined as: Activities that are an unbiased and independent evaluation of all the sampling and testing procedures used in the acceptance program. ODOT’s Independent Assurance (IA) Program uses a combination approach requiring laboratory certification, technician certification, proficiency samples, and where possible, split samples of verification or QC tests. The Construction Section certifies quality control and quality assurance testing laboratories and technicians. Contractor’s test results of split verification samples are compared to Region QA test results for compliance using ODOT IA parameters. The PM performs random inspections of QC labs and technicians for compliance. The quality of Region QA test results are constantly monitored through the Departments proficiency samples program, which is outlined in Appendix B.
2
ODOT Quality Assurance Program
NOTE: The Quality Assurance Testing (both Verification and Independent Assurance) will be performed by a Quality Assurance Laboratory designated by the Agency in compliance with 23CRF637.
Quality Assurance Program Components
Third-Party Resolution The Construction Sections Central Materials Laboratory performs third party dispute resolutions. This is normally done by testing backup samples at the Central Materials Laboratory, but may include other resolution techniques or procedures as determined by the materials expert in the corresponding section. CERTIFICATION ADVISORY COMMITTEE The certification programs (both Technician and Laboratory Certifications) for ODOT’s Quality Assurance program will be overseen by a Certification Advisory Committee. The purpose of this committee is to review and provide general oversight to the certification programs. The committee will be responsible for establishing policy as related to the certification programs and will also be responsible for reviewing allegations concerning abuse by technicians. The Certification Advisory Committee will perform other duties as required to successfully implement and continue the Certification Programs. A meeting of the committee may be called at any time by the Chair of the Certification Advisory Committee or by written request of at least two members of the Committee. A majority of the members of the Committee shall be present for transaction of official business. Membership Membership of the Certification Advisory Committee will include the following: ODOT Construction and Materials Engineer (Chair) ODOT Pavements Services Engineer ODOT Quality Assurance Engineer ODOT Structural Services Engineer APAO Executive Director or Representative OCAPA Executive Director or Representative AGC Heavy Highway Representative Industry “At Large” Representative (appointed by Committee) The Industry “At Large” Representative will serve for two years.
3

ODOT Quality Assurance Program
Random Samples The Quality Assurance Program is based on theoretical conditions and the application of statistical acceptance procedures. In order for this program to succeed, the sampling shall remove any bias and all material shall have an equal opportunity of appearing in the sample population. Sampling at the same time (i.e. noon) each day may jeopardize the effectiveness of this program. To obtain a representative sample, a reliable system of random sampling shall be employed. Some work, like process control, lends itself quite well to the use of the Random Units Table and the Random Sample Location forms that ODOT has developed. This is the preferred method to assure that the samples are representative and eliminate sampling bias. In other work, like Verification or Independent Assurance, it may be difficult to apply random numbers to sample selection. In this case, it is imperative that the samples are taken at locations or times, which do not have an identifiable pattern, and are completely random and without bias. Commercial Source Quality Control The ODOT quality assurance program allows some freedom for commercial sources to establish their own quality control plan that is tailored to the operation of the specific commercial source. The commercial supplier is required to submit a written quality control plan to the appropriate Region Quality Assurance Coordinator for approval. All testing for the approved quality control plan is required to be performed by a certified technician in an ODOT certified laboratory. Specific details on Commercial Source Quality Control may be found in Appendix D.
4

II. ROLES AND RESPONSIBILITIES
Contractor The contractor’s responsibilities are to: • Furnish a written quality control plan (See Appendix G, Pg. 61, for minimum requirements); • Furnish and incorporate materials/products which are of the quality specified; • Provide ODOT-approved certified technicians and laboratories; • Perform quality control of all materials/products used on ODOT construction projects; • Sample and test materials using appropriate devices and procedures; • Furnish QL when required; • Sample and provide splits to ODOT upon request; • Perform required tests on contractor’s split of verification samples; • Properly document, sign and deliver test results as required, on ODOT forms according to
Section 3 criteria; and • Retain splits of all QC samples until PM determines that the split samples may be discarded. • Retain all split portions of Verification samples until notified in writing by the Project
Manager to discard.
Project Manager (PM) The Project Manager has the authority and responsibility to enforce the provisions of the contract. The PM’s Quality Control Compliance Specialist (QCCS) is involved with the project QA activities and is experienced and certified in all areas of field testing and documentation. The Project Manager is responsible to ensure that: • The project meets the requirements specified in the plans and specifications. • All required tests are performed, documented, and submitted. The PM is also responsible for
informing the QAC of project schedules, current quantities, and anticipated sampling requirements so verification testing can be accomplished.
• The contractor’s QC program meets required standards. This is accomplished by performing inspections of contractor’s personnel, testing procedures, and testing equipment.
• The contractor and Region Quality Assurance Laboratory is notified in writing within 5 working days of an IA/Verification sample’s completion, as to which backup samples may be discarded or that an investigation is in progress. Upon the completion of an investigation inform the contractor, in writing, as to which backup samples may be discarded. Written notification will identify the Lot/Sublots, include the IA test results and if required the resolution of an IA investigation.
5

Region Quality Assurance Team The Region Quality Assurance Team consists of a Quality Assurance Coordinator (QAC), Assistant Quality Assurance Coordinator and Quality Assurance Technicians (QAT). They are resources for the PMs, inspectors, technicians, other agencies, and contractors. They are also experienced in construction and are certified in design and testing of construction materials. Specific duties include, but are not limited to, the following: • Maintain uniformity in construction and testing activities; • Perform all required IA and verification testing; • Properly document on ODOT forms according to Section 3 criteria; • Calibrate or verify calibration of all nuclear moisture density gauges for ODOT, industry,
and other agencies; • Administer the Region’s radiation safety program; • Troubleshoot construction problems related to materials; • Recommend changes to mix designs; • Assist in the technician certification program; • Oversee Region testing facilities; • Inspect contractor facilities and/or technicians; and • Assist in QC laboratory certification. • Retain IA/Verification splits until notified by the PM.
Construction Section The Construction Section’s duties include: • Support of the QA program by coordinating training and certification for technicians and by
certifying all testing labs associated with ODOT construction projects; • Administer the proficiency sample program; • Provide third-party dispute resolution, according to the QA program, when necessary. • Utilize the QA Steering Committee to establish and ensure statewide consistency in the QA
Program.
6
III. LAB CERTIFICATION PROGRAM
OVERVIEW The Construction Section (CS) developed this laboratory certification program to support the Oregon Department of Transportation’s (ODOT) Quality Assurance Program for Construction Materials. This program recognizes three categories of laboratories that will test materials for ODOT construction projects: Quality Control, Quality Assurance, and Dispute Resolution. To ensure that laboratories consistently provide quality test results, they shall be certified according to this Program. PROGRAM DESCRIPTION 1. Quality Control Laboratories Quality control of construction materials is the responsibility of the contractor. Laboratories performing quality control testing may be the contractor’s own, the material supplier’s or an independent testing laboratory. The ODOT Central Laboratory will certify all Quality Control Laboratories for those test methods necessary to perform Quality Control tests of construction materials for ODOT construction projects. An outline of the on-site inspection process and laboratory certification criteria is found in Appendix A. This certification will be valid for one year. If a laboratory’s certification expires and the laboratory has a continued need to test materials for ODOT construction projects, the laboratory shall apply for re-certification. This laboratory certification process is designed to provide a “snapshot” of the quality of a laboratory. The ODOT Central Laboratory or its authorized representative will examine the laboratory’s testing equipment for accuracy and conformance to specifications. If the laboratory’s equipment is properly calibrated and within specifications, and if the laboratory meets all other conditions specified in Appendix A, ODOT will certify the laboratory as competent and able to test materials for ODOT construction projects. 2. Quality Assurance Laboratories Quality assurance is the responsibility of ODOT (the owner). Quality Assurance Laboratories perform Independent Assurance (IA) and/or Verification tests in coordination with Quality Control Laboratories performing quality control tests of materials for ODOT construction projects. This provides ODOT with an independent analysis of the quality control test results to ensure that the results of quality control tests are valid. Quality Assurance Laboratories will usually be ODOT Region Laboratories, but may also be the ODOT Central Laboratory or an ODOT contracted independent testing laboratory.
7
Quality Assurance Laboratories perform Independent Assurance (IA) and/or Verification tests during production of materials. These laboratories perform a portion of the tests that the Quality Control Laboratories perform. The quality control and quality assurance test results are compared to each other to determine the reliability of the quality control testing program. The ODOT Central Laboratory will certify all Quality Assurance Laboratories for those test methods necessary to perform quality assurance tests of construction materials for ODOT construction projects. This certification will be valid for one year. If a laboratory’s certification expires and the laboratory has a continued need to test materials for ODOT construction projects, the laboratory shall apply for re-certification. An outline of the on-site inspection process and laboratory certification criteria is found in Appendix A. This laboratory certification process is designed to provide not only a “snapshot” of the quality of a laboratory, but also an evaluation of the laboratory’s performance in maintaining quality and consistency. ODOT Central Laboratory inspectors will examine the laboratory’s testing equipment for accuracy and conformance to specification. In addition, the quality assurance laboratory is required to participate in the ODOT Central Materials Laboratory Proficiency Sample Program (see Appendix B). If the laboratory’s equipment is properly calibrated and within specifications, and if the laboratory meets all other conditions specified in Appendix A, then ODOT will certify the laboratory as competent and able to perform independent assurance and/or verification tests of materials for ODOT construction projects. 3. Dispute Resolution Laboratories When Quality Control and Quality Assurance test results conflict and the conflict cannot be resolved; a neutral Dispute Resolution Laboratory will test the material in question. The test results of the Dispute Resolution Laboratory will decide the dispute. The ODOT Central Laboratory will perform all dispute resolutions unless a potential for conflict of interest exists. In the event that the ODOT Central Laboratory acts as the Quality Assurance laboratory, and that the dispute is therefore between the Quality Control Laboratory and ODOT Central Laboratory, the ODOT Central Laboratory will defer its dispute resolution duties to a certified laboratory agreed upon between ODOT and the Contractor. The ODOT Central Laboratory shall certify dispute Resolution Laboratories., other than the ODOT Central Laboratory. Conclusions formed from the test report(s) of the Dispute Resolution Laboratory performing dispute resolution materials testing for any or all disputed test results will be considered the actual test results.
8
No Dispute Resolution Laboratory shall perform Independent Assurance or Verification tests on its own tests. Laboratory Decertification A Quality Control or Quality Assurance Laboratory may have its entire certification or its certification for specific test methods revoked by ODOT if it is found to not conform to the specifications and standards of its ODOT certification. A laboratory that has had its certification revoked for a specific test method(s) may not test materials that require the use of such revoked test certification(s). A laboratory that has had its entire certification revoked shall promptly cease testing materials for ODOT construction projects. A laboratory that has had its certification partially or entirely revoked may seek reinstatement by demonstrating conformance to the ODOT Laboratory Inspection criteria (See appendix A). In addition, any laboratory/company intentionally misrepresenting the status of their certification or falsifying test results will be subject to disciplinary action up to a one-year suspension of their certification. Any allegation regarding the practices of a certified laboratory will be made in writing to the Certification Advisory Committee. The Certification Advisory Committee will investigate the complaint and take appropriate disciplinary action. In all cases, the parties involved in the complaint will be provided an opportunity to appear before the committee before any actions are taken.
9

IV. TECHNICIAN CERTIFICATION PROGRAM INTRODUCTION / BACKGROUND The Oregon Department of Transportation (ODOT) has established a strategy for quality control and quality assurance in its dealings with construction of transportation facilities. Through revisions in its specifications and contractual practices, ODOT has implemented this strategy by placing the responsibility on the contractor for quality control in contracted work. Quality control involves the routine sampling and analysis of the quality of materials and work to ensure that the quality of both remain within a specified range. In turn, ODOT is responsible for quality assurance - i.e. the oversight of quality control activities by the contractors to assure compliance with the specifications. The Oregon Department of Transportation’s Quality Assurance Program will require all personnel and laboratories performing testing on ODOT projects to be certified. The level of certification is dependent on the specific type of testing to be performed. General oversight for the certification programs will be provided by the Certification Advisory Committee described in Section I of this document. Specific direction and administration of the individual certifications will be provided by groups referenced in the description of the individual certifications. TECHNICIAN CERTIFICATION PROGRAMS Purpose: The purpose of these technician certification programs is to develop and maintain a pool of well-trained technicians to perform field-testing of materials for both Quality Control and Quality Assurance. All technician certification programs must be approved by the Certification Advisory Committee. Who Must Be Certified? All personnel responsible for performing and reporting on tests required on ODOT projects must be certified. This requirement applies to project personnel working as technicians for the State, Contractors, or Consultants on such projects.
10
Certifications Following is a summary of the approved Technician Certifications currently in place. Certified Aggregate Technician (CAgT): A CAgT performs a variety of tests on soils and aggregates including sieve analysis, fracture, sand equivalency, and other tests and performs other duties as required by current specifications for soils and aggregate materials. Certified Embankment and Base Technician (CEBT): The CEBT performs testing of soils and aggregates for establishing maximum density and optimum moisture for compaction of subgrade soils and aggregate bases. Certified Density Technician (CDT): A CDT performs in-place density testing of soils, aggregates, and asphalt mixtures using the nuclear density gauge. In addition to certification, a CDT must possess a current Radiation Safety Card issued by an approved source. Certified Asphalt Technician I (CAT-I): A CAT-I performs sampling and testing for HMAC and EAC mixtures including AC content, maximum specific gravity, sieve analysis, void measurements using a currently approved compaction device, and other tests and performs other duties as required by current specifications for HMAC. Certified Asphalt Technician II (CAT-II): A CAT-II is responsible for managing the volumetric properties of asphalt mixes by controlling plant operations, for troubleshooting HMAC sampling and testing processes, and for making appropriate adjustments to HMAC production and laydown procedures. Certification at CAT-II level is contingent on having successfully completed the CAT-I certification phase at least once. Certified Mix Design Technician (CMDT): A CMDT is responsible for preparing HMAC and EAC Mix Designs, including all material testing and data analysis necessary to properly complete a design. A CMDT prepares designs for both dense and open graded HMAC mixtures.
11

Certified Hveem Stability Technician (CHST): A CHST is responsible for testing dense graded HMAC wearing course mix designs for stability. This certification will be issued by the ODOT Pavement Materials Engineer based on an evaluation of the technician and their laboratory. The certification is contingent on maintaining satisfactory participation in a mandatory round robin testing program as outlined in the Departments Contractor Mix Design Guidelines. Quality Control Technician (QCT): A QCT performs testing of fresh Portland cement concrete including sampling, concrete temperature, slump, unit weight, air content, and fabrication of specimens for strength testing and performs other duties including calculating cement content and water-cement ratio as required by specifications. QCT certification may be obtained through the ACI certification program, with Oregon Supplement, conducted by the Oregon Concrete and Aggregate Producers Association (OCAPA). Concrete Control Technician (CCT): A CCT is responsible for proportioning concrete mixtures to meet job requirements and for making adjustments to the mix design and mix production as necessary to provide a concrete mixture of the quality required by specifications. A CCT certification may be obtained through a program conducted by OCAPA. Concrete Strength Testing Technician (CSTT): A CSTT is responsible for testing the compressive or flexural strength of hardened concrete cylinders or beams. The duties of a CSTT include proper capping of specimens (bonded and unbonded), correct operation of breaking device and visual evaluation of broken specimens. Also, the CSTT is responsible to insure the proper handling, mold removal, logging and curing of field fabricated samples upon arrival at the laboratory. A CSTT certification may be obtained through a program conducted by OCAPA. Certification Requirements To obtain any of the above personnel certifications, the technician will be required to pass a written and/or a practical test demonstrating a knowledge and understanding of how to perform the specific tests. All tests shall be administered and evaluated only by evaluators approved by the Certification Advisory Committee Chair, or their designated representative. To apply for the certification, the applicant will either register for one of the approved training classes, where the exam will be administered as part of the class, or submit an application to challenge the exam. The challenge applications will be submitted through the approved training program to facilitate scheduling. Appropriate fees will be charged for the challenge exams to cover scheduling, overhead and facility use. Applicants will be scheduled for examination
12
through a cooperative effort between ODOT and the appropriate training program service provider. All certifications shall be contingent upon the technicians signing a rights and responsibilities agreement. This agreement will inform the technicians of the rights and responsibilities along with the consequences of the abuse and or neglect of these responsibilities. The technician will submit a signed agreement at the time they take the certification examination. All certifications will be valid for three years from the original certification except QCT is valid for 5 years and CSTT is valid for a 6 year period. Examination Process The Oregon Department of Transportation is a member of the Western Alliance for Quality Transportation Construction (WAQTC), which consists of 11 western states committed to the quality of our transportation systems. WAQTC has developed a technician-training program, which is comprised of instructional, and student modules used to assist in the training process of material field-tested procedures. ODOT has adopted the training package for all certifications except the concrete and mix design certifications. The Asphalt Paving Association of Oregon (APAO) currently performs the instructional phase, while ODOT maintains the certification and administration of the written and practical exam process. The certification system is made up of two phases. One is the WAQTC written and performance exams and the other is the ODOT written and performance exam requirements. The written exams are required in both phases, but the performance exam is a combination of WAQTC testing procedures, ODOT known samples, and the use of ODOT specifications. During the exam process, only hand calculators are allowed, use of lab top computers is not permitted during any of the exam phases. WAQCT Exam Process • Written Examination
a. Closed Book b. Consists of multiple modules, depending on the needed certification c. Each module consists of 5 questions with multiple choice, true or false, and required
calculations. d. Written exam time lines vary depending on the needed certification. In general, 1 to 1 ½
hours is given to complete the exam. • Performance Examination
a. Each participant will demonstrate proficiency in the designated test methods b. The exam is open book but the technician will not have access to the performance exam
checklist. c. Normally 4 ½ hours is given to complete the performance exam process with 4 hours
actual lab time and ½ hour given to complete calculations.
13
d. During the performance exam the examinee may be asked to explain various steps of a procedure to reduce the full test time.
e. The performance exam checklist consists of yes and no blocks. In order to successfully complete the checklist all of the yes blocks must be filled out. In the event, a participant fails the first attempt; a second attempt will be given, if time permits, and after the exam proctor explains the correct procedure. Anyone failing a test method on the performance exam may repeat that trial during the day of the performance exam, depending on the timelines and the type of test. Repeat trials will be allowed in not more than 50% of the total test methods in that performance exam. If the participant fails on the second attempt the performance exam will stop and the participant will have to re-take the exam at the scheduling convenience of the Agency.
• Passing Score – Written/Performance
a. Initial exam (first attempt): An overall score of 70% with a minimum of 60% on any one-test method.
b. Re-exam (second attempt): An initial exam overall score below 70% will require a re-exam on all test methods. An initial exam score above 70% overall, but below 60% on one or more test methods, will require a re-exam on only those test methods. In the case of one test method comprising the re-exam, the examinee must receive a score of 70%. In the case of more than one test method comprising the re-exam, the examinee must receive an overall score of 70% with a minimum of 60% on any one-test method.
Performance: All performance checklists must have 100% yes blanks checked and each test method must be performed within the designated time limit. Re-examination Policy – Written/Performance Failure of either examination the second time will require attendance of the standard course for that qualification and passing the exam element failed on the second attempt if certification is still desired. ODOT Exam Process
• Written Exam:
a. Open Book b. Consists of multiple choice, true or false, essay questions about test procedures and
specifications and completion of various ODOT forms. c. Written exam time lines vary depending on the needed certification. In general, 3 to 3 ½
hours is given to complete the exam.
14
• Performance Examination
a. Each participant will demonstrate proficiency in the designated test methods with known samples. Each participant will demonstrate the ability to apply specifications to the needed test and identify the quality of the material being tested.
b. The performance examination for ODOT is performed in conjunction with the WAQTC performance exam. Normally 4 ½ hours is given to complete the performance exam process with 4 hours actual lab time and ½ hours given to complete calculations. The performance exam answers will be graded based on completion of the required tests, application of the correct specifications, and meeting the parameters set fourth in the Independent Assurance Parameters section of the Quality Assurance Program.
• Passing Score – Written/Performance
a. Initial exam (first attempt): An overall score of 70% is required to successfully complete the exam requirement.
b. Re-exam (second attempt): An overall score of 70% is required to successfully complete the exam requirement.
c. Initial exam (first attempt) for the QCT ODOT supplemental exam: An overall score of 80% is required to successfully complete the exam requirement. For the CCT certification an overall score of 75% is required to successfully complete the exam requirement.
d. Re-exam (second attempt) for the QCT and CCT ODOT exam the participant must meet the same criteria as the Initial exam (first attempt).
Performance
a. Initial exam (first attempt): Performing all the required tests, application of correct specifications and meeting the Independent Assurance Parameters is required to receive a pass rating. The grading is based on pass/fail of all associated tests performed under the desired certification.
b. Re-exam (second attempt): The same criteria as the Initial exam must be met. Re-examination Policy – Written/Performance Failure of either examination the second time will require attendance of the course for that qualification and passing the exam element failed on the second attempt if certification is still desired. Also, on the date the certification process is started a technician will have 120 days to complete the exam requirements for the desired certification. If the exam requirements are not met within the 120-day time frame and certification is still desired the technician will be required to perform the entire exam process again. Applicants attempting the challenge process are given one opportunity to successfully meet the certification requirements. Failure of any event on the first attempt will require the individual to attend formal training which can be scheduled through the training program service provider.
15
This requirement only applies to applicants who have never possessed ODOT certification in the desired discipline. Documentation of Certification Upon the successful completion of the examination(s), the participant’s name, home address, and/or company affiliation will be registered in the official registry of certified technicians for the appropriate certification. The official registry is maintained by the ODOT Construction Section and can be accessed on the internet at the following address: www.odot.state.or.us/techserv/operatns/techcert/techcertDynamic/Index1.cfm It is anticipated that many technicians will hold multiple certifications. Each certified technician will be given a laminated wallet-size identification card, which indicates all areas of certification, and official letter(s) indicating certification(s) held. Recertification Recertification is necessary after three years. Certified Technicians must obtain recertification before the expiration date of the certification. Recertification may only be obtained by passing the written and/or practical test required for that particular certification. A Certified Technician must apply for the appropriate certification. The Certified Technician is responsible for scheduling his/her own written and/or practical comprehensive examination. It should be noted that should a technician fail to successfully complete a Certification renewal in a specialty area, the technician will be considered disqualified in that area, only, until the requirements for Certification renewal have been successfully met, subject to the limitations set forth in this document.
16
Revocation or Suspension of Certification Technician Certifications may be revoked at any time by the Certification Advisory Committee Chair for just cause. Proposed revocations will be sent to the individual in writing along with the individual’s right to appeal the proposed revocation. A proposed revocation is effective upon receipt by the technician and will be affirmed, modified, or vacated following any appeal. The reasons that certified technicians will be subject to revocation or suspension of their certifications are negligence or abuse of their responsibilities. The Certification Advisory Committee may disqualify certified technicians for other reasons of just cause which may or may not be specifically defined herein following the due process procedures outlined herein. Negligence is defined as unintentional deviations from approved procedures which may or may not cause erroneous results. The following penalties are guidelines for findings of negligence: The first finding of negligence will result in a letter of reprimand being sent to both the employee and the employer, the second will result in a thirty (30) day suspension of the Certification, third in a one hundred eighty (180) day suspension of Certification, and the fourth in permanent revocation of the Certification. Abuse is defined as intentional deviations from approved procedures. The following penalties are guidelines for findings of abuse: The first finding of abuse will result in a one (1) year suspension of an individual’s Certification. Any subsequent finding of abuse will result in that person being ineligible for any future type of Certification. Revocations or suspensions for abuse or negligence in one Certification area will be considered revocations or suspensions in all Certifications held by the technician. It should be noted that should a technician fail to successfully complete a Certification renewal in a specialty area, that technician will be considered disqualified in that area, only, until the requirements for Certification renewal have been successfully met, subject to the limitations set forth in this document. Allegations of negligence or abuse will be made to the Certification Advisory Committee in writing. The allegations will contain the name, address, and signature of the individual(s) making the allegation. The allegations will be investigated by the Certification Advisory Committee. The accused and the individual(s) making the allegation will be given the opportunity to appear before the Committee. All involved parties will be notified in writing of the findings by the Committee within a 30 day period. Any warranted penalties will be imposed in accordance with guidance contained herein and according to the guidelines outlined under the Technician Compliant Process (See Appendix F). Decisions regarding allegations of negligence or abuse may be appealed in writing to the Committee Chair who will independently consider such written appeals but may rely on the advice and counsel of the Committee and take such action, as he/she considers appropriate.
17
Because ODOT is a member of the Western Alliance for Quality Transportation Construction, and the Certifications are honored by other member states. The Certification Advisory Committee will notify the other members of the WAQTC, or other participants in the TTQP, of anyone having a Certification revoked or suspended. Applicants With Disabilities or Special Needs Applicants with a disability and those who have special needs should notify the Certification Advisory Committee Chair at the time of application so that appropriate accommodations can be made. Disclaimer Certification of an individual by the ODOT Technician Certification Program indicates only that the individual has demonstrated a certain level of competence on a written and/or practical examination in a selected field of activity. ODOT may require this certification of individuals performing activities specified in work contracts or other activities. ODOT and the Certification Advisory Committee make no claims regarding the abilities or competence of certified individuals. Each individual or organization utilizing certified individuals must make its own independent judgment of the competence of certified individuals. ODOT specifically disclaims any responsibility for the actions, or the failure to act, of individuals who have been certified through the ODOT Technician Certification Program.
18
APPENDIX A
OREGON DEPARTMENT OF TRANSPORTATION CONSTRUCTION SECTION CENTRAL MATERIALS LABORATORY ON-SITE LABORATORY INSPECTION CRITERIA FOR QUALITY CONTROL AND QUALITY ASSURANCE LABORATORIES A laboratory desiring information and/or an application package for ODOT laboratory certification may contact the ODOT Central Laboratory at the following address: Oregon Department of Transportation
Construction Section, Materials Laboratory Attn: Lab Certification Coordinator 800 Airport Road SE Salem, OR 97310-4798 Telephone (503) 986-3087
Laboratories requesting ODOT certification shall make arrangements to receive an on-site inspection. Forms will be included in the application package to facilitate the laboratory’s response to this requirement. NOTE: It is the responsibility of the requesting laboratory to have their lab clean, organized and in complete operating order at the time of inspection. All equipment must be readily available and accessible. The ODOT Laboratory Certification Team does not search for stowed equipment. In addition an authorized representative must be present at the time of inspection to answer questions or respond to identify and present equipment. Failure to meet this criterion or to find unorganized, unkempt facilities may result in a canceled inspection. On-Site Inspection The Lab Certification Inspector will visit each laboratory whose application for certification has been accepted. The laboratory inspector will evaluate the laboratory using criteria A through H listed below. A discussion of the criteria follows:
A. Requirement: The laboratory shall maintain facilities (fixed or mobile) for proper
control of the laboratory environment. This criterion is used to evaluate the laboratory’s physical ability to provide an appropriate environment in which to test materials. General requirements include: the facility shall be physically able to function as a laboratory (e.g. adequate power, water, lighting, floor space etc.) and have the capability of maintaining temperatures that are specified in the test methods for which the laboratory is seeking certification.
19
B. Requirement: The laboratory shall maintain facilities for proper storage, handling,
and conditioning of test specimens and samples. This criterion is used to evaluate a laboratory’s physical ability to store samples and keep them organized. The laboratory shall maintain separate areas on its premises to store samples and splits of samples in an organized manner so that samples are not lost or discarded and may be found at a future date. In addition, the laboratory shall have facilities for the conditioning of samples as required by any test method for which the laboratory seeks certification.
C. Requirement: Calibration certificates held by laboratories shall meet the
requirements of ISO/IEC 17025 and shall include appropriate statements of uncertainty. Laboratories shall use accredited calibration service providers. The laboratory shall maintain necessary calibration equipment and reference standards. A laboratory shall have, on hand, calibration and verification equipment necessary to ensure the accuracy of its equipment. Such equipment could include calibration weights for scales or balances; manometers for the verification of vacuum pumps; thermometers etc.
D. Requirement: The laboratory shall maintain equipment conforming to specification
requirements necessary for the testing performed. This criterion is used to ensure that the laboratory’s testing equipment conforms to the specifications listed in the test methods for which the laboratory is seeking certification.
E. Requirement: The laboratory shall demonstrate adequate care when recording and
processing data and test results. This criterion is used to evaluate the laboratory’s ability to produce accurate test reports. The laboratory shall have procedures in place that facilitate the timely and accurate recording of data and the ultimate accuracy of its test reports.
F. Requirement: The laboratory shall demonstrate proper techniques for selection,
identifying, handling, conditioning, storing, and retaining test samples. This criterion is similar to criteria B but is concerned with the laboratory’s internal policies and procedures rather than its physical capabilities in regards to the above activities. The laboratory shall have policies and procedures in place to ensure that its personnel and technical staff have the ability to select, identify, handle, condition, store, and retain test samples as required by the test methods for which the laboratory is seeking certification.
G. Requirement: The laboratory shall include the laboratory’s name and address and the
name(s) of the technician(s) performing the test(s) on their test reports. This criterion is used to ensure that the above information appears on the laboratory’s test reports that are submitted to ODOT. In addition to the above, the technician(s) certification card number shall be entered on all test reports.
20
H. Requirement: The laboratory shall have on site at the time of inspection and during production operations, all equipment (except items listed as mobile equipment) necessary to perform the test methods for which they have requested certification. The ODOT Lab Certification inspection team has a Color Coded Tagging System, which identifies various lab equipment that has met the certification criterion. The unique Colored Tag is valid for a 1 year period and starts from the date of the Final Report. (Note: Not all testing equipment is tagged; reference the appropriate test procedure to identify required equipment.) Mobile equipment for additional test procedures may be added at a later date provided the following conditions are met:
• The laboratory must demonstrate adequate workspace and electrical system to operate
required equipment. • If equipment is new, they must provide copies of invoices that include the make,
model and serial number of the equipment. • If the equipment is rented or borrowed, it must come from another ODOT certified
laboratory and provide the make, model and serial number as well as the number and color of the ODOT inspection tag.
Mobile Equipment 1. Ignition Oven 2. Gyratory Compactor
3. Field concrete equipment Preliminary Report The ODOT Lab Certification Inspector will prepare a preliminary report of findings and present it to the laboratory manager at the conclusion of the on-site inspection. The preliminary inspection report will list all discrepancies for each test method in which the laboratory has requested certification. The inspector will discuss each discrepancy noted in the preliminary report with the laboratory manager in sufficient detail so that the laboratory manager understands the scope of the problem(s) and what corrective action is required in order to obtain certification for the test method(s) in question. When the inspector and the laboratory manager have covered all of the deficiencies, both parties will sign the preliminary report. These signatures indicate that both parties have read the report and understand its contents. The inspector will leave the original copy of the report with the laboratory manager and place a copy in the laboratory’s permanent file. The laboratory inspector will immediately (same or next day) FAX or hand deliver a copy of the report to the project manager and the region QA personnel for their files and general information. Laboratories are expected to correct all deficiencies within thirty-days so that a certification may be issued. If a laboratory needs more than thirty-days to correct deficiencies, the laboratory shall notify the laboratory inspector, in writing, explaining why they need additional time. The laboratory will not be certified until all deficiencies are corrected.
21

If the ODOT Lab Certification Inspector within the thirty-days receives no response to the preliminary report allowed, then the laboratory will be immediately decertified until the deficiencies are corrected or a written response has been received. Final Report Once all of the deficiencies have been corrected the ODOT Lab Certification Inspector will prepare a final report of findings and mail it to the laboratory. The laboratory inspector will mail copies of the final report to the project manager and the region QA office. Certificate of Laboratory Certification The ODOT Central Laboratory will prepare a Certificate of Laboratory Certification for a laboratory when the laboratory has met the requirements listed in Appendix A, and has corrected all deficiencies noted by the inspector. The certificate will be mailed to the laboratory with the final report of findings. The Certificate will include the type of certification, laboratory name, test methods the laboratory has been certified to perform, color of the inspection tag and the Construction Section Manager’s signature. This Certificate is proof of a laboratory’s ODOT certification for the listed test methods and may be presented as such to any ODOT project manager. The laboratory inspector will mail copies of the Certification with the final report to the project manager and the region QA office. Certificates of Laboratory Certification are valid for one-year from the date of the inspection. Follow Up On-Site Inspections If at any time during a laboratory’s term of certification, the project manager or region QA personnel suspect that any of the contractor’s laboratory equipment, conditions outlined under Requirement H or the laboratory building itself are out of specification, the project manager or region QA personnel may request an additional on-site inspection. The project manager or region QA personnel will contact the Lab Certification Inspector and schedule the follow up on-site inspection.
22
Laboratory Decertification If the follow up on-site inspection reveals that the laboratory is deficient in one or more areas, the laboratory inspector will immediately decertify the laboratory for those test methods affected by the deficient equipment or facilities. The laboratory inspector will recertify the laboratory following correction of all deficiencies. A laboratory may not perform materials tests using test methods for which it has been decertified. In addition, any laboratory/company intentionally misrepresenting the status of their certification or falsifying test results will be subject to disciplinary action up to a one-year suspension of their certification. Any allegations regarding the practices of a certified laboratory will be made in writing to the Certification Advisory Committee. The Certification Advisory Committee will investigate the complaint and decide on appropriate disciplinary action. In all cases, the parties involved in the complaint will be provided an opportunity to appear before the committee before any actions are taken.
23
APPENDIX B OREGON DEPARTMENT OF TRANSPORTATION CONSTRUCTION SECTION QUALITY ASSURANCE LABORATORY PROFICIENCY SAMPLE PROGRAM Proficiency sample testing is an additional factor used to evaluate the performance of a Quality Assurance (QA) laboratory and the Quality Assurance (QA) laboratory technicians. It provides information not otherwise available from the on-site inspection and a means of continued monitoring of laboratory performance. The ODOT Construction Section requires QA Laboratories and QA laboratory technicians to participate in this Proficiency Sample-testing Program. Participation includes testing all applicable samples, which are to be distributed and completed within the specified time frame. The resulting data is to be analyzed by the ODOT Quality Assurance Engineer. Proficiency samples are distributed by Construction Section at six-month intervals as outlined in the Proficiency Sample Testing Plan in Table 1 of this Appendix. The Construction Section will distribute a minimum of one set of samples as indicated in Table 1 for each of the QA laboratory technicians. The ODOT Central Laboratory and the QA laboratory technicians will perform the required testing listed in Table 1 on each set of samples. The distribution of proficiency samples is not intended to coincide with the on-site laboratory inspection. Proficiency Sample test results will be submitted to the Quality Assurance Engineer within 30 days of receipt of the sample. A QA laboratory may be subject to decertification as described in Section 2 Appendix A Lab Certification Program. When a QA laboratory technician results are beyond two standard deviations of the grand average values, the Quality Assurance Coordinator (QAC) shall attempt to determine the reason for the discrepancies and report the findings and actions taken to the ODOT Quality Assurance Engineer (QAE) within thirty days of issuance of a final report. The adequacy of the QAC’s response will be considered in preparing a report on certification and recertification. If the QA laboratory technician exceeds the two standard deviation limit on the next set of Proficiency Samples for the same test and is not able to provide the QAE with a satisfactory explanation for exceeding the limits; the QA laboratory technician will immediately perform a backup proficiency sample witnessed by the QAE or designated representative. If there is no resolution and the results of the backup sample exceed the two standard deviation limit their Technician Certification(s) for certifications affected by that procedure(s) will be suspended automatically for six months. Suspensions and written appeals are subject to review by the Certification Advisory Committee prior to implementation.
TABLE 1 – PROFICIENCY SAMPLE TESTING PLAN
24
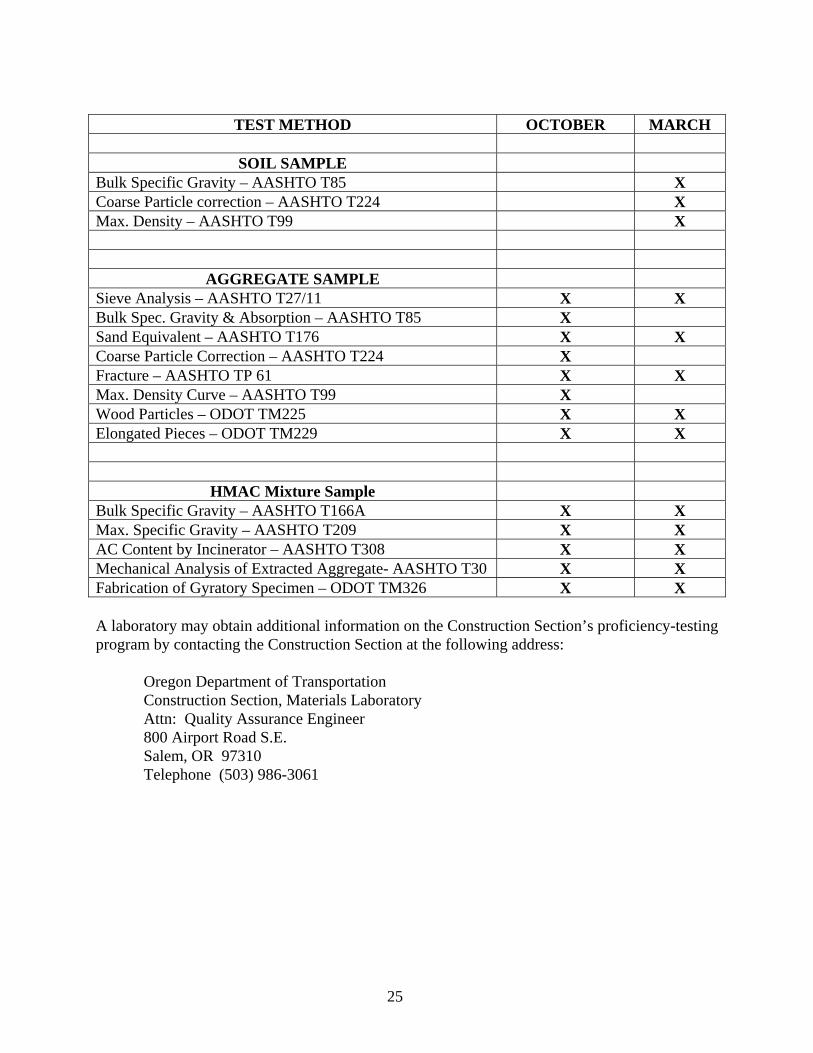
TEST METHOD OCTOBER MARCH
SOIL SAMPLE
Bulk Specific Gravity – AASHTO T85 X Coarse Particle correction – AASHTO T224 X Max. Density – AASHTO T99 X
AGGREGATE SAMPLE Sieve Analysis – AASHTO T27/11 X X Bulk Spec. Gravity & Absorption – AASHTO T85 X Sand Equivalent – AASHTO T176 X X Coarse Particle Correction – AASHTO T224 X Fracture – AASHTO TP 61 X X Max. Density Curve – AASHTO T99 X Wood Particles – ODOT TM225 X X Elongated Pieces – ODOT TM229 X X
HMAC Mixture Sample Bulk Specific Gravity – AASHTO T166A X X Max. Specific Gravity – AASHTO T209 X X AC Content by Incinerator – AASHTO T308 X X Mechanical Analysis of Extracted Aggregate- AASHTO T30 X X Fabrication of Gyratory Specimen – ODOT TM326 X X A laboratory may obtain additional information on the Construction Section’s proficiency-testing program by contacting the Construction Section at the following address:
Oregon Department of Transportation Construction Section, Materials Laboratory
Attn: Quality Assurance Engineer 800 Airport Road S.E. Salem, OR 97310 Telephone (503) 986-3061
25
APPENDIX C
PRODUCT SPECIFIC QC/QA TESTING PLAN
The Quality Assurance Program consists of three distinct sub-programs. The Quality Control Program, the Verification Program and the Independent Assurance Program. This appendix provides specific details on how the programs work together to assure specification materials are incorporated into ODOT projects. It also provides details on specific requirements of each of the programs for each of the materials, which are utilized on ODOT projects. In general, contractor’s quality control tests are obtained at the highest frequency. Agency verification tests are run usually on a frequency of 10% of the QC testing frequency. While the Independent Assurance program takes steps to assure the quality of both the QC and the verification test results. ODOT will accept materials based on the contractors QC test results only if verified by the Agency verification testing. Verification of QC test results will require all of the following conditions to be met:
1. The material meets the specified quality: both the Department's and the Contractor's split. 2. The split samples meet Independent Assurance parameters.
3. The Department's Verification test results compare reasonably to the ongoing Quality Control data.
If any of the above conditions are not met, an investigation will be conducted by the Project Managers office to determine whether to reject the material or if the material is suitable for the intended purpose according to section 150.25 and also what price adjustment might be applied. See Investigation Criteria for details and requirements (Pg. 27). Step 2 in the above conditions compares the contractors test results on the split verification sample to the agency results. The Independent Assurance Parameters to be used for the comparison are listed in Table 1 of this appendix. The following pages detail the Investigation Criteria, Quality Control, Verification and Independent Assurance requirements for each of the specific materials used on ODOT projects.
26
Investigation Criteria
The intent of the investigation is to determine reasonable cause for the discrepancy and provide supporting documentation. Materials failing to meet the conditions outlined for Verification, Independent Assurance and prior Quality Control testing, potentially have an impact on the quality of the material produced or incorporated into the project. Several resources are available to assist with the troubleshooting process and data collection. Appendix E, (Troubleshooting Guide) provides some guidance through the evaluation phase based on material discipline and the associated tests. The guide is an evaluation tool and is not necessarily a complete listing of all potential areas to be investigated and the assistance of the Region QAC, QAE or other technical resources is encouraged. The investigation and the resolution of the discrepancy shall be documented on form (734-4040) and at a minimum will contain the following information:
• Clearly explain the issue under investigation. Provide the bid item number, material description, test procedure or process in question, associated Quality Assurance testing reference’s and date or timelines of the testing issue.
• Describe the steps taken to resolve the discrepancy and the associated information or
test results gathered to support the findings.
• Provide a conclusion based on the findings.
• Describe recommendations or actions to be taken.
• Provide written notification to the QAC and Quality Control entity upon completion of the investigation. Ensure a copy of the investigation is maintained in the project files.
27

28
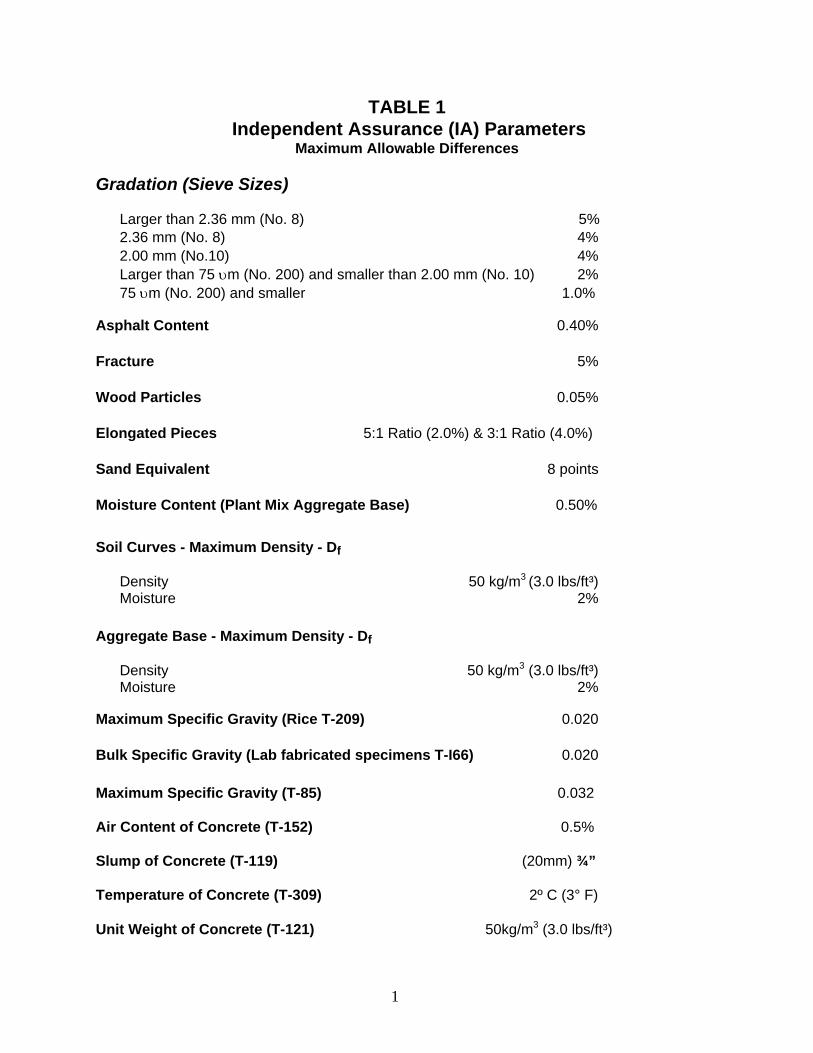
TABLE 1 Independent Assurance (IA) Parameters
Maximum Allowable Differences Gradation (Sieve Sizes)
Larger than 2.36 mm (No. 8) 5% 2.36 mm (No. 8) 4% 2.00 mm (No.10) 4% Larger than 75 υm (No. 200) and smaller than 2.00 mm (No. 10) 2% 75 υm (No. 200) and smaller 1.0%
Asphalt Content 0.40%
Fracture 5%
Wood Particles 0.05%
Elongated Pieces 5:1 Ratio (2.0%) & 3:1 Ratio (4.0%)
Sand Equivalent 8 points
Moisture Content (Plant Mix Aggregate Base) 0.50% Soil Curves - Maximum Density - Df
Density 50 kg/m3 (3.0 lbs/ft³) Moisture 2%
Aggregate Base - Maximum Density - Df
Density 50 kg/m3 (3.0 lbs/ft³) Moisture 2%
Maximum Specific Gravity (Rice T-209) 0.020
Bulk Specific Gravity (Lab fabricated specimens T-I66) 0.020 Maximum Specific Gravity (T-85) 0.032 Air Content of Concrete (T-152) 0.5% Slump of Concrete (T-119) (20mm) ¾” Temperature of Concrete (T-309) 2º C (3° F) Unit Weight of Concrete (T-121) 50kg/m3 (3.0 lbs/ft³)
1
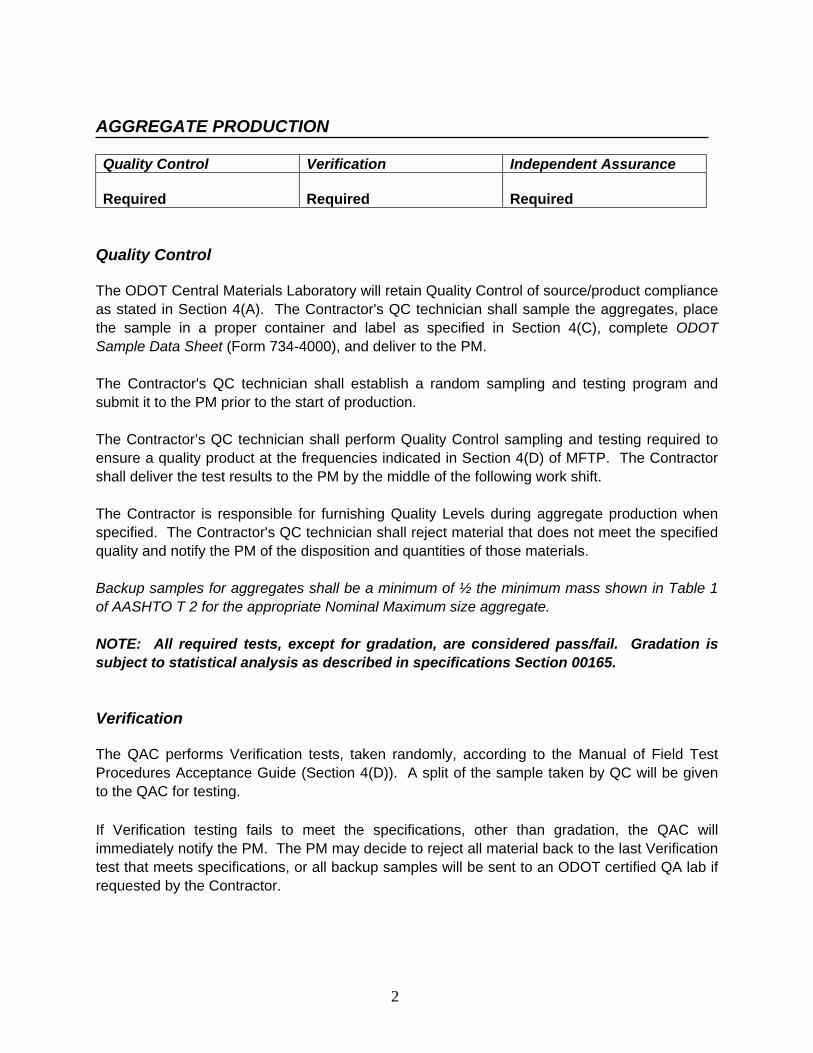
AGGREGATE PRODUCTION Quality Control Verification Independent Assurance Required
Required
Required
Quality Control The ODOT Central Materials Laboratory will retain Quality Control of source/product compliance as stated in Section 4(A). The Contractor's QC technician shall sample the aggregates, place the sample in a proper container and label as specified in Section 4(C), complete ODOT Sample Data Sheet (Form 734-4000), and deliver to the PM. The Contractor's QC technician shall establish a random sampling and testing program and submit it to the PM prior to the start of production. The Contractor’s QC technician shall perform Quality Control sampling and testing required to ensure a quality product at the frequencies indicated in Section 4(D) of MFTP. The Contractor shall deliver the test results to the PM by the middle of the following work shift. The Contractor is responsible for furnishing Quality Levels during aggregate production when specified. The Contractor's QC technician shall reject material that does not meet the specified quality and notify the PM of the disposition and quantities of those materials. Backup samples for aggregates shall be a minimum of ½ the minimum mass shown in Table 1 of AASHTO T 2 for the appropriate Nominal Maximum size aggregate. NOTE: All required tests, except for gradation, are considered pass/fail. Gradation is subject to statistical analysis as described in specifications Section 00165. Verification The QAC performs Verification tests, taken randomly, according to the Manual of Field Test Procedures Acceptance Guide (Section 4(D)). A split of the sample taken by QC will be given to the QAC for testing. If Verification testing fails to meet the specifications, other than gradation, the QAC will immediately notify the PM. The PM may decide to reject all material back to the last Verification test that meets specifications, or all backup samples will be sent to an ODOT certified QA lab if requested by the Contractor.
2
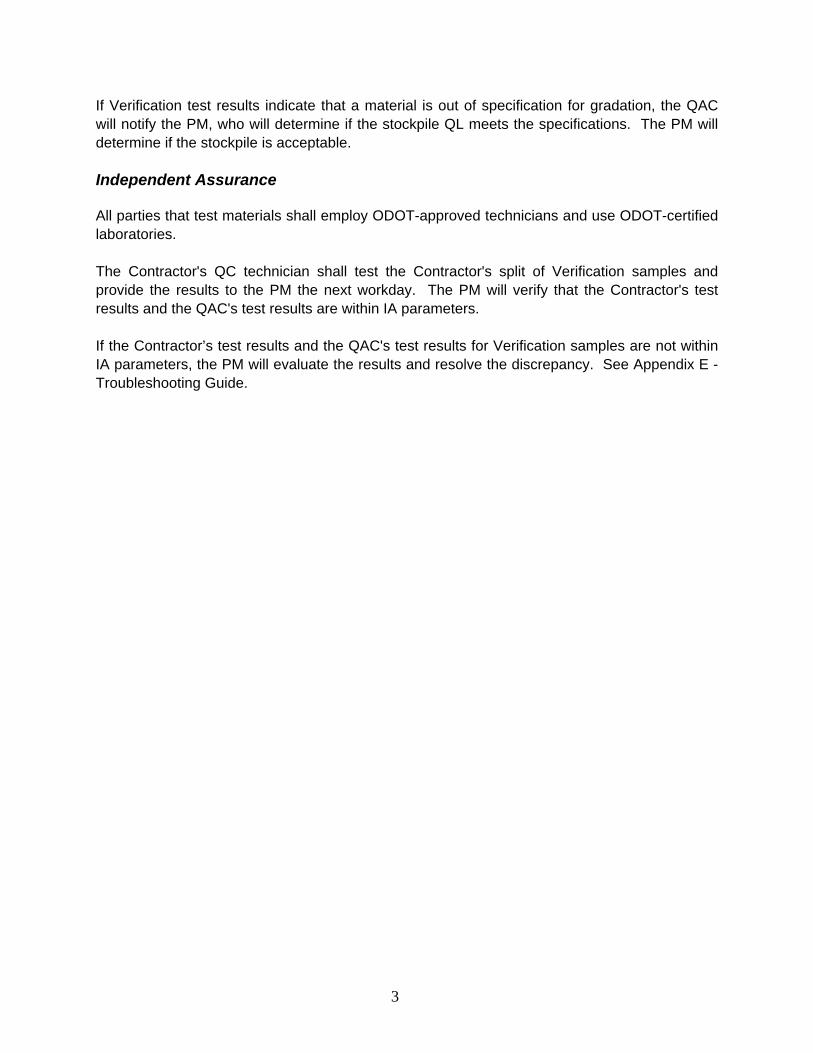
If Verification test results indicate that a material is out of specification for gradation, the QAC will notify the PM, who will determine if the stockpile QL meets the specifications. The PM will determine if the stockpile is acceptable. Independent Assurance All parties that test materials shall employ ODOT-approved technicians and use ODOT-certified laboratories. The Contractor's QC technician shall test the Contractor's split of Verification samples and provide the results to the PM the next workday. The PM will verify that the Contractor's test results and the QAC's test results are within IA parameters. If the Contractor’s test results and the QAC's test results for Verification samples are not within IA parameters, the PM will evaluate the results and resolve the discrepancy. See Appendix E - Troubleshooting Guide.
3
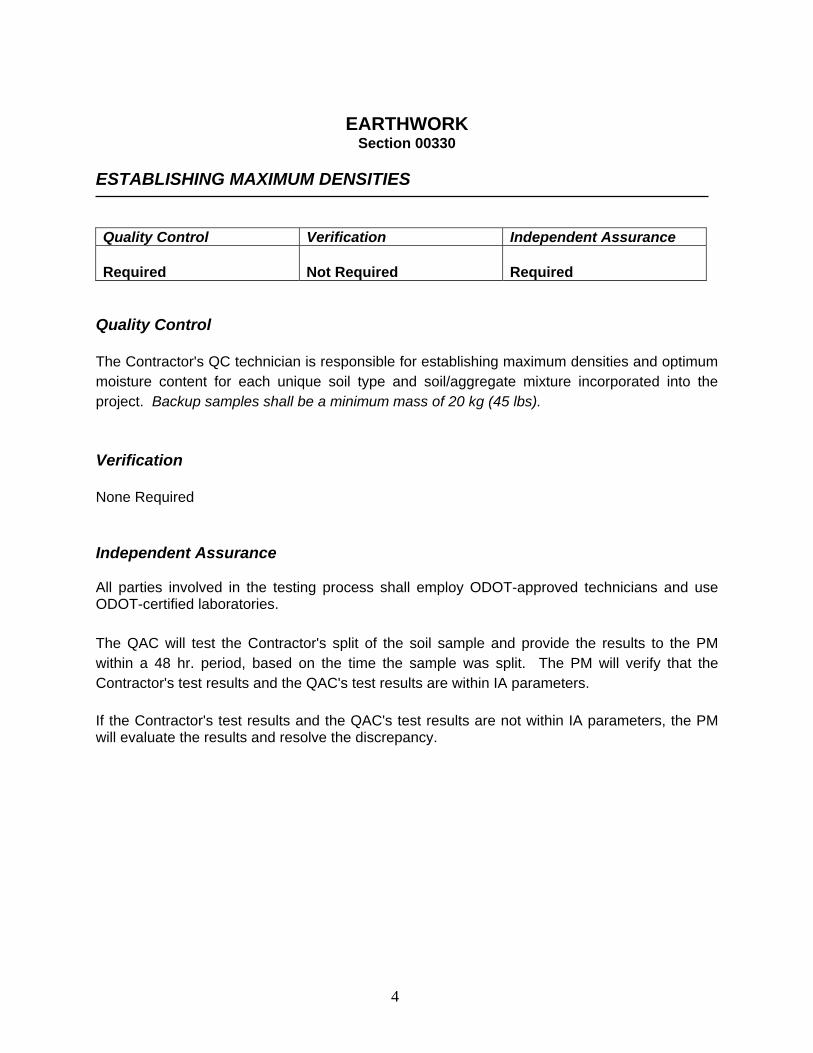
EARTHWORK
Section 00330 ESTABLISHING MAXIMUM DENSITIES Quality Control Verification Independent Assurance Required
Not Required
Required
Quality Control The Contractor's QC technician is responsible for establishing maximum densities and optimum moisture content for each unique soil type and soil/aggregate mixture incorporated into the project. Backup samples shall be a minimum mass of 20 kg (45 lbs). Verification None Required Independent Assurance All parties involved in the testing process shall employ ODOT-approved technicians and use ODOT-certified laboratories. The QAC will test the Contractor's split of the soil sample and provide the results to the PM within a 48 hr. period, based on the time the sample was split. The PM will verify that the Contractor's test results and the QAC's test results are within IA parameters. If the Contractor's test results and the QAC's test results are not within IA parameters, the PM will evaluate the results and resolve the discrepancy.
4
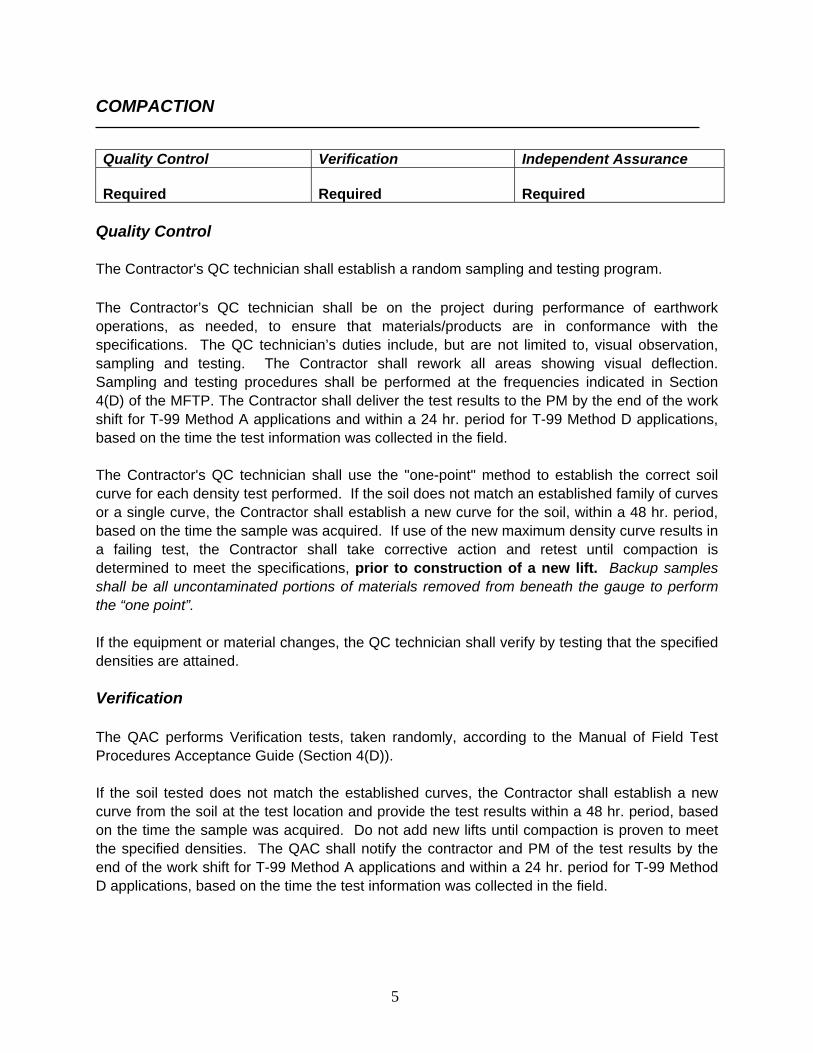
COMPACTION Quality Control Verification Independent Assurance Required
Required
Required
Quality Control The Contractor's QC technician shall establish a random sampling and testing program. The Contractor’s QC technician shall be on the project during performance of earthwork operations, as needed, to ensure that materials/products are in conformance with the specifications. The QC technician’s duties include, but are not limited to, visual observation, sampling and testing. The Contractor shall rework all areas showing visual deflection. Sampling and testing procedures shall be performed at the frequencies indicated in Section 4(D) of the MFTP. The Contractor shall deliver the test results to the PM by the end of the work shift for T-99 Method A applications and within a 24 hr. period for T-99 Method D applications, based on the time the test information was collected in the field. The Contractor's QC technician shall use the "one-point" method to establish the correct soil curve for each density test performed. If the soil does not match an established family of curves or a single curve, the Contractor shall establish a new curve for the soil, within a 48 hr. period, based on the time the sample was acquired. If use of the new maximum density curve results in a failing test, the Contractor shall take corrective action and retest until compaction is determined to meet the specifications, prior to construction of a new lift. Backup samples shall be all uncontaminated portions of materials removed from beneath the gauge to perform the “one point”. If the equipment or material changes, the QC technician shall verify by testing that the specified densities are attained. Verification The QAC performs Verification tests, taken randomly, according to the Manual of Field Test Procedures Acceptance Guide (Section 4(D)). If the soil tested does not match the established curves, the Contractor shall establish a new curve from the soil at the test location and provide the test results within a 48 hr. period, based on the time the sample was acquired. Do not add new lifts until compaction is proven to meet the specified densities. The QAC shall notify the contractor and PM of the test results by the end of the work shift for T-99 Method A applications and within a 24 hr. period for T-99 Method D applications, based on the time the test information was collected in the field.
5

If the density test fails, the Contractor shall identify the limits of failing compaction, take corrective action, and notify the PM. The PM will schedule a new Verification test. Do not add new lifts until the Verification tests demonstrate that specified densities exist. Independent Assurance All parties involved in the testing process shall employ ODOT-approved technicians, use ODOT-certified labs, and use ODOT-calibrated or calibration verified by ODOT, nuclear density gauge(s).
6
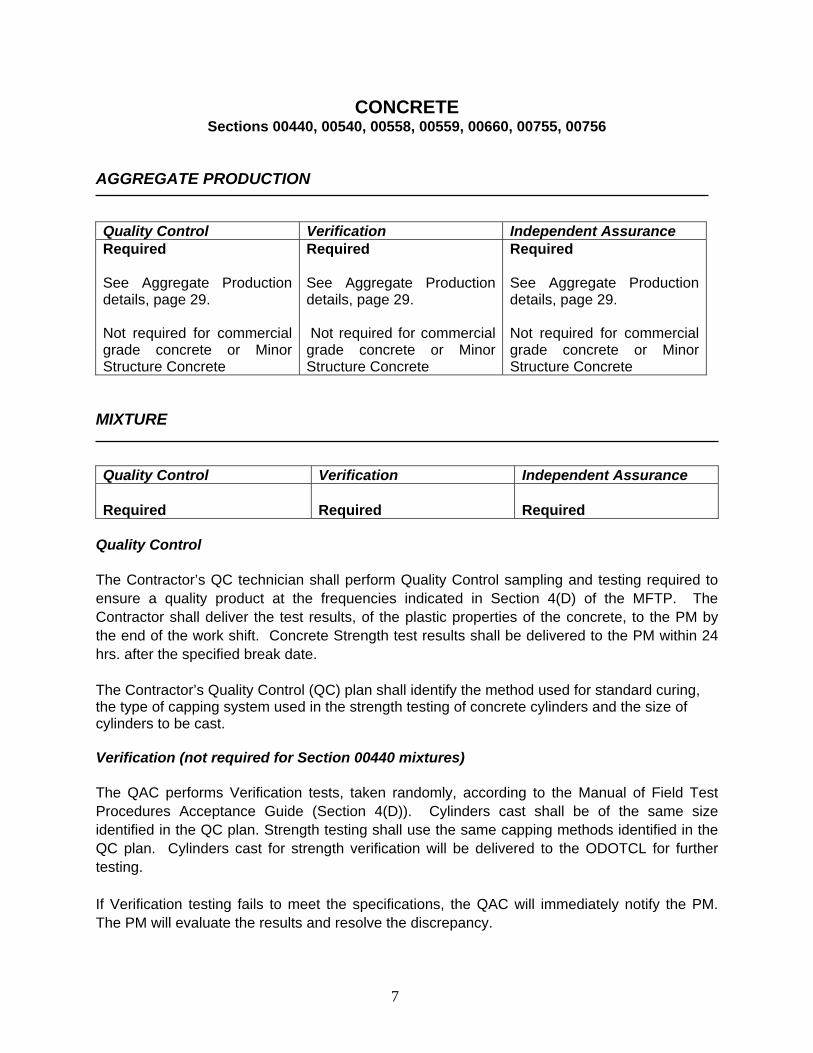
CONCRETE Sections 00440, 00540, 00558, 00559, 00660, 00755, 00756
AGGREGATE PRODUCTION Quality Control Verification Independent Assurance Required See Aggregate Production details, page 29. Not required for commercial grade concrete or Minor Structure Concrete
Required See Aggregate Production details, page 29. Not required for commercial grade concrete or Minor Structure Concrete
Required See Aggregate Production details, page 29. Not required for commercial grade concrete or Minor Structure Concrete
MIXTURE Quality Control Verification Independent Assurance Required
Required
Required
Quality Control The Contractor’s QC technician shall perform Quality Control sampling and testing required to ensure a quality product at the frequencies indicated in Section 4(D) of the MFTP. The Contractor shall deliver the test results, of the plastic properties of the concrete, to the PM by the end of the work shift. Concrete Strength test results shall be delivered to the PM within 24 hrs. after the specified break date. The Contractor’s Quality Control (QC) plan shall identify the method used for standard curing, the type of capping system used in the strength testing of concrete cylinders and the size of cylinders to be cast. Verification (not required for Section 00440 mixtures) The QAC performs Verification tests, taken randomly, according to the Manual of Field Test Procedures Acceptance Guide (Section 4(D)). Cylinders cast shall be of the same size identified in the QC plan. Strength testing shall use the same capping methods identified in the QC plan. Cylinders cast for strength verification will be delivered to the ODOTCL for further testing. If Verification testing fails to meet the specifications, the QAC will immediately notify the PM. The PM will evaluate the results and resolve the discrepancy.
7

Independent Assurance All parties involved in the testing process shall employ ODOT-approved technicians and use ODOT-certified laboratories. The PM will perform random inspections to ensure that the contractor’s Quality Control plan is followed. The Contractor’s QC technician shall test the same load and portion of load from which the Verification samples are taken. This testing will be for plastic properties and strength testing. QC technician shall immediately report the results of the plastic properties testing to the QAC. The QAC will verify that the contractor’s plastic properties test results and the QAC’s plastic properties test results are within IA parameters. If the Contractor’s plastic properties test results and the QAC’s plastic properties test results for the Verification sample are not within IA parameters, the QAC will evaluate the results, resolve the discrepancy and notify the PM of the resolution. The QAC test results, of the plastic properties of the concrete, or the investigation of IA issues will be given to the PM by the end of the work shift, if an agency representative is available. The Contractor’s QC technician shall make and cure three (3) cylinders of the same size identified in the QC plan. Strength testing of the three concrete cylinders shall be in accordance with AASHTO T-22, using the same capping method identified in the QC plan. The PM shall compare the Contractor’s results for these cylinders to the Verification cylinders and to the on going Quality Control. The PM shall resolve discrepancies. Note: On a single truck placement when Verification/IA is performed by the Region Quality Assurance Lab the contractor’s test results may be used for Normal Quality Control testing.
8
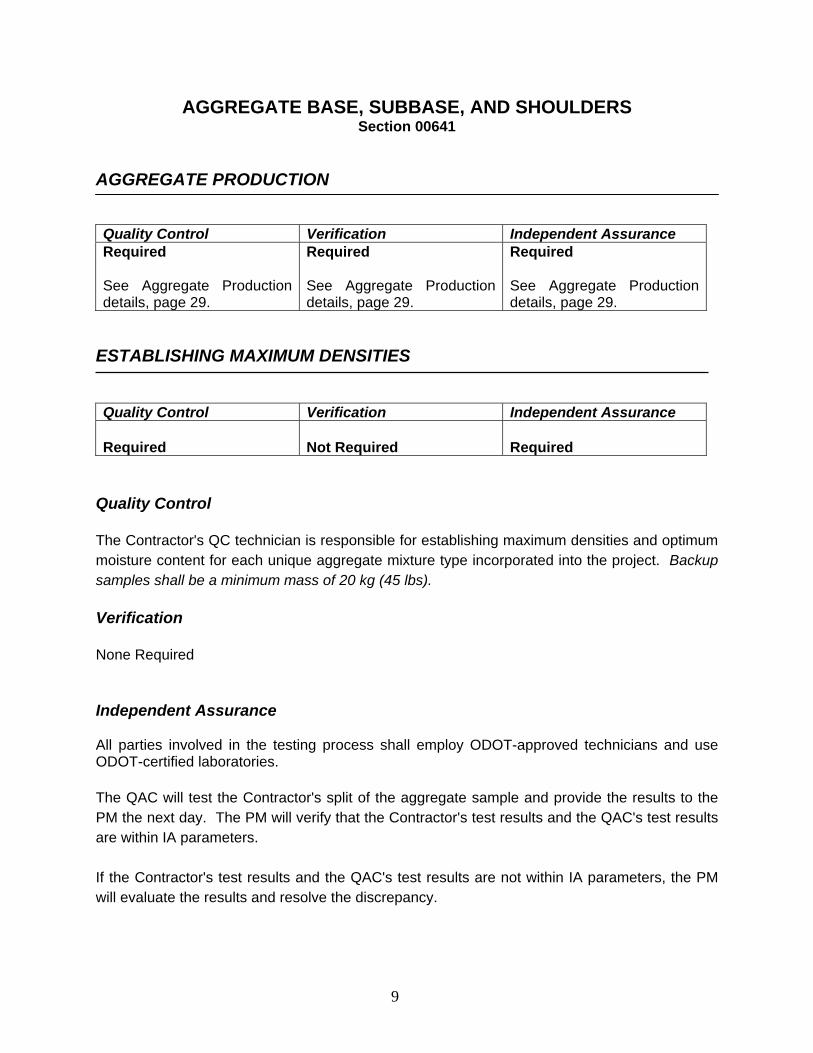
AGGREGATE BASE, SUBBASE, AND SHOULDERS Section 00641
AGGREGATE PRODUCTION Quality Control Verification Independent Assurance Required See Aggregate Production details, page 29.
Required See Aggregate Production details, page 29.
Required See Aggregate Production details, page 29.
ESTABLISHING MAXIMUM DENSITIES Quality Control Verification Independent Assurance Required
Not Required
Required
Quality Control The Contractor's QC technician is responsible for establishing maximum densities and optimum moisture content for each unique aggregate mixture type incorporated into the project. Backup samples shall be a minimum mass of 20 kg (45 lbs). Verification None Required Independent Assurance All parties involved in the testing process shall employ ODOT-approved technicians and use ODOT-certified laboratories. The QAC will test the Contractor's split of the aggregate sample and provide the results to the PM the next day. The PM will verify that the Contractor's test results and the QAC's test results are within IA parameters. If the Contractor's test results and the QAC's test results are not within IA parameters, the PM will evaluate the results and resolve the discrepancy.
9
AGGREGATE MIXTURE Quality Control Verification Independent Assurance Required
Required
Required
Quality Control The Contractor's QC technician shall establish a random sampling and testing program and submit it to the PM prior to the start of production. The Contractor's QC technician shall perform Quality Control sampling and testing required to ensure a quality product at the frequencies indicated in Section 4(D) of the MFTP. The Contractor shall deliver the test results to the PM by middle of the following work shift. Backup samples shall be a minimum mass shown in Table 1 of T 255 / T 265 and kept in an airtight container. Verification The QAC performs Verification tests, taken randomly, according to the Manual of Field Test Procedures Acceptance Guide (Section 4(D)). If the moisture content exceeds the limits according to specification, the Contractor shall, take corrective action, and notify the PM. The PM will schedule a new Verification test. Independent Assurance All parties that test materials shall employ ODOT-approved technicians and use ODOT-certified laboratories. If the Contractors test results and the QAC's test results for Verification samples are not within IA parameters, the PM will evaluate the results and resolve the discrepancy. See Appendix E - Troubleshooting Guide.
10
COMPACTION
Quality Control Verification Independent Assurance Required
Required
Required
Quality Control The Contractor's QC technician shall establish a random sampling and testing program and submit it to the PM prior to the start of production. The Contractor shall perform Quality Control sampling and testing required to ensure a quality product at the frequencies indicated in Section 4(D) of the MFTP. The Contractor shall deliver the test results to the PM on the same day the testing is performed. The Contractor's QC technician shall also perform the following:
• Use the test procedures applicable for determination of the maximum density for this material indicated in Section 4(D) of the MFTP. • Establish a rolling pattern to provide the specified compaction • Stop placement if the specified densities are not met
Verification The QAC performs Verification tests, taken randomly, according to the Manual of Field Test Procedures Acceptance Guide (Section 4(D)). If the density test fails, the Contractor shall identify the limits of failing compaction, take corrective action, and notify the PM. The PM will schedule a new Verification test. Do not add new lifts until the Verification test demonstrates that the specified densities exist. Independent Assurance All parties involved in the testing process shall employ ODOT-approved technicians, use ODOT-certified laboratories, and use ODOT-calibrated or calibration verified by ODOT, nuclear moisture density gauge(s).
11
EMULSIFIED ASPHALT PRODUCTS/MATERIALS
Sections 00710, 00712, 00715 and 00730 AGGREGATE PRODUCTION Quality Control Verification Independent Assurance Required See Aggregate Production details, page 29.
Required See Aggregate Production details, page 29.
Required See Aggregate Production details, page 29.
EMULSIFIED ASPHALT CEMENT Quality Control Verification Independent Assurance Required
Not Required
Not Required
Quality Control Sample all required materials as specified in Sections 4(C) and 4(D). Complete ODOT Sample Data Sheet (Form 734-4000), place in the proper containers and label as specified in Section 4(C), and deliver to the PM by the middle of the following work shift.
12
EMULSIFIED ASPHALT CONCRETE PAVEMENT (EAC) Section 00735
AGGREGATE PRODUCTION Quality Control Verification Independent Assurance Required See Aggregate Production details, page 29.
Required See Aggregate Production details, page 29.
Required See Aggregate Production details, page 29.
MIXTURE PRODUCTION Quality Control Verification Independent Assurance Required
Required
Required
Quality Control The Contractor's QC technician shall establish a random sampling and testing program and submit it to the PM prior to the start of production. The Contractor's QC technician shall perform Quality Control sampling and testing required to ensure a quality product at the frequencies indicated in Section 4(D) of the MFTP. The Contractor shall deliver the test results to the PM by the middle of the following work shift. Backup samples for aggregates shall be a minimum of ½ the minimum mass shown in Table 1 of AASHTO T 2 for the appropriate Nominal Maximum size aggregate. The Contractor's QC technician is responsible for monitoring plant operation to ensure that specification materials are delivered to the project. Monitoring activities may include, but are not limited to, the following:
• Calibrate the asphalt plant • Maintain an inventory of materials • Control segregation in silo(s) and truck loading operations • Reject any mixture that is visually defective. Inform the PM of the quantity and disposition of the rejected material • Sample all required materials as specified in Sections 4(C) and 4(D), (e.g. liquid asphalt, emulsion, cement, tack, etc.), place in the proper container and label as specified in Section 4(C), complete ODOT Sample Data Sheet (Form 734-4000), and deliver to the PM by the middle of the following work shift.
13
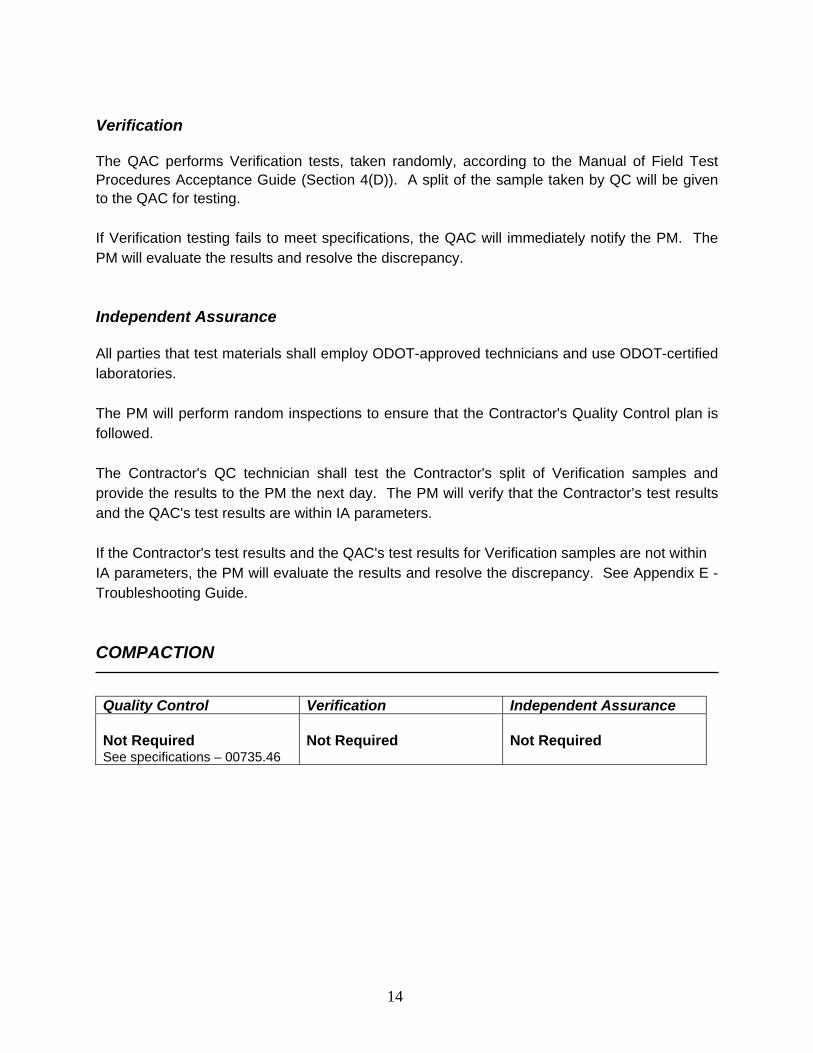
Verification The QAC performs Verification tests, taken randomly, according to the Manual of Field Test Procedures Acceptance Guide (Section 4(D)). A split of the sample taken by QC will be given to the QAC for testing. If Verification testing fails to meet specifications, the QAC will immediately notify the PM. The PM will evaluate the results and resolve the discrepancy. Independent Assurance All parties that test materials shall employ ODOT-approved technicians and use ODOT-certified laboratories. The PM will perform random inspections to ensure that the Contractor's Quality Control plan is followed. The Contractor's QC technician shall test the Contractor's split of Verification samples and provide the results to the PM the next day. The PM will verify that the Contractor’s test results and the QAC's test results are within IA parameters. If the Contractor's test results and the QAC's test results for Verification samples are not within IA parameters, the PM will evaluate the results and resolve the discrepancy. See Appendix E - Troubleshooting Guide. COMPACTION Quality Control Verification Independent Assurance Not Required See specifications – 00735.46
Not Required
Not Required
14
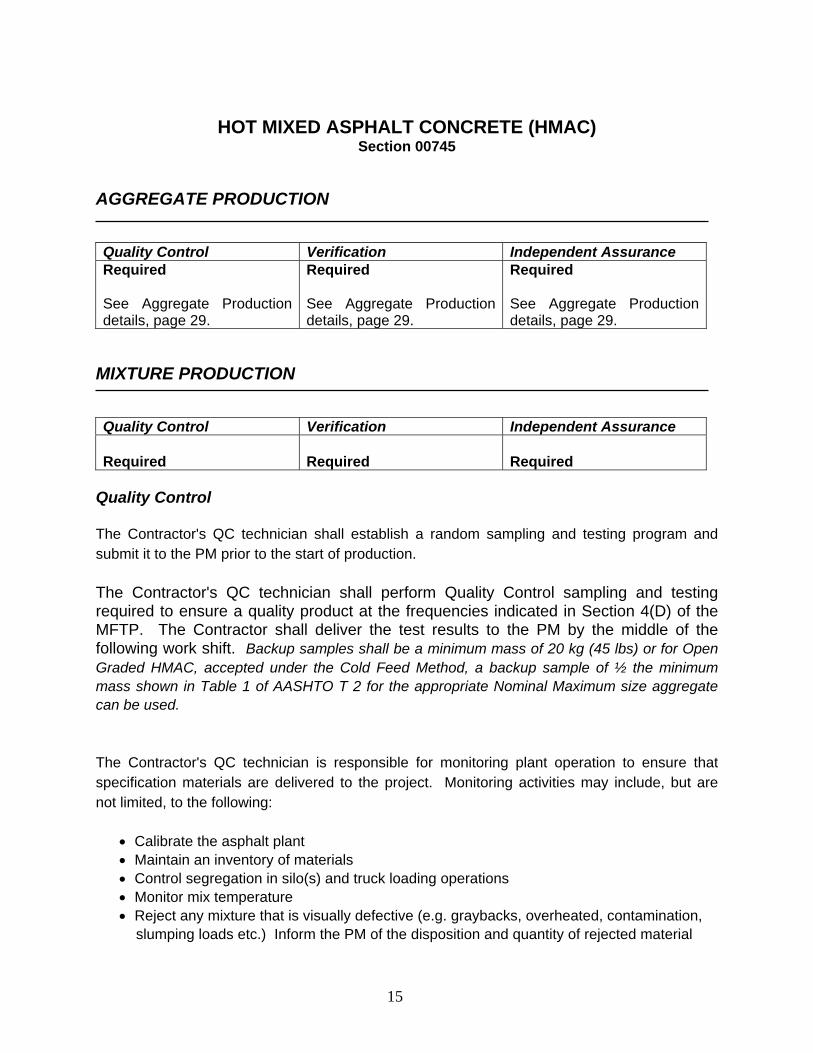
HOT MIXED ASPHALT CONCRETE (HMAC)
Section 00745 AGGREGATE PRODUCTION Quality Control Verification Independent Assurance Required See Aggregate Production details, page 29.
Required See Aggregate Production details, page 29.
Required See Aggregate Production details, page 29.
MIXTURE PRODUCTION Quality Control Verification Independent Assurance Required
Required
Required
Quality Control The Contractor's QC technician shall establish a random sampling and testing program and submit it to the PM prior to the start of production. The Contractor's QC technician shall perform Quality Control sampling and testing required to ensure a quality product at the frequencies indicated in Section 4(D) of the MFTP. The Contractor shall deliver the test results to the PM by the middle of the following work shift. Backup samples shall be a minimum mass of 20 kg (45 lbs) or for Open Graded HMAC, accepted under the Cold Feed Method, a backup sample of ½ the minimum mass shown in Table 1 of AASHTO T 2 for the appropriate Nominal Maximum size aggregate can be used. The Contractor's QC technician is responsible for monitoring plant operation to ensure that specification materials are delivered to the project. Monitoring activities may include, but are not limited, to the following:
• Calibrate the asphalt plant • Maintain an inventory of materials • Control segregation in silo(s) and truck loading operations • Monitor mix temperature • Reject any mixture that is visually defective (e.g. graybacks, overheated, contamination, slumping loads etc.) Inform the PM of the disposition and quantity of rejected material
15
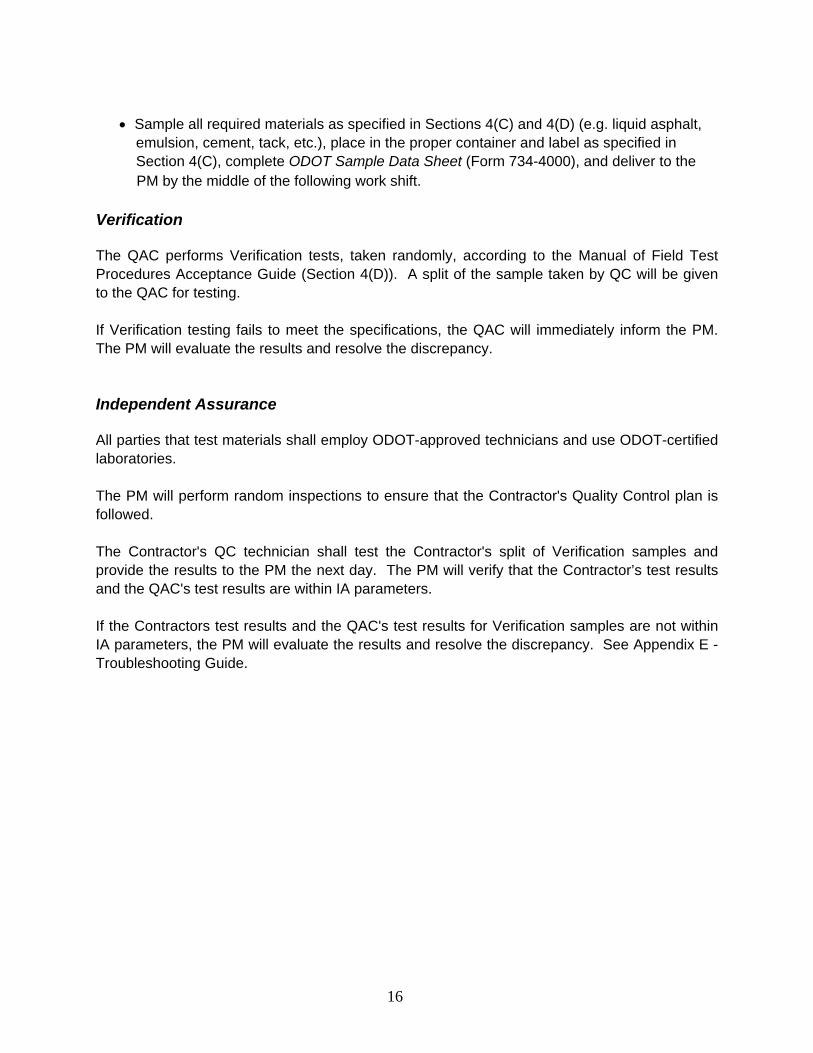
• Sample all required materials as specified in Sections 4(C) and 4(D) (e.g. liquid asphalt, emulsion, cement, tack, etc.), place in the proper container and label as specified in Section 4(C), complete ODOT Sample Data Sheet (Form 734-4000), and deliver to the
PM by the middle of the following work shift. Verification The QAC performs Verification tests, taken randomly, according to the Manual of Field Test Procedures Acceptance Guide (Section 4(D)). A split of the sample taken by QC will be given to the QAC for testing. If Verification testing fails to meet the specifications, the QAC will immediately inform the PM. The PM will evaluate the results and resolve the discrepancy. Independent Assurance All parties that test materials shall employ ODOT-approved technicians and use ODOT-certified laboratories. The PM will perform random inspections to ensure that the Contractor's Quality Control plan is followed. The Contractor's QC technician shall test the Contractor's split of Verification samples and provide the results to the PM the next day. The PM will verify that the Contractor’s test results and the QAC's test results are within IA parameters. If the Contractors test results and the QAC's test results for Verification samples are not within IA parameters, the PM will evaluate the results and resolve the discrepancy. See Appendix E - Troubleshooting Guide.
16
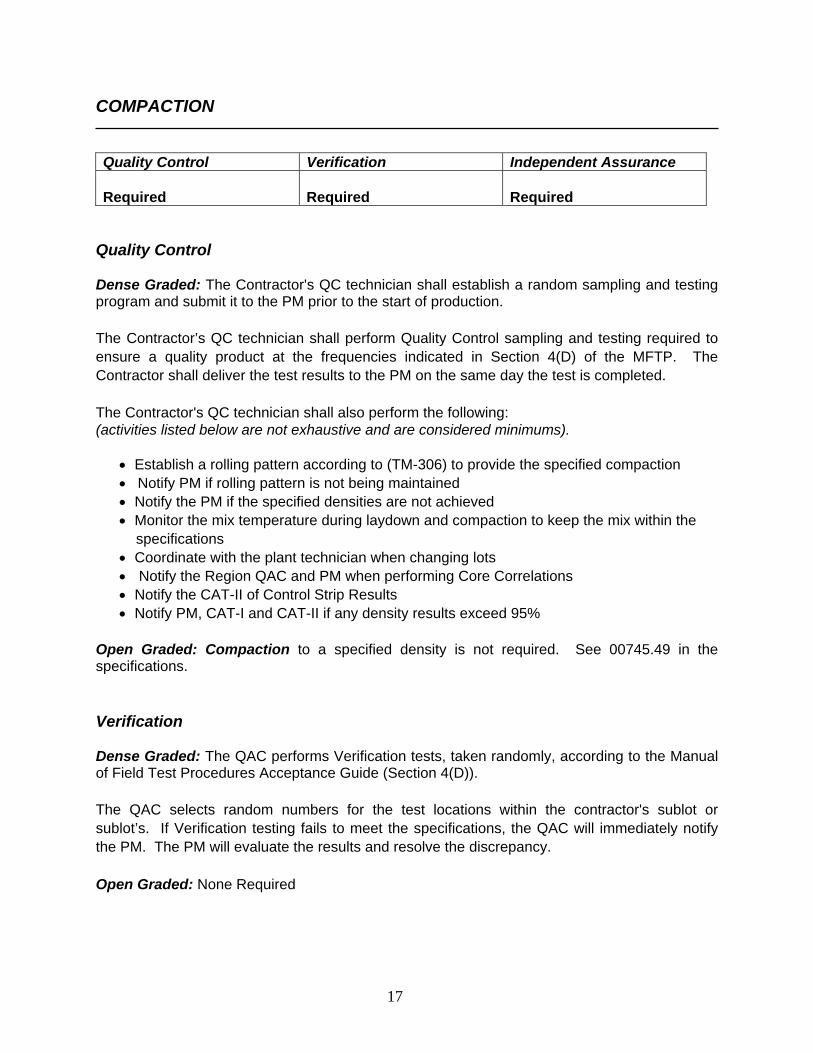
COMPACTION Quality Control Verification Independent Assurance Required
Required
Required
Quality Control Dense Graded: The Contractor's QC technician shall establish a random sampling and testing program and submit it to the PM prior to the start of production. The Contractor’s QC technician shall perform Quality Control sampling and testing required to ensure a quality product at the frequencies indicated in Section 4(D) of the MFTP. The Contractor shall deliver the test results to the PM on the same day the test is completed. The Contractor's QC technician shall also perform the following: (activities listed below are not exhaustive and are considered minimums).
• Establish a rolling pattern according to (TM-306) to provide the specified compaction • Notify PM if rolling pattern is not being maintained • Notify the PM if the specified densities are not achieved • Monitor the mix temperature during laydown and compaction to keep the mix within the specifications • Coordinate with the plant technician when changing lots • Notify the Region QAC and PM when performing Core Correlations • Notify the CAT-II of Control Strip Results • Notify PM, CAT-I and CAT-II if any density results exceed 95%
Open Graded: Compaction to a specified density is not required. See 00745.49 in the specifications. Verification Dense Graded: The QAC performs Verification tests, taken randomly, according to the Manual of Field Test Procedures Acceptance Guide (Section 4(D)). The QAC selects random numbers for the test locations within the contractor's sublot or sublot’s. If Verification testing fails to meet the specifications, the QAC will immediately notify the PM. The PM will evaluate the results and resolve the discrepancy. Open Graded: None Required
17

Independent Assurance Dense Graded: All parties involved in the testing process shall employ ODOT-approved technicians, use ODOT-certified labs and use ODOT-calibrated or calibration verified by ODOT, nuclear density gauge(s). Open Graded: None Required
18
APPENDIX D
ODOT APPROVED COMMERCIAL AGGREGATE PRODUCT PROGRAM
ODOT Policy
For Aggregate Production Testing of Commercially available Aggregate Products Commercial Aggregate Products—Aggregates not specifically manufactured and stockpiled for use on ODOT or Local Agency projects from a single source. When requested by a supplier and the Region QAC agrees that it is to the benefit of the Department, a product may be put on the ODOT Approved Commercial Aggregate Product Program (OACAPP) using the following guidelines, or as modified and approved. When a commercial aggregate supplier is proposing to produce an Aggregate Base Product(s) as an ODOT Approved Commercial Product, a plan may be submitted for performing AASHTO T 99. This plan shall replace the requirements in the FTMAG for that source. A commercial aggregate supplier shall have an ODOT-certified QC technician sample, on a random basis, each stockpile being manufactured by the supplier and test the sample in an ODOT- certified laboratory. The commercial aggregate supplier shall submit to the Region QAC, in the Region the source is located, a Quality Control Plan. The Region QAC is responsible for reviewing and approving that Quality Control Plan. The products covered by the approved Quality Control Plan are classified as ODOT Approved Commercial Products. The supplier's QC technician shall perform all sampling and testing for each product at the minimum frequencies shown in the Field Tested Materials Acceptance Guide (Section 4(D)). When materials are produced at very high production rates, the Region QAC may allow the minimum frequency to be altered after the supplier submits a written proposal to do so. The written proposal shall detail the proposed sampling and testing frequencies and shall describe how uniformity of production will be assured. The supplier shall retain backup samples, for the previous 10 sublots, until the test results are verified by the Region QA group or as required by the Region QAC. The supplier shall obtain under the supervision of the Region QAC, at the minimum required frequency: samples for product compliance and then the Region QAC shall submit them for testing at the Central Materials Laboratory. The supplier shall send requests to waive tests, as allowed by the specifications, to the Region QAC, who will notify the appropriate people of any waivers granted. Waivers will apply to all projects which are supplied from that source. When a waiver requires periodic testing by the
19
supplier, the test results shall be sent to the Region QAC. All specified tests shall be performed for Verification and Independent Assurance Testing. The supplier shall submit all requests for changes in production sizes to the Region QAC, who will obtain the approval of the discipline specific engineer. If approved, changes in produced sizes will apply to all projects which are supplied from that source. The commercial supplier shall maintain files of all QC tests for each stockpile. It shall enter the test results into the ODOT Stat. Spec. program to calculate the Quality Level for each stockpile. The QL for gradation shall meet the requirements of Section 00165 of the Oregon Standard Specifications For Construction. Other required test results shall be shown in columns to the right in the program. The Region QAC may, with approval of the QAE, accept alternate means of statistical analysis for the supplier’s product. The supplier shall deliver weekly or at an interval determined by the Region QAC, copies of the ongoing sublot test results, along with the ongoing QL (Quality Levels). The supplier shall keep the Region QAC informed about production schedules so that Verification testing can be scheduled. The Region QA group will obtain Verification samples on a random basis and the split of this Verification sample shall be ran by the supplier’s QC technician to test for Independent Assurance. The test results shall be available within 24 hours of the time of sampling. If the test results indicate that the produced material meets quality requirements and the results are within IA parameters, the QAC may allow all backup QC samples prior to the Verification sample to be discarded. The Region QAC will randomly audit the QC files to verify that the Quality Levels reflect actual test results. The Region QAC will retain QL information for each stockpile along with Verification and IA test results. When requested by the Project Manager, the Region QAC will send a memo to the PM verifying and identifying what materials where produced under the ODOT APPROVED COMMERCIAL AGGREGATE PRODUCT PROGRAM and meet the required specifications. If Verification test results, for tests other than gradation, do not meet the quality requirements, no material from the stockpile in question will be accepted until the problem has been resolved. The Region QAC will notify each PM, for the projects being supplied from that source, that the material in question shall not be used until the problem has been satisfactorily resolved. The resolution may involve rejection of the stockpile if the investigation confirms non-specification material. If the material test results do not meet IA parameters, the Region QAC will work with the supplier to resolve the problem. If the supplier is not following their Quality Control Plan or product(s) fails to meet compliance testing requirements. The Region QAC may discontinue that suppliers Commercial Product status of those products effected. That product’s status will be returned upon approval of the Region QAC. The Region QAC will provide data to other Regions that are using material considered ODOT Approved Commercial Products.
20
APPENDIX E - TROUBLESHOOTING GUIDE The following information is a guide to assist in evaluation of discrepancies that occur between the contractors QC test results and the Region verification results. The information is only a guide and is not necessarily a complete listing of all potential areas to be investigated. AGGREGATE TESTING 1. Compare both test results for sample initial wet weights, initial dry weights, after wash dry
weights, individual sieve weights and any tare weights if used. May point to a transposed or incorrectly recorded weight. May point to a splitting error.
2. Check all mathematics (% passing based on initial dry weight?) 3. Check constant mass calculations if available. 4. Check sieve loss calculations. 5. Check sample size meets minimum requirements. 6. If gradation problems, are the screens overloaded? 7. Is the equipment calibrated correctly, or within specification? 8. Is the equipment operating correctly? Check mechanical sieve shakers by hand sieving
procedure. 9. Is the current test procedure being used and followed correctly by both parties? 10. If wash procedure required, check wash loss. May point to error in initial dry weight. 11. Sum the QC and QA individual sieve weights and recalculate the gradation based on the
total of the two test results. Does this match closely to on going QL mean values? If so may indicate splitting bias.
12. Re-test the sample. 13. If the original material is saved, exchange samples and re-test. This action might reveal equipment or procedural discrepancies. 14. Re-test the split in the other technician's lab. This action might reveal equipment or procedural discrepancies. 15. Obtain the next sample and observe the sampling, splitting, equipment and testing procedures used by the technician. 16. Compare results to ongoing Quality Levels (or Statspec) mean values? May show a
problem with splitting. WOODWASTE TEST 1. Check mathematics. (% Woodwaste based on initial dry weight?) 2. Check constant mass calculations if available. 3. Was material decanted over the #40 screen during the wash process? 4. Was wood or deleterious material returned to the sample prior to shaking? 5. Compare results to ongoing Quality Levels (or Statspec) mean values? May show
a problem with splitting.
21
FRACTURE TEST 1. Check mathematics. (% Fracture based on correct weights?) 2. Were the correct specs used for the product being tested (HMAC-Single Fracture
and Base Aggregate-Combined Fracture)? 3. Did both parties test the same? (Splitting the sample or not splitting the sample.) 4. If samples not split, do F+Q+N match closely to the retained mass(es) for
gradation? 5. Do both parties have approximately the same amounts of F, Q, and N? If not may
indicate a difference in interpretation of fractured particles. 6. Swap samples and re-test. This action might reveal procedural discrepancies. 7. If results do not vary from originals, may point to a splitting error. 8. Check electronic balances. 9. Compare results to ongoing Quality Levels (or Statspec) mean values? May show
a problem with splitting. FLAT AND ELONGATED TEST 1. Check mathematics. (% FE based on correct weights?) 2. Did both parties test the same? (Based on individual screens during gradation
analysis and summed up or material recombined and split out with one evaluation) 3. Does MS closely match the retained masses for gradation (4.75mm (+ No. 4)
material) 4. Proper caliper ratio used by both parties? 5. Swap samples and re-test. This action might reveal procedural discrepancies. 6. If results do not vary from originals, may point to a splitting error. 7. Check electronic balances. 8. Check caliper for tight fit between points when closed and smooth operation of
armature. 9. Compare results to ongoing Quality Levels (or Statspec) mean values? May show a
problem with splitting. SAND EQUIVALENT TEST 1. Check mathematics. (SE based on correct readings? Results rounded up?) 2. Did both parties test at the same moisture content? (Screening and wetting the
sample to both parties satisfaction, prior to splitting, is recommended.) 3. Are both methods of shaking the same? (Mechanical versus hand.) 4. Check lab temperatures and SE solution age and temperature. When in doubt
observe technician prepare new batch of working solution. 5. Swap samples and re-test. This action might reveal procedural discrepancies. 6. Observe parties cleaning the +4.75mm (No. 4) material insuring fine particles are
removed. 7. If results do not vary from originals, may point to a splitting error. 8. Check shaking device for proper throw distance and proper number of strokes. 9. Check irrigation wand to insure good fluid flow from openings.
22
10. All clay materials being flushed into suspension? (Crushed aggregates tend to be more difficult to separate)
11. Check lab to insure SE tube is placed in a stable location free of vibration during the settlement period.
12. Digital timer being used? 13. Weighted foot assembly in good condition and properly lowered? 14. Graduated marks properly read? 15. Compare results to ongoing Quality Levels (or Statspec) mean values? May show a
problem with splitting. SOIL/AGGREGATE RELATIVE MAXIMUM DENSITY AND OPTIMUM MOISTURE DETERMINATIONS TEST 1. Check Test Method for Material size. Was correct method (A or D) used? 2. Did both parties use same technique? Was the sample initially oven-dried or air-
dried? Separate samples at each point or rescreen and recompact the same sample? Were samples tested immediately or were they “marinated” at different moistures overnight? Were samples compacted manually or mechanically?
3. Check mathematics. Correct mold factor used? 4. Check tare weights on molds/base plates. Collar removed? 5. Check electronic balances. 6. Check surface on which samples were compacted. Concrete or unyielding surface
used? 7. Check constant mass on individual samples if available. 8. If available, check planning sheets for correct moisture addition calculations. 9. Check plotting of data. Correct scale used. Dry densities plotted vs. dry basis
moistures. Wet and dry side slopes similar? 10. When held up to a light (or placed on a light table) do the two curve shapes match
closely? Same shape, but one curve plots higher and too the left, indicates different compaction energy consistently applied to samples.
11. Nickel radius used in the absence of data? 12. Was the passing 4.75 mm (no.4) or 19.00 mm (3/4”) material brushed off of the
retained 4.75 mm (no.4) or 19.00 mm (3/4”) material? 13. Swap passing 4.75 mm (no.4) or 19.00 mm (3/4”) observe each party perform the
sample preparation and compaction procedure. Correct moisture computed and material properly mixed? Correct layers and layer heights? Hammer dropped from the correct height? Correct number of blows? Correct trimming and cleaning of mold? Moisture samples obtained correctly tested?
23
COARSE AGGREGATE BULK SPECIFIC GRAVITY TEST 1. Check mathematics. Check tare weights. Was empty basket weighed in water or
“zeroed” in water? 2. Were samples oven dried prior to soaking? Were samples soaked approximately
the same length of time? 3. Do both parties have approximately the same Gsa? This indicates the difference is
probably in interpretation of the SSD point. 4. Check constant mass calculations on final dry weight if available. 5. Swap samples and observe each party perform the sample preparation procedure.
Include screening over a nested 6.3mm (1/4”) and 4.75mm (No. 4) sieve to check that both parties used the correct screen originally. Significant material passing the 4.75mm (No. 4) indicates too small of a screen was used. No material retained on the 4.75mm (No. 4) may indicate too large of screen was used.
6. Each party use the correct SSD point? Correct tare weights and sample weights? Correct water temperature and water level? Air bubbles shaken out? Basket not touching sides of tank? Suspension device not hanging on scale hole? No loss of material? Final dry sample cooled before weighing?
7. Check balances and thermometers. 8. How do values compare with pit history? COMPACTION OF EMBANKMENTS Verification of compaction is based more on visual acceptance while the physical test validates that what you have observed meets specification. This observation is part of QC acceptance when the technician signs the test report. It is also the duty of the project inspector and the QCCS to observe the operation to assure that they are in agreement with the QC technician. The QAT's testing, as appropriate and possible, validates the quality of the product and the validity of the physical testing and/or the visual deflection conclusions of the QC technician. 1. If isolated soft/pumping areas are noted, inform the project inspector. The project inspector
and the Contractor's QC technician should take corrective action. No Verification tests are to be taken until corrections have been made.
2. If the Verification test is taken and the one point proctor does not fit any of the curves used for Quality Control on the project, the QC technician should run a curve on the material from the Verification site so that the compaction can be calculated. 3. If; after calculating the compaction, the site does not meet specification but looks obviously compacted, the QCCS will review the soil curve and bulk density of the plus 4.75 mm (no.4) or 19.00mm (3/4”) material. If this does not resolve the issue, the QCCS may request the QAT to rerun the Contractor's soil curve and bulk density.
24
SOIL DENSITY TESTING 1. Check mathematics. 2. Does the one point fall on the curve used correctly? (2lbs/2% and one point on the
dry side of identified curve). 3. Both wet density shots within 2lbs? 4. Coarse Particles fit the rules for Method A or Method D? 5. Was a Corrected Dry Density calculation needed and calculation was based on the
original average wet density of the gauge? 6. Was the correct data used from the identified curve (Gsb and Absorption/Moisture)? 7. Observe testing in the field and look for the following: Random Representative
location selected? Correct site preparation? Correct drilling of the test hole? Correct placement and seating of the gauge? Correct data recorded? Excavation of test site to full depth of probe? Is moisture uniform in the excavated area?
8. Observe proper fabrication of the one point and look for the following: Proper screening of material? In-place moisture measured prior to addition of additional moisture if needed? Proper compaction of sample in correct mold? Stable surface for compaction of one point? Moisture sample taken from cut face? Proper moisture test performed based on material size?
9. Check equipment. Speedy moisture tester, balances and has density gauge been calibrated and calibration been verified by Region QA lab.
PROCESSED AGGREGATE DENSITY TESTING 1. Check mathematics. 2. Is the correct curve being used? Is the correct density information being used? 3. Are the wet density shots within 2 lbs? 4. Observe testing in the field and look for the following: Random Representative
location selected? Correct site preparation? Does in-place material appear to be uniform (segregated areas)? Correct drilling of the test hole? Correct placement and seating of the gauge? Correct data recorded?
5. Has the density gauge been calibrated and calibration verified by Region QA? HMAC TESTING The following should be considered in addition to the items listed in the Aggregate section. IGNITION OVEN – AC CONTENT 1. Check mathematics? 2. Was the correct calibration factor used? 3. Were calibration samples batched properly and calculations performed correctly? 4. Same method (A or B) used by both parties? 5. Was companion moisture used or sample dried prior to testing? 6. Sample have a clean burn? Sample achieve constant mass? 7. Check basket weights. Check sample size.
25
8. Check gradation results. The coarse half of a split will have a lower asphalt content than the fine half.
9. Ignition oven calibrated. Exhaust system clean. 10. Is the Oven set at the correct temperature? 11. Does the manufacture scale drift test meet parameters & are the filters cleaned? 12. Was the thermometer removed prior to Initial and Final Weighing? 13. Were the initial and final weights taken at the same temperatures? 14. Was the mix moisture removed from the initial mass reading? RICE GRAVITY TESTING 1. Check mathematics. 2. Check tare weights of pycnometers and lids. 3. Check sample sizes. 4. Check pycnometer calibration numbers. 5. Check equipment. Proper vacuum pressure? Calibrated thermometer? Check
balances. 6. Is the “dry back” procedure appropriate for this material? 7. Check gradation results. The coarse half of a split will have a higher Rice Gravity
than the fine half. BULK GRAVITY TESTING 1. Check mathematics. 2. Check sample heights. 3. Check measured volumes compared to heights. Tallest specimen should have
largest volume. 4. Check equipment. Proper suspension apparatus? Calibrated thermometers? Tank
overflow? Damp towel for SSD? 5. Check compaction equipment. Proper gyrations? Proper pressure? Proper angle
of gyration? 6. Check gradation results. The coarse half of a split will usually have a lower Bulk
Gravity than the fine half. 7. Observe testing. Swap samples and observe performing procedure. Watch for
immersion and SSD procedures. Is basket and wire assembly free floating? 8. If results do not vary from originals, may point to a splitting or compaction error. 9. If results vary from originals, may point to a technician or equipment error.
26
HMAC DENSITY TESTING Compaction Once the gauge has been initially calibrated, the QC technician should identify a location close to his/her office that can act as a reference. This site should be an area of flat concrete that can be tested. Test the gauge at this site prior to going to the project to assure that the gauge is still reading accurately. 1. Set the gauge on the flat concrete surface and scribe a line around the case. 2. Take a four-minute test on the site and document the result. (It's a good idea to paint the density on the concrete so that others may use it). Note: Verification is by independent sampling and testing and does not use a split sample. There is not opportunity to rework HMAC; therefore it is imperative to troubleshoot density testing issues immediately. QCCS (Checks) 1. Check mathematics. Correct MAMD used? Core Correlation factor applied if needed? 2. Check equipment. Gauge operating in the correct mode? Correct site preparation? Correct
placement and seating of the gauge? Footprint marked? Correct data recorded? Correct rotation of the gauge without touching the handle.
3. Has the Contractor's gauge been calibrated or verified by the Region QA group? 4. Is the Contractor's QC technician following the proper procedures (i.e. points sanded properly, gauge in the proper mode, is the gate-sticking, etc.)? 5. Does the first sublot MDT match the JMF MDT within reasonable parameters? (specification is 50 kg/m3 (3.0 lb/ft3)). This is really a large variation - check the asphalt content of the mixture. 6. If compaction is low, are there sufficient rollers to achieve compaction? 7. Is the rolling pattern compacting the whole panel, not just the center? 8. Is the laydown temperature correct according to the JMF or has temperature changed during production? Has there been a substantial change in lift thickness? 9. Is weather a factor (colder, wetter)? If any problems are found that cannot be resolved, the inspector or QCCS should contact the Region QA group immediately.
27

QAT (Checks) The QAT's duty is to verify compaction using separate, randomly selected sites within a sublot. There is no IA for nuclear density testing. Whether during random Verification testing, or when called by the QCCS, the QAT will: 1. Prior to leaving for the project, or periodically during the construction, perform two 1 min counts on the Region calibration blocks in the backscatter position. 2. On the project, choose two sites at random and perform the normal tests on these sites with both the QC and QA gauges. The average for each gauge when compared to the other should be within 24 kg/m3 (1.5 lb/ft3). 3. If the difference between the two gauges is greater than 24 kg/m3 (1.5 lb/ft3), the
Contractor's QC technician should rerun the tests while the QAT observes to detect any procedural errors.
4. If the two gauges are still not in agreement, immediately take both gauges back to the calibration blocks and check their calibration. (Take two one (1) minute counts on each block. The average of the two wet Densities should be within the tolerances given in TM-304 Annual Check). 5. If either gauge is out of calibration, recalibrate prior to project testing. 6. If the gauges are in calibration, run the hot substrate test on both gauges. There may be occasions when several sublots have been completed before Verification shows that the Contractor's results are suspect. In that case, always contact the QAC to work with the Project Manager to resolve.
28
Plastic Concrete Testing General For All Concrete Tests 1. Was the test started within prescribed time limits of obtaining the sample? 2. Were the QA and QC samples taken from the same portion of the load? 3. Was the sample adequately recombined if taken from two parts of the load? 4. Was the concrete covered if ambient conditions were adverse? 5. Was all equipment used within specification/tolerance, clean and damp prior to test? 6. Was excess water removed from the sampling container prior to obtaining the sample? Slump (T-119) 1. Once the test was started was it completed in the allotted 2 ½ minutes and immediately
measured? 2. Does Equipment meet specification? 3. Tamping rod w/hemispherical tip 4. Flat, rigid, non-absorbent base, level and on a surface free of vibration or disturbance (not a
warped water damaged piece of plywood) 5. Cone that is free of dents, rust damage and concrete build up on the inside 6. Correct amount of layers and quantity/volume in each layer? 7. Was each layer rodded 25 times extending into the preceding layer? 8. On the top layer, was a head kept above the top of the cone at all times? 9. Was the excess concrete cleaned away from the base of the cone prior to lifting? 10. Was the cone pulled too fast/slow? 11. Was the cone pulled straight with no twisting or lateral movement? 12. Was the measurement reading taken from the displaced original center? Note: If mix has 1 ½ inch or larger aggregate it must be removed by the wet sieve method prior to performing the test. Air Content (AASHTO T-152) 1. Was the test started within 5 minutes of obtaining the sample? 2. Has the air meter gauge been calibrated within the last three months? NOTE: The air meter calibration can be checked in the field. 3. Was the bowl filled in approximately equal 1/3 layers? 4. Was each layer rodded 25 times extending into the preceding layer? 5. Were the sides of the bowl tapped 10 to 15 times with a mallet after each layer had been
rodded? 6. Was the cover seal moistened and seated properly on the bowl? 7. Was water injected into the petcocks and meter rocked until no air bubbles appeared?
29
8. Was air pumped into the initial air chamber until it passed the initial pressure setting (as determined in the calibration process) and allowed to cool? Was any air noted seeping out of open petcocks at this time?
9. Was initial gauge adjusted to initial air pressure before opening main air valve? 10. Were the sides of the bowl tapped “smartly” during release of main air valve? 11. During release of main air valve was there any air leaking out the sides due to an
incomplete seal?
Temperature (AASHTO T-309) 1. Has the measuring devise been calibrated or verified for accuracy within the last year? 2. Was there adequate concrete cover around the measuring device sensor? 3. Was the concrete pressed around the measuring device at the surface? 4. Was the temperature recorded after a minimum of 2 minutes and the measuring device
allowed to stabilize? Unit Weight (AASHTO T-121) Since the unit weight test is usually performed in conjunction with the air content test, see steps 3, 4 and 5 under the air content portion of this guide. 1. Check math 2. Was the dry mass of the measure accurately recorded? 3. Has the measure’s volume been accurately calibrated? 4. Was a strike off plate used to create a smooth surface free of voids and level with the rim? 5. Is the scale accurate? Cross check QA and QC scales to field verify accurate measurement.
30
APPENDIX F
OREGON DEPARTMENT OF TRANSPORTATION CONSTRUCTION SECTION
TECHNICIAN COMPLAINT PROCESS
The Oregon Department of Transportation’s Technician Certification program is intended to assure qualified personnel are performing all materials testing for ODOT construction projects. In addition to certified technicians, we need a means to address concerns that are raised regarding those technicians not following approved procedures. The Technician Complaint Process will provide guidance on how to deal with these concerns. It should be understood that the intent of the process is to resolve differences of opinion on appropriate procedures at the lowest possible level. Technicians are encouraged to work together to resolve any differences they might have. Only when those issues can not be resolved at the project level should they be raised to the level of filling an official complaint. It should be understood that in no way is the formal complaint process intended to remove any authority the Project Manager may have under an existing contract. Any individual may file a complaint regarding testing procedures or practices. The first step when filling a complaint is to decide whether the issue is a case of “Neglect” or “Abuse”. “Neglect” is defined as unintentional deviations from approved procedures, while “abuse” is defined as intentional deviations from approved procedures. Once a decision is made on the type of offence, the appropriate process for dealing with the issue will be followed. Processes for dealing with both Abuse and Neglect are outlined below: Complaint Process for Abuse
Because abuse is defined as intentional, the process for dealing with instances of abuse will be more formal and penalties more severe than for instances of neglect. Step 1: When an instance of abuse is suspected, the issue shall be raised immediately to the ODOT Quality Assurance Engineer (QAE). The QAE will investigate the issue and make a preliminary determination on whether it actually should be considered abuse or neglect. If the issue is determined to be abuse, move to step 2 below. If it is determined to actually be a case of neglect, move to step 1 of the process for dealing with neglect. Step 2: The QAE will gather information regarding the incident from both the technician involved as well as the individual filing the complaint. The QAE will review the
31

information and determine whether the incident is significant to warrant review by the Certification Advisory Committee (CAC). This review will be completed within 60 day of receipt of the complaint. If the incident is determined to be “significant”, (insignificant issues will be handled directly by the QAE) a summary of the incident will be submitted to the CAC for their review. The issue will be put on the agenda for the next CAC meeting. Both the technician and the individual filling the complaint will be invited to attend the meeting to present any appropriate information. Step 3: The CAC will determine the merits of the complaint and also the severity level of the abuse. Abuse will be identified as one of two different levels of severity. Level 1 being identified as the least severe form of abuse. This level would typically be identified as intentional deviations from approved procedures with no intent to misrepresent the quality of material being incorporated in the project. This level of abuse could result in up to a 180 day suspension of all certifications held by the technician. The exact duration of the suspension will be set by the CAC depending on the circumstances encountered. A second instance (within a three year period) of Level 1 abuse would result in a minimum 180 day suspension of all certifications. Level 2 abuse is much more severe and is identified by intentional deviations from approved procedures with the intent to misrepresent the quality of material being tested. This level of abuse will be dealt with by a 1-year suspension of all certifications for the technician. A second instance of level 2 abuse will result in permanent revocation of all certifications. In all cases, the CAC will conduct the investigation into the allegations and make a recommendation to the ODOT Construction Engineer as to appropriate sanctions against the technician. All final decisions regarding suspension of certifications will be up to the ODOT Construction Engineer. Complaint Process for Neglect
Again, neglect is much less severe than abuse and individuals are encouraged to resolve their differences at the project level so the project can continue forward in a positive fashion. The complaint process for neglect is intended primarily to allow a means of tracking the types of problems being encountered and also to look out for technicians who seem to have repeated instances of neglect. Step 1: When an individual discovers a significant problem with a technician’s procedures or testing process, that individual will personally point out the concern to the technician. The two individuals will work together to try to resolve the issue. They may need to refer to the Manual of Field Test Procedures or other contract documents to verify proper procedures.
32
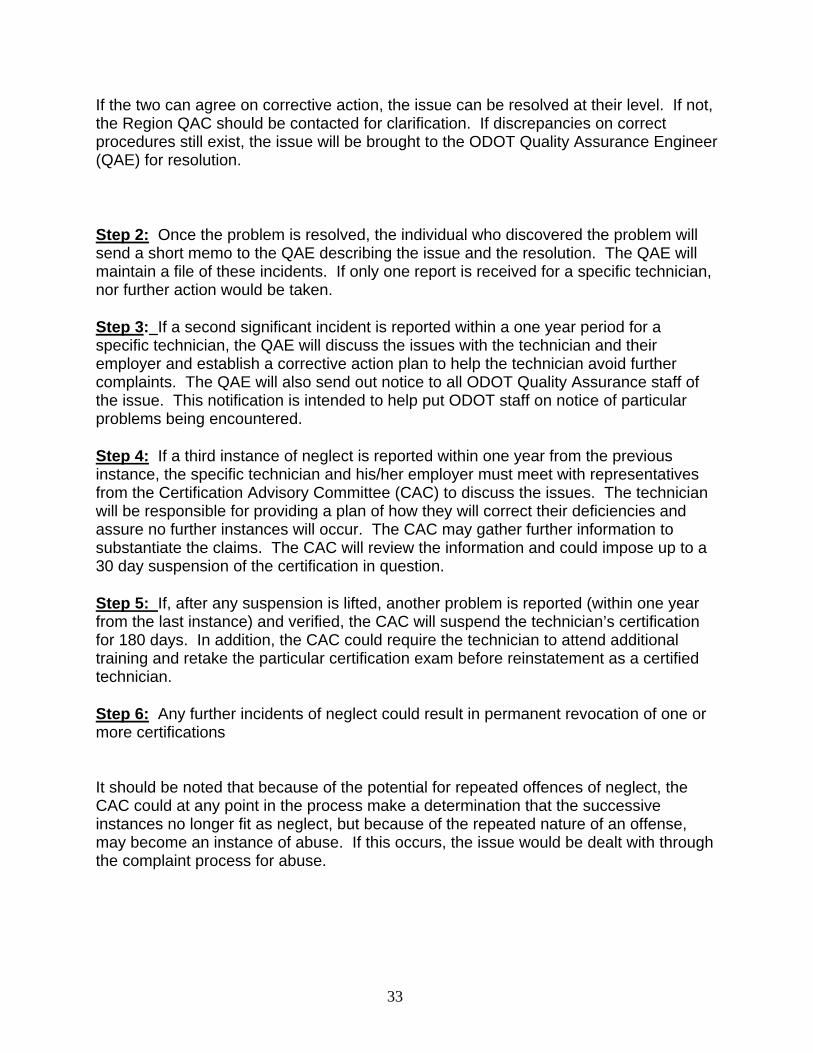
If the two can agree on corrective action, the issue can be resolved at their level. If not, the Region QAC should be contacted for clarification. If discrepancies on correct procedures still exist, the issue will be brought to the ODOT Quality Assurance Engineer (QAE) for resolution. Step 2: Once the problem is resolved, the individual who discovered the problem will send a short memo to the QAE describing the issue and the resolution. The QAE will maintain a file of these incidents. If only one report is received for a specific technician, nor further action would be taken. Step 3: If a second significant incident is reported within a one year period for a specific technician, the QAE will discuss the issues with the technician and their employer and establish a corrective action plan to help the technician avoid further complaints. The QAE will also send out notice to all ODOT Quality Assurance staff of the issue. This notification is intended to help put ODOT staff on notice of particular problems being encountered. Step 4: If a third instance of neglect is reported within one year from the previous instance, the specific technician and his/her employer must meet with representatives from the Certification Advisory Committee (CAC) to discuss the issues. The technician will be responsible for providing a plan of how they will correct their deficiencies and assure no further instances will occur. The CAC may gather further information to substantiate the claims. The CAC will review the information and could impose up to a 30 day suspension of the certification in question. Step 5: If, after any suspension is lifted, another problem is reported (within one year from the last instance) and verified, the CAC will suspend the technician’s certification for 180 days. In addition, the CAC could require the technician to attend additional training and retake the particular certification exam before reinstatement as a certified technician. Step 6: Any further incidents of neglect could result in permanent revocation of one or more certifications It should be noted that because of the potential for repeated offences of neglect, the CAC could at any point in the process make a determination that the successive instances no longer fit as neglect, but because of the repeated nature of an offense, may become an instance of abuse. If this occurs, the issue would be dealt with through the complaint process for abuse.
33

34

APPENDIX G
Contractor Quality Control Plan
This plan is intended to provide a description of the personnel involved in the testing activities and identify the system or process for material Quality Control. The Quality Control Plan must contain at a minimum the following information.
• Include: Project Name, Contract Number and date of anticipated use and author
of submitted plan. • Provide office telephone, cellular phone & fax numbers for contractor’s
superintendent & quality control manager. • Describe personnel & methods to deliver accurate, legible & complete test results
to designated agency representative, within required time limits.
• Designate who will provide required QL analysis.
• Describe location and methods for backup sample storage.
• Provide random numbers and include examples of your method for applying, to provide representative samples.
• Provide identification and certification numbers for all equipment, laboratories, &
technicians used to perform testing on and offsite for the project.
• Provide current Scale License and Certification for all weighting devices used on the project. Identify the location of the scales and type of scale i.e. platform, silo etc
• For every material that has tolerances or limits for tests listed in the Manual of Field Test Procedures, provide:
o Bid item & Specification Section number(s) for product to be used. o Source and supplier of material o Proposed production rate, methods & source of testing o Anticipated earliest date of use
• For each material supplier & subcontractor, provide:
o Company name, address, & physical location. o Quality control contact name and telephone #. o Location, type, & quantity of materials to be used.
35
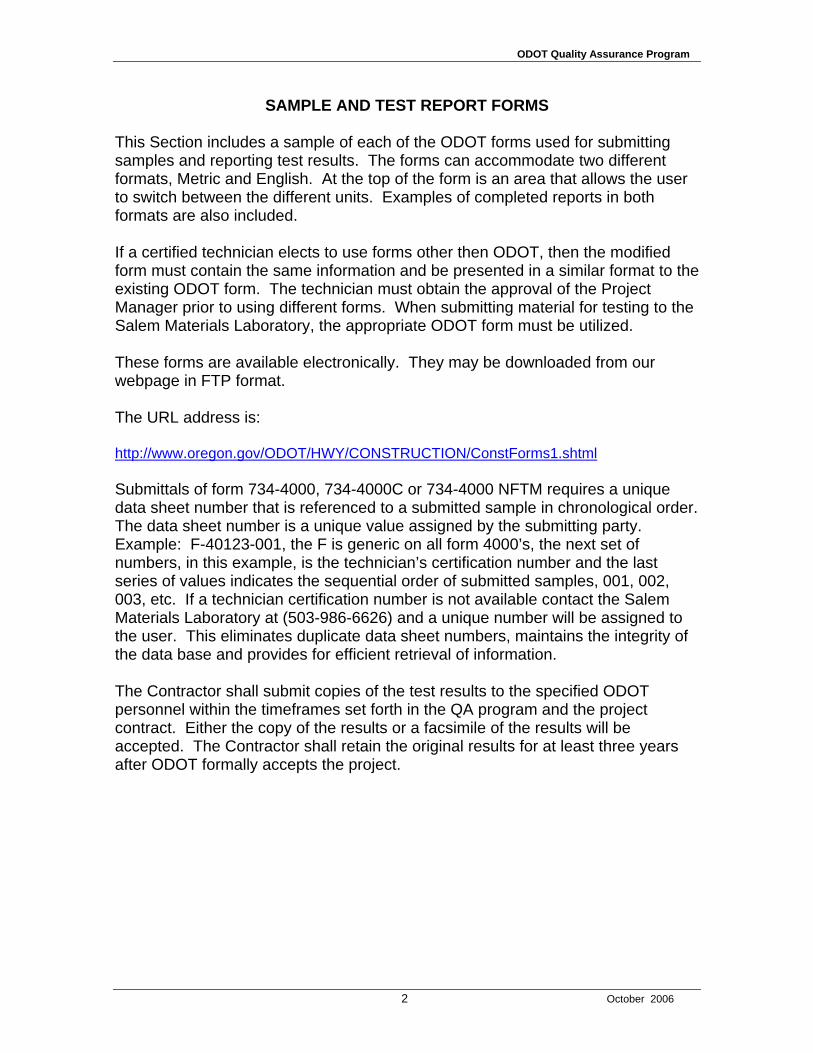
ODOT Quality Assurance Program
SAMPLE AND TEST REPORT FORMS This Section includes a sample of each of the ODOT forms used for submitting samples and reporting test results. The forms can accommodate two different formats, Metric and English. At the top of the form is an area that allows the user to switch between the different units. Examples of completed reports in both formats are also included. If a certified technician elects to use forms other then ODOT, then the modified form must contain the same information and be presented in a similar format to the existing ODOT form. The technician must obtain the approval of the Project Manager prior to using different forms. When submitting material for testing to the Salem Materials Laboratory, the appropriate ODOT form must be utilized. These forms are available electronically. They may be downloaded from our webpage in FTP format. The URL address is: http://www.oregon.gov/ODOT/HWY/CONSTRUCTION/ConstForms1.shtml Submittals of form 734-4000, 734-4000C or 734-4000 NFTM requires a unique data sheet number that is referenced to a submitted sample in chronological order. The data sheet number is a unique value assigned by the submitting party. Example: F-40123-001, the F is generic on all form 4000’s, the next set of numbers, in this example, is the technician’s certification number and the last series of values indicates the sequential order of submitted samples, 001, 002, 003, etc. If a technician certification number is not available contact the Salem Materials Laboratory at (503-986-6626) and a unique number will be assigned to the user. This eliminates duplicate data sheet numbers, maintains the integrity of the data base and provides for efficient retrieval of information. The Contractor shall submit copies of the test results to the specified ODOT personnel within the timeframes set forth in the QA program and the project contract. Either the copy of the results or a facsimile of the results will be accepted. The Contractor shall retain the original results for at least three years after ODOT formally accepts the project.
2 October 2006
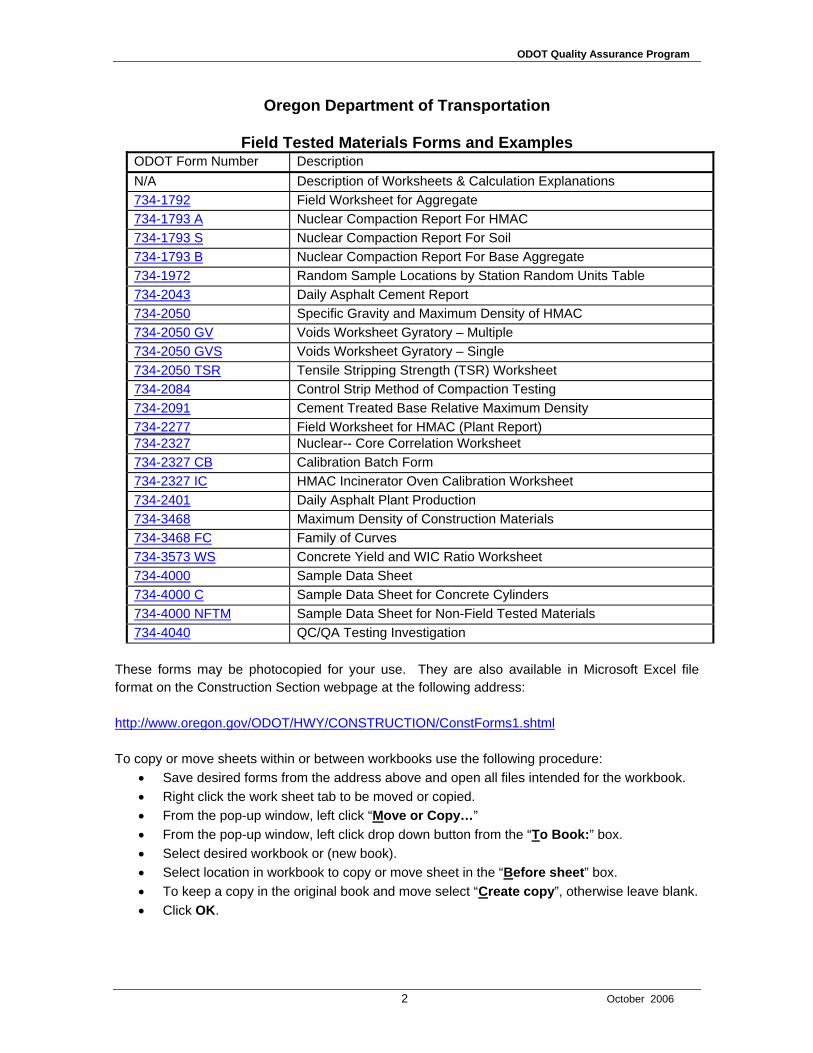
ODOT Quality Assurance Program
Oregon Department of Transportation
Field Tested Materials Forms and Examples ODOT Form Number Description N/A Description of Worksheets & Calculation Explanations 734-1792 Field Worksheet for Aggregate 734-1793 A Nuclear Compaction Report For HMAC 734-1793 S Nuclear Compaction Report For Soil 734-1793 B Nuclear Compaction Report For Base Aggregate 734-1972 Random Sample Locations by Station Random Units Table 734-2043 Daily Asphalt Cement Report 734-2050 Specific Gravity and Maximum Density of HMAC 734-2050 GV Voids Worksheet Gyratory – Multiple 734-2050 GVS Voids Worksheet Gyratory – Single 734-2050 TSR Tensile Stripping Strength (TSR) Worksheet 734-2084 Control Strip Method of Compaction Testing 734-2091 Cement Treated Base Relative Maximum Density 734-2277 Field Worksheet for HMAC (Plant Report) 734-2327 Nuclear-- Core Correlation Worksheet 734-2327 CB Calibration Batch Form 734-2327 IC HMAC Incinerator Oven Calibration Worksheet 734-2401 Daily Asphalt Plant Production 734-3468 Maximum Density of Construction Materials 734-3468 FC Family of Curves 734-3573 WS Concrete Yield and WIC Ratio Worksheet 734-4000 Sample Data Sheet 734-4000 C Sample Data Sheet for Concrete Cylinders 734-4000 NFTM Sample Data Sheet for Non-Field Tested Materials 734-4040 QC/QA Testing Investigation
These forms may be photocopied for your use. They are also available in Microsoft Excel file format on the Construction Section webpage at the following address: http://www.oregon.gov/ODOT/HWY/CONSTRUCTION/ConstForms1.shtml To copy or move sheets within or between workbooks use the following procedure:
• Save desired forms from the address above and open all files intended for the workbook. • Right click the work sheet tab to be moved or copied. • From the pop-up window, left click “Move or Copy…” • From the pop-up window, left click drop down button from the “To Book:” box. • Select desired workbook or (new book). • Select location in workbook to copy or move sheet in the “Before sheet” box. • To keep a copy in the original book and move select “Create copy”, otherwise leave blank. • Click OK.
2 October 2006
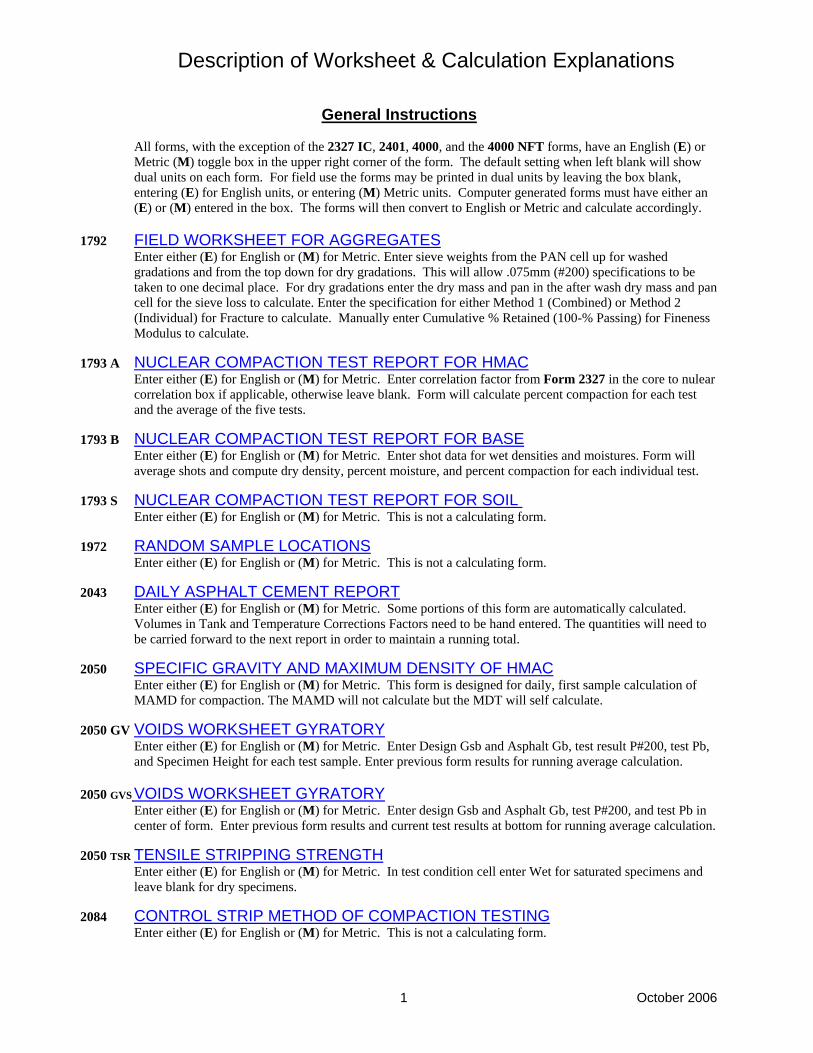
Description of Worksheet & Calculation Explanations
General Instructions All forms, with the exception of the 2327 IC, 2401, 4000, and the 4000 NFT forms, have an English (E) or Metric (M) toggle box in the upper right corner of the form. The default setting when left blank will show dual units on each form. For field use the forms may be printed in dual units by leaving the box blank, entering (E) for English units, or entering (M) Metric units. Computer generated forms must have either an (E) or (M) entered in the box. The forms will then convert to English or Metric and calculate accordingly.
1792 FIELD WORKSHEET FOR AGGREGATES
Enter either (E) for English or (M) for Metric. Enter sieve weights from the PAN cell up for washed gradations and from the top down for dry gradations. This will allow .075mm (#200) specifications to be taken to one decimal place. For dry gradations enter the dry mass and pan in the after wash dry mass and pan cell for the sieve loss to calculate. Enter the specification for either Method 1 (Combined) or Method 2 (Individual) for Fracture to calculate. Manually enter Cumulative % Retained (100-% Passing) for Fineness Modulus to calculate.
1793 A NUCLEAR COMPACTION TEST REPORT FOR HMACEnter either (E) for English or (M) for Metric. Enter correlation factor from Form 2327 in the core to nulear correlation box if applicable, otherwise leave blank. Form will calculate percent compaction for each test and the average of the five tests.
1793 B NUCLEAR COMPACTION TEST REPORT FOR BASEEnter either (E) for English or (M) for Metric. Enter shot data for wet densities and moistures. Form will average shots and compute dry density, percent moisture, and percent compaction for each individual test.
1793 S NUCLEAR COMPACTION TEST REPORT FOR SOIL Enter either (E) for English or (M) for Metric. This is not a calculating form.
1972 RANDOM SAMPLE LOCATIONSEnter either (E) for English or (M) for Metric. This is not a calculating form.
2043 DAILY ASPHALT CEMENT REPORTEnter either (E) for English or (M) for Metric. Some portions of this form are automatically calculated. Volumes in Tank and Temperature Corrections Factors need to be hand entered. The quantities will need to be carried forward to the next report in order to maintain a running total.
2050 SPECIFIC GRAVITY AND MAXIMUM DENSITY OF HMAC
Enter either (E) for English or (M) for Metric. This form is designed for daily, first sample calculation of MAMD for compaction. The MAMD will not calculate but the MDT will self calculate.
2050 GV VOIDS WORKSHEET GYRATORYEnter either (E) for English or (M) for Metric. Enter Design Gsb and Asphalt Gb, test result P#200, test Pb, and Specimen Height for each test sample. Enter previous form results for running average calculation.
2050 GVS VOIDS WORKSHEET GYRATORYEnter either (E) for English or (M) for Metric. Enter design Gsb and Asphalt Gb, test P#200, and test Pb in center of form. Enter previous form results and current test results at bottom for running average calculation.
2050 TSR TENSILE STRIPPING STRENGTHEnter either (E) for English or (M) for Metric. In test condition cell enter Wet for saturated specimens and leave blank for dry specimens.
2084 CONTROL STRIP METHOD OF COMPACTION TESTINGEnter either (E) for English or (M) for Metric. This is not a calculating form.
1 October 2006
Description of Worksheet & Calculation Explanations
2091 CEMENT TREATED BASE RELATIVE MAXIMUM DENSITY Enter either (E) for English or (M) for Metric. This is not a calculating form.
2277 FIELD WORKSHEET FOR HMAC (PLANT REPORT)
Enter either (E) for English or (M) for Metric. Enter the exact term, EAC or HMAC in the heading cell. Enter Sieves from the pan up. When applying correction factors for aggregate gradation and/or asphalt (Cf) from Form 2327 IC, they should be entered as they appear on that form (e.g. + or –). Enter dry washed mass with pan tare for sieve loss calculation. The total asphalt (O) cell is the sub total multiplied by the asphalt meter correction cell, if needed. If the plant reads in Tons leave the asphalt meter correction blank. If Ultrapave is used, convert to dry Tons/Mg and enter those values for beginning and ending antistrip.
2327 NUCLEAR - CORE CORRELATION WORKSHEETEnter either (E) for English or (M) for Metric. This form calculates the information to the ratio used cells. Check the unwanted ratios and the form will automatically adjust the overall correlation.
2327 IC HMAC INCINERATOR OVEN CALIBRATION WORKSHEETIf the blank and RAP are combined prior to washing, enter the combined weights in the center of the form for wet, dry, and after washed dry masses. If performed separately, use the RAP sample section in the upper right portion of the form and use the center portion for the Blank only.
2401 DAILY ASPHALT PLANT PRODUCTIONEnter the exact term EAC or HMAC in the material type cell. The asphalt deductions (k) box is only for material removed from the oil tank during production and not incorporated into the mix (material removed and used for other purposes). It is not to be used to deduct asphalt in mix waste based on the 2043 form.
3468 MAXIMUM DENSITY OF CONSTRUCTION MATERIALSEnter either (E) for English or (M) for Metric. This form has a Material Description box in the heading area to give a visual description (dark brown, gravely clay). The companion form will compute the coarse particle corrections based on the rules established under T 99/180 and T 224. For Base Aggregate, enter the stockpile AVE Pc for calculations of relative max dry density and combined optimum moisture content.
3468 FC FAMILY OF CURVESEnter either (E) for English or (M) for Metric. This is not a calculating form.
3573ws CONCRETE YIELD AND W/C RATIO WORKSHEETEnter either (E) for English or (M) for Metric. The pot calibration is a divisor number, not a multiplier. The number for ¼ cubic foot pots should resemble 0.2497 for English and 0.007070 for Metric.
4000 SAMPLE DATA SHEETIn the Data Sheet Number cell the “F” number is the card number and one plus number of data sheets submitted prior to it. Also remember to include your Phone Number.
4000 C SAMPLE DATA SHEET FOR CONCRETE CYLINDERSThis form does the same calculations the 3573wc form. The NET WEIGHT is the weight of the concrete only and does not include the weight of the pot. In the slots with the capitol letters “A through H” there should be a number to represent the number of days for the break. The “F” number is the card number and one plus number of data sheets submitted prior to it. Also remember to include your Phone Number.
4000NFTMSAMPLE DATA SHEET FOR NON-FIELD TESTED MATERIALS This form is for submittals of materials not field tested and include items like steel, bolts, washers etc. 4040 QA/QC TESTING INVESTIGATION
This form is for data collection during the investigation phase outlined in the Quality Assurance Program under Appendix C. Remember submit copies of the report according to the distribution list.
2 October 2006
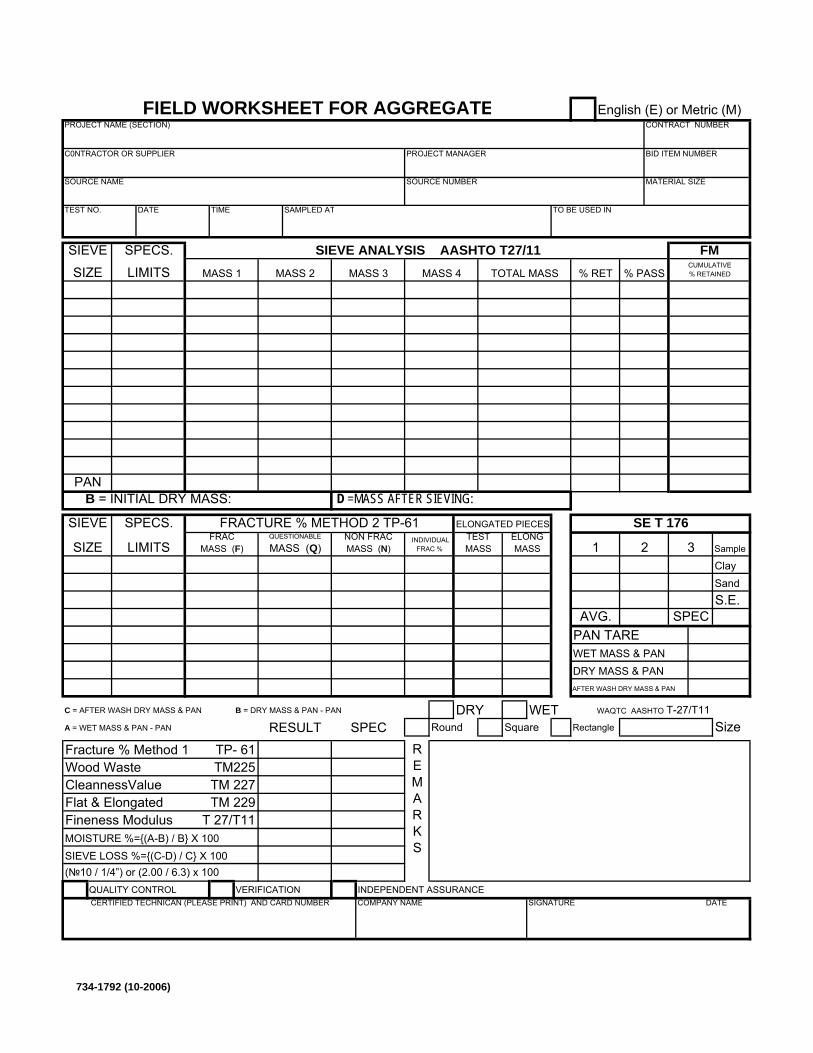
English (E) or Metric (M)
Sample
Clay SandS.E.
PAN TAREWET MASS & PANDRY MASS & PANAFTER WASH DRY MASS & PAN
C = AFTER WASH DRY MASS & PAN B = DRY MASS & PAN - PAN DRY WET WAQTC AASHTO T-27/T11A = WET MASS & PAN - PAN RESULT SPEC Round Square Rectangle Size
Fracture % Method 1 TP- 61Wood Waste TM225CleannessValue TM 227Flat & Elongated TM 229Fineness Modulus T 27/T11
(№10 / 1/4”) or (2.00 / 6.3) x 100QUALITY CONTROL VERIFICATION INDEPENDENT ASSURANCE
FIELD WORKSHEET FOR AGGREGATE
AVG. SPEC
MOISTURE %={(A-B) / B} X 100
SIEVE ANALYSIS AASHTO T27/11TOTAL MASS % RET % PASSMASS 1
SIEVE LOSS %={(C-D) / C} X 100
MASS 3MASS 2
SIEVE
SIZE
SPECS.
LIMITS MASS 4
PAN
ELONG MASS
TEST MASS
INDIVIDUAL FRAC %
ELONGATED PIECES SE T 176
D =MASS AFTER SIEVING:
3NON FRAC MASS (N)
FRAC MASS (F)
SPECS.
SIZE LIMITS
SIEVE
MATERIAL SIZE
TEST NO.
SOURCE NAME SOURCE NUMBER
TO BE USED INSAMPLED ATDATE TIME
BID ITEM NUMBER
CONTRACT NUMBERPROJECT NAME (SECTION)
PROJECT MANAGERC0NTRACTOR OR SUPPLIER
SIGNATURE DATECOMPANY NAMECERTIFIED TECHNICAN (PLEASE PRINT) AND CARD NUMBER
CUMULATIVE % RETAINED
FM
FRACTURE % METHOD 2 TP-61QUESTIONABLE
MASS (Q)
B = INITIAL DRY MASS:
21
REMARKS
734-1792 (10-2006)
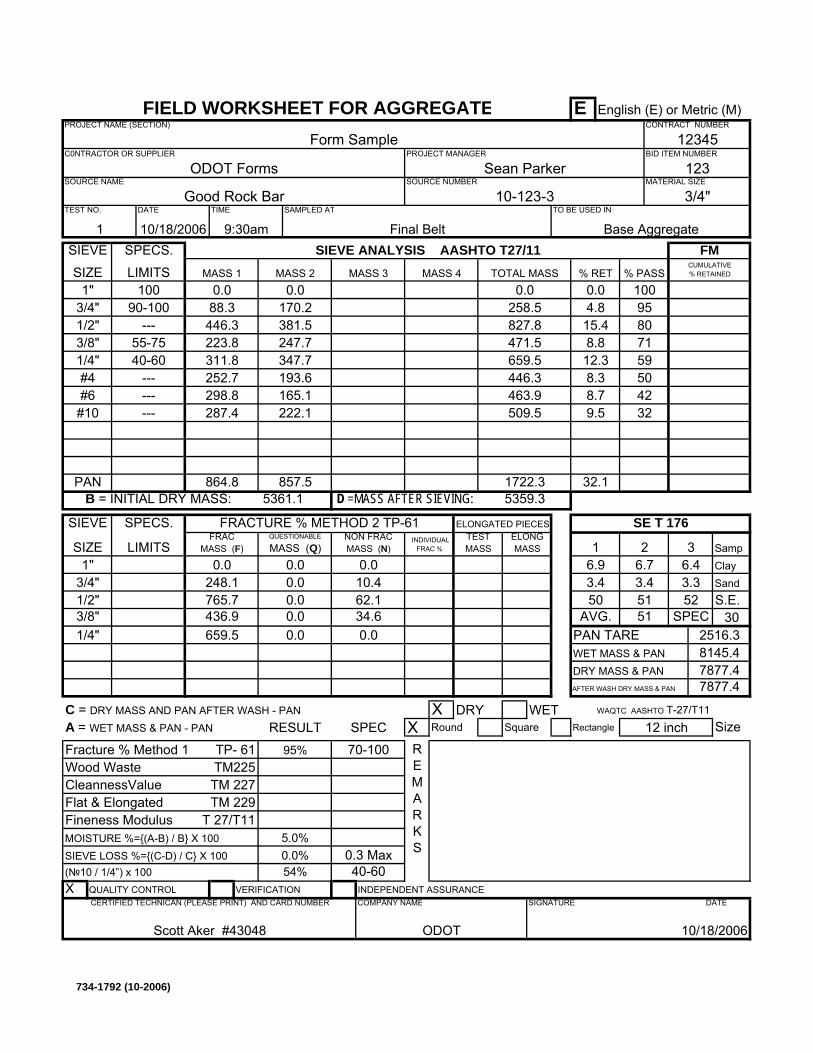
E English (E) or Metric (M)
SampClay SandS.E.
30PAN TAREWET MASS & PANDRY MASS & PANAFTER WASH DRY MASS & PAN
C = DRY MASS AND PAN AFTER WASH - PAN X DRY WET WAQTC AASHTO T-27/T11
A = WET MASS & PAN - PAN RESULT SPEC X Round Square Rectangle Size
Fracture % Method 1 TP- 61Wood Waste TM225CleannessValue TM 227Flat & Elongated TM 229Fineness Modulus T 27/T11
(№10 / 1/4”) x 100X QUALITY CONTROL VERIFICATION INDEPENDENT ASSURANCE
FIELD WORKSHEET FOR AGGREGATE
AVG. SPEC
MOISTURE %={(A-B) / B} X 100
SIEVE ANALYSIS AASHTO T27/11TOTAL MASS % RET % PASSMASS 1
70-100
SIEVE LOSS %={(C-D) / C} X 100
0.0%5.0%
2516.38145.47877.47877.4
MASS 3MASS 2
SIEVE
SIZE
SPECS.
LIMITS
165.1222.1
MASS 4
381.5247.7
298.8287.4
15.4223.8311.8252.7
471.5 8.81/4"#4#6
32.2857.5864.8 32.1
#10
1"3/4"1/2"3/8"
PAN
10090-100
--- 55-7540-60 --- --- ---
0.0
32
ELONG MASS
TEST MASS
12.38.3
428.73232
80715950
INDIVIDUAL FRAC %
0.0 0.0
ELONGATED PIECES SE T 176
1722.35359.3 D =MASS AFTER SIEVING:
30.0
248.1
NON FRAC MASS (N)
FRAC MASS (F)
0.00.0
0.0
765.7436.9659.5
SPECS.
SIZE LIMITS1"
0.00.0
10.462.1
1
3/8"1/4"
3/4"1/2"
SIEVE
ODOT FormsMATERIAL SIZE
TEST NO.
SOURCE NAME
10-123-3Good Rock Bar
123
3/4"
Sean ParkerSOURCE NUMBER
Base AggregateTO BE USED IN
10/18/2006 9:30amSAMPLED ATDATE TIME
Final Belt
BID ITEM NUMBER
CONTRACT NUMBERPROJECT NAME (SECTION)
Form SamplePROJECT MANAGERC0NTRACTOR OR SUPPLIER
12345
95%
34.60.0
10/18/2006ODOT
SIGNATURE DATECOMPANY NAME
Scott Aker #43048
CERTIFIED TECHNICAN (PLEASE PRINT) AND CARD NUMBER
40-6054%0.3 Max
9.5
0.0 0.0
463.9509.50.0 0.0
CUMULATIVE % RETAINED
FM
0.0
446.388.3
347.7193.6
827.8
659.5446.3
10095
0.0170.2 258.5 4.8
0.0 0.0
FRACTURE % METHOD 2 TP-61QUESTIONABLE
MASS (Q)
B = INITIAL DRY MASS: 5361.1
216.9 6.46.7
REMARKS
12 inch
3.352
5151
3.450
3.4
734-1792 (10-2006)
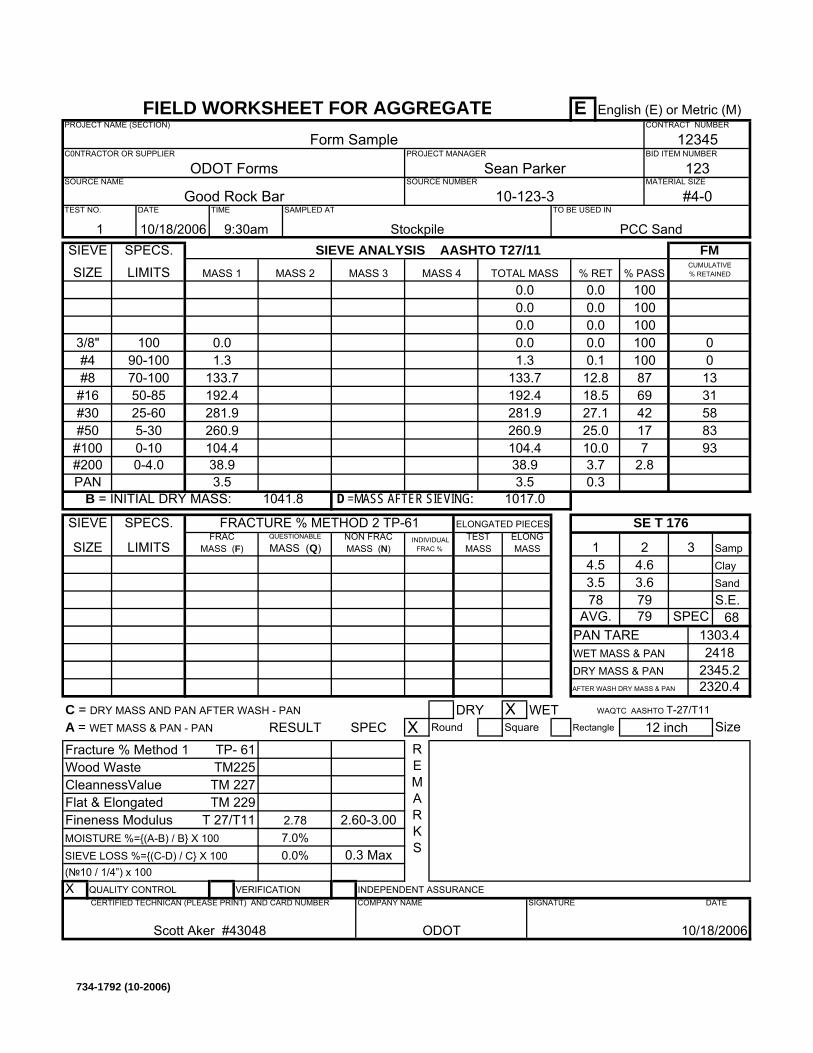
E English (E) or Metric (M)
SampClay SandS.E.
68PAN TAREWET MASS & PANDRY MASS & PANAFTER WASH DRY MASS & PAN
C = DRY MASS AND PAN AFTER WASH - PAN DRY X WET WAQTC AASHTO T-27/T11
A = WET MASS & PAN - PAN RESULT SPEC X Round Square Rectangle Size
Fracture % Method 1 TP- 61Wood Waste TM225CleannessValue TM 227Flat & Elongated TM 229Fineness Modulus T 27/T11
(№10 / 1/4”) x 100X QUALITY CONTROL VERIFICATION INDEPENDENT ASSURANCE
REMARKS
12 inch
7979
3.578
3.6
214.5 4.6
FRACTURE % METHOD 2 TP-61QUESTIONABLE
MASS (Q)
B = INITIAL DRY MASS: 1041.8
1001000.0 0.0
0.0 0.0
0.0
1.3133.7
CUMULATIVE % RETAINED
FM
0013
192.4281.9260.9 25.0
27.1
104.4 10.0104.40-100-4.0
2.60-3.00
Scott Aker #43048
CERTIFIED TECHNICAN (PLEASE PRINT) AND CARD NUMBER
0.3 Max
10/18/2006ODOT
SIGNATURE DATECOMPANY NAME
BID ITEM NUMBER
CONTRACT NUMBERPROJECT NAME (SECTION)
Form SamplePROJECT MANAGERC0NTRACTOR OR SUPPLIER
12345
PCC SandTO BE USED IN
10/18/2006 9:30amSAMPLED ATDATE TIME
Stockpile
ODOT FormsMATERIAL SIZE
TEST NO.
SOURCE NAME
10-123-3Good Rock Bar
123
#4-0
Sean ParkerSOURCE NUMBER
1
SIEVE SPECS.
SIZE LIMITSNON FRAC MASS (N)
FRAC MASS (F)
INDIVIDUAL FRAC %
38.9 3.7
ELONGATED PIECES SE T 176
3.51017.0 D =MASS AFTER SIEVING:
3
10010010087
0.1
5883
12.8316918.5
4217
93
7
ELONG MASS
TEST MASS
90-10070-10050-8525-60
100
PAN
5-30#50#100#200
3/8"#4#8#16
2.83.538.9
0.3
#30
0.00.01.3
133.7
0.0 0.0
260.9
MASS 4
192.4281.9
MASS 3MASS 2
SIEVE
SIZE
SPECS.
LIMITS
1303.42418
2345.22320.4
SIEVE LOSS %={(C-D) / C} X 100
2.78
0.0%7.0%
FIELD WORKSHEET FOR AGGREGATE
AVG. SPEC
MOISTURE %={(A-B) / B} X 100
SIEVE ANALYSIS AASHTO T27/11TOTAL MASS % RET % PASSMASS 1
734-1792 (10-2006)
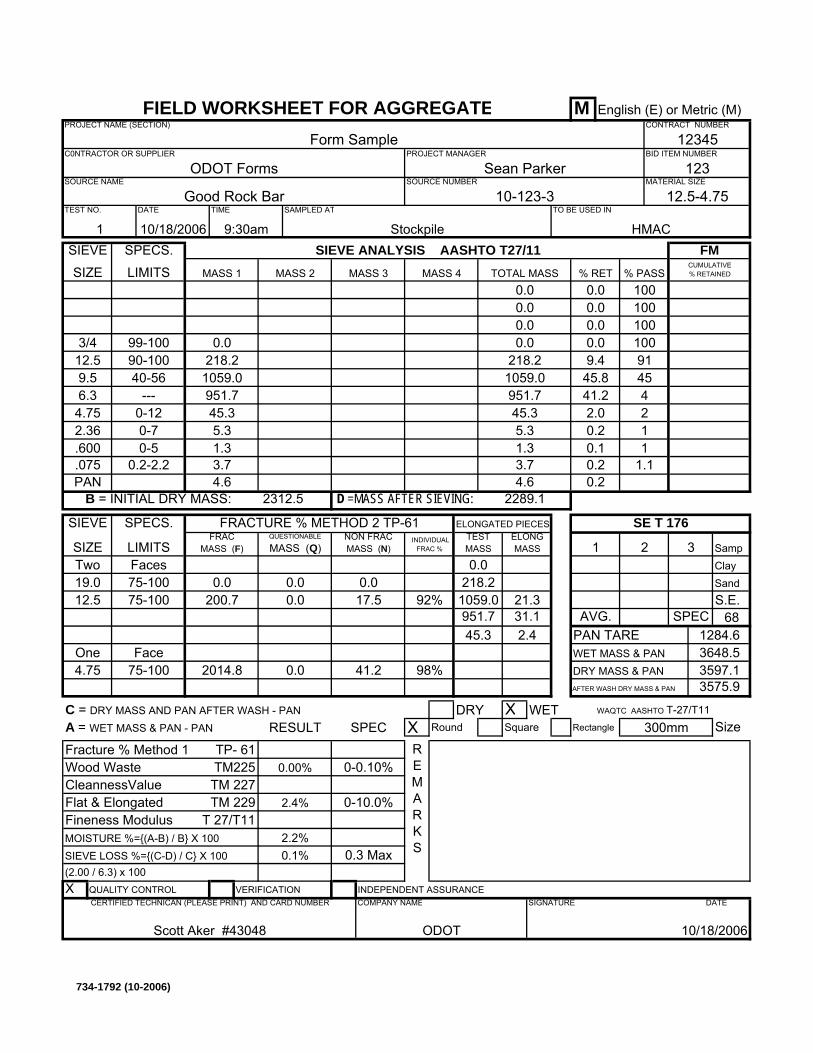
M English (E) or Metric (M)
SampClay SandS.E.
68PAN TAREWET MASS & PANDRY MASS & PANAFTER WASH DRY MASS & PAN
C = DRY MASS AND PAN AFTER WASH - PAN DRY X WET WAQTC AASHTO T-27/T11
A = WET MASS & PAN - PAN RESULT SPEC X Round Square Rectangle Size
Fracture % Method 1 TP- 61Wood Waste TM225CleannessValue TM 227Flat & Elongated TM 229Fineness Modulus T 27/T11
(2.00 / 6.3) x 100X QUALITY CONTROL VERIFICATION INDEPENDENT ASSURANCE
FIELD WORKSHEET FOR AGGREGATE
AVG. SPEC
MOISTURE %={(A-B) / B} X 100
SIEVE ANALYSIS AASHTO T27/11TOTAL MASS % RET % PASSMASS 1
0-0.10%0.00%
SIEVE LOSS %={(C-D) / C} X 100
2.4%
0.1%2.2%
1284.63648.53597.13575.9
MASS 3MASS 2
SIEVE
SIZE
SPECS.
LIMITS
5.3
MASS 4
951.745.3
0.00.0
218.21059.0
0.0 0.012.59.56.3
1.14.63.7
0.2
4.75
3/4
PAN
0-72.36.600.075
99-10090-10040-56 --- 0-12
0.0 41.2
98%
21.331.1
1059.092%
0.0
1
ELONG MASS
TEST MASS
9.445.8
441.221
1001009145
INDIVIDUAL FRAC %
3.7 0.2
ELONGATED PIECES SE T 176
4.62289.1 D =MASS AFTER SIEVING:
3
0.0
NON FRAC MASS (N)
FRAC MASS (F)
0.0200.7
SPECS.
SIZE LIMITSTwo Faces
0.00.017.5
1
19.0 75-10012.5 75-100
SIEVE
ODOT FormsMATERIAL SIZE
TEST NO.
SOURCE NAME
10-123-3Good Rock Bar
123
12.5-4.75
Sean ParkerSOURCE NUMBER
HMACTO BE USED IN
10/18/2006 9:30amSAMPLED ATDATE TIME
Stockpile
BID ITEM NUMBER
CONTRACT NUMBERPROJECT NAME (SECTION)
Form SamplePROJECT MANAGERC0NTRACTOR OR SUPPLIER
12345
45.3 2.4
218.2
951.7
One Face2014.8
10/18/2006ODOT
SIGNATURE DATECOMPANY NAME
0-10.0%
Scott Aker #43048
CERTIFIED TECHNICAN (PLEASE PRINT) AND CARD NUMBER
0.3 Max
1.30-50.2-2.2
2.0
1.3 0.1
951.745.35.3 0.2
CUMULATIVE % RETAINED
FM
0.0
218.21059.0
1001000.0 0.0
0.0 0.0
FRACTURE % METHOD 2 TP-61QUESTIONABLE
MASS (Q)
B = INITIAL DRY MASS: 2312.5
4.75 75-100
21
REMARKS
300mm
734-1792 (10-2006)
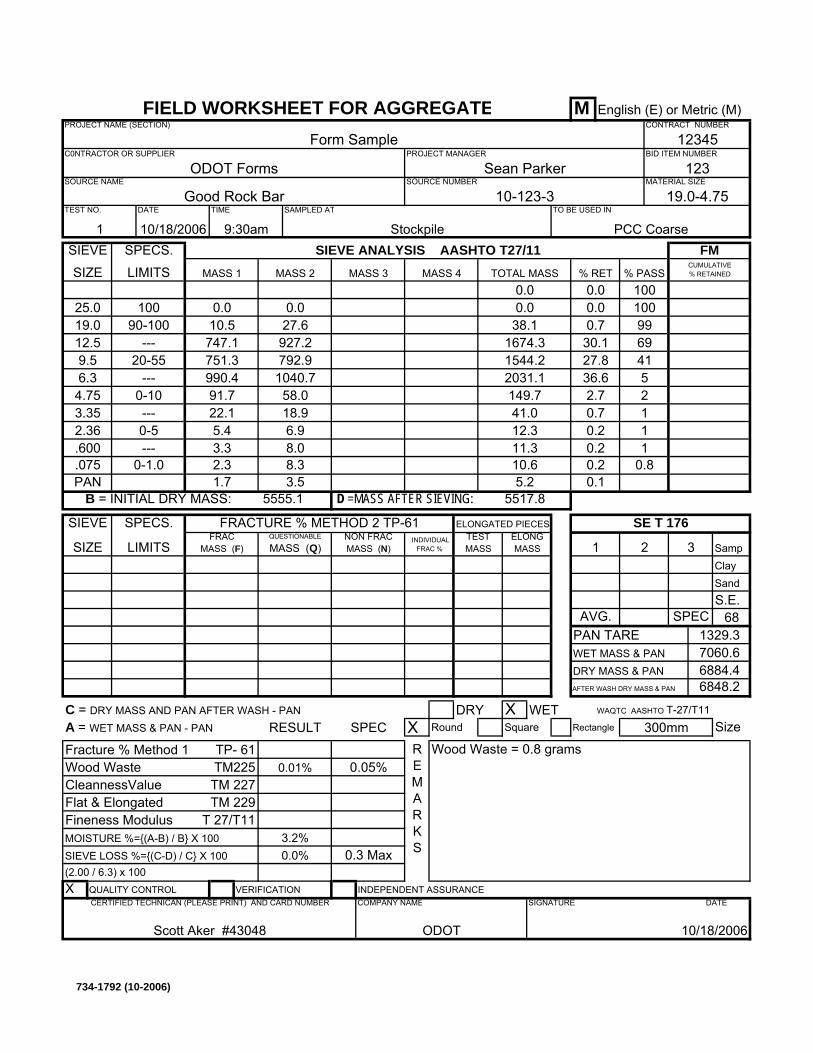
M English (E) or Metric (M)
SampClay SandS.E.
68PAN TAREWET MASS & PANDRY MASS & PANAFTER WASH DRY MASS & PAN
C = DRY MASS AND PAN AFTER WASH - PAN DRY X WET WAQTC AASHTO T-27/T11
A = WET MASS & PAN - PAN RESULT SPEC X Round Square Rectangle Size
Fracture % Method 1 TP- 61Wood Waste TM225CleannessValue TM 227Flat & Elongated TM 229Fineness Modulus T 27/T11
(2.00 / 6.3) x 100X QUALITY CONTROL VERIFICATION INDEPENDENT ASSURANCE
REMARKS
300mmWood Waste = 0.8 grams
21
FRACTURE % METHOD 2 TP-61QUESTIONABLE
MASS (Q)
B = INITIAL DRY MASS: 5555.1
1001000.0 0.0 0.0
0.0 0.0
792.91040.7
38.1
1544.22031.1
10.50.0
CUMULATIVE % RETAINED
FM
149.741.012.3 0.2
0.7
11.3 0.23.3 --- 0-1.0
8.08.3
Scott Aker #43048
CERTIFIED TECHNICAN (PLEASE PRINT) AND CARD NUMBER
0.3 Max
10/18/2006ODOT
SIGNATURE DATECOMPANY NAME
BID ITEM NUMBER
CONTRACT NUMBERPROJECT NAME (SECTION)
Form SamplePROJECT MANAGERC0NTRACTOR OR SUPPLIER
12345
PCC CoarseTO BE USED IN
10/18/2006 9:30amSAMPLED ATDATE TIME
Stockpile
ODOT FormsMATERIAL SIZE
TEST NO.
SOURCE NAME
10-123-3Good Rock Bar
123
19.0-4.75
Sean ParkerSOURCE NUMBER
1
SIEVE SPECS.
SIZE LIMITSNON FRAC MASS (N)
FRAC MASS (F)
INDIVIDUAL FRAC %
10.6 0.2
ELONGATED PIECES SE T 176
5.25517.8 D =MASS AFTER SIEVING:
3
9969415
27.836.6
22.711
1
ELONG MASS
TEST MASS
20-55 --- 0-10 ---
10090-100
---
PAN
0-52.36.600.075
25.019.012.59.56.34.75
0.83.51.7
2.30.1
3.35
0.7747.1751.3990.4
1674.3 30.1
5.4
58.018.9
MASS 4
27.6927.2
91.7
6.922.1
MASS 3MASS 2
SIEVE
SIZE
SPECS.
LIMITS
1329.37060.66884.46848.2
0.05%0.01%
SIEVE LOSS %={(C-D) / C} X 100
0.0%3.2%
FIELD WORKSHEET FOR AGGREGATE
AVG. SPEC
MOISTURE %={(A-B) / B} X 100
SIEVE ANALYSIS AASHTO T27/11TOTAL MASS % RET % PASSMASS 1
734-1792 (10-2006)
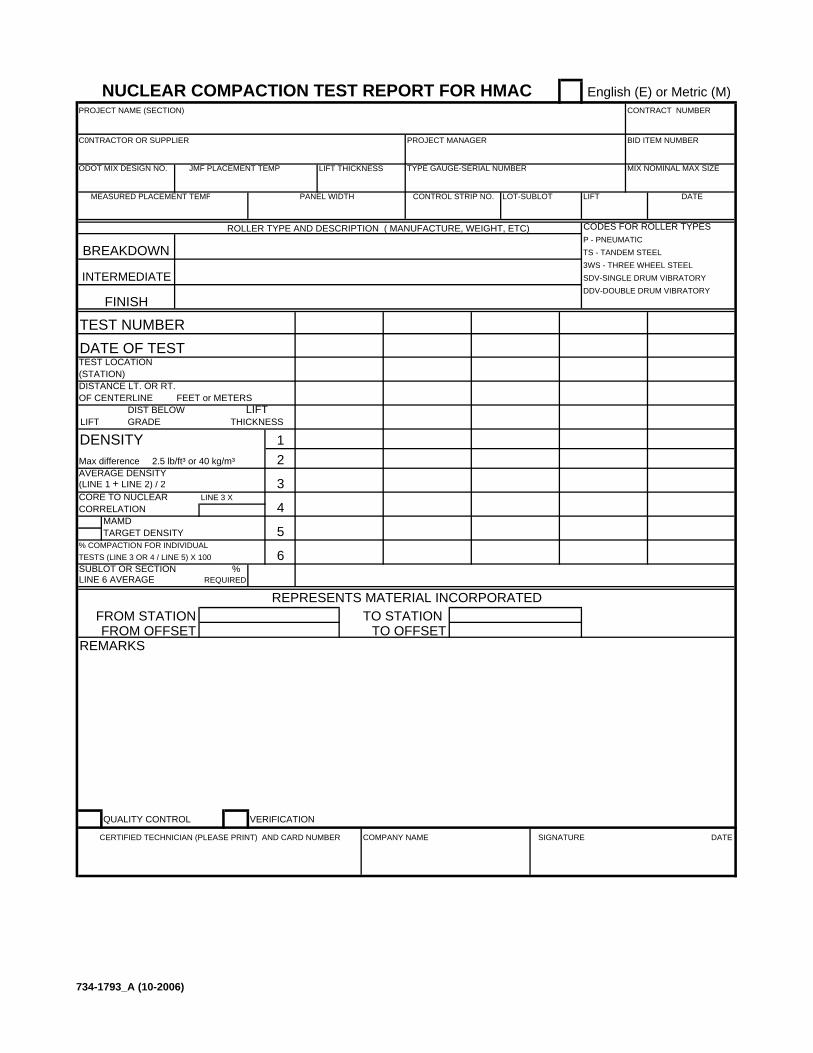
LIFT THICKNESS
CODES FOR ROLLER TYPESP - PNEUMATICTS - TANDEM STEEL3WS - THREE WHEEL STEELSDV-SINGLE DRUM VIBRATORYDDV-DOUBLE DRUM VIBRATORY
TEST NUMBERDATE OF TESTTEST LOCATION (STATION)DISTANCE LT. OR RT.OF CENTERLINE FEET or METERS
DIST BELOW LIFTLIFT GRADE THICKNESS
DENSITY 1Max difference 2.5 lb/ft³ or 40 kg/m³ 2AVERAGE DENSITY(LINE 1 + LINE 2) / 2CORE TO NUCLEAR LINE 3 XCORRELATION
MAMDTARGET DENSITY
% COMPACTION FOR INDIVIDUALTESTS (LINE 3 OR 4 / LINE 5) X 100SUBLOT OR SECTION %LINE 6 AVERAGE REQUIRED
REMARKS
QUALITY CONTROL VERIFICATION
REPRESENTS MATERIAL INCORPORATED FROM STATIONFROM OFFSET
TO STATION TO OFFSET
3
5
6
4
CONTRACT NUMBER
PANEL WIDTHMEASURED PLACEMENT TEMP
JMF PLACEMENT TEMP
PROJECT NAME (SECTION)
PROJECT MANAGER
TYPE GAUGE-SERIAL NUMBER
C0NTRACTOR OR SUPPLIER BID ITEM NUMBER
MIX NOMINAL MAX SIZE
LIFTLOT-SUBLOTCONTROL STRIP NO.
COMPANY NAMECERTIFIED TECHNICIAN (PLEASE PRINT) AND CARD NUMBER
ODOT MIX DESIGN NO.
DATE
SIGNATURE DATE
BREAKDOWN
FINISH
INTERMEDIATE
NUCLEAR COMPACTION TEST REPORT FOR HMAC English (E) or Metric (M)
ROLLER TYPE AND DESCRIPTION ( MANUFACTURE, WEIGHT, ETC)
734-1793_A (10-2006)
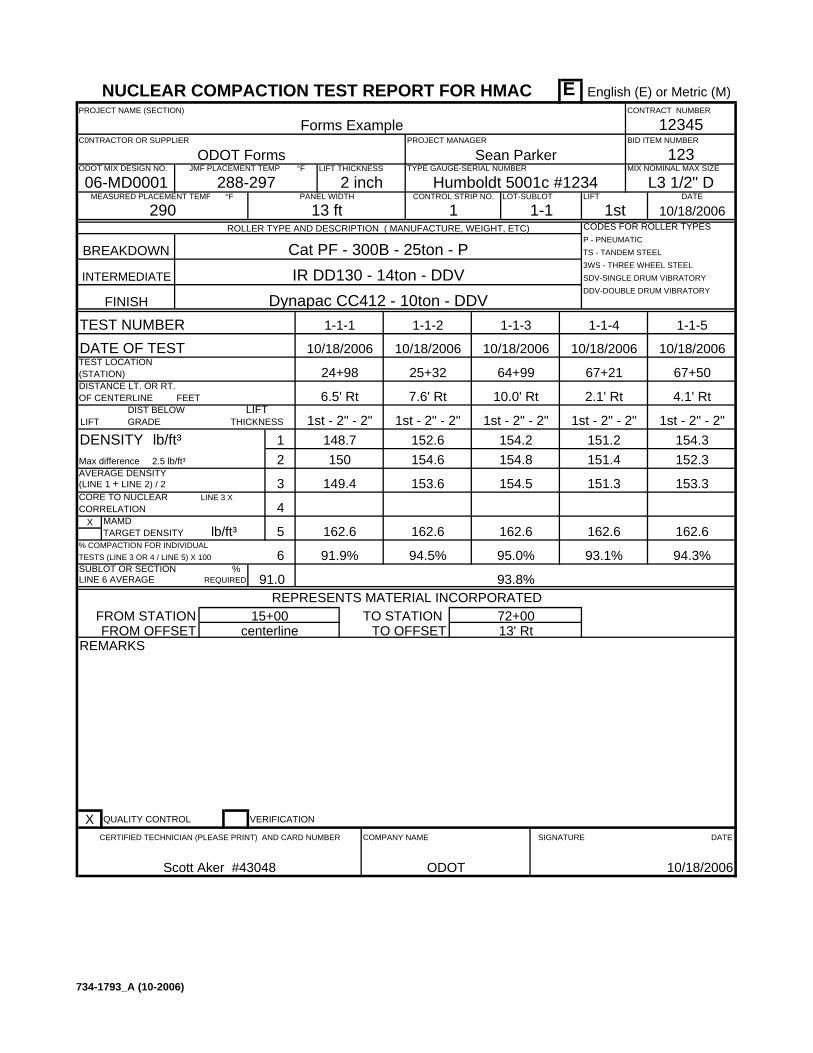
E
°F LIFT THICKNESS
°F
CODES FOR ROLLER TYPESP - PNEUMATICTS - TANDEM STEEL3WS - THREE WHEEL STEELSDV-SINGLE DRUM VIBRATORYDDV-DOUBLE DRUM VIBRATORY
TEST NUMBERDATE OF TESTTEST LOCATION (STATION)DISTANCE LT. OR RT.OF CENTERLINE FEET
DIST BELOW LIFTLIFT GRADE THICKNESS
DENSITY lb/ft³ 1Max difference 2.5 lb/ft³ 2AVERAGE DENSITY(LINE 1 + LINE 2) / 2CORE TO NUCLEAR LINE 3 XCORRELATION
X MAMDTARGET DENSITY
% COMPACTION FOR INDIVIDUALTESTS (LINE 3 OR 4 / LINE 5) X 100SUBLOT OR SECTION %LINE 6 AVERAGE REQUIRED
REMARKS
X QUALITY CONTROL VERIFICATION
72+0013' Rt
REPRESENTS MATERIAL INCORPORATED FROM STATIONFROM OFFSET
TO STATION TO OFFSET
15+00centerline
153.6 151.3 153.33
4
1st - 2" - 2"148.7150
149.4
162.6 162.65
6
162.6
93.8%
94.5% 93.1% 94.3%95.0%91.9%
1st - 2" - 2"151.2151.4
162.6
154.8154.2152.6
1st - 2" - 2"
154.6
1st - 2" - 2"
10/18/2006
67+50
4.1' Rt
162.6
1st - 2" - 2"154.3152.3
1-1-5
10/18/2006
24+98
6.5' Rt
10/18/2006
25+32
7.6' Rt
10/18/2006
64+99
10.0' Rt
CONTRACT NUMBER
290 1PANEL WIDTH
13 ftMEASURED PLACEMENT TEMP
288-297 2 inch06-MD0001JMF PLACEMENT TEMP
PROJECT NAME (SECTION)
PROJECT MANAGER
TYPE GAUGE-SERIAL NUMBERSean ParkerODOT Forms
C0NTRACTOR OR SUPPLIERForms Example
10/18/2006
BID ITEM NUMBER
MIX NOMINAL MAX SIZE
L3 1/2" DLIFT
Humboldt 5001c #1234LOT-SUBLOT
1-1CONTROL STRIP NO.
123
12345
ODOT
COMPANY NAME
Scott Aker #43048
CERTIFIED TECHNICIAN (PLEASE PRINT) AND CARD NUMBER
1st
ODOT MIX DESIGN NO.
DATE
SIGNATURE DATE
10/18/2006
BREAKDOWN Cat PF - 300B - 25ton - PIR DD130 - 14ton - DDV
Dynapac CC412 - 10ton - DDV
67+21
2.1' Rt
FINISH
INTERMEDIATE
NUCLEAR COMPACTION TEST REPORT FOR HMAC English (E) or Metric (M)
ROLLER TYPE AND DESCRIPTION ( MANUFACTURE, WEIGHT, ETC)
91.0
lb/ft³
1-1-31-1-21-1-1 1-1-4
10/18/2006
154.5
734-1793_A (10-2006)

M
°C LIFT THICKNESS
°C
CODES FOR ROLLER TYPESP - PNEUMATICTS - TANDEM STEEL3WS - THREE WHEEL STEELSDV-SINGLE DRUM VIBRATORYDDV-DOUBLE DRUM VIBRATORY
TEST NUMBERDATE OF TESTTEST LOCATION (STATION)DISTANCE LT. OR RT.OF CENTERLINE METERS
DIST BELOW LIFTLIFT GRADE THICKNESS
DENSITY kg/m³ 1Max difference 40 kg/m³ 2AVERAGE DENSITY(LINE 1 + LINE 2) / 2CORE TO NUCLEAR LINE 3 XCORRELATION
X MAMDTARGET DENSITY
% COMPACTION FOR INDIVIDUALTESTS (LINE 3 OR 4 / LINE 5) X 100SUBLOT OR SECTION %LINE 6 AVERAGE REQUIRED
REMARKS
X QUALITY CONTROL VERIFICATION
2337
NUCLEAR COMPACTION TEST REPORT FOR HMAC English (E) or Metric (M)
ROLLER TYPE AND DESCRIPTION ( MANUFACTURE, WEIGHT, ETC)
91.0
kg/m³
1-1-31-1-21-1-1 1-1-4
10/18/2006
9+065
1.0m Rt
FINISH
INTERMEDIATE
BREAKDOWN Cat PF - 300B - 25ton - PIR DD130 - 14ton - DDV
Dynapac CC412 - 10ton - DDV
12345
ODOT
COMPANY NAME
Scott Aker #43048
CERTIFIED TECHNICIAN (PLEASE PRINT) AND CARD NUMBER
1st
ODOT MIX DESIGN NO.
DATE
SIGNATURE DATE
10/18/2006
10/18/2006
BID ITEM NUMBER
MIX NOMINAL MAX SIZE
L3 19.0mm DLIFT
Humboldt 5001c #1234LOT-SUBLOT
1-1CONTROL STRIP NO.
123
PROJECT NAME (SECTION)
PROJECT MANAGER
TYPE GAUGE-SERIAL NUMBERSean ParkerODOT Forms
C0NTRACTOR OR SUPPLIERForms Example
CONTRACT NUMBER
143 1PANEL WIDTH
5.5mMEASURED PLACEMENT TEMP
144-148 50mm06-MD0001JMF PLACEMENT TEMP
1-1-5
10/18/2006
9+354
1.3m Rt
10/18/2006
9+322
0.4m Rt
10/18/2006
9+648
1.6m Rt
10/18/2006
9+329
0.9m Rt
2578
1st - 100 - 50233723352334
234023201st - 100 - 50
2322
1st - 100 - 50 1st - 100 - 5023262336
2578
91.8%
91.5% 91.9% 92.0%92.1%91.7%
2578 25785
6
2578
4
1st - 100 - 5023252331
2328
1.0159
2321 2331 2336
2358 2368 23732365
3
2374
10+4805.5m Rt
REPRESENTS MATERIAL INCORPORATED FROM STATIONFROM OFFSET
TO STATION TO OFFSET
8+950centerline
734-1793_A (10-2006)
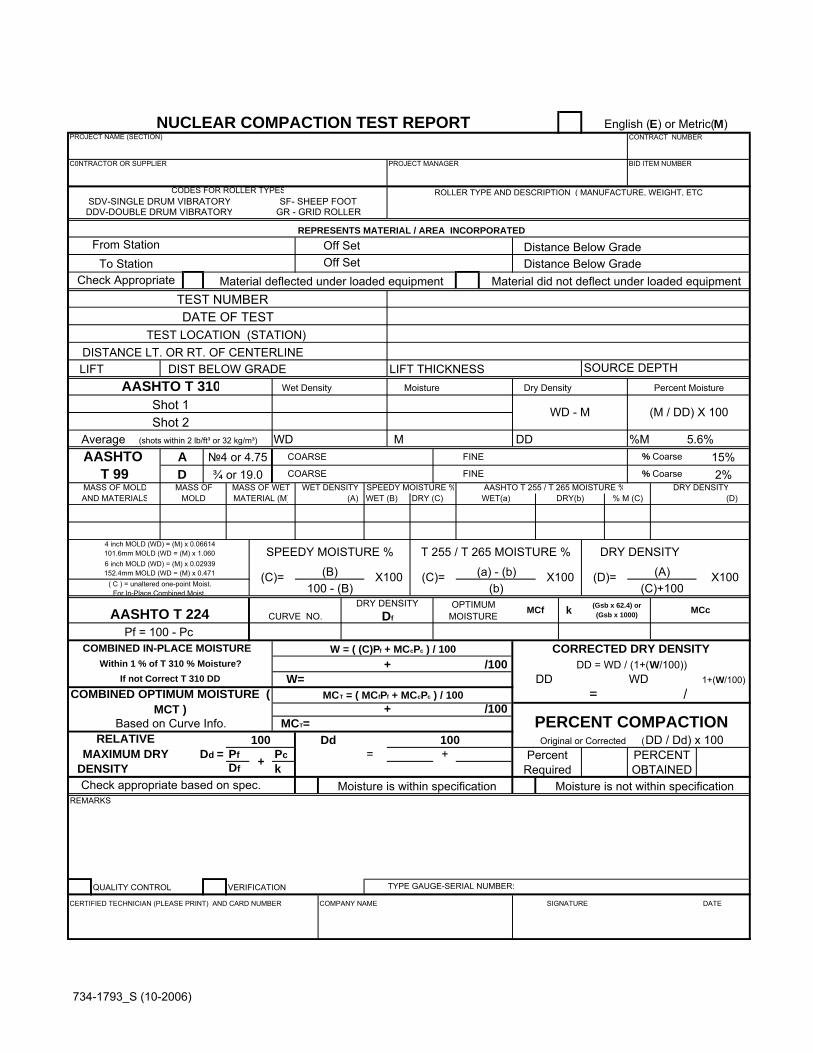
LIFT THICKNESS SOURCE DEPTH
(shots within 2 lb/ft³ or 32 kg/m³) WD M DD %M
(A) WET (B) DRY (C) (D)
(A)
/100
= //100
DdDd = Pf Pc = +
Df k
REMARKS
QUALITY CONTROL VERIFICATION
CERTIFIED TECHNICIAN (PLEASE PRINT) AND CARD NUMBER
Moisture is not within specification
Percent Required
Moisture is within specification
DD = WD / (1+(W/100))If not Correct T 310 DD
CURVE NO.
Check appropriate based on spec.
+
100RELATIVE MAXIMUM DRY
DENSITY
5.6%
AASHTO T 310Shot 1 (M / DD) X 100Shot 2
WD - M
% Coarse 15%№4 or 4.75 FINE
Distance Below Grade
DRY DENSITY
Off SetOff Set
DIST BELOW GRADE
COARSE
NUCLEAR COMPACTION TEST REPORT English (E) or Metric(M)
Pf = 100 - Pc
( C ) = unaltered one-point Moist. For In-Place Combined Moist.
AASHTO T 224
X100
PROJECT NAME (SECTION) CONTRACT NUMBER
BID ITEM NUMBERC0NTRACTOR OR SUPPLIER PROJECT MANAGER
ROLLER TYPE AND DESCRIPTION ( MANUFACTURE, WEIGHT, ETC
To Station
Df
Percent Moisture
k (Gsb x 62.4) or (Gsb x 1000)
REPRESENTS MATERIAL / AREA INCORPORATED From Station Distance Below Grade
CODES FOR ROLLER TYPESSF- SHEEP FOOT
GR - GRID ROLLERSDV-SINGLE DRUM VIBRATORYDDV-DOUBLE DRUM VIBRATORY
TYPE GAUGE-SERIAL NUMBER:
COMPANY NAME SIGNATURE DATE
COMBINED OPTIMUM MOISTURE ( MCT )
Based on Curve Info.
COMBINED IN-PLACE MOISTURE +
W=
W = ( (C)Pf + MCcPc ) / 100
MCT = ( MCfPf + MCcPc ) / 100+
DATE OF TESTTEST LOCATION (STATION)
TEST NUMBER
2%T 99 ¾ or 19.0 COARSE FINE % Coarse
AD
MASS OF MOLDAND MATERIALS
AASHTO
MASS OFMOLD
MASS OF WETMATERIAL (M)
WET DENSITY SPEEDY MOISTURE % DRY DENSITY% M (C)
AASHTO T 255 / T 265 MOISTURE %WET(a) DRY(b)
100 - (B)(B)(C)=
SPEEDY MOISTURE %
OPTIMUM MOISTURE
T 255 / T 265 MOISTURE %
MCc
X100(C)=(b)
(a) - (b) X100(C)+100
(D)=
PERCENT OBTAINED
CORRECTED DRY DENSITY
MCf
100
Material did not deflect under loaded equipment
DD WD 1+(W/100)
PERCENT COMPACTIONOriginal or Corrected (DD / Dd) x 100
Check Appropriate Material deflected under loaded equipment
Within 1 % of T 310 % Moisture?
MCT=
4 inch MOLD (WD) = (M) x 0.06614 101.6mm MOLD (WD = (M) x 1.060 6 inch MOLD (WD) = (M) x 0.02939 152.4mm MOLD (WD = (M) x 0.471
DISTANCE LT. OR RT. OF CENTERLINE
Wet Density
LIFTMoisture Dry Density
Average
DRY DENSITY
734-1793_S (10-2006)
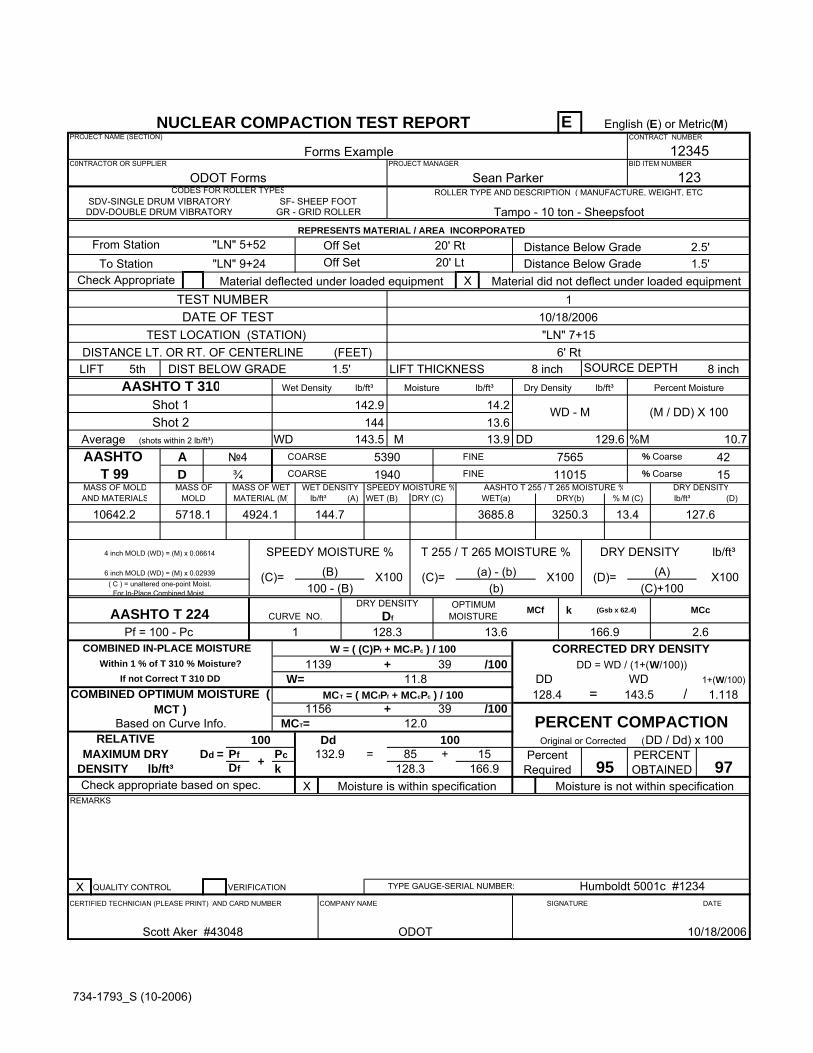
E
X
LIFT THICKNESS SOURCE DEPTH
(shots within 2 lb/ft³) WD M DD %M
(A) WET (B) DRY (C) (D)
(A)
/100
= //100
DdDd = Pf Pc = +
Df kX
REMARKS
X QUALITY CONTROL VERIFICATION
CERTIFIED TECHNICIAN (PLEASE PRINT) AND CARD NUMBER
Average
lb/ft³DRY DENSITY
lb/ft³lb/ft³
13.43685.8 3250.3
Moisture lb/ft³ Dry Density lb/ft³
DISTANCE LT. OR RT. OF CENTERLINE (FEET)
Wet Density lb/ft³
LIFT 5th
Check Appropriate Material deflected under loaded equipment
Within 1 % of T 310 % Moisture?
128.3
11.8
39MCT= 12.0
4 inch MOLD (WD) = (M) x 0.06614
6 inch MOLD (WD) = (M) x 0.02939
Material did not deflect under loaded equipment
166.9
1.118128.4 143.5DD WD 1+(W/100)
PERCENT COMPACTIONOriginal or Corrected (DD / Dd) x 100
(C)+100(D)=
9795PERCENT OBTAINED
CORRECTED DRY DENSITY
MCf
13.6
15100
OPTIMUM MOISTURE
T 255 / T 265 MOISTURE %
MCc
2.6166.9
X100(C)=(b)
(a) - (b) X100100 - (B)
(B)(C)=
SPEEDY MOISTURE %
DRY DENSITY
127.6% M (C)
AASHTO T 255 / T 265 MOISTURE %WET(a) DRY(b)
MASS OF WETMATERIAL (M)
WET DENSITY
144.7
SPEEDY MOISTURE %
10642.2
MASS OFMOLD
5718.1
AD
MASS OF MOLDAND MATERIALS
AASHTO 11015 15T 99 ¾ COARSE 1940 FINE % Coarse
1DATE OF TEST 10/18/2006
TEST LOCATION (STATION) "LN" 7+15
TEST NUMBER
COMBINED OPTIMUM MOISTURE ( MCT )
Based on Curve Info.
COMBINED IN-PLACE MOISTURE +
W=
W = ( (C)Pf + MCcPc ) / 100
MCT = ( MCfPf + MCcPc ) / 100+
10/18/2006
TYPE GAUGE-SERIAL NUMBER: Humboldt 5001c #1234COMPANY NAME SIGNATURE DATE
Scott Aker #43048 ODOT
CODES FOR ROLLER TYPESSF- SHEEP FOOT
GR - GRID ROLLERSDV-SINGLE DRUM VIBRATORYDDV-DOUBLE DRUM VIBRATORY
REPRESENTS MATERIAL / AREA INCORPORATED From Station "LN" 5+52
Tampo - 10 ton - Sheepsfoot
2.5'Distance Below Grade
ROLLER TYPE AND DESCRIPTION ( MANUFACTURE, WEIGHT, ETC
1156
To Station
Df
8 inch8 inchPercent Moisture
k (Gsb x 62.4)
39
BID ITEM NUMBER
ODOT FormsC0NTRACTOR OR SUPPLIER PROJECT MANAGER
Sean Parker 123
PROJECT NAME (SECTION) CONTRACT NUMBER
Forms Example 12345
4924.1
NUCLEAR COMPACTION TEST REPORT English (E) or Metric(M)
Pf = 100 - Pc
( C ) = unaltered one-point Moist. For In-Place Combined Moist.
128.31AASHTO T 224
X100
144
DRY DENSITY
"LN" 9+24Off SetOff Set
143.5 13.9
6' RtDIST BELOW GRADE 1.5'
COARSE
Distance Below Grade 1.5'20' Rt20' Lt
% Coarse 42№4 75655390 FINE
129.6 10.7
AASHTO T 310Shot 1 (M / DD) X 100142.9Shot 2
WD - M13.614.2
Check appropriate based on spec.
+
100RELATIVE MAXIMUM DRY
DENSITY lb/ft³85
Moisture is not within specification
Percent Required
132.9
Moisture is within specification
DD = WD / (1+(W/100))If not Correct T 310 DD
1139
CURVE NO.
734-1793_S (10-2006)
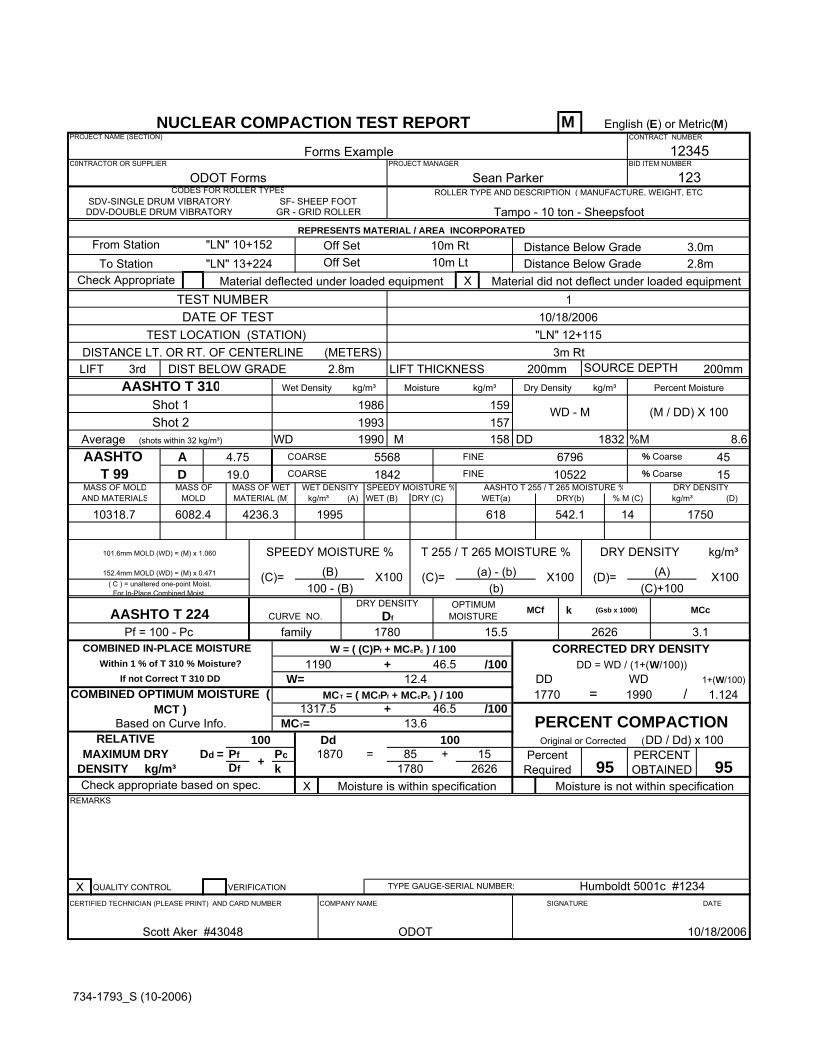
M
X
LIFT THICKNESS SOURCE DEPTH
(shots within 32 kg/m³) WD M DD %M
(A) WET (B) DRY (C) (D)
(A)
/100
= //100
DdDd = Pf Pc = +
Df kX
REMARKS
X QUALITY CONTROL VERIFICATION
CERTIFIED TECHNICIAN (PLEASE PRINT) AND CARD NUMBER
85
Moisture is not within specification
Percent Required
1870
Moisture is within specification
DD = WD / (1+(W/100))If not Correct T 310 DD
1190
CURVE NO.
Check appropriate based on spec.
+
100RELATIVE MAXIMUM DRY
DENSITY kg/m³
1832 8.6
AASHTO T 310Shot 1 (M / DD) X 1001986Shot 2
WD - M157159
% Coarse 454.75 67965568 FINE
Distance Below Grade 2.8m10m Rt10m Lt
DRY DENSITY
"LN" 13+224Off SetOff Set
1990 158
3m RtDIST BELOW GRADE 2.8m
COARSE
4236.3
NUCLEAR COMPACTION TEST REPORT English (E) or Metric(M)
Pf = 100 - Pc
( C ) = unaltered one-point Moist. For In-Place Combined Moist.
1780familyAASHTO T 224
X100
1993
PROJECT NAME (SECTION) CONTRACT NUMBER
Forms Example 12345BID ITEM NUMBER
ODOT FormsC0NTRACTOR OR SUPPLIER PROJECT MANAGER
Sean Parker 123ROLLER TYPE AND DESCRIPTION ( MANUFACTURE, WEIGHT, ETC
1317.5
To Station
Df
200mm200mmPercent Moisture
k (Gsb x 1000)
46.5
REPRESENTS MATERIAL / AREA INCORPORATED From Station "LN" 10+152
Tampo - 10 ton - Sheepsfoot
3.0mDistance Below Grade
CODES FOR ROLLER TYPESSF- SHEEP FOOT
GR - GRID ROLLERSDV-SINGLE DRUM VIBRATORYDDV-DOUBLE DRUM VIBRATORY
10/18/2006
TYPE GAUGE-SERIAL NUMBER: Humboldt 5001c #1234COMPANY NAME SIGNATURE DATE
Scott Aker #43048 ODOT
COMBINED OPTIMUM MOISTURE ( MCT )
Based on Curve Info.
COMBINED IN-PLACE MOISTURE +
W=
W = ( (C)Pf + MCcPc ) / 100
MCT = ( MCfPf + MCcPc ) / 100+
1DATE OF TEST 10/18/2006
TEST LOCATION (STATION) "LN" 12+115
TEST NUMBER
10522 15T 99 19.0 COARSE 1842 FINE % Coarse
AD
MASS OF MOLDAND MATERIALS
AASHTO
10318.7
MASS OFMOLD
6082.4
MASS OF WETMATERIAL (M)
WET DENSITY
1995
SPEEDY MOISTURE % DRY DENSITY
1750% M (C)
AASHTO T 255 / T 265 MOISTURE %WET(a) DRY(b)
100 - (B)(B)(C)=
SPEEDY MOISTURE %
OPTIMUM MOISTURE
T 255 / T 265 MOISTURE %
MCc
3.12626
X100(C)=(b)
(a) - (b) X100(C)+100
(D)=
9595PERCENT OBTAINED
CORRECTED DRY DENSITY
MCf
15.5
15100
Material did not deflect under loaded equipment
2626
1.1241770 1990DD WD 1+(W/100)
PERCENT COMPACTIONOriginal or Corrected (DD / Dd) x 100
Check Appropriate Material deflected under loaded equipment
Within 1 % of T 310 % Moisture?
1780
12.4
46.5MCT= 13.6
101.6mm MOLD (WD) = (M) x 1.060
152.4mm MOLD (WD) = (M) x 0.471
DISTANCE LT. OR RT. OF CENTERLINE (METERS)
Wet Density kg/m³
LIFT 3rdMoisture kg/m³ Dry Density kg/m³
Average
kg/m³DRY DENSITY
kg/m³kg/m³
14618 542.1
734-1793_S (10-2006)
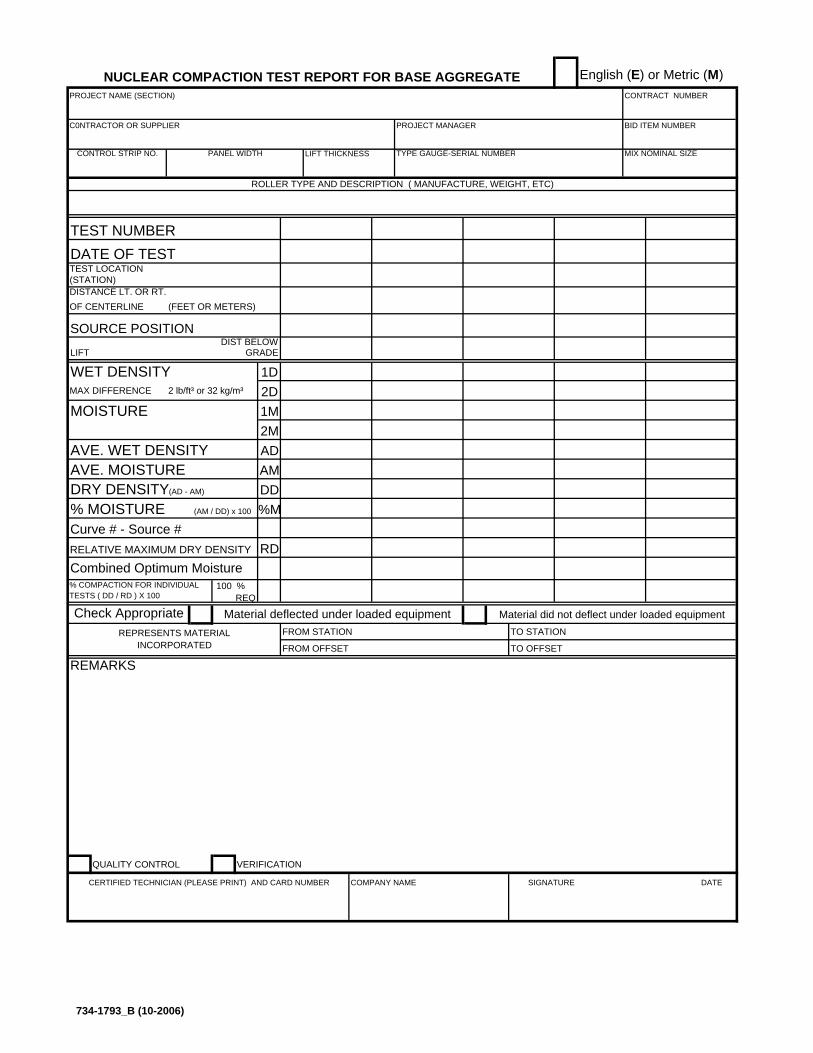
English (E) or Metric (M)
LIFT THICKNESS
TEST NUMBERDATE OF TESTTEST LOCATION (STATION)DISTANCE LT. OR RT.OF CENTERLINE (FEET OR METERS)
SOURCE POSITIONDIST BELOW
LIFT GRADE
WET DENSITY 1DMAX DIFFERENCE 2 lb/ft³ or 32 kg/m³ 2DMOISTURE 1M
2MAVE. WET DENSITY ADAVE. MOISTURE AMDRY DENSITY(AD - AM) DD
%M
RD
% COMPACTION FOR INDIVIDUAL %TESTS ( DD / RD ) X 100 REQ
FROM STATION TO STATION
FROM OFFSET TO OFFSET
REMARKS
QUALITY CONTROL VERIFICATION
Check Appropriate Material deflected under loaded equipment Material did not deflect under loaded equipment
Curve # - Source #
REPRESENTS MATERIALINCORPORATED
CONTRACT NUMBER
ROLLER TYPE AND DESCRIPTION ( MANUFACTURE, WEIGHT, ETC)
PANEL WIDTH
PROJECT NAME (SECTION)
PROJECT MANAGER
TYPE GAUGE-SERIAL NUMBER
C0NTRACTOR OR SUPPLIER
CONTROL STRIP NO.
SIGNATURE DATE
BID ITEM NUMBER
MIX NOMINAL SIZE
COMPANY NAMECERTIFIED TECHNICIAN (PLEASE PRINT) AND CARD NUMBER
Combined Optimum Moisture100
RELATIVE MAXIMUM DRY DENSITY
% MOISTURE (AM / DD) x 100
NUCLEAR COMPACTION TEST REPORT FOR BASE AGGREGATE
734-1793_B (10-2006)

wet average
0 0 0 0 0
E 0 0 0 0 0
moist average
0 0 0 0 0E 0 0 0 0 0M 0 0 0 0 0
dry density
E 0 0 0 0 0M 0 0 0 0 0
% moisture
E #DIV/0! #DIV/0! #DIV/0! #DIV/0! #DIV/0!RE #DIV/0! #DIV/0! #DIV/0! #DIV/0! #DIV/0!
0 0 0 0 0M
M
RM
#DIV/0!
#DIV/0!
#DIV/0! #DIV/0! #DIV/0! #DIV/0!
#DIV/0! #DIV/0! #DIV/0! #DIV/0!
734-1793_B (10-2006)
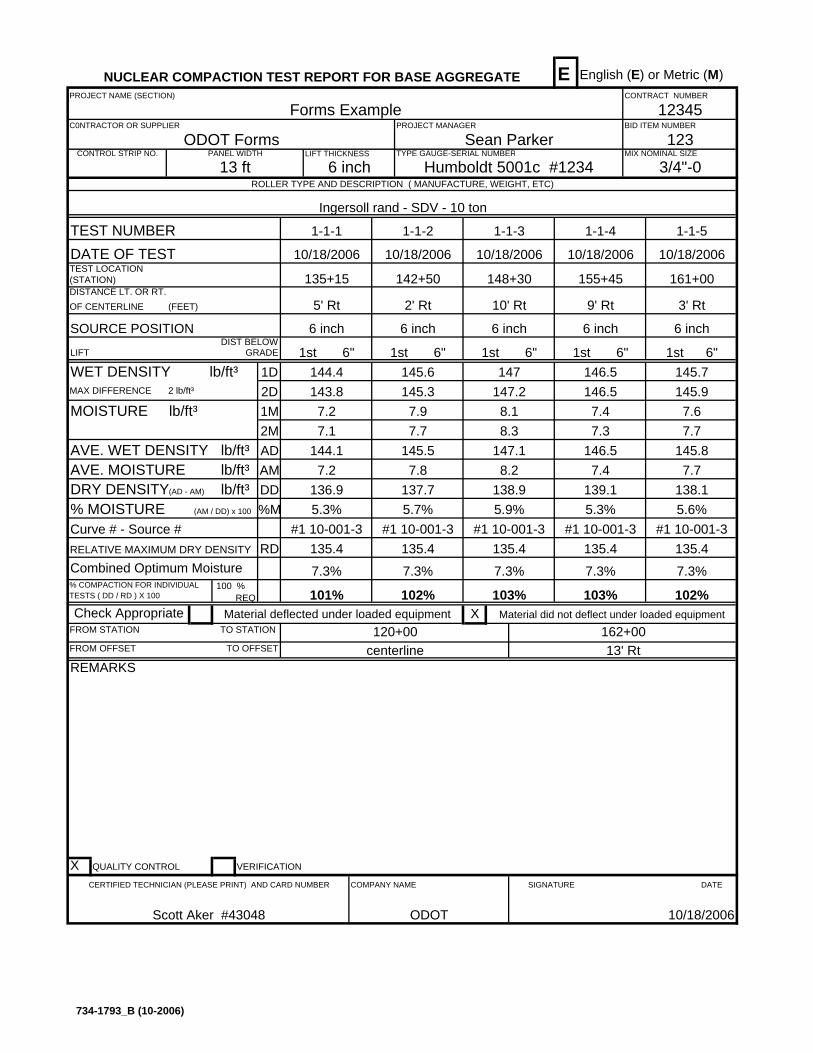
E English (E) or Metric (M)
LIFT THICKNESS
TEST NUMBERDATE OF TESTTEST LOCATION (STATION)DISTANCE LT. OR RT.OF CENTERLINE (FEET)
SOURCE POSITIONDIST BELOW
LIFT GRADE
WET DENSITY 1DMAX DIFFERENCE 2 lb/ft³ 2DMOISTURE lb/ft³ 1M
2MAVE. WET DENSITY ADAVE. MOISTURE AMDRY DENSITY(AD - AM) DD
%M
RD
% COMPACTION FOR INDIVIDUAL %TESTS ( DD / RD ) X 100 REQ
XFROM STATION TO STATION
FROM OFFSET TO OFFSET
REMARKS
X QUALITY CONTROL VERIFICATION
Check Appropriate Material deflected under loaded equipment Material did not deflect under loaded equipment
5.9% 5.3% 5.6%Curve # - Source # #1 10-001-3 #1 10-001-3 #1 10-001-3 #1 10-001-3 #1 10-001-3
103% 102%103%
7.3% 7.3% 7.3%
centerline 13' Rt
1st 6"144.4143.8
135.4
7.2
5.3%
7.1
145.3
1st 6"147
147.2
101%
7.3%
7.2 7.8
102%
7.3%
135.4
5.7%
146.5
145.7145.97.67.7
146.5146.57.47.3
145.8
CONTRACT NUMBER
ROLLER TYPE AND DESCRIPTION ( MANUFACTURE, WEIGHT, ETC)
120+00 162+00
PANEL WIDTH
13 ft 6 inch
1-1-5
3' Rt
PROJECT NAME (SECTION)
PROJECT MANAGER
TYPE GAUGE-SERIAL NUMBERSean ParkerODOT Forms
C0NTRACTOR OR SUPPLIERForms Example
CONTROL STRIP NO.
SIGNATURE DATE
10/18/2006
BID ITEM NUMBER
MIX NOMINAL SIZE
3/4"-0Humboldt 5001c #1234
123
1st 6"
6 inch
ODOT
COMPANY NAME
Scott Aker #43048
CERTIFIED TECHNICIAN (PLEASE PRINT) AND CARD NUMBER
1-1-2
10/18/2006
142+50
2' Rt
144.1 145.5
lb/ft³
10/18/2006
161+00
12345
6 inch
155+45
9' Rt
Ingersoll rand - SDV - 10 ton
10/18/2006
135+15
5' Rt
1-1-1 1-1-4
10/18/2006
7.9
6 inch 6 inch 6 inch
1st 6"145.6
1st 6"
138.1138.98.2 7.4
135.4 135.4135.4
8.3147.1
7.7136.9 137.7 139.1
Combined Optimum Moisture100
RELATIVE MAXIMUM DRY DENSITY
% MOISTURE (AM / DD) x 100
NUCLEAR COMPACTION TEST REPORT FOR BASE AGGREGATE
lb/ft³
lb/ft³
lb/ft³
1-1-3
10/18/2006
148+30
10' Rt
8.17.7
734-1793_B (10-2006)

M English (E) or Metric (M)
LIFT THICKNESS
TEST NUMBERDATE OF TESTTEST LOCATION (STATION)DISTANCE LT. OR RT.OF CENTERLINE (METERS)
SOURCE POSITIONDIST BELOW
LIFT GRADE
WET DENSITY 1DMAX DIFFERENCE 32 kg/m³ 2DMOISTURE kg/m³ 1M
2MAVE. WET DENSITY ADAVE. MOISTURE AMDRY DENSITY(AD - AM) DD
%M
RD
% COMPACTION FOR INDIVIDUAL %TESTS ( DD / RD ) X 100 REQ
XFROM STATION TO STATION
FROM OFFSET TO OFFSET
REMARKS
X QUALITY CONTROL VERIFICATION
NUCLEAR COMPACTION TEST REPORT FOR BASE AGGREGATE
kg/m³
kg/m³
kg/m³
1-1-3
10/18/2006
0+130
2.1m Rt
171192
Combined Optimum Moisture100
RELATIVE MAXIMUM DRY DENSITY
% MOISTURE (AM / DD) x 100
1994 19941994
1702281
1772010 2039 2112 20872110
171 187
1-1-1 1-1-4
10/18/2006
189
150mm 150mm 150mm
1st top2226
1st top
10/18/2006
0+172
12345
150mm
0+156
3.0m Rt
Ingersoll rand - SDV - 10 ton
10/18/2006
0+065
1.5m Rt
COMPANY NAME
Scott Aker #43048
CERTIFIED TECHNICIAN (PLEASE PRINT) AND CARD NUMBER
1-1-2
10/18/2006
0+087
2.3m Rt
2209 2230
kg/m³
SIGNATURE DATE
10/18/2006
BID ITEM NUMBER
MIX NOMINAL SIZE
19.0mm-0Humboldt 5001c #1234
123
1st top
150mm
ODOT
PROJECT NAME (SECTION)
PROJECT MANAGER
TYPE GAUGE-SERIAL NUMBERSean ParkerODOT Forms
C0NTRACTOR OR SUPPLIERForms Example
CONTROL STRIP NO.
CONTRACT NUMBER
ROLLER TYPE AND DESCRIPTION ( MANUFACTURE, WEIGHT, ETC)
0+000 0+250
PANEL WIDTH
Varies 150mm
1-1-5
1.9m Rt
2299
22592269179175
23012296184189
2264
101%
9.7%
199 191
102%
9.7%
1994
9.4%
2234
1st top22782284
1st top22072211
1994
201
9.9%
197
centerline 6.5m Rt
#1 10-001-3 #1 10-001-3
106% 105%106%
9.7% 9.7% 9.7%
Check Appropriate Material deflected under loaded equipment Material did not deflect under loaded equipment
8.1% 8.9% 8.5%Curve # - Source # #1 10-001-3 #1 10-001-3 #1 10-001-3
734-1793_B (10-2006)
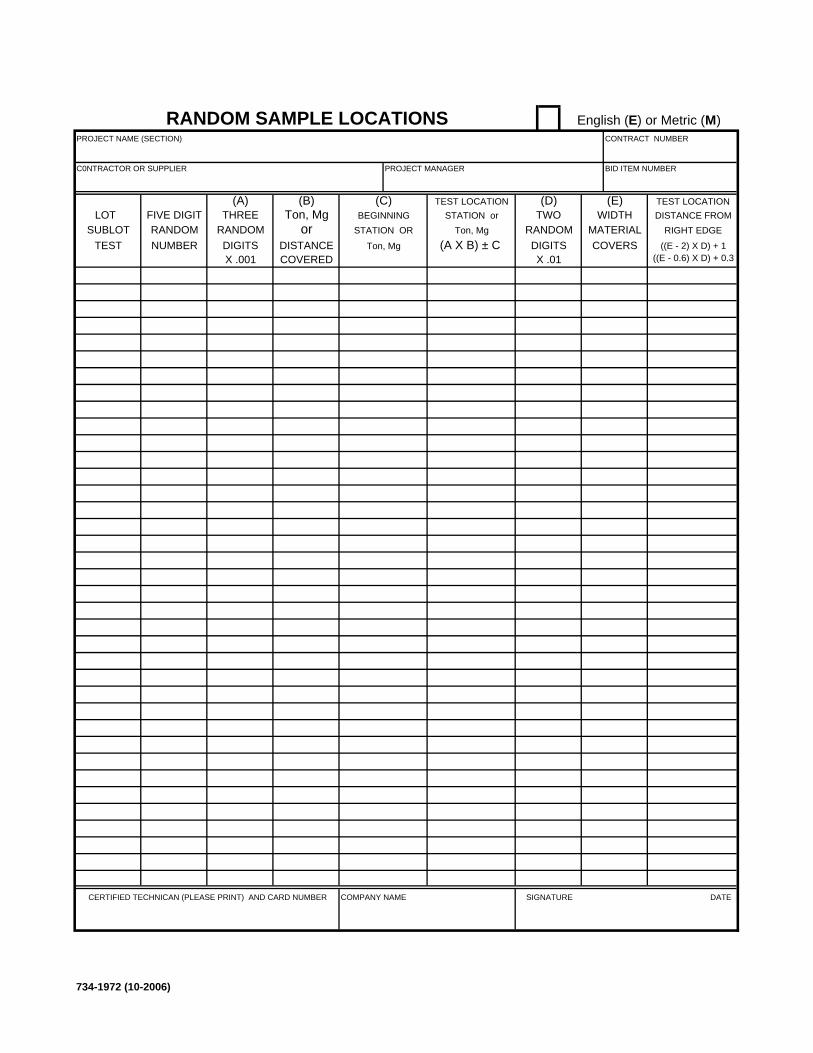
COMPANY NAME
CONTRACT NUMBER
BID ITEM NUMBER
TEST LOCATIONFIVE DIGIT Ton, Mg
X .01
DISTANCE FROMRIGHT EDGE
WIDTHMATERIALCOVERSDIGITS ((E - 2) X D) + 1
((E - 0.6) X D) + 0.3Ton, MgTEST NUMBER (A X B) ± C DIGITS
X .001 COVERED
LOT SUBLOT
THREERANDOMRANDOM
(A) (B) (E)
or STATION ORSTATION or
Ton, Mg
TEST LOCATION(C)BEGINNING
PROJECT NAME (SECTION)
PROJECT MANAGERC0NTRACTOR OR SUPPLIER
TWO
RANDOM SAMPLE LOCATIONS English (E) or Metric (M)
CERTIFIED TECHNICAN (PLEASE PRINT) AND CARD NUMBER SIGNATURE DATE
(D)
RANDOMDISTANCE
734-1972 (10-2006)
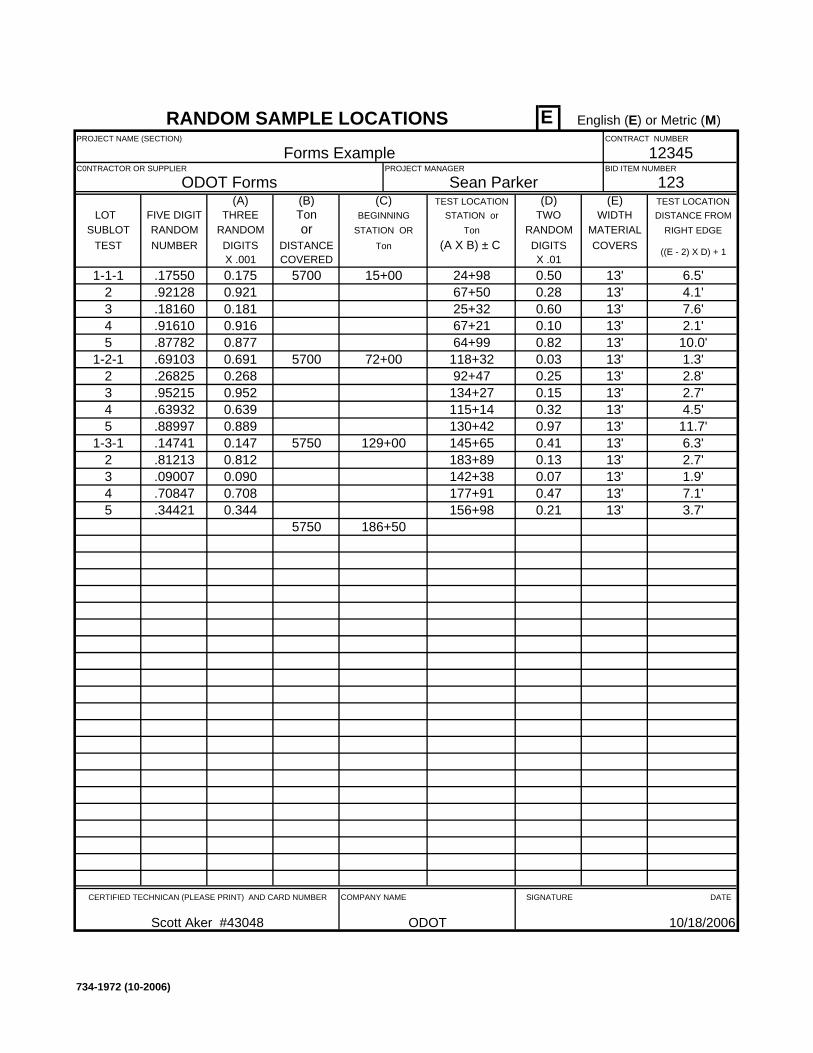
E
Scott Aker #43048
TWO
RANDOM SAMPLE LOCATIONS English (E) or Metric (M)
CERTIFIED TECHNICAN (PLEASE PRINT) AND CARD NUMBER SIGNATURE DATE
(D)
RANDOMDISTANCECOVERED
PROJECT NAME (SECTION)
PROJECT MANAGER
Sean ParkerODOT FormsC0NTRACTOR OR SUPPLIER
Forms Example
(A) (B) (E)
or LOT
SUBLOTTHREE
RANDOMRANDOM
1-1-1 5700
DIGITSX .0010.175.17550
TonTEST NUMBERSTATION OR
STATION orTon
(A X B) ± C X .01
DISTANCE FROMRIGHT EDGE
WIDTHMATERIALCOVERSDIGITS ((E - 2) X D) + 1
TEST LOCATION(C)BEGINNINGFIVE DIGIT Ton
0.50 6.5'15+00 13'24+982 .92128 0.921 67+50
CONTRACT NUMBER
12345BID ITEM NUMBER
123
0.28 13' 4.1'
TEST LOCATION
3 .18160 0.181 25+32 0.60 13' 7.6'4 .91610 0.916 67+21 0.10 13' 2.1'5 .87782 0.877 64+99 0.82 13' 10.0'
1-2-1 .69103 0.691 5700 72+00 118+32 0.03 13' 1.3'2 .26825 0.268 92+47 0.25 13' 2.8'3 .95215 0.952 134+27 0.15 13' 2.7'4 .63932 0.639 115+14 0.32 13' 4.5'5 .88997 0.889 130+42 0.97 13' 11.7'
1-3-1 .14741 0.147 5750 129+00 145+65 0.41 13' 6.3'2 .81213 0.812 183+89 0.13 13' 2.7'3 .09007 0.090 142+38 0.07 13' 1.9'4 .70847 0.708 177+91 0.47 13' 7.1'5 .34421 0.344 156+98 0.21 13' 3.7'
5750 186+50
COMPANY NAME
ODOT 10/18/2006
734-1972 (10-2006)
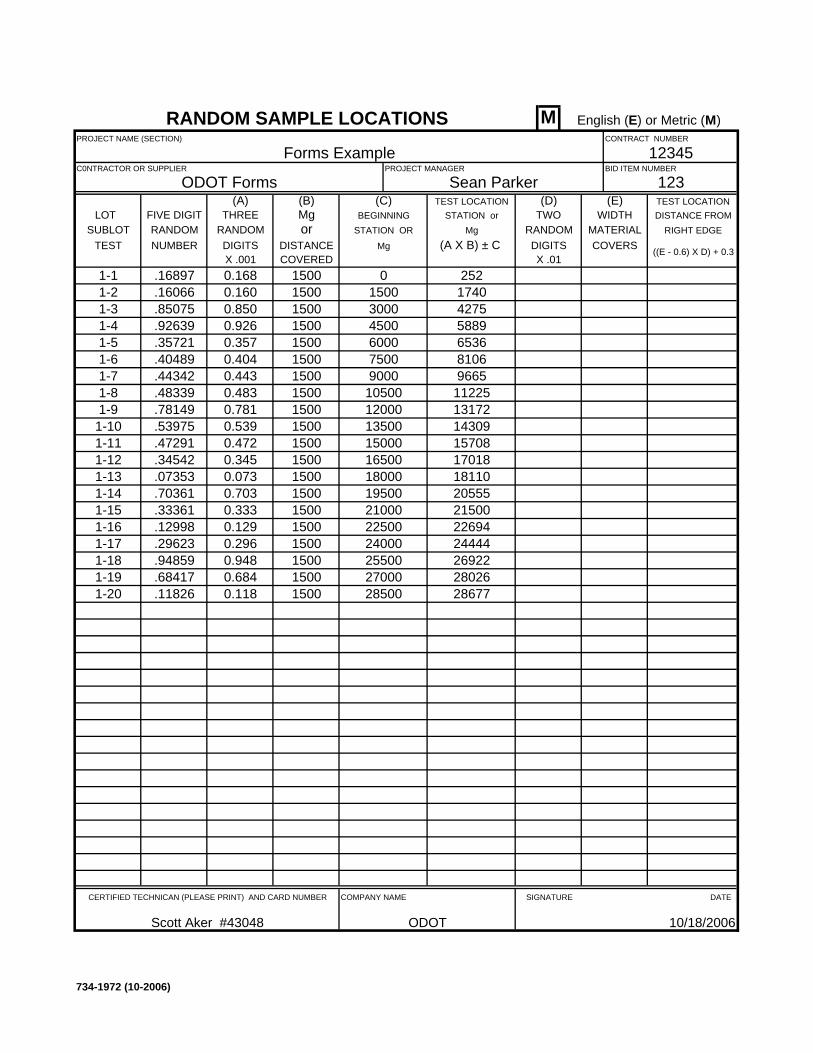
M
COMPANY NAME
ODOT 10/18/2006
1-20 .11826 0.118 1500 28500 2867727000 280261-19 .68417 0.684 1500
1-18 .94859 0.948 1500 25500 2692224000 244441-17 .29623 0.296 1500
1-16 .12998 0.129 1500 22500 2269421000 215001-15 .33361 0.333 1500
1-14 .70361 0.703 1500 19500 2055518000 181101-13 .07353 0.073 1500
1-12 .34542 0.345 1500 16500 1701815000 157081-11 .47291 0.472 1500
1-10 .53975 0.539 1500 13500 1430912000 131721-9 .78149 0.781 1500
1-8 .48339 0.483 1500 10500 112259000 96651-7 .44342 0.443 1500
1-6 .40489 0.404 1500 7500 81066000 65361-5 .35721 0.357 1500
1-4 .92639 0.926 1500 4500 58893000 42751-3 .85075 0.850 15001500 1740
CONTRACT NUMBER
12345BID ITEM NUMBER
123TEST LOCATION
1-2 .16066 0.160 15000 252
FIVE DIGIT Mg
X .01
DISTANCE FROMRIGHT EDGE
WIDTHMATERIALCOVERSDIGITS ((E - 0.6) X D) + 0.3MgTEST NUMBER (A X B) ± C
1-1 1500
DIGITSX .0010.168.16897
COVERED
LOT SUBLOT
THREERANDOMRANDOM
(A) (B) (E)
or STATION ORSTATION or
Mg
TEST LOCATION(C)BEGINNING
PROJECT NAME (SECTION)
PROJECT MANAGER
Sean ParkerODOT FormsC0NTRACTOR OR SUPPLIER
Forms Example
Scott Aker #43048
TWO
RANDOM SAMPLE LOCATIONS English (E) or Metric (M)
CERTIFIED TECHNICAN (PLEASE PRINT) AND CARD NUMBER SIGNATURE DATE
(D)
RANDOMDISTANCE
734-1972 (10-2006)
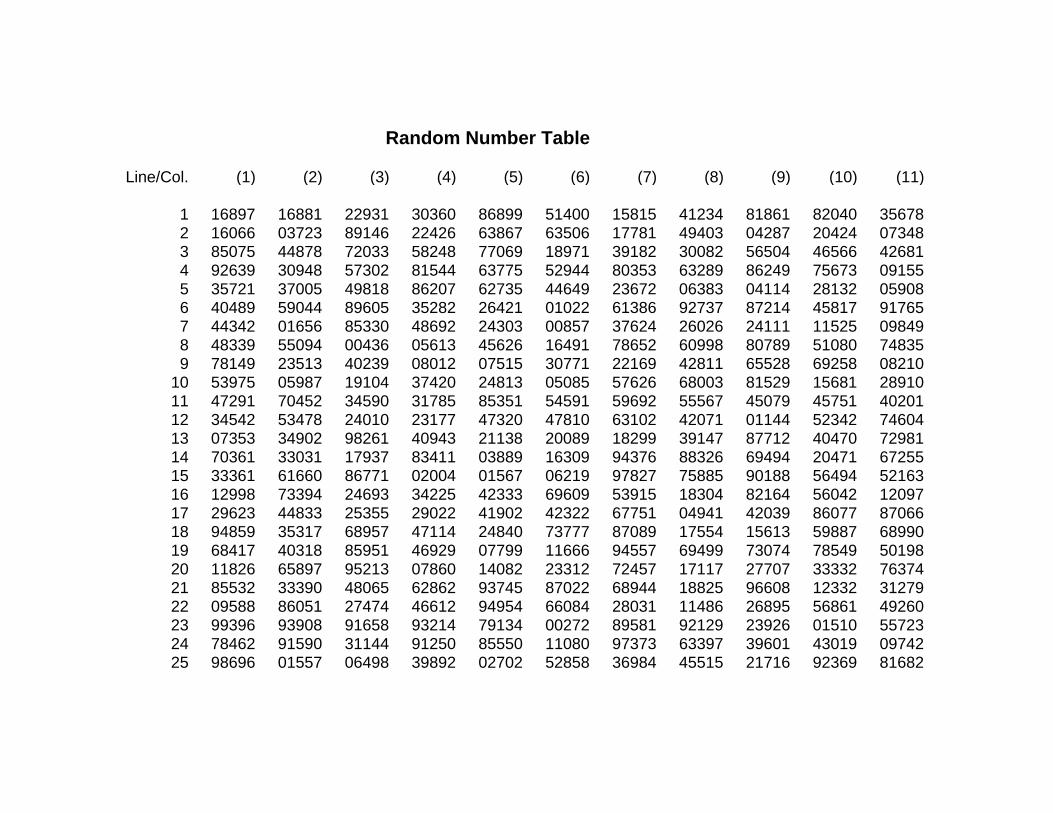
Random Number Table
Line/Col. (1) (2) (3) (4) (5) (6) (7) (8) (9) (10) (11)
1 16897 16881 22931 30360 86899 51400 15815 41234 81861 82040 356782 16066 03723 89146 22426 63867 63506 17781 49403 04287 20424 073483 85075 44878 72033 58248 77069 18971 39182 30082 56504 46566 426814 92639 30948 57302 81544 63775 52944 80353 63289 86249 75673 091555 35721 37005 49818 86207 62735 44649 23672 06383 04114 28132 059086 40489 59044 89605 35282 26421 01022 61386 92737 87214 45817 917657 44342 01656 85330 48692 24303 00857 37624 26026 24111 11525 098498 48339 55094 00436 05613 45626 16491 78652 60998 80789 51080 748359 78149 23513 40239 08012 07515 30771 22169 42811 65528 69258 08210
10 53975 05987 19104 37420 24813 05085 57626 68003 81529 15681 2891011 47291 70452 34590 31785 85351 54591 59692 55567 45079 45751 4020112 34542 53478 24010 23177 47320 47810 63102 42071 01144 52342 7460413 07353 34902 98261 40943 21138 20089 18299 39147 87712 40470 7298114 70361 33031 17937 83411 03889 16309 94376 88326 69494 20471 6725515 33361 61660 86771 02004 01567 06219 97827 75885 90188 56494 5216316 12998 73394 24693 34225 42333 69609 53915 18304 82164 56042 1209717 29623 44833 25355 29022 41902 42322 67751 04941 42039 86077 8706618 94859 35317 68957 47114 24840 73777 87089 17554 15613 59887 6899019 68417 40318 85951 46929 07799 11666 94557 69499 73074 78549 5019820 11826 65897 95213 07860 14082 23312 72457 17117 27707 33332 7637421 85532 33390 48065 62862 93745 87022 68944 18825 96608 12332 3127922 09588 86051 27474 46612 94954 66084 28031 11486 26895 56861 4926023 99396 93908 91658 93214 79134 00272 89581 92129 23926 01510 5572324 78462 91590 31144 91250 85550 11080 97373 63397 39601 43019 0974225 98696 01557 06498 39892 02702 52858 36984 45515 21716 92369 81682
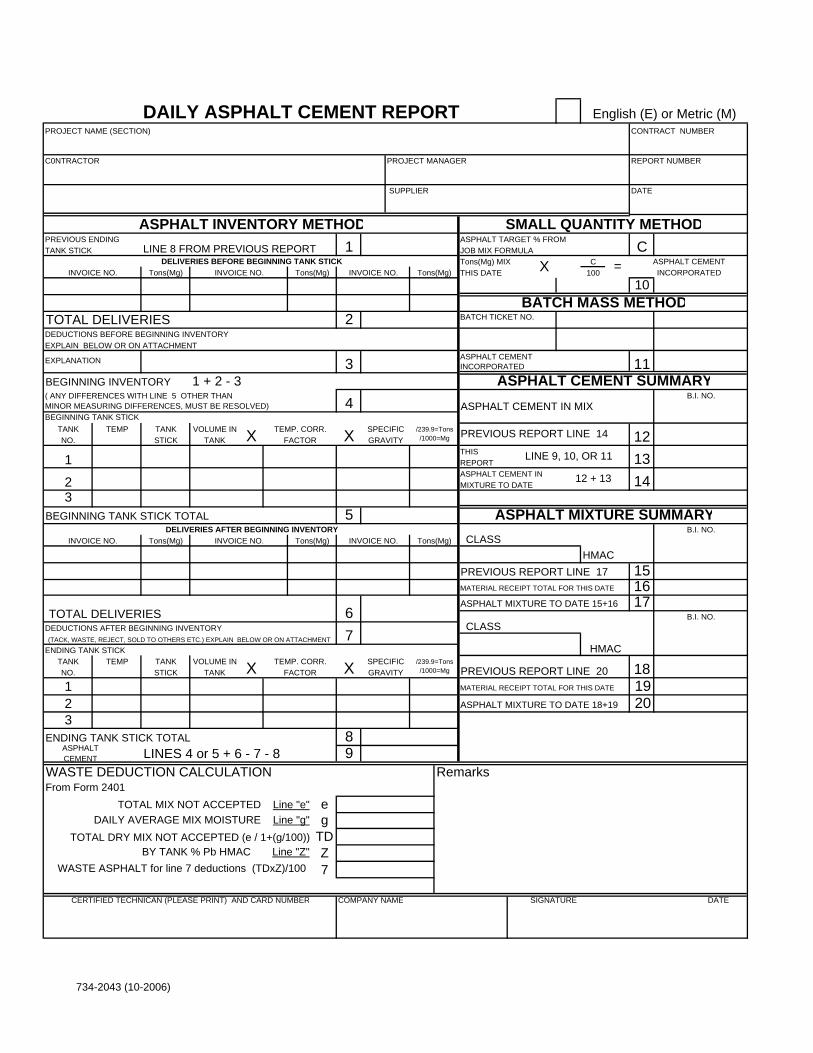
PREVIOUS ENDING ASPHALT TARGET % FROMTANK STICK JOB MIX FORMULA
Tons(Mg) MIX CTHIS DATE 100
10
TOTAL DELIVERIES 2DEDUCTIONS BEFORE BEGINNING INVENTORYEXPLAIN BELOW OR ON ATTACHMENT
ASPHALT CEMENTINCORPORATED
BEGINNING INVENTORY 1 + 2 - 3( ANY DIFFERENCES WITH LINE 5 OTHER THANMINOR MEASURING DIFFERENCES, MUST BE RESOLVED) ASPHALT CEMENT IN MIX
THIS REPORTASPHALT CEMENT IN MIXTURE TO DATE
BEGINNING TANK STICK TOTAL 5
HMACPREVIOUS REPORT LINE 17 15
16ASPHALT MIXTURE TO DATE 15+16 17
DEDUCTIONS AFTER BEGINNING INVENTORY
19ASPHALT MIXTURE TO DATE 18+19 20
ENDING TANK STICK TOTAL 8LINES 4 or 5 + 6 - 7 - 8 9
WASTE DEDUCTION CALCULATION RemarksFrom Form 2401
TOTAL MIX NOT ACCEPTED Line "e" eDAILY AVERAGE MIX MOISTURE Line "g" g
TOTAL DRY MIX NOT ACCEPTED (e / 1+(g/100)) TD BY TANK % Pb HMAC Line "Z" Z
WASTE ASPHALT for line 7 deductions (TDxZ)/100 7
4 0.00
SPECIFICGRAVITY
/239.9=Tons /1000=Mg
0.00
0.00
DAILY ASPHALT CEMENT REPORT English (E) or Metric (M)
TANK
32
ASPHALT CEMENT
ENDING TANK STICK7
1
TANK
Tons(Mg)
TEMP TANKSTICK
Tons(Mg)
3
INVOICE NO.Tons(Mg)
XTEMP. CORR.FACTOR
INVOICE NO.
XVOLUME IN
1DELIVERIES BEFORE BEGINNING TANK STICK
INVOICE NO. Tons(Mg) INVOICE NO.
LINE 8 FROM PREVIOUS REPORT
Tons(Mg)INVOICE NO. Tons(Mg)
12 + 13 141
BEGINNING TANK STICK
LINE 9, 10, OR 11
12
11
0.00
B.I. NO.
B.I. NO.
SIGNATURE DATE
B.I. NO.
13
18
CASPHALT CEMENT
SMALL QUANTITY METHOD
INCORPORATED
DATE
CERTIFIED TECHNICAN (PLEASE PRINT) AND CARD NUMBER COMPANY NAME
BATCH MASS METHOD
ASPHALT CEMENT SUMMARY
ASPHALT MIXTURE SUMMARY
BATCH TICKET NO.
NO.
X
3
PREVIOUS REPORT LINE 14
2
REPORT NUMBER
=
SUPPLIER
ASPHALT INVENTORY METHOD
EXPLANATION
CONTRACT NUMBER
PROJECT MANAGERC0NTRACTOR
PROJECT NAME (SECTION)
FACTOR
DELIVERIES AFTER BEGINNING INVENTORYINVOICE NO.
STICK TANKTEMP. CORR.TANK TEMP TANK VOLUME IN
/239.9=Tons /1000=Mg
X GRAVITY
6 0.00TOTAL DELIVERIES
NO.
MATERIAL RECEIPT TOTAL FOR THIS DATE
PREVIOUS REPORT LINE 20X
(TACK, WASTE, REJECT, SOLD TO OTHERS ETC.) EXPLAIN BELOW OR ON ATTACHMENT
SPECIFIC
CLASS
CLASS
MATERIAL RECEIPT TOTAL FOR THIS DATE
HMAC
734-2043 (10-2006)
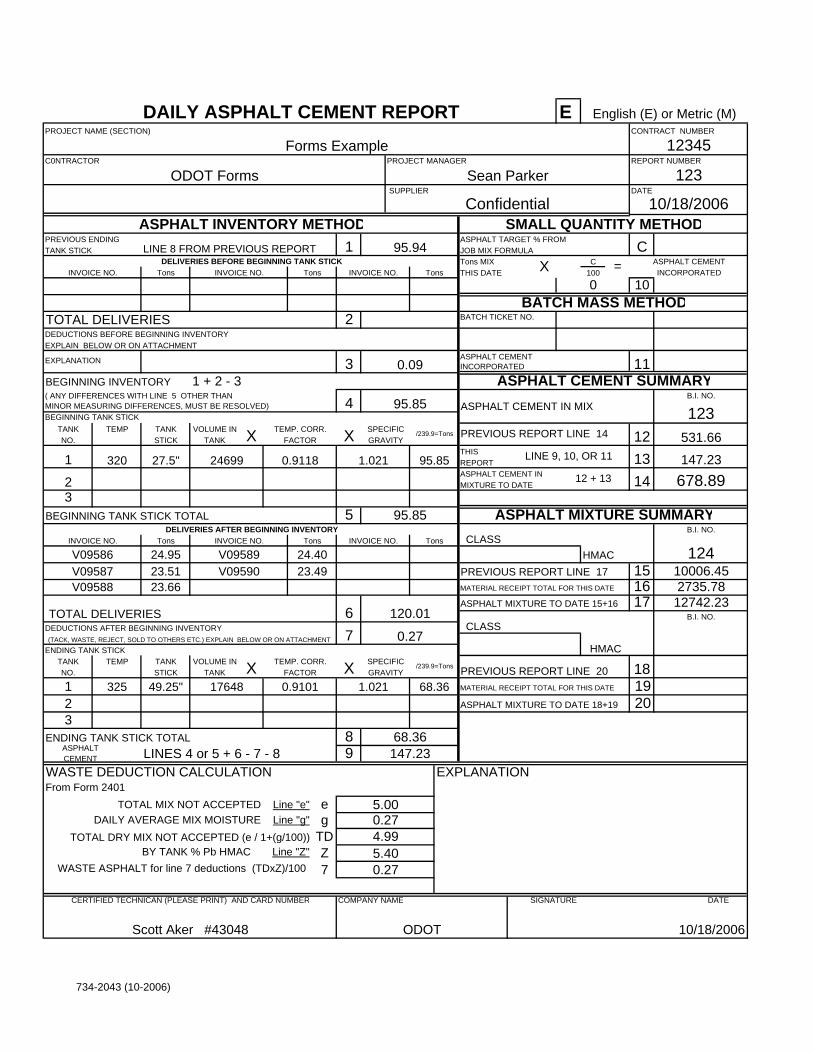
E
PREVIOUS ENDING ASPHALT TARGET % FROMTANK STICK JOB MIX FORMULA
Tons MIX CTHIS DATE 100
10
TOTAL DELIVERIES 2DEDUCTIONS BEFORE BEGINNING INVENTORYEXPLAIN BELOW OR ON ATTACHMENT
ASPHALT CEMENTINCORPORATED
BEGINNING INVENTORY 1 + 2 - 3( ANY DIFFERENCES WITH LINE 5 OTHER THANMINOR MEASURING DIFFERENCES, MUST BE RESOLVED) ASPHALT CEMENT IN MIX
THIS REPORTASPHALT CEMENT IN MIXTURE TO DATE
BEGINNING TANK STICK TOTAL 5
HMACPREVIOUS REPORT LINE 17 15
16ASPHALT MIXTURE TO DATE 15+16 17
DEDUCTIONS AFTER BEGINNING INVENTORY
19ASPHALT MIXTURE TO DATE 18+19 20
ENDING TANK STICK TOTAL 8LINES 4 or 5 + 6 - 7 - 8 9
WASTE DEDUCTION CALCULATION EXPLANATIONFrom Form 2401
TOTAL MIX NOT ACCEPTED Line "e" eDAILY AVERAGE MIX MOISTURE Line "g" g
TOTAL DRY MIX NOT ACCEPTED (e / 1+(g/100)) TD BY TANK % Pb HMAC Line "Z" Z
WASTE ASPHALT for line 7 deductions (TDxZ)/100 7
MATERIAL RECEIPT TOTAL FOR THIS DATE
HMAC
MATERIAL RECEIPT TOTAL FOR THIS DATE
PREVIOUS REPORT LINE 20
TOTAL DELIVERIES
NO.
CLASS
0.00
24.40
6 120.01
TANK TEMP TANK VOLUME IN
5.400.27
0.274.99
TANK
17648 0.9101FACTORX TEMP. CORR.
147.23
5.00
SPECIFIC
68.36
/239.9=Tons
0.00
X GRAVITY
Confidential
DELIVERIES AFTER BEGINNING INVENTORY
V09587V09586
INVOICE NO.
24.95
EXPLANATION
CONTRACT NUMBER
PROJECT MANAGER
Sean ParkerODOT FormsC0NTRACTOR
PROJECT NAME (SECTION)
123
12345REPORT NUMBER
Forms Example
2320
NO.
23.51
X0
=
CLASS
DATE
CERTIFIED TECHNICAN (PLEASE PRINT) AND CARD NUMBER COMPANY NAME
BATCH MASS METHOD
ASPHALT CEMENT SUMMARY
ASPHALT MIXTURE SUMMARY
BATCH TICKET NO.
10/18/2006 SUPPLIER
ASPHALT INVENTORY METHODC
ASPHALT CEMENT
SMALL QUANTITY METHOD
INCORPORATED
95.94
SIGNATURE DATE
Scott Aker #43048 ODOT 10/18/2006
B.I. NO.
13
18
124
2735.7810006.45
12742.23
B.I. NO.
123
B.I. NO.
147.23678.89
531.66
11
0.00
3
PREVIOUS REPORT LINE 14
LINE 9, 10, OR 11
0.09
95.85
12
12 + 13 141
BEGINNING TANK STICK
0.00
0.9118 1.02124699
1DELIVERIES BEFORE BEGINNING TANK STICK
INVOICE NO. Tons INVOICE NO.
LINE 8 FROM PREVIOUS REPORT
TonsINVOICE NO. Tons
XTEMP. CORR.FACTOR
INVOICE NO.
V09590
Tons
3
23.49
INVOICE NO.
TEMP TANKSTICK XVOLUME IN
TANK
27.5"
V09588 23.66
ENDING TANK STICK7 0.27
1 325 49.25"
(TACK, WASTE, REJECT, SOLD TO OTHERS ETC.) EXPLAIN BELOW OR ON ATTACHMENT
STICK
ASPHALT CEMENT
32
DAILY ASPHALT CEMENT REPORT English (E) or Metric (M)
0.00
TANK
1.021 68.36
Tons
V09589
4 95.85
SPECIFICGRAVITY
/239.9=Tons
Tons
95.85
734-2043 (10-2006)
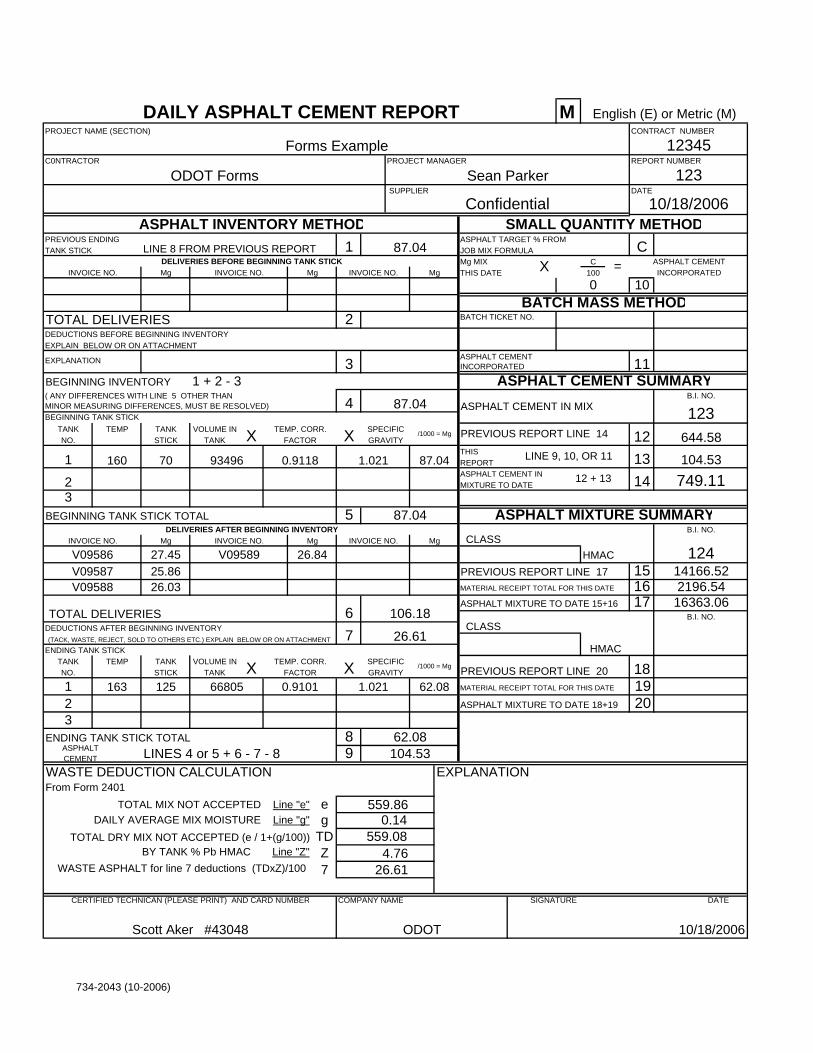
M
PREVIOUS ENDING ASPHALT TARGET % FROMTANK STICK JOB MIX FORMULA
Mg MIX CTHIS DATE 100
10
TOTAL DELIVERIES 2DEDUCTIONS BEFORE BEGINNING INVENTORYEXPLAIN BELOW OR ON ATTACHMENT
ASPHALT CEMENTINCORPORATED
BEGINNING INVENTORY 1 + 2 - 3( ANY DIFFERENCES WITH LINE 5 OTHER THANMINOR MEASURING DIFFERENCES, MUST BE RESOLVED) ASPHALT CEMENT IN MIX
THIS REPORTASPHALT CEMENT IN MIXTURE TO DATE
BEGINNING TANK STICK TOTAL 5
HMACPREVIOUS REPORT LINE 17 15
16ASPHALT MIXTURE TO DATE 15+16 17
DEDUCTIONS AFTER BEGINNING INVENTORY
19ASPHALT MIXTURE TO DATE 18+19 20
ENDING TANK STICK TOTAL 8LINES 4 or 5 + 6 - 7 - 8 9
WASTE DEDUCTION CALCULATION EXPLANATIONFrom Form 2401
TOTAL MIX NOT ACCEPTED Line "e" eDAILY AVERAGE MIX MOISTURE Line "g" g
TOTAL DRY MIX NOT ACCEPTED (e / 1+(g/100)) TD BY TANK % Pb HMAC Line "Z" Z
WASTE ASPHALT for line 7 deductions (TDxZ)/100 7
4 87.04
SPECIFICGRAVITY
/1000 = Mg
559.860.14
559.084.76
2
DAILY ASPHALT CEMENT REPORT English (E) or Metric (M)
0.00
TANK
1.021 62.08
Mg
V09589
ASPHALT CEMENT
3
ENDING TANK STICK7 26.61
1 163 125
(TACK, WASTE, REJECT, SOLD TO OTHERS ETC.) EXPLAIN BELOW OR ON ATTACHMENT
V09588 26.03
INVOICE NO.
TEMP TANKSTICK XVOLUME IN
TANK
70
Mg
87.043
INVOICE NO.Mg
XTEMP. CORR.FACTOR
1DELIVERIES BEFORE BEGINNING TANK STICK
INVOICE NO. Mg INVOICE NO.
LINE 8 FROM PREVIOUS REPORT
MgINVOICE NO. Mg
12 + 13 141
BEGINNING TANK STICK
0.00
0.9118 1.02193496 LINE 9, 10, OR 1187.04
12
11
0.00
B.I. NO.
123
B.I. NO.
104.53749.11
644.58
B.I. NO.
13
18
124
2196.5414166.52
16363.06
SIGNATURE DATE
Scott Aker #43048 ODOT 10/18/2006
SUPPLIER
ASPHALT INVENTORY METHODC
ASPHALT CEMENT
SMALL QUANTITY METHOD
INCORPORATED
87.04
DATE
CERTIFIED TECHNICAN (PLEASE PRINT) AND CARD NUMBER COMPANY NAME
BATCH MASS METHOD
ASPHALT CEMENT SUMMARY
ASPHALT MIXTURE SUMMARY
BATCH TICKET NO.
10/18/2006
25.86
X0
=
3
PREVIOUS REPORT LINE 14
2160
NO.
CONTRACT NUMBER
PROJECT MANAGER
Sean ParkerODOT FormsC0NTRACTOR
PROJECT NAME (SECTION)
123
12345REPORT NUMBER
Forms Example
Confidential
DELIVERIES AFTER BEGINNING INVENTORY
V09587V09586
INVOICE NO.
27.45
EXPLANATION
104.53
SPECIFICSTICK TANK
66805 0.9101FACTORX X
26.61
TEMP. CORR.TANK TEMP TANK VOLUME IN
62.08
/1000 = Mg
0.00
GRAVITY
0.00
26.84
6 106.18TOTAL DELIVERIES
NO.
CLASS
CLASS
MATERIAL RECEIPT TOTAL FOR THIS DATE
HMAC
MATERIAL RECEIPT TOTAL FOR THIS DATE
PREVIOUS REPORT LINE 20
734-2043 (10-2006)
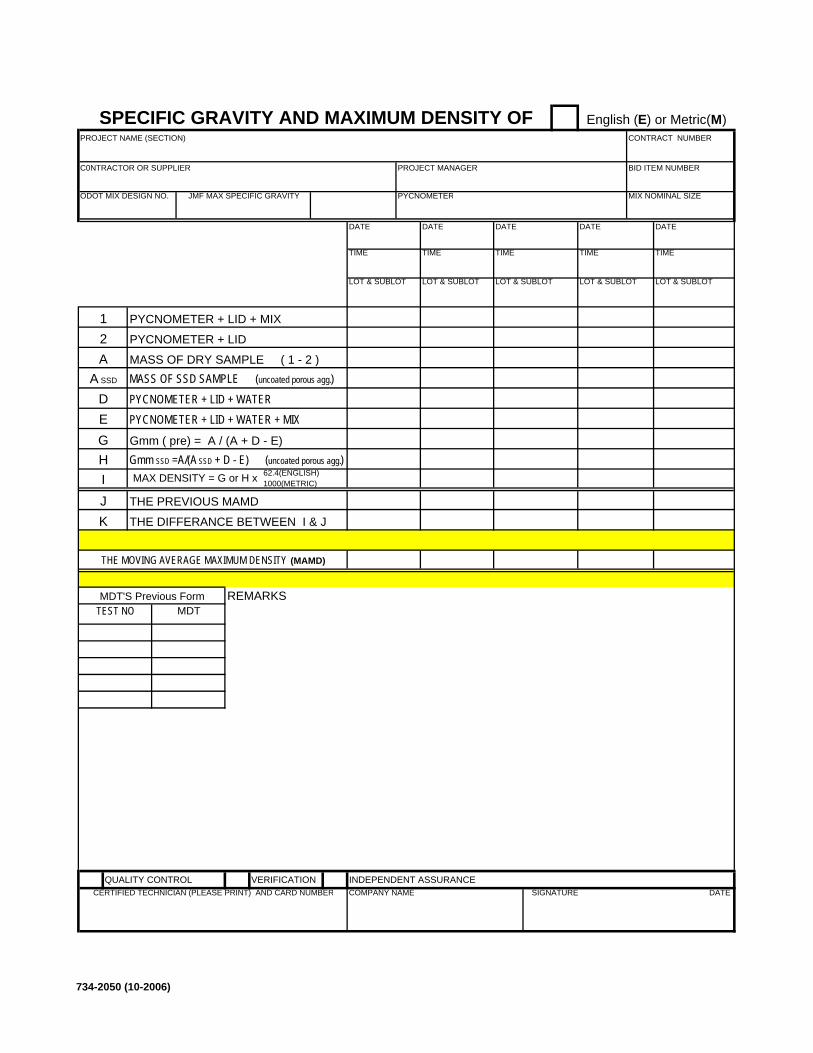
REMARKS
QUALITY CONTROL VERIFICATION INDEPENDENT ASSURANCE
SPECIFIC GRAVITY AND MAXIMUM DENSITY OF English (E) or Metric(M)
62.4(ENGLISH) 1000(METRIC)MAX DENSITY = G or H x
PROJECT NAME (SECTION)
PROJECT MANAGER
PYCNOMETER
C0NTRACTOR OR SUPPLIER
JMF MAX SPECIFIC GRAVITY
CONTRACT NUMBER
CERTIFIED TECHNICIAN (PLEASE PRINT) AND CARD NUMBER
ODOT MIX DESIGN NO.
SIGNATURE DATE
MIX NOMINAL SIZE
LOT & SUBLOT LOT & SUBLOT
DATE DATE
TIMETIME
DATE DATE
COMPANY NAME
BID ITEM NUMBER
LOT & SUBLOT
H
PYCNOMETER + LID + WATERPYCNOMETER + LID + WATER + MIX
Gmm ( pre) = A / (A + D - E)Gmm SSD =A/(A SSD + D - E) (uncoated porous agg.)
I
12A
A SSD
DEG
PYCNOMETER + LID
PYCNOMETER + LID + MIX
MASS OF DRY SAMPLE ( 1 - 2 )MASS OF SSD SAMPLE (uncoated porous agg.)
TIME
LOT & SUBLOT
TIME
LOT & SUBLOT
TIME
THE PREVIOUS MAMD
THE DIFFERANCE BETWEEN I & J
JK
TEST NO MDT
THE MOVING AVERAGE MAXIMUM DENSITY (MAMD)
MDT'S Previous Form
DATE
734-2050 (10-2006)
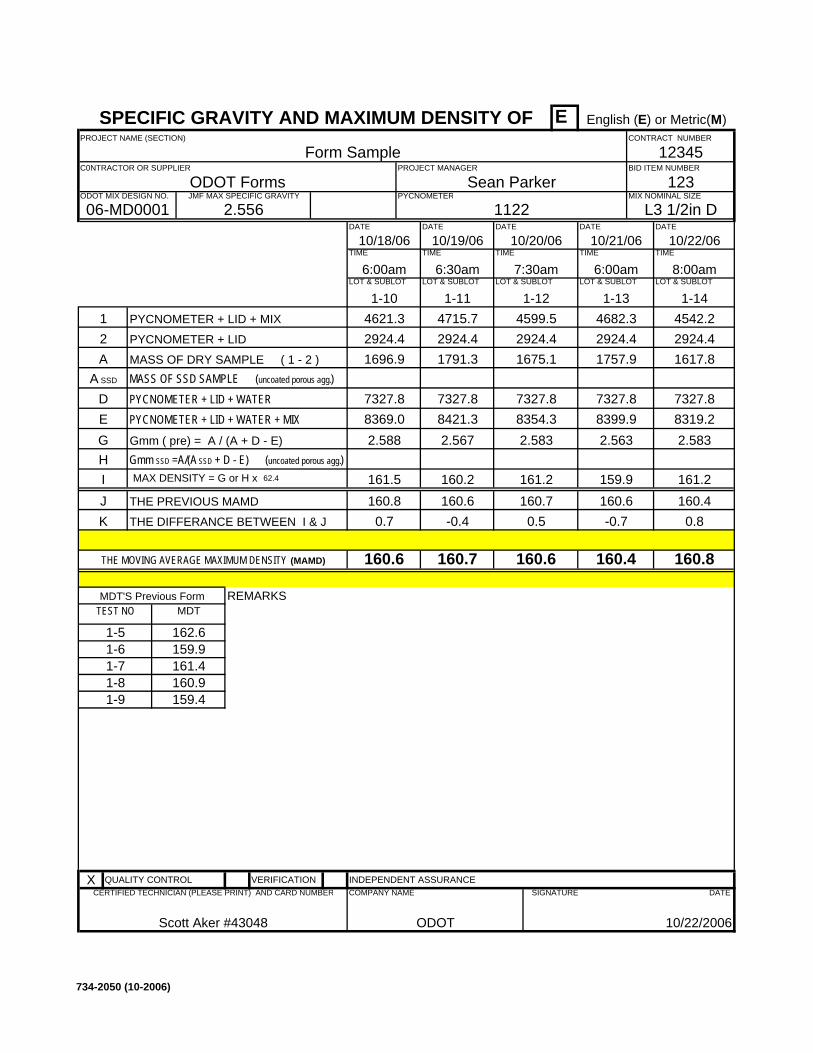
E
REMARKS
X QUALITY CONTROL VERIFICATION INDEPENDENT ASSURANCE
DATE
10/18/06 10/19/06 10/20/06 10/21/06 10/22/06
1-9 159.4
MDT'S Previous Form
1-7 161.41-8 160.9
1-5 162.61-6 159.9
TEST NO MDT
THE MOVING AVERAGE MAXIMUM DENSITY (MAMD) 160.6
0.8160.8 160.6
160.4 160.8160.7 160.6
0.7 -0.4 0.5 -0.7THE PREVIOUS MAMD
THE DIFFERANCE BETWEEN I & J
JK
160.7 160.6
8:00am
1-14
TIME
LOT & SUBLOT
1-12
7:30amTIME
LOT & SUBLOT
TIME
6:00am
PYCNOMETER + LID
PYCNOMETER + LID + MIX
MASS OF DRY SAMPLE ( 1 - 2 )MASS OF SSD SAMPLE (uncoated porous agg.)
7327.88399.9
2924.41617.8
2924.4
7327.8
4542.2
8421.3
1791.3
7327.88354.3 8319.2
160.4
4715.72924.4
7327.8
2924.41675.1
4682.3
1757.9
I
12A
A SSD
DEG
4599.5
PYCNOMETER + LID + WATERPYCNOMETER + LID + WATER + MIX
Gmm ( pre) = A / (A + D - E)Gmm SSD =A/(A SSD + D - E) (uncoated porous agg.)
2.583H
7327.88369.0
1696.9
2.588
2924.4
12345
ODOT
COMPANY NAME
BID ITEM NUMBER
6:30amLOT & SUBLOT
1-114621.3
TIMETIME
DATE DATE
1-13
06-MD0001
LOT & SUBLOT6:00am
1-10LOT & SUBLOT
1122DATE DATE
2.556
123
Form SampleCONTRACT NUMBER
Scott Aker #43048
CERTIFIED TECHNICIAN (PLEASE PRINT) AND CARD NUMBER
ODOT MIX DESIGN NO.
SIGNATURE DATE
10/22/2006
MIX NOMINAL SIZE
L3 1/2in D
PROJECT MANAGER
PYCNOMETERSean ParkerODOT Forms
C0NTRACTOR OR SUPPLIER
JMF MAX SPECIFIC GRAVITY
2.5832.563
161.2
SPECIFIC GRAVITY AND MAXIMUM DENSITY OF English (E) or Metric(M)
62.4MAX DENSITY = G or H x 161.5 160.2 161.2 159.9
2.567
PROJECT NAME (SECTION)
734-2050 (10-2006)
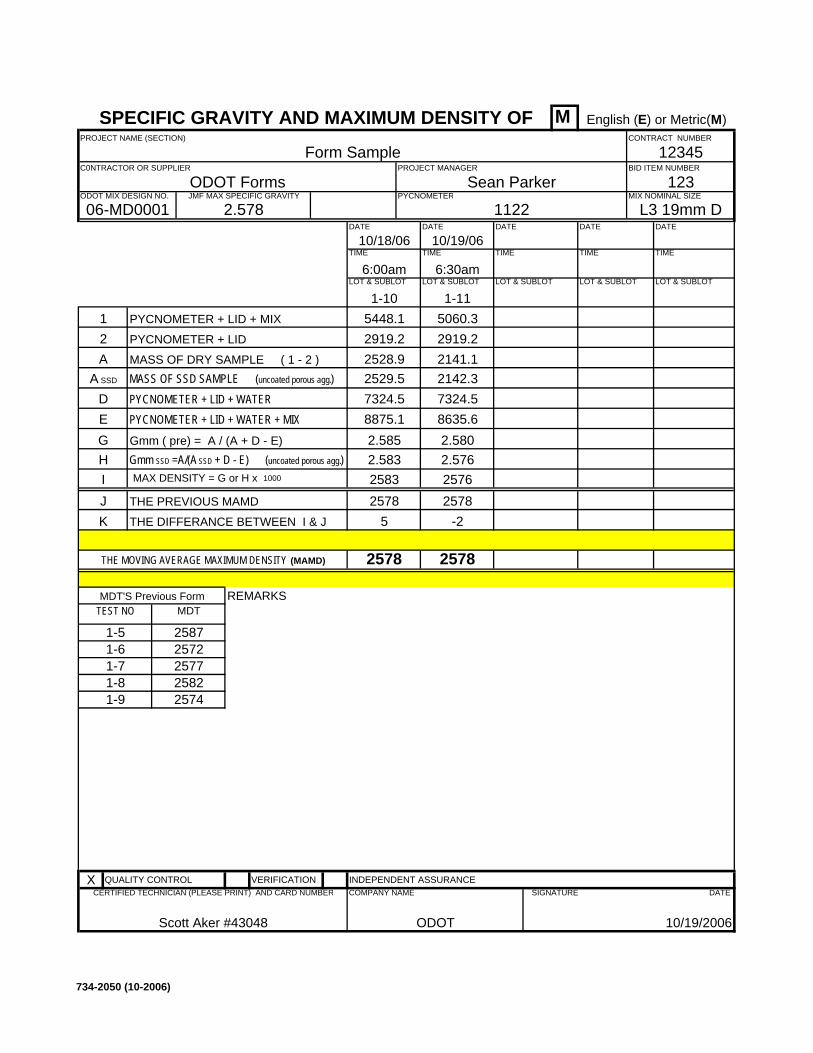
M
REMARKS
X QUALITY CONTROL VERIFICATION INDEPENDENT ASSURANCE
SPECIFIC GRAVITY AND MAXIMUM DENSITY OF English (E) or Metric(M)
1000MAX DENSITY = G or H x 2583 2576
2.580
PROJECT NAME (SECTION)
PROJECT MANAGER
PYCNOMETERSean ParkerODOT Forms
C0NTRACTOR OR SUPPLIER
JMF MAX SPECIFIC GRAVITY123
Form SampleCONTRACT NUMBER
Scott Aker #43048
CERTIFIED TECHNICIAN (PLEASE PRINT) AND CARD NUMBER
ODOT MIX DESIGN NO.
SIGNATURE DATE
10/19/2006
MIX NOMINAL SIZE
L3 19mm D06-MD0001
LOT & SUBLOT6:00am
1-10LOT & SUBLOT
1122DATE DATE
2.578
TIMETIME
DATE DATE
2919.2
12345
ODOT
COMPANY NAME
BID ITEM NUMBER
6:30amLOT & SUBLOT
1-115448.1
H
7324.58875.1
2528.9
2.5832.585
2529.5PYCNOMETER + LID + WATERPYCNOMETER + LID + WATER + MIX
Gmm ( pre) = A / (A + D - E)Gmm SSD =A/(A SSD + D - E) (uncoated porous agg.) 2.576
I
12A
A SSD
DEG
5060.32919.2
2142.37324.5
8635.6
2141.1 PYCNOMETER + LID
PYCNOMETER + LID + MIX
MASS OF DRY SAMPLE ( 1 - 2 )MASS OF SSD SAMPLE (uncoated porous agg.)
TIME
LOT & SUBLOT
TIME
LOT & SUBLOT
TIME
THE PREVIOUS MAMD
THE DIFFERANCE BETWEEN I & J
JK
2578 2578
2578
5 -2
TEST NO MDT
THE MOVING AVERAGE MAXIMUM DENSITY (MAMD) 2578
1-5 25871-6 2572
1-9 2574
MDT'S Previous Form
1-7 25771-8 2582
DATE
10/18/06 10/19/06
734-2050 (10-2006)
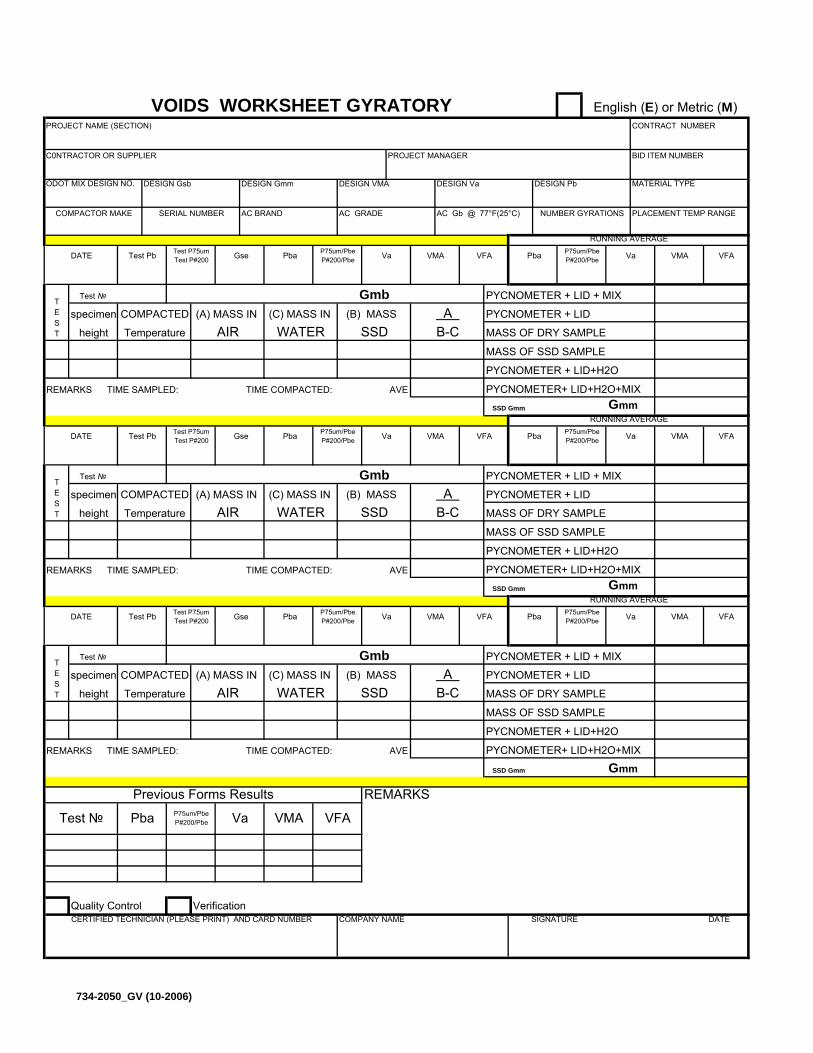
DESIGN Gsb DESIGN Gmm DESIGN VMA DESIGN Va DESIGN Pb
Gmb PYCNOMETER + LID + MIX
PYCNOMETER + LID
WATER MASS OF DRY SAMPLE
MASS OF SSD SAMPLE
PYCNOMETER + LID+H2O
AVE PYCNOMETER+ LID+H2O+MIXGmm
Gmb PYCNOMETER + LID + MIX
PYCNOMETER + LID
WATER MASS OF DRY SAMPLE
MASS OF SSD SAMPLE
PYCNOMETER + LID+H2O
AVE PYCNOMETER+ LID+H2O+MIXGmm
Gmb PYCNOMETER + LID + MIX
PYCNOMETER + LID
WATER MASS OF DRY SAMPLE
MASS OF SSD SAMPLE
PYCNOMETER + LID+H2O
AVE PYCNOMETER+ LID+H2O+MIX
Gmm
REMARKS
Quality Control Verification
RUNNING AVERAGE
VFAVMAVaP75um/Pbe P#200/Pbe Pba
B-C
SSD Gmm
SSD Gmm
(B) MASS
(C) MASS IN
DATE
TEST
A SSD
SSD Gmm
A
TIME SAMPLED: TIME COMPACTED:REMARKS
Previous Forms Results
COMPACTED
Test №
(C) MASS IN
SSDAIR
P75um/Pbe P#200/Pbe
AIR(A) MASS IN
Temperature
REMARKS
TEST
specimen COMPACTED
Test Pb Pba
TIME SAMPLED: TIME COMPACTED:
Temperature
COMPACTED
(A) MASS IN (B) MASS
VFAVMAVaP75um/Pbe
P#200/Pbe
CERTIFIED TECHNICIAN (PLEASE PRINT) AND CARD NUMBER COMPANY NAME SIGNATURE DATE
specimen
SSD
Test №
GseTest P75um Test P#200
TIME COMPACTED:TIME SAMPLED:
height
COMPACTOR MAKE AC BRAND AC GRADE
TEST height
specimen
B-C A
MATERIAL TYPE
NUMBER GYRATIONS PLACEMENT TEMP RANGE
ODOT MIX DESIGN NO.
CONTRACT NUMBER
BID ITEM NUMBER
PROJECT NAME (SECTION)
PROJECT MANAGERC0NTRACTOR OR SUPPLIER
REMARKS
RUNNING AVERAGE
VFA
B-C(B) MASS (C) MASS IN
AC Gb @ 77°F(25°C)
Test №
SERIAL NUMBER
VOIDS WORKSHEET GYRATORY English (E) or Metric (M)
Test P75um Test P#200
P75um/Pbe P#200/PbeDATE Test Pb Gse Pba VFA
RUNNING AVERAGE
Pba
VFAVMAVa
VMAVa
VMAVaP75um/Pbe P#200/Pbe Pba
VFAVMAVaP75um/Pbe P#200/Pbe Pba GseTest P75um
Test P#200Test PbDATE
height Temperature AIR(A) MASS IN
Test № VFAVMAVaP75um/Pbe P#200/PbePba
734-2050_GV (10-2006)
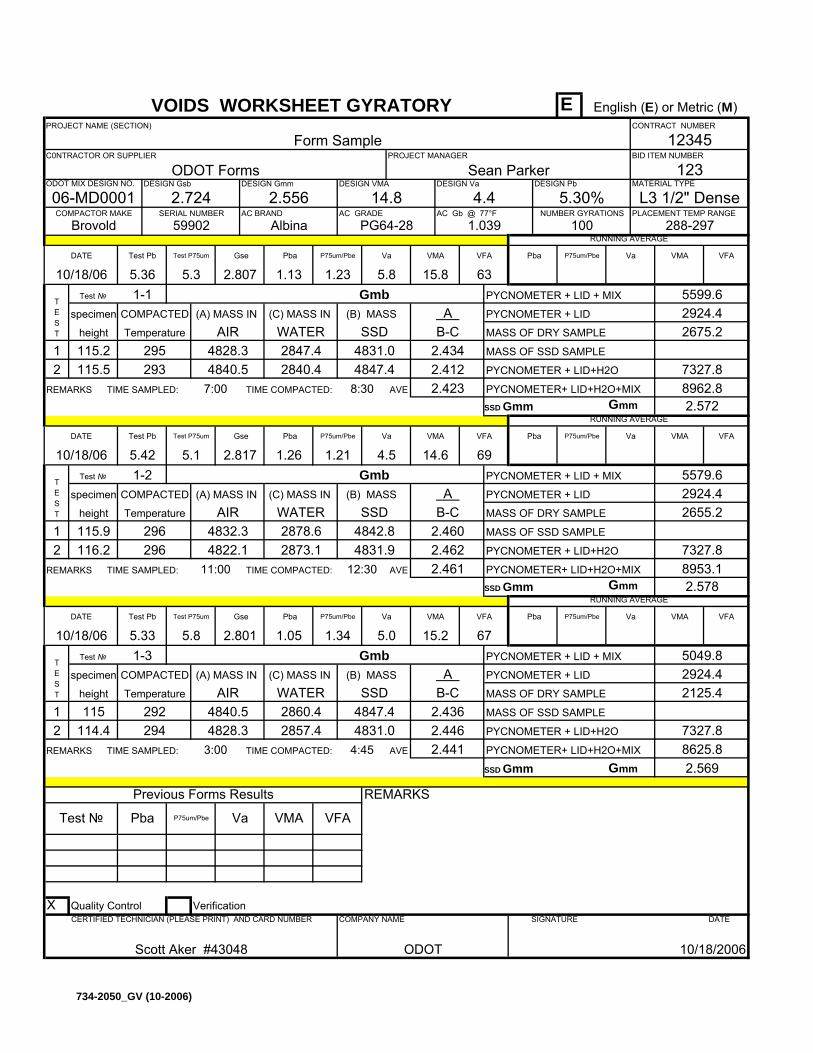
E
DESIGN Gsb DESIGN Gmm DESIGN VMA DESIGN Va DESIGN Pb
Gmb PYCNOMETER + LID + MIX
PYCNOMETER + LID
WATER MASS OF DRY SAMPLE
1 MASS OF SSD SAMPLE
2 PYCNOMETER + LID+H2O
AVE PYCNOMETER+ LID+H2O+MIXGmm
Gmb PYCNOMETER + LID + MIX
PYCNOMETER + LID
WATER MASS OF DRY SAMPLE
1 MASS OF SSD SAMPLE
2 PYCNOMETER + LID+H2O
AVE PYCNOMETER+ LID+H2O+MIXGmm
Gmb PYCNOMETER + LID + MIX
PYCNOMETER + LID
WATER MASS OF DRY SAMPLE
1 MASS OF SSD SAMPLE
2 PYCNOMETER + LID+H2O
AVE PYCNOMETER+ LID+H2O+MIX
Gmm
REMARKS
X Quality Control Verification
Test № VFAVMAVaP75um/PbePba
DATE
height Temperature AIR(A) MASS IN
Pba GseTest P75umTest Pb VFAVMAVaP75um/Pbe
VMAVaP75um/Pbe Pba
Pba
VFAVMAVa
VMAVa
2.434
8:30
15.8 63
VOIDS WORKSHEET GYRATORY English (E) or Metric (M)
Test P75um P75um/PbeDATE Test Pb Gse Pba VFA
RUNNING AVERAGEBrovold 59902 Albina PG64-28 100
AC Gb @ 77°F
Test №
5.82.807 1.13 1.23
1.039SERIAL NUMBER
B-C
114.4 294 4828.3115 4840.5
(B) MASS
4847.4
(C) MASS IN
REMARKS
115.2 4828.3115.5
2954840.5
RUNNING AVERAGE
VFA
2873.14822.1296116.2
PROJECT NAME (SECTION)
PROJECT MANAGER
Sean ParkerODOT FormsC0NTRACTOR OR SUPPLIER
Form Sample
123
CONTRACT NUMBER
BID ITEM NUMBER12345
4.42.556 14.8ODOT MIX DESIGN NO.
06-MD0001 2.724MATERIAL TYPE
L3 1/2" Dense5.30%NUMBER GYRATIONS PLACEMENT TEMP RANGE
2.462
288-297
B-C2924.4 A
2655.2
2.412
height
COMPACTOR MAKE AC BRAND AC GRADE
TEST height
10/18/061-15.36
specimen
1-3
292
5.1 GseTest P75um
TIME COMPACTED:
296 4832.3
TIME SAMPLED:
115.94831.9
Scott Aker #43048 ODOT 10/18/2006
CERTIFIED TECHNICIAN (PLEASE PRINT) AND CARD NUMBER COMPANY NAME SIGNATURE DATE
specimen
SSD
Test №
VFAVMAVaP75um/Pbe
2.423
5599.6
Temperature
5.3
COMPACTED
293
(A) MASS IN (B) MASS
2847.4
COMPACTED
7:00
1.265.42Test Pb Pba
TIME SAMPLED: TIME COMPACTED:
1-21.21
AIR(A) MASS IN
10/18/06 5.33 5.8
Temperature
REMARKS 11:00
TEST
specimen
Test №
(C) MASS IN
4831.02840.4
SSDAIR
4847.4
P75um/Pbe
5.0
COMPACTED
2860.4
4:454831.02857.4
2.801
TIME SAMPLED: 3:00 TIME COMPACTED:REMARKS
Previous Forms Results
2.441
1.05
SSD Gmm
15.2
A
2.4362.446
2.569
TEST
A
2878.6SSD
2.461
12:30
4842.8
SSD Gmm
2.460
(B) MASS
2.817
(C) MASS IN
4.5 14.610/18/06DATE
2.572
1.34
69
B-C
67
5579.6
SSD Gmm
8625.8
2924.4
2.578
7327.88953.1
5049.8
7327.8
2924.4
2675.2
7327.88962.8
2125.4
RUNNING AVERAGE
VFAVMAVaP75um/Pbe Pba
734-2050_GV (10-2006)
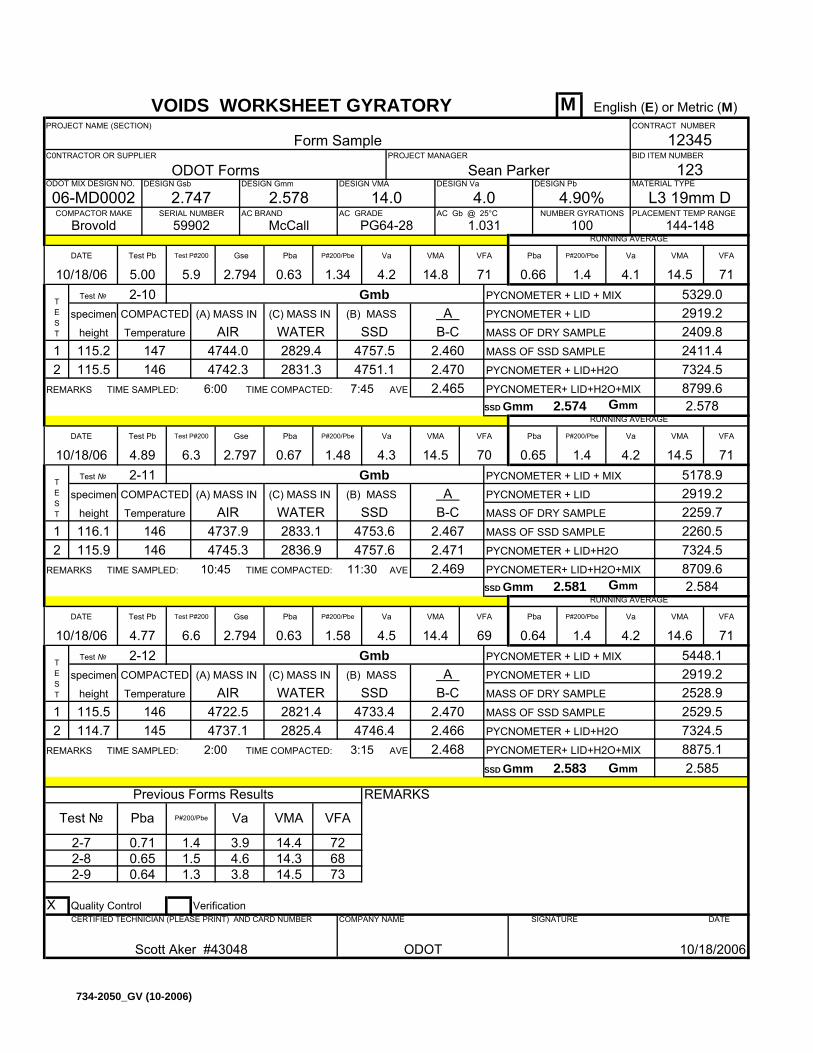
M
DESIGN Gsb DESIGN Gmm DESIGN VMA DESIGN Va DESIGN Pb
Gmb PYCNOMETER + LID + MIX
PYCNOMETER + LID
WATER MASS OF DRY SAMPLE
1 MASS OF SSD SAMPLE
2 PYCNOMETER + LID+H2O
AVE PYCNOMETER+ LID+H2O+MIXGmm
Gmb PYCNOMETER + LID + MIX
PYCNOMETER + LID
WATER MASS OF DRY SAMPLE
1 MASS OF SSD SAMPLE
2 PYCNOMETER + LID+H2O
AVE PYCNOMETER+ LID+H2O+MIXGmm
Gmb PYCNOMETER + LID + MIX
PYCNOMETER + LID
WATER MASS OF DRY SAMPLE
1 MASS OF SSD SAMPLE
2 PYCNOMETER + LID+H2O
AVE PYCNOMETER+ LID+H2O+MIX
Gmm
REMARKS
X Quality Control Verification
1.41.5 14.3
72
3.8 14.5 7368
2528.9
RUNNING AVERAGE
VFAVMAVaP#200/Pbe Pba
4.2 14.6
2409.8
7324.58799.6
2411.4
8875.1
2919.2
2.584
7324.52260.5
8709.6
715448.1
7324.5
2919.2
2.578
1.58
70
B-C
69 1.4
5178.9
SSD Gmm
71
2.574SSD Gmm
2.467
(B) MASS
2.797
(C) MASS IN
4.3 14.510/18/06DATE
2.585
2529.5
TEST
A
2833.1SSD
2.4692.581
11:30
4753.6
0.63
SSD Gmm 2.583
14.4
A
2.4702.466
0.64
0.65 4.6
TIME SAMPLED: 2:00 TIME COMPACTED:REMARKS
Previous Forms Results
2.468
0.71 3.9 14.4
4.5
COMPACTED
2821.4
3:154746.42825.4
2.794
Test №
(C) MASS IN
4757.52831.3
SSDAIR
4751.1
P#200/Pbe
AIR(A) MASS IN
10/18/06 4.77 6.6
Temperature
REMARKS 10:45
TEST
specimen COMPACTED
6:00
0.674.89Test Pb Pba
TIME SAMPLED: TIME COMPACTED:
2-111.48
2.465
5329.0
Temperature
5.9
COMPACTED
4.1
146
(A) MASS IN (B) MASS
2829.4
1.4 14.5VFAVMAVaP#200/Pbe
4757.6
Scott Aker #43048 ODOT 10/18/2006
CERTIFIED TECHNICIAN (PLEASE PRINT) AND CARD NUMBER COMPANY NAME SIGNATURE DATE
specimen
SSD
Test № 2-12
146
6.3 GseTest P#200
TIME COMPACTED:
146 4737.9
TIME SAMPLED:
116.1height
COMPACTOR MAKE AC BRAND AC GRADE
TEST height
10/18/062-105.00
specimen
2.471
144-148
B-C2919.2 A
71
2259.7
2.470
4.21.4
MATERIAL TYPE
L3 19mm D4.90%NUMBER GYRATIONS PLACEMENT TEMP RANGE
4.02.578 14.0ODOT MIX DESIGN NO.
06-MD0002 2.747
123
CONTRACT NUMBER
BID ITEM NUMBER12345
PROJECT NAME (SECTION)
PROJECT MANAGER
Sean ParkerODOT FormsC0NTRACTOR OR SUPPLIER
Form Sample
2836.94745.3146115.9
0.65 14.5
REMARKS
115.2 4744.0115.5
1474742.3
RUNNING AVERAGE
VFA
B-C
114.7 145 4737.1115.5 4722.5
(B) MASS
4733.4
(C) MASS IN
100AC Gb @ 25°C
Test №
0.664.22.794 0.63 1.34
1.031SERIAL NUMBER
Brovold 59902 McCall PG64-28
VOIDS WORKSHEET GYRATORY English (E) or Metric (M)
Test P#200 P#200/PbeDATE Test Pb Gse Pba VFA
RUNNING AVERAGE
Pba
VFAVMAVa
VMAVa
2.460
7:45
14.8 71
VMAVaP#200/Pbe Pba
VFAVMAVaP#200/Pbe Pba GseTest P#200Test PbDATE
2-9 0.64 1.3
height Temperature AIR(A) MASS IN
2-72-8
Test № VFAVMAVaP#200/PbePba
734-2050_GV (10-2006)
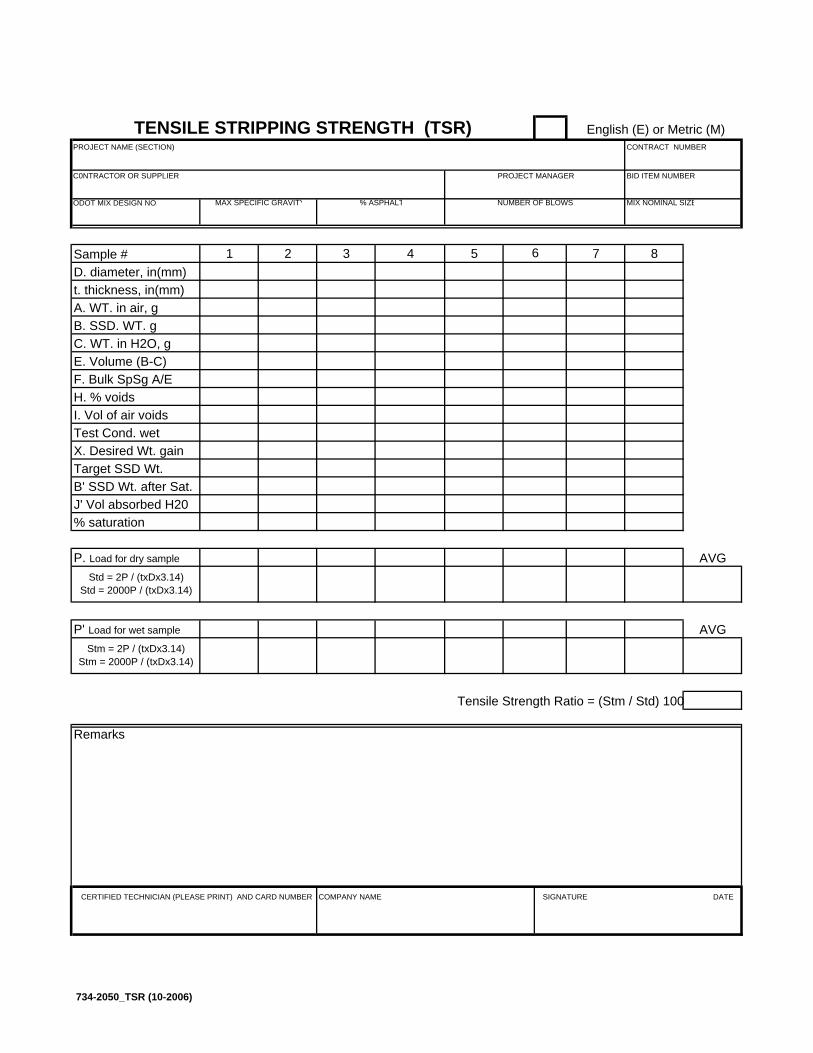
ODOT MIX DESIGN NO.
Sample # 1 2 3 4 5 7 8D. diameter, in(mm)t. thickness, in(mm)A. WT. in air, gB. SSD. WT. gC. WT. in H2O, gE. Volume (B-C) F. Bulk SpSg A/E H. % voids I. Vol of air voids Test Cond. wet X. Desired Wt. gain Target SSD Wt. B' SSD Wt. after Sat.J' Vol absorbed H20 % saturation
P. Load for dry sample AVG
P' Load for wet sample AVG
Tensile Strength Ratio = (Stm / Std) 100
Remarks
Stm = 2P / (txDx3.14) Stm = 2000P / (txDx3.14)
Std = 2P / (txDx3.14) Std = 2000P / (txDx3.14)
English (E) or Metric (M)TENSILE STRIPPING STRENGTH (TSR)
6
PROJECT MANAGERC0NTRACTOR OR SUPPLIER
CERTIFIED TECHNICIAN (PLEASE PRINT) AND CARD NUMBER
COMPANY NAME SIGNATURE DATE
MAX SPECIFIC GRAVITY % ASPHALT NUMBER OF BLOWS
CONTRACT NUMBER
BID ITEM NUMBER
MIX NOMINAL SIZE
PROJECT NAME (SECTION)
734-2050_TSR (10-2006)
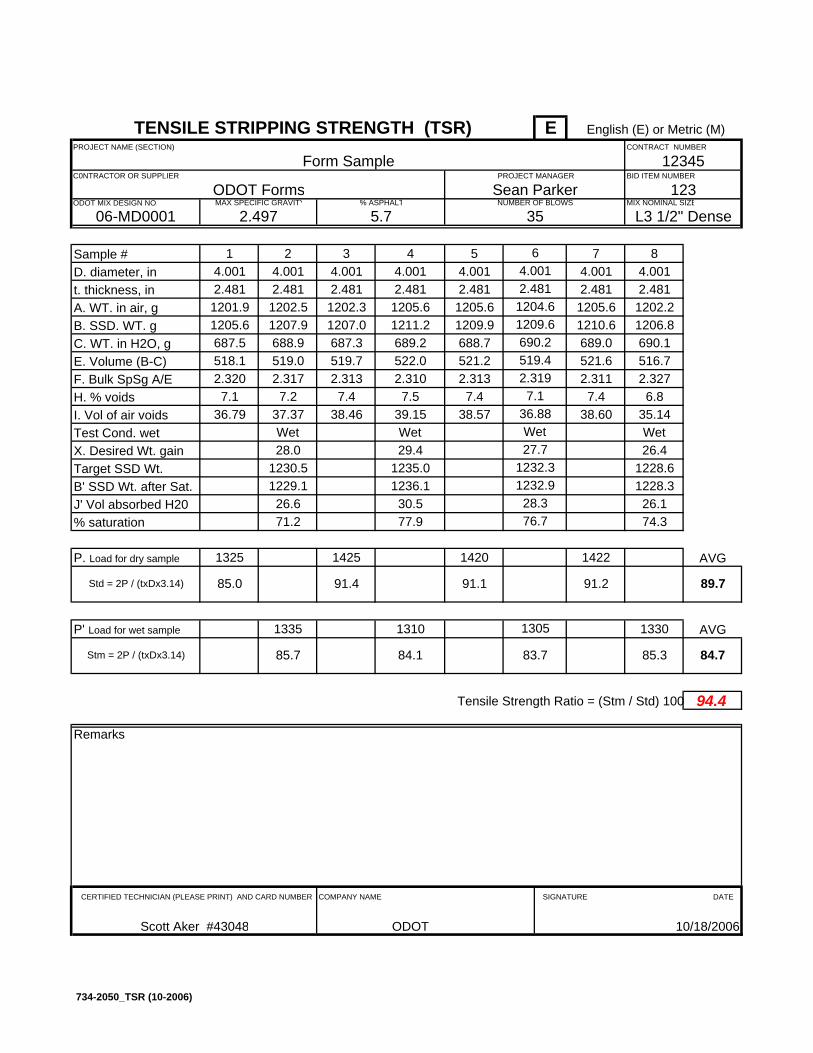
E
ODOT MIX DESIGN NO.
06-MD0001
Sample # 1 2 3 4 5 7 8D. diameter, in 4.001 4.001 4.001 4.001 4.001 4.001 4.001t. thickness, in 2.481 2.481 2.481 2.481 2.481 2.481 2.481A. WT. in air, g 1201.9 1202.5 1202.3 1205.6 1205.6 1205.6 1202.2B. SSD. WT. g 1205.6 1207.9 1207.0 1211.2 1209.9 1210.6 1206.8C. WT. in H2O, g 687.5 688.9 687.3 689.2 688.7 689.0 690.1E. Volume (B-C) 518.1 519.0 519.7 522.0 521.2 521.6 516.7F. Bulk SpSg A/E 2.320 2.317 2.313 2.310 2.313 2.311 2.327 H. % voids 7.1 7.2 7.4 7.5 7.4 7.4 6.8I. Vol of air voids 36.79 37.37 38.46 39.15 38.57 38.60 35.14Test Cond. wet Wet Wet WetX. Desired Wt. gain 28.0 29.4 26.4Target SSD Wt. 1230.5 1235.0 1228.6B' SSD Wt. after Sat. 1229.1 1236.1 1228.3J' Vol absorbed H20 26.6 30.5 26.1% saturation 71.2 77.9 74.3
P. Load for dry sample 1325 1425 1420 1422 AVG
P' Load for wet sample 1335 1310 1330 AVG
Tensile Strength Ratio = (Stm / Std) 100 94.4
Remarks
MAX SPECIFIC GRAVITY % ASPHALT NUMBER OF BLOWS
CONTRACT NUMBER
12345BID ITEM NUMBER
MIX NOMINAL SIZE
PROJECT NAME (SECTION)
Form Sample
123
5.72.497 35
COMPANY NAME SIGNATURE DATE
L3 1/2" Dense
519.42.3197.1
2.481
Scott Aker #43048 ODOT 10/18/2006
CERTIFIED TECHNICIAN (PLEASE PRINT) AND CARD NUMBER
85.7
36.88Wet
76.7
English (E) or Metric (M)TENSILE STRIPPING STRENGTH (TSR)
64.001
PROJECT MANAGER
Sean ParkerC0NTRACTOR OR SUPPLIER
ODOT Forms
690.21209.61204.6
91.2
28.31232.91232.327.7
Std = 2P / (txDx3.14) 85.0 91.4
91.1
1305
89.7
Stm = 2P / (txDx3.14) 84.785.3 83.7 84.1
734-2050_TSR (10-2006)

M
ODOT MIX DESIGN NO.
06-MD0001
Sample # 1 2 3 4 5 7 8D. diameter, mm 101.6 101.6 101.6 101.6 101.6 101.6 101.6t. thichness, mm 63.1 63.1 63.1 63.1 63.1 63.1 63.1A. WT. in air, g 1201.9 1202.5 1202.3 1205.6 1205.6 1205.6 1202.2B. SSD. WT. g 1205.6 1207.9 1207.0 1211.2 1209.9 1210.6 1206.8C. WT. in H2O, g 687.5 688.9 687.3 689.2 688.7 689.0 690.1E. Volume (B-C) 518.1 519.0 519.7 522.0 521.2 521.6 516.7F. Bulk SpSg A/E 2.320 2.317 2.313 2.310 2.313 2.311 2.327 H. % voids 7.1 7.2 7.4 7.5 7.4 7.4 6.8I. Vol of air voids 36.79 37.37 38.46 39.15 38.57 38.60 35.14Test Cond. wet Wet Wet WetX. Desired Wt. gain 28.0 29.4 26.4Target SSD Wt. 1230.5 1235.0 1228.6B' SSD Wt. after Sat. 1229.1 1236.1 1228.3J' Vol absorbed H20 26.6 30.5 26.1% saturation 71.2 77.9 74.3
P. Load for dry sample 5895 6340 6320 6320 AVG
P' Load for wet sample 5940 5830 5920 AVG
Tensile Strength Ratio = (Stm / Std) 100 94.4
Remarks
617.9
Stm = 2000P / (txDx3.14) 583.6588.2 576.7 579.2
627.9
5805
Std = 2000P / (txDx3.14) 585.7 629.9
690.21209.61204.6
627.9
28.31232.91232.327.7
English (E) or Metric (M)TENSILE STRIPPING STRENGTH (TSR)
6101.6
PROJECT MANAGER
Sean ParkerC0NTRACTOR OR SUPPLIER
ODOT Forms
63.1
Scott Aker #43048 ODOT 10/18/2006
CERTIFIED TECHNICIAN (PLEASE PRINT) AND CARD NUMBER
590.2
36.88Wet
76.7
5.72.497 35
COMPANY NAME SIGNATURE DATE
L3 12.5mm D
519.42.3197.1
MAX SPECIFIC GRAVITY % ASPHALT NUMBER OF BLOWS
CONTRACT NUMBER
12345BID ITEM NUMBER
MIX NOMINAL SIZE
PROJECT NAME (SECTION)
Form Sample
123
734-2050_TSR (10-2006)
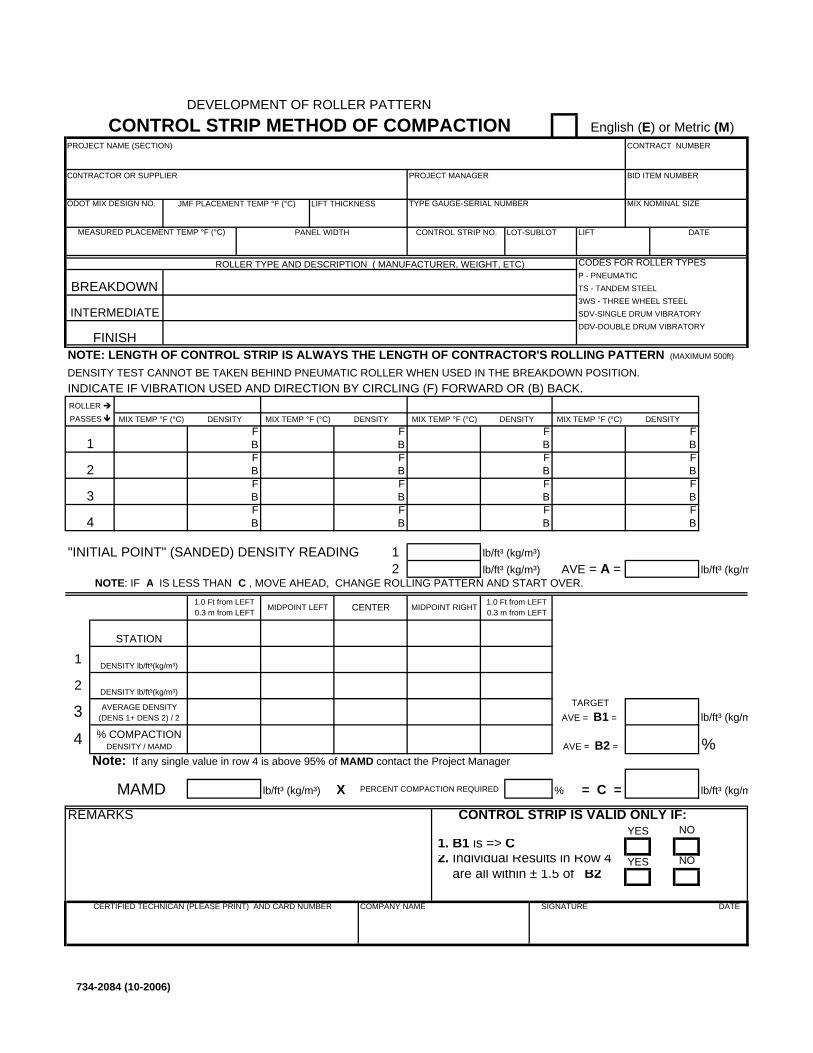
LIFT THICKNESS
CODES FOR ROLLER TYPESP - PNEUMATICTS - TANDEM STEEL3WS - THREE WHEEL STEELSDV-SINGLE DRUM VIBRATORYDDV-DOUBLE DRUM VIBRATORY
DENSITY TEST CANNOT BE TAKEN BEHIND PNEUMATIC ROLLER WHEN USED IN THE BREAKDOWN POSITION.INDICATE IF VIBRATION USED AND DIRECTION BY CIRCLING (F) FORWARD OR (B) BACK.
F F F FB B B BF F F FB B B BF F F FB B B BF F F FB B B B
"INITIAL POINT" (SANDED) DENSITY READING 1 lb/ft³ (kg/m³)2 lb/ft³ (kg/m³) lb/ft³ (kg/m
NOTE: IF A IS LESS THAN C , MOVE AHEAD, CHANGE ROLLING PATTERN AND START OVER.
lb/ft³ (kg/m
%Note: If any single value in row 4 is above 95% of MAMD contact the Project Manager
MAMD lb/ft³ (kg/m³) X PERCENT COMPACTION REQUIRED % lb/ft³ (kg/m
REMARKS CONTROL STRIP IS VALID ONLY IF: YES NO
1. B1 is => C 2. Individual Results in Row 4 YES NO are all within ± 1.5 of B2
MIDPOINT LEFT CENTER MIDPOINT RIGHT 1.0 Ft from LEFT 0.3 m from LEFT
1.0 Ft from LEFT 0.3 m from LEFT
DEVELOPMENT OF ROLLER PATTERN
CONTROL STRIP METHOD OF COMPACTION English (E) or Metric (M)
NOTE: LENGTH OF CONTROL STRIP IS ALWAYS THE LENGTH OF CONTRACTOR'S ROLLING PATTERN (MAXIMUM 500ft)
AVE = A =
= C =
AVE = B2 =
TARGET AVE = B1 =
AVERAGE DENSITY (DENS 1+ DENS 2) / 2
DENSITY lb/ft³(kg/m³)
% COMPACTION DENSITY / MAMD4
2
3
ROLLER
STATION
DENSITY lb/ft³(kg/m³)1
3
DENSITY
4
PASSES
1
2
ROLLER TYPE AND DESCRIPTION ( MANUFACTURER, WEIGHT, ETC)
MIX TEMP °F (°C) DENSITY MIX TEMP °F (°C) DENSITY MIX TEMP °F (°C) MIX TEMP °F (°C)DENSITY
FINISH
INTERMEDIATE
BREAKDOWN
COMPANY NAMECERTIFIED TECHNICAN (PLEASE PRINT) AND CARD NUMBER
ODOT MIX DESIGN NO.
DATE
SIGNATURE DATE
BID ITEM NUMBER
MIX NOMINAL SIZE
LIFTLOT-SUBLOTCONTROL STRIP NO.
PROJECT NAME (SECTION)
PROJECT MANAGER
TYPE GAUGE-SERIAL NUMBER
C0NTRACTOR OR SUPPLIER
CONTRACT NUMBER
MEASURED PLACEMENT TEMP °F (°C) PANEL WIDTH
JMF PLACEMENT TEMP °F (°C)
734-2084 (10-2006)

m³)
m³)
m³)
734-2084 (10-2006)

E
LIFT THICKNESS
CODES FOR ROLLER TYPESP - PNEUMATICTS - TANDEM STEEL3WS - THREE WHEEL STEELSDV-SINGLE DRUM VIBRATORYDDV-DOUBLE DRUM VIBRATORY
DENSITY TEST CANNOT BE TAKEN BEHIND PNEUMATIC ROLLER WHEN USED IN THE BREAKDOWN POSITION.INDICATE IF VIBRATION USED AND DIRECTION BY CIRCLING (F) FORWARD OR (B) BACK.
F F F FB B B BF F F FB B B BF F F FB B B BF F F FB B B B
"INITIAL POINT" (SANDED) DENSITY READING 1 lb/ft³2 lb/ft³ lb/ft³
NOTE: IF A IS LESS THAN C , MOVE AHEAD, CHANGE ROLLING PATTERN AND START OVER.
lb/ft³
%Note: If any single value in row 4 is above 95% of MAMD contact the Project Manager
MAMD lb/ft³ X PERCENT COMPACTION REQUIRED % lb/ft³
REMARKS CONTROL STRIP IS VALID ONLY IF: YES NO
1. B1 is => C X2. Individual Results in Row 4 YES NO are all within ± 1.5 of B2 X
CONTRACT NUMBER
MEASURED PLACEMENT TEMP °F
290 1PANEL WIDTH
13 ft
JMF PLACEMENT TEMP °F
288-297 2 inch06-MD0001
PROJECT NAME (SECTION)
PROJECT MANAGER
TYPE GAUGE-SERIAL NUMBERSean ParkerODOT Forms
C0NTRACTOR OR SUPPLIERForms Example
10/18/2006
BID ITEM NUMBER
MIX NOMINAL SIZE
L3 1/2 DLIFT
Humbold 5001c #1234LOT-SUBLOT
1/1CONTROL STRIP NO.
123
12345
ODOT
COMPANY NAME
Scott Aker #43048
CERTIFIED TECHNICAN (PLEASE PRINT) AND CARD NUMBER
1st
ODOT MIX DESIGN NO.
DATE
SIGNATURE DATE
10/18/2006
INTERMEDIATE
BREAKDOWN Cat PF 300B - 25 ton - PIR DD130 - 14 ton - DDV
Dynapac CC412 - 10 ton - DDV
ROLLER TYPE AND DESCRIPTION ( MANUFACTURER, WEIGHT, ETC)
MIX TEMP °F DENSITY MIX TEMP °F DENSITY MIX TEMP °F MIX TEMP °FDENSITY
FINISH
PASSES
1
2
180
175
4
288
281
277
148.8
149.1
158 150.2
IR DD130 Dynapac CC412
251
245
241
147.5
147.3 --- 3
Dynapac CC 412
145.1 148.1 160
DENSITY
149.9
172
4
2
3
ROLLER
STATION
DENSITY lb/ft³1
CAT PT 300B
---
---
150.9151.1
92.9
AVERAGE DENSITY (DENS 1+ DENS 2) / 2
DENSITY lb/ft³
% COMPACTION DENSITY / MAMD
151.8151.7
93.3
152.8153.1
94.2
151.3
153.2153.2
17+01 17+42 17+86149.2149.9
151.4
151.6
151.7
93.3 AVE = B2 =
TARGET AVE = B1 =
English (E) or Metric (M)
151.1
NOTE: LENGTH OF CONTROL STRIP IS ALWAYS THE LENGTH OF CONTRACTOR'S ROLLING PATTERN (MAXIMUM 500ft)
AVE = A =
92.0 149.6= C =
149.6
92.0
162.6
1.0 Ft from LEFT
DEVELOPMENT OF ROLLER PATTERN
CONTROL STRIP METHOD OF COMPACTION
16+00151.3 153.3
17+53
153.2
94.2
MIDPOINT LEFT CENTER MIDPOINT RIGHT 1.0 Ft from LEFT
734-2084 (10-2006)
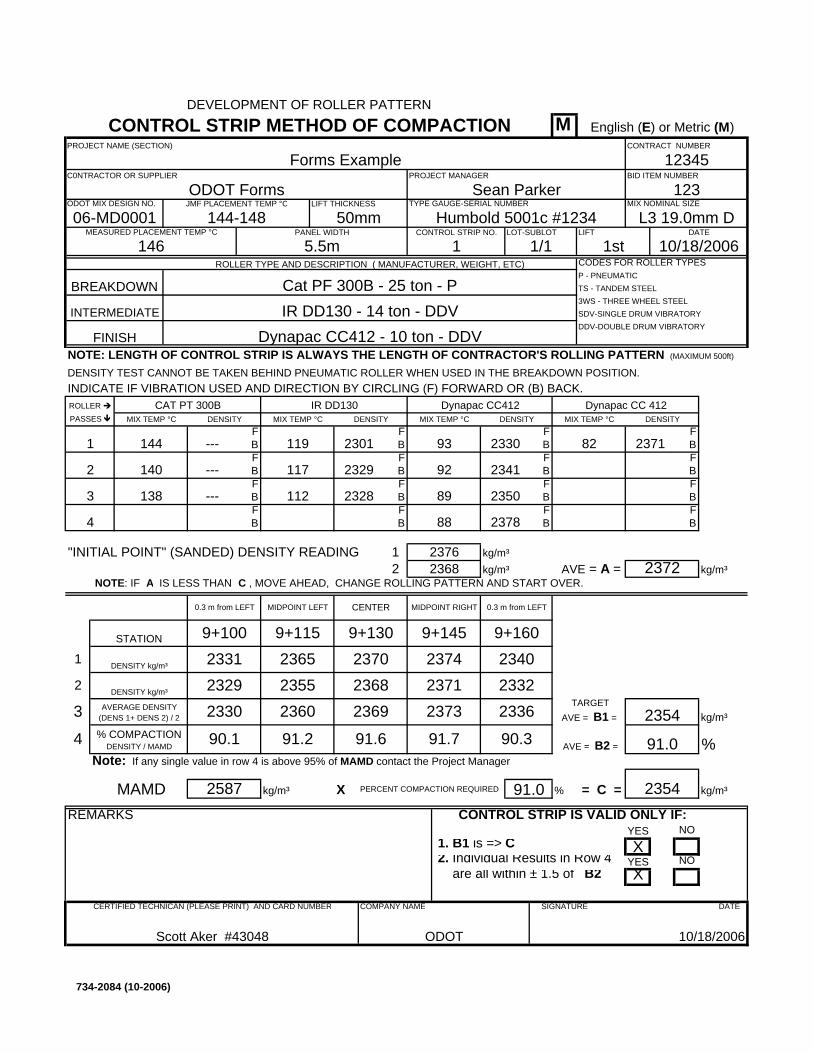
M
LIFT THICKNESS
CODES FOR ROLLER TYPESP - PNEUMATICTS - TANDEM STEEL3WS - THREE WHEEL STEELSDV-SINGLE DRUM VIBRATORYDDV-DOUBLE DRUM VIBRATORY
DENSITY TEST CANNOT BE TAKEN BEHIND PNEUMATIC ROLLER WHEN USED IN THE BREAKDOWN POSITION.INDICATE IF VIBRATION USED AND DIRECTION BY CIRCLING (F) FORWARD OR (B) BACK.
F F F FB B B BF F F FB B B BF F F FB B B BF F F FB B B B
"INITIAL POINT" (SANDED) DENSITY READING 1 kg/m³2 kg/m³ kg/m³
NOTE: IF A IS LESS THAN C , MOVE AHEAD, CHANGE ROLLING PATTERN AND START OVER.
kg/m³
%Note: If any single value in row 4 is above 95% of MAMD contact the Project Manager
MAMD kg/m³ X PERCENT COMPACTION REQUIRED % kg/m³
REMARKS CONTROL STRIP IS VALID ONLY IF: YES NO
1. B1 is => C X2. Individual Results in Row 4 YES NO are all within ± 1.5 of B2 X
MIDPOINT LEFT CENTER MIDPOINT RIGHT 0.3 m from LEFT
2587
0.3 m from LEFT
DEVELOPMENT OF ROLLER PATTERN
CONTROL STRIP METHOD OF COMPACTION
9+1002331 2365
9+115
2369
91.6
English (E) or Metric (M)
2376
NOTE: LENGTH OF CONTROL STRIP IS ALWAYS THE LENGTH OF CONTRACTOR'S ROLLING PATTERN (MAXIMUM 500ft)
AVE = A =
91.0 2354= C =
2336
90.32354
91.0 AVE = B2 =
TARGET AVE = B1 =
2372
23702368
9+130 9+145 9+16023402332
2368
237423712373
91.7
23552360
91.2
23292330
90.1
AVERAGE DENSITY (DENS 1+ DENS 2) / 2
DENSITY kg/m³
% COMPACTION DENSITY / MAMD4
2
3
ROLLER
STATION
DENSITY kg/m³1
CAT PT 300B
---
---
--- 3
Dynapac CC 412
2301 2330 82
DENSITY
2371
89
88
IR DD130 Dynapac CC412
119
117
112
2329
2328
2341
2350
23784
144
140
138
PASSES
1
2
93
92
Dynapac CC412 - 10 ton - DDV
ROLLER TYPE AND DESCRIPTION ( MANUFACTURER, WEIGHT, ETC)
MIX TEMP °C DENSITY MIX TEMP °C DENSITY MIX TEMP °C MIX TEMP °CDENSITY
FINISH
INTERMEDIATE
BREAKDOWN Cat PF 300B - 25 ton - PIR DD130 - 14 ton - DDV
12345
ODOT
COMPANY NAME
Scott Aker #43048
CERTIFIED TECHNICAN (PLEASE PRINT) AND CARD NUMBER
1st
ODOT MIX DESIGN NO.
DATE
SIGNATURE DATE
10/18/2006
10/18/2006
BID ITEM NUMBER
MIX NOMINAL SIZE
L3 19.0mm DLIFT
Humbold 5001c #1234LOT-SUBLOT
1/1CONTROL STRIP NO.
123
PROJECT NAME (SECTION)
PROJECT MANAGER
TYPE GAUGE-SERIAL NUMBERSean ParkerODOT Forms
C0NTRACTOR OR SUPPLIERForms Example
CONTRACT NUMBER
MEASURED PLACEMENT TEMP °C
146 1PANEL WIDTH
5.5m
JMF PLACEMENT TEMP °C
144-148 50mm06-MD0001
734-2084 (10-2006)
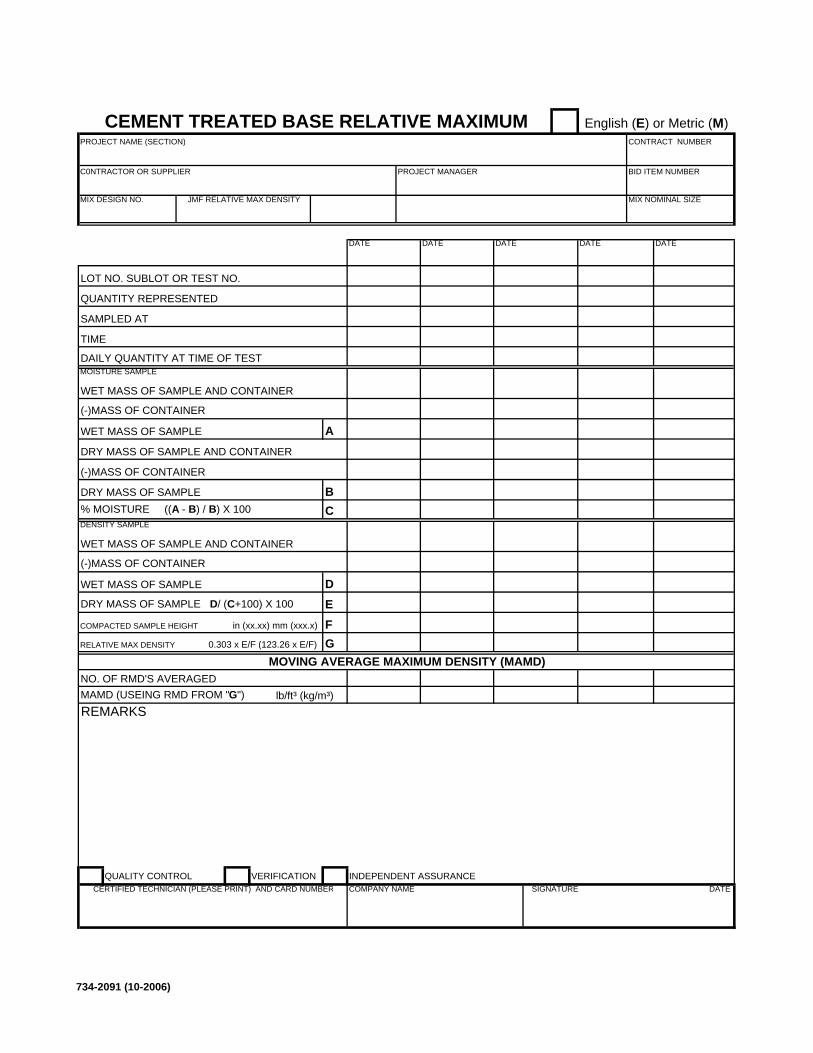
LOT NO. SUBLOT OR TEST NO.
QUANTITY REPRESENTED
SAMPLED AT
TIME
DAILY QUANTITY AT TIME OF TESTMOISTURE SAMPLE
WET MASS OF SAMPLE AND CONTAINER
(-)MASS OF CONTAINER
WET MASS OF SAMPLE ADRY MASS OF SAMPLE AND CONTAINER
(-)MASS OF CONTAINER
DRY MASS OF SAMPLE B% MOISTURE ((A - B) / B) X 100 CDENSITY SAMPLE
WET MASS OF SAMPLE AND CONTAINER
(-)MASS OF CONTAINER
WET MASS OF SAMPLE DDRY MASS OF SAMPLE D/ (C+100) X 100 ECOMPACTED SAMPLE HEIGHT FRELATIVE MAX DENSITY G
NO. OF RMD'S AVERAGED MAMD (USEING RMD FROM "G")REMARKS
QUALITY CONTROL VERIFICATION INDEPENDENT ASSURANCE
lb/ft³ (kg/m³)
CEMENT TREATED BASE RELATIVE MAXIMUM English (E) or Metric (M)
in (xx.xx) mm (xxx.x)
0.303 x E/F (123.26 x E/F)
MOVING AVERAGE MAXIMUM DENSITY (MAMD)
DATE
PROJECT NAME (SECTION)
PROJECT MANAGERC0NTRACTOR OR SUPPLIER
CONTRACT NUMBER
CERTIFIED TECHNICIAN (PLEASE PRINT) AND CARD NUMBER
MIX DESIGN NO.
SIGNATURE DATE
MIX NOMINAL SIZEJMF RELATIVE MAX DENSITY
COMPANY NAME
BID ITEM NUMBER
DATE DATE DATEDATE
734-2091 (10-2006)

E
LOT NO. SUBLOT OR TEST NO.
QUANTITY REPRESENTED
SAMPLED AT
TIME
DAILY QUANTITY AT TIME OF TESTMOISTURE SAMPLE
WET MASS OF SAMPLE AND CONTAINER
(-)MASS OF CONTAINER
WET MASS OF SAMPLE ADRY MASS OF SAMPLE AND CONTAINER
(-)MASS OF CONTAINER
DRY MASS OF SAMPLE B% MOISTURE ((A - B) / B) X 100 CDENSITY SAMPLE
WET MASS OF SAMPLE AND CONTAINER
(-)MASS OF CONTAINER
WET MASS OF SAMPLE DDRY MASS OF SAMPLE D/ (C+100) X 100 ECOMPACTED SAMPLE HEIGHT FRELATIVE MAX DENSITY G
NO. OF RMD'S AVERAGED MAMD (USEING RMD FROM "G")REMARKS
X QUALITY CONTROL VERIFICATION INDEPENDENT ASSURANCE
10.0 10.0 10.0 10.0
2400.1 2409.6 2412.8 2412.5468.7 468.5 468.7
DATE DATEDATE
1-1-4
1078.1
8:00am
1512.7326.31186.41404.4326.3
326.31186.41404.4326.3
8:00am
1512.7
8:00am
1512.7
1766.4
1078.1
1755.11931.4 1941.1 1944.3 1943.8
468.5
1078.1 1078.1
1186.4
1755.1 1763.9
1404.4326.3
326.31186.41404.4326.3
DATE
1512.7326.3
15+14
1-1-3
12345
ODOT
COMPANY NAME
BID ITEM NUMBER
1-1-2
8:00am
Scott Aker #43048
CERTIFIED TECHNICIAN (PLEASE PRINT) AND CARD NUMBER
MIX DESIGN NO.
SIGNATURE DATE
10/18/2006
MIX NOMINAL SIZE
19mmJMF RELATIVE MAX DENSITY
10/18/2006
PROJECT NAME (SECTION)
PROJECT MANAGER
Sean ParkerODOT FormsC0NTRACTOR OR SUPPLIER
123
Form ExampleCONTRACT NUMBER
4.01
06-001234 134.8
11+75
DATE
1-1-1
10+50 12+91
136 134.6 132.3 133.53.91 3.97 4.02
10/18/2006 10/18/2006 10/18/2006
MOVING AVERAGE MAXIMUM DENSITY (MAMD)
lb/ft³
CEMENT TREATED BASE RELATIVE MAXIMUM English (E) or Metric (M)
in (xx.xx)
0.303 x E/F
2091 (10-2006)
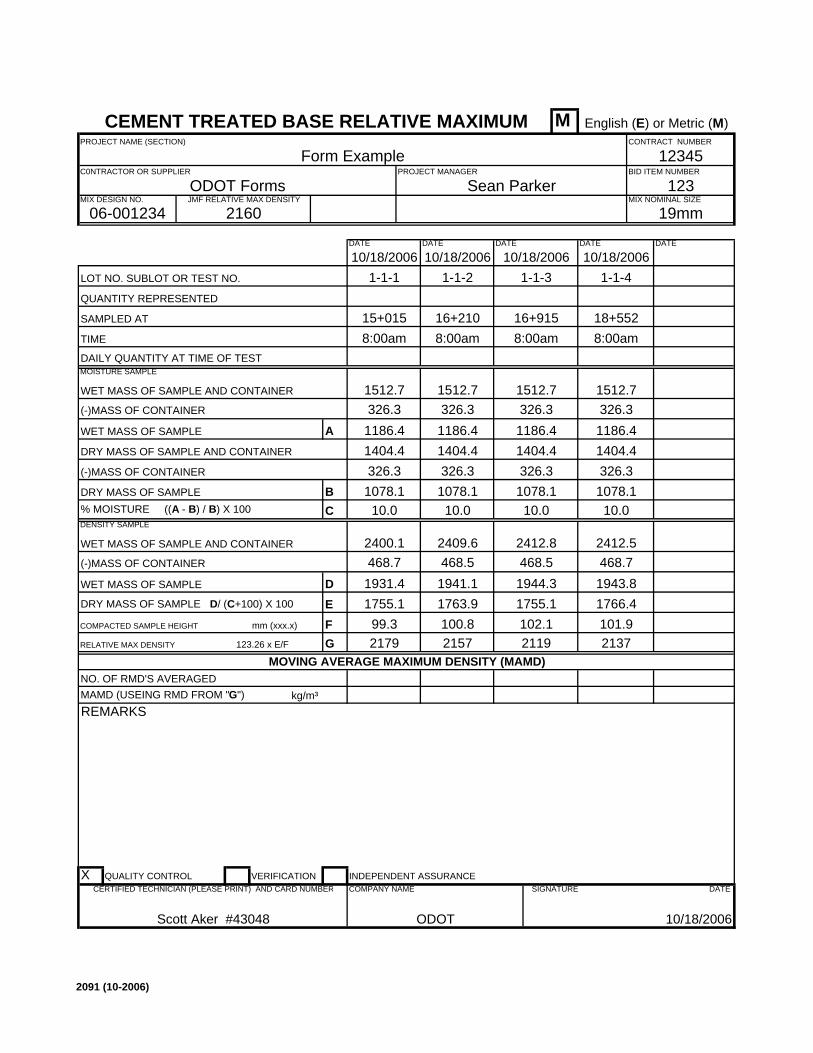
M
LOT NO. SUBLOT OR TEST NO.
QUANTITY REPRESENTED
SAMPLED AT
TIME
DAILY QUANTITY AT TIME OF TESTMOISTURE SAMPLE
WET MASS OF SAMPLE AND CONTAINER
(-)MASS OF CONTAINER
WET MASS OF SAMPLE ADRY MASS OF SAMPLE AND CONTAINER
(-)MASS OF CONTAINER
DRY MASS OF SAMPLE B% MOISTURE ((A - B) / B) X 100 CDENSITY SAMPLE
WET MASS OF SAMPLE AND CONTAINER
(-)MASS OF CONTAINER
WET MASS OF SAMPLE DDRY MASS OF SAMPLE D/ (C+100) X 100 ECOMPACTED SAMPLE HEIGHT FRELATIVE MAX DENSITY G
NO. OF RMD'S AVERAGED MAMD (USEING RMD FROM "G")REMARKS
X QUALITY CONTROL VERIFICATION INDEPENDENT ASSURANCE
kg/m³
CEMENT TREATED BASE RELATIVE MAXIMUM English (E) or Metric (M)
mm (xxx.x)
123.26 x E/F
10/18/2006 10/18/2006 10/18/2006
MOVING AVERAGE MAXIMUM DENSITY (MAMD)2179 2157 2119 213799.3 100.8 102.1 101.9
06-001234 2160
16+210
DATE
1-1-1
15+015 16+915
PROJECT NAME (SECTION)
PROJECT MANAGER
Sean ParkerODOT FormsC0NTRACTOR OR SUPPLIER
123
Form ExampleCONTRACT NUMBER
Scott Aker #43048
CERTIFIED TECHNICIAN (PLEASE PRINT) AND CARD NUMBER
MIX DESIGN NO.
SIGNATURE DATE
10/18/2006
MIX NOMINAL SIZE
19mmJMF RELATIVE MAX DENSITY
10/18/2006
18+552
1-1-3
12345
ODOT
COMPANY NAME
BID ITEM NUMBER
1-1-2
8:00am
DATE
1512.7326.31186.4
1755.1 1763.9
1404.4326.3
326.31186.41404.4326.3
1766.4
1078.1
1755.11931.4 1941.1 1944.3 1943.8
468.5
1078.1 1078.1
8:00am
1512.7
1186.41404.4326.3
8:00am
1512.7
1078.1
8:00am
1512.7326.31186.41404.4326.3
326.3
DATE DATEDATE
1-1-4
2400.1 2409.6 2412.8 2412.5468.7 468.5 468.7
10.0 10.0 10.0 10.0
2091 (10-2006)
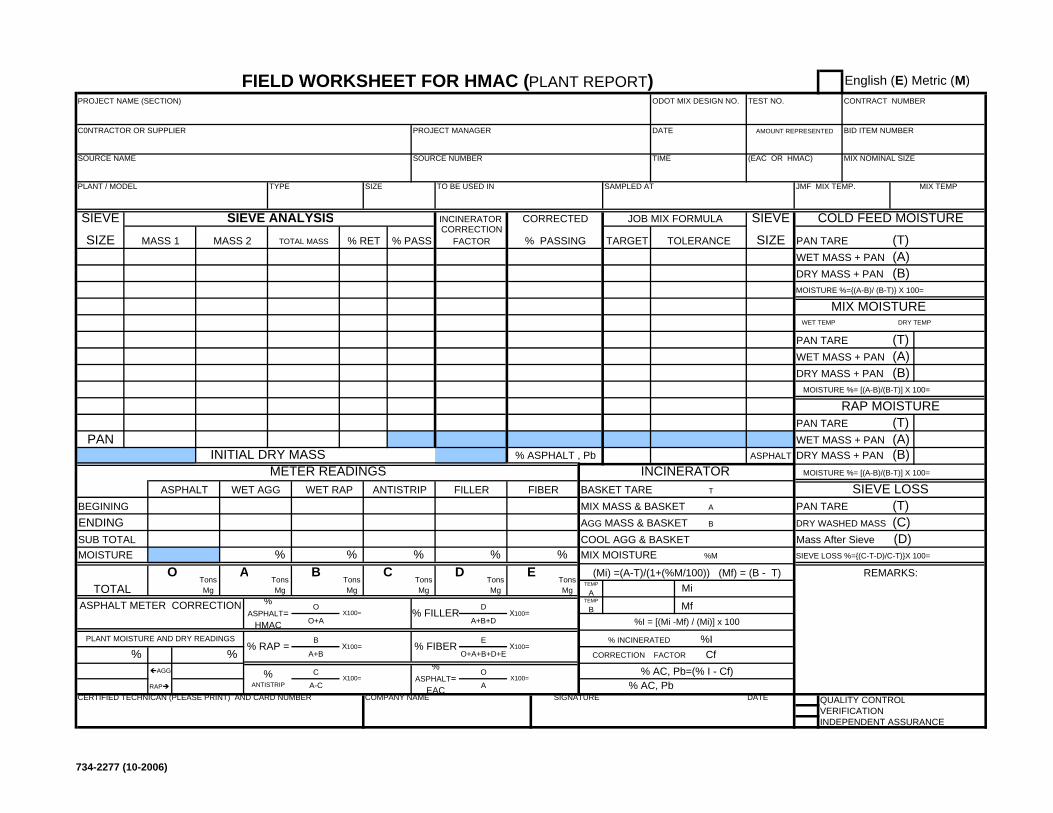
English (E) Metric (M)
PAN TARE (T)WET MASS + PAN (A)DRY MASS + PAN (B)MOISTURE %={(A-B)/ (B-T)} X 100=
PAN TARE (T)WET MASS + PAN (A)DRY MASS + PAN (B)
PAN TARE (T)WET MASS + PAN (A)DRY MASS + PAN (B)
BASKET TARE T
BEGINING A PAN TARE (T)ENDING B DRY WASHED MASS (C)SUB TOTAL Mass After Sieve (D)MOISTURE % % % % % MIX MOISTURE %M
TEMP
A MiTEMP
B Mf
%I% % Cf
AGG
RAP
QUALITY CONTROLVERIFICATIONINDEPENDENT ASSURANCE
DRY TEMP
SIEVE LOSSMOISTURE %= [(A-B)/(B-T)] X 100=
RAP MOISTUREMOISTURE %= [(A-B)/(B-T)] X 100=
% FILLER
TOTAL
%I = [(Mi -Mf) / (Mi)] x 100
DX100=
A+B+D
0.000.00%
ASPHALT= HMAC
% AC, Pb=(% I - Cf)
COOL AGG & BASKET
(Mi) =(A-T)/(1+(%M/100)) (Mf) = (B - T)
% INCINERATED
CORRECTION FACTOR
% AC, Pb
X100=
0.00
0.00
INCINERATOR
MIX MASS & BASKETAGG MASS & BASKET
METER READINGS
COMPANY NAME SIGNATURE DATE
X100=
% ASPHALT=
EAC
OX100=
ACERTIFIED TECHNICAN (PLEASE PRINT) AND CARD NUMBER
% ANTISTRIP
PLANT MOISTURE AND DRY READINGS% RAP =
TOLERANCE
0
00
MIX NOMINAL SIZE
0
SIEVE
SIZE00
00
CONTRACT NUMBER
BID ITEM NUMBER
X100=
0.00
E
O+A+B+D+E% FIBER
A+B
0.00
B
0
X100=O+A
O
0.00.0
PAN
0.0
0.00.0
INCINERATOR
% RET
CORRECTION FACTOR% PASS
CORRECTED
0.0
0.0
0.00 0.00
TOTAL MASS
MIX TEMPTYPEPLANT / MODEL
MASS 1
SIZE
MASS 2
0.0
0.00.0
SIEVE ANALYSIS
0
SIEVE
SIZE
ASPHALT
JMF MIX TEMP.
% PASSING
JOB MIX FORMULA
TARGET
FILLER WET RAP
INITIAL DRY MASS
WET AGGASPHALT ANTISTRIP
0.00.0
00.00
% ASPHALT , Pb
ASPHALT METER CORRECTION0.00
TEST NO.
AMOUNT REPRESENTEDDATE
ODOT MIX DESIGN NO.PROJECT NAME (SECTION)
(EAC OR HMAC)SOURCE NAME
PROJECT MANAGER
SOURCE NUMBER
C0NTRACTOR OR SUPPLIER
TIME
TO BE USED IN SAMPLED AT
00
COLD FEED MOISTURE
MIX MOISTURE
WET TEMP
B CTons Mg
Tons Mg
Tons Mg
C
A-C
D E
FIBER
Tons Mg
Tons Mg
Tons Mg
FIELD WORKSHEET FOR HMAC (PLANT REPORT)
REMARKS:
SIEVE LOSS %={(C-T-D)/C-T)}X 100=
O A
734-2277 (10-2006)
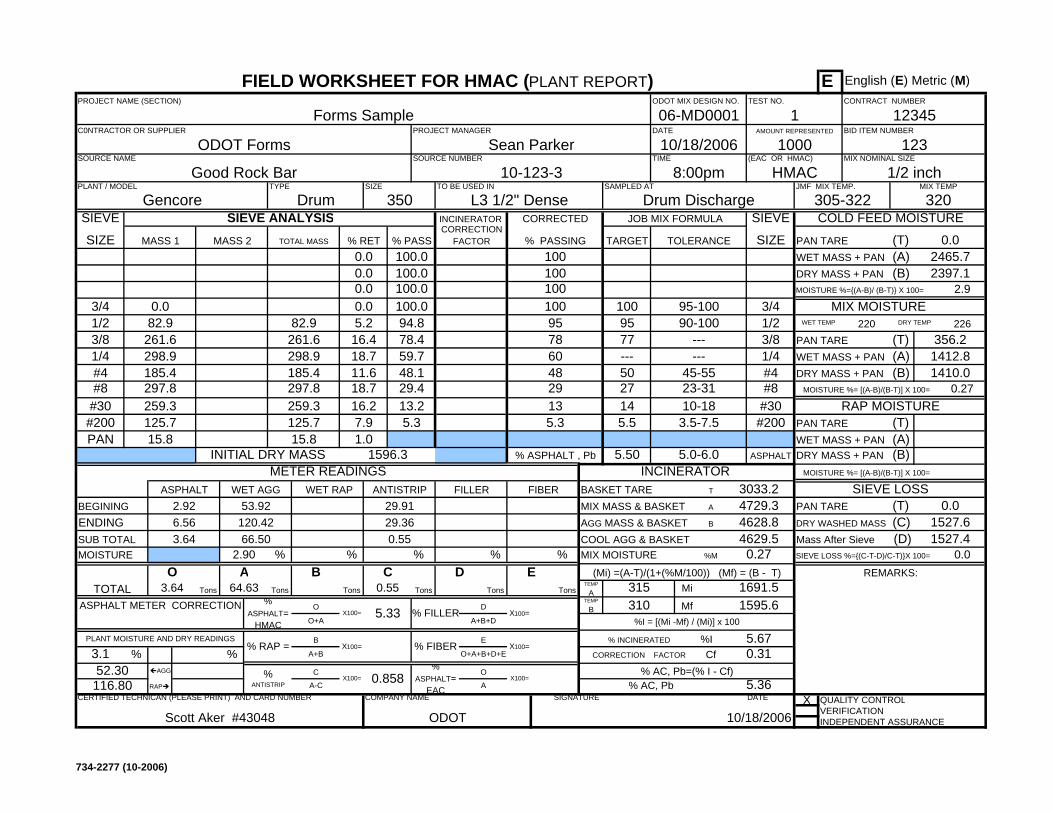
E English (E) Metric (M)
PAN TARE (T)WET MASS + PAN (A)DRY MASS + PAN (B)MOISTURE %={(A-B)/ (B-T)} X 100=
PAN TARE (T)WET MASS + PAN (A)DRY MASS + PAN (B)
PAN TARE (T)WET MASS + PAN (A)DRY MASS + PAN (B)
BASKET TARE T
BEGINING A PAN TARE (T)ENDING B DRY WASHED MASS (C)SUB TOTAL Mass After Sieve (D)MOISTURE % % % % % MIX MOISTURE %M
TEMP
A MiTEMP
B Mf
%I% % Cf
AGG
RAP
X QUALITY CONTROLVERIFICATIONINDEPENDENT ASSURANCE
Tons Tons Tons
FIELD WORKSHEET FOR HMAC (PLANT REPORT)
REMARKS:
SIEVE LOSS %={(C-T-D)/C-T)}X 100= 0.01527.4
O A
C
A-C
356.2
D E
FIBER
B CTons Tons Tons
COLD FEED MOISTURE
0.01527.6
2.9MIX MOISTURE
WET TEMP
220
18.7
18.7
2465.72397.1
0.27
94.878.4
90-100
1/4#4
TO BE USED IN
L3 1/2" DenseSAMPLED AT
Drum Discharge
HMAC8:00pmTIME10/18/2006
PROJECT NAME (SECTION)
Forms Sample
1000(EAC OR HMAC)SOURCE NAME
PROJECT MANAGER
SOURCE NUMBERSean ParkerODOT Forms
C0NTRACTOR OR SUPPLIER
ASPHALT METER CORRECTION64.63
TEST NO.
1AMOUNT REPRESENTEDDATE
06-MD0001ODOT MIX DESIGN NO.
1596.3 % ASPHALT , Pb
6.56
2.900.550.00
29.4
FILLER WET RAP
INITIAL DRY MASS
WET AGGASPHALT ANTISTRIP
297.8259.3
JMF MIX TEMP.
305-322
% PASSING
JOB MIX FORMULA
TARGET
48
95-100
#200
SIEVE
SIZE
ASPHALT
Drum
0.00.0
SIEVE ANALYSIS
0.00.0
350SIZE
298.9
259.3
MASS 2
82.9261.6
185.4
0.0
MIX TEMP
320TYPEPLANT / MODEL
Gencore
MASS 1
10-123-3
3.64
53.92120.4266.50
2.92
100.0
Good Rock Bar
0.0
TOTAL MASS
5.5142729
13
10095
CORRECTED
100.0
261.65.216.4
100.00.00.0
100
10082.9
298.9185.4
INCINERATOR
0.0% RET
CORRECTION FACTOR% PASS
11.6 48.1
3/41/2
#200
297.8
3/81/4
#8#4
5.3PAN
#305.3
16.2
1.07.9
13.2
15.8125.715.8
125.7
5.0-6.05.50
--- ---
45-55
77
23-3110-18
3.5-7.5
A+B
0.00
B
0.55
5.33X100=O+A
O
X100=
29.3629.91
0.00
0.858
E
O+A+B+D+E% FIBER
CONTRACT NUMBER
12345BID ITEM NUMBER
123MIX NOMINAL SIZE
1/2 inch
#30
SIEVE
SIZE00
1/23/8
0.0
#8
03/4
50 ---
TOLERANCE
100.0
59.7
100
9578
100
60
CERTIFIED TECHNICAN (PLEASE PRINT) AND CARD NUMBER
% ANTISTRIP
PLANT MOISTURE AND DRY READINGS
52.30116.80
3.1 % RAP =
% ASPHALT=
EAC
OX100=
A
Scott Aker #43048
1410.0
ODOT
METER READINGS
COMPANY NAME SIGNATURE DATE
10/18/2006
X100=
0.27
1691.51595.6
315
X100=
0.00
0.00
INCINERATOR 3033.24729.34628.8
MIX MASS & BASKETAGG MASS & BASKET
4629.5
% AC, Pb=(% I - Cf)5.36
COOL AGG & BASKET
310
(Mi) =(A-T)/(1+(%M/100)) (Mf) = (B - T)
5.670.31
% INCINERATED
CORRECTION FACTOR
% AC, Pb
% FILLER
TOTAL
%I = [(Mi -Mf) / (Mi)] x 100
DX100=
A+B+D
0.003.64%
ASPHALT= HMAC
DRY TEMP 226
SIEVE LOSS
1412.8
MOISTURE %= [(A-B)/(B-T)] X 100=
RAP MOISTUREMOISTURE %= [(A-B)/(B-T)] X 100=
734-2277 (10-2006)
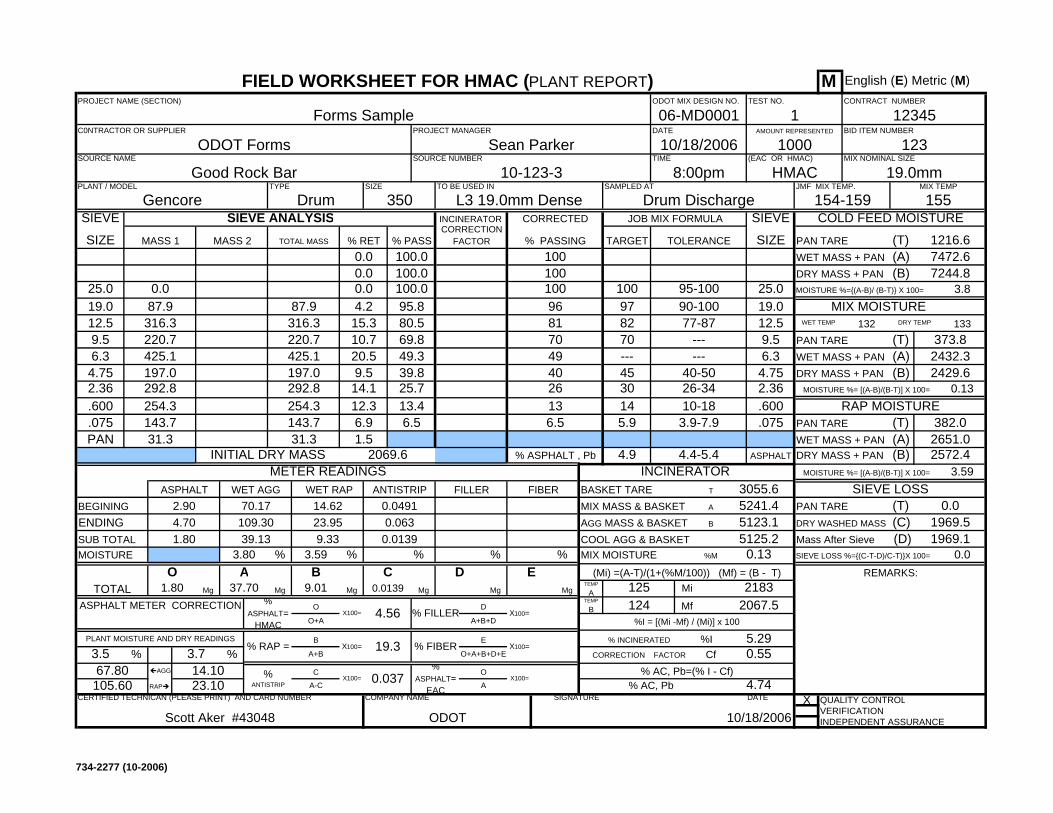
M English (E) Metric (M)
PAN TARE (T)WET MASS + PAN (A)DRY MASS + PAN (B)MOISTURE %={(A-B)/ (B-T)} X 100=
PAN TARE (T)WET MASS + PAN (A)DRY MASS + PAN (B)
PAN TARE (T)WET MASS + PAN (A)DRY MASS + PAN (B)
BASKET TARE T
BEGINING A PAN TARE (T)ENDING B DRY WASHED MASS (C)SUB TOTAL Mass After Sieve (D)MOISTURE % % % % % MIX MOISTURE %M
TEMP
A MiTEMP
B Mf
%I% % Cf
AGG
RAP
X QUALITY CONTROLVERIFICATIONINDEPENDENT ASSURANCE
DRY TEMP 133
SIEVE LOSS
2432.3
MOISTURE %= [(A-B)/(B-T)] X 100=
382.0RAP MOISTURE
MOISTURE %= [(A-B)/(B-T)] X 100=
% FILLER
TOTAL
%I = [(Mi -Mf) / (Mi)] x 100
DX100=
A+B+D
0.001.80%
ASPHALT= HMAC
% AC, Pb=(% I - Cf)4.74
COOL AGG & BASKET
124
(Mi) =(A-T)/(1+(%M/100)) (Mf) = (B - T)
5.290.55
% INCINERATED
CORRECTION FACTOR
% AC, Pb
X100=
0.00
0.00
INCINERATOR 3055.65241.45123.1
MIX MASS & BASKETAGG MASS & BASKET
5125.20.13
21832067.5
125
Scott Aker #43048
2429.6
ODOT
METER READINGS2572.42651.0
COMPANY NAME SIGNATURE DATE
10/18/2006
X100=
% ASPHALT=
EAC
OX100=
ACERTIFIED TECHNICAN (PLEASE PRINT) AND CARD NUMBER
% ANTISTRIP
PLANT MOISTURE AND DRY READINGS
67.80105.60
14.1023.10
3.73.5 % RAP =
TOLERANCE
100.0
49.3
100
8170
100
49
2.36
25.019.0
45 ---
MIX NOMINAL SIZE
19.0mm
.600
SIEVE
SIZE00
12.59.5
1216.6
CONTRACT NUMBER
12345BID ITEM NUMBER
123
X100=
0.0630.0491
0.00
0.037
E
O+A+B+D+E% FIBER19.3
A+B
9.01
B
0.0139
4.56X100=O+A
O
4.4-5.44.9
--- ---
40-50
70
26-3410-18
3.9-7.913.4
31.3143.731.3
143.7 6.5PAN
.6006.5
12.3
1.56.9.075
292.8
9.56.3
2.364.75
25.019.012.5 316.3
425.1197.0
INCINERATOR
0.0% RET
CORRECTION FACTOR% PASS
9.5 39.8
CORRECTED
100.0
220.715.310.7
95.84.287.9
100
961009782
5.9143026
13
10-123-3
1.80
70.17109.3039.13
2.90
100.0
Good Rock Bar
87.9
TOTAL MASS
MIX TEMP
155TYPEPLANT / MODEL
Gencore
MASS 1
SIZE
425.1
254.3
MASS 2
316.3220.7
197.0
0.0
Drum
0.0
0.00.0
SIEVE ANALYSIS
0.00.0
350
.075
3.59
SIEVE
SIZE
ASPHALT
JMF MIX TEMP.
154-159
% PASSING
JOB MIX FORMULA
TARGET
40
95-10090-100
25.7
FILLER WET RAP
INITIAL DRY MASS
WET AGGASPHALT ANTISTRIP
292.8254.3
3.800.01399.33
23.95
2069.6 % ASPHALT , Pb
4.7014.62
ASPHALT METER CORRECTION37.70
TEST NO.
1AMOUNT REPRESENTEDDATE
06-MD0001ODOT MIX DESIGN NO.PROJECT NAME (SECTION)
Forms Sample
1000(EAC OR HMAC)SOURCE NAME
PROJECT MANAGER
SOURCE NUMBERSean ParkerODOT Forms
C0NTRACTOR OR SUPPLIER
HMAC8:00pmTIME10/18/2006
TO BE USED IN
L3 19.0mm DenseSAMPLED AT
Drum Discharge
20.5
14.1
7472.67244.8
0.13
80.569.8
77-87
6.34.75
COLD FEED MOISTURE
0.01969.5
3.8MIX MOISTURE
WET TEMP
3.59
132
B CMg Mg Mg
C
A-C
373.8
D E
FIBER
Mg Mg Mg
FIELD WORKSHEET FOR HMAC (PLANT REPORT)
REMARKS:
SIEVE LOSS %={(C-T-D)/C-T)}X 100= 0.01969.1
O A
734-2277 (10-2006)
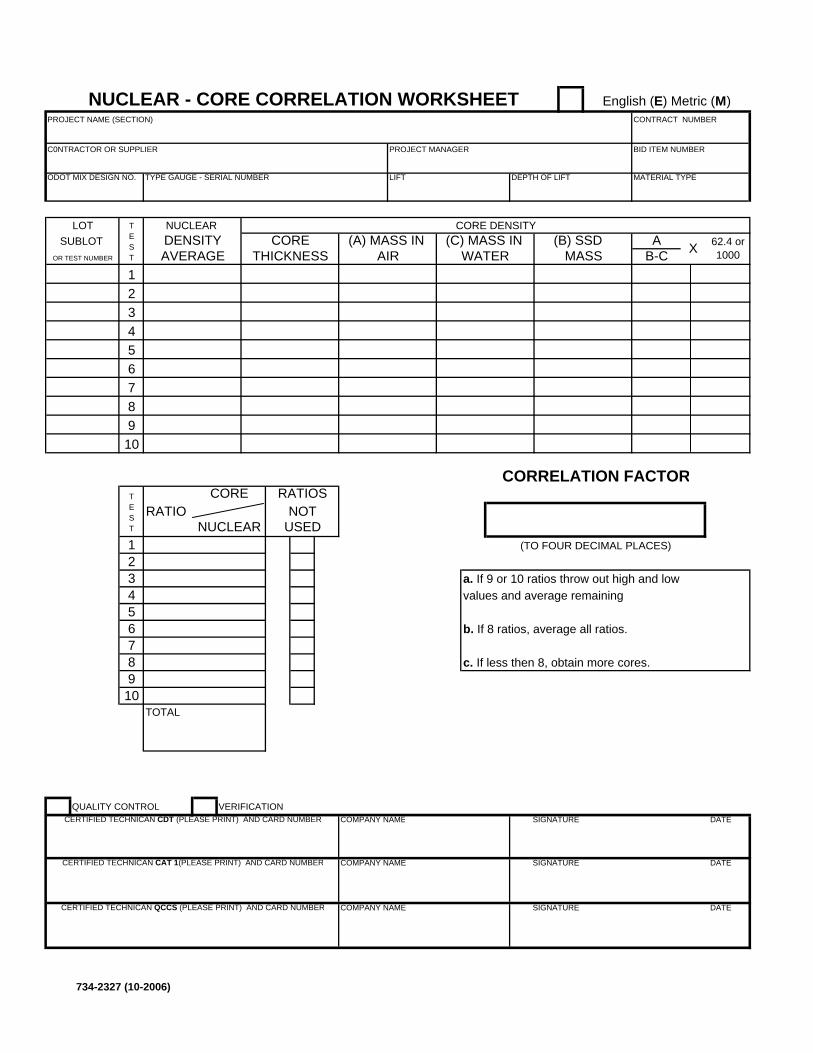
12345678910
RATIOSRATIO NOT
USED12345678910
QUALITY CONTROL VERIFICATION
CONTRACT NUMBER
BID ITEM NUMBER
PROJECT NAME (SECTION)
PROJECT MANAGERC0NTRACTOR OR SUPPLIER
MATERIAL TYPE
X 62.4 or 1000
SIGNATURE DATE
AB-C
TYPE GAUGE - SERIAL NUMBER
LOTSUBLOT
ODOT MIX DESIGN NO.
DENSITY (A) MASS IN NUCLEAR
LIFT
OR TEST NUMBER
COMPANY NAMECERTIFIED TECHNICAN CDT (PLEASE PRINT) AND CARD NUMBER
TEST
DEPTH OF LIFT
AVERAGE AIR WATERCORE
THICKNESS(C) MASS IN
TEST
CORRELATION FACTOR
(TO FOUR DECIMAL PLACES)
CORE
NUCLEAR
b. If 8 ratios, average all ratios.
c. If less then 8, obtain more cores.
COMPANY NAME SIGNATURE DATECERTIFIED TECHNICAN CAT 1(PLEASE PRINT) AND CARD NUMBER
CERTIFIED TECHNICAN QCCS (PLEASE PRINT) AND CARD NUMBER
a. If 9 or 10 ratios throw out high and lowvalues and average remaining
COMPANY NAME SIGNATURE DATE
TOTAL
English (E) Metric (M)NUCLEAR - CORE CORRELATION WORKSHEET
CORE DENSITY(B) SSD
MASS
734-2327 (10-2006)
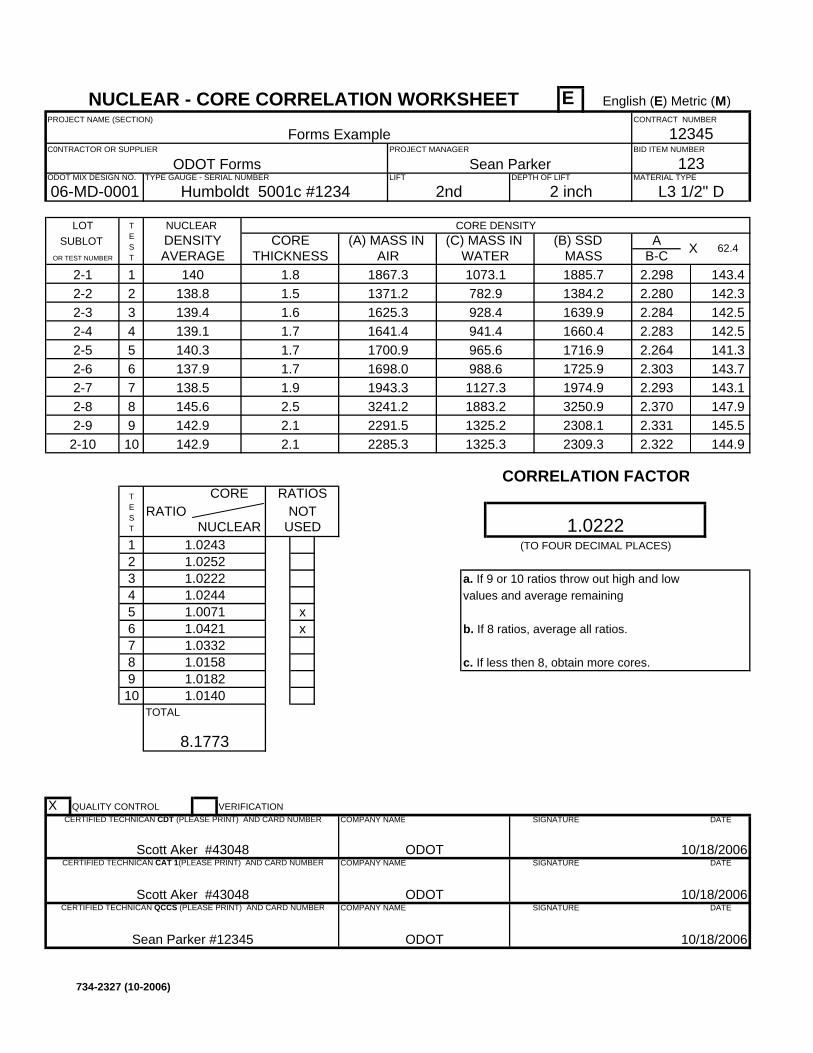
E
12345678910
RATIOSRATIO NOT
USED12345 x6 x78910
X QUALITY CONTROL VERIFICATION
English (E) Metric (M)NUCLEAR - CORE CORRELATION WORKSHEET
1660.4
CORE DENSITY
138.8 1371.2 782.9 1384.2
(B) SSD MASS
COMPANY NAME SIGNATURE DATE
TOTAL
8.1773
a. If 9 or 10 ratios throw out high and lowvalues and average remaining
Sean Parker #12345 ODOT 10/18/2006
COMPANY NAME SIGNATURE DATE
Scott Aker #43048 ODOT 10/18/2006
CERTIFIED TECHNICAN CAT 1(PLEASE PRINT) AND CARD NUMBER
CERTIFIED TECHNICAN QCCS (PLEASE PRINT) AND CARD NUMBER
b. If 8 ratios, average all ratios.
c. If less then 8, obtain more cores.1.01821.0140
CORE
NUCLEAR
1.00711.04211.03321.0158
1.02431.02521.02221.0244
TEST
143.4142.3
1.0222
CORRELATION FACTOR
(TO FOUR DECIMAL PLACES)
2.2982.2802.2842.283
145.5144.9
2.2642.3032.2932.370
143.1147.9
2.3312.322
1.9
2308.12.12309.32.1
2.5
1725.91.71974.9
928.4941.4
988.61127.3
1.7965.6 1716.9
138.51883.21325.21325.3
1943.33241.22291.52285.3
137.9
1625.31641.4
1698.0140.3 1700.91.7
1.6139.1
2-10
145.6142.9142.9
2-62-72-82-9
1.51885.7
2-5
1639.9
140 1.8 1073.11867.3
DEPTH OF LIFT
2nd 2 inch
139.4
AVERAGE AIR WATERCORE
THICKNESS(C) MASS IN
OR TEST NUMBER
ODOT
COMPANY NAME
Scott Aker #43048
CERTIFIED TECHNICAN CDT (PLEASE PRINT) AND CARD NUMBER
TEST
2-12-22-32-4
TYPE GAUGE - SERIAL NUMBER
Humboldt 5001c #1234
LOTSUBLOT
ODOT MIX DESIGN NO.
06-MD-0001
DENSITY (A) MASS IN NUCLEAR
LIFT MATERIAL TYPE
L3 1/2" D
12345
10/18/2006
X 62.4
SIGNATURE DATE
AB-C
3250.9
123
Forms ExampleCONTRACT NUMBER
BID ITEM NUMBER
PROJECT NAME (SECTION)
PROJECT MANAGER
Sean ParkerODOT FormsC0NTRACTOR OR SUPPLIER
142.5142.5141.3143.7
734-2327 (10-2006)
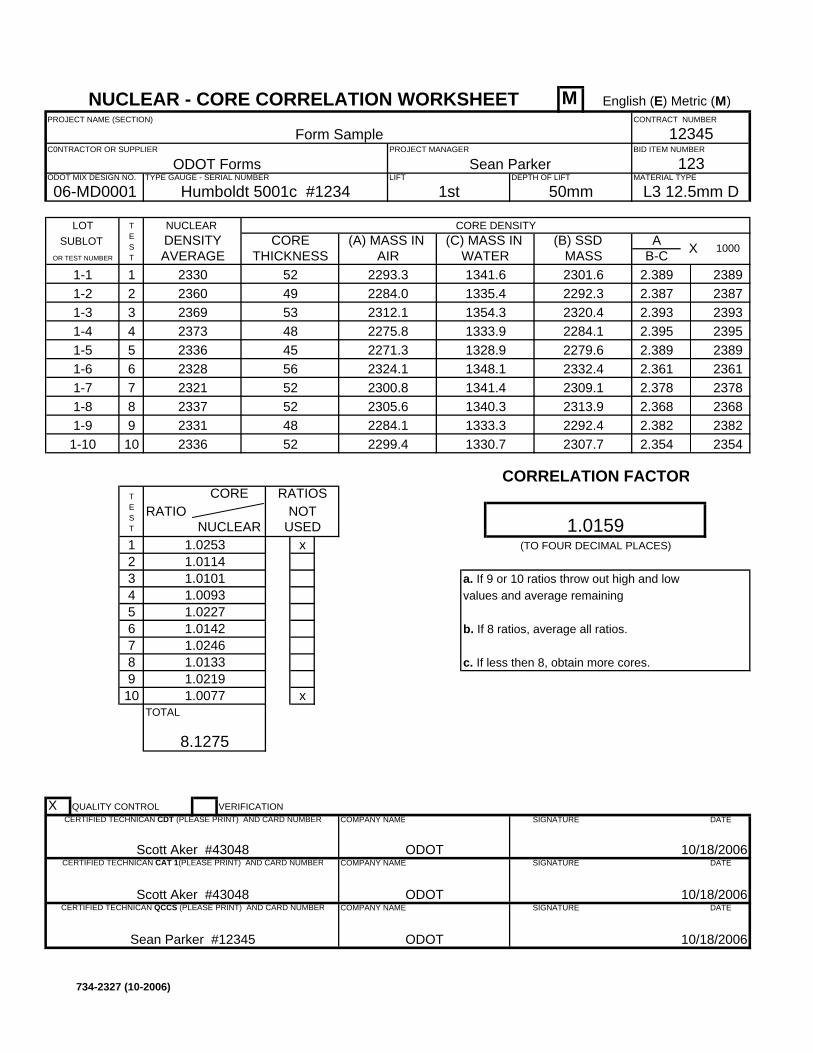
M
12345678910
RATIOSRATIO NOT
USED1 x2345678910 x
X QUALITY CONTROL VERIFICATION
2393239523892361
123
Form SampleCONTRACT NUMBER
BID ITEM NUMBER
PROJECT NAME (SECTION)
PROJECT MANAGER
Sean ParkerODOT FormsC0NTRACTOR OR SUPPLIER
MATERIAL TYPE
L3 12.5mm D
12345
10/18/2006
X 1000
SIGNATURE DATE
AB-C
2313.9
TYPE GAUGE - SERIAL NUMBER
Humboldt 5001c #1234
LOTSUBLOT
ODOT MIX DESIGN NO.
06-MD0001
DENSITY (A) MASS IN NUCLEAR
LIFT
OR TEST NUMBER
ODOT
COMPANY NAME
Scott Aker #43048
CERTIFIED TECHNICAN CDT (PLEASE PRINT) AND CARD NUMBER
TEST
1-11-21-31-4
DEPTH OF LIFT
1st 50mm
2369
AVERAGE AIR WATERCORE
THICKNESS(C) MASS IN
492301.6
1-5
2320.4
2330 52 1341.62293.3
1-61-71-81-91-10
233723312336
2328
2312.12275.8
2324.12336 2271.345
532373
23211340.31333.31330.7
2300.82305.62284.12299.4
2332.4562309.1
1354.31333.9
1348.11341.4
481328.9 2279.6
2.3822.354
52
2292.4482307.752
52
2.3932.395
23822354
2.3892.3612.3782.368
23782368
1.01011.0093
TEST
23892387
1.0159
CORRELATION FACTOR
(TO FOUR DECIMAL PLACES)
2.3892.387
1.0077
CORE
NUCLEAR
1.02271.01421.02461.0133
1.02531.0114
b. If 8 ratios, average all ratios.
c. If less then 8, obtain more cores.1.0219
Sean Parker #12345 ODOT 10/18/2006
COMPANY NAME SIGNATURE DATE
Scott Aker #43048 ODOT 10/18/2006
CERTIFIED TECHNICAN CAT 1(PLEASE PRINT) AND CARD NUMBER
CERTIFIED TECHNICAN QCCS (PLEASE PRINT) AND CARD NUMBER
a. If 9 or 10 ratios throw out high and lowvalues and average remaining
COMPANY NAME SIGNATURE DATE
TOTAL
8.1275
English (E) Metric (M)NUCLEAR - CORE CORRELATION WORKSHEET
2284.1
CORE DENSITY
2360 2284.0 1335.4 2292.3
(B) SSD MASS
734-2327 (10-2006)
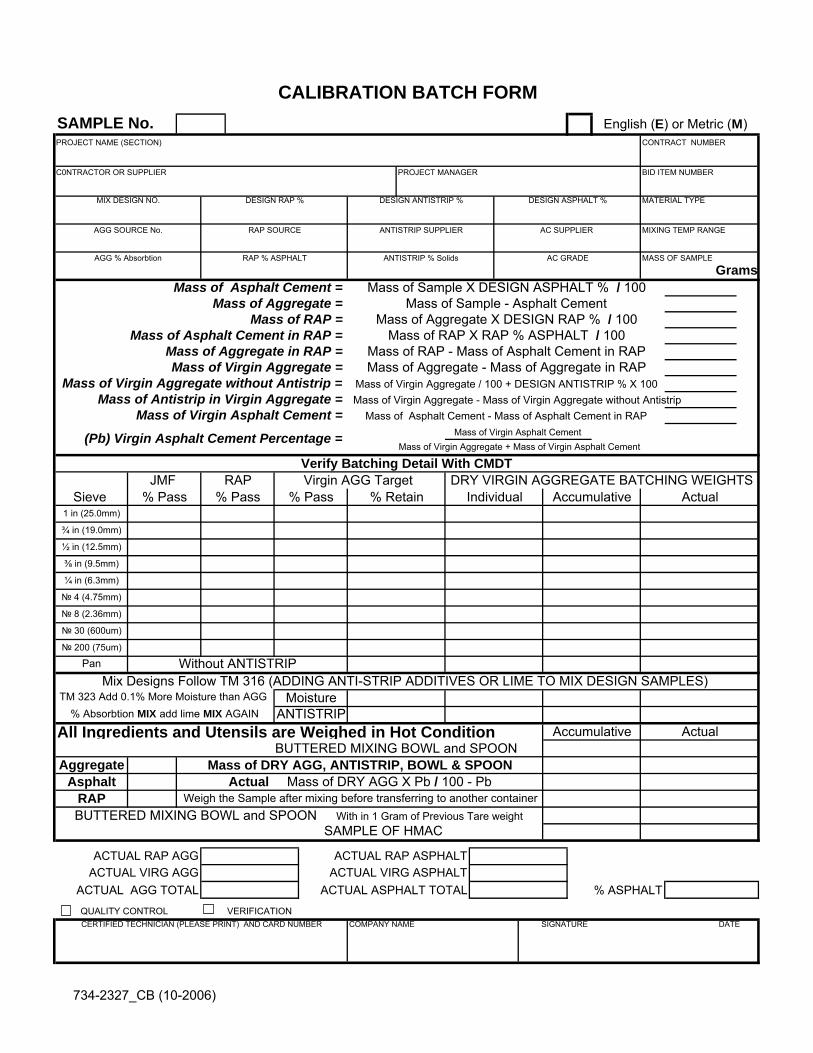
All Ingredients and Utensils are Weighed in Hot Condition
ACTUAL RAP AGG ACTUAL RAP ASPHALTACTUAL VIRG AGG ACTUAL VIRG ASPHALT
ACTUAL AGG TOTAL ACTUAL ASPHALT TOTAL % ASPHALT
QUALITY CONTROL VERIFICATION
English (E) or Metric (M)
Mass of DRY AGG, ANTISTRIP, BOWL & SPOON
Mass of RAP X RAP % ASPHALT / 100
AC SUPPLIER
Mass of Sample X DESIGN ASPHALT % / 100
Mass of Aggregate X DESIGN RAP % / 100
(Pb) Virgin Asphalt Cement Percentage =
½ in (12.5mm)
RAP
Mass of Virgin Aggregate without Antistrip =
1 in (25.0mm)
¾ in (19.0mm)
JMF
SAMPLE No.
C0NTRACTOR OR SUPPLIER PROJECT MANAGER BID ITEM NUMBER
PROJECT NAME (SECTION) CONTRACT NUMBER
MATERIAL TYPEDESIGN ASPHALT %DESIGN ANTISTRIP %MIX DESIGN NO. DESIGN RAP %
Mass of Sample - Asphalt Cement
Mass of Aggregate - Mass of Aggregate in RAP
Mass of Asphalt Cement =
Mass of RAP - Mass of Asphalt Cement in RAP
Sieve % Pass
Mass of Virgin Asphalt Cement =
№ 4 (4.75mm)
№ 8 (2.36mm)
№ 30 (600um)
MIXING TEMP RANGE
Mass of Virgin Aggregate / 100 + DESIGN ANTISTRIP % X 100
Accumulative
Verify Batching Detail With CMDT
Mass of Virgin Aggregate - Mass of Virgin Aggregate without Antistrip Mass of Antistrip in Virgin Aggregate =
Accumulative
Without ANTISTRIP
Mix Designs Follow TM 316 (ADDING ANTI-STRIP ADDITIVES OR LIME TO MIX DESIGN SAMPLES)
ANTISTRIP
BUTTERED MIXING BOWL and SPOON With in 1 Gram of Previous Tare weight
Pan
AggregateAsphalt
Moisture
BUTTERED MIXING BOWL and SPOON
RAP
TM 323 Add 0.1% More Moisture than AGG
Actual
Mass of Aggregate =
Mass of Aggregate in RAP =Mass of Virgin Aggregate =
Mass of RAP =Mass of Asphalt Cement in RAP =
AGG SOURCE No.
AGG % Absorbtion RAP % ASPHALT
ANTISTRIP SUPPLIER
MASS OF SAMPLE
GramsANTISTRIP % Solids AC GRADE
RAP SOURCE
CERTIFIED TECHNICIAN (PLEASE PRINT) AND CARD NUMBER
COMPANY NAME
SIGNATURE DATE
Weigh the Sample after mixing before transferring to another containerActual Mass of DRY AGG X Pb / 100 - Pb
SAMPLE OF HMAC
⅜ in (9.5mm)
Mass of Asphalt Cement - Mass of Asphalt Cement in RAP
DRY VIRGIN AGGREGATE BATCHING WEIGHTSVirgin AGG Target % Pass ActualIndividual
Mass of Virgin Aggregate + Mass of Virgin Asphalt Cement
% Retain
Mass of Virgin Asphalt Cement
% Pass
% Absorbtion MIX add lime MIX AGAIN
№ 200 (75um)
¼ in (6.3mm)
CALIBRATION BATCH FORM
734-2327_CB (10-2006)
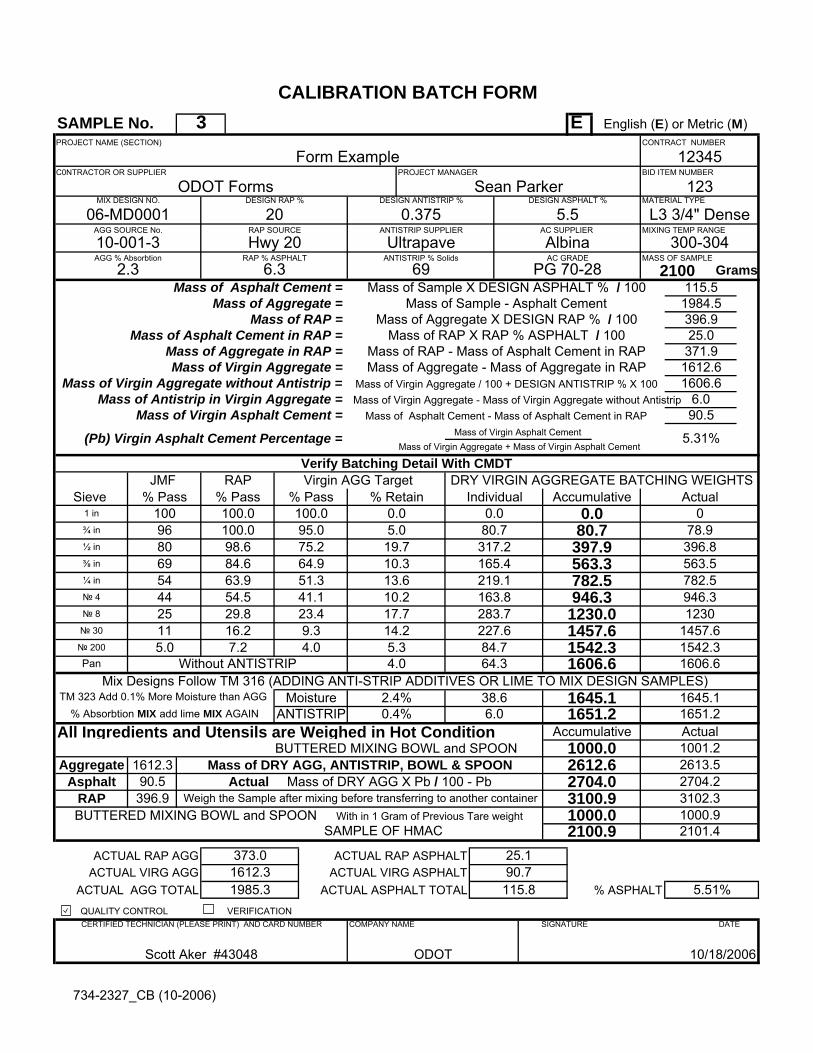
E
All Ingredients and Utensils are Weighed in Hot Condition
ACTUAL RAP AGG ACTUAL RAP ASPHALTACTUAL VIRG AGG ACTUAL VIRG ASPHALT
ACTUAL AGG TOTAL ACTUAL ASPHALT TOTAL % ASPHALT
QUALITY CONTROL VERIFICATION
CALIBRATION BATCH FORM
19.7
946.31230.01457.6
165.4219.1
1542.3
% Absorbtion MIX add lime MIX AGAIN
10.313.6
84.663.954.529.816.2
№ 200
¼ in
283.7
100.0
% Pass
563.3
80.7100.095.0
Actual
563.5
Individual
Mass of Virgin Aggregate + Mass of Virgin Asphalt Cement5.31%
0.05.0
% Retain0.0
Mass of Virgin Asphalt Cement
Mass of Asphalt Cement - Mass of Asphalt Cement in RAP
163.8
397.9317.280.7
782.5
DRY VIRGIN AGGREGATE BATCHING WEIGHTS
396.8
Virgin AGG Target % Pass
Scott Aker #43048 ODOT 10/18/2006
⅜ in
5444
64.951.341.123.4
SIGNATURE DATE
2704.23100.9
90.7
Weigh the Sample after mixing before transferring to another containerActual Mass of DRY AGG X Pb / 100 - Pb
115.8
25.1
SAMPLE OF HMAC
1985.3
373.01612.3
8069
2511
396.9
7.2
75.2
9.3
CERTIFIED TECHNICIAN (PLEASE PRINT) AND CARD NUMBER
1651.2
14.2 227.684.7
1651.2
1000.02612.6
5.51%
COMPANY NAME
L3 3/4" Dense
4.0
MASS OF SAMPLE
2100 GramsANTISTRIP % Solids AC GRADE
PG 70-28
20RAP SOURCE
Hwy 20
1542.3
0.375ANTISTRIP SUPPLIER
Ultrapave
078.9
0.0
10.217.7
2.3RAP % ASPHALT
6.3
1645.1
1606.6
782.5946.31230
1457.6
69
06-MD0001AGG SOURCE No.
10-001-3AGG % Absorbtion
Mass of Aggregate =
Mass of Aggregate in RAP =Mass of Virgin Aggregate =
Mass of RAP =Mass of Asphalt Cement in RAP =
2704.0
2100.91000.0
Actual1001.2
2101.41000.9
2613.5
3102.3BUTTERED MIXING BOWL and SPOON With in 1 Gram of Previous Tare weight
Pan 4.0
AggregateAsphalt
Moisture
BUTTERED MIXING BOWL and SPOON
64.3
RAP
TM 323 Add 0.1% More Moisture than AGG
1606.6
Accumulative
Without ANTISTRIP
38.6 1645.16.0
Mix Designs Follow TM 316 (ADDING ANTI-STRIP ADDITIVES OR LIME TO MIX DESIGN SAMPLES)
ANTISTRIP2.4%0.4%
№ 4
№ 8
№ 30
MIXING TEMP RANGE
300-304
Mass of Virgin Aggregate / 100 + DESIGN ANTISTRIP % X 100
Accumulative
Verify Batching Detail With CMDT
Mass of Virgin Aggregate - Mass of Virgin Aggregate without Antistrip Mass of Antistrip in Virgin Aggregate =
5.0
Mass of Sample - Asphalt Cement
Mass of Aggregate - Mass of Aggregate in RAP
Mass of Asphalt Cement =
Mass of RAP - Mass of Asphalt Cement in RAP
98.6
5.3
Sieve % Pass
Mass of Virgin Asphalt Cement =
MATERIAL TYPEDESIGN ASPHALT %DESIGN ANTISTRIP %MIX DESIGN NO. DESIGN RAP %
SAMPLE No.
ODOT Forms Sean Parker 123C0NTRACTOR OR SUPPLIER PROJECT MANAGER BID ITEM NUMBER
PROJECT NAME (SECTION) CONTRACT NUMBER
Form Example 12345
½ in
RAP
100.0
Mass of Virgin Aggregate without Antistrip =
10096
1 in
¾ in
JMF
6.0
(Pb) Virgin Asphalt Cement Percentage =
90.5
1606.6
371.91612.6
5.5AC SUPPLIER
Albina
Mass of Sample X DESIGN ASPHALT % / 100
Mass of Aggregate X DESIGN RAP % / 100
3 English (E) or Metric (M)
1612.390.5
Mass of DRY AGG, ANTISTRIP, BOWL & SPOON
Mass of RAP X RAP % ASPHALT / 100
115.51984.5396.925.0
734-2327_CB (10-2006)

M
All Ingredients and Utensils are Weighed in Hot Condition
ACTUAL RAP AGG ACTUAL RAP ASPHALTACTUAL VIRG AGG ACTUAL VIRG ASPHALT
ACTUAL AGG TOTAL ACTUAL ASPHALT TOTAL % ASPHALT
QUALITY CONTROL VERIFICATION
3 English (E) or Metric (M)
1612.390.5
Mass of DRY AGG, ANTISTRIP, BOWL & SPOON
Mass of RAP X RAP % ASPHALT / 100
115.51984.5396.925.0
5.5AC SUPPLIER
Albina
Mass of Sample X DESIGN ASPHALT % / 100
Mass of Aggregate X DESIGN RAP % / 100
6.0
(Pb) Virgin Asphalt Cement Percentage =
90.5
1606.6
371.91612.6
12345
12.5mm
RAP
100.0
Mass of Virgin Aggregate without Antistrip =
10096
25.0mm
19.0mm
JMF
SAMPLE No.
ODOT Forms Sean Parker 123C0NTRACTOR OR SUPPLIER PROJECT MANAGER BID ITEM NUMBER
PROJECT NAME (SECTION) CONTRACT NUMBER
Form Example
MATERIAL TYPEDESIGN ASPHALT %DESIGN ANTISTRIP %MIX DESIGN NO. DESIGN RAP %
5.0
Mass of Sample - Asphalt Cement
Mass of Aggregate - Mass of Aggregate in RAP
Mass of Asphalt Cement =
Mass of RAP - Mass of Asphalt Cement in RAP
98.6
5.3
Sieve % Pass
Mass of Virgin Asphalt Cement =
4.75mm
2.36mm
600um
MIXING TEMP RANGE
300-304
Mass of Virgin Aggregate / 100 + DESIGN ANTISTRIP % X 100
Accumulative
Verify Batching Detail With CMDT
Mass of Virgin Aggregate - Mass of Virgin Aggregate without Antistrip Mass of Antistrip in Virgin Aggregate =
1606.6
Accumulative
Without ANTISTRIP
38.6 1645.16.0
Mix Designs Follow TM 316 (ADDING ANTI-STRIP ADDITIVES OR LIME TO MIX DESIGN SAMPLES)
ANTISTRIP2.4%0.4%
BUTTERED MIXING BOWL and SPOON With in 1 Gram of Previous Tare weight
Pan 4.0
AggregateAsphalt
Moisture
BUTTERED MIXING BOWL and SPOON
64.3
RAP
TM 323 Add 0.1% More Moisture than AGG
2704.0
2100.91000.0
Actual1001.2
2101.41000.9
2613.5
3102.3
Mass of Aggregate =
Mass of Aggregate in RAP =Mass of Virgin Aggregate =
Mass of RAP =Mass of Asphalt Cement in RAP =
06-MD0001AGG SOURCE No.
10-001-3AGG % Absorbtion
2.3RAP % ASPHALT
6.3
1645.1
1606.6
782.5946.31230
1457.6
69
Hwy 20
1542.3
0.375ANTISTRIP SUPPLIER
Ultrapave
078.9
0.0
10.217.7
L3 3/4" Dense
4.0
MASS OF SAMPLE
2100 GramsANTISTRIP % Solids AC GRADE
PG 70-28
20RAP SOURCE
CERTIFIED TECHNICIAN (PLEASE PRINT) AND CARD NUMBER
1651.2
14.2 227.684.7
1651.2
1000.02612.6
5.51%
COMPANY NAME
373.01612.3
8069
2511
396.9
7.2
75.2
9.3
SIGNATURE DATE
2704.23100.9
90.7
Weigh the Sample after mixing before transferring to another containerActual Mass of DRY AGG X Pb / 100 - Pb
115.8
25.1
SAMPLE OF HMAC
1985.3
Scott Aker #43048 ODOT 10/18/2006
9.5mm
5444
64.951.341.123.4
Mass of Asphalt Cement - Mass of Asphalt Cement in RAP
163.8
397.9317.280.7
782.5
DRY VIRGIN AGGREGATE BATCHING WEIGHTS
396.8
Virgin AGG Target % Pass Actual
563.5
Individual
Mass of Virgin Aggregate + Mass of Virgin Asphalt Cement5.31%
0.05.0
% Retain0.0
Mass of Virgin Asphalt Cement
283.7
100.0
% Pass
563.3
80.7100.095.0
% Absorbtion MIX add lime MIX AGAIN
10.313.6
84.663.954.529.816.2
75um
6.3mm
CALIBRATION BATCH FORM
19.7
946.31230.01457.6
165.4219.1
1542.3
734-2327_CB (10-2006)
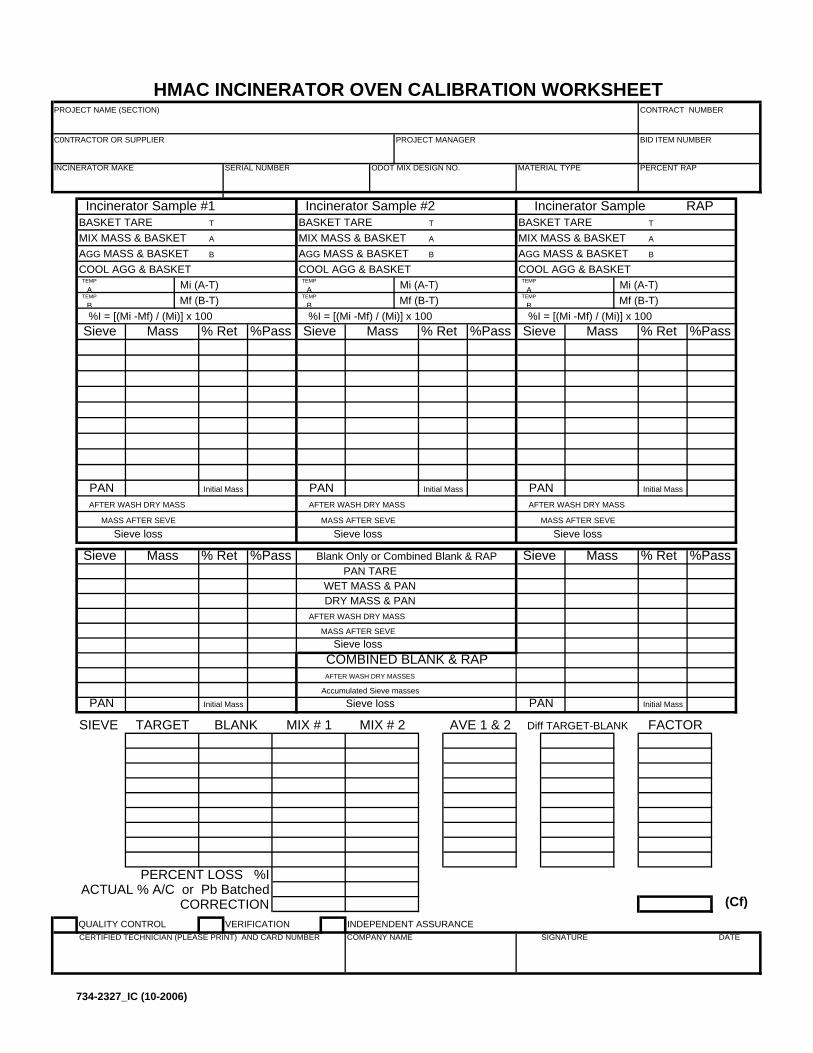
BASKET TARE T BASKET TARE T BASKET TARE T
A A A
B B B
TEMP
ATEMP
ATEMP
ATEMP
BTEMP
BTEMP
B
% Ret %Pass % Ret %Pass % Ret %Pass
% Ret %Pass % Ret %Pass
SIEVE
PERCENT LOSS %IACTUAL % A/C or Pb Batched
CORRECTIONQUALITY CONTROL VERIFICATION INDEPENDENT ASSURANCE
0PAN Initial Mass
0.00.00.00.00.00.00.0
Sieve Mass0.0
PAN Initial Mass
00.00.00.00.00.00.00.0
Sieve Mass0.0
MASS AFTER SEVE 0AFTER WASH DRY MASS
Sieve loss
%I = [(Mi -Mf) / (Mi)] x 100
Mi (A-T)Mf (B-T)
AGG MASS & BASKETCOOL AGG & BASKET
Incinerator Sample RAP
MIX MASS & BASKET
PAN Initial Mass
00.00.0
0.0
0.0
MASS AFTER SEVE
Sieve Mass0.0
Incinerator Sample #2
MIX MASS & BASKET
COOL AGG & BASKET
AFTER WASH DRY MASS
AGG MASS & BASKET AGG MASS & BASKET
0.0
0.0
0.0
MASS AFTER SEVE
PAN Initial Mass
Mi (A-T)Mf (B-T)
Sieve loss
COOL AGG & BASKET
Blank Only or Combined Blank & RAPPAN TARE
Sieve Mass0.0
0.0WET MASS & PANDRY MASS & PAN
INCINERATOR MAKE
0.0
Sieve loss
Incinerator Sample #1
MIX MASS & BASKET
0.00.0
SERIAL NUMBER PERCENT RAPODOT MIX DESIGN NO. MATERIAL TYPE
#VALUE!
#VALUE!
0.00
0.0TARGET BLANK MIX # 1
0.0
HMAC INCINERATOR OVEN CALIBRATION WORKSHEETPROJECT NAME (SECTION)
PROJECT MANAGERC0NTRACTOR OR SUPPLIER
CONTRACT NUMBER
BID ITEM NUMBER
0.0
%I = [(Mi -Mf) / (Mi)] x 100Sieve Mass
%I = [(Mi -Mf) / (Mi)] x 100
AFTER WASH DRY MASS
0.00
0.0
0.00.00.0
0.00.0
SIGNATURE DATECERTIFIED TECHNICIAN (PLEASE PRINT) AND CARD NUMBER COMPANY NAME
0
(Cf)
PAN Initial Mass
Mi (A-T)Mf (B-T)
AFTER WASH DRY MASSES
AFTER WASH DRY MASS
MASS AFTER SEVE
Sieve lossCOMBINED BLANK & RAP
Sieve loss
MIX # 2 AVE 1 & 2
Accumulated Sieve masses 0
Diff TARGET-BLANK
0.00.00.0
0.0
FACTOR
0.0
0.00.00.0
734-2327_IC (10-2006)
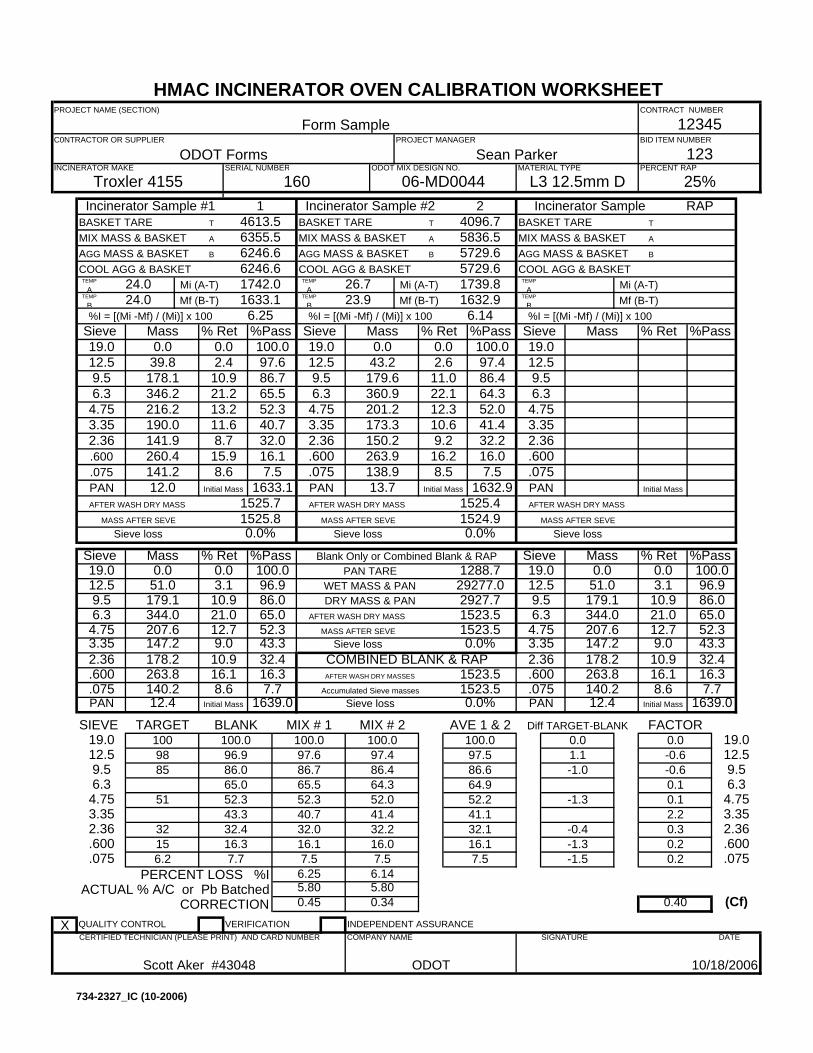
BASKET TARE T BASKET TARE T BASKET TARE T
A A A
B B B
TEMP
ATEMP
ATEMP
ATEMP
BTEMP
BTEMP
B
% Ret %Pass % Ret %Pass % Ret %Pass
% Ret %Pass % Ret %Pass
SIEVE
PERCENT LOSS %IACTUAL % A/C or Pb Batched
CORRECTIONX QUALITY CONTROL VERIFICATION INDEPENDENT ASSURANCE
.600
19.012.59.5
Diff TARGET-BLANK
4.753.352.36
6.3
FACTOR0.0 0.01.1-1.0
1523.5
MIX # 2 AVE 1 & 2
1523.50.0%
1523.5
0.0%Accumulated Sieve masses 1523.5
Mi (A-T)Mf (B-T)
100.097.4
AFTER WASH DRY MASSES
AFTER WASH DRY MASS
MASS AFTER SEVE
Sieve lossCOMBINED BLANK & RAP
Sieve loss140.2 8.6 7.7
86.0
PAN 12.4 Initial Mass 1639.0
4.753.35
SIGNATURE DATE
Scott Aker #43048 ODOT 10/18/2006
CERTIFIED TECHNICIAN (PLEASE PRINT) AND CARD NUMBER COMPANY NAME
.075
(Cf)
.075
2.36
97.586.664.9
12.59.56.3
96.9100.0
.600 263.8 16.1 16.3
1632.96.14
0.0%
1525.4
6.2523.9
%I = [(Mi -Mf) / (Mi)] x 100
AFTER WASH DRY MASS
7.5
2.6
12345
2.36 178.2 10.9 32.4
29277.02927.7
%I = [(Mi -Mf) / (Mi)] x 100Sieve Mass
HMAC INCINERATOR OVEN CALIBRATION WORKSHEETPROJECT NAME (SECTION)
PROJECT MANAGER
Sean ParkerODOT FormsC0NTRACTOR OR SUPPLIER
123
Form SampleCONTRACT NUMBER
BID ITEM NUMBER
3.35 147.2 9.0 43.3
65.0
TARGET BLANK MIX # 1100.097.686.765.5
100.0
86.0
.600
.075
1009885
51
32
19.0
86.464.3
52.340.7
32.4
52.241.132.132.0
52.041.432.2
52.343.3
6.216.37.7
16.17.5
157.5
16.17.5
-1.3-1.5
16.0
0.40
6.255.800.45
6.145.800.34
-0.4
-1.3
0.1-0.6-0.6
0.12.20.30.20.2
SERIAL NUMBER
160PERCENT RAP
25%ODOT MIX DESIGN NO.
06-MD0044MATERIAL TYPE
L3 12.5mm D
4.75 207.6 12.7 52.36.3 344.0 21.0 65.0
Troxler 4155INCINERATOR MAKE
12.5 51.0 3.1
Sieve loss
Incinerator Sample #1 14613.5
MIX MASS & BASKET
9.5 179.1 10.9
1288.7100.096.9 WET MASS & PAN
DRY MASS & PAN
Blank Only or Combined Blank & RAPPAN TARE
Sieve Mass19.0 0.0
Sieve loss
0.0
6246.6COOL AGG & BASKET 6246.6
12.5 39.8 2.4 97.69.5
6355.5
19.0 0.0 0.0 100.0
Mi (A-T)Mf (B-T)
178.1 10.9 86.76.3 346.2 21.2 65.54.75 216.2 13.2 52.33.35 190.0 11.6 40.72.36 141.9 8.7 32.0.600 260.4 15.9 16.1
MASS AFTER SEVE
1525.71525.8
PAN 12.0 Initial Mass 1633.1.075 141.2 8.6
AGG MASS & BASKET
12.5 43.2
6.3 360.9
3.35 173.3
5729.6COOL AGG & BASKET
AFTER WASH DRY MASS
24.0 1742.024.0 1633.1
AGG MASS & BASKET5729.6
26.7
Incinerator Sample #2 24096.7
MIX MASS & BASKET 5836.5
1739.8
MASS AFTER SEVE 1524.90.0%
Sieve Mass19.0 0.0 0.0 100.0
97.49.5 179.6 11.0 86.4
22.1 64.34.75 201.2 12.3 52.0
10.6 41.42.36 150.2 9.2 32.2.600 263.9 16.2 16.0.075 138.9 8.5 7.5PAN 13.7 Initial Mass 1632.9
Incinerator Sample RAP
MIX MASS & BASKETAGG MASS & BASKETCOOL AGG & BASKET
%I = [(Mi -Mf) / (Mi)] x 100
Mi (A-T)Mf (B-T)
MASS AFTER SEVE 0AFTER WASH DRY MASS
Sieve loss
Sieve Mass19.012.59.56.34.753.352.36.600.075PAN Initial Mass
Sieve Mass19.0 0.0 0.0 100.012.5 51.0 3.1 96.9
10.9 86.06.3 344.0 21.0 65.09.5 179.1
12.7 52.33.35 147.2 9.0 43.34.75 207.6
2.36 178.2 10.9 32.4.600 263.8 16.1 16.3
1639.0.075 140.2 8.6 7.7PAN 12.4 Initial Mass
734-2327_IC (10-2006)
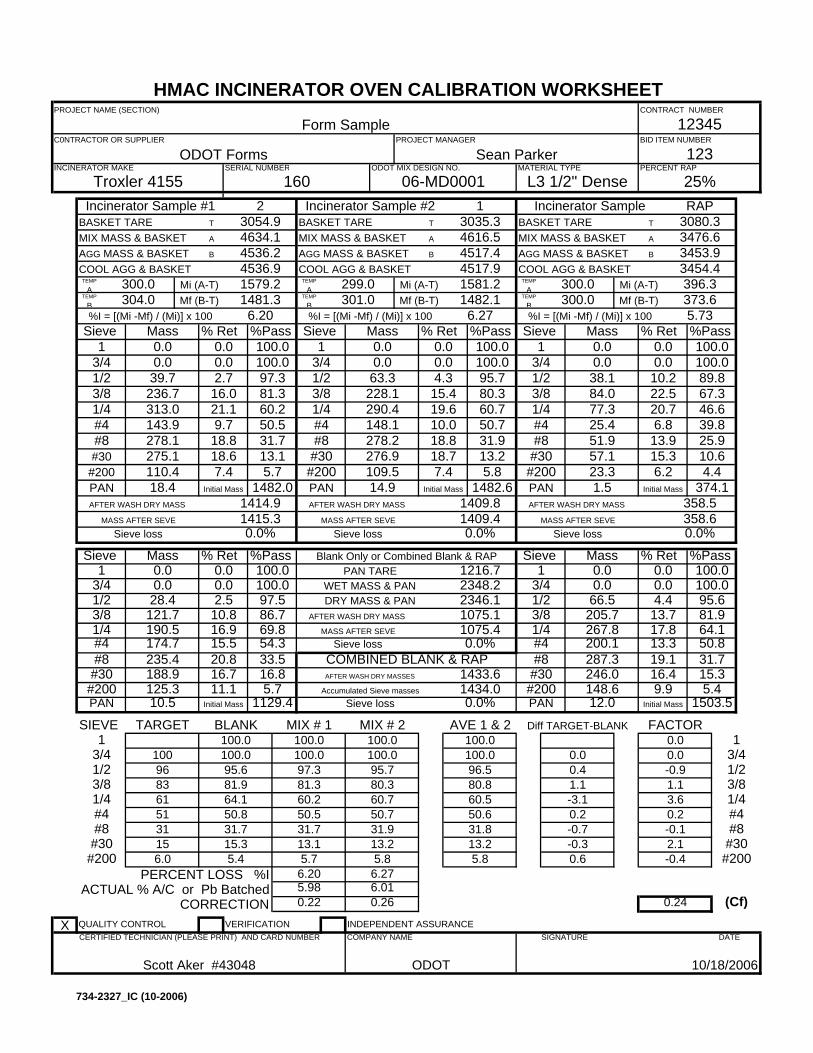
BASKET TARE T BASKET TARE T BASKET TARE T
A A A
B B B
TEMP
ATEMP
ATEMP
ATEMP
BTEMP
BTEMP
B
% Ret %Pass % Ret %Pass % Ret %Pass
% Ret %Pass % Ret %Pass
SIEVE
PERCENT LOSS %IACTUAL % A/C or Pb Batched
CORRECTIONX QUALITY CONTROL VERIFICATION INDEPENDENT ASSURANCE
1503.5#200 148.6 9.9 5.4PAN 12.0 Initial Mass
#30 246.0 16.4 15.3#8 287.3 19.1 31.7
17.8 64.1#4 200.1 13.3 50.81/4 267.8
4.4 95.63/8 205.7 13.7 81.91/2 66.5
0.0 100.03/4 0.0 0.0 100.0
Sieve Mass1 0.0
PAN 1.5 Initial Mass 374.1#200 23.3 6.2 4.4#30 57.1 15.3 10.6#8 51.9 13.9 25.9#4 25.4 6.8 39.81/4 77.3 20.7 46.63/8 84.0 22.5 67.31/2 38.1 10.2 89.8
0.0 100.03/4 0.0 0.0 100.0
Sieve Mass1 0.0
MASS AFTER SEVE
358.5358.60.0%
AFTER WASH DRY MASS
Sieve loss
396.3373.6
%I = [(Mi -Mf) / (Mi)] x 100 5.73
300.0300.0
Mi (A-T)Mf (B-T)
AGG MASS & BASKET 3453.9COOL AGG & BASKET 3454.4
Incinerator Sample RAP3080.3
MIX MASS & BASKET 3476.6
PAN 14.9 Initial Mass 1482.6#200 109.5 7.4 5.8#30 276.9 18.7 13.2
10.0 50.7#8 278.2 18.8 31.9
15.4 80.31/4 290.4 19.6 60.7
100.01/2 63.3 4.3 95.7
1581.2
MASS AFTER SEVE 1409.40.0%
Sieve Mass1 0.0 0.0 100.0
Incinerator Sample #2 13035.3
MIX MASS & BASKET 4616.54517.4
COOL AGG & BASKET
AFTER WASH DRY MASS
300.0 1579.2304.0 1481.3
AGG MASS & BASKET4517.9
299.0
#200 110.4 7.4
AGG MASS & BASKET
3/4 0.0
3/8 228.1
#4 148.1
MASS AFTER SEVE
1414.91415.3
PAN 18.4 Initial Mass 1482.0
#30 275.1 18.6 13.1#8 278.1 18.8 31.7#4 143.9 9.7 50.51/4 313.0 21.1 60.2
39.7 2.7 97.33/8 236.7 16.0 81.3
4634.1
1 0.0 0.0 100.0
Mi (A-T)Mf (B-T)
Sieve loss
0.0
4536.2COOL AGG & BASKET 4536.9
3/4 0.0 0.0 100.01/2
Blank Only or Combined Blank & RAPPAN TARE
Sieve Mass1 0.0
1/2 28.4 2.5
1216.7100.0100.0 WET MASS & PAN
DRY MASS & PAN
Troxler 4155INCINERATOR MAKE
3/4 0.0 0.0
Sieve loss
Incinerator Sample #1 23054.9
MIX MASS & BASKET
3/8 121.7 10.8 86.71/4 190.5 16.9 69.8
SERIAL NUMBER
160PERCENT RAP
25%ODOT MIX DESIGN NO.
06-MD0001MATERIAL TYPE
L3 1/2" Dense
1.1-0.90.0
3.60.2-0.12.1-0.4
1.1
-0.7
-3.10.2
0.24
6.205.980.22
6.276.010.26
5.813.25.8
-0.30.6
13.26.0
15.35.4
13.15.7
1531.7
60.550.631.831.7
60.750.731.9
64.150.8
95.780.3
60.250.5
#30#200
1009683615131
1
81.9
TARGET BLANK MIX # 1100.0100.097.381.3
100.0
95.6
#4 174.7 15.5 54.3
HMAC INCINERATOR OVEN CALIBRATION WORKSHEETPROJECT NAME (SECTION)
PROJECT MANAGER
Sean ParkerODOT FormsC0NTRACTOR OR SUPPLIER
123
Form SampleCONTRACT NUMBER
BID ITEM NUMBER12345
#8 235.4 20.8 33.5
2348.22346.1
%I = [(Mi -Mf) / (Mi)] x 100Sieve Mass
1482.16.27
0.0%
1409.8
6.20301.0
%I = [(Mi -Mf) / (Mi)] x 100
AFTER WASH DRY MASS
5.7
0.0
#30 188.9 16.7 16.8#200
#8
100.096.580.8
3/41/23/8
100.0100.0
1/4#4
SIGNATURE DATE
Scott Aker #43048 ODOT 10/18/2006
CERTIFIED TECHNICIAN (PLEASE PRINT) AND CARD NUMBER COMPANY NAME
#200
(Cf)
PAN 10.5 Initial Mass 1129.4125.3 11.1 5.7
97.5
Mi (A-T)Mf (B-T)
100.0100.0
AFTER WASH DRY MASSES
AFTER WASH DRY MASS
MASS AFTER SEVE
Sieve lossCOMBINED BLANK & RAP
Sieve loss
1075.1
MIX # 2 AVE 1 & 2
1075.40.0%
1433.6
0.0%Accumulated Sieve masses 1434.0
Diff TARGET-BLANK
1/4#4#8
3/8
FACTOR 0.0
0.00.4
#30
13/41/2
734-2327_IC (10-2006)
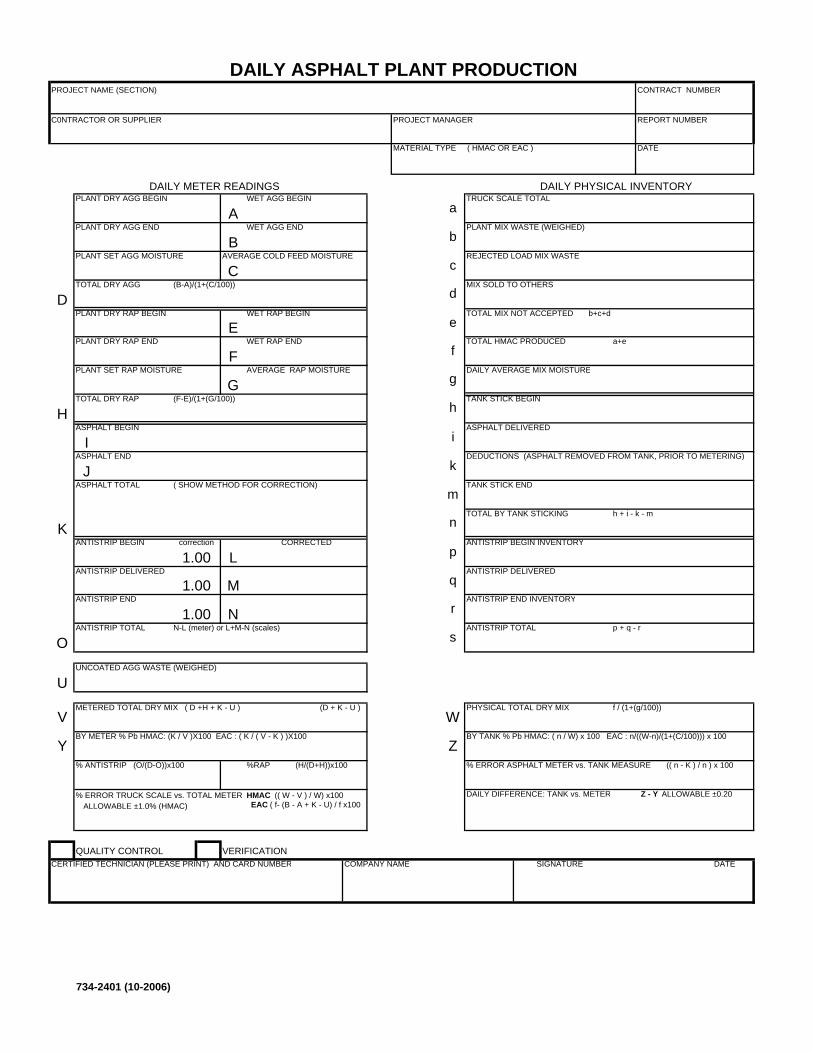
DAILY METER READINGS DAILY PHYSICAL INVENTORYPLANT DRY AGG BEGIN WET AGG BEGIN TRUCK SCALE TOTAL
PLANT DRY AGG END WET AGG END PLANT MIX WASTE (WEIGHED)
PLANT SET AGG MOISTURE AVERAGE COLD FEED MOISTURE REJECTED LOAD MIX WASTE
CTOTAL DRY AGG (B-A)/(1+(C/100)) MIX SOLD TO OTHERS
PLANT DRY RAP BEGIN WET RAP BEGIN TOTAL MIX NOT ACCEPTED b+c+d
PLANT DRY RAP END WET RAP END TOTAL HMAC PRODUCED a+e
PLANT SET RAP MOISTURE AVERAGE RAP MOISTURE DAILY AVERAGE MIX MOISTURE
TOTAL DRY RAP (F-E)/(1+(G/100)) TANK STICK BEGIN
ASPHALT BEGIN ASPHALT DELIVERED
IASPHALT END DEDUCTIONS (ASPHALT REMOVED FROM TANK, PRIOR TO METERING)
JASPHALT TOTAL ( SHOW METHOD FOR CORRECTION) TANK STICK END
TOTAL BY TANK STICKING h + i - k - m
ANTISTRIP BEGIN ANTISTRIP BEGIN INVENTORY
LANTISTRIP DELIVERED ANTISTRIP DELIVERED
MANTISTRIP END ANTISTRIP END INVENTORY
NANTISTRIP TOTAL N-L (meter) or L+M-N (scales) ANTISTRIP TOTAL p + q - r
UNCOATED AGG WASTE (WEIGHED)
METERED TOTAL DRY MIX ( D +H + K - U ) (D + K - U ) PHYSICAL TOTAL DRY MIX f / (1+(g/100))
BY METER % Pb HMAC: (K / V )X100 EAC : ( K / ( V - K ) )X100 BY TANK % Pb HMAC: ( n / W) x 100 EAC : n/((W-n)/(1+(C/100))) x 100
% ANTISTRIP (O/(D-O))x100 %RAP (H/(D+H))x100 % ERROR ASPHALT METER vs. TANK MEASURE (( n - K ) / n ) x 100
% ERROR TRUCK SCALE vs. TOTAL METER HMAC (( W - V ) / W) x100 DAILY DIFFERENCE: TANK vs. METER Z - Y ALLOWABLE ±0.20 EAC ( f- (B - A + K - U) / f x100
QUALITY CONTROL VERIFICATION
W
Z
ALLOWABLE ±1.0% (HMAC)
K
O
U
V
Y
D
E
F
H
G
0.00
1.00
1.00
b
c
d
f
g
h
i
aA
0.00B
k
m
n
0.00
e
correction
0.000
0.000
0.000CORRECTED
1.00
p
q
r
0.000
0.00
s
0.00
0.00
CERTIFIED TECHNICIAN (PLEASE PRINT) AND CARD NUMBER SIGNATURE DATECOMPANY NAME
REPORT NUMBERPROJECT MANAGERC0NTRACTOR OR SUPPLIER
CONTRACT NUMBER
DAILY ASPHALT PLANT PRODUCTIONPROJECT NAME (SECTION)
DATEMATERIAL TYPE ( HMAC OR EAC )
0.00
0.00
734-2401 (10-2006)
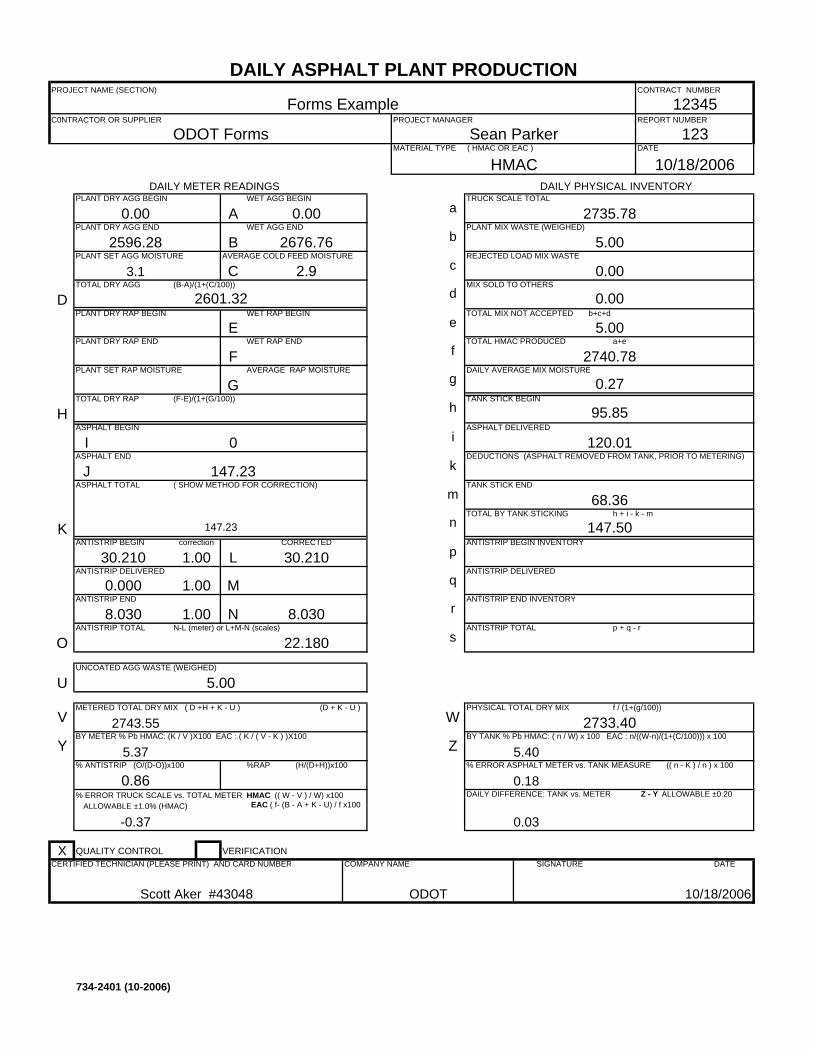
DAILY METER READINGS DAILY PHYSICAL INVENTORYPLANT DRY AGG BEGIN WET AGG BEGIN TRUCK SCALE TOTAL
PLANT DRY AGG END WET AGG END PLANT MIX WASTE (WEIGHED)
PLANT SET AGG MOISTURE AVERAGE COLD FEED MOISTURE REJECTED LOAD MIX WASTE
CTOTAL DRY AGG (B-A)/(1+(C/100)) MIX SOLD TO OTHERS
PLANT DRY RAP BEGIN WET RAP BEGIN TOTAL MIX NOT ACCEPTED b+c+d
PLANT DRY RAP END WET RAP END TOTAL HMAC PRODUCED a+e
PLANT SET RAP MOISTURE AVERAGE RAP MOISTURE DAILY AVERAGE MIX MOISTURE
TOTAL DRY RAP (F-E)/(1+(G/100)) TANK STICK BEGIN
ASPHALT BEGIN ASPHALT DELIVERED
IASPHALT END DEDUCTIONS (ASPHALT REMOVED FROM TANK, PRIOR TO METERING)
JASPHALT TOTAL ( SHOW METHOD FOR CORRECTION) TANK STICK END
TOTAL BY TANK STICKING h + i - k - m
ANTISTRIP BEGIN ANTISTRIP BEGIN INVENTORY
LANTISTRIP DELIVERED ANTISTRIP DELIVERED
MANTISTRIP END ANTISTRIP END INVENTORY
NANTISTRIP TOTAL N-L (meter) or L+M-N (scales) ANTISTRIP TOTAL p + q - r
UNCOATED AGG WASTE (WEIGHED)
METERED TOTAL DRY MIX ( D +H + K - U ) (D + K - U ) PHYSICAL TOTAL DRY MIX f / (1+(g/100))
BY METER % Pb HMAC: (K / V )X100 EAC : ( K / ( V - K ) )X100 BY TANK % Pb HMAC: ( n / W) x 100 EAC : n/((W-n)/(1+(C/100))) x 100
% ANTISTRIP (O/(D-O))x100 %RAP (H/(D+H))x100 % ERROR ASPHALT METER vs. TANK MEASURE (( n - K ) / n ) x 100
% ERROR TRUCK SCALE vs. TOTAL METER HMAC (( W - V ) / W) x100 DAILY DIFFERENCE: TANK vs. METER Z - Y ALLOWABLE ±0.20 EAC ( f- (B - A + K - U) / f x100
X QUALITY CONTROL VERIFICATION
2735.78
5.00
0.00
2740.78
0.00
5.00
DATE
10/18/2006MATERIAL TYPE ( HMAC OR EAC )
HMAC
Forms ExampleCONTRACT NUMBER
DAILY ASPHALT PLANT PRODUCTIONPROJECT NAME (SECTION)
123
12345
ODOT
COMPANY NAME
REPORT NUMBER
5.00
PROJECT MANAGER
Sean ParkerODOT FormsC0NTRACTOR OR SUPPLIER
Scott Aker #43048
CERTIFIED TECHNICIAN (PLEASE PRINT) AND CARD NUMBER SIGNATURE DATE
10/18/2006
147.50
0.27
0.00
95.85
120.01
68.36
0.000
2733.40
s
30.210CORRECTED
1.00
0.18
5.40
p
q
r
e
correction
-0.37
0.86
5.37
2743.55
8.030
22.180
k
m
n
0.00
a0.00 A
2676.76
2.9
2596.28
3.1
B
0.03
0.00
c
d
f
g
h
i0
147.23
30.210 1.00
0.000 1.00
8.030
b
D
E
F
H
2601.32
G
0.00
ALLOWABLE ±1.0% (HMAC)
K
O
U
V
Y
147.23
W
Z
734-2401 (10-2006)
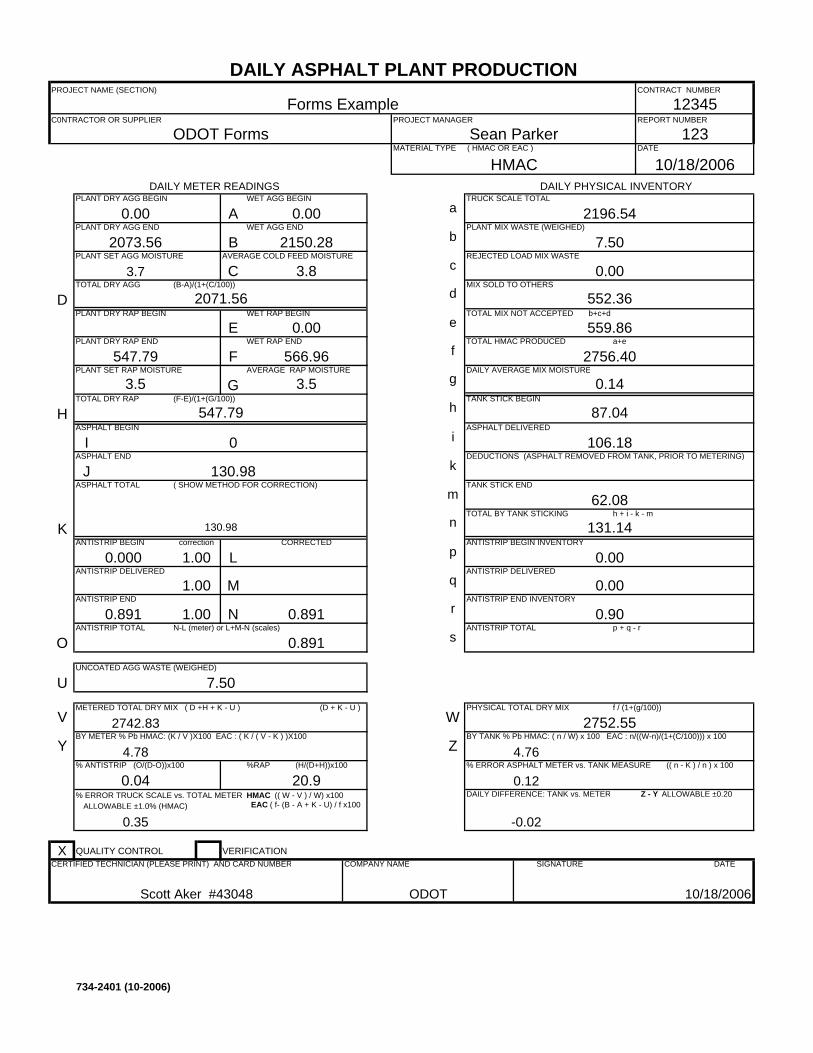
DAILY METER READINGS DAILY PHYSICAL INVENTORYPLANT DRY AGG BEGIN WET AGG BEGIN TRUCK SCALE TOTAL
PLANT DRY AGG END WET AGG END PLANT MIX WASTE (WEIGHED)
PLANT SET AGG MOISTURE AVERAGE COLD FEED MOISTURE REJECTED LOAD MIX WASTE
CTOTAL DRY AGG (B-A)/(1+(C/100)) MIX SOLD TO OTHERS
PLANT DRY RAP BEGIN WET RAP BEGIN TOTAL MIX NOT ACCEPTED b+c+d
PLANT DRY RAP END WET RAP END TOTAL HMAC PRODUCED a+e
PLANT SET RAP MOISTURE AVERAGE RAP MOISTURE DAILY AVERAGE MIX MOISTURE
TOTAL DRY RAP (F-E)/(1+(G/100)) TANK STICK BEGIN
ASPHALT BEGIN ASPHALT DELIVERED
IASPHALT END DEDUCTIONS (ASPHALT REMOVED FROM TANK, PRIOR TO METERING)
JASPHALT TOTAL ( SHOW METHOD FOR CORRECTION) TANK STICK END
TOTAL BY TANK STICKING h + i - k - m
ANTISTRIP BEGIN ANTISTRIP BEGIN INVENTORY
LANTISTRIP DELIVERED ANTISTRIP DELIVERED
MANTISTRIP END ANTISTRIP END INVENTORY
NANTISTRIP TOTAL N-L (meter) or L+M-N (scales) ANTISTRIP TOTAL p + q - r
UNCOATED AGG WASTE (WEIGHED)
METERED TOTAL DRY MIX ( D +H + K - U ) (D + K - U ) PHYSICAL TOTAL DRY MIX f / (1+(g/100))
BY METER % Pb HMAC: (K / V )X100 EAC : ( K / ( V - K ) )X100 BY TANK % Pb HMAC: ( n / W) x 100 EAC : n/((W-n)/(1+(C/100))) x 100
% ANTISTRIP (O/(D-O))x100 %RAP (H/(D+H))x100 % ERROR ASPHALT METER vs. TANK MEASURE (( n - K ) / n ) x 100
% ERROR TRUCK SCALE vs. TOTAL METER HMAC (( W - V ) / W) x100 DAILY DIFFERENCE: TANK vs. METER Z - Y ALLOWABLE ±0.20 EAC ( f- (B - A + K - U) / f x100
X QUALITY CONTROL VERIFICATION
W
Z
ALLOWABLE ±1.0% (HMAC)
K
O
U
V
Y
130.98
D
E
F
H
3.5
2071.56
G
566.96
3.5
0
130.98
0.000 1.00
1.00
0.891
b
-0.02
0.00
0.00
c
d
f
g
h
i
a0.00
547.79
A
2150.28
3.8
2073.56
3.7
B
k
m
n
547.79
e
correction
0.35
0.04
4.78
2742.83
0.891
0.891
0.000CORRECTED
1.00
0.12
4.76
p
q
r
0.000
0.00
0.90
20.9
2752.55
s
131.14
0.14
-0.90
0.00
87.04
106.18
62.08
Scott Aker #43048
CERTIFIED TECHNICIAN (PLEASE PRINT) AND CARD NUMBER SIGNATURE DATE
10/18/2006
123
12345
ODOT
COMPANY NAME
REPORT NUMBER
7.50
PROJECT MANAGER
Sean ParkerODOT FormsC0NTRACTOR OR SUPPLIER
Forms ExampleCONTRACT NUMBER
DAILY ASPHALT PLANT PRODUCTIONPROJECT NAME (SECTION)
DATE
10/18/2006MATERIAL TYPE ( HMAC OR EAC )
HMAC
2196.54
7.50
0.00
2756.40
552.36
559.86
734-2401 (10-2006)
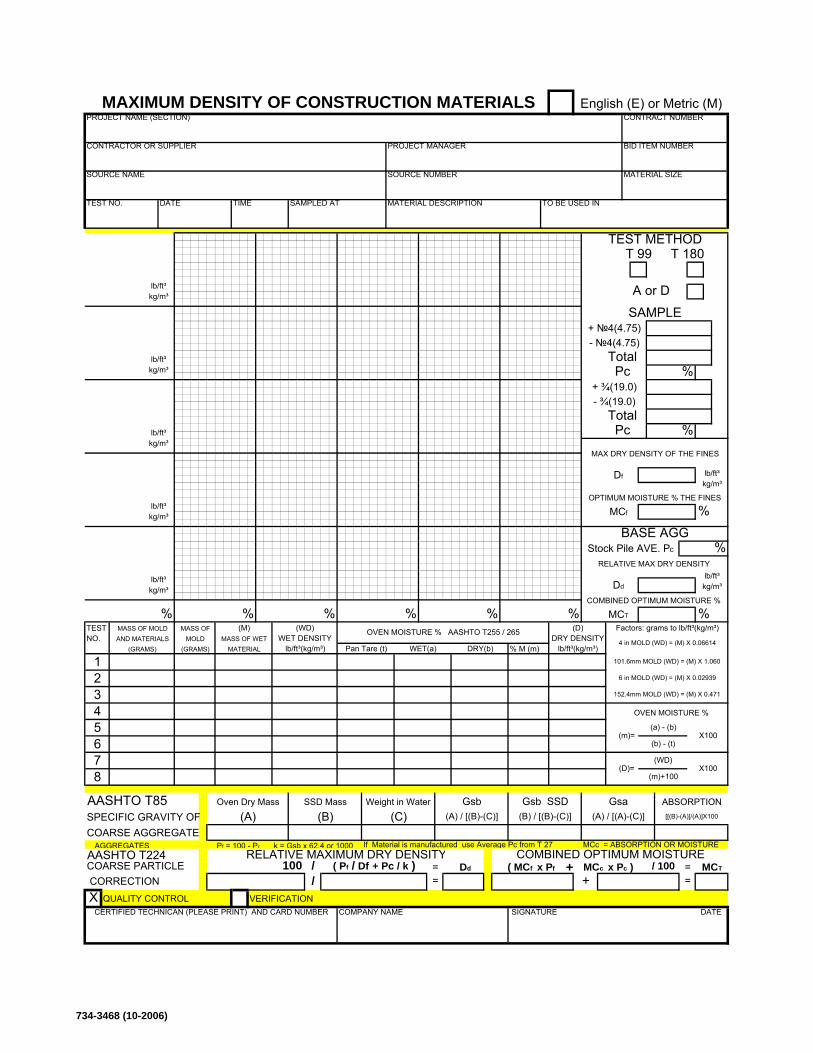
TESTNO.
% M (m)
AASHTO T85SPECIFIC GRAVITY OFCOARSE AGGREGATE
AGGREGATES Pf = 100 - Pc k = Gsb x 62.4 or 1000 If Material is manufactured use Average Pc from T 27 MCc = ABSORPTION OR MOISTUREAASHTO T224COARSE PARTICLE CORRECTION
QUALITY CONTROL VERIFICATION
T 99
A or D
+
BASE AGG
%
TEST METHOD
COMBINED OPTIMUM MOISTURE
SAMPLE
MASS OFMOLD
CONTRACT NUMBER
2
AND MATERIALS
%
%
lb/ft³ kg/m³
% COMBINED OPTIMUM MOISTURE %
MCT
OPTIMUM MOISTURE % THE FINES
T 180
PROJECT NAME (SECTION)
CONTRACTOR OR SUPPLIER
SOURCE NUMBERSOURCE NAME
MATERIAL DESCRIPTION
PROJECT MANAGER
TO BE USED IN
BID ITEM NUMBER
MATERIAL SIZE
(M)
WET DENSITY
% %(WD)
MASS OF WETMATERIAL lb/ft³(kg/m³)
(GRAMS)
3
MASS OF MOLD
1(GRAMS)
%
8
4567
Pan Tare (t) WET(a) DRY(b)
+ MCc x Pc )( MCf x Pf
SIGNATURE DATECOMPANY NAMECERTIFIED TECHNICAN (PLEASE PRINT) AND CARD NUMBER
100 / /
X
ABSORPTION
(A) (B)
Oven Dry Mass
(C)
=( Pf / Df + Pc / k )
Weight in WaterSSD Mass Gsb(A) / [(B)-(C)]
RELATIVE MAXIMUM DRY DENSITYDd=
(B) / [(B)-(C)] (A) / [(A)-(C)]Gsb SSD
Gsa
(WD)(D)= X100
(m)+100
=
[[(B)-(A)]/(A)]X100
/ 100=
MCT
lb/ft³(kg/m³)DRY DENSITY
%(D) Factors: grams to lb/ft³(kg/m³)
4 in MOLD (WD) = (M) X 0.06614
Total
%PcTotal
Pc
Df
MCf
%
lb/ft³ kg/m³
Stock Pile AVE. Pc
Dd
%OVEN MOISTURE % AASHTO T255 / 265
(m)=(b) - (t)
X100
OVEN MOISTURE %
(a) - (b)
101.6mm MOLD (WD) = (M) X 1.060
6 in MOLD (WD) = (M) X 0.02939
152.4mm MOLD (WD) = (M) X 0.471
English (E) or Metric (M)MAXIMUM DENSITY OF CONSTRUCTION MATERIALS
lb/ft³ kg/m³
TEST NO. DATE TIME SAMPLED AT
lb/ft³ kg/m³
lb/ft³ kg/m³
lb/ft³ kg/m³
+ №4(4.75)- №4(4.75)
+ ¾(19.0)- ¾(19.0)
RELATIVE MAX DRY DENSITY lb/ft³ kg/m³
MAX DRY DENSITY OF THE FINES
734-3468 (10-2006)
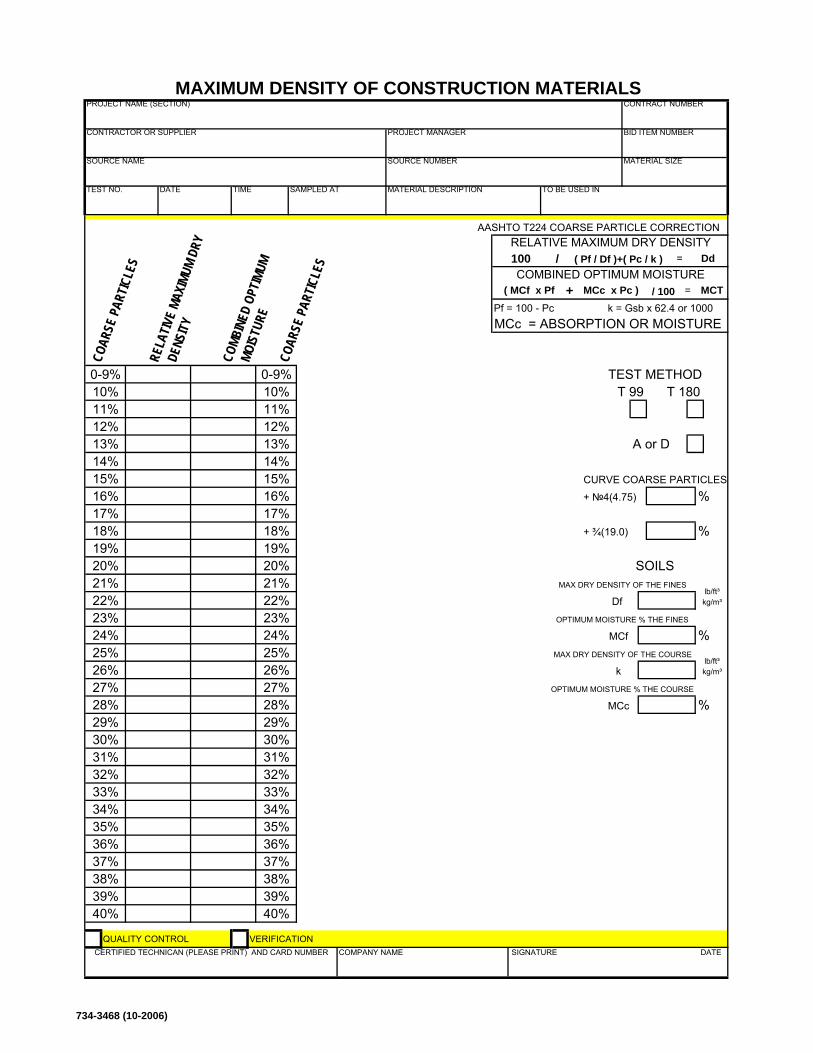
AASHTO T224 COARSE PARTICLE CORRECTION
Pf = 100 - Pc k = Gsb x 62.4 or 1000MCc = ABSORPTION OR MOISTURE
+ №4(4.75)
+ ¾(19.0)
QUALITY CONTROL VERIFICATIONCERTIFIED TECHNICAN (PLEASE PRINT) AND CARD NUMBER COMPANY NAME SIGNATURE DATE
40% 40%39% 39%38% 38%37% 37%36% 36%35% 35%34% 34%33% 33%32% 32%31% 31%30% 30%29% 29%
MCc %28% 28%27% 27%
k 26% 26%25% 25%24% 24% MCf 0.0 %23% 23%22% 22%21% 21%20% 20%19% 19%18% 18% %17% 17%16% 16% %15% 15% CURVE COARSE PARTICLES
14% 14%13% 13% 12% 12%11% 11% 10% 10% T 99 T 180
TEST METHOD0-9% 0-9%
COMBINED OPTIMUM MOISTURE( MCf x Pf + MCc x Pc ) / 100 = MCT
RELATIVE MAXIMUM DRY DENSITY100 / ( Pf / Df )+( Pc / k ) = Dd
TEST NO. DATE
TIME SAMPLED AT
SOURCE NAME SOURCE NUMBER
MATERIAL DESCRIPTION TO BE USED IN
MATERIAL SIZE
CONTRACTOR OR SUPPLIER PROJECT MANAGER BID ITEM NUMBER
MAXIMUM DENSITY OF CONSTRUCTION MATERIALSPROJECT NAME (SECTION) CONTRACT NUMBER
COAR
SE P
ARTIC
LES
RELA
TIVE
MAXI
MUM
DRY
DENS
ITY
COMB
INED
OPT
IMUM
MO
ISTU
RECO
ARSE
PAR
TICLE
S
OPTIMUM MOISTURE % THE COURSE
lb/ft³ kg/m³
A or D
lb/ft³ kg/m³
MAX DRY DENSITY OF THE FINES
OPTIMUM MOISTURE % THE FINES
MAX DRY DENSITY OF THE COURSE
SOILS
Df 0
734-3468 (10-2006)
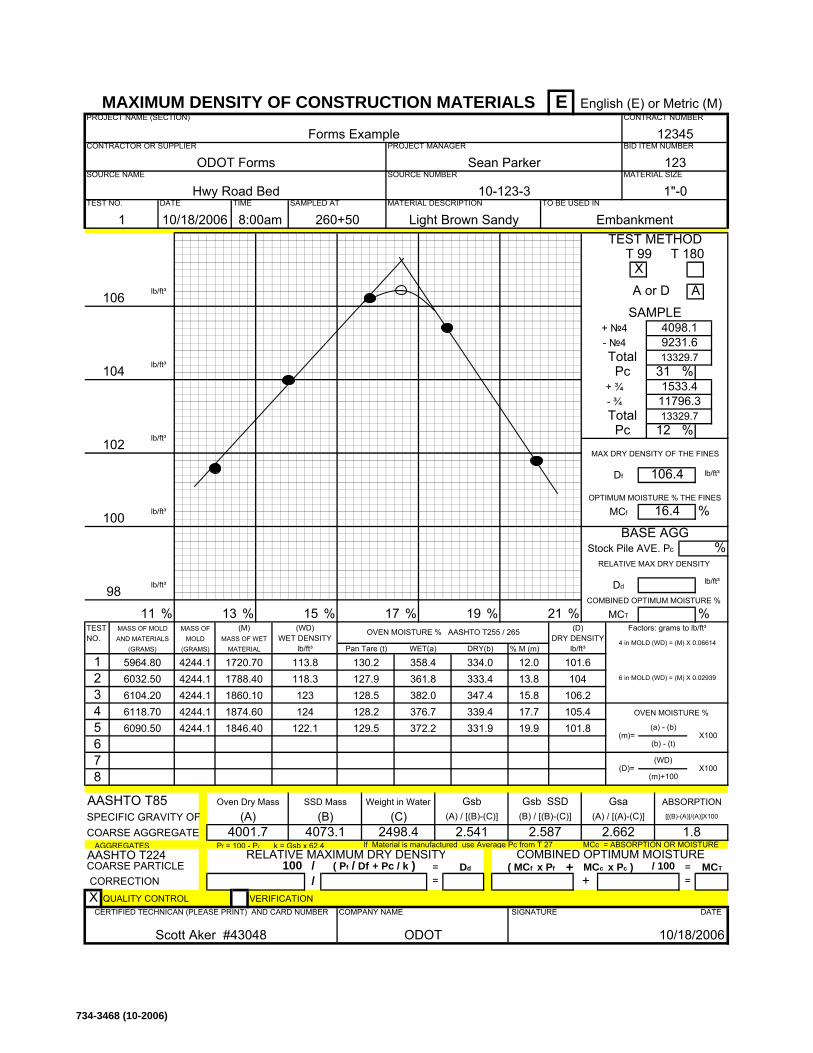
TESTNO.
% M (m)
AASHTO T85SPECIFIC GRAVITY OFCOARSE AGGREGATE
AGGREGATES Pf = 100 - Pc k = Gsb x 62.4 If Material is manufactured use Average Pc from T 27 MCc = ABSORPTION OR MOISTUREAASHTO T224COARSE PARTICLE CORRECTION
QUALITY CONTROL VERIFICATION
lb/ft³
lb/ft³
lb/ft³
+ №4- №4
+ ¾- ¾
RELATIVE MAX DRY DENSITY
lb/ft³
English (E) or Metric (M)MAXIMUM DENSITY OF CONSTRUCTION MATERIALS E
lb/ft³106
Hwy Road BedTEST NO. DATE TIME SAMPLED AT
6 in MOLD (WD) = (M) X 0.02939
(m)=(b) - (t)
X100
OVEN MOISTURE %
(a) - (b)
%OVEN MOISTURE % AASHTO T255 / 265
128.5 382.0 347.4 15.813.8
106.4
Stock Pile AVE. Pc
Dd
Df
MCf
%
lb/ft³
Total
%12PcTotal
11796.3
Pc
13329.7
DRY DENSITY
101.6
%(D) Factors: grams to lb/ft³
4 in MOLD (WD) = (M) X 0.06614
=
[[(B)-(A)]/(A)]X100
/ 100=
MCT
1.8
(WD)(D)= X100
(m)+100
=
(B) / [(B)-(C)] (A) / [(A)-(C)]Gsb SSD
2.587 2.662
Gsa
=( Pf / Df + Pc / k )
Weight in WaterSSD Mass Gsb(A) / [(B)-(C)]
RELATIVE MAXIMUM DRY DENSITYDd
ABSORPTION
2.541(A) (B)
Oven Dry Mass
4001.7 4073.1 2498.4(C)
100 / /
X
10/18/2006ODOTScott Aker #43048
SIGNATURE DATECOMPANY NAMECERTIFIED TECHNICAN (PLEASE PRINT) AND CARD NUMBER
+ MCc x Pc )( MCf x Pf
105.4
Pan Tare (t) WET(a) DRY(b)
127.9 361.8 333.4
101.8
lb/ft³
130.2 358.4 334.0 12.0
19.9128.2 376.7 339.4 17.7129.5
67
372.2 331.91846.40
11 %
8
5964.80
6090.5045
6118.70
102
3
104
MASS OF MOLD
1(GRAMS)
6104.20
100
98
MATERIAL lb/ft³
6032.50 1788.40
(GRAMS)
(M)
1720.70
15
WET DENSITY
13 %
4244.1
%(WD)
MASS OF WET
10-123-3MATERIAL DESCRIPTION
PROJECT MANAGERForms Example
TO BE USED IN
BID ITEM NUMBER
123MATERIAL SIZE
1"-0
ODOT Forms
PROJECT NAME (SECTION)
CONTRACTOR OR SUPPLIER
SOURCE NUMBERSean Parker
SOURCE NAME
1 10/18/2006 8:00am 260+50 EmbankmentLight Brown Sandy
17 % 19COMBINED OPTIMUM MOISTURE %
MCT
OPTIMUM MOISTURE % THE FINES
T 180
12345CONTRACT NUMBER
2 4244.1 104
AND MATERIALS
%
21 %
lb/ft³
1874.60
MASS OFMOLD
4244.1
4244.1
4244.11860.10
TEST METHOD
COMBINED OPTIMUM MOISTURE
113.8118.3123124
122.1
SAMPLE
T 99
AA or D
+
BASE AGG
X
%16.4
106.2
4098.19231.613329.7
1533.431
MAX DRY DENSITY OF THE FINES
734-3468 (10-2006)
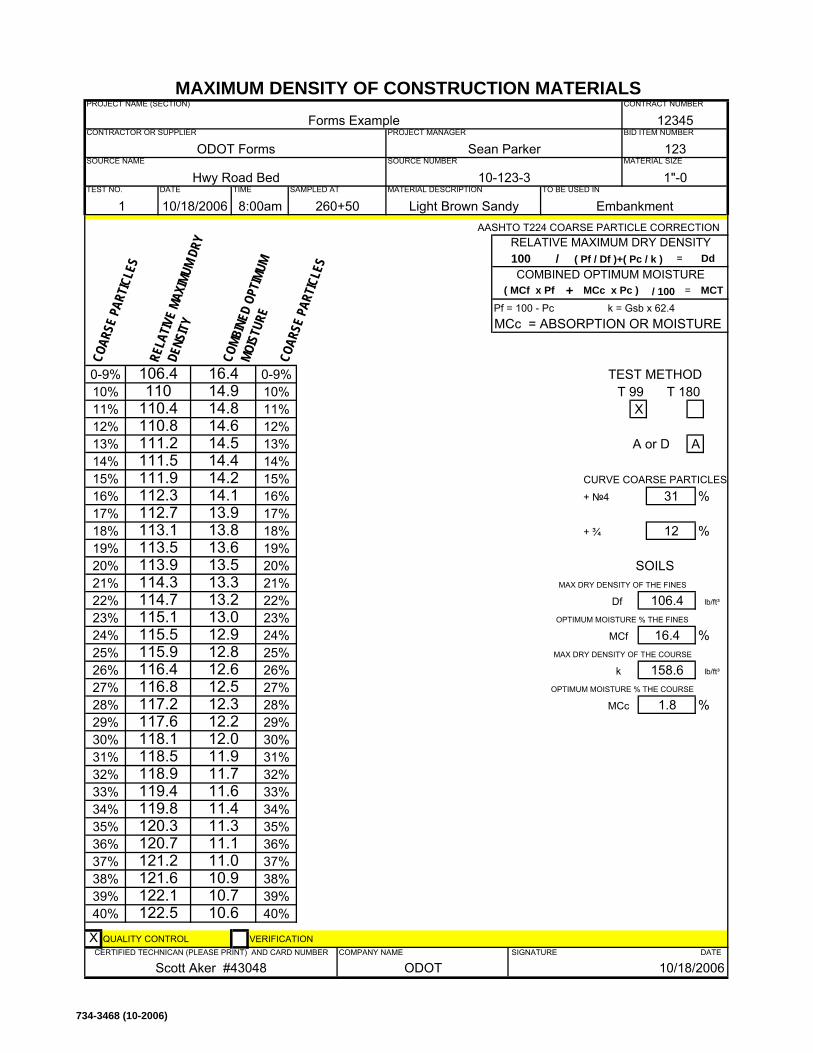
AASHTO T224 COARSE PARTICLE CORRECTION
Pf = 100 - Pc k = Gsb x 62.4MCc = ABSORPTION OR MOISTURE
+ №4
+ ¾
QUALITY CONTROL VERIFICATION
OPTIMUM MOISTURE % THE COURSE
lb/ft³
A or D
lb/ft³
MAX DRY DENSITY OF THE FINES
OPTIMUM MOISTURE % THE FINES
MAX DRY DENSITY OF THE COURSE
SOILS
Df 106.4
COAR
SE P
ARTIC
LES
RELA
TIVE
MAXI
MUM
DRY
DENS
ITY
COMB
INED
OPT
IMUM
MO
ISTU
RECO
ARSE
PAR
TICLE
S
MAXIMUM DENSITY OF CONSTRUCTION MATERIALSPROJECT NAME (SECTION) CONTRACT NUMBER
Forms Example 12345CONTRACTOR OR SUPPLIER PROJECT MANAGER BID ITEM NUMBER
ODOT Forms Sean Parker 123SOURCE NAME SOURCE NUMBER
MATERIAL DESCRIPTION TO BE USED IN
MATERIAL SIZE
Hwy Road Bed 10-123-3 1"-0
Light Brown Sandy EmbankmentTEST NO. DATE
1 10/18/2006 8:00am 260+50TIME SAMPLED AT
RELATIVE MAXIMUM DRY DENSITY100 / ( Pf / Df )+( Pc / k ) = DdCOMBINED OPTIMUM MOISTURE
( MCf x Pf + MCc x Pc ) / 100 = MCT
0-9% 106.4 16.4 0-9% TEST METHOD10% 110 14.9 10% T 99 T 18011% 110.4 14.8 11% X 012% 110.8 14.6 12%13% 111.2 14.5 13% A14% 111.5 14.4 14%15% 111.9 14.2 15% CURVE COARSE PARTICLES
16% 112.3 14.1 16% 31 %17% 112.7 13.9 17%18% 113.1 13.8 18% 12 %19% 113.5 13.6 19%20% 113.9 13.5 20%21% 114.3 13.3 21%22% 114.7 13.2 22%23% 115.1 13.0 23%24% 115.5 12.9 24% MCf 16.4 %25% 115.9 12.8 25%26% 116.4 12.6 26% k 158.627% 116.8 12.5 27%28% 117.2 12.3 28% MCc 1.8 %29% 117.6 12.2 29%30% 118.1 12.0 30%31% 118.5 11.9 31%32% 118.9 11.7 32%33% 119.4 11.6 33%34% 119.8 11.4 34%35% 120.3 11.3 35%36% 120.7 11.1 36%37% 121.2 11.0 37%38% 121.6 10.9 38%39% 122.1 10.7 39%40% 122.5 10.6 40%
X 0CERTIFIED TECHNICAN (PLEASE PRINT) AND CARD NUMBER COMPANY NAME SIGNATURE DATE
Scott Aker #43048 ODOT 10/18/2006
734-3468 (10-2006)
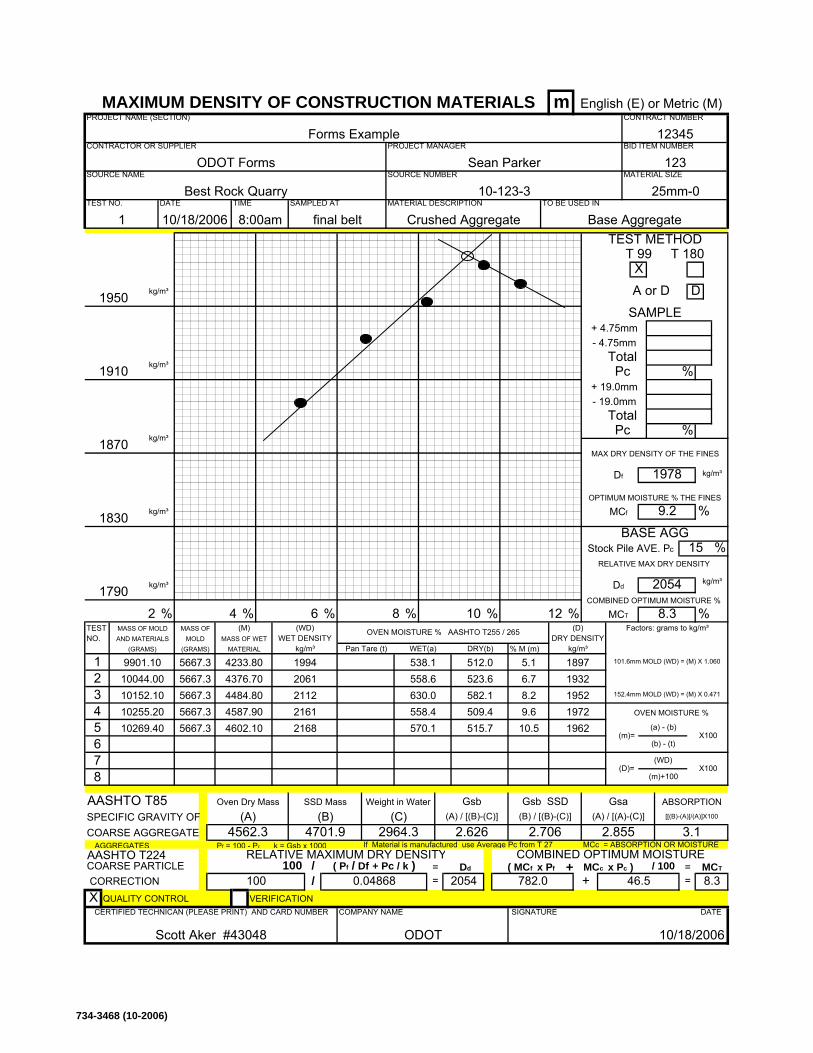
TESTNO.
% M (m)
AASHTO T85SPECIFIC GRAVITY OFCOARSE AGGREGATE
AGGREGATES Pf = 100 - Pc k = Gsb x 1000 If Material is manufactured use Average Pc from T 27 MCc = ABSORPTION OR MOISTUREAASHTO T224COARSE PARTICLE CORRECTION
QUALITY CONTROL VERIFICATION
T 99
DA or D
+
BASE AGG
X
%9.2
TEST METHOD
COMBINED OPTIMUM MOISTURE
19942061211221612168
SAMPLE
4587.90
MASS OFMOLD
5667.3
5667.3
5667.34484.80
12345CONTRACT NUMBER
2 5667.3 1932
AND MATERIALS
%
12 %
kg/m³
Base AggregateCrushed Aggregate
8 % 10
2054COMBINED OPTIMUM MOISTURE %
MCT
OPTIMUM MOISTURE % THE FINES
T 180
1 10/18/2006 8:00am final belt
PROJECT NAME (SECTION)
CONTRACTOR OR SUPPLIER
SOURCE NUMBERSean Parker
SOURCE NAME
10-123-3MATERIAL DESCRIPTION
PROJECT MANAGERForms Example
TO BE USED IN
BID ITEM NUMBER
123MATERIAL SIZE
25mm-0
ODOT Forms
(M)
4233.80
6
WET DENSITY
4 %
5667.3
%(WD)
MASS OF WETMATERIAL kg/m³
10044.00 4376.70
(GRAMS)
10255.20
1870
3
1910
MASS OF MOLD
1(GRAMS)
10152.10
1830
1790
2 %
8
9901.10
10269.404567
570.1 515.74602.10 10.5558.4 509.4 9.6
538.1 512.0 5.1
19521972
Pan Tare (t) WET(a) DRY(b)
558.6 523.6
1962
+ MCc x Pc )( MCf x Pf
2054 782.0
10/18/2006ODOTScott Aker #43048
SIGNATURE DATECOMPANY NAMECERTIFIED TECHNICAN (PLEASE PRINT) AND CARD NUMBER
100 / /
X
ABSORPTION
2.626(A) (B)
Oven Dry Mass
4562.3 4701.9 2964.3(C)
=0.04868( Pf / Df + Pc / k )
Weight in WaterSSD Mass Gsb(A) / [(B)-(C)]
RELATIVE MAXIMUM DRY DENSITYDd
100=
(B) / [(B)-(C)] (A) / [(A)-(C)]Gsb SSD
2.706 2.855
Gsa
(WD)(D)= X100
(m)+100
8.3=
[[(B)-(A)]/(A)]X100
/ 100=
MCT
46.5
3.1
kg/m³DRY DENSITY
1897
%(D) Factors: grams to kg/m³
Total
%PcTotal
Pc
Df
MCf
%
kg/m³
8.3
Stock Pile AVE. Pc 15
Dd
%OVEN MOISTURE % AASHTO T255 / 265
630.0 582.1 8.26.7
(m)=(b) - (t)
X100
OVEN MOISTURE %
(a) - (b)
101.6mm MOLD (WD) = (M) X 1.060
152.4mm MOLD (WD) = (M) X 0.471
English (E) or Metric (M)MAXIMUM DENSITY OF CONSTRUCTION MATERIALS m
kg/m³1950
Best Rock QuarryTEST NO. DATE TIME SAMPLED AT
kg/m³
kg/m³
kg/m³
+ 4.75mm- 4.75mm
+ 19.0mm- 19.0mm
RELATIVE MAX DRY DENSITY
kg/m³
1978
MAX DRY DENSITY OF THE FINES
734-3468 (10-2006)
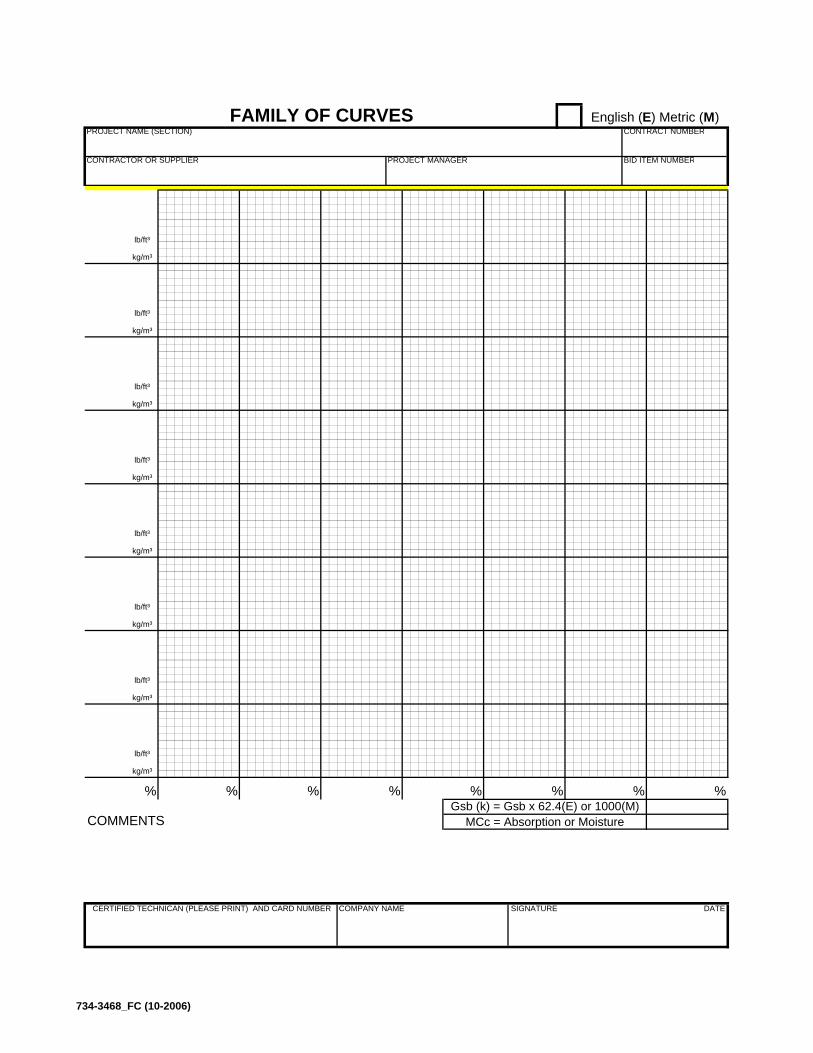
COMMENTS
% % %
%
% %%
%
lb/ft³
kg/m³
lb/ft³
kg/m³
CONTRACT NUMBER
BID ITEM NUMBER
PROJECT NAME (SECTION)
CONTRACTOR OR SUPPLIER PROJECT MANAGER
SIGNATURE DATECOMPANY NAMECERTIFIED TECHNICAN (PLEASE PRINT) AND CARD NUMBER
Gsb (k) = Gsb x 62.4(E) or 1000(M)MCc = Absorption or Moisture
English (E) Metric (M)
lb/ft³
kg/m³
lb/ft³
kg/m³
lb/ft³
kg/m³
FAMILY OF CURVES
lb/ft³
kg/m³
lb/ft³
kg/m³
lb/ft³
kg/m³
734-3468_FC (10-2006)
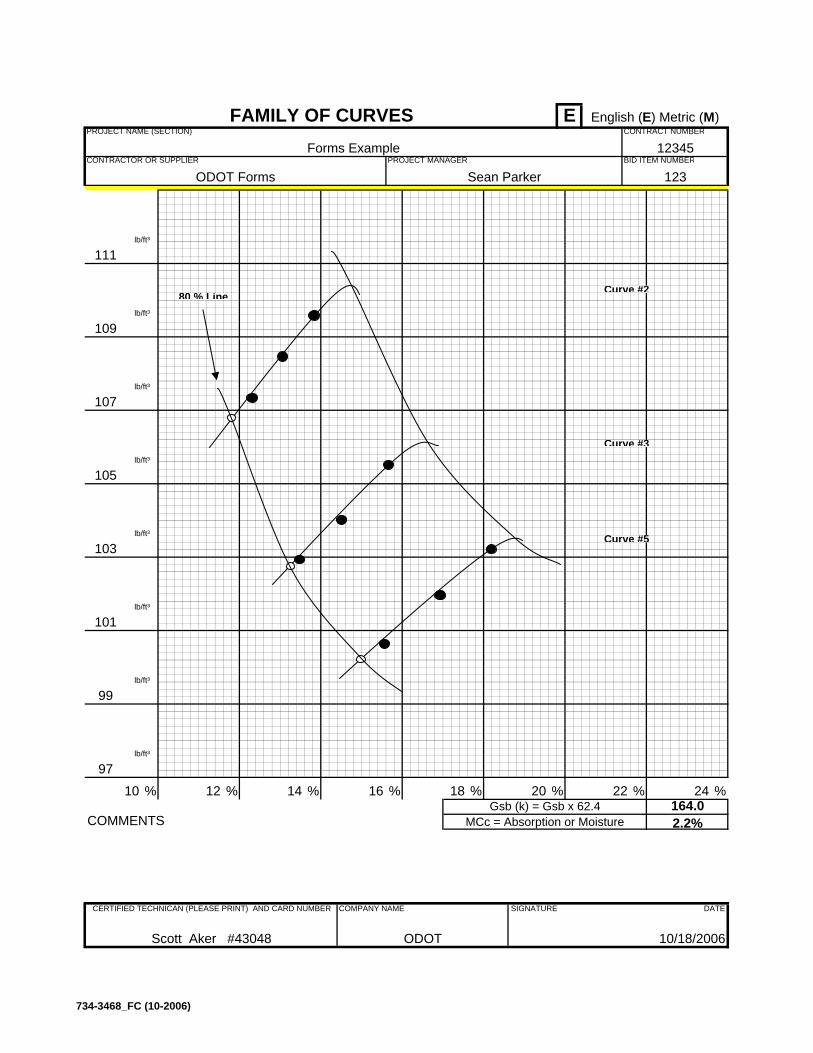
Curve #280 % Line
Curve #3
Curve #5
COMMENTS
lb/ft³
109
lb/ft³
FAMILY OF CURVES
lb/ft³
lb/ft³
lb/ft³
English (E) Metric (M)E
lb/ft³
2.2%
ODOT Forms
101
103
111
105
107
164.0Gsb (k) = Gsb x 62.4MCc = Absorption or Moisture
10/18/2006ODOTScott Aker #43048
SIGNATURE DATECOMPANY NAMECERTIFIED TECHNICAN (PLEASE PRINT) AND CARD NUMBER
12345CONTRACT NUMBER
BID ITEM NUMBER
PROJECT NAME (SECTION)
CONTRACTOR OR SUPPLIER PROJECT MANAGERForms Example
121097
99
%
lb/ft³
lb/ft³
22 24%
123
%
Sean Parker
% %%% 20181614 %
734-3468_FC (10-2006)
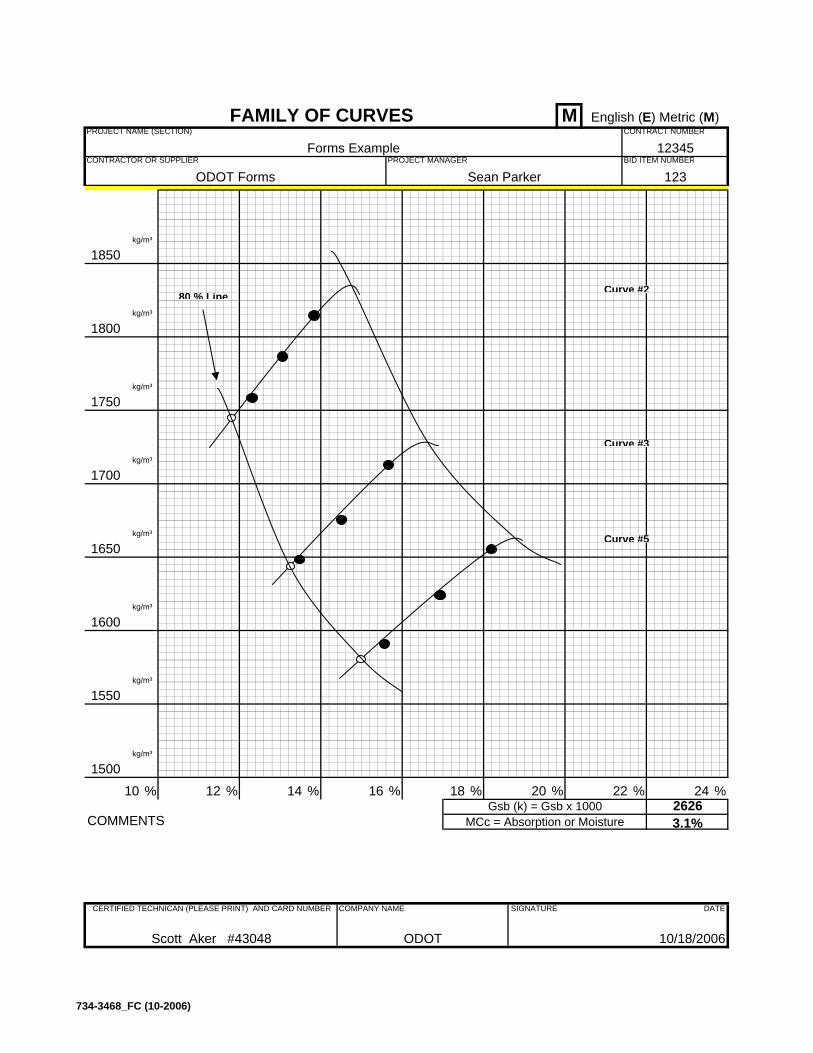
Curve #280 % Line
Curve #3
Curve #5
COMMENTS
% 20181614 % 22 24%
123
%
Sean Parker
% %%12101500
1550
%
kg/m³
kg/m³
12345CONTRACT NUMBER
BID ITEM NUMBER
PROJECT NAME (SECTION)
CONTRACTOR OR SUPPLIER PROJECT MANAGERForms Example
10/18/2006ODOTScott Aker #43048
SIGNATURE DATECOMPANY NAMECERTIFIED TECHNICAN (PLEASE PRINT) AND CARD NUMBER
2626Gsb (k) = Gsb x 1000MCc = Absorption or Moisture
English (E) Metric (M)M
kg/m³
3.1%
ODOT Forms
1600
1650
1850
1700
1750
kg/m³
1800
kg/m³
FAMILY OF CURVES
kg/m³
kg/m³
kg/m³
734-3468_FC (10-2006)
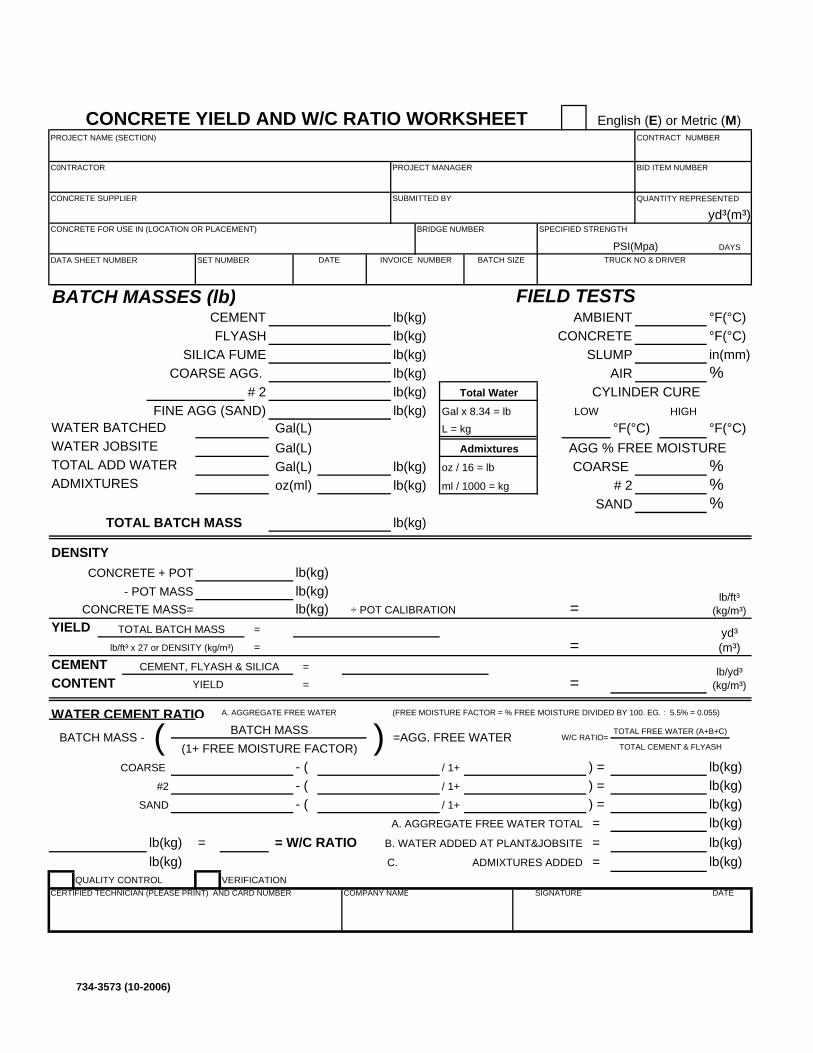
QUANTITY REPRESENTED
DATA SHEET NUMBER SET NUMBER
BATCH MASSES (lb) FIELD TESTSCEMENT lb(kg) AMBIENT °F(°C)FLYASH lb(kg) CONCRETE °F(°C)
SILICA FUME lb(kg) SLUMP in(mm)COARSE AGG. lb(kg) AIR %
# 2 lb(kg)FINE AGG (SAND) lb(kg)
WATER BATCHED °F(°C) °F(°C)WATER JOBSITE AGG % FREE MOISTURETOTAL ADD WATER lb(kg) COARSE %ADMIXTURES lb(kg) # 2 %
SAND %TOTAL BATCH MASS lb(kg)
DENSITYCONCRETE + POT lb(kg)
- POT MASS lb(kg)CONCRETE MASS= lb(kg) =
YIELD =
= =CEMENT CEMENT, FLYASH & SILICA =CONTENT YIELD = =
WATER CEMENT RATIO A. AGGREGATE FREE WATER (FREE MOISTURE FACTOR = % FREE MOISTURE DIVIDED BY 100. EG. : 5.5% = 0.055)
COARSE - ( / 1+ ) = lb(kg)#2 - ( / 1+ ) = lb(kg)
SAND - ( / 1+ ) = lb(kg)A. AGGREGATE FREE WATER TOTAL = lb(kg)
lb(kg) = = W/C RATIO B. WATER ADDED AT PLANT&JOBSITE = lb(kg)lb(kg) C. ADMIXTURES ADDED = lb(kg)
QUALITY CONTROL VERIFICATION
Total Water
Admixtures
Gal x 8.34 = lbL = kg
CYLINDER CURE
C0NTRACTOR
yd³(m³)
INVOICE NUMBER
CONCRETE YIELD AND W/C RATIO WORKSHEET English (E) or Metric (M)PROJECT NAME (SECTION)
PROJECT MANAGER
CONTRACT NUMBER
BATCH SIZEDATE TRUCK NO & DRIVERDAYS
CONCRETE FOR USE IN (LOCATION OR PLACEMENT) SPECIFIED STRENGTHBRIDGE NUMBER
CONCRETE SUPPLIER SUBMITTED BY
BID ITEM NUMBER
PSI(Mpa)
CERTIFIED TECHNICIAN (PLEASE PRINT) AND CARD NUMBER COMPANY NAME
SIGNATURE DATE
TOTAL FREE WATER (A+B+C)
TOTAL CEMENT & FLYASH
0
W/C RATIO=BATCH MASS - ( (1+ FREE MOISTURE FACTOR)BATCH MASS ) =AGG. FREE WATER
Gal(L)Gal(L)
oz(ml)
÷ POT CALIBRATION
HIGH
Gal(L) oz / 16 = lb
ml / 1000 = kg
LOW
lb/ft³ (kg/m³)
lb/yd³ (kg/m³)
yd³ (m³)
TOTAL BATCH MASS
lb/ft³ x 27 or DENSITY (kg/m³)
734-3573 (10-2006)
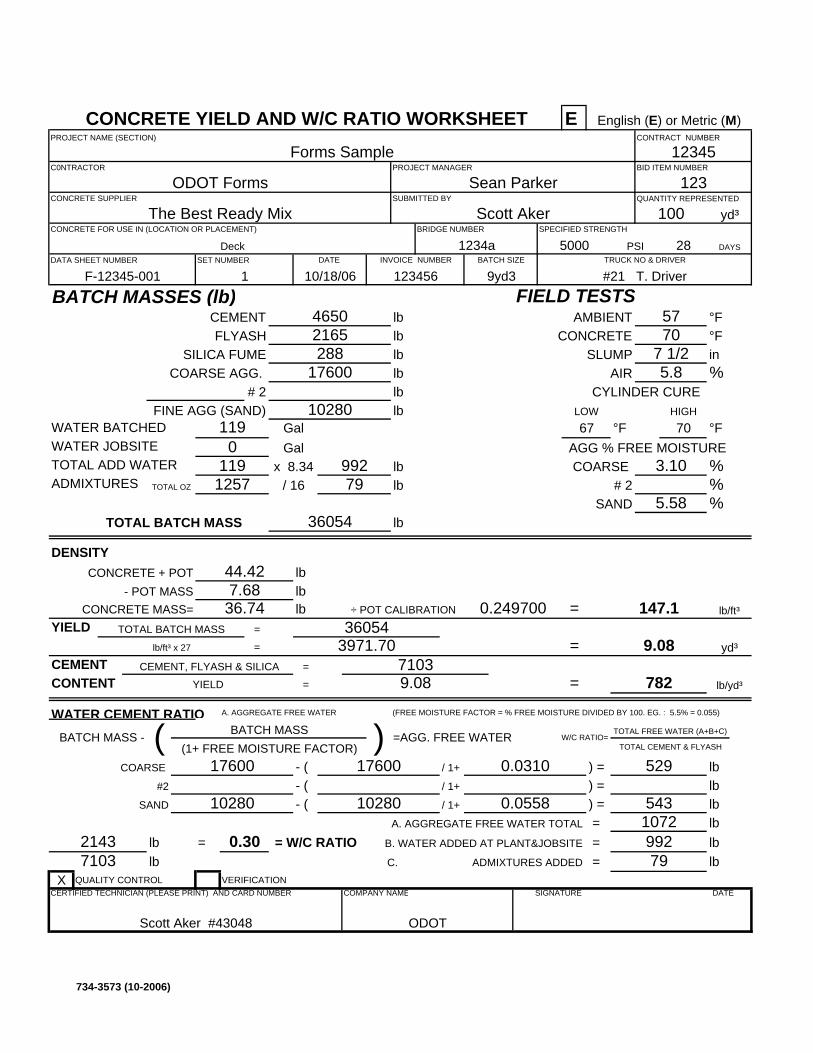
E
QUANTITY REPRESENTED
DATA SHEET NUMBER SET NUMBER
BATCH MASSES (lb) FIELD TESTSCEMENT lb AMBIENT °FFLYASH lb CONCRETE °F
SILICA FUME lb SLUMP inCOARSE AGG. lb AIR %
# 2 lbFINE AGG (SAND) lb
WATER BATCHED °F °FWATER JOBSITE AGG % FREE MOISTURETOTAL ADD WATER lb COARSE %ADMIXTURES lb # 2 %
SAND %TOTAL BATCH MASS lb
DENSITYCONCRETE + POT lb
- POT MASS lbCONCRETE MASS= lb =
YIELD =
= =CEMENT CEMENT, FLYASH & SILICA =CONTENT YIELD = =
WATER CEMENT RATIO A. AGGREGATE FREE WATER (FREE MOISTURE FACTOR = % FREE MOISTURE DIVIDED BY 100. EG. : 5.5% = 0.055)
COARSE - ( / 1+ ) = lb#2 - ( / 1+ ) = lb
SAND - ( / 1+ ) = lbA. AGGREGATE FREE WATER TOTAL = lb
lb = = W/C RATIO B. WATER ADDED AT PLANT&JOBSITE = lblb C. ADMIXTURES ADDED = lb
X QUALITY CONTROL VERIFICATION
lb/yd³
yd³TOTAL BATCH MASS
lb/ft³ x 27
360543971.70 9.08
67 70
lb/ft³
5.58
147.1
HIGH
36054
79992x 8.34 oz / 16 = lb
ml / 1000 = kg
LOW
44.427.68
36.74 0.249700÷ POT CALIBRATION
0119
1257
10280
/ 16TOTAL OZ
GalGal
7 1/25.817600
288
119
W/C RATIO=BATCH MASS - ( (1+ FREE MOISTURE FACTOR)BATCH MASS ) =AGG. FREE WATER
7829.08
0.0558
17600 17600 0.0310
10280
10280
TOTAL FREE WATER (A+B+C)
TOTAL CEMENT & FLYASH
5290
CERTIFIED TECHNICIAN (PLEASE PRINT) AND CARD NUMBER COMPANY NAME
543
SIGNATURE DATE
21437103
107299279
0.30
The Best Ready Mix Scott Aker
Scott Aker #43048 ODOT
PSI5000 28
7103
3.10
CONCRETE SUPPLIER SUBMITTED BY
12345
123BID ITEM NUMBER
DAYS
CONCRETE FOR USE IN (LOCATION OR PLACEMENT)
Deck 1234aSPECIFIED STRENGTHBRIDGE NUMBER
46502165
5770
9yd3BATCH SIZEDATE TRUCK NO & DRIVER
10/18/06 #21 T. Driver
CONCRETE YIELD AND W/C RATIO WORKSHEET English (E) or Metric (M)PROJECT NAME (SECTION)
PROJECT MANAGER
CONTRACT NUMBER
Forms Sample
CYLINDER CURE
C0NTRACTOR
100 yd³
Sean ParkerODOT Forms
1F-12345-001 123456INVOICE NUMBER
Total Water
Admixtures
Gal x 8.34 = lbL = kg
734-3573 (10-2006)
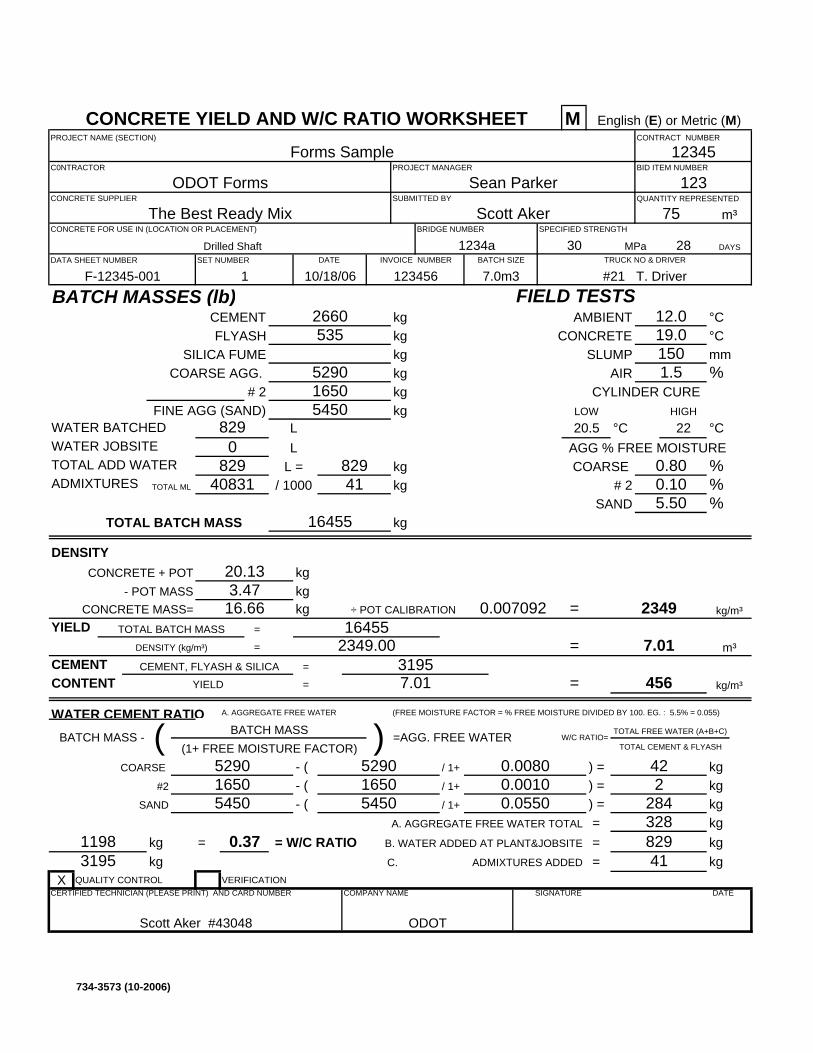
M
QUANTITY REPRESENTED
DATA SHEET NUMBER SET NUMBER
BATCH MASSES (lb) FIELD TESTSCEMENT kg AMBIENT °CFLYASH kg CONCRETE °C
SILICA FUME kg SLUMP mmCOARSE AGG. kg AIR %
# 2 kgFINE AGG (SAND) kg
WATER BATCHED °C °CWATER JOBSITE AGG % FREE MOISTURETOTAL ADD WATER kg COARSE %ADMIXTURES kg # 2 %
SAND %TOTAL BATCH MASS kg
DENSITYCONCRETE + POT kg
- POT MASS kgCONCRETE MASS= kg =
YIELD =
= =CEMENT CEMENT, FLYASH & SILICA =CONTENT YIELD = =
WATER CEMENT RATIO A. AGGREGATE FREE WATER (FREE MOISTURE FACTOR = % FREE MOISTURE DIVIDED BY 100. EG. : 5.5% = 0.055)
COARSE - ( / 1+ ) = kg#2 - ( / 1+ ) = kg
SAND - ( / 1+ ) = kgA. AGGREGATE FREE WATER TOTAL = kg
kg = = W/C RATIO B. WATER ADDED AT PLANT&JOBSITE = kgkg C. ADMIXTURES ADDED = kg
X QUALITY CONTROL VERIFICATION
Total Water
Admixtures
Gal x 8.34 = lbL = kg
CYLINDER CURE
C0NTRACTOR
75 m³
Sean ParkerODOT Forms
1F-12345-001 123456INVOICE NUMBER
CONCRETE YIELD AND W/C RATIO WORKSHEET English (E) or Metric (M)PROJECT NAME (SECTION)
PROJECT MANAGER
CONTRACT NUMBER
Forms Sample
7.0m3BATCH SIZEDATE TRUCK NO & DRIVER
10/18/06 #21 T. Driver
2660535
12.019.0
DAYS
CONCRETE FOR USE IN (LOCATION OR PLACEMENT)
Drilled Shaft 1234aSPECIFIED STRENGTHBRIDGE NUMBER
CONCRETE SUPPLIER SUBMITTED BY
12345
123BID ITEM NUMBER
The Best Ready Mix Scott Aker
Scott Aker #43048 ODOT
MPa30 28
3195
0.80
CERTIFIED TECHNICIAN (PLEASE PRINT) AND CARD NUMBER COMPANY NAME
284
SIGNATURE DATE
11983195
32882941
0.37
TOTAL FREE WATER (A+B+C)
TOTAL CEMENT & FLYASH
4220.0010
0.0550
5290 5290 0.008016505450
16505450
W/C RATIO=
0.10
BATCH MASS - ( (1+ FREE MOISTURE FACTOR)BATCH MASS ) =AGG. FREE WATER
4567.01
TOTAL ML
LL
1501.55290
1650
8290
82940831
5450
/ 1000
20.133.47
16.66 0.007092÷ POT CALIBRATION
HIGH
16455
41829L = oz / 16 = lb
ml / 1000 = kg
LOW20.5 22
kg/m³
5.50
2349
kg/m³
m³TOTAL BATCH MASS
DENSITY (kg/m³)
164552349.00 7.01
734-3573 (10-2006)
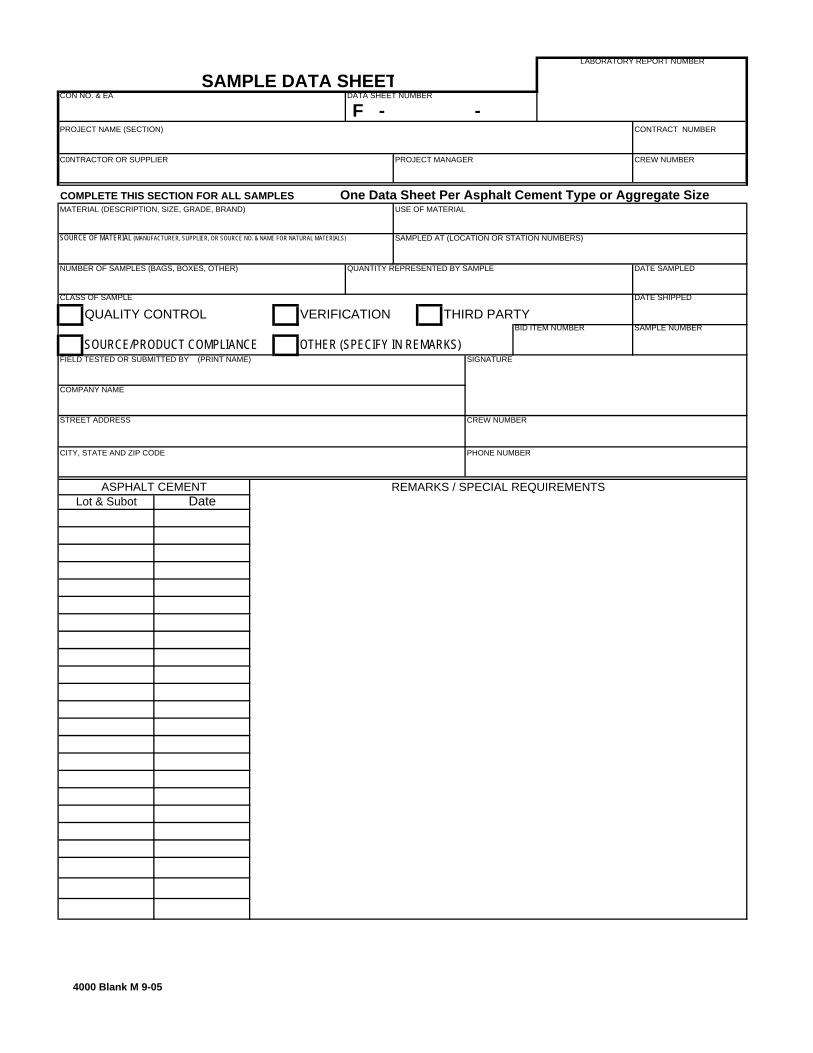
F - -
COMPLETE THIS SECTION FOR ALL SAMPLES
CLASS OF SAMPLE
QUALITY CONTROL VERIFICATION THIRD PARTY
SOURCE/PRODUCT COMPLIANCE OTHER (SPECIFY IN REMARKS)
LABORATORY REPORT NUMBER
SAMPLE DATA SHEET
SAMPLE NUMBER
PROJECT NAME (SECTION)
PROJECT MANAGER
NUMBER OF SAMPLES (BAGS, BOXES, OTHER) QUANTITY REPRESENTED BY SAMPLE
FIELD TESTED OR SUBMITTED BY (PRINT NAME) SIGNATURE
COMPANY NAME
SOURCE OF MATERIAL (MANUFACTURER, SUPPLIER, OR SOURCE NO. & NAME FOR NATURAL MATERIALS) SAMPLED AT (LOCATION OR STATION NUMBERS)
DATE SAMPLED
CONTRACT NUMBER
C0NTRACTOR OR SUPPLIER CREW NUMBER
MATERIAL (DESCRIPTION, SIZE, GRADE, BRAND) USE OF MATERIAL One Data Sheet Per Asphalt Cement Type or Aggregate Size
CITY, STATE AND ZIP CODE
CREW NUMBER
PHONE NUMBER
STREET ADDRESS
DATE SHIPPED
Lot & Subot DateASPHALT CEMENT REMARKS / SPECIAL REQUIREMENTS
CON NO. & EA DATA SHEET NUMBER
BID ITEM NUMBER
4000 Blank M 9-05
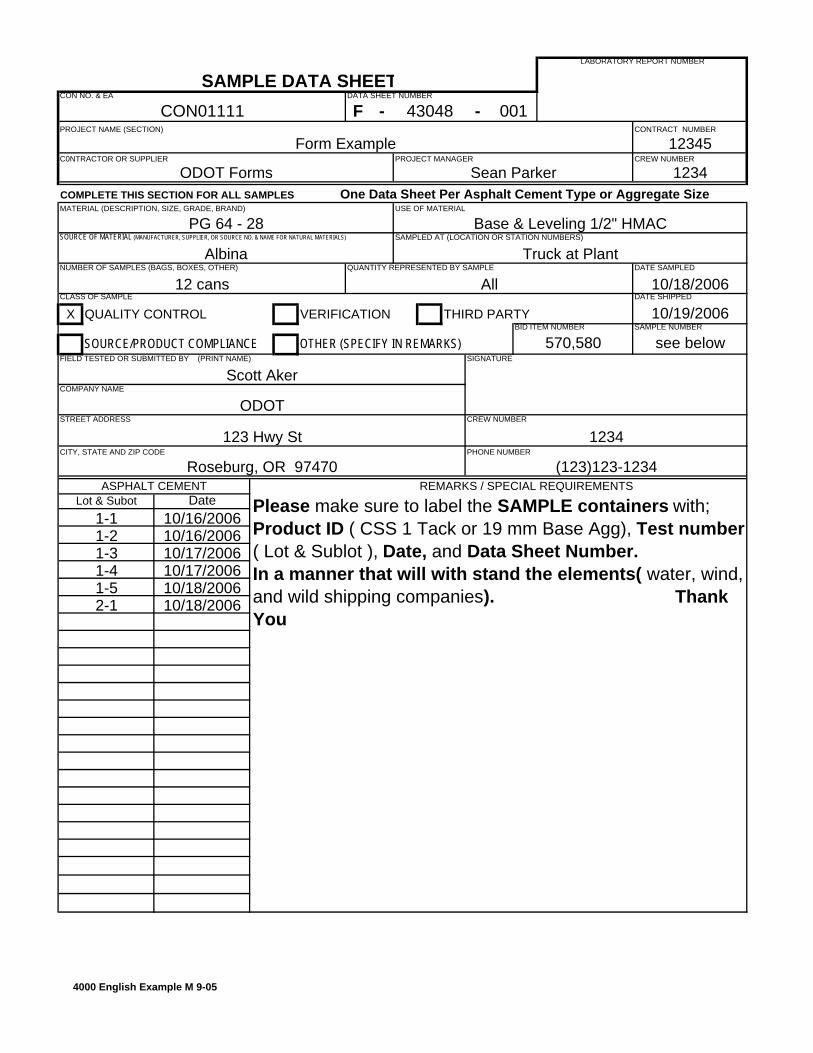
F - -
COMPLETE THIS SECTION FOR ALL SAMPLES
CLASS OF SAMPLE
X QUALITY CONTROL VERIFICATION THIRD PARTY
SOURCE/PRODUCT COMPLIANCE OTHER (SPECIFY IN REMARKS)
REMARKS / SPECIAL REQUIREMENTS
CON NO. & EA
CON01111DATA SHEET NUMBER
43048
570,580
Please make sure to label the SAMPLE containers with; Product ID ( CSS 1 Tack or 19 mm Base Agg), Test number ( Lot & Sublot ), Date, and Data Sheet Number. In a manner that will with stand the elements( water, wind, and wild shipping companies). Thank You
2-1 10/18/2006
1-4 10/17/20061-5 10/18/2006
Lot & Subot DateASPHALT CEMENT
1-1 10/16/20061-2 10/16/20061-3 10/17/2006
All12 cans
CITY, STATE AND ZIP CODE
CREW NUMBER
1234PHONE NUMBER
123 Hwy StSTREET ADDRESS
BID ITEM NUMBER
CONTRACT NUMBER
12345
Base & Leveling 1/2" HMACPG 64 - 28
Form ExampleC0NTRACTOR OR SUPPLIER CREW NUMBER
MATERIAL (DESCRIPTION, SIZE, GRADE, BRAND) USE OF MATERIAL One Data Sheet Per Asphalt Cement Type or Aggregate Size
DATE SHIPPED
10/19/2006
10/18/2006DATE SAMPLED
Truck at Plant
Sean ParkerODOT Forms 1234
SOURCE OF MATERIAL (MANUFACTURER, SUPPLIER, OR SOURCE NO. & NAME FOR NATURAL MATERIALS) SAMPLED AT (LOCATION OR STATION NUMBERS)
Albina
Roseburg, OR 97470 (123)123-1234
FIELD TESTED OR SUBMITTED BY (PRINT NAME)
Scott Aker
ODOT
SIGNATURE
COMPANY NAME
LABORATORY REPORT NUMBER
SAMPLE DATA SHEET
see belowSAMPLE NUMBER
001PROJECT NAME (SECTION)
PROJECT MANAGER
NUMBER OF SAMPLES (BAGS, BOXES, OTHER) QUANTITY REPRESENTED BY SAMPLE
4000 English Example M 9-05
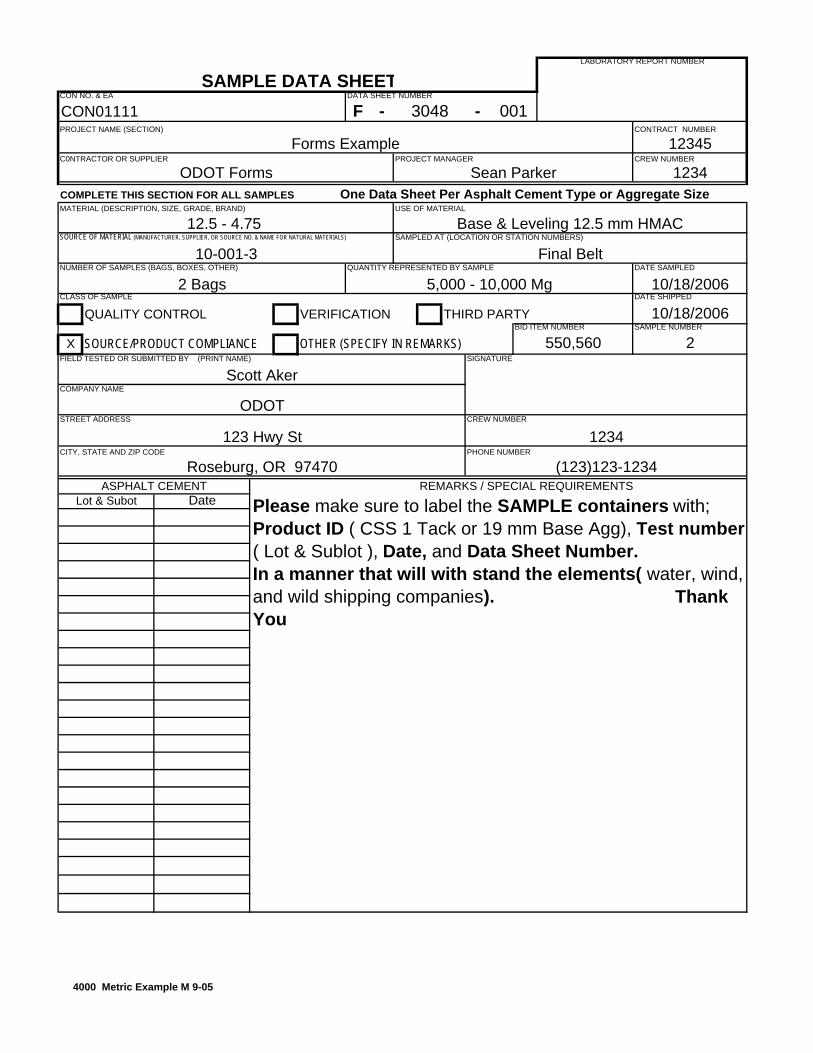
F - -
COMPLETE THIS SECTION FOR ALL SAMPLES
CLASS OF SAMPLE
QUALITY CONTROL VERIFICATION THIRD PARTY
X SOURCE/PRODUCT COMPLIANCE OTHER (SPECIFY IN REMARKS)
REMARKS / SPECIAL REQUIREMENTS
CON NO. & EA
CON01111DATA SHEET NUMBER
3048
LABORATORY REPORT NUMBER
SAMPLE DATA SHEET
2SAMPLE NUMBER
001PROJECT NAME (SECTION)
PROJECT MANAGERC0NTRACTOR OR SUPPLIER
1234
Roseburg, OR 97470 (123)123-1234
FIELD TESTED OR SUBMITTED BY (PRINT NAME)
Scott Aker
ODOT
SIGNATURE
COMPANY NAME
DATE SHIPPED
10/18/2006
10/18/2006DATE SAMPLED
MATERIAL (DESCRIPTION, SIZE, GRADE, BRAND) USE OF MATERIAL
CONTRACT NUMBER
12345
One Data Sheet Per Asphalt Cement Type or Aggregate Size
Forms Example
Sean ParkerODOT FormsCREW NUMBER
Base & Leveling 12.5 mm HMAC12.5 - 4.75
10-001-3
5,000 - 10,000 Mg2 BagsNUMBER OF SAMPLES (BAGS, BOXES, OTHER) QUANTITY REPRESENTED BY SAMPLE
Final BeltSOURCE OF MATERIAL (MANUFACTURER, SUPPLIER, OR SOURCE NO. & NAME FOR NATURAL MATERIALS) SAMPLED AT (LOCATION OR STATION NUMBERS)
CITY, STATE AND ZIP CODE
CREW NUMBER
1234PHONE NUMBER
123 Hwy StSTREET ADDRESS
Lot & Subot DateASPHALT CEMENT
Please make sure to label the SAMPLE containers with; Product ID ( CSS 1 Tack or 19 mm Base Agg), Test number ( Lot & Sublot ), Date, and Data Sheet Number. In a manner that will with stand the elements( water, wind, and wild shipping companies). Thank You
BID ITEM NUMBER
550,560
4000 Metric Example M 9-05
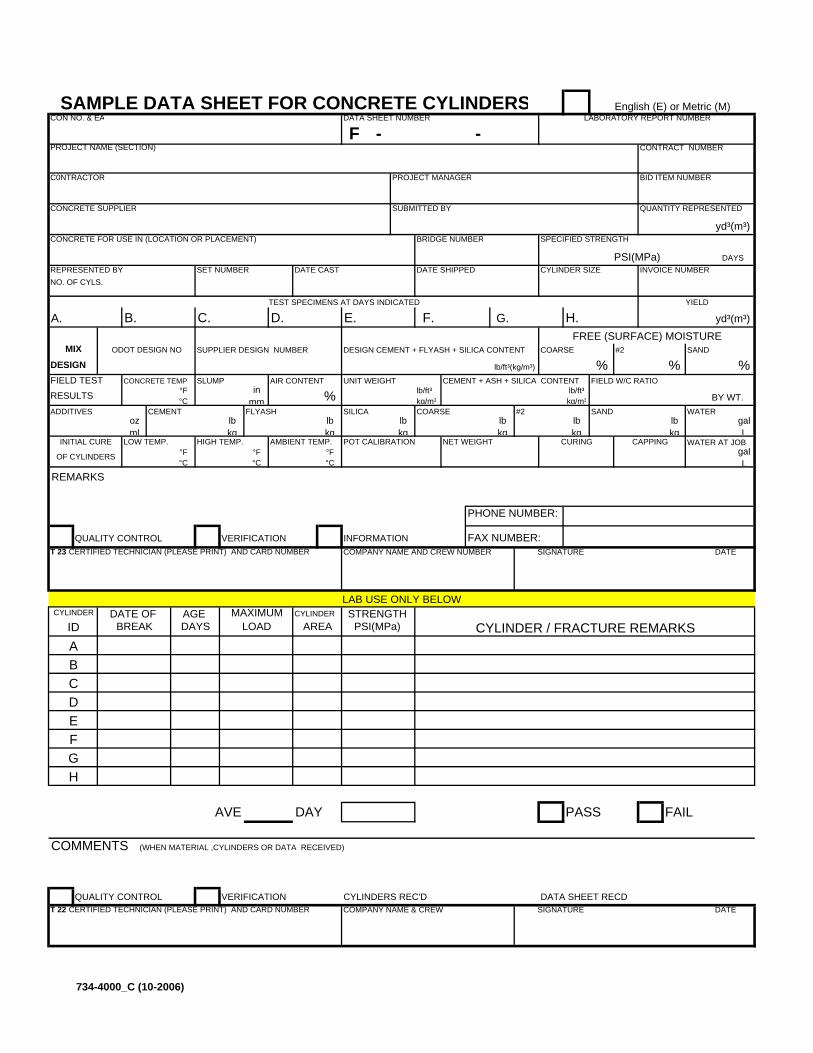
F - -
QUANTITY REPRESENTED
REPRESENTED BY SET NUMBER DATE CAST DATE SHIPPEDNO. OF CYLS.
A. B. C. D. E. F. G. H.
SUPPLIER DESIGN NUMBER DESIGN CEMENT + FLYASH + SILICA CONTENT COARSE #2 SAND
DESIGN % % %FIELD TEST CONCRETE TEMP SLUMP AIR CONTENT UNIT WEIGHT CEMENT + ASH + SILICA CONTENT FIELD W/C RATIO
RESULTS °F °C
in mm % lb/ft³
kg/m³lb/ft³ kg/m³ BY WT.
ADDITIVES CEMENT FLYASH SILICA COARSE #2 SAND WATERoz ml
lb kg
lb kg
lb kg
lb kg
lb kg
lb kg
gal L
LOW TEMP. HIGH TEMP. AMBIENT TEMP. POT CALIBRATION NET WEIGHT WATER AT JOB°F °C
°F °C
°F °C
gal L
REMARKS
QUALITY CONTROL VERIFICATION INFORMATION
CYLINDER
AVE DAY PASS FAIL
COMMENTS (WHEN MATERIAL ,CYLINDERS OR DATA RECEIVED)
QUALITY CONTROL VERIFICATION CYLINDERS REC'D DATA SHEET RECD
MIX
DATE OF
CYLINDER SIZE INVOICE NUMBER
CAPPING
CYLINDER
INITIAL CURE
OF CYLINDERS
T 23 CERTIFIED TECHNICIAN (PLEASE PRINT) AND CARD NUMBER
AGE
CURING
CYLINDER / FRACTURE REMARKSPSI(MPa) STRENGTH
LAB USE ONLY BELOW
FREE (SURFACE) MOISTURE
CONCRETE FOR USE IN (LOCATION OR PLACEMENT) BRIDGE NUMBER
TEST SPECIMENS AT DAYS INDICATED YIELD
ODOT DESIGN NO
yd³(m³)
SUBMITTED BY
SAMPLE DATA SHEET FOR CONCRETE CYLINDERSCON NO. & EA DATA SHEET NUMBER
CONTRACT NUMBER
PROJECT MANAGER
PROJECT NAME (SECTION)
C0NTRACTOR
CONCRETE SUPPLIER
PSI(MPa)
SPECIFIED STRENGTH
DAYS
BID ITEM NUMBER
COMPANY NAME & CREW SIGNATURE DATET 22 CERTIFIED TECHNICIAN (PLEASE PRINT) AND CARD NUMBER
MAXIMUMLOAD
C
ID
BA
BREAK DAYS AREA
DEFG
PHONE NUMBER:
FAX NUMBER:COMPANY NAME AND CREW NUMBER SIGNATURE DATE
H
English (E) or Metric (M)
lb/ft³(kg/m³)
LABORATORY REPORT NUMBER
yd³(m³)
734-4000_C (10-2006)
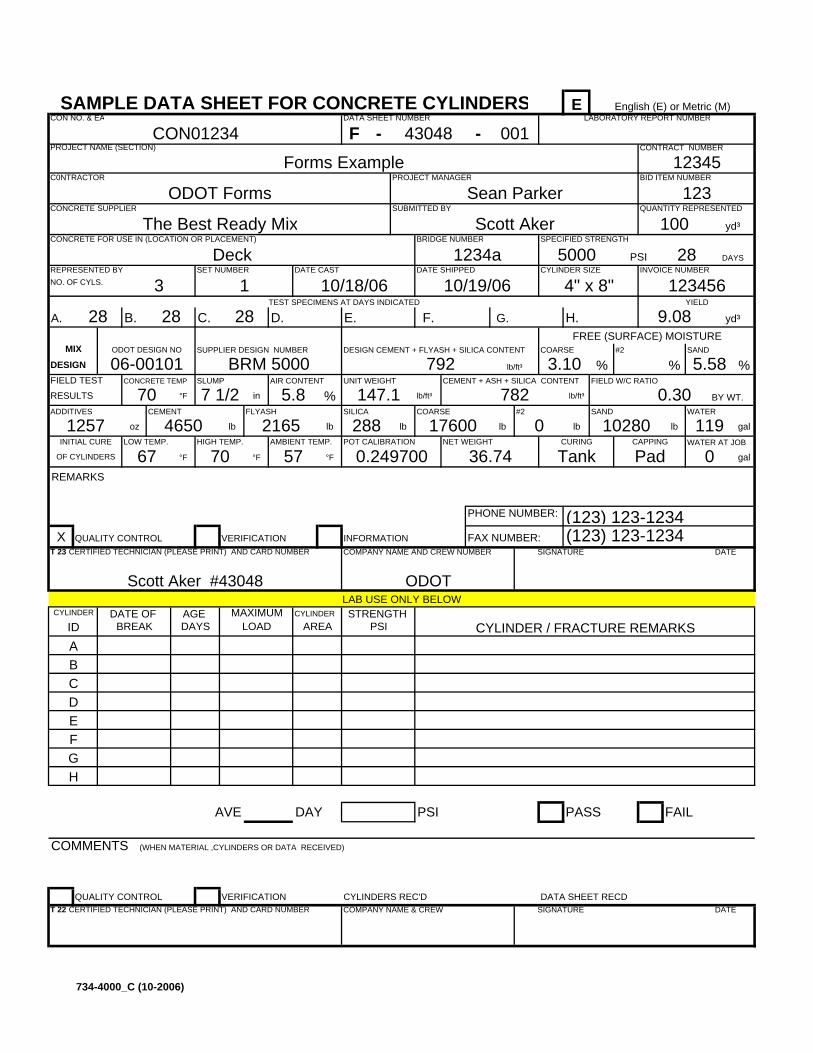
F - -
QUANTITY REPRESENTED
REPRESENTED BY SET NUMBER DATE CAST DATE SHIPPEDNO. OF CYLS.
A. B. C. D. E. F. G. H.
SUPPLIER DESIGN NUMBER DESIGN CEMENT + FLYASH + SILICA CONTENT COARSE #2 SAND
DESIGN % % %FIELD TEST CONCRETE TEMP SLUMP AIR CONTENT UNIT WEIGHT CEMENT + ASH + SILICA CONTENT FIELD W/C RATIO
RESULTS °F in % lb/ft³ lb/ft³ BY WT.ADDITIVES CEMENT FLYASH SILICA COARSE #2 SAND WATER
oz lb lb lb lb lb lb galLOW TEMP. HIGH TEMP. AMBIENT TEMP. POT CALIBRATION NET WEIGHT WATER AT JOB
°F °F °F gal
REMARKS
X QUALITY CONTROL VERIFICATION INFORMATION
CYLINDER
AVE DAY PSI PASS FAIL
COMMENTS (WHEN MATERIAL ,CYLINDERS OR DATA RECEIVED)
QUALITY CONTROL VERIFICATION CYLINDERS REC'D DATA SHEET RECD
1234a
English (E) or Metric (M)
lb/ft³
LABORATORY REPORT NUMBERE
yd³
5.583.10
COMPANY NAME AND CREW NUMBER SIGNATURE DATE
Scott Aker #43048 ODOT
H
(123) 123-1234
Tank Pad 0
PHONE NUMBER: (123) 123-1234FAX NUMBER:
GFED
BREAK
BA
DAYS
T 22 CERTIFIED TECHNICIAN (PLEASE PRINT) AND CARD NUMBER
MAXIMUMLOAD
C
ID
COMPANY NAME & CREW SIGNATURE DATE
ODOT FormsC0NTRACTOR
CONCRETE SUPPLIER
PSI5000SPECIFIED STRENGTH
DAYS
BID ITEM NUMBER
CONTRACT NUMBER
12345PROJECT MANAGER
PROJECT NAME (SECTION)
Forms Example
SAMPLE DATA SHEET FOR CONCRETE CYLINDERS001
CON NO. & EA
CON01234DATA SHEET NUMBER
43048
123Sean Parker
100 yd³
SUBMITTED BY
Scott AkerThe Best Ready Mix
28
11910280
TEST SPECIMENS AT DAYS INDICATED YIELD
9.08
06-00101ODOT DESIGN NO
BRM 5000 792
7 1/2
CONCRETE FOR USE IN (LOCATION OR PLACEMENT)
Deck
3 10/18/061
BRIDGE NUMBER
10/19/06
288 17600 0
FREE (SURFACE) MOISTURE28 28 28
782
0.249700CURING
36.74
21651257
5.8 147.1
4650
CYLINDER
INITIAL CURE
OF CYLINDERS 67
T 23 CERTIFIED TECHNICIAN (PLEASE PRINT) AND CARD NUMBER
57
AGE
70
123456CYLINDER SIZE INVOICE NUMBER
4" x 8"
CAPPING
0.30
CYLINDER / FRACTURE REMARKSAREA PSISTRENGTH
LAB USE ONLY BELOW
70
MIX
DATE OF
734-4000_C (10-2006)
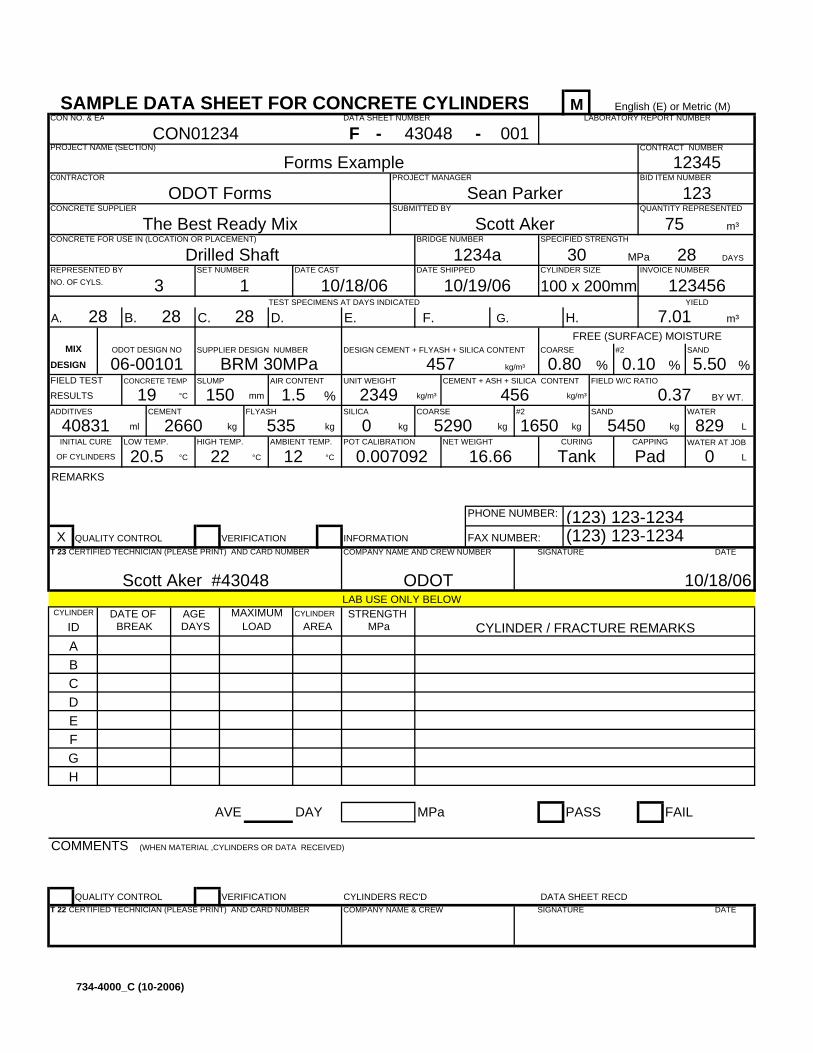
F - -
QUANTITY REPRESENTED
REPRESENTED BY SET NUMBER DATE CAST DATE SHIPPEDNO. OF CYLS.
A. B. C. D. E. F. G. H.
SUPPLIER DESIGN NUMBER DESIGN CEMENT + FLYASH + SILICA CONTENT COARSE #2 SAND
DESIGN % % %FIELD TEST CONCRETE TEMP SLUMP AIR CONTENT UNIT WEIGHT CEMENT + ASH + SILICA CONTENT FIELD W/C RATIO
RESULTS °C mm % kg/m³ kg/m³ BY WT.ADDITIVES CEMENT FLYASH SILICA COARSE #2 SAND WATER
ml kg kg kg kg kg kg LLOW TEMP. HIGH TEMP. AMBIENT TEMP. POT CALIBRATION NET WEIGHT WATER AT JOB
°C °C °C L
REMARKS
X QUALITY CONTROL VERIFICATION INFORMATION
CYLINDER
AVE DAY MPa PASS FAIL
COMMENTS (WHEN MATERIAL ,CYLINDERS OR DATA RECEIVED)
QUALITY CONTROL VERIFICATION CYLINDERS REC'D DATA SHEET RECD
BRIDGE NUMBER
10/19/06
28 28 28
CYLINDER / FRACTURE REMARKSAREA MPaSTRENGTH
LAB USE ONLY BELOW
19
06-00101ODOT DESIGN NO
123456CYLINDER SIZE INVOICE NUMBER
100 x 200mm
CAPPING
0.37
MIX
DATE OF CYLINDER
INITIAL CURE
OF CYLINDERS 20.5
T 23 CERTIFIED TECHNICIAN (PLEASE PRINT) AND CARD NUMBER
53540831
1.5 2349 456
0.007092CURING
2660 0 5290 1650
BRM 30MPa 457
150
1234aCONCRETE FOR USE IN (LOCATION OR PLACEMENT)
Drilled Shaft
3 10/18/061
16.66
FREE (SURFACE) MOISTURE
The Best Ready Mix
28
8295450
TEST SPECIMENS AT DAYS INDICATED YIELD
7.01
12
SUBMITTED BY
Scott Aker
123Sean Parker
75 m³
SAMPLE DATA SHEET FOR CONCRETE CYLINDERS001
CON NO. & EA
CON01234DATA SHEET NUMBER
43048
Forms ExampleCONTRACT NUMBER
12345PROJECT MANAGER
PROJECT NAME (SECTION)
ODOT FormsC0NTRACTOR
CONCRETE SUPPLIER
MPa30SPECIFIED STRENGTH
DAYS
BID ITEM NUMBER
COMPANY NAME & CREW SIGNATURE DATE
AGE DAYS
T 22 CERTIFIED TECHNICIAN (PLEASE PRINT) AND CARD NUMBER
MAXIMUMLOAD
C
ID
BA
BREAK
DEFG
(123) 123-1234
Tank Pad 0
PHONE NUMBER: (123) 123-1234FAX NUMBER:
22
COMPANY NAME AND CREW NUMBER SIGNATURE DATE
Scott Aker #43048 ODOT 10/18/06
H
English (E) or Metric (M)
kg/m³
LABORATORY REPORT NUMBERM
m³
5.500.100.80
734-4000_C (10-2006)
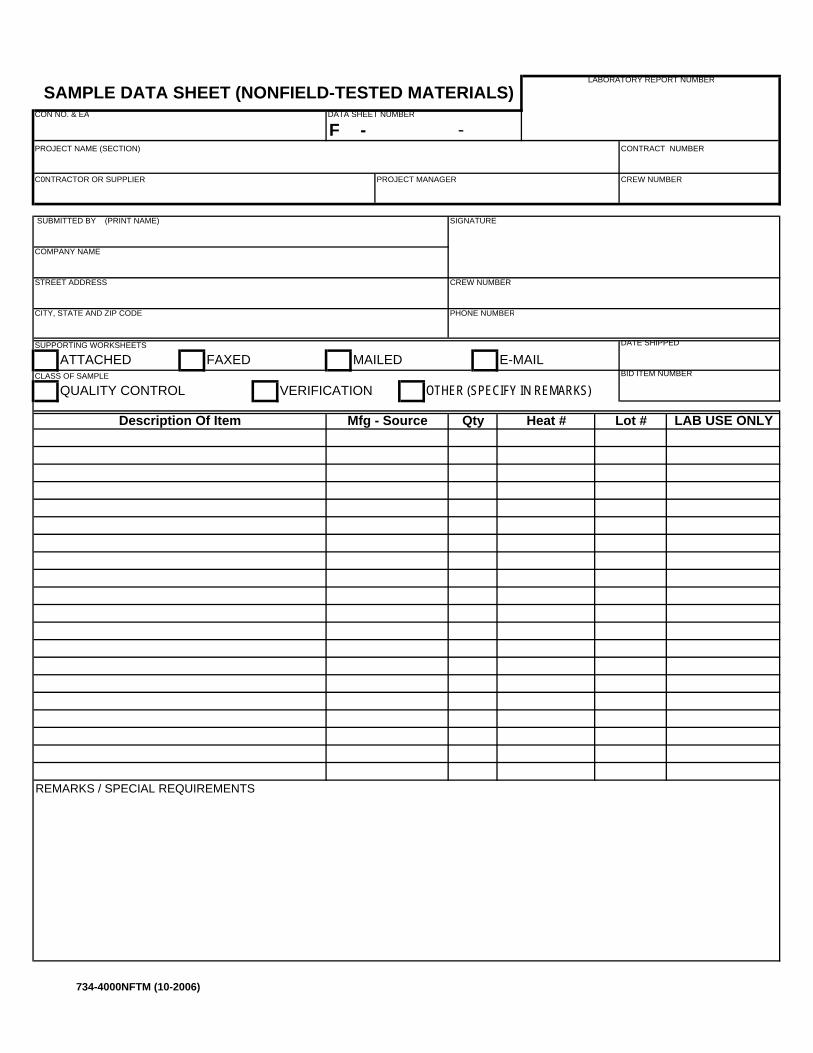
F - -
SUPPORTING WORKSHEETS
ATTACHED FAXED MAILED E-MAILCLASS OF SAMPLE
QUALITY CONTROL VERIFICATION OTHER (SPECIFY IN REMARKS)
REMARKS / SPECIAL REQUIREMENTS
Mfg - Source Heat # LAB USE ONLYDescription Of Item Qty
LABORATORY REPORT NUMBER
SAMPLE DATA SHEET (NONFIELD-TESTED MATERIALS)
BID ITEM NUMBER
PROJECT NAME (SECTION)
CREW NUMBERPROJECT MANAGER
SUBMITTED BY (PRINT NAME) SIGNATURE
COMPANY NAME
CITY, STATE AND ZIP CODE
CONTRACT NUMBER
C0NTRACTOR OR SUPPLIER
CON NO. & EA DATA SHEET NUMBER
STREET ADDRESS
Lot #
CREW NUMBER
PHONE NUMBER
DATE SHIPPED
734-4000NFTM (10-2006)
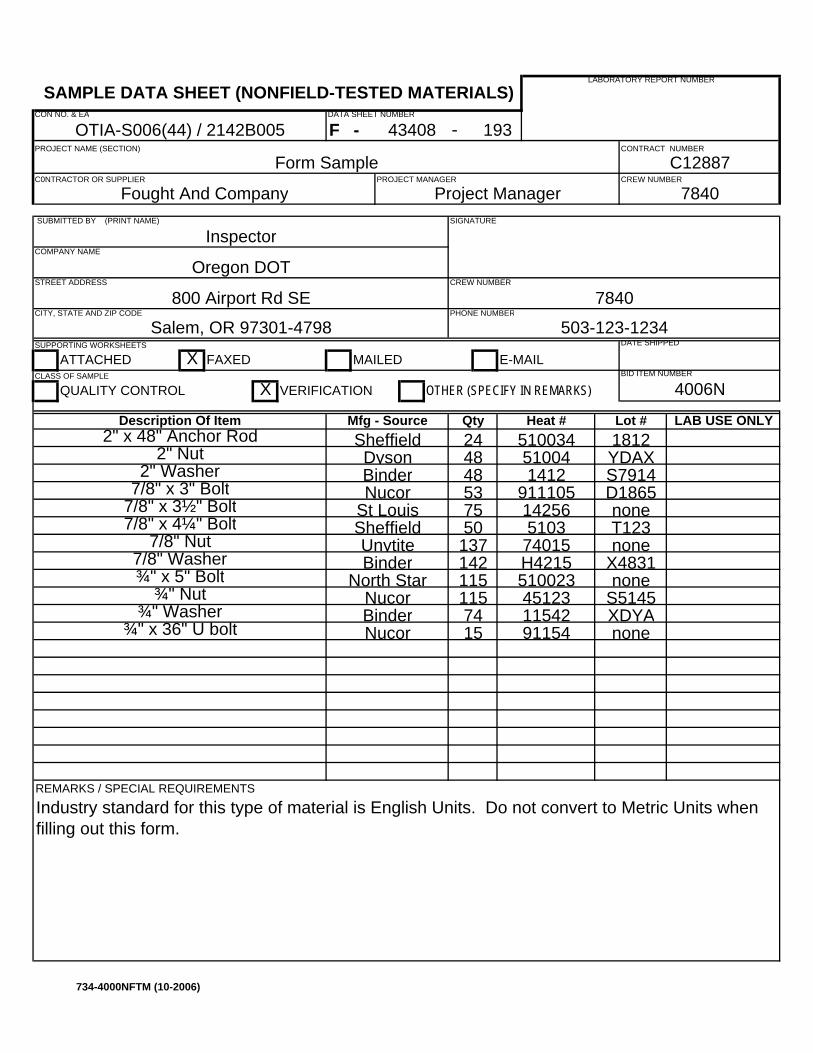
F - -
SUPPORTING WORKSHEETS
ATTACHED X FAXED MAILED E-MAILCLASS OF SAMPLE
QUALITY CONTROL X VERIFICATION OTHER (SPECIFY IN REMARKS)
REMARKS / SPECIAL REQUIREMENTS
XDYAnone
Industry standard for this type of material is English Units. Do not convert to Metric Units when filling out this form.
T123none
X4831none
STREET ADDRESS
YDAX
Lot #1812
CREW NUMBER
7840PHONE NUMBER
4006N
DATE SHIPPED
CON NO. & EA
OTIA-S006(44) / 2142B005DATA SHEET NUMBER
43408
800 Airport Rd SECITY, STATE AND ZIP CODE
CONTRACT NUMBER
C12887Form Sample
Project ManagerFought And CompanyC0NTRACTOR OR SUPPLIER
7840 SUBMITTED BY (PRINT NAME)
Inspector
Oregon DOT
SIGNATURE
COMPANY NAME
LABORATORY REPORT NUMBER
SAMPLE DATA SHEET (NONFIELD-TESTED MATERIALS)
BID ITEM NUMBER
193PROJECT NAME (SECTION)
CREW NUMBERPROJECT MANAGER
Salem, OR 97301-4798 503-123-1234
LAB USE ONLYDescription Of Item
2" Washer2" Nut
2" x 48" Anchor Rod
S7914
Qty
7/8" x 3" Bolt7/8" x 3½" Bolt 75 14256
D1865none
¾" x 5" Bolt
7/8" x 4¼" Bolt
7/8" Washer7/8" Nut
Sheffield
Binder
¾" Nut
¾" x 36" U bolt¾" Washer
Nucor S5145115
Mfg - Source Heat #24Sheffield484853
510034510041412
911105
DysonBinderNucor
St Louis50 5103
Unytite 137 74015142 H4215
North Star 115 51002345123
Binder 74 11542Nucor 15 91154
734-4000NFTM (10-2006)
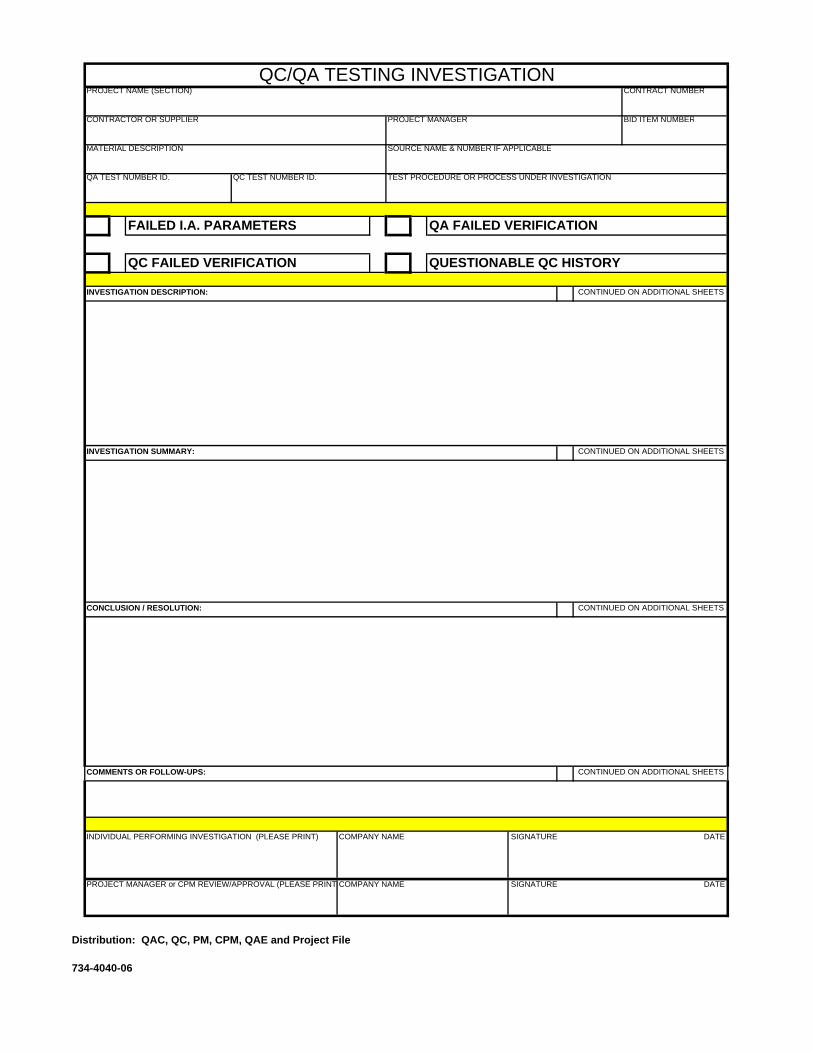
QC TEST NUMBER ID.QA TEST NUMBER ID. TEST PROCEDURE OR PROCESS UNDER INVESTIGATION
COMPANY NAME SIGNATURE DATE
INVESTIGATION SUMMARY: CONTINUED ON ADDITIONAL SHEETS
COMMENTS OR FOLLOW-UPS:
QUESTIONABLE QC HISTORY
CONTINUED ON ADDITIONAL SHEETS
CONCLUSION / RESOLUTION:
CONTINUED ON ADDITIONAL SHEETS
CONTINUED ON ADDITIONAL SHEETS
FAILED I.A. PARAMETERS
QC FAILED VERIFICATION
INVESTIGATION DESCRIPTION:
QA FAILED VERIFICATION
INDIVIDUAL PERFORMING INVESTIGATION (PLEASE PRINT)
QC/QA TESTING INVESTIGATION
CONTRACT NUMBERPROJECT NAME (SECTION)
BID ITEM NUMBER
CONTRACTOR OR SUPPLIER
MATERIAL DESCRIPTION
PROJECT MANAGER
SOURCE NAME & NUMBER IF APPLICABLE
SIGNATURE DATECOMPANY NAMEPROJECT MANAGER or CPM REVIEW/APPROVAL (PLEASE PRINT)
Distribution: QAC, QC, PM, CPM, QAE and Project File
734-4040-06
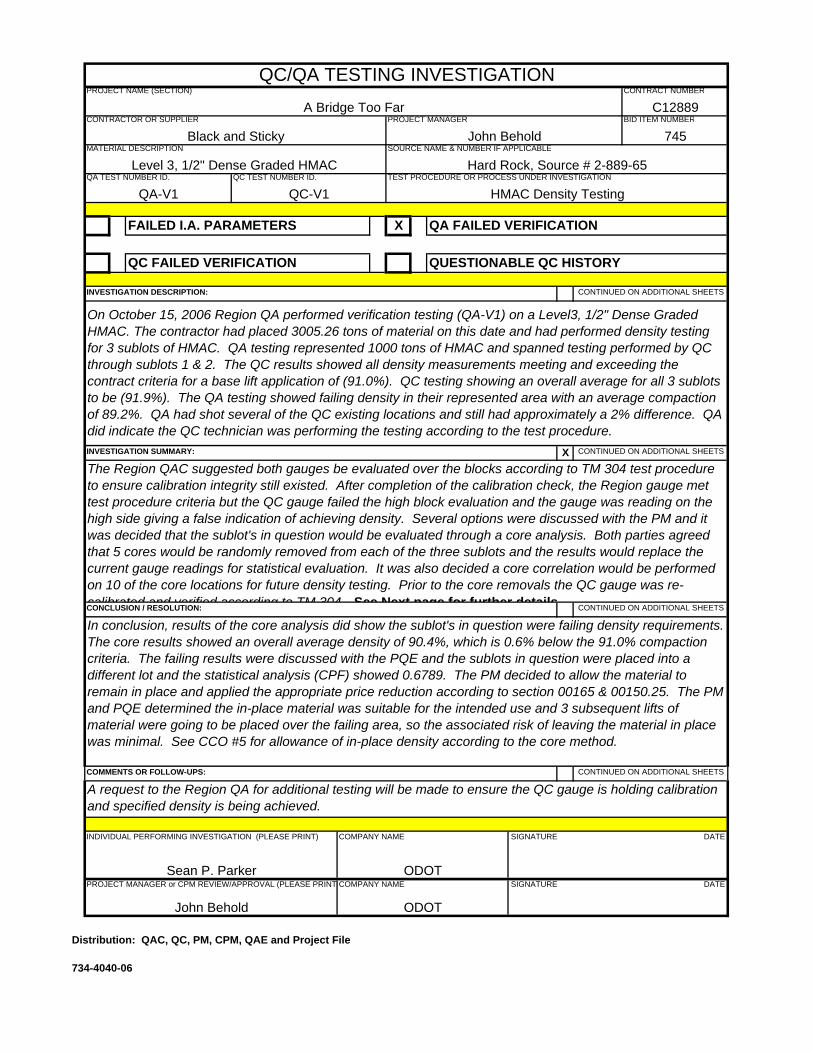
ODOTJohn Behold
SIGNATURE DATECOMPANY NAMEPROJECT MANAGER or CPM REVIEW/APPROVAL (PLEASE PRINT)
Level 3, 1/2" Dense Graded HMAC
CONTRACTOR OR SUPPLIER
John BeholdMATERIAL DESCRIPTION
PROJECT MANAGER
Hard Rock, Source # 2-889-65SOURCE NAME & NUMBER IF APPLICABLE
INDIVIDUAL PERFORMING INVESTIGATION (PLEASE PRINT)
QC/QA TESTING INVESTIGATIONC12889
CONTRACT NUMBERPROJECT NAME (SECTION)
A Bridge Too FarBID ITEM NUMBER
745Black and Sticky
INVESTIGATION DESCRIPTION:
On October 15, 2006 Region QA performed verification testing (QA-V1) on a Level3, 1/2" Dense Graded HMAC. The contractor had placed 3005.26 tons of material on this date and had performed density testing for 3 sublots of HMAC. QA testing represented 1000 tons of HMAC and spanned testing performed by QC through sublots 1 & 2. The QC results showed all density measurements meeting and exceeding the contract criteria for a base lift application of (91.0%). QC testing showing an overall average for all 3 sublots to be (91.9%). The QA testing showed failing density in their represented area with an average compaction of 89.2%. QA had shot several of the QC existing locations and still had approximately a 2% difference. QA did indicate the QC technician was performing the testing according to the test procedure.
Sean P. Parker
X
QA FAILED VERIFICATION FAILED I.A. PARAMETERS
QC FAILED VERIFICATION QUESTIONABLE QC HISTORY
CONTINUED ON ADDITIONAL SHEETS
The Region QAC suggested both gauges be evaluated over the blocks according to TM 304 test procedure to ensure calibration integrity still existed. After completion of the calibration check, the Region gauge met test procedure criteria but the QC gauge failed the high block evaluation and the gauge was reading on the high side giving a false indication of achieving density. Several options were discussed with the PM and it was decided that the sublot's in question would be evaluated through a core analysis. Both parties agreed that 5 cores would be randomly removed from each of the three sublots and the results would replace the current gauge readings for statistical evaluation. It was also decided a core correlation would be performed on 10 of the core locations for future density testing. Prior to the core removals the QC gauge was re-calibrated and verified according to TM 304 See Next page for further detailsCONCLUSION / RESOLUTION:
In conclusion, results of the core analysis did show the sublot's in question were failing density requirements. The core results showed an overall average density of 90.4%, which is 0.6% below the 91.0% compaction criteria. The failing results were discussed with the PQE and the sublots in question were placed into a different lot and the statistical analysis (CPF) showed 0.6789. The PM decided to allow the material to remain in place and applied the appropriate price reduction according to section 00165 & 00150.25. The PM and PQE determined the in-place material was suitable for the intended use and 3 subsequent lifts of material were going to be placed over the failing area, so the associated risk of leaving the material in place was minimal. See CCO #5 for allowance of in-place density according to the core method.
CONTINUED ON ADDITIONAL SHEETS
CONTINUED ON ADDITIONAL SHEETS
INVESTIGATION SUMMARY: CONTINUED ON ADDITIONAL SHEETS
COMMENTS OR FOLLOW-UPS:
A request to the Region QA for additional testing will be made to ensure the QC gauge is holding calibration and specified density is being achieved.
ODOT
TEST PROCEDURE OR PROCESS UNDER INVESTIGATION
HMAC Density Testing
X
COMPANY NAME SIGNATURE DATE
QA-V1 QC-V1QC TEST NUMBER ID.QA TEST NUMBER ID.
Distribution: QAC, QC, PM, CPM, QAE and Project File
734-4040-06
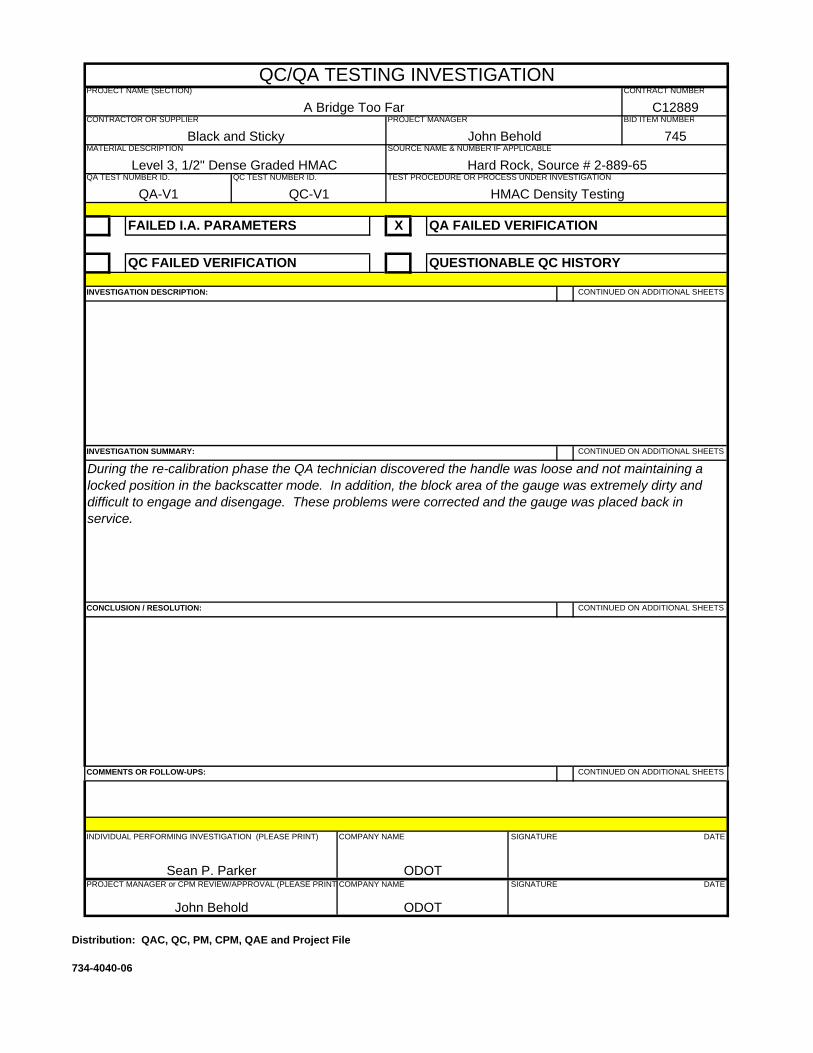
QA-V1 QC-V1QC TEST NUMBER ID.QA TEST NUMBER ID.
ODOT
TEST PROCEDURE OR PROCESS UNDER INVESTIGATION
HMAC Density Testing
COMPANY NAME SIGNATURE DATE
INVESTIGATION SUMMARY: CONTINUED ON ADDITIONAL SHEETS
COMMENTS OR FOLLOW-UPS:
QUESTIONABLE QC HISTORY
CONTINUED ON ADDITIONAL SHEETS
During the re-calibration phase the QA technician discovered the handle was loose and not maintaining a locked position in the backscatter mode. In addition, the block area of the gauge was extremely dirty and difficult to engage and disengage. These problems were corrected and the gauge was placed back in service.
CONCLUSION / RESOLUTION:
CONTINUED ON ADDITIONAL SHEETS
CONTINUED ON ADDITIONAL SHEETS
FAILED I.A. PARAMETERS
QC FAILED VERIFICATION
INVESTIGATION DESCRIPTION:
Sean P. Parker
X
QA FAILED VERIFICATION
INDIVIDUAL PERFORMING INVESTIGATION (PLEASE PRINT)
QC/QA TESTING INVESTIGATIONC12889
CONTRACT NUMBERPROJECT NAME (SECTION)
A Bridge Too FarBID ITEM NUMBER
745Black and Sticky
Level 3, 1/2" Dense Graded HMAC
CONTRACTOR OR SUPPLIER
John BeholdMATERIAL DESCRIPTION
PROJECT MANAGER
Hard Rock, Source # 2-889-65SOURCE NAME & NUMBER IF APPLICABLE
ODOTJohn Behold
SIGNATURE DATECOMPANY NAMEPROJECT MANAGER or CPM REVIEW/APPROVAL (PLEASE PRINT)
Distribution: QAC, QC, PM, CPM, QAE and Project File
734-4040-06
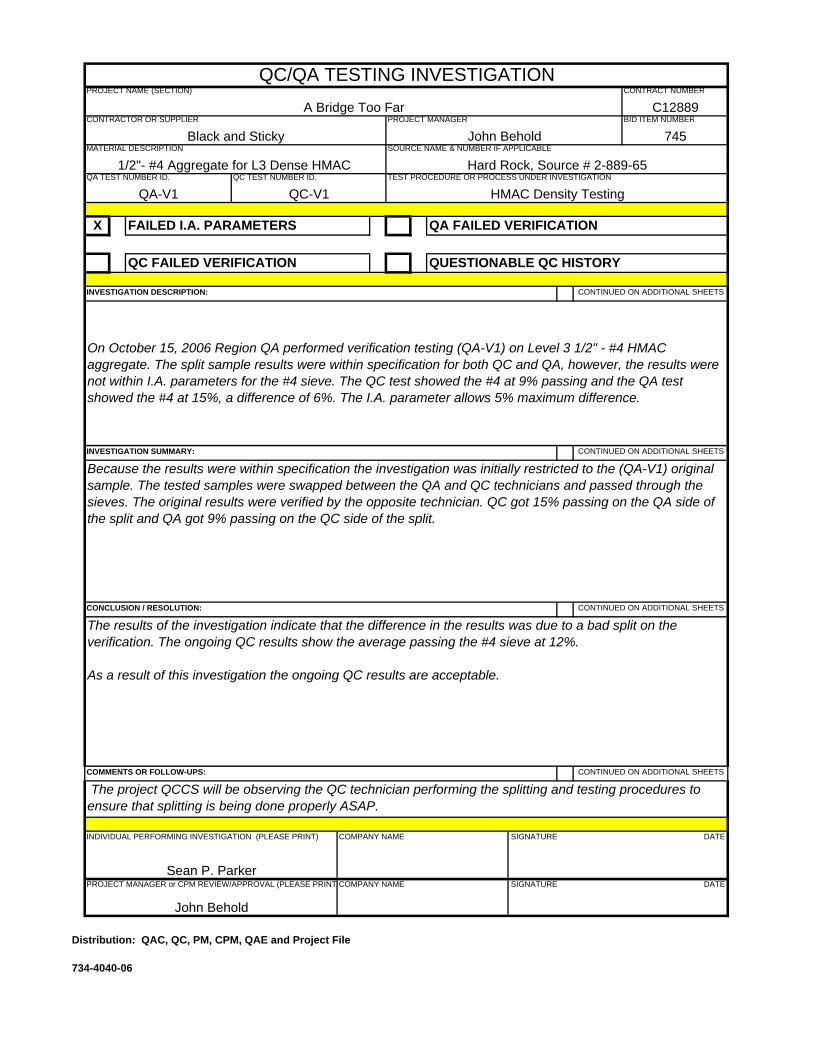
QA-V1 QC-V1QC TEST NUMBER ID.QA TEST NUMBER ID. TEST PROCEDURE OR PROCESS UNDER INVESTIGATION
HMAC Density Testing
COMPANY NAME SIGNATURE DATE
INVESTIGATION SUMMARY: CONTINUED ON ADDITIONAL SHEETS
COMMENTS OR FOLLOW-UPS:
The project QCCS will be observing the QC technician performing the splitting and testing procedures to ensure that splitting is being done properly ASAP.
QUESTIONABLE QC HISTORY
CONTINUED ON ADDITIONAL SHEETS
Because the results were within specification the investigation was initially restricted to the (QA-V1) originalsample. The tested samples were swapped between the QA and QC technicians and passed through thesieves. The original results were verified by the opposite technician. QC got 15% passing on the QA side ofthe split and QA got 9% passing on the QC side of the split.
CONCLUSION / RESOLUTION:
The results of the investigation indicate that the difference in the results was due to a bad split on theverification. The ongoing QC results show the average passing the #4 sieve at 12%.
As a result of this investigation the ongoing QC results are acceptable.
CONTINUED ON ADDITIONAL SHEETS
CONTINUED ON ADDITIONAL SHEETS
X FAILED I.A. PARAMETERS
QC FAILED VERIFICATION
INVESTIGATION DESCRIPTION:
On October 15, 2006 Region QA performed verification testing (QA-V1) on Level 3 1/2" - #4 HMACaggregate. The split sample results were within specification for both QC and QA, however, the results werenot within I.A. parameters for the #4 sieve. The QC test showed the #4 at 9% passing and the QA testshowed the #4 at 15%, a difference of 6%. The I.A. parameter allows 5% maximum difference.
Sean P. Parker
QA FAILED VERIFICATION
INDIVIDUAL PERFORMING INVESTIGATION (PLEASE PRINT)
QC/QA TESTING INVESTIGATIONC12889
CONTRACT NUMBERPROJECT NAME (SECTION)
A Bridge Too FarBID ITEM NUMBER
745Black and Sticky
1/2"- #4 Aggregate for L3 Dense HMAC
CONTRACTOR OR SUPPLIER
John BeholdMATERIAL DESCRIPTION
PROJECT MANAGER
Hard Rock, Source # 2-889-65SOURCE NAME & NUMBER IF APPLICABLE
John Behold
SIGNATURE DATECOMPANY NAMEPROJECT MANAGER or CPM REVIEW/APPROVAL (PLEASE PRINT)
Distribution: QAC, QC, PM, CPM, QAE and Project File
734-4040-06
ODOT Quality Assurance Program
SOURCE REVIEW AND PRODUCT COMPLIANCE TESTING FOR AGGREGATE
Source Review and Product Compliance testing of aggregate is separate from the Quality Control testing performed by the Contractor during aggregate production. These tests are used to evaluate the durability and soundness of the aggregate. In this section Source Review and Product Compliance are defined, the method of numbering sources is described and sampling frequency is outlined. Source Number ODOT Region geologists assign source identification numbers and monitor State-owned and other commercial sources. The ODOT Central Materials Laboratory maintains a database of test results on samples from each source and establishes the testing frequency. Aggregate sources are identified by a three-part number. The first part indicates the county in which the source is located. The second part is the number of that source in the county. The third part is the ODOT region. For example: 22-001-2. The "22" is Linn County (22nd alphabetically), the "001" indicates that it is the first source identified in Linn County, and the "2" indicates that it is in Region 2.
SOURCE REVIEW General Source Review is the testing of unprocessed, uncrushed samples from an aggregate source for the purpose of evaluating the material in the source before it is processed. According to Section 165.04 of the 2002 Standard Specifications a contractor may submit unprocessed aggregate from a maximum of two sources to the ODOT Central Laboratory for testing. This type of testing is optional and is only done at the Contractor’s or supplier’s request to assist in evaluating a source for possible use. The test results are for information only and cannot be used to meet Product Compliance test requirements. Sampling The Contractor or supplier's certified technician shall obtain five 22 kg (50 lb) samples of material. If possible, take each sample from a different area, or depth, of the source from which the Contractor or supplier intends to mine material. Samples shall come from areas that have enough raw materials to produce the quantities required by the project. The technician shall sample the material, properly bag and label it (see Section 4(C)), fill out the Sample Data Sheet (form 734-4000M), and deliver the material to the Project Manager for transmittal to the Central Materials Laboratory. See Section 3, "Report Forms," for examples. After aggregate production begins, the processed aggregate shall also be tested for product compliance. October 2004
1
ODOT Quality Assurance Program
PRODUCT COMPLIANCE
General Once a Contractor or supplier establishes a crushing or screening operation the material produced is subject to testing according to the Project contract documents and Section 4(D) of the MFTP. The tests are used to determine compliance with soundness and durability specifications and can include soundness, degrade, abrasion, lightweight pieces, organics and plasticity index. Not all tests are performed on all aggregates. Refer to the specifications for the specific product. Product Compliance testing used to determine compliance with the specifications must be performed by the ODOT Central Laboratory. Sampling frequency is described below. Sample sizes are listed in Section 4(C). Product compliance testing is required for each aggregate source used on a project. Sampling The Contractor or supplier's certified technician shall obtain two 22 kg (50 lb) samples of each stockpile size for testing at the frequency listed below. The technician shall sample the material, properly bag and label it (see Section 4(C)), fill out the Sample Data Sheet (form 734-4000M), and deliver the material to the Project Manager for transmittal to the Central Materials Laboratory. See Section 3, "Report Forms," for examples. Sampling and Testing Frequency AGGREGATE PRODUCTS - except Asphalt Aggregates: For aggregates which require product compliance testing, sample and submit for testing each separated size of aggregate produced at least once every 12 months. This includes concrete aggregate, base aggregate, shoulder aggregate, riprap aggregate and a few others. ASPHALT AGGREGATE: For aggregate to used in Hot Mixed Asphalt Concrete, Emulsified Asphalt Concrete or Chip Seals, sample and submit each separated size of aggregate to the ODOT Central Lab for product compliance testing at the frequency shown in the Region tables of this section. Sampling frequency varies from one sample per 5 000 Mg (Ton) to one sample per 20 000 Mg (Ton) produced. Sources not listed in the tables shall be sampled and tested once per 5 000 Mg (Ton) produced until enough data has been collected to show that the source consistently meets specifications. The ODOT Pavement Materials Engineer will determine when the sampling frequency can be reduced.
October 2004
2
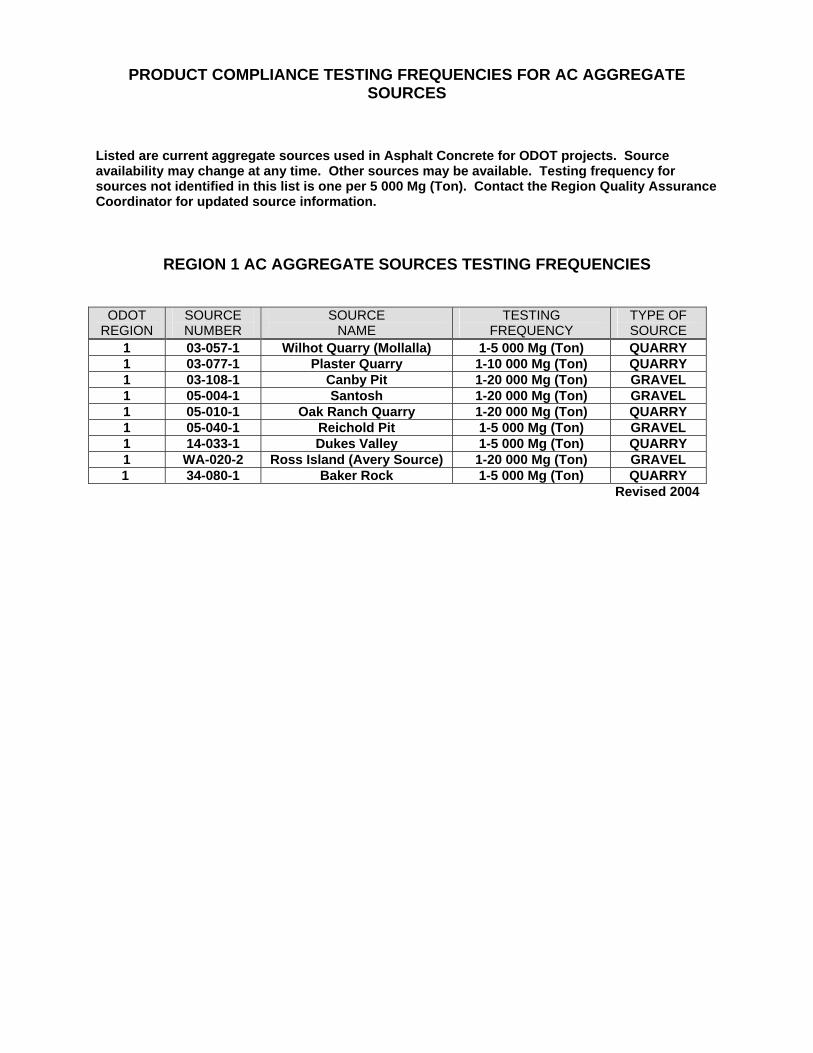
PRODUCT COMPLIANCE TESTING FREQUENCIES FOR AC AGGREGATE SOURCES
Listed are current aggregate sources used in Asphalt Concrete for ODOT projects. Source availability may change at any time. Other sources may be available. Testing frequency for sources not identified in this list is one per 5 000 Mg (Ton). Contact the Region Quality Assurance Coordinator for updated source information.
REGION 1 AC AGGREGATE SOURCES TESTING FREQUENCIES
ODOT
REGION SOURCE NUMBER
SOURCE NAME
TESTING FREQUENCY
TYPE OF SOURCE
1 03-057-1 Wilhot Quarry (Mollalla) 1-5 000 Mg (Ton) QUARRY 1 03-077-1 Plaster Quarry 1-10 000 Mg (Ton) QUARRY 1 03-108-1 Canby Pit 1-20 000 Mg (Ton) GRAVEL 1 05-004-1 Santosh 1-20 000 Mg (Ton) GRAVEL 1 05-010-1 Oak Ranch Quarry 1-20 000 Mg (Ton) QUARRY 1 05-040-1 Reichold Pit 1-5 000 Mg (Ton) GRAVEL 1 14-033-1 Dukes Valley 1-5 000 Mg (Ton) QUARRY 1 WA-020-2 Ross Island (Avery Source) 1-20 000 Mg (Ton) GRAVEL
1 34-080-1 Baker Rock 1-5 000 Mg (Ton) QUARRY Revised 2004
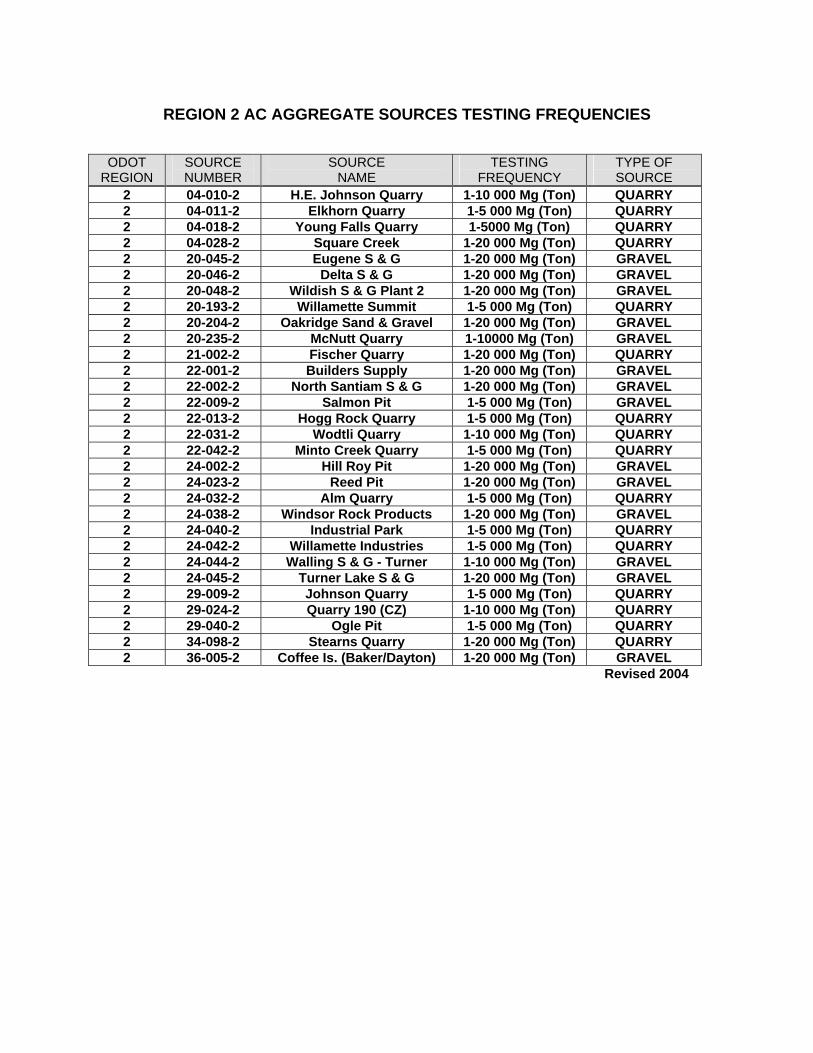
REGION 2 AC AGGREGATE SOURCES TESTING FREQUENCIES
ODOT REGION
SOURCE NUMBER
SOURCE NAME
TESTING FREQUENCY
TYPE OF SOURCE
2 04-010-2 H.E. Johnson Quarry 1-10 000 Mg (Ton) QUARRY 2 04-011-2 Elkhorn Quarry 1-5 000 Mg (Ton) QUARRY 2 04-018-2 Young Falls Quarry 1-5000 Mg (Ton) QUARRY 2 04-028-2 Square Creek 1-20 000 Mg (Ton) QUARRY 2 20-045-2 Eugene S & G 1-20 000 Mg (Ton) GRAVEL 2 20-046-2 Delta S & G 1-20 000 Mg (Ton) GRAVEL 2 20-048-2 Wildish S & G Plant 2 1-20 000 Mg (Ton) GRAVEL 2 20-193-2 Willamette Summit 1-5 000 Mg (Ton) QUARRY 2 20-204-2 Oakridge Sand & Gravel 1-20 000 Mg (Ton) GRAVEL 2 20-235-2 McNutt Quarry 1-10000 Mg (Ton) GRAVEL 2 21-002-2 Fischer Quarry 1-20 000 Mg (Ton) QUARRY 2 22-001-2 Builders Supply 1-20 000 Mg (Ton) GRAVEL 2 22-002-2 North Santiam S & G 1-20 000 Mg (Ton) GRAVEL 2 22-009-2 Salmon Pit 1-5 000 Mg (Ton) GRAVEL 2 22-013-2 Hogg Rock Quarry 1-5 000 Mg (Ton) QUARRY 2 22-031-2 Wodtli Quarry 1-10 000 Mg (Ton) QUARRY 2 22-042-2 Minto Creek Quarry 1-5 000 Mg (Ton) QUARRY 2 24-002-2 Hill Roy Pit 1-20 000 Mg (Ton) GRAVEL 2 24-023-2 Reed Pit 1-20 000 Mg (Ton) GRAVEL 2 24-032-2 Alm Quarry 1-5 000 Mg (Ton) QUARRY 2 24-038-2 Windsor Rock Products 1-20 000 Mg (Ton) GRAVEL 2 24-040-2 Industrial Park 1-5 000 Mg (Ton) QUARRY 2 24-042-2 Willamette Industries 1-5 000 Mg (Ton) QUARRY 2 24-044-2 Walling S & G - Turner 1-10 000 Mg (Ton) GRAVEL 2 24-045-2 Turner Lake S & G 1-20 000 Mg (Ton) GRAVEL 2 29-009-2 Johnson Quarry 1-5 000 Mg (Ton) QUARRY 2 29-024-2 Quarry 190 (CZ) 1-10 000 Mg (Ton) QUARRY 2 29-040-2 Ogle Pit 1-5 000 Mg (Ton) QUARRY 2 34-098-2 Stearns Quarry 1-20 000 Mg (Ton) QUARRY 2 36-005-2 Coffee Is. (Baker/Dayton) 1-20 000 Mg (Ton) GRAVEL
Revised 2004
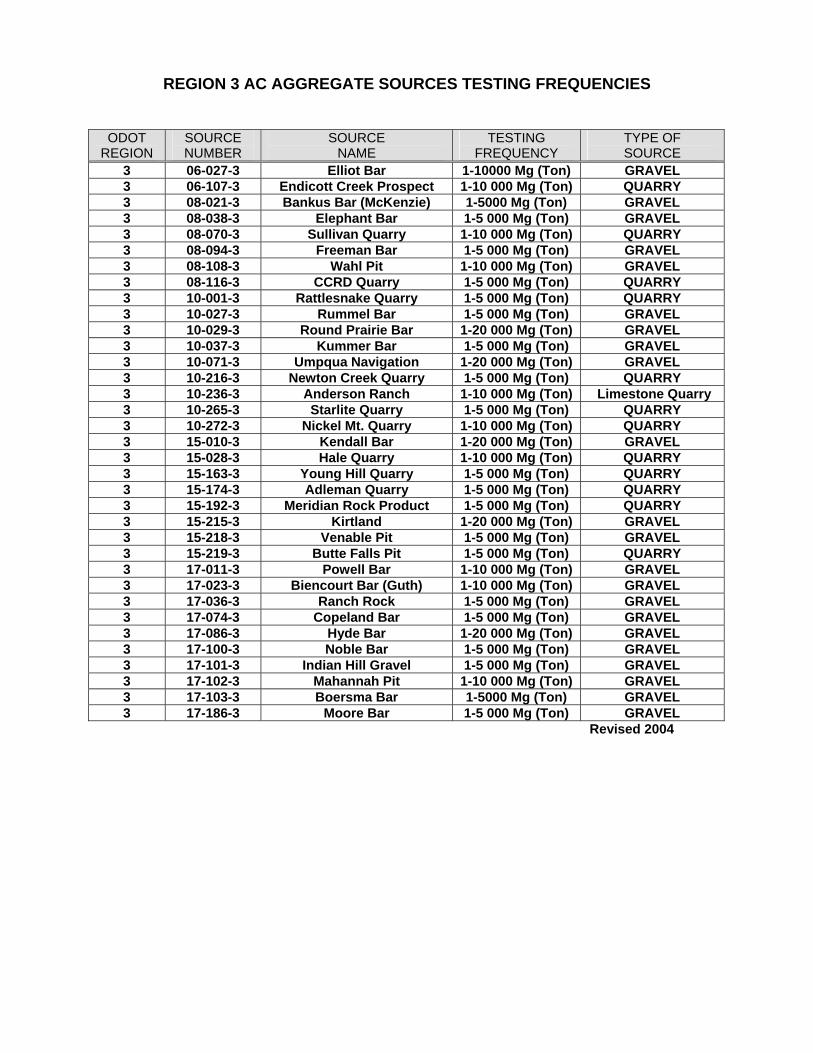
REGION 3 AC AGGREGATE SOURCES TESTING FREQUENCIES
ODOT REGION
SOURCE NUMBER
SOURCE NAME
TESTING FREQUENCY
TYPE OF SOURCE
3 06-027-3 Elliot Bar 1-10000 Mg (Ton) GRAVEL 3 06-107-3 Endicott Creek Prospect 1-10 000 Mg (Ton) QUARRY 3 08-021-3 Bankus Bar (McKenzie) 1-5000 Mg (Ton) GRAVEL 3 08-038-3 Elephant Bar 1-5 000 Mg (Ton) GRAVEL 3 08-070-3 Sullivan Quarry 1-10 000 Mg (Ton) QUARRY 3 08-094-3 Freeman Bar 1-5 000 Mg (Ton) GRAVEL 3 08-108-3 Wahl Pit 1-10 000 Mg (Ton) GRAVEL 3 08-116-3 CCRD Quarry 1-5 000 Mg (Ton) QUARRY 3 10-001-3 Rattlesnake Quarry 1-5 000 Mg (Ton) QUARRY 3 10-027-3 Rummel Bar 1-5 000 Mg (Ton) GRAVEL 3 10-029-3 Round Prairie Bar 1-20 000 Mg (Ton) GRAVEL 3 10-037-3 Kummer Bar 1-5 000 Mg (Ton) GRAVEL 3 10-071-3 Umpqua Navigation 1-20 000 Mg (Ton) GRAVEL 3 10-216-3 Newton Creek Quarry 1-5 000 Mg (Ton) QUARRY 3 10-236-3 Anderson Ranch 1-10 000 Mg (Ton) Limestone Quarry 3 10-265-3 Starlite Quarry 1-5 000 Mg (Ton) QUARRY 3 10-272-3 Nickel Mt. Quarry 1-10 000 Mg (Ton) QUARRY 3 15-010-3 Kendall Bar 1-20 000 Mg (Ton) GRAVEL 3 15-028-3 Hale Quarry 1-10 000 Mg (Ton) QUARRY 3 15-163-3 Young Hill Quarry 1-5 000 Mg (Ton) QUARRY 3 15-174-3 Adleman Quarry 1-5 000 Mg (Ton) QUARRY 3 15-192-3 Meridian Rock Product 1-5 000 Mg (Ton) QUARRY 3 15-215-3 Kirtland 1-20 000 Mg (Ton) GRAVEL 3 15-218-3 Venable Pit 1-5 000 Mg (Ton) GRAVEL 3 15-219-3 Butte Falls Pit 1-5 000 Mg (Ton) QUARRY 3 17-011-3 Powell Bar 1-10 000 Mg (Ton) GRAVEL 3 17-023-3 Biencourt Bar (Guth) 1-10 000 Mg (Ton) GRAVEL 3 17-036-3 Ranch Rock 1-5 000 Mg (Ton) GRAVEL 3 17-074-3 Copeland Bar 1-5 000 Mg (Ton) GRAVEL 3 17-086-3 Hyde Bar 1-20 000 Mg (Ton) GRAVEL 3 17-100-3 Noble Bar 1-5 000 Mg (Ton) GRAVEL 3 17-101-3 Indian Hill Gravel 1-5 000 Mg (Ton) GRAVEL 3 17-102-3 Mahannah Pit 1-10 000 Mg (Ton) GRAVEL 3 17-103-3 Boersma Bar 1-5000 Mg (Ton) GRAVEL 3 17-186-3 Moore Bar 1-5 000 Mg (Ton) GRAVEL
Revised 2004
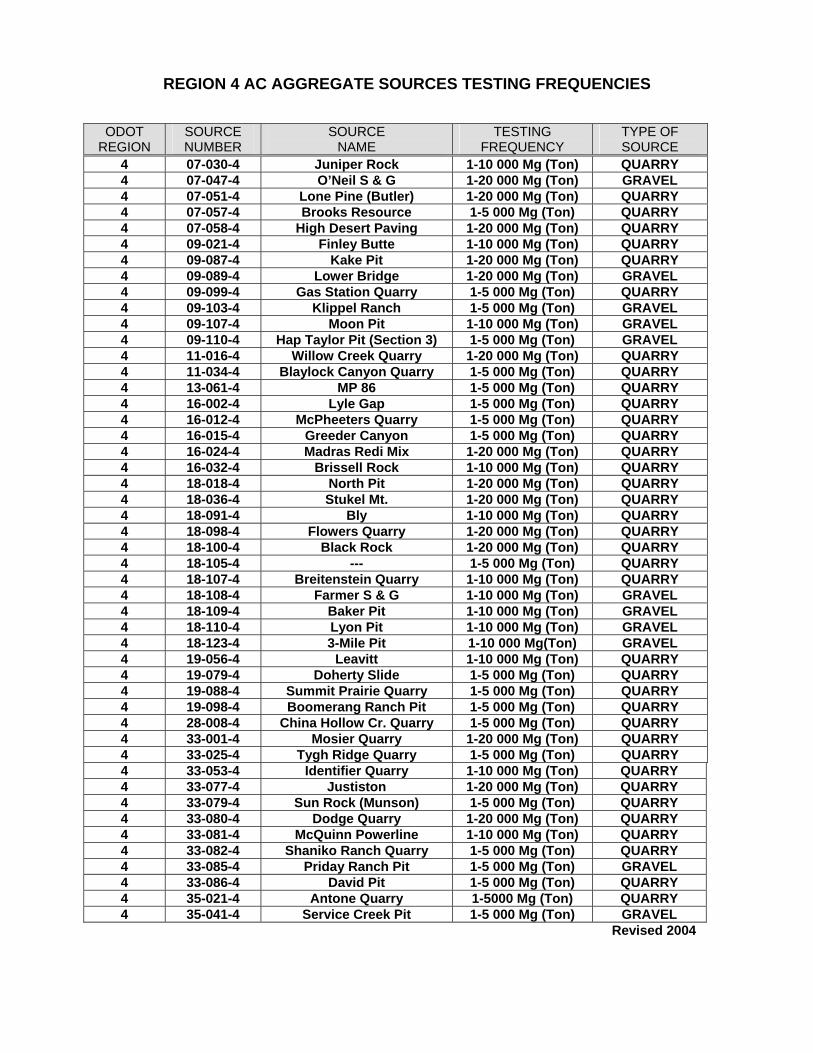
REGION 4 AC AGGREGATE SOURCES TESTING FREQUENCIES
ODOT REGION
SOURCE NUMBER
SOURCE NAME
TESTING FREQUENCY
TYPE OF SOURCE
4 07-030-4 Juniper Rock 1-10 000 Mg (Ton) QUARRY 4 07-047-4 O’Neil S & G 1-20 000 Mg (Ton) GRAVEL 4 07-051-4 Lone Pine (Butler) 1-20 000 Mg (Ton) QUARRY 4 07-057-4 Brooks Resource 1-5 000 Mg (Ton) QUARRY 4 07-058-4 High Desert Paving 1-20 000 Mg (Ton) QUARRY 4 09-021-4 Finley Butte 1-10 000 Mg (Ton) QUARRY 4 09-087-4 Kake Pit 1-20 000 Mg (Ton) QUARRY 4 09-089-4 Lower Bridge 1-20 000 Mg (Ton) GRAVEL 4 09-099-4 Gas Station Quarry 1-5 000 Mg (Ton) QUARRY 4 09-103-4 Klippel Ranch 1-5 000 Mg (Ton) GRAVEL 4 09-107-4 Moon Pit 1-10 000 Mg (Ton) GRAVEL 4 09-110-4 Hap Taylor Pit (Section 3) 1-5 000 Mg (Ton) GRAVEL 4 11-016-4 Willow Creek Quarry 1-20 000 Mg (Ton) QUARRY 4 11-034-4 Blaylock Canyon Quarry 1-5 000 Mg (Ton) QUARRY 4 13-061-4 MP 86 1-5 000 Mg (Ton) QUARRY 4 16-002-4 Lyle Gap 1-5 000 Mg (Ton) QUARRY 4 16-012-4 McPheeters Quarry 1-5 000 Mg (Ton) QUARRY 4 16-015-4 Greeder Canyon 1-5 000 Mg (Ton) QUARRY 4 16-024-4 Madras Redi Mix 1-20 000 Mg (Ton) QUARRY 4 16-032-4 Brissell Rock 1-10 000 Mg (Ton) QUARRY 4 18-018-4 North Pit 1-20 000 Mg (Ton) QUARRY 4 18-036-4 Stukel Mt. 1-20 000 Mg (Ton) QUARRY 4 18-091-4 Bly 1-10 000 Mg (Ton) QUARRY 4 18-098-4 Flowers Quarry 1-20 000 Mg (Ton) QUARRY 4 18-100-4 Black Rock 1-20 000 Mg (Ton) QUARRY 4 18-105-4 --- 1-5 000 Mg (Ton) QUARRY 4 18-107-4 Breitenstein Quarry 1-10 000 Mg (Ton) QUARRY 4 18-108-4 Farmer S & G 1-10 000 Mg (Ton) GRAVEL 4 18-109-4 Baker Pit 1-10 000 Mg (Ton) GRAVEL 4 18-110-4 Lyon Pit 1-10 000 Mg (Ton) GRAVEL 4 18-123-4 3-Mile Pit 1-10 000 Mg(Ton) GRAVEL 4 19-056-4 Leavitt 1-10 000 Mg (Ton) QUARRY 4 19-079-4 Doherty Slide 1-5 000 Mg (Ton) QUARRY 4 19-088-4 Summit Prairie Quarry 1-5 000 Mg (Ton) QUARRY 4 19-098-4 Boomerang Ranch Pit 1-5 000 Mg (Ton) QUARRY 4 28-008-4 China Hollow Cr. Quarry 1-5 000 Mg (Ton) QUARRY 4 33-001-4 Mosier Quarry 1-20 000 Mg (Ton) QUARRY 4 33-025-4 Tygh Ridge Quarry 1-5 000 Mg (Ton) QUARRY 4 33-053-4 Identifier Quarry 1-10 000 Mg (Ton) QUARRY 4 33-077-4 Justiston 1-20 000 Mg (Ton) QUARRY 4 33-079-4 Sun Rock (Munson) 1-5 000 Mg (Ton) QUARRY 4 33-080-4 Dodge Quarry 1-20 000 Mg (Ton) QUARRY 4 33-081-4 McQuinn Powerline 1-10 000 Mg (Ton) QUARRY 4 33-082-4 Shaniko Ranch Quarry 1-5 000 Mg (Ton) QUARRY 4 33-085-4 Priday Ranch Pit 1-5 000 Mg (Ton) GRAVEL 4 33-086-4 David Pit 1-5 000 Mg (Ton) QUARRY 4 35-021-4 Antone Quarry 1-5000 Mg (Ton) QUARRY 4 35-041-4 Service Creek Pit 1-5 000 Mg (Ton) GRAVEL
Revised 2004
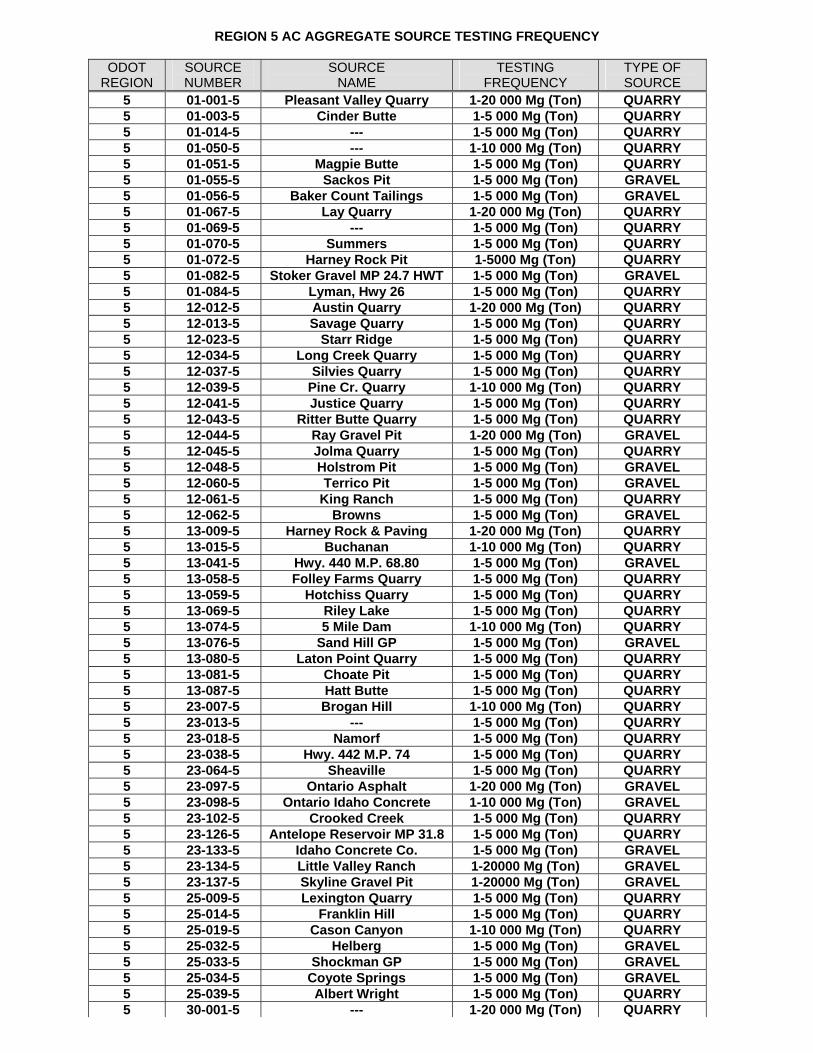
REGION 5 AC AGGREGATE SOURCE TESTING FREQUENCY
ODOT REGION
SOURCE NUMBER
SOURCE NAME
TESTING FREQUENCY
TYPE OF SOURCE
5 01-001-5 Pleasant Valley Quarry 1-20 000 Mg (Ton) QUARRY 5 01-003-5 Cinder Butte 1-5 000 Mg (Ton) QUARRY 5 01-014-5 --- 1-5 000 Mg (Ton) QUARRY 5 01-050-5 --- 1-10 000 Mg (Ton) QUARRY 5 01-051-5 Magpie Butte 1-5 000 Mg (Ton) QUARRY 5 01-055-5 Sackos Pit 1-5 000 Mg (Ton) GRAVEL 5 01-056-5 Baker Count Tailings 1-5 000 Mg (Ton) GRAVEL 5 01-067-5 Lay Quarry 1-20 000 Mg (Ton) QUARRY 5 01-069-5 --- 1-5 000 Mg (Ton) QUARRY 5 01-070-5 Summers 1-5 000 Mg (Ton) QUARRY 5 01-072-5 Harney Rock Pit 1-5000 Mg (Ton) QUARRY 5 01-082-5 Stoker Gravel MP 24.7 HWT 1-5 000 Mg (Ton) GRAVEL 5 01-084-5 Lyman, Hwy 26 1-5 000 Mg (Ton) QUARRY 5 12-012-5 Austin Quarry 1-20 000 Mg (Ton) QUARRY 5 12-013-5 Savage Quarry 1-5 000 Mg (Ton) QUARRY 5 12-023-5 Starr Ridge 1-5 000 Mg (Ton) QUARRY 5 12-034-5 Long Creek Quarry 1-5 000 Mg (Ton) QUARRY 5 12-037-5 Silvies Quarry 1-5 000 Mg (Ton) QUARRY 5 12-039-5 Pine Cr. Quarry 1-10 000 Mg (Ton) QUARRY 5 12-041-5 Justice Quarry 1-5 000 Mg (Ton) QUARRY 5 12-043-5 Ritter Butte Quarry 1-5 000 Mg (Ton) QUARRY 5 12-044-5 Ray Gravel Pit 1-20 000 Mg (Ton) GRAVEL 5 12-045-5 Jolma Quarry 1-5 000 Mg (Ton) QUARRY 5 12-048-5 Holstrom Pit 1-5 000 Mg (Ton) GRAVEL 5 12-060-5 Terrico Pit 1-5 000 Mg (Ton) GRAVEL 5 12-061-5 King Ranch 1-5 000 Mg (Ton) QUARRY 5 12-062-5 Browns 1-5 000 Mg (Ton) GRAVEL 5 13-009-5 Harney Rock & Paving 1-20 000 Mg (Ton) QUARRY 5 13-015-5 Buchanan 1-10 000 Mg (Ton) QUARRY 5 13-041-5 Hwy. 440 M.P. 68.80 1-5 000 Mg (Ton) GRAVEL 5 13-058-5 Folley Farms Quarry 1-5 000 Mg (Ton) QUARRY 5 13-059-5 Hotchiss Quarry 1-5 000 Mg (Ton) QUARRY 5 13-069-5 Riley Lake 1-5 000 Mg (Ton) QUARRY 5 13-074-5 5 Mile Dam 1-10 000 Mg (Ton) QUARRY 5 13-076-5 Sand Hill GP 1-5 000 Mg (Ton) GRAVEL 5 13-080-5 Laton Point Quarry 1-5 000 Mg (Ton) QUARRY 5 13-081-5 Choate Pit 1-5 000 Mg (Ton) QUARRY 5 13-087-5 Hatt Butte 1-5 000 Mg (Ton) QUARRY 5 23-007-5 Brogan Hill 1-10 000 Mg (Ton) QUARRY 5 23-013-5 --- 1-5 000 Mg (Ton) QUARRY 5 23-018-5 Namorf 1-5 000 Mg (Ton) QUARRY 5 23-038-5 Hwy. 442 M.P. 74 1-5 000 Mg (Ton) QUARRY 5 23-064-5 Sheaville 1-5 000 Mg (Ton) QUARRY 5 23-097-5 Ontario Asphalt 1-20 000 Mg (Ton) GRAVEL 5 23-098-5 Ontario Idaho Concrete 1-10 000 Mg (Ton) GRAVEL 5 23-102-5 Crooked Creek 1-5 000 Mg (Ton) QUARRY 5 23-126-5 Antelope Reservoir MP 31.8 1-5 000 Mg (Ton) QUARRY 5 23-133-5 Idaho Concrete Co. 1-5 000 Mg (Ton) GRAVEL 5 23-134-5 Little Valley Ranch 1-20000 Mg (Ton) GRAVEL 5 23-137-5 Skyline Gravel Pit 1-20000 Mg (Ton) GRAVEL 5 25-009-5 Lexington Quarry 1-5 000 Mg (Ton) QUARRY 5 25-014-5 Franklin Hill 1-5 000 Mg (Ton) QUARRY 5 25-019-5 Cason Canyon 1-10 000 Mg (Ton) QUARRY 5 25-032-5 Helberg 1-5 000 Mg (Ton) GRAVEL 5 25-033-5 Shockman GP 1-5 000 Mg (Ton) GRAVEL 5 25-034-5 Coyote Springs 1-5 000 Mg (Ton) GRAVEL 5 25-039-5 Albert Wright 1-5 000 Mg (Ton) QUARRY 5 30-001-5 --- 1-20 000 Mg (Ton) QUARRY
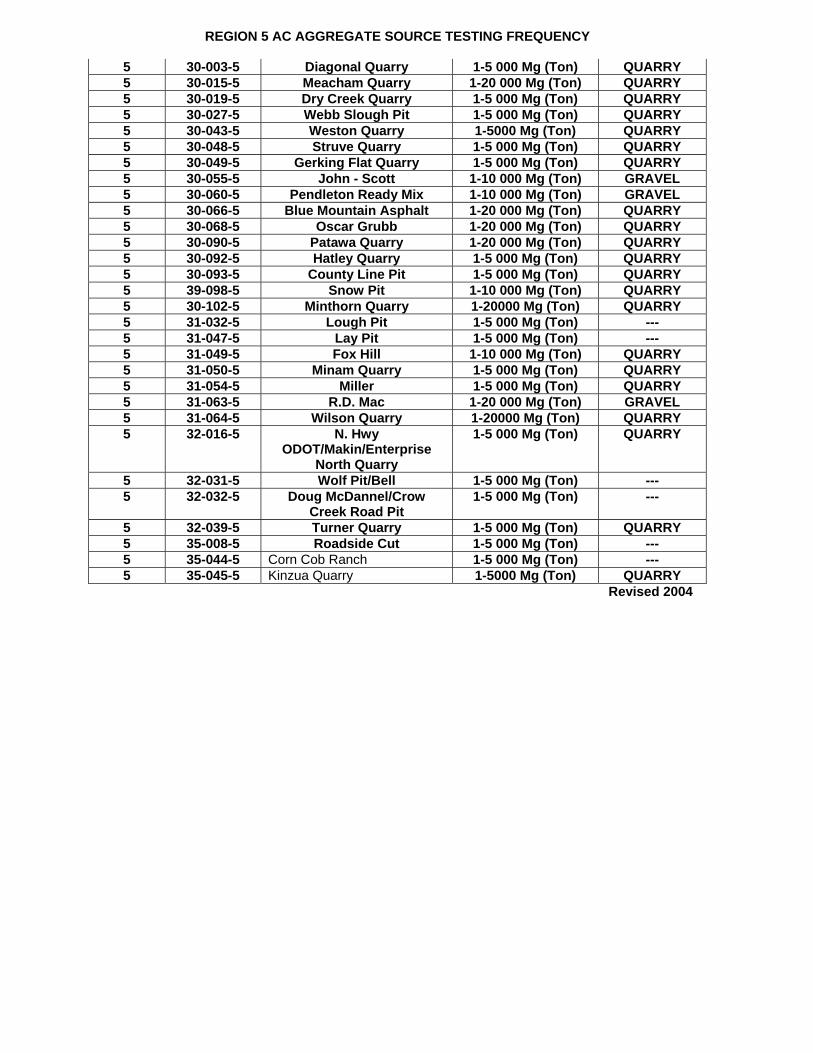
REGION 5 AC AGGREGATE SOURCE TESTING FREQUENCY
5 30-003-5 Diagonal Quarry 1-5 000 Mg (Ton) QUARRY 5 30-015-5 Meacham Quarry 1-20 000 Mg (Ton) QUARRY 5 30-019-5 Dry Creek Quarry 1-5 000 Mg (Ton) QUARRY 5 30-027-5 Webb Slough Pit 1-5 000 Mg (Ton) QUARRY 5 30-043-5 Weston Quarry 1-5000 Mg (Ton) QUARRY 5 30-048-5 Struve Quarry 1-5 000 Mg (Ton) QUARRY 5 30-049-5 Gerking Flat Quarry 1-5 000 Mg (Ton) QUARRY 5 30-055-5 John - Scott 1-10 000 Mg (Ton) GRAVEL 5 30-060-5 Pendleton Ready Mix 1-10 000 Mg (Ton) GRAVEL 5 30-066-5 Blue Mountain Asphalt 1-20 000 Mg (Ton) QUARRY 5 30-068-5 Oscar Grubb 1-20 000 Mg (Ton) QUARRY 5 30-090-5 Patawa Quarry 1-20 000 Mg (Ton) QUARRY 5 30-092-5 Hatley Quarry 1-5 000 Mg (Ton) QUARRY 5 30-093-5 County Line Pit 1-5 000 Mg (Ton) QUARRY 5 39-098-5 Snow Pit 1-10 000 Mg (Ton) QUARRY 5 30-102-5 Minthorn Quarry 1-20000 Mg (Ton) QUARRY 5 31-032-5 Lough Pit 1-5 000 Mg (Ton) --- 5 31-047-5 Lay Pit 1-5 000 Mg (Ton) --- 5 31-049-5 Fox Hill 1-10 000 Mg (Ton) QUARRY 5 31-050-5 Minam Quarry 1-5 000 Mg (Ton) QUARRY 5 31-054-5 Miller 1-5 000 Mg (Ton) QUARRY 5 31-063-5 R.D. Mac 1-20 000 Mg (Ton) GRAVEL 5 31-064-5 Wilson Quarry 1-20000 Mg (Ton) QUARRY 5 32-016-5 N. Hwy
ODOT/Makin/Enterprise North Quarry
1-5 000 Mg (Ton) QUARRY
5 32-031-5 Wolf Pit/Bell 1-5 000 Mg (Ton) --- 5 32-032-5 Doug McDannel/Crow
Creek Road Pit 1-5 000 Mg (Ton) ---
5 32-039-5 Turner Quarry 1-5 000 Mg (Ton) QUARRY 5 35-008-5 Roadside Cut 1-5 000 Mg (Ton) --- 5 35-044-5 Corn Cob Ranch 1-5 000 Mg (Ton) --- 5 35-045-5 Kinzua Quarry 1-5000 Mg (Ton) QUARRY
Revised 2004
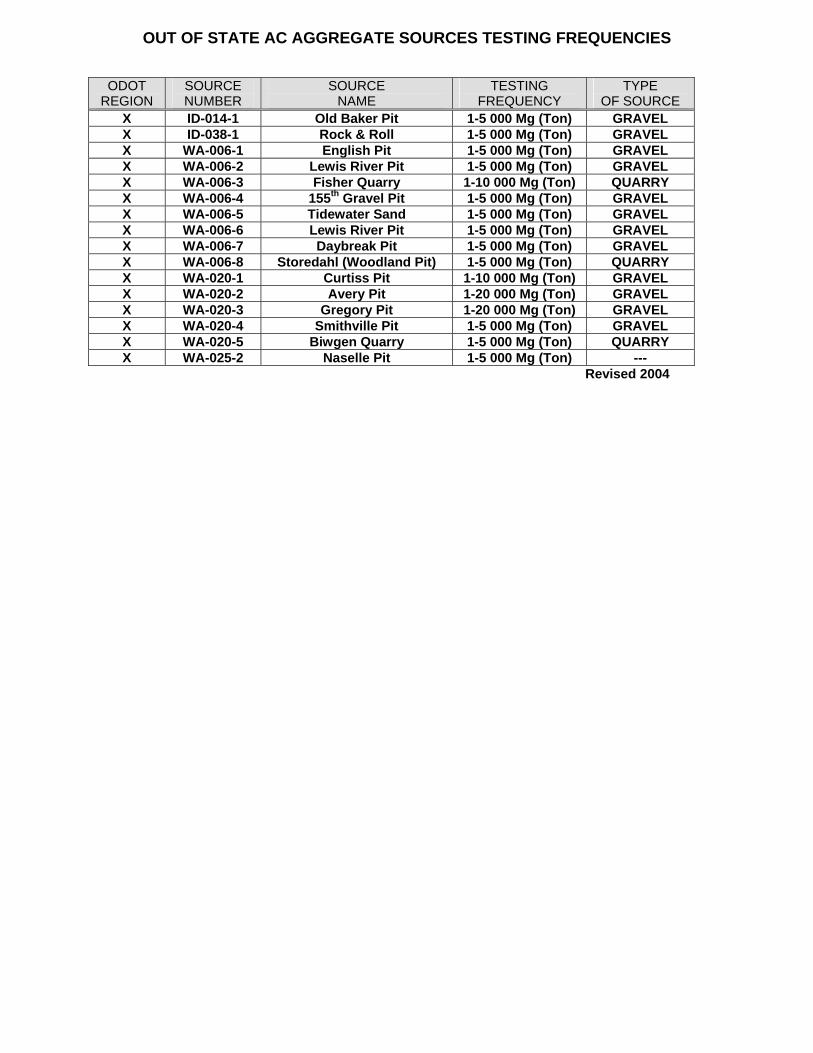
OUT OF STATE AC AGGREGATE SOURCES TESTING FREQUENCIES
ODOT REGION
SOURCE NUMBER
SOURCE NAME
TESTING FREQUENCY
TYPE OF SOURCE
X ID-014-1 Old Baker Pit 1-5 000 Mg (Ton) GRAVEL X ID-038-1 Rock & Roll 1-5 000 Mg (Ton) GRAVEL X WA-006-1 English Pit 1-5 000 Mg (Ton) GRAVEL X WA-006-2 Lewis River Pit 1-5 000 Mg (Ton) GRAVEL X WA-006-3 Fisher Quarry 1-10 000 Mg (Ton) QUARRY X WA-006-4 155th Gravel Pit 1-5 000 Mg (Ton) GRAVEL X WA-006-5 Tidewater Sand 1-5 000 Mg (Ton) GRAVEL X WA-006-6 Lewis River Pit 1-5 000 Mg (Ton) GRAVEL X WA-006-7 Daybreak Pit 1-5 000 Mg (Ton) GRAVEL X WA-006-8 Storedahl (Woodland Pit) 1-5 000 Mg (Ton) QUARRY X WA-020-1 Curtiss Pit 1-10 000 Mg (Ton) GRAVEL X WA-020-2 Avery Pit 1-20 000 Mg (Ton) GRAVEL X WA-020-3 Gregory Pit 1-20 000 Mg (Ton) GRAVEL X WA-020-4 Smithville Pit 1-5 000 Mg (Ton) GRAVEL X WA-020-5 Biwgen Quarry 1-5 000 Mg (Ton) QUARRY X WA-025-2 Naselle Pit 1-5 000 Mg (Ton) ---
Revised 2004
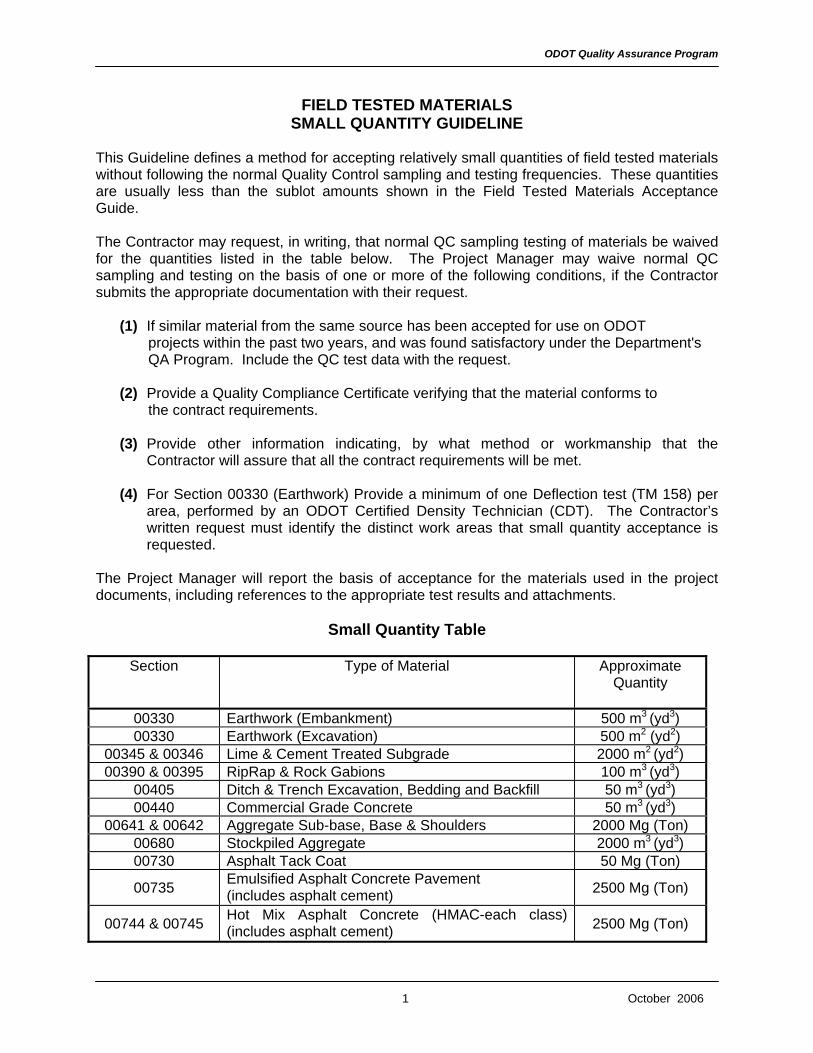
ODOT Quality Assurance Program
FIELD TESTED MATERIALS SMALL QUANTITY GUIDELINE
This Guideline defines a method for accepting relatively small quantities of field tested materials without following the normal Quality Control sampling and testing frequencies. These quantities are usually less than the sublot amounts shown in the Field Tested Materials Acceptance Guide. The Contractor may request, in writing, that normal QC sampling testing of materials be waived for the quantities listed in the table below. The Project Manager may waive normal QC sampling and testing on the basis of one or more of the following conditions, if the Contractor submits the appropriate documentation with their request.
(1) If similar material from the same source has been accepted for use on ODOT projects within the past two years, and was found satisfactory under the Department's QA Program. Include the QC test data with the request. (2) Provide a Quality Compliance Certificate verifying that the material conforms to the contract requirements.
(3) Provide other information indicating, by what method or workmanship that the
Contractor will assure that all the contract requirements will be met.
(4) For Section 00330 (Earthwork) Provide a minimum of one Deflection test (TM 158) per area, performed by an ODOT Certified Density Technician (CDT). The Contractor’s written request must identify the distinct work areas that small quantity acceptance is requested.
The Project Manager will report the basis of acceptance for the materials used in the project documents, including references to the appropriate test results and attachments.
Small Quantity Table
Section Type of Material Approximate Quantity
00330 Earthwork (Embankment) 500 m3 (yd3) 00330 Earthwork (Excavation) 500 m2 (yd2)
00345 & 00346 Lime & Cement Treated Subgrade 2000 m2 (yd2) 00390 & 00395 RipRap & Rock Gabions 100 m3 (yd3)
00405 Ditch & Trench Excavation, Bedding and Backfill 50 m3 (yd3) 00440 Commercial Grade Concrete 50 m3 (yd3)
00641 & 00642 Aggregate Sub-base, Base & Shoulders 2000 Mg (Ton) 00680 Stockpiled Aggregate 2000 m3 (yd3) 00730 Asphalt Tack Coat 50 Mg (Ton)
00735 Emulsified Asphalt Concrete Pavement (includes asphalt cement) 2500 Mg (Ton)
00744 & 00745 Hot Mix Asphalt Concrete (HMAC-each class) (includes asphalt cement) 2500 Mg (Ton)
October 2006 1
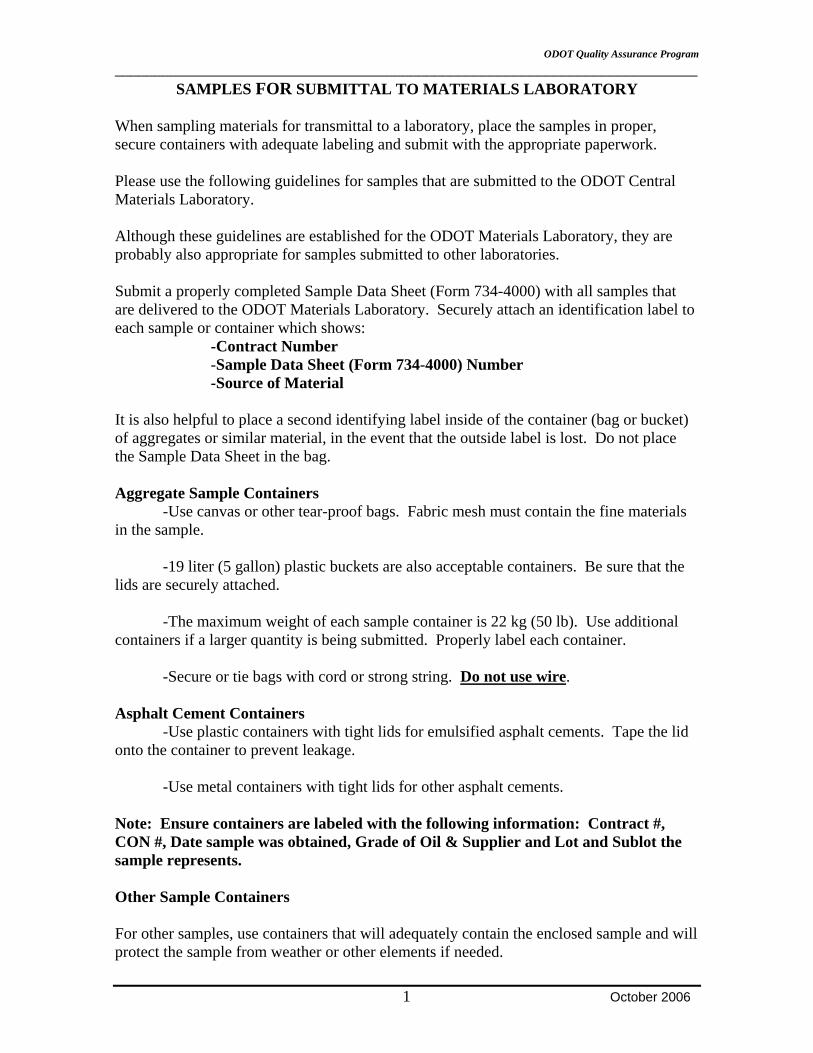
ODOT Quality Assurance Program _________________________________________________________________________
1 October 2006
SAMPLES FOR SUBMITTAL TO MATERIALS LABORATORY
When sampling materials for transmittal to a laboratory, place the samples in proper, secure containers with adequate labeling and submit with the appropriate paperwork. Please use the following guidelines for samples that are submitted to the ODOT Central Materials Laboratory. Although these guidelines are established for the ODOT Materials Laboratory, they are probably also appropriate for samples submitted to other laboratories. Submit a properly completed Sample Data Sheet (Form 734-4000) with all samples that are delivered to the ODOT Materials Laboratory. Securely attach an identification label to each sample or container which shows: -Contract Number -Sample Data Sheet (Form 734-4000) Number -Source of Material It is also helpful to place a second identifying label inside of the container (bag or bucket) of aggregates or similar material, in the event that the outside label is lost. Do not place the Sample Data Sheet in the bag. Aggregate Sample Containers -Use canvas or other tear-proof bags. Fabric mesh must contain the fine materials in the sample. -19 liter (5 gallon) plastic buckets are also acceptable containers. Be sure that the lids are securely attached. -The maximum weight of each sample container is 22 kg (50 lb). Use additional containers if a larger quantity is being submitted. Properly label each container. -Secure or tie bags with cord or strong string. Do not use wire. Asphalt Cement Containers -Use plastic containers with tight lids for emulsified asphalt cements. Tape the lid onto the container to prevent leakage. -Use metal containers with tight lids for other asphalt cements. Note: Ensure containers are labeled with the following information: Contract #, CON #, Date sample was obtained, Grade of Oil & Supplier and Lot and Sublot the sample represents. Other Sample Containers For other samples, use containers that will adequately contain the enclosed sample and will protect the sample from weather or other elements if needed.
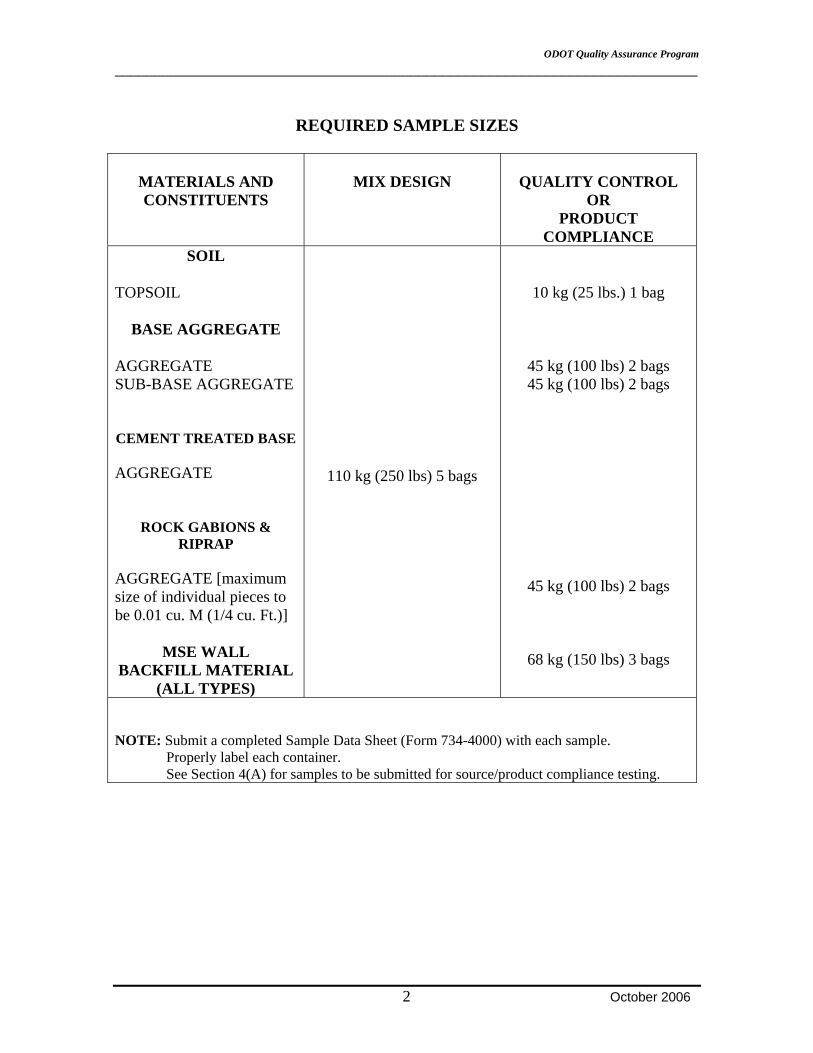
ODOT Quality Assurance Program _________________________________________________________________________
2 October 2006
REQUIRED SAMPLE SIZES
MATERIALS AND CONSTITUENTS
MIX DESIGN
QUALITY CONTROL
OR PRODUCT
COMPLIANCE SOIL
TOPSOIL
BASE AGGREGATE
AGGREGATE SUB-BASE AGGREGATE CEMENT TREATED BASE
AGGREGATE
ROCK GABIONS & RIPRAP
AGGREGATE [maximum size of individual pieces to be 0.01 cu. M (1/4 cu. Ft.)]
MSE WALL BACKFILL MATERIAL
(ALL TYPES)
110 kg (250 lbs) 5 bags
10 kg (25 lbs.) 1 bag
45 kg (100 lbs) 2 bags 45 kg (100 lbs) 2 bags
45 kg (100 lbs) 2 bags
68 kg (150 lbs) 3 bags
NOTE: Submit a completed Sample Data Sheet (Form 734-4000) with each sample. Properly label each container. See Section 4(A) for samples to be submitted for source/product compliance testing.
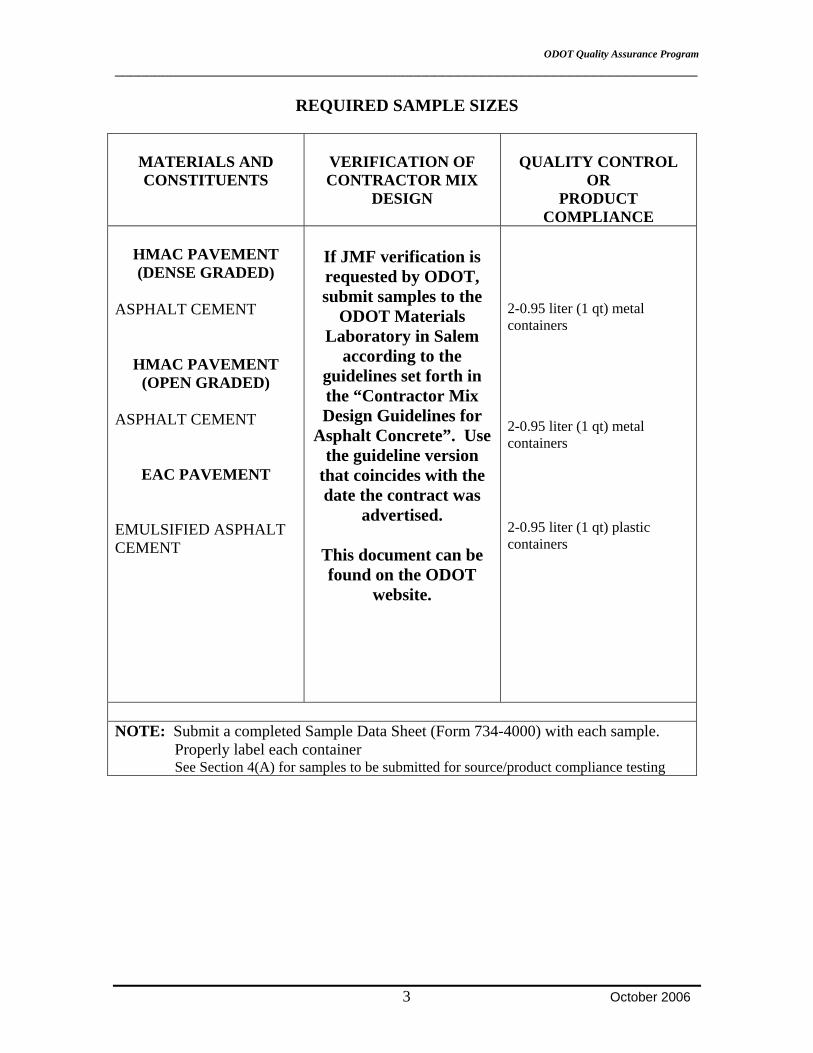
ODOT Quality Assurance Program _________________________________________________________________________
3 October 2006
REQUIRED SAMPLE SIZES
MATERIALS AND CONSTITUENTS
VERIFICATION OF CONTRACTOR MIX
DESIGN
QUALITY CONTROL
OR PRODUCT
COMPLIANCE
HMAC PAVEMENT (DENSE GRADED)
ASPHALT CEMENT
HMAC PAVEMENT (OPEN GRADED)
ASPHALT CEMENT
EAC PAVEMENT
EMULSIFIED ASPHALT CEMENT
If JMF verification is requested by ODOT, submit samples to the
ODOT Materials Laboratory in Salem
according to the guidelines set forth in the “Contractor Mix Design Guidelines for
Asphalt Concrete”. Use the guideline version
that coincides with the date the contract was
advertised.
This document can be found on the ODOT
website.
2-0.95 liter (1 qt) metal containers 2-0.95 liter (1 qt) metal containers 2-0.95 liter (1 qt) plastic containers
NOTE: Submit a completed Sample Data Sheet (Form 734-4000) with each sample. Properly label each container See Section 4(A) for samples to be submitted for source/product compliance testing
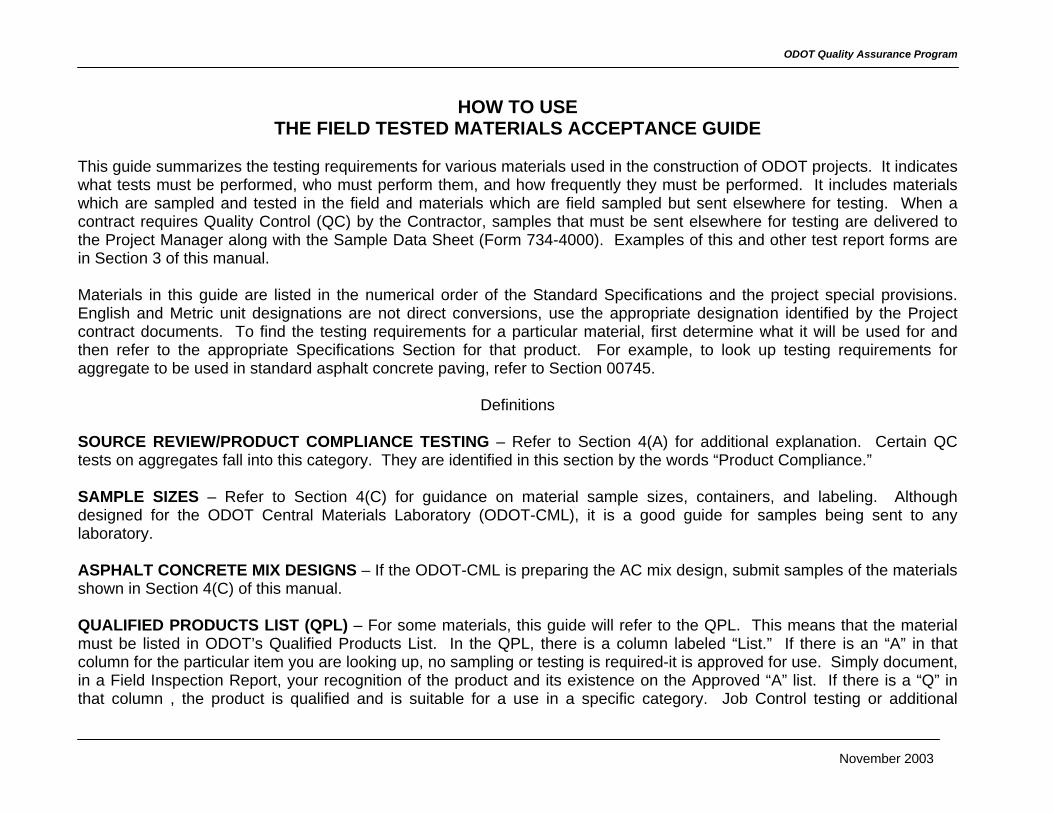
ODOT Quality Assurance Program
HOW TO USE THE FIELD TESTED MATERIALS ACCEPTANCE GUIDE
This guide summarizes the testing requirements for various materials used in the construction of ODOT projects. It indicates what tests must be performed, who must perform them, and how frequently they must be performed. It includes materials which are sampled and tested in the field and materials which are field sampled but sent elsewhere for testing. When a contract requires Quality Control (QC) by the Contractor, samples that must be sent elsewhere for testing are delivered to the Project Manager along with the Sample Data Sheet (Form 734-4000). Examples of this and other test report forms are in Section 3 of this manual. Materials in this guide are listed in the numerical order of the Standard Specifications and the project special provisions. English and Metric unit designations are not direct conversions, use the appropriate designation identified by the Project contract documents. To find the testing requirements for a particular material, first determine what it will be used for and then refer to the appropriate Specifications Section for that product. For example, to look up testing requirements for aggregate to be used in standard asphalt concrete paving, refer to Section 00745.
Definitions SOURCE REVIEW/PRODUCT COMPLIANCE TESTING – Refer to Section 4(A) for additional explanation. Certain QC tests on aggregates fall into this category. They are identified in this section by the words “Product Compliance.” SAMPLE SIZES – Refer to Section 4(C) for guidance on material sample sizes, containers, and labeling. Although designed for the ODOT Central Materials Laboratory (ODOT-CML), it is a good guide for samples being sent to any laboratory. ASPHALT CONCRETE MIX DESIGNS – If the ODOT-CML is preparing the AC mix design, submit samples of the materials shown in Section 4(C) of this manual. QUALIFIED PRODUCTS LIST (QPL) – For some materials, this guide will refer to the QPL. This means that the material must be listed in ODOT’s Qualified Products List. In the QPL, there is a column labeled “List.” If there is an “A” in that column for the particular item you are looking up, no sampling or testing is required-it is approved for use. Simply document, in a Field Inspection Report, your recognition of the product and its existence on the Approved “A” list. If there is a “Q” in that column , the product is qualified and is suitable for a use in a specific category. Job Control testing or additional
November 2003
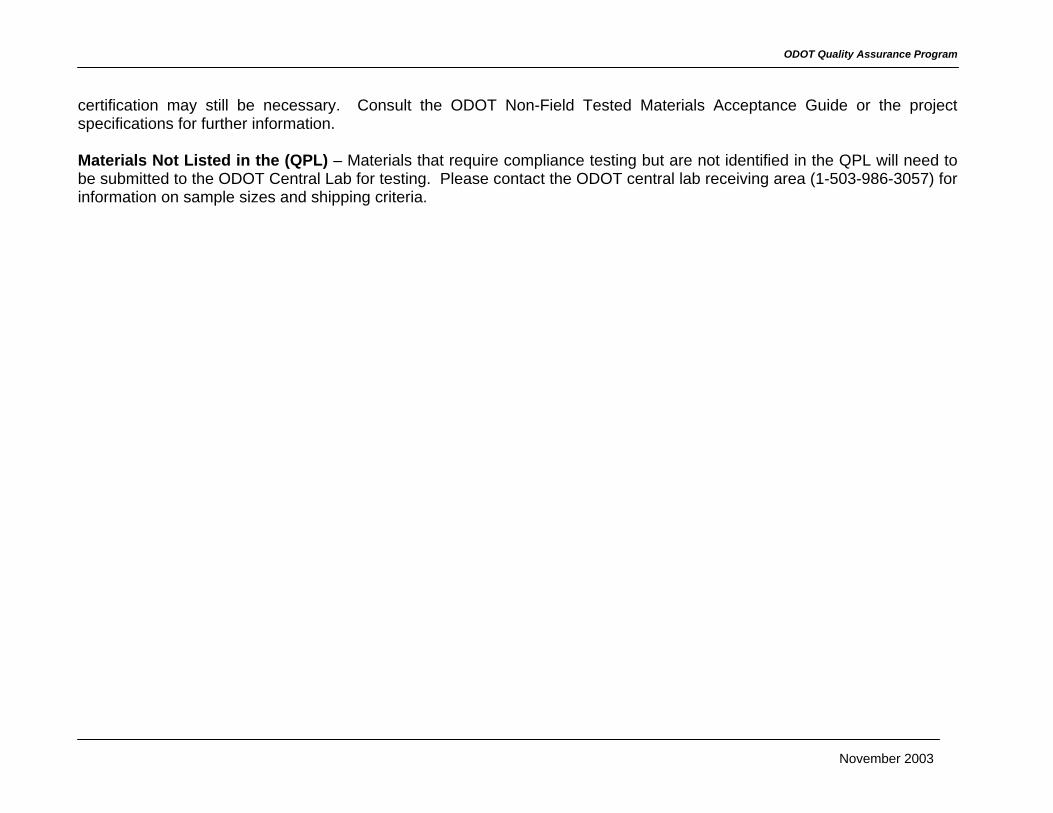
ODOT Quality Assurance Program
certification may still be necessary. Consult the ODOT Non-Field Tested Materials Acceptance Guide or the project specifications for further information. Materials Not Listed in the (QPL) – Materials that require compliance testing but are not identified in the QPL will need to be submitted to the ODOT Central Lab for testing. Please contact the ODOT central lab receiving area (1-503-986-3057) for information on sample sizes and shipping criteria.
November 2003

ODOT Quality Assurance Program
TYPES OF TESTS
The following types of tests will be performed by the Contractor or Engineer on materials and products required for contract work: 1. Source Review – This test type is addressed in Section 4(A) of this Manual.
The Engineer will test unprocessed material from an aggregate source, if requested by the Contractor, to provide information about the quality of material. Tests will involve degradation, soundness, and abrasion, but may involve other tests. Favorable test results do not imply that processed material from the source will comply with specifications after it is processed as required for the project.
2. Product Compliance – This test type is addressed in Section 4(A) of this Manual. The Engineer will test processed material if process control testing indicates
that the processed material meets the contract quality requirements. Tests will involve degradation, soundness, abrasion, and lightweight pieces, but may involve other tests. The material shall not be incorporated into the project unless Product Compliance tests show favorable results.
3. Quality Control – The Contractor will perform quality control testing as described in Section 2 and specified in 4(D) of this Manual or as modified by the Special
Provisions or Supplemental Standard Specifications. 4. Verification – The Engineer will perform Verification testing as described in Section 2 and specified in Section 4(D) of this Manual. Note: The required 10%
testing of Quality Control by the Region QA is considered a minimum frequency and testing may be increased when deemed necessary by the engineer. These tests provide the basis for the Engineer’s decision on acceptance of materials and products. If Independent Assurance is to be done on a material, a split of the Verification sample will be given to the Contractor for testing.
5. Independent Assurance – Where Independent Assurance involves testing, the Engineer will evaluate test results from split samples to assure that Contractor
test results meet required parameters. 6. Visual – Visual Inspection: Examination and assessment of construction materials, by OBSERVATION, to determine if the materials appear to meet the contract
requirements and are acceptable for incorporation into ODOT construction projects. Visual inspection, when stated in the contract, is a method generally used by the Project Inspector in lieu of normal sampling and testing of field tested materials as defined in section 00165.00 of the Standard Specifications to document quality. Supporting documentation for visual acceptance is, at a minimum, a field inspection report. Consult the construction contract for other acceptance document requirements.
November 2003

ODOT Quality Assurance Program
November 2003
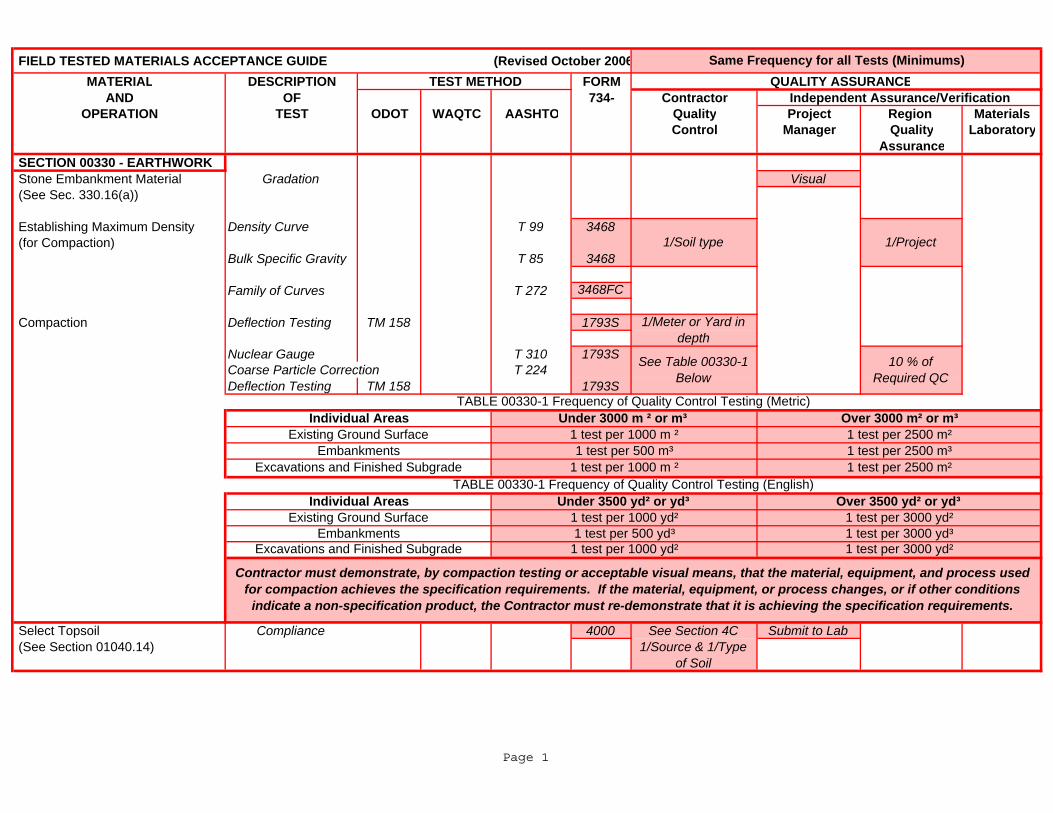
FIELD TESTED MATERIALS ACCEPTANCE GUIDE (Revised October 2006MATERIAL DESCRIPTION TEST METHOD FORM QUALITY ASSURANCE
AND OF 734- Contractor Independent Assurance/VerificationOPERATION TEST ODOT WAQTC AASHTO Quality Project Region Materials
Control Manager Quality LaboratoryAssurance
SECTION 00330 - EARTHWORK Stone Embankment Material Gradation Visual (See Sec. 330.16(a))
Establishing Maximum Density Density Curve T 99 3468 (for Compaction) Bulk Specific Gravity T 85 3468
Family of Curves T 272 3468FC
Compaction Deflection Testing TM 158 1793S
Nuclear Gauge T 310 1793SCoarse Particle Correction T 224Deflection Testing TM 158 1793S
Select Topsoil Compliance 4000 See Section 4C Submit to Lab (See Section 01040.14) 1/Source & 1/Type
of Soil
1/Soil type 1/Project
1 test per 500 yd³ 1 test per 3000 yd³
Under 3000 m ² or m³ TABLE 00330-1 Frequency of Quality Control Testing (Metric)
Over 3000 m² or m³
See Table 00330-1 Below
1 test per 2500 m²1 test per 2500 m³1 test per 2500 m²
TABLE 00330-1 Frequency of Quality Control Testing (English)
Excavations and Finished Subgrade 1 test per 1000 yd² 1 test per 3000 yd²
1 test per 1000 yd² 1 test per 3000 yd²Individual Areas Under 3500 yd² or yd³ Over 3500 yd² or yd³
Existing Ground SurfaceEmbankments
Contractor must demonstrate, by compaction testing or acceptable visual means, that the material, equipment, and process used for compaction achieves the specification requirements. If the material, equipment, or process changes, or if other conditions
indicate a non-specification product, the Contractor must re-demonstrate that it is achieving the specification requirements.
Existing Ground Surface
Excavations and Finished Subgrade1 test per 500 m³
1 test per 1000 m ²
1 test per 1000 m ²
10 % of Required QC
Embankments
Same Frequency for all Tests (Minimums)
1/Meter or Yard in depth
Individual Areas
Page 1
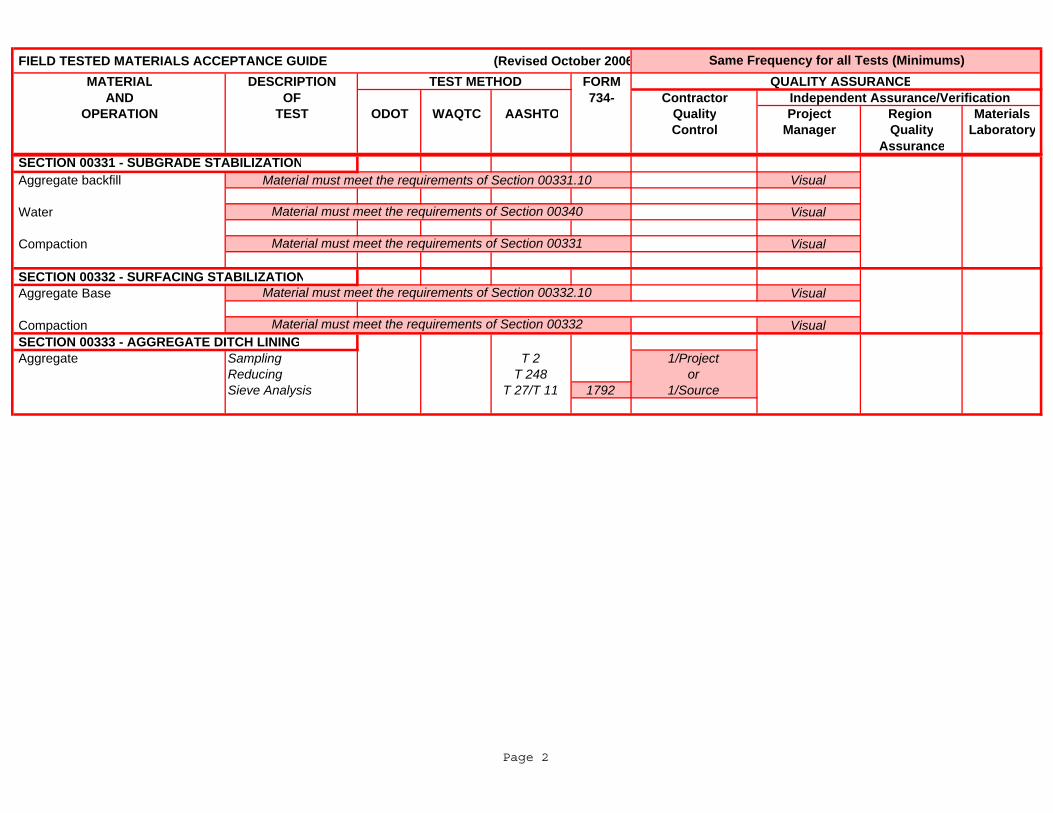
FIELD TESTED MATERIALS ACCEPTANCE GUIDE (Revised October 2006MATERIAL DESCRIPTION TEST METHOD FORM QUALITY ASSURANCE
AND OF 734- Contractor Independent Assurance/VerificationOPERATION TEST ODOT WAQTC AASHTO Quality Project Region Materials
Control Manager Quality LaboratoryAssurance
Same Frequency for all Tests (Minimums)
Aggregate backfill Material must meet the requirements of Section 00331.10 Visual
Water Visual
Compaction Visual
SECTION 00332 - SURFACING STABILIZATION Aggregate Base Visual
Compaction Visual SECTION 00333 - AGGREGATE DITCH LINING Aggregate Sampling T 2 1/Project
Reducing T 248 orSieve Analysis T 27/T 11 1792 1/Source
Material must meet the requirements of Section 00332
SECTION 00331 - SUBGRADE STABILIZATION
Material must meet the requirements of Section 00340
Material must meet the requirements of Section 00331
Material must meet the requirements of Section 00332.10
Page 2
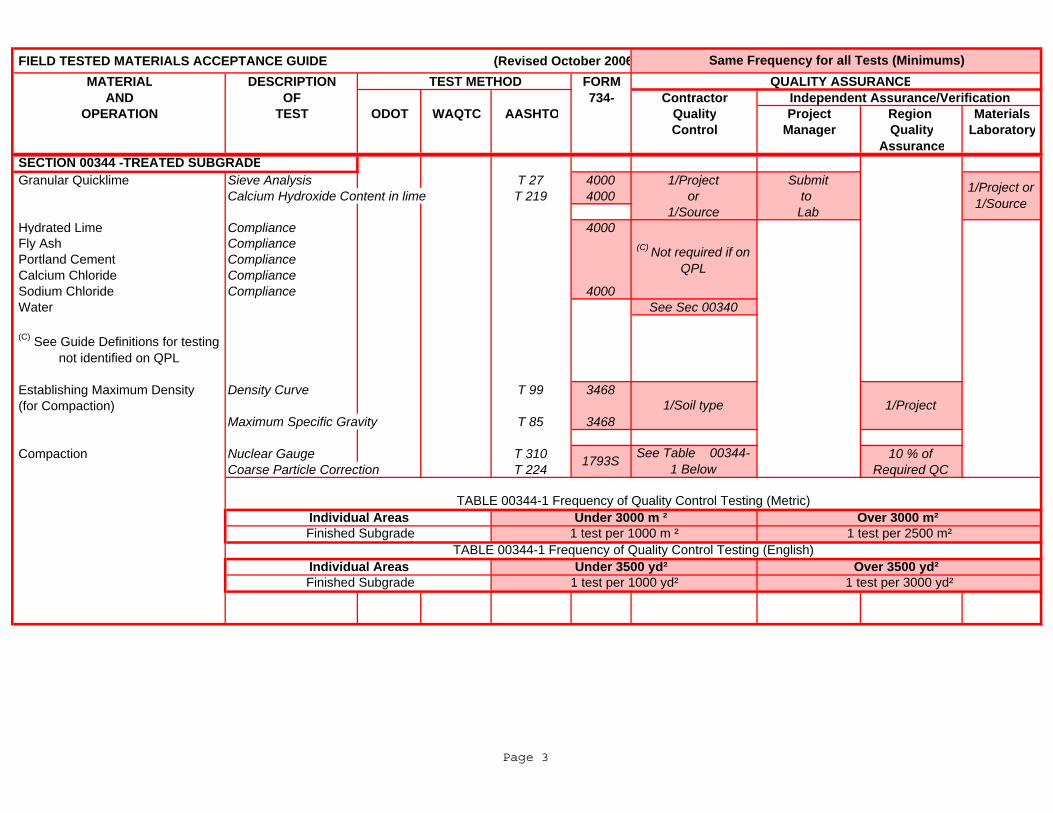
FIELD TESTED MATERIALS ACCEPTANCE GUIDE (Revised October 2006MATERIAL DESCRIPTION TEST METHOD FORM QUALITY ASSURANCE
AND OF 734- Contractor Independent Assurance/VerificationOPERATION TEST ODOT WAQTC AASHTO Quality Project Region Materials
Control Manager Quality LaboratoryAssurance
Same Frequency for all Tests (Minimums)
Granular Quicklime Sieve Analysis T 27 4000 1/Project SubmitCalcium Hydroxide Content in lime T 219 4000 or to
1/Source Lab Hydrated Lime Compliance 4000 Fly Ash Compliance Portland Cement Compliance Calcium Chloride Compliance Sodium Chloride Compliance 4000 Water See Sec 00340
(C) See Guide Definitions for testing not identified on QPL
Establishing Maximum Density Density Curve T 99 3468 (for Compaction)
Maximum Specific Gravity T 85 3468
Compaction Nuclear Gauge T 310 10 % ofCoarse Particle Correction T 224 Required QC
1/Soil type 1/Project
1793S
1 test per 1000 yd²
1/Project or 1/Source
SECTION 00344 -TREATED SUBGRADE
1 test per 3000 yd² Finished Subgrade
See Table 00344-1 Below
1 test per 1000 m ²
TABLE 00344-1 Frequency of Quality Control Testing (Metric)Individual Areas Under 3000 m ² Over 3000 m²
1 test per 2500 m² Finished Subgrade
(C) Not required if on QPL
Individual Areas Under 3500 yd² Over 3500 yd² TABLE 00344-1 Frequency of Quality Control Testing (English)
Page 3
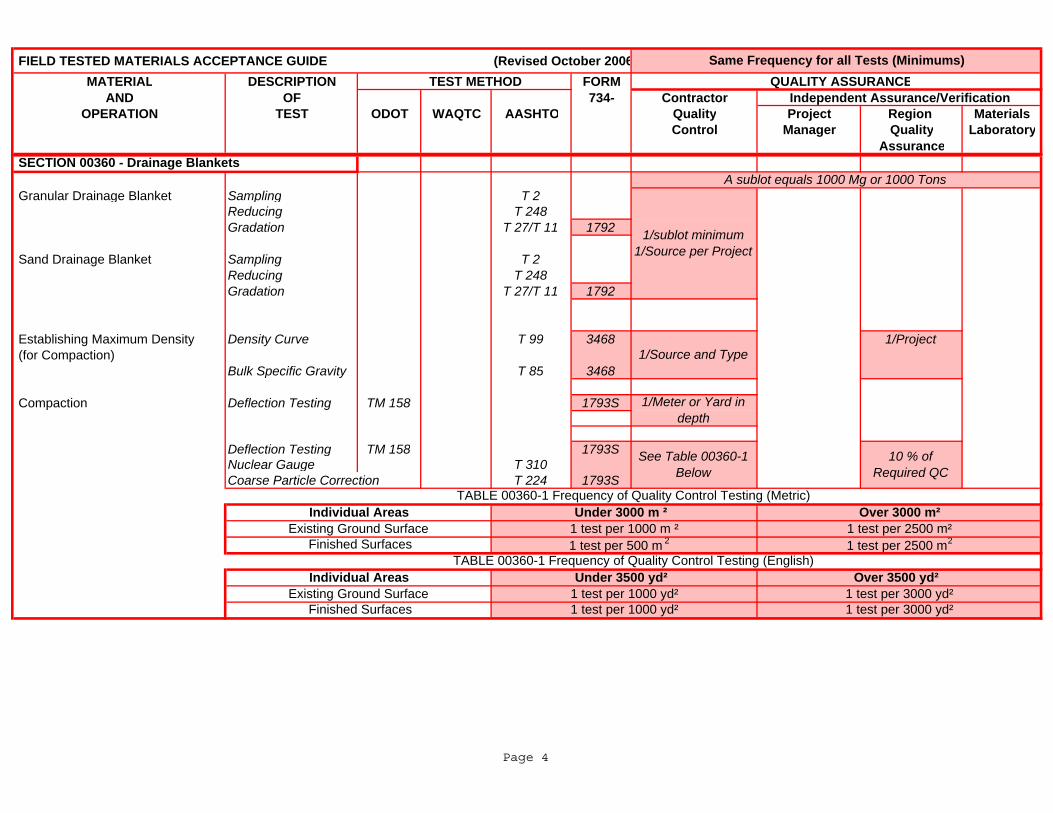
FIELD TESTED MATERIALS ACCEPTANCE GUIDE (Revised October 2006MATERIAL DESCRIPTION TEST METHOD FORM QUALITY ASSURANCE
AND OF 734- Contractor Independent Assurance/VerificationOPERATION TEST ODOT WAQTC AASHTO Quality Project Region Materials
Control Manager Quality LaboratoryAssurance
Same Frequency for all Tests (Minimums)
Granular Drainage Blanket Sampling T 2Reducing T 248
Gradation T 27/T 11 1792
Sand Drainage Blanket Sampling T 2Reducing T 248Gradation T 27/T 11 1792
Establishing Maximum Density Density Curve T 99 3468 1/Project (for Compaction) Bulk Specific Gravity T 85 3468
Compaction Deflection Testing TM 158 1793S
Deflection Testing TM 158 1793SNuclear Gauge T 310Coarse Particle Correction T 224 1793S
1/sublot minimum 1/Source per Project
1/Source and Type
TABLE 00360-1 Frequency of Quality Control Testing (Metric)
1 test per 2500 m²Over 3000 m²
Existing Ground Surface
SECTION 00360 - Drainage BlanketsA sublot equals 1000 Mg or 1000 Tons
Individual Areas
1 test per 2500 m2
Finished Surfaces 1 test per 1000 yd²
1/Meter or Yard in depth
Under 3000 m ² 1 test per 1000 m ²
Existing Ground Surface 1 test per 1000 yd²
Finished Surfaces 1 test per 500 m 2
See Table 00360-1 Below
10 % of Required QC
1 test per 3000 yd²1 test per 3000 yd²
TABLE 00360-1 Frequency of Quality Control Testing (English)Individual Areas Under 3500 yd² Over 3500 yd²
Page 4
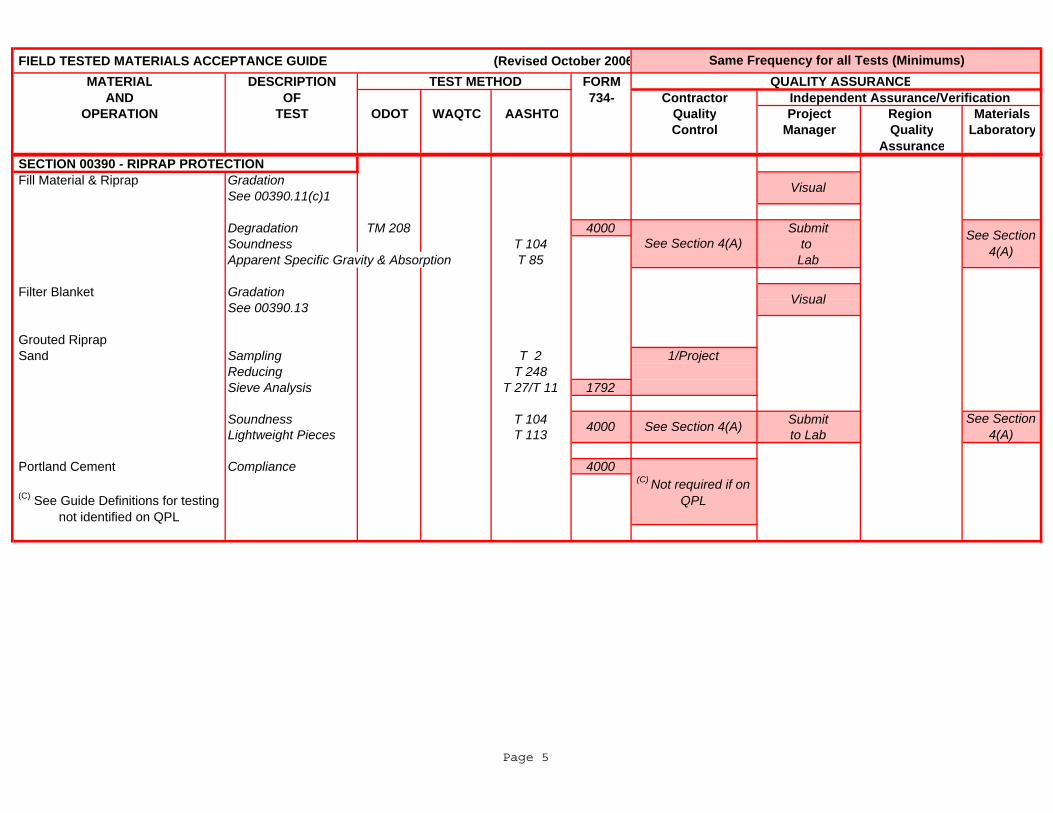
FIELD TESTED MATERIALS ACCEPTANCE GUIDE (Revised October 2006MATERIAL DESCRIPTION TEST METHOD FORM QUALITY ASSURANCE
AND OF 734- Contractor Independent Assurance/VerificationOPERATION TEST ODOT WAQTC AASHTO Quality Project Region Materials
Control Manager Quality LaboratoryAssurance
Same Frequency for all Tests (Minimums)
SECTION 00390 - RIPRAP PROTECTION Fill Material & Riprap Gradation
See 00390.11(c)1
Degradation TM 208 4000 SubmitSoundness T 104 to Apparent Specific Gravity & Absorption T 85 Lab
Filter Blanket Gradation See 00390.13
Grouted Riprap Sand Sampling T 2 1/Project
Reducing T 248Sieve Analysis T 27/T 11 1792
Soundness T 104 SubmitLightweight Pieces T 113 to Lab
Portland Cement Compliance 4000
(C) See Guide Definitions for testing not identified on QPL
4000
Visual
(C) Not required if on QPL
See Section 4(A)See Section 4(A)
See Section 4(A)
Visual
See Section 4(A)
Page 5
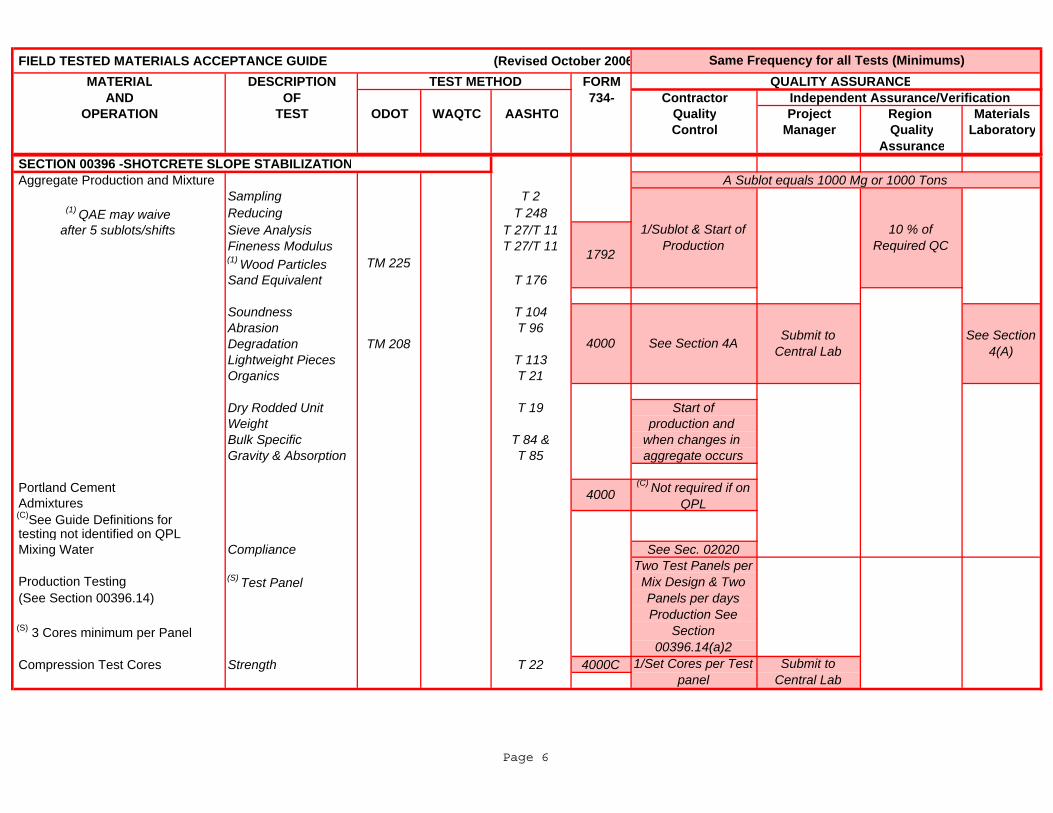
FIELD TESTED MATERIALS ACCEPTANCE GUIDE (Revised October 2006MATERIAL DESCRIPTION TEST METHOD FORM QUALITY ASSURANCE
AND OF 734- Contractor Independent Assurance/VerificationOPERATION TEST ODOT WAQTC AASHTO Quality Project Region Materials
Control Manager Quality LaboratoryAssurance
Same Frequency for all Tests (Minimums)
SECTION 00396 -SHOTCRETE SLOPE STABILIZATION Aggregate Production and Mixture A Sublot equals 1000 Mg or 1000 Tons
Sampling T 2(1) QAE may waive Reducing T 248
after 5 sublots/shifts Sieve Analysis T 27/T 11Fineness Modulus T 27/T 11(1) Wood Particles TM 225Sand Equivalent T 176
Soundness T 104Abrasion T 96Degradation TM 208Lightweight Pieces T 113Organics T 21
Dry Rodded Unit T 19 Start ofWeight production and Bulk Specific T 84 & when changes in Gravity & Absorption T 85 aggregate occurs
Portland Cement Admixtures (C)See Guide Definitions for testing not identified on QPL Mixing Water Compliance See Sec. 02020 Production Testing (S) Test Panel (See Section 00396.14)
(S) 3 Cores minimum per Panel Compression Test Cores Strength T 22 4000C
10 % of Required QC
See Section 4A
1/Sublot & Start of Production
1/Set Cores per Test panel
1792
4000
4000(C) Not required if on
QPL
Two Test Panels per Mix Design & Two Panels per days Production See
Section 00396.14(a)2
Submit to Central Lab
See Section 4(A)
Submit to Central Lab
Page 6
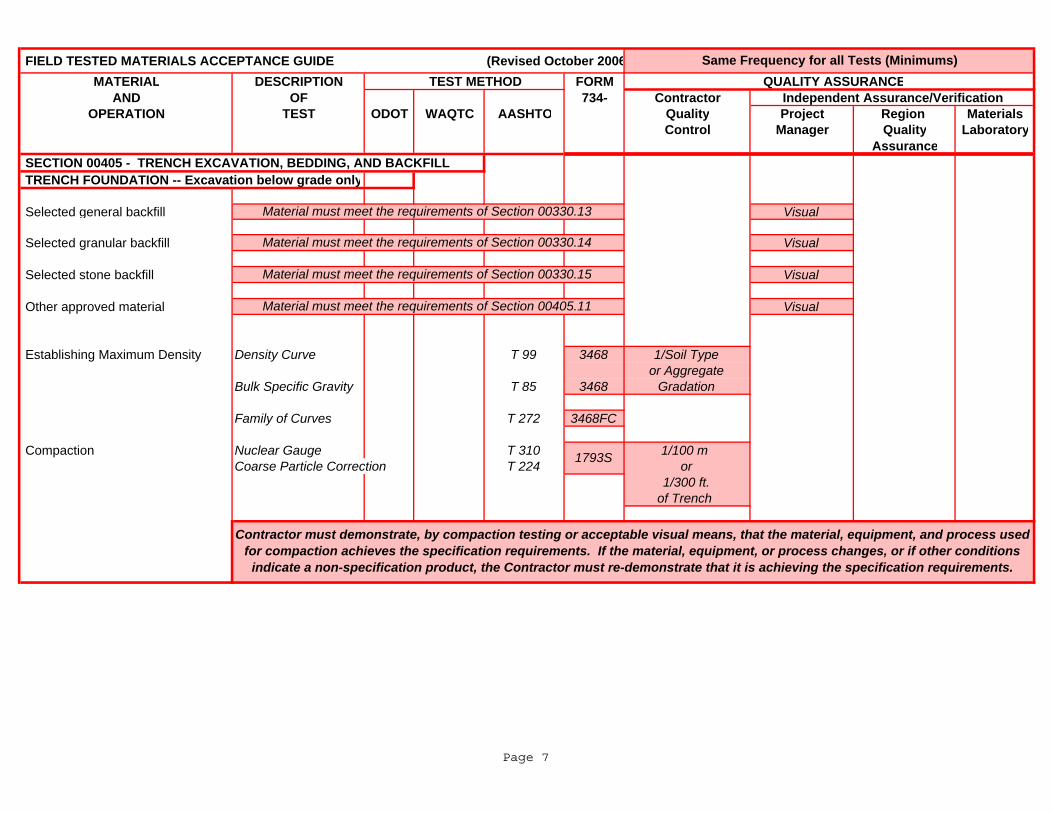
FIELD TESTED MATERIALS ACCEPTANCE GUIDE (Revised October 2006MATERIAL DESCRIPTION TEST METHOD FORM QUALITY ASSURANCE
AND OF 734- Contractor Independent Assurance/VerificationOPERATION TEST ODOT WAQTC AASHTO Quality Project Region Materials
Control Manager Quality LaboratoryAssurance
SECTION 00405 - TRENCH EXCAVATION, BEDDING, AND BACKFILL TRENCH FOUNDATION -- Excavation below grade only
Selected general backfill Visual
Selected granular backfill Visual
Selected stone backfill Visual
Other approved material Visual
Establishing Maximum Density Density Curve T 99 3468 1/Soil Type or Aggregate
Bulk Specific Gravity T 85 3468 Gradation
Family of Curves T 272 3468FC
Compaction Nuclear Gauge T 310 1/100 m Coarse Particle Correction T 224 or
1/300 ft. of Trench
1793S
Contractor must demonstrate, by compaction testing or acceptable visual means, that the material, equipment, and process used for compaction achieves the specification requirements. If the material, equipment, or process changes, or if other conditions
indicate a non-specification product, the Contractor must re-demonstrate that it is achieving the specification requirements.
Material must meet the requirements of Section 00405.11
Same Frequency for all Tests (Minimums)
Material must meet the requirements of Section 00330.13
Material must meet the requirements of Section 00330.14
Material must meet the requirements of Section 00330.15
Page 7
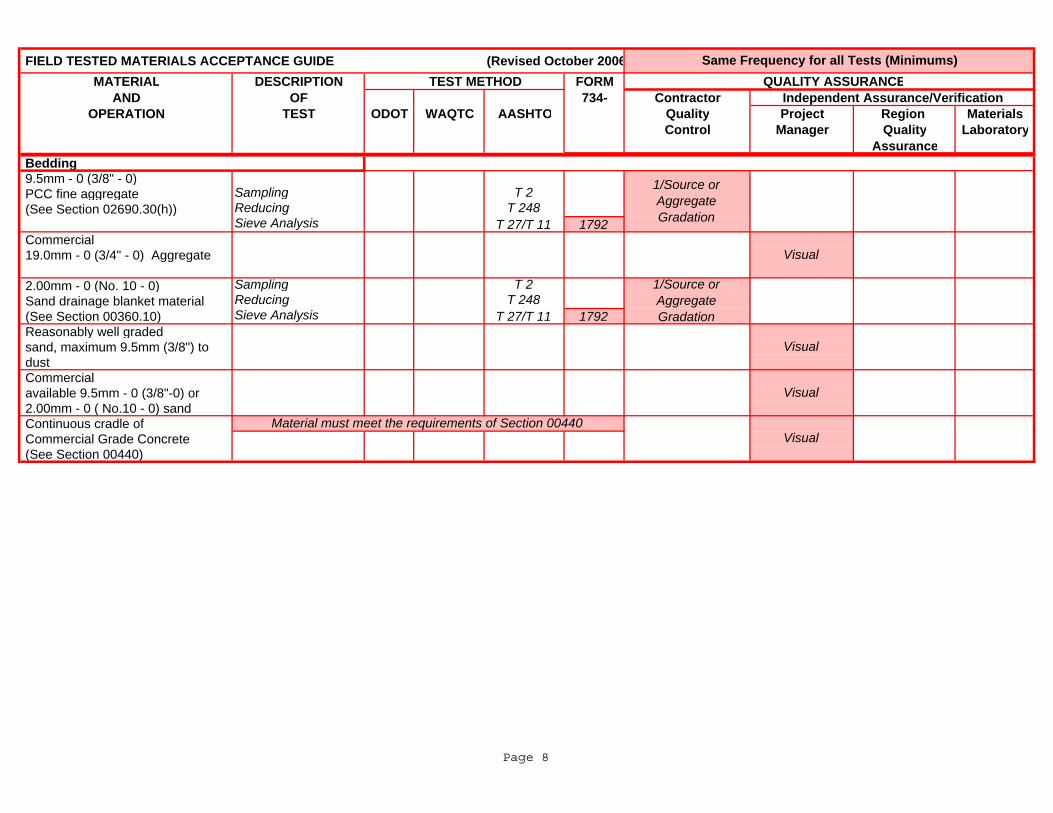
FIELD TESTED MATERIALS ACCEPTANCE GUIDE (Revised October 2006MATERIAL DESCRIPTION TEST METHOD FORM QUALITY ASSURANCE
AND OF 734- Contractor Independent Assurance/VerificationOPERATION TEST ODOT WAQTC AASHTO Quality Project Region Materials
Control Manager Quality LaboratoryAssurance
Same Frequency for all Tests (Minimums)
Bedding 9.5mm - 0 (3/8" - 0) PCC fine aggregate Sampling T 2 (See Section 02690.30(h)) Reducing T 248
Sieve Analysis T 27/T 11 1792 Commercial 19.0mm - 0 (3/4" - 0) Aggregate
2.00mm - 0 (No. 10 - 0) Sampling T 2 Sand drainage blanket material Reducing T 248 (See Section 00360.10) Sieve Analysis T 27/T 11 1792 Reasonably well graded sand, maximum 9.5mm (3/8") to dust Commercial available 9.5mm - 0 (3/8"-0) or 2.00mm - 0 ( No.10 - 0) sand Continuous cradle of Commercial Grade Concrete (See Section 00440)
1/Source or Aggregate Gradation
1/Source or Aggregate Gradation
Visual
Visual
Visual
Material must meet the requirements of Section 00440Visual
Page 8

FIELD TESTED MATERIALS ACCEPTANCE GUIDE (Revised October 2006MATERIAL DESCRIPTION TEST METHOD FORM QUALITY ASSURANCE
AND OF 734- Contractor Independent Assurance/VerificationOPERATION TEST ODOT WAQTC AASHTO Quality Project Region Materials
Control Manager Quality LaboratoryAssurance
Same Frequency for all Tests (Minimums)
Flexible Pipe
Rigid Pipe: Aggregate Base Sampling T 2 25.0mm - 0 (1"- 0) or Reducing T 248 19.0mm - 0 (3/4"- 0) aggregate Sieve Analysis T 27 1792 (See Section 02630.10) Rigid Pipe: Commercial 25.0mm - 0 (1"- 0) or 19.0mm - 0 (3/4"- 0) aggregate Establishing Maximum Density Density Curve T 99 3468
Bulk Specific Gravity T 85 Coarse Particle Correction T 224 3468
Compaction Nuclear Gauge T 310 1793B 1/100 m or 1/300 ft.
of Trench and every 0.5 m or 1.5 ft. of Fill
Visual
Use the Listed Material requirements under Bedding
1/Source or Gradation
Contractor must demonstrate, by compaction testing or acceptable visual means, that the material, equipment, and process used for compaction achieves the specification requirements. If the material, equipment, or process changes, or if other conditions
indicate a non-specification product, the Contractor must re-demonstrate that it is achieving the specification requirements.
Pipe Zone Material
1/Source or Aggregate Gradation
Page 9
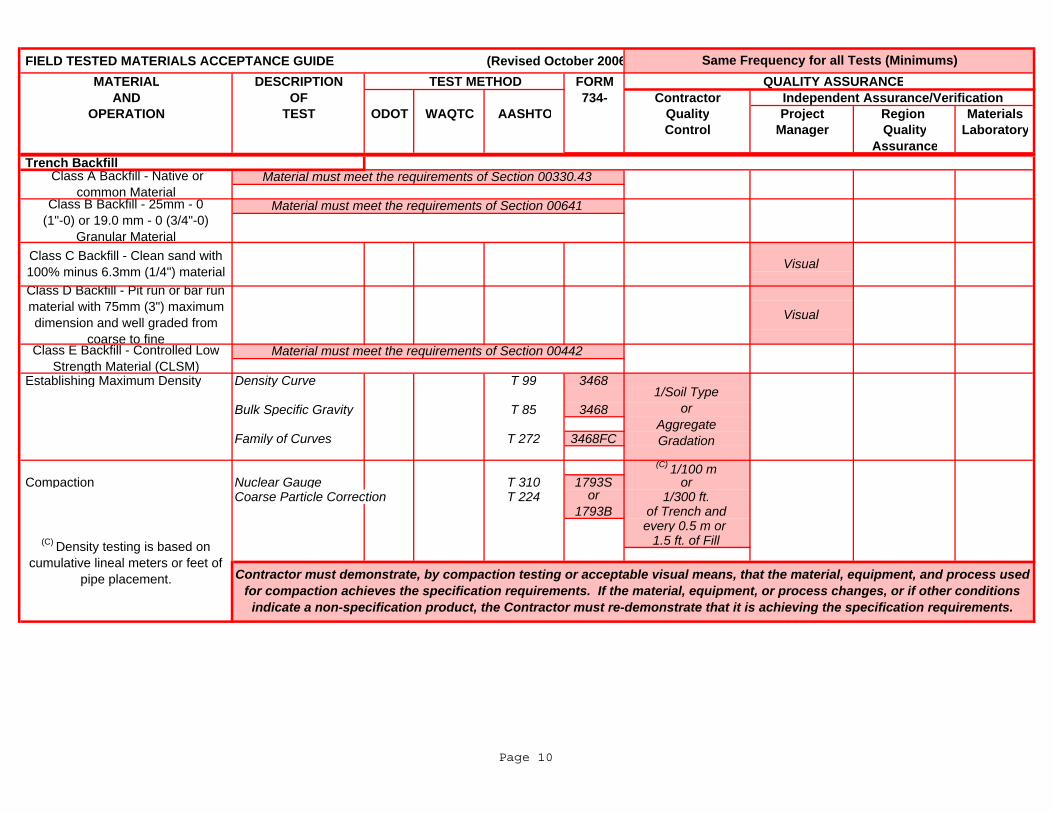
FIELD TESTED MATERIALS ACCEPTANCE GUIDE (Revised October 2006MATERIAL DESCRIPTION TEST METHOD FORM QUALITY ASSURANCE
AND OF 734- Contractor Independent Assurance/VerificationOPERATION TEST ODOT WAQTC AASHTO Quality Project Region Materials
Control Manager Quality LaboratoryAssurance
Same Frequency for all Tests (Minimums)
Trench Backfill
Establishing Maximum Density Density Curve T 99 3468
Bulk Specific Gravity T 85 3468
Family of Curves T 272 3468FC
(C) 1/100 m Compaction Nuclear Gauge T 310 1793S or
Coarse Particle Correction T 224 or 1/300 ft.1793B of Trench and
every 0.5 m or 1.5 ft. of Fill
Contractor must demonstrate, by compaction testing or acceptable visual means, that the material, equipment, and process used for compaction achieves the specification requirements. If the material, equipment, or process changes, or if other conditions
indicate a non-specification product, the Contractor must re-demonstrate that it is achieving the specification requirements.
Class E Backfill - Controlled Low Strength Material (CLSM)
Class A Backfill - Native or common Material
Material must meet the requirements of Section 00641
Material must meet the requirements of Section 00330.43
Material must meet the requirements of Section 00442
(C) Density testing is based on cumulative lineal meters or feet of
pipe placement.
Visual
Visual
1/Soil Type or
Aggregate Gradation
Class B Backfill - 25mm - 0 (1"-0) or 19.0 mm - 0 (3/4"-0)
Granular Material
Class D Backfill - Pit run or bar run material with 75mm (3") maximum dimension and well graded from
coarse to fine
Class C Backfill - Clean sand with 100% minus 6.3mm (1/4") material
Page 10
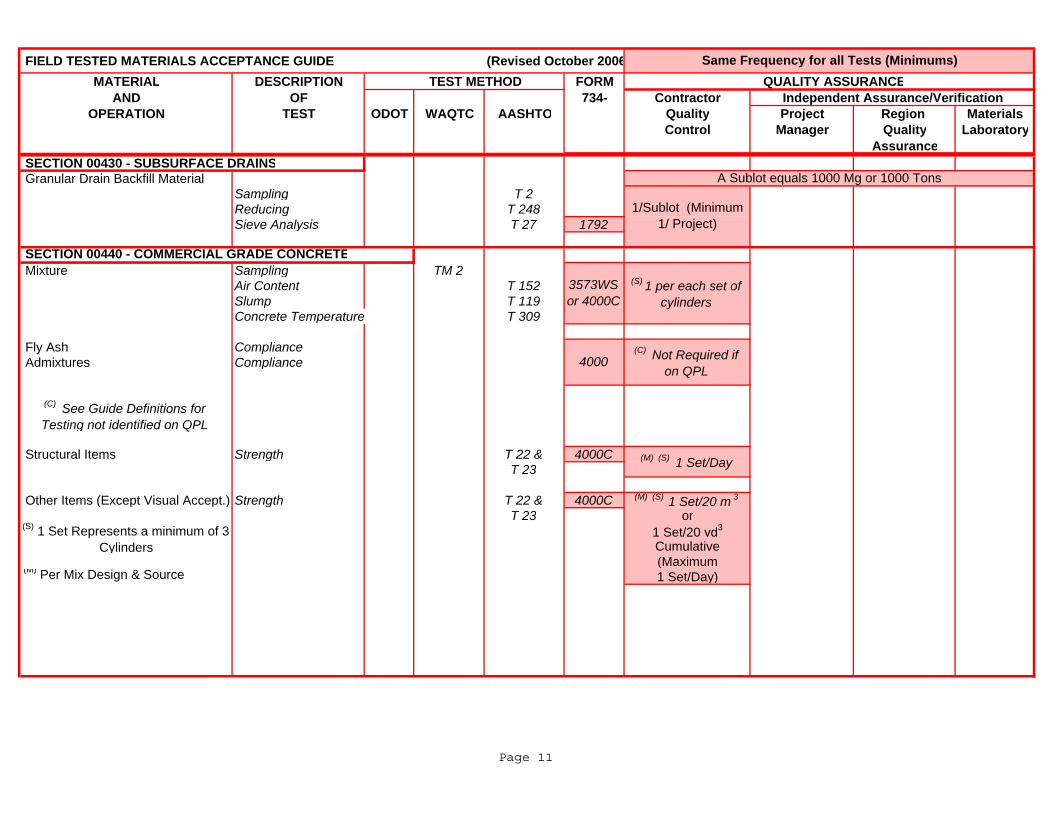
FIELD TESTED MATERIALS ACCEPTANCE GUIDE (Revised October 2006MATERIAL DESCRIPTION TEST METHOD FORM QUALITY ASSURANCE
AND OF 734- Contractor Independent Assurance/VerificationOPERATION TEST ODOT WAQTC AASHTO Quality Project Region Materials
Control Manager Quality LaboratoryAssurance
Same Frequency for all Tests (Minimums)
SECTION 00430 - SUBSURFACE DRAINS Granular Drain Backfill Material
Sampling T 2Reducing T 248Sieve Analysis T 27 1792
Mixture Sampling TM 2Air Content T 152Slump T 119Concrete Temperature T 309
Fly Ash Compliance Admixtures Compliance
Structural Items Strength T 22 & 4000CT 23
Other Items (Except Visual Accept.) Strength T 22 & 4000C (M) (S) 1 Set/20 m 3
T 23 or1 Set/20 yd3
Cumulative(Maximum
(M) Per Mix Design & Source 1 Set/Day)
3573WS or 4000C
(S) 1 per each set of cylinders
A Sublot equals 1000 Mg or 1000 Tons
1/Sublot (Minimum 1/ Project)
(M) (S) 1 Set/Day
(C) Not Required if on QPL
(S) 1 Set Represents a minimum of 3 Cylinders
4000
(C) See Guide Definitions for Testing not identified on QPL
SECTION 00440 - COMMERCIAL GRADE CONCRETE
Page 11
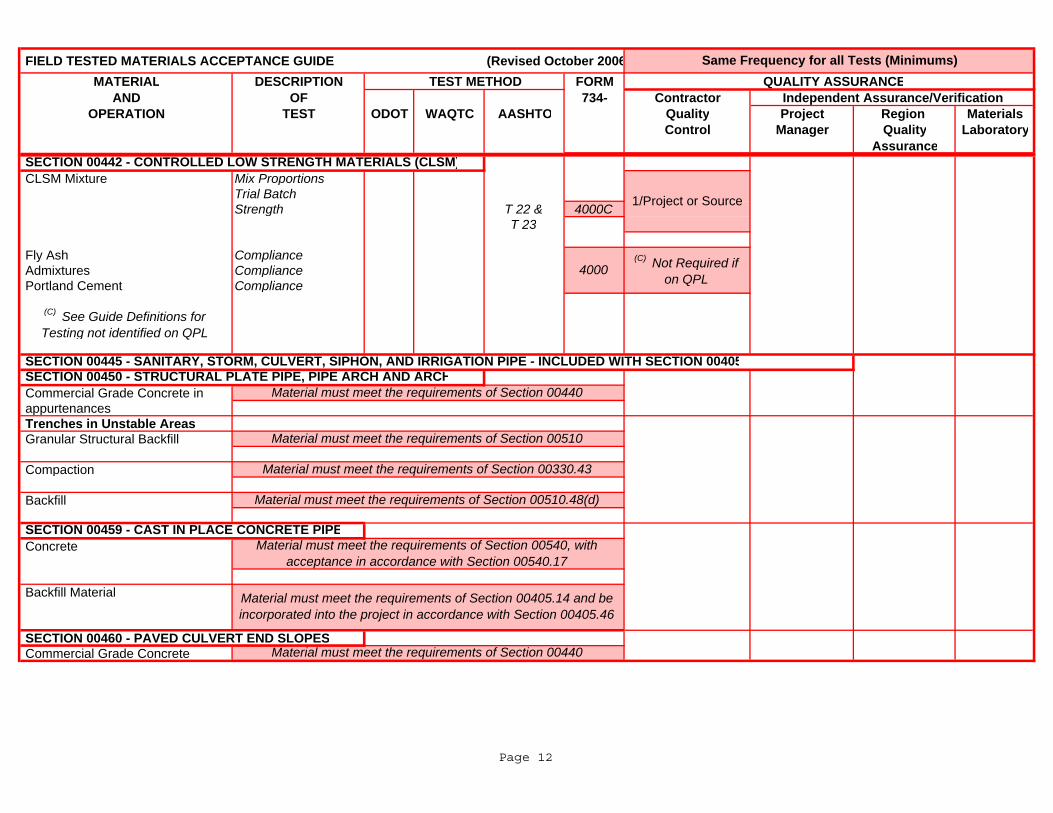
FIELD TESTED MATERIALS ACCEPTANCE GUIDE (Revised October 2006MATERIAL DESCRIPTION TEST METHOD FORM QUALITY ASSURANCE
AND OF 734- Contractor Independent Assurance/VerificationOPERATION TEST ODOT WAQTC AASHTO Quality Project Region Materials
Control Manager Quality LaboratoryAssurance
Same Frequency for all Tests (Minimums)
CLSM Mixture Mix ProportionsTrial Batch Strength T 22 & 4000C
T 23
Fly Ash Compliance Admixtures Compliance Portland Cement Compliance
Commercial Grade Concrete in appurtenances Trenches in Unstable Areas Granular Structural Backfill
Compaction
Backfill
Concrete
Backfill Material
SECTION 00460 - PAVED CULVERT END SLOPES Commercial Grade Concrete
4000(C) Not Required if
on QPL
(C) See Guide Definitions for Testing not identified on QPL
SECTION 00442 - CONTROLLED LOW STRENGTH MATERIALS (CLSM)
Material must meet the requirements of Section 00510.48(d)
1/Project or Source
SECTION 00445 - SANITARY, STORM, CULVERT, SIPHON, AND IRRIGATION PIPE - INCLUDED WITH SECTION 00405
Material must meet the requirements of Section 00440
Material must meet the requirements of Section 00540, with acceptance in accordance with Section 00540.17
Material must meet the requirements of Section 00405.14 and be incorporated into the project in accordance with Section 00405.46
SECTION 00459 - CAST IN PLACE CONCRETE PIPE
SECTION 00450 - STRUCTURAL PLATE PIPE, PIPE ARCH AND ARCHMaterial must meet the requirements of Section 00440
Material must meet the requirements of Section 00510
Material must meet the requirements of Section 00330.43
Page 12
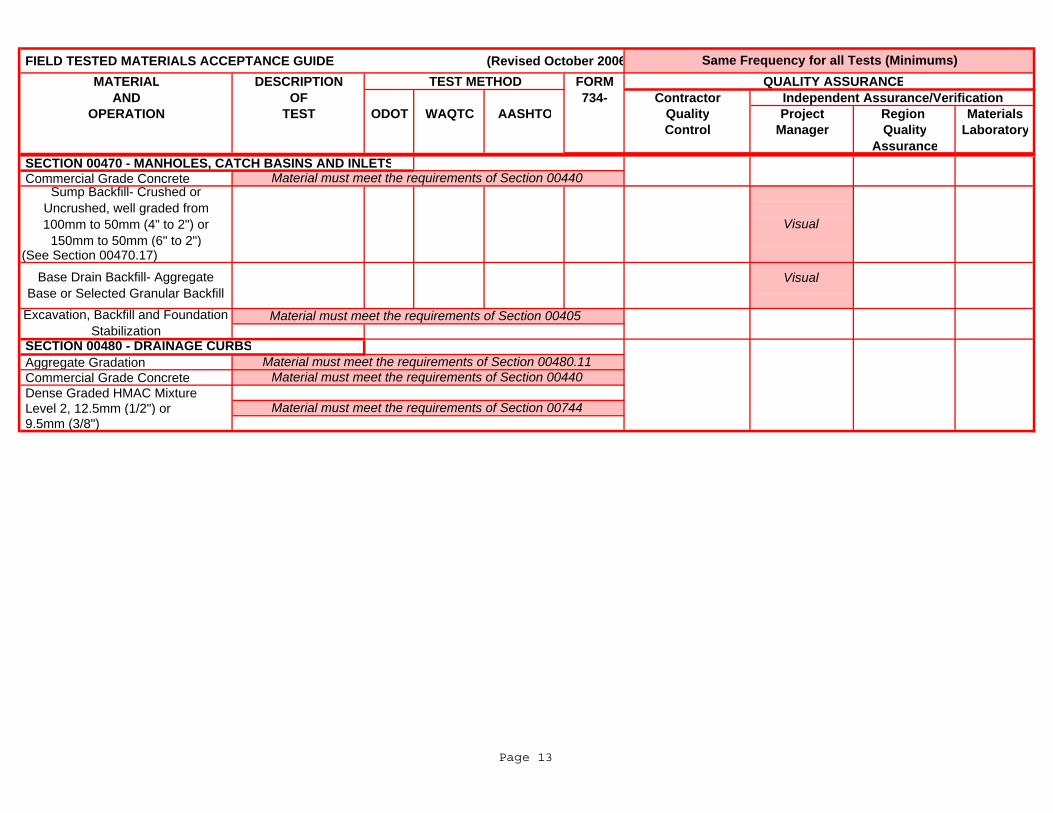
FIELD TESTED MATERIALS ACCEPTANCE GUIDE (Revised October 2006MATERIAL DESCRIPTION TEST METHOD FORM QUALITY ASSURANCE
AND OF 734- Contractor Independent Assurance/VerificationOPERATION TEST ODOT WAQTC AASHTO Quality Project Region Materials
Control Manager Quality LaboratoryAssurance
Same Frequency for all Tests (Minimums)
SECTION 00470 - MANHOLES, CATCH BASINS AND INLETS Commercial Grade Concrete
(See Section 00470.17)
Aggregate Gradation Commercial Grade Concrete Dense Graded HMAC Mixture Level 2, 12.5mm (1/2") or 9.5mm (3/8")
Visual
Visual
Material must meet the requirements of Section 00744
Material must meet the requirements of Section 00440
Material must meet the requirements of Section 00405
Base Drain Backfill- Aggregate Base or Selected Granular Backfill
Material must meet the requirements of Section 00440
Sump Backfill- Crushed or Uncrushed, well graded from 100mm to 50mm (4" to 2") or
150mm to 50mm (6" to 2")
Material must meet the requirements of Section 00480.11 SECTION 00480 - DRAINAGE CURBS
Excavation, Backfill and Foundation Stabilization
Page 13
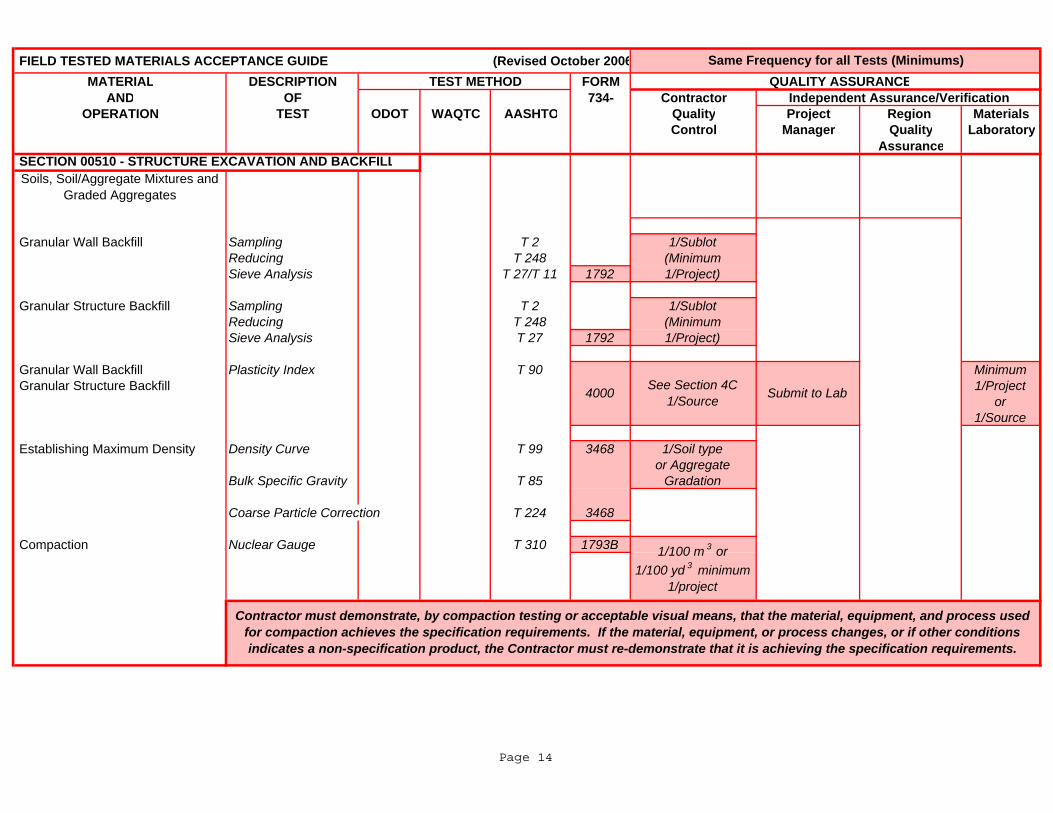
FIELD TESTED MATERIALS ACCEPTANCE GUIDE (Revised October 2006MATERIAL DESCRIPTION TEST METHOD FORM QUALITY ASSURANCE
AND OF 734- Contractor Independent Assurance/VerificationOPERATION TEST ODOT WAQTC AASHTO Quality Project Region Materials
Control Manager Quality LaboratoryAssurance
Soils, Soil/Aggregate Mixtures and Graded Aggregates
Granular Wall Backfill Sampling T 2 1/SublotReducing T 248 (Minimum
Sieve Analysis T 27/T 11 1792 1/Project)
Granular Structure Backfill Sampling T 2 1/SublotReducing T 248 (MinimumSieve Analysis T 27 1792 1/Project)
Granular Wall Backfill Plasticity Index T 90 Minimum Granular Structure Backfill 1/Project
or1/Source
Establishing Maximum Density Density Curve T 99 3468 1/Soil type or Aggregate
Bulk Specific Gravity T 85 Gradation
Coarse Particle Correction T 224 3468
Compaction Nuclear Gauge T 310 1793B
See Section 4C 1/Source4000 Submit to Lab
Same Frequency for all Tests (Minimums)
Contractor must demonstrate, by compaction testing or acceptable visual means, that the material, equipment, and process used for compaction achieves the specification requirements. If the material, equipment, or process changes, or if other conditions indicates a non-specification product, the Contractor must re-demonstrate that it is achieving the specification requirements.
1/100 m 3 or 1/100 yd 3 minimum
1/project
SECTION 00510 - STRUCTURE EXCAVATION AND BACKFILL
Page 14
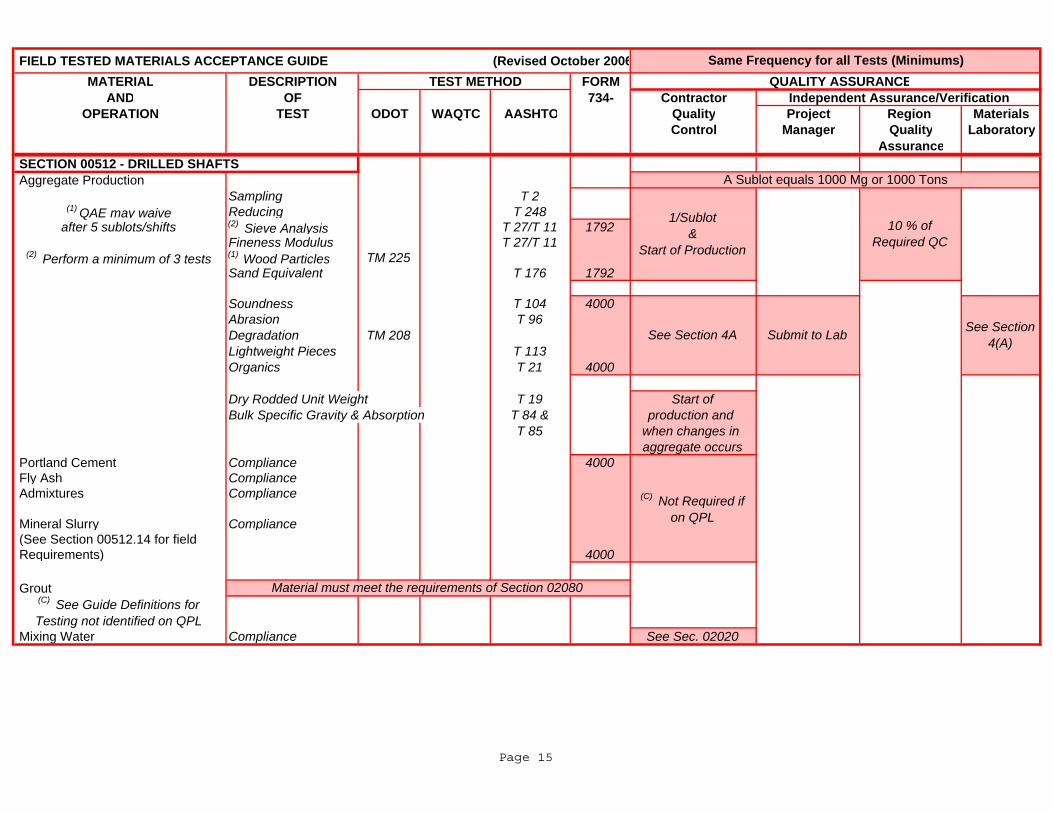
FIELD TESTED MATERIALS ACCEPTANCE GUIDE (Revised October 2006MATERIAL DESCRIPTION TEST METHOD FORM QUALITY ASSURANCE
AND OF 734- Contractor Independent Assurance/VerificationOPERATION TEST ODOT WAQTC AASHTO Quality Project Region Materials
Control Manager Quality LaboratoryAssurance
Same Frequency for all Tests (Minimums)
SECTION 00510 STRUCTURE EXCAVATION AND BACKFILL SECTION 00512 - DRILLED SHAFTS Aggregate Production
Sampling T 2(1) QAE may waive Reducing T 248
after 5 sublots/shifts (2) Sieve Analysis T 27/T 11 1792Fineness Modulus T 27/T 11
(2) Perform a minimum of 3 tests (1) Wood Particles TM 225Sand Equivalent T 176 1792
Soundness T 104 4000Abrasion T 96Degradation TM 208Lightweight Pieces T 113Organics T 21 4000
Dry Rodded Unit Weight T 19 Start ofBulk Specific Gravity & Absorption T 84 & production and
T 85 when changes in aggregate occurs
Portland Cement Compliance 4000 Fly Ash Compliance Admixtures Compliance
Mineral Slurry Compliance (See Section 00512.14 for field Requirements) 4000
Grout
Mixing Water Compliance See Sec. 02020
Material must meet the requirements of Section 02080
See Section 4A Submit to Lab See Section 4(A)
A Sublot equals 1000 Mg or 1000 Tons
1/Sublot &
Start of Production
10 % of Required QC
(C) Not Required if on QPL
(C) See Guide Definitions for Testing not identified on QPL
Page 15
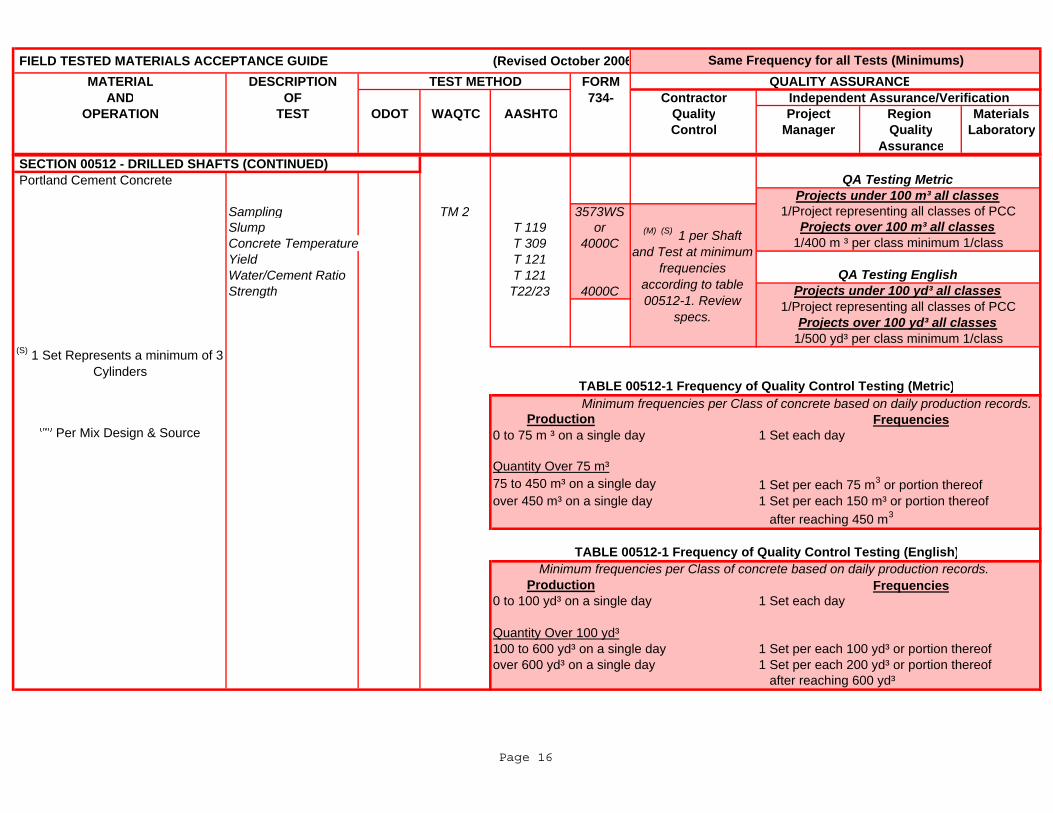
FIELD TESTED MATERIALS ACCEPTANCE GUIDE (Revised October 2006MATERIAL DESCRIPTION TEST METHOD FORM QUALITY ASSURANCE
AND OF 734- Contractor Independent Assurance/VerificationOPERATION TEST ODOT WAQTC AASHTO Quality Project Region Materials
Control Manager Quality LaboratoryAssurance
Same Frequency for all Tests (Minimums)
SECTION 00510 STRUCTURE EXCAVATION AND BACKFILL SECTION 00512 - DRILLED SHAFTS (CONTINUED) Portland Cement Concrete
Sampling TM 2 3573WSSlump T 119 orConcrete Temperature T 309 4000CYield T 121Water/Cement Ratio T 121Strength T22/23 4000C
Minimum frequencies per Class of concrete based on daily production records.Frequencies
(M) Per Mix Design & Source 0 to 75 m ³ on a single day 1 Set each day
Frequencies
Quantity Over 75 m³
Projects under 100 yd³ all classes
over 600 yd³ on a single day
0 to 100 yd³ on a single day 1 Set each day
Quantity Over 100 yd³100 to 600 yd³ on a single day 1 Set per each 100 yd³ or portion thereof
Production
over 450 m³ on a single day 1 Set per each 150 m³ or portion thereof75 to 450 m³ on a single day
1/400 m ³ per class minimum 1/class
QA Testing English
(M) (S) 1 per Shaft and Test at minimum
frequencies according to table 00512-1. Review
specs.
ProductionMinimum frequencies per Class of concrete based on daily production records.
1 Set per each 75 m3 or portion thereof
Projects under 100 m³ all classes1/Project representing all classes of PCC
Projects over 100 m³ all classes
QA Testing Metric
(S) 1 Set Represents a minimum of 3 Cylinders
1/Project representing all classes of PCCProjects over 100 yd³ all classes
1/500 yd³ per class minimum 1/class
after reaching 600 yd³1 Set per each 200 yd³ or portion thereof
after reaching 450 m3
TABLE 00512-1 Frequency of Quality Control Testing (English)
TABLE 00512-1 Frequency of Quality Control Testing (Metric)
Page 16
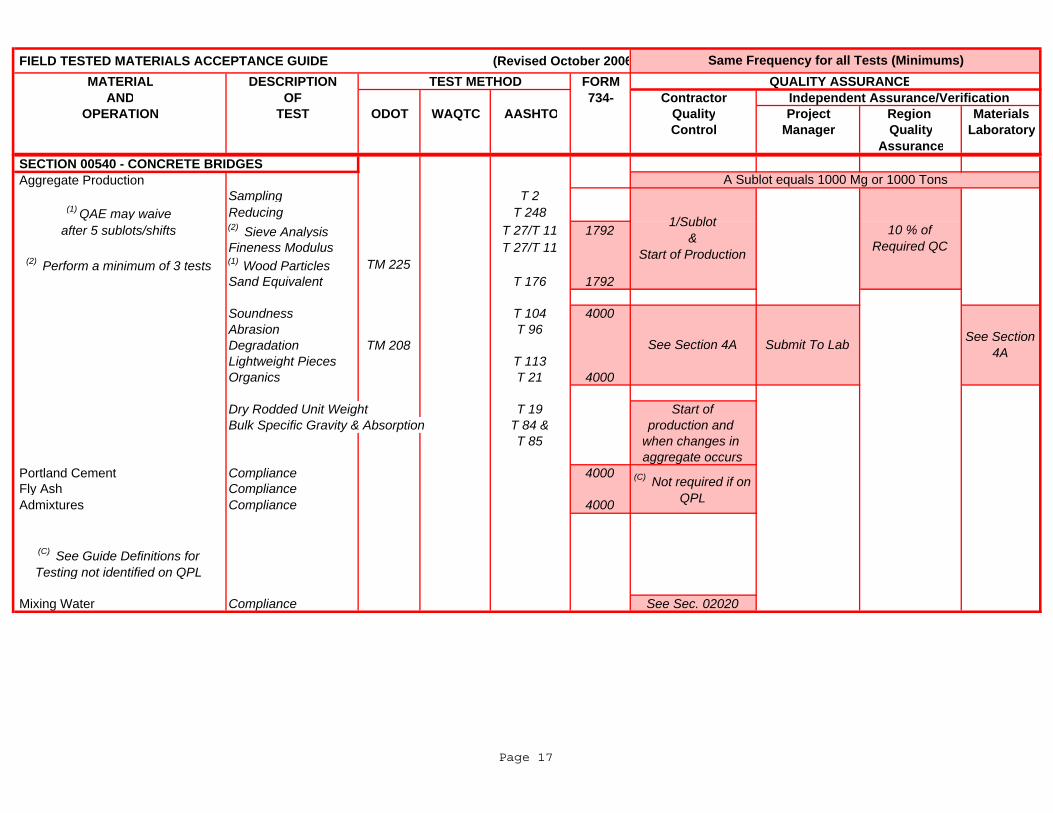
FIELD TESTED MATERIALS ACCEPTANCE GUIDE (Revised October 2006MATERIAL DESCRIPTION TEST METHOD FORM QUALITY ASSURANCE
AND OF 734- Contractor Independent Assurance/VerificationOPERATION TEST ODOT WAQTC AASHTO Quality Project Region Materials
Control Manager Quality LaboratoryAssurance
Same Frequency for all Tests (Minimums)
SECTION 00510 STRUCTURE EXCAVATION AND BACKFILL SECTION 00540 - CONCRETE BRIDGES Aggregate Production
Sampling T 2(1) QAE may waive Reducing T 248
after 5 sublots/shifts (2) Sieve Analysis T 27/T 11 1792Fineness Modulus T 27/T 11
(2) Perform a minimum of 3 tests (1) Wood Particles TM 225Sand Equivalent T 176 1792
Soundness T 104 4000Abrasion T 96Degradation TM 208Lightweight Pieces T 113Organics T 21 4000
Dry Rodded Unit Weight T 19 Start ofBulk Specific Gravity & Absorption T 84 & production and
T 85 when changes in aggregate occurs
Portland Cement Compliance 4000 Fly Ash Compliance Admixtures Compliance 4000
Mixing Water Compliance See Sec. 02020
See Section 4A
A Sublot equals 1000 Mg or 1000 Tons
10 % of Required QC
Submit To Lab
1/Sublot &
Start of Production
See Section 4A
(C) Not required if on QPL
(C) See Guide Definitions for Testing not identified on QPL
Page 17
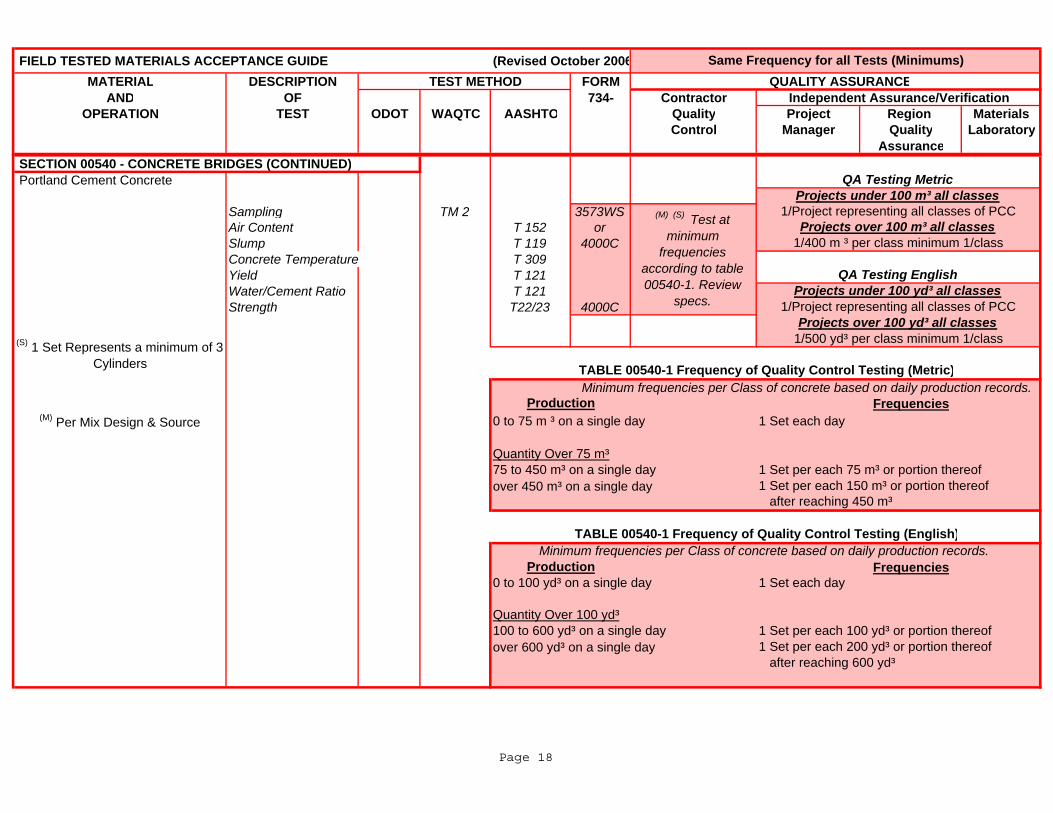
FIELD TESTED MATERIALS ACCEPTANCE GUIDE (Revised October 2006MATERIAL DESCRIPTION TEST METHOD FORM QUALITY ASSURANCE
AND OF 734- Contractor Independent Assurance/VerificationOPERATION TEST ODOT WAQTC AASHTO Quality Project Region Materials
Control Manager Quality LaboratoryAssurance
Same Frequency for all Tests (Minimums)
SECTION 00510 STRUCTURE EXCAVATION AND BACKFILL SECTION 00540 - CONCRETE BRIDGES (CONTINUED) Portland Cement Concrete
Sampling TM 2 3573WSAir Content T 152 orSlump T 119 4000CConcrete Temperature T 309Yield T 121Water/Cement Ratio T 121Strength T22/23 4000C
Minimum frequencies per Class of concrete based on daily production records.Frequencies
(M) Per Mix Design & Source 0 to 75 m ³ on a single day 1 Set each day
over 450 m³ on a single day
Frequencies
over 600 yd³ on a single day
Minimum frequencies per Class of concrete based on daily production records.
Quantity Over 75 m³
1/500 yd³ per class minimum 1/class
1 Set per each 100 yd³ or portion thereof
1 Set per each 75 m³ or portion thereof
after reaching 450 m³
100 to 600 yd³ on a single day1 Set per each 200 yd³ or portion thereof after reaching 600 yd³
QA Testing MetricProjects under 100 m³ all classes
1/400 m ³ per class minimum 1/class
Production
TABLE 00540-1 Frequency of Quality Control Testing (Metric)
Production
1 Set per each 150 m³ or portion thereof75 to 450 m³ on a single day
(S) 1 Set Represents a minimum of 3 Cylinders
1/Project representing all classes of PCCProjects over 100 m³ all classes
QA Testing EnglishProjects under 100 yd³ all classes
1/Project representing all classes of PCCProjects over 100 yd³ all classes
1 Set each day
Quantity Over 100 yd³
0 to 100 yd³ on a single day
TABLE 00540-1 Frequency of Quality Control Testing (English)
(M) (S) Test at minimum
frequencies according to table 00540-1. Review
specs.
Page 18
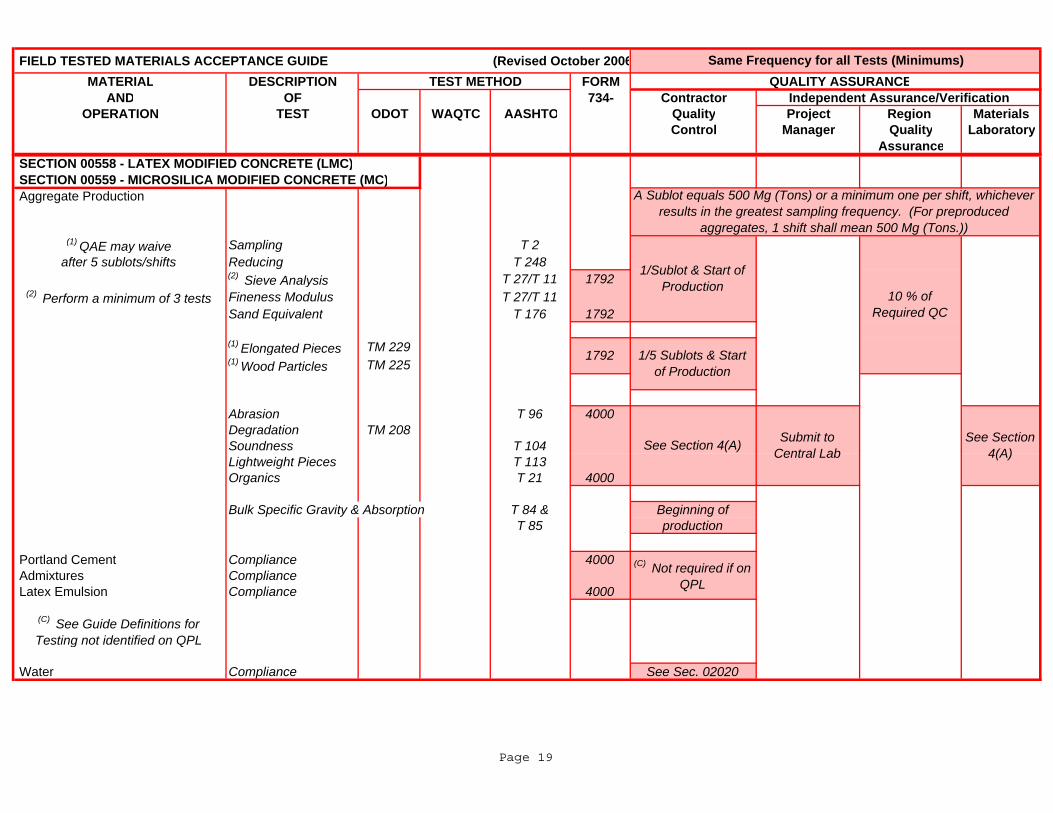
FIELD TESTED MATERIALS ACCEPTANCE GUIDE (Revised October 2006MATERIAL DESCRIPTION TEST METHOD FORM QUALITY ASSURANCE
AND OF 734- Contractor Independent Assurance/VerificationOPERATION TEST ODOT WAQTC AASHTO Quality Project Region Materials
Control Manager Quality LaboratoryAssurance
Same Frequency for all Tests (Minimums)
SECTION 00510 STRUCTURE EXCAVATION AND BACKFILL SECTION 00558 - LATEX MODIFIED CONCRETE (LMC) SECTION 00559 - MICROSILICA MODIFIED CONCRETE (MC) Aggregate Production
(1) QAE may waive Sampling T 2after 5 sublots/shifts Reducing T 248
(2) Sieve Analysis T 27/T 11 1792(2) Perform a minimum of 3 tests Fineness Modulus T 27/T 11
Sand Equivalent T 176 1792
(1) Elongated Pieces TM 229(1) Wood Particles TM 225
Abrasion T 96 4000Degradation TM 208Soundness T 104Lightweight Pieces T 113Organics T 21 4000
Bulk Specific Gravity & Absorption T 84 & Beginning ofT 85 production
Portland Cement Compliance 4000 Admixtures Compliance Latex Emulsion Compliance 4000
Water Compliance See Sec. 02020
See Section 4(A)
1792
1/Sublot & Start of Production
10 % of Required QC
1/5 Sublots & Start of Production
A Sublot equals 500 Mg (Tons) or a minimum one per shift, whichever results in the greatest sampling frequency. (For preproduced
aggregates, 1 shift shall mean 500 Mg (Tons.))
Submit to Central LabSee Section 4(A)
(C) Not required if on QPL
(C) See Guide Definitions for Testing not identified on QPL
Page 19
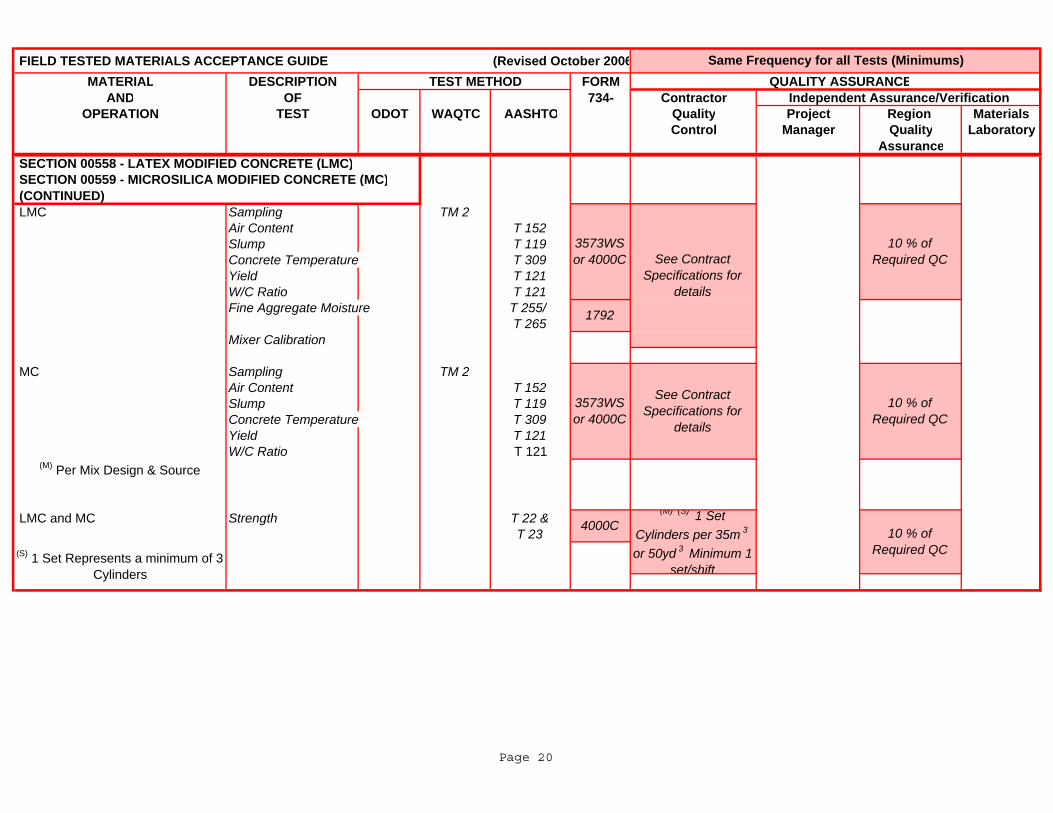
FIELD TESTED MATERIALS ACCEPTANCE GUIDE (Revised October 2006MATERIAL DESCRIPTION TEST METHOD FORM QUALITY ASSURANCE
AND OF 734- Contractor Independent Assurance/VerificationOPERATION TEST ODOT WAQTC AASHTO Quality Project Region Materials
Control Manager Quality LaboratoryAssurance
Same Frequency for all Tests (Minimums)
SECTION 00510 STRUCTURE EXCAVATION AND BACKFILL SECTION 00558 - LATEX MODIFIED CONCRETE (LMC) SECTION 00559 - MICROSILICA MODIFIED CONCRETE (MC) (CONTINUED) LMC Sampling TM 2
Air Content T 152Slump T 119Concrete Temperature T 309Yield T 121W/C Ratio T 121Fine Aggregate Moisture T 255/
T 265Mixer Calibration
MC Sampling TM 2Air Content T 152Slump T 119Concrete Temperature T 309Yield T 121W/C Ratio T 121
(M) Per Mix Design & Source
LMC and MC Strength T 22 &T 23
10 % of Required QCSee Contract
Specifications for details
See Contract Specifications for
details
10 % of Required QC(S) 1 Set Represents a minimum of 3
Cylinders
3573WS or 4000C
3573WS or 4000C
4000C(M) (S) 1 Set
Cylinders per 35m 3
or 50yd 3 Minimum 1 set/shift
1792
10 % of Required QC
Page 20
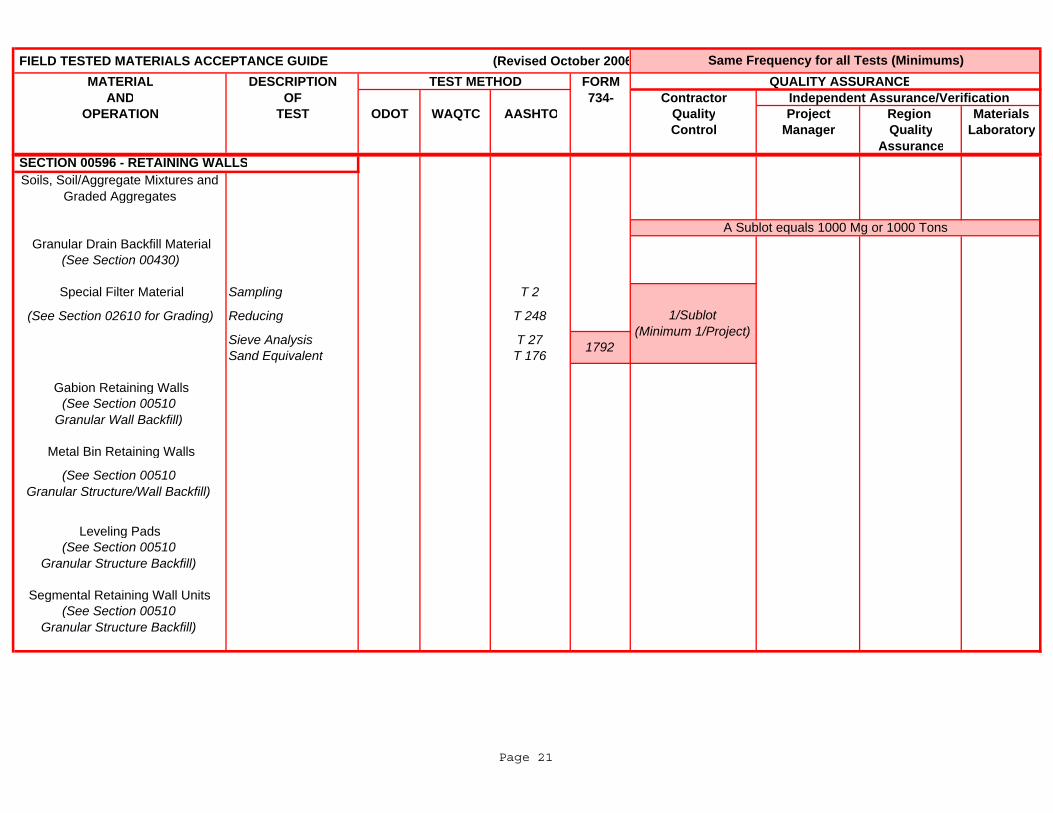
FIELD TESTED MATERIALS ACCEPTANCE GUIDE (Revised October 2006MATERIAL DESCRIPTION TEST METHOD FORM QUALITY ASSURANCE
AND OF 734- Contractor Independent Assurance/VerificationOPERATION TEST ODOT WAQTC AASHTO Quality Project Region Materials
Control Manager Quality LaboratoryAssurance
Same Frequency for all Tests (Minimums)
SECTION 00510 STRUCTURE EXCAVATION AND BACKFILLSoils, Soil/Aggregate Mixtures and
Graded Aggregates
Granular Drain Backfill Material (See Section 00430)
Special Filter Material Sampling T 2
(See Section 02610 for Grading) Reducing T 248
Sieve Analysis T 27Sand Equivalent T 176
Gabion Retaining Walls(See Section 00510
Granular Wall Backfill)
Metal Bin Retaining Walls
(See Section 00510 Granular Structure/Wall Backfill)
Leveling Pads(See Section 00510
Granular Structure Backfill)
Segmental Retaining Wall Units(See Section 00510
Granular Structure Backfill)
SECTION 00596 - RETAINING WALLS
1792
1/Sublot (Minimum 1/Project)
A Sublot equals 1000 Mg or 1000 Tons
Page 21
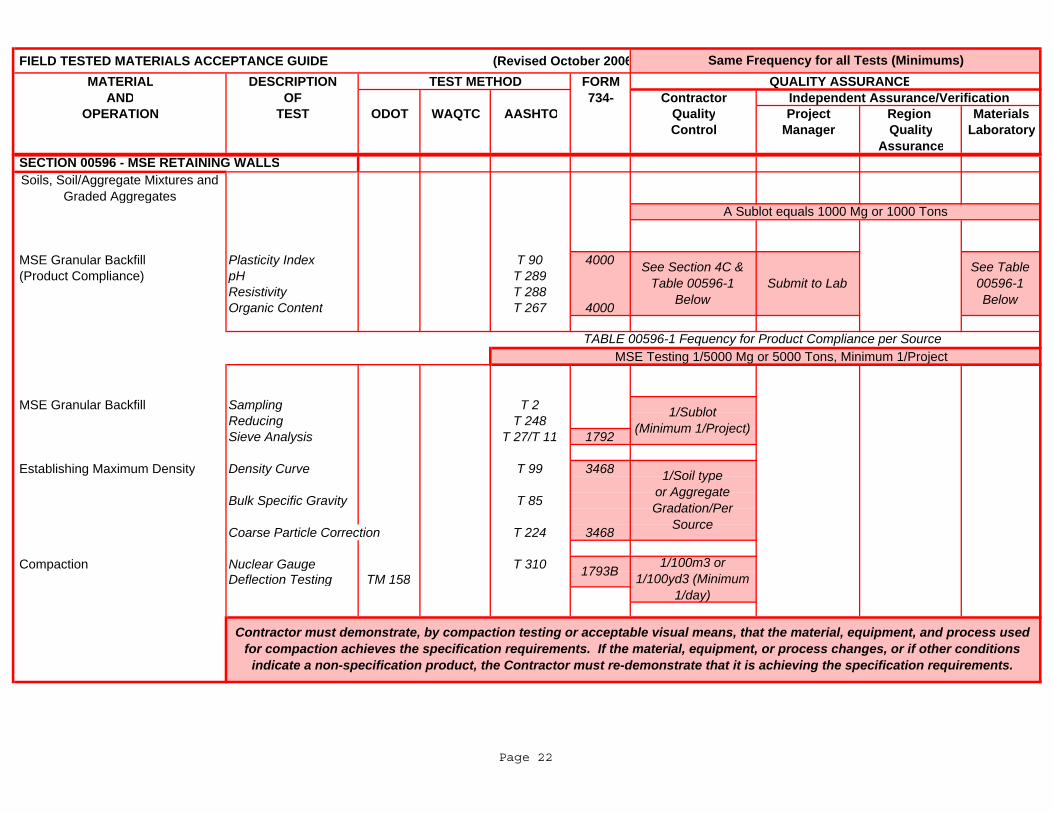
FIELD TESTED MATERIALS ACCEPTANCE GUIDE (Revised October 2006MATERIAL DESCRIPTION TEST METHOD FORM QUALITY ASSURANCE
AND OF 734- Contractor Independent Assurance/VerificationOPERATION TEST ODOT WAQTC AASHTO Quality Project Region Materials
Control Manager Quality LaboratoryAssurance
Same Frequency for all Tests (Minimums)
SECTION 00510 STRUCTURE EXCAVATION AND BACKFILLSoils, Soil/Aggregate Mixtures and
Graded Aggregates
MSE Granular Backfill Plasticity Index T 90 4000 (Product Compliance) pH T 289
Resistivity T 288Organic Content T 267 4000
MSE Testing 1/5000 Mg or 5000 Tons, Minimum 1/Project
MSE Granular Backfill Sampling T 2
Reducing T 248Sieve Analysis T 27/T 11 1792
Establishing Maximum Density Density Curve T 99 3468
Bulk Specific Gravity T 85
Coarse Particle Correction T 224 3468
Compaction Nuclear Gauge T 310Deflection Testing TM 158
1/Sublot (Minimum 1/Project)
See Section 4C & Table 00596-1
Below
Contractor must demonstrate, by compaction testing or acceptable visual means, that the material, equipment, and process used for compaction achieves the specification requirements. If the material, equipment, or process changes, or if other conditions
indicate a non-specification product, the Contractor must re-demonstrate that it is achieving the specification requirements.
1793B
1/Soil type or Aggregate Gradation/Per
Source
1/100m3 or 1/100yd3 (Minimum
1/day)
TABLE 00596-1 Fequency for Product Compliance per Source
See Table 00596-1 Below
SECTION 00596 - MSE RETAINING WALLS
Submit to Lab
A Sublot equals 1000 Mg or 1000 Tons
Page 22
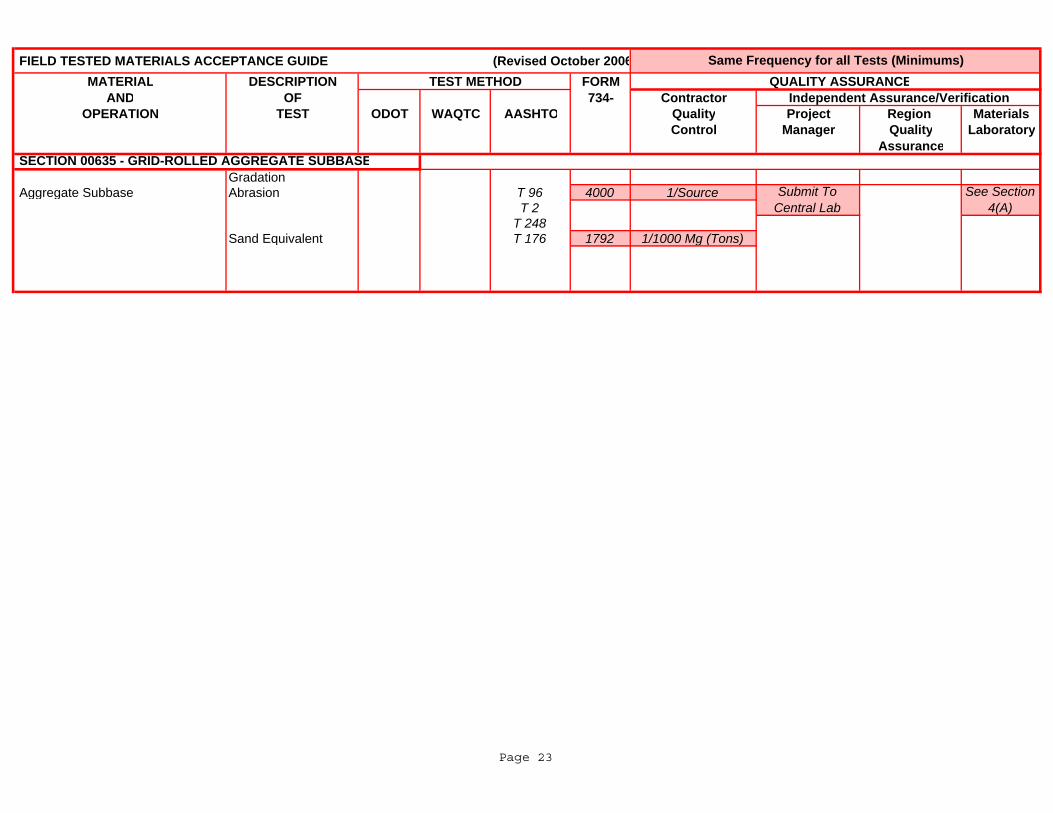
FIELD TESTED MATERIALS ACCEPTANCE GUIDE (Revised October 2006MATERIAL DESCRIPTION TEST METHOD FORM QUALITY ASSURANCE
AND OF 734- Contractor Independent Assurance/VerificationOPERATION TEST ODOT WAQTC AASHTO Quality Project Region Materials
Control Manager Quality LaboratoryAssurance
Gradation Aggregate Subbase Abrasion T 96 4000 1/Source
T 2T 248
Sand Equivalent T 176 1792 1/1000 Mg (Tons)
Same Frequency for all Tests (Minimums)
SECTION 00635 - GRID-ROLLED AGGREGATE SUBBASE
Submit To Central Lab
See Section 4(A)
Page 23
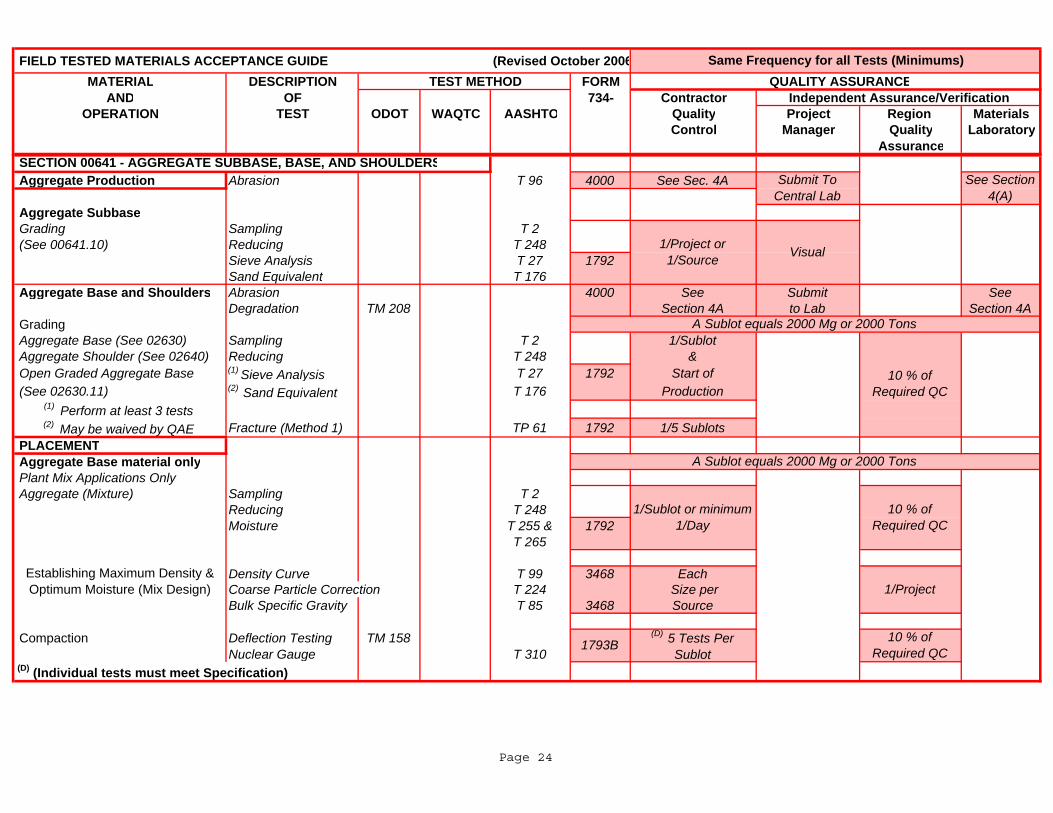
FIELD TESTED MATERIALS ACCEPTANCE GUIDE (Revised October 2006MATERIAL DESCRIPTION TEST METHOD FORM QUALITY ASSURANCE
AND OF 734- Contractor Independent Assurance/VerificationOPERATION TEST ODOT WAQTC AASHTO Quality Project Region Materials
Control Manager Quality LaboratoryAssurance
Same Frequency for all Tests (Minimums)
SECTION 00635 GRID ROLLED AGGREGATE SUBBASE Aggregate Production Abrasion T 96 4000 See Sec. 4A
Aggregate Subbase Grading Sampling T 2 (See 00641.10) Reducing T 248
Sieve Analysis T 27 1792Sand Equivalent T 176
Aggregate Base and Shoulders Abrasion 4000 See Submit SeeDegradation TM 208 Section 4A to Lab Section 4A
Grading Aggregate Base (See 02630) Sampling T 2 1/Sublot Aggregate Shoulder (See 02640) Reducing T 248 & Open Graded Aggregate Base (1) Sieve Analysis T 27 1792 Start of (See 02630.11) (2) Sand Equivalent T 176 Production
(1) Perform at least 3 tests (2) May be waived by QAE Fracture (Method 1) TP 61 1792 1/5 Sublots
PLACEMENT Aggregate Base material only Plant Mix Applications Only Aggregate (Mixture) Sampling T 2
Reducing T 248Moisture T 255 & 1792
T 265
Density Curve T 99 3468 EachCoarse Particle Correction T 224 Size perBulk Specific Gravity T 85 3468 Source
Compaction Deflection Testing TM 158 Nuclear Gauge T 310
(D) (Individual tests must meet Specification)
1/Sublot or minimum 1/Day
10 % of Required QC
1/Project
A Sublot equals 2000 Mg or 2000 Tons
Submit To Central Lab
See Section 4(A)
1/Project or 1/Source Visual
A Sublot equals 2000 Mg or 2000 Tons
SECTION 00641 - AGGREGATE SUBBASE, BASE, AND SHOULDERS
10 % of Required QC
Establishing Maximum Density & Optimum Moisture (Mix Design)
1793B(D) 5 Tests Per
Sublot10 % of
Required QC
Page 24
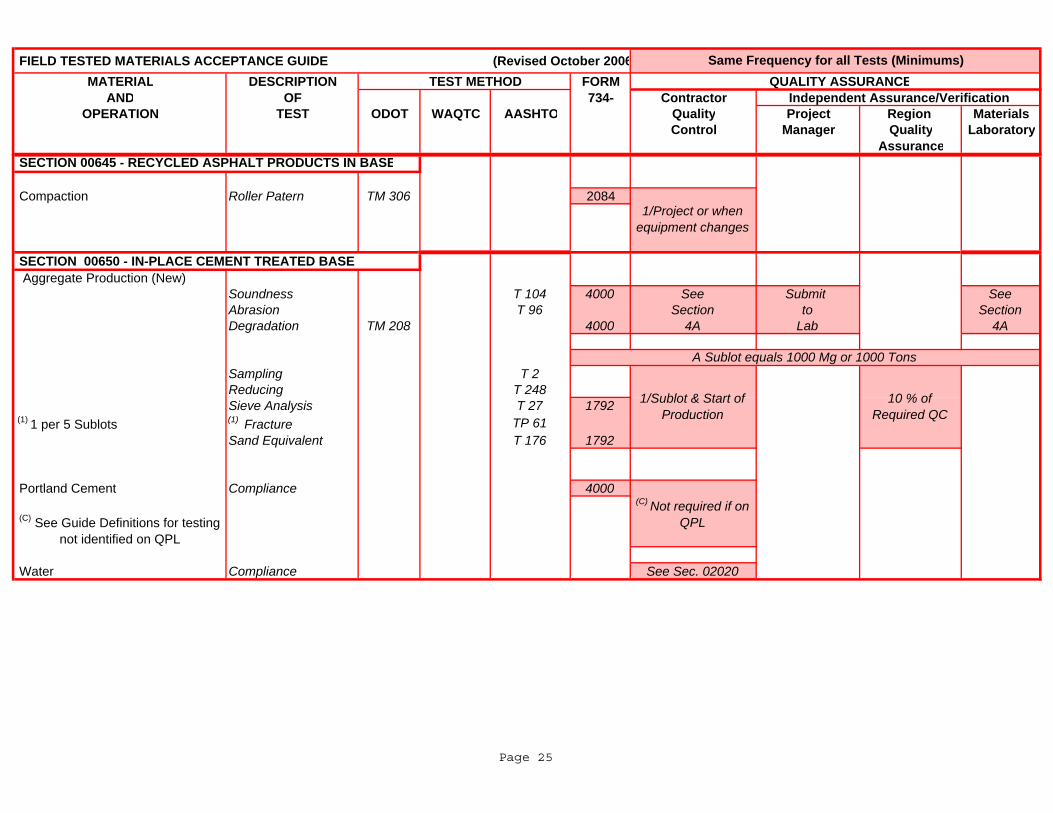
FIELD TESTED MATERIALS ACCEPTANCE GUIDE (Revised October 2006MATERIAL DESCRIPTION TEST METHOD FORM QUALITY ASSURANCE
AND OF 734- Contractor Independent Assurance/VerificationOPERATION TEST ODOT WAQTC AASHTO Quality Project Region Materials
Control Manager Quality LaboratoryAssurance
Same Frequency for all Tests (Minimums)
SECTION 00635 GRID ROLLED AGGREGATE SUBBASE
Compaction Roller Patern TM 306 2084
SECTION 00650 - IN-PLACE CEMENT TREATED BASE Aggregate Production (New)
Soundness T 104 4000 See Submit SeeAbrasion T 96 Section to SectionDegradation TM 208 4000 4A Lab 4A
Sampling T 2Reducing T 248Sieve Analysis T 27 1792
(1) 1 per 5 Sublots (1) Fracture TP 61Sand Equivalent T 176 1792
Portland Cement Compliance 4000
(C) See Guide Definitions for testing not identified on QPL
Water Compliance See Sec. 02020
1/Sublot & Start of Production
SECTION 00645 - RECYCLED ASPHALT PRODUCTS IN BASE
1/Project or when equipment changes
A Sublot equals 1000 Mg or 1000 Tons
10 % of Required QC
(C) Not required if on QPL
Page 25
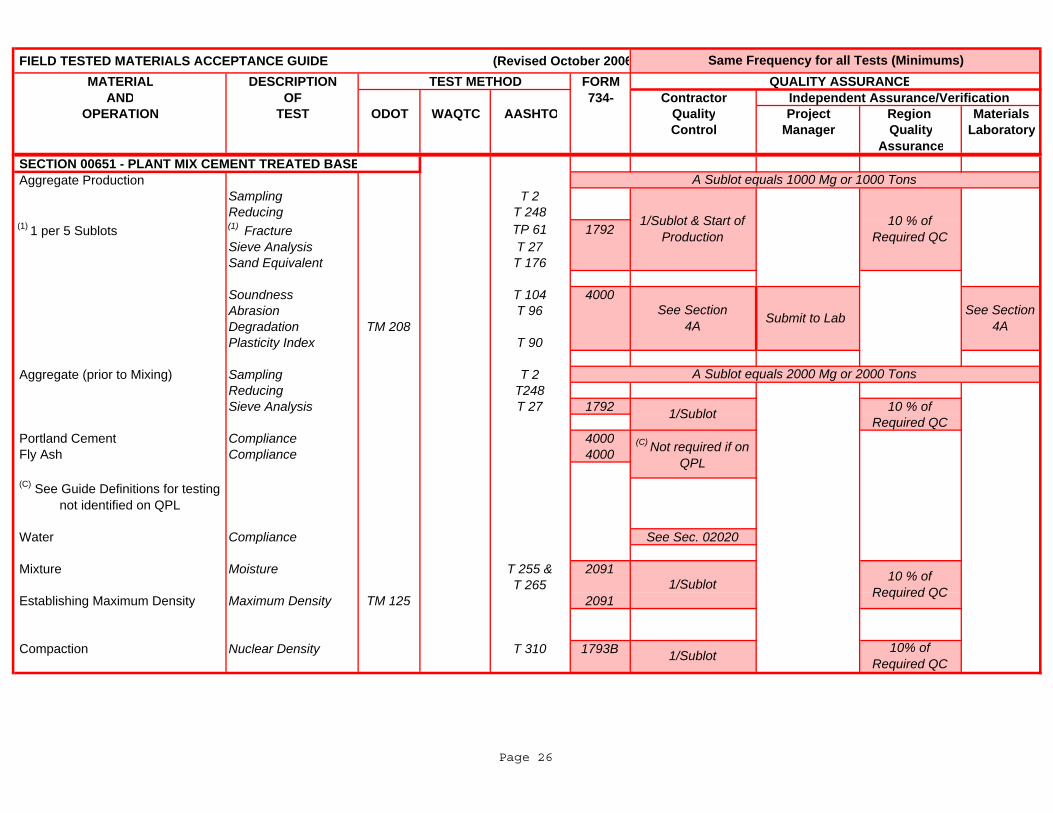
FIELD TESTED MATERIALS ACCEPTANCE GUIDE (Revised October 2006MATERIAL DESCRIPTION TEST METHOD FORM QUALITY ASSURANCE
AND OF 734- Contractor Independent Assurance/VerificationOPERATION TEST ODOT WAQTC AASHTO Quality Project Region Materials
Control Manager Quality LaboratoryAssurance
Same Frequency for all Tests (Minimums)
SECTION 00635 GRID ROLLED AGGREGATE SUBBASE SECTION 00651 - PLANT MIX CEMENT TREATED BASE Aggregate Production
Sampling T 2Reducing T 248
(1) 1 per 5 Sublots (1) Fracture TP 61 1792Sieve Analysis T 27Sand Equivalent T 176
Soundness T 104 4000Abrasion T 96Degradation TM 208Plasticity Index T 90
Aggregate (prior to Mixing) Sampling T 2Reducing T248Sieve Analysis T 27 1792 10 % of Required QC
Portland Cement Compliance 4000 Fly Ash Compliance 4000
(C) See Guide Definitions for testing not identified on QPL
Water Compliance See Sec. 02020
Mixture Moisture T 255 & 2091T 265
Establishing Maximum Density Maximum Density TM 125 2091
Compaction Nuclear Density T 310 1793B
See Section 4A
See Section 4A Submit to Lab
1/Sublot
A Sublot equals 1000 Mg or 1000 Tons
A Sublot equals 2000 Mg or 2000 Tons
10 % of Required QC1/Sublot
(C) Not required if on QPL
1/Sublot 10% of Required QC
10 % of Required QC
1/Sublot & Start of Production
Page 26
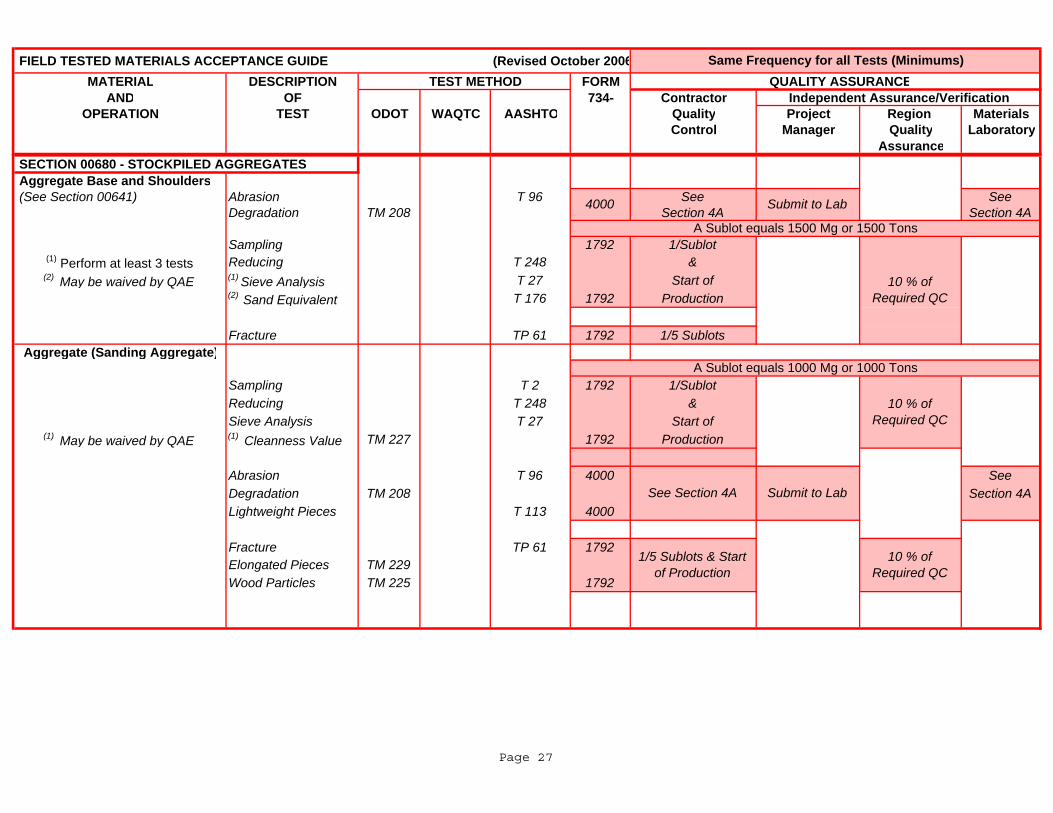
FIELD TESTED MATERIALS ACCEPTANCE GUIDE (Revised October 2006MATERIAL DESCRIPTION TEST METHOD FORM QUALITY ASSURANCE
AND OF 734- Contractor Independent Assurance/VerificationOPERATION TEST ODOT WAQTC AASHTO Quality Project Region Materials
Control Manager Quality LaboratoryAssurance
Same Frequency for all Tests (Minimums)
SECTION 00635 GRID ROLLED AGGREGATE SUBBASE SECTION 00680 - STOCKPILED AGGREGATES Aggregate Base and Shoulders (See Section 00641) Abrasion T 96 See See
Degradation TM 208 Section 4A Section 4A
Sampling 1792 1/Sublot (1) Perform at least 3 tests Reducing T 248 &
(2) May be waived by QAE (1) Sieve Analysis T 27 Start of (2) Sand Equivalent T 176 1792 Production
Fracture TP 61 1792 1/5 SublotsAggregate (Sanding Aggregate)
Sampling T 2 1792 1/SublotReducing T 248 &Sieve Analysis T 27 Start of
(1) May be waived by QAE (1) Cleanness Value TM 227 1792 Production
Abrasion T 96 4000 SeeDegradation TM 208 Section 4ALightweight Pieces T 113 4000
Fracture TP 61 1792Elongated Pieces TM 229Wood Particles TM 225 1792
See Section 4A Submit to Lab
10 % of Required QC
A Sublot equals 1500 Mg or 1500 Tons
A Sublot equals 1000 Mg or 1000 Tons
1/5 Sublots & Start of Production
10 % of Required QC
Submit to Lab
10 % of Required QC
4000
Page 27
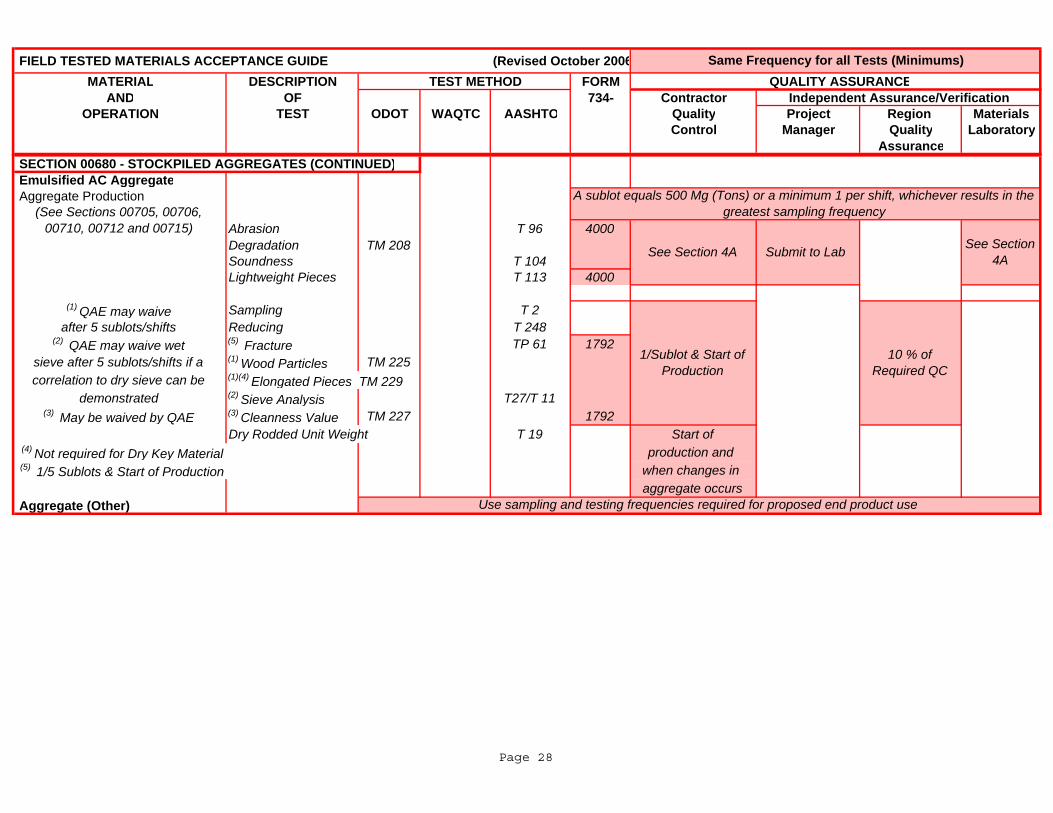
FIELD TESTED MATERIALS ACCEPTANCE GUIDE (Revised October 2006MATERIAL DESCRIPTION TEST METHOD FORM QUALITY ASSURANCE
AND OF 734- Contractor Independent Assurance/VerificationOPERATION TEST ODOT WAQTC AASHTO Quality Project Region Materials
Control Manager Quality LaboratoryAssurance
Same Frequency for all Tests (Minimums)
SECTION 00635 GRID ROLLED AGGREGATE SUBBASE SECTION 00680 - STOCKPILED AGGREGATES (CONTINUED) Emulsified AC Aggregate Aggregate Production
Abrasion T 96 4000Degradation TM 208Soundness T 104Lightweight Pieces T 113 4000
(1) QAE may waive Sampling T 2after 5 sublots/shifts Reducing T 248
(2) QAE may waive wet (5) Fracture TP 61 1792sieve after 5 sublots/shifts if a (1) Wood Particles TM 225correlation to dry sieve can be (1)(4) Elongated Pieces TM 229
demonstrated (2) Sieve Analysis T27/T 11(3) May be waived by QAE (3) Cleanness Value TM 227 1792
Dry Rodded Unit Weight T 19 Start of (4) Not required for Dry Key Material production and (5) 1/5 Sublots & Start of Production when changes in
aggregate occurs Aggregate (Other)
See Section 4A
1/Sublot & Start of Production
See Section 4A Submit to Lab
10 % of Required QC
(See Sections 00705, 00706, 00710, 00712 and 00715)
Use sampling and testing frequencies required for proposed end product use
A sublot equals 500 Mg (Tons) or a minimum 1 per shift, whichever results in the greatest sampling frequency
Page 28
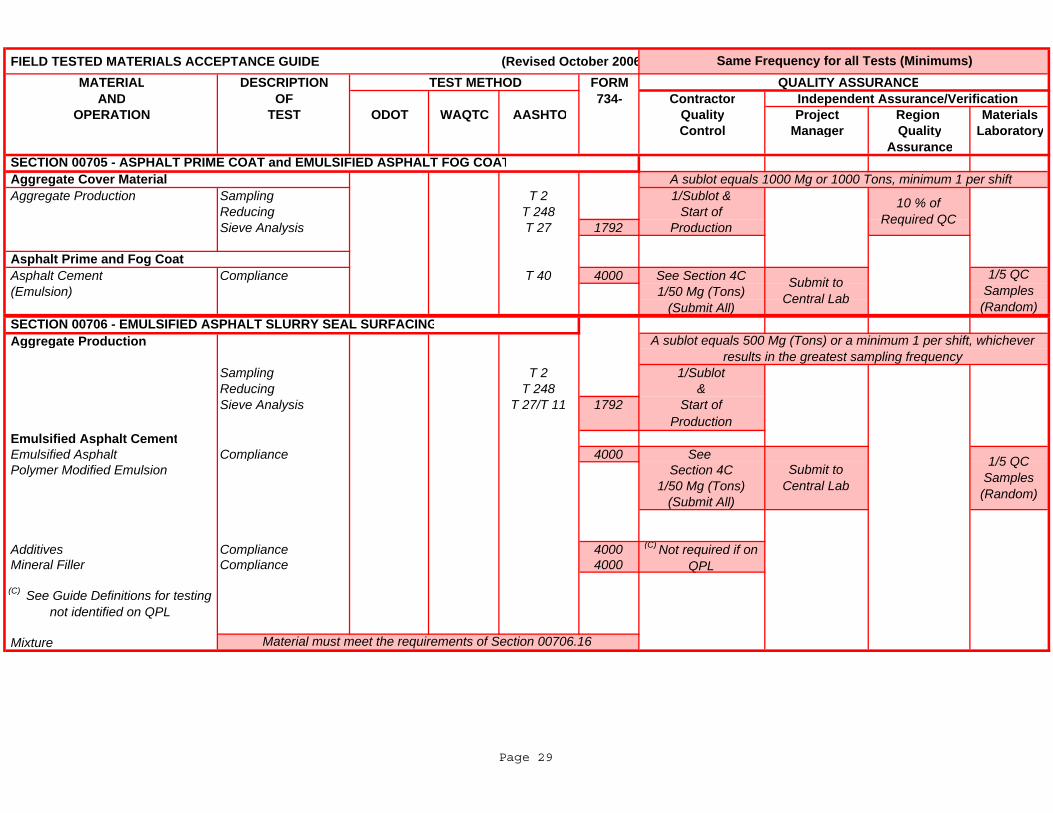
FIELD TESTED MATERIALS ACCEPTANCE GUIDE (Revised October 2006MATERIAL DESCRIPTION TEST METHOD FORM QUALITY ASSURANCE
AND OF 734- Contractor Independent Assurance/VerificationOPERATION TEST ODOT WAQTC AASHTO Quality Project Region Materials
Control Manager Quality LaboratoryAssurance
Aggregate Production Sampling T 2 1/Sublot &Reducing T 248 Start ofSieve Analysis T 27 1792 Production
Asphalt Cement Compliance T 40 4000 See Section 4C (Emulsion) 1/50 Mg (Tons)
(Submit All)
Aggregate Production
Sampling T 2 1/SublotReducing T 248 &Sieve Analysis T 27/T 11 1792 Start of
Production Emulsified Asphalt Cement Emulsified Asphalt Compliance 4000 See Polymer Modified Emulsion Section 4C
1/50 Mg (Tons)(Submit All)
Additives Compliance 4000 Mineral Filler Compliance 4000
Mixture Material must meet the requirements of Section 00706.16
(C) Not required if on QPL
Same Frequency for all Tests (Minimums)
A sublot equals 1000 Mg or 1000 Tons, minimum 1 per shift
1/5 QC Samples (Random)
1/5 QC Samples (Random)
A sublot equals 500 Mg (Tons) or a minimum 1 per shift, whichever results in the greatest sampling frequency
Submit to Central Lab
10 % of Required QC
Submit to Central Lab
(C) See Guide Definitions for testing not identified on QPL
SECTION 00705 - ASPHALT PRIME COAT and EMULSIFIED ASPHALT FOG COAT Aggregate Cover Material
Asphalt Prime and Fog Coat
SECTION 00706 - EMULSIFIED ASPHALT SLURRY SEAL SURFACING
Page 29
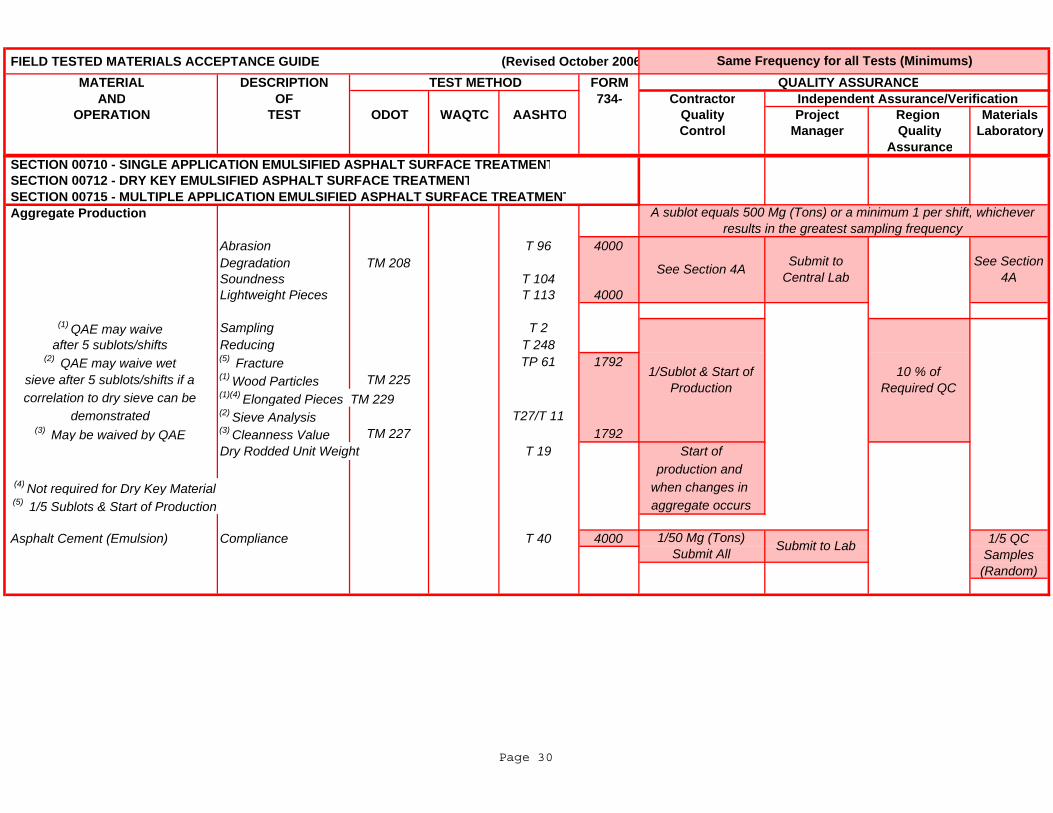
FIELD TESTED MATERIALS ACCEPTANCE GUIDE (Revised October 2006MATERIAL DESCRIPTION TEST METHOD FORM QUALITY ASSURANCE
AND OF 734- Contractor Independent Assurance/VerificationOPERATION TEST ODOT WAQTC AASHTO Quality Project Region Materials
Control Manager Quality LaboratoryAssurance
Same Frequency for all Tests (Minimums)
SECTION 00705 ASPHALT PRIME COAT d EMULSIFIED ASPHALT FOG COAT SECTION 00710 - SINGLE APPLICATION EMULSIFIED ASPHALT SURFACE TREATMENT SECTION 00712 - DRY KEY EMULSIFIED ASPHALT SURFACE TREATMENT SECTION 00715 - MULTIPLE APPLICATION EMULSIFIED ASPHALT SURFACE TREATMENT Aggregate Production
Abrasion T 96 4000Degradation TM 208Soundness T 104Lightweight Pieces T 113 4000
(1) QAE may waive Sampling T 2after 5 sublots/shifts Reducing T 248
(2) QAE may waive wet (5) Fracture TP 61 1792sieve after 5 sublots/shifts if a (1) Wood Particles TM 225correlation to dry sieve can be (1)(4) Elongated Pieces TM 229
demonstrated (2) Sieve Analysis T27/T 11(3) May be waived by QAE (3) Cleanness Value TM 227 1792
Dry Rodded Unit Weight T 19 Start ofproduction and
(4) Not required for Dry Key Material when changes in (5) 1/5 Sublots & Start of Production aggregate occurs
Asphalt Cement (Emulsion) Compliance T 40 4000
1/Sublot & Start of Production
1/5 QC Samples (Random)
Submit to Central Lab
10 % of Required QC
1/50 Mg (Tons) Submit All Submit to Lab
See Section 4A
A sublot equals 500 Mg (Tons) or a minimum 1 per shift, whichever results in the greatest sampling frequency
See Section 4A
Page 30
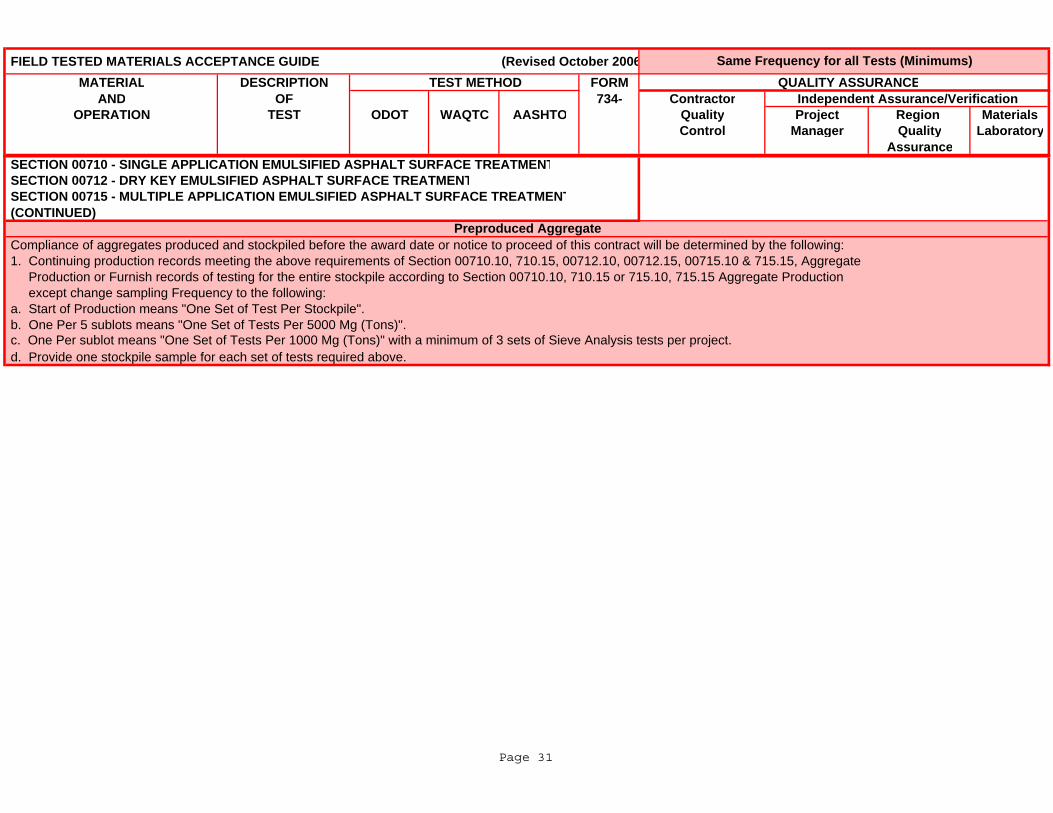
FIELD TESTED MATERIALS ACCEPTANCE GUIDE (Revised October 2006MATERIAL DESCRIPTION TEST METHOD FORM QUALITY ASSURANCE
AND OF 734- Contractor Independent Assurance/VerificationOPERATION TEST ODOT WAQTC AASHTO Quality Project Region Materials
Control Manager Quality LaboratoryAssurance
Same Frequency for all Tests (Minimums)
SECTION 00705 ASPHALT PRIME COAT d EMULSIFIED ASPHALT FOG COAT SECTION 00710 - SINGLE APPLICATION EMULSIFIED ASPHALT SURFACE TREATMENT SECTION 00712 - DRY KEY EMULSIFIED ASPHALT SURFACE TREATMENT SECTION 00715 - MULTIPLE APPLICATION EMULSIFIED ASPHALT SURFACE TREATMENT (CONTINUED)
Compliance of aggregates produced and stockpiled before the award date or notice to proceed of this contract will be determined by the following: 1. Continuing production records meeting the above requirements of Section 00710.10, 710.15, 00712.10, 00712.15, 00715.10 & 715.15, Aggregate Production or Furnish records of testing for the entire stockpile according to Section 00710.10, 710.15 or 715.10, 715.15 Aggregate Production except change sampling Frequency to the following: a. Start of Production means "One Set of Test Per Stockpile". b. One Per 5 sublots means "One Set of Tests Per 5000 Mg (Tons)".
d. Provide one stockpile sample for each set of tests required above. c. One Per sublot means "One Set of Tests Per 1000 Mg (Tons)" with a minimum of 3 sets of Sieve Analysis tests per project.
Preproduced Aggregate
Page 31
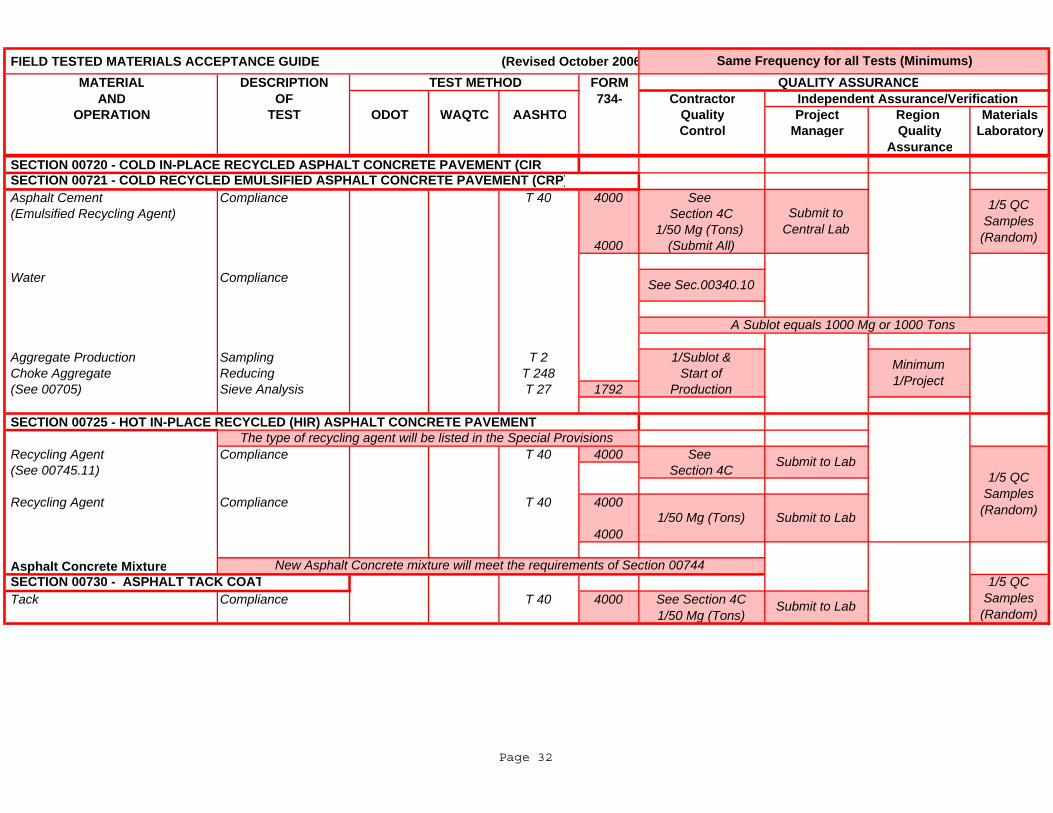
FIELD TESTED MATERIALS ACCEPTANCE GUIDE (Revised October 2006MATERIAL DESCRIPTION TEST METHOD FORM QUALITY ASSURANCE
AND OF 734- Contractor Independent Assurance/VerificationOPERATION TEST ODOT WAQTC AASHTO Quality Project Region Materials
Control Manager Quality LaboratoryAssurance
Same Frequency for all Tests (Minimums)
SECTION 00705 ASPHALT PRIME COAT d EMULSIFIED ASPHALT FOG COAT SECTION 00720 - COLD IN-PLACE RECYCLED ASPHALT CONCRETE PAVEMENT (CIR)
Asphalt Cement Compliance T 40 4000 See (Emulsified Recycling Agent) Section 4C
1/50 Mg (Tons) 4000 (Submit All)
Water Compliance
Aggregate Production Sampling T 2 1/Sublot & Choke Aggregate Reducing T 248 Start of (See 00705) Sieve Analysis T 27 1792 Production
SECTION 00725 - HOT IN-PLACE RECYCLED (HIR) ASPHALT CONCRETE PAVEMENT
Recycling Agent Compliance T 40 4000 See (See 00745.11) Section 4C
Recycling Agent Compliance T 40 4000
4000
Asphalt Concrete Mixture
Tack Compliance T 40 4000 See Section 4C1/50 Mg (Tons)
Submit to Central Lab
1/5 QC Samples (Random)Submit to Lab
SECTION 00721 - COLD RECYCLED EMULSIFIED ASPHALT CONCRETE PAVEMENT (CRP)
SECTION 00730 - ASPHALT TACK COAT
See Sec.00340.10
1/50 Mg (Tons) Submit to Lab
Submit to Lab
New Asphalt Concrete mixture will meet the requirements of Section 00744
The type of recycling agent will be listed in the Special Provisions
1/5 QC Samples (Random)
A Sublot equals 1000 Mg or 1000 Tons
1/5 QC Samples (Random)
Minimum 1/Project
Page 32
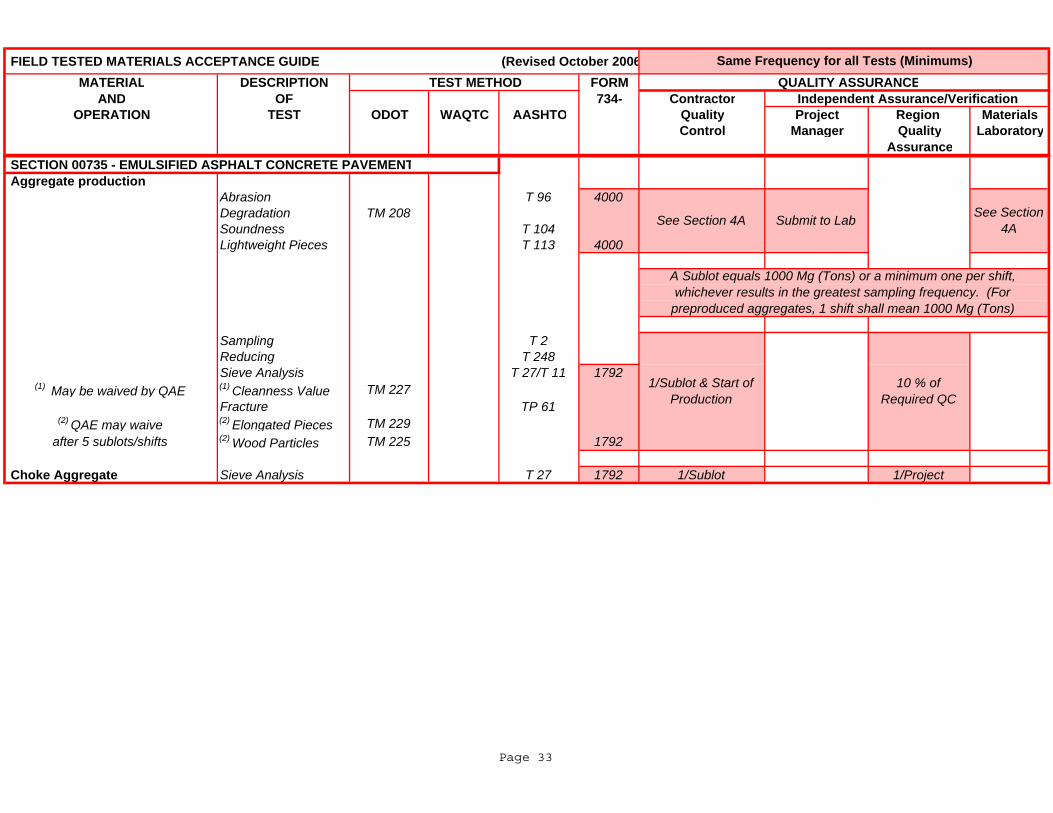
FIELD TESTED MATERIALS ACCEPTANCE GUIDE (Revised October 2006MATERIAL DESCRIPTION TEST METHOD FORM QUALITY ASSURANCE
AND OF 734- Contractor Independent Assurance/VerificationOPERATION TEST ODOT WAQTC AASHTO Quality Project Region Materials
Control Manager Quality LaboratoryAssurance
Same Frequency for all Tests (Minimums)
SECTION 00705 ASPHALT PRIME COAT d EMULSIFIED ASPHALT FOG COAT SECTION 00735 - EMULSIFIED ASPHALT CONCRETE PAVEMENT Aggregate production
Abrasion T 96 4000Degradation TM 208Soundness T 104Lightweight Pieces T 113 4000
Sampling T 2Reducing T 248Sieve Analysis T 27/T 11 1792
(1) May be waived by QAE (1) Cleanness Value TM 227Fracture TP 61
(2) QAE may waive (2) Elongated Pieces TM 229after 5 sublots/shifts (2) Wood Particles TM 225 1792
Choke Aggregate Sieve Analysis T 27 1792 1/Sublot 1/Project
1/Sublot & Start of Production
10 % of Required QC
A Sublot equals 1000 Mg (Tons) or a minimum one per shift, whichever results in the greatest sampling frequency. (For
preproduced aggregates, 1 shift shall mean 1000 Mg (Tons)
Submit to Lab See Section 4ASee Section 4A
Page 33
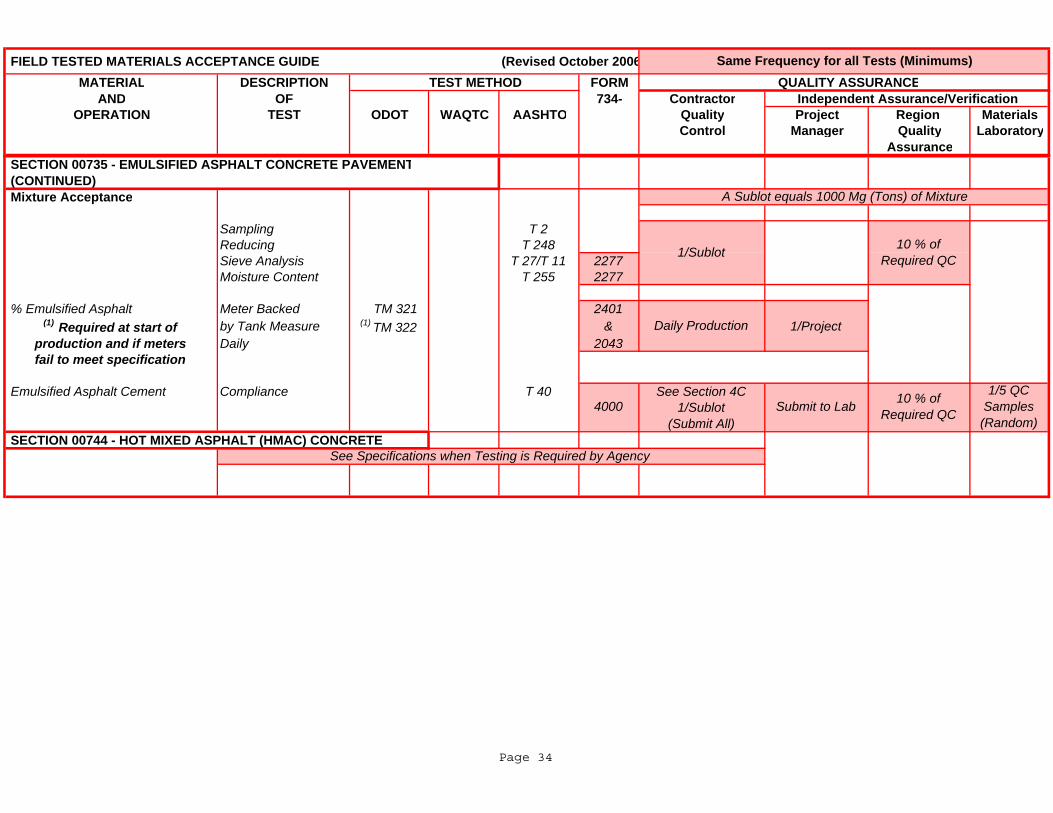
FIELD TESTED MATERIALS ACCEPTANCE GUIDE (Revised October 2006MATERIAL DESCRIPTION TEST METHOD FORM QUALITY ASSURANCE
AND OF 734- Contractor Independent Assurance/VerificationOPERATION TEST ODOT WAQTC AASHTO Quality Project Region Materials
Control Manager Quality LaboratoryAssurance
Same Frequency for all Tests (Minimums)
SECTION 00705 ASPHALT PRIME COAT d EMULSIFIED ASPHALT FOG COAT SECTION 00735 - EMULSIFIED ASPHALT CONCRETE PAVEMENT (CONTINUED) Mixture Acceptance
Sampling T 2Reducing T 248Sieve Analysis T 27/T 11 2277Moisture Content T 255 2277
% Emulsified Asphalt Meter Backed TM 321 2401 (1) Required at start of by Tank Measure (1) TM 322 & 1/Project
production and if meters Daily 2043fail to meet specification
Emulsified Asphalt Cement Compliance T 40 See Section 4C1/Sublot
(Submit All) SECTION 00744 - HOT MIXED ASPHALT (HMAC) CONCRETE
4000
Daily Production
1/Sublot
A Sublot equals 1000 Mg (Tons) of Mixture
1/5 QC Samples (Random)
Submit to Lab 10 % of Required QC
10 % of Required QC
See Specifications when Testing is Required by Agency
Page 34
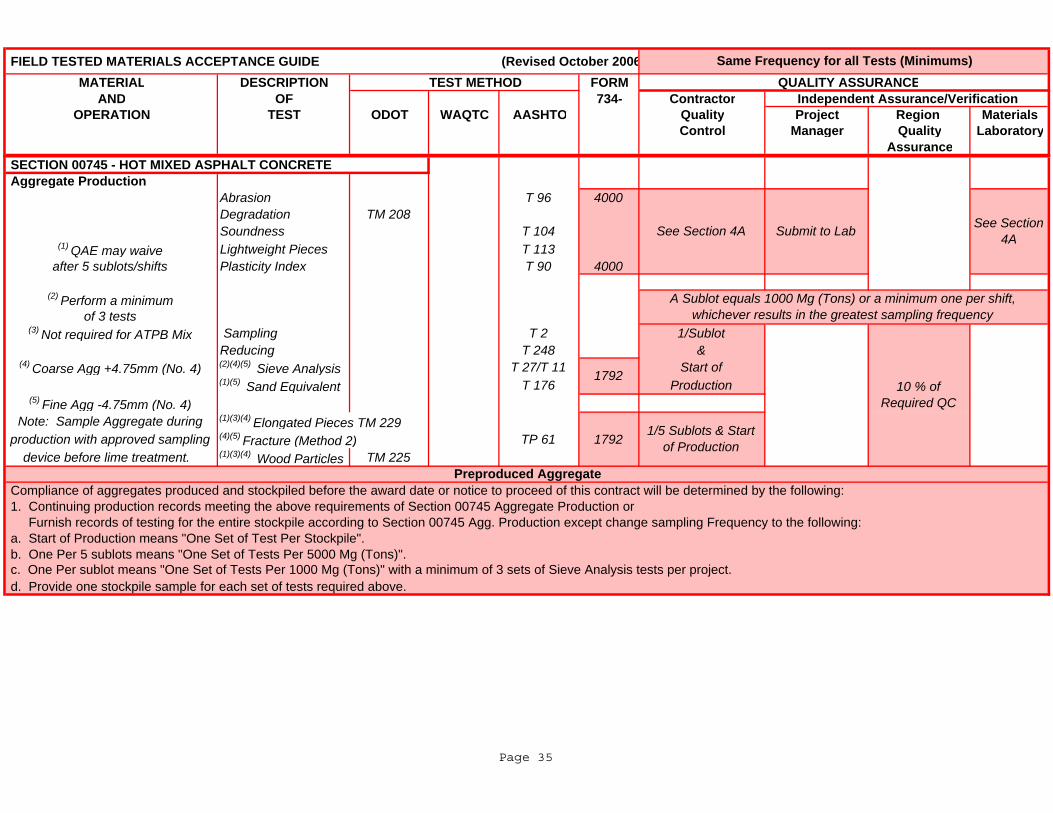
FIELD TESTED MATERIALS ACCEPTANCE GUIDE (Revised October 2006MATERIAL DESCRIPTION TEST METHOD FORM QUALITY ASSURANCE
AND OF 734- Contractor Independent Assurance/VerificationOPERATION TEST ODOT WAQTC AASHTO Quality Project Region Materials
Control Manager Quality LaboratoryAssurance
Same Frequency for all Tests (Minimums)
SECTION 00705 ASPHALT PRIME COAT d EMULSIFIED ASPHALT FOG COAT SECTION 00745 - HOT MIXED ASPHALT CONCRETE Aggregate Production
Abrasion T 96 4000Degradation TM 208Soundness T 104
(1) QAE may waive Lightweight Pieces T 113after 5 sublots/shifts Plasticity Index T 90 4000
(2) Perform a minimumof 3 tests
(3) Not required for ATPB Mix Sampling T 2 1/SublotReducing T 248 &
(4) Coarse Agg +4.75mm (No. 4) (2)(4)(5) Sieve Analysis T 27/T 11 Start of(1)(5) Sand Equivalent T 176 Production
(5) Fine Agg -4.75mm (No. 4)Note: Sample Aggregate during (1)(3)(4) Elongated Pieces TM 229
production with approved sampling (4)(5) Fracture (Method 2) TP 61 1792device before lime treatment. (1)(3)(4) Wood Particles TM 225
Compliance of aggregates produced and stockpiled before the award date or notice to proceed of this contract will be determined by the following: 1. Continuing production records meeting the above requirements of Section 00745 Aggregate Production or Furnish records of testing for the entire stockpile according to Section 00745 Agg. Production except change sampling Frequency to the following: a. Start of Production means "One Set of Test Per Stockpile". b. One Per 5 sublots means "One Set of Tests Per 5000 Mg (Tons)".
d. Provide one stockpile sample for each set of tests required above. c. One Per sublot means "One Set of Tests Per 1000 Mg (Tons)" with a minimum of 3 sets of Sieve Analysis tests per project.
1792
Preproduced Aggregate
See Section 4A Submit to Lab
10 % of Required QC
A Sublot equals 1000 Mg (Tons) or a minimum one per shift, whichever results in the greatest sampling frequency
See Section 4A
1/5 Sublots & Start of Production
Page 35
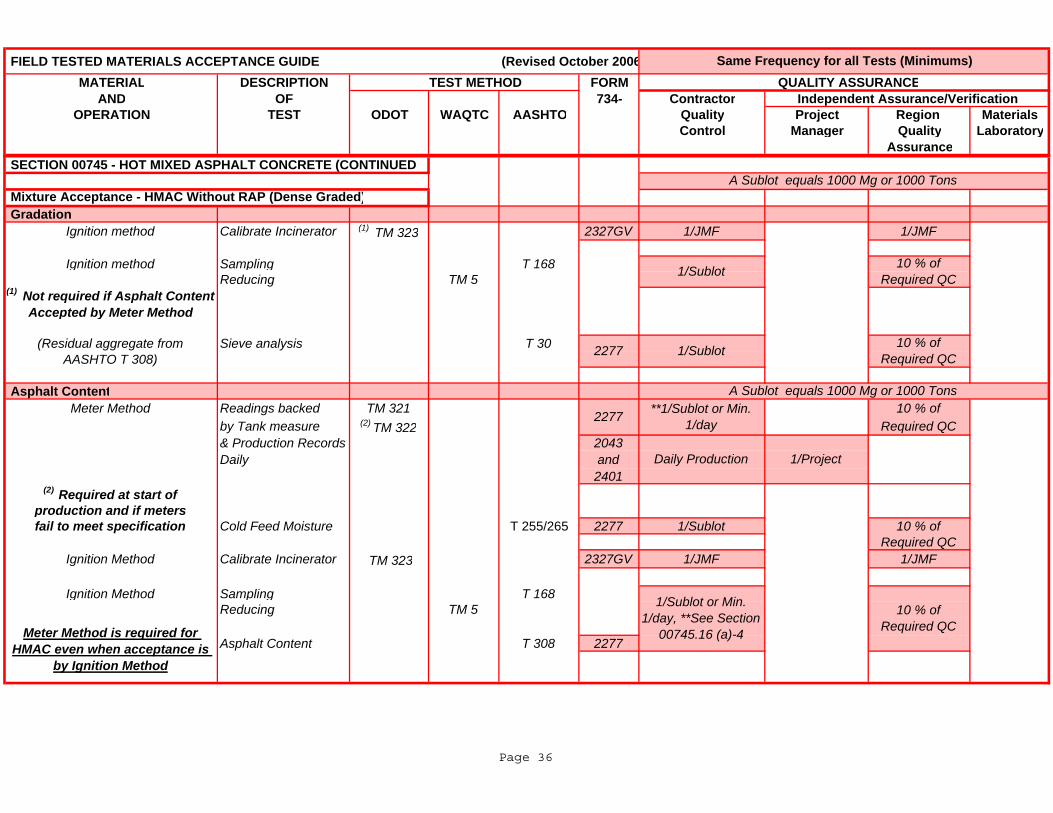
FIELD TESTED MATERIALS ACCEPTANCE GUIDE (Revised October 2006MATERIAL DESCRIPTION TEST METHOD FORM QUALITY ASSURANCE
AND OF 734- Contractor Independent Assurance/VerificationOPERATION TEST ODOT WAQTC AASHTO Quality Project Region Materials
Control Manager Quality LaboratoryAssurance
Same Frequency for all Tests (Minimums)
SECTION 00705 ASPHALT PRIME COAT d EMULSIFIED ASPHALT FOG COAT SECTION 00745 - HOT MIXED ASPHALT CONCRETE (CONTINUED
GradationIgnition method Calibrate Incinerator (1) TM 323 2327GV 1/JMF 1/JMF
Ignition method Sampling T 168Reducing TM 5
(Residual aggregate from Sieve analysis T 30
AASHTO T 308)
Asphalt ContentMeter Method Readings backed TM 321 10 % of
by Tank measure (2) TM 322 Required QC& Production Records 2043Daily and
2401(2) Required at start of
production and if metersfail to meet specification Cold Feed Moisture T 255/265 2277 1/Sublot 10 % of
Required QCIgnition Method Calibrate Incinerator TM 323 2327GV 1/JMF 1/JMF
Ignition Method Sampling T 168Reducing TM 5
Asphalt Content T 308 2277
Mixture Acceptance - HMAC Without RAP (Dense Graded)
Daily Production
1/Sublot or Min. 1/day, **See Section
00745.16 (a)-4
A Sublot equals 1000 Mg or 1000 Tons
Meter Method is required for HMAC even when acceptance is
by Ignition Method
10 % of Required QC
1/Project
2277
(1) Not required if Asphalt Content Accepted by Meter Method
2277
1/Sublot 10 % of Required QC
1/Sublot 10 % of Required QC
**1/Sublot or Min. 1/day
A Sublot equals 1000 Mg or 1000 Tons
Page 36
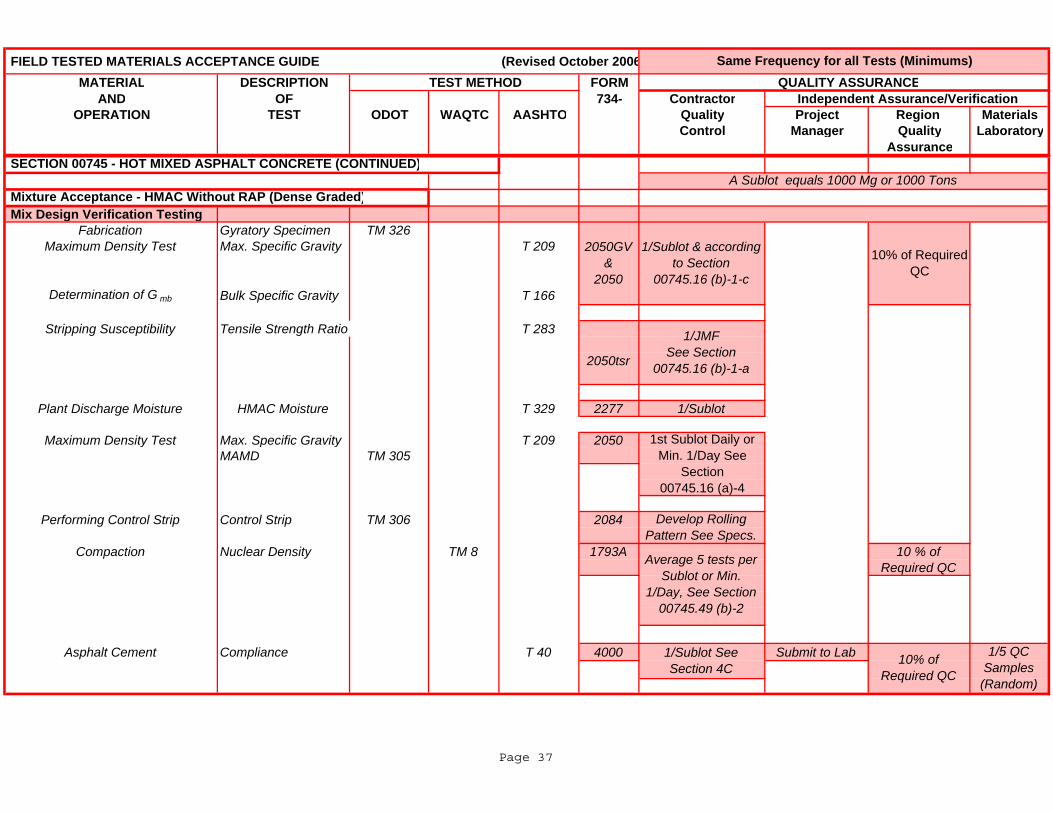
FIELD TESTED MATERIALS ACCEPTANCE GUIDE (Revised October 2006MATERIAL DESCRIPTION TEST METHOD FORM QUALITY ASSURANCE
AND OF 734- Contractor Independent Assurance/VerificationOPERATION TEST ODOT WAQTC AASHTO Quality Project Region Materials
Control Manager Quality LaboratoryAssurance
Same Frequency for all Tests (Minimums)
SECTION 00705 ASPHALT PRIME COAT d EMULSIFIED ASPHALT FOG COAT
Mix Design Verification TestingFabrication Gyratory Specimen TM 326
Maximum Density Test Max. Specific Gravity T 209
Determination of G mb Bulk Specific Gravity T 166
Stripping Susceptibility Tensile Strength Ratio T 283
2050tsr
Plant Discharge Moisture HMAC Moisture T 329 2277 1/Sublot
Maximum Density Test Max. Specific Gravity T 209 2050MAMD TM 305
Performing Control Strip Control Strip TM 306 2084
Compaction Nuclear Density TM 8 1793A 10 % ofRequired QC
Asphalt Cement Compliance T 40 4000 Submit to Lab
Mixture Acceptance - HMAC Without RAP (Dense Graded) SECTION 00745 - HOT MIXED ASPHALT CONCRETE (CONTINUED)
2050GV &
2050
1/JMF See Section
00745.16 (b)-1-a
Average 5 tests per Sublot or Min.
1/Day, See Section 00745.49 (b)-2
Develop Rolling Pattern See Specs.
10% of Required QC
1st Sublot Daily or Min. 1/Day See
Section 00745.16 (a)-4
1/Sublot See Section 4C
1/Sublot & according to Section
00745.16 (b)-1-c
1/5 QC Samples (Random)
10% of Required QC
A Sublot equals 1000 Mg or 1000 Tons
Page 37
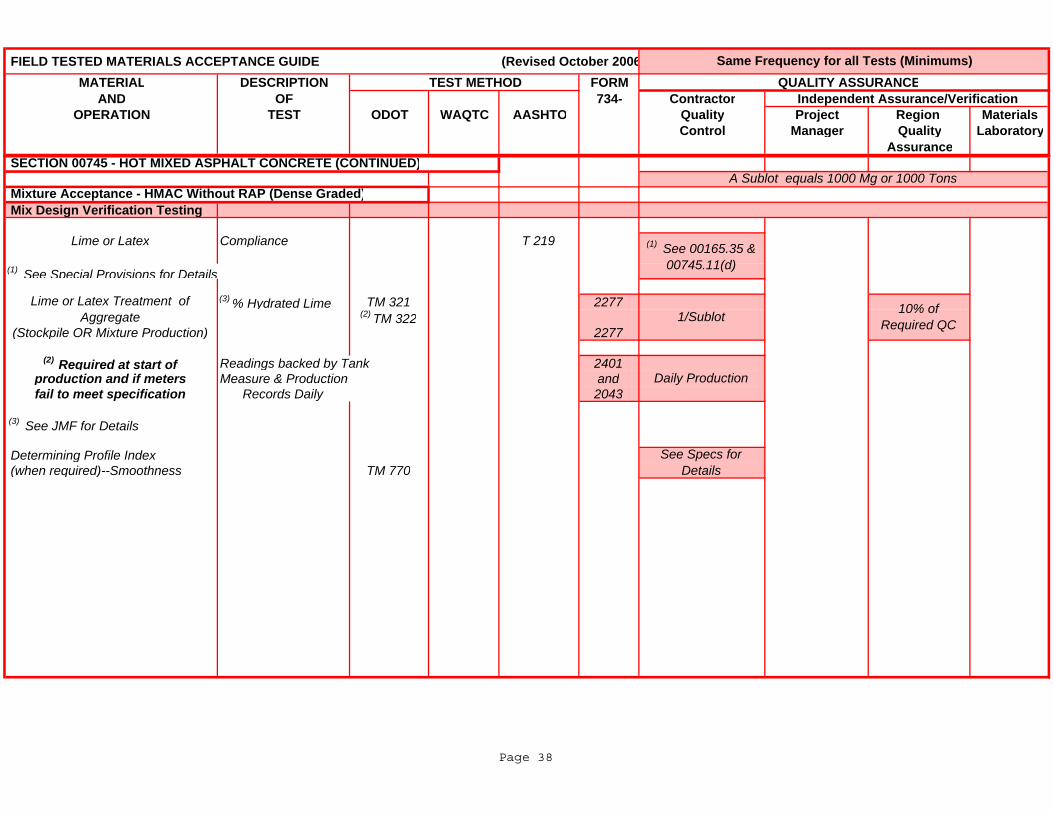
FIELD TESTED MATERIALS ACCEPTANCE GUIDE (Revised October 2006MATERIAL DESCRIPTION TEST METHOD FORM QUALITY ASSURANCE
AND OF 734- Contractor Independent Assurance/VerificationOPERATION TEST ODOT WAQTC AASHTO Quality Project Region Materials
Control Manager Quality LaboratoryAssurance
Same Frequency for all Tests (Minimums)
SECTION 00705 ASPHALT PRIME COAT d EMULSIFIED ASPHALT FOG COAT
Mix Design Verification Testing
Lime or Latex Compliance T 219
(1) See Special Provisions for Details
(3) % Hydrated Lime TM 321 2277(2) TM 322
(Stockpile OR Mixture Production) 2277
(2) Required at start of Readings backed by Tank 2401production and if meters Measure & Production andfail to meet specification Records Daily 2043
(3) See JMF for Details
Determining Profile Index (when required)--Smoothness TM 770
Mixture Acceptance - HMAC Without RAP (Dense Graded)
SECTION 00745 - HOT MIXED ASPHALT CONCRETE (CONTINUED)
See Specs for Details
(1) See 00165.35 & 00745.11(d)
A Sublot equals 1000 Mg or 1000 Tons
10% of Required QC
Lime or Latex Treatment of Aggregate 1/Sublot
Daily Production
Page 38
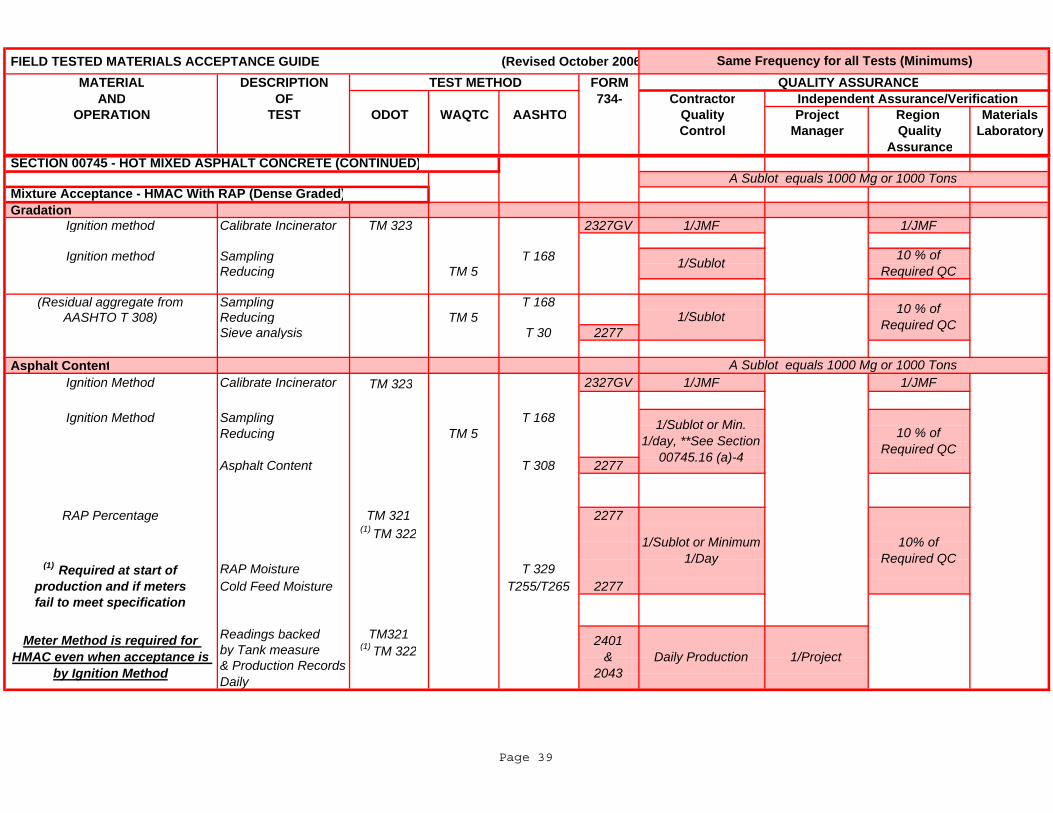
FIELD TESTED MATERIALS ACCEPTANCE GUIDE (Revised October 2006MATERIAL DESCRIPTION TEST METHOD FORM QUALITY ASSURANCE
AND OF 734- Contractor Independent Assurance/VerificationOPERATION TEST ODOT WAQTC AASHTO Quality Project Region Materials
Control Manager Quality LaboratoryAssurance
Same Frequency for all Tests (Minimums)
SECTION 00705 ASPHALT PRIME COAT d EMULSIFIED ASPHALT FOG COAT
GradationIgnition method Calibrate Incinerator TM 323 2327GV 1/JMF 1/JMF
Ignition method Sampling T 168Reducing TM 5
(Residual aggregate from Sampling T 168AASHTO T 308) Reducing TM 5
Sieve analysis T 30 2277
Asphalt ContentIgnition Method Calibrate Incinerator TM 323 2327GV 1/JMF 1/JMF
Ignition Method Sampling T 168Reducing TM 5
Asphalt Content T 308 2277
RAP Percentage TM 321 2277(1) TM 322
(1) Required at start of RAP Moisture T 329production and if meters Cold Feed Moisture T255/T265 2277fail to meet specification
Readings backed TM321by Tank measure (1) TM 322& Production RecordsDaily
Meter Method is required for HMAC even when acceptance is
by Ignition Method
1/Sublot 10 % of Required QC
10% of Required QC
10 % of Required QC1/Sublot
1/Sublot or Min. 1/day, **See Section
00745.16 (a)-4
SECTION 00745 - HOT MIXED ASPHALT CONCRETE (CONTINUED)A Sublot equals 1000 Mg or 1000 Tons
2401 &
2043Daily Production 1/Project
Mixture Acceptance - HMAC With RAP (Dense Graded)
A Sublot equals 1000 Mg or 1000 Tons
10 % of Required QC
1/Sublot or Minimum 1/Day
Page 39
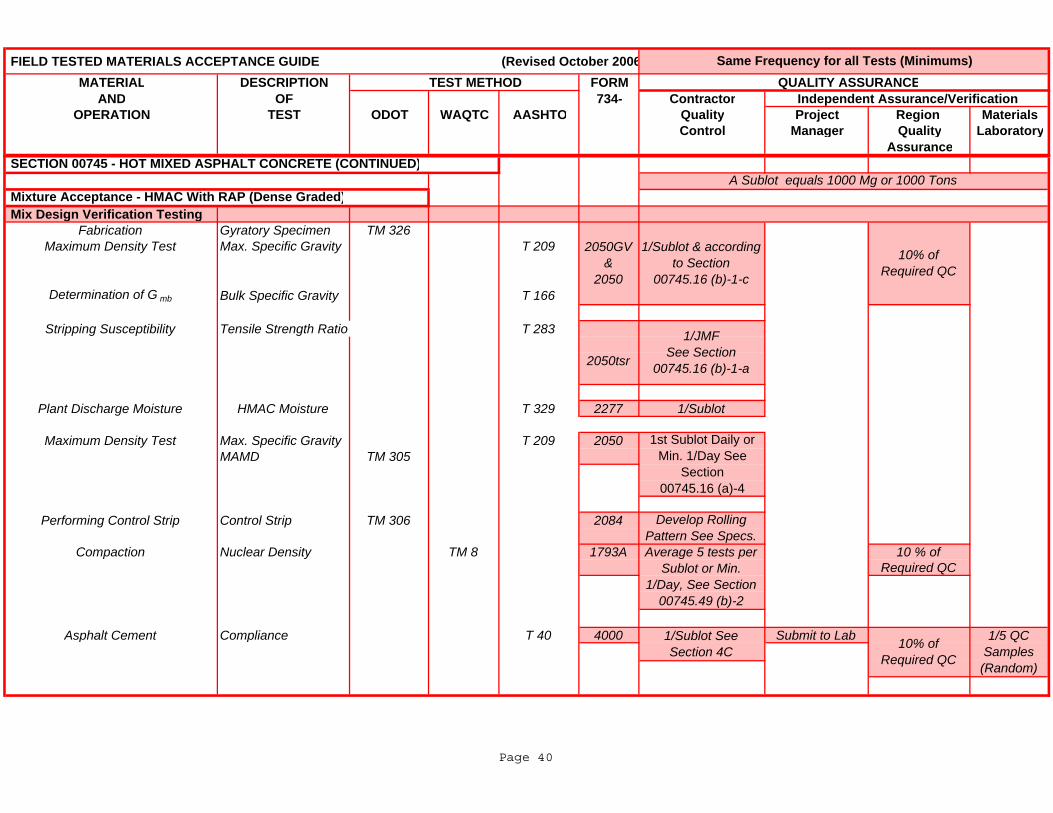
FIELD TESTED MATERIALS ACCEPTANCE GUIDE (Revised October 2006MATERIAL DESCRIPTION TEST METHOD FORM QUALITY ASSURANCE
AND OF 734- Contractor Independent Assurance/VerificationOPERATION TEST ODOT WAQTC AASHTO Quality Project Region Materials
Control Manager Quality LaboratoryAssurance
Same Frequency for all Tests (Minimums)
SECTION 00705 ASPHALT PRIME COAT d EMULSIFIED ASPHALT FOG COAT
Mix Design Verification TestingFabrication Gyratory Specimen TM 326
Maximum Density Test Max. Specific Gravity T 209
Determination of G mb Bulk Specific Gravity T 166
Stripping Susceptibility Tensile Strength Ratio T 283
2050tsr
Plant Discharge Moisture HMAC Moisture T 329 2277 1/Sublot
Maximum Density Test Max. Specific Gravity T 209 2050MAMD TM 305
Performing Control Strip Control Strip TM 306 2084
Compaction Nuclear Density TM 8 1793A 10 % ofRequired QC
Asphalt Cement Compliance T 40 4000 Submit to Lab
SECTION 00745 - HOT MIXED ASPHALT CONCRETE (CONTINUED)
Mixture Acceptance - HMAC With RAP (Dense Graded)
1/Sublot & according to Section
00745.16 (b)-1-c
2050GV &
2050
A Sublot equals 1000 Mg or 1000 Tons
Develop Rolling Pattern See Specs.
10% of Required QC
1/JMF See Section
00745.16 (b)-1-a
1st Sublot Daily or Min. 1/Day See
Section 00745.16 (a)-4
Average 5 tests per Sublot or Min.
1/Day, See Section 00745.49 (b)-2
1/Sublot See Section 4C 10% of
Required QC
1/5 QC Samples (Random)
Page 40
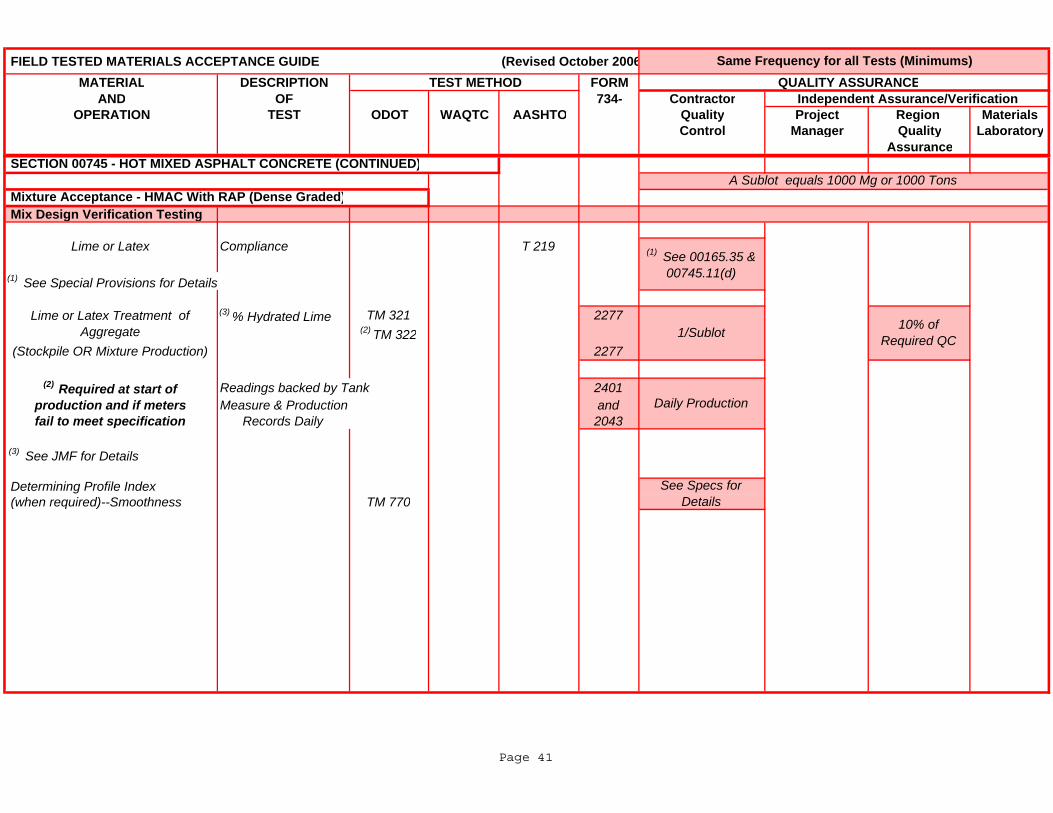
FIELD TESTED MATERIALS ACCEPTANCE GUIDE (Revised October 2006MATERIAL DESCRIPTION TEST METHOD FORM QUALITY ASSURANCE
AND OF 734- Contractor Independent Assurance/VerificationOPERATION TEST ODOT WAQTC AASHTO Quality Project Region Materials
Control Manager Quality LaboratoryAssurance
Same Frequency for all Tests (Minimums)
SECTION 00705 ASPHALT PRIME COAT d EMULSIFIED ASPHALT FOG COAT
Mix Design Verification Testing
Lime or Latex Compliance T 219
(1) See Special Provisions for Details
(3) % Hydrated Lime TM 321 2277(2) TM 322
(Stockpile OR Mixture Production) 2277
(2) Required at start of Readings backed by Tank 2401 production and if meters Measure & Production andfail to meet specification Records Daily 2043
(3) See JMF for Details
Determining Profile Index (when required)--Smoothness TM 770
(1) See 00165.35 & 00745.11(d)
Lime or Latex Treatment of Aggregate 1/Sublot
Mixture Acceptance - HMAC With RAP (Dense Graded)
10% of Required QC
SECTION 00745 - HOT MIXED ASPHALT CONCRETE (CONTINUED)A Sublot equals 1000 Mg or 1000 Tons
Daily Production
See Specs for Details
Page 41
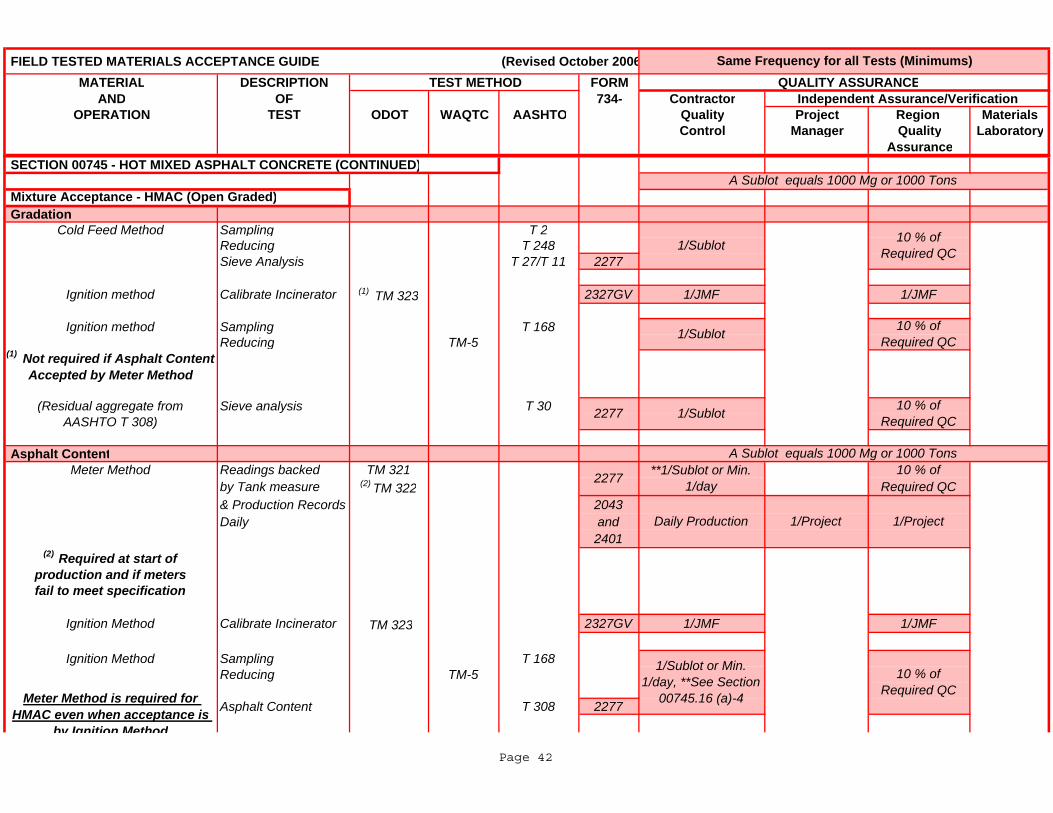
FIELD TESTED MATERIALS ACCEPTANCE GUIDE (Revised October 2006MATERIAL DESCRIPTION TEST METHOD FORM QUALITY ASSURANCE
AND OF 734- Contractor Independent Assurance/VerificationOPERATION TEST ODOT WAQTC AASHTO Quality Project Region Materials
Control Manager Quality LaboratoryAssurance
Same Frequency for all Tests (Minimums)
SECTION 00705 ASPHALT PRIME COAT d EMULSIFIED ASPHALT FOG COAT SECTION 00745 - HOT MIXED ASPHALT CONCRETE (CONTINUED)
Gradation Cold Feed Method Sampling T 2
Reducing T 248Sieve Analysis T 27/T 11 2277
Ignition method Calibrate Incinerator (1) TM 323 2327GV 1/JMF 1/JMF
Ignition method Sampling T 168Reducing TM-5
(Residual aggregate from Sieve analysis T 30
AASHTO T 308)
Asphalt ContentMeter Method Readings backed TM 321 10 % of
by Tank measure (2) TM 322 Required QC& Production Records 2043Daily and
2401(2) Required at start of
production and if metersfail to meet specification
Ignition Method Calibrate Incinerator TM 323 2327GV 1/JMF 1/JMF
Ignition Method Sampling T 168Reducing TM-5
Asphalt Content T 308 2277
Mixture Acceptance - HMAC (Open Graded)
Meter Method is required for HMAC even when acceptance is
by Ignition Method
1/Sublot 10 % of Required QC
1/Project
1/Sublot 10 % of Required QC
**1/Sublot or Min. 1/day
(1) Not required if Asphalt Content Accepted by Meter Method
A Sublot equals 1000 Mg or 1000 Tons
1/Sublot or Min. 1/day, **See Section
00745.16 (a)-4
10 % of Required QC
1/Sublot2277
2277
Daily Production
10 % of Required QC
A Sublot equals 1000 Mg or 1000 Tons
1/Project
Page 42
FIELD TESTED MATERIALS ACCEPTANCE GUIDE (Revised October 2006MATERIAL DESCRIPTION TEST METHOD FORM QUALITY ASSURANCE
AND OF 734- Contractor Independent Assurance/VerificationOPERATION TEST ODOT WAQTC AASHTO Quality Project Region Materials
Control Manager Quality LaboratoryAssurance
Same Frequency for all Tests (Minimums)
SECTION 00705 ASPHALT PRIME COAT d EMULSIFIED ASPHALT FOG COATby Ignition Method
Page 43
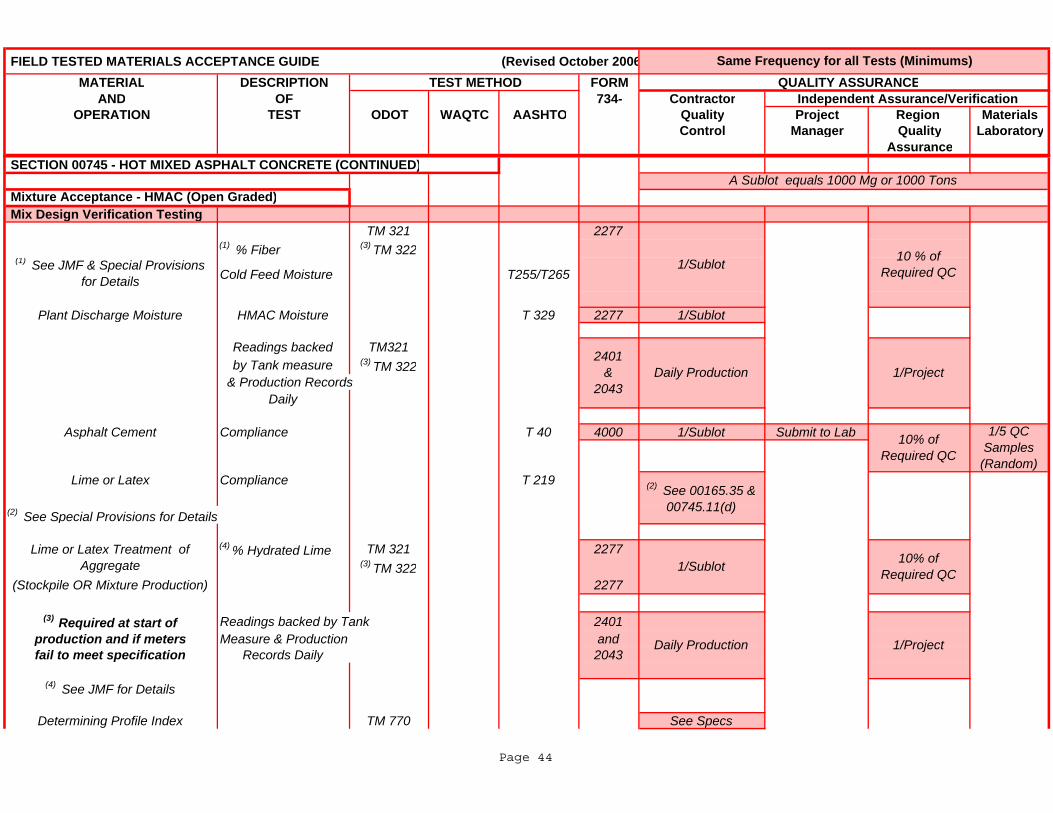
FIELD TESTED MATERIALS ACCEPTANCE GUIDE (Revised October 2006MATERIAL DESCRIPTION TEST METHOD FORM QUALITY ASSURANCE
AND OF 734- Contractor Independent Assurance/VerificationOPERATION TEST ODOT WAQTC AASHTO Quality Project Region Materials
Control Manager Quality LaboratoryAssurance
Same Frequency for all Tests (Minimums)
SECTION 00705 ASPHALT PRIME COAT d EMULSIFIED ASPHALT FOG COAT SECTION 00745 - HOT MIXED ASPHALT CONCRETE (CONTINUED)
Mix Design Verification TestingTM 321 2277
(1) % Fiber (3) TM 322(1) See JMF & Special Provisions
for Details Cold Feed Moisture T255/T265
Plant Discharge Moisture HMAC Moisture T 329 2277 1/Sublot
Readings backed TM321 by Tank measure (3) TM 322
& Production RecordsDaily
Asphalt Cement Compliance T 40 4000 1/Sublot Submit to Lab
Lime or Latex Compliance T 219
(2) See Special Provisions for Details
(4) % Hydrated Lime TM 321 2277(3) TM 322
(Stockpile OR Mixture Production) 2277
(3) Required at start of Readings backed by Tank 2401 production and if meters Measure & Production andfail to meet specification Records Daily 2043
(4) See JMF for Details
Determining Profile Index TM 770 See Specs
A Sublot equals 1000 Mg or 1000 Tons
1/Sublot 10 % of Required QC
Mixture Acceptance - HMAC (Open Graded)
Daily Production 1/Project
1/5 QC Samples (Random)
Lime or Latex Treatment of Aggregate 1/Sublot 10% of
Required QC
2401 &
2043Daily Production 1/Project
10% of Required QC
(2) See 00165.35 & 00745.11(d)
Page 44
FIELD TESTED MATERIALS ACCEPTANCE GUIDE (Revised October 2006MATERIAL DESCRIPTION TEST METHOD FORM QUALITY ASSURANCE
AND OF 734- Contractor Independent Assurance/VerificationOPERATION TEST ODOT WAQTC AASHTO Quality Project Region Materials
Control Manager Quality LaboratoryAssurance
Same Frequency for all Tests (Minimums)
SECTION 00705 ASPHALT PRIME COAT d EMULSIFIED ASPHALT FOG COAT(when required)--Smoothness
Page 45
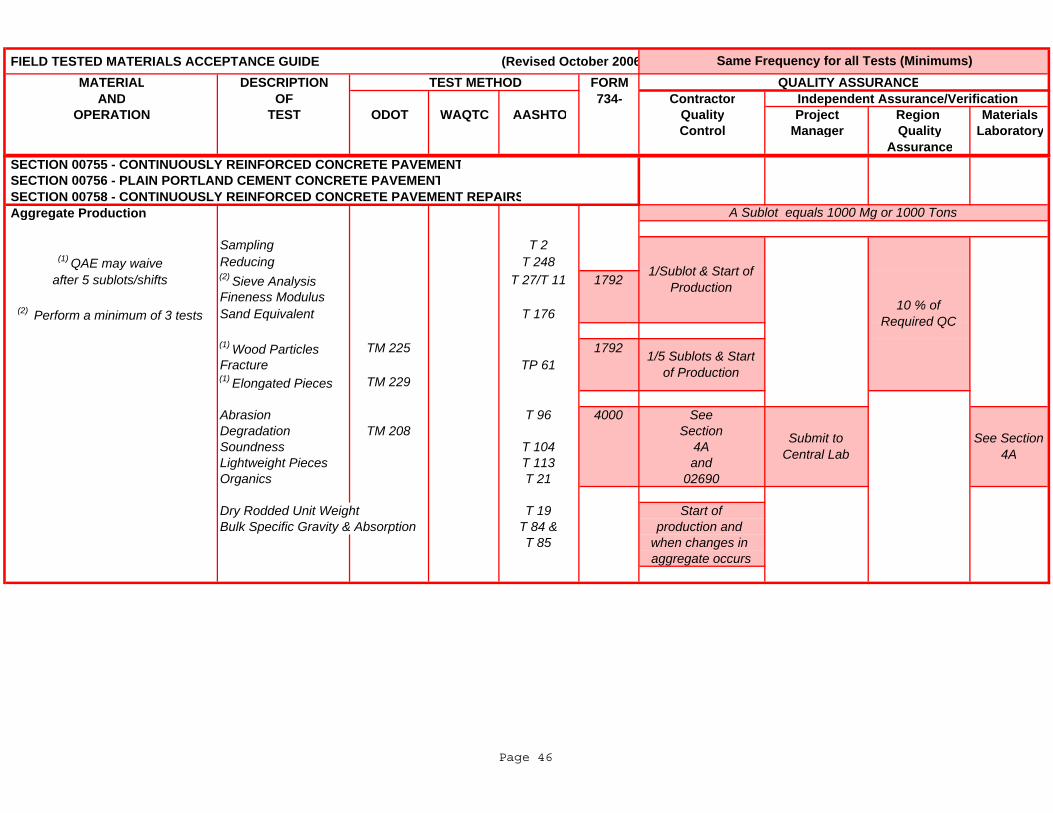
FIELD TESTED MATERIALS ACCEPTANCE GUIDE (Revised October 2006MATERIAL DESCRIPTION TEST METHOD FORM QUALITY ASSURANCE
AND OF 734- Contractor Independent Assurance/VerificationOPERATION TEST ODOT WAQTC AASHTO Quality Project Region Materials
Control Manager Quality LaboratoryAssurance
Same Frequency for all Tests (Minimums)
SECTION 00705 ASPHALT PRIME COAT d EMULSIFIED ASPHALT FOG COAT SECTION 00755 - CONTINUOUSLY REINFORCED CONCRETE PAVEMENT SECTION 00756 - PLAIN PORTLAND CEMENT CONCRETE PAVEMENT SECTION 00758 - CONTINUOUSLY REINFORCED CONCRETE PAVEMENT REPAIRS Aggregate Production
Sampling T 2(1) QAE may waive Reducing T 248
after 5 sublots/shifts (2) Sieve Analysis T 27/T 11 1792Fineness Modulus
(2) Perform a minimum of 3 tests Sand Equivalent T 176
(1) Wood Particles TM 225 1792Fracture TP 61(1) Elongated Pieces TM 229
Abrasion T 96 4000 SeeDegradation TM 208 SectionSoundness T 104 4ALightweight Pieces T 113 andOrganics T 21 02690
Dry Rodded Unit Weight T 19 Start ofBulk Specific Gravity & Absorption T 84 & production and
T 85 when changes in aggregate occurs
A Sublot equals 1000 Mg or 1000 Tons
1/5 Sublots & Start of Production
See Section 4A
1/Sublot & Start of Production
10 % of Required QC
Submit to Central Lab
Page 46
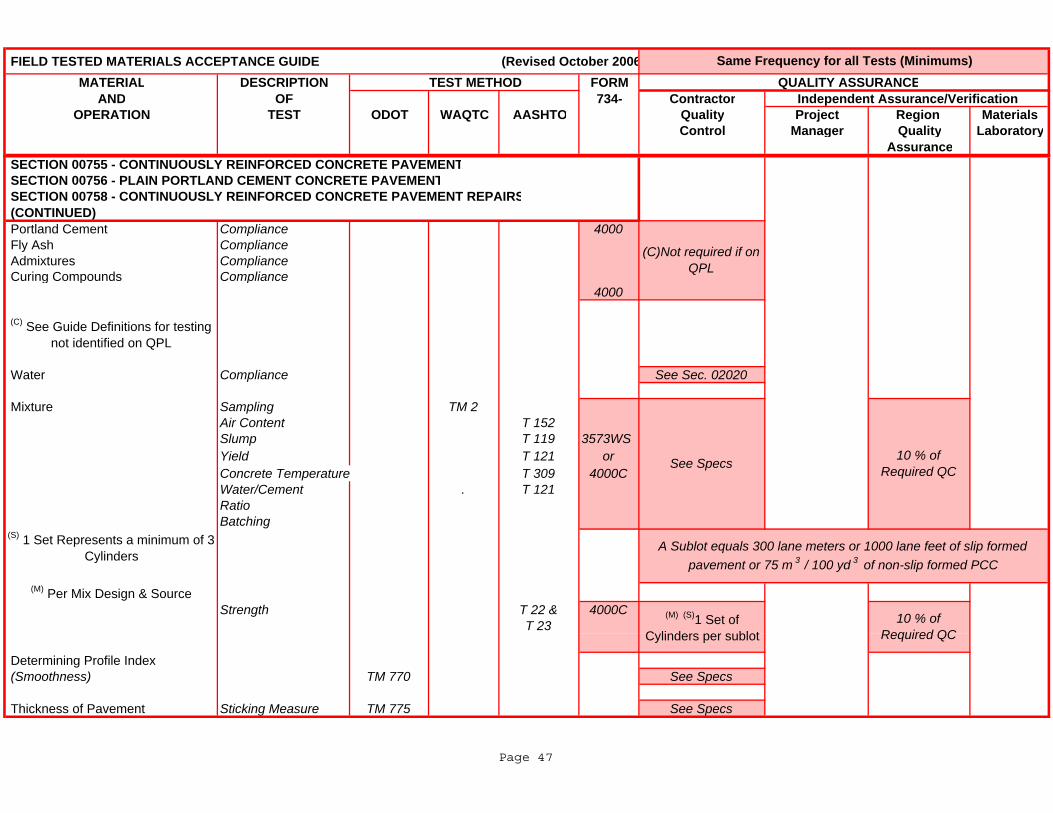
FIELD TESTED MATERIALS ACCEPTANCE GUIDE (Revised October 2006MATERIAL DESCRIPTION TEST METHOD FORM QUALITY ASSURANCE
AND OF 734- Contractor Independent Assurance/VerificationOPERATION TEST ODOT WAQTC AASHTO Quality Project Region Materials
Control Manager Quality LaboratoryAssurance
Same Frequency for all Tests (Minimums)
SECTION 00705 ASPHALT PRIME COAT d EMULSIFIED ASPHALT FOG COAT SECTION 00755 - CONTINUOUSLY REINFORCED CONCRETE PAVEMENT SECTION 00756 - PLAIN PORTLAND CEMENT CONCRETE PAVEMENT SECTION 00758 - CONTINUOUSLY REINFORCED CONCRETE PAVEMENT REPAIRS (CONTINUED) Portland Cement Compliance 4000 Fly Ash Compliance Admixtures Compliance Curing Compounds Compliance 4000
(C) See Guide Definitions for testing not identified on QPL
Water Compliance See Sec. 02020
Mixture Sampling TM 2Air Content T 152 Slump T 119 3573WSYield T 121 orConcrete Temperature T 309 4000CWater/Cement . T 121Ratio Batching
(S) 1 Set Represents a minimum of 3 Cylinders
(M) Per Mix Design & SourceStrength T 22 & 4000C
T 23
Determining Profile Index (Smoothness) TM 770 See Specs
Thickness of Pavement Sticking Measure TM 775 See Specs
(M) (S)1 Set of Cylinders per sublot
10 % of Required QC
See Specs 10 % of Required QC
A Sublot equals 300 lane meters or 1000 lane feet of slip formed pavement or 75 m 3 / 100 yd 3 of non-slip formed PCC
(C)Not required if on QPL
Page 47
ODOT Quality Assurance Program
HOW TO USE THE FIELD TESTED MATERIALS ACCEPTANCE GUIDE
FOR TYPE D OR E PROJECTS ONLY The use of this guide will only be allowed when specifically called out in Section 00165. 10 (a) of the project Special Provisions This guide summarizes the testing requirements for various materials used in the construction of ODOT/ Local Agency projects. It indicates what tests must be performed, who must perform them, and how frequently they must be performed. It includes materials which are sampled and tested in the field and materials which are field sampled but sent elsewhere for testing. When a contract requires Quality Control (QC) by the Contractor, samples that must be sent elsewhere for testing are delivered to the Project Manager along with the Sample Data Sheet (Form 734-4000). Examples of this and other test report forms are in Section 3 of this manual. Materials in this guide are listed in the numerical order of the Standard Specifications and the project special provisions. English and Metric unit designations are not direct conversions, use the appropriate designation identified by the Project contract documents. To find the testing requirements for a particular material, first determine what it will be used for and then refer to the appropriate Specifications Section for that product. For example, to look up testing requirements for aggregate to be used in standard asphalt concrete paving, refer to Section 00745.
Definitions SAMPLE SIZES – Refer to Section 4(C) for guidance on material sample sizes, containers, and labeling. Although designed for the ODOT Central Materials Laboratory (ODOT-CML), it is a good guide for samples being sent to any laboratory. ASPHALT CONCRETE MIX DESIGNS – If the ODOT-CML is preparing the AC mix design, submit samples of the materials shown in Section 4(C) of this manual. QUALIFIED PRODUCTS LIST (QPL) – For some materials, this guide will refer to the QPL. This means that the material must be listed in ODOT’s Qualified Products List. In the QPL, there is a column labeled “List.” If there is an “A” in that column for the particular item you are looking up, no sampling or testing is required-it is approved for use. Simply document, in a Field Inspection Report, your recognition of the product and its existence on the Approved “A” list. If there is a “Q” in that column, the product is qualified and is suitable for a use in a specific category. Job Control testing or additional certification may still be necessary. Consult the ODOT Non-Field Tested Materials Acceptance Guide, the ODOT Field Tested Materials Acceptance Guide or the project specifications for further information.
1
October 2005
ODOT Quality Assurance Program
Materials Not Listed in the (QPL) - Materials that require compliance testing but are not identified in the QPL will need to be submitted to the ODOT Central Lab for testing. Please contact the ODOT central lab receiving area (1-503-986-3057) for information on sample sizes and shipping criteria.
2
October 2005
ODOT Quality Assurance Program
TYPES OF TESTS For TYPE D OR E PROJECTS ONLY
This Section is only to be used on projects were the Special Provisions specifically calls out Contractor Quality Control Type D or E. The following types of tests will be performed by the Contractor or Engineer on materials and products required for contract work: 1. Source Review – This test type is addressed in Section 4(A) of this Manual.
The Engineer will test unprocessed material from an aggregate source, if requested by the Contractor, to provide information about the quality of material. Tests will involve degradation, soundness, and abrasion, but may involve other tests. Favorable test results do not imply that processed material from the source will comply with specifications after it is processed as required for the project.
2. Product Compliance – This test type is addressed in Section 4(A) of this Manual. This section shall be complied with except that under Product Compliance
the contractor may elect to use the ODOT Central Laboratory or a nationally credited private laboratory approved by the Engineer. The material shall not be incorporated into the project unless Product Compliance tests show favorable results.
3. Quality Control – The Contractor will perform quality control testing as described in Section 2 and specified in Section 5 of this Manual or as modified by the
Special Provisions or Supplemental Standard Specifications. 4. Quality Assurance – The Engineer shall review documentation to assure its accuracy and completeness. The Engineer may elect to have additional testing
performed by certified technicians. 5. Production Control Testing – Testing preformed by the contractor or producer at a rate that assures the provided material meets the quality specified. 6. Visual – Visual Inspection: Examination and assessment of construction materials, by OBSERVATION, to determine if the materials appear to meet the
contract requirements and are acceptable for incorporation into construction projects. Visual inspection, when stated in the contract, is a method generally used by the Project Inspector in lieu of normal sampling and testing of field tested materials as defined in section 00165.00 of the Standard Specifications to document quality. Supporting documentation for visual acceptance is, at a minimum, a field inspection report. Consult the construction contract for other acceptance document requirements.
3
October 2005

THIS PAGE INTENTIONALLY LEFT BLANK
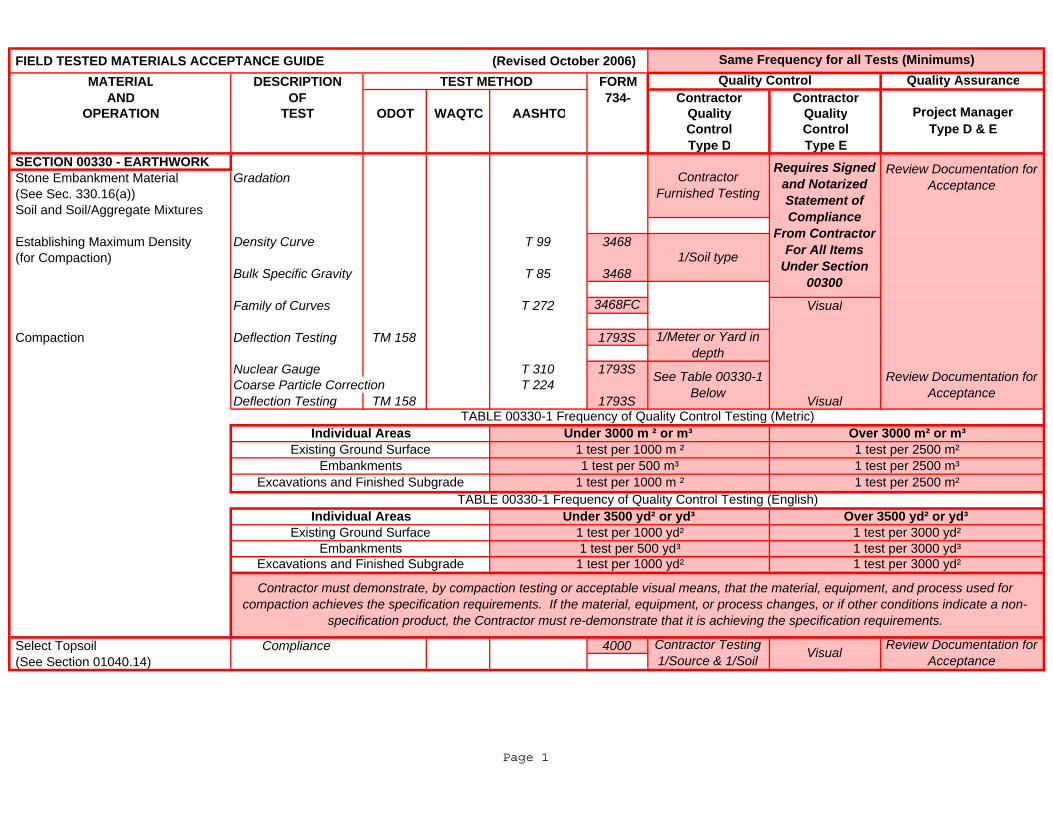
FIELD TESTED MATERIALS ACCEPTANCE GUIDE (Revised October 2006)MATERIAL DESCRIPTION TEST METHOD FORM
AND OF 734- Contractor ContractorOPERATION TEST ODOT WAQTC AASHTO Quality Quality
Control ControlType D Type E
SECTION 00330 - EARTHWORK Stone Embankment Material Gradation (See Sec. 330.16(a)) Soil and Soil/Aggregate Mixtures
Establishing Maximum Density Density Curve T 99 3468 (for Compaction) Bulk Specific Gravity T 85 3468
Family of Curves T 272 3468FC Visual
Compaction Deflection Testing TM 158 1793S
Nuclear Gauge T 310 1793SCoarse Particle Correction T 224Deflection Testing TM 158 1793S Visual
Select Topsoil Compliance 4000 (See Section 01040.14)
Quality Control Quality Assurance
Review Documentation for Acceptance
Review Documentation for Acceptance
Contractor Furnished Testing
Project Manager Type D & E
Requires Signed and Notarized Statement of Compliance
From Contractor For All Items
Under Section 00300
See Table 00330-1 Below
1/Soil type
Contractor Testing 1/Source & 1/Soil
Existing Ground Surface
Excavations and Finished Subgrade1 test per 500 m³
1 test per 1000 m ²
Embankments
Contractor must demonstrate, by compaction testing or acceptable visual means, that the material, equipment, and process used for compaction achieves the specification requirements. If the material, equipment, or process changes, or if other conditions indicate a non-
specification product, the Contractor must re-demonstrate that it is achieving the specification requirements.
Excavations and Finished Subgrade
Visual Review Documentation for Acceptance
1 test per 3000 yd²1 test per 500 yd³ 1 test per 3000 yd³
Embankments
TABLE 00330-1 Frequency of Quality Control Testing (English)
Existing Ground Surface
1 test per 2500 m³
Individual Areas Under 3500 yd² or yd³ Over 3500 yd² or yd³
1 test per 1000 m ²
1 test per 1000 yd²
Under 3000 m ² or m³ 1 test per 2500 m²
1 test per 2500 m²
1 test per 1000 yd² 1 test per 3000 yd²
Same Frequency for all Tests (Minimums)
1/Meter or Yard in depth
Individual AreasTABLE 00330-1 Frequency of Quality Control Testing (Metric)
Over 3000 m² or m³
Page 1
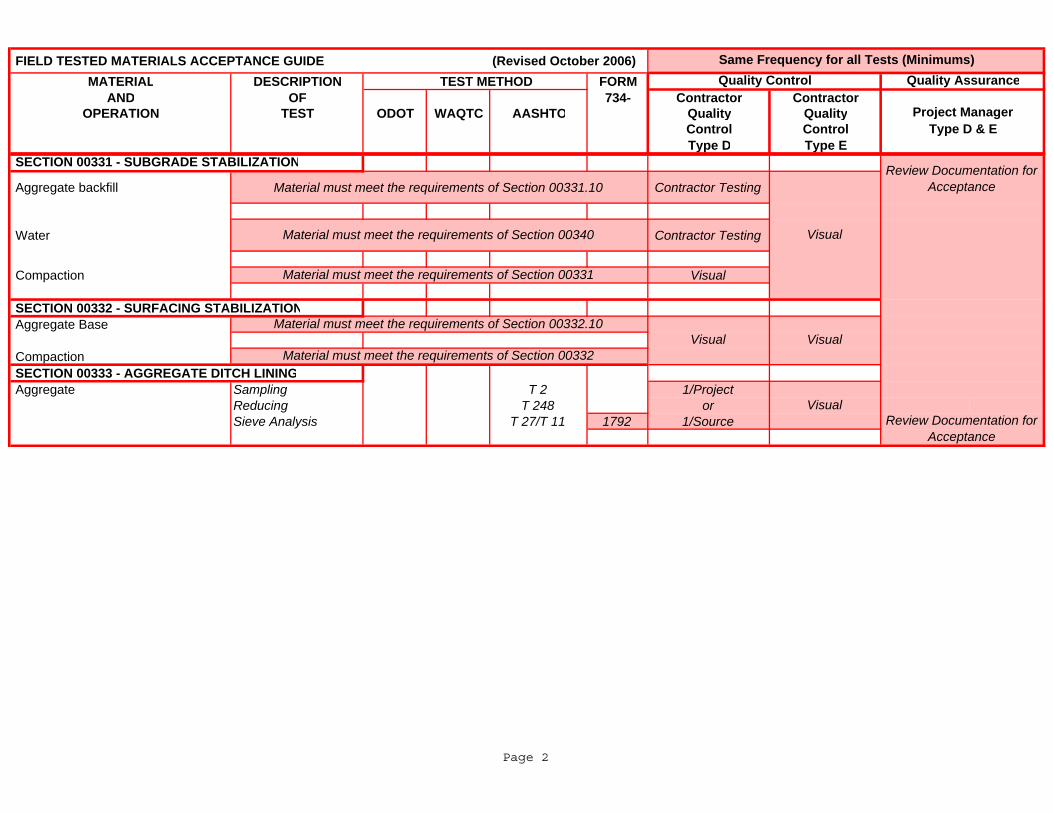
FIELD TESTED MATERIALS ACCEPTANCE GUIDE (Revised October 2006)MATERIAL DESCRIPTION TEST METHOD FORM
AND OF 734- Contractor ContractorOPERATION TEST ODOT WAQTC AASHTO Quality Quality
Control ControlType D Type E
Quality Control Quality Assurance
Project Manager Type D & E
Same Frequency for all Tests (Minimums)
Aggregate backfill Material must meet the requirements of Section 00331.10 Contractor Testing
Water Contractor Testing
Compaction Visual
SECTION 00332 - SURFACING STABILIZATION Aggregate Base
Compaction SECTION 00333 - AGGREGATE DITCH LINING Aggregate Sampling T 2 1/Project
Reducing T 248 orSieve Analysis T 27/T 11 1792 1/Source
Material must meet the requirements of Section 00332
SECTION 00331 - SUBGRADE STABILIZATION
Visual
Review Documentation for Acceptance
Visual
VisualReview Documentation for
Acceptance
Visual
Material must meet the requirements of Section 00331
Material must meet the requirements of Section 00332.10
Material must meet the requirements of Section 00340
Page 2
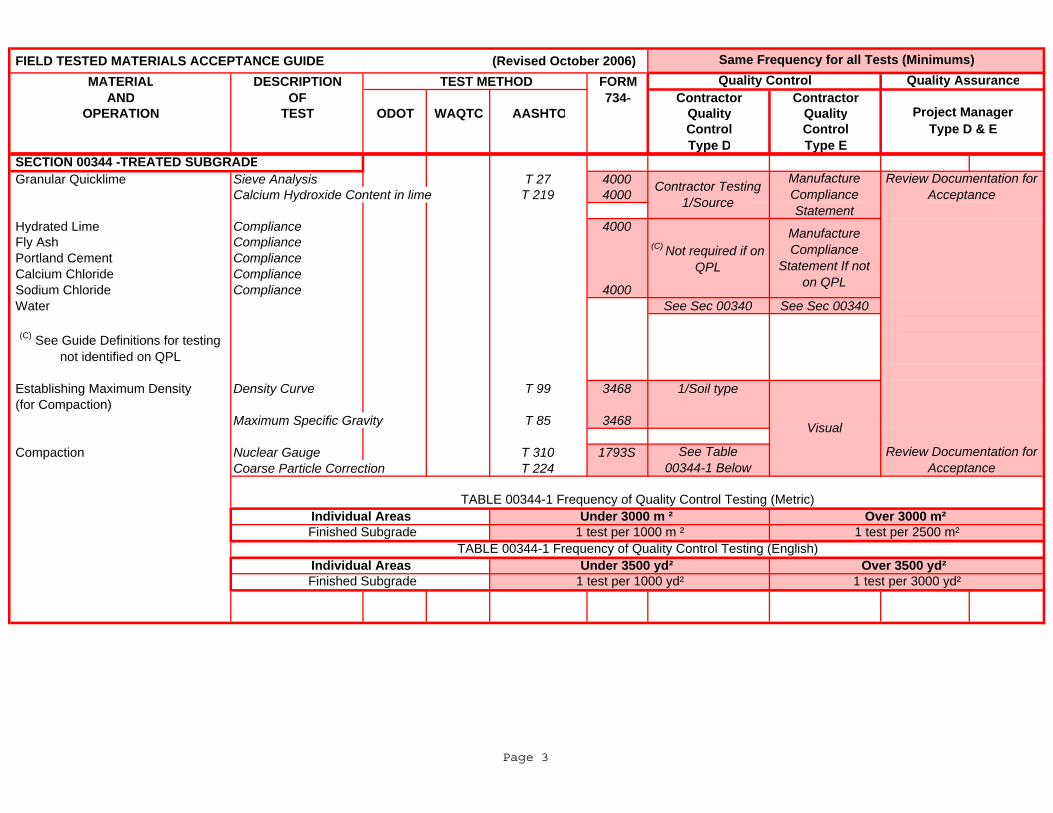
FIELD TESTED MATERIALS ACCEPTANCE GUIDE (Revised October 2006)MATERIAL DESCRIPTION TEST METHOD FORM
AND OF 734- Contractor ContractorOPERATION TEST ODOT WAQTC AASHTO Quality Quality
Control ControlType D Type E
Quality Control Quality Assurance
Project Manager Type D & E
Same Frequency for all Tests (Minimums)
Granular Quicklime Sieve Analysis T 27 4000Calcium Hydroxide Content in lime T 219 4000
Hydrated Lime Compliance 4000 Fly Ash Compliance Portland Cement Compliance Calcium Chloride Compliance Sodium Chloride Compliance 4000 Water See Sec 00340 See Sec 00340
(C) See Guide Definitions for testing not identified on QPL
Establishing Maximum Density Density Curve T 99 3468 1/Soil type (for Compaction)
Maximum Specific Gravity T 85 3468
Compaction Nuclear Gauge T 310 1793SCoarse Particle Correction T 224
Visual
SECTION 00344 -TREATED SUBGRADE
Review Documentation for Acceptance
Contractor Testing 1/Source
Manufacture Compliance Statement
1 test per 3000 yd²
Over 3000 m² 1 test per 2500 m²
Review Documentation for Acceptance
Under 3000 m ² 1 test per 1000 m ²
1 test per 1000 yd²Individual Areas
Finished Subgrade
See Table 00344-1 Below
Under 3500 yd² Over 3500 yd² TABLE 00344-1 Frequency of Quality Control Testing (English)
Finished Subgrade
TABLE 00344-1 Frequency of Quality Control Testing (Metric)Individual Areas
(C) Not required if on QPL
Manufacture Compliance
Statement If not on QPL
Page 3
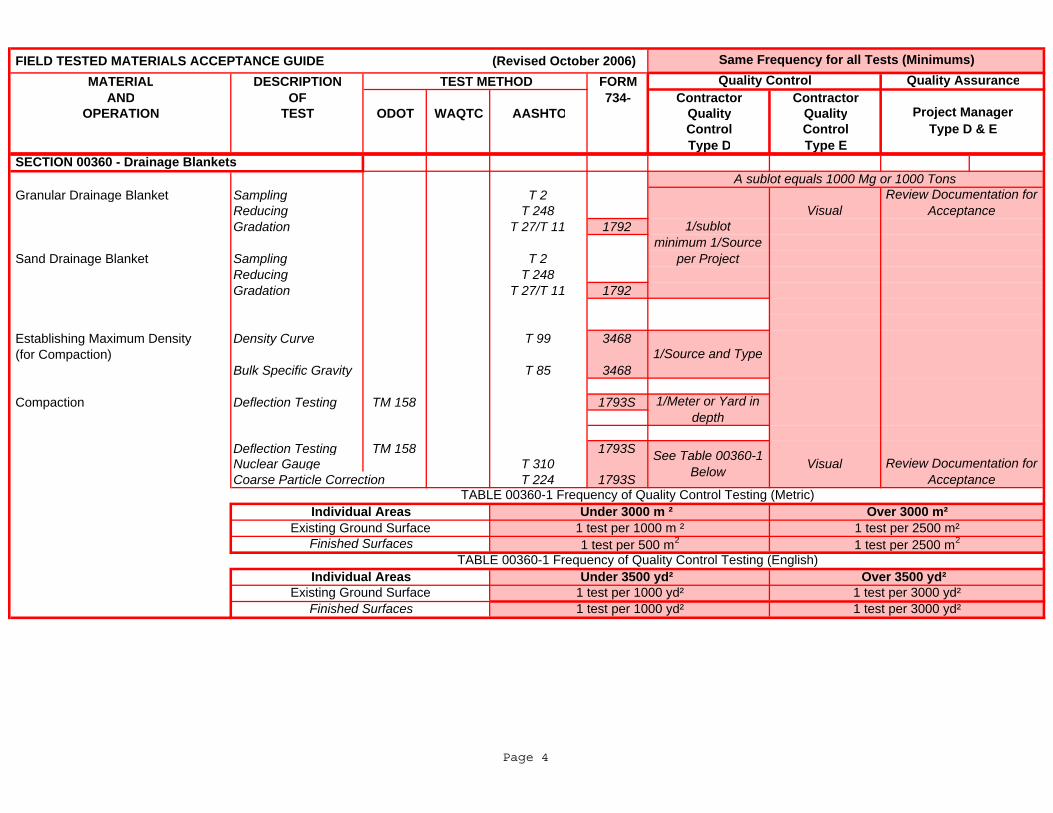
FIELD TESTED MATERIALS ACCEPTANCE GUIDE (Revised October 2006)MATERIAL DESCRIPTION TEST METHOD FORM
AND OF 734- Contractor ContractorOPERATION TEST ODOT WAQTC AASHTO Quality Quality
Control ControlType D Type E
Quality Control Quality Assurance
Project Manager Type D & E
Same Frequency for all Tests (Minimums)
Granular Drainage Blanket Sampling T 2Reducing T 248
Gradation T 27/T 11 1792
Sand Drainage Blanket Sampling T 2Reducing T 248Gradation T 27/T 11 1792
Establishing Maximum Density Density Curve T 99 3468 (for Compaction) Bulk Specific Gravity T 85 3468
Compaction Deflection Testing TM 158 1793S
Deflection Testing TM 158 1793SNuclear Gauge T 310Coarse Particle Correction T 224 1793S
1 test per 2500 m2
1 test per 3000 yd²
Visual
Review Documentation for Acceptance
Review Documentation for Acceptance
TABLE 00360-1 Frequency of Quality Control Testing (Metric)Individual Areas
SECTION 00360 - Drainage BlanketsA sublot equals 1000 Mg or 1000 Tons
Visual
1/Source and Type
1 test per 2500 m²Over 3000 m²
Existing Ground Surface
1/Meter or Yard in depth
Under 3000 m ² 1 test per 1000 m ²
Finished Surfaces 1 test per 500 m2
See Table 00360-1 Below
Existing Ground Surface 1 test per 1000 yd² 1 test per 3000 yd²
1/sublot minimum 1/Source
per Project
Over 3500 yd²
Finished Surfaces 1 test per 1000 yd²
TABLE 00360-1 Frequency of Quality Control Testing (English)Individual Areas Under 3500 yd²
Page 4
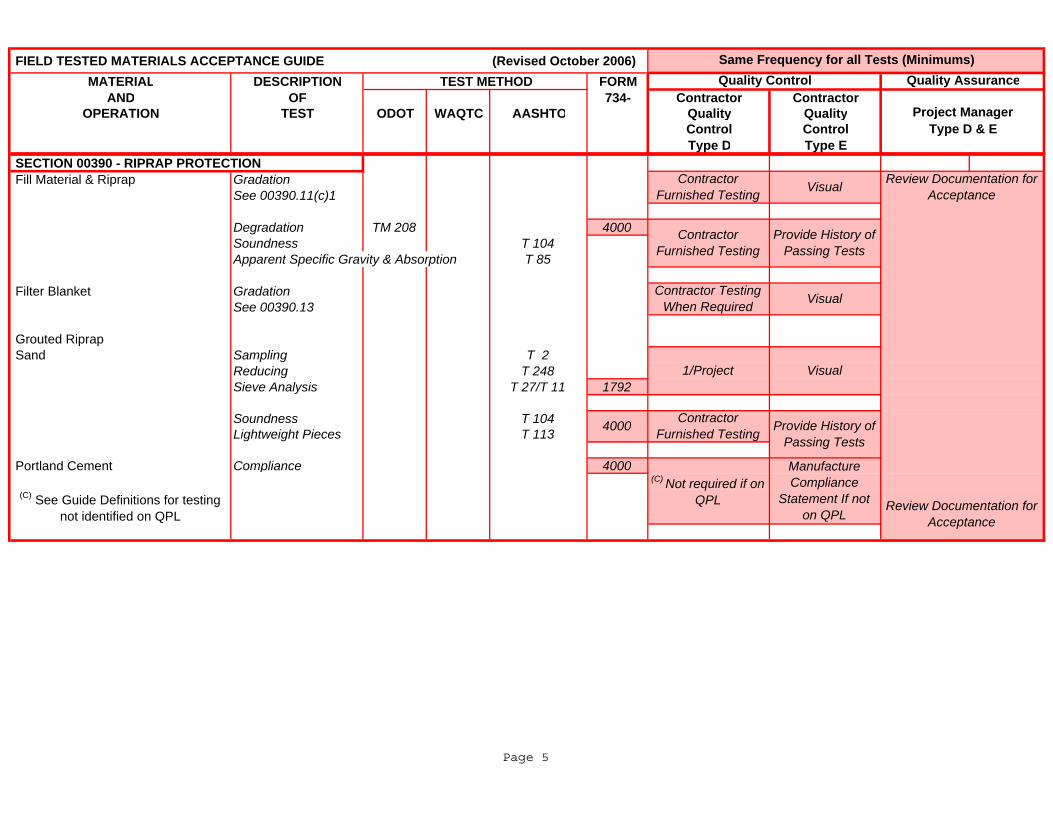
FIELD TESTED MATERIALS ACCEPTANCE GUIDE (Revised October 2006)MATERIAL DESCRIPTION TEST METHOD FORM
AND OF 734- Contractor ContractorOPERATION TEST ODOT WAQTC AASHTO Quality Quality
Control ControlType D Type E
Quality Control Quality Assurance
Project Manager Type D & E
Same Frequency for all Tests (Minimums)
SECTION 00390 - RIPRAP PROTECTION Fill Material & Riprap Gradation
See 00390.11(c)1
Degradation TM 208 4000Soundness T 104Apparent Specific Gravity & Absorption T 85
Filter Blanket Gradation See 00390.13
Grouted Riprap Sand Sampling T 2
Reducing T 248Sieve Analysis T 27/T 11 1792
Soundness T 104Lightweight Pieces T 113
Portland Cement Compliance 4000
(C) See Guide Definitions for testing not identified on QPL
Visual Review Documentation for Acceptance
Provide History of Passing Tests
Visual
Visual
Review Documentation for Acceptance
Manufacture Compliance
Statement If not on QPL
Provide History of Passing Tests
Contractor Furnished Testing
Contractor Testing When Required
(C) Not required if on QPL
1/Project
Contractor Furnished Testing
Contractor Furnished Testing4000
Page 5
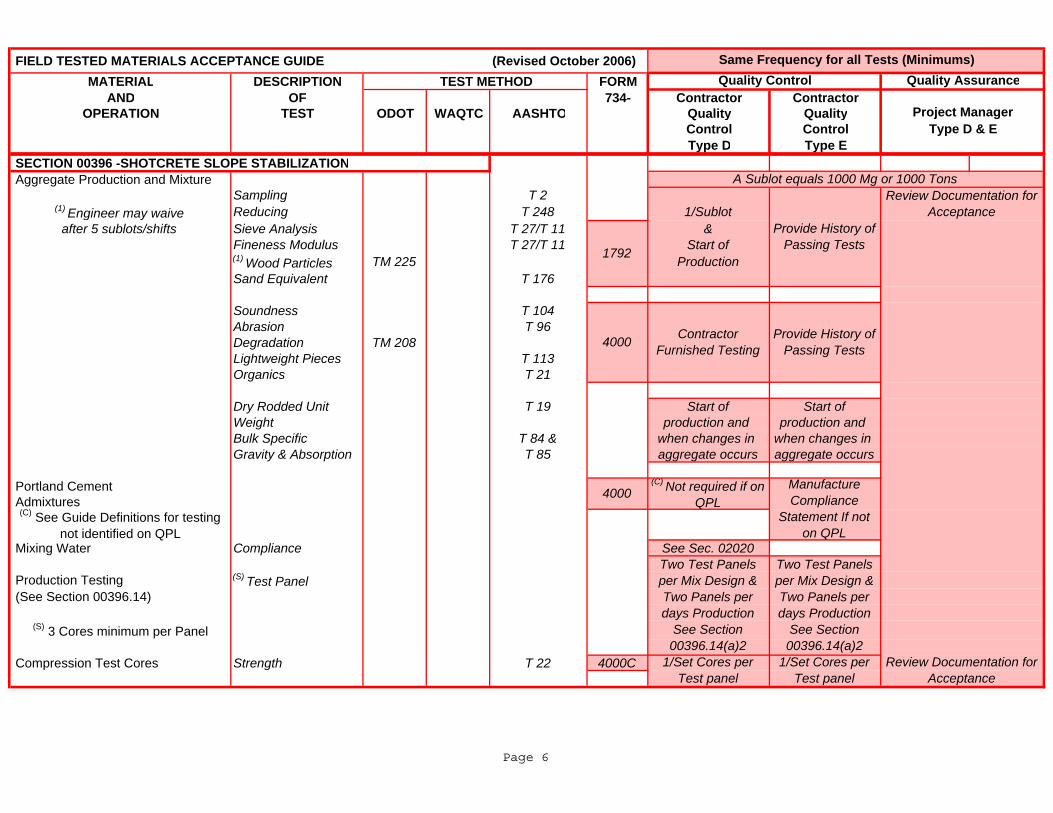
FIELD TESTED MATERIALS ACCEPTANCE GUIDE (Revised October 2006)MATERIAL DESCRIPTION TEST METHOD FORM
AND OF 734- Contractor ContractorOPERATION TEST ODOT WAQTC AASHTO Quality Quality
Control ControlType D Type E
Quality Control Quality Assurance
Project Manager Type D & E
Same Frequency for all Tests (Minimums)
SECTION 00396 -SHOTCRETE SLOPE STABILIZATION Aggregate Production and Mixture
Sampling T 2(1) Engineer may waive Reducing T 248 1/Sublotafter 5 sublots/shifts Sieve Analysis T 27/T 11 &
Fineness Modulus T 27/T 11 Start of(1) Wood Particles TM 225 ProductionSand Equivalent T 176
Soundness T 104Abrasion T 96Degradation TM 208Lightweight Pieces T 113Organics T 21
Dry Rodded Unit T 19 Start of Start ofWeight production and production and Bulk Specific T 84 & when changes in when changes in Gravity & Absorption T 85 aggregate occurs aggregate occurs
Portland Cement Admixtures
Mixing Water Compliance See Sec. 02020 Production Testing (S) Test Panel (See Section 00396.14)
(S) 3 Cores minimum per Panel Compression Test Cores Strength T 22 4000C Review Documentation for
Acceptance
A Sublot equals 1000 Mg or 1000 Tons
Contractor Furnished Testing
Manufacture Compliance
Statement If not on QPL
Two Test Panels per Mix Design & Two Panels per days Production
See Section 00396.14(a)2
1/Set Cores per Test panel
Two Test Panels per Mix Design & Two Panels per days Production
See Section 00396.14(a)2
1/Set Cores per Test panel
Review Documentation for Acceptance
1792
4000
4000(C) Not required if on
QPL(C) See Guide Definitions for testing
not identified on QPL
Provide History of Passing Tests
Provide History of Passing Tests
Page 6
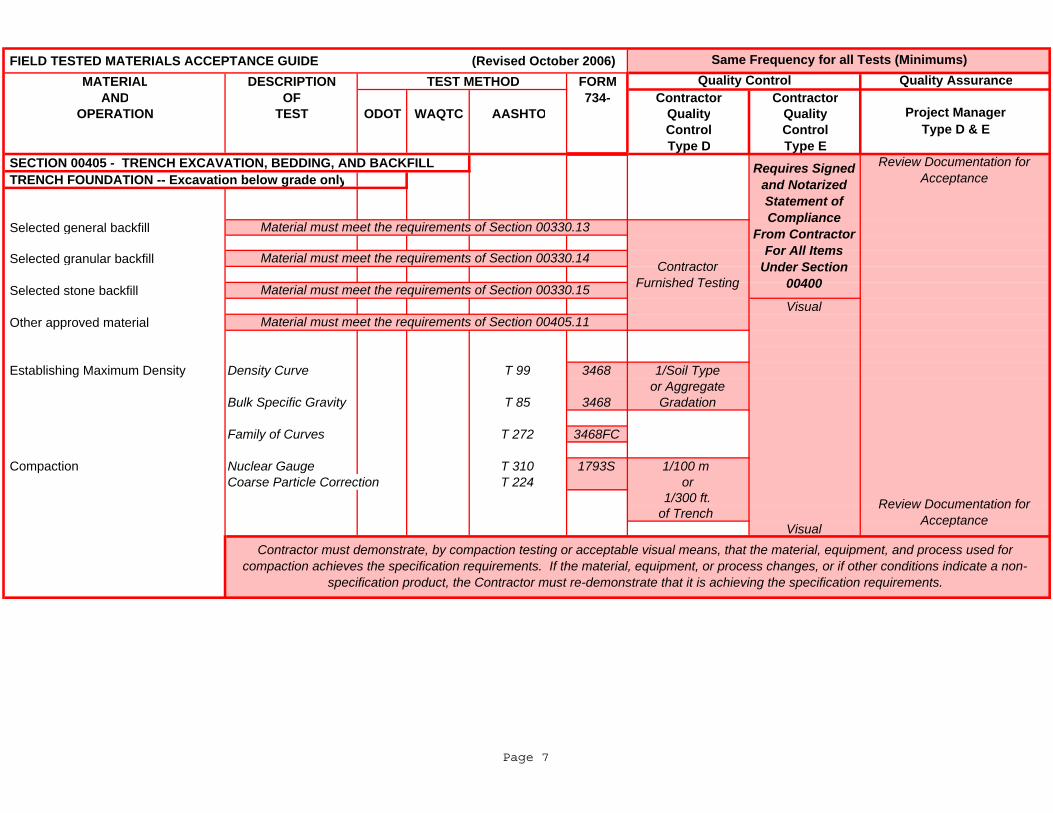
FIELD TESTED MATERIALS ACCEPTANCE GUIDE (Revised October 2006)MATERIAL DESCRIPTION TEST METHOD FORM
AND OF 734- Contractor ContractorOPERATION TEST ODOT WAQTC AASHTO Quality Quality
Control ControlType D Type E
SECTION 00405 - TRENCH EXCAVATION, BEDDING, AND BACKFILL TRENCH FOUNDATION -- Excavation below grade only
Selected general backfill
Selected granular backfill
Selected stone backfill Visual
Other approved material
Establishing Maximum Density Density Curve T 99 3468 1/Soil Type or Aggregate
Bulk Specific Gravity T 85 3468 Gradation
Family of Curves T 272 3468FC
Compaction Nuclear Gauge T 310 1793S 1/100 m Coarse Particle Correction T 224 or
1/300 ft. of Trench
Visual
Material must meet the requirements of Section 00330.13
Material must meet the requirements of Section 00330.14
Material must meet the requirements of Section 00330.15
Material must meet the requirements of Section 00405.11
Same Frequency for all Tests (Minimums)Quality Control Quality Assurance
Project Manager Type D & E
Requires Signed and Notarized Statement of Compliance
From Contractor For All Items
Under Section 00400
Contractor must demonstrate, by compaction testing or acceptable visual means, that the material, equipment, and process used for compaction achieves the specification requirements. If the material, equipment, or process changes, or if other conditions indicate a non-
specification product, the Contractor must re-demonstrate that it is achieving the specification requirements.
Review Documentation for Acceptance
Review Documentation for Acceptance
Contractor Furnished Testing
Page 7
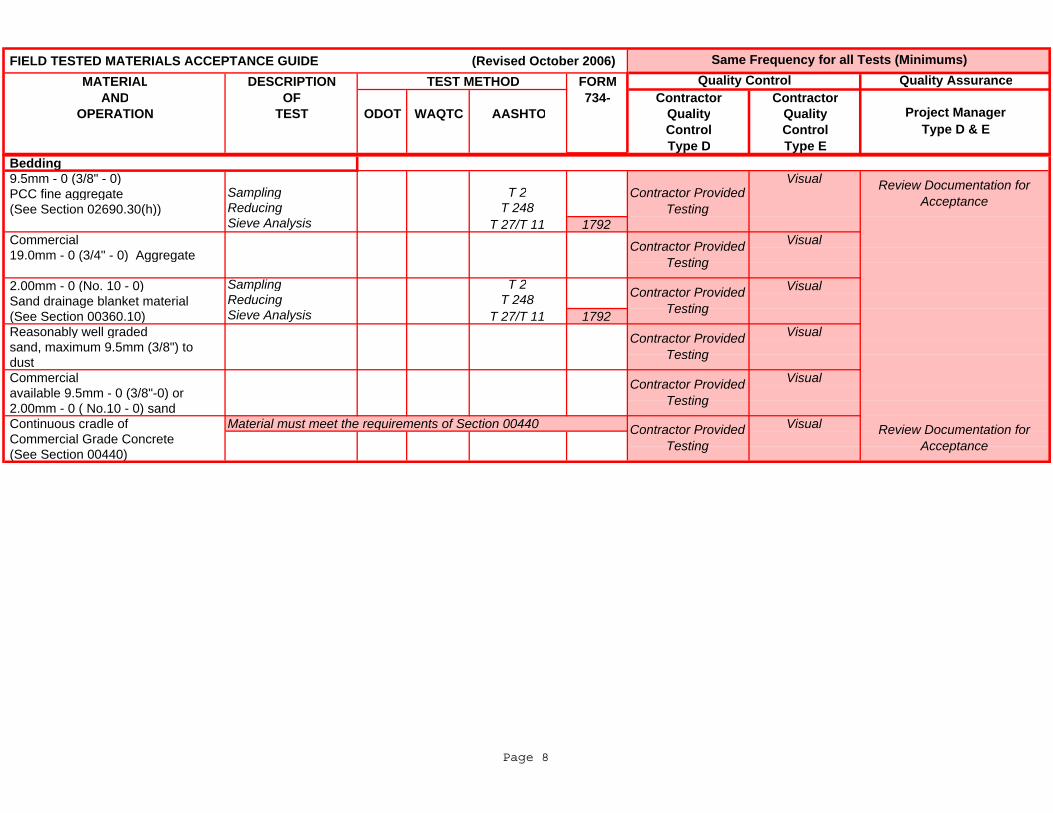
FIELD TESTED MATERIALS ACCEPTANCE GUIDE (Revised October 2006)MATERIAL DESCRIPTION TEST METHOD FORM
AND OF 734- Contractor ContractorOPERATION TEST ODOT WAQTC AASHTO Quality Quality
Control ControlType D Type E
Same Frequency for all Tests (Minimums)Quality Control Quality Assurance
Project Manager Type D & E
Bedding 9.5mm - 0 (3/8" - 0) Visual PCC fine aggregate Sampling T 2 (See Section 02690.30(h)) Reducing T 248
Sieve Analysis T 27/T 11 1792 Commercial Visual 19.0mm - 0 (3/4" - 0) Aggregate
2.00mm - 0 (No. 10 - 0) Sampling T 2 Visual Sand drainage blanket material Reducing T 248 (See Section 00360.10) Sieve Analysis T 27/T 11 1792 Reasonably well graded Visual sand, maximum 9.5mm (3/8") to dust Commercial Visual available 9.5mm - 0 (3/8"-0) or 2.00mm - 0 ( No.10 - 0) sand Continuous cradle of Material must meet the requirements of Section 00440 Visual Commercial Grade Concrete (See Section 00440)
Contractor Provided Testing
Contractor Provided Testing
Contractor Provided Testing
Review Documentation for Acceptance
Review Documentation for Acceptance
Contractor Provided Testing
Contractor Provided Testing
Contractor Provided Testing
Page 8
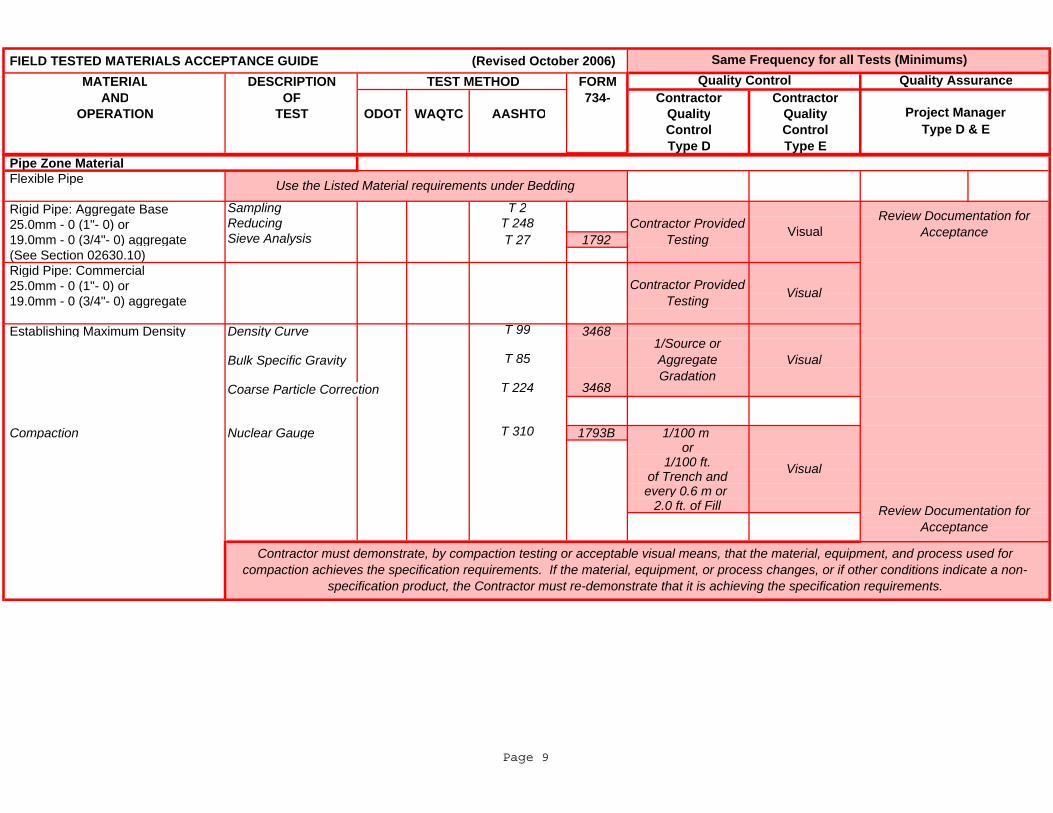
FIELD TESTED MATERIALS ACCEPTANCE GUIDE (Revised October 2006)MATERIAL DESCRIPTION TEST METHOD FORM
AND OF 734- Contractor ContractorOPERATION TEST ODOT WAQTC AASHTO Quality Quality
Control ControlType D Type E
Same Frequency for all Tests (Minimums)Quality Control Quality Assurance
Project Manager Type D & E
Pipe Zone Material Flexible Pipe
Rigid Pipe: Aggregate Base Sampling T 2 25.0mm - 0 (1"- 0) or Reducing T 248 19.0mm - 0 (3/4"- 0) aggregate Sieve Analysis T 27 1792 (See Section 02630.10) Rigid Pipe: Commercial 25.0mm - 0 (1"- 0) or 19.0mm - 0 (3/4"- 0) aggregate Establishing Maximum Density Density Curve T 99 3468
Bulk Specific Gravity T 85 Coarse Particle Correction T 224 3468
Compaction Nuclear Gauge T 310 1793B 1/100 m or 1/100 ft.
of Trench and every 0.6 m or 2.0 ft. of Fill
Visual
Contractor Provided Testing
Contractor Provided Testing
Contractor must demonstrate, by compaction testing or acceptable visual means, that the material, equipment, and process used for compaction achieves the specification requirements. If the material, equipment, or process changes, or if other conditions indicate a non-
specification product, the Contractor must re-demonstrate that it is achieving the specification requirements.
Use the Listed Material requirements under Bedding
Review Documentation for Acceptance
Review Documentation for Acceptance
Visual
Visual
Visual
1/Source or Aggregate Gradation
Page 9
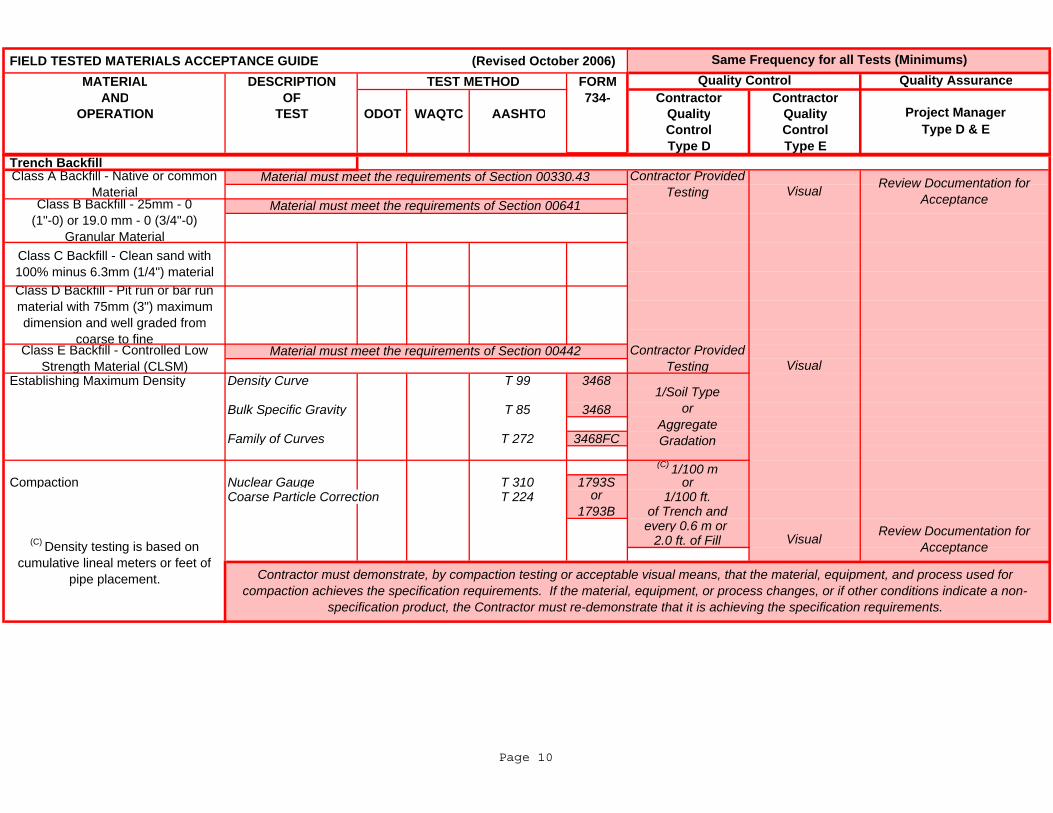
FIELD TESTED MATERIALS ACCEPTANCE GUIDE (Revised October 2006)MATERIAL DESCRIPTION TEST METHOD FORM
AND OF 734- Contractor ContractorOPERATION TEST ODOT WAQTC AASHTO Quality Quality
Control ControlType D Type E
Same Frequency for all Tests (Minimums)Quality Control Quality Assurance
Project Manager Type D & E
Trench Backfill
Establishing Maximum Density Density Curve T 99 3468
Bulk Specific Gravity T 85 3468
Family of Curves T 272 3468FC
(C) 1/100 m Compaction Nuclear Gauge T 310 1793S or
Coarse Particle Correction T 224 or 1/100 ft.1793B of Trench and
every 0.6 m or 2.0 ft. of Fill
Contractor must demonstrate, by compaction testing or acceptable visual means, that the material, equipment, and process used for compaction achieves the specification requirements. If the material, equipment, or process changes, or if other conditions indicate a non-
specification product, the Contractor must re-demonstrate that it is achieving the specification requirements.
1/Soil Type or
Aggregate Gradation
Class B Backfill - 25mm - 0 (1"-0) or 19.0 mm - 0 (3/4"-0)
Granular Material
Class D Backfill - Pit run or bar run material with 75mm (3") maximum dimension and well graded from
coarse to fine
Class C Backfill - Clean sand with 100% minus 6.3mm (1/4") material
Material must meet the requirements of Section 00330.43
Material must meet the requirements of Section 00442Class E Backfill - Controlled Low Strength Material (CLSM)
Class A Backfill - Native or common Material
Material must meet the requirements of Section 00641
(C) Density testing is based on cumulative lineal meters or feet of
pipe placement.
Review Documentation for Acceptance
Contractor Provided Testing
Contractor Provided Testing
Visual
Visual
Review Documentation for AcceptanceVisual
Page 10
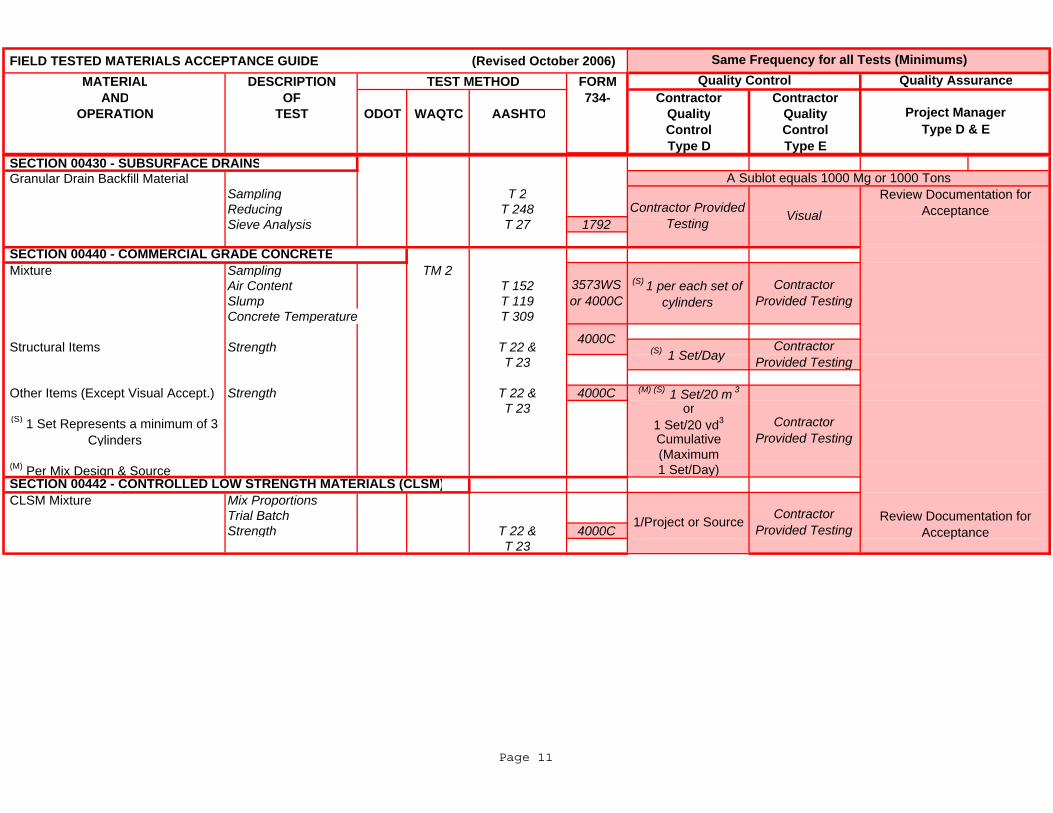
FIELD TESTED MATERIALS ACCEPTANCE GUIDE (Revised October 2006)MATERIAL DESCRIPTION TEST METHOD FORM
AND OF 734- Contractor ContractorOPERATION TEST ODOT WAQTC AASHTO Quality Quality
Control ControlType D Type E
Same Frequency for all Tests (Minimums)Quality Control Quality Assurance
Project Manager Type D & E
SECTION 00430 - SUBSURFACE DRAINS Granular Drain Backfill Material
Sampling T 2Reducing T 248Sieve Analysis T 27 1792
Mixture Sampling TM 2Air Content T 152Slump T 119Concrete Temperature T 309
Structural Items Strength T 22 &T 23
Other Items (Except Visual Accept.) Strength T 22 & 4000C (M) (S) 1 Set/20 m 3
T 23 or1 Set/20 yd3
Cumulative(Maximum
(M) Per Mix Design & Source 1 Set/Day)
CLSM Mixture Mix ProportionsTrial Batch Strength T 22 & 4000C
T 23
(S) 1 per each set of cylinders
SECTION 00440 - COMMERCIAL GRADE CONCRETE
Review Documentation for Acceptance
Review Documentation for Acceptance
Contractor Provided Testing
Contractor Provided Testing
Contractor Provided Testing
Contractor Provided Testing
(S) 1 Set Represents a minimum of 3 Cylinders
3573WS or 4000C
SECTION 00442 - CONTROLLED LOW STRENGTH MATERIALS (CLSM)
4000C
1/Project or Source
(S) 1 Set/Day
Contractor Provided Testing
A Sublot equals 1000 Mg or 1000 Tons
Visual
Page 11
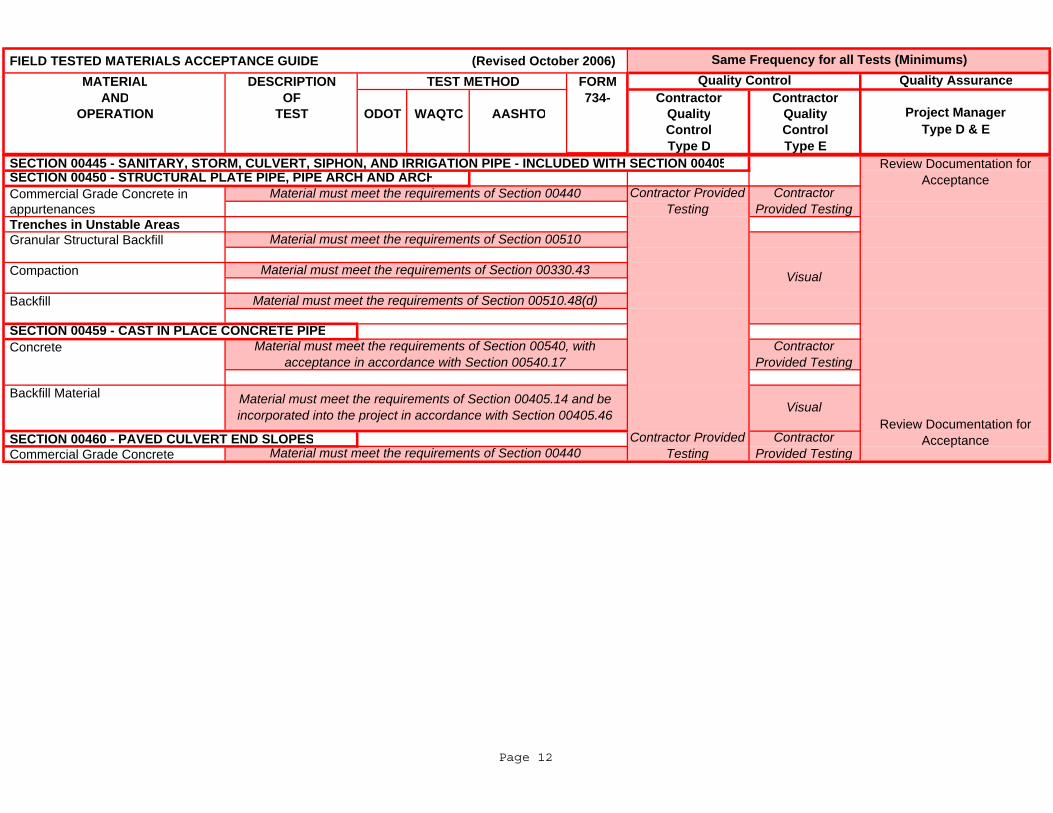
FIELD TESTED MATERIALS ACCEPTANCE GUIDE (Revised October 2006)MATERIAL DESCRIPTION TEST METHOD FORM
AND OF 734- Contractor ContractorOPERATION TEST ODOT WAQTC AASHTO Quality Quality
Control ControlType D Type E
Same Frequency for all Tests (Minimums)Quality Control Quality Assurance
Project Manager Type D & E
SECTION 00445 - SANITARY, STORM, CULVERT, SIPHON, AND IRRIGATION PIPE - INCLUDED WITH SECTION 00405
Commercial Grade Concrete in appurtenances Trenches in Unstable Areas Granular Structural Backfill
Compaction
Backfill
Concrete
Backfill Material
SECTION 00460 - PAVED CULVERT END SLOPES Commercial Grade Concrete
Contractor Provided Testing
Visual
Material must meet the requirements of Section 00440
SECTION 00450 - STRUCTURAL PLATE PIPE, PIPE ARCH AND ARCHMaterial must meet the requirements of Section 00440
Material must meet the requirements of Section 00510
Material must meet the requirements of Section 00330.43
Material must meet the requirements of Section 00405.14 and be incorporated into the project in accordance with Section 00405.46
Material must meet the requirements of Section 00510.48(d)
Contractor Provided Testing
Material must meet the requirements of Section 00540, with acceptance in accordance with Section 00540.17
SECTION 00459 - CAST IN PLACE CONCRETE PIPE
Contractor Provided Testing
Contractor Provided Testing
Visual
Contractor Provided Testing
Review Documentation for Acceptance
Review Documentation for Acceptance
Page 12
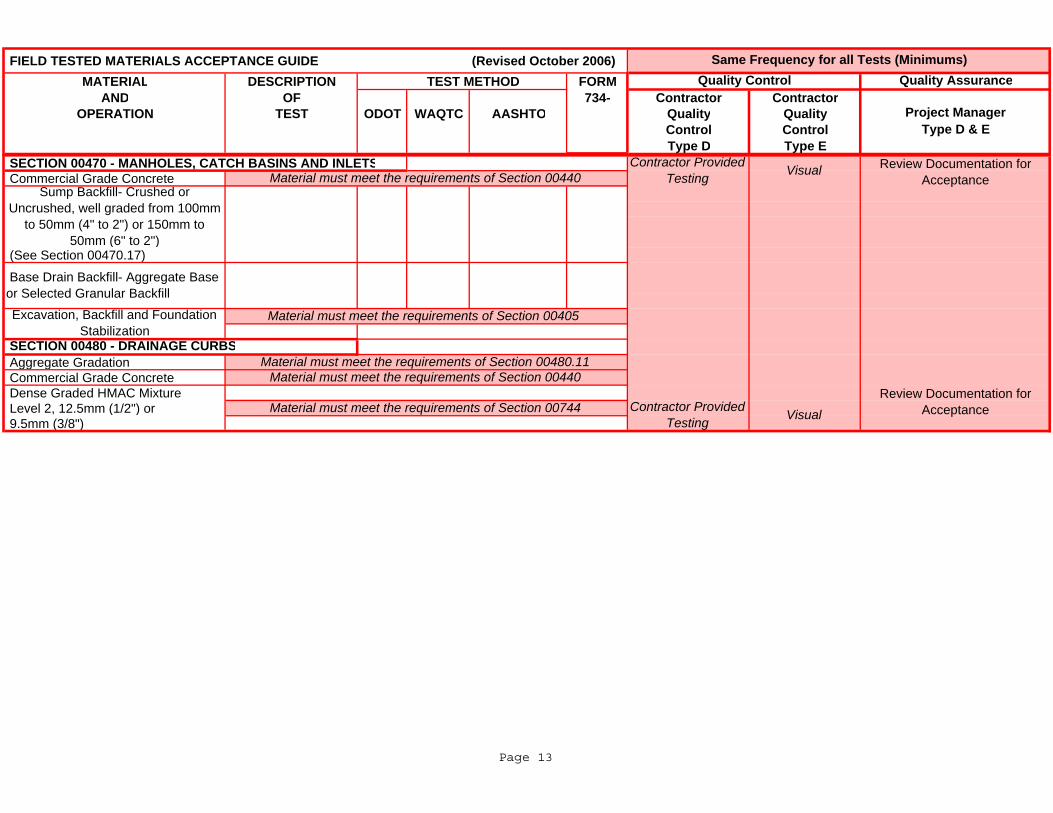
FIELD TESTED MATERIALS ACCEPTANCE GUIDE (Revised October 2006)MATERIAL DESCRIPTION TEST METHOD FORM
AND OF 734- Contractor ContractorOPERATION TEST ODOT WAQTC AASHTO Quality Quality
Control ControlType D Type E
Same Frequency for all Tests (Minimums)Quality Control Quality Assurance
Project Manager Type D & E
SECTION 00470 - MANHOLES, CATCH BASINS AND INLETS Commercial Grade Concrete
(See Section 00470.17)
Aggregate Gradation Commercial Grade Concrete Dense Graded HMAC Mixture Level 2, 12.5mm (1/2") or 9.5mm (3/8")
Material must meet the requirements of Section 00744
Material must meet the requirements of Section 00440
Material must meet the requirements of Section 00405
Material must meet the requirements of Section 00440Material must meet the requirements of Section 00480.11
SECTION 00480 - DRAINAGE CURBS
Excavation, Backfill and Foundation Stabilization
Base Drain Backfill- Aggregate Base or Selected Granular Backfill
Sump Backfill- Crushed or Uncrushed, well graded from 100mm
to 50mm (4" to 2") or 150mm to 50mm (6" to 2")
Contractor Provided Testing
Contractor Provided Testing
Review Documentation for Acceptance
Review Documentation for Acceptance
Visual
Visual
Page 13
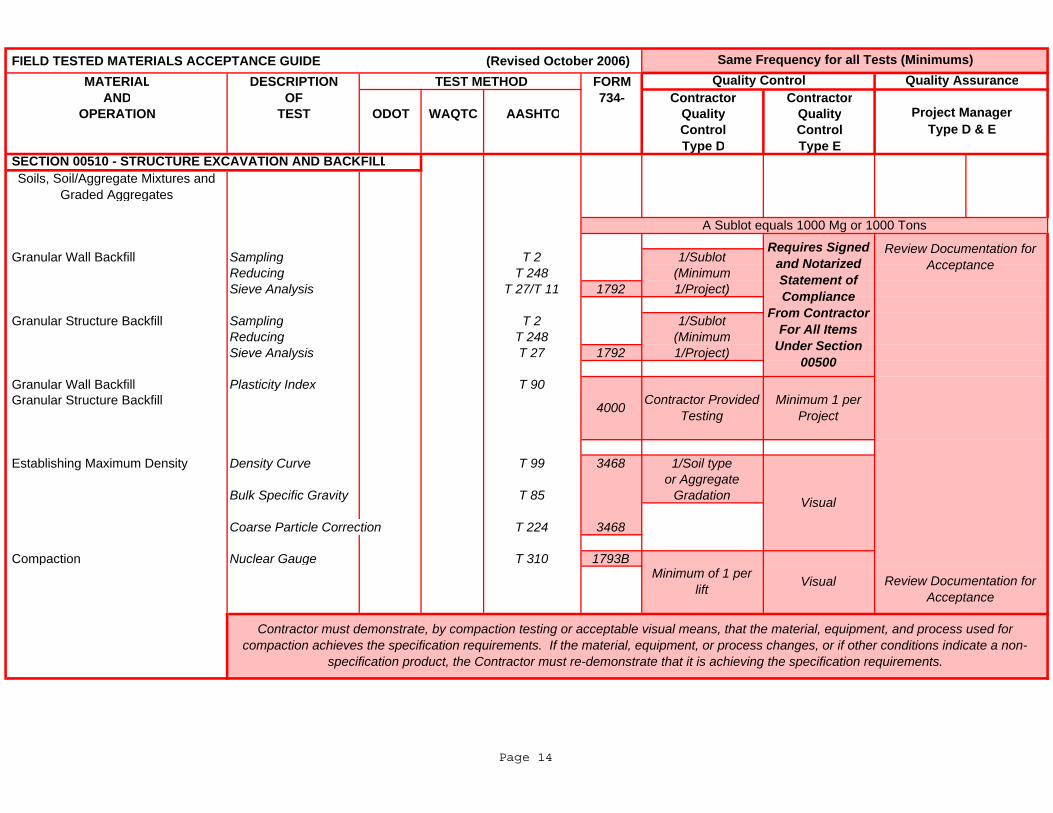
FIELD TESTED MATERIALS ACCEPTANCE GUIDE (Revised October 2006)MATERIAL DESCRIPTION TEST METHOD FORM
AND OF 734- Contractor ContractorOPERATION TEST ODOT WAQTC AASHTO Quality Quality
Control ControlType D Type E
Soils, Soil/Aggregate Mixtures and Graded Aggregates
Granular Wall Backfill Sampling T 2 1/SublotReducing T 248 (Minimum
Sieve Analysis T 27/T 11 1792 1/Project)
Granular Structure Backfill Sampling T 2 1/SublotReducing T 248 (MinimumSieve Analysis T 27 1792 1/Project)
Granular Wall Backfill Plasticity Index T 90 Granular Structure Backfill
Establishing Maximum Density Density Curve T 99 3468 1/Soil type or Aggregate
Bulk Specific Gravity T 85 Gradation
Coarse Particle Correction T 224 3468
Compaction Nuclear Gauge T 310 1793B
Same Frequency for all Tests (Minimums)
Contractor must demonstrate, by compaction testing or acceptable visual means, that the material, equipment, and process used for compaction achieves the specification requirements. If the material, equipment, or process changes, or if other conditions indicate a non-
specification product, the Contractor must re-demonstrate that it is achieving the specification requirements.
Quality Control
SECTION 00510 - STRUCTURE EXCAVATION AND BACKFILL
4000
Quality Assurance
Project Manager Type D & E
Requires Signed and Notarized Statement of Compliance
From Contractor For All Items
Under Section 00500
A Sublot equals 1000 Mg or 1000 Tons
Review Documentation for Acceptance
Review Documentation for Acceptance
Visual
Visual
Minimum 1 per Project
Contractor Provided Testing
Minimum of 1 per lift
Page 14
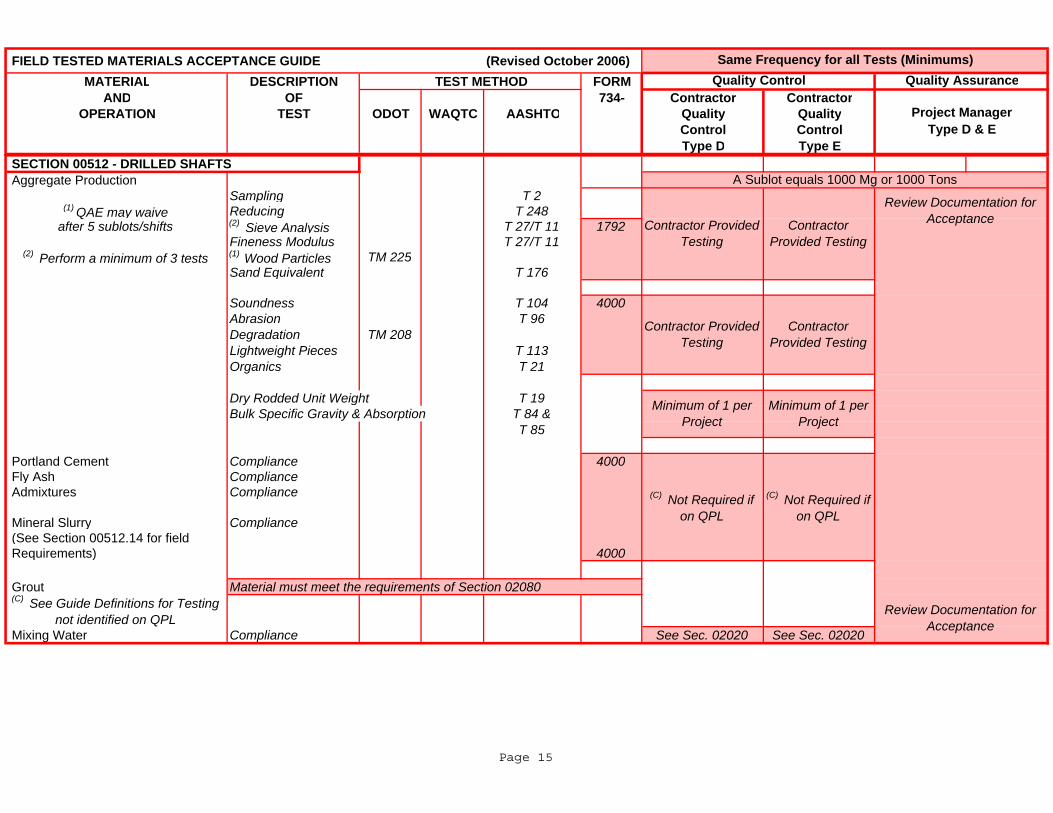
FIELD TESTED MATERIALS ACCEPTANCE GUIDE (Revised October 2006)MATERIAL DESCRIPTION TEST METHOD FORM
AND OF 734- Contractor ContractorOPERATION TEST ODOT WAQTC AASHTO Quality Quality
Control ControlType D Type E
Same Frequency for all Tests (Minimums)Quality Control
SECTION 00510 STRUCTURE EXCAVATION AND BACKFILL
Quality Assurance
Project Manager Type D & E
SECTION 00512 - DRILLED SHAFTS Aggregate Production
Sampling T 2(1) QAE may waive Reducing T 248
after 5 sublots/shifts (2) Sieve Analysis T 27/T 11 1792Fineness Modulus T 27/T 11
(2) Perform a minimum of 3 tests (1) Wood Particles TM 225Sand Equivalent T 176
Soundness T 104 4000Abrasion T 96Degradation TM 208Lightweight Pieces T 113Organics T 21
Dry Rodded Unit Weight T 19Bulk Specific Gravity & Absorption T 84 &
T 85
Portland Cement Compliance 4000 Fly Ash Compliance Admixtures Compliance
Mineral Slurry Compliance (See Section 00512.14 for field Requirements) 4000
Grout Material must meet the requirements of Section 02080
Mixing Water Compliance See Sec. 02020 See Sec. 02020
A Sublot equals 1000 Mg or 1000 Tons
(C) See Guide Definitions for Testing not identified on QPL
Review Documentation for Acceptance
Contractor Provided Testing
Contractor Provided Testing
Contractor Provided Testing
Contractor Provided Testing
Minimum of 1 per Project
Minimum of 1 per Project
(C) Not Required if on QPL
(C) Not Required if on QPL
Review Documentation for Acceptance
Page 15
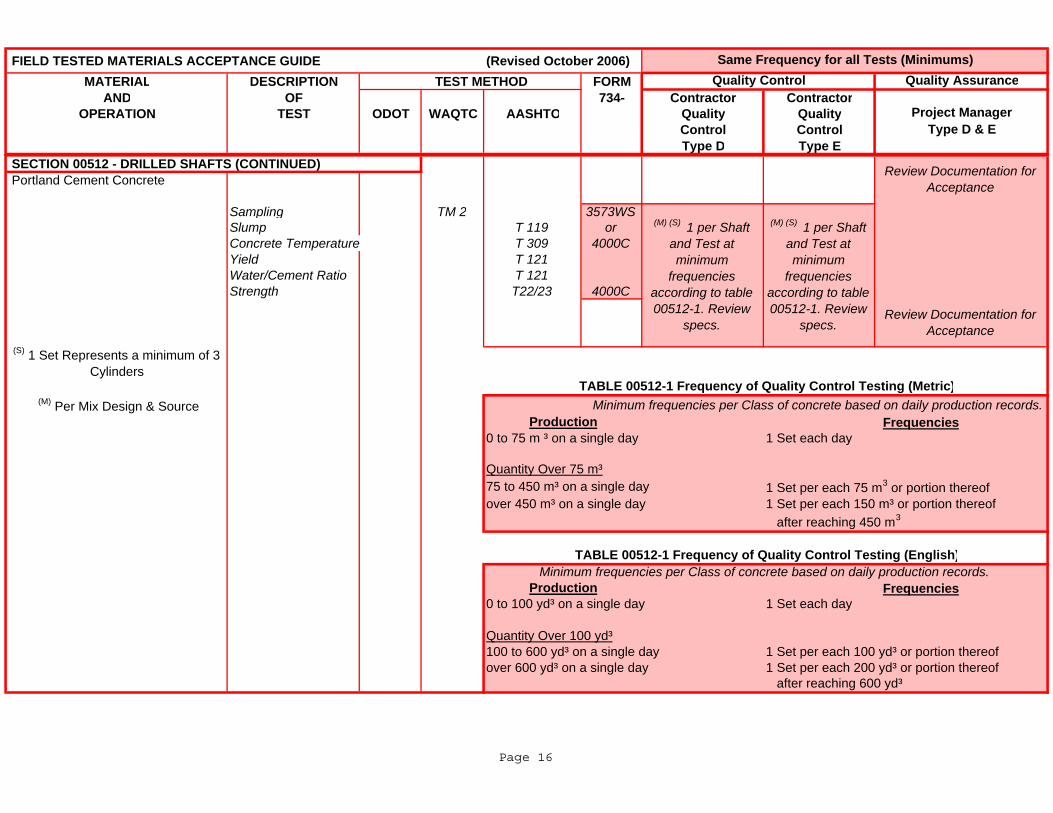
FIELD TESTED MATERIALS ACCEPTANCE GUIDE (Revised October 2006)MATERIAL DESCRIPTION TEST METHOD FORM
AND OF 734- Contractor ContractorOPERATION TEST ODOT WAQTC AASHTO Quality Quality
Control ControlType D Type E
Same Frequency for all Tests (Minimums)Quality Control
SECTION 00510 STRUCTURE EXCAVATION AND BACKFILL
Quality Assurance
Project Manager Type D & E
SECTION 00512 - DRILLED SHAFTS (CONTINUED) Portland Cement Concrete
Sampling TM 2 3573WSSlump T 119 orConcrete Temperature T 309 4000CYield T 121Water/Cement Ratio T 121Strength T22/23 4000C
(M) Per Mix Design & Source Minimum frequencies per Class of concrete based on daily production records.Frequencies
0 to 75 m ³ on a single day 1 Set each day
Frequencies
after reaching 450 m3
TABLE 00512-1 Frequency of Quality Control Testing (English)
TABLE 00512-1 Frequency of Quality Control Testing (Metric)
(M) (S) 1 per Shaft and Test at minimum
frequencies according to table 00512-1. Review
specs.
Production
over 450 m³ on a single day 1 Set per each 150 m³ or portion thereof75 to 450 m³ on a single dayQuantity Over 75 m³
Review Documentation for Acceptance
Quantity Over 100 yd³100 to 600 yd³ on a single day 1 Set per each 100 yd³ or portion thereof
1 Set per each 200 yd³ or portion thereof
(S) 1 Set Represents a minimum of 3 Cylinders
Review Documentation for Acceptance
after reaching 600 yd³
ProductionMinimum frequencies per Class of concrete based on daily production records.
1 Set per each 75 m3 or portion thereof
over 600 yd³ on a single day
0 to 100 yd³ on a single day 1 Set each day
(M) (S) 1 per Shaft and Test at minimum
frequencies according to table 00512-1. Review
specs.
Page 16
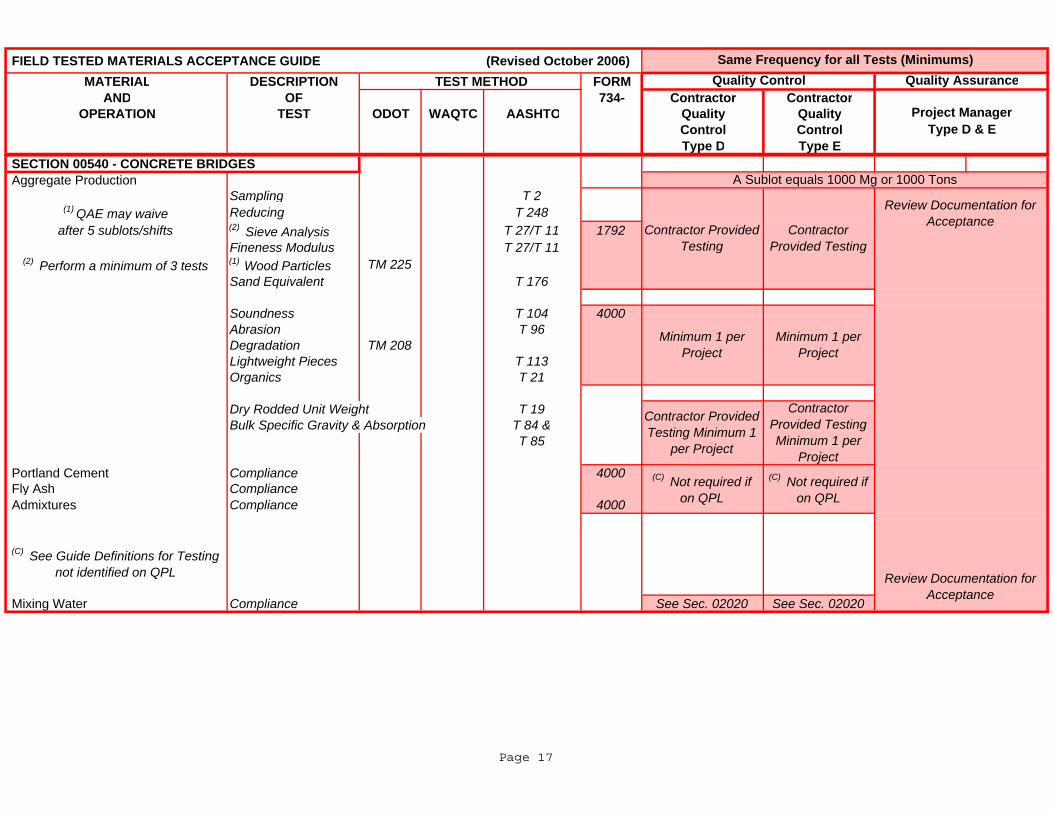
FIELD TESTED MATERIALS ACCEPTANCE GUIDE (Revised October 2006)MATERIAL DESCRIPTION TEST METHOD FORM
AND OF 734- Contractor ContractorOPERATION TEST ODOT WAQTC AASHTO Quality Quality
Control ControlType D Type E
Same Frequency for all Tests (Minimums)Quality Control
SECTION 00510 STRUCTURE EXCAVATION AND BACKFILL
Quality Assurance
Project Manager Type D & E
SECTION 00540 - CONCRETE BRIDGES Aggregate Production
Sampling T 2(1) QAE may waive Reducing T 248
after 5 sublots/shifts (2) Sieve Analysis T 27/T 11 1792Fineness Modulus T 27/T 11
(2) Perform a minimum of 3 tests (1) Wood Particles TM 225Sand Equivalent T 176
Soundness T 104 4000Abrasion T 96Degradation TM 208Lightweight Pieces T 113Organics T 21
Dry Rodded Unit Weight T 19Bulk Specific Gravity & Absorption T 84 &
T 85
Portland Cement Compliance 4000 Fly Ash Compliance Admixtures Compliance 4000
Mixing Water Compliance See Sec. 02020 See Sec. 02020
A Sublot equals 1000 Mg or 1000 Tons
Contractor Provided Testing
(C) See Guide Definitions for Testing not identified on QPL
(C) Not required if on QPL
Contractor Provided Testing Minimum 1
per Project
Contractor Provided Testing Minimum 1 per
Project(C) Not required if
on QPL
Contractor Provided Testing
Minimum 1 per Project
Minimum 1 per Project
Review Documentation for Acceptance
Review Documentation for Acceptance
Page 17
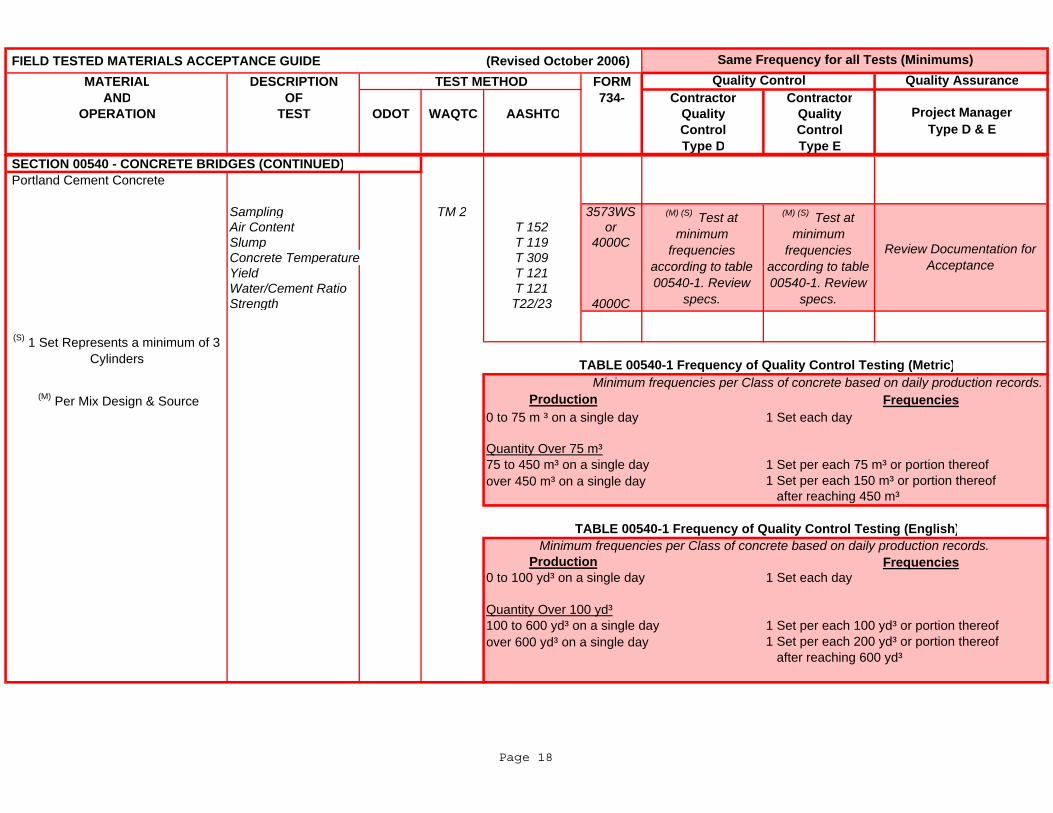
FIELD TESTED MATERIALS ACCEPTANCE GUIDE (Revised October 2006)MATERIAL DESCRIPTION TEST METHOD FORM
AND OF 734- Contractor ContractorOPERATION TEST ODOT WAQTC AASHTO Quality Quality
Control ControlType D Type E
Same Frequency for all Tests (Minimums)Quality Control
SECTION 00510 STRUCTURE EXCAVATION AND BACKFILL
Quality Assurance
Project Manager Type D & E
SECTION 00540 - CONCRETE BRIDGES (CONTINUED) Portland Cement Concrete
Sampling TM 2 3573WSAir Content T 152 orSlump T 119 4000CConcrete Temperature T 309Yield T 121Water/Cement Ratio T 121Strength T22/23 4000C
Minimum frequencies per Class of concrete based on daily production records. (M) Per Mix Design & Source Frequencies
0 to 75 m ³ on a single day 1 Set each day
over 450 m³ on a single day
Frequencies
over 600 yd³ on a single day
1 Set per each 75 m³ or portion thereof
after reaching 600 yd³
100 to 600 yd³ on a single day1 Set per each 200 yd³ or portion thereof
Quantity Over 75 m³
Review Documentation for Acceptance
(M) (S) Test at minimum
frequencies according to table 00540-1. Review
specs.
Production
TABLE 00540-1 Frequency of Quality Control Testing (Metric)
(M) (S) Test at minimum
frequencies according to table 00540-1. Review
specs.
(S) 1 Set Represents a minimum of 3 Cylinders
Production
1 Set per each 150 m³ or portion thereof75 to 450 m³ on a single day
0 to 100 yd³ on a single day
TABLE 00540-1 Frequency of Quality Control Testing (English)
1 Set per each 100 yd³ or portion thereof
after reaching 450 m³
Minimum frequencies per Class of concrete based on daily production records.
1 Set each day
Quantity Over 100 yd³
Page 18
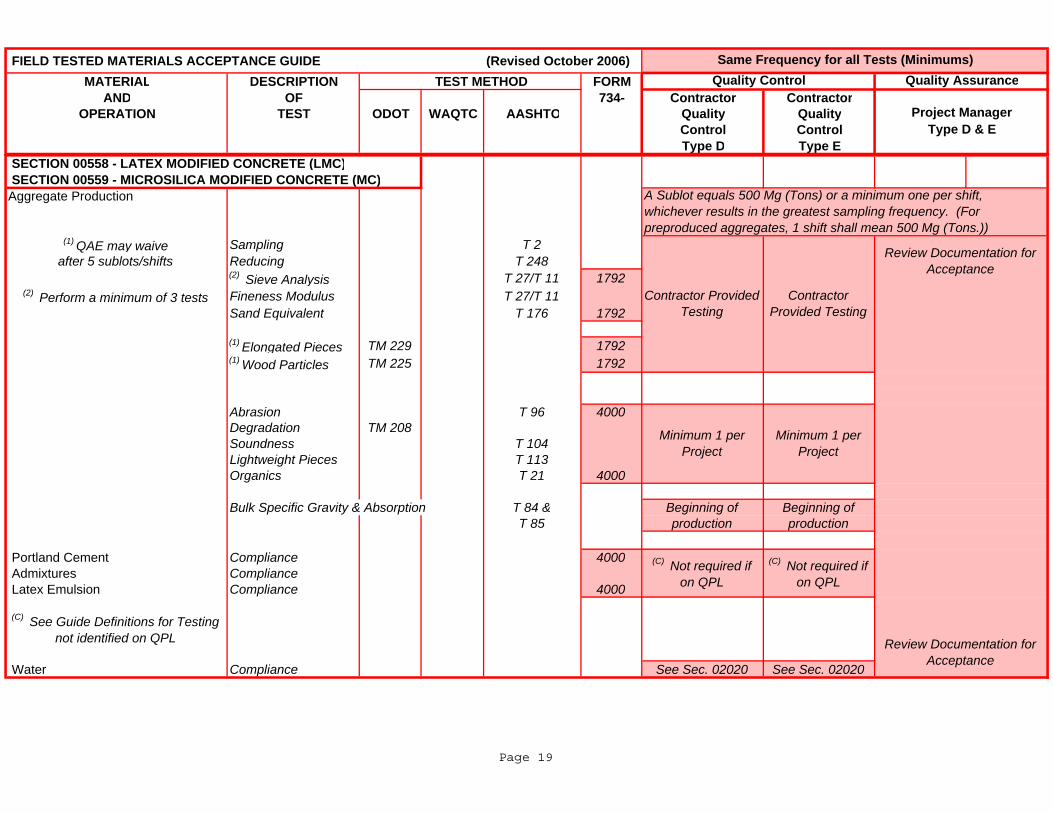
FIELD TESTED MATERIALS ACCEPTANCE GUIDE (Revised October 2006)MATERIAL DESCRIPTION TEST METHOD FORM
AND OF 734- Contractor ContractorOPERATION TEST ODOT WAQTC AASHTO Quality Quality
Control ControlType D Type E
Same Frequency for all Tests (Minimums)Quality Control
SECTION 00510 STRUCTURE EXCAVATION AND BACKFILL
Quality Assurance
Project Manager Type D & E
SECTION 00558 - LATEX MODIFIED CONCRETE (LMC) SECTION 00559 - MICROSILICA MODIFIED CONCRETE (MC)Aggregate Production
(1) QAE may waive Sampling T 2after 5 sublots/shifts Reducing T 248
(2) Sieve Analysis T 27/T 11 1792(2) Perform a minimum of 3 tests Fineness Modulus T 27/T 11
Sand Equivalent T 176 1792
(1) Elongated Pieces TM 229 1792(1) Wood Particles TM 225 1792
Abrasion T 96 4000Degradation TM 208Soundness T 104Lightweight Pieces T 113Organics T 21 4000
Bulk Specific Gravity & Absorption T 84 & Beginning of Beginning ofT 85 production production
Portland Cement Compliance 4000 Admixtures Compliance Latex Emulsion Compliance 4000
Water Compliance See Sec. 02020 See Sec. 02020
A Sublot equals 500 Mg (Tons) or a minimum one per shift, whichever results in the greatest sampling frequency. (For preproduced aggregates, 1 shift shall mean 500 Mg (Tons.))
(C) See Guide Definitions for Testing not identified on QPL
Contractor Provided Testing
Contractor Provided Testing
Review Documentation for Acceptance
(C) Not required if on QPL
Minimum 1 per Project
Minimum 1 per Project
Review Documentation for Acceptance
(C) Not required if on QPL
Page 19
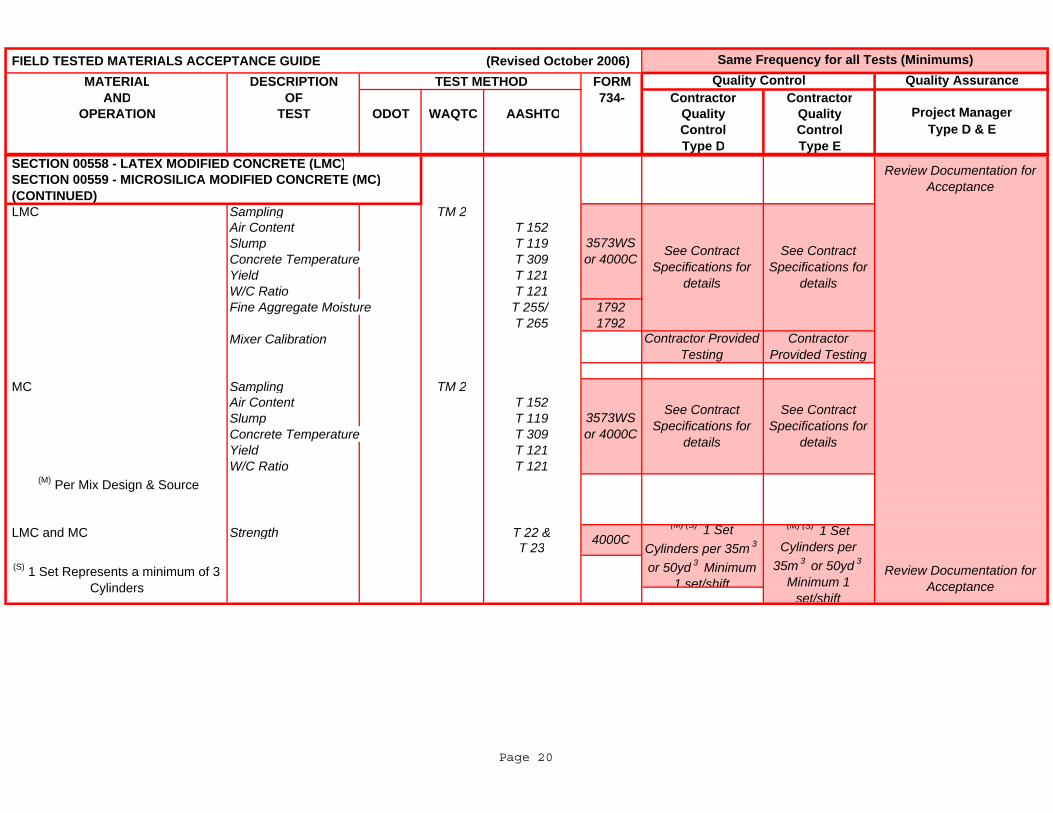
FIELD TESTED MATERIALS ACCEPTANCE GUIDE (Revised October 2006)MATERIAL DESCRIPTION TEST METHOD FORM
AND OF 734- Contractor ContractorOPERATION TEST ODOT WAQTC AASHTO Quality Quality
Control ControlType D Type E
Same Frequency for all Tests (Minimums)Quality Control
SECTION 00510 STRUCTURE EXCAVATION AND BACKFILL
Quality Assurance
Project Manager Type D & E
SECTION 00558 - LATEX MODIFIED CONCRETE (LMC) SECTION 00559 - MICROSILICA MODIFIED CONCRETE (MC) (CONTINUED) LMC Sampling TM 2
Air Content T 152Slump T 119Concrete Temperature T 309Yield T 121W/C Ratio T 121Fine Aggregate Moisture T 255/ 1792
T 265 1792Mixer Calibration
MC Sampling TM 2Air Content T 152Slump T 119Concrete Temperature T 309Yield T 121W/C Ratio T 121
(M) Per Mix Design & Source
LMC and MC Strength T 22 &T 23
(M) (S) 1 Set Cylinders per 35m 3
or 50yd 3 Minimum 1 set/shift
See Contract Specifications for
details
Contractor Provided Testing
Contractor Provided Testing
(S) 1 Set Represents a minimum of 3 Cylinders
3573WS or 4000C
3573WS or 4000C
4000C
See Contract Specifications for
details
Review Documentation for Acceptance
Review Documentation for Acceptance
See Contract Specifications for
details
See Contract Specifications for
details
(M) (S) 1 Set Cylinders per
35m 3 or 50yd 3
Minimum 1 set/shift
Page 20
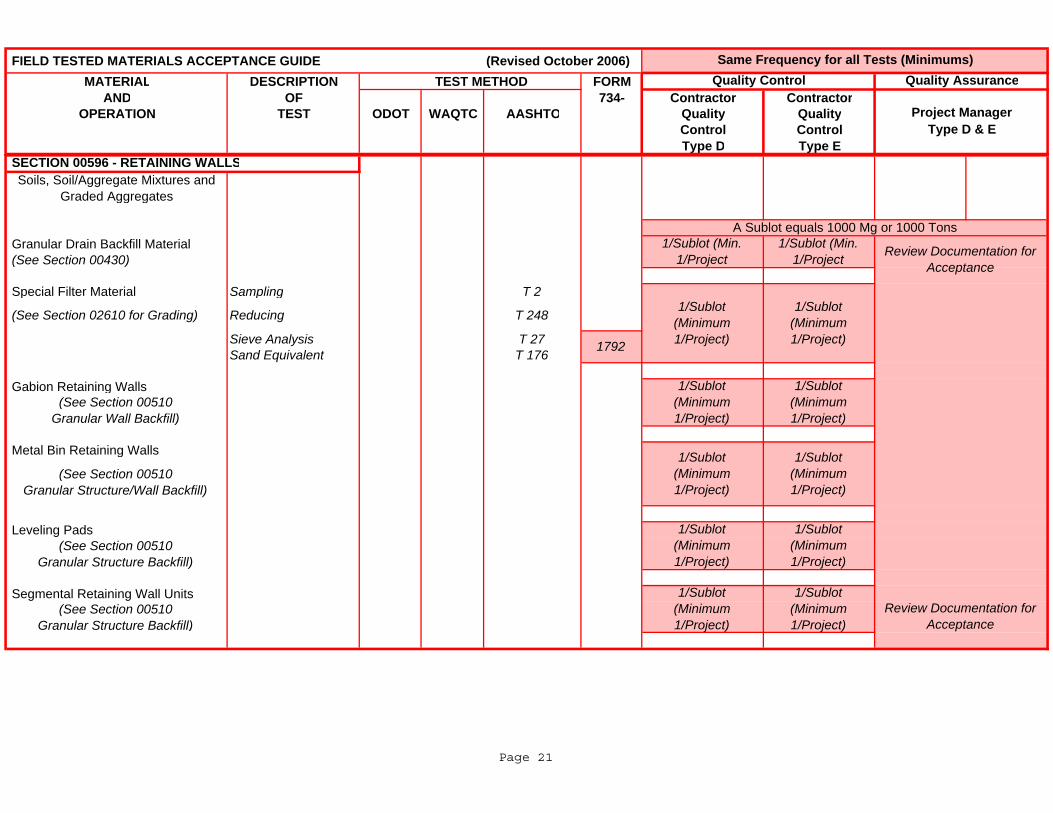
FIELD TESTED MATERIALS ACCEPTANCE GUIDE (Revised October 2006)MATERIAL DESCRIPTION TEST METHOD FORM
AND OF 734- Contractor ContractorOPERATION TEST ODOT WAQTC AASHTO Quality Quality
Control ControlType D Type E
Same Frequency for all Tests (Minimums)Quality Control
SECTION 00510 STRUCTURE EXCAVATION AND BACKFILL
Quality Assurance
Project Manager Type D & E
Soils, Soil/Aggregate Mixtures and Graded Aggregates
Granular Drain Backfill Material (See Section 00430) Special Filter Material Sampling T 2
(See Section 02610 for Grading) Reducing T 248
Sieve Analysis T 27Sand Equivalent T 176
Gabion Retaining Walls(See Section 00510
Granular Wall Backfill)
Metal Bin Retaining Walls
(See Section 00510 Granular Structure/Wall Backfill)
Leveling Pads(See Section 00510
Granular Structure Backfill)
Segmental Retaining Wall Units(See Section 00510
Granular Structure Backfill)
SECTION 00596 - RETAINING WALLS
1792
1/Sublot (Minimum 1/Project)
1/Sublot (Minimum 1/Project)
A Sublot equals 1000 Mg or 1000 Tons
Review Documentation for Acceptance
Review Documentation for Acceptance
1/Sublot (Minimum 1/Project)
1/Sublot (Min. 1/Project
1/Sublot (Min. 1/Project
1/Sublot (Minimum 1/Project)
1/Sublot (Minimum 1/Project)
1/Sublot (Minimum 1/Project)
1/Sublot (Minimum 1/Project)
1/Sublot (Minimum 1/Project)
1/Sublot (Minimum 1/Project)
1/Sublot (Minimum 1/Project)
Page 21
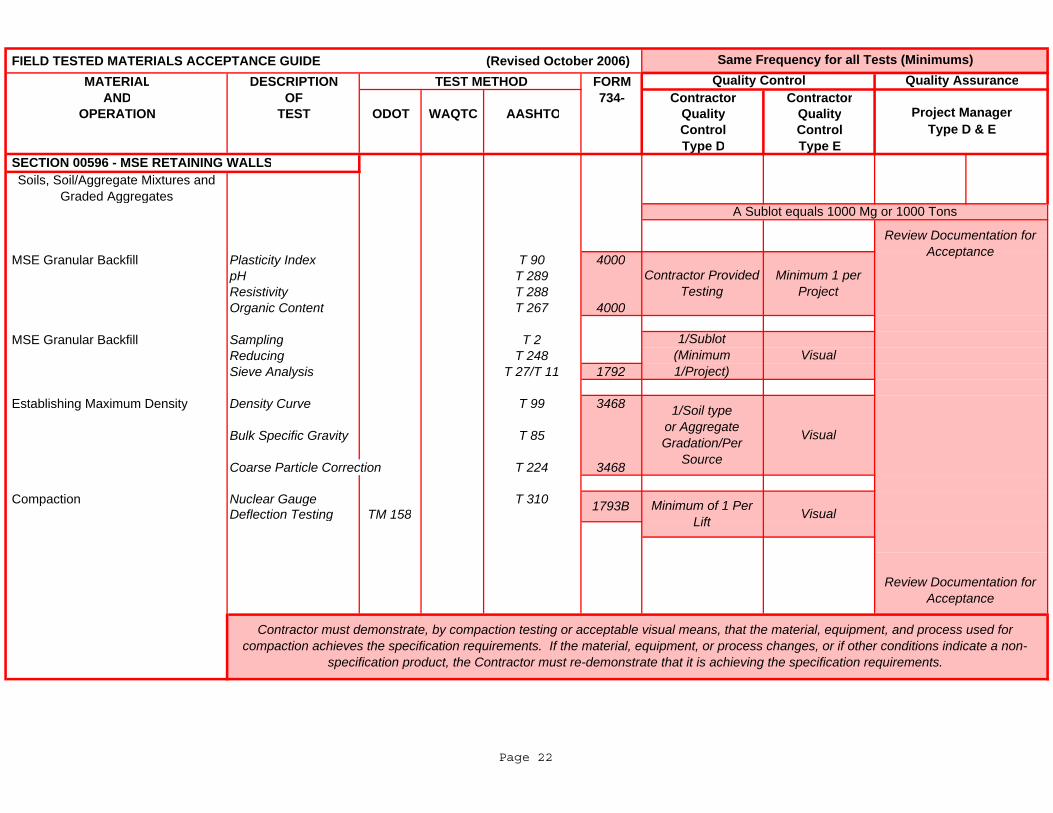
FIELD TESTED MATERIALS ACCEPTANCE GUIDE (Revised October 2006)MATERIAL DESCRIPTION TEST METHOD FORM
AND OF 734- Contractor ContractorOPERATION TEST ODOT WAQTC AASHTO Quality Quality
Control ControlType D Type E
Same Frequency for all Tests (Minimums)Quality Control
SECTION 00510 STRUCTURE EXCAVATION AND BACKFILL
Quality Assurance
Project Manager Type D & E
Soils, Soil/Aggregate Mixtures and Graded Aggregates
MSE Granular Backfill Plasticity Index T 90 4000pH T 289Resistivity T 288Organic Content T 267 4000
MSE Granular Backfill Sampling T 2
Reducing T 248Sieve Analysis T 27/T 11 1792
Establishing Maximum Density Density Curve T 99 3468
Bulk Specific Gravity T 85
Coarse Particle Correction T 224 3468
Compaction Nuclear Gauge T 310Deflection Testing TM 158
Contractor must demonstrate, by compaction testing or acceptable visual means, that the material, equipment, and process used for compaction achieves the specification requirements. If the material, equipment, or process changes, or if other conditions indicate a non-
specification product, the Contractor must re-demonstrate that it is achieving the specification requirements.
1793B
1/Soil type or Aggregate Gradation/Per
Source
Minimum of 1 Per Lift
SECTION 00596 - MSE RETAINING WALLS
A Sublot equals 1000 Mg or 1000 Tons
Minimum 1 per Project
Review Documentation for Acceptance
Review Documentation for Acceptance
Contractor Provided Testing
Visual
Visual
Visual
1/Sublot (Minimum 1/Project)
Page 22
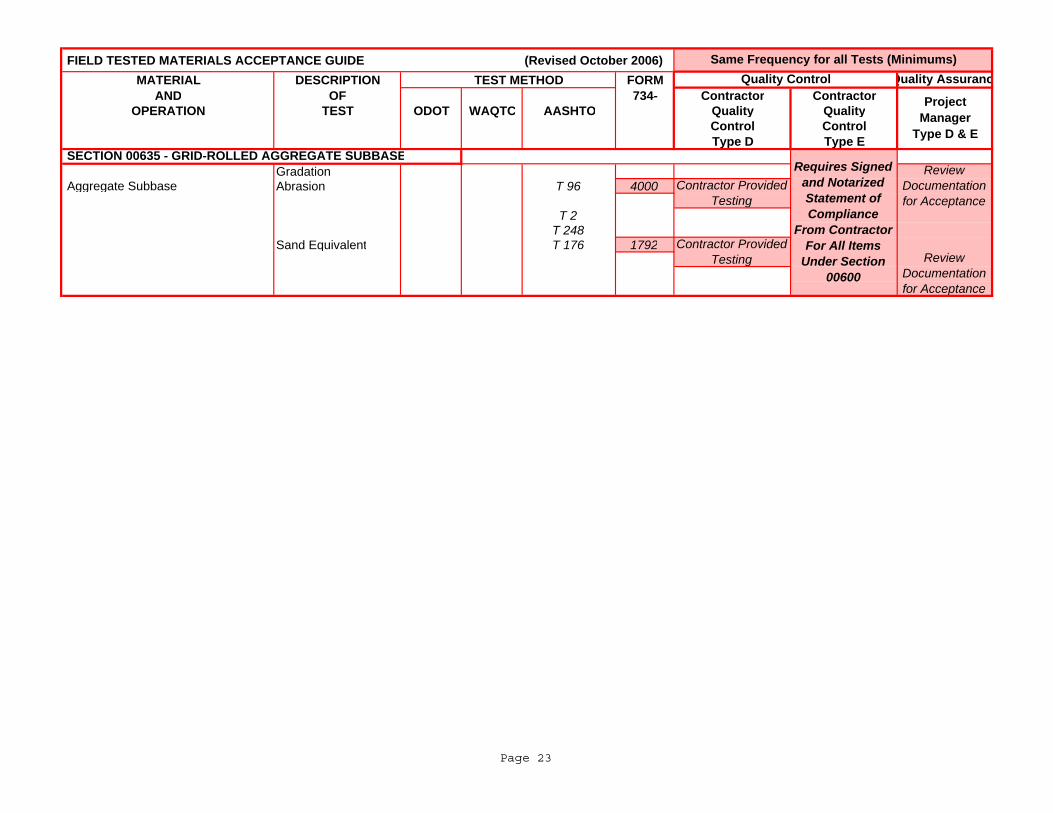
FIELD TESTED MATERIALS ACCEPTANCE GUIDE (Revised October 2006)MATERIAL DESCRIPTION TEST METHOD FORM
AND OF 734- Contractor ContractorOPERATION TEST ODOT WAQTC AASHTO Quality Quality
Control ControlType D Type E
Gradation Aggregate Subbase Abrasion T 96 4000
T 2T 248
Sand Equivalent T 176 1792
Same Frequency for all Tests (Minimums)Quality Control Quality Assuranc
Project Manager
Type D & E
SECTION 00635 - GRID-ROLLED AGGREGATE SUBBASEReview
Documentation for Acceptance
Review Documentation for Acceptance
Contractor Provided Testing
Contractor Provided Testing
Requires Signed and Notarized Statement of Compliance
From Contractor For All Items
Under Section 00600
Page 23
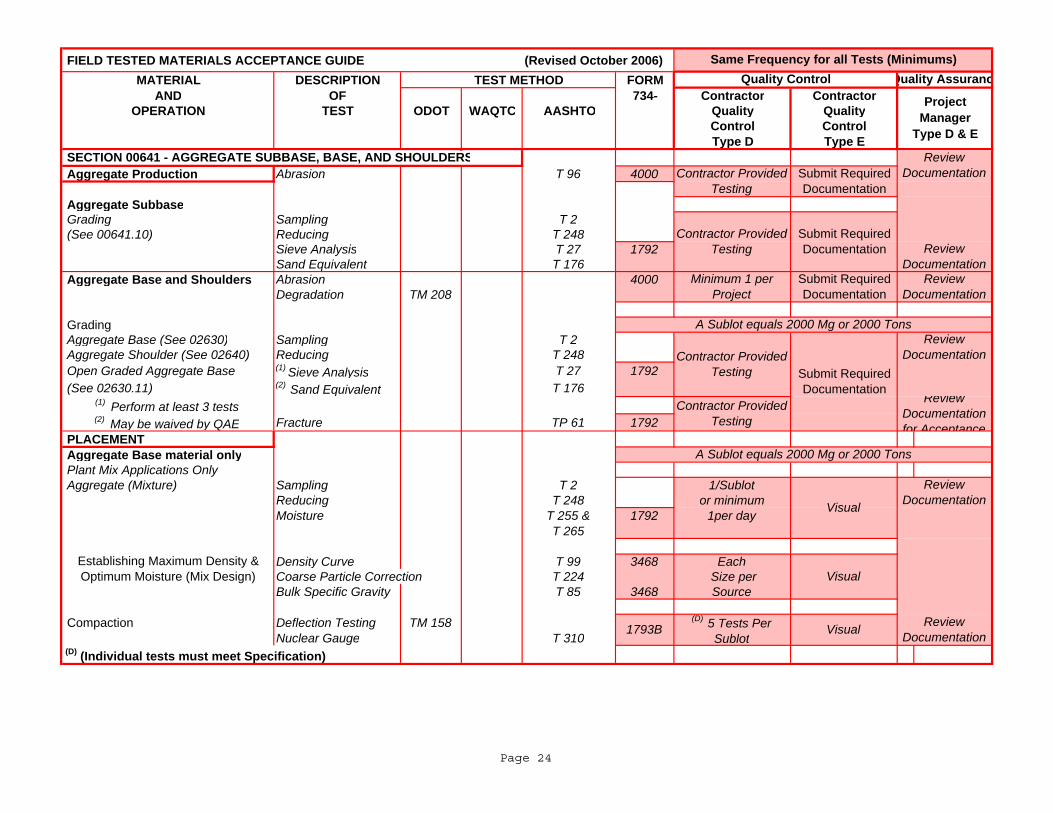
FIELD TESTED MATERIALS ACCEPTANCE GUIDE (Revised October 2006)MATERIAL DESCRIPTION TEST METHOD FORM
AND OF 734- Contractor ContractorOPERATION TEST ODOT WAQTC AASHTO Quality Quality
Control ControlType D Type E
Same Frequency for all Tests (Minimums)Quality Control Quality Assuranc
Project Manager
Type D & E
SECTION 00635 GRID ROLLED AGGREGATE SUBBASE Aggregate Production Abrasion T 96 4000
Aggregate Subbase Grading Sampling T 2 (See 00641.10) Reducing T 248
Sieve Analysis T 27 1792Sand Equivalent T 176
Aggregate Base and Shoulders Abrasion 4000Degradation TM 208
Grading Aggregate Base (See 02630) Sampling T 2 Aggregate Shoulder (See 02640) Reducing T 248 Open Graded Aggregate Base (1) Sieve Analysis T 27 1792 (See 02630.11) (2) Sand Equivalent T 176
(1) Perform at least 3 tests(2) May be waived by QAE Fracture TP 61 1792
PLACEMENT Aggregate Base material only Plant Mix Applications Only Aggregate (Mixture) Sampling T 2 1/Sublot
Reducing T 248 or minimumMoisture T 255 & 1792 1per day
T 265
Density Curve T 99 3468 EachCoarse Particle Correction T 224 Size perBulk Specific Gravity T 85 3468 Source
Compaction Deflection Testing TM 158 Nuclear Gauge T 310
(D) (Individual tests must meet Specification)
A Sublot equals 2000 Mg or 2000 Tons
Contractor Provided Testing
Submit Required Documentation
Submit Required Documentation
Minimum 1 per Project
A Sublot equals 2000 Mg or 2000 Tons
SECTION 00641 - AGGREGATE SUBBASE, BASE, AND SHOULDERS
Establishing Maximum Density & Optimum Moisture (Mix Design)
1793B(D) 5 Tests Per
SublotVisual
Review Documentation
Review Documentation
Review Documentation
Review Documentation for Acceptance
Submit Required Documentation
Contractor Provided Testing
Contractor Provided Testing
Visual
Visual
Review Documentation
Review Documentation
Contractor Provided Testing
Review Documentation Submit Required
Documentation
Page 24
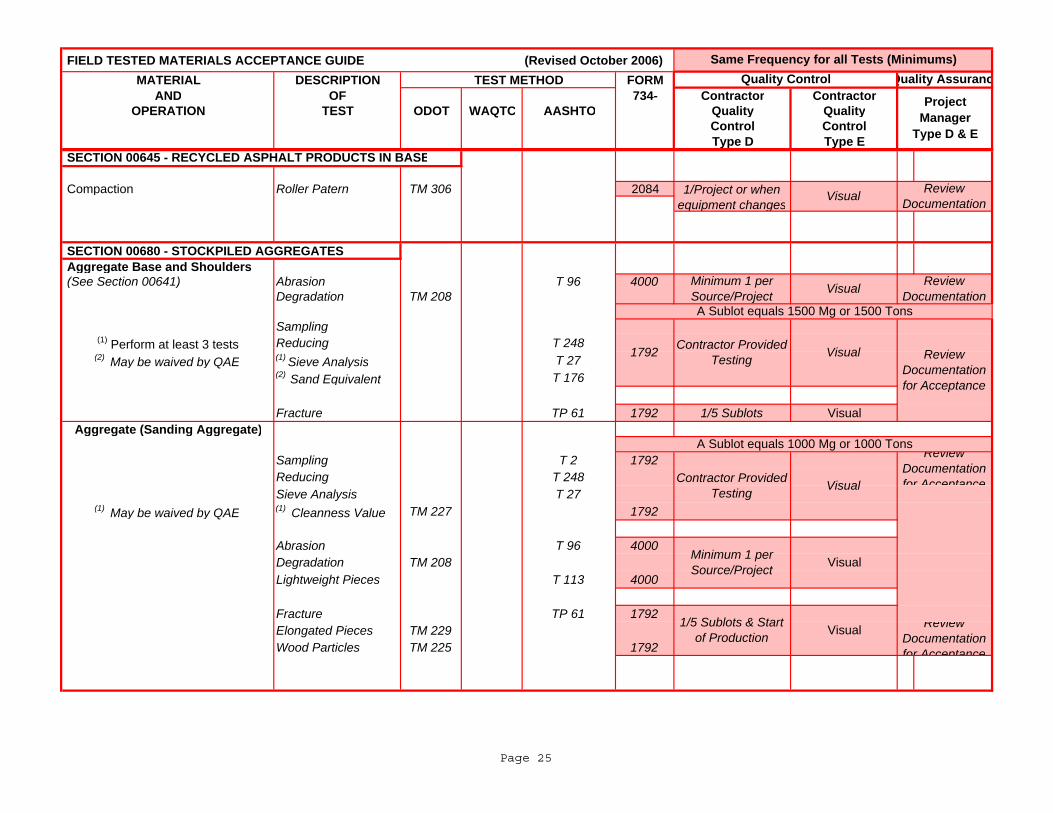
FIELD TESTED MATERIALS ACCEPTANCE GUIDE (Revised October 2006)MATERIAL DESCRIPTION TEST METHOD FORM
AND OF 734- Contractor ContractorOPERATION TEST ODOT WAQTC AASHTO Quality Quality
Control ControlType D Type E
Same Frequency for all Tests (Minimums)Quality Control Quality Assuranc
Project Manager
Type D & E
SECTION 00635 GRID ROLLED AGGREGATE SUBBASE
Compaction Roller Patern TM 306 2084
SECTION 00680 - STOCKPILED AGGREGATES Aggregate Base and Shoulders (See Section 00641) Abrasion T 96 4000
Degradation TM 208
Sampling(1) Perform at least 3 tests Reducing T 248
(2) May be waived by QAE (1) Sieve Analysis T 27(2) Sand Equivalent T 176
Fracture TP 61 1792 1/5 Sublots VisualAggregate (Sanding Aggregate)
Sampling T 2 1792Reducing T 248Sieve Analysis T 27
(1) May be waived by QAE (1) Cleanness Value TM 227 1792
Abrasion T 96 4000Degradation TM 208Lightweight Pieces T 113 4000
Fracture TP 61 1792Elongated Pieces TM 229Wood Particles TM 225 1792
SECTION 00645 - RECYCLED ASPHALT PRODUCTS IN BASE
Visual
A Sublot equals 1000 Mg or 1000 Tons
1792 Review Documentation for Acceptance
1/Project or when equipment changes
Visual Review Documentation
Review Documentation
Contractor Provided Testing Visual
Visual
Contractor Provided Testing
Minimum 1 per Source/Project
Visual
Review Documentation for Acceptance
1/5 Sublots & Start of Production
Review Documentation for Acceptance
A Sublot equals 1500 Mg or 1500 Tons
Minimum 1 per Source/Project Visual
Page 25
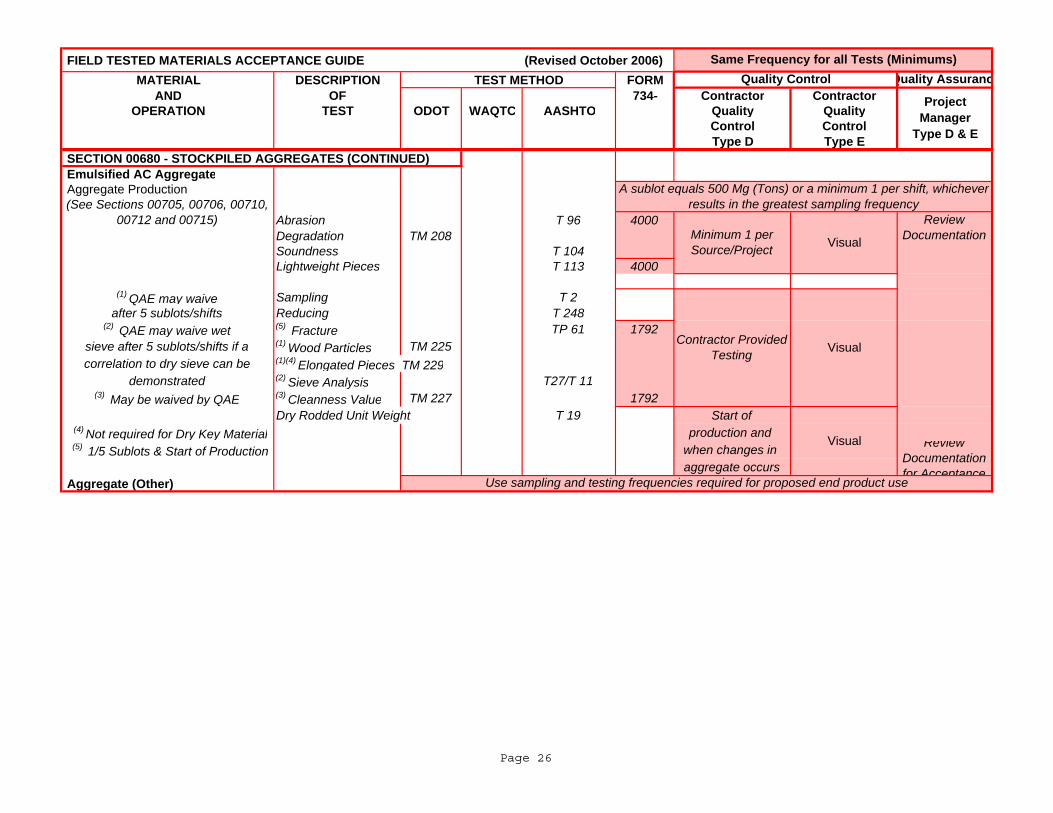
FIELD TESTED MATERIALS ACCEPTANCE GUIDE (Revised October 2006)MATERIAL DESCRIPTION TEST METHOD FORM
AND OF 734- Contractor ContractorOPERATION TEST ODOT WAQTC AASHTO Quality Quality
Control ControlType D Type E
Same Frequency for all Tests (Minimums)Quality Control Quality Assuranc
Project Manager
Type D & E
SECTION 00635 GRID ROLLED AGGREGATE SUBBASE SECTION 00680 - STOCKPILED AGGREGATES (CONTINUED) Emulsified AC Aggregate Aggregate Production
Abrasion T 96 4000Degradation TM 208Soundness T 104Lightweight Pieces T 113 4000
(1) QAE may waive Sampling T 2after 5 sublots/shifts Reducing T 248
(2) QAE may waive wet (5) Fracture TP 61 1792sieve after 5 sublots/shifts if a (1) Wood Particles TM 225correlation to dry sieve can be (1)(4) Elongated Pieces TM 229
demonstrated (2) Sieve Analysis T27/T 11(3) May be waived by QAE (3) Cleanness Value TM 227 1792
Dry Rodded Unit Weight T 19 Start of (4) Not required for Dry Key Material production and (5) 1/5 Sublots & Start of Production when changes in
aggregate occurs Aggregate (Other)
(See Sections 00705, 00706, 00710, 00712 and 00715)
Use sampling and testing frequencies required for proposed end product use
A sublot equals 500 Mg (Tons) or a minimum 1 per shift, whichever results in the greatest sampling frequency
Visual
Contractor Provided Testing Visual
Visual
Review Documentation
Review Documentation for Acceptance
Minimum 1 per Source/Project
Page 26
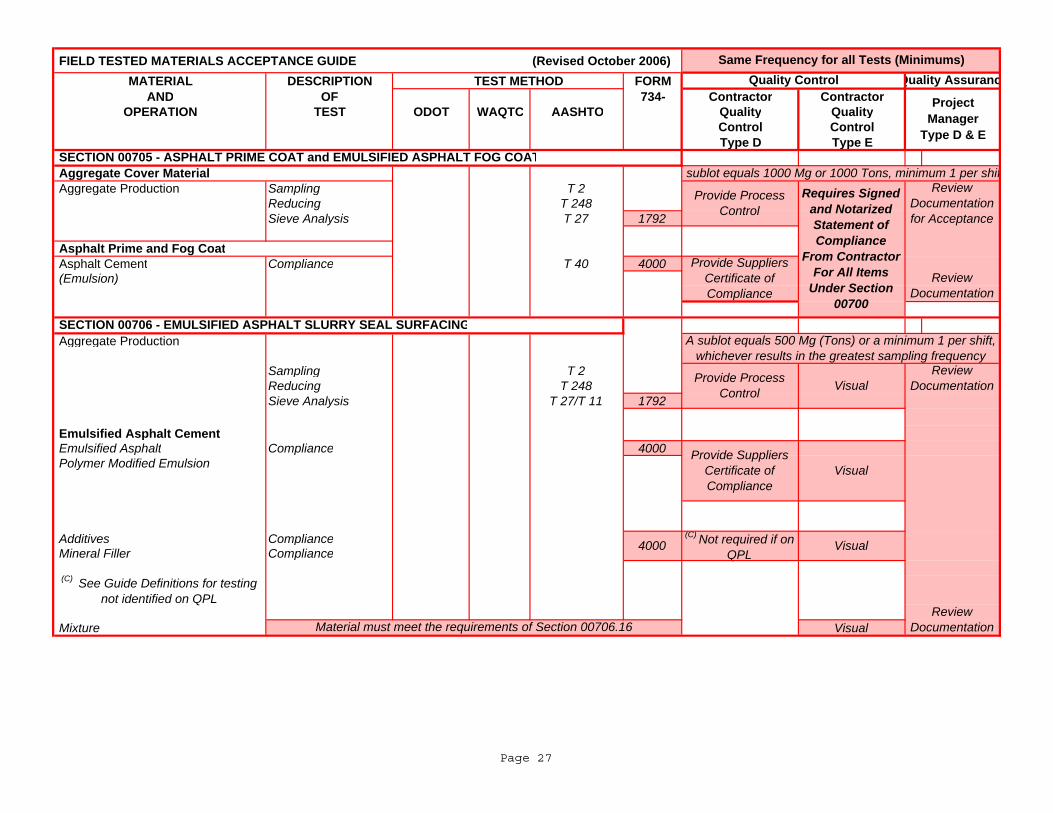
FIELD TESTED MATERIALS ACCEPTANCE GUIDE (Revised October 2006)MATERIAL DESCRIPTION TEST METHOD FORM
AND OF 734- Contractor ContractorOPERATION TEST ODOT WAQTC AASHTO Quality Quality
Control ControlType D Type E
Aggregate Production Sampling T 2Reducing T 248Sieve Analysis T 27 1792
Asphalt Cement Compliance T 40 4000 (Emulsion)
Aggregate Production
Sampling T 2Reducing T 248Sieve Analysis T 27/T 11 1792
Emulsified Asphalt Cement Emulsified Asphalt Compliance 4000 Polymer Modified Emulsion
Additives Compliance Mineral Filler Compliance
Mixture Visual
Provide Process Control Visual
Provide Suppliers Certificate of Compliance
Visual
Same Frequency for all Tests (Minimums)
A sublot equals 500 Mg (Tons) or a minimum 1 per shift, whichever results in the greatest sampling frequency
Quality Control Quality Assuranc
Project Manager
Type D & E
(C) See Guide Definitions for testing not identified on QPL
Material must meet the requirements of Section 00706.16
SECTION 00705 - ASPHALT PRIME COAT and EMULSIFIED ASPHALT FOG COAT Aggregate Cover Material
Asphalt Prime and Fog Coat
SECTION 00706 - EMULSIFIED ASPHALT SLURRY SEAL SURFACING
Requires Signed and Notarized Statement of Compliance
From Contractor For All Items
Under Section 00700
A sublot equals 1000 Mg or 1000 Tons, minimum 1 per shifReview
Documentation for Acceptance
Review Documentation
Provide Suppliers Certificate of Compliance
Provide Process Control
(C) Not required if on QPL
Review Documentation
Review Documentation
Visual4000
Page 27
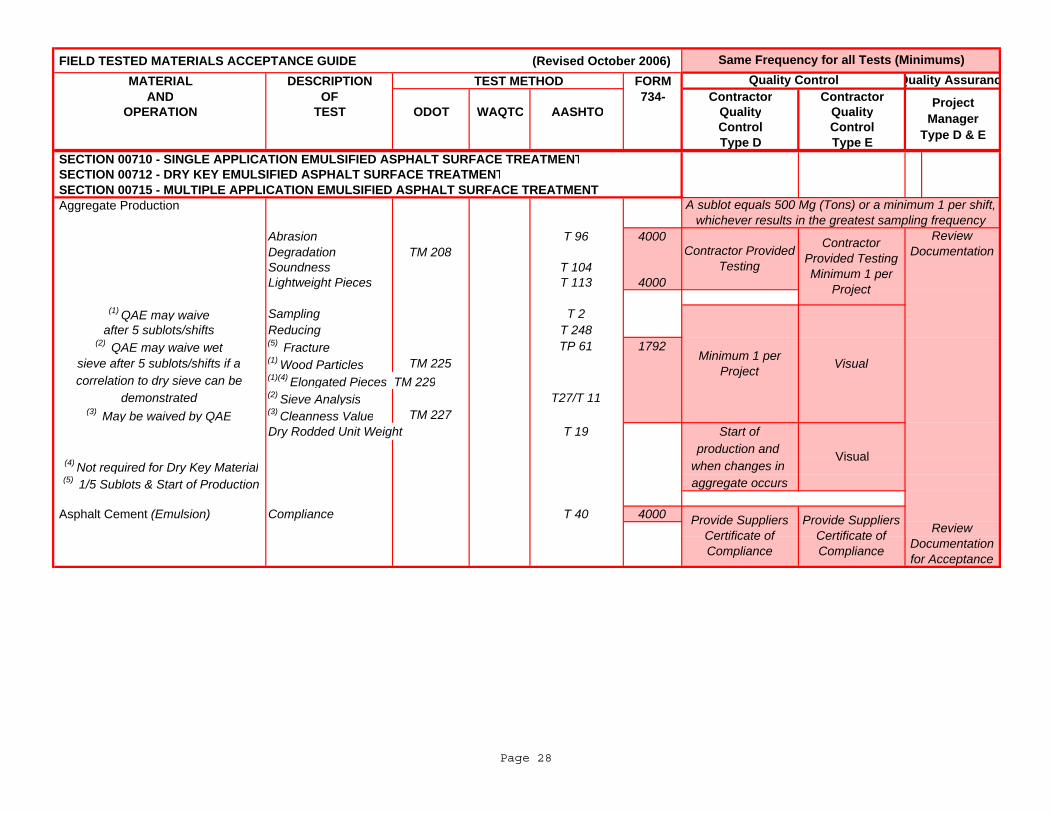
FIELD TESTED MATERIALS ACCEPTANCE GUIDE (Revised October 2006)MATERIAL DESCRIPTION TEST METHOD FORM
AND OF 734- Contractor ContractorOPERATION TEST ODOT WAQTC AASHTO Quality Quality
Control ControlType D Type E
Same Frequency for all Tests (Minimums)Quality Control Quality Assuranc
Project Manager
Type D & E
SECTION 00710 - SINGLE APPLICATION EMULSIFIED ASPHALT SURFACE TREATMENT SECTION 00712 - DRY KEY EMULSIFIED ASPHALT SURFACE TREATMENT SECTION 00715 - MULTIPLE APPLICATION EMULSIFIED ASPHALT SURFACE TREATMENT Aggregate Production
Abrasion T 96 4000Degradation TM 208Soundness T 104 Lightweight Pieces T 113 4000
(1) QAE may waive Sampling T 2after 5 sublots/shifts Reducing T 248
(2) QAE may waive wet (5) Fracture TP 61 1792sieve after 5 sublots/shifts if a (1) Wood Particles TM 225correlation to dry sieve can be (1)(4) Elongated Pieces TM 229
demonstrated (2) Sieve Analysis T27/T 11(3) May be waived by QAE (3) Cleanness Value TM 227
Dry Rodded Unit Weight T 19 Start ofproduction and
(4) Not required for Dry Key Material when changes in (5) 1/5 Sublots & Start of Production aggregate occurs
Asphalt Cement (Emulsion) Compliance T 40 4000
A sublot equals 500 Mg (Tons) or a minimum 1 per shift, whichever results in the greatest sampling frequency
Contractor Provided Testing
Contractor Provided Testing Minimum 1 per
Project
Review Documentation
VisualMinimum 1 per Project
Provide Suppliers Certificate of Compliance
Provide Suppliers Certificate of Compliance
Visual
Review Documentation for Acceptance
Page 28
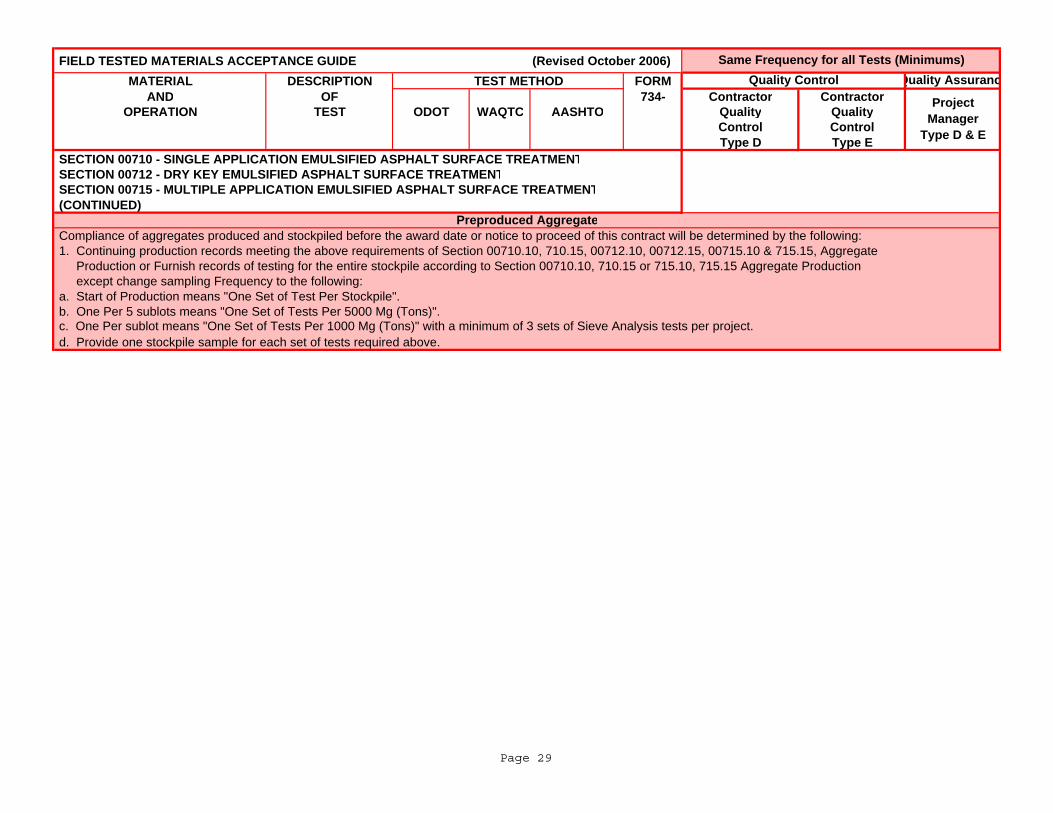
FIELD TESTED MATERIALS ACCEPTANCE GUIDE (Revised October 2006)MATERIAL DESCRIPTION TEST METHOD FORM
AND OF 734- Contractor ContractorOPERATION TEST ODOT WAQTC AASHTO Quality Quality
Control ControlType D Type E
Same Frequency for all Tests (Minimums)Quality Control Quality Assuranc
Project Manager
Type D & E
SECTION 00710 - SINGLE APPLICATION EMULSIFIED ASPHALT SURFACE TREATMENT SECTION 00712 - DRY KEY EMULSIFIED ASPHALT SURFACE TREATMENT SECTION 00715 - MULTIPLE APPLICATION EMULSIFIED ASPHALT SURFACE TREATMENT (CONTINUED)
Compliance of aggregates produced and stockpiled before the award date or notice to proceed of this contract will be determined by the following: 1. Continuing production records meeting the above requirements of Section 00710.10, 710.15, 00712.10, 00712.15, 00715.10 & 715.15, Aggregate Production or Furnish records of testing for the entire stockpile according to Section 00710.10, 710.15 or 715.10, 715.15 Aggregate Production except change sampling Frequency to the following: a. Start of Production means "One Set of Test Per Stockpile". b. One Per 5 sublots means "One Set of Tests Per 5000 Mg (Tons)".
d. Provide one stockpile sample for each set of tests required above.
Preproduced Aggregate
c. One Per sublot means "One Set of Tests Per 1000 Mg (Tons)" with a minimum of 3 sets of Sieve Analysis tests per project.
Page 29
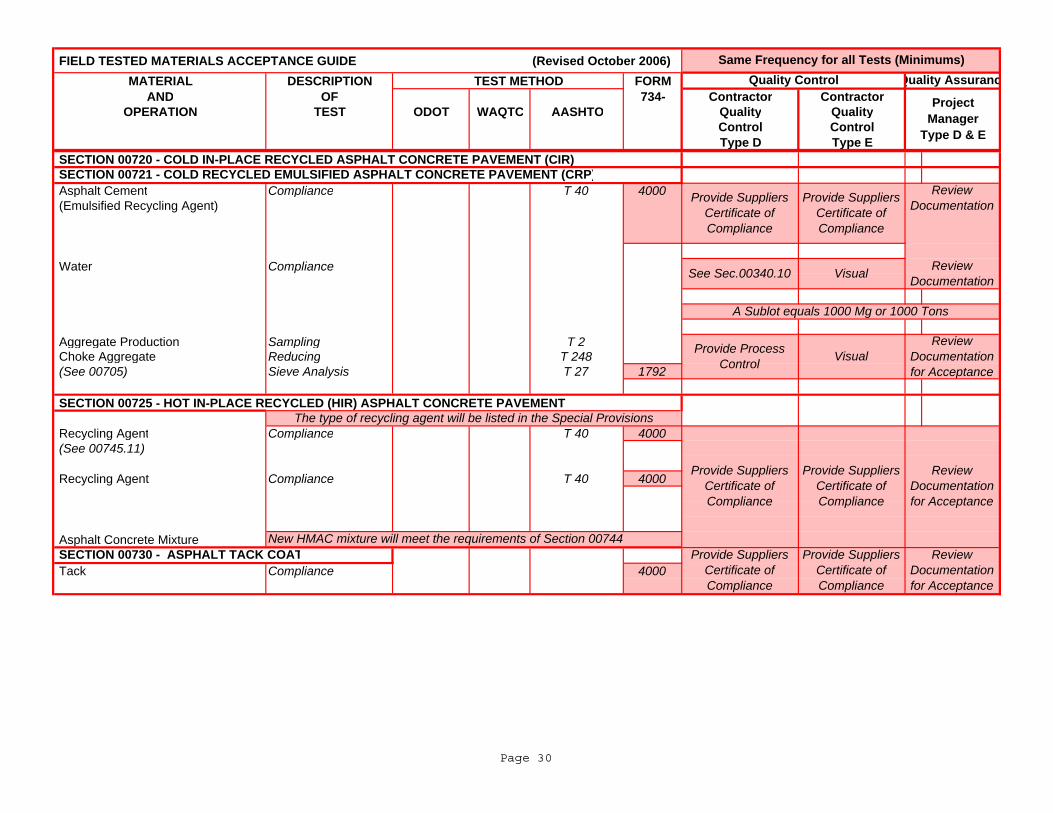
FIELD TESTED MATERIALS ACCEPTANCE GUIDE (Revised October 2006)MATERIAL DESCRIPTION TEST METHOD FORM
AND OF 734- Contractor ContractorOPERATION TEST ODOT WAQTC AASHTO Quality Quality
Control ControlType D Type E
Same Frequency for all Tests (Minimums)Quality Control Quality Assuranc
Project Manager
Type D & E
SECTION 00720 - COLD IN-PLACE RECYCLED ASPHALT CONCRETE PAVEMENT (CIR)
Asphalt Cement Compliance T 40 4000 (Emulsified Recycling Agent)
Water Compliance
Aggregate Production Sampling T 2 Choke Aggregate Reducing T 248 (See 00705) Sieve Analysis T 27 1792
SECTION 00725 - HOT IN-PLACE RECYCLED (HIR) ASPHALT CONCRETE PAVEMENT
Recycling Agent Compliance T 40 4000 (See 00745.11)
Recycling Agent Compliance T 40 4000
Asphalt Concrete Mixture
Tack Compliance 4000 SECTION 00730 - ASPHALT TACK COAT
See Sec.00340.10
Provide Suppliers Certificate of Compliance
Provide Suppliers Certificate of Compliance
Provide Suppliers Certificate of Compliance
The type of recycling agent will be listed in the Special Provisions
A Sublot equals 1000 Mg or 1000 Tons
SECTION 00721 - COLD RECYCLED EMULSIFIED ASPHALT CONCRETE PAVEMENT (CRP)
New HMAC mixture will meet the requirements of Section 00744
Review Documentation
Review Documentation
Provide Suppliers Certificate of Compliance
Provide Suppliers Certificate of Compliance
Visual
Provide Process Control Visual
Review Documentation for Acceptance
Review Documentation for Acceptance
Provide Suppliers Certificate of Compliance
Review Documentation for Acceptance
Page 30
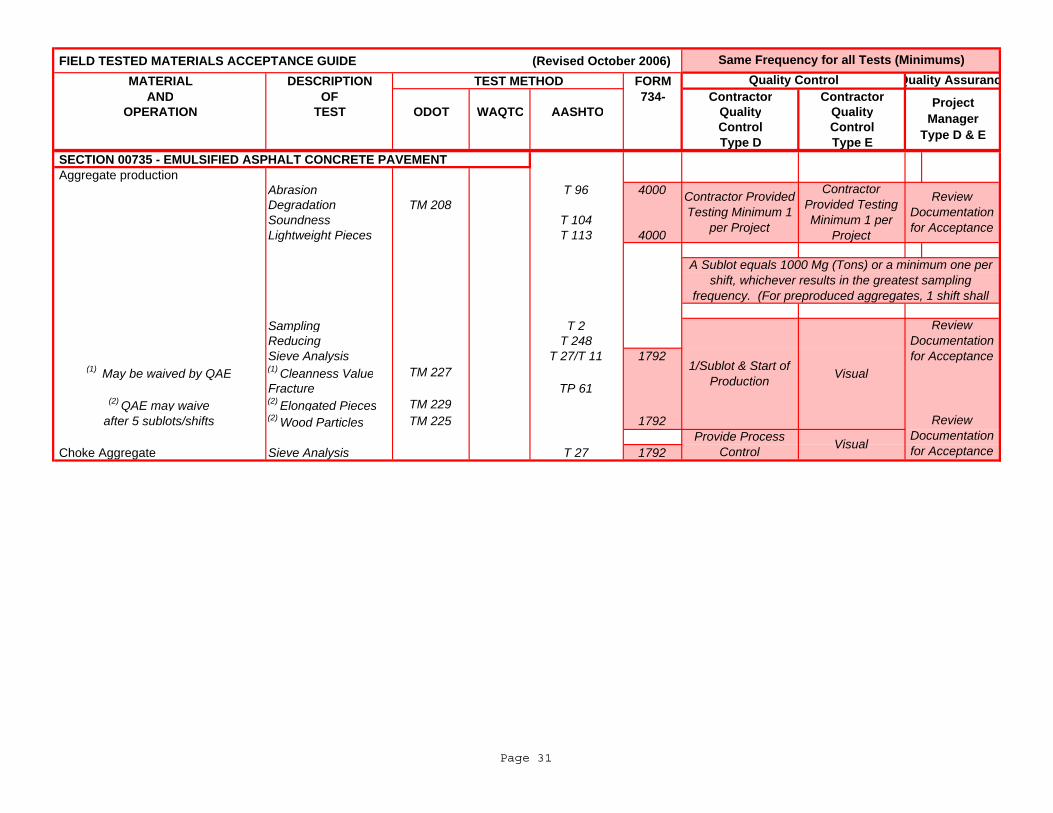
FIELD TESTED MATERIALS ACCEPTANCE GUIDE (Revised October 2006)MATERIAL DESCRIPTION TEST METHOD FORM
AND OF 734- Contractor ContractorOPERATION TEST ODOT WAQTC AASHTO Quality Quality
Control ControlType D Type E
Same Frequency for all Tests (Minimums)Quality Control Quality Assuranc
Project Manager
Type D & E
SECTION 00735 - EMULSIFIED ASPHALT CONCRETE PAVEMENT Aggregate production
Abrasion T 96 4000Degradation TM 208Soundness T 104Lightweight Pieces T 113 4000
Sampling T 2Reducing T 248Sieve Analysis T 27/T 11 1792
(1) May be waived by QAE (1) Cleanness Value TM 227Fracture TP 61
(2) QAE may waive (2) Elongated Pieces TM 229after 5 sublots/shifts (2) Wood Particles TM 225 1792
Choke Aggregate Sieve Analysis T 27 1792
1/Sublot & Start of Production
Contractor Provided Testing Minimum 1
per Project
Provide Process Control
Contractor Provided Testing Minimum 1 per
Project
Review Documentation for Acceptance
Review Documentation for Acceptance
Review Documentation for Acceptance
Visual
Visual
A Sublot equals 1000 Mg (Tons) or a minimum one per shift, whichever results in the greatest sampling
frequency. (For preproduced aggregates, 1 shift shall
Page 31
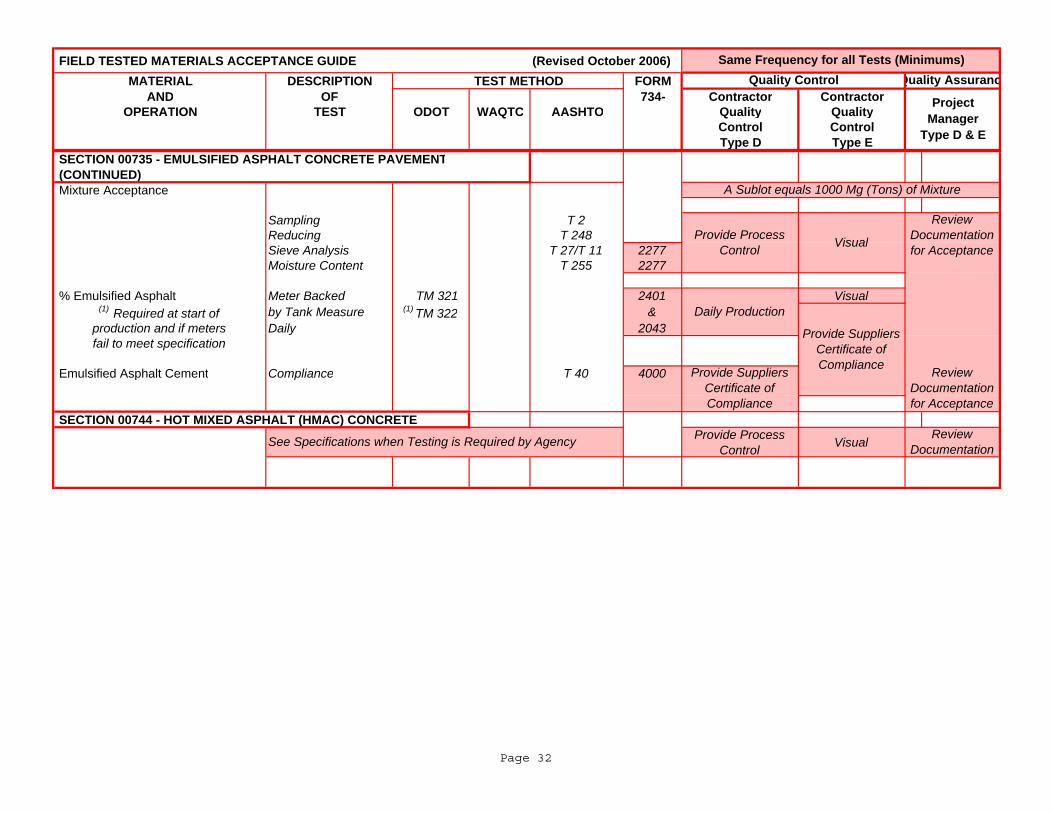
FIELD TESTED MATERIALS ACCEPTANCE GUIDE (Revised October 2006)MATERIAL DESCRIPTION TEST METHOD FORM
AND OF 734- Contractor ContractorOPERATION TEST ODOT WAQTC AASHTO Quality Quality
Control ControlType D Type E
Same Frequency for all Tests (Minimums)Quality Control Quality Assuranc
Project Manager
Type D & E
SECTION 00735 - EMULSIFIED ASPHALT CONCRETE PAVEMENT (CONTINUED) Mixture Acceptance
Sampling T 2Reducing T 248Sieve Analysis T 27/T 11 2277Moisture Content T 255 2277
% Emulsified Asphalt Meter Backed TM 321 2401 Visual(1) Required at start of by Tank Measure (1) TM 322 &
production and if meters Daily 2043fail to meet specification
Emulsified Asphalt Cement Compliance T 40 4000
SECTION 00744 - HOT MIXED ASPHALT (HMAC) CONCRETE Provide Process
Control Visual
Daily Production
Provide Process Control
A Sublot equals 1000 Mg (Tons) of Mixture
Visual
Provide Suppliers Certificate of Compliance
Review Documentation for Acceptance
Review Documentation for Acceptance
See Specifications when Testing is Required by Agency Review Documentation
Provide Suppliers Certificate of Compliance
Page 32
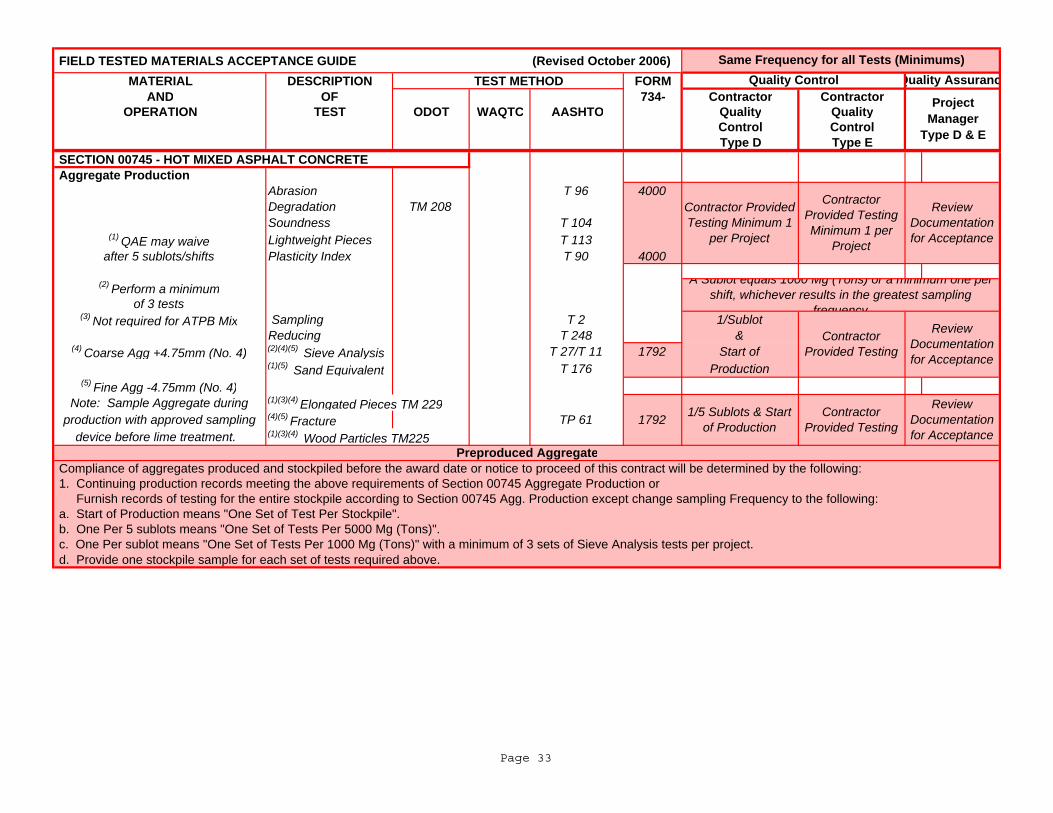
FIELD TESTED MATERIALS ACCEPTANCE GUIDE (Revised October 2006)MATERIAL DESCRIPTION TEST METHOD FORM
AND OF 734- Contractor ContractorOPERATION TEST ODOT WAQTC AASHTO Quality Quality
Control ControlType D Type E
Same Frequency for all Tests (Minimums)Quality Control Quality Assuranc
Project Manager
Type D & E
SECTION 00745 - HOT MIXED ASPHALT CONCRETE Aggregate Production
Abrasion T 96 4000Degradation TM 208Soundness T 104
(1) QAE may waive Lightweight Pieces T 113after 5 sublots/shifts Plasticity Index T 90 4000
(2) Perform a minimumof 3 tests
(3) Not required for ATPB Mix Sampling T 2 1/SublotReducing T 248 &
(4) Coarse Agg +4.75mm (No. 4) (2)(4)(5) Sieve Analysis T 27/T 11 1792 Start of(1)(5) Sand Equivalent T 176 Production
(5) Fine Agg -4.75mm (No. 4)Note: Sample Aggregate during (1)(3)(4) Elongated Pieces TM 229
production with approved sampling (4)(5) Fracture TP 61 1792device before lime treatment. (1)(3)(4) Wood Particles TM225
Compliance of aggregates produced and stockpiled before the award date or notice to proceed of this contract will be determined by the following: 1. Continuing production records meeting the above requirements of Section 00745 Aggregate Production or Furnish records of testing for the entire stockpile according to Section 00745 Agg. Production except change sampling Frequency to the following: a. Start of Production means "One Set of Test Per Stockpile". b. One Per 5 sublots means "One Set of Tests Per 5000 Mg (Tons)". c. One Per sublot means "One Set of Tests Per 1000 Mg (Tons)" with a minimum of 3 sets of Sieve Analysis tests per project. d. Provide one stockpile sample for each set of tests required above.
Contractor Provided Testing Minimum 1
per Project
Contractor Provided Testing Minimum 1 per
Project
A Sublot equals 1000 Mg (Tons) or a minimum one per shift, whichever results in the greatest sampling
frequency
1/5 Sublots & Start of Production
Review Documentation for Acceptance
Preproduced Aggregate
Contractor Provided Testing
Contractor Provided Testing
Review Documentation for Acceptance
Review Documentation for Acceptance
Page 33
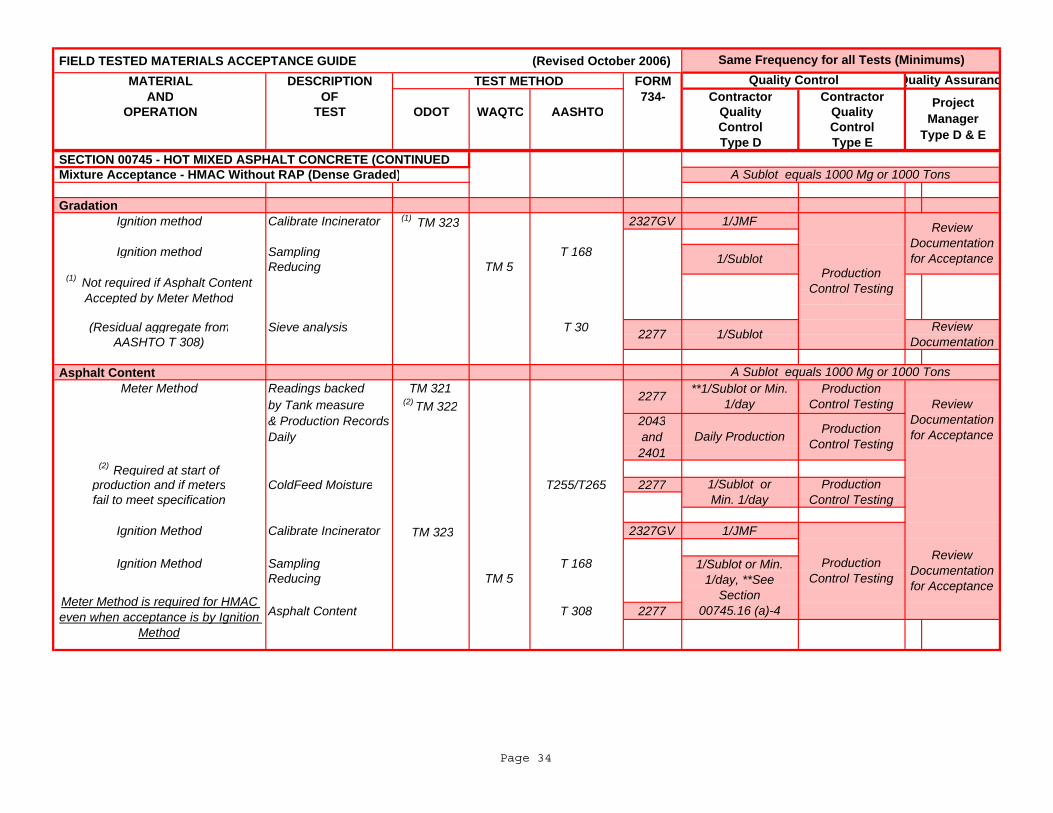
FIELD TESTED MATERIALS ACCEPTANCE GUIDE (Revised October 2006)MATERIAL DESCRIPTION TEST METHOD FORM
AND OF 734- Contractor ContractorOPERATION TEST ODOT WAQTC AASHTO Quality Quality
Control ControlType D Type E
Same Frequency for all Tests (Minimums)Quality Control Quality Assuranc
Project Manager
Type D & E
SECTION 00745 - HOT MIXED ASPHALT CONCRETE (CONTINUED
GradationIgnition method Calibrate Incinerator (1) TM 323 2327GV 1/JMF
Ignition method Sampling T 168Reducing TM 5
(Residual aggregate from Sieve analysis T 30
AASHTO T 308)
Asphalt ContentMeter Method Readings backed TM 321
by Tank measure (2) TM 322& Production Records 2043Daily and
2401(2) Required at start of
production and if meters ColdFeed Moisture T255/T265 2277fail to meet specification
Ignition Method Calibrate Incinerator TM 323 2327GV 1/JMF
Ignition Method Sampling T 168Reducing TM 5 Asphalt Content T 308 2277
Meter Method is required for HMAC even when acceptance is by Ignition
Method
Mixture Acceptance - HMAC Without RAP (Dense Graded)
Production Control Testing
2277
(1) Not required if Asphalt Content Accepted by Meter Method
2277
1/Sublot or Min. 1/day, **See
Section 00745.16 (a)-4
1/Sublot or Min. 1/day
Production Control Testing
Daily Production
1/Sublot
1/Sublot
**1/Sublot or Min. 1/day
A Sublot equals 1000 Mg or 1000 Tons
Review Documentation
Production Control Testing
Review Documentation for Acceptance
Production Control Testing
Review Documentation for Acceptance
A Sublot equals 1000 Mg or 1000 Tons
Review Documentation for Acceptance
Production Control Testing
Page 34
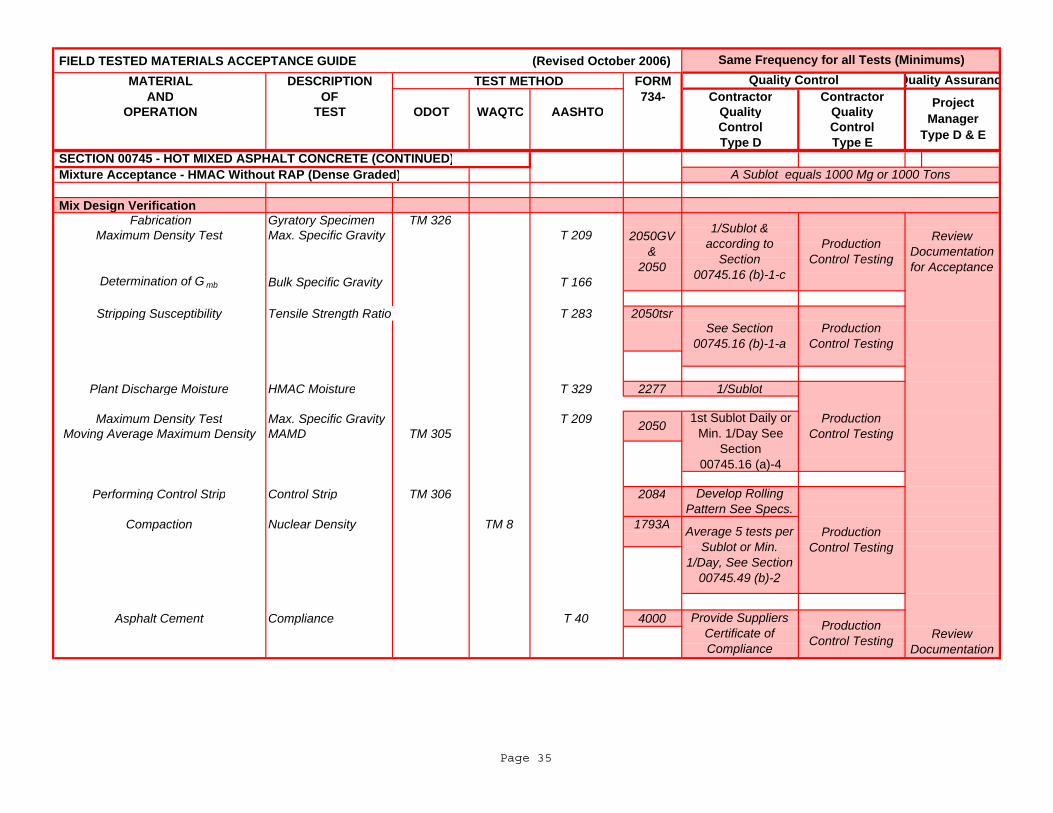
FIELD TESTED MATERIALS ACCEPTANCE GUIDE (Revised October 2006)MATERIAL DESCRIPTION TEST METHOD FORM
AND OF 734- Contractor ContractorOPERATION TEST ODOT WAQTC AASHTO Quality Quality
Control ControlType D Type E
Same Frequency for all Tests (Minimums)Quality Control Quality Assuranc
Project Manager
Type D & E
Mix Design Verification Fabrication Gyratory Specimen TM 326
Maximum Density Test Max. Specific Gravity T 209
Determination of G mb Bulk Specific Gravity T 166
Stripping Susceptibility Tensile Strength Ratio T 283 2050tsr
Plant Discharge Moisture HMAC Moisture T 329 2277 1/Sublot
Maximum Density Test Max. Specific Gravity T 209Moving Average Maximum Density MAMD TM 305
Performing Control Strip Control Strip TM 306 2084
Compaction Nuclear Density TM 8 1793A
Asphalt Cement Compliance T 40 4000
1st Sublot Daily or Min. 1/Day See
Section 00745.16 (a)-4
1/Sublot & according to
Section 00745.16 (b)-1-c
Average 5 tests per Sublot or Min.
1/Day, See Section 00745.49 (b)-2
Develop Rolling Pattern See Specs.
Provide Suppliers Certificate of Compliance
See Section 00745.16 (b)-1-a
A Sublot equals 1000 Mg or 1000 Tons
2050
Mixture Acceptance - HMAC Without RAP (Dense Graded) SECTION 00745 - HOT MIXED ASPHALT CONCRETE (CONTINUED)
2050GV &
2050
Production Control Testing
Review Documentation for Acceptance
Review Documentation
Production Control Testing
Production Control Testing
Production Control Testing
Production Control Testing
Page 35
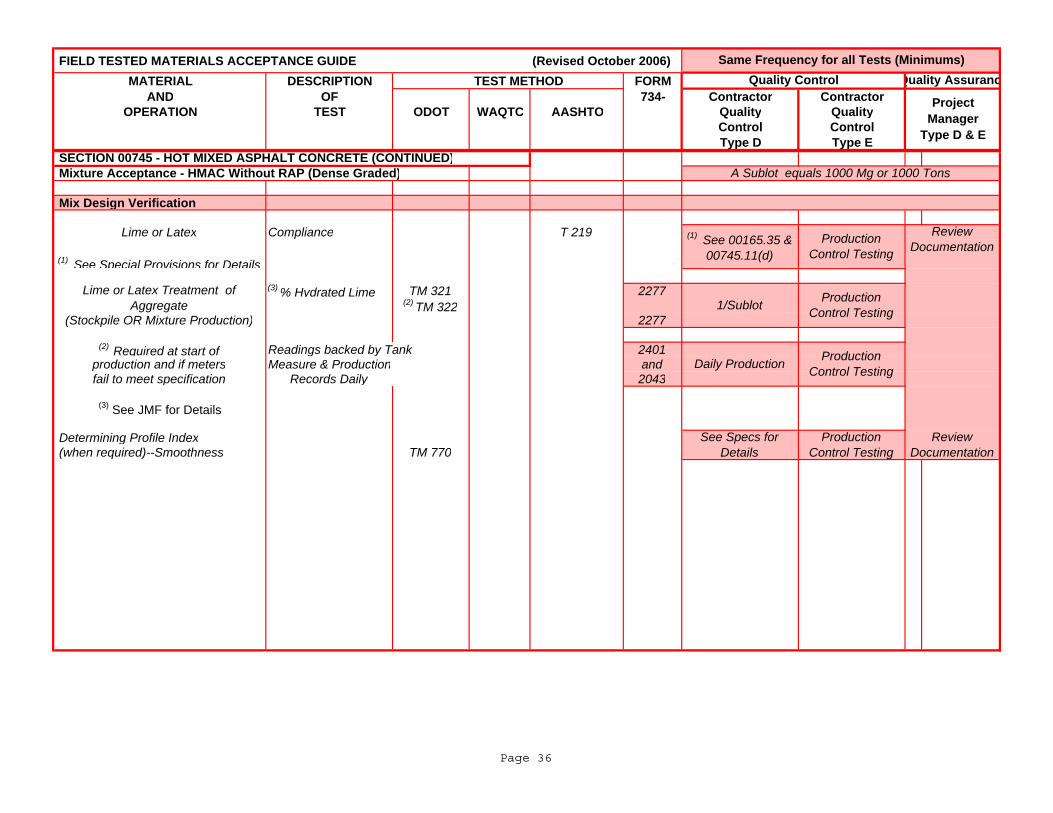
FIELD TESTED MATERIALS ACCEPTANCE GUIDE (Revised October 2006)MATERIAL DESCRIPTION TEST METHOD FORM
AND OF 734- Contractor ContractorOPERATION TEST ODOT WAQTC AASHTO Quality Quality
Control ControlType D Type E
Same Frequency for all Tests (Minimums)Quality Control Quality Assuranc
Project Manager
Type D & E
Mix Design Verification
Lime or Latex Compliance T 219
(1) See Special Provisions for Details
(3) % Hydrated Lime TM 321 2277(2) TM 322
(Stockpile OR Mixture Production) 2277
(2) Required at start of Readings backed by Tank 2401production and if meters Measure & Production andfail to meet specification Records Daily 2043
(3) See JMF for Details
Determining Profile Index (when required)--Smoothness TM 770
Daily Production
Review Documentation
See Specs for Details
A Sublot equals 1000 Mg or 1000 Tons SECTION 00745 - HOT MIXED ASPHALT CONCRETE (CONTINUED)
(1) See 00165.35 & 00745.11(d)
Lime or Latex Treatment of Aggregate 1/Sublot
Production Control Testing
Production Control Testing
Production Control Testing
Production Control Testing
Mixture Acceptance - HMAC Without RAP (Dense Graded)
Review Documentation
Page 36
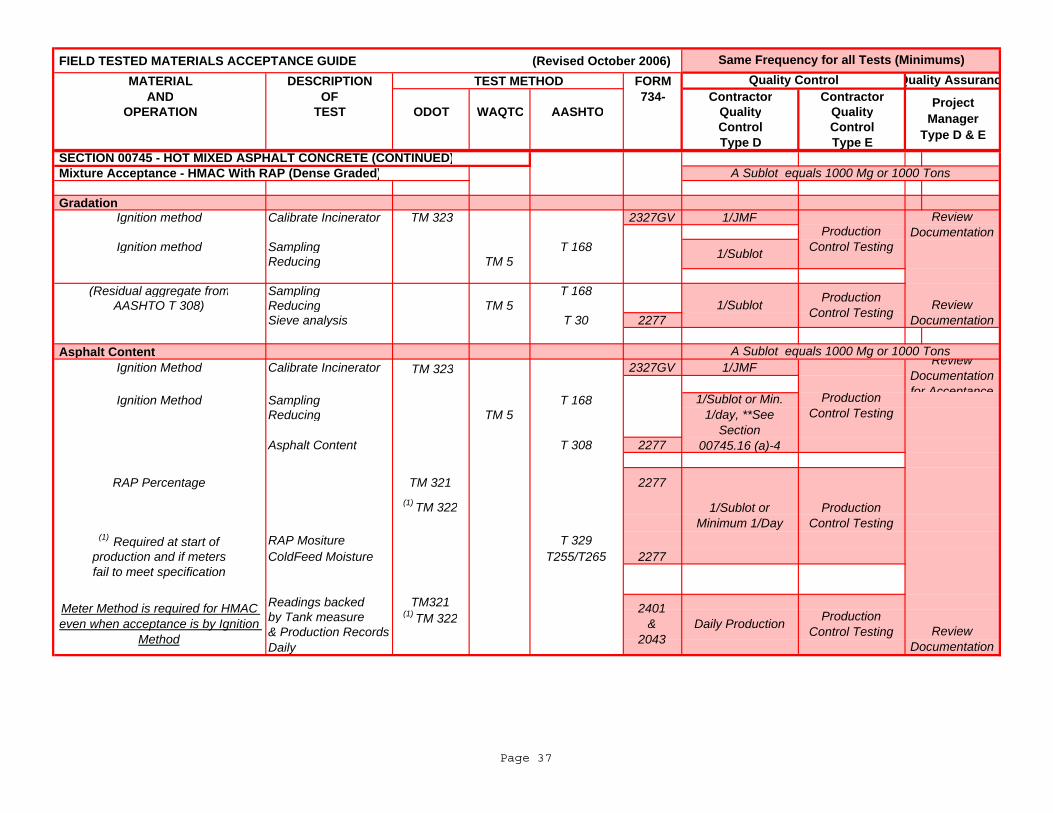
FIELD TESTED MATERIALS ACCEPTANCE GUIDE (Revised October 2006)MATERIAL DESCRIPTION TEST METHOD FORM
AND OF 734- Contractor ContractorOPERATION TEST ODOT WAQTC AASHTO Quality Quality
Control ControlType D Type E
Same Frequency for all Tests (Minimums)Quality Control Quality Assuranc
Project Manager
Type D & E
GradationIgnition method Calibrate Incinerator TM 323 2327GV 1/JMF
Ignition method Sampling T 168Reducing TM 5
(Residual aggregate from Sampling T 168AASHTO T 308) Reducing TM 5
Sieve analysis T 30 2277
Asphalt ContentIgnition Method Calibrate Incinerator TM 323 2327GV 1/JMF
Ignition Method Sampling T 168Reducing TM 5
Asphalt Content T 308 2277
RAP Percentage TM 321 2277(1) TM 322
(1) Required at start of RAP Mositure T 329production and if meters ColdFeed Moisture T255/T265 2277fail to meet specification
Readings backed TM321by Tank measure (1) TM 322& Production RecordsDaily
1/Sublot
1/Sublot
1/Sublot or Minimum 1/Day
2401 &
2043Daily Production
Meter Method is required for HMAC even when acceptance is by Ignition
Method
SECTION 00745 - HOT MIXED ASPHALT CONCRETE (CONTINUED)A Sublot equals 1000 Mg or 1000 Tons Mixture Acceptance - HMAC With RAP (Dense Graded)
A Sublot equals 1000 Mg or 1000 Tons
1/Sublot or Min. 1/day, **See
Section 00745.16 (a)-4
Review Documentation
Production Control Testing
Production Control Testing
Production Control Testing
Review Documentation
Review Documentation
Production Control Testing
Production Control Testing
Review Documentation for Acceptance
Page 37
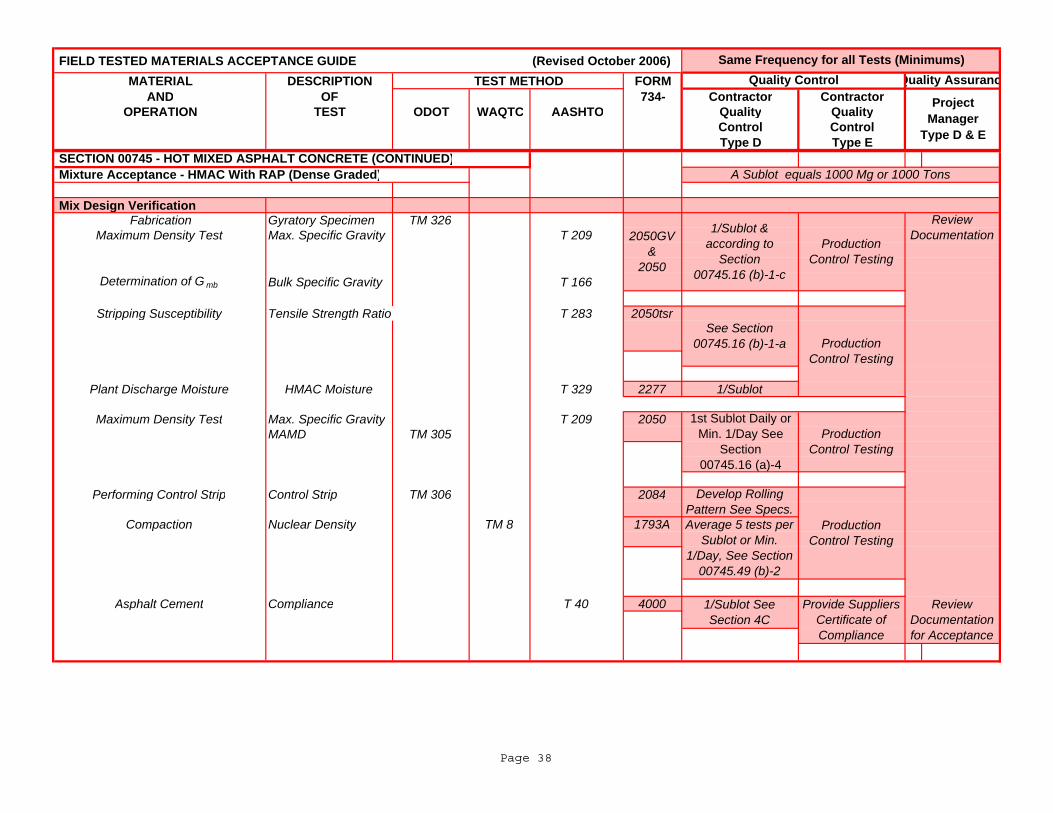
FIELD TESTED MATERIALS ACCEPTANCE GUIDE (Revised October 2006)MATERIAL DESCRIPTION TEST METHOD FORM
AND OF 734- Contractor ContractorOPERATION TEST ODOT WAQTC AASHTO Quality Quality
Control ControlType D Type E
Same Frequency for all Tests (Minimums)Quality Control Quality Assuranc
Project Manager
Type D & E
Mix Design Verification Fabrication Gyratory Specimen TM 326
Maximum Density Test Max. Specific Gravity T 209
Determination of G mb Bulk Specific Gravity T 166
Stripping Susceptibility Tensile Strength Ratio T 283 2050tsr
Plant Discharge Moisture HMAC Moisture T 329 2277 1/Sublot
Maximum Density Test Max. Specific Gravity T 209 2050MAMD TM 305
Performing Control Strip Control Strip TM 306 2084
Compaction Nuclear Density TM 8 1793A
Asphalt Cement Compliance T 40 4000
Mixture Acceptance - HMAC With RAP (Dense Graded)
2050GV &
2050
SECTION 00745 - HOT MIXED ASPHALT CONCRETE (CONTINUED)
1/Sublot & according to
Section 00745.16 (b)-1-c
Develop Rolling Pattern See Specs.
A Sublot equals 1000 Mg or 1000 Tons
Production Control Testing
Production Control Testing
Average 5 tests per Sublot or Min.
1/Day, See Section 00745.49 (b)-2
1/Sublot See Section 4C
See Section 00745.16 (b)-1-a
1st Sublot Daily or Min. 1/Day See
Section 00745.16 (a)-4
Review Documentation for Acceptance
Production Control Testing
Review Documentation
Production Control Testing
Provide Suppliers Certificate of Compliance
Page 38
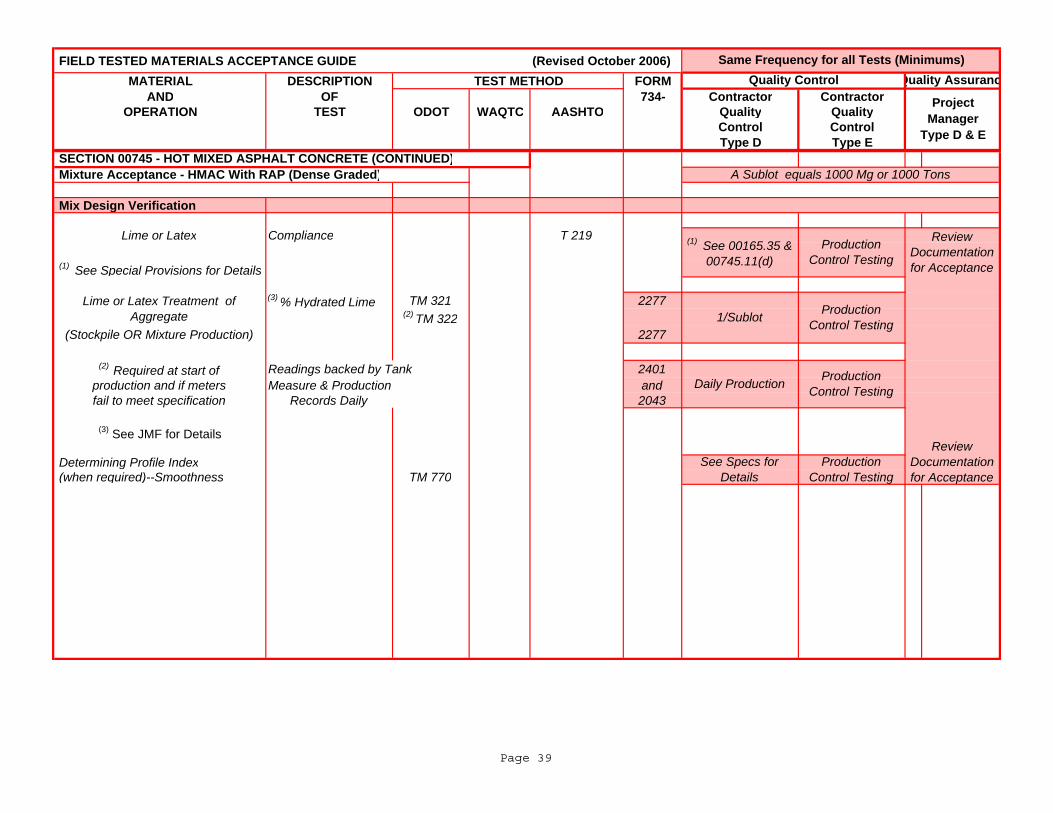
FIELD TESTED MATERIALS ACCEPTANCE GUIDE (Revised October 2006)MATERIAL DESCRIPTION TEST METHOD FORM
AND OF 734- Contractor ContractorOPERATION TEST ODOT WAQTC AASHTO Quality Quality
Control ControlType D Type E
Same Frequency for all Tests (Minimums)Quality Control Quality Assuranc
Project Manager
Type D & E
Mix Design Verification
Lime or Latex Compliance T 219
(1) See Special Provisions for Details
(3) % Hydrated Lime TM 321 2277(2) TM 322
(Stockpile OR Mixture Production) 2277
(2) Required at start of Readings backed by Tank 2401production and if meters Measure & Production andfail to meet specification Records Daily 2043
(3) See JMF for Details
Determining Profile Index (when required)--Smoothness TM 770
Lime or Latex Treatment of Aggregate 1/Sublot
SECTION 00745 - HOT MIXED ASPHALT CONCRETE (CONTINUED)A Sublot equals 1000 Mg or 1000 Tons Mixture Acceptance - HMAC With RAP (Dense Graded)
(1) See 00165.35 & 00745.11(d)
Production Control Testing
Daily Production
See Specs for Details
Production Control Testing
Review Documentation for Acceptance
Review Documentation for Acceptance
Production
Control Testing
Production Control Testing
Page 39
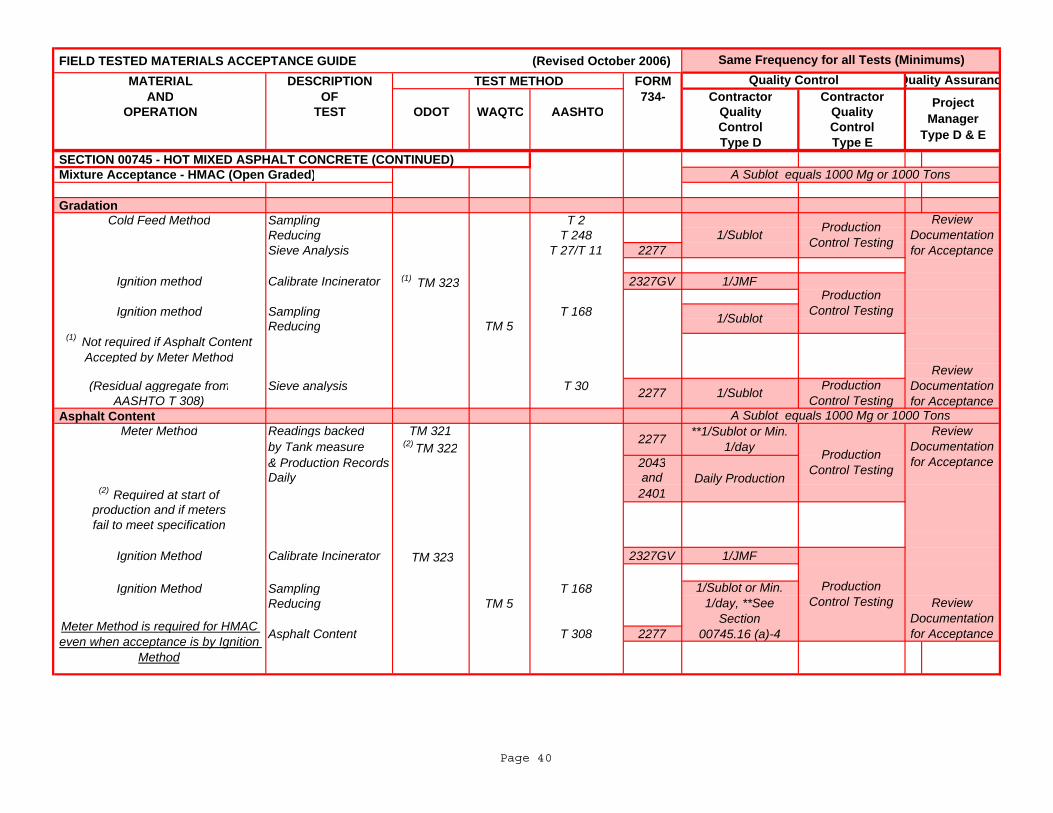
FIELD TESTED MATERIALS ACCEPTANCE GUIDE (Revised October 2006)MATERIAL DESCRIPTION TEST METHOD FORM
AND OF 734- Contractor ContractorOPERATION TEST ODOT WAQTC AASHTO Quality Quality
Control ControlType D Type E
Same Frequency for all Tests (Minimums)Quality Control Quality Assuranc
Project Manager
Type D & E
SECTION 00745 - HOT MIXED ASPHALT CONCRETE (CONTINUED)
Gradation Cold Feed Method Sampling T 2
Reducing T 248Sieve Analysis T 27/T 11 2277
Ignition method Calibrate Incinerator (1) TM 323 2327GV 1/JMF
Ignition method Sampling T 168Reducing TM 5
(Residual aggregate from Sieve analysis T 30
AASHTO T 308) Asphalt Content
Meter Method Readings backed TM 321 by Tank measure (2) TM 322 & Production Records 2043 Daily and
(2) Required at start of 2401production and if metersfail to meet specification
Ignition Method Calibrate Incinerator TM 323 2327GV 1/JMF
Ignition Method Sampling T 168Reducing TM 5
Asphalt Content T 308 2277Meter Method is required for HMAC
even when acceptance is by Ignition Method
1/Sublot
1/Sublot
**1/Sublot or Min. 1/day
(1) Not required if Asphalt Content Accepted by Meter Method
Production Control Testing
Mixture Acceptance - HMAC (Open Graded)
2277
2277
Daily Production
1/Sublot or Min. 1/day, **See
Section 00745.16 (a)-4
A Sublot equals 1000 Mg or 1000 Tons
1/Sublot
A Sublot equals 1000 Mg or 1000 TonsReview
Documentation for Acceptance
Review Documentation for Acceptance
Production Control Testing
Review Documentation for Acceptance
Review Documentation for Acceptance
Production Control Testing
Production Control Testing
Production Control Testing
Page 40
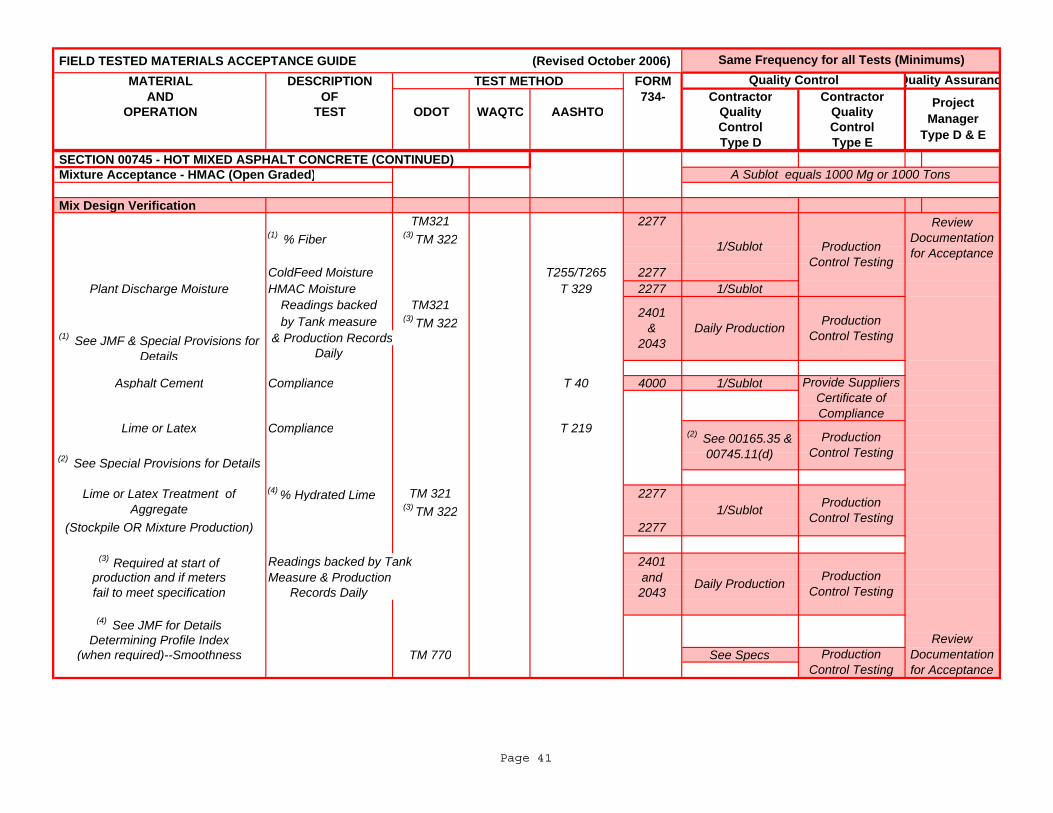
FIELD TESTED MATERIALS ACCEPTANCE GUIDE (Revised October 2006)MATERIAL DESCRIPTION TEST METHOD FORM
AND OF 734- Contractor ContractorOPERATION TEST ODOT WAQTC AASHTO Quality Quality
Control ControlType D Type E
Same Frequency for all Tests (Minimums)Quality Control Quality Assuranc
Project Manager
Type D & E
SECTION 00745 - HOT MIXED ASPHALT CONCRETE (CONTINUED)
Mix Design VerificationTM321 2277
(1) % Fiber (3) TM 322
ColdFeed Moisture T255/T265 2277Plant Discharge Moisture HMAC Moisture T 329 2277 1/Sublot
Readings backed TM321by Tank measure (3) TM 322
& Production RecordsDaily
Asphalt Cement Compliance T 40 4000 1/Sublot
Lime or Latex Compliance T 219
(2) See Special Provisions for Details
(4) % Hydrated Lime TM 321 2277(3) TM 322
(Stockpile OR Mixture Production) 2277
(3) Required at start of Readings backed by Tank 2401production and if meters Measure & Production andfail to meet specification Records Daily 2043
(4) See JMF for DetailsDetermining Profile Index
(when required)--Smoothness TM 770 See Specs
Production Control Testing
Mixture Acceptance - HMAC (Open Graded) A Sublot equals 1000 Mg or 1000 Tons
1/Sublot
Review Documentation for Acceptance
Daily Production
Production Control Testing
Production Control Testing
Production Control Testing
Production Control Testing
Lime or Latex Treatment of Aggregate 1/Sublot
2401 &
2043Daily Production
(1) See JMF & Special Provisions for Details
(2) See 00165.35 & 00745.11(d)
Review Documentation for Acceptance
Production Control Testing
Provide Suppliers Certificate of Compliance
Page 41
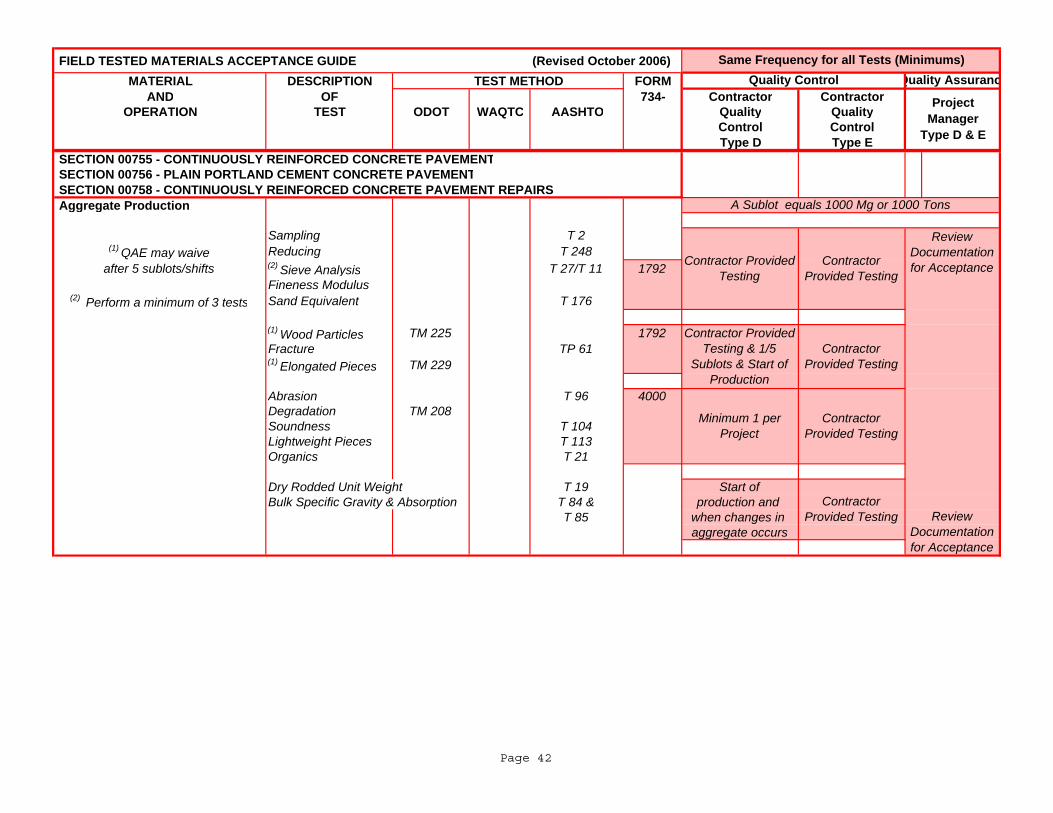
FIELD TESTED MATERIALS ACCEPTANCE GUIDE (Revised October 2006)MATERIAL DESCRIPTION TEST METHOD FORM
AND OF 734- Contractor ContractorOPERATION TEST ODOT WAQTC AASHTO Quality Quality
Control ControlType D Type E
Same Frequency for all Tests (Minimums)Quality Control Quality Assuranc
Project Manager
Type D & E
SECTION 00755 - CONTINUOUSLY REINFORCED CONCRETE PAVEMENT SECTION 00756 - PLAIN PORTLAND CEMENT CONCRETE PAVEMENT SECTION 00758 - CONTINUOUSLY REINFORCED CONCRETE PAVEMENT REPAIRS Aggregate Production
Sampling T 2(1) QAE may waive Reducing T 248
after 5 sublots/shifts (2) Sieve Analysis T 27/T 11 1792Fineness Modulus
(2) Perform a minimum of 3 tests Sand Equivalent T 176
(1) Wood Particles TM 225 1792Fracture TP 61(1) Elongated Pieces TM 229
Abrasion T 96 4000Degradation TM 208Soundness T 104Lightweight Pieces T 113Organics T 21
Dry Rodded Unit Weight T 19 Start ofBulk Specific Gravity & Absorption T 84 & production and
T 85 when changes in aggregate occurs
Contractor Provided Testing
A Sublot equals 1000 Mg or 1000 Tons
Contractor Provided Testing
Contractor Provided Testing & 1/5
Sublots & Start of Production
Contractor Provided Testing
Minimum 1 per Project
Contractor Provided Testing
Review Documentation for Acceptance
Review Documentation for Acceptance
Contractor Provided Testing
Page 42
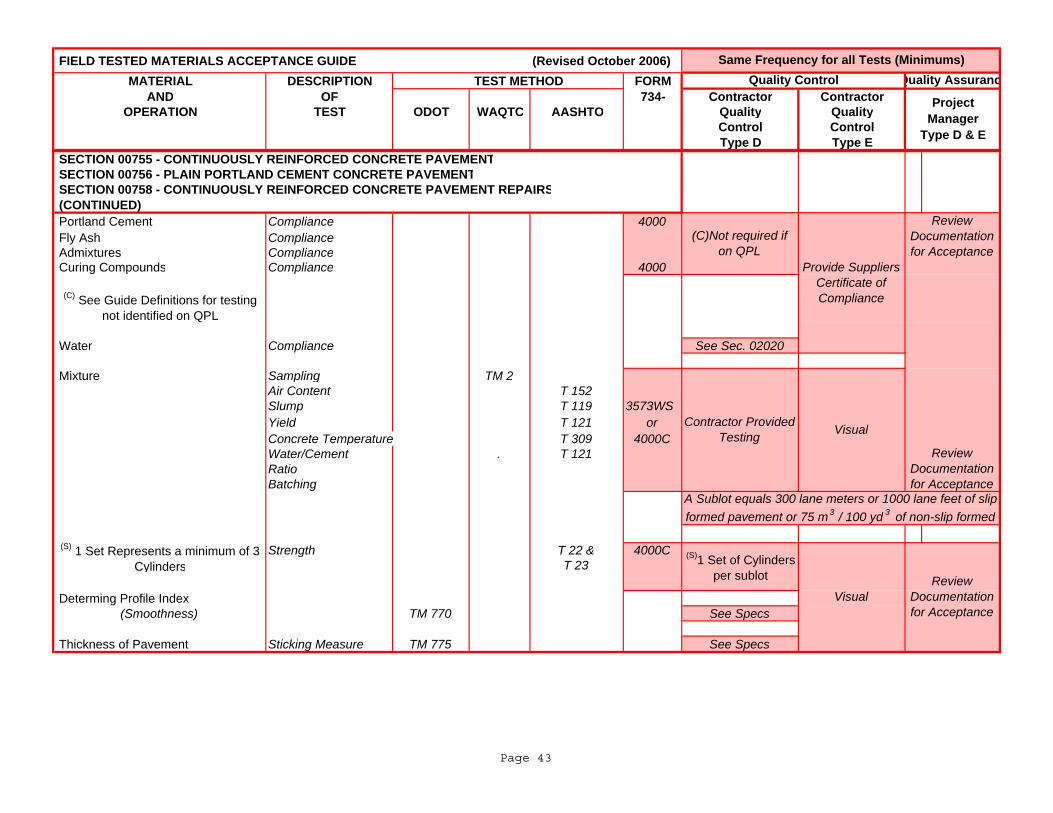
FIELD TESTED MATERIALS ACCEPTANCE GUIDE (Revised October 2006)MATERIAL DESCRIPTION TEST METHOD FORM
AND OF 734- Contractor ContractorOPERATION TEST ODOT WAQTC AASHTO Quality Quality
Control ControlType D Type E
Same Frequency for all Tests (Minimums)Quality Control Quality Assuranc
Project Manager
Type D & E
SECTION 00755 - CONTINUOUSLY REINFORCED CONCRETE PAVEMENT SECTION 00756 - PLAIN PORTLAND CEMENT CONCRETE PAVEMENT SECTION 00758 - CONTINUOUSLY REINFORCED CONCRETE PAVEMENT REPAIRS (CONTINUED) Portland Cement Compliance 4000 Fly Ash Compliance Admixtures Compliance Curing Compounds Compliance 4000
(C) See Guide Definitions for testing not identified on QPL
Water Compliance See Sec. 02020
Mixture Sampling TM 2Air Content T 152 Slump T 119 3573WSYield T 121 orConcrete Temperature T 309 4000CWater/Cement . T 121Ratio Batching
Strength T 22 & 4000CT 23
Determing Profile Index(Smoothness) TM 770 See Specs
Thickness of Pavement Sticking Measure TM 775 See Specs
Review Documentation for Acceptance
Visual
A Sublot equals 300 lane meters or 1000 lane feet of slip formed pavement or 75 m3 / 100 yd 3 of non-slip formed
Review Documentation for Acceptance
(S) 1 Set Represents a minimum of 3 Cylinders
(S)1 Set of Cylinders per sublot
Contractor Provided Testing
(C)Not required if on QPL
Review Documentation for Acceptance
Visual
Provide Suppliers Certificate of Compliance
Page 43