Oregon Department of Fish and Wildlife Washington ...
55
2008 JOINT STAFF REPORT: STOCK STATUS AND FISHERIES FOR FALL CHINOOK SALMON, COHO SALMON, CHUM SALMON, SUMMER STEELHEAD, AND WHITE STURGEON Joint Columbia River Management Staff Oregon Department of Fish and Wildlife Washington Department of Fish and Wildlife July 14, 2008
Transcript of Oregon Department of Fish and Wildlife Washington ...
2008 JOINT STAFF REPORT: STOCK STATUS AND FISHERIES FOR
FALL CHINOOK SALMON, COHO SALMON, CHUM SALMON, SUMMER STEELHEAD,
AND WHITE STURGEON
Joint Columbia River Management Staff
Oregon Department of Fish and Wildlife
Washington Department of Fish and Wildlife
July 14, 2008
2
TABLE OF CONTENTS INTRODUCTION ...........................................................................................................................5 THE COMPACT .............................................................................................................................5 SEASONS CONSIDERED .............................................................................................................5 STOCKS CONSIDERED................................................................................................................6
Fall Chinook ............................................................................................................................... 6 2007 Returns ........................................................................................................................... 7 2008 Forecast ......................................................................................................................... 8
Summer Steelhead....................................................................................................................... 9 2007 Returns ......................................................................................................................... 10 2008 Forecast ....................................................................................................................... 10
Coho.......................................................................................................................................... 11 2007 Returns ......................................................................................................................... 12 2008 Forecast ....................................................................................................................... 12
Chum Salmon............................................................................................................................ 12 REVIEW OF MAINSTEM FISHERIES AND SELECT AREA FISHERIES.............................13
Non-Indian Commercial Fisheries ........................................................................................... 13 2007 Early Fall Commercial Mainstem Fisheries................................................................ 14 2007 Late Fall Commercial Mainstem Fisheries ................................................................. 14
Non-Indian Recreational Fisheries........................................................................................... 14 2007 Buoy 10 Sport Fishery ................................................................................................. 15 2007 Lower Columbia Mainstem Sport Fishery................................................................... 15 2007 Columbia Mainstem Recreational Fisheries above Bonneville Dam.......................... 15
Select Area Fisheries ................................................................................................................ 16 2007 Select Area Fisheries ................................................................................................... 17
Treaty Indian Fisheries............................................................................................................. 18 2007 Treaty Indian Fall Fisheries ........................................................................................ 18
2007 Fishery Impacts................................................................................................................ 19 2008 FALL SEASON FISHERY EXPECTATIONS ...................................................................19
Endangered Species Act........................................................................................................ 19 2008 Management Guidelines .............................................................................................. 20
Non-Indian Fisheries ................................................................................................................ 20 2008 Non-Indian Columbia River Fall Fishery Chinook Allocation Agreement ..................... 21 Youngs Bay Select Area Fisheries ............................................................................................ 22 Other Select Area Fisheries ...................................................................................................... 22 Treaty Indian Commercial Fisheries ........................................................................................ 22
3
LIST OF TABLES Table 1 Summary of 2007 Actual and Current 2008 Forecasts of Adult Salmon and Steelhead
Returns to the Columbia River......................................................................................23
Table 2. Stock Accountability of Adult Fall Chinook Returning to the Columbia River, 1980-2007. ..............................................................................................................................23
Table 3. Predicted and Actual Returns (Thousands) of Columbia River Adult Fall Chinook, 2002-2007......................................................................................................................24
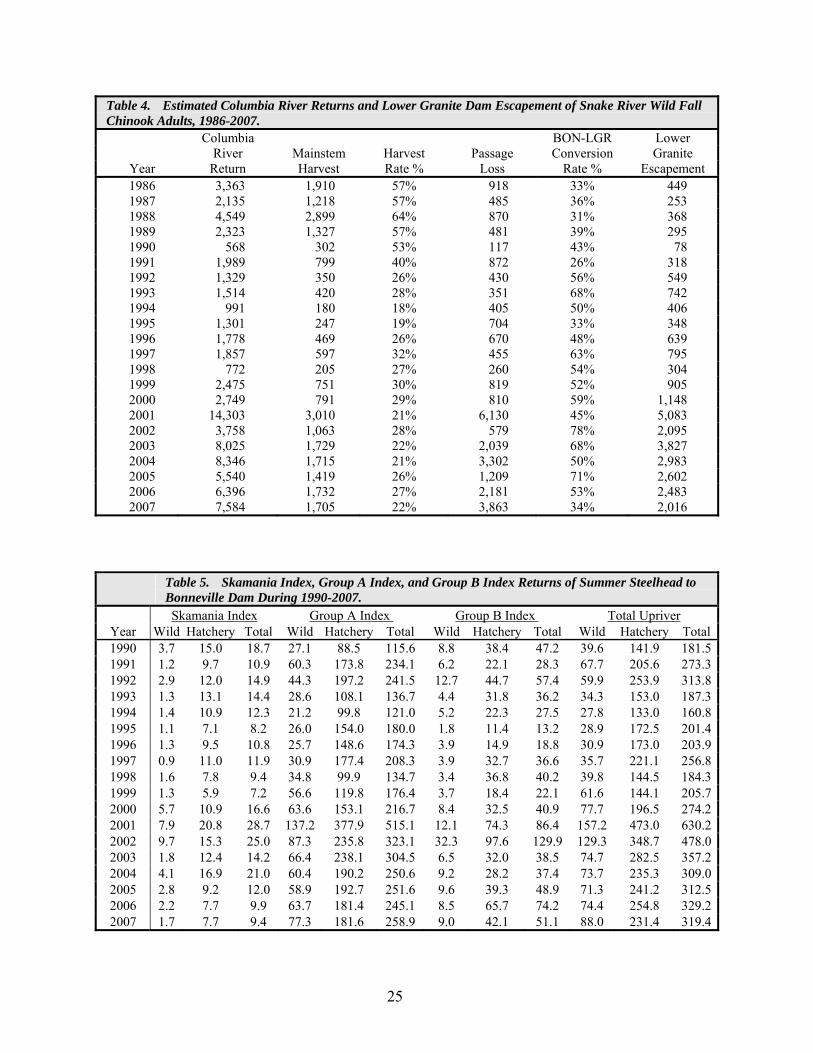
Table 4. Estimated Columbia River Returns and Lower Granite Dam Escapement of Snake River Wild Fall Chinook Adults, 1986-2007. ...............................................................25
Table 5. Skamania Index, Group A Index, and Group B Index Returns of Summer Steelhead to Bonneville Dam During 1990-2007. .............................................................................25
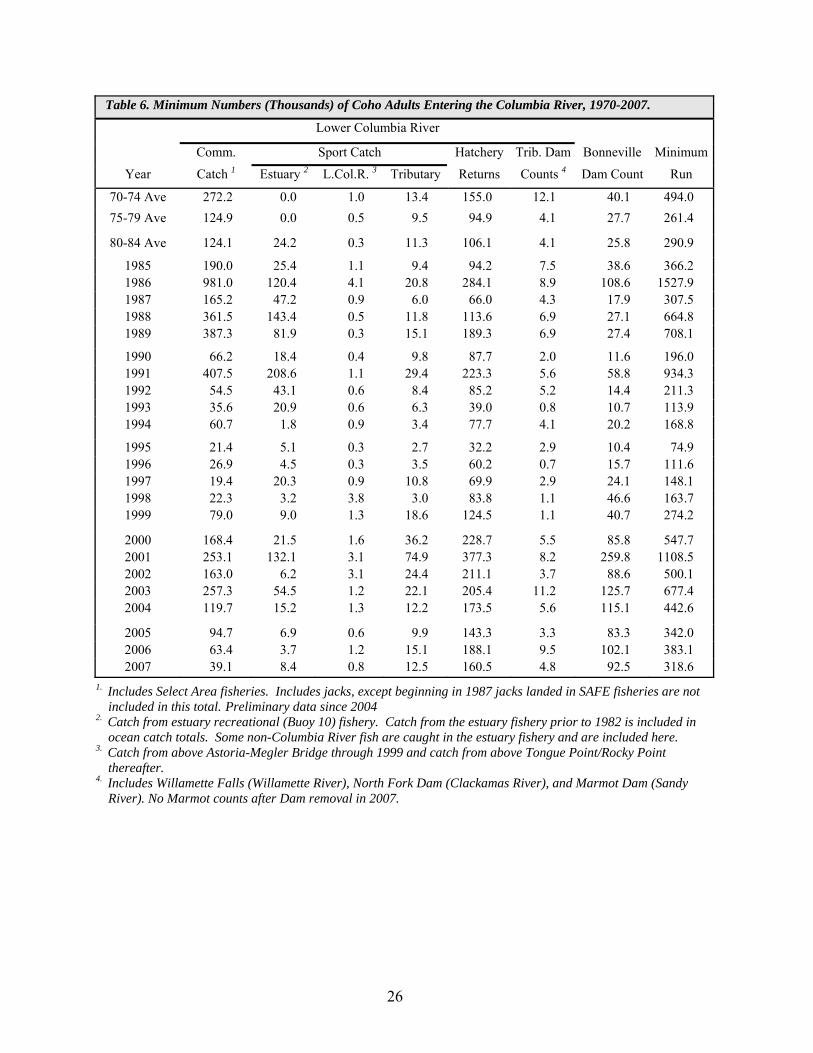
Table 6. Minimum Numbers (Thousands) of Coho Adults Entering the Columbia River, 1970-2007. ..............................................................................................................................26
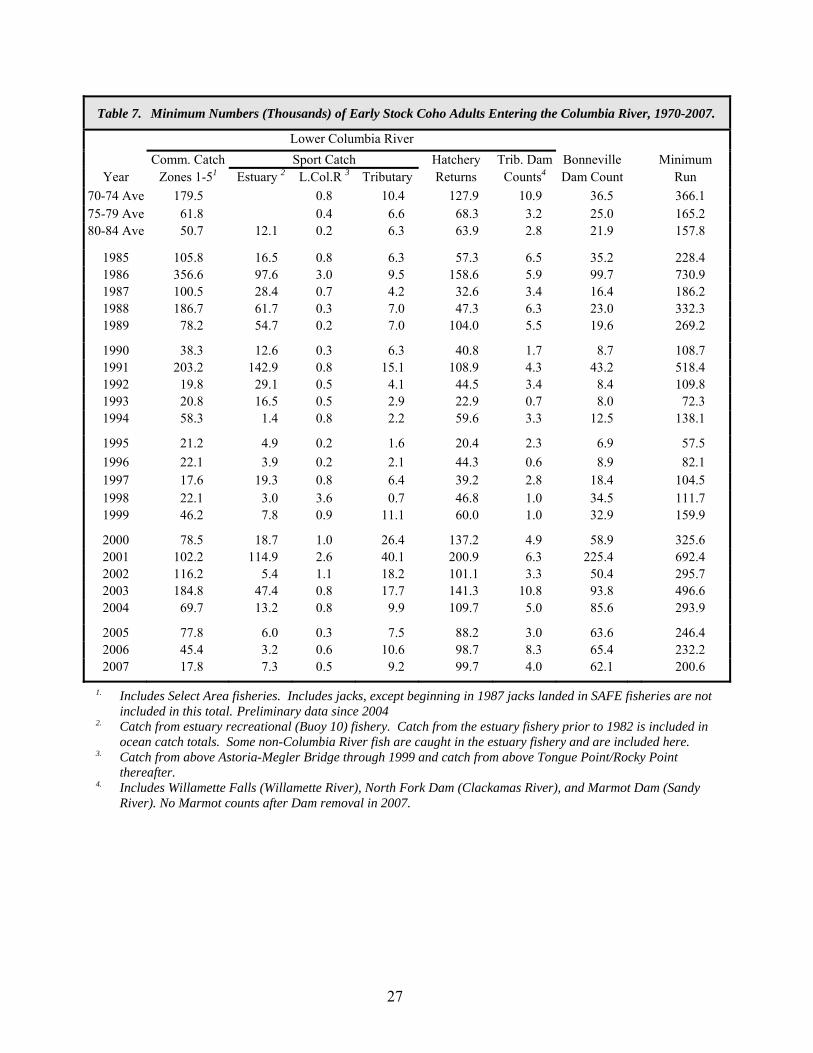
Table 7. Minimum Numbers (Thousands) of Early Stock Coho Adults Entering the Columbia River, 1970-2007...........................................................................................................27
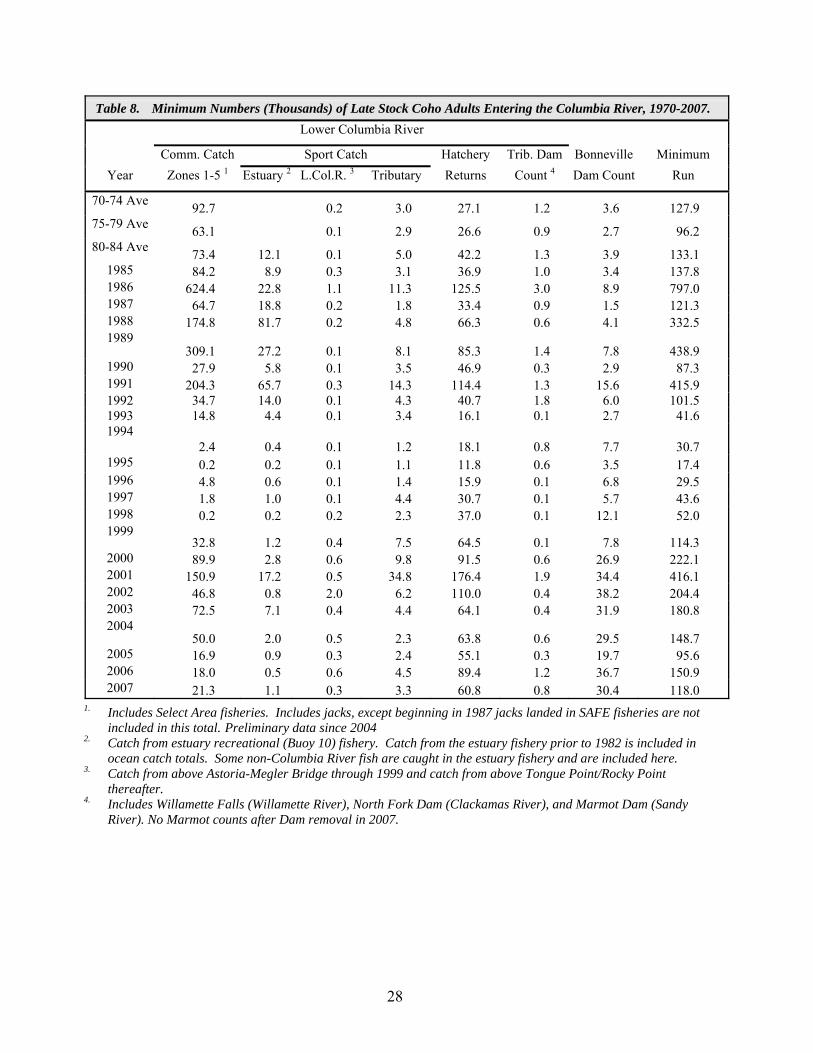
Table 8. Minimum Numbers (Thousands) of Late Stock Coho Adults Entering the Columbia River, 1970-2007...........................................................................................................28
Table 9. Escapement Index Values for Chum in Washington Lower Columbia River Tributaries and for Coho in Oregon Columbia River Tributaries Downstream of the Sandy River, 1950-2007......................................................................................................................29
Table 10. Federally-Listed Species Found in Columbia River Fishery Management Areas .......30
Table 11. Sturgeon Catch Guidelines in the Zone 6 Management Area, 2001-2008....................30
Table 12. Fall Lower Columbia River and Zone 6 Mainstem Commercial Seasons, 2007. ........31
Table 13. Fall Select Area Commercial Fishing Seasons, 2007....................................................32
Table 14. Salmon, Steelhead, and Sturgeon Catch in 2007 Fall Fisheries (Includes adults and jacks). ............................................................................................................................33
Table 15. Non-Indian Fall Commercial Fishing Seasons, 2007....................................................34
Table 16. Catch Composition of Fall Zone 6 Treaty Indian Fisheries, 2007 (adults and jacks). .42
Table 17. Stock Composition of Adult Fall Chinook Landed in Mainstem Columbia River Fisheries, 2007. .............................................................................................................43
Table 18. 2007 Fall Fishery Impact Summary .............................................................................43
Table 19. Fishing Area and Spring Creek Sanctuary Restrictions in Effect During Treaty Indian Fall Commercial Set Gillnet Seasons, 1988-2007.........................................................44
Table 20. Number of Adult Chinook, Coho, Steelhead, and Sturgeon Landed During Treaty Indian Fall Seasons (Aug-Nov) Above Bonneville Dam, 1970-2007...........................45
Table 21. Wild Upriver Summer Steelhead Catch in Fall Season Fisheries, 1985-2007..............47
Table 22. Annual Sturgeon Catches in Zone 6 Reservoirs above Bonneville Dam, 1995-2008. 47
4
Table 23. Time, Area, and Gear Restrictions in Effect for Early Fall Non-Indian Commercial Mainstem Fishing Seasons, 1990-2007.........................................................................48
Table 24. Number of Adult Chinook, Chum, Coho, Steelhead, and Sturgeon Landed During Early Fall Mainstem Columbia River Commercial Seasons Below Bonneville Dam, 1970-2007......................................................................................................................49
Table 25. Closed Fishing Areas During Late Fall Mainstem Non-Indian Fishing Seasons, 2002-2007. ..............................................................................................................................50
Table 26. Number of Adult Chinook, Coho, Steelhead, and Sturgeon Landed during Late Fall Mainstem Columbia River (mid-Sep to mid-Nov) and Select Area Commercial Seasons below Bonneville Dam, 1970-2007.................................................................51
Table 27. Lower Columbia River White and Green Sturgeon Catch, 1991-2007. .......................52
Table 28. Select Area Fall Commercial Fisheries Landings, 2000-2007. ....................................53
Table 29. Combined Oregon and Washington Angler Effort and Catch in the Buoy 10 Recreational Fishery, 1982-2007 . ...............................................................................54
Table 30. Fall Salmon Angler Trips and Catch on the Lower Columbia River August-October, 1980-2007......................................................................................................................55
LIST OF FIGURES
Figure 1. Columbia River Commercial Fishing Zones...................................................................6 Figure 2. Average Run Timing of Fall Chinook over Bonneville Dam, applied to the 2008
Forecast. ..........................................................................................................................7 Figure 3. Major Columbia River Fall Chinook Stock Components and General Destination .......9 Figure 4. Average Run Timing of Summer Steelhead over Bonneville Dam, applied to the 2008
Forecast. ........................................................................................................................10
5
INTRODUCTION
This report describes fall fisheries in the mainstem Columbia River and includes a summary of 2007 fall fisheries, 2008 management guidelines, and expectations for 2008 fall fish runs and fisheries. This report is part of an annual series of reports produced by the Joint Columbia River Management Staff of the Oregon Department of Fish and Wildlife (ODFW) and Washington Department of Fish and Wildlife (WDFW) prior to each major Columbia River Compact hearing. The first Columbia River Compact hearing of the 2008 fall management period will begin at 10 AM, Tuesday July 22 via teleconference. Members of the U.S. v Oregon Technical Advisory Committee (TAC) have reviewed this report.
THE COMPACT
The Columbia River Compact is charged by congressional and statutory authority to adopt seasons and rules for Columbia River commercial fisheries. In recent years, the Compact has consisted of the Oregon and Washington agency directors, or their delegates, acting on behalf of the Oregon Fish and Wildlife Commission (OFWC) and the Washington Fish and Wildlife Commission (WFWC). In addition, the Columbia River treaty tribes have authority to regulate treaty Indian fisheries.
When addressing commercial seasons for Columbia River fisheries, the Compact must consider the effect of the commercial fishery on escapement, treaty rights, and the impact on species listed under the Endangered Species Act (ESA). Working together under the Compact, the states have the responsibility to address the allocation of limited resources between recreational, commercial and treaty Indian fishers. This responsibility has become increasingly demanding in recent years. The states maintain a conservative management approach when considering Columbia River fisheries that will affect species listed under the ESA.
SEASONS CONSIDERED
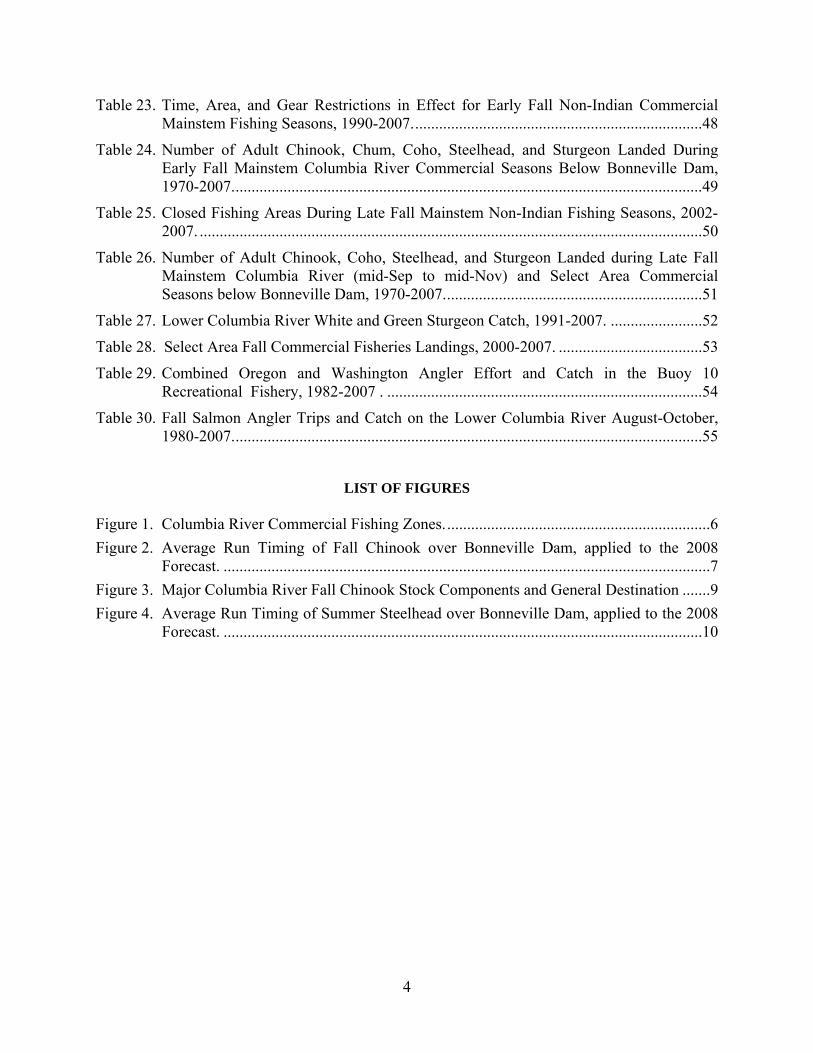
At the July 22 hearing, the Compact will consider the following non-Indian commercial fishing seasons: 1) mainstem early fall season (early August) fishing periods in Zones 1-5 (Figure 1); and 2) fall salmon seasons in Select Area fishing sites. The Compact may also consider treaty Indian fisheries in Zone 6 (Figure 1). Additionally, a Compact hearing will likely be scheduled to consider non-Indian commercial fisheries during mid to late August and/or treaty Indian commercial fisheries in the mainstem Columbia River. Future hearings will be scheduled throughout the fall management period as additional information on fish runs and ongoing fisheries become available.
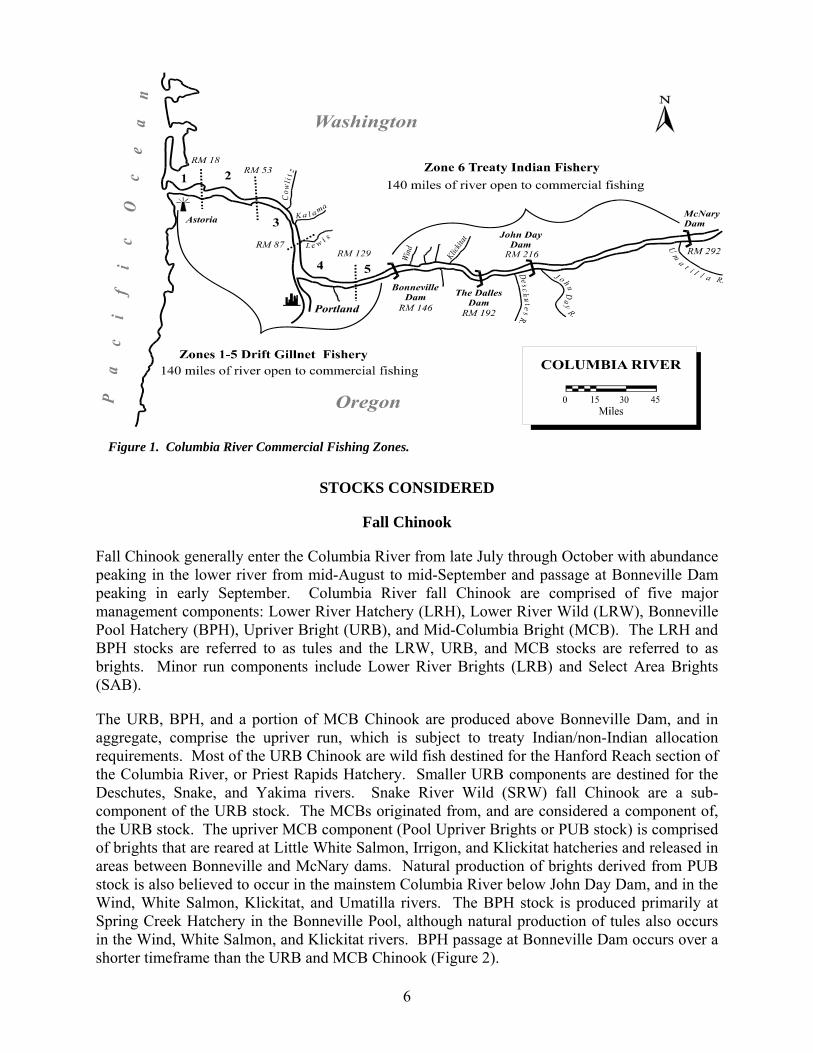
Figure 1. Columbia River Commercial Fishing Zones.
STOCKS CONSIDERED
Fall Chinook
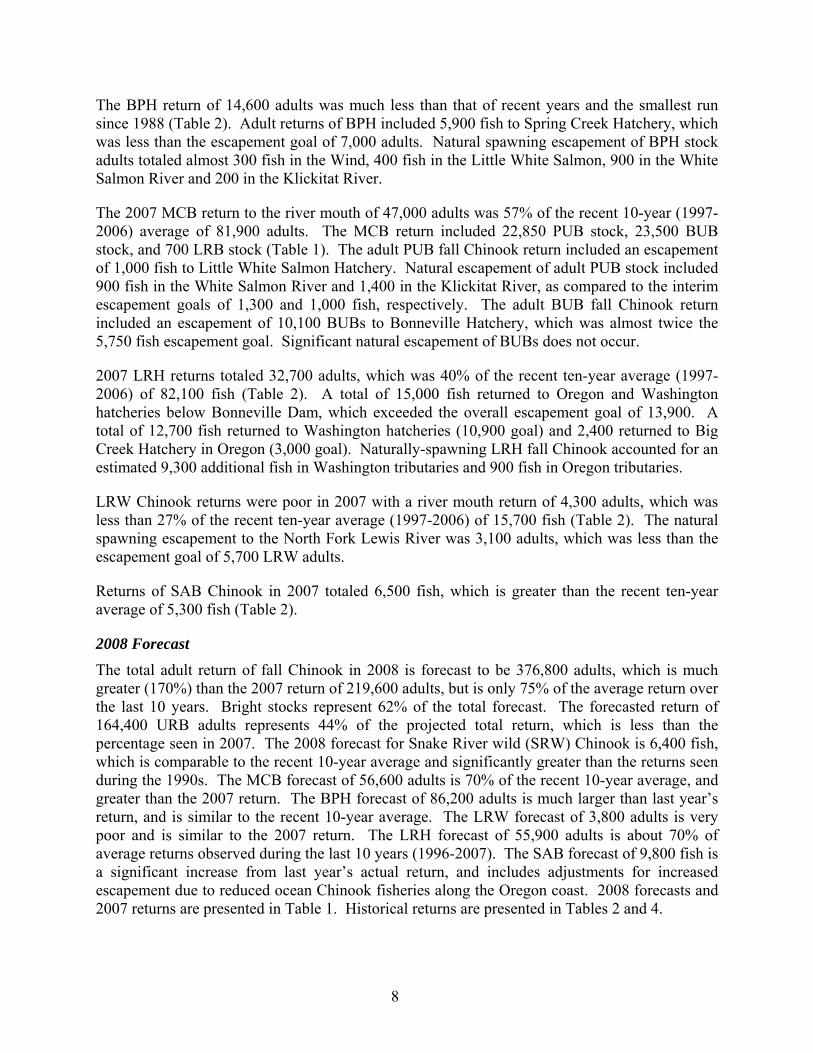
Fall Chinook generally enter the Columbia River from late July through October with abundance peaking in the lower river from mid-August to mid-September and passage at Bonneville Dam peaking in early September. Columbia River fall Chinook are comprised of five major management components: Lower River Hatchery (LRH), Lower River Wild (LRW), Bonneville Pool Hatchery (BPH), Upriver Bright (URB), and Mid-Columbia Bright (MCB). The LRH and BPH stocks are referred to as tules and the LRW, URB, and MCB stocks are referred to as brights. Minor run components include Lower River Brights (LRB) and Select Area Brights (SAB).
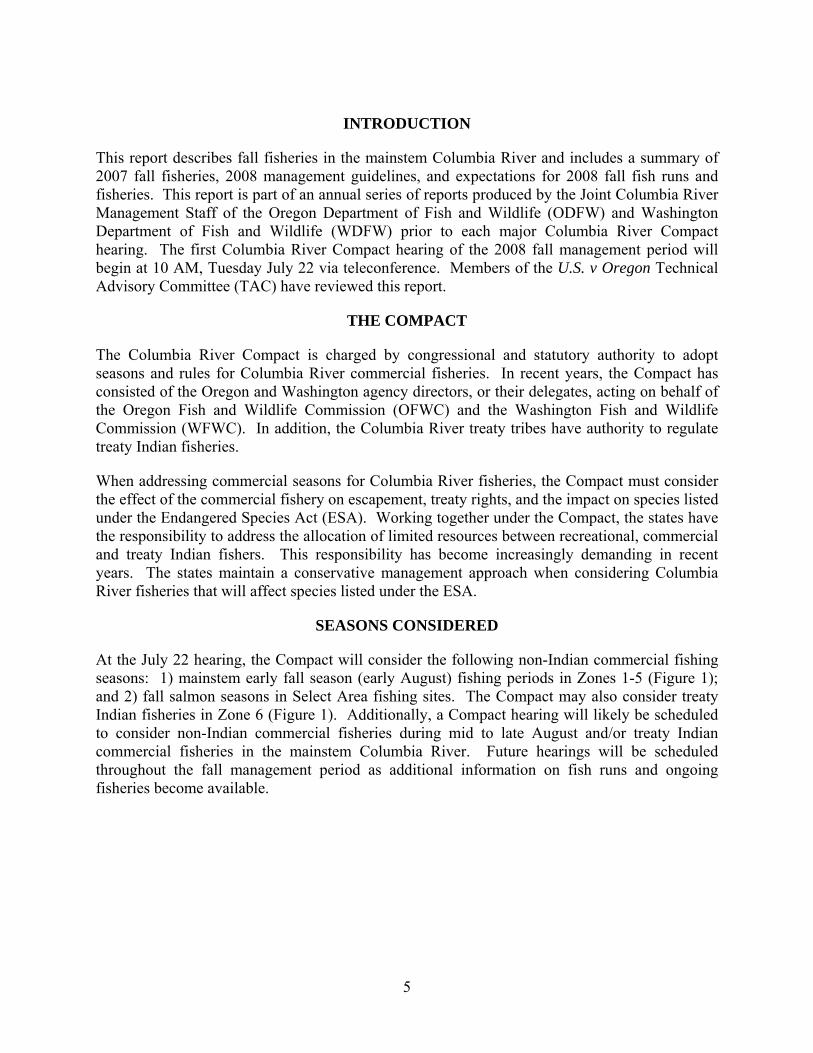
The URB, BPH, and a portion of MCB Chinook are produced above Bonneville Dam, and in aggregate, comprise the upriver run, which is subject to treaty Indian/non-Indian allocation requirements. Most of the URB Chinook are wild fish destined for the Hanford Reach section of the Columbia River, or Priest Rapids Hatchery. Smaller URB components are destined for the Deschutes, Snake, and Yakima rivers. Snake River Wild (SRW) fall Chinook are a sub-component of the URB stock. The MCBs originated from, and are considered a component of, the URB stock. The upriver MCB component (Pool Upriver Brights or PUB stock) is comprised of brights that are reared at Little White Salmon, Irrigon, and Klickitat hatcheries and released in areas between Bonneville and McNary dams. Natural production of brights derived from PUB stock is also believed to occur in the mainstem Columbia River below John Day Dam, and in the Wind, White Salmon, Klickitat, and Umatilla rivers. The BPH stock is produced primarily at Spring Creek Hatchery in the Bonneville Pool, although natural production of tules also occurs in the Wind, White Salmon, and Klickitat rivers. BPH passage at Bonneville Dam occurs over a shorter timeframe than the URB and MCB Chinook (Figure 2).
6
-
1,000
2,000
3,000
4,000
5,000
6,000
7,000
8,000
1-Aug
8-Aug
15-Aug
22-Aug
29-Aug
5-Sep
12-Sep
19-Sep
26-Sep
3-Oct
10-Oct
17-Oct
24-Oct
31-Oct
Brights Tules
Figure 2. Average Run Timing of Fall Chinook over Bonneville Dam, applied to the 2008 Forecast.
The lower river run is comprised of LRH, LRW, MCB (BUB and LRB components), and SAB stocks, which are all produced below Bonneville Dam. The LRH stock is currently produced from hatchery facilities (five in Washington and one in Oregon) while the LRW stock is naturally produced primarily in the Lewis River system, with smaller components also present in the Cowlitz and Sandy rivers. Some natural production of LRH stock likely occurs in many tributaries below Bonneville Dam, including the Coweeman, East Fork Lewis, and Grays rivers. The MCB production below Bonneville Dam (Bonneville Upriver Brights or BUB stock) occurs at Bonneville Hatchery in Oregon. The LRBs are a self-sustaining natural stock that spawns in the mainstem Columbia approximately three miles downstream from Bonneville Dam. The LRB stock is closely related to URBs and is thought to have originated from MCB or URB stock. Lower River Brights were originally classified as BUBs, but beginning in 1998 this stock was considered a unique subcomponent of the MCB stock. SABs are a hatchery stock that originated from Rogue River fall Chinook stock egg transfers during 1982-1986. In 2006, production of this stock was transferred from ODFW’s Klaskanine Hatchery to the South Fork Klaskanine Hatchery operated by the Clatsop County Fisheries (CCF) Project (formerly Clatsop County Economic Development Council’s (CEDC) Fisheries Project), with additional releases from net pens located in Youngs Bay.
2007 Returns
The total 2007 Columbia River fall Chinook adult return of 219,600 adults was 43% of the recent 10-year average (1997-2006) of 510,600 adults, and was the third lowest return since 1985 (Tables 2 and 3). The 2007 URB return of 114,500 adults was 48% of the recent 10-year average (237,100) and accounted for 52% of the total river mouth return (Table 2). The 2007 McNary Dam count of 58,740 adults surpassed the management goal of 43,500 fish, although only about 14,000 adult fish spawned on the Hanford Reach. The 2007 Deschutes River Basin return was the lowest since 1999, with a return of 7,600 adults to the Deschutes River. Estimated returns of SRW fall Chinook to the Columbia River in 2007 totaled 7,600 fish, which was 140% of the recent 10-year average (1997-2006) of 5,400 adults, and was five times greater than the average return of the 1990s (Table 4).
7
8
The BPH return of 14,600 adults was much less than that of recent years and the smallest run since 1988 (Table 2). Adult returns of BPH included 5,900 fish to Spring Creek Hatchery, which was less than the escapement goal of 7,000 adults. Natural spawning escapement of BPH stock adults totaled almost 300 fish in the Wind, 400 fish in the Little White Salmon, 900 in the White Salmon River and 200 in the Klickitat River.
The 2007 MCB return to the river mouth of 47,000 adults was 57% of the recent 10-year (1997-2006) average of 81,900 adults. The MCB return included 22,850 PUB stock, 23,500 BUB stock, and 700 LRB stock (Table 1). The adult PUB fall Chinook return included an escapement of 1,000 fish to Little White Salmon Hatchery. Natural escapement of adult PUB stock included 900 fish in the White Salmon River and 1,400 in the Klickitat River, as compared to the interim escapement goals of 1,300 and 1,000 fish, respectively. The adult BUB fall Chinook return included an escapement of 10,100 BUBs to Bonneville Hatchery, which was almost twice the 5,750 fish escapement goal. Significant natural escapement of BUBs does not occur.
2007 LRH returns totaled 32,700 adults, which was 40% of the recent ten-year average (1997-2006) of 82,100 fish (Table 2). A total of 15,000 fish returned to Oregon and Washington hatcheries below Bonneville Dam, which exceeded the overall escapement goal of 13,900. A total of 12,700 fish returned to Washington hatcheries (10,900 goal) and 2,400 returned to Big Creek Hatchery in Oregon (3,000 goal). Naturally-spawning LRH fall Chinook accounted for an estimated 9,300 additional fish in Washington tributaries and 900 fish in Oregon tributaries.
LRW Chinook returns were poor in 2007 with a river mouth return of 4,300 adults, which was less than 27% of the recent ten-year average (1997-2006) of 15,700 fish (Table 2). The natural spawning escapement to the North Fork Lewis River was 3,100 adults, which was less than the escapement goal of 5,700 LRW adults.
Returns of SAB Chinook in 2007 totaled 6,500 fish, which is greater than the recent ten-year average of 5,300 fish (Table 2).
2008 Forecast The total adult return of fall Chinook in 2008 is forecast to be 376,800 adults, which is much greater (170%) than the 2007 return of 219,600 adults, but is only 75% of the average return over the last 10 years. Bright stocks represent 62% of the total forecast. The forecasted return of 164,400 URB adults represents 44% of the projected total return, which is less than the percentage seen in 2007. The 2008 forecast for Snake River wild (SRW) Chinook is 6,400 fish, which is comparable to the recent 10-year average and significantly greater than the returns seen during the 1990s. The MCB forecast of 56,600 adults is 70% of the recent 10-year average, and greater than the 2007 return. The BPH forecast of 86,200 adults is much larger than last year’s return, and is similar to the recent 10-year average. The LRW forecast of 3,800 adults is very poor and is similar to the 2007 return. The LRH forecast of 55,900 adults is about 70% of average returns observed during the last 10 years (1996-2007). The SAB forecast of 9,800 fish is a significant increase from last year’s actual return, and includes adjustments for increased escapement due to reduced ocean Chinook fisheries along the Oregon coast. 2008 forecasts and 2007 returns are presented in Table 1. Historical returns are presented in Tables 2 and 4.
Lower River Hatchery
Lower River Wild
Up River Brights
Bonneville Pool Hatchery
Mid - Columbia Brights
Washington
Oregon
SnakeRiver
TheDalles
JohnDay McNary
Bonnevill
River Mouth
Lower River Hatchery
Lower River Wild
Up River Brights
Bonneville Pool Hatchery
Mid - Columbia Brights
Washington
Oregon
SnakeRiver
SnakeRiver
TheDallesThe
DallesJohnDayJohnDay McNary
Bonnevill
River Mouth
Figure 3. Major Columbia River Fall Chinook Stock Components and General Destination
Summer Steelhead
The Columbia River summer steelhead run is made up of populations originating from both lower river and upper river tributaries. Summer steelhead enter the Columbia River primarily from April through October each year, with most of the run entering from late June to mid-September. The lower Columbia River (LCR) component is primarily hatchery produced, derived from Skamania stock steelhead and tends to be earlier timed than the upriver stocks. Peak timing of the lower river component is in May and June. The Skamania stock was successfully introduced into numerous streams below Bonneville Dam, and a few streams above, including the Wind and Hood rivers. Summer steelhead caught on the mainstem Columbia River during May and June of each year are classified and counted as lower river stock (destined for areas below Bonneville Dam).
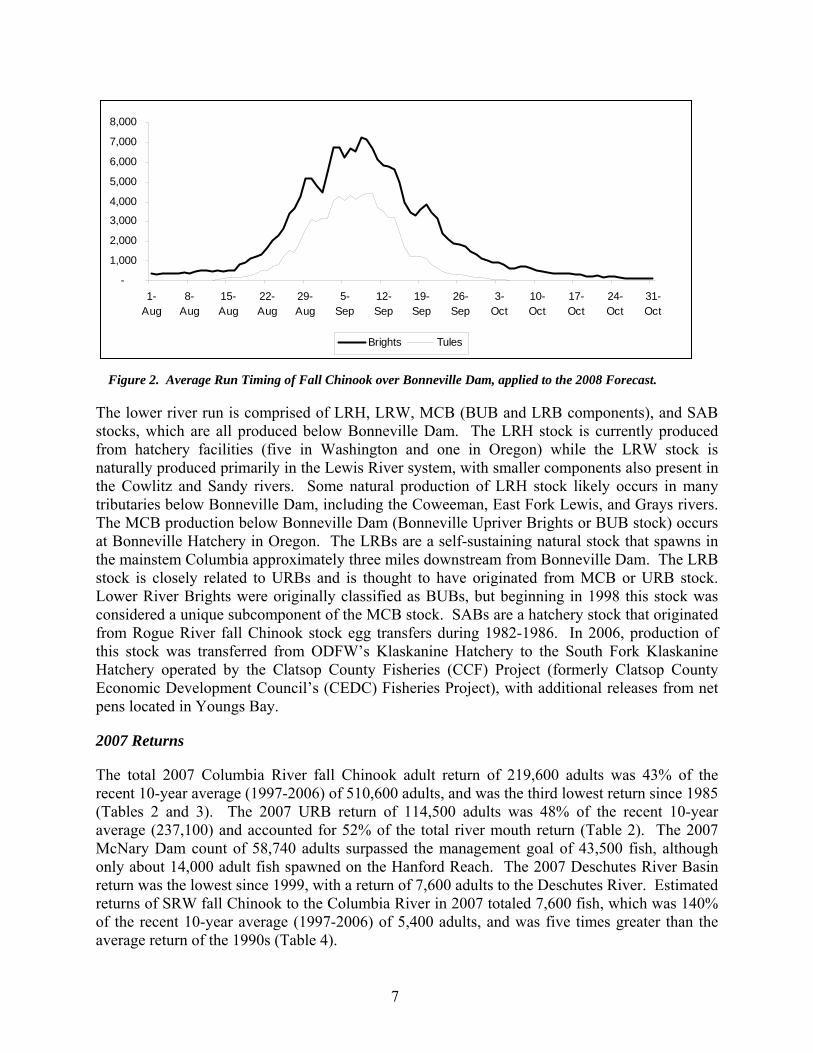
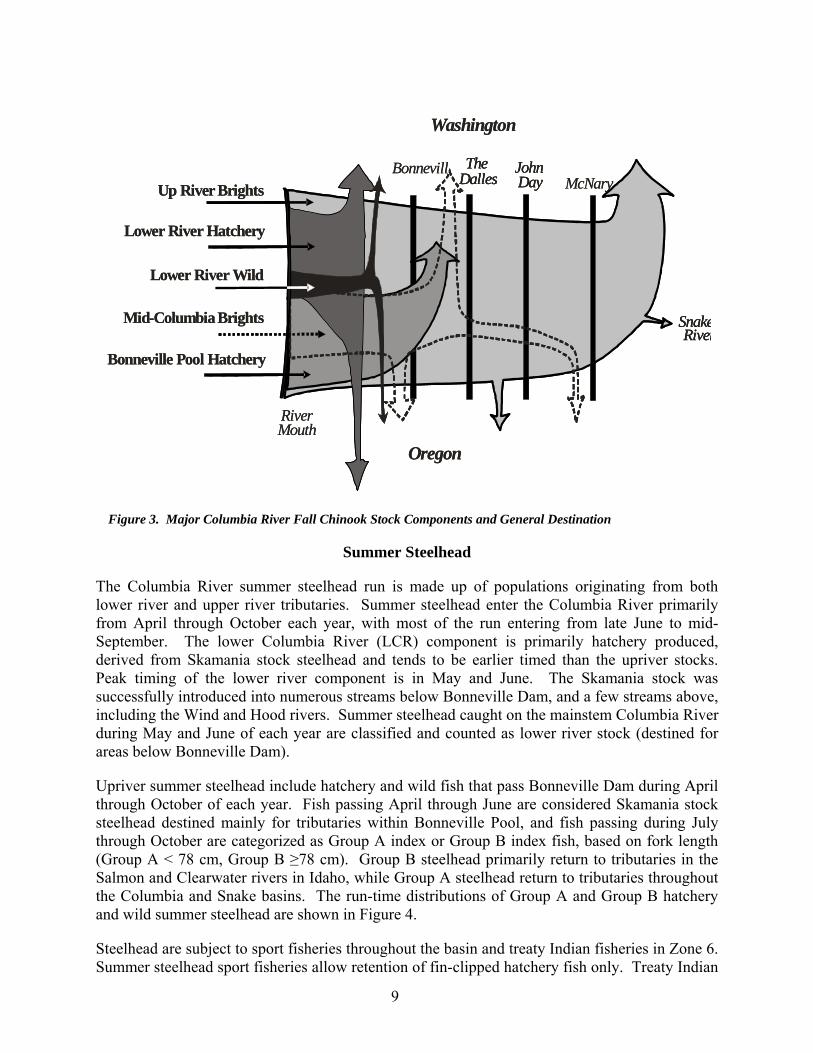
Upriver summer steelhead include hatchery and wild fish that pass Bonneville Dam during April through October of each year. Fish passing April through June are considered Skamania stock steelhead destined mainly for tributaries within Bonneville Pool, and fish passing during July through October are categorized as Group A index or Group B index fish, based on fork length (Group A < 78 cm, Group B ≥78 cm). Group B steelhead primarily return to tributaries in the Salmon and Clearwater rivers in Idaho, while Group A steelhead return to tributaries throughout the Columbia and Snake basins. The run-time distributions of Group A and Group B hatchery and wild summer steelhead are shown in Figure 4.
Steelhead are subject to sport fisheries throughout the basin and treaty Indian fisheries in Zone 6. Summer steelhead sport fisheries allow retention of fin-clipped hatchery fish only. Treaty Indian
9
steelhead harvest is non mark-selective, and occurs in platform and gillnet fisheries. A majority of the treaty catch occurs during the fall gillnet fishery concurrent with landings of fall Chinook. In recent years the tribes have reduced catch of wild steelhead during fall treaty Indian gillnet seasons. Commercial harvest of steelhead by non-Indians has been prohibited since 1975 and time, area, and gear restrictions are implemented to minimize incidental handle of steelhead.
2007 Returns
The 2007 return of upriver summer steelhead to Bonneville Dam was 319,400 fish, including 9,400 Skamania index fish, 258,900 Group A index fish, and 51,100 Group B index fish (Tables 1 and 5). The 2007 return was 96% of the 10-year average (1998-2006) and continued the stable trend of upriver steelhead passage. Wild fish returns include estimates of 1,700 upriver Skamania steelhead, 77,300 Group A index, and 9,000 Group B index steelhead. The 2007 total return of wild upriver summer steelhead was greater (111%) than the recent 10-year average of 79,500 fish. Overall, summer steelhead populations are stable or improving, with the exception of the upriver Skamania return, which has experienced a slight decline over the past few years. When compared to average returns of the 1990s, the 2007 returns are 1½ to 2 times greater for Group A and Group B index summer steelhead (Table 5).
0
1000
2000
3000
4000
5000
6000
1-Jul
8-Jul
15-Jul
22-Jul
29-Jul
5-Aug
12-Aug
19-Aug
26-Aug
2-Sep
9-Sep
16-Sep
23-Sep
30-Sep
7-Oct
14-Oct
21-Oct
28-Oct
All GroupsWild AHatchery AWild BHatchery B
Wild B
Figure 4. Average Run Timing of Summer Steelhead over Bonneville Dam, applied to the 2008 Forecast.
2008 Forecast
The 2008 forecast for the summer steelhead return to Bonneville Dam is 326,400 upriver fish, including 10,400 Skamania index fish, 266,300 Group A index fish, and 49,700 Group B index fish. The forecasts for wild fish include 2,200 Skamania stock, 69,400 Group A index, and 8,500 Group B index steelhead. Overall, the forecasted return is similar (96%) to the recent 10-year average of 340,000 fish. Group A and Group B index steelhead forecasts continue the stable trend, but the Skamania stock is forecast to be only 68% of the 10-year year average, and the wild Skamania component, is forecasted to be only 57% of the 10-year average (Tables 1 and 5).
10
11
Coho
Lower Columbia River hatchery coho return primarily to Oregon and Washington hatcheries downstream from Bonneville Dam, although substantial hatchery production also occurs above Bonneville Dam. In recent years, approximately one-third of the releases have occurred above Bonneville Dam. Since 1970, adult (hatchery and wild) coho returns to the Columbia River have ranged from a low of 74,900 in 1995 to a high of 1,527,900 in 1986 (Table 6).
The Columbia River hatchery coho return includes both early and late segments. Early stock coho enter the Columbia River from mid-August to early October with peak entry occurring in early September. In the ocean, early stock coho tend to remain near the Oregon and southern Washington coasts and most migrate southward from the Columbia River. Early coho are also referred to as Type S, referring to their southerly ocean migration from the mouth of the Columbia River. Since 1970, adult returns of Columbia River early stock coho have ranged from a low of 43,400 in 1983 (El Niño year) to a high of 730,800 in 1986 (Table 7). In 2007, releases of early coho above Bonneville Dam comprised 39% of the total early stock releases.
Late stock coho enter the Columbia River from mid-September through December with peak entry occurring in mid-October. In the ocean, late stock coho tend to migrate northward from the Columbia River along the Washington coast and Vancouver Island. Late stock coho are referred to as Type N, referring to their northerly ocean migration from the mouth of the Columbia River. Hatchery production of late stock coho has expanded since 1975, and is primarily from Washington hatcheries below Bonneville Dam. In 2007, releases of late stock coho above Bonneville Dam comprised 40% of the total late stock releases. Since 1970, Columbia River returns of late stock coho have ranged from a low of 17,400 in 1995 to a high of 797,000 in 1986 (Table 8).
Differences in migration timing are known to exist between early and late stocks. Within each stock group, timing differences may also exist between hatchery and natural-origin coho, and between fish of the same stock from different tributaries. The states use this information to develop fishing scenarios that maximize opportunities to harvest hatchery fish while limiting impacts to naturally produced fish. Much more information is needed regarding the timing differences between hatchery and naturally produced fish, and between individual stocks of naturally produced fish in order to further improve the management of these fisheries.
Historic natural coho production areas in Washington included the Grays, Elochoman, Cowlitz, Toutle, Kalama, Lewis, and Washougal watersheds. Stream surveys conducted in Washington from 1945-1979 in the Toutle and lower Cowlitz River tributaries showed a steady decline of naturally spawning coho. Smolt traps are currently being used in several Washington tributaries to estimate natural production. During 2001-2007, smolt production from these areas ranged from 231,600 to 890,600 fish.
In Oregon, Columbia River tributaries with historic natural coho production included the Lewis and Clark, Youngs, Klaskanine, Clatskanie, Clackamas, and Sandy rivers plus Big, Gnat, Beaver, Milton, and Scappoose creeks. Annual spawning fish survey counts conducted in Oregon lower Columbia River tributaries from December through February since 1949 suggested that wild coho may have been extirpated from Oregon's lower Columbia tributaries, excluding the Clackamas and Sandy rivers. Intensive surveys conducted during 1990-1992 and counts of 0.0-0.4 fish per mile during 1993-1999 supported this conclusion; however, increased numbers of
12
coho have been observed in lower Columbia River tributaries since 1999 which suggests that some remnant Oregon populations may persist in the lower Columbia River Basin
Historical natural coho production areas above Bonneville Dam include the Spokane, Yakima, Wenatchee, Entiat, Methow, and Snake Rivers. The majority of coho presently passing Bonneville Dam are from the U.S. v. Oregon Management Plan mandated hatchery releases of lower river coho stocks in the Yakima, Umatilla, Klickitat, Wenatchee, Methow, and Clearwater rivers. These releases outside the Klickitat are primarily for restoring naturally producing coho to appropriate habitats above Bonneville Dam, most recently in the Snake, Yakama, Methow, and Entiat rivers. Counts of coho destined for areas above Bonneville Dam have represented an increasing percentage of the total return in response to increased releases above Bonneville Dam.
2007 Returns
The 2007 Columbia River coho return of 318,600 adults was comprised of 200,600 early stock fish and 118,000 late stock fish. The adult return was 69% of the prior 10-year average (Table 6); however, early and late coho aggregate and individual hatchery escapement goals were achieved. The Bonneville Dam count of 92,500 coho adults was slightly less than the recent 10-year average of 97,200, but well above the 25,300 average count of the 1990s.
2008 Forecast
The 2008 forecast for the coho return to the Columbia River mouth, (following expected ocean fisheries), is 164,800 adults, which includes 96,000 early stock and 68,800 late stock. The forecast is 35% of the most recent 10-year average of 475,800 fish, and is more comparable to the average run size during the 1990s (239,700 fish). The forecast for early stock coho is 31% of the recent 10-year average of 305,500 fish, and the late stock forecast is 40% of the recent 10-year average of 170,300 fish (Tables 1, 6, 7, and 8). Approximately 44,600 coho are expected to pass Bonneville Dam. The early stock hatchery escapement goal of 15,200, and the late stock hatchery goal of 7,200 are expected to be achieved.
Chum Salmon
Chum salmon return to the Columbia River from mid-October through mid-December with spawning occurring from late October through early January. Chum salmon returns are primarily from natural production. Primary production areas for chum salmon include the Grays River in Washington, smaller tributaries just downstream from Bonneville Dam, and the mainstem Columbia River in specific locations from the I-205 Bridge upstream to Bonneville Dam. Currently there are two hatchery supplementation programs releasing fed fry. These hatchery releases contribute to the spawning populations in the Grays River and in the mainstem Columbia and tributaries near Bonneville Dam. Washington index areas have been surveyed annually since 1950 and specific areas of the mainstem Columbia River have been surveyed annually since 1998. Beginning in 2000, survey areas were expanded to include non-index streams in Washington and Oregon entering the Columbia River downstream of Bonneville Dam. In some years significant numbers of chum salmon have been observed in some non-index Washington areas. Until recently, few chum have been observed in Oregon tributaries; however, survey effort has been light compared to Washington streams. In 2006, 189 chum salmon returned to Big Creek Hatchery compared to an average of six fish per year during 1990-2005; however, the 2007 return was only one adult chum. Chum salmon returns (fish-per-mile) to
Washington index areas decreased dramatically in 2007 (Table 9). A few adult chum salmon are caught incidentally in the late fall non-Indian commercial fishery with landings typically occurring after mid-October. Chum landings from commercial mainstem and Select Area fisheries are typically less than 10 fish during the fall season (Table 14).
0
2,500
5,000
7,500
10,000
12,500
15,000
Jan Feb Mar Apr May Jun Jul Aug Sep Oct Nov Dec
Chinook Steelhead Sockeye Coho
Spring Chinook
Sockeye
Steelhead
Fall Chinook
Coho
Wint er / S pr ing Management P er iod Fa l l Management P er iod
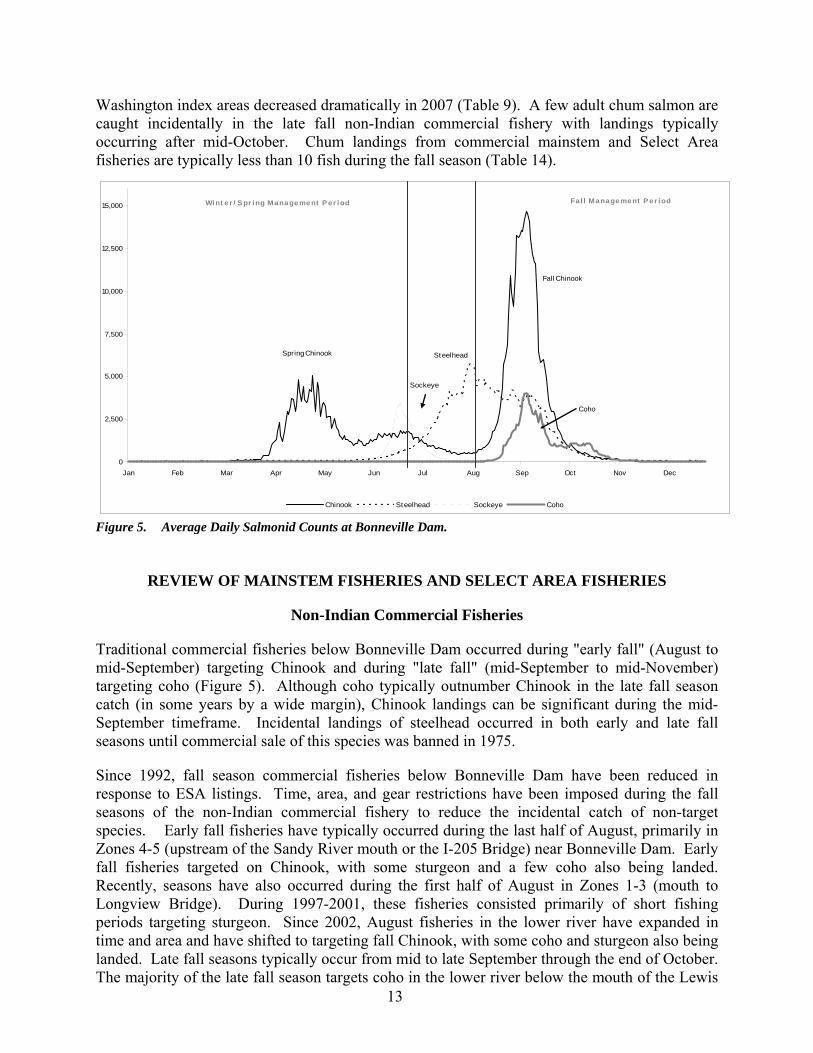
Figure 5. Average Daily Salmonid Counts at Bonneville Dam.
REVIEW OF MAINSTEM FISHERIES AND SELECT AREA FISHERIES
Non-Indian Commercial Fisheries
Traditional commercial fisheries below Bonneville Dam occurred during "early fall" (August to mid-September) targeting Chinook and during "late fall" (mid-September to mid-November) targeting coho (Figure 5). Although coho typically outnumber Chinook in the late fall season catch (in some years by a wide margin), Chinook landings can be significant during the mid-September timeframe. Incidental landings of steelhead occurred in both early and late fall seasons until commercial sale of this species was banned in 1975.
13
Since 1992, fall season commercial fisheries below Bonneville Dam have been reduced in response to ESA listings. Time, area, and gear restrictions have been imposed during the fall seasons of the non-Indian commercial fishery to reduce the incidental catch of non-target species. Early fall fisheries have typically occurred during the last half of August, primarily in Zones 4-5 (upstream of the Sandy River mouth or the I-205 Bridge) near Bonneville Dam. Early fall fisheries targeted on Chinook, with some sturgeon and a few coho also being landed. Recently, seasons have also occurred during the first half of August in Zones 1-3 (mouth to Longview Bridge). During 1997-2001, these fisheries consisted primarily of short fishing periods targeting sturgeon. Since 2002, August fisheries in the lower river have expanded in time and area and have shifted to targeting fall Chinook, with some coho and sturgeon also being landed. Late fall seasons typically occur from mid to late September through the end of October. The majority of the late fall season targets coho in the lower river below the mouth of the Lewis
14
River. Some target Chinook seasons have also occurred during mid- to late September, typically in Zones 4-5 (upstream of the I-205 Bridge in some years). During 1995-1998, extremely low coho abundance curtailed nearly all commercial fishing opportunities during the late fall period.
Reduced non-Indian commercial salmon fishing opportunities in the late 1990s and adoption of the Joint State Sturgeon Management Agreements beginning in 1997 resulted in target sturgeon fisheries becoming an important part of fall fishing strategies to allow the commercial fishery access to the commercial allocation. Beginning in 2003, sturgeon fishery management changed considerably when the commercial white sturgeon allocation was reduced to 8,000 fish. Since 2002, daily and/or weekly possession and sales limits concurrent with salmon fisheries have largely replaced directed sturgeon seasons during the fall and late fall timeframe.
2007 Early Fall Commercial Mainstem Fisheries
The 2007 early fall lower river commercial fishery was managed to harvest Chinook and a limited number of sturgeon. The early fall season consisted of four target Chinook fishing periods, including three 12-hour periods during August 2-10 in Zones 1-5 and one 11-hour period in Zones 4-5 during August 23-24. A 9-inch minimum mesh size restriction was adopted for all four periods to minimize handle of steelhead and under-sized sturgeon. Landing limits for white sturgeon were in effect during all periods, with a 12 fish weekly limit for the first three periods and a three fish weekly limit for the final period (Tables 12, 15, and 23). Landings for the early fall season included 3,981 Chinook, 57 coho, and 2,737 white sturgeon (Tables 14, 24, and 27). The total Chinook and URB-only catches were only 39% and 54% of the preseason expectations, respectively (Table 17). The four-day early fall season was half of the recent (2003-2007) average season length (Table 24). Adult Chinook landings during the 2007 early fall season were the lowest since 1991, but landings of white sturgeon were the highest since 2001.
2007 Late Fall Commercial Mainstem Fisheries
Late fall mainstem fisheries in 2007 consisted of 26 individual fishing periods (6-12 hours each) occurring between September 19 and October 31 (Tables 12 and 15). The season included the most fishing periods since 2001, and 50% more periods than the recent five-year average (17 days), but had fewer periods than the strong return years of 1985-1989, when season length averaged 39 days annually. Much of the fishing effort occurred after the peak of the salmon run had passed Bonneville Dam, leading to many fishing periods with relatively small catches of salmon in each period. Landings during the fishery included 8,169 Chinook, 30,136 coho, 38 chum, and 2,734 white sturgeon (Tables 14, 26, and 27). Chinook catches were 59% of the preseason expectation and well below the recent five-year average (Table 26). Coho landings were similar to 2005-2006 and slightly exceeded preseason expectations but were well below the recent five-year average catch of 75,100. White sturgeon catch was regulated with weekly per-vessel possession and sales limits of 7-12 fish during the initial 10 fishing periods, after which sturgeon sales were prohibited because the annual guideline had been reached.
Non-Indian Recreational Fisheries
A fall recreational fishery exists throughout the Columbia River with the primary catch areas being the estuary (Buoy 10), the lower river between Tongue Point and Bonneville Dam (LCR), and the Vernita-Hanford Reach area below Priest Rapids Dam. The Buoy 10 sport fishery
15
catches fall Chinook and coho in the estuary area of the Columbia River from Buoy 10 upstream to the Tongue Point/Rocky Point line, and accounts for the majority of the Columbia River recreational coho harvest. The LCR sport fishery catches fall Chinook, summer steelhead, and coho in the mainstem Columbia River from the Tongue Point/Rocky Point line upstream to Bonneville Dam. Since 2001, the harvest of fall Chinook in the LCR sport fishery has increased as the result of increased effort and anglers more successfully targeting fish in deeper areas of the river. The Hanford Reach fishery targets fall Chinook in the area downstream of Priest Rapids Dam. Smaller fisheries also occur in the mainstem Columbia River between Bonneville and McNary dams targeting Chinook and steelhead near tributary mouths. In all these fisheries, only adipose fin-clipped hatchery steelhead may be retained, and all unclipped steelhead must be released immediately unharmed. Additionally, all unclipped coho caught downstream of the Hood River Bridge must be released.
2007 Buoy 10 Sport Fishery
The 2007 Buoy 10 fishery opened on August 1 for adipose fin-clipped coho and steelhead. Chinook retention was allowed during August 22 – September 3 and September 29 – December 31. The daily bag limit was two salmon with not more than one Chinook, except that two additional coho were allowed during September 29 – December 31. The expected catch for the fishery was adult 3,800 Chinook and 12,200 coho. The 2007 Buoy 10 fishery produced 36,100 angler trips and catches of 3,800 Chinook, and 8,400 adipose fin-clipped coho (Tables 14 and 29).
2007 Lower Columbia Mainstem Sport Fishery
The LCR sport fishery opened August 1 with a daily bag limit of two salmon, only one of which could be a Chinook. Chinook retention was prohibited downstream of Warrior Rock during September 5 – 28 to protect naturally spawning populations of LRH fall Chinook in the Lewis and Coweeman rivers. Preseason expectations were for a catch of 10,840 adult Chinook and 1,000 coho; however, a reduced upriver fall Chinook run size led to a Chinook closure during September 19-28. When the fishery reopened to Chinook retention on September 29, the states allowed the retention of two additional adipose fin-clipped coho in the daily salmon limit. The 2007 mainstem sport fishery below Bonneville Dam produced 79,800 angler trips with a catch of 8,100 adult fall Chinook, 900 adipose fin-clipped adult coho, and 4,700 adipose fin-clipped summer steelhead (Tables 14 and 30). Angler effort and fall Chinook catch in the mainstem sport fishery were the lowest since 1999 and 2000, respectively.
2007 Columbia Mainstem Recreational Fisheries above Bonneville Dam
The Columbia River is typically open for Chinook retention during the fall season in the area from Bonneville Dam upstream to the Hwy. 395 Bridge near Pasco, Washington (37 miles upstream of McNary Dam). Additional areas of the Columbia River upstream of the Hwy. 395 Bridge, such as Hanford Reach, may also be open during the fall season.
Chinook harvested above Bonneville Dam are primarily URB stock. Average Chinook catch during the last 10 years (1997-2006) in the area from Bonneville upstream to the Hwy. 395 Bridge has been fairly static, with about 900 Chinook retained annually. The catch from the Hanford Reach is significantly higher, with about 5,500 Chinook retained annually during the same time frame. Chinook harvest in the area from Bonneville Dam to Hwy. 395 totaled 150
16
fish in 2007. The low catch may be attributable to the shortened season (closed September 20-28). In the area from the Hwy 395 Bridge upstream to Priest Rapids Dam, which is primarily the Hanford Reach fishery, Chinook harvest was estimated at 4,614 adult fish (Table 14).
Steelhead fisheries also occur in the area from Bonneville Dam upstream to the old Hanford town site (below Priest Rapids Dam) during specific months of the year. Fisheries also occur within Zone 6 tributaries where migrating steelhead may “dip-in” to seek refuge in the cooler water of the tributary. This dip-in tributary catch is included with the mainstem catch. Recreational steelhead harvest in areas above Bonneville Dam is derived from catch record card (CRC), or punch card reports, as creel checks are limited. Release estimates are based on mark rates at Bonneville and McNary dams.
Estimated catch for the 2007 fall season (August –December) is 20,450 kept steelhead and 9,000 released steelhead for fisheries between Bonneville Dam and the Hwy 395 Bridge (including dip-ins). These estimates are based on an average of final and preliminary catch record card data from 1999-2006 (Table 14).
Select Area Fisheries
Select Area commercial fisheries occur in off-channel areas targeting coho and Chinook returning from net-pen and hatchery releases at these sites. These fisheries were initiated in 1962 with the adoption of coho salmon seasons in Youngs Bay. Initially, Youngs Bay seasons were concurrent with the late fall mainstem gillnet season. Since 1977 the Youngs Bay season has been separated from mainstem seasons and has increased in importance with the involvement of the Clatsop County Fisheries Project that pioneered the successful net-pen acclimation program, which is now a cornerstone of the Select Area Fisheries Enhancement (SAFE) project.
Declines in mainstem fishing opportunities and success of the Youngs Bay fishery prompted the Bonneville Power Administration (BPA) to fund a research project in 1993 to expand net-pen programs in Youngs Bay and other off-channel fishing areas. This BPA funding now supports the SAFE Project that operates production sites and fisheries in Youngs Bay, Tongue Point/South Channel, and Blind Slough/Knappa Slough in Oregon and Deep River in Washington. Fall SAFE fisheries primarily target hatchery coho returning to these release sites; however, SAB fall Chinook are also produced and harvested in Youngs Bay. SAFE production of coho and SAB Chinook also contribute to the Buoy 10 recreational fishery. Select Area fisheries targeting coho are typically initiated in late August or early September and continue through the end of October. In Youngs Bay, limited Chinook target fishing periods occur weekly from mid-June (summer season) through August to target hold-over SAFE-produced spring Chinook and early returning SAB fall Chinook. A target Chinook fishery has occurred intermittently in Knappa Slough when surplus tule fall Chinook were expected to return to Big Creek Hatchery.
Fall Select Area fisheries have occurred in Youngs Bay since 1962; Tongue Point/South Channel, Blind Slough/Knappa Slough, and Deep River since 1996; and Steamboat Slough during 2000-2005. All non-Indian fisheries are managed in accordance with predetermined harvest impact rates or catch guidelines; however, Select Area fall fishery impacts on listed fish are negligible and inseason modifications are seldom necessary.
17
Recreational fisheries also occur in the Select Areas. As per permanent regulations, Youngs Bay, Blind Slough/Knappa Slough, and Deep River Select Areas are open the entire year for retention of Chinook and adipose fin-clipped coho with a daily bag limit of either two adult salmonids in any combination (Oregon) or two adult salmon during January 1 – July 31 and four adult salmon of which two may be Chinook during August 1 – December 31 (Washington). Chinook retained during January 1 – July 31 must be fin-clipped (either adipose or ventral clips) in Youngs Bay and associated tributaries, and adipose fin-clipped in other Select Areas and tributaries. These fisheries tend to have relatively low effort and catch, with a five-year average (2002-2006) combined catch of approximately 340 Chinook and 275 coho per fall season.
2007 Select Area Fisheries
Select Area fisheries occurring during the fall of 2007 were managed to harvest hatchery and net-pen reared coho and SAB fall Chinook salmon with minimal impacts to listed species. A sales/possession limit of five white sturgeon per vessel per calendar week was also adopted for fall commercial fisheries in 2007. Sale of white sturgeon was prohibited effective October 14, 2007 when the annual catch guideline (400 fish) for the Select Areas was met. Total coho harvest in the four Select Area fisheries during the fall of 2007 was a record low (10,516 fish), driven primarily by unexpectedly low returns of Youngs Bay coho. However, Chinook landings were average with a total of 4,533 Chinook, similar to recent years’ catches, even though fisheries in Blind Slough/Knappa Slough were restricted to increase tule escapement to Big Creek Hatchery, as they were in 2006. Additionally, 148 white sturgeon were harvested incidentally in SAFE fall fisheries. Landings for 2007 fall Select Area seasons are summarized in Tables 14 and 28.
Similar to the pattern in recent years, the fall Youngs Bay Select Area fishery began in early August with weekly 30-36 hour fishing periods through late August, followed by a 72-hour period from August 28 – August 31, and continuous fishing from the week of Labor Day through the end of October (Tables 13 and 15). August fishing periods were intended to harvest net-pen produced SAB fall Chinook and early returning coho without jeopardizing SAB fall Chinook broodstock needs at the Klaskanine and South Fork Klaskanine hatcheries. To ensure adequate SAB escapement, the upper Youngs Bay fishing boundary was moved downstream from the confluence of Youngs and Klaskanine rivers to Battle Creek Slough beginning in August. The season included 57 consecutive days of fishing from September 4 through October 31 with the intent of harvesting late-returning SAB fall Chinook and hatchery-origin coho whose abundance typically peaks in mid-September. The complete season consisted of 64 fishing days, and resulted in a catch of 4,002 Chinook, 3,301 coho, and 64 white sturgeon (Tables 14 and 28). The SAB Chinook catch was slightly greater than preseason expectations (3,300 fish) while coho harvest was much lower than preseason expectations (23,300 fish).
The Tongue Point/South Channel fishery opened on September 4 and included the South Channel fishing area from the outset of the season in an effort to maximize harvest of coho released from the Tongue Point net pens. The fishery was initiated with three nightly 12-hour fishing periods per week during September 4 – September 14, increased to four nightly 12-hour periods during the week of September 17, then increased again to four nightly 16-hour periods each week from September 24 – October 26 (Tables 13 and 15). The 30-night season resulted in landings of approximately 269 Chinook, 2,043 coho, and 66 white sturgeon (Tables 14 and 28). The coho catch was less than half the preseason expectation of 5,000 fish.
18
The season structure of the Blind Slough/Knappa Slough fishery was similar to the Tongue Point/South Channel fishery. The fishery began with three, 12-hour nightly fishing periods each week during September 4 – September 14 followed by four, 12-hour nightly periods during the week of September 17. Beginning September 24, nightly fishing hours were expanded to 14 hours in an effort to maximize harvest of the net-pen reared coho (Tables 13 and 15). Due to low anticipated returns of tule fall Chinook to Big Creek Hatchery; the late August season was closed to protect this stock. For the second year in a row the fishing area was restricted to Blind Slough until the week of September 17, to provide additional protection to Big Creek Chinook. The 30-night season ended October 26 and resulted in landings of 87 Chinook, 2,498 coho, and 13 white sturgeon (Tables 14 and 28). The coho catch was slightly less than the preseason expectation of 3,000 fish.
The structure of the Deep River fishery was similar to that used in other SAFE fishing areas with multiple nightly fishing periods occurring each week from September 3 – October 26. The fishery consisted of four 12-hour nightly periods per week during September 3 – 21. The nightly fishing periods were lengthened to 16 hours beginning September 24 in response to decreasing daylight hours (Tables 13 and 15). The 32-night season resulted in landings of 175 Chinook, 2,674 coho, and five white sturgeon (Tables 14 and 28). The coho catch was slightly less than the preseason expectation of 3,300 fish.
The 2007 recreational fisheries in Select Areas occurred as per permanent regulations. Preliminary catch estimates for 2007 were much less than the recent 5-year average, with an estimated 40 Chinook and zero coho kept.
Treaty Indian Fisheries
During the fall, fisheries in the mainstem Columbia River between Bonneville and McNary dams included treaty Indian commercial and ceremonial and subsistence (C&S) fisheries, recreational sturgeon fisheries, and limited fall Chinook and steelhead sport fisheries focusing around tributary mouths. All fisheries that occurred in this section of the Columbia River were managed in accordance with predetermined harvest impact rates or catch guidelines. Landings and fishery structure during 2007 fall seasons are summarized in Tables 12, 14, 16, 17 and 19-22.
2007 Treaty Indian Fall Fisheries
The treaty Indian commercial fishery in the fall of 2007 was managed to target harvestable URB and BPH fall Chinook stocks while allowing some harvest of summer steelhead and limiting impacts on listed SRW fall Chinook and wild Group B index summer steelhead. The 25½-day commercial gillnet salmon fishery consisted of seven fishing periods; one 2½-day fishing period, four 3½-day fishing periods, and two 4½-day fishing periods (Table 12). The commercial gillnet fishery harvested fewer Chinook than expected. Catches were highest in the third and fourth weeks (Tables 14 and 16). Based on an expected moderate return of BPH fall Chinook, the standard (large) sanctuary around Spring Creek Hatchery was utilized in all openings. As in most years, all other standard dam and river mouth sanctuaries were in effect and all of Zone 6 was open throughout the duration of the fall salmon season (Table 19). The tribes did not require a minimum mesh size restriction for the first two gillnet openings, but an 8-inch minimum mesh size was required after that to limit handle of listed steelhead. Aerial net counts indicated that effort was higher than 2006 with total daily net counts ranging between 251 and 528 per week.

19
The average count for statistical weeks 35-39 was 364 in 2002, 293 in 2003, 223 in 2004, 352 in 2005, 372 in 2006, and 454 in 2007.
The 2007 fall commercial gillnet salmon season occurred between August 21 and October 6. Sales of platform and hook and line caught fish occurred from August 1 through October 16. Fall season fisheries resulted in catches of 36,782 adult Chinook, 7,964 Chinook jacks, 19,457 steelhead, and 8,035 coho, of which 24% of the Chinook, and 48% of the steelhead were taken home or sold directly to the public (Tables 16 and 17). The season was similar to 2006, which was longer than the previous five years and was much closer to the seasons in the late 1980s, when seasons ranged from 35-46 days. The adult Chinook catch of 36,782 fish represents a sharp decline from 2006 and was below the recent 5- and 10-year averages of 107,400 and 82,800 respectively (Table 20).
The total catch of 19,457 summer steelhead in all treaty Indian fall season fisheries included 2,747 Group A wild index steelhead and 1,050 Group B wild index steelhead. The 2007 total catch was more than the recent 5-year average of 18,400 and far less than the strong return years of 1984-1989, when catches averaged 63,900 steelhead annually (Table 20).
The 2007 sturgeon harvest guidelines for Treaty Indian fisheries in Zone 6 were not met in the John Day Pool during the winter gillnet fishery. The tribes opened a setline fishery in the John Day Pool from August 1 to August 18 and harvested 18 sturgeon. Retention of sturgeon during the fall salmon fishery was allowed for subsistence purposes only. Annual white sturgeon catches by pool are summarized in Table 22.
2007 Fishery Impacts
Fall season fisheries target healthy hatchery stocks of steelhead and salmon and also provide for white sturgeon harvest. Fall fisheries are structured to minimize handle of ESA-listed fish through the use of time, area, and gear restrictions while maximizing harvest of healthy stocks of fish. Harvest impacts on URB fall Chinook were 23.39% as compared with the ESA guideline of 31.29%. Total URB fall Chinook impacts were 7.44% (8.25% guideline) in non-Indian fisheries and 15.95% (23.04% guideline) in treaty Indian fisheries. The ER for LRH wild Chinook totaled 47% compared to the 42% maximum limit for combined ocean and mainstem fisheries. The ER for LCR coho was 18.6% compared to the maximum ER limit of 20% in combined ocean and in-river fisheries. Total impacts to wild Group B summer steelhead totaled 13.4% compared to the 17.0% limit. Incidental mortalities from non-Indian fall fisheries resulted in impacts of 1.8% to wild Group B steelhead, compared to the 2.0% limit. Treaty Indian harvest resulted in an impact of 11.6% to wild Group B steelhead, compared to the 15% limit (Tables 18 and 21).
2008 FALL SEASON FISHERY EXPECTATIONS
Endangered Species Act
Status reviews occurring since 1991 have resulted in the majority of Columbia Basin salmon and steelhead stocks being listed under the Endangered Species Act (ESA) and are shown in Table 10. The U.S. v Oregon Technical Advisory Committee (TAC) has prepared Biological Assessments (BAs) for combined fisheries based on relevant U.S. v Oregon management plans
20
and agreements. The TAC has completed BAs of impacts to all ESA-listed salmonid stocks (including steelhead) for all mainstem Columbia River fisheries since January 1992. In addition, ODFW has a management plan in place for wild coho that were state listed in 1999, which includes separate abundance-based harvest matrices for ocean and freshwater fisheries. Green sturgeon are also ESA listed and are included in the current BA.
2008 Management Guidelines
The parties to U.S. v Oregon have re-negotiated a new plan covering fisheries from January 2008 through December 2017. This agreement titled “2008-2017 U.S. v Oregon Management Agreement” (2008-2017 MA) provides specific fishery management constraints for fall Chinook, steelhead, and coho. A BA concerning Columbia River treaty Indian and non-Indian fisheries as described in the 2008-2017 MA was submitted to the NMFS and a Biological Opinion (BO) has been issued. This BO covers mainstem fisheries through December 31, 2017. Guidelines from the 2008-2017 Management Agreement are highlighted below.
Allowable SRW fall Chinook impacts in combined non-Indian and treaty Indian mainstem fisheries below the confluence of the Snake River is 31.25% of the aggregate URB run, based on the preseason forecast.
The freshwater URB impact rate limit of 31.25%, and will be allocated 23.00% for treaty Indian fisheries and 8.25% for non-Indian fisheries.
The ER on LRH Chinook will be limited to 41% for combined ocean and in-river fisheries. The expected ER for mainstem Columbia River fisheries is 8.2%.
Upriver fall Chinook escapement goals include 7,000 adult fall Chinook (4,000 females) to Spring Creek Hatchery and 43,500 adult fall Chinook (natural and hatchery) above McNary Dam.
Treaty Indian fall fisheries will be managed to limit impacts on Group B index steelhead to no greater than 15%, based on preseason run size expectations.
All mainstem non-Indian fall fisheries below the Highway 395 Bridge in Pasco, Washington will be managed for individual upriver wild steelhead impact rates not to exceed 2% on wild Group A and Group B index steelhead.
Ocean and lower river fisheries will be managed to provide for Bonneville Dam escapement of at least 50% of the upriver coho salmon return.
Ocean and lower river fisheries will be managed for a combined ER of no more than 8% for LCR coho. The expected Columbia River exploitation rate is 1.96%.
Non-Indian fisheries will be managed for an impact rate of less than 5% for Columbia River chum salmon.
Non-Indian Fisheries
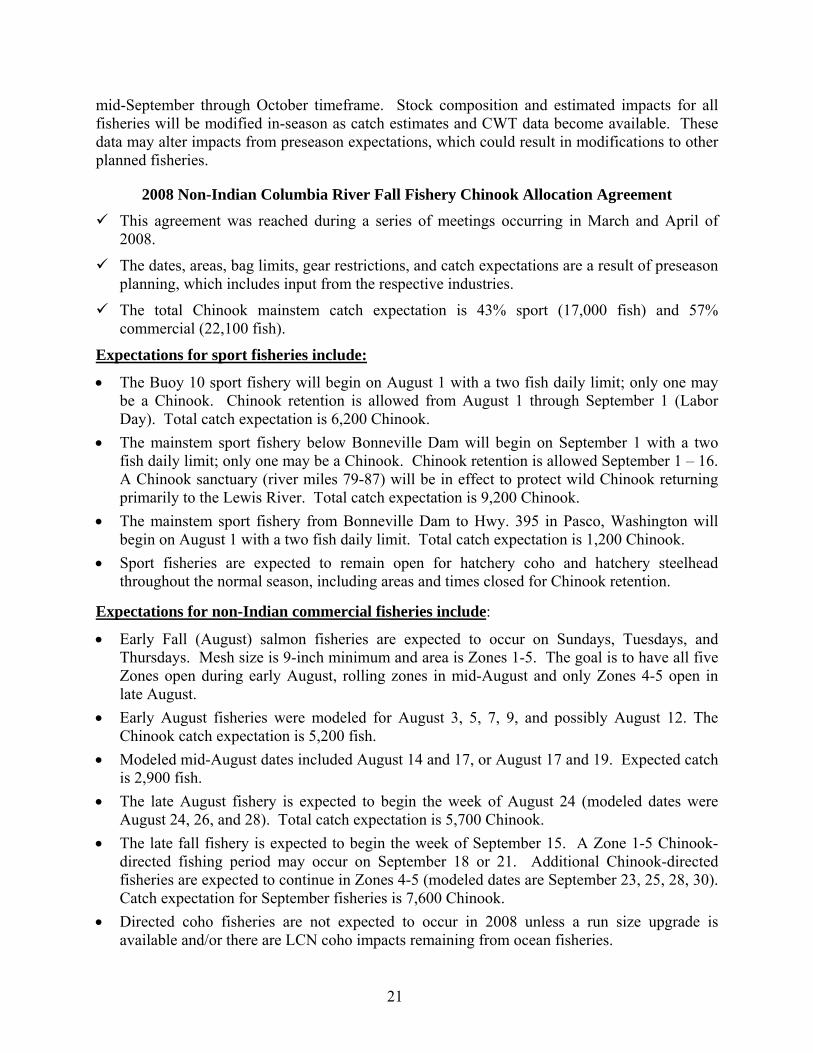
Specific recommendations for fall commercial seasons to harvest sturgeon, Chinook, and coho will be presented at Compact hearings occurring throughout the fall management period. Based on preseason run size forecasts, a fishing schedule was developed for sport and commercial fisheries through the North of Falcon management process. As the fall management period continues, run size updates will occur which could alter planned fisheries. Chinook run sizes are typically not updated prior to mid-September; therefore, fisheries occurring prior to that time will be managed conservatively to allow for flexibility in shaping fishing opportunities during the
21
mid-September through October timeframe. Stock composition and estimated impacts for all fisheries will be modified in-season as catch estimates and CWT data become available. These data may alter impacts from preseason expectations, which could result in modifications to other planned fisheries.
2008 Non-Indian Columbia River Fall Fishery Chinook Allocation Agreement This agreement was reached during a series of meetings occurring in March and April of
2008.
The dates, areas, bag limits, gear restrictions, and catch expectations are a result of preseason planning, which includes input from the respective industries.
The total Chinook mainstem catch expectation is 43% sport (17,000 fish) and 57% commercial (22,100 fish).
Expectations for sport fisheries include:
• The Buoy 10 sport fishery will begin on August 1 with a two fish daily limit; only one may be a Chinook. Chinook retention is allowed from August 1 through September 1 (Labor Day). Total catch expectation is 6,200 Chinook.
• The mainstem sport fishery below Bonneville Dam will begin on September 1 with a two fish daily limit; only one may be a Chinook. Chinook retention is allowed September 1 – 16. A Chinook sanctuary (river miles 79-87) will be in effect to protect wild Chinook returning primarily to the Lewis River. Total catch expectation is 9,200 Chinook.
• The mainstem sport fishery from Bonneville Dam to Hwy. 395 in Pasco, Washington will begin on August 1 with a two fish daily limit. Total catch expectation is 1,200 Chinook.
• Sport fisheries are expected to remain open for hatchery coho and hatchery steelhead throughout the normal season, including areas and times closed for Chinook retention.
Expectations for non-Indian commercial fisheries include:
• Early Fall (August) salmon fisheries are expected to occur on Sundays, Tuesdays, and Thursdays. Mesh size is 9-inch minimum and area is Zones 1-5. The goal is to have all five Zones open during early August, rolling zones in mid-August and only Zones 4-5 open in late August.
• Early August fisheries were modeled for August 3, 5, 7, 9, and possibly August 12. The Chinook catch expectation is 5,200 fish.
• Modeled mid-August dates included August 14 and 17, or August 17 and 19. Expected catch is 2,900 fish.
• The late August fishery is expected to begin the week of August 24 (modeled dates were August 24, 26, and 28). Total catch expectation is 5,700 Chinook.
• The late fall fishery is expected to begin the week of September 15. A Zone 1-5 Chinook-directed fishing period may occur on September 18 or 21. Additional Chinook-directed fisheries are expected to continue in Zones 4-5 (modeled dates are September 23, 25, 28, 30). Catch expectation for September fisheries is 7,600 Chinook.
• Directed coho fisheries are not expected to occur in 2008 unless a run size upgrade is available and/or there are LCN coho impacts remaining from ocean fisheries.
22
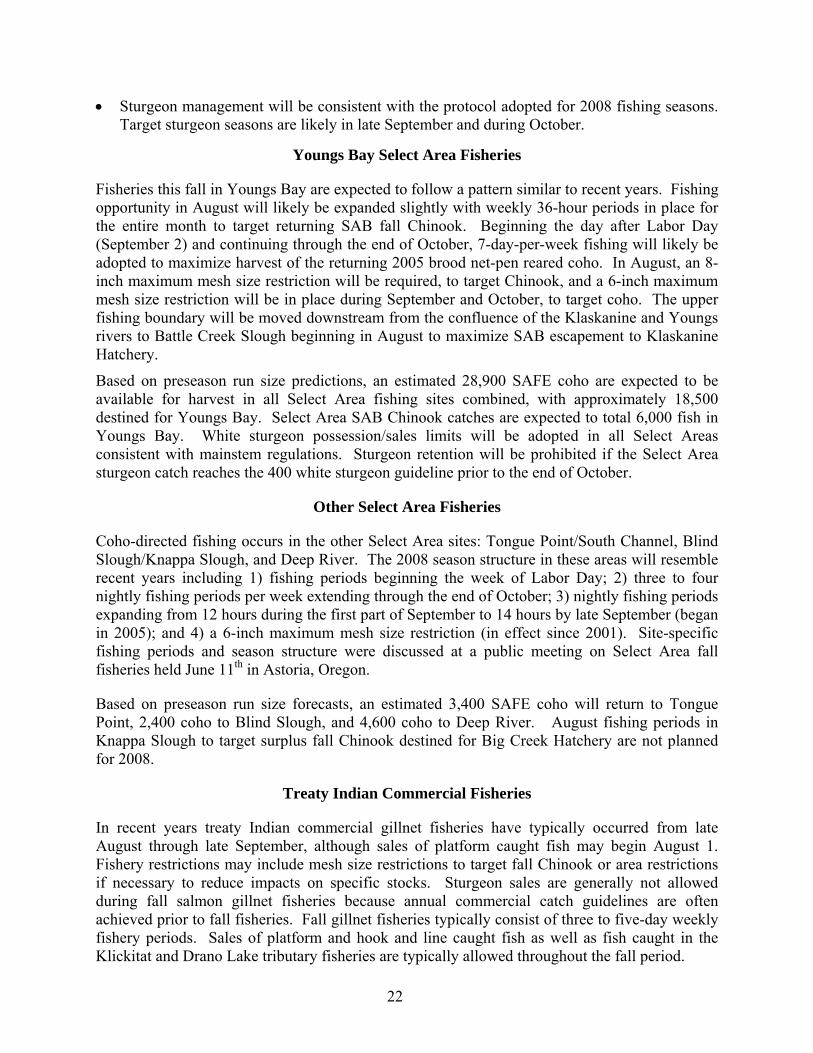
• Sturgeon management wil ted for 2008 fishing seasons. Target sturgeon seasons are likely in late September and during October.
consistent with mainstem regulat be prohibited if the Select Area sturgeon catch reaches the 400 white sturgeon guideline prior to the end of October.
striction (in effect since 2001). Site-specific
Knappa Slough to target sur k Hatchery are not planned for 2008.
fishery periods. Sales of platform and hook and line caught fish as well as fish caught in the Klickitat and Drano Lake tributary fisheries are typically allowed throughout the fall period.
l be consistent with the protocol adop
Youngs Bay Select Area Fisheries
Fisheries this fall in Youngs Bay are expected to follow a pattern similar to recent years. Fishing opportunity in August will likely be expanded slightly with weekly 36-hour periods in place for the entire month to target returning SAB fall Chinook. Beginning the day after Labor Day (September 2) and continuing through the end of October, 7-day-per-week fishing will likely be adopted to maximize harvest of the returning 2005 brood net-pen reared coho. In August, an 8-inch maximum mesh size restriction will be required, to target Chinook, and a 6-inch maximum mesh size restriction will be in place during September and October, to target coho. The upper fishing boundary will be moved downstream from the confluence of the Klaskanine and Youngs rivers to Battle Creek Slough beginning in August to maximize SAB escapement to Klaskanine Hatchery.
Based on preseason run size predictions, an estimated 28,900 SAFE coho are expected to be available for harvest in all Select Area fishing sites combined, with approximately 18,500 destined for Youngs Bay. Select Area SAB Chinook catches are expected to total 6,000 fish in Youngs Bay. White sturgeon possession/sales limits will be adopted in all Select Areas
ions. Sturgeon retention will
Other Select Area Fisheries
Coho-directed fishing occurs in the other Select Area sites: Tongue Point/South Channel, Blind Slough/Knappa Slough, and Deep River. The 2008 season structure in these areas will resemble recent years including 1) fishing periods beginning the week of Labor Day; 2) three to four nightly fishing periods per week extending through the end of October; 3) nightly fishing periods expanding from 12 hours during the first part of September to 14 hours by late September (began in 2005); and 4) a 6-inch maximum mesh size refishing periods and season structure were discussed at a public meeting on Select Area fall fisheries held June 11th in Astoria, Oregon.
Based on preseason run size forecasts, an estimated 3,400 SAFE coho will return to Tongue Point, 2,400 coho to Blind Slough, and 4,600 coho to Deep River. August fishing periods in
plus fall Chinook destined for Big Cree
Treaty Indian Commercial Fisheries
In recent years treaty Indian commercial gillnet fisheries have typically occurred from late August through late September, although sales of platform caught fish may begin August 1. Fishery restrictions may include mesh size restrictions to target fall Chinook or area restrictions if necessary to reduce impacts on specific stocks. Sturgeon sales are generally not allowed during fall salmon gillnet fisheries because annual commercial catch guidelines are often achieved prior to fall fisheries. Fall gillnet fisheries typically consist of three to five-day weekly
23
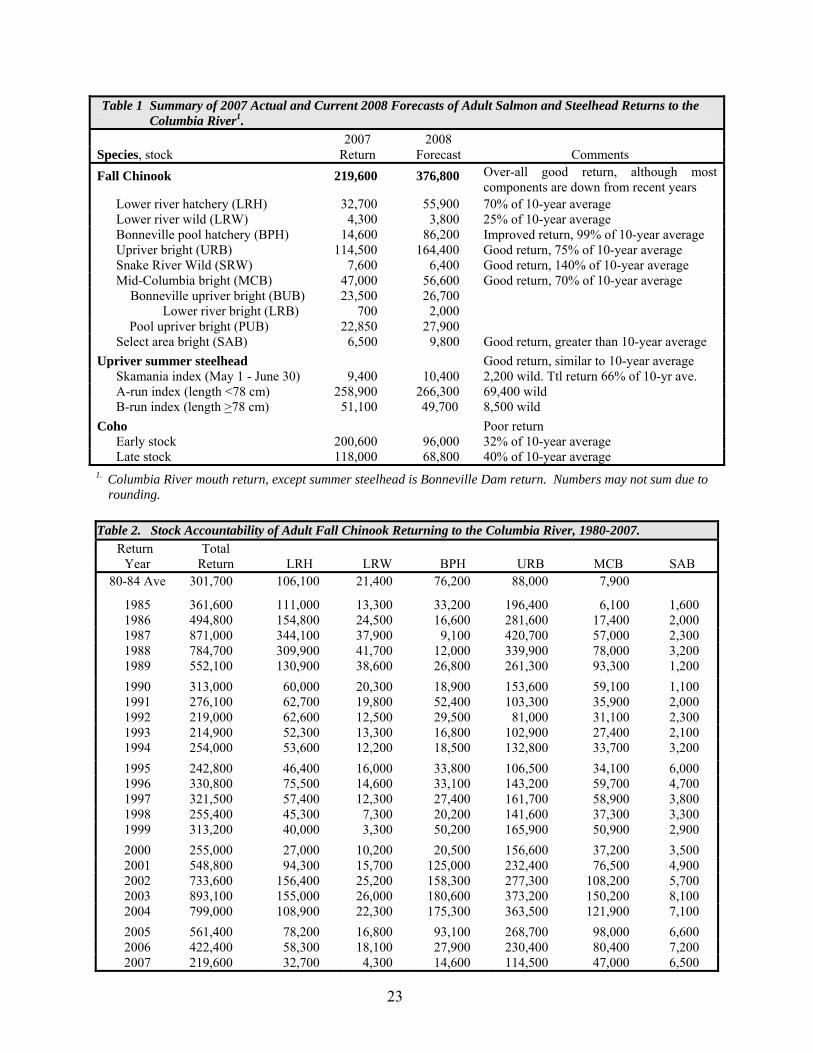
Table 1 Summary of 2007 Actual and Current 2008 Forecasts of Adult Salmon and Steelhead Returns to the Columbia River1.
2007 2008 Species, stock Return Forecast Comments Fall Chinook 219,600 376,800 Over-all good return, although most
components are down from recent years Lower river hatchery (LRH) 32,700 55,900 70% of 10-year average Lower river wild (LRW) 4,300 3,800 25% of 10-year average Bonneville pool hatchery (BPH) 14,600 86,200 Improved return, 99% of 10-year average Upriver bright (URB) 114,500 164,400 Good return, 75% of 10-year average Snake River Wild (SRW) 7,600 6,400 Good return, 140% of 10-year average Mid-Columbia bright (MCB) 47,000 56,600 Good return, 70% of 10-year average
Bonneville upriver bright (BUB) 23,500 26,700 Lower river bright (LRB) 700 2,000 Pool upriver bright (PUB) 22,850 27,900 Select area bright (SAB) 6,500 9,800 Good return, greater than 10-year average
Upriver summer steelhead Good return, similar to 10-year average Skamania index (May 1 - June 30) 9,400 10,400 2,200 wild. Ttl return 66% of 10-yr ave. A-run index (length <78 cm) 258,900 266,300 69,400 wild B-run index (length >78 cm) 51,100 49,700 8,500 wild
Coho Poor return Early stock 200,600 96,000 32% of 10-year average Late stock 118,000 68,800 40% of 10-year average
1. Columbia River mouth return, except summer steelhead is Bonneville Dam return. Numbers may not sum due to rounding.
Table 2. Stock Accountability of Adult Fall Chinook Returning to the Columbia River, 1980-2007.
Return Total Year Return LRH LRW BPH URB MCB SAB
80-84 Ave 301,700 106,100 21,400 76,200 88,000 7,900 1985 361,600 111,000 13,300 33,200 196,400 6,100 1,600 1986 494,800 154,800 24,500 16,600 281,600 17,400 2,000 1987 871,000 344,100 37,900 9,100 420,700 57,000 2,300 1988 784,700 309,900 41,700 12,000 339,900 78,000 3,200 1989 552,100 130,900 38,600 26,800 261,300 93,300 1,200 1990 313,000 60,000 20,300 18,900 153,600 59,100 1,100 1991 276,100 62,700 19,800 52,400 103,300 35,900 2,000 1992 219,000 62,600 12,500 29,500 81,000 31,100 2,300 1993 214,900 52,300 13,300 16,800 102,900 27,400 2,100 1994 254,000 53,600 12,200 18,500 132,800 33,700 3,200 1995 242,800 46,400 16,000 33,800 106,500 34,100 6,000 1996 330,800 75,500 14,600 33,100 143,200 59,700 4,700 1997 321,500 57,400 12,300 27,400 161,700 58,900 3,800 1998 255,400 45,300 7,300 20,200 141,600 37,300 3,300 1999 313,200 40,000 3,300 50,200 165,900 50,900 2,900 2000 255,000 27,000 10,200 20,500 156,600 37,200 3,500 2001 548,800 94,300 15,700 125,000 232,400 76,500 4,900 2002 733,600 156,400 25,200 158,300 277,300 108,200 5,700 2003 893,100 155,000 26,000 180,600 373,200 150,200 8,100 2004 799,000 108,900 22,300 175,300 363,500 121,900 7,100 2005 561,400 78,200 16,800 93,100 268,700 98,000 6,600 2006 422,400 58,300 18,100 27,900 230,400 80,400 7,200 2007 219,600 32,700 4,300 14,600 114,500 47,000 6,500
24
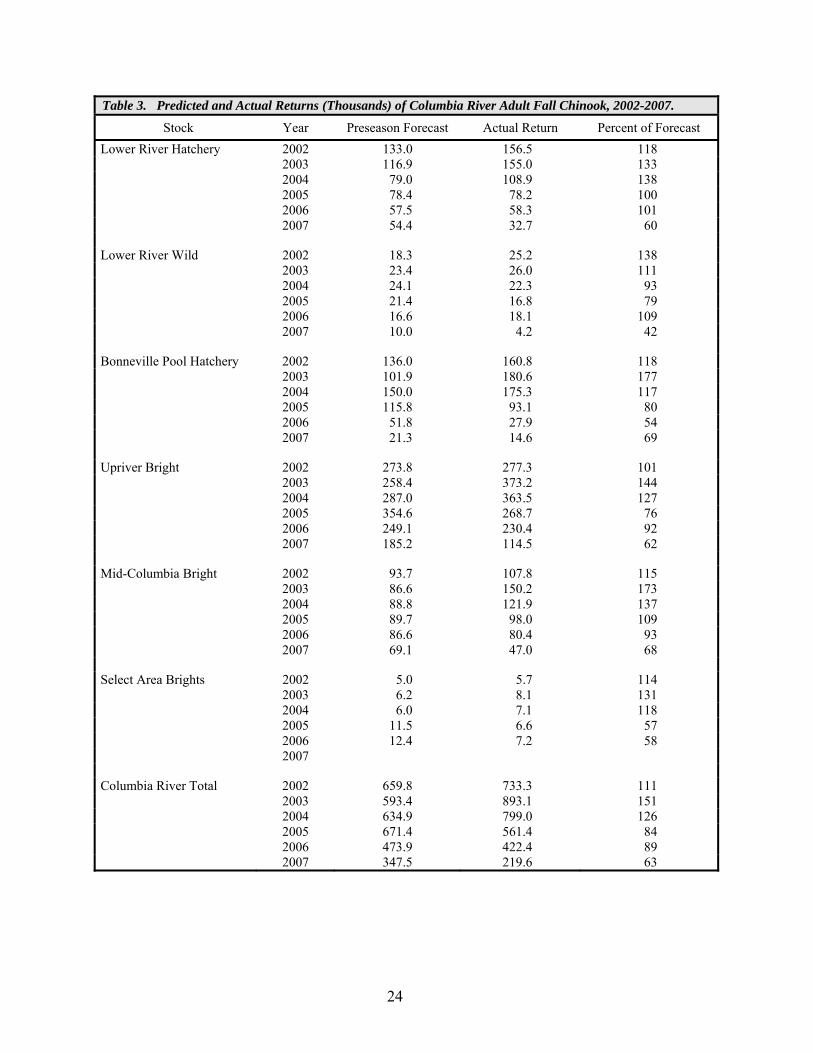
Table 3. Predicted and Actual Returns (Thousands) of Columbia River Adult Fall Chinook, 2002-2007.
Stock Year Preseason Forecast Actual Return Percent of Forecast Lower River Hatchery 2002 133.0 156.5 118 2003 116.9 155.0 133 2004 79.0 108.9 138 2005 78.4 78.2 100 2006 57.5 58.3 101 2007 54.4 32.7 60 Lower River Wild 2002 18.3 25.2 138 2003 23.4 26.0 111 2004 24.1 22.3 93 2005 21.4 16.8 79 2006 16.6 18.1 109 2007 10.0 4.2 42 Bonneville Pool Hatchery 2002 136.0 160.8 118 2003 101.9 180.6 177 2004 150.0 175.3 117 2005 115.8 93.1 80 2006 51.8 27.9 54 2007 21.3 14.6 69 Upriver Bright 2002 273.8 277.3 101 2003 258.4 373.2 144 2004 287.0 363.5 127 2005 354.6 268.7 76 2006 249.1 230.4 92 2007 185.2 114.5 62 Mid-Columbia Bright 2002 93.7 107.8 115 2003 86.6 150.2 173 2004 88.8 121.9 137 2005 89.7 98.0 109 2006 86.6 80.4 93 2007 69.1 47.0 68 Select Area Brights 2002 5.0 5.7 114 2003 6.2 8.1 131 2004 6.0 7.1 118 2005 11.5 6.6 57 2006 12.4 7.2 58 2007 Columbia River Total 2002 659.8 733.3 111 2003 593.4 893.1 151 2004 634.9 799.0 126 2005 671.4 561.4 84 2006 473.9 422.4 89 2007 347.5 219.6 63
25
Table 4. Estimated Columbia River Returns and Lower Granite Dam Escapement of Snake River Wild Fall Chinook Adults, 1986-2007.
Columbia BON-LGR Lower River Mainstem Harvest Passage Conversion Granite
Year Return Harvest Rate % Loss Rate % Escapement 1986 3,363 1,910 57% 918 33% 449 1987 2,135 1,218 57% 485 36% 253 1988 4,549 2,899 64% 870 31% 368 1989 2,323 1,327 57% 481 39% 295 1990 568 302 53% 117 43% 78 1991 1,989 799 40% 872 26% 318 1992 1,329 350 26% 430 56% 549 1993 1,514 420 28% 351 68% 742 1994 991 180 18% 405 50% 406 1995 1,301 247 19% 704 33% 348 1996 1,778 469 26% 670 48% 639 1997 1,857 597 32% 455 63% 795 1998 772 205 27% 260 54% 304 1999 2,475 751 30% 819 52% 905 2000 2,749 791 29% 810 59% 1,148 2001 14,303 3,010 21% 6,130 45% 5,083 2002 3,758 1,063 28% 579 78% 2,095 2003 8,025 1,729 22% 2,039 68% 3,827 2004 8,346 1,715 21% 3,302 50% 2,983 2005 5,540 1,419 26% 1,209 71% 2,602 2006 6,396 1,732 27% 2,181 53% 2,483 2007 7,584 1,705 22% 3,863 34% 2,016
Table 5. Skamania Index, Group A Index, and Group B Index Returns of Summer Steelhead to Bonneville Dam During 1990-2007.
Skamania Index Group A Index Group B Index Total UpriverYear Wild Hatchery Total Wild Hatchery Total Wild Hatchery Total Wild Hatchery Total 1990 3.7 15.0 18.7 27.1 88.5 115.6 8.8 38.4 47.2 39.6 141.9 181.51991 1.2 9.7 10.9 60.3 173.8 234.1 6.2 22.1 28.3 67.7 205.6 273.31992 2.9 12.0 14.9 44.3 197.2 241.5 12.7 44.7 57.4 59.9 253.9 313.81993 1.3 13.1 14.4 28.6 108.1 136.7 4.4 31.8 36.2 34.3 153.0 187.31994 1.4 10.9 12.3 21.2 99.8 121.0 5.2 22.3 27.5 27.8 133.0 160.81995 1.1 7.1 8.2 26.0 154.0 180.0 1.8 11.4 13.2 28.9 172.5 201.41996 1.3 9.5 10.8 25.7 148.6 174.3 3.9 14.9 18.8 30.9 173.0 203.91997 0.9 11.0 11.9 30.9 177.4 208.3 3.9 32.7 36.6 35.7 221.1 256.81998 1.6 7.8 9.4 34.8 99.9 134.7 3.4 36.8 40.2 39.8 144.5 184.31999 1.3 5.9 7.2 56.6 119.8 176.4 3.7 18.4 22.1 61.6 144.1 205.72000 5.7 10.9 16.6 63.6 153.1 216.7 8.4 32.5 40.9 77.7 196.5 274.22001 7.9 20.8 28.7 137.2 377.9 515.1 12.1 74.3 86.4 157.2 473.0 630.22002 9.7 15.3 25.0 87.3 235.8 323.1 32.3 97.6 129.9 129.3 348.7 478.02003 1.8 12.4 14.2 66.4 238.1 304.5 6.5 32.0 38.5 74.7 282.5 357.22004 4.1 16.9 21.0 60.4 190.2 250.6 9.2 28.2 37.4 73.7 235.3 309.02005 2.8 9.2 12.0 58.9 192.7 251.6 9.6 39.3 48.9 71.3 241.2 312.52006 2.2 7.7 9.9 63.7 181.4 245.1 8.5 65.7 74.2 74.4 254.8 329.22007 1.7 7.7 9.4 77.3 181.6 258.9 9.0 42.1 51.1 88.0 231.4 319.4
26
Table 6. Minimum Numbers (Thousands) of Coho Adults Entering the Columbia River, 1970-2007.
Lower Columbia River Comm. Sport Catch Hatchery Trib. Dam Bonneville Minimum
Year Catch 1 Estuary 2 L.Col.R. 3 Tributary Returns Counts 4 Dam Count Run
70-74 Ave 272.2 0.0 1.0 13.4 155.0 12.1 40.1 494.0 75-79 Ave 124.9 0.0 0.5 9.5 94.9 4.1 27.7 261.4
80-84 Ave 124.1 24.2 0.3 11.3 106.1 4.1 25.8 290.9
1985 190.0 25.4 1.1 9.4 94.2 7.5 38.6 366.2 1986 981.0 120.4 4.1 20.8 284.1 8.9 108.6 1527.9 1987 165.2 47.2 0.9 6.0 66.0 4.3 17.9 307.5 1988 361.5 143.4 0.5 11.8 113.6 6.9 27.1 664.8 1989 387.3 81.9 0.3 15.1 189.3 6.9 27.4 708.1
1990 66.2 18.4 0.4 9.8 87.7 2.0 11.6 196.0 1991 407.5 208.6 1.1 29.4 223.3 5.6 58.8 934.3 1992 54.5 43.1 0.6 8.4 85.2 5.2 14.4 211.3 1993 35.6 20.9 0.6 6.3 39.0 0.8 10.7 113.9 1994 60.7 1.8 0.9 3.4 77.7 4.1 20.2 168.8
1995 21.4 5.1 0.3 2.7 32.2 2.9 10.4 74.9 1996 26.9 4.5 0.3 3.5 60.2 0.7 15.7 111.6 1997 19.4 20.3 0.9 10.8 69.9 2.9 24.1 148.1 1998 22.3 3.2 3.8 3.0 83.8 1.1 46.6 163.7 1999 79.0 9.0 1.3 18.6 124.5 1.1 40.7 274.2
2000 168.4 21.5 1.6 36.2 228.7 5.5 85.8 547.7 2001 253.1 132.1 3.1 74.9 377.3 8.2 259.8 1108.5 2002 163.0 6.2 3.1 24.4 211.1 3.7 88.6 500.1 2003 257.3 54.5 1.2 22.1 205.4 11.2 125.7 677.4 2004 119.7 15.2 1.3 12.2 173.5 5.6 115.1 442.6
2005 94.7 6.9 0.6 9.9 143.3 3.3 83.3 342.0 2006 63.4 3.7 1.2 15.1 188.1 9.5 102.1 383.1 2007 39.1 8.4 0.8 12.5 160.5 4.8 92.5 318.6
1. Includes Select Area fisheries. Includes jacks, except beginning in 1987 jacks landed in SAFE fisheries are not included in this total. Preliminary data since 2004
2. Catch from estuary recreational (Buoy 10) fishery. Catch from the estuary fishery prior to 1982 is included in ocean catch totals. Some non-Columbia River fish are caught in the estuary fishery and are included here.
3. Catch from above Astoria-Megler Bridge through 1999 and catch from above Tongue Point/Rocky Point thereafter.
4. Includes Willamette Falls (Willamette River), North Fork Dam (Clackamas River), and Marmot Dam (Sandy River). No Marmot counts after Dam removal in 2007.
27
Table 7. Minimum Numbers (Thousands) of Early Stock Coho Adults Entering the Columbia River, 1970-2007.
Lower Columbia River Comm. Catch Sport Catch Hatchery Trib. Dam Bonneville Minimum
Year Zones 1-51 Estuary 2 L.Col.R 3 Tributary Returns Counts4 Dam Count Run 70-74 Ave 179.5 0.8 10.4 127.9 10.9 36.5 366.1 75-79 Ave 61.8 0.4 6.6 68.3 3.2 25.0 165.2 80-84 Ave 50.7 12.1 0.2 6.3 63.9 2.8 21.9 157.8
1985 105.8 16.5 0.8 6.3 57.3 6.5 35.2 228.4 1986 356.6 97.6 3.0 9.5 158.6 5.9 99.7 730.9 1987 100.5 28.4 0.7 4.2 32.6 3.4 16.4 186.2 1988 186.7 61.7 0.3 7.0 47.3 6.3 23.0 332.3 1989 78.2 54.7 0.2 7.0 104.0 5.5 19.6 269.2
1990 38.3 12.6 0.3 6.3 40.8 1.7 8.7 108.7 1991 203.2 142.9 0.8 15.1 108.9 4.3 43.2 518.4 1992 19.8 29.1 0.5 4.1 44.5 3.4 8.4 109.8 1993 20.8 16.5 0.5 2.9 22.9 0.7 8.0 72.3 1994 58.3 1.4 0.8 2.2 59.6 3.3 12.5 138.1
1995 21.2 4.9 0.2 1.6 20.4 2.3 6.9 57.5 1996 22.1 3.9 0.2 2.1 44.3 0.6 8.9 82.1 1997 17.6 19.3 0.8 6.4 39.2 2.8 18.4 104.5 1998 22.1 3.0 3.6 0.7 46.8 1.0 34.5 111.7 1999 46.2 7.8 0.9 11.1 60.0 1.0 32.9 159.9
2000 78.5 18.7 1.0 26.4 137.2 4.9 58.9 325.6 2001 102.2 114.9 2.6 40.1 200.9 6.3 225.4 692.4 2002 116.2 5.4 1.1 18.2 101.1 3.3 50.4 295.7 2003 184.8 47.4 0.8 17.7 141.3 10.8 93.8 496.6 2004 69.7 13.2 0.8 9.9 109.7 5.0 85.6 293.9
2005 77.8 6.0 0.3 7.5 88.2 3.0 63.6 246.4 2006 45.4 3.2 0.6 10.6 98.7 8.3 65.4 232.2 2007 17.8 7.3 0.5 9.2 99.7 4.0 62.1 200.6
1. Includes Select Area fisheries. Includes jacks, except beginning in 1987 jacks landed in SAFE fisheries are not included in this total. Preliminary data since 2004
2. Catch from estuary recreational (Buoy 10) fishery. Catch from the estuary fishery prior to 1982 is included in ocean catch totals. Some non-Columbia River fish are caught in the estuary fishery and are included here.
3. Catch from above Astoria-Megler Bridge through 1999 and catch from above Tongue Point/Rocky Point thereafter.
4. Includes Willamette Falls (Willamette River), North Fork Dam (Clackamas River), and Marmot Dam (Sandy River). No Marmot counts after Dam removal in 2007.
28
Table 8. Minimum Numbers (Thousands) of Late Stock Coho Adults Entering the Columbia River, 1970-2007. Lower Columbia River
Comm. Catch Sport Catch Hatchery Trib. Dam Bonneville Minimum Year Zones 1-5 1 Estuary 2 L.Col.R. 3 Tributary Returns Count 4 Dam Count Run
70-74 Ave 92.7 0.2 3.0 27.1 1.2 3.6 127.9 75-79 Ave 63.1 0.1 2.9 26.6 0.9 2.7 96.2 80-84 Ave 73.4 12.1 0.1 5.0 42.2 1.3 3.9 133.1
1985 84.2 8.9 0.3 3.1 36.9 1.0 3.4 137.8 1986 624.4 22.8 1.1 11.3 125.5 3.0 8.9 797.0 1987 64.7 18.8 0.2 1.8 33.4 0.9 1.5 121.3 1988 174.8 81.7 0.2 4.8 66.3 0.6 4.1 332.5 1989
309.1 27.2 0.1 8.1 85.3 1.4 7.8 438.9 1990 27.9 5.8 0.1 3.5 46.9 0.3 2.9 87.3 1991 204.3 65.7 0.3 14.3 114.4 1.3 15.6 415.9 1992 34.7 14.0 0.1 4.3 40.7 1.8 6.0 101.5 1993 14.8 4.4 0.1 3.4 16.1 0.1 2.7 41.6 1994
2.4 0.4 0.1 1.2 18.1 0.8 7.7 30.7 1995 0.2 0.2 0.1 1.1 11.8 0.6 3.5 17.4 1996 4.8 0.6 0.1 1.4 15.9 0.1 6.8 29.5 1997 1.8 1.0 0.1 4.4 30.7 0.1 5.7 43.6 1998 0.2 0.2 0.2 2.3 37.0 0.1 12.1 52.0 1999
32.8 1.2 0.4 7.5 64.5 0.1 7.8 114.3 2000 89.9 2.8 0.6 9.8 91.5 0.6 26.9 222.1 2001 150.9 17.2 0.5 34.8 176.4 1.9 34.4 416.1 2002 46.8 0.8 2.0 6.2 110.0 0.4 38.2 204.4 2003 72.5 7.1 0.4 4.4 64.1 0.4 31.9 180.8 2004
50.0 2.0 0.5 2.3 63.8 0.6 29.5 148.7 2005 16.9 0.9 0.3 2.4 55.1 0.3 19.7 95.6 2006 18.0 0.5 0.6 4.5 89.4 1.2 36.7 150.9 2007 21.3 1.1 0.3 3.3 60.8 0.8 30.4 118.0
1. Includes Select Area fisheries. Includes jacks, except beginning in 1987 jacks landed in SAFE fisheries are not included in this total. Preliminary data since 2004
2. Catch from estuary recreational (Buoy 10) fishery. Catch from the estuary fishery prior to 1982 is included in ocean catch totals. Some non-Columbia River fish are caught in the estuary fishery and are included here.
3. Catch from above Astoria-Megler Bridge through 1999 and catch from above Tongue Point/Rocky Point thereafter.
4. Includes Willamette Falls (Willamette River), North Fork Dam (Clackamas River), and Marmot Dam (Sandy River). No Marmot counts after Dam removal in 2007.
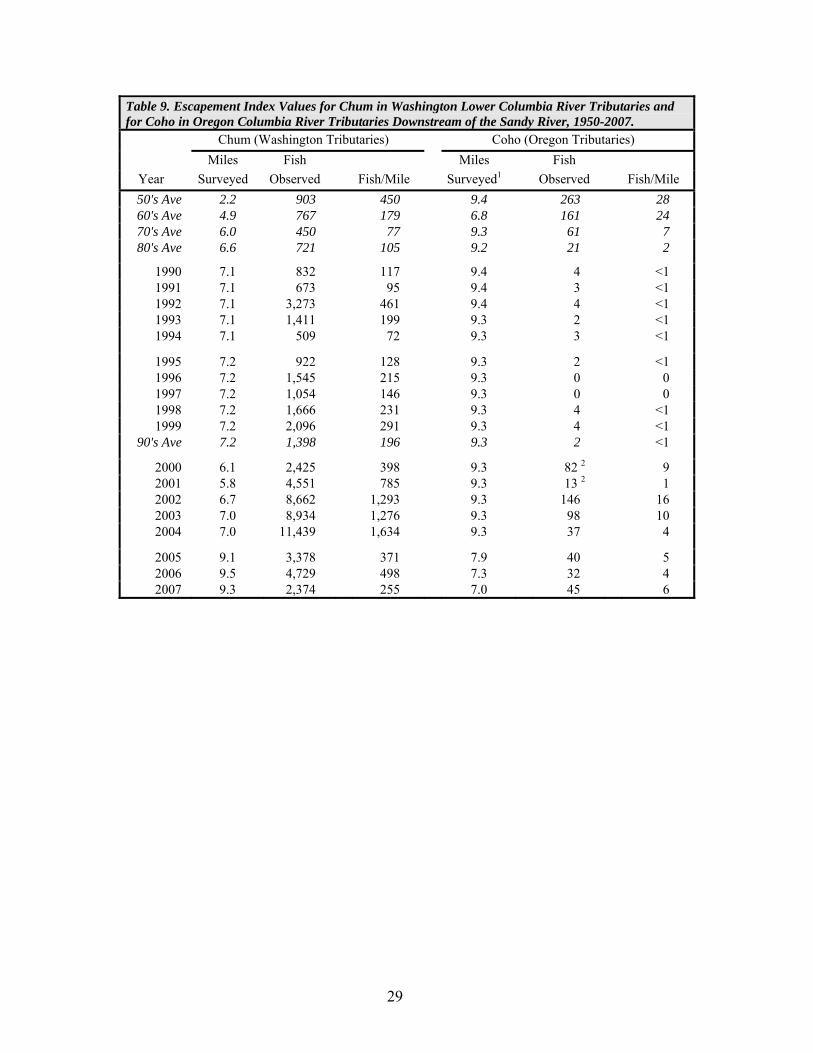
29
Table 9. Escapement Index Values for Chum in Washington Lower Columbia River Tributaries and for Coho in Oregon Columbia River Tributaries Downstream of the Sandy River, 1950-2007.
Chum (Washington Tributaries) Coho (Oregon Tributaries)
Miles Fish Miles Fish Year Surveyed Observed Fish/Mile Surveyed1 Observed Fish/Mile 50's Ave 2.2 903 450 9.4 263 28 60's Ave 4.9 767 179 6.8 161 24 70's Ave 6.0 450 77 9.3 61 7 80's Ave 6.6 721 105 9.2 21 2
1990 7.1 832 117 9.4 4 <1 1991 7.1 673 95 9.4 3 <1 1992 7.1 3,273 461 9.4 4 <1 1993 7.1 1,411 199 9.3 2 <1 1994 7.1 509 72 9.3 3 <1
1995 7.2 922 128 9.3 2 <1 1996 7.2 1,545 215 9.3 0 0 1997 7.2 1,054 146 9.3 0 0 1998 7.2 1,666 231 9.3 4 <1 1999 7.2 2,096 291 9.3 4 <1
90's Ave 7.2 1,398 196 9.3 2 <1
2000 6.1 2,425 398 9.3 82 2 9 2001 5.8 4,551 785 9.3 13 2 1 2002 6.7 8,662 1,293 9.3 146 16 2003 7.0 8,934 1,276 9.3 98 10 2004 7.0 11,439 1,634 9.3 37 4
2005 9.1 3,378 371 7.9 40 5 2006 9.5 4,729 498 7.3 32 4 2007 9.3 2,374 255 7.0 45 6
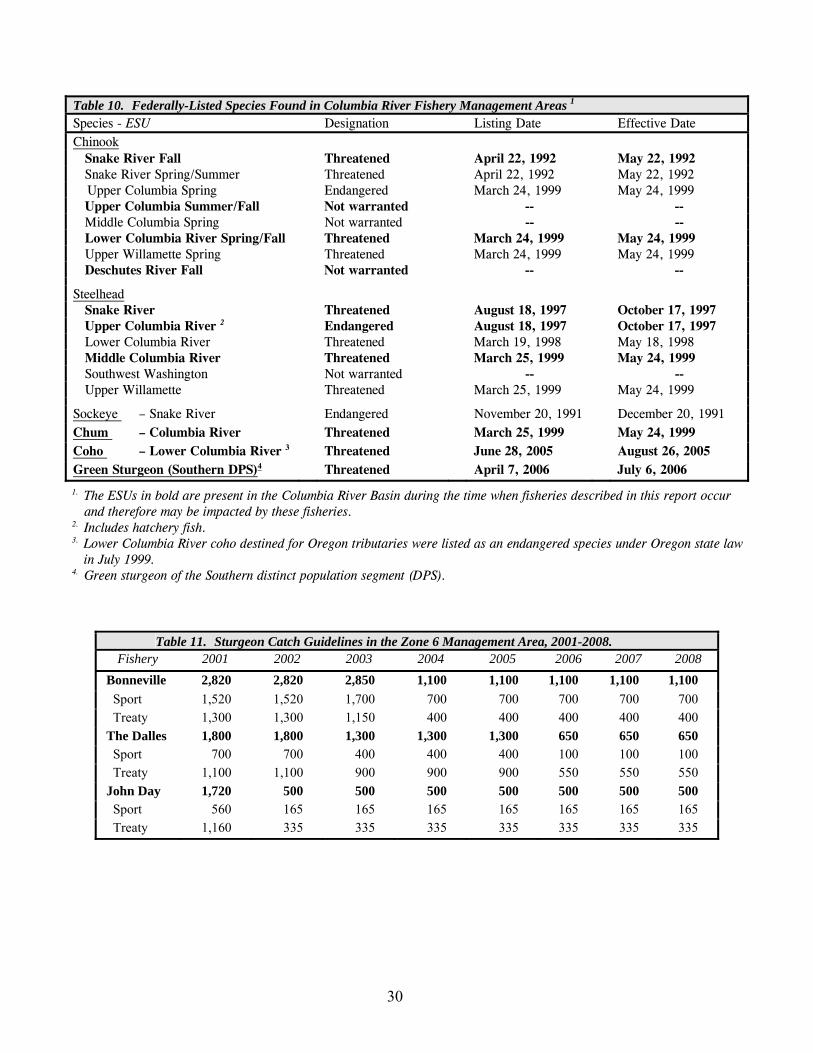
30
Table 10. Federally-Listed Species Found in Columbia River Fishery Management Areas 1
Species - ESU Designation Listing Date Effective Date Chinook Snake River Fall Threatened April 22, 1992 May 22, 1992 Snake River Spring/Summer Threatened April 22, 1992 May 22, 1992 Upper Columbia Spring Endangered March 24, 1999 May 24, 1999 Upper Columbia Summer/Fall Not warranted -- -- Middle Columbia Spring Not warranted -- -- Lower Columbia River Spring/Fall Threatened March 24, 1999 May 24, 1999 Upper Willamette Spring Threatened March 24, 1999 May 24, 1999 Deschutes River Fall Not warranted -- -- Steelhead Snake River Threatened August 18, 1997 October 17, 1997 Upper Columbia River 2 Endangered August 18, 1997 October 17, 1997 Lower Columbia River Threatened March 19, 1998 May 18, 1998 Middle Columbia River Threatened March 25, 1999 May 24, 1999 Southwest Washington Not warranted -- -- Upper Willamette Threatened March 25, 1999 May 24, 1999 Sockeye – Snake River Endangered November 20, 1991 December 20, 1991 Chum – Columbia River Threatened March 25, 1999 May 24, 1999 Coho – Lower Columbia River 3 Threatened June 28, 2005 August 26, 2005 Green Sturgeon (Southern DPS)4 Threatened April 7, 2006 July 6, 2006
1. The ESUs in bold are present in the Columbia River Basin during the time when fisheries described in this report occur and therefore may be impacted by these fisheries.
2. Includes hatchery fish. 3. Lower Columbia River coho destined for Oregon tributaries were listed as an endangered species under Oregon state law
in July 1999. 4. Green sturgeon of the Southern distinct population segment (DPS).
Table 11. Sturgeon Catch Guidelines in the Zone 6 Management Area, 2001-2008. Fishery 2001 2002 2003 2004 2005 2006 2007 2008
Bonneville 2,820 2,820 2,850 1,100 1,100 1,100 1,100 1,100 Sport 1,520 1,520 1,700 700 700 700 700 700 Treaty 1,300 1,300 1,150 400 400 400 400 400 The Dalles 1,800 1,800 1,300 1,300 1,300 650 650 650 Sport 700 700 400 400 400 100 100 100 Treaty 1,100 1,100 900 900 900 550 550 550 John Day 1,720 500 500 500 500 500 500 500 Sport 560 165 165 165 165 165 165 165 Treaty 1,160 335 335 335 335 335 335 335
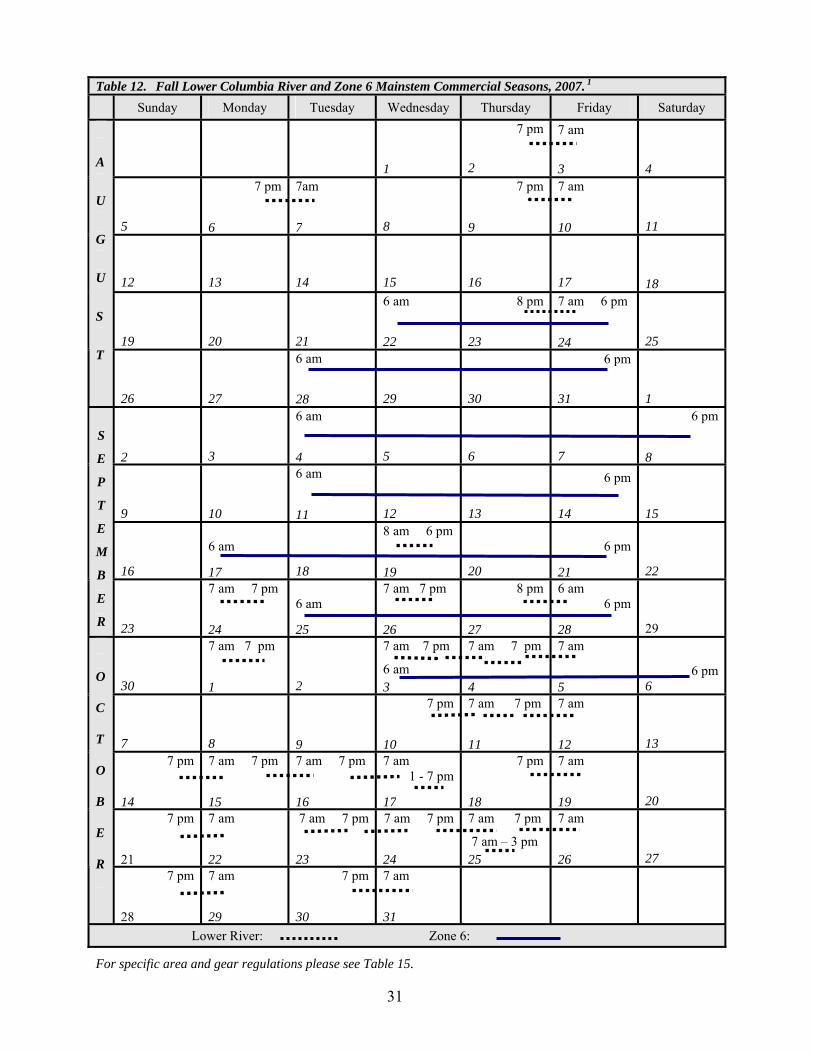
Table 12. Fall Lower Columbia River and Zone 6 Mainstem Commercial Seasons, 2007. 1
Sunday Monday Tuesday Wednesday Thursday Friday Saturday
1
7 pm
2
7 am
3
4
5
7 pm
6
7am
7 8
7 pm
9
7 am
10 11 12
13
14
15
16
17
18
19 20
21
6 am
22
8 pm
23
7 am 6 pm
24 25
A U G U S T
26
27
6 am
28 29 30
6 pm
31 1
2
3
6 am
4
5
6
7
6 pm
8
9
10
6 am
11
31
12 13
6 pm 14
15
16
6 am 17
18
8 am 6 pm
19
20
6 pm
21
22
S
E
P
T
E
M
B
E
R 23
7 am 7 pm
24
6 am
25
7 am 7 pm
26
8 pm
27
6 am 6 pm
28 29
30
7 am 7 pm
1 2
7 am 7 pm
6 am 3
7 am 7 pm
4
7 am
56 pm
6
7
8
9
7 pm
10
7 am 7 pm
11
7 am
12
13 7 pm
14
7 am 7 pm
15
7 am 7 pm
16
7 am 1 - 7 pm
17
7 pm
18
7 am
19
20
7 pm
21
7 am
22
7 am 7 pm
23
7 am 7 pm
24
7 am 7 pm
7 am – 3 pm 25
7 am
26 27
O
C
T
O
B
E
R
7 pm
28
7 am
29
7 pm 7 am
30 31 Lower River: Zone 6:
For specific area and gear regulations please see Table 15.
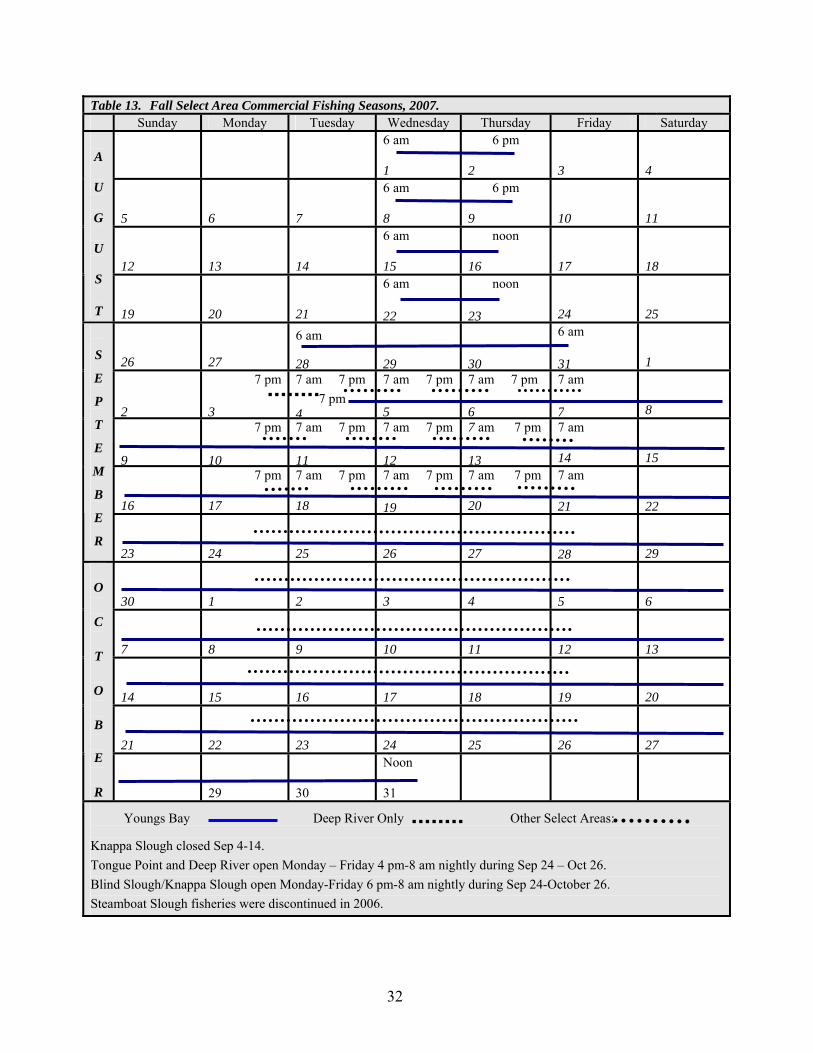
Table 13. Fall Select Area Commercial Fishing Seasons, 2007. Sunday Monday Tuesday Wednesday Thursday Friday Saturday
6 am
32
1
6 pm
2
3
4
5 6
7
6 am 8
6 pm
9
10 11
12
13
14
6 am 15
noon
16
17
18
A
U
G
U
S
T 19 20 21
6 am 22
noon
23 24 25
26
27
6 am
28
29
30
6 am
31 1
2
7 pm
3
7 am 7 pm 7 pm
4
7 am 7 pm
5
7 am 7 pm
6
7 am
7 8 9
7 pm 10
7 am 7 pm 11
7 am 7 pm 12
7 am 7 pm 13
7 am 14
15
16
7 pm 17
7 am 7 pm 18
7 am 7 pm 19
7 am 7 pm 20
7 am
21
22
S
E
P
T
E
M
B
E
R
23
24
25
26
27
28 29
30
1
2 3 4
5
6
7
8
9
10
11
12
13
14
15 16
17
18
19 20
21
22
23
24
25
26
27
O
C
T
O
B
E
R
30
Noon 31 29
Youngs Bay Deep River Only Other Select Areas: Knappa Slough closed Sep 4-14. Tongue Point and Deep River open Monday – Friday 4 pm-8 am nightly during Sep 24 – Oct 26. Blind Slough/Knappa Slough open Monday-Friday 6 pm-8 am nightly during Sep 24-October 26. Steamboat Slough fisheries were discontinued in 2006.
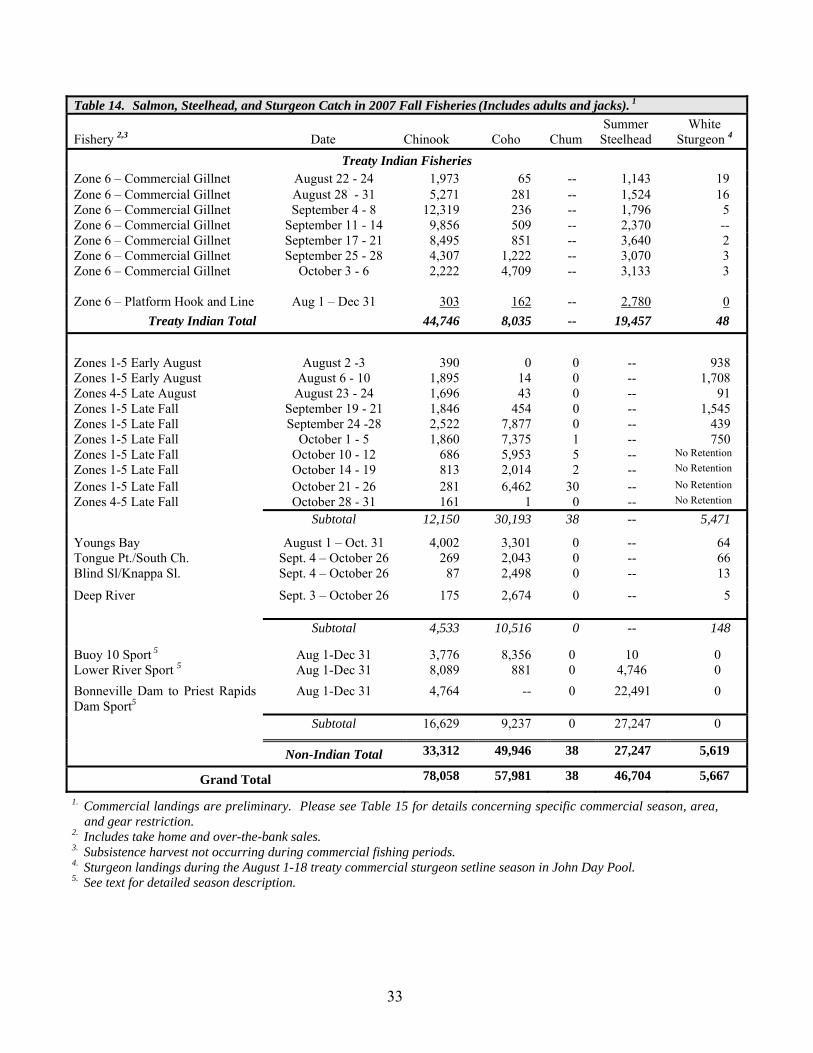
33
Table 14. Salmon, Steelhead, and Sturgeon Catch in 2007 Fall Fisheries (Includes adults and jacks). 1
Fishery 2,3 Date Chinook Coho Chum Summer
Steelhead White
Sturgeon 4
Treaty Indian Fisheries Zone 6 – Commercial Gillnet August 22 - 24 1,973 65 -- 1,143 19 Zone 6 – Commercial Gillnet August 28 - 31 5,271 281 -- 1,524 16 Zone 6 – Commercial Gillnet September 4 - 8 12,319 236 -- 1,796 5 Zone 6 – Commercial Gillnet September 11 - 14 9,856 509 -- 2,370 -- Zone 6 – Commercial Gillnet September 17 - 21 8,495 851 -- 3,640 2 Zone 6 – Commercial Gillnet September 25 - 28 4,307 1,222 -- 3,070 3 Zone 6 – Commercial Gillnet October 3 - 6 2,222 4,709 -- 3,133 3 Zone 6 – Platform Hook and Line Aug 1 – Dec 31 303 162 -- 2,780 0
Treaty Indian Total 44,746 8,035 -- 19,457 48
Zones 1-5 Early August August 2 -3 390 0 0 -- 938 Zones 1-5 Early August August 6 - 10 1,895 14 0 -- 1,708 Zones 4-5 Late August August 23 - 24 1,696 43 0 -- 91 Zones 1-5 Late Fall September 19 - 21 1,846 454 0 -- 1,545 Zones 1-5 Late Fall September 24 -28 2,522 7,877 0 -- 439 Zones 1-5 Late Fall October 1 - 5 1,860 7,375 1 -- 750 Zones 1-5 Late Fall October 10 - 12 686 5,953 5 -- No Retention
Zones 1-5 Late Fall October 14 - 19 813 2,014 2 -- No Retention
Zones 1-5 Late Fall October 21 - 26 281 6,462 30 -- No Retention
Zones 4-5 Late Fall October 28 - 31 161 1 0 -- No Retention
Subtotal 12,150 30,193 38 -- 5,471
Youngs Bay August 1 – Oct. 31 4,002 3,301 0 -- 64 Tongue Pt./South Ch. Sept. 4 – October 26 269 2,043 0 -- 66 Blind Sl/Knappa Sl. Sept. 4 – October 26 87 2,498 0 -- 13
Deep River Sept. 3 – October 26 175 2,674 0 -- 5 Subtotal 4,533 10,516 0 -- 148
Buoy 10 Sport 5 Aug 1-Dec 31 3,776 8,356 0 10 0 Lower River Sport 5 Aug 1-Dec 31 8,089 881 0 4,746 0 Bonneville Dam to Priest Rapids Dam Sport5
Aug 1-Dec 31 4,764 -- 0 22,491 0
Subtotal 16,629 9,237 0 27,247 0
Non-Indian Total 33,312 49,946 38 27,247 5,619
Grand Total 78,058 57,981 38 46,704 5,667
1. Commercial landings are preliminary. Please see Table 15 for details concerning specific commercial season, area, and gear restriction.
2. Includes take home and over-the-bank sales. 3. Subsistence harvest not occurring during commercial fishing periods. 4. Sturgeon landings during the August 1-18 treaty commercial sturgeon setline season in John Day Pool. 5. See text for detailed season description.
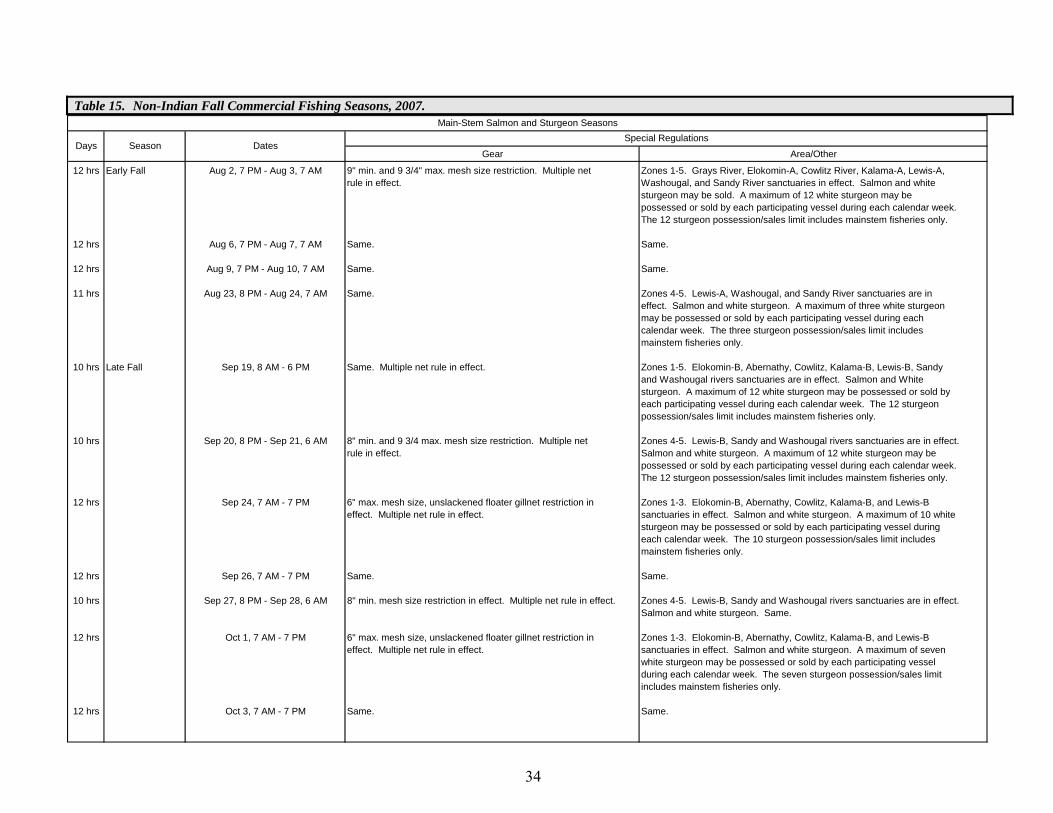
Table 15. Non-Indian Fall Commercial Fishing Seasons, 2007.
Gear Area/Other
12 hrs Early Fall Aug 2, 7 PM - Aug 3, 7 AM 9" min. and 9 3/4" max. mesh size restriction. Multiple net Zones 1-5. Grays River, Elokomin-A, Cowlitz River, Kalama-A, Lewis-A,rule in effect. Washougal, and Sandy River sanctuaries in effect. Salmon and white
sturgeon may be sold. A maximum of 12 white sturgeon may bepossessed or sold by each participating vessel during each calendar week.The 12 sturgeon possession/sales limit includes mainstem fisheries only.
12 hrs Aug 6, 7 PM - Aug 7, 7 AM Same. Same.
12 hrs Aug 9, 7 PM - Aug 10, 7 AM Same. Same.
11 hrs Aug 23, 8 PM - Aug 24, 7 AM Same. Zones 4-5. Lewis-A, Washougal, and Sandy River sanctuaries are ineffect. Salmon and white sturgeon. A maximum of three white sturgeonmay be possessed or sold by each participating vessel during eachcalendar week. The three sturgeon possession/sales limit includesmainstem fisheries only.
10 hrs Late Fall Sep 19, 8 AM - 6 PM Same. Multiple net rule in effect. Zones 1-5. Elokomin-B, Abernathy, Cowlitz, Kalama-B, Lewis-B, Sandyand Washougal rivers sanctuaries are in effect. Salmon and Whitesturgeon. A maximum of 12 white sturgeon may be possessed or sold byeach participating vessel during each calendar week. The 12 sturgeonpossession/sales limit includes mainstem fisheries only.
10 hrs Sep 20, 8 PM - Sep 21, 6 AM 8" min. and 9 3/4 max. mesh size restriction. Multiple net Zones 4-5. Lewis-B, Sandy and Washougal rivers sanctuaries are in effect.rule in effect. Salmon and white sturgeon. A maximum of 12 white sturgeon may be
possessed or sold by each participating vessel during each calendar week.The 12 sturgeon possession/sales limit includes mainstem fisheries only.
12 hrs Sep 24, 7 AM - 7 PM 6" max. mesh size, unslackened floater gillnet restriction in Zones 1-3. Elokomin-B, Abernathy, Cowlitz, Kalama-B, and Lewis-Beffect. Multiple net rule in effect. sanctuaries in effect. Salmon and white sturgeon. A maximum of 10 white
sturgeon may be possessed or sold by each participating vessel duringeach calendar week. The 10 sturgeon possession/sales limit includesmainstem fisheries only.
12 hrs Sep 26, 7 AM - 7 PM Same. Same.
10 hrs Sep 27, 8 PM - Sep 28, 6 AM 8" min. mesh size restriction in effect. Multiple net rule in effect. Zones 4-5. Lewis-B, Sandy and Washougal rivers sanctuaries are in effect.Salmon and white sturgeon. Same.
12 hrs Oct 1, 7 AM - 7 PM 6" max. mesh size, unslackened floater gillnet restriction in Zones 1-3. Elokomin-B, Abernathy, Cowlitz, Kalama-B, and Lewis-Beffect. Multiple net rule in effect. sanctuaries in effect. Salmon and white sturgeon. A maximum of seven
white sturgeon may be possessed or sold by each participating vesselduring each calendar week. The seven sturgeon possession/sales limitincludes mainstem fisheries only.
12 hrs Oct 3, 7 AM - 7 PM Same. Same.
Special RegulationsMain-Stem Salmon and Sturgeon Seasons
DatesSeasonDays
34
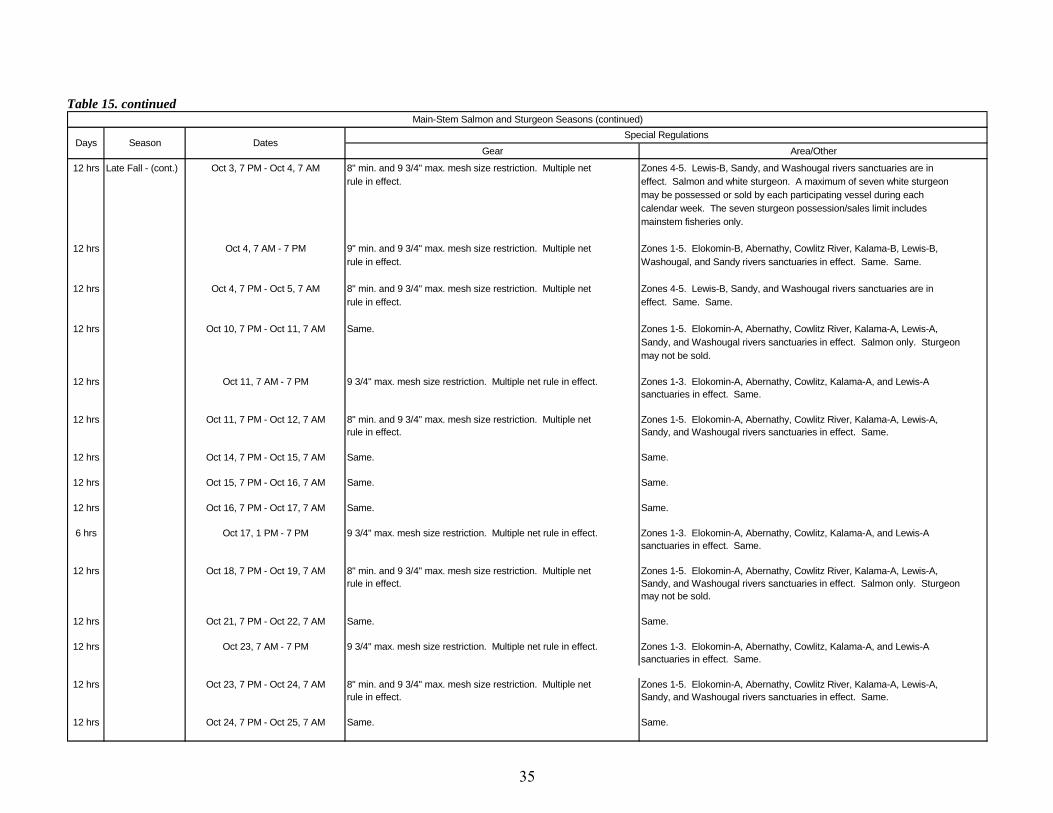
Table 15. continued
Gear Area/Other
12 hrs Late Fall - (cont.) Oct 3, 7 PM - Oct 4, 7 AM 8" min. and 9 3/4" max. mesh size restriction. Multiple net Zones 4-5. Lewis-B, Sandy, and Washougal rivers sanctuaries are in rule in effect. effect. Salmon and white sturgeon. A maximum of seven white sturgeon
may be possessed or sold by each participating vessel during eachcalendar week. The seven sturgeon possession/sales limit includesmainstem fisheries only.
12 hrs Oct 4, 7 AM - 7 PM 9" min. and 9 3/4" max. mesh size restriction. Multiple net Zones 1-5. Elokomin-B, Abernathy, Cowlitz River, Kalama-B, Lewis-B,rule in effect. Washougal, and Sandy rivers sanctuaries in effect. Same. Same.
12 hrs Oct 4, 7 PM - Oct 5, 7 AM 8" min. and 9 3/4" max. mesh size restriction. Multiple net Zones 4-5. Lewis-B, Sandy, and Washougal rivers sanctuaries are in rule in effect. effect. Same. Same.
12 hrs Oct 10, 7 PM - Oct 11, 7 AM Same. Zones 1-5. Elokomin-A, Abernathy, Cowlitz River, Kalama-A, Lewis-A,Sandy, and Washougal rivers sanctuaries in effect. Salmon only. Sturgeonmay not be sold.
12 hrs Oct 11, 7 AM - 7 PM 9 3/4" max. mesh size restriction. Multiple net rule in effect. Zones 1-3. Elokomin-A, Abernathy, Cowlitz, Kalama-A, and Lewis-Asanctuaries in effect. Same.
12 hrs Oct 11, 7 PM - Oct 12, 7 AM 8" min. and 9 3/4" max. mesh size restriction. Multiple net Zones 1-5. Elokomin-A, Abernathy, Cowlitz River, Kalama-A, Lewis-A,rule in effect. Sandy, and Washougal rivers sanctuaries in effect. Same.
12 hrs Oct 14, 7 PM - Oct 15, 7 AM Same. Same.
12 hrs Oct 15, 7 PM - Oct 16, 7 AM Same. Same.
12 hrs Oct 16, 7 PM - Oct 17, 7 AM Same. Same.
6 hrs Oct 17, 1 PM - 7 PM 9 3/4" max. mesh size restriction. Multiple net rule in effect. Zones 1-3. Elokomin-A, Abernathy, Cowlitz, Kalama-A, and Lewis-Asanctuaries in effect. Same.
12 hrs Oct 18, 7 PM - Oct 19, 7 AM 8" min. and 9 3/4" max. mesh size restriction. Multiple net Zones 1-5. Elokomin-A, Abernathy, Cowlitz River, Kalama-A, Lewis-A,rule in effect. Sandy, and Washougal rivers sanctuaries in effect. Salmon only. Sturgeon
may not be sold.
12 hrs Oct 21, 7 PM - Oct 22, 7 AM Same. Same.
12 hrs Oct 23, 7 AM - 7 PM 9 3/4" max. mesh size restriction. Multiple net rule in effect. Zones 1-3. Elokomin-A, Abernathy, Cowlitz, Kalama-A, and Lewis-Asanctuaries in effect. Same.
12 hrs Oct 23, 7 PM - Oct 24, 7 AM 8" min. and 9 3/4" max. mesh size restriction. Multiple net Zones 1-5. Elokomin-A, Abernathy, Cowlitz River, Kalama-A, Lewis-A,rule in effect. Sandy, and Washougal rivers sanctuaries in effect. Same.
12 hrs Oct 24, 7 PM - Oct 25, 7 AM Same. Same.
Main-Stem Salmon and Sturgeon Seasons (continued)
Days Season DatesSpecial Regulations
35
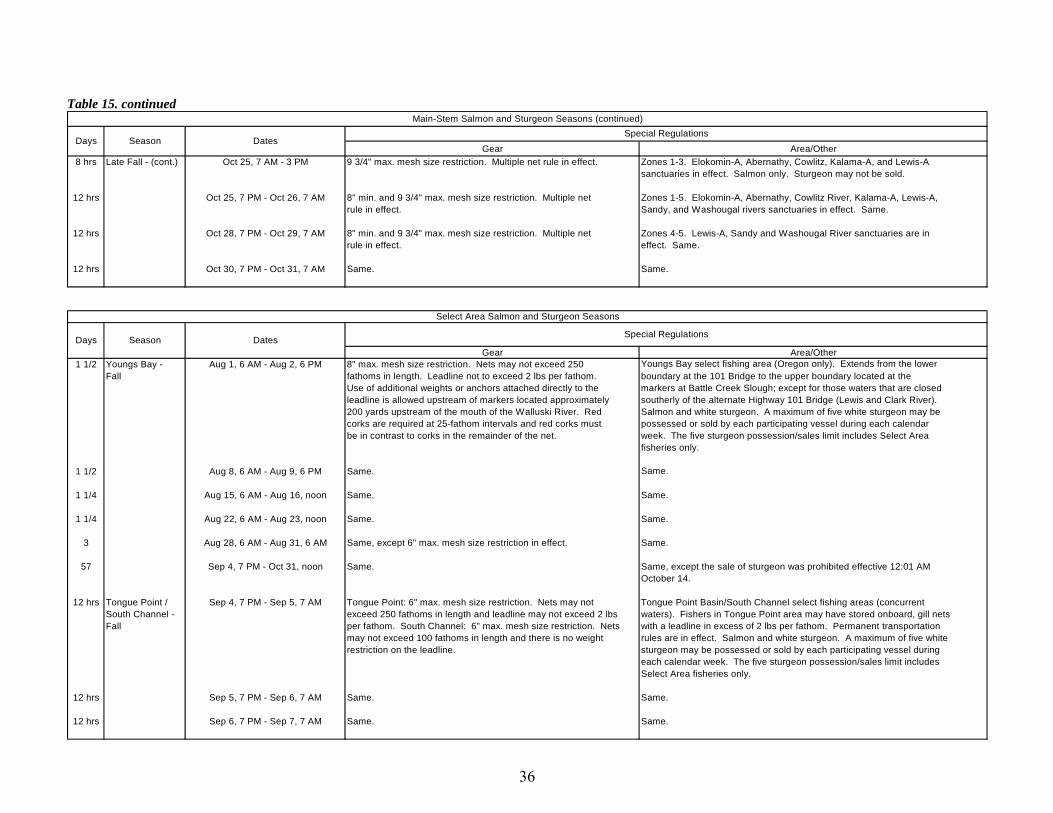
Table 15. continued
Gear Area/Other8 hrs Late Fall - (cont.) Oct 25, 7 AM - 3 PM 9 3/4" max. mesh size restriction. Multiple net rule in effect. Zones 1-3. Elokomin-A, Abernathy, Cowlitz, Kalama-A, and Lewis-A
sanctuaries in effect. Salmon only. Sturgeon may not be sold.
12 hrs Oct 25, 7 PM - Oct 26, 7 AM 8" min. and 9 3/4" max. mesh size restriction. Multiple net Zones 1-5. Elokomin-A, Abernathy, Cowlitz River, Kalama-A, Lewis-A,rule in effect. Sandy, and Washougal rivers sanctuaries in effect. Same.
12 hrs Oct 28, 7 PM - Oct 29, 7 AM 8" min. and 9 3/4" max. mesh size restriction. Multiple net Zones 4-5. Lewis-A, Sandy and Washougal River sanctuaries are in rule in effect. effect. Same.
12 hrs Oct 30, 7 PM - Oct 31, 7 AM Same. Same.
Gear Area/Other1 1/2 Youngs Bay - Aug 1, 6 AM - Aug 2, 6 PM 8" max. mesh size restriction. Nets may not exceed 250 Youngs Bay select fishing area (Oregon only). Extends from the lower
Fall fathoms in length. Leadline not to exceed 2 lbs per fathom. boundary at the 101 Bridge to the upper boundary located at theUse of additional weights or anchors attached directly to the markers at Battle Creek Slough; except for those waters that are closedleadline is allowed upstream of markers located approximately southerly of the alternate Highway 101 Bridge (Lewis and Clark River).200 yards upstream of the mouth of the Walluski River. Red Salmon and white sturgeon. A maximum of five white sturgeon may becorks are required at 25-fathom intervals and red corks must possessed or sold by each participating vessel during each calendarbe in contrast to corks in the remainder of the net. week. The five sturgeon possession/sales limit includes Select Area
fisheries only.
1 1/2 Aug 8, 6 AM - Aug 9, 6 PM Same. Same.
1 1/4 Aug 15, 6 AM - Aug 16, noon Same. Same.
1 1/4 Aug 22, 6 AM - Aug 23, noon Same. Same.
3 Aug 28, 6 AM - Aug 31, 6 AM Same, except 6" max. mesh size restriction in effect. Same.
57 Sep 4, 7 PM - Oct 31, noon Same. Same, except the sale of sturgeon was prohibited effective 12:01 AMOctober 14.
12 hrs Tongue Point / Sep 4, 7 PM - Sep 5, 7 AM Tongue Point: 6" max. mesh size restriction. Nets may not Tongue Point Basin/South Channel select fishing areas (concurrentSouth Channel - exceed 250 fathoms in length and leadline may not exceed 2 lbs waters). Fishers in Tongue Point area may have stored onboard, gill netsFall per fathom. South Channel: 6" max. mesh size restriction. Nets with a leadline in excess of 2 lbs per fathom. Permanent transportation
may not exceed 100 fathoms in length and there is no weight rules are in effect. Salmon and white sturgeon. A maximum of five white restriction on the leadline. sturgeon may be possessed or sold by each participating vessel during
each calendar week. The five sturgeon possession/sales limit includesSelect Area fisheries only.
12 hrs Sep 5, 7 PM - Sep 6, 7 AM Same. Same.
12 hrs Sep 6, 7 PM - Sep 7, 7 AM Same. Same.
Select Area Salmon and Sturgeon Seasons
Days Season Dates Special Regulations
Special RegulationsMain-Stem Salmon and Sturgeon Seasons (continued)
Days Season Dates
36
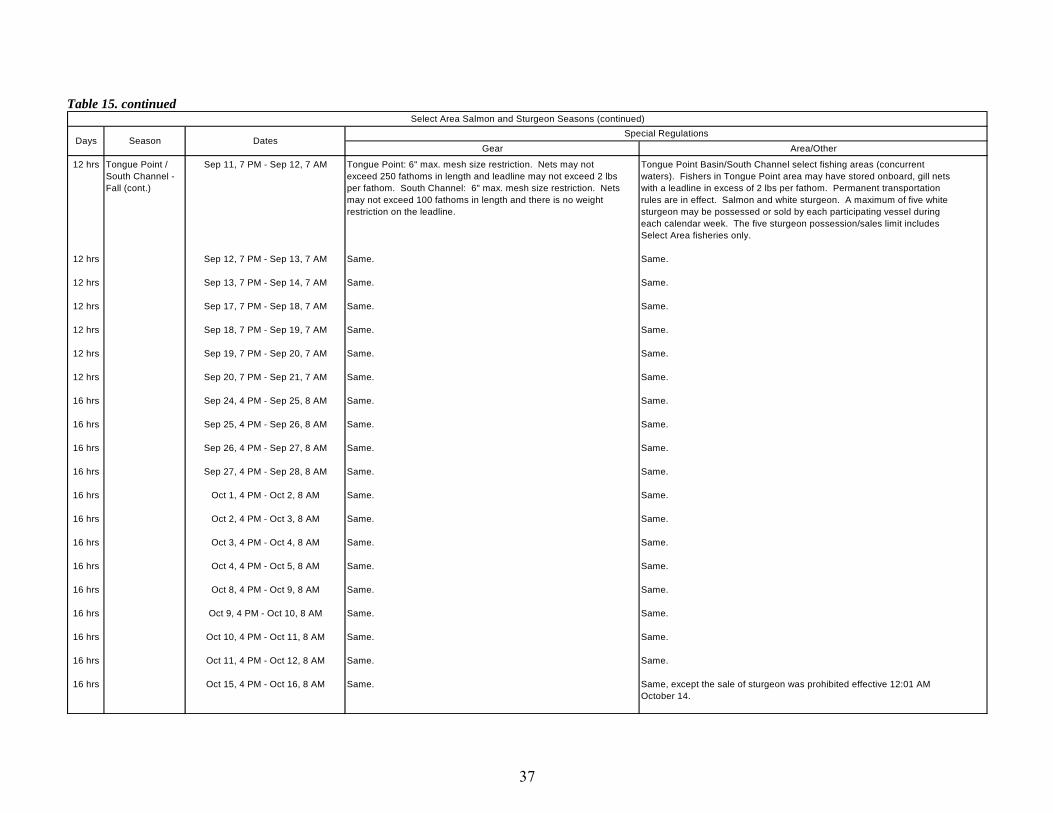
Table 15. continued
Gear Area/Other
12 hrs Tongue Point / Sep 11, 7 PM - Sep 12, 7 AM Tongue Point: 6" max. mesh size restriction. Nets may not Tongue Point Basin/South Channel select fishing areas (concurrentSouth Channel - exceed 250 fathoms in length and leadline may not exceed 2 lbs waters). Fishers in Tongue Point area may have stored onboard, gill netsFall (cont.) per fathom. South Channel: 6" max. mesh size restriction. Nets with a leadline in excess of 2 lbs per fathom. Permanent transportation
may not exceed 100 fathoms in length and there is no weight rules are in effect. Salmon and white sturgeon. A maximum of five white restriction on the leadline. sturgeon may be possessed or sold by each participating vessel during
each calendar week. The five sturgeon possession/sales limit includesSelect Area fisheries only.
12 hrs Sep 12, 7 PM - Sep 13, 7 AM Same. Same.
12 hrs Sep 13, 7 PM - Sep 14, 7 AM Same. Same.
12 hrs Sep 17, 7 PM - Sep 18, 7 AM Same. Same.
12 hrs Sep 18, 7 PM - Sep 19, 7 AM Same. Same.
12 hrs Sep 19, 7 PM - Sep 20, 7 AM Same. Same.
12 hrs Sep 20, 7 PM - Sep 21, 7 AM Same. Same.
16 hrs Sep 24, 4 PM - Sep 25, 8 AM Same. Same.
16 hrs Sep 25, 4 PM - Sep 26, 8 AM Same. Same.
16 hrs Sep 26, 4 PM - Sep 27, 8 AM Same. Same.
16 hrs Sep 27, 4 PM - Sep 28, 8 AM Same. Same.
16 hrs Oct 1, 4 PM - Oct 2, 8 AM Same. Same.
16 hrs Oct 2, 4 PM - Oct 3, 8 AM Same. Same.
16 hrs Oct 3, 4 PM - Oct 4, 8 AM Same. Same.
16 hrs Oct 4, 4 PM - Oct 5, 8 AM Same. Same.
16 hrs Oct 8, 4 PM - Oct 9, 8 AM Same. Same.
16 hrs Oct 9, 4 PM - Oct 10, 8 AM Same. Same.
16 hrs Oct 10, 4 PM - Oct 11, 8 AM Same. Same.
16 hrs Oct 11, 4 PM - Oct 12, 8 AM Same. Same.
16 hrs Oct 15, 4 PM - Oct 16, 8 AM Same. Same, except the sale of sturgeon was prohibited effective 12:01 AMOctober 14.
Select Area Salmon and Sturgeon Seasons (continued)Special Regulations
Days Season Dates
37
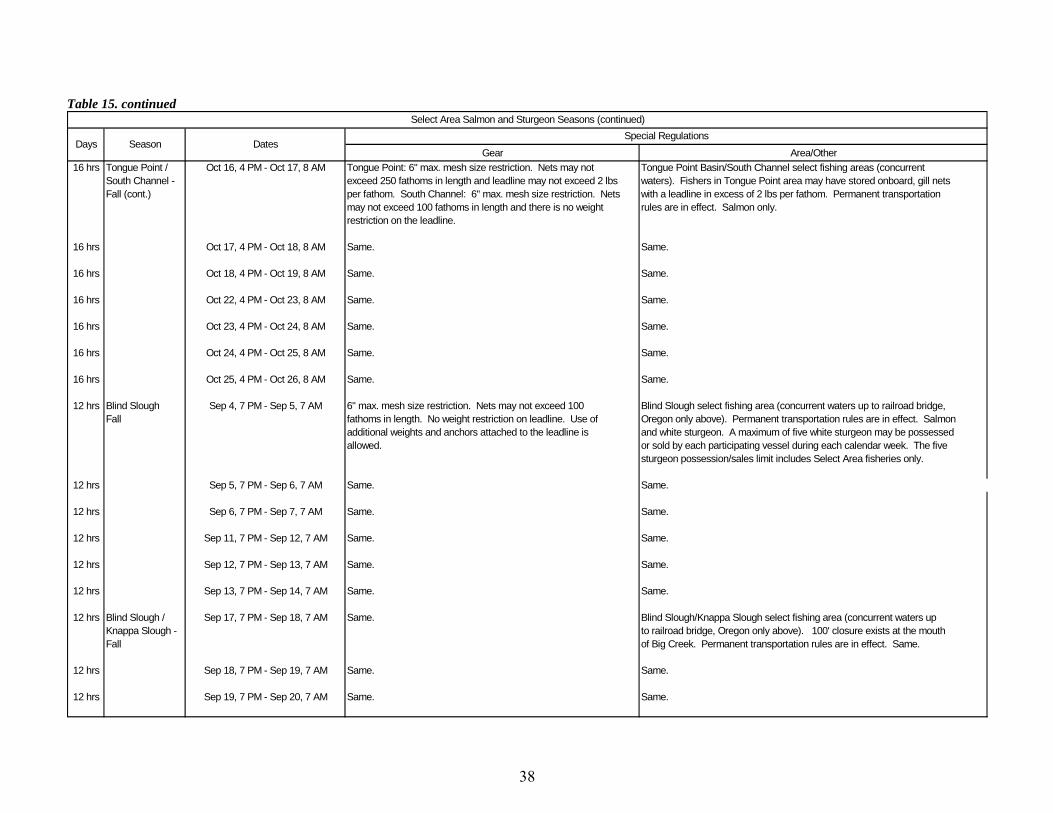
Table 15. continued
Gear Area/Other16 hrs Tongue Point / Oct 16, 4 PM - Oct 17, 8 AM Tongue Point: 6" max. mesh size restriction. Nets may not Tongue Point Basin/South Channel select fishing areas (concurrent
South Channel - exceed 250 fathoms in length and leadline may not exceed 2 lbs waters). Fishers in Tongue Point area may have stored onboard, gill netsFall (cont.) per fathom. South Channel: 6" max. mesh size restriction. Nets with a leadline in excess of 2 lbs per fathom. Permanent transportation
may not exceed 100 fathoms in length and there is no weight rules are in effect. Salmon only.restriction on the leadline.
16 hrs Oct 17, 4 PM - Oct 18, 8 AM Same. Same.
16 hrs Oct 18, 4 PM - Oct 19, 8 AM Same. Same.
16 hrs Oct 22, 4 PM - Oct 23, 8 AM Same. Same.
16 hrs Oct 23, 4 PM - Oct 24, 8 AM Same. Same.
16 hrs Oct 24, 4 PM - Oct 25, 8 AM Same. Same.
16 hrs Oct 25, 4 PM - Oct 26, 8 AM Same. Same.
12 hrs Blind Slough Sep 4, 7 PM - Sep 5, 7 AM 6" max. mesh size restriction. Nets may not exceed 100 Blind Slough select fishing area (concurrent waters up to railroad bridge,Fall fathoms in length. No weight restriction on leadline. Use of Oregon only above). Permanent transportation rules are in effect. Salmon
additional weights and anchors attached to the leadline is and white sturgeon. A maximum of five white sturgeon may be possessedallowed. or sold by each participating vessel during each calendar week. The five
sturgeon possession/sales limit includes Select Area fisheries only.
12 hrs Sep 5, 7 PM - Sep 6, 7 AM Same. Same.
12 hrs Sep 6, 7 PM - Sep 7, 7 AM Same. Same.
12 hrs Sep 11, 7 PM - Sep 12, 7 AM Same. Same.
12 hrs Sep 12, 7 PM - Sep 13, 7 AM Same. Same.
12 hrs Sep 13, 7 PM - Sep 14, 7 AM Same. Same.
12 hrs Blind Slough / Sep 17, 7 PM - Sep 18, 7 AM Same. Blind Slough/Knappa Slough select fishing area (concurrent waters upKnappa Slough - to railroad bridge, Oregon only above). 100' closure exists at the mouthFall of Big Creek. Permanent transportation rules are in effect. Same.
12 hrs Sep 18, 7 PM - Sep 19, 7 AM Same. Same.
12 hrs Sep 19, 7 PM - Sep 20, 7 AM Same. Same.
Special RegulationsSeason Dates
Select Area Salmon and Sturgeon Seasons (continued)
Days
38
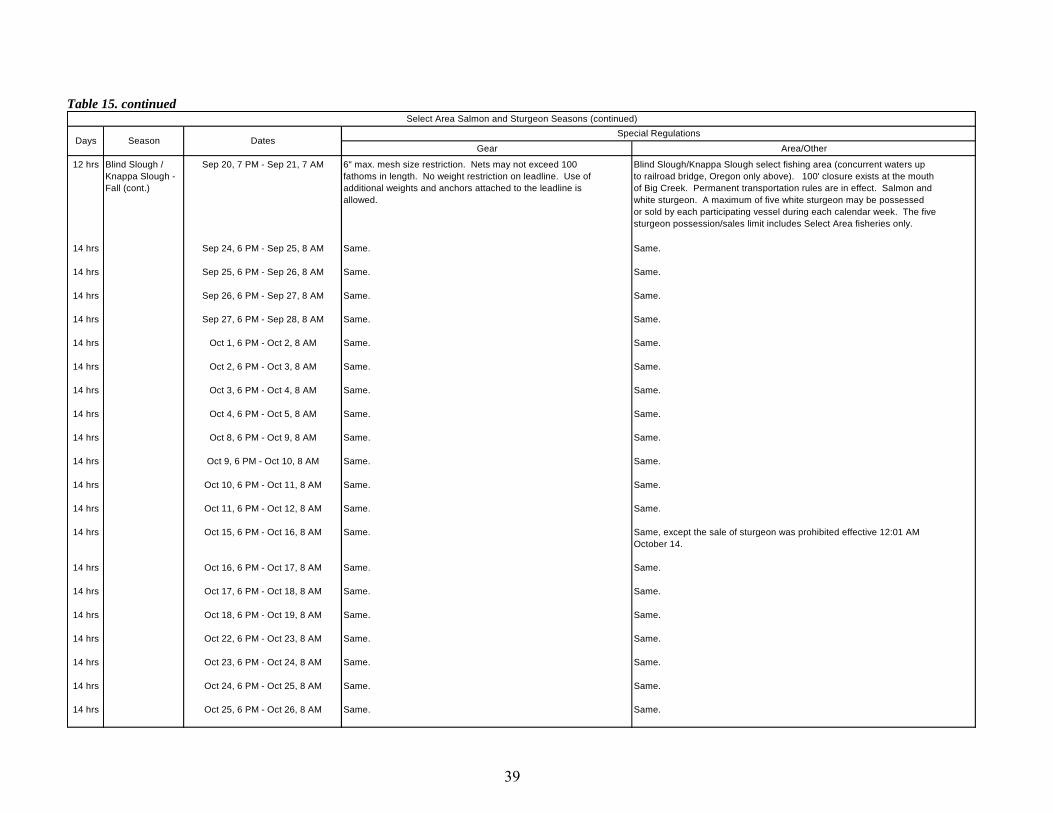
Table 15. continued
Gear Area/Other
12 hrs Blind Slough / Sep 20, 7 PM - Sep 21, 7 AM 6" max. mesh size restriction. Nets may not exceed 100 Blind Slough/Knappa Slough select fishing area (concurrent waters upKnappa Slough - fathoms in length. No weight restriction on leadline. Use of to railroad bridge, Oregon only above). 100' closure exists at the mouthFall (cont.) additional weights and anchors attached to the leadline is of Big Creek. Permanent transportation rules are in effect. Salmon and
allowed. white sturgeon. A maximum of five white sturgeon may be possessedor sold by each participating vessel during each calendar week. The fivesturgeon possession/sales limit includes Select Area fisheries only.
14 hrs Sep 24, 6 PM - Sep 25, 8 AM Same. Same.
14 hrs Sep 25, 6 PM - Sep 26, 8 AM Same. Same.
14 hrs Sep 26, 6 PM - Sep 27, 8 AM Same. Same.
14 hrs Sep 27, 6 PM - Sep 28, 8 AM Same. Same.
14 hrs Oct 1, 6 PM - Oct 2, 8 AM Same. Same.
14 hrs Oct 2, 6 PM - Oct 3, 8 AM Same. Same.
14 hrs Oct 3, 6 PM - Oct 4, 8 AM Same. Same.
14 hrs Oct 4, 6 PM - Oct 5, 8 AM Same. Same.
14 hrs Oct 8, 6 PM - Oct 9, 8 AM Same. Same.
14 hrs Oct 9, 6 PM - Oct 10, 8 AM Same. Same.
14 hrs Oct 10, 6 PM - Oct 11, 8 AM Same. Same.
14 hrs Oct 11, 6 PM - Oct 12, 8 AM Same. Same.
14 hrs Oct 15, 6 PM - Oct 16, 8 AM Same. Same, except the sale of sturgeon was prohibited effective 12:01 AMOctober 14.
14 hrs Oct 16, 6 PM - Oct 17, 8 AM Same. Same.
14 hrs Oct 17, 6 PM - Oct 18, 8 AM Same. Same.
14 hrs Oct 18, 6 PM - Oct 19, 8 AM Same. Same.
14 hrs Oct 22, 6 PM - Oct 23, 8 AM Same. Same.
14 hrs Oct 23, 6 PM - Oct 24, 8 AM Same. Same.
14 hrs Oct 24, 6 PM - Oct 25, 8 AM Same. Same.
14 hrs Oct 25, 6 PM - Oct 26, 8 AM Same. Same.
Select Area Salmon and Sturgeon Seasons (continued)
Days Season DatesSpecial Regulations
39
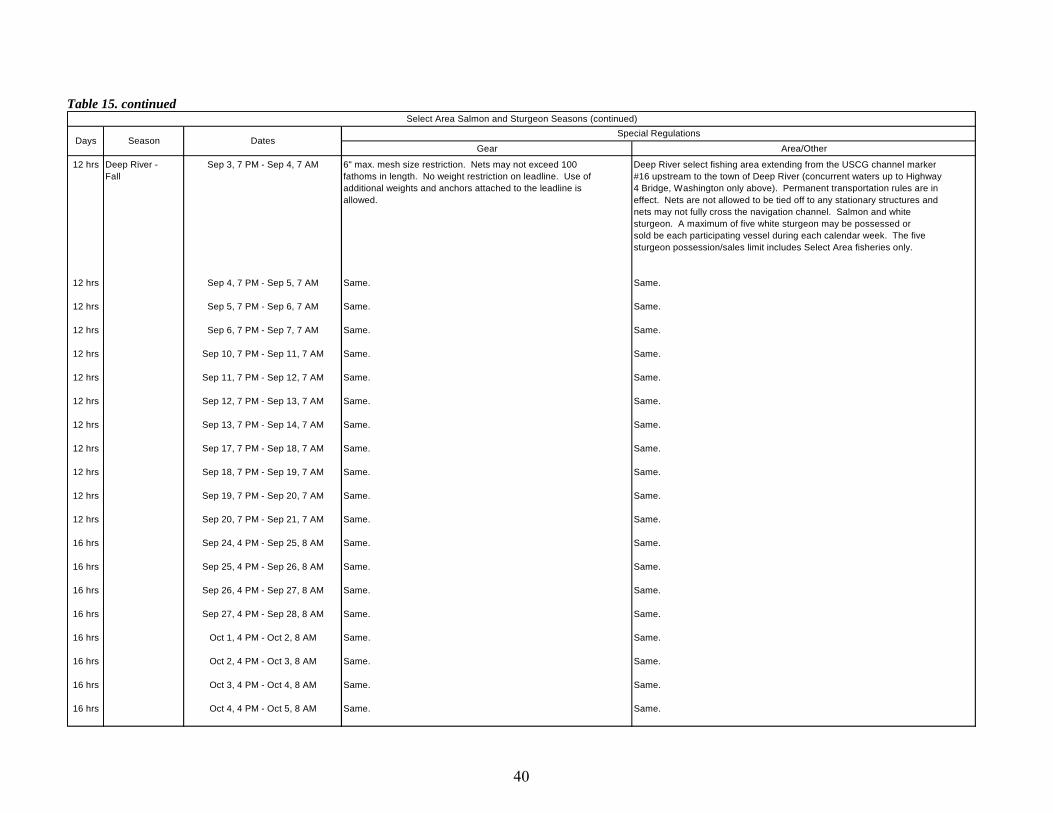
Table 15. continued
Gear Area/Other
12 hrs Deep River - Sep 3, 7 PM - Sep 4, 7 AM 6" max. mesh size restriction. Nets may not exceed 100 Deep River select fishing area extending from the USCG channel marker Fall fathoms in length. No weight restriction on leadline. Use of #16 upstream to the town of Deep River (concurrent waters up to Highway
additional weights and anchors attached to the leadline is 4 Bridge, Washington only above). Permanent transportation rules are inallowed. effect. Nets are not allowed to be tied off to any stationary structures and
nets may not fully cross the navigation channel. Salmon and whitesturgeon. A maximum of five white sturgeon may be possessed orsold be each participating vessel during each calendar week. The fivesturgeon possession/sales limit includes Select Area fisheries only.
12 hrs Sep 4, 7 PM - Sep 5, 7 AM Same. Same.
12 hrs Sep 5, 7 PM - Sep 6, 7 AM Same. Same.
12 hrs Sep 6, 7 PM - Sep 7, 7 AM Same. Same.
12 hrs Sep 10, 7 PM - Sep 11, 7 AM Same. Same.
12 hrs Sep 11, 7 PM - Sep 12, 7 AM Same. Same.
12 hrs Sep 12, 7 PM - Sep 13, 7 AM Same. Same.
12 hrs Sep 13, 7 PM - Sep 14, 7 AM Same. Same.
12 hrs Sep 17, 7 PM - Sep 18, 7 AM Same. Same.
12 hrs Sep 18, 7 PM - Sep 19, 7 AM Same. Same.
12 hrs Sep 19, 7 PM - Sep 20, 7 AM Same. Same.
12 hrs Sep 20, 7 PM - Sep 21, 7 AM Same. Same.
16 hrs Sep 24, 4 PM - Sep 25, 8 AM Same. Same.
16 hrs Sep 25, 4 PM - Sep 26, 8 AM Same. Same.
16 hrs Sep 26, 4 PM - Sep 27, 8 AM Same. Same.
16 hrs Sep 27, 4 PM - Sep 28, 8 AM Same. Same.
16 hrs Oct 1, 4 PM - Oct 2, 8 AM Same. Same.
16 hrs Oct 2, 4 PM - Oct 3, 8 AM Same. Same.
16 hrs Oct 3, 4 PM - Oct 4, 8 AM Same. Same.
16 hrs Oct 4, 4 PM - Oct 5, 8 AM Same. Same.
Select Area Salmon and Sturgeon Seasons (continued)
DatesSeasonSpecial Regulations
Days
40
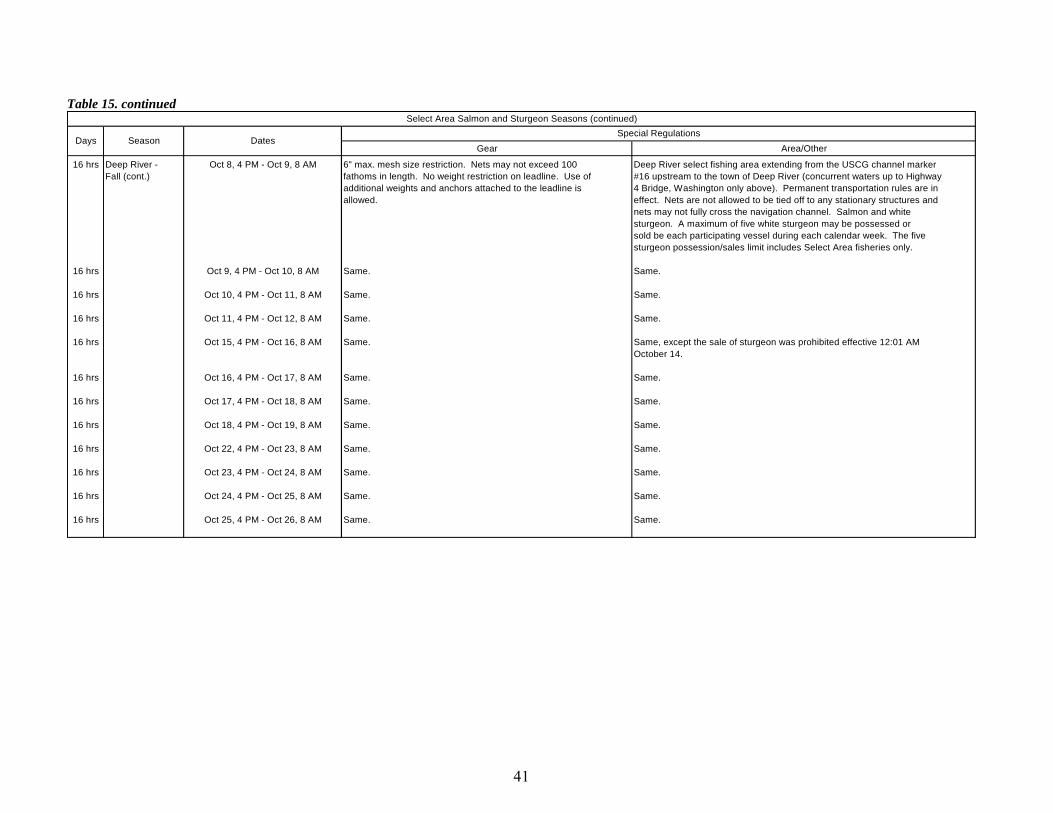
Table 15. continued
Gear Area/Other
16 hrs Deep River - Oct 8, 4 PM - Oct 9, 8 AM 6" max. mesh size restriction. Nets may not exceed 100 Deep River select fishing area extending from the USCG channel marker Fall (cont.) fathoms in length. No weight restriction on leadline. Use of #16 upstream to the town of Deep River (concurrent waters up to Highway
additional weights and anchors attached to the leadline is 4 Bridge, Washington only above). Permanent transportation rules are inallowed. effect. Nets are not allowed to be tied off to any stationary structures and
nets may not fully cross the navigation channel. Salmon and whitesturgeon. A maximum of five white sturgeon may be possessed orsold be each participating vessel during each calendar week. The fivesturgeon possession/sales limit includes Select Area fisheries only.
16 hrs Oct 9, 4 PM - Oct 10, 8 AM Same. Same.
16 hrs Oct 10, 4 PM - Oct 11, 8 AM Same. Same.
16 hrs Oct 11, 4 PM - Oct 12, 8 AM Same. Same.
16 hrs Oct 15, 4 PM - Oct 16, 8 AM Same. Same, except the sale of sturgeon was prohibited effective 12:01 AMOctober 14.
16 hrs Oct 16, 4 PM - Oct 17, 8 AM Same. Same.
16 hrs Oct 17, 4 PM - Oct 18, 8 AM Same. Same.
16 hrs Oct 18, 4 PM - Oct 19, 8 AM Same. Same.
16 hrs Oct 22, 4 PM - Oct 23, 8 AM Same. Same.
16 hrs Oct 23, 4 PM - Oct 24, 8 AM Same. Same.
16 hrs Oct 24, 4 PM - Oct 25, 8 AM Same. Same.
16 hrs Oct 25, 4 PM - Oct 26, 8 AM Same. Same.
Season
Select Area Salmon and Sturgeon Seasons (continued)Special Regulations
DatesDays
41
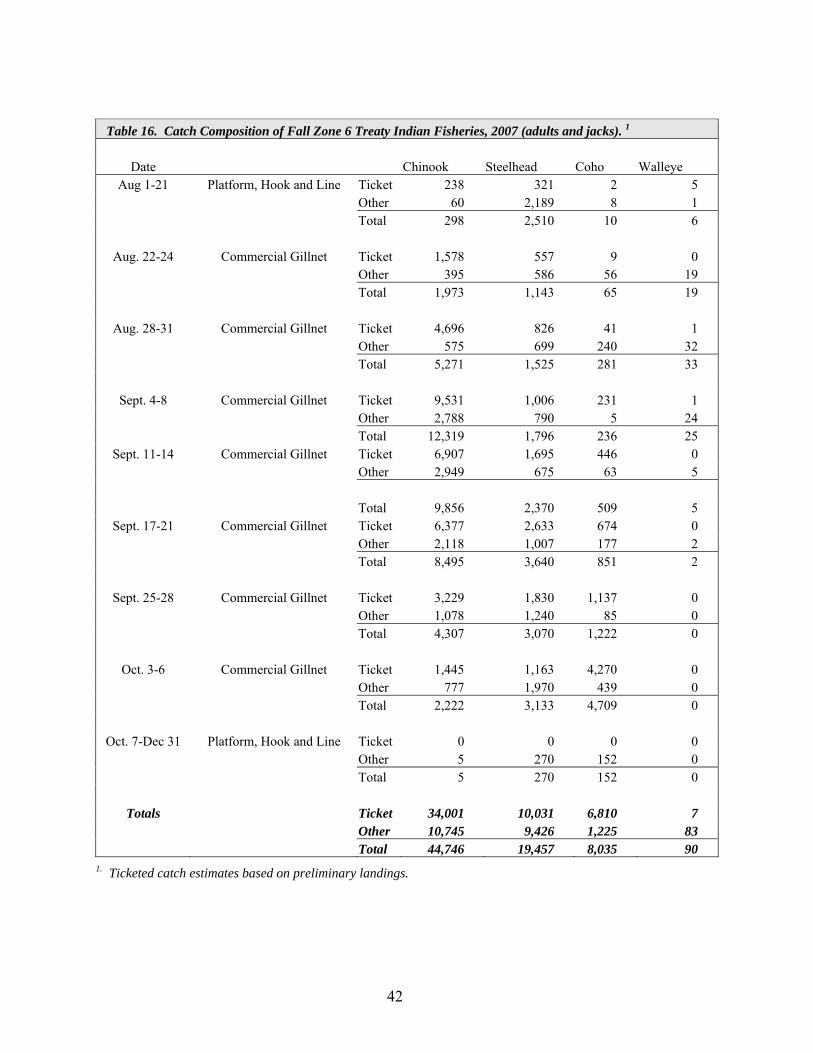
42
Table 16. Catch Composition of Fall Zone 6 Treaty Indian Fisheries, 2007 (adults and jacks). 1
Date Chinook Steelhead Coho Walleye
Aug 1-21 Platform, Hook and Line Ticket 238 321 2 5 Other 60 2,189 8 1 Total 298 2,510 10 6
Aug. 22-24 Commercial Gillnet Ticket 1,578 557 9 0 Other 395 586 56 19 Total 1,973 1,143 65 19
Aug. 28-31 Commercial Gillnet Ticket 4,696 826 41 1 Other 575 699 240 32 Total 5,271 1,525 281 33
Sept. 4-8 Commercial Gillnet Ticket 9,531 1,006 231 1 Other 2,788 790 5 24 Total 12,319 1,796 236 25
Sept. 11-14 Commercial Gillnet Ticket 6,907 1,695 446 0 Other 2,949 675 63 5 Total 9,856 2,370 509 5
Sept. 17-21 Commercial Gillnet Ticket 6,377 2,633 674 0 Other 2,118 1,007 177 2 Total 8,495 3,640 851 2
Sept. 25-28 Commercial Gillnet Ticket 3,229 1,830 1,137 0 Other 1,078 1,240 85 0 Total 4,307 3,070 1,222 0
Oct. 3-6 Commercial Gillnet Ticket 1,445 1,163 4,270 0 Other 777 1,970 439 0 Total 2,222 3,133 4,709 0
Oct. 7-Dec 31 Platform, Hook and Line Ticket 0 0 0 0 Other 5 270 152 0 Total 5 270 152 0
Totals Ticket 34,001 10,031 6,810 7 Other 10,745 9,426 1,225 83 Total 44,746 19,457 8,035 90
1. Ticketed catch estimates based on preliminary landings.
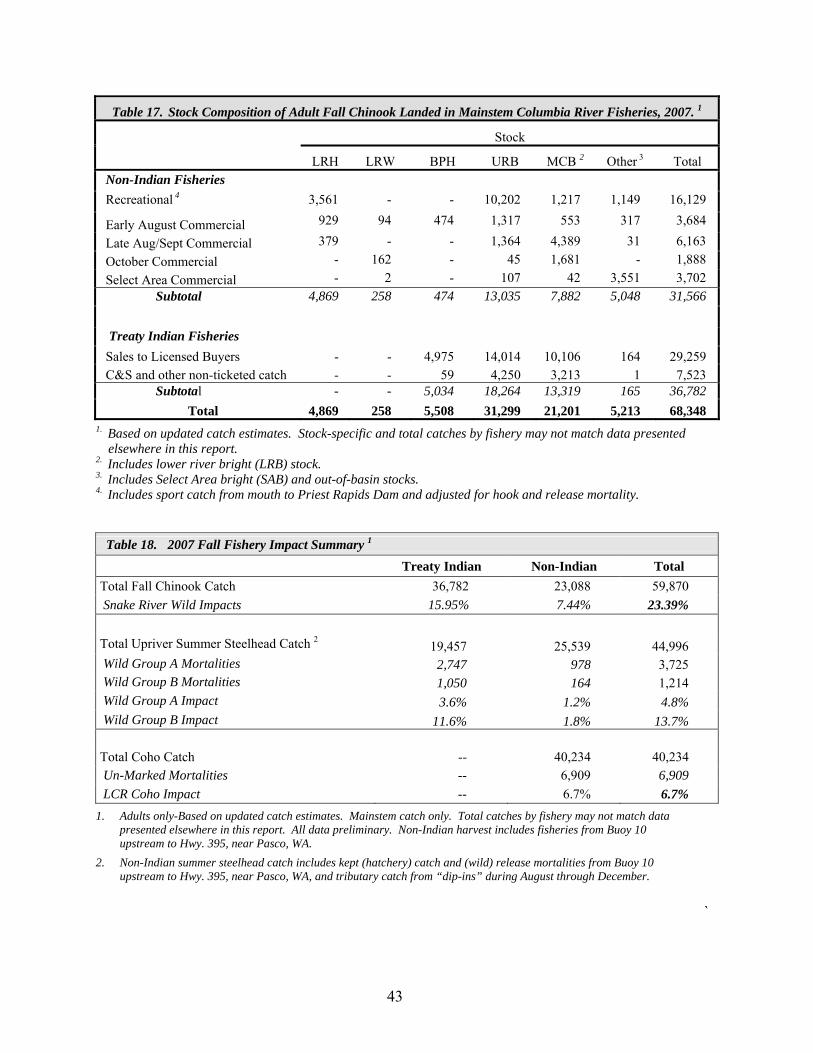
43
Table 17. Stock Composition of Adult Fall Chinook Landed in Mainstem Columbia River Fisheries, 2007. 1
Stock
LRH LRW BPH URB MCB 2 Other 3 Total Non-Indian Fisheries Recreational 4 3,561 - - 10,202 1,217 1,149 16,129
Early August Commercial 929 94 474 1,317 553 317 3,684
Late Aug/Sept Commercial 379 - - 1,364 4,389 31 6,163 October Commercial - 162 - 45 1,681 - 1,888 Select Area Commercial - 2 - 107 42 3,551 3,702
Subtotal 4,869 258 474 13,035 7,882 5,048 31,566 Treaty Indian Fisheries Sales to Licensed Buyers - - 4,975 14,014 10,106 164 29,259 C&S and other non-ticketed catch - - 59 4,250 3,213 1 7,523
Subtotal - - 5,034 18,264 13,319 165 36,782 Total 4,869 258 5,508 31,299 21,201 5,213 68,348
1. Based on updated catch estimates. Stock-specific and total catches by fishery may not match data presented elsewhere in this report.
2. Includes lower river bright (LRB) stock. 3. Includes Select Area bright (SAB) and out-of-basin stocks. 4. Includes sport catch from mouth to Priest Rapids Dam and adjusted for hook and release mortality.
Table 18. 2007 Fall Fishery Impact Summary 1
Treaty Indian Non-Indian Total Total Fall Chinook Catch 36,782 23,088 59,870 Snake River Wild Impacts 15.95% 7.44% 23.39% Total Upriver Summer Steelhead Catch 2 19,457 25,539 44,996 Wild Group A Mortalities 2,747 978 3,725 Wild Group B Mortalities 1,050 164 1,214 Wild Group A Impact 3.6% 1.2% 4.8% Wild Group B Impact 11.6% 1.8% 13.7% Total Coho Catch -- 40,234 40,234 Un-Marked Mortalities -- 6,909 6,909 LCR Coho Impact -- 6.7% 6.7% 1. Adults only-Based on updated catch estimates. Mainstem catch only. Total catches by fishery may not match data
presented elsewhere in this report. All data preliminary. Non-Indian harvest includes fisheries from Buoy 10 upstream to Hwy. 395, near Pasco, WA.
2. Non-Indian summer steelhead catch includes kept (hatchery) catch and (wild) release mortalities from Buoy 10 upstream to Hwy. 395, near Pasco, WA, and tributary catch from “dip-ins” during August through December.
`
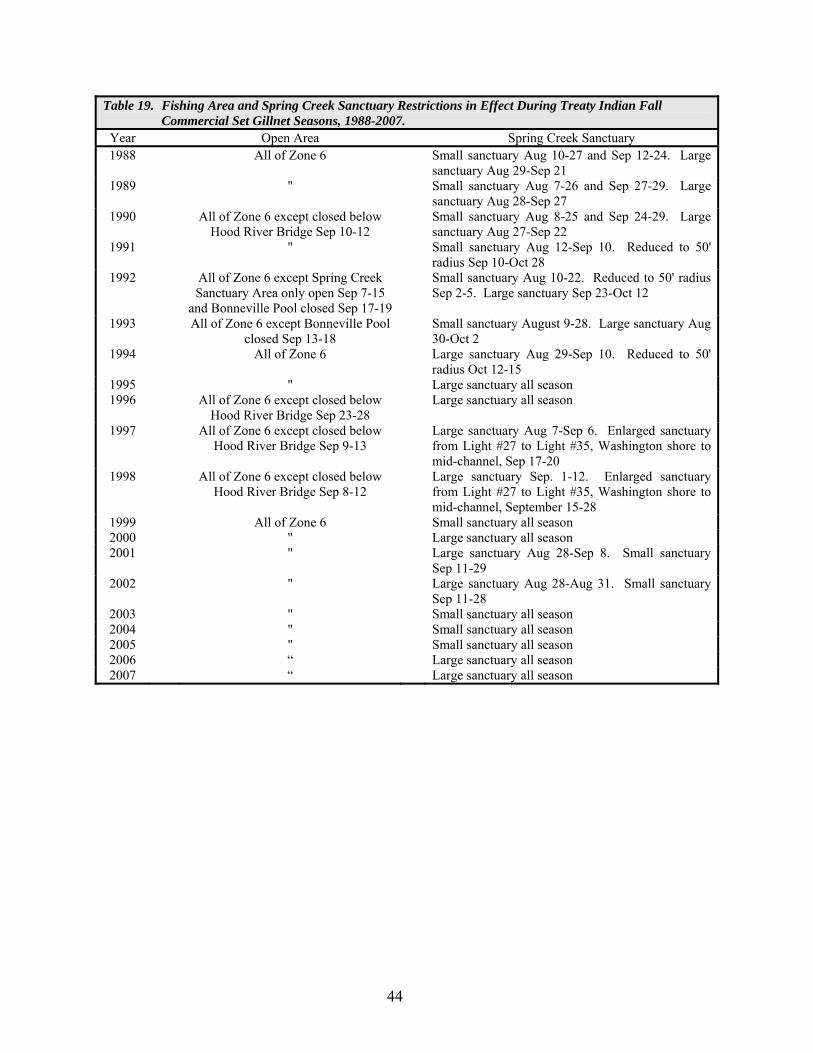
44
Table 19. Fishing Area and Spring Creek Sanctuary Restrictions in Effect During Treaty Indian Fall Commercial Set Gillnet Seasons, 1988-2007.
Year Open Area Spring Creek Sanctuary 1988 All of Zone 6 Small sanctuary Aug 10-27 and Sep 12-24. Large
sanctuary Aug 29-Sep 21 1989 " Small sanctuary Aug 7-26 and Sep 27-29. Large
sanctuary Aug 28-Sep 27 1990 All of Zone 6 except closed below
Hood River Bridge Sep 10-12 Small sanctuary Aug 8-25 and Sep 24-29. Large
sanctuary Aug 27-Sep 22 1991 " Small sanctuary Aug 12-Sep 10. Reduced to 50'
radius Sep 10-Oct 28 1992 All of Zone 6 except Spring Creek
Sanctuary Area only open Sep 7-15 and Bonneville Pool closed Sep 17-19
Small sanctuary Aug 10-22. Reduced to 50' radius Sep 2-5. Large sanctuary Sep 23-Oct 12
1993 All of Zone 6 except Bonneville Pool closed Sep 13-18
Small sanctuary August 9-28. Large sanctuary Aug 30-Oct 2
1994 All of Zone 6 Large sanctuary Aug 29-Sep 10. Reduced to 50' radius Oct 12-15
1995 " Large sanctuary all season 1996 All of Zone 6 except closed below
Hood River Bridge Sep 23-28 Large sanctuary all season
1997 All of Zone 6 except closed below Hood River Bridge Sep 9-13
Large sanctuary Aug 7-Sep 6. Enlarged sanctuary from Light #27 to Light #35, Washington shore to mid-channel, Sep 17-20
1998 All of Zone 6 except closed below Hood River Bridge Sep 8-12
Large sanctuary Sep. 1-12. Enlarged sanctuary from Light #27 to Light #35, Washington shore to mid-channel, September 15-28
1999 All of Zone 6 Small sanctuary all season 2000 " Large sanctuary all season 2001 " Large sanctuary Aug 28-Sep 8. Small sanctuary
Sep 11-29 2002 " Large sanctuary Aug 28-Aug 31. Small sanctuary
Sep 11-28 2003 " Small sanctuary all season 2004 " Small sanctuary all season 2005 " Small sanctuary all season 2006 “ Large sanctuary all season 2007 “ Large sanctuary all season
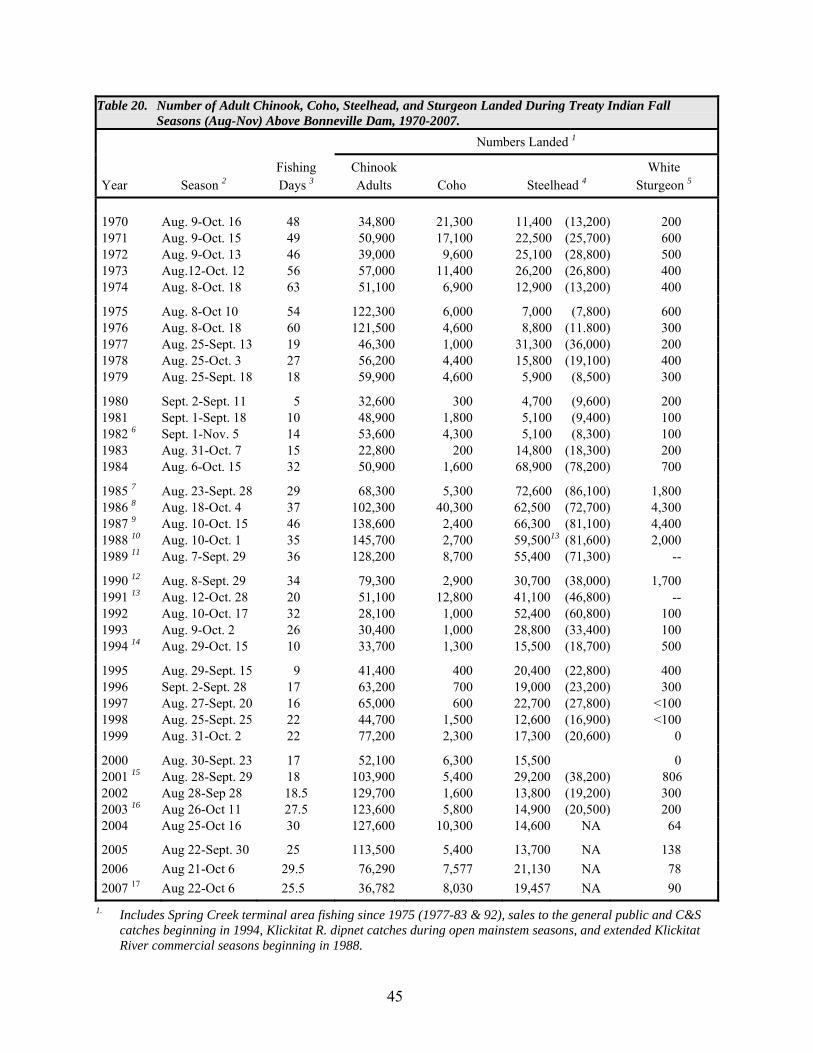
45
Table 20. Number of Adult Chinook, Coho, Steelhead, and Sturgeon Landed During Treaty Indian Fall Seasons (Aug-Nov) Above Bonneville Dam, 1970-2007.
Numbers Landed 1
Fishing Chinook White Year Season 2 Days 3 Adults Coho Steelhead 4 Sturgeon 5
1970 Aug. 9-Oct. 16 48 34,800 21,300 11,400 (13,200) 200 1971 Aug. 9-Oct. 15 49 50,900 17,100 22,500 (25,700) 600 1972 Aug. 9-Oct. 13 46 39,000 9,600 25,100 (28,800) 500 1973 Aug.12-Oct. 12 56 57,000 11,400 26,200 (26,800) 400 1974 Aug. 8-Oct. 18 63 51,100 6,900 12,900 (13,200) 400
1975 Aug. 8-Oct 10 54 122,300 6,000 7,000 (7,800) 600 1976 Aug. 8-Oct. 18 60 121,500 4,600 8,800 (11.800) 300 1977 Aug. 25-Sept. 13 19 46,300 1,000 31,300 (36,000) 200 1978 Aug. 25-Oct. 3 27 56,200 4,400 15,800 (19,100) 400 1979 Aug. 25-Sept. 18 18 59,900 4,600 5,900 (8,500) 300
1980 Sept. 2-Sept. 11 5 32,600 300 4,700 (9,600) 200 1981 Sept. 1-Sept. 18 10 48,900 1,800 5,100 (9,400) 100 1982 6 Sept. 1-Nov. 5 14 53,600 4,300 5,100 (8,300) 100 1983 Aug. 31-Oct. 7 15 22,800 200 14,800 (18,300) 200 1984 Aug. 6-Oct. 15 32 50,900 1,600 68,900 (78,200) 700
1985 7 Aug. 23-Sept. 28 29 68,300 5,300 72,600 (86,100) 1,800 1986 8 Aug. 18-Oct. 4 37 102,300 40,300 62,500 (72,700) 4,300 1987 9 Aug. 10-Oct. 15 46 138,600 2,400 66,300 (81,100) 4,400 1988 10 Aug. 10-Oct. 1 35 145,700 2,700 59,50013 (81,600) 2,000 1989 11 Aug. 7-Sept. 29 36 128,200 8,700 55,400 (71,300) --
1990 12 Aug. 8-Sept. 29 34 79,300 2,900 30,700 (38,000) 1,700 1991 13 Aug. 12-Oct. 28 20 51,100 12,800 41,100 (46,800) -- 1992 Aug. 10-Oct. 17 32 28,100 1,000 52,400 (60,800) 100 1993 Aug. 9-Oct. 2 26 30,400 1,000 28,800 (33,400) 100 1994 14 Aug. 29-Oct. 15 10 33,700 1,300 15,500 (18,700) 500
1995 Aug. 29-Sept. 15 9 41,400 400 20,400 (22,800) 400 1996 Sept. 2-Sept. 28 17 63,200 700 19,000 (23,200) 300 1997 Aug. 27-Sept. 20 16 65,000 600 22,700 (27,800) <100 1998 Aug. 25-Sept. 25 22 44,700 1,500 12,600 (16,900) <100 1999 Aug. 31-Oct. 2 22 77,200 2,300 17,300 (20,600) 0
2000 Aug. 30-Sept. 23 17 52,100 6,300 15,500 0 2001 15 Aug. 28-Sept. 29 18 103,900 5,400 29,200 (38,200) 806
2002 Aug 28-Sep 28 18.5 129,700 1,600 13,800 (19,200) 300 2003 16 Aug 26-Oct 11 27.5 123,600 5,800 14,900 (20,500) 200 2004 Aug 25-Oct 16 30 127,600 10,300 14,600 NA 64
2005 Aug 22-Sept. 30 25 113,500 5,400 13,700 NA 138 2006 Aug 21-Oct 6 29.5 76,290 7,577 21,130 NA 78 2007 17 Aug 22-Oct 6 25.5 36,782 8,030 19,457 NA 90
1. Includes Spring Creek terminal area fishing since 1975 (1977-83 & 92), sales to the general public and C&S catches beginning in 1994, Klickitat R. dipnet catches during open mainstem seasons, and extended Klickitat River commercial seasons beginning in 1988.
46
2. For Commercial Gillnet openings - Minimum mesh size: 1970-1974 none; 1975 7-1/2"; 1976-1982 8"; 1983 none; 1984 none, except 8" Oct 9-15; 1985 none, except 8" Sep 14-28; 1986 none, except 8" Sep 6-Oct 4; 1987 none; 1988 none, except 8" Aug 17-27 and Sep 18-24 and 8" and 9" test fishery Sep 28-Oct 1; 1989 8" except none Aug 7-12; 1990 8" except none Sep 3-5, Sep 12-15 below Hood River Br., Sep 17-22, and Sep 24-29; 1991-97 none; 1998 8"; 1999 none except 8" Sep 15-18 and Sep 29-Oct 2; 2000-2002 none.
3. Mainstem commercial seasons only. 4. Steelhead run year totals are in parentheses. Sales to licensed buyers during sockeye and fall seasons only
through 1984. Sales to licensed buyers, general public and C&S catch, including winter season catches of holdover and fresh run summer steelhead, for calendar year from 1985-present.
5. No sturgeon sales allowed in set net fisheries since 1991. Includes landings in fall set-line fisheries. 6. Includes Nov 1-5 coho fishery below Klickitat River. 7. Spring Creek sanctuary area open to fishing Aug 23-28 and Aug 29-Sep 3. 8. Includes Sep 29-Oct 4 dipnet and experimental gillnet fishery. An additional catch of 1,000 Chinook occurred
above Priest Rapids Dam. Over half of the coho catch (24,100) occurred in the Klickitat River dipnet fishery. 9. An additional catch of 2,200 Chinook occurred above Priest Rapids Dam. 10. Includes Sep 28-Oct 1 test fishery in John Day Pool. No sturgeon sales allowed after Sep 3. An additional
catch of 2,300 Chinook and an estimated 300 steelhead occurred above Priest Rapids Dam. Includes 5,500 coho captured in an extended Klickitat River dipnet season.
11. No sturgeon sales allowed. An additional catch of 800 Chinook occurred above Priest Rapids Dam. Includes 6,100 coho captured in an extended Klickitat River dipnet season.
12. An additional 200 Chinook catch occurred above Priest Rapids Dam. Includes 1,900 coho captured in an extended Klickitat River dipnet season.
13. Includes 5,500 coho captured in an extended Klickitat River dipnet season. 14. An additional catch of 570 Chinook and 70 steelhead occurred above Priest Rapids Dam. An additional catch
of 220 Chinook and 80 steelhead occurred above McNary Dam. 15. Target sturgeon gillnet seasons adopted for Zone 61 (Bonneville Pool) during November 14-30 and Zone 63
(John Day Pool) during November 14-December 7. 16. Target sturgeon gillnet season adopted for Zone 61 (Bonneville Pool) during December 1-14. No sturgeon
were landed. 17. Includes all fall season harvest – Aug 1-Dec 31.
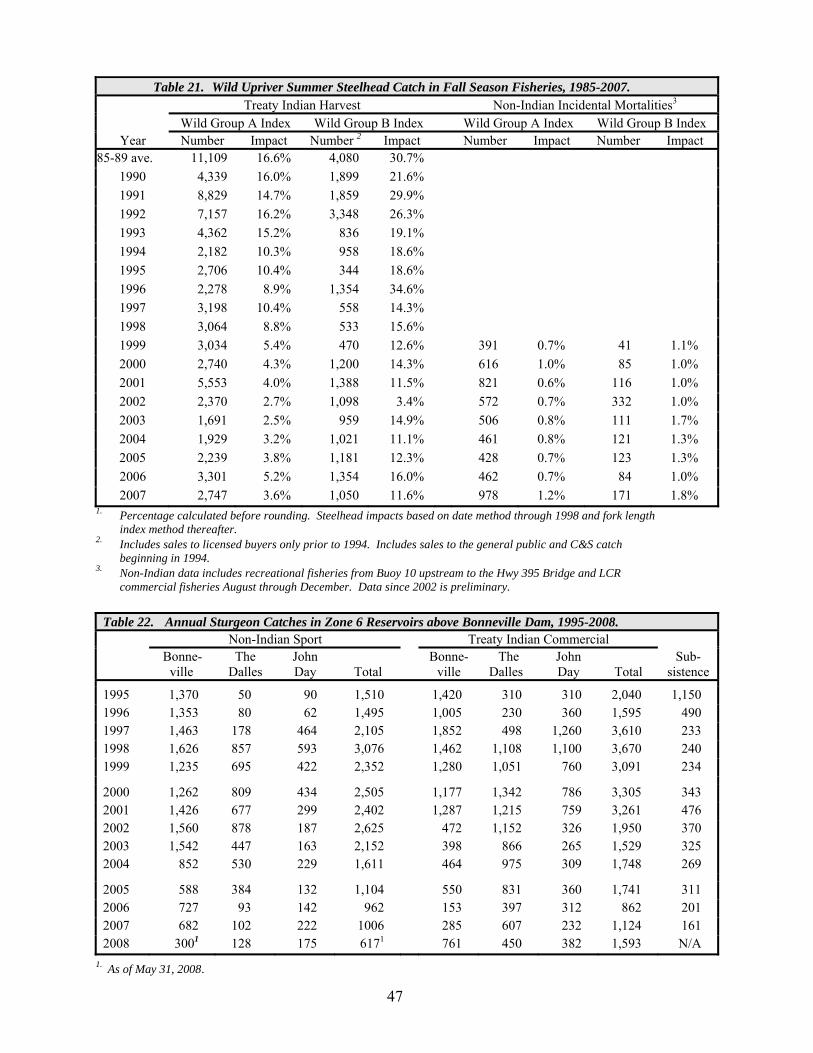
47
Table 21. Wild Upriver Summer Steelhead Catch in Fall Season Fisheries, 1985-2007. Treaty Indian Harvest Non-Indian Incidental Mortalities3
Wild Group A Index Wild Group B Index Wild Group A Index Wild Group B Index Year Number Impact Number 2 Impact Number Impact Number Impact
85-89 ave. 11,109 16.6% 4,080 30.7% 1990 4,339 16.0% 1,899 21.6% 1991 8,829 14.7% 1,859 29.9% 1992 7,157 16.2% 3,348 26.3% 1993 4,362 15.2% 836 19.1% 1994 2,182 10.3% 958 18.6% 1995 2,706 10.4% 344 18.6% 1996 2,278 8.9% 1,354 34.6% 1997 3,198 10.4% 558 14.3% 1998 3,064 8.8% 533 15.6% 1999 3,034 5.4% 470 12.6% 391 0.7% 41 1.1% 2000 2,740 4.3% 1,200 14.3% 616 1.0% 85 1.0% 2001 5,553 4.0% 1,388 11.5% 821 0.6% 116 1.0% 2002 2,370 2.7% 1,098 3.4% 572 0.7% 332 1.0% 2003 1,691 2.5% 959 14.9% 506 0.8% 111 1.7% 2004 1,929 3.2% 1,021 11.1% 461 0.8% 121 1.3% 2005 2,239 3.8% 1,181 12.3% 428 0.7% 123 1.3% 2006 3,301 5.2% 1,354 16.0% 462 0.7% 84 1.0% 2007 2,747 3.6% 1,050 11.6% 978 1.2% 171 1.8%
1. Percentage calculated before rounding. Steelhead impacts based on date method through 1998 and fork length index method thereafter.
2. Includes sales to licensed buyers only prior to 1994. Includes sales to the general public and C&S catch beginning in 1994.
3. Non-Indian data includes recreational fisheries from Buoy 10 upstream to the Hwy 395 Bridge and LCR commercial fisheries August through December. Data since 2002 is preliminary.
Table 22. Annual Sturgeon Catches in Zone 6 Reservoirs above Bonneville Dam, 1995-2008. Non-Indian Sport Treaty Indian Commercial Bonne-
ville The
Dalles John Day
Total
Bonne-ville
The Dalles
John Day
Total
Sub-sistence
1995 1,370 50 90 1,510 1,420 310 310 2,040 1,150 1996 1,353 80 62 1,495 1,005 230 360 1,595 490 1997 1,463 178 464 2,105 1,852 498 1,260 3,610 233 1998 1,626 857 593 3,076 1,462 1,108 1,100 3,670 240 1999 1,235 695 422 2,352 1,280 1,051 760 3,091 234
2000 1,262 809 434 2,505 1,177 1,342 786 3,305 343 2001 1,426 677 299 2,402 1,287 1,215 759 3,261 476 2002 1,560 878 187 2,625 472 1,152 326 1,950 370 2003 1,542 447 163 2,152 398 866 265 1,529 325 2004 852 530 229 1,611 464 975 309 1,748 269
2005 588 384 132 1,104 550 831 360 1,741 311 2006 727 93 142 962 153 397 312 862 201 2007 682 102 222 1006 285 607 232 1,124 161 2008 3001 128 175 6171 761 450 382 1,593 N/A
1. As of May 31, 2008.
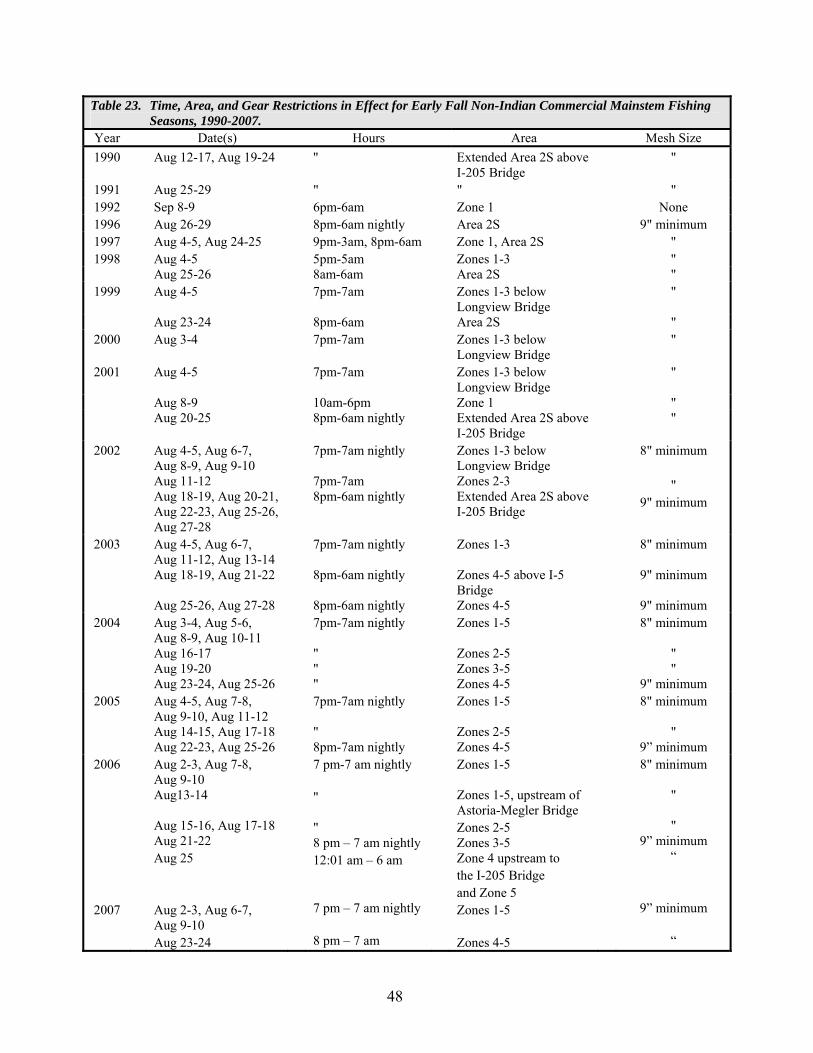
48
Table 23. Time, Area, and Gear Restrictions in Effect for Early Fall Non-Indian Commercial Mainstem Fishing Seasons, 1990-2007.
Year Date(s) Hours Area Mesh Size 1990 Aug 12-17, Aug 19-24 " Extended Area 2S above
I-205 Bridge "
1991 Aug 25-29 " " " 1992 Sep 8-9 6pm-6am Zone 1 None 1996 Aug 26-29 8pm-6am nightly Area 2S 9" minimum 1997 Aug 4-5, Aug 24-25 9pm-3am, 8pm-6am Zone 1, Area 2S " 1998 Aug 4-5 5pm-5am Zones 1-3 "
Aug 25-26 8am-6am Area 2S " 1999 Aug 4-5 7pm-7am Zones 1-3 below
Longview Bridge "
Aug 23-24 8pm-6am Area 2S " 2000 Aug 3-4 7pm-7am Zones 1-3 below
Longview Bridge "
2001 Aug 4-5 7pm-7am Zones 1-3 below Longview Bridge
"
Aug 8-9 10am-6pm Zone 1 " Aug 20-25 8pm-6am nightly Extended Area 2S above
I-205 Bridge "
2002 Aug 4-5, Aug 6-7, Aug 8-9, Aug 9-10 Aug 11-12 Aug 18-19, Aug 20-21, Aug 22-23, Aug 25-26, Aug 27-28
7pm-7am nightly 7pm-7am 8pm-6am nightly
Zones 1-3 below Longview Bridge Zones 2-3 Extended Area 2S above I-205 Bridge
8" minimum "
9" minimum
2003 Aug 4-5, Aug 6-7, Aug 11-12, Aug 13-14 Aug 18-19, Aug 21-22 Aug 25-26, Aug 27-28
7pm-7am nightly 8pm-6am nightly 8pm-6am nightly
Zones 1-3 Zones 4-5 above I-5 Bridge Zones 4-5
8" minimum
9" minimum
9" minimum 2004 Aug 3-4, Aug 5-6,
Aug 8-9, Aug 10-11 Aug 16-17 Aug 19-20 Aug 23-24, Aug 25-26
7pm-7am nightly " " "
Zones 1-5 Zones 2-5 Zones 3-5 Zones 4-5
8" minimum " "
9" minimum 2005 Aug 4-5, Aug 7-8,
Aug 9-10, Aug 11-12 Aug 14-15, Aug 17-18 Aug 22-23, Aug 25-26
7pm-7am nightly " 8pm-7am nightly
Zones 1-5 Zones 2-5 Zones 4-5
8" minimum "
9” minimum 2006
Aug 2-3, Aug 7-8,
Aug 9-10 Aug13-14 Aug 15-16, Aug 17-18 Aug 21-22 Aug 25
7 pm-7 am nightly " " 8 pm – 7 am nightly 12:01 am – 6 am
Zones 1-5 Zones 1-5, upstream of Astoria-Megler Bridge Zones 2-5 Zones 3-5 Zone 4 upstream to the I-205 Bridge and Zone 5
8" minimum " "
9” minimum “
2007
Aug 2-3, Aug 6-7, Aug 9-10 Aug 23-24
7 pm – 7 am nightly 8 pm – 7 am
Zones 1-5 Zones 4-5
9” minimum “
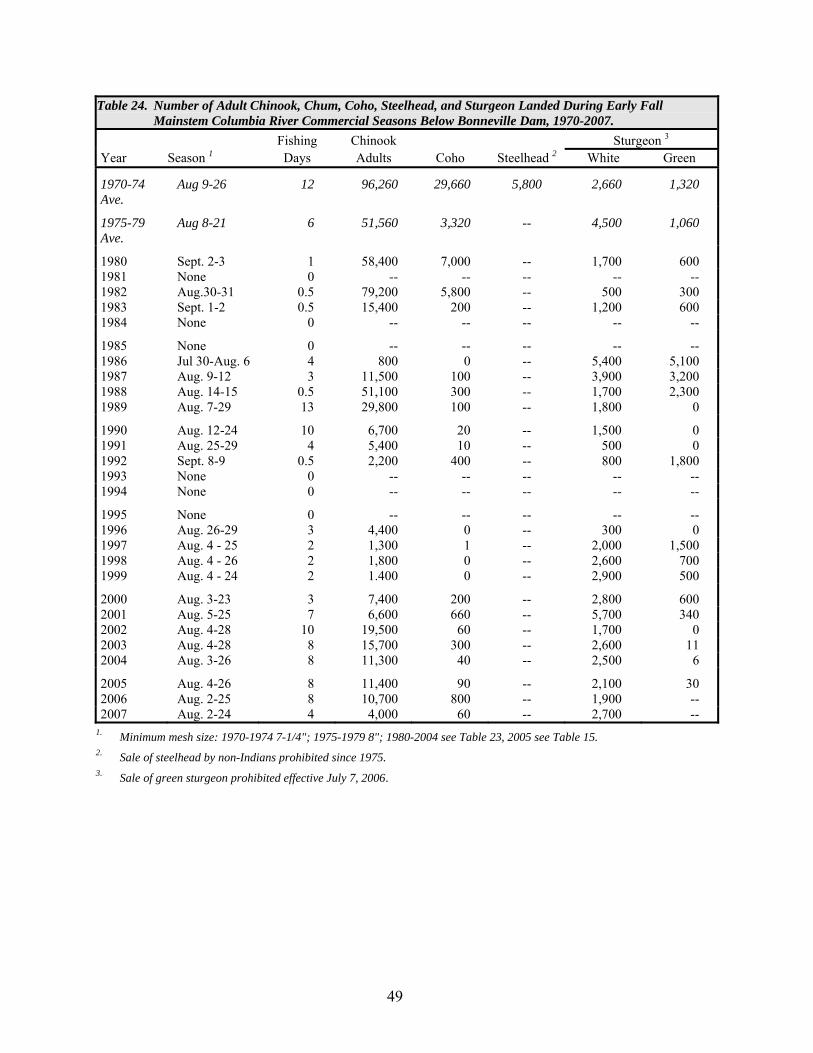
49
Table 24. Number of Adult Chinook, Chum, Coho, Steelhead, and Sturgeon Landed During Early Fall Mainstem Columbia River Commercial Seasons Below Bonneville Dam, 1970-2007.
Fishing Chinook Sturgeon 3
Year Season 1 Days Adults Coho Steelhead 2 White Green
1970-74 Ave.
Aug 9-26 12 96,260 29,660 5,800 2,660 1,320
1975-79 Ave.
Aug 8-21 6 51,560 3,320 -- 4,500 1,060
1980 Sept. 2-3 1 58,400 7,000 -- 1,700 600 1981 None 0 -- -- -- -- -- 1982 Aug.30-31 0.5 79,200 5,800 -- 500 300 1983 Sept. 1-2 0.5 15,400 200 -- 1,200 600 1984 None 0 -- -- -- -- --
1985 None 0 -- -- -- -- -- 1986 Jul 30-Aug. 6 4 800 0 -- 5,400 5,100 1987 Aug. 9-12 3 11,500 100 -- 3,900 3,200 1988 Aug. 14-15 0.5 51,100 300 -- 1,700 2,300 1989 Aug. 7-29 13 29,800 100 -- 1,800 0
1990 Aug. 12-24 10 6,700 20 -- 1,500 0 1991 Aug. 25-29 4 5,400 10 -- 500 0 1992 Sept. 8-9 0.5 2,200 400 -- 800 1,800 1993 None 0 -- -- -- -- -- 1994 None 0 -- -- -- -- --
1995 None 0 -- -- -- -- -- 1996 Aug. 26-29 3 4,400 0 -- 300 0 1997 Aug. 4 - 25 2 1,300 1 -- 2,000 1,500 1998 Aug. 4 - 26 2 1,800 0 -- 2,600 700 1999 Aug. 4 - 24 2 1.400 0 -- 2,900 500
2000 Aug. 3-23 3 7,400 200 -- 2,800 600 2001 Aug. 5-25 7 6,600 660 -- 5,700 340 2002 Aug. 4-28 10 19,500 60 -- 1,700 0 2003 Aug. 4-28 8 15,700 300 -- 2,600 11 2004 Aug. 3-26 8 11,300 40 -- 2,500 6
2005 Aug. 4-26 8 11,400 90 -- 2,100 30 2006 Aug. 2-25 8 10,700 800 -- 1,900 -- 2007 Aug. 2-24 4 4,000 60 -- 2,700 --
1. Minimum mesh size: 1970-1974 7-1/4"; 1975-1979 8"; 1980-2004 see Table 23, 2005 see Table 15. 2. Sale of steelhead by non-Indians prohibited since 1975. 3. Sale of green sturgeon prohibited effective July 7, 2006.
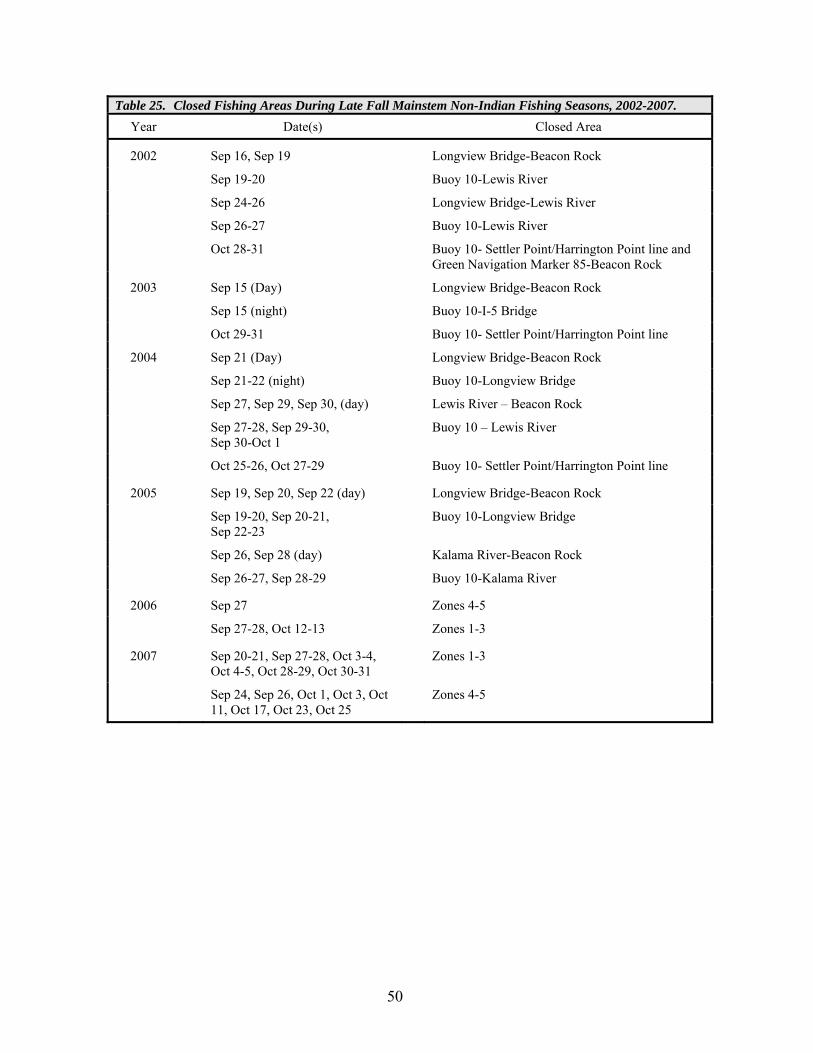
50
Table 25. Closed Fishing Areas During Late Fall Mainstem Non-Indian Fishing Seasons, 2002-2007. Year Date(s) Closed Area
2002 Sep 16, Sep 19 Longview Bridge-Beacon Rock
Sep 19-20 Buoy 10-Lewis River
Sep 24-26 Longview Bridge-Lewis River
Sep 26-27 Buoy 10-Lewis River
Oct 28-31 Buoy 10- Settler Point/Harrington Point line and Green Navigation Marker 85-Beacon Rock
2003 Sep 15 (Day) Longview Bridge-Beacon Rock
Sep 15 (night) Buoy 10-I-5 Bridge
Oct 29-31 Buoy 10- Settler Point/Harrington Point line
2004 Sep 21 (Day) Longview Bridge-Beacon Rock
Sep 21-22 (night) Buoy 10-Longview Bridge
Sep 27, Sep 29, Sep 30, (day) Lewis River – Beacon Rock
Sep 27-28, Sep 29-30, Sep 30-Oct 1
Buoy 10 – Lewis River
Oct 25-26, Oct 27-29 Buoy 10- Settler Point/Harrington Point line
2005 Sep 19, Sep 20, Sep 22 (day) Longview Bridge-Beacon Rock
Sep 19-20, Sep 20-21, Sep 22-23
Buoy 10-Longview Bridge
Sep 26, Sep 28 (day) Kalama River-Beacon Rock
Sep 26-27, Sep 28-29 Buoy 10-Kalama River
2006 Sep 27 Zones 4-5
Sep 27-28, Oct 12-13 Zones 1-3
2007 Sep 20-21, Sep 27-28, Oct 3-4, Oct 4-5, Oct 28-29, Oct 30-31
Zones 1-3
Sep 24, Sep 26, Oct 1, Oct 3, Oct 11, Oct 17, Oct 23, Oct 25
Zones 4-5
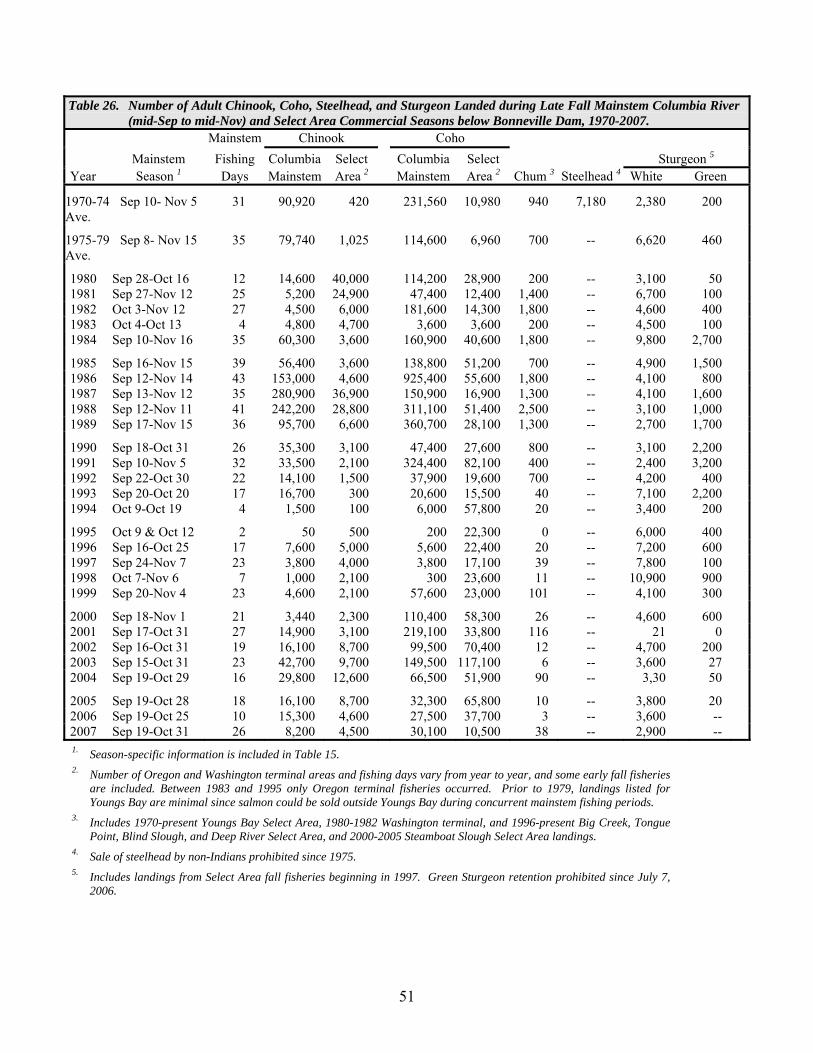
51
Table 26. Number of Adult Chinook, Coho, Steelhead, and Sturgeon Landed during Late Fall Mainstem Columbia River (mid-Sep to mid-Nov) and Select Area Commercial Seasons below Bonneville Dam, 1970-2007.
Mainstem Chinook Coho Mainstem Fishing Columbia Select Columbia Select Sturgeon 5
Year Season 1 Days Mainstem Area 2 Mainstem Area 2 Chum 3 Steelhead 4 White Green
1970-74 Ave.
Sep 10- Nov 5 31 90,920 420 231,560 10,980 940 7,180 2,380 200
1975-79 Ave.
Sep 8- Nov 15 35 79,740 1,025 114,600 6,960 700 -- 6,620 460
1980 Sep 28-Oct 16 12 14,600 40,000 114,200 28,900 200 -- 3,100 50 1981 Sep 27-Nov 12 25 5,200 24,900 47,400 12,400 1,400 -- 6,700 100 1982 Oct 3-Nov 12 27 4,500 6,000 181,600 14,300 1,800 -- 4,600 400 1983 Oct 4-Oct 13 4 4,800 4,700 3,600 3,600 200 -- 4,500 100 1984 Sep 10-Nov 16 35 60,300 3,600 160,900 40,600 1,800 -- 9,800 2,700
1985 Sep 16-Nov 15 39 56,400 3,600 138,800 51,200 700 -- 4,900 1,500 1986 Sep 12-Nov 14 43 153,000 4,600 925,400 55,600 1,800 -- 4,100 800 1987 Sep 13-Nov 12 35 280,900 36,900 150,900 16,900 1,300 -- 4,100 1,600 1988 Sep 12-Nov 11 41 242,200 28,800 311,100 51,400 2,500 -- 3,100 1,000 1989 Sep 17-Nov 15 36 95,700 6,600 360,700 28,100 1,300 -- 2,700 1,700
1990 Sep 18-Oct 31 26 35,300 3,100 47,400 27,600 800 -- 3,100 2,200 1991 Sep 10-Nov 5 32 33,500 2,100 324,400 82,100 400 -- 2,400 3,200 1992 Sep 22-Oct 30 22 14,100 1,500 37,900 19,600 700 -- 4,200 400 1993 Sep 20-Oct 20 17 16,700 300 20,600 15,500 40 -- 7,100 2,200 1994 Oct 9-Oct 19 4 1,500 100 6,000 57,800 20 -- 3,400 200
1995 Oct 9 & Oct 12 2 50 500 200 22,300 0 -- 6,000 400 1996 Sep 16-Oct 25 17 7,600 5,000 5,600 22,400 20 -- 7,200 600 1997 Sep 24-Nov 7 23 3,800 4,000 3,800 17,100 39 -- 7,800 100 1998 Oct 7-Nov 6 7 1,000 2,100 300 23,600 11 -- 10,900 900 1999 Sep 20-Nov 4 23 4,600 2,100 57,600 23,000 101 -- 4,100 300
2000 Sep 18-Nov 1 21 3,440 2,300 110,400 58,300 26 -- 4,600 600 2001 Sep 17-Oct 31 27 14,900 3,100 219,100 33,800 116 -- 21 0 2002 Sep 16-Oct 31 19 16,100 8,700 99,500 70,400 12 -- 4,700 200 2003 Sep 15-Oct 31 23 42,700 9,700 149,500 117,100 6 -- 3,600 27 2004 Sep 19-Oct 29 16 29,800 12,600 66,500 51,900 90 -- 3,30 50
2005 Sep 19-Oct 28 18 16,100 8,700 32,300 65,800 10 -- 3,800 20 2006 Sep 19-Oct 25 10 15,300 4,600 27,500 37,700 3 -- 3,600 -- 2007 Sep 19-Oct 31 26 8,200 4,500 30,100 10,500 38 -- 2,900 -- 1. Season-specific information is included in Table 15. 2. Number of Oregon and Washington terminal areas and fishing days vary from year to year, and some early fall fisheries
are included. Between 1983 and 1995 only Oregon terminal fisheries occurred. Prior to 1979, landings listed for Youngs Bay are minimal since salmon could be sold outside Youngs Bay during concurrent mainstem fishing periods.
3. Includes 1970-present Youngs Bay Select Area, 1980-1982 Washington terminal, and 1996-present Big Creek, Tongue Point, Blind Slough, and Deep River Select Area, and 2000-2005 Steamboat Slough Select Area landings.
4. Sale of steelhead by non-Indians prohibited since 1975. 5. Includes landings from Select Area fall fisheries beginning in 1997. Green Sturgeon retention prohibited since July 7,
2006.
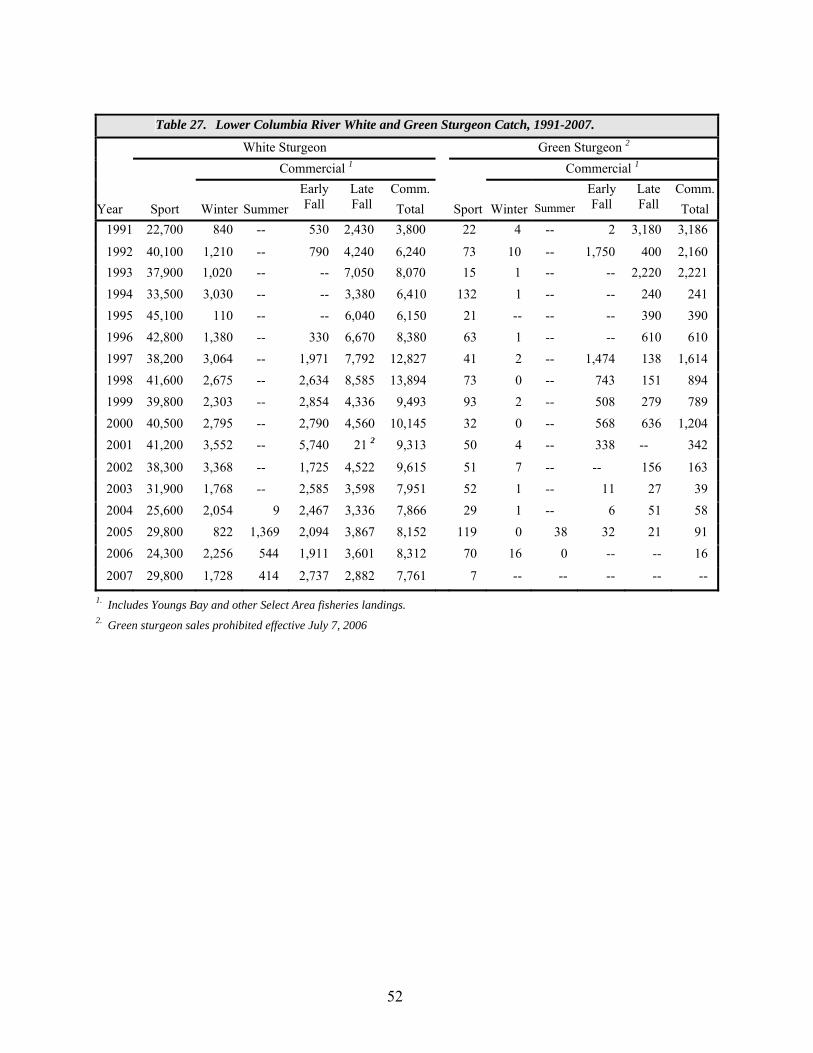
52
Table 27. Lower Columbia River White and Green Sturgeon Catch, 1991-2007.
White Sturgeon Green Sturgeon 2
Commercial 1 Commercial 1
Comm. Comm.Year Sport Winter Summer
Early Fall
Late Fall Total Sport Winter Summer
Early Fall
Late Fall Total
1991 22,700 840 -- 530 2,430 3,800 22 4 -- 2 3,180 3,186
1992 40,100 1,210 -- 790 4,240 6,240 73 10 -- 1,750 400 2,160 1993 37,900 1,020 -- -- 7,050 8,070 15 1 -- -- 2,220 2,221 1994 33,500 3,030 -- -- 3,380 6,410 132 1 -- -- 240 241 1995 45,100 110 -- -- 6,040 6,150 21 -- -- -- 390 390 1996 42,800 1,380 -- 330 6,670 8,380 63 1 -- -- 610 610 1997 38,200 3,064 -- 1,971 7,792 12,827 41 2 -- 1,474 138 1,614 1998 41,600 2,675 -- 2,634 8,585 13,894 73 0 -- 743 151 894 1999 39,800 2,303 -- 2,854 4,336 9,493 93 2 -- 508 279 789 2000 40,500 2,795 -- 2,790 4,560 10,145 32 0 -- 568 636 1,204 2001 41,200 3,552 -- 5,740 21 2 9,313 50 4 -- 338 -- 342
2002 38,300 3,368 -- 1,725 4,522 9,615 51 7 -- -- 156 163 2003 31,900 1,768 -- 2,585 3,598 7,951 52 1 -- 11 27 39 2004 25,600 2,054 9 2,467 3,336 7,866 29 1 -- 6 51 58 2005 29,800 822 1,369 2,094 3,867 8,152 119 0 38 32 21 91 2006 24,300 2,256 544 1,911 3,601 8,312 70 16 0 -- -- 16
2007 29,800 1,728 414 2,737 2,882 7,761 7 -- -- -- -- --
1. Includes Youngs Bay and other Select Area fisheries landings. 2. Green sturgeon sales prohibited effective July 7, 2006
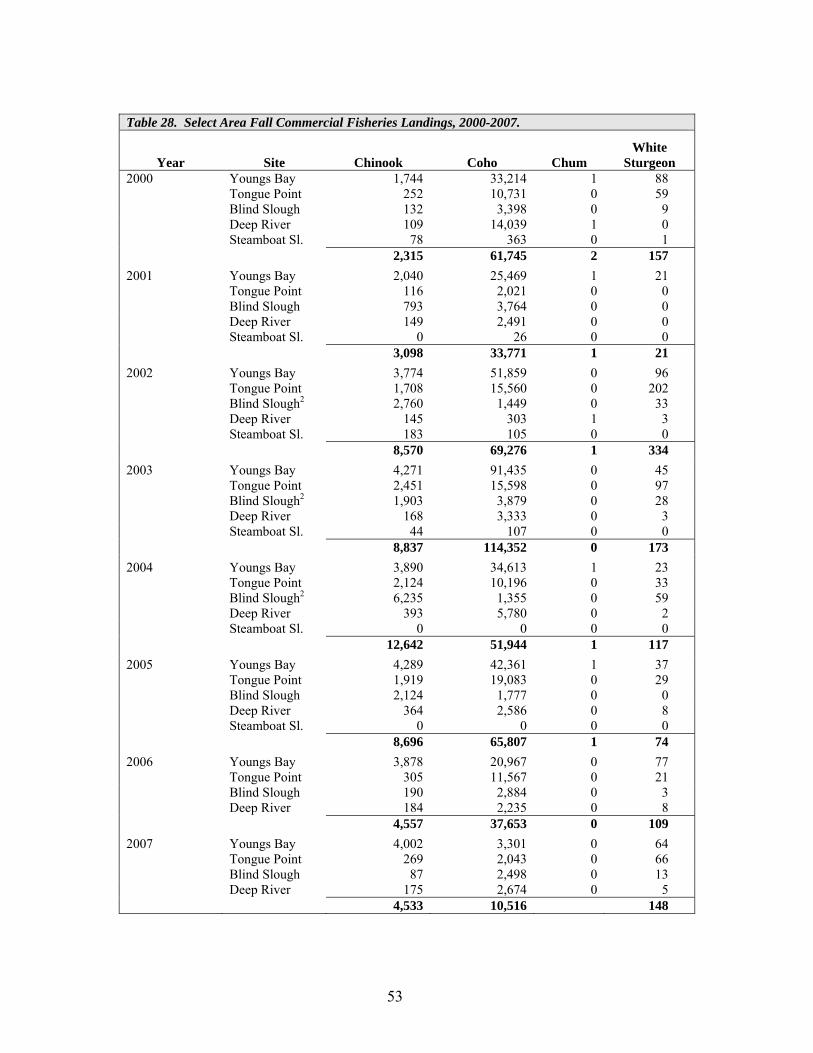
53
Table 28. Select Area Fall Commercial Fisheries Landings, 2000-2007.
Year Site Chinook Coho Chum White
Sturgeon 2000 Youngs Bay 1,744 33,214 1 88 Tongue Point 252 10,731 0 59 Blind Slough 132 3,398 0 9 Deep River 109 14,039 1 0 Steamboat Sl. 78 363 0 1 2,315 61,745 2 157 2001 Youngs Bay 2,040 25,469 1 21 Tongue Point 116 2,021 0 0 Blind Slough 793 3,764 0 0 Deep River 149 2,491 0 0 Steamboat Sl. 0 26 0 0 3,098 33,771 1 21 2002 Youngs Bay 3,774 51,859 0 96 Tongue Point 1,708 15,560 0 202 Blind Slough2 2,760 1,449 0 33 Deep River 145 303 1 3 Steamboat Sl. 183 105 0 0 8,570 69,276 1 334 2003 Youngs Bay 4,271 91,435 0 45 Tongue Point 2,451 15,598 0 97 Blind Slough2 1,903 3,879 0 28 Deep River 168 3,333 0 3 Steamboat Sl. 44 107 0 0 8,837 114,352 0 173 2004 Youngs Bay 3,890 34,613 1 23 Tongue Point 2,124 10,196 0 33 Blind Slough2 6,235 1,355 0 59 Deep River 393 5,780 0 2 Steamboat Sl. 0 0 0 0 12,642 51,944 1 117 2005 Youngs Bay 4,289 42,361 1 37 Tongue Point 1,919 19,083 0 29 Blind Slough 2,124 1,777 0 0 Deep River 364 2,586 0 8 Steamboat Sl. 0 0 0 0 8,696 65,807 1 74 2006 Youngs Bay 3,878 20,967 0 77 Tongue Point 305 11,567 0 21 Blind Slough 190 2,884 0 3 Deep River 184 2,235 0 8 4,557 37,653 0 109 2007 Youngs Bay 4,002 3,301 0 64 Tongue Point 269 2,043 0 66 Blind Slough 87 2,498 0 13 Deep River 175 2,674 0 5 4,533 10,516 148
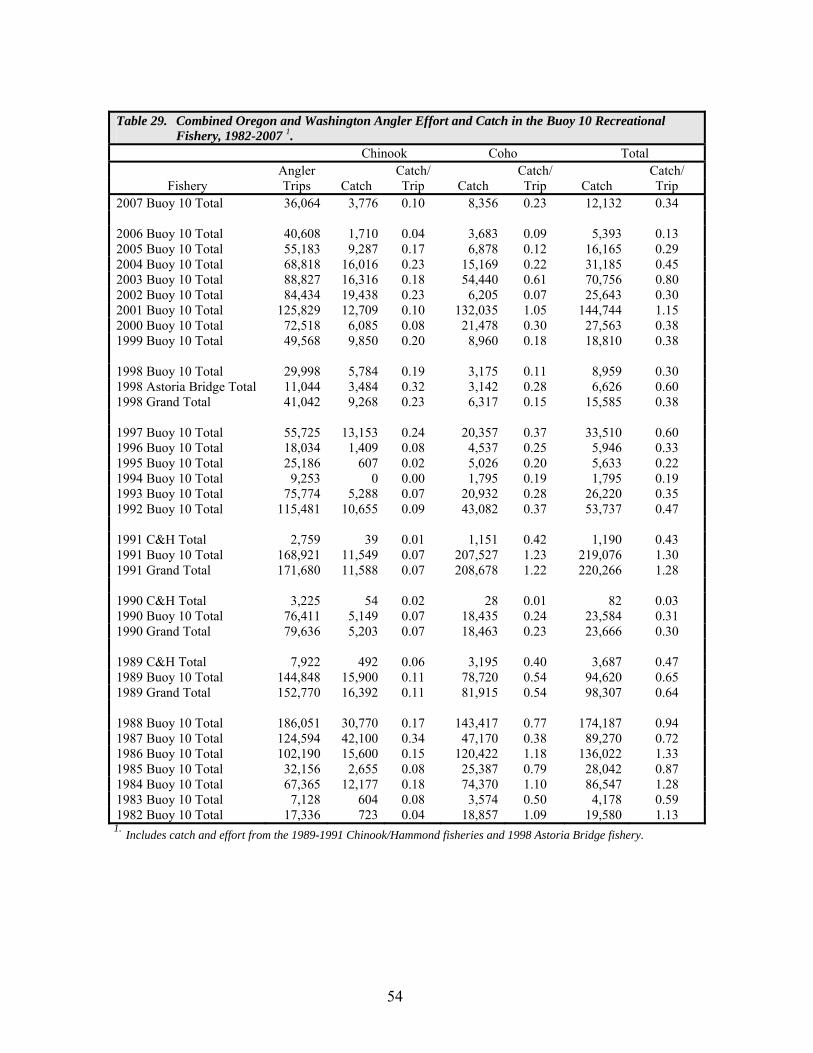
54
Table 29. Combined Oregon and Washington Angler Effort and Catch in the Buoy 10 Recreational Fishery, 1982-2007 1.
Chinook Coho Total Angler Catch/ Catch/ Catch/
Fishery Trips Catch Trip Catch Trip Catch Trip 2007 Buoy 10 Total 36,064 3,776 0.10 8,356 0.23 12,132 0.34 2006 Buoy 10 Total 40,608 1,710 0.04 3,683 0.09 5,393 0.13 2005 Buoy 10 Total 55,183 9,287 0.17 6,878 0.12 16,165 0.29 2004 Buoy 10 Total 68,818 16,016 0.23 15,169 0.22 31,185 0.45 2003 Buoy 10 Total 88,827 16,316 0.18 54,440 0.61 70,756 0.80 2002 Buoy 10 Total 84,434 19,438 0.23 6,205 0.07 25,643 0.30 2001 Buoy 10 Total 125,829 12,709 0.10 132,035 1.05 144,744 1.15 2000 Buoy 10 Total 72,518 6,085 0.08 21,478 0.30 27,563 0.38 1999 Buoy 10 Total 49,568 9,850 0.20 8,960 0.18 18,810 0.38 1998 Buoy 10 Total 29,998 5,784 0.19 3,175 0.11 8,959 0.30 1998 Astoria Bridge Total 11,044 3,484 0.32 3,142 0.28 6,626 0.60 1998 Grand Total 41,042 9,268 0.23 6,317 0.15 15,585 0.38 1997 Buoy 10 Total 55,725 13,153 0.24 20,357 0.37 33,510 0.60 1996 Buoy 10 Total 18,034 1,409 0.08 4,537 0.25 5,946 0.33 1995 Buoy 10 Total 25,186 607 0.02 5,026 0.20 5,633 0.22 1994 Buoy 10 Total 9,253 0 0.00 1,795 0.19 1,795 0.19 1993 Buoy 10 Total 75,774 5,288 0.07 20,932 0.28 26,220 0.35 1992 Buoy 10 Total 115,481 10,655 0.09 43,082 0.37 53,737 0.47 1991 C&H Total 2,759 39 0.01 1,151 0.42 1,190 0.43 1991 Buoy 10 Total 168,921 11,549 0.07 207,527 1.23 219,076 1.30 1991 Grand Total 171,680 11,588 0.07 208,678 1.22 220,266 1.28 1990 C&H Total 3,225 54 0.02 28 0.01 82 0.03 1990 Buoy 10 Total 76,411 5,149 0.07 18,435 0.24 23,584 0.31 1990 Grand Total 79,636 5,203 0.07 18,463 0.23 23,666 0.30 1989 C&H Total 7,922 492 0.06 3,195 0.40 3,687 0.47 1989 Buoy 10 Total 144,848 15,900 0.11 78,720 0.54 94,620 0.65 1989 Grand Total 152,770 16,392 0.11 81,915 0.54 98,307 0.64 1988 Buoy 10 Total 186,051 30,770 0.17 143,417 0.77 174,187 0.94 1987 Buoy 10 Total 124,594 42,100 0.34 47,170 0.38 89,270 0.72 1986 Buoy 10 Total 102,190 15,600 0.15 120,422 1.18 136,022 1.33 1985 Buoy 10 Total 32,156 2,655 0.08 25,387 0.79 28,042 0.87 1984 Buoy 10 Total 67,365 12,177 0.18 74,370 1.10 86,547 1.28 1983 Buoy 10 Total 7,128 604 0.08 3,574 0.50 4,178 0.59 1982 Buoy 10 Total 17,336 723 0.04 18,857 1.09 19,580 1.13 1. Includes catch and effort from the 1989-1991 Chinook/Hammond fisheries and 1998 Astoria Bridge fishery.
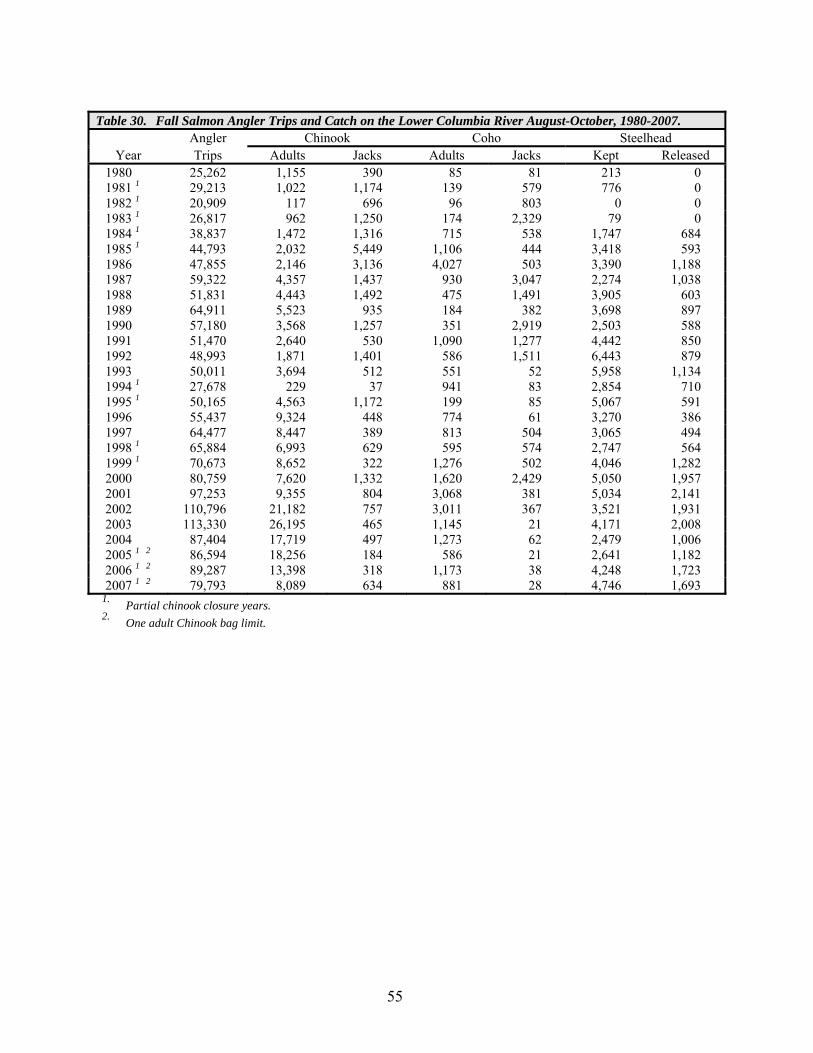
55
Table 30. Fall Salmon Angler Trips and Catch on the Lower Columbia River August-October, 1980-2007.
Angler Chinook Coho Steelhead Year Trips Adults Jacks Adults Jacks Kept Released
1980 25,262 1,155 390 85 81 213 0 1981 1 29,213 1,022 1,174 139 579 776 0 1982 1 20,909 117 696 96 803 0 0 1983 1 26,817 962 1,250 174 2,329 79 0 1984 1 38,837 1,472 1,316 715 538 1,747 684 1985 1 44,793 2,032 5,449 1,106 444 3,418 593 1986 47,855 2,146 3,136 4,027 503 3,390 1,188 1987 59,322 4,357 1,437 930 3,047 2,274 1,038 1988 51,831 4,443 1,492 475 1,491 3,905 603 1989 64,911 5,523 935 184 382 3,698 897 1990 57,180 3,568 1,257 351 2,919 2,503 588 1991 51,470 2,640 530 1,090 1,277 4,442 850 1992 48,993 1,871 1,401 586 1,511 6,443 879 1993 50,011 3,694 512 551 52 5,958 1,134 1994 1 27,678 229 37 941 83 2,854 710 1995 1 50,165 4,563 1,172 199 85 5,067 591 1996 55,437 9,324 448 774 61 3,270 386 1997 64,477 8,447 389 813 504 3,065 494 1998 1 65,884 6,993 629 595 574 2,747 564 1999 1 70,673 8,652 322 1,276 502 4,046 1,282 2000 80,759 7,620 1,332 1,620 2,429 5,050 1,957 2001 97,253 9,355 804 3,068 381 5,034 2,141 2002 110,796 21,182 757 3,011 367 3,521 1,931 2003 113,330 26,195 465 1,145 21 4,171 2,008 2004 87,404 17,719 497 1,273 62 2,479 1,006 2005 1 2 86,594 18,256 184 586 21 2,641 1,182 2006 1 2 89,287 13,398 318 1,173 38 4,248 1,723 2007 1 2 79,793 8,089 634 881 28 4,746 1,693
1. Partial chinook closure years. 2. One adult Chinook bag limit.