Orbis Database for Our Research: A Practical User Guide · Andriansyah January 2014; pg. 1 Orbis...
19
Andriansyah January 2014; pg. 1 Orbis Database for Our Research: A Practical User Guide This user guide will show you how to utilize Orbis - Bureau van Dijk database available at the Victoria University library for our research. Using the perspective from a research student, this guide provides a practical, straightforward guide to collect data. In order to do so, we provide an example of data need for an illustrative purpose. Other needs of different data are easy to collect after understanding this guide and exploring the database by yourself. Let’s start by identifying a hypothetical model we would like to examine. For an illustrative purpose, let’s say we are interested in examining the relationship between stock return and dividends as specified by the following model: where return is the stock return, calculated by ; dividend is the ordinary dividend payment; ROA is return on assets, and asset is the total assets. The subscript i denotes individual firms and t indexes year. ROA and asset are set as control variables. Again, as an illustrative purpose, we are interested in Australian equity market over the period 2008-2012. Our sample is non finance firms listed on the Australian Stock Exchange. With this need, we practically would collect a panel data set which looks like as follows:
Transcript of Orbis Database for Our Research: A Practical User Guide · Andriansyah January 2014; pg. 1 Orbis...
Andriansyah January 2014; pg. 1
Orbis Database for Our Research: A Practical User Guide
This user guide will show you how to utilize Orbis - Bureau van Dijk database available
at the Victoria University library for our research. Using the perspective from a research
student, this guide provides a practical, straightforward guide to collect data. In order to
do so, we provide an example of data need for an illustrative purpose. Other needs of
different data are easy to collect after understanding this guide and exploring the database
by yourself.
Let’s start by identifying a hypothetical model we would like to examine. For an illustrative
purpose, let’s say we are interested in examining the relationship between stock return and
dividends as specified by the following model:
where return is the stock return, calculated by ; dividend is
the ordinary dividend payment; ROA is return on assets, and asset is the total assets. The
subscript i denotes individual firms and t indexes year. ROA and asset are set as control
variables.
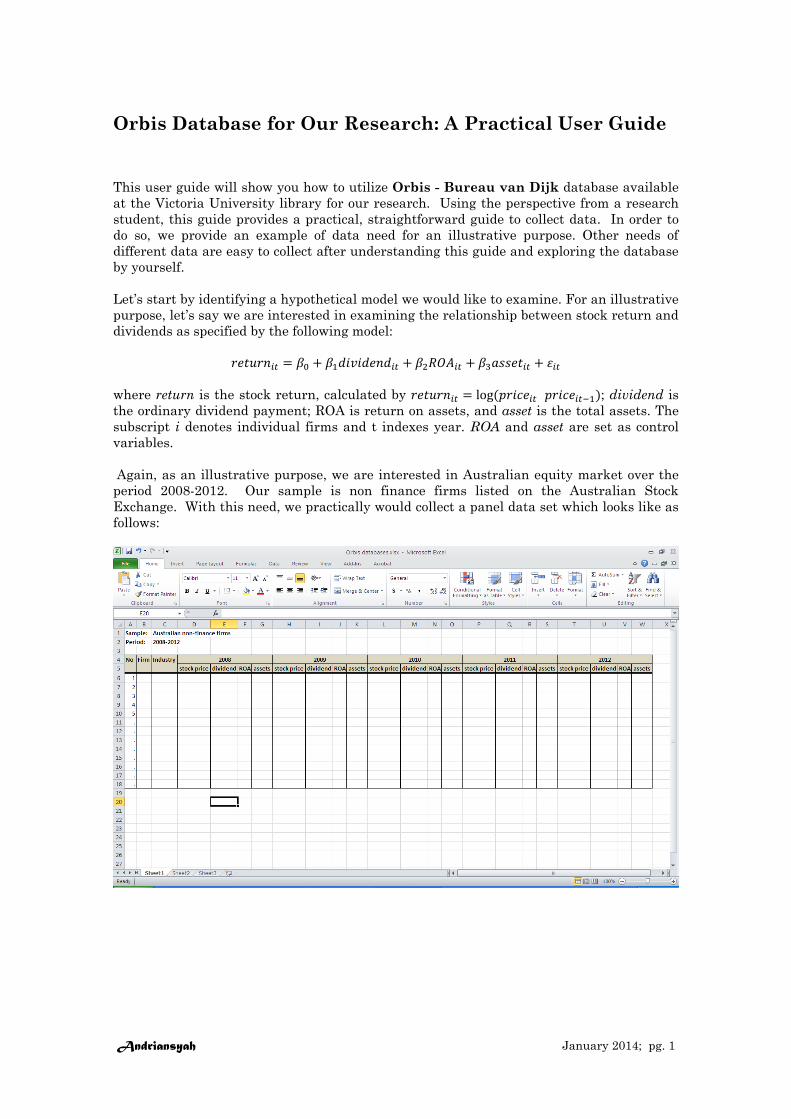
Again, as an illustrative purpose, we are interested in Australian equity market over the
period 2008-2012. Our sample is non finance firms listed on the Australian Stock
Exchange. With this need, we practically would collect a panel data set which looks like as
follows:
Andriansyah January 2014; pg. 2
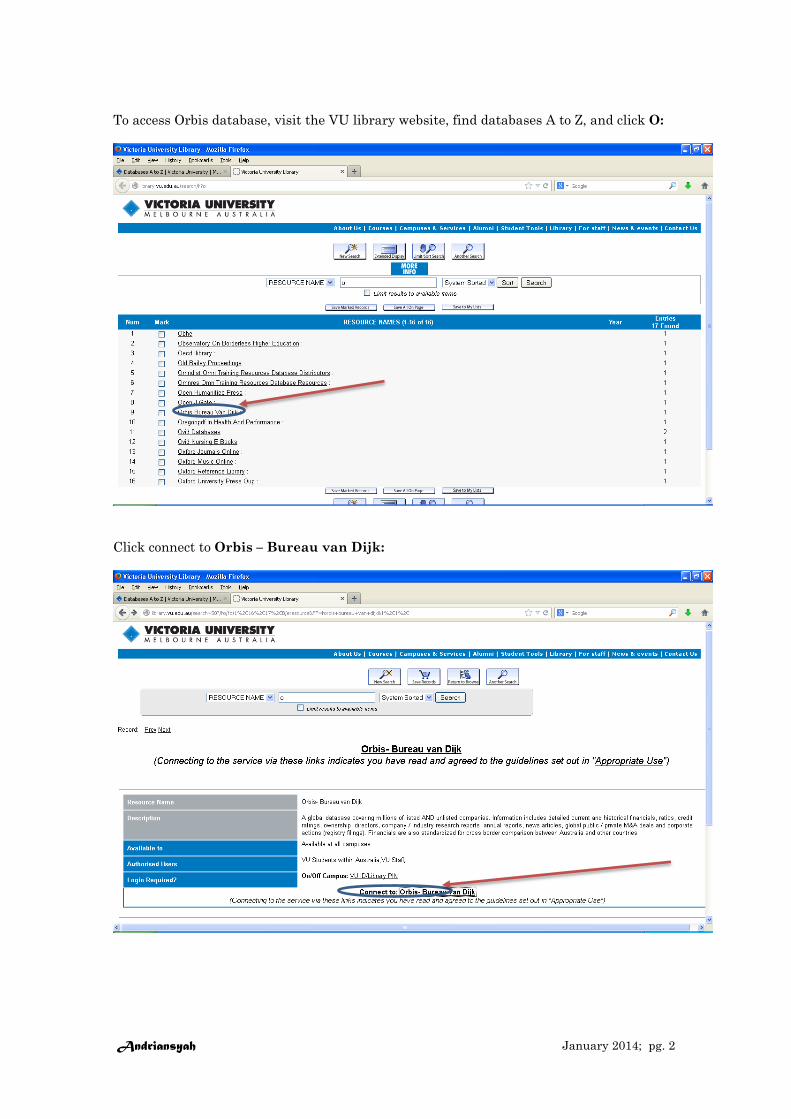
To access Orbis database, visit the VU library website, find databases A to Z, and click O:
Click connect to Orbis – Bureau van Dijk:

Andriansyah January 2014; pg. 3
After entering our student ID and library password, we will have a full access to the
database:
Remember that we aim to download non-finance listed firm accounting data from
Australia over the period 2008-2012.
First we need to choose Australia by the following steps:
Click Location -> World region/Country/Region in country

Andriansyah January 2014; pg. 4
Tick Australia and then OK
We will find this screen below. Looking at the summary (as indicated below), we know that
Orbis covers data for 564,348 firms around the world, where 16,851 are located in
Australia.

Andriansyah January 2014; pg. 5
However, we only need data form listed firms; therefore we shall limit the search further by
clicking Legal form and then Public/Private/Branch:
Tick Public and OK

Andriansyah January 2014; pg. 6
And then click Stock data -> Listed/unlisted companies and OK
Tick Publicly listed companies and OK

Andriansyah January 2014; pg. 7
Now, we can see that the number of listed firms in Australia covered by Orbis is 1,840
firms.
Please note that we only choose firms that are still listed as of the time we access the
databases. If we want also covers unlisted firms, for instance to avoid survival bias, we may
also click Formerly publicly listed companies to cover delisted firms. If a country has two or
more stock exchanges, we may need to choose one or some stock exchanges by clicking Stock
data and Stock exchange, as shown below.
Because we are only interested at non-finance firms, our next step is to exclude finance
firms from our sample by clicking Industry and Industry classifications:

Andriansyah January 2014; pg. 8
Please be aware that industry classifications are different from country to country. Orbis
have five different industry classifications: NACE Rev.2, NAICS 2007, US SIC, NACE Rev.
2 main sections and BvD major sections. We leave the definitions of each of them for you to
explore.
Now, let’s say we would like to use BvD major sector, and define finance firms as Banks
and Insurance companies. Tick all sectors except the two sectors and click OK

Andriansyah January 2014; pg. 9
Our final sample now consists of 1,744 non finance firms:
After clicking View list of results, we will see:
We see that the Orbis shows the default result of our search i.e. non-finance listed
Australian firms. Here it shows company name, country ISO code, NACE rev. 2 core code,
cons. code, last avail. year, operating revenue, number of employees, BvD indep. indic, and

Andriansyah January 2014; pg. 10
GUO name. Of these variables, we only need company name and last avail. year. We may
delete unused variables by clicking icon X (removing the columns) or keep them by doing
nothing. We can also add more columns by clicking Add
In fact, clicking Add may be the most important steps to choose the variables we need.
After clicking Add, we will see:
From here we invite you to fully explore all Options available to identify data you may
need. We can also delete the columns as mentioned above by unticking in Your Selection.
Let’s untick all boxes.

Andriansyah January 2014; pg. 11
In our case, variables we need to download are industry, stock price, dividend payment,
ROA and total assets.
Let’s start from industry data. Click Industry & activities, Industry classification and tick
BvD major section. We can see that BvD major section now exists under Variables in Your
Selection. This indicates we have selected the industry data to download.
Now select stock price data. Click Stock data and Annual stock data:

Andriansyah January 2014; pg. 12
After clicking Market price – year end, we will see the screen below.
Click Absolute years, then tick 2012, 2011, …, 2007. Click also original currency, or
equivalently we also can tick AUD and untick USD. Exchange rate that is used is at each
closing date. Note that we also add 2007 even though our sample period is 2008-2012; this
is because we need stock price in 2007 to calculate return in 2008.
Click OK, and now the stock price data has been selected, together with BvD major
sector. Note that if you also see Market price | Lastest avail. year under Variables, that
happens because you have not unticked Last avail. year in Relative years before we click
Absolute years.

Andriansyah January 2014; pg. 13
Now, search for ordinary dividends and select it. We can find ordinary dividends under
Financial data, Detailed Format, Profit & loss account:
Again we click Absolute periods and tick 2012, …, 2008. Tick original currency (or tick
AUD and untick USD), tick thousand under Unit (it is up to you to choose the unit you like;
here we choose thousand), and tick at each closing date under Exchange rate. Click OK.

Andriansyah January 2014; pg. 14
Next, ROA can be found under Financial data, Global ratios, Industry companies. Choose
ROA using Net income (%). Note that ROA is measured as a percentage, so now we only
need to choose years, not currency, unit and exchange rate.
Finally, total assets can be found under Financial data, and Key financial & employees. Do
the same things as before, to get:

Andriansyah January 2014; pg. 15
Check again if all variables we need are already under Variables; or we can modify them if
necessary. In our case, we need to untick ROA using Net Income | latest avail. yr. If every
thing is ok as we need, click OK
Here are the final results we need. Oops- not exactly final actually, but very close to get
there. Some notes here:
1. There are 1,744 non finance firms in our sample. We can see that the display
below is only the first of 70 screens. We can scroll down to check this.
2. There are 22 columns for all variables (1 for industry, 6 for stock prices, 5 for each
dividends, ROA, and assets). We can scroll to the right to check this.
3. We can save the search strategy by clicking Save. Search strategy is the options
we set to define our sample i.e. non finance Australian listed public firms.
4. We can save or export the result into a Microsoft Excel file by clicking Export.

Andriansyah January 2014; pg. 16
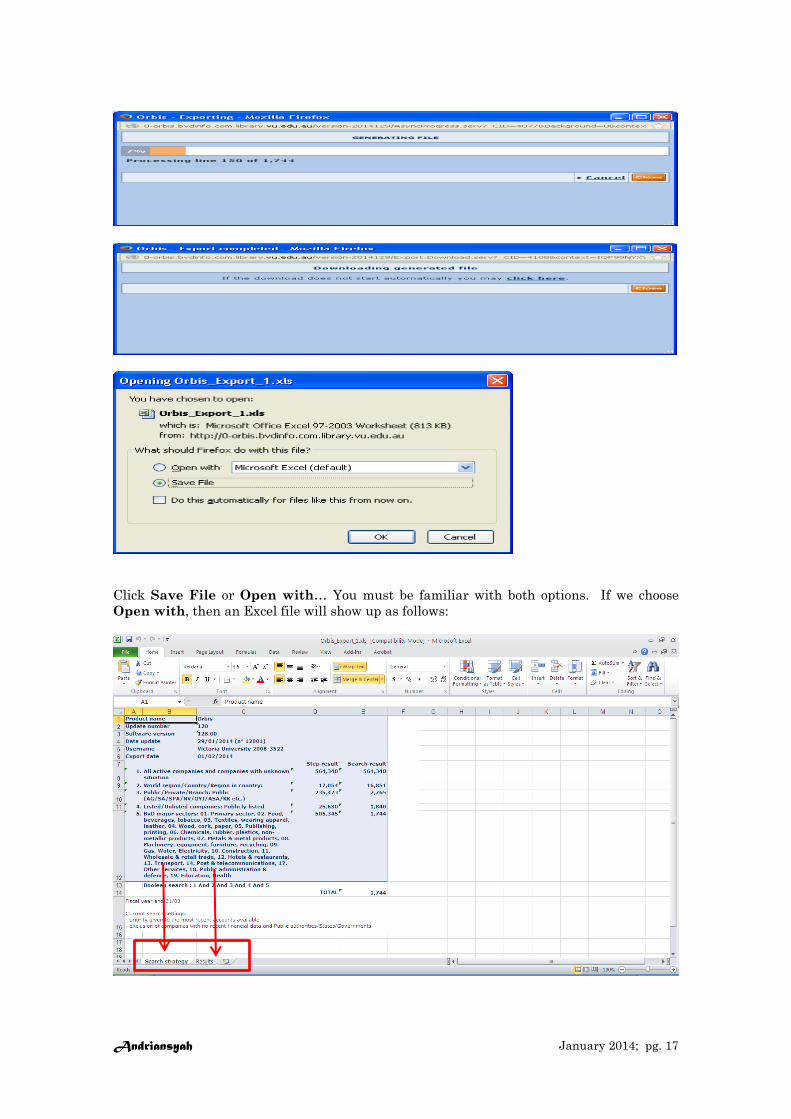
This screen will appear after we click Export:
Say, keep the parameters as they are. The most important is we select an Excel file (*.xls)
as a selected format. We can change the name of file if we wish. Click OK.
Then, well, be patient….
Andriansyah January 2014; pg. 17
Click Save File or Open with… You must be familiar with both options. If we choose
Open with, then an Excel file will show up as follows:
Andriansyah January 2014; pg. 18
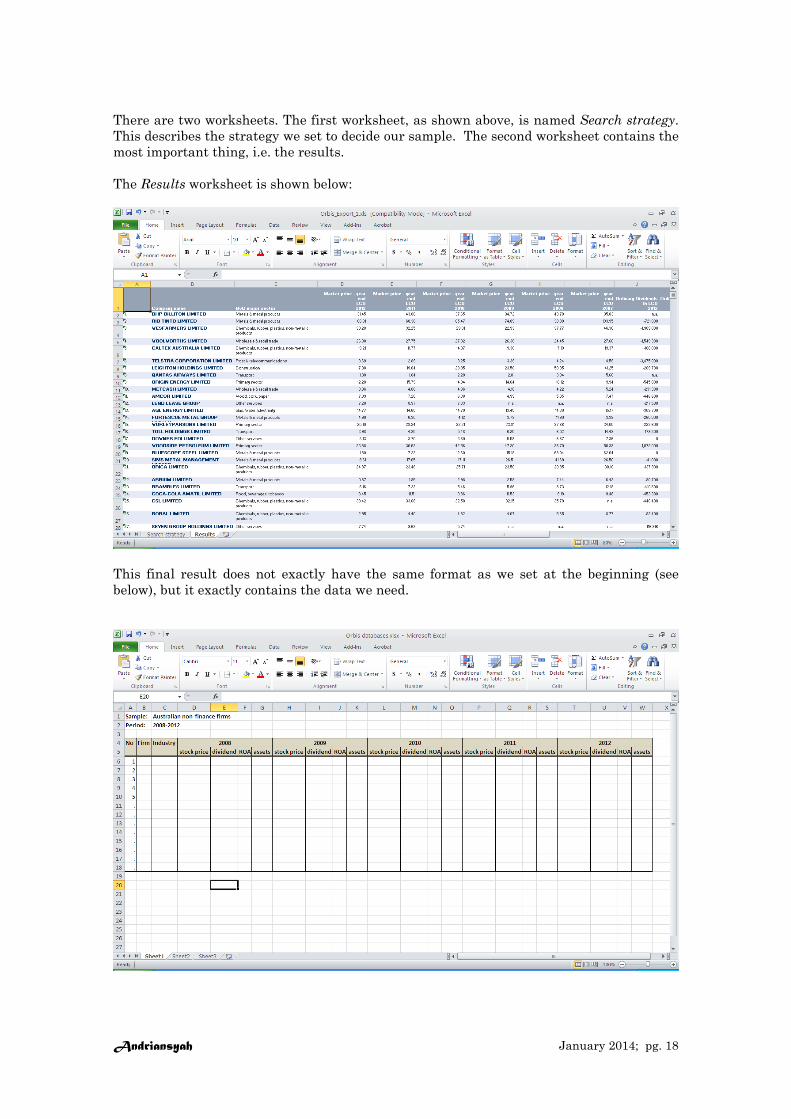
There are two worksheets. The first worksheet, as shown above, is named Search strategy.
This describes the strategy we set to decide our sample. The second worksheet contains the
most important thing, i.e. the results.
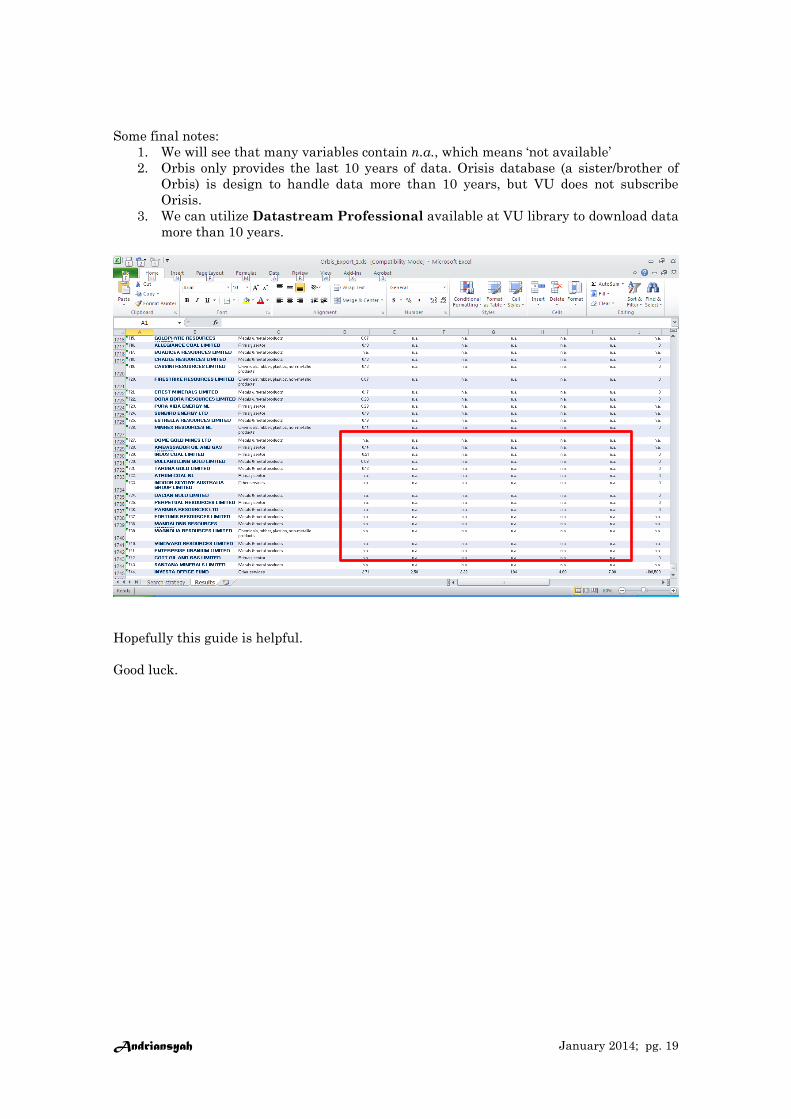
The Results worksheet is shown below:
This final result does not exactly have the same format as we set at the beginning (see
below), but it exactly contains the data we need.
Andriansyah January 2014; pg. 19
Some final notes:
1. We will see that many variables contain n.a., which means ‘not available’
2. Orbis only provides the last 10 years of data. Orisis database (a sister/brother of
Orbis) is design to handle data more than 10 years, but VU does not subscribe
Orisis.
3. We can utilize Datastream Professional available at VU library to download data
more than 10 years.
Hopefully this guide is helpful.
Good luck.