
Orange Belgium’s Bold positioning drives another quarter ...
24
Press release Embargo until February 13, 2019 at 7:00 am Regulated information Financial information for the fourth quarter and full year 2018 Orange Belgium’s Bold positioning drives another quarter of solid commercial growth Strong growth in mobile contract net-adds: +116.8% yoy / +61k in Q4’18 Solid convergence contract net-adds: +75.0% yoy / +25 k in Q4’18 Q4’18 Retail services revenue +9.8% yoy Q4’18 Adjusted EBITDA +11.3% yoy Proposed dividend: €0.50 per share Q4’18 Belgium operational highlights Record mobile contract net-adds. The mobile contract customer base grew 61k to 2.5m subscribers. Orange Belgium’s simplified mobile offering continued to attract customers towards mid and high-end tariffs. These plans include abundant voice/data allowances and have improved customer satisfaction and retention. Average mobile data consumption per subscriber continued its growth trajectory. In December, usage grew 79% yoy (twice the 2017 growth rate) to 3.2 GB/month. Convergence offering confirmed its high attractiveness without recourse to promotional activities. Love customers reached 180k (+75.0% yoy) with net-adds of 25k subscribers. Convergent mobile subscribers grew by 81.6% yoy and represent 11.5% of mobile contract customers. Solid growth in B2C convergent ARPO and slight contraction in mobile-only ARPO. B2C convergent ARPO grew by 7.0% to €75.5 due to absence of promotional activities. Mobile-only ARPO ended 1.8% lower as decreasing out-of- bundle revenues mitigated greater access revenues. Group financial highlights Q4’18 revenues increased 5.1% to €342.2m thanks to retail services (+9.8%), in particular convergent services (+94.6%). Full-year revenues grew 2.7% to €1,279.8m on the solid growth in retail services (+8.4%). Q4’18 Adjusted EBITDA grew by 11.3% to €77.4m on growing revenues as well as efficiencies, in particular an improving cost structure in convergence services. Amidst a surge in convergent customers, the cable operations’ EBITDA loss was limited to €1.5m this quarter against a €3.5m loss in Q4’17. Adjusted EBITDA for the full-year contracted by 3.3% €286.1m due to the loss of MVNO revenues and the impact of EU roaming regulation. Net debt decreased to €264.3m at year-end. Gearing remains low with a net debt to EBITDA ratio of 0.9x. The Board of Directors will propose at the Annual General Meeting a dividend of €0.50 per share for the 2018 fiscal year. Orange Belgium Group’s consolidated key figures FY 2018 FY 2017 Variation Q4 2018 Q4 2017 Variation Belgium operating KPI Mobile contract customers base excl. M2M (in ‘000) 2,469 2,315 6.6% Net adds excl. M2M qoq (in ‘000) 153 68 126.9% 61 28 116.8% ARPO mobile only contract (€ per month) 20.8 21.2 -1.8% Convergent customer base (in ‘000) 180 103 75.0% Net adds qoq (in ‘000) 77 70 11.0% 25 21 18.5% B2C convergent ARPO (€ per month) 75.5 70.5 7.0% convergent mobile customer as % mobile contract customer base 11.5% 6.7% Group financials (€ m) Revenues 1,279.8 1,246.4 2.7% 342.2 325.4 5.1% Retail service revenues 768.4 709.0 8.4% 199.3 181.4 9.8% Adjusted EBITDA 286.1 295.8 -3.3% 77.4 69.6 11.3% % of Revenues 22.4% 23.7% 22.6% 21.4% Net profit 32.4 39.0 -16.8% 8.2 -1.9 529.0% Capex -179.4 -188.4 -4.8% -69.0 -73.8 6.5% Organic cash flow 80.6 65.9 22.3% -14.1 -15.9 11.4% Net financial debt 264.3 312.8 -15.5%
Transcript of Orange Belgium’s Bold positioning drives another quarter ...

Press release
Embargo until February 13, 2019 at 7:00 am
Regulated information
Financial information for the fourth quarter and full year 2018
Orange Belgium’s Bold positioning drives another quarter of solid commercial growth
Strong growth in mobile contract net-adds: +116.8% yoy / +61k in Q4’18
Solid convergence contract net-adds: +75.0% yoy / +25 k in Q4’18
Q4’18 Retail services revenue +9.8% yoy
Q4’18 Adjusted EBITDA +11.3% yoy
Proposed dividend: €0.50 per share
Q4’18 Belgium operational highlights
Record mobile contract net-adds. The mobile contract customer base grew 61k to 2.5m subscribers. Orange Belgium’s
simplified mobile offering continued to attract customers towards mid and high-end tariffs. These plans include abundant
voice/data allowances and have improved customer satisfaction and retention.
Average mobile data consumption per subscriber continued its growth trajectory. In December, usage grew 79% yoy
(twice the 2017 growth rate) to 3.2 GB/month.
Convergence offering confirmed its high attractiveness without recourse to promotional activities. Love customers
reached 180k (+75.0% yoy) with net-adds of 25k subscribers. Convergent mobile subscribers grew by 81.6% yoy and
represent 11.5% of mobile contract customers.
Solid growth in B2C convergent ARPO and slight contraction in mobile-only ARPO. B2C convergent ARPO grew by
7.0% to €75.5 due to absence of promotional activities. Mobile-only ARPO ended 1.8% lower as decreasing out-of-
bundle revenues mitigated greater access revenues.
Group financial highlights
Q4’18 revenues increased 5.1% to €342.2m thanks to retail services (+9.8%), in particular convergent services (+94.6%).
Full-year revenues grew 2.7% to €1,279.8m on the solid growth in retail services (+8.4%).
Q4’18 Adjusted EBITDA grew by 11.3% to €77.4m on growing revenues as well as efficiencies, in particular an improving
cost structure in convergence services. Amidst a surge in convergent customers, the cable operations’ EBITDA loss was
limited to €1.5m this quarter against a €3.5m loss in Q4’17. Adjusted EBITDA for the full-year contracted by 3.3%
€286.1m due to the loss of MVNO revenues and the impact of EU roaming regulation.
Net debt decreased to €264.3m at year-end. Gearing remains low with a net debt to EBITDA ratio of 0.9x.
The Board of Directors will propose at the Annual General Meeting a dividend of €0.50 per share for the 2018 fiscal year.
Orange Belgium Group’s consolidated key figures FY 2018 FY 2017 Variation Q4 2018 Q4 2017 Variation
Belgium operating KPI
Mobile contract customers base excl. M2M (in ‘000) 2,469 2,315 6.6%
Net adds excl. M2M qoq (in ‘000) 153 68 126.9% 61 28 116.8%
ARPO mobile only contract (€ per month) 20.8 21.2 -1.8%
Convergent customer base (in ‘000) 180 103 75.0%
Net adds qoq (in ‘000) 77 70 11.0% 25 21 18.5%
B2C convergent ARPO (€ per month) 75.5 70.5 7.0%
convergent mobile customer as % mobile contract customer base
11.5% 6.7%
Group financials (€ m)
Revenues 1,279.8 1,246.4 2.7% 342.2 325.4 5.1%
Retail service revenues 768.4 709.0 8.4% 199.3 181.4 9.8%
Adjusted EBITDA 286.1 295.8 -3.3% 77.4 69.6 11.3%
% of Revenues 22.4% 23.7% 22.6% 21.4%
Net profit 32.4 39.0 -16.8% 8.2 -1.9 529.0%
Capex -179.4 -188.4 -4.8% -69.0 -73.8 6.5%
Organic cash flow 80.6 65.9 22.3% -14.1 -15.9 11.4%
Net financial debt 264.3 312.8 -15.5%

Michaël Trabbia, Chief Executive Officer, commented:
“2018 was a turning point for Orange Belgium. We reshaped the telecom market with our Bold Challenger positioning,
while confirming our success on the Internet & TV market with our Love offer. We listened to our customers’ unmet demand
for simple and worry-free offers. I am proud that we were the first Belgian mobile operator to launch unlimited mobile and
convergent services.
Our unlimited offers and excellent network contributed to a record number of new customers choosing a mobile or Love
offer in 2018. Our customers are clearly reaping the benefits: average data consumption has increased 79% in only one
year! And for the first time, Orange was the most used mobile network in Belgium during the New Year celebration.
In 2019, we will continue to address consumer frustrations in Belgium. We will therefore launch a genuine unlimited
Internet-only offer. We are committed to not increase prices on mobile and bundles. Finally, we guarantee indoor mobile
coverage for each customer.”
Arnaud Castille, Chief Financial Officer, stated:
“Orange Belgium met all 2018 targets despite active competition, loss of MVNO revenues and the impact of EU roaming
regulation. This demonstrates our ability to create value with a Bold positioning and highlights the Group’s strong
underlying performance. I am especially pleased that Adjusted EBITDA returned to growth in the third and fourth quarter.
Shaping the future, we also reached two important achievements in 2018. We signed a 5-year wholesale partnership with
Medialaan, the leading Flemish commercial broadcaster. Secondly, we narrowed the convergence operations’ EBITDA
losses by 11% through a combination of cost optimization, churn reduction and lower wholesale price.”
2019 outlook
Orange Belgium expects slight growth in revenues in 2019. The Company targets Adjusted EBITDA between €285m and
€305m. Total capex is expected to remain stable in comparison to last year.
1. Key highlights
1.1 Operational highlights
Orange Belgium guarantees indoor connectivity
As a market differentiator, Orange Belgium gives its customers various innovative solutions to boost the quality of their
indoor calling and surfing experience. Orange customers with an eligible smartphone can benefit from Voice-over-Wi-
Fi (VoWiFi) calling feature or they can ask for a mobile coverage extender (Femto) device to enjoy a premium indoor
coverage. Both solutions are free of charge. During the year, the company dispatched approximately 6.5k Femto
devices.
Orange Belgium participates in the Fluvius’ fibre pilot project in Flanders
Fluvius, the public utilities provider in Flanders, is rolling out a pilot FTTH network with passive access across 5
municipalities. Orange Belgium is the first Belgian telecom operator to partner with Fluvius on this pilot project. Orange
Belgium will be responsible for its own backhaul network and will roll out its own active equipment connected to
Fluvius’ fibre network.
This initiative allows an acceleration of investment and lower prices for consumers, as several operators can use the
shared infrastructure at a reasonable price. It also stimulates competition as each service operator can use its own
active equipment, which allows them to further differentiate on services and technological network innovation.
BIPT updated its customer care quality indicators for the first half of 2018
The Belgian regulator BIPT updated its barometer on fixed and mobile services. The information is designed to provide
end-users as well as policymakers with better insight into the available services. The BIPT analysis highlighted Orange
Belgium’s customer care. The company led in response time on customer assistance services, percentage of
problems solved at first contact as well as complaints concerning billing and repair time.
1.2 Regulatory highlights
Revision of Broadband and TV distribution market analysis decisions – update
Telenet filed an appeal with the European Court of Justice to contest the EC comments letter regarding the new
market analysis. In parallel, all cable operators have appealed the decisions before the Belgian Court of Appeal (Cour
des Marchés). On 30 January 2019, the Court of Appeal rejected the claims of Telenet, Nethys and Brutélé to suspend
the market analysis decisions while waiting for the outcome of the European Court. The timing for the final outcome of
these procedures is uncertain.
The BIPT launched a consultation on the cost models for wholesale access to cable networks and Proximus' FTTH
network. The consultation started on December 13, 2018 and will run until February 15, 2019. The results of the
consultation will be used as input for the future decisions regarding regulated wholesale tariffs.
The implementation of the “broadband only” and “single installer” obligations is decided by the aforesaid BIPT division
and should be available by mid-year.
A pre-consultation on the updated reference offers for cable and the reference offer for Proximus’ fiber network, in
order to reflect the obligations of the new market analysis decisions, is ongoing. The consultation on the reference
offer decisions is expected mid-2019. This should lead to lower access price and greater competition in the fixed
market.
New spectrum allocation, renewal of existing spectrum attributions
The draft of the Royal Decrees regarding the allocation of the 700, 1400 and 3400-3800 MHz band and the
renewal/reallocation conditions of the 900, 1800 and 2100 MHz bands were approved in July. However, Mr Alexander
De Croo then Minister of Telecommunications put forward an unexpected new element relating to the conditions to
attract a 4th mobile network operator. The Council of Ministers gave an initial approval for the Royal Decrees at the end
of that month.
On 6 February 2019, the Federal and regional governments failed to reach an agreement on the allocation of proceeds
from the spectrum auction and by a lack of an impact study on the possibility of opening the auction to a fourth
entrant with discriminatory conditions.
It is unclear whether the current government will handle the proposal to change the electronic communications law and
the Royal Decrees regarding the attribution and renewal of an important number of frequencies. A spectrum auction in
2019 is in any case unlikely. If the current government cannot conclude on the matter, the process will be substantially
delayed further.
Fixed voice access and call origination
In line with other EU markets, the BIPT has decided to deregulate fixed voice related markets. Proximus proposes to
continue to supply a carrier select / carrier preselect service on commercial terms until the end of 2019. The BIPT
decided on December 17, 2018, to deregulate end-users’ access to national fixed telephony services via CS (Carrier

Selection) and CPS (Carrier Preselection). A similar decision has been taken for the wholesale fixed call origination
market.
Regulation on international intra-EU tariffs for voice & SMS
As from May 15, 2019. European regulations are applicable to intra-EU international voice calls and SMS for residential
customers. A cap of €0.19 per minute (excl. VAT) is applicable to voice calls while SMS charges are limited to €0.06
(excl. VAT) per message.
Electromagnetic fields standards in Brussels
The Brussels regional government has agreed to a framework with mobile operators to allow the deployment of a next-
generation network in the capital. The cap for Electromagnetic fields is expected to increase from 6 volts per meter to
14.5 volts per meter. Without this increase, 5G deployment would be impossible in the Brussels region.
2. Comments on the financial situation
2.1 Consolidated figures for the Orange Belgium Group
Orange Belgium group’s consolidated key figures (€ m) FY 2018 FY 2017 Variation Q4 2018 Q4 2017 Variation
Revenues 1,279.8 1,246.4 2.7% 342.2 325.4 5.1%
Retail service revenues 768.4 709.0 8.4% 199.3 181.4 9.8%
Equipment sales 125.0 125.4 -0.3% 40.1 43.9 -8.6%
Wholesale revenues 329.2 350.7 -6.1% 85.6 82.7 3.4%
Other revenues 57.2 61.3 -6.6% 17.3 17.4 -0.8%
Adjusted EBITDA 286.1 295.8 -3.3% 77.4 69.6 11.3%
% of Revenues 22.4% 23.7% 22.6% 21.4%
Reported EBITDA 278.6 305.6 -8.8% 74.4 67.6 10.1%
% of Revenues 21.8% 24.5% 21.8% 20.8%
Net profit 32.4 39.0 -16.8% 8.2 -1.9 529.0%
Earnings per share (€) 0.54 0.65 -17.0% 0.14 -0.03 527.9%
Capex -179.4 -188.4 -4.8% -69.0 -73.8 6.5%
% of Revenues 14.0% 15.1% 20.2% 22.7%
Organic cash flow 80.6 65.9 22.3% -14.1 -15.9 11.4%
Net financial debt 264.3 312.8 -15.5%
Net financial debt / Reported EBITDA 0.9 1.0
2.2 Consolidated statement of comprehensive income
Revenues Group revenues grew 2.7% to €1,279.8m in 2018. In Q4’18, group revenues increased 5.1% yoy to €342.2m. For the last
quarter of the year, the MVNO revenues had a positive impact of €2.7m while the EU roaming regulation had a negative
impact of €5.5m. The total impact during 2018 of the MVNO revenues was -€27.9m and -€26.2m for the EU roaming
regulation.
Retail service revenues grew 8.4% to €768.4m for the full year and by 9.8% in the fourth quarter to €199.3m. Growth was
mainly driven by convergent services revenues, which doubled (+94.6% in the fourth quarter and +117.6% for the full-year).
Result of operating activities before depreciation and other expenses The adjusted EBITDA amounted to €77.4m in the fourth quarter, an increase of 11.3% yoy, which translated into a margin
of 22.6%, an improvement of 124 bps. For the full year, the adjusted EBITDA reached €286.1m (-3.3% yoy). The EU
roaming regulation impacted the adjusted EBITDA for the quarter by - €3.1m. For the complete year, the impact of the
MVNO revenues and the EU regulation was of -€27.9m and of -€16.8m, respectively.
It is important to highlight that the EBITDA loss of convergence services has decreased from €3.5m in the fourth quarter of
2017 to €1.5m this quarter in spite of a steady increase of the convergence subscriber base. This was achieved thanks to
cost improvement, churn reduction and a reduced wholesale price. As soon as the single-installer is implemented, Orange
will have a positive impact on its direct costs as well as on the churn levels.
Total operational expenses reached €264.8m in Q4’18 (+3.5%) compared to €255.9m in the previous year. Total
operational expenses for the full-year increased 4.5% to €993.7m. The following provides an overview of the different
expenses:
Direct costs decreased by 0.5% to €160.5m in Q4’18 as the lower wholesale price for cable access helped contained
access costs. During the quarter, higher cable access and content costs were offset by lower customer equipment costs
and commissions due to the 2017 acquisition of distribution partners. For the full-year, direct costs increased 4.5% to
€593.0m mainly due to higher cable access and content costs.
Labor costs increased due to the integration of distribution partners acquired last year. Labor costs in Q4 increased
1.4% to €34.1m in Q4’18 (Q4’17: €33.6m) For the full-year, labor costs increased 6.5% to €139.5m (2017: €131.0m).

Indirect costs amounted to €70.2m in Q4’18 compared to €60.9m in the previous year. The 15.3% increase is due to
greater IT & Network expenses linked to the Company’s digital transformation as well as higher advertizing expenses due
to end of year campaigns. For the full-year, indirect costs increased 3.5% to €261.1m due to higher IT & Network
expenses and advertizing expenses.
The adjustments to EBITDA amounted to -€2.9m in Q4’18 and -€7.6m for the full-year. These were entirely related to
headcount related restructuring charges.
Reported EBITDA adjustments (€ m ) FY 2018 FY 2017 Variation Q4 2018 Q4 2017 Variation
Adjusted EBITDA 286.1 295.8 -3.3% 77.4 69.6 11.3%
Adjustments -7.6 9.8 N/A -2.9 -1.9 N/A
- o/w other restructuring costs -7.6 9.7 N/A -2.9 -1.9 N/A
- o/w other operating income 0.0 0.1 N/A 0.0 0.0 N/A
Reported EBITDA 278.6 305.6 -8.8% 74.4 67.6 10.1%
Depreciation and amortization
In Q4’18, depreciation and amortization increased from €60.8m to €62.0m. On a full-year basis, depreciation and
amortization increased from €230.1m to €235.7m in 2018.
Operating profit (EBIT)
Q4’18 operating profit was €12.5m compared to a €11.0m operating loss in Q4’17. The increase was largely attributable to
a €6.8m growth in reported EBITDA during the quarter. 2018 EBIT decreased 25.6% to €43.2m due to lower Adjusted
EBITDA and higher restructuring charges. The operating margin in Q4’18 was 3.7% and 3.4% on a full-year basis.
Financial result
Net financial expenses were comparable to the previous year. Q4’18 expenses were €1.3m while full-year expenses
amounted to €4.9m.
Taxes
Tax expense for Q4’18 was €3.0m compared to a €10.4m tax credit in Q4’17. Full-year tax expense decreased from
€14.1m in 2017 to €5.9m in 2018. The decrease is the cumulative impact of a lower pre-tax profit, and a lower corporate
tax rate (29.58% in 2018 versus from 33.99% in 2017). In 2017, the Company took a €17.9m goodwill impairment charge
on Orange Communications Luxembourg, which was not tax-deductible. The effective tax rate in 2018 was 15.3% against
26,6% in the previous year.
Net profit
In Q4’18, higher Adjusted EBITDA and lower tax expense contributed to a net profit of €8.2m compared to a €1.9m loss in
2017. The full-year net profit decreased from €39.0m in 2017 to €32.4m in 2018 due to lower Adjusted EBITDA and higher
restructuring charges.

2.3 Liquidity and capital resources
The Group uses Operating cash flow and Organic cash flow as the main metrics for analysing cash generation. Operating
cash flow is defined as Adjusted EBITDA less capex. Organic cash flow measures the Net cash provided by operating
activities, less capex, plus proceeds from the disposal of tangible and intangible assets.
During the quarter, the Company spent €69.0m on capital expenditures (Q4’17: €73.8m), of which €12.3m was cable-
related (Q4’17: €11.3m). Capital expenditure for the year was €179.4m (2017 €188.4m), of which €43.7m (2017 €46.8m)
was cable-related.
Operating cash flow improved from -€4.2m in Q4’17 to €8.4m in Q4’18 due to higher Adjusted EBITDA and lower capex.
On a full-year basis, operating cash flow increased to €106.7m due to lower capex.
Organic cash flow improved in Q4’18 as cash usage decreased from €15.9m to €14.1m. On a full-year basis, organic cash
flow improved by 22.3% to €80.6m due to lower capex payables.
Consolidated cash flow statement (€m ) FY 2018 FY 2017 Variation Q4 2018 Q4 2017 Variation
Adjusted EBITDA 286.1 295.8 -3.3% 77.4 69.6 11.3%
Capex -179.4 -188.4 4.8% -69.0 -73.8 6.5%
Operating cash flow 106.7 107.4 -0.6% 8.4 -4.2 299.9%
Tax paid -29.0 -52.4 44.6% -4.0 -14.8 72.8%
Net interest -3.8 -3.8 1.7% -0.9 -0.9 7.7%
Working capital 18.5 45.9 -59.8% -23.6 3.4 -803.6%
Other -10.5 -18.7 44.1% -13.1 -17.7 26.0%
Change in fixed assets payables -1.4 -14.1 90.3% 19.1 16.8 13.7%
Disposal of property, plant and equipment and intangible assets 0.0 1.6 -100.0% 0.0 1.6 -100.0%
Organic cash flow 80.6 65.9 22.3% -14.1 -15.9 11.4%
Financial investments -4.2 -8.0 4.5 -8.3
Treasury shares 2.5 -2.2 2.5 0.0
Dividends -30.0 -30.0 0.0 0.0
Debt drawdown 14.8 5.9 16.4 -5.9
Debt repayment -50.1 -70.1 - 0.0 29.9
Net change in cash and cash equivalents 13.6 -38.5 9.3 -0.2
Cash and cash equivalents
Opening balance 13.0 51.4 17.2 13.2
Closing balance 26.6 13.0 26.6 13.0
Net financial debt 264.3 312.8
Net debt at year-end was €264.3m, compared to €312.8m at the end of 2017. The net debt/reported EBITDA ratio at
December 31, 2018 amounted to 0.9x.
Orange Belgium Group’s consolidated key figures (€ m) 2018 2017
Group revolving credit facility -288.3 -325.8
Bank credit line -2.5 0.0
Gross debt -290.9 -325.8
Cash and equivalents 26.6 13.0
Net debt -264.3 -312.8
Net debt/Adjusted EBITDA 0.9x 1.0x
Net debt/Reported EBITDA 0.9x 1.0x

2.4 Activities of the Orange Belgium Group by segment
The following gives a breakdown of Orange Belgium Group’s activities in greater detail:
2.4.1. Activities in Belgium
Operational Review
Key operating figures of Orange Belgium (in ‘000) Q4
2018
Q4
2017 Variation
Convergent KPIs
convergent customer base 180 103 75.0%
- B2C convergent customer base 162 94 73.0%
- B2B convergent customer base 18 9 95.4%
quarterly ARPO (€ per month)
- B2C convergent ARPO 75.5 70.5 7.0%
Mobile KPIs
mobile customers (excl. MVNOs) 4,149 3,855 7.7%
- contract 3,582 3,265 9.7%
- M2M 1,114 950 17.2%
- excluding M2M 2,469 2,315 6.6%
- prepaid 567 589 -3.8%
mobile customers (excl. MVNOs) 4,149 3,855 7.7%
- B2C convergent 244 137 77.9%
- mobile only and mobile B2B 3,906 3,717 5.1%
- M2M 1,114 950 17.2%
- excluding M2M 2,225 2,178 2.1%
of which B2B convergent mobile 40 19 108.2%
- prepaid 567 589 -3.8%
MVNO customers 12 522 -97.6%
quarterly ARPO (€ per month)
mobile only blended ARPO 18.0 18.2 -1.5%
- mobile only contract ARPO 20.8 21.2 -1.8%
- mobile only prepaid ARPO 7.1 7.7 -6.7%
Fixed KPIs
broadband customers 186 109 71.1%
- FTTx and cable customers 180 103 75.0%
- xDSL 6 6 1.1%
- LTE for fixed and others 0 0
internet features
TV 180 103 75.0%
Convergent operations
The convergent customer base, i.e. customers that have subscribed to offers combining at least a fixed broadband
connection and a mobile contract, is an important commercial indicator for Orange Belgium. Orange Belgium’s growth
momentum in convergence continued in Q4’18 with 25k net additions, resulting in a total convergent customer base of 180k,
of which 162k were B2C customers and 18k B2B customers. This was achieved without any promotional activities. Churn in
the convergent segment reached its lowest level since launch. This was realized thanks to a dedicated focus on quality
throughout the entire customer journey.
In the B2C mobile convergent segment, Orange Belgium added 34k subscribers during the quarter, taking its customer base
for this segment to 244k (137k in Q4’17). The B2C convergent ARPO increased 7% to €75.5 euros in Q4’18. The B2B mobile
convergent customer base increased to 40k at the end of Q4’18.
Mobile operations
Orange Belgium’s mobile performance was very solid in Q4’18, with net adds of 110k mobile customers or an increase of
295k compared to the end of the fourth quarter of 2017. Excluding M2M, the contract customer base increased by 61k in the
fourth quarter, which shows an acceleration in net additions compared to last year. The M2M contract base increased by 58k
in the past quarter to 1.1m connected cards. Finally, the prepaid customer base slipped by 3.8% in the fourth quarter of 2018.
Mobile-only blended ARPO, which excludes all B2C mobile customers who have subscribed to a convergence offer,
amounted to €18.0 in the fourth quarter of 2018, an decrease of 1.5% yoy. The mobile-only contract ARPO slipped by 1.8%
yoy to to €20.8 in the fourth quarter of 2018. Explained by the fact that Orange Belgium’s generous offers in voice and data

included in its mobile plans have led to a reduction in out-of-access revenues. This was in part compensated by an increase in
the access revenues. Prepaid ARPO dropped 6.7% to €7.1 in the fourth quarter of 2018.
Fixed segment
At the end of the Q4’18, Orange Belgium had a total of 122k fixed voice lines, compared to 134k at the end if Q4’17. The xDSL
customer base, which mostly relates to legacy ADSL business that is no longer available, remained flat.
Financial Review
Key financial figures of Orange Belgium (€ m) FY 2018 FY 2017 Variation Q4 2018 Q4 2017 Variation
Revenues 1,226.4 1,191.6 2.9% 327.2 310.5 5.4%
Retail service revenues 727.6 671.5 8.4% 188.4 171.9 9.6%
Convergent service revenues 106.3 48.9 117.6% 32.7 16.8 94.6%
Mobile only service revenues 583.3 583.9 -0.1% 145.8 145.4 0.2%
Fixed only service revenues 33.6 35.3 -5.0% 8.9 8.7 1.6%
IT & Integration service revenues 4.5 3.5 28.8% 1.1 0.9 17.7%
Equipment sales 110.4 108.8 1.5% 36.2 38.2 -5.3%
Wholesale revenues 322.6 344.1 -6.2% 83.0 80.5 3.1%
Other revenues 65.7 67.2 -2.2% 19.6 20.0 -1.9%
Adjusted EBITDA 279.9 287.2 -2.5% 74.7 63.8 17.0%
% of Revenues 22.8% 24.1% 22.8% 20.5%
Reported EBITDA 272.4 297.1 -8.3% 71.8 61.9 16.0%
% of Revenues 22.2% 24.9% 21.9% 19.9%
Revenues in Belgium for the full year increased 2.9% yoy to €1,226.4m. Revenues grew 5.4% yoy to €327.2m in the fourth
quarter.
Growth in retail service revenues have continued its acceleration in Q4’18 with a year-on-year increase of 9.6%. Retail
service revenues in Q4’18 amounted to €188.4m and €727.6m for the full-year. This strong increase was driven by
continued uptake of convergent services. Convergent services revenues continued its spectacular growth trajectory in the
fourth quarter with an increase of 94.6% yoy, resulting in an increase of 117.6% year-on-year full-year. This growth stems
from the sustained uptake of customers opting for Orange Belgium’s Love offer, resulting in both an increase of the cable
broadband and digital TV customer base, as well as in an increase of convergent mobile customer. Mobile-only service
revenues were stable on a quarterly and full year-basis.
Equipment sales declined by 5.3% to €36.2m in Q4’18 and grew 1.5% to €110.4m for the full-year.
Wholesale revenues grew 3.1% to €83.0m in Q4’18. For the full-year, wholesale revenues decreased by 6.2% to €322.6m.
This was essentially the outcome of expected lower MVNO revenues: €10.2m in the Q4’18 and €43.3m for the full-year
versus €7.4m and €70.8m in the comparable period in 2017.
Adjusted EBITDA in Belgium was €74.7m in Q4’18 and €279.9m for the full-year of 2018, compared to €63.8m and
€287.2m in the comparable period in 2017.
Orange Belgium further reduced the EBITDA loss of its cable business to €1.5m in Q4’18 (loss of €4.3m in Q3’18 and a loss
of €3.5m in Q4’17) due to better industrialization, lower churn and improved wholesale conditions. On the latter, the BIPT
lowered the wholesale access price to €20.29, effective from August 1, 2018 and laid the course for a vast improvement in
the operational model. For the full-year, the cable business represented an EBITDA loss of €16.4m, compared to a loss of
€18.5m in 2017.
2.4.2. Activities in Luxembourg
Market overview
In October, Prime Minister Xavier Bettel was re-elected by forming a new coalition. Digitalization of the country is a clear
priority. In early November, the government announced, it would have an active role in the country’s 5G deployment in
2019.
High mobile penetration is slowing subscriber growth. Competition has intensified with very aggressive promotional entry
tariffs and heavy promotion on flagship devices. Tango (Proximus Luxembourg) launched infinity targeting the youth
segment. Join, the 4th player, MVNO of Post went bankrupt and is now fully owned by the incumbent. SFR (Telenet) has
been actively communicating in Q4.
Mobile Number Portability (MNP) was rather flat this year with less moves between operators than in the previous. This is a
continuous phenomenon so far and is symptomatic of market saturation. The main moves were on the B2B entry and mid
tariffs as well as Orange Luxembourg’s disruptive “Boom” residential mobile offer (which was promoted in Q4 on a limited
period).

Operational Review
Key operational figures of Orange Luxembourg (in ‘000) Q4 2018 Q4 2017 Variation
Convergent KPIs
convergent customer base 8 5 57.5%
- B2C convergent customer base 4 4 24.9%
- B2B convergent customer base 4 2 122.2%
Mobile KPIs
mobile customers (excl. MVNOs) 193 183 5.1%
- contract 180 173 4.4%
- M2M 71 65 8.4%
- excluding M2M 110 108 1.9%
- prepaid 12 11 16.4%
mobile customers (excl. MVNOs) 193 183 5.1%
- B2C convergent 4 4 24.9%
- mobile only 188 180 4.7%
- M2M 71 65 8.4%
- excluding M2M 105 104 1.1%
- prepaid 12 11 16.4%
MVNO customers 2 2 2.9%
quarterly ARPO (€ per month)
mobile only blended ARPO 28.1 27.0 4.2%
- mobile only contract ARPO 30.7 29.1 5.5%
- mobile only prepaid ARPO 6.5 6.7 -3.2%
Fixed KPIs
broadband customers 13 17 -23.3%
- FTTx and cable customers 8 5 57.5%
- xDSL 5 12 -60.2%
- LTE for fixed and others 0 0 NA
internet features
TV 4 4 3.9%
Orange Luxembourg delivered another strong quarter as evidenced by growth of convergent, mobile and fixed customer
base. In Q2’18, Orange Luxembourg changed its handset subsidy strategy to target higher value customers. This
transformation is delivering positive impacts on EBITDA and cash flows. The Company finished the year with the highest
MNP share.
In the mobile market, Orange Luxembourg’s prepaid customer base continued to grow in spite of its focus on the postpaid
segment. In Q4’18, Orange Luxembourg achieved positive net-adds on the contract mobile segment. Mobile subscribers
grew 5.1% to 193k on lower churn in the B2B segment as well as the addition of large accounts. Blended ARPO increased
4.2 % to €28.1 euros.
Consumers have a better perception of Orange’s price positioning. That had positive spill over effects on all offers and
especially the improved Love convergent offers. Orange became a full-fiber provider by selling 1Gbps fiber access as well
as 100Mbps, the current market standard. Orange Luxembourg’s internet and convergent offers remain attractive as the
convergent customer base grew 57.5%. Customers looking for an internet-only plan can choose an ADSL plan (Internet @
Home) or a Fibre plan (La Fibre 100 % Fibre).
Financial Review
Key financial figures of Orange Luxembourg (€ m) FY 2018 FY 2017 Variation Q4 2018 Q4 2017 Variation
Revenues 66.9 66.2 1.0% 19.0 18.7 1.5%
Retail service revenues 40.7 37.4 8.8% 10.8 9.5 14.2%
Convergent service revenues 0.0 0.0 0.0 0.0
Mobile only service revenues 33.0 31.7 4.1% 8.6 7.9 9.5%
Fixed only service revenues 7.8 5.8 35.0% 2.2 1.6 37.3%
IT & Integration service revenues 0.0 0.0 0.0 0.0
Equipment sales 14.6 16.6 -11.8% 3.9 5.7 -30.7%
Wholesale revenues 10.7 9.9 7.9% 3.8 3.1 23.7%
Other revenues 0.9 2.4 -61.9% 0.5 0.5 -9.5%
Adjusted EBITDA 6.2 8.5 -27.1% 2.7 5.8 -52.4%
% of Revenues 9.3% 12.9% 14.4% 30.7%
Reported EBITDA 6.1 8.5 -27.7% 2.7 5.8 -53.2%
% of Revenues 9.2% 12.8% 14.2% 30.7%
Q4’18 revenues grew 1.5% to €19.0m. Retail services continued to perform strongly with revenues increasing 14.2% to
€10.8m. Mobile-only revenue increased 9.5% on a growing subscriber base (+4.7%) and ARPO improvement (+4.2%). The
continued success of Love offers helped Fixed revenues.
Orange Luxembourg reported Adjusted EBITDA of €2.7m in Q4’18 (Q4’17: €5.8m). The year-on-year decline is due to a
one-off item in the previous year. In Q4’17, the company received a €3.3m settlement from a vendor for non-completion of
a project. Excluding that one-off, Adjusted EBITDA increased 9.7% in the fourth quarter.
3. Financial risks and risk management
There have been no significant changes in the information contained in the 2017 annual report (p.75-76 and p.114-115).
4. Disputes
The information relating to disputes included in the 2017 annual report has been updated as follows:
Telecom masts
Since 1997, certain municipalities and four provinces have adopted local taxes, on an annual basis, on pylons, masts or
antennas erected within their boundaries. Orange Belgium continues to file fiscal objections against each tax assessment
notice received concerning these taxes. These taxes are currently being contested in Civil Courts (Courts of First Instance -
Tax Chamber and Courts of Appeal).
On 22 December 2016, the three mobile operators concluded an agreement in principle with the Walloon government on
the issue of taxing mobile infrastructure in the Walloon region for the period 2016-2019 and agreed to settle the dispute on
the Walloon regional taxes for 2014.
Over a 4 year period (2016-2019), Orange Belgium commits to pay €16.1m and to invest €20m on incremental telecom
infrastructure in the Walloon region. In return, the Walloon Region commits to: i) no longer levy taxes on telecom
infrastructure; ii) implement a legislative, regulatory and administrative framework designed to facilitate the deployment of
such infrastructure; and iii) discourage municipalities and provinces from taxing telecom infrastructure. In 2018, several
Walloon municipalities and provinces levied taxes on telecom infrastructure.
The operators will be entitled to deduct such local taxes levied in 2016-2019 by Walloon municipalities or provinces from
the 2019 settlement and investment amounts.
Regulation of broadband and cable
On 29 June 2018, the CRC (the telecoms and media regulators) adopted new decisions on the broadband and broadcast.
These maintain the access obligations of incumbent operators of fixed networks, among which cable operators: Telenet,
Nethys and Brutélé. The decisions imply additional obligations compared to the ones imposed in the 2011 decision and
foresee a reduction of applicable wholesale charges. Telenet attacked the observations of the EC on the draft decision
before the General Court of the European Union. The cable operators also attacked the market analysis decisions before
the Court of appeal of Brussels. Orange Belgium intervened in the national proceedings to support the CRC decision. On 3
October 2018, the Court of Appeal delivered an intermediary judgment. The Court put the national proceedings on hold
until judgment of the European Court, while maintaining its prerogative to maintain or suspend the decisions.
Access to Telenet’s cable network – own channel
The decisions on regulated access to the cable networks allows Orange Belgium to offer its “own channels” (channels that
are not commercially offered by the cable operators) to its retail TV customers. VOO permits such channels (Eleven Sports
3) on its network. Telenet refuses to offer such access at reasonable conditions.
Orange Belgium filed a legal claim before the Commercial Court against Telenet to get access to an own channel at
reasonable conditions. On 30 May 2018, the Commercial Court of Antwerp dismissed Orange Belgium’s claim. Orange
Belgium appealed this decision. The pleadings before the Court of appeal are foreseen in March 2019 and a judgment is
expected in the second quarter of 2019.
Access to Telenet’s cable network – own internet profile
An “internet profile” is the internet access tariff plans that a broadband provider offers its retail clients. These can vary in
data transmission speeds and/ or volumes. Cable network regulations permits alternative operators to package “internet
profiles” which differ from the regulated cable operator’s “own internet profiles”. Despite several requests since 2015,
Telenet refused to grant Orange Belgium such own profile. In view of the damages incurred by these refusals, Orange
Belgium filed a complaint against Telenet with the regulator in February 2018. On 22 October 2018, the regulator published
a decision which found Telenet in breach with its regulatory obligation for not providing an own profile to Orange Belgium.
Lycamobile
On 19 February 2016, Lycamobile Belgium Limited and Lycamobile BVBA initiated legal proceedings against Orange
Belgium (previously Mobistar) before the Brussels Commercial Court claiming damages for the alleged belated commercial
launch of Lycamobile’s 4G services. The case was heard on 10 March 2017. By judgement on 12 May 2017, the Brussels
Commercial Court dismissed the claim and ordered Lycamobile to pay Orange Belgium €18,000 as compensation for
procedural costs. The judgement was served on 3 July 2017 and Lycamobile paid the full amount. On 11 August 2017,

Lycamobile filed an appeal before the Brussels Court of Appeal. An introductory hearing took place on 21 September 2017
and a calendar for the filing of trial briefs was set. Parties have exchanged trial briefs. No pleading date has been set.
Agency agreement
In July 2011, a former agent initiated a procedure before the Brussels Commercial Court to obtain compensation for the
termination of his agency agreement. The agent claims damages for an amount of around €16.9m. Orange Belgium is
convinced that the claim is, at least for the major part, unfounded and filed a counterclaim for around €14.6m. A hearing
was held on 14 January 2013. By judgement on 22 April 2013, the Brussels Commercial Court decided that the claims from
both parties were partially founded. The court appointed a judicial expert to determine the compensation to be paid by
both parties. After several years, both parties reached a settlement. The proceedings were formally terminated by the court
on 8 February 2018.
Euphony Benelux SA in bankruptcy
On 2 April 2015, Orange Belgium was summoned by the receivers of Euphony Benelux NV to a hearing on 17 April 2015 at
the Brussels Commercial Court. The bankruptcy receivers claim that Orange Belgium should pay a provisional amount of
one (1) euro for overdue commissions as well as an eviction fee. In this context, the bankruptcy receivers claim that Orange
Belgium should submit all relevant documents to allow the bankruptcy receivers to calculate the amounts claimed.
On 17 April 2018, the Court dismissed the claim relating to the eviction fee and appointed an expert for the claim relating to
the overdue commissions. Orange Belgium has filed an appeal at the Brussels Court of Appeals. An introductory hearing
took place and the Court of Appeals has set a calendar for the filing of trial briefs. Both parties are currently exchanging
trial briefs.
5. Significant event after the end of the fourth quarter of 2018
On 1 January 2019, the BIPT’s decision on fixed termination rate which lowers tariffs from €0.007/min to €0.0016/min
entered into force. 3Starsnet, a fixed operator, has filed an appeal to the BIPT’s decision.
6. Shareholder remuneration
The Orange Belgium Group aims to balance the appropriate cash returns to equity holders with the requirement of
maintaining a balanced and sound financial position, while leaving sufficient leeway to continue to invest in its convergent
strategy and building out of its network.
Considering the financial and commercial performance of 2018 and the mid-term outlook, the Board of Directors will
propose to the Annual General Meeting of Shareholders on 2 May 2019 to distribute an ordinary gross dividend of €0.50
per share for the financial year 2018. If approved, the gross ordinary dividend of €0.50 will be paid on 16 May 2019 (ex-
dividend date 14 May 2019; record date 15 May 2019).
7. IFRS 16
As from 1 January 2019, Orange Belgium will adopt the IFRS 16 accounting standard. This new standard changes the
accounting treatment of leases. Under IAS17, finance lease agreements are recognized on the balance sheet whereas
operating leases are off-balance sheet. However, IFRS16 makes no distinction between finance and operating leases as
both will be recognized on the balance sheet.
Orange Belgium in line with Orange SA group reporting will update its financial KPI terminology. EBITDAaL (EBITDA
after leases) will replace Adjusted EBITDA. Orange SA held an IFRS 16teach-in session on 6 February 2019. That
presentation is available on Orange SA on investor relations website.
8. Outlook
Orange Belgium expects slight growth in revenues in 2019 taking into account further uptake on its postpaid and
convergent customer base.
For 2019, the Company expects an Adjusted EBITDA (under IAS17) between €285m and €305m. This range takes into
account headwinds such as the decrease in MVNO revenues, the international call impact due to the new regulation and
the payment of the Orange branding fee as from May. As a reminder, the Company expects cable operations to achieve
EBITDA breakeven by year-end. Orange Belgium expects the gap between Adjusted EBITDA and EBITDAaL to be minimal
in 2019.
In addition, total capex is expected to remain stable in comparison to last year.

9. 2019 Financial calendar
23 March Start of quiet period
24 April Financial results Q1 2019 (7:00 am CET) – Press release
24 April Financial results Q1 2019 (10:00 am CET) – Audio conference call
02 May Annual General Meeting of Shareholders
25 June Start of quiet period
24 July Financial results Q2 2019 (7:00 am CET) – Press release
24 July Financial results Q2 2019 (2:00 pm CET) – Audio conference call/webcast
24 September Start of quiet period
23 October Financial results Q3 2019 (7:00 am CET) – Press release
23 October Financial results Q3 2019 (10:00 am CET) – Audio conference call
This is a preliminary agenda and is subject to changes
10. Conference call details
Date: 13 February 2019
Time: 14:00 (CET), 13:00 (UK), 08:00 (US/NY)
Conference call: Orange Belgium FY 2018 results
Please aim to access the conference call ten minutes prior to the scheduled start time.
11. Shares
Share trading volumes and closing prices are based on trades made on NYSE Euronext Brussels.
FY 2018 FY 2017 Q4 2018 Q4 2017
Trading of shares
Average closing share price (€) 15.5 20.0 15.7 18.7
Average daily volume 65,702 55,848 70,111 50,130
Average daily value traded (€m) 1.0 1.1 1.1 0.9
Shares and market values
Total number of shares (m) 60.01 60.01 60.01 60.01
Treasury shares (k) 0.0 141.5 0.0 141.5
Closing price (€) 17.2 17.5 17.2 17.5
Market capitalization (€m) 1,034.6 1,050.3 1,034.6 1,050.3

12. Quarterly results
Orange Belgium Group (‘000) Q4
2018
Q3
2018
Q2
2018
Q1
2018
Q4
2017
Convergent KPIs
convergent customer base 189 162 143 128 108
- B2C convergent customer base 167 144 127 114 97
- B2B Convergent customer base 22 19 16 14 11
Mobile KPIs
mobile customers (excl. MVNOs) 4,342 4,232 4,140 4,050 4,038
- contract 3,763 3,643 3,553 3,458 3,438
- M2M 1,184 1,125 1,087 1,019 1,015
- excluding M2M 2,578 2,519 2,466 2,439 2,423
- prepaid 580 589 586 592 600
mobile customers (excl. MVNOs) 4,342 4,232 4,139 4,050 4,038
- B2C convergent 248 214 184 167 141
- mobile only 4,094 4,018 3,956 3,884 3,897
- M2M 1,184 1,125 1,087 1,019 1,015
- excluding M2M 2,330 2,305 2,282 2,272 2,282
- prepaid 580 589 586 592 600
MVNO customers 12 13 27 210 525
Fixed KPIs
broadband customers 199 173 153 139 120
- FTTx and cable customers 189 162 143 128 108
- xDSL 10 11 11 11 12
- LTE for fixed and others 0 0 0 0 0
internet features
TV 184 159 140 126 107

Orange Belgium (‘000) Q4 2018 Q3 2018 Q2 2018 Q1 2018 Q4 2017
Convergent KPIs
convergent customer base 180 155 136 122 103
- B2C convergent customer base 162 140 123 110 94
- B2B Convergent customer base 18 15 13 11 9
quarterly ARPO (per month, in €)
- B2C convergent ARPO 75.5 76.7 73.7 71.9 70.5
Mobile KPIs
mobile customers (excl. MVNOs) 4,149 4,040 3,947 3,857 3,855
- contract 3,582 3,463 3,372 3,275 3,265
- M2M 1,114 1,055 1,017 946 950
- excluding M2M 2,469 2,408 2,355 2,329 2,315
- prepaid 567 577 575 582 589
mobile customers (excl. MVNOs) 4,149 4,040 3,947 3,857 3,855
- B2C convergent 244 210 180 163 137
- mobile only 3,906 3,830 3,767 3,694 3,717
- M2M 1,114 1,055 1,017 946 950
- excluding M2M 2,225 2,197 2,175 2,166 2,178
- of which B2B convergent mobile customers 40 32 27 24 19
- prepaid 567 577 575 582 589
MVNO customers 12 13 25 208 522
quarterly ARPO (€ per month)
mobile only blended ARPO 18.0 18.8 18.4 18.1 18.2
- mobile only contract ARPO 20.8 21.8 21.3 21.1 21.2
- mobile only prepaid ARPO 7.1 7.5 7.4 7.0 7.7
Fixed KPIs
broadband customers 186 161 141 127 109
- FTTx and cable customers 180 155 136 122 103
- xDSL 6 5 5 5 6
- LTE for fixed and others 0 0 0 0 0
internet features
TV 180 155 136 122 103

Orange Luxembourg (‘000) Q4 2018 Q3 2018 Q2 2018 Q1 2018 Q4 2017
Convergent KPIs
convergent customer base 8 7 7 6 5
- B2C convergent customer base 4 4 4 4 4
- B2B Convergent customer base 4 4 3 3 2
Mobile KPIs
mobile customers (excl. MVNOs) 193 192 193 194 183
- contract 180 180 181 183 173
- M2M 71 69 71 73 65
- excluding M2M 110 111 111 110 108
- prepaid 12 12 11 11 11
mobile customers (excl. MVNOs) 193 192 193 194 183
- B2C convergent 4 4 4 4 4
- mobile only 188 188 189 190 180
- M2M 71 69 71 73 65
- excluding M2M 105 107 107 106 104
- prepaid 12 12 11 11 11
MVNO customers 2 2 2 2 2
quarterly ARPO (€ per month)
mobile only blended ARPO 28.1 27.4 27.6 26.2 27.0
- mobile only contract ARPO 30.7 29.6 29.9 28.2 29.1
- mobile only prepaid ARPO 6.5 6.8 6.3 6.2 6.7
Fixed KPIs
broadband customers 13 13 12 12 12
- FTTx and cable customers 8 7 7 6 5
- xDSL 5 5 6 6 6
- LTE for fixed and others 0 0 0 0 0
internet features
TV 4 4 4 4 4
13. Consolidated financial statements
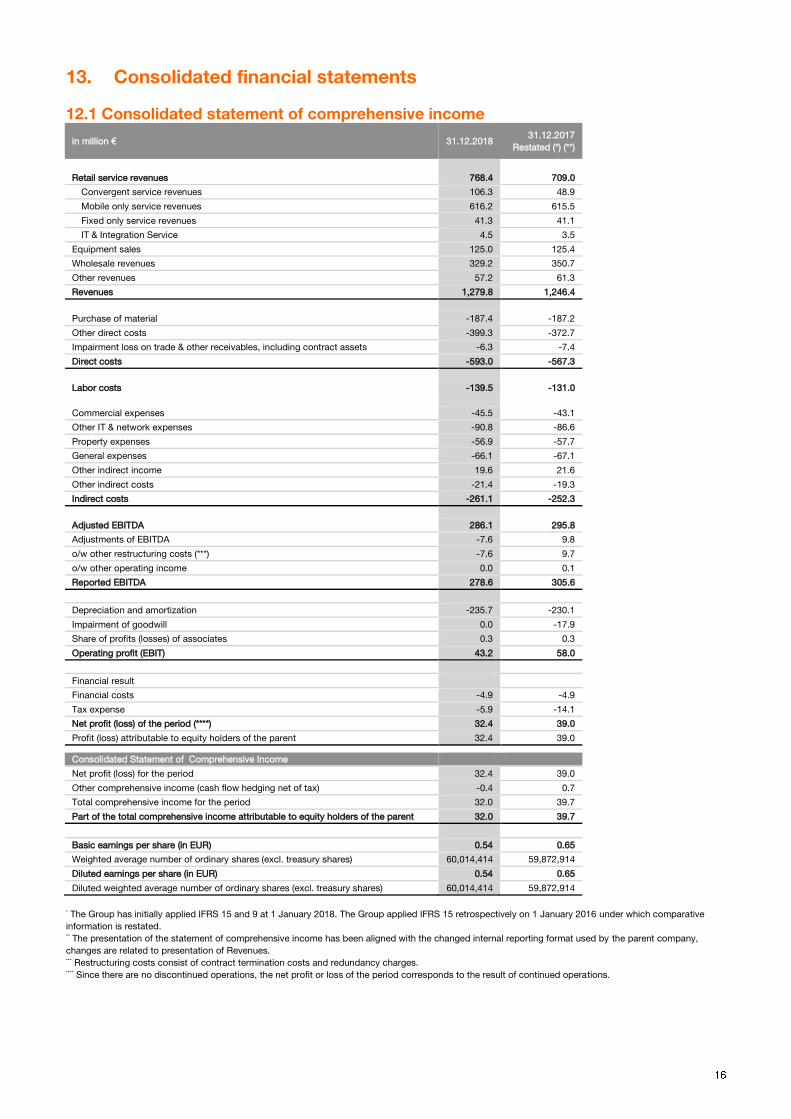
12.1 Consolidated statement of comprehensive income
in million € 31.12.2018 31.12.2017
Restated (*) (**)
Retail service revenues 768.4 709.0
Convergent service revenues 106.3 48.9
Mobile only service revenues 616.2 615.5
Fixed only service revenues 41.3 41.1
IT & Integration Service 4.5 3.5
Equipment sales 125.0 125.4
Wholesale revenues 329.2 350.7
Other revenues 57.2 61.3
Revenues 1,279.8 1,246.4
Purchase of material -187.4 -187.2
Other direct costs -399.3 -372.7
Impairment loss on trade & other receivables, including contract assets -6.3 -7.4
Direct costs -593.0 -567.3
Labor costs -139.5 -131.0
Commercial expenses -45.5 -43.1
Other IT & network expenses -90.8 -86.6
Property expenses -56.9 -57.7
General expenses -66.1 -67.1
Other indirect income 19.6 21.6
Other indirect costs -21.4 -19.3
Indirect costs -261.1 -252.3
Adjusted EBITDA 286.1 295.8
Adjustments of EBITDA -7.6 9.8
o/w other restructuring costs (***) -7.6 9.7
o/w other operating income 0.0 0.1
Reported EBITDA 278.6 305.6
Depreciation and amortization -235.7 -230.1
Impairment of goodwill 0.0 -17.9
Share of profits (losses) of associates 0.3 0.3
Operating profit (EBIT) 43.2 58.0
Financial result
Financial costs -4.9 -4.9
Tax expense -5.9 -14.1
Net profit (loss) of the period (****) 32.4 39.0
Profit (loss) attributable to equity holders of the parent 32.4 39.0
Consolidated Statement of Comprehensive Income
Net profit (loss) for the period 32.4 39.0
Other comprehensive income (cash flow hedging net of tax) -0.4 0.7
Total comprehensive income for the period 32.0 39.7
Part of the total comprehensive income attributable to equity holders of the parent 32.0 39.7
Basic earnings per share (in EUR) 0.54 0.65
Weighted average number of ordinary shares (excl. treasury shares) 60,014,414 59,872,914
Diluted earnings per share (in EUR) 0.54 0.65
Diluted weighted average number of ordinary shares (excl. treasury shares) 60,014,414 59,872,914
* The Group has initially applied IFRS 15 and 9 at 1 January 2018. The Group applied IFRS 15 retrospectively on 1 January 2016 under which comparative
information is restated. ** The presentation of the statement of comprehensive income has been aligned with the changed internal reporting format used by the parent company,
changes are related to presentation of Revenues. *** Restructuring costs consist of contract termination costs and redundancy charges. **** Since there are no discontinued operations, the net profit or loss of the period corresponds to the result of continued operations.

12.2 Consolidated statement of financial position in million € 31.12.2018
31.12.2017
Restated (*)
ASSETS
Goodwill 67.0 66.4
Other intangible assets 285.3 304.0
Property, plant and equipment 772.3 809.9
Interests in associates and joint ventures 4.4 4.0
Non-current financial assets 2.5 1.5
Other non-current assets 1.4 0.7
Deferred tax assets 3.3 3.5
Total non-current assets 1,136.2 1,190.0
Inventories 27.7 24.9
Trade receivables 194.3 184.8
Current financial assets 0.4 0.5
Current derivatives assets 0.2 0.1
Other current assets 2.7 2.7
Operating taxes and levies receivables 1.9 1.4
Current tax assets 0.1 0.0
Prepaid expenses 11.4 11.0
Other Assets related to contracts with customers 61.8 69.8
Cash and cash equivalents 26.6 13.0
Total current assets 326.9 308.1
Total assets 1,463.1 1,498.1
EQUITY AND LIABILITIES
Share capital 131.7 131.7
Legal reserve 13.2 13.2
Retained earnings (excl. legal reserve) 442.2 440.2
Treasury shares 0.0 -2.5
Equity attributable to the owners of the parent 587.1 582.6
Total equity 587.1 582.6
Non-current financial liabilities 269.9 319.6
Non-current derivatives liabilities 2.8 3.0
Non-current employee benefits 0.1 0.3
Non-current provisions for dismantling 63.2 65.9
Other non-current liabilities 1.9 2.8
Deferred tax liabilities 8.1 10.8
Total non-current liabilities 346.0 402.3
Current financial liabilities 20.8 6.1
Current derivatives liabilities 0.2 0.1
Current fixed assets payable 53.3 56.2
Trade payables 266.6 224.3
Current employee benefits 30.8 30.0
Current provisions for dismantling 1.2 1.0
Current restructuring provisions 3.0 1.8
Other current liabilities 3.5 12.7
Operating taxes and levies payables 85.6 94.2
Current tax payables 3.1 23.3
Liabilities related to contracts with customers 59.4 61.3
Deferred income 2.3 2.2
Total current liabilities 530.0 513.1
Total equity and liabilities 1,463.1 1,498.1
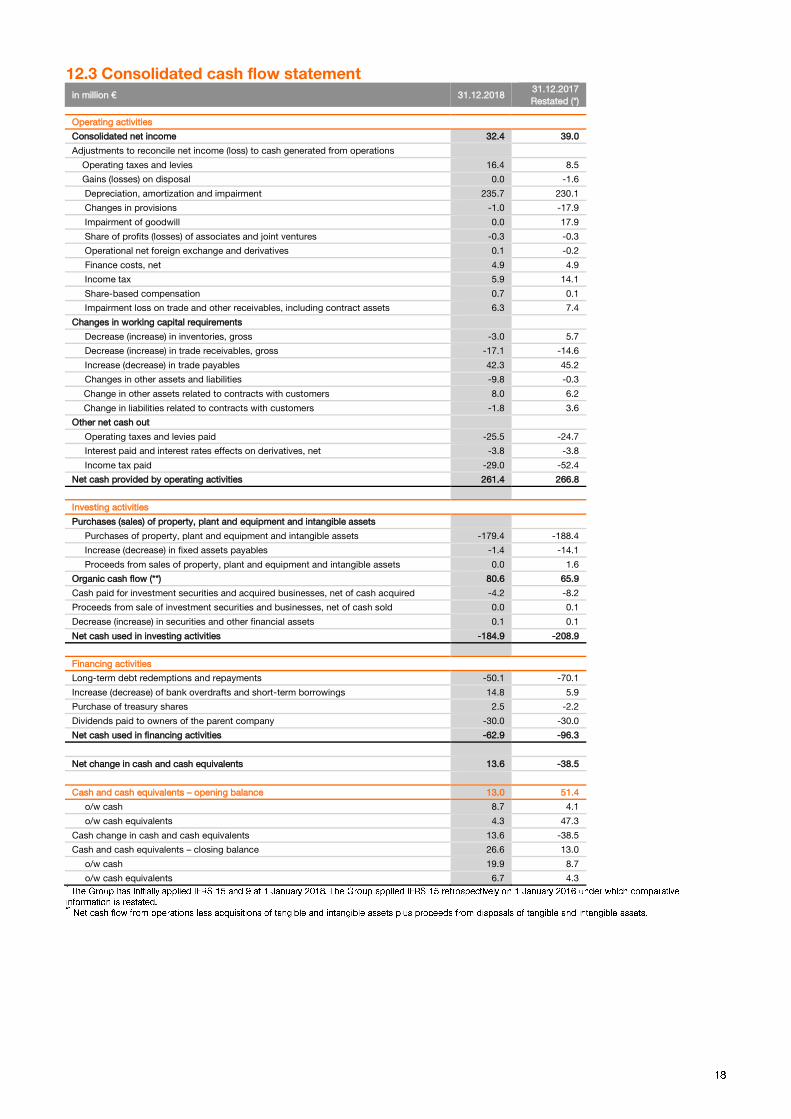
12.3 Consolidated cash flow statement in million € 31.12.2018
31.12.2017
Restated (*)
Operating activities
Consolidated net income 32.4 39.0
Adjustments to reconcile net income (loss) to cash generated from operations
Operating taxes and levies 16.4 8.5
Gains (losses) on disposal 0.0 -1.6
Depreciation, amortization and impairment 235.7 230.1
Changes in provisions -1.0 -17.9
Impairment of goodwill 0.0 17.9
Share of profits (losses) of associates and joint ventures -0.3 -0.3
Operational net foreign exchange and derivatives 0.1 -0.2
Finance costs, net 4.9 4.9
Income tax 5.9 14.1
Share-based compensation 0.7 0.1
Impairment loss on trade and other receivables, including contract assets 6.3 7.4
Changes in working capital requirements
Decrease (increase) in inventories, gross -3.0 5.7
Decrease (increase) in trade receivables, gross -17.1 -14.6
Increase (decrease) in trade payables 42.3 45.2
Changes in other assets and liabilities -9.8 -0.3
Change in other assets related to contracts with customers 8.0 6.2
Change in liabilities related to contracts with customers -1.8 3.6
Other net cash out
Operating taxes and levies paid -25.5 -24.7
Interest paid and interest rates effects on derivatives, net -3.8 -3.8
Income tax paid -29.0 -52.4
Net cash provided by operating activities 261.4 266.8
Investing activities
Purchases (sales) of property, plant and equipment and intangible assets
Purchases of property, plant and equipment and intangible assets -179.4 -188.4
Increase (decrease) in fixed assets payables -1.4 -14.1
Proceeds from sales of property, plant and equipment and intangible assets 0.0 1.6
Organic cash flow (**) 80.6 65.9
Cash paid for investment securities and acquired businesses, net of cash acquired -4.2 -8.2
Proceeds from sale of investment securities and businesses, net of cash sold 0.0 0.1
Decrease (increase) in securities and other financial assets 0.1 0.1
Net cash used in investing activities -184.9 -208.9
Financing activities
Long-term debt redemptions and repayments -50.1 -70.1
Increase (decrease) of bank overdrafts and short-term borrowings 14.8 5.9
Purchase of treasury shares 2.5 -2.2
Dividends paid to owners of the parent company -30.0 -30.0
Net cash used in financing activities -62.9 -96.3
Net change in cash and cash equivalents 13.6 -38.5
Cash and cash equivalents – opening balance 13.0 51.4
o/w cash 8.7 4.1
o/w cash equivalents 4.3 47.3
Cash change in cash and cash equivalents 13.6 -38.5
Cash and cash equivalents – closing balance 26.6 13.0
o/w cash 19.9 8.7
o/w cash equivalents 6.7 4.3
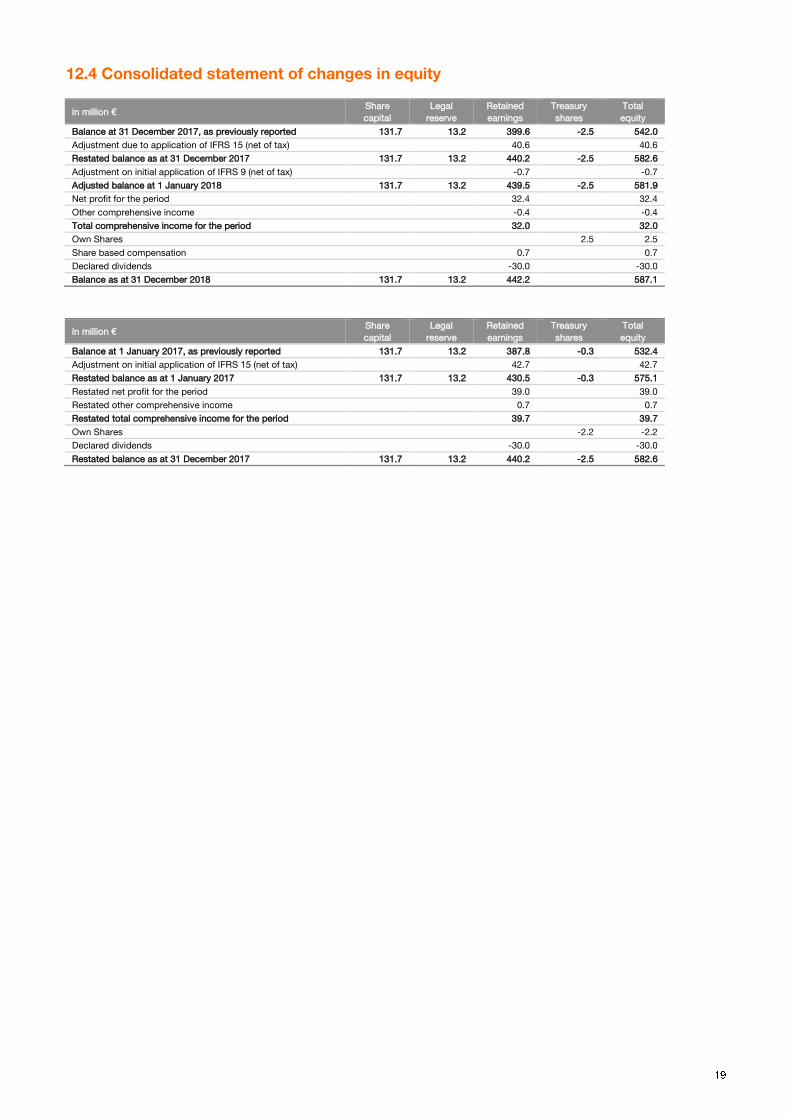
12.4 Consolidated statement of changes in equity
in million € Share
capital
Legal
reserve
Retained
earnings
Treasury
shares
Total
equity
Balance at 31 December 2017, as previously reported 131.7 13.2 399.6 -2.5 542.0
Adjustment due to application of IFRS 15 (net of tax) 40.6 40.6
Restated balance as at 31 December 2017 131.7 13.2 440.2 -2.5 582.6
Adjustment on initial application of IFRS 9 (net of tax) -0.7 -0.7
Adjusted balance at 1 January 2018 131.7 13.2 439.5 -2.5 581.9
Net profit for the period 32.4 32.4
Other comprehensive income -0.4 -0.4
Total comprehensive income for the period 32.0 32.0
Own Shares 2.5 2.5
Share based compensation 0.7 0.7
Declared dividends -30.0 -30.0
Balance as at 31 December 2018 131.7 13.2 442.2 587.1
in million € Share
capital
Legal
reserve
Retained
earnings
Treasury
shares
Total
equity
Balance at 1 January 2017, as previously reported 131.7 13.2 387.8 -0.3 532.4
Adjustment on initial application of IFRS 15 (net of tax) 42.7 42.7
Restated balance as at 1 January 2017 131.7 13.2 430.5 -0.3 575.1
Restated net profit for the period 39.0 39.0
Restated other comprehensive income 0.7 0.7
Restated total comprehensive income for the period 39.7 39.7
Own Shares -2.2 -2.2
Declared dividends -30.0 -30.0
Restated balance as at 31 December 2017 131.7 13.2 440.2 -2.5 582.6

12.5 Segment information
31.12.2018 (in million €) Orange
Belgium
Orange
Luxembourg
Interco
elimination
Orange
Belgium
Group
Retail service revenues 727.6 40.7 0.0 768.4
Convergent service revenues 106.3 0.0 0.0 106.3
Mobile only service revenues 583.3 33.0 0.0 616.2
Fixed only service revenues 33.6 7.8 0.0 41.3
IT & Integration service revenues 4.5 0.0 0.0 4.5
Equipment sales 110.4 14.6 0.0 125.0
Wholesale revenues 322.6 10.7 -4.1 329.2
Other revenues 65.7 0.9 -9.4 57.2
Revenues
1,226.4 66.9 -13.5 1,279.8
Direct costs -570.2 -36.3 13.5 -593.0
Labor costs -129.8 -9.8 0.0 -139.5
Indirect costs -246.5 -14.6 0.0 -261.1
Adjusted EBITDA 279.9 6.2 0.0 286.1
Reported EBITDA 272.4 6.1 0.0 278.6
31.12.2017 (in million €)
Orange
Belgium
Orange
Luxembourg
Interco
elimination
Orange
Belgium
Group
Retail service revenues 671.5 37.4 0.0 709.0
Convergent service revenues 48.9 0.0 0.0 48.9
Mobile only service revenues 583.9 31.7 0.0 615.5
Fixed only service revenues 35.3 5.8 0.0 41.1
IT & Integration service revenues 3.5 0.0 0.0 3.5
Equipment sales 108.8 16.6 0.0 125.4
Wholesale revenues 344.1 9.9 -3.3 350.7
Other revenues 67.2 2.4 -8.2 61.3
Revenues
1,191.6 66.2 -11.5 1,246.4
Direct costs -541.9 -37.0 11.5 -567.3
Labor costs -121.3 -9.6 0.0 -131.0
Indirect costs -241.2 -11.1 0.0 -252.3
Adjusted EBITDA 287.2 8.5 0.0 295.8
Reported EBITDA 297.1 8.5 0.0 305.6

14. Statutory auditor’s procedures
The statutory auditor, KPMG Bedrijfsrevisoren - Réviseurs d’Entreprises, represented by Jos Briers has confirmed that the
audit procedures, which have been substantially completed, have not revealed any material misstatement in the accounting
information included in the Company’s annual announcement.

15. Glossary
Financial KPIs
revenues
revenues in line with the offer
Provide Group revenues split in convergent services, mobile only services, fixed only services, IT &
integration services, wholesale, equipment sales and other revenues.
retail service revenues
Revenue aggregation of revenues from convergent services, mobile only services, fixed only
services, IT & integration services.
convergent services
Revenues from B2C convergent offers (excluding equipment sales). A convergent offer is defined
as an offer combining at least a broadband access (xDSL, FTTx, cable or Fixed-4G (fLTE) with cell-
lock) and a mobile voice contract (excluding MVNOs). Convergent services revenues do not
include incoming and visitor roaming revenues.
mobile only services
Revenues from mobile offers (excluding B2C convergent offers and equipment sales) and M2M
connectivity, excluding incoming and visitors roaming revenues.
fixed only services
Revenues from fixed offers (excluding B2C convergent offers and equipment sales) including (i)
fixed broadband, (ii) fixed narrowband, and (iii) data infrastructure, managed networks, and
incoming phone calls to customer relations call centers.
IT & integration services
Revenues from collaborative services (consulting, integration, messaging, project management),
application services (customer relationship management and infrastructure applications), hosting,
cloud computing services, security services, video-conferencing and M2M services. It also
includes equipment sales associated with the supply of these services.
wholesale
Revenues with third-party telecom operators for (i) mobile: incoming, visitor roaming, domestic
mobile interconnection (i.e. network sharing and domestic roaming agreement) and MVNO, and for
(ii) fixed carriers services.
equipment sales
Revenues from all mobile and fixed equipment sales, excluding (i) equipment sales associated
with the supply of IT & Integration services, and (ii) equipment sales to dealers and brokers.
other revenues
Include (i) equipment sales to brokers and dealers, (ii) portal, on-line advertising revenues, (iii)
corporate transversal business line activities, and (iv) other miscellaneous revenues.
P&L elements
reported EBITDA / adjusted EBITDA
Reported EBITDA corresponds to the operating income before depreciation and amortization,
before effects resulting from business combinations, before reclassification of cumulative
translation adjustment from liquidated entities, before impairment of goodwill and fixed assets, and
before share of profits (losses) of associates.
Adjusted EBITDA (previously Restated EBITDA) corresponds to the reported EBITDA adjusted for
the effects of significant litigation, specific labor expenses, review of the investments and business
portfolio, restructuring costs and, where appropriate, other specific items.
cash flow elements
operating cash flow
Adjusted EBITDA minus CAPEX.
CAPEX
Capital expenditures on tangible and intangible assets excluding telecommunication licenses and
excluding investments through financial leases.
licences & spectrum
Cash out related to acquisitions of licences and spectrum.
change in WCR
Change in net inventories, plus change in gross trade receivables, plus change in trade
payables, plus change in other elements of WCR.
other operational items
Mainly offset of non-cash items included in adjusted EBITDA, items not included in adjusted
EBITDA but included in net cash provided by operating activities, and change in fixed asset
payables.
net debt variation Variation of net debt level.
net financial debt
net financial debt
Net financial debt as defined and used by Orange does not include Orange Bank activities, for
which this concept is not relevant. It consists of (a) financial liabilities excluding operating payables
(translated at the year-end closing rate) including derivative instruments (assets and liabilities), less
(b) cash collateral paid, cash, cash equivalents and financial assets at fair value. Financial
instruments designated as cash flow hedges and net investment hedges included in net financial
debt are set up to hedge, among other, items that are not (future cash flows, net investment in
foreign currencies). Effects on the hedge of these items are carried in equity. As a consequence,
the “equity components related to unmatured hedging instruments” are added to gross financial
debt to offset this temporary difference.

Operational KPIs
convergent
B2Cconvergent customer base
Number of B2C customers holding an offer combining at least a broadband access (xDSL, FTTx,
cable or Fixed-4G (fLTE) with cell-lock) and a mobile voice contract (excluding MVNOs).
B2C convergent ARPO
Average quarterly Revenues Per Offer (ARPO) of convergent services are calculated by dividing (a)
the revenues from convergent offers billed to the B2C customers (excluding equipment sales) over
the past three months, by (b) the weighted average number of convergent offers over the same
period. The weighted average number of convergent offers is the average of the monthly averages
during the period in question. The monthly average is the arithmetic mean of the number of
convergent offers at the start and end of the month. Convergent ARPO is expressed as monthly
revenues per convergent offer.
mobile
mobile customer base (excl. MVNOs)
Number of customers with active simcard, including (i) M2M and (ii) business and internet
everywhere (excluding MVNOs). Since 1Q 2018, customers of entities accounted for using the
equity method are no longer counted in customer bases. Data for 2016 and 2017 have been
restated accordingly.
contract
Customer with whom Orange has a formal contractual agreement with the customer billed on a
monthly basis for access fees and any additional voice or data use.
prepaid
Customer with whom Orange has written contract with the customer paying in advance any data
or voice use by purchasing vouchers in retail outlets for example.
M2M (machine-to-machine)
Exchange of information between machines that is established between the central control system
(server) and any type of equipment, through one or several communication networks.
mobile B2C convergent customers
Number of mobile lines of B2C convergent customers.
mobile only customers
Number of mobile customers (see definition of this term) excluding mobile convergent customers
(see definition of this term).
MVNO customers
Hosted MVNO customers on Orange networks.
mobile only ARPO (quarterly)
Average quarterly Revenues Per Offer (ARPO) of mobile only services are calculated by dividing (a)
the revenues of mobile only services billed to the customers, generated over the past three
months, by (b) the weighted average number of mobile only customers (excluding M2M customers)
over the same period. The weighted average number of customers is the average of the monthly
averages during the period in question. The monthly average is the arithmetic mean of the number
of customers at the start and end of the month. Mobile only ARPO is expressed as monthly
revenues per customer.
Fixed
number of lines (copper + FTTH)
Number of fixed lines operated by Orange. Since 1Q 2018, customers of entities accounted for
under the equity method are no longer counted in customer bases. Data for 2016 and 2017 have
been restated accordingly.
B2C broadband convergent customers Number of B2C customers holding an offer combining at least a broadband access (xDSL, FTTx,
cable or Fixed-4G (fLTE) with cell-lock) and a mobile voice contract (excluding MVNOs).
fixed broadband only customers Number of fixed broadband customers excluding broadband convergent customers (see definition
of this term).
fixed only broadband ARPO (quarterly)
Average quarterly Revenues Per Offer (ARPO) of fixed only broadband services (xDSL, FTTH, Fixed-
4G (fLTE), satellite and Wimax) are calculated by dividing (a) the revenues from consumer fixed only
broadband services over the past three months, by (b) the weighted average number of accesses
over the same period. The weighted average number of accesses is the average of the monthly
averages during the period in question. The monthly average is the arithmetic mean of the number
of accesses at the start and end of the month. ARPO is expressed as monthly revenues per access.
Consolidation perimeter
The consolidation perimeter has not changed since 31 December 2017 and includes Orange Belgium S.A. (100 %), Orange Communications Luxembourg S.A.
(100 %), Smart Services Network S.A. (100 %), IRISnet S.C.R.L. (accounted for by equity method - 28.16 %), Walcom S.A. (100 %), Walcom Business
solutions S.A. (100 %), Walcom Liège S.A. (100 %), A3COM S.A. (100 %) and A&S Partners S.A. (100 %).
Rounding
Due to rounding, numbers presented may not add up precisely to the totals provided and percentages may not precisely reflect the absolute figures.

About Orange Belgium
Orange Belgium is one of the leading telecommunication operators in the Belgian market, with over 3m customers, and in Luxembourg
through its subsidiary Orange Luxembourg.
As a convergent actor, we provide mobile telecommunication services, internet and TV to private clients, as well as innovative mobile and
fixed line services to businesses. Our high-performance mobile network supports 2G, 3G, 4G and 4G+ technology and is the subject of
ongoing investments.
Orange Belgium is a subsidiary of the Orange Group, one of the leading European and African operators of mobile telephony and internet
access, as well as one of the world leaders for telecommunication services to enterprises.
Orange Belgium is listed on the Brussels Stock Exchange (OBEL).
More information on: corporate.orange.be, www.orange.be or follow us on Twitter: @pressOrangeBe.
Investors contact
Ana Castaño Lopez +32 468 46 95 31
Eric Chang +32 495 55 98 17
Press contact
Annelore Marynissen – [email protected] +32 479 01 60 58
Isabelle Vanden Eede (FR) – [email protected] +32 474 77 77 28