Oracle Hospitality Reporting and Analytics Advanced Running Reports Oracle Hospitality Reporting and...
124
Oracle ® Hospitality Reporting and Analytics Advanced User Guide Release 8.5.0 E65823-01 September 2015
Transcript of Oracle Hospitality Reporting and Analytics Advanced Running Reports Oracle Hospitality Reporting and...

Oracle® Hospitality Reporting and AnalyticsAdvancedUser Guide
Release 8.5.0
E65823-01
September 2015

Oracle Hospitality Reporting and Analytics Advanced User Guide, Release 8.5.0
E65823-01
Copyright © 2000, 2015, Oracle and/or its affiliates. All rights reserved.
This software and related documentation are provided under a license agreement containing restrictions onuse and disclosure and are protected by intellectual property laws. Except as expressly permitted in yourlicense agreement or allowed by law, you may not use, copy, reproduce, translate, broadcast, modify, license,transmit, distribute, exhibit, perform, publish, or display any part, in any form, or by any means. Reverseengineering, disassembly, or decompilation of this software, unless required by law for interoperability, isprohibited.
The information contained herein is subject to change without notice and is not warranted to be error-free. Ifyou find any errors, please report them to us in writing.
If this software or related documentation is delivered to the U.S. Government or anyone licensing it on behalfof the U.S. Government, then the following notice is applicable:
U.S. GOVERNMENT END USERS: Oracle programs, including any operating system, integrated software,any programs installed on the hardware, and/or documentation, delivered to U.S. Government end users are"commercial computer software" pursuant to the applicable Federal Acquisition Regulation and agency-specific supplemental regulations. As such, use, duplication, disclosure, modification, and adaptation of theprograms, including any operating system, integrated software, any programs installed on the hardware,and/or documentation, shall be subject to license terms and license restrictions applicable to the programs.No other rights are granted to the U.S. Government.
This software or hardware is developed for general use in a variety of information management applications.It is not developed or intended for use in any inherently dangerous applications, including applications thatmay create a risk of personal injury. If you use this software or hardware in dangerous applications, then youshall be responsible to take all appropriate fail-safe, backup, redundancy, and other measures to ensure itssafe use. Oracle Corporation and its affiliates disclaim any liability for any damages caused by use of thissoftware or hardware in dangerous applications.
Oracle and Java are registered trademarks of Oracle and/or its affiliates. Other names may be trademarks oftheir respective owners.
Intel and Intel Xeon are trademarks or registered trademarks of Intel Corporation. All SPARC trademarks areused under license and are trademarks or registered trademarks of SPARC International, Inc. AMD, Opteron,the AMD logo, and the AMD Opteron logo are trademarks or registered trademarks of Advanced MicroDevices. UNIX is a registered trademark of The Open Group.
This software or hardware and documentation may provide access to or information about content, products,and services from third parties. Oracle Corporation and its affiliates are not responsible for and expresslydisclaim all warranties of any kind with respect to third-party content, products, and services unlessotherwise set forth in an applicable agreement between you and Oracle. Oracle Corporation and its affiliateswill not be responsible for any loss, costs, or damages incurred due to your access to or use of third-partycontent, products, or services, except as set forth in an applicable agreement between you and Oracle.

Contents
1 Getting Started
Report Types.............................................................................................................................................. 1-1
2 Running Reports
Running Standard Reports...................................................................................................................... 2-1
Modifying Standard Reports .................................................................................................................. 2-2
Exporting Reports..................................................................................................................................... 2-3
3 Reporting on Summary Information
Daily Operations Report.......................................................................................................................... 3-1
Day Part Sales Summary Report ............................................................................................................ 3-4
Day Part Operations Summary Report.................................................................................................. 3-4
Today’s Operations Report ..................................................................................................................... 3-7
Revenue Center Details Report............................................................................................................. 3-10
4 Reporting on Daily Detail Information
Adjustment Details Report ...................................................................................................................... 4-2
Cash Management Report ....................................................................................................................... 4-3
CC Batch Activity Report ........................................................................................................................ 4-4
CC Batch Report........................................................................................................................................ 4-4
CC Batch Details Report .......................................................................................................................... 4-5
Control Report........................................................................................................................................... 4-5
Cost of Goods Sold Summary Report.................................................................................................... 4-7
Cost of Goods Sold by Item Group ........................................................................................................ 4-7
Daily Discounts Report ............................................................................................................................ 4-8
Job Code Summary Report...................................................................................................................... 4-9
Job Code Employee Detail Report........................................................................................................ 4-10
Labor Analysis Summary Report ......................................................................................................... 4-10
Labor by Day Part and Hour Report ................................................................................................... 4-11
Labor by Quarter Hour Report ............................................................................................................. 4-13
No Sale Report......................................................................................................................................... 4-13
Sales Mix Summary Report ................................................................................................................... 4-14
iii
Service Charges Report .......................................................................................................................... 4-15
Service Performance Summary Report................................................................................................ 4-15
Taxes Report ............................................................................................................................................ 4-16
Tender Media Report ............................................................................................................................. 4-17
Weather Analysis Report....................................................................................................................... 4-18
Weather by Location Report ................................................................................................................. 4-18
5 Reporting on Current Business Day Information
Today’s Service Performance Report..................................................................................................... 5-1
Today’s Tenders Report........................................................................................................................... 5-2
Today’s Tenders Drilldown Reports...................................................................................................... 5-3
6 Reporting on Key Performance Indicators
Store and Date Comparison Report ....................................................................................................... 6-1
Store Comparison Report ........................................................................................................................ 6-2
Daily Operations Comparison by Location Report ............................................................................. 6-2
Daily Operations Comparison by Dates Report................................................................................... 6-4
Daily Operations Comparison by Revenue Center Report ................................................................ 6-5
Sales Comparison by Location Report................................................................................................... 6-7
Today’s Store Comparison Report VAT................................................................................................ 6-7
7 Reporting on Employee Information
Item Sales Detail by Employee Report .................................................................................................. 7-1
Item Sales Summary by Employee......................................................................................................... 7-2
Employee Control Report........................................................................................................................ 7-2
Employee Sales Performance Report ..................................................................................................... 7-3
Employees Report..................................................................................................................................... 7-4
HR Employee Detail Report.................................................................................................................... 7-4
Employee Earnings Detail Report .......................................................................................................... 7-6
Employee Sales Summary Report .......................................................................................................... 7-7
Employee Time Card Detail Report....................................................................................................... 7-8
Manager Control Report.......................................................................................................................... 7-8
Staff Scheduling Performance................................................................................................................. 7-9
Time Card Summary Report ................................................................................................................... 7-9
Employee Time Card Detail Report..................................................................................................... 7-10
Employee Exceptions Report ................................................................................................................ 7-11
Employee Productivity Report ............................................................................................................. 7-12
8 Reporting on Kitchen Display System Performance
KDS Summary Report.............................................................................................................................. 8-1
KDS Orders by Prep Time Report .......................................................................................................... 8-1
KDS Orders by Station Report ................................................................................................................ 8-2
Speed of Service Report ........................................................................................................................... 8-2
iv
Today’s KDS Summary Report............................................................................................................... 8-3
9 Reporting on Menus
Combo Items Summary Report .............................................................................................................. 9-1
Menu Engineering by Major and Family Group Report..................................................................... 9-2
Major Group Menu Engineering Report ............................................................................................... 9-3
Family Group Menu Engineering Report ............................................................................................. 9-3
Item Groups Average Pricing Report .................................................................................................... 9-4
Pricing Detail by Major Group Report .................................................................................................. 9-4
Pricing Detail by Family Group Report................................................................................................. 9-5
Menu Item Average Pricing Report ....................................................................................................... 9-5
Menu Item Affinity Sales Report............................................................................................................ 9-6
10 Reporting on Menu Item Alignment
Definitions Alignment Report .............................................................................................................. 10-1
Major and Family Group Alignment Report ...................................................................................... 10-2
Menu Item Alignment Major Group Masters Report........................................................................ 10-3
Menu Item Alignment Family Group Masters Report...................................................................... 10-3
Menu Item Alignment Report............................................................................................................... 10-3
Unaligned Definitions Report............................................................................................................... 10-4
Unaligned Item Groups Report ............................................................................................................ 10-4
Unaligned Menu Items Report ............................................................................................................. 10-5
11 Reporting on System Administration
Daily Checklist Report ........................................................................................................................... 11-2
Revenue Center Sales Comparison: Transactions vs. Daily Report ................................................ 11-4
Employee Sales Comparison: Transaction vs. Daily Report ............................................................ 11-4
Menu Item Sales Comparison: Transaction vs. Daily Report........................................................... 11-5
Daily Exceptions List Report................................................................................................................. 11-6
EMS Batch Status Report ....................................................................................................................... 11-6
Posting Exceptions Report..................................................................................................................... 11-6
Labor Runtime Error Log Report ......................................................................................................... 11-7
Last Posting Report ................................................................................................................................ 11-7
Portal Log-on Report .............................................................................................................................. 11-8
Portal Log-on Report Detail Report ..................................................................................................... 11-8
Portal Server Runtime Errors Report................................................................................................... 11-8
Posting Server Runtime Errors Report ................................................................................................ 11-9
Posting Report ......................................................................................................................................... 11-9
Posting Date Detail Report .................................................................................................................. 11-10
Business Date Posting Detail Report.................................................................................................. 11-10
VAT Comparison Report..................................................................................................................... 11-11
VAT Report Menu Item Report .......................................................................................................... 11-12
VAT Report MenuItem FixedPeriods Report ................................................................................... 11-12
v

VAT Report Tax Report ....................................................................................................................... 11-12
12 Reporting on Import and Export
Import Export Log Report ..................................................................................................................... 12-1
13 Reporting on Cash Management
Safes Report ............................................................................................................................................. 13-1
Till Report ................................................................................................................................................ 13-2
Bank Deposit Report .............................................................................................................................. 13-3
Count Adjustments Report ................................................................................................................... 13-4
Starting Amount Adjustments Report................................................................................................. 13-4
Over/Short Report ................................................................................................................................. 13-5
Paid-In/Paid-Out Report....................................................................................................................... 13-6
Server Bank Report ................................................................................................................................. 13-7
Bank Deposit Adjustments Report....................................................................................................... 13-8
Petty Cash Report ................................................................................................................................... 13-8
Cash Management Activity Report...................................................................................................... 13-9
14 Building Custom Reports in Microsoft Excel
Installing iQuery ..................................................................................................................................... 14-1
Building a Query..................................................................................................................................... 14-1
15 Building Interactive Reports
Creating Interactive Reports ................................................................................................................. 15-1
Modifying and Deleting Interactive Reports ...................................................................................... 15-2
Publishing Interactive Reports.............................................................................................................. 15-2
16 Retrieving Guest Check Information
Retrieving Information with Check Query ......................................................................................... 16-1
Retrieving Transaction Information with Audit & Analysis............................................................ 16-2
Exporting Audit & Analysis Queries................................................................................................... 16-4
17 Scheduling Reports for Email Distribution
Creating Report Emails .......................................................................................................................... 17-1
vi
1Getting Started
Oracle Hospitality Reporting and Analytics Advanced is a web-based solution thatconsolidates food and beverage information in the cloud. Oracle Hospitality Reportingand Analytics Advanced centralizes point-of-sale (POS) data to provide operationaland analytical insights into the business, improving efficiency by deliveringinformation to all roles within the business.
Report Types
Report TypesOracle Hospitality Reporting and Analytics Advanced provides standard reports. Astandard report is pre-configured to retrieve data on a specific aspect of businessoperations.
You can use iQuery and Interactive Reports to build custom reports. iQuery is aMicrosoft Excel add-in that enables you to build queries in Microsoft Excel and workwith the results in a spreadsheet. Interactive Reports is a tool that enables you to buildcustom reports and view them in real time. Use custom reports to track data on sales,profit, operating expenses, and other performance measurements. Compare thecustom report data with data in other reports such as standard reports to makebusiness decisions for your organization.
Getting Started 1-1

Report Types
1-2 User Guide

2Running Reports
Oracle Hospitality Reporting and Analytics Advanced enables you to run standardreports or modify and then run standard reports. When you modify a standard report,you apply filters by defining date ranges, locations, revenue centers, and order types.After you run a report, you can export it to an Adobe PDF, Microsoft Excel, or comma-separated file.
Running Standard Reports
Modifying Standard Reports
Exporting Reports
Running Standard Reports
1. In the side menu on the Reporting and Analytics home page, click Reports andthen click More Reports.
2. In the Reports list, click the report name and then click the specific report.
3. Click Run Report.
Related Topics:
Reporting on Summary Information
Related Topics:
Reporting on Daily Detail Information
Related Topics:
Reporting on Current Business Day Information
Related Topics:
Reporting on Key Performance Indicators
Related Topics:
Reporting on Employee Information
Running Reports 2-1

Modifying Standard Reports
1. In the side menu on the Reporting and Analytics home page, click Reports andthen click More Reports.
2. In the Reports list, click the report name and then click the specific report.
3. On the Modify Report tab, modify the report as described in the following table:
Setting Description
Business Dates Select the date or date range for the report.
To select dates from the calendar view,select Please Select from the drop-downlist. Select dates as follows:• Click a single day.• Click the month name to select all the
days in the month.• Click the day column header to select all
those days in the month.• Click the numbered week to select all
the days in that week.• Press and hold the Ctrl key to select
multiple days.
Locations Select the locations for which the reportreturns data.
Revenue Centers Select the revenue centers for which thereport returns data.
Order Types Select the order types for which the reportreturns data.
4. On the Preferences tab, specify how Reporting and Analytics saves reports asdescribed in the following table:
Option Description
Save When you select the report from theReporting and Analytics home page sidemenu, the report runs with the settings youselected in step 3.
Restore defaults Removes previously saved report settings.
Save as Saves the report with the settings youselected in step 3 as a custom report in theOther Reports portlet.
5. On the Favorite tab, specify favorite settings as described in the following table:
Modifying Standard Reports
2-2 User Guide
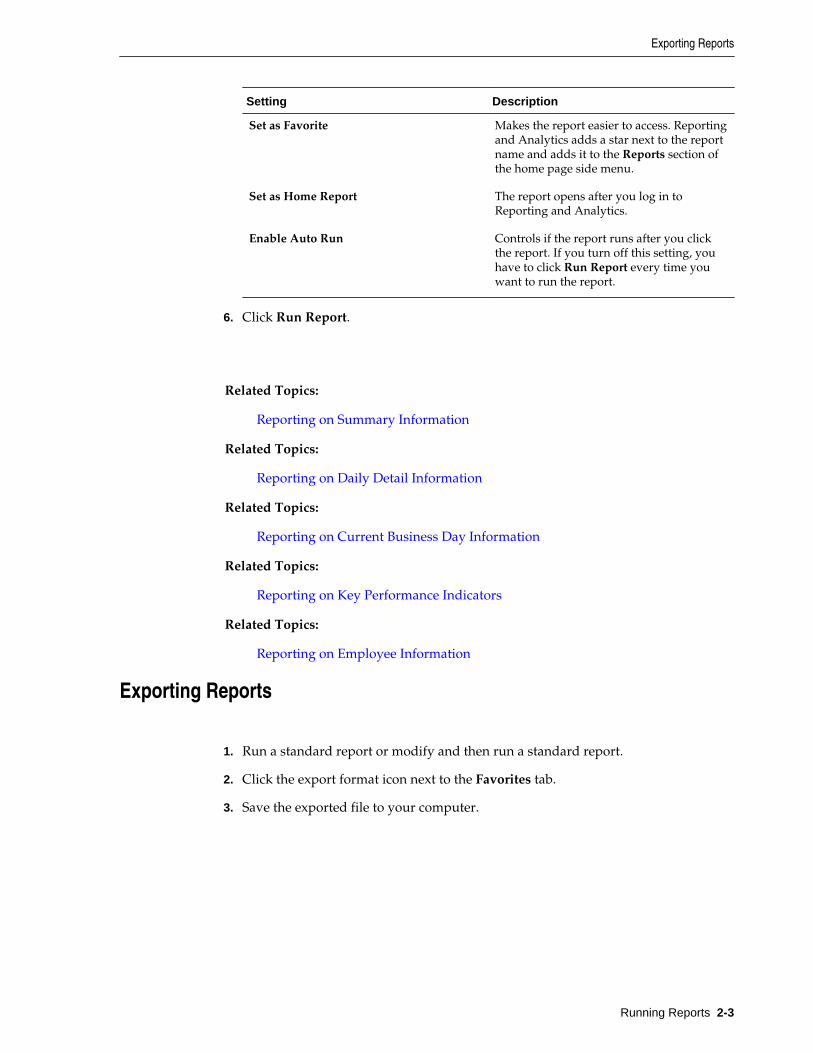
Setting Description
Set as Favorite Makes the report easier to access. Reportingand Analytics adds a star next to the reportname and adds it to the Reports section ofthe home page side menu.
Set as Home Report The report opens after you log in toReporting and Analytics.
Enable Auto Run Controls if the report runs after you clickthe report. If you turn off this setting, youhave to click Run Report every time youwant to run the report.
6. Click Run Report.
Related Topics:
Reporting on Summary Information
Related Topics:
Reporting on Daily Detail Information
Related Topics:
Reporting on Current Business Day Information
Related Topics:
Reporting on Key Performance Indicators
Related Topics:
Reporting on Employee Information
Exporting Reports
1. Run a standard report or modify and then run a standard report.
2. Click the export format icon next to the Favorites tab.
3. Save the exported file to your computer.
Exporting Reports
Running Reports 2-3
Exporting Reports
2-4 User Guide
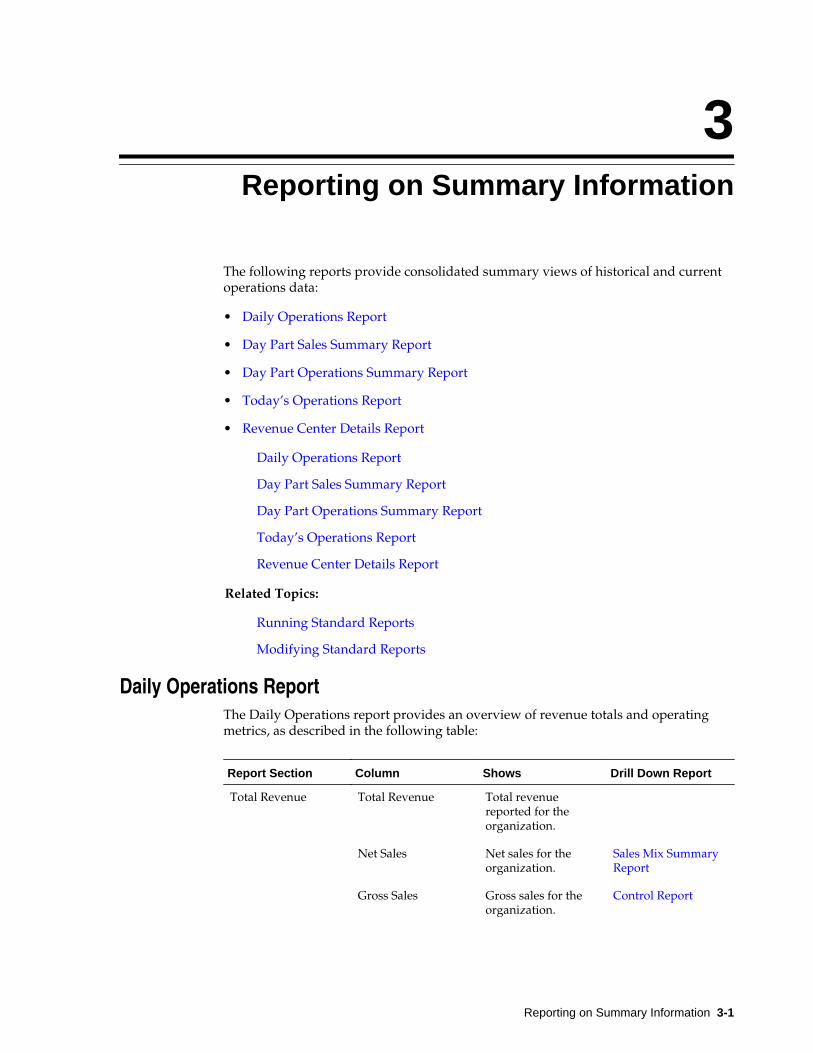
3Reporting on Summary Information
The following reports provide consolidated summary views of historical and currentoperations data:
• Daily Operations Report
• Day Part Sales Summary Report
• Day Part Operations Summary Report
• Today’s Operations Report
• Revenue Center Details Report
Daily Operations Report
Day Part Sales Summary Report
Day Part Operations Summary Report
Today’s Operations Report
Revenue Center Details Report
Related Topics:
Running Standard Reports
Modifying Standard Reports
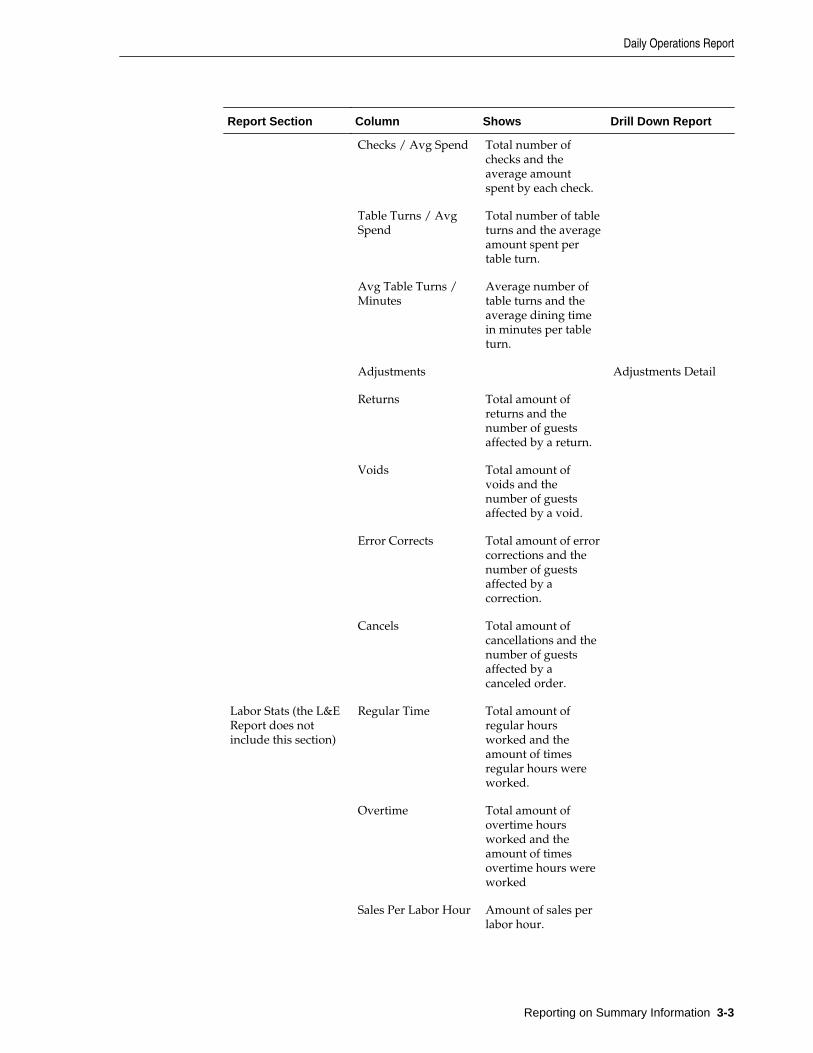
Daily Operations ReportThe Daily Operations report provides an overview of revenue totals and operatingmetrics, as described in the following table:
Report Section Column Shows Drill Down Report
Total Revenue Total Revenue Total revenuereported for theorganization.
Net Sales Net sales for theorganization.
Sales Mix SummaryReport
Gross Sales Gross sales for theorganization.
Control Report
Reporting on Summary Information 3-1

Report Section Column Shows Drill Down Report
Discounts All discounts thataffect net and grosssales for theorganization.
Daily DiscountsReport
Service Charges All service chargesthat affect the net andgross sales for theorganization.
Service ChargesReport
Taxes All taxes that affectthe net and grosssales for theorganization.
Taxes Report
Total Operating Cost Total Operating Cost Total operating costfor the organization(Cost of Goods Sold+ Labor Cost).
Cost of Goods Sold Total cost of goodssold by theorganization.
Cost of Goods SoldSummary
Labor Cost Total amount paidout to employees forall positions in theorganization.
Job Code Summary
Total OperatingMargin
Total OperatingMargin
Total operatingmargin for theorganization (TotalRevenue - TotalOperating Cost).
Receipts Total amount on allopen and closedchecks for all areas ofthe organization.
Receipts
Paid In Total amount paid byguests.
Pay Ins
Paid Out Total amount paid bythe organization foritems like food orlabor.
Pay Outs
Operating Metrics Service Service PerformanceSummary
Guests / Avg Spend Total number ofguests and theaverage amountspent by each guest.
Daily Operations Report
3-2 User Guide
Report Section Column Shows Drill Down Report
Checks / Avg Spend Total number ofchecks and theaverage amountspent by each check.
Table Turns / AvgSpend
Total number of tableturns and the averageamount spent pertable turn.
Avg Table Turns /Minutes
Average number oftable turns and theaverage dining timein minutes per tableturn.
Adjustments Adjustments Detail
Returns Total amount ofreturns and thenumber of guestsaffected by a return.
Voids Total amount ofvoids and thenumber of guestsaffected by a void.
Error Corrects Total amount of errorcorrections and thenumber of guestsaffected by acorrection.
Cancels Total amount ofcancellations and thenumber of guestsaffected by acanceled order.
Labor Stats (the L&EReport does notinclude this section)
Regular Time Total amount ofregular hoursworked and theamount of timesregular hours wereworked.
Overtime Total amount ofovertime hoursworked and theamount of timesovertime hours wereworked
Sales Per Labor Hour Amount of sales perlabor hour.
Daily Operations Report
Reporting on Summary Information 3-3

Report Section Column Shows Drill Down Report
Avg Hourly Pay Average amount ofpay per hour.
Revenue Center Revenue Center List of all revenuecenters.
Service PerformanceSummary
Net Sales Net Sales for therevenue center.
Check Total number ofchecks for therevenue center.
Avg Check Average checkamount for therevenue center.
Guest Total guest count forthe revenue center.
Avg Guest Average amountspent by each guestat the revenue center.
Day Part Sales Summary ReportThe Day Part Sales Summary report provides sales information and totals by Day Part,as described in the following table:
Column Shows Drill Down Report
Day Part The day part is a fixed periodof time, such as Lunch,Brunch, and Happy Hour.
Day Part OperationsSummary Report
Days of the Week Shows the days of the weekthat are applicable to the daypart.
Start Time Shows the start time for theday part.
End Time Shows the end time for theday part.
Net Sales Shows the net sales of theorganization by day part.
Checks/Transactions Shows the number of checksor transactions that occurredduring the day part.
Day Part Operations Summary Report
Day Part Sales Summary Report
3-4 User Guide

The Day Part Operations Summary report provides an overview of revenue totals andoperating metrics for a specific day part, as described in the following table:
Report Section Column Shows Drill Down Report
Day Part Revenue
For example, DinnerRevenue Details.
Day Part Revenue Shows the totalrevenue for theorganization duringthe day part.
Net Sales Shows the net salesfor the organizationduring the day part.
Day Part Sales MixSummary
Gross Sales Shows the gross salesfor the organizationduring the day part.
Discounts Shows all discountsthat affect net andgross sales for theorganization duringthe day part.
Day Part Discounts
Service Charges Shows all servicecharges that affect theorganization duringthe day part.
Day Part ServiceCharges
Operating Cost Operating Cost Shows the totaloperating cost for theorganization duringthe day part.
Cost of Goods Sold Shows the total costof goods sold by theorganization duringthe day part.
Day Part Cost ofGoods SoldSummary
Labor Cost Shows the total laborcosts for theorganization duringthe day part.
Operating Margin Operating Margin Shows the totaloperating margin forthe organizationduring the day part.
Receipts Shows the totalamount generatedthrough sales by theorganization duringthe day part.
Day Part Receipts
Day Part OperatingMetrics
Service Day Part Service byQuarter Hour
Day Part Operations Summary Report
Reporting on Summary Information 3-5

Report Section Column Shows Drill Down Report
Guests / Avg Spend Total number ofguests and theaverage amountspent by each guest.
Checks / Avg Spend Total number ofchecks and theaverage amountspent by each check.
Table Turns / AvgSpend
Total number of tableturns and the averageamount spent pertable turn.
Avg Table Turns /Minutes
Average number oftable turns and theaverage dining timein minutes per tableturn.
Adjustments Adjustments Detail
Returns Total amount ofreturns and thenumber of guestsaffected by a return.
Voids Total amount ofvoids and thenumber of guestsaffected by a void.
Error Corrects Total amount of errorcorrections and thenumber of guestsaffected by acorrection.
Cancels Total amount ofcancellations and thenumber of guestsaffected by acanceled order.
Labor Stats (the L&EReport does notinclude this section)
Regular Time Total amount ofregular hoursworked and theamount of timesregular hours wereworked.
Labor Summary
Overtime Total amount ofovertime hoursworked and theamount of timesovertime hours wereworked
Day Part Operations Summary Report
3-6 User Guide

Report Section Column Shows Drill Down Report
Sales Per Labor Hour Amount of sales perlabor hour.
Avg Hourly Pay Average amount ofpay per hour.
Revenue Center Revenue Center List of all revenuecenters.
Day Part ServicePerformanceSummary
Net Sales Net Sales for therevenue center.
Check Total number ofchecks for therevenue center.
Avg Check Average checkamount for therevenue center.
Guest Total guest count forthe revenue center.
Avg Guest Average amountspent by each guestat the revenue center.
Today’s Operations ReportThe Today’s Operations report provides an overview of revenue totals and operatingmetrics for the current business day, as described in the following table:
Report Section Column Shows Drill Down Report
Total Revenue Total Revenue Shows the totalrevenue for theorganization for thecurrent business day.
Net Sales Shows the net salesfor the organizationfor the currentbusiness day.
Today’s Net SalesMix Summary
Gross Sales Shows the gross salesfor the organizationfor the currentbusiness day.
Discounts Shows all discountsthat affect net andgross sales for theorganization duringthe current businessday.
Day Part Discounts
Today’s Operations Report
Reporting on Summary Information 3-7

Report Section Column Shows Drill Down Report
Service Charges Shows all servicecharges that affect theorganization duringthe current businessday.
Day Part ServiceCharges
Operating Costs Operating Costs Shows the totaloperating cost for theorganization duringthe current businessday.
Cost of Goods Sold Shows the total costof goods sold by theorganization duringthe current businessday.
Today’s Cost ofGoods SoldSummary
Labor Cost Shows the total laborcosts for theorganization duringthe current businessday.
Operating Margin Operating Margin Shows the totaloperating margin forthe organizationduring the currentbusiness day.
Receipts Shows the totalamount generatedthrough sales by theorganization duringthe current businessday.
Receipts
Operating Metrics Service Today’s ServicePerformance
Guests / Avg Spend Total number ofguests and theaverage amountspent by each guest.
Checks / Avg Spend Total number ofchecks and theaverage amountspent by each check.
Table Turns / AvgSpend
Total number of tableturns and the averageamount spent pertable turn.
Today’s Operations Report
3-8 User Guide

Report Section Column Shows Drill Down Report
Avg Table Turns /Minutes
Average number oftable turns and theaverage dining timein minutes per tableturn.
Adjustments Adjustments Detail
Returns Total amount ofreturns and thenumber of guestsaffected by a return.
Voids Total amount ofvoids and thenumber of guestsaffected by a void.
Error Corrects Total amount of errorcorrections and thenumber of guestsaffected by acorrection.
Cancels Total amount ofcancellations and thenumber of guestsaffected by acanceled order.
Labor Stats (the L&EReport does notinclude this section)
Regular Time Total amount ofregular hoursworked and theamount of timesregular hours wereworked.
Labor Summary
Overtime Total amount ofovertime hoursworked and theamount of timesovertime hours wereworked
Sales Per Labor Hour Amount of sales perlabor hour.
Avg Hourly Pay Average amount ofpay per hour.
Revenue Center Revenue Center List of all revenuecenters.
Service PerformanceSummary
Net Sales Net Sales for therevenue center.
Today’s Operations Report
Reporting on Summary Information 3-9

Report Section Column Shows Drill Down Report
Check Total number ofchecks for therevenue center.
Avg Check Average checkamount for therevenue center.
Guest Total guest count forthe revenue center.
Avg Guest Average amountspent by each guestat the revenue center.
Revenue Center Details ReportThe Revenue Center Details report provides sales information and totals for specificrevenue centers, as described in the following table:
Column Shows
Revenue Center Shows a list of revenue centers.
Location Shows the location for the revenue center.
Net Sales Shows the net sales for the location andrevenue center.
FC% Shows the food cost percentage by location.
Guest Shows the number of guests at the locationand revenue center.
Per Guest Shows the average amount spent per guest.
Check Shows the number of guest checks at thelocation and revenue center.
Per Check Shows the average check amount based onlocation and revenue center.
Tables Shows the number of tales at the location andrevenue center.
Per Tables Shows the average check amount per tablebased on location and revenue center.
Revenue Center Details Report
3-10 User Guide
4Reporting on Daily Detail Information
The following reports provide daily information for specific areas of operation:
• Adjustment Details Report
• Cash Management Report
• CC Batch Activity Report
• CC Batch Report
• CC Batch Details Report
• Control Report
• Cost of Goods Sold Summary Report
• Cost of Goods Sold by Item Group
• Daily Discounts Report
• Job Code Summary Report
• Job Code Employee Detail Report
• Labor Analysis Summary Report
• Labor by Day Part and Hour Report
• Labor by Quarter Hour Report
• No Sale Report
• Sales Mix Summary Report
• Service Charges Report
• Service Performance Summary Report
• Taxes Report
• Tender Media Report
• Weather Analysis Report
• Weather by Location Report
Adjustment Details Report
Cash Management Report
Reporting on Daily Detail Information 4-1
CC Batch Activity Report
CC Batch Report
CC Batch Details Report
Control Report
Cost of Goods Sold Summary Report
Cost of Goods Sold by Item Group
Daily Discounts Report
Job Code Summary Report
Job Code Employee Detail Report
Labor Analysis Summary Report
Labor by Day Part and Hour Report
Labor by Quarter Hour Report
No Sale Report
Sales Mix Summary Report
Service Charges Report
Service Performance Summary Report
Taxes Report
Tender Media Report
Weather Analysis Report
Weather by Location Report
Related Topics:
Running Standard Reports
Modifying Standard Reports
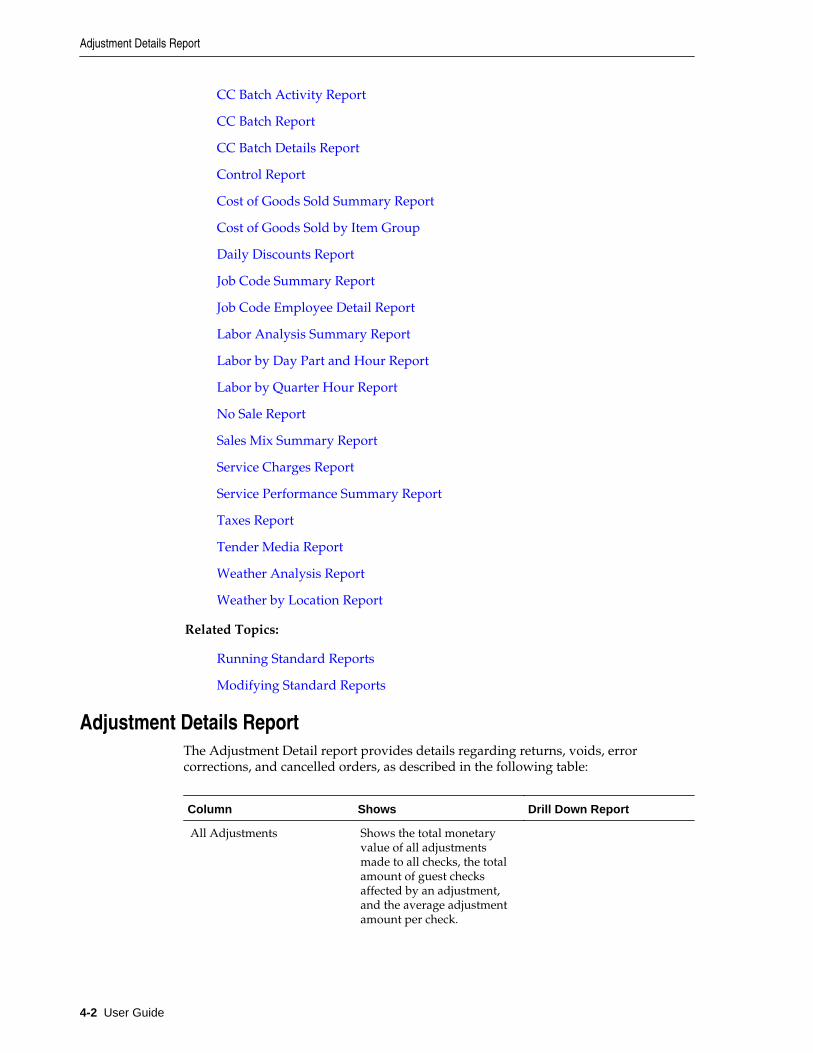
Adjustment Details ReportThe Adjustment Detail report provides details regarding returns, voids, errorcorrections, and cancelled orders, as described in the following table:
Column Shows Drill Down Report
All Adjustments Shows the total monetaryvalue of all adjustmentsmade to all checks, the totalamount of guest checksaffected by an adjustment,and the average adjustmentamount per check.
Adjustment Details Report
4-2 User Guide
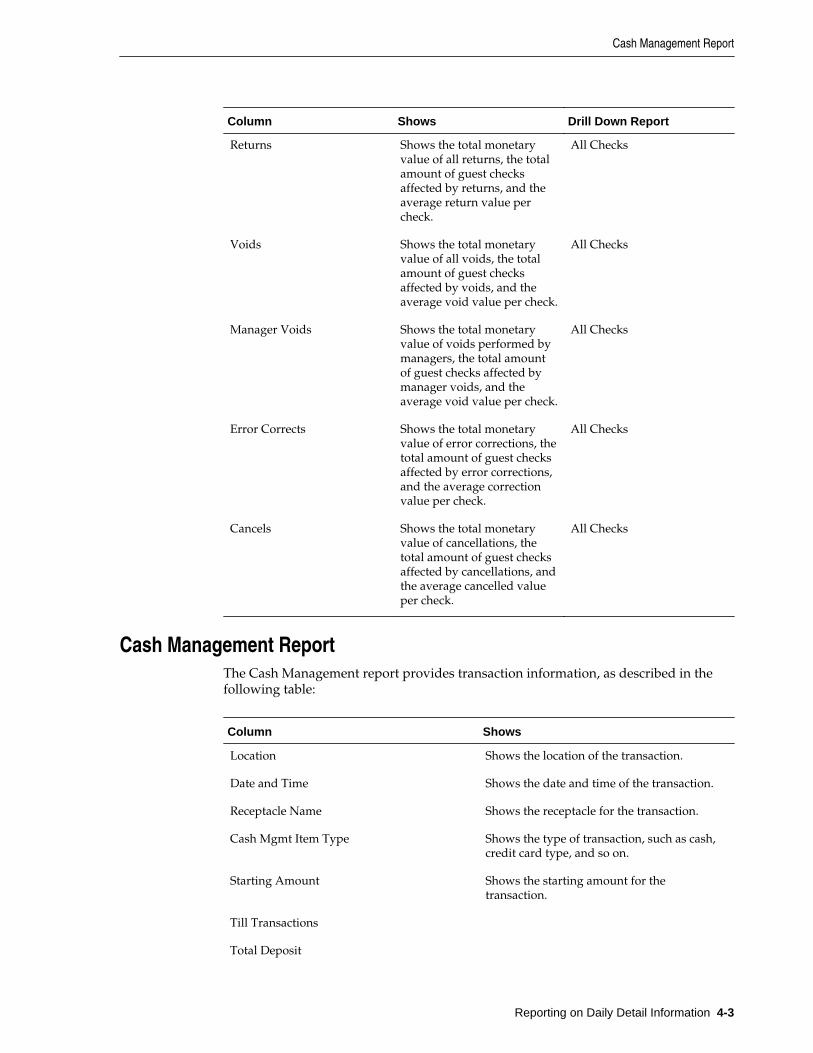
Column Shows Drill Down Report
Returns Shows the total monetaryvalue of all returns, the totalamount of guest checksaffected by returns, and theaverage return value percheck.
All Checks
Voids Shows the total monetaryvalue of all voids, the totalamount of guest checksaffected by voids, and theaverage void value per check.
All Checks
Manager Voids Shows the total monetaryvalue of voids performed bymanagers, the total amountof guest checks affected bymanager voids, and theaverage void value per check.
All Checks
Error Corrects Shows the total monetaryvalue of error corrections, thetotal amount of guest checksaffected by error corrections,and the average correctionvalue per check.
All Checks
Cancels Shows the total monetaryvalue of cancellations, thetotal amount of guest checksaffected by cancellations, andthe average cancelled valueper check.
All Checks
Cash Management ReportThe Cash Management report provides transaction information, as described in thefollowing table:
Column Shows
Location Shows the location of the transaction.
Date and Time Shows the date and time of the transaction.
Receptacle Name Shows the receptacle for the transaction.
Cash Mgmt Item Type Shows the type of transaction, such as cash,credit card type, and so on.
Starting Amount Shows the starting amount for thetransaction.
Till Transactions
Total Deposit
Cash Management Report
Reporting on Daily Detail Information 4-3
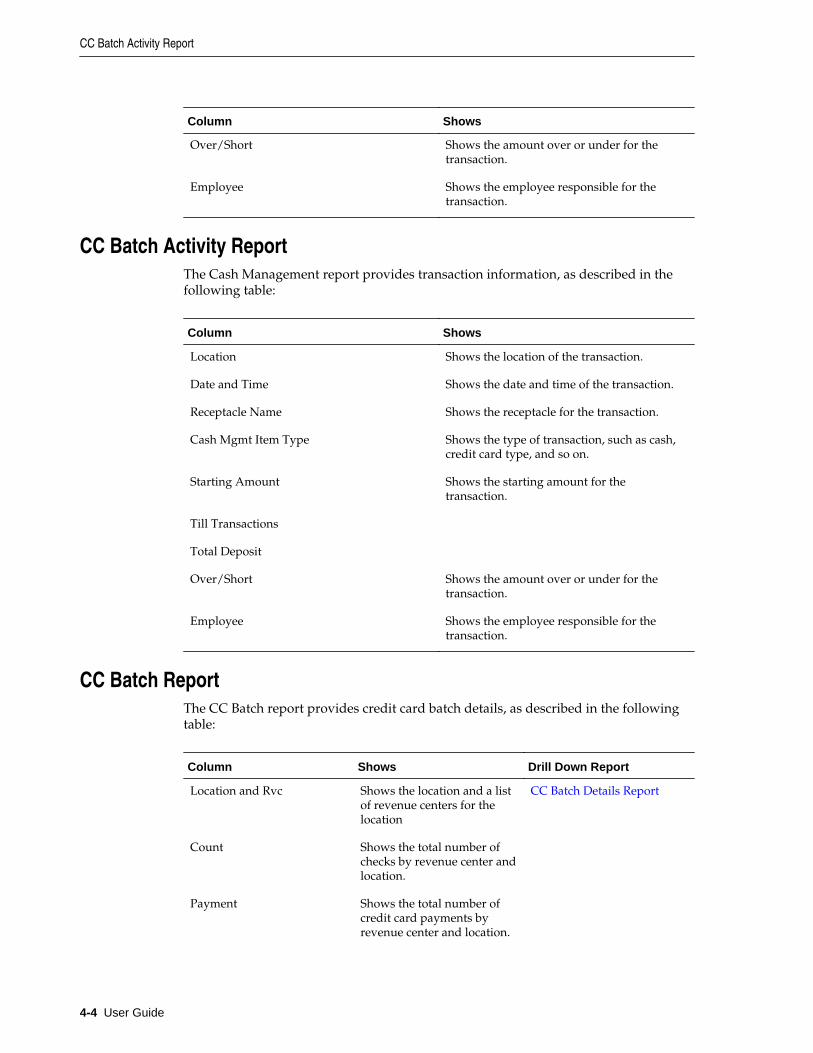
Column Shows
Over/Short Shows the amount over or under for thetransaction.
Employee Shows the employee responsible for thetransaction.
CC Batch Activity ReportThe Cash Management report provides transaction information, as described in thefollowing table:
Column Shows
Location Shows the location of the transaction.
Date and Time Shows the date and time of the transaction.
Receptacle Name Shows the receptacle for the transaction.
Cash Mgmt Item Type Shows the type of transaction, such as cash,credit card type, and so on.
Starting Amount Shows the starting amount for thetransaction.
Till Transactions
Total Deposit
Over/Short Shows the amount over or under for thetransaction.
Employee Shows the employee responsible for thetransaction.
CC Batch ReportThe CC Batch report provides credit card batch details, as described in the followingtable:
Column Shows Drill Down Report
Location and Rvc Shows the location and a listof revenue centers for thelocation
CC Batch Details Report
Count Shows the total number ofchecks by revenue center andlocation.
Payment Shows the total number ofcredit card payments byrevenue center and location.
CC Batch Activity Report
4-4 User Guide

Column Shows Drill Down Report
% Revenue Shows the percentage of allrevenue that is accounted forby credit cards.
Tips Shows the total monetaryvalue of credit card tips.
Tips % Shows the percentage of alltips accounted for by creditcard tips.
CC Batch Details ReportThe CC Batch report provides check details for credit card batches, as described in thefollowing table:
Column Shows
Check Shows the check number.
Batch Shows the batch in which the check wasprocessed.
Acct Number Shows the masked credit card number usedto pay the check.
Exp Shows the expiration date for the credit card.
Employee Shows the employee that performed thecredit card transaction.
Rev Center Shows the revenue center where thetransaction was performed.
Time Shows the date and time of the transaction.
Tips Shows the amount of tip left on the creditcard payment.
Payment Shows the total amount on each credit cardtransaction.
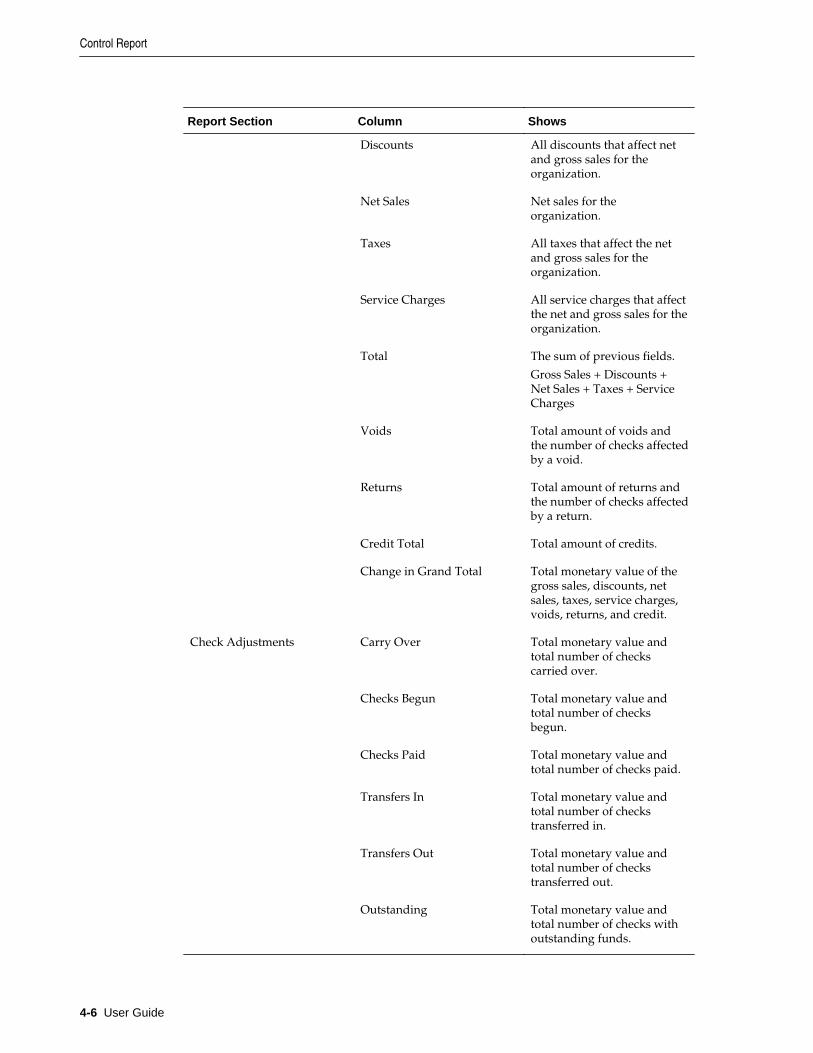
Control ReportThe Control report provides revenue, adjustment, and gross change information, asdescribed in the following table:
Report Section Column Shows
Control Item Gross Sales Gross sales for theorganization.
CC Batch Details Report
Reporting on Daily Detail Information 4-5
Report Section Column Shows
Discounts All discounts that affect netand gross sales for theorganization.
Net Sales Net sales for theorganization.
Taxes All taxes that affect the netand gross sales for theorganization.
Service Charges All service charges that affectthe net and gross sales for theorganization.
Total The sum of previous fields.
Gross Sales + Discounts +Net Sales + Taxes + ServiceCharges
Voids Total amount of voids andthe number of checks affectedby a void.
Returns Total amount of returns andthe number of checks affectedby a return.
Credit Total Total amount of credits.
Change in Grand Total Total monetary value of thegross sales, discounts, netsales, taxes, service charges,voids, returns, and credit.
Check Adjustments Carry Over Total monetary value andtotal number of checkscarried over.
Checks Begun Total monetary value andtotal number of checksbegun.
Checks Paid Total monetary value andtotal number of checks paid.
Transfers In Total monetary value andtotal number of checkstransferred in.
Transfers Out Total monetary value andtotal number of checkstransferred out.
Outstanding Total monetary value andtotal number of checks withoutstanding funds.
Control Report
4-6 User Guide
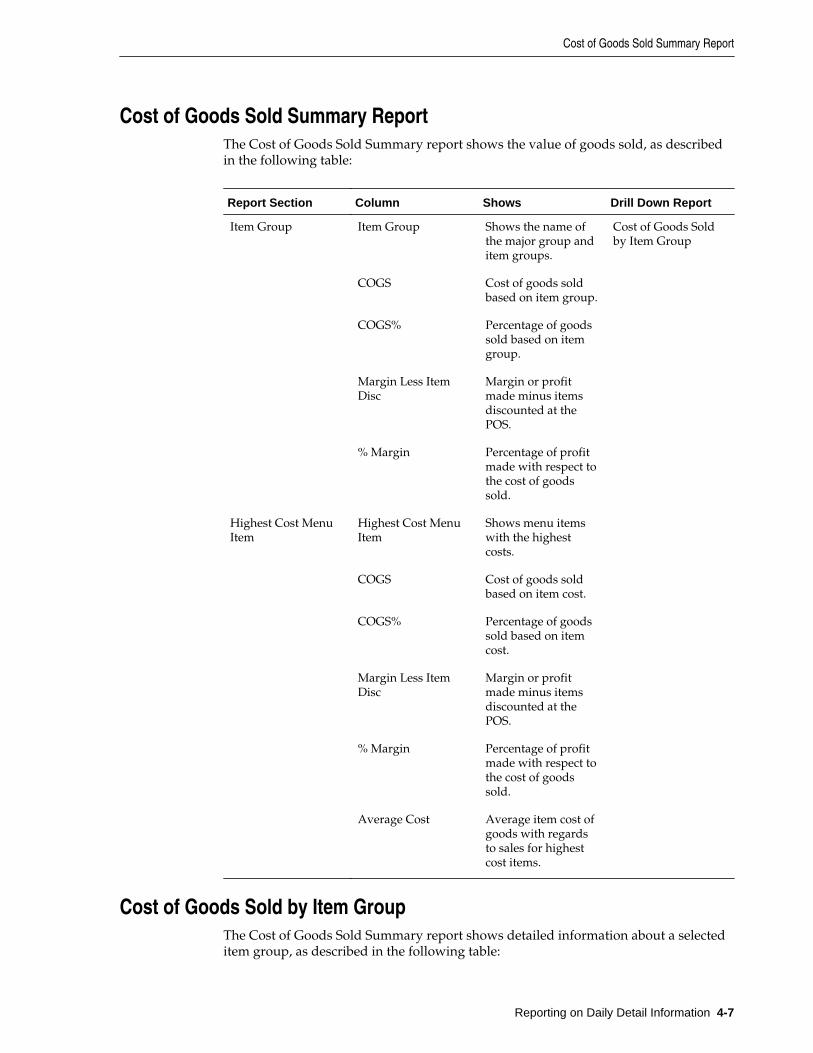
Cost of Goods Sold Summary ReportThe Cost of Goods Sold Summary report shows the value of goods sold, as describedin the following table:
Report Section Column Shows Drill Down Report
Item Group Item Group Shows the name ofthe major group anditem groups.
Cost of Goods Soldby Item Group
COGS Cost of goods soldbased on item group.
COGS% Percentage of goodssold based on itemgroup.
Margin Less ItemDisc
Margin or profitmade minus itemsdiscounted at thePOS.
% Margin Percentage of profitmade with respect tothe cost of goodssold.
Highest Cost MenuItem
Highest Cost MenuItem
Shows menu itemswith the highestcosts.
COGS Cost of goods soldbased on item cost.
COGS% Percentage of goodssold based on itemcost.
Margin Less ItemDisc
Margin or profitmade minus itemsdiscounted at thePOS.
% Margin Percentage of profitmade with respect tothe cost of goodssold.
Average Cost Average item cost ofgoods with regardsto sales for highestcost items.
Cost of Goods Sold by Item GroupThe Cost of Goods Sold Summary report shows detailed information about a selecteditem group, as described in the following table:
Cost of Goods Sold Summary Report
Reporting on Daily Detail Information 4-7
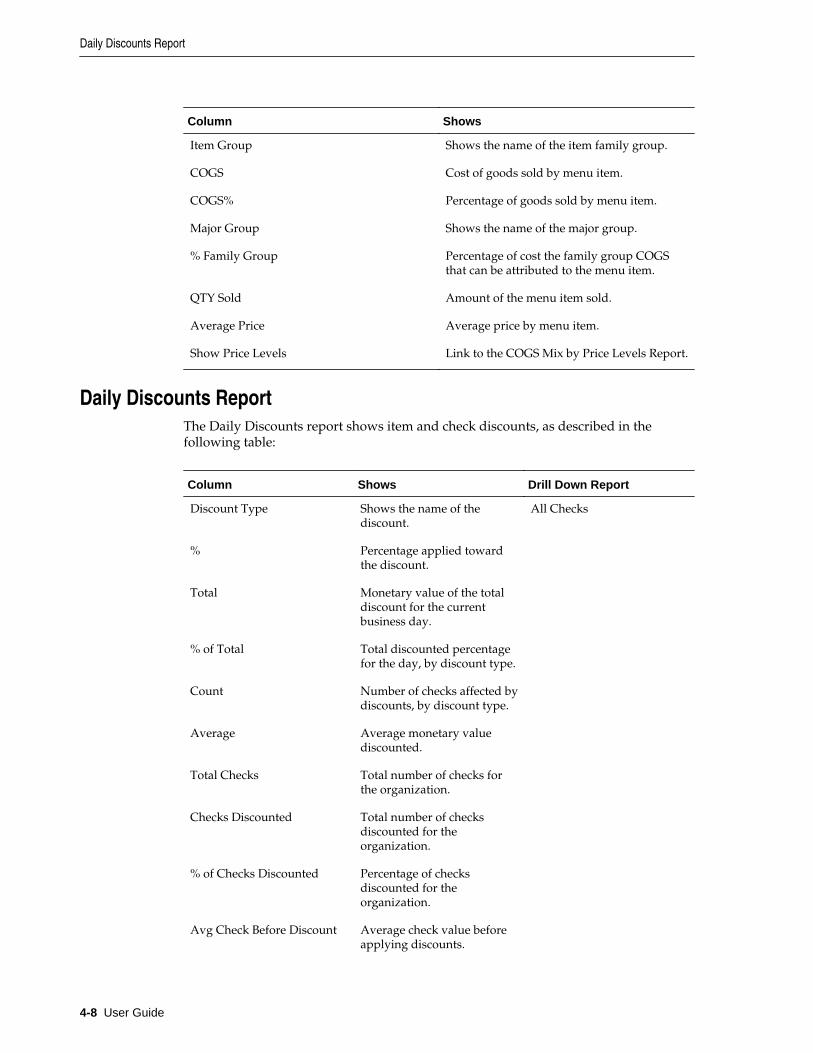
Column Shows
Item Group Shows the name of the item family group.
COGS Cost of goods sold by menu item.
COGS% Percentage of goods sold by menu item.
Major Group Shows the name of the major group.
% Family Group Percentage of cost the family group COGSthat can be attributed to the menu item.
QTY Sold Amount of the menu item sold.
Average Price Average price by menu item.
Show Price Levels Link to the COGS Mix by Price Levels Report.
Daily Discounts ReportThe Daily Discounts report shows item and check discounts, as described in thefollowing table:
Column Shows Drill Down Report
Discount Type Shows the name of thediscount.
All Checks
% Percentage applied towardthe discount.
Total Monetary value of the totaldiscount for the currentbusiness day.
% of Total Total discounted percentagefor the day, by discount type.
Count Number of checks affected bydiscounts, by discount type.
Average Average monetary valuediscounted.
Total Checks Total number of checks forthe organization.
Checks Discounted Total number of checksdiscounted for theorganization.
% of Checks Discounted Percentage of checksdiscounted for theorganization.
Avg Check Before Discount Average check value beforeapplying discounts.
Daily Discounts Report
4-8 User Guide

Column Shows Drill Down Report
Avg Depth of Discount Percentage of the total valueof checks discounted.
Gross Sales Gross sales for theorganization.
% Discount off Gross Sales Percentage of gross salesdiscounted.
Job Code Summary ReportThe Job Code Summary report shows hour and pay information by job code, asdescribed in the following table:
Column Shows Drill Down Report
Job Codes Shows the job codes for allemployment positions.
Job Code Employee DetailReport
Total Pay Total pay by job code.
Total Hours Total work hours by job code.
Average Hourly Pay Average hourly pay by jobcode.
Regular Pay Monetary value of regularpay by job code.
Regular Hours Number of regular workhours by job code.
Overtime Pay Monetary value of overtimepay by job code.
Overtime Hours Number of overtime workhours by job code.
Net Sales Net sales for theorganization.
Total Labor Total monetary value paid tothe job code.
Total Time Total number of hoursworked by the job code.
Average Hourly Pay Average hourly pay of all jobcodes.
Labor Cost (% Net Sales) Percentage of labor spent toaccrue net sales.
Sales Per Labor Hours Monetary value of sales perlabor hour.
Job Code Summary Report
Reporting on Daily Detail Information 4-9

Job Code Employee Detail ReportThe Job Code Employee Detail report shows hour and pay details by specificemployee, as described in the following table:
Column Shows Drill Down Report
Job Codes Shows a list of employees byjob code and location.
Drills into information screenshowing employee-specificdetails such as clock-in andclock-out information andhours worked.
Total Pay Total pay by employee.
Total Hours Total work hours byemployee.
Average Hourly Pay Average hourly pay byemployee.
Regular Pay Monetary value of regularpay by employee.
Regular Hours Number of regular workhours by employee.
Overtime Pay Monetary value of overtimepay by employee.
Overtime Hours Number of overtime workhours by employee.
Net Sales Net sales for theorganization.
Total Labor Total monetary value paid tothe employee.
Total Time Total number of hoursworked by the employee.
Average Hourly Pay Average hourly pay of all jobcodes.
Labor Cost (% Net Sales) Percentage of labor spent toaccrue net sales.
Sales Per Labor Hours Monetary value of sales perlabor hour.
Labor Analysis Summary ReportThe Labor Analysis Summary report presents an overview of regular pay, overtime,and hours, as described in the following table:
Job Code Employee Detail Report
4-10 User Guide

Column Shows Drill Down Report
Labor Categories Shows all labor categories. Labor by Day Part and Hour
Total Pay Total monetary value ofsalaries paid.
Total Hours Total amount of hoursworked by all employees.
Theo Hours Estimated work hours for allemployees.
Avg Hourly Pay Average hourly pay by laborcategory.
Regular Pay Total monetary value ofregular hours paid.
Regular Hours Total number of regularhours worked.
Overtime Pay Total monetary value ofovertime hours paid.
Overtime Hours Total number of overtimehours worked.
Net Sales Net sales for theorganization.
Labor Cost (% Net Sales) The amount of labor requiredto accrue a certain amount ofsales.
Variance to Theo Hrs Variance with respect toforecasted or theoreticalhours.
Avg Hourly Pay Average hourly pay for theorganization.
Sales Per Labor Hours Monetary value of sales perlabor hour.
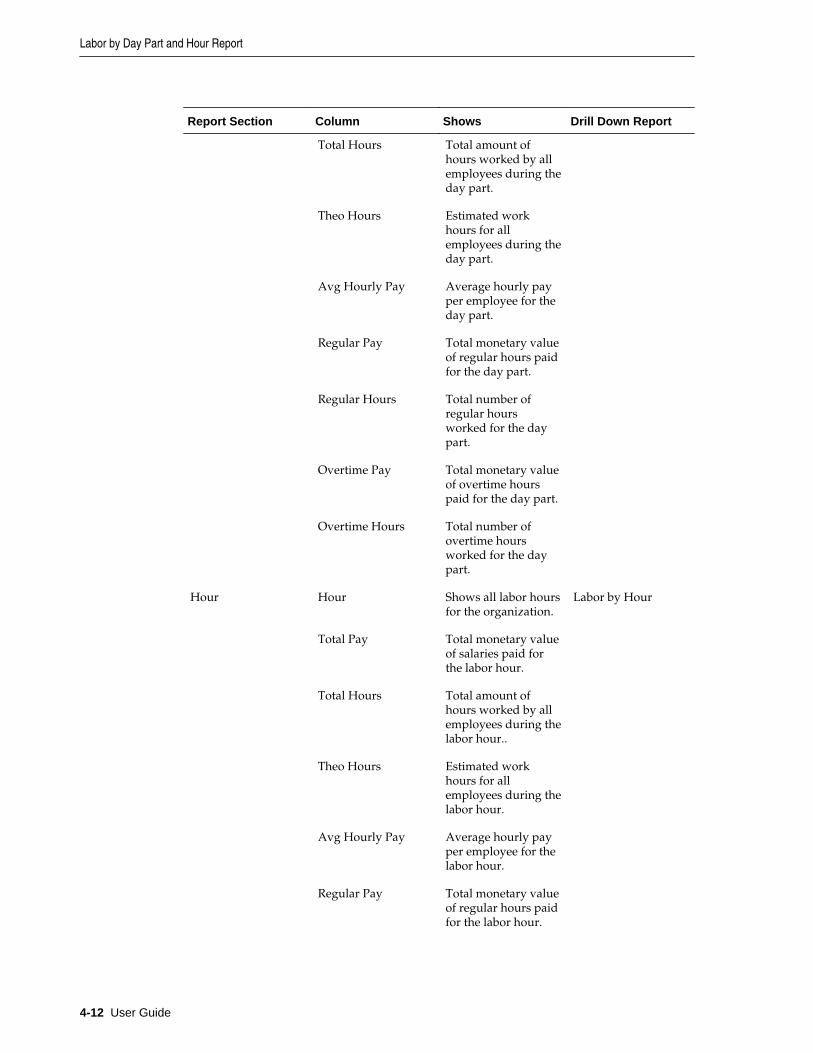
Labor by Day Part and Hour ReportThe Labor by Day Part and Hour report presents labor information organized by daypart or hours, as described in the following table:
Report Section Column Shows Drill Down Report
Day Part Day Part Shows all day parts. Labor by Day Part
Total Pay Total monetary valueof salaries paid forthe day part.
Labor by Day Part and Hour Report
Reporting on Daily Detail Information 4-11
Report Section Column Shows Drill Down Report
Total Hours Total amount ofhours worked by allemployees during theday part.
Theo Hours Estimated workhours for allemployees during theday part.
Avg Hourly Pay Average hourly payper employee for theday part.
Regular Pay Total monetary valueof regular hours paidfor the day part.
Regular Hours Total number ofregular hoursworked for the daypart.
Overtime Pay Total monetary valueof overtime hourspaid for the day part.
Overtime Hours Total number ofovertime hoursworked for the daypart.
Hour Hour Shows all labor hoursfor the organization.
Labor by Hour
Total Pay Total monetary valueof salaries paid forthe labor hour.
Total Hours Total amount ofhours worked by allemployees during thelabor hour..
Theo Hours Estimated workhours for allemployees during thelabor hour.
Avg Hourly Pay Average hourly payper employee for thelabor hour.
Regular Pay Total monetary valueof regular hours paidfor the labor hour.
Labor by Day Part and Hour Report
4-12 User Guide
Report Section Column Shows Drill Down Report
Regular Hours Total number ofregular hoursworked for the laborhour.
Overtime Pay Total monetary valueof overtime hourspaid for the laborhour.
Overtime Hours Total number ofovertime hoursworked for the laborhour.
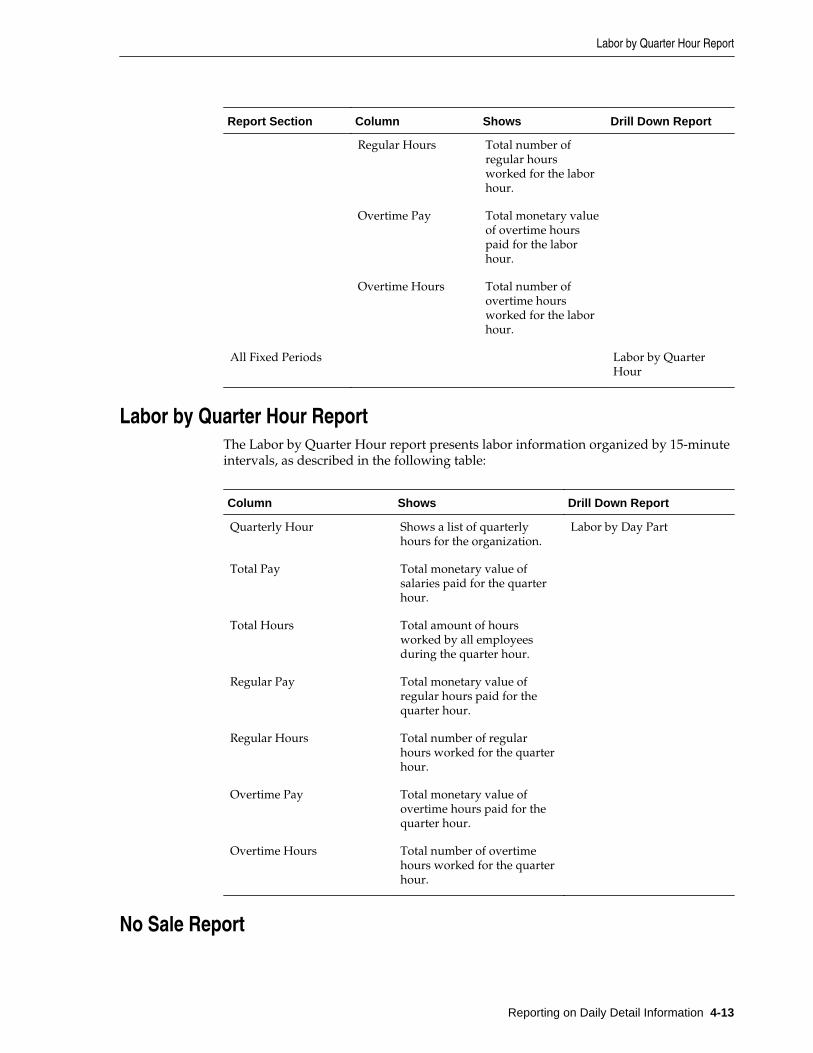
All Fixed Periods Labor by QuarterHour
Labor by Quarter Hour ReportThe Labor by Quarter Hour report presents labor information organized by 15-minuteintervals, as described in the following table:
Column Shows Drill Down Report
Quarterly Hour Shows a list of quarterlyhours for the organization.
Labor by Day Part
Total Pay Total monetary value ofsalaries paid for the quarterhour.
Total Hours Total amount of hoursworked by all employeesduring the quarter hour.
Regular Pay Total monetary value ofregular hours paid for thequarter hour.
Regular Hours Total number of regularhours worked for the quarterhour.
Overtime Pay Total monetary value ofovertime hours paid for thequarter hour.
Overtime Hours Total number of overtimehours worked for the quarterhour.
No Sale Report
Labor by Quarter Hour Report
Reporting on Daily Detail Information 4-13
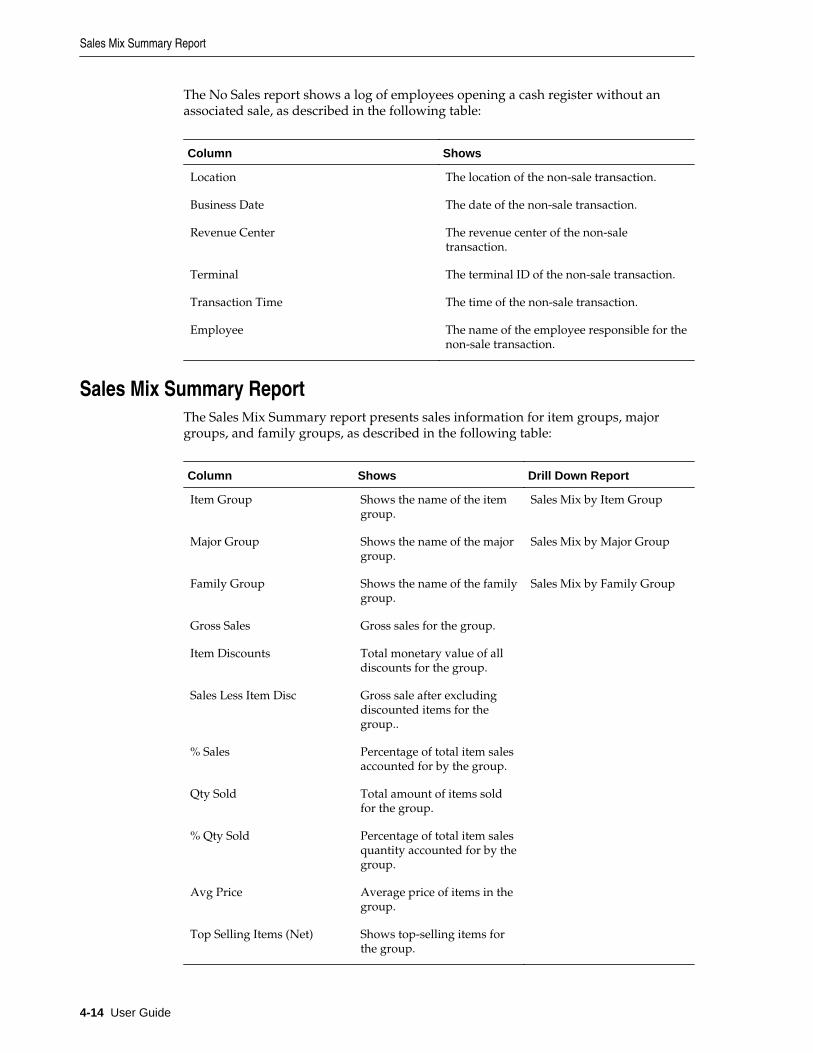
The No Sales report shows a log of employees opening a cash register without anassociated sale, as described in the following table:
Column Shows
Location The location of the non-sale transaction.
Business Date The date of the non-sale transaction.
Revenue Center The revenue center of the non-saletransaction.
Terminal The terminal ID of the non-sale transaction.
Transaction Time The time of the non-sale transaction.
Employee The name of the employee responsible for thenon-sale transaction.
Sales Mix Summary ReportThe Sales Mix Summary report presents sales information for item groups, majorgroups, and family groups, as described in the following table:
Column Shows Drill Down Report
Item Group Shows the name of the itemgroup.
Sales Mix by Item Group
Major Group Shows the name of the majorgroup.
Sales Mix by Major Group
Family Group Shows the name of the familygroup.
Sales Mix by Family Group
Gross Sales Gross sales for the group.
Item Discounts Total monetary value of alldiscounts for the group.
Sales Less Item Disc Gross sale after excludingdiscounted items for thegroup..
% Sales Percentage of total item salesaccounted for by the group.
Qty Sold Total amount of items soldfor the group.
% Qty Sold Percentage of total item salesquantity accounted for by thegroup.
Avg Price Average price of items in thegroup.
Top Selling Items (Net) Shows top-selling items forthe group.
Sales Mix Summary Report
4-14 User Guide

Service Charges ReportThe Service Charges report present information for fees, gratuities, tips, and otherservice charges, as described in the following table:
Column Shows Drill Down Report
Service Charges Name of the service charge. All Checks
Total Total monetary value by eachservice charge.
% of Total Percentage of all servicecharges that are accountedfor by each service charge.
Count Total number of checksaffected by each servicecharge.
Average Average monetary value ofthe service charge.
Service Performance Summary ReportThe Service Performance Summary report presents an overview of all guests, checks,and averages by Day Part and Hour, as described in the following table:
Report Section Column Shows Drill Down Report
Day Part Day Part Shows all day parts. Day Part Service byQuarter Hour
Net Sales Net sales for theorganization.
% Sales Percentage of netsales accounted forby the service charge.
Guests Total number ofguests.
Sales per Guest Monetary value ofsales per guest.
Checks Total number ofchecks.
Avg Check Average value ofchecks.
Table Turns Total number of tableturns.
Service Charges Report
Reporting on Daily Detail Information 4-15

Report Section Column Shows Drill Down Report
Avg Minutes Average time inminutes that checksremain open.
Hour Hour Shows all hours in abusiness day.
Service by Hour
Net Sales Net sales for thehour.
% Sales Percentage of netsales accounted forby the hour.
Guests Total number ofguests during thehour.
Sales per Guest Monetary value ofsales per guestduring the hour.
Checks Total number ofchecks for the hour.
Avg Check Average value ofchecks during thehour..
Table Turns Total number of tableturns for the hour.
Avg Minutes Average time inminutes that checksremain open duringthe hour..
All Fixed Periods Shows net sales, %Sales, Guests, Salesper Guest, Checks,Avg Check, TableTurns, and AvgMinutes for all fixedperiods, typically setto 15-minuteintervals.
Taxes ReportThe Taxes report shows details pertaining to taxes collected and paid out, as describedin the following table:
Column Shows
Tax Type Name of the tax type, such as state, federal, orsales.
Taxes Report
4-16 User Guide
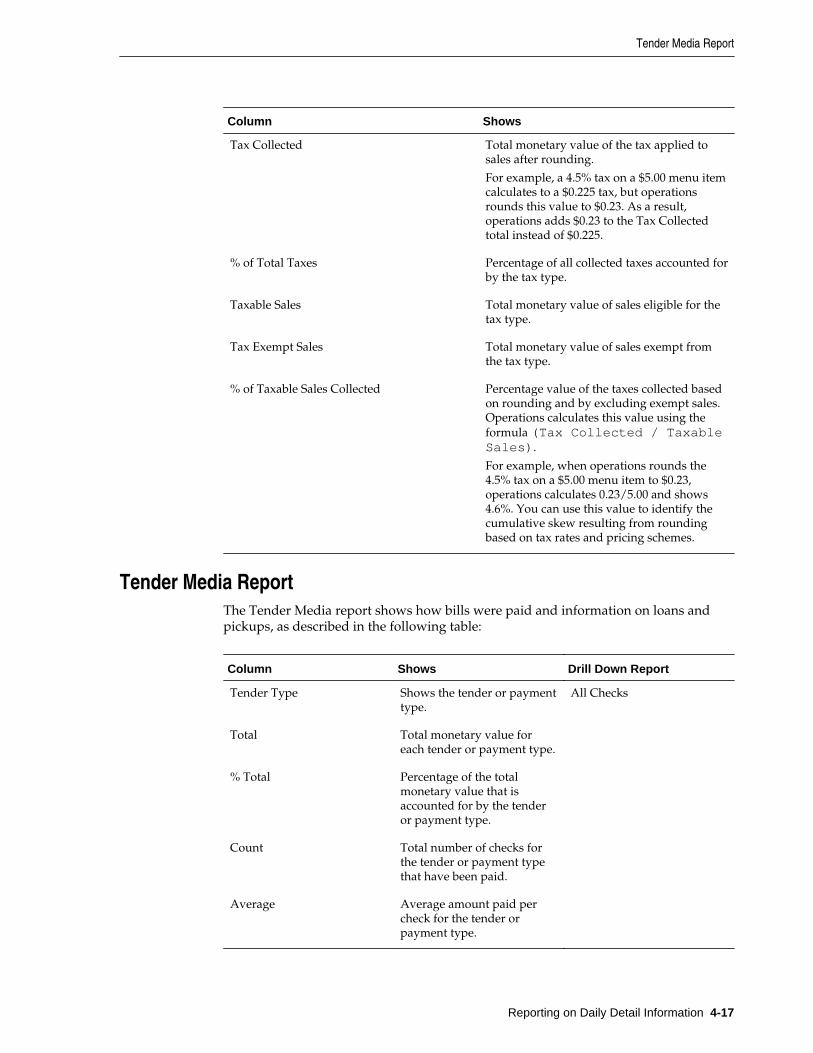
Column Shows
Tax Collected Total monetary value of the tax applied tosales after rounding.
For example, a 4.5% tax on a $5.00 menu itemcalculates to a $0.225 tax, but operationsrounds this value to $0.23. As a result,operations adds $0.23 to the Tax Collectedtotal instead of $0.225.
% of Total Taxes Percentage of all collected taxes accounted forby the tax type.
Taxable Sales Total monetary value of sales eligible for thetax type.
Tax Exempt Sales Total monetary value of sales exempt fromthe tax type.
% of Taxable Sales Collected Percentage value of the taxes collected basedon rounding and by excluding exempt sales.Operations calculates this value using theformula (Tax Collected / TaxableSales).
For example, when operations rounds the4.5% tax on a $5.00 menu item to $0.23,operations calculates 0.23/5.00 and shows4.6%. You can use this value to identify thecumulative skew resulting from roundingbased on tax rates and pricing schemes.
Tender Media ReportThe Tender Media report shows how bills were paid and information on loans andpickups, as described in the following table:
Column Shows Drill Down Report
Tender Type Shows the tender or paymenttype.
All Checks
Total Total monetary value foreach tender or payment type.
% Total Percentage of the totalmonetary value that isaccounted for by the tenderor payment type.
Count Total number of checks forthe tender or payment typethat have been paid.
Average Average amount paid percheck for the tender orpayment type.
Tender Media Report
Reporting on Daily Detail Information 4-17

Weather Analysis ReportThe Weather Analysis report shows sales information by weather condition categories,as described in the following table:
Column Shows Drill Down Report
Location Shows the name of thelocation.
Weather by Location
Weather Condition Shows the weatherconditions for the location.
# Days Shows the number of daysthe location is projected toexperience weathercondition.
Guests Total number of guestscounted during the weathercondition.
Checks Total number of checkscreated during the weathercondition.
Sales Total monetary value of salesduring the weathercondition.
Weather by Location ReportThe Weather by Location report shows sales information by weather conditioncategories at a specific location, as described in the following table:
Column Shows
Date List of applicable dates.
Weather Condition Shows the weather conditions for the day.
High Temp Shows the high temperature for the day.
Low Temp Shows the low temperature for the day.
Guests Total number of guests counted during theweather condition.
Checks Total number of checks created during theweather condition.
Sales Total monetary value of sales during theweather condition.
Weather Analysis Report
4-18 User Guide

5Reporting on Current Business Day
Information
The following reports provide sales and operations information for the currentbusiness day:
• Today’s Service Performance Report
• Today’s Tenders Report
• Today’s Tenders Drilldown Reports
Today’s Service Performance Report
Today’s Tenders Report
Today’s Tenders Drilldown Reports
Related Topics:
Running Standard Reports
Modifying Standard Reports
Today’s Service Performance ReportThe Today’s Service Performance report provides details regarding sales, guests,checks, and averages for the current business day, as described in the following table:
Report Section Column Shows
Day Part Day Part Shows all day parts.
Net Sales Net sales for the organizationand for each day part.
% Sales Percentage of net salesaccounted for by the servicecharge.
Guests Total number of guests.
Sales per Guest Average monetary value ofsales per guest.
Checks Total number of checks.
Avg Check Average value of checks.
Reporting on Current Business Day Information 5-1

Report Section Column Shows
Table Turns Total number of table turns.
Avg Minutes Average time in minutes thatchecks remain open.
Hour Hour Shows all hours in a businessday.
Net Sales Net sales for the hour.
% Sales Percentage of net salesaccounted for by the hour.
Guests Total number of guestsduring the hour.
Sales per Guest Average monetary value ofsales per guest during thehour.
Checks Total number of checks forthe hour.
Avg Check Average value of checksduring the hour..
Table Turns Total number of table turnsfor the hour.
Avg Minutes Average time in minutes thatchecks remain open duringthe hour..
All Fixed Periods Shows net sales, % Sales,Guests, Sales per Guest,Checks, Avg Check, TableTurns, and Avg Minutes forall fixed periods, typically setto 15-minute intervals.
Today’s Tenders ReportThe Today’s Tenders report provides details regarding payments, loans, and pickupsby tender type for the current business day, as described in the following table:
Column Shows Drill Down Report
Revenue Center A list of locations and therevenue centers in eachlocation.
Cash Total monetary value ofpayments with cash.
Comps Total monetary value ofcomplimentary items.
Today’s Comps
Today’s Tenders Report
5-2 User Guide

Column Shows Drill Down Report
Credit Card Total monetary value ofpayments with credit cards.
Today’s Credit Card Report
Direct Bill Today’s Direct Bill
Room Charge Total monetary value ofroom charges processed.
Today’s Room Charges
Other Tenders Total monetary value ofpayments through othertenders.
Today’s Other Tenders
Paid Out Total monetary value paidout by the organization.
Paid In Total monetary value paid into the organization.
Today’s Tenders Drilldown ReportsThe Today’s Tenders report drills down to the following reports:
• Today’s Comps
• Today’s Credit Card
• Today’s Direct Bill
• Today’s Room Charges
• Today’s Other Tenders
These reports show detailed information about the guest checks applicable to thetender type, as described in the following table:
Column Shows Drill Down Report
Location / Check A list of the locations, tendertypes, and the applicableguest check IDs.
Check Detail
Date The date the guest check wascreated.
Time The time the guest check wascreated.
Guest Name The name of the guest.
Reference Info
Employee The employee who createdthe check.
Today’s Tenders Drilldown Reports
Reporting on Current Business Day Information 5-3

Column Shows Drill Down Report
Tender
For example, the Today’sRoom Charges report labelsthis column Service Charges.
The total monetary value oftender type in the guestcheck.
Line Total
Today’s Tenders Drilldown Reports
5-4 User Guide

6Reporting on Key Performance Indicators
The following reports provide information for comparing key performance indicators(KPIs):
• Store and Date Comparison Report
• Store Comparison Report
• Daily Operations Comparison by Location Report
• Daily Operations Comparison by Dates Report
• Daily Operations Comparison by Revenue Center Report
• Sales Comparison by Location Report
• Today’s Store Comparison Report VAT
Store and Date Comparison Report
Store Comparison Report
Daily Operations Comparison by Location Report
Daily Operations Comparison by Dates Report
Daily Operations Comparison by Revenue Center Report
Sales Comparison by Location Report
Today’s Store Comparison Report VAT
Related Topics:
Running Standard Reports
Modifying Standard Reports
Store and Date Comparison ReportThe Store and Date Comparison Report shows key performance indicators for eachstore and date, as described in the following table:
Column Shows
Location A list of all locations, and then a list of datesfor each location.
Net Sales
Reporting on Key Performance Indicators 6-1

Column Shows
Prep Cost Total cost of preparation.
Labor Cost Total cost of labor.
Margin Less Item Disc Margin or profit made minus itemsdiscounted at the POS.
Guests Total number of guests at the given locationand date.
Per Guest Average amount spent by each guest at thegiven location and date.
Discounts Total monetary value of discounts removedfrom the gross sales at the given location anddate.
Overtime Total amount paid in overtime wages toemployees at the given location and date.
Store Comparison ReportThe Store Comparison Report shows key performance indicators for each storelocation, as described in the following table:
Column Shows
Location A list of all locations.
Net Sales
Prep Cost Total cost of preparation.
Labor Cost Total cost of labor.
Margin Less Item Disc Margin or profit made minus itemsdiscounted at the POS.
Guests Total number of guests at the given location.
Per Guest Average amount spent by each guest at thegiven location.
Discounts Total monetary value of discounts removedfrom the gross sales at the given location.
Overtime Total amount paid in overtime wages toemployees at the given location.
Daily Operations Comparison by Location ReportYou can use the location selection filter to configure the Daily Operations Comparisonby Location report to perform a side-by-side comparison of two locations. The reportshows values for both entered locations as well as the variance between the twolocations, as described in the following table:
Store Comparison Report
6-2 User Guide
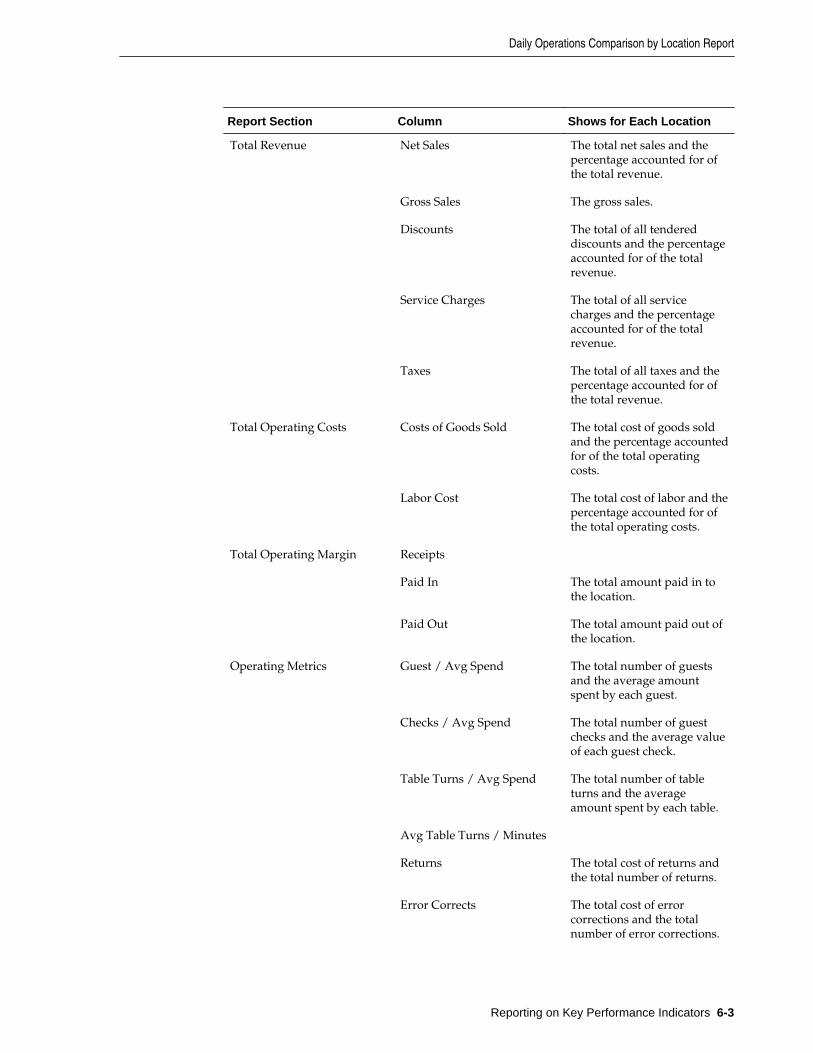
Report Section Column Shows for Each Location
Total Revenue Net Sales The total net sales and thepercentage accounted for ofthe total revenue.
Gross Sales The gross sales.
Discounts The total of all tendereddiscounts and the percentageaccounted for of the totalrevenue.
Service Charges The total of all servicecharges and the percentageaccounted for of the totalrevenue.
Taxes The total of all taxes and thepercentage accounted for ofthe total revenue.
Total Operating Costs Costs of Goods Sold The total cost of goods soldand the percentage accountedfor of the total operatingcosts.
Labor Cost The total cost of labor and thepercentage accounted for ofthe total operating costs.
Total Operating Margin Receipts
Paid In The total amount paid in tothe location.
Paid Out The total amount paid out ofthe location.
Operating Metrics Guest / Avg Spend The total number of guestsand the average amountspent by each guest.
Checks / Avg Spend The total number of guestchecks and the average valueof each guest check.
Table Turns / Avg Spend The total number of tableturns and the averageamount spent by each table.
Avg Table Turns / Minutes
Returns The total cost of returns andthe total number of returns.
Error Corrects The total cost of errorcorrections and the totalnumber of error corrections.
Daily Operations Comparison by Location Report
Reporting on Key Performance Indicators 6-3

Report Section Column Shows for Each Location
Cancels The total cost of cancelleditems and the total number ofcancelled items.
Regular Hours The total number of regularhours worked.
Overtime The total number of overtimehours worked.
Sales Per Hour The average value of salesper hours worked.
Avg Hourly Pay The average hourly wage foremployees.
Daily Operations Comparison by Dates ReportYou can use the business date selection filter to configure the Daily OperationsComparison by Dates report to perform a side-by-side comparison of two businessdates. The report shows values for both entered dates as well as the variance betweenthe two dates, as described in the following table:
Report Section Column Shows for Each BusinessDate
Total Revenue Net Sales The total net sales and thepercentage accounted for ofthe total revenue.
Gross Sales The gross sales.
Discounts The total of all tendereddiscounts and the percentageaccounted for of the totalrevenue.
Service Charges The total of all servicecharges and the percentageaccounted for of the totalrevenue.
Taxes The total of all taxes and thepercentage accounted for ofthe total revenue.
Total Operating Costs Costs of Goods Sold The total cost of goods soldand the percentage accountedfor of the total operatingcosts.
Labor Cost The total cost of labor and thepercentage accounted for ofthe total operating costs.
Total Operating Margin Receipts
Daily Operations Comparison by Dates Report
6-4 User Guide
Report Section Column Shows for Each BusinessDate
Paid In The total amount paid induring the business day.
Paid Out The total amount paid outduring the business day.
Operating Metrics Guest / Avg Spend The total number of guestsand the average amountspent by each guest.
Checks / Avg Spend The total number of guestchecks and the average valueof each guest check.
Table Turns / Avg Spend The total number of tableturns and the averageamount spent by each table.
Avg Table Turns / Minutes
Returns The total cost of returns andthe total number of returns.
Error Corrects The total cost of errorcorrections and the totalnumber of error corrections.
Cancels The total cost of cancelleditems and the total number ofcancelled items.
Regular Hours The total number of regularhours worked.
Overtime The total number of overtimehours worked.
Sales Per Hour The average value of salesper hours worked.
Avg Hourly Pay The average hourly wage foremployees.
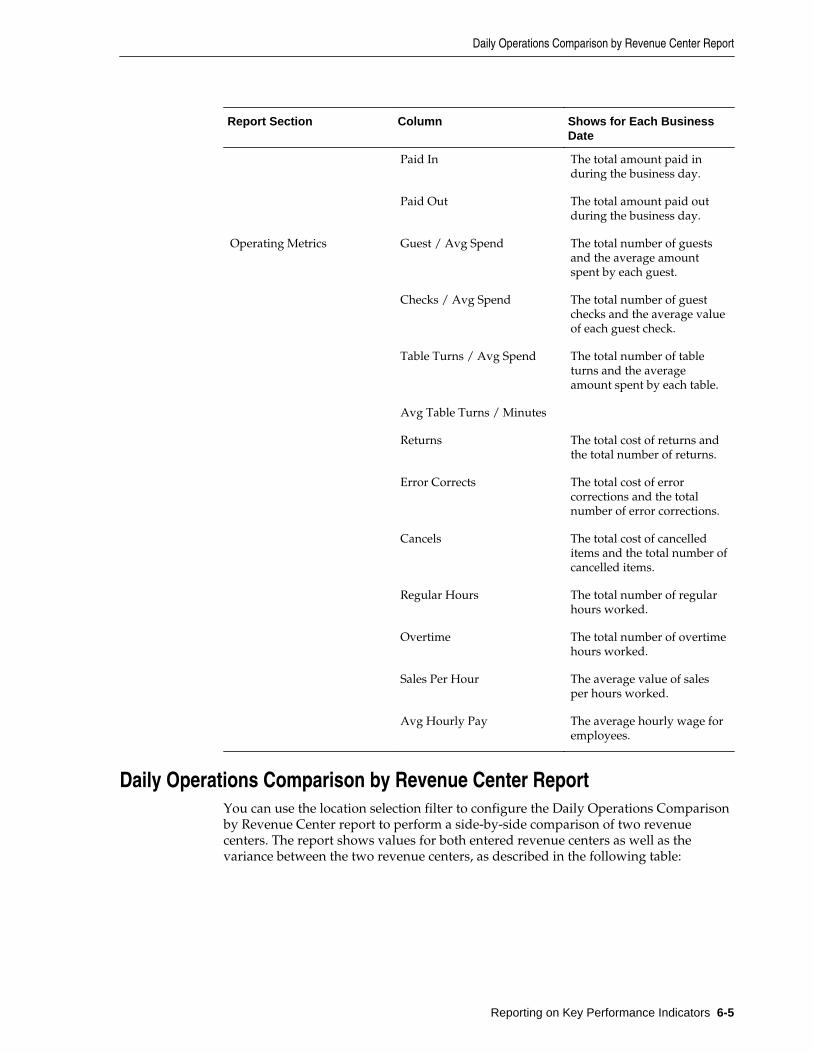
Daily Operations Comparison by Revenue Center ReportYou can use the location selection filter to configure the Daily Operations Comparisonby Revenue Center report to perform a side-by-side comparison of two revenuecenters. The report shows values for both entered revenue centers as well as thevariance between the two revenue centers, as described in the following table:
Daily Operations Comparison by Revenue Center Report
Reporting on Key Performance Indicators 6-5
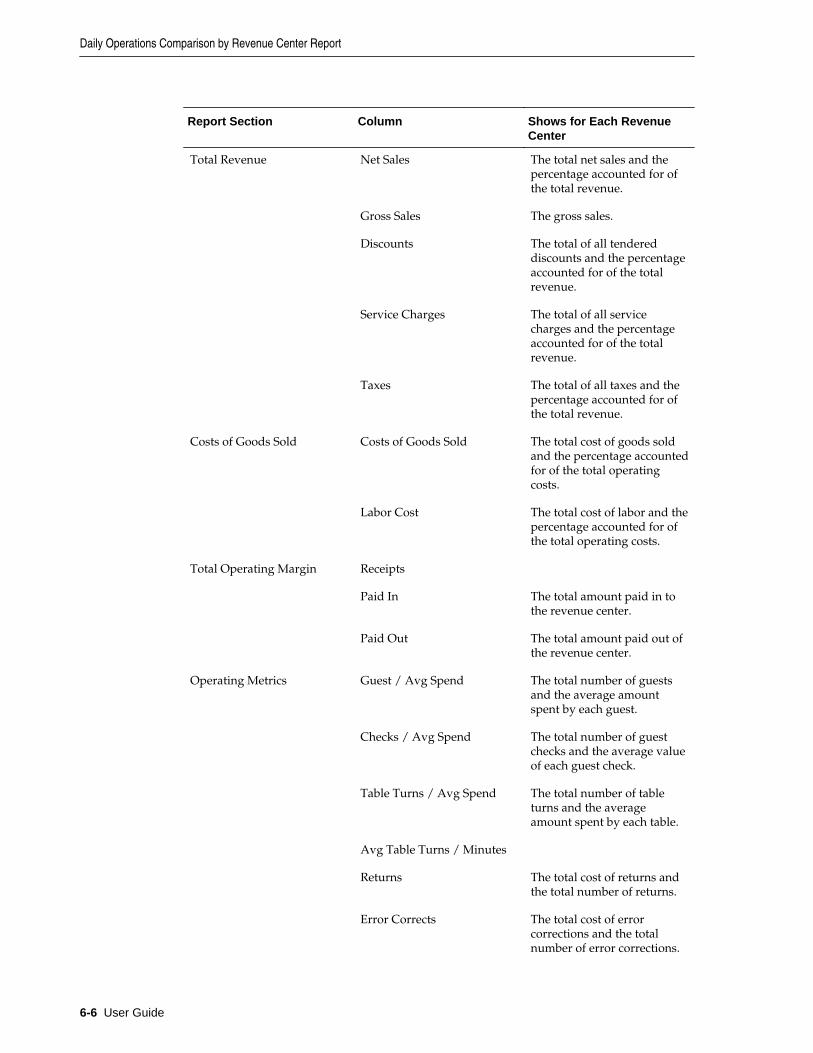
Report Section Column Shows for Each RevenueCenter
Total Revenue Net Sales The total net sales and thepercentage accounted for ofthe total revenue.
Gross Sales The gross sales.
Discounts The total of all tendereddiscounts and the percentageaccounted for of the totalrevenue.
Service Charges The total of all servicecharges and the percentageaccounted for of the totalrevenue.
Taxes The total of all taxes and thepercentage accounted for ofthe total revenue.
Costs of Goods Sold Costs of Goods Sold The total cost of goods soldand the percentage accountedfor of the total operatingcosts.
Labor Cost The total cost of labor and thepercentage accounted for ofthe total operating costs.
Total Operating Margin Receipts
Paid In The total amount paid in tothe revenue center.
Paid Out The total amount paid out ofthe revenue center.
Operating Metrics Guest / Avg Spend The total number of guestsand the average amountspent by each guest.
Checks / Avg Spend The total number of guestchecks and the average valueof each guest check.
Table Turns / Avg Spend The total number of tableturns and the averageamount spent by each table.
Avg Table Turns / Minutes
Returns The total cost of returns andthe total number of returns.
Error Corrects The total cost of errorcorrections and the totalnumber of error corrections.
Daily Operations Comparison by Revenue Center Report
6-6 User Guide
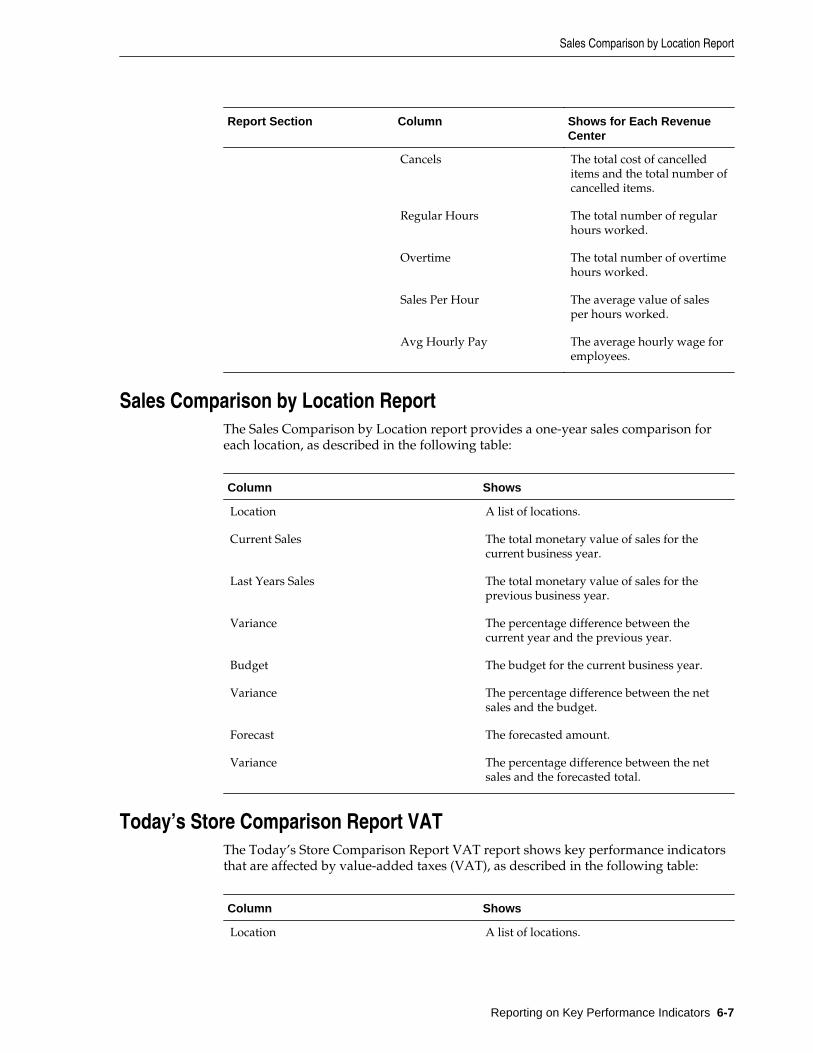
Report Section Column Shows for Each RevenueCenter
Cancels The total cost of cancelleditems and the total number ofcancelled items.
Regular Hours The total number of regularhours worked.
Overtime The total number of overtimehours worked.
Sales Per Hour The average value of salesper hours worked.
Avg Hourly Pay The average hourly wage foremployees.
Sales Comparison by Location ReportThe Sales Comparison by Location report provides a one-year sales comparison foreach location, as described in the following table:
Column Shows
Location A list of locations.
Current Sales The total monetary value of sales for thecurrent business year.
Last Years Sales The total monetary value of sales for theprevious business year.
Variance The percentage difference between thecurrent year and the previous year.
Budget The budget for the current business year.
Variance The percentage difference between the netsales and the budget.
Forecast The forecasted amount.
Variance The percentage difference between the netsales and the forecasted total.
Today’s Store Comparison Report VATThe Today’s Store Comparison Report VAT report shows key performance indicatorsthat are affected by value-added taxes (VAT), as described in the following table:
Column Shows
Location A list of locations.
Sales Comparison by Location Report
Reporting on Key Performance Indicators 6-7

Column Shows
Sales net VAT The total monetary value of sales thatincluded a VAT.
Checks The total number of guest checks.
Per Check The average amount spent per guest checkafter adjusting for VAT.
Food Cost The total cost of food.
FC%
Labor Cost The total cost of labor.
LC%
Overtime The total amount of overtime hours worked.
Gross after Disc The gross revenue after applying discounts.
Discounts The total value of discounts applied.
Today’s Store Comparison Report VAT
6-8 User Guide
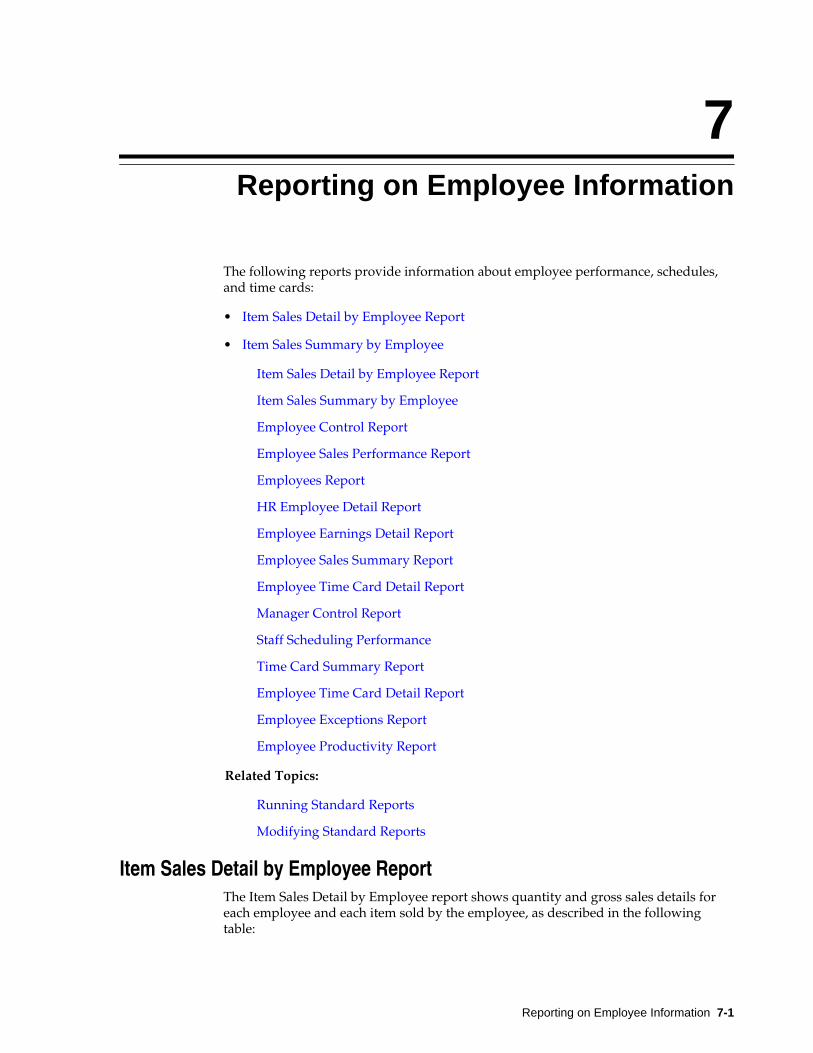
7Reporting on Employee Information
The following reports provide information about employee performance, schedules,and time cards:
• Item Sales Detail by Employee Report
• Item Sales Summary by Employee
Item Sales Detail by Employee Report
Item Sales Summary by Employee
Employee Control Report
Employee Sales Performance Report
Employees Report
HR Employee Detail Report
Employee Earnings Detail Report
Employee Sales Summary Report
Employee Time Card Detail Report
Manager Control Report
Staff Scheduling Performance
Time Card Summary Report
Employee Time Card Detail Report
Employee Exceptions Report
Employee Productivity Report
Related Topics:
Running Standard Reports
Modifying Standard Reports
Item Sales Detail by Employee ReportThe Item Sales Detail by Employee report shows quantity and gross sales details foreach employee and each item sold by the employee, as described in the followingtable:
Reporting on Employee Information 7-1
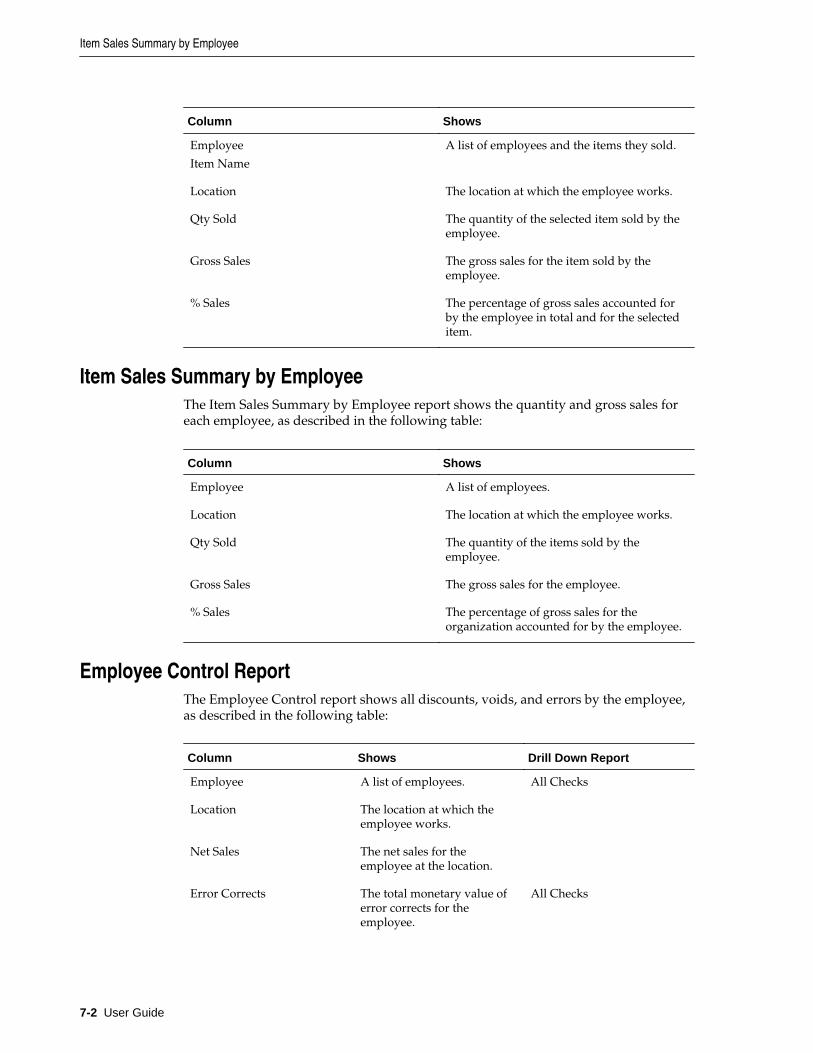
Column Shows
Employee
Item Name
A list of employees and the items they sold.
Location The location at which the employee works.
Qty Sold The quantity of the selected item sold by theemployee.
Gross Sales The gross sales for the item sold by theemployee.
% Sales The percentage of gross sales accounted forby the employee in total and for the selecteditem.
Item Sales Summary by EmployeeThe Item Sales Summary by Employee report shows the quantity and gross sales foreach employee, as described in the following table:
Column Shows
Employee A list of employees.
Location The location at which the employee works.
Qty Sold The quantity of the items sold by theemployee.
Gross Sales The gross sales for the employee.
% Sales The percentage of gross sales for theorganization accounted for by the employee.
Employee Control ReportThe Employee Control report shows all discounts, voids, and errors by the employee,as described in the following table:
Column Shows Drill Down Report
Employee A list of employees. All Checks
Location The location at which theemployee works.
Net Sales The net sales for theemployee at the location.
Error Corrects The total monetary value oferror corrects for theemployee.
All Checks
Item Sales Summary by Employee
7-2 User Guide

Column Shows Drill Down Report
% Sales The percentage of allmonetary corrects attributedto the employee.
Voids The total monetary value ofvoids by the employee.
All Checks
% Sales The percentage of all voidsattributed to the employee.
Mgr Voids The total monetary value ofmanager voids for theemployee.
All Checks
% Sales The percentage of allmanager voids attributed tothe employee.
Discounts The total monetary valuediscounted by the employee.
All Checks
% Sales The percentage of alldiscounts attributed to theemployee.
Employee Sales Performance ReportThe Employee Sales Performance report shows all discounts, voids, and errors by theemployee, as described in the following table:
Column Shows Drill Down Report
Employee A list of employees. All Checks
Location The location at which theemployee works.
Net Sales The net sales for theemployee at the location.
%Sales The percentage of the netsales for location attributed tothe selected employee.
Checks The total number of checkscreated by the employee.
Avg Checks The average monetary valueof each check created by theemployee.
Guest The total number of guestsserved by the employee.
Employee Sales Performance Report
Reporting on Employee Information 7-3

Column Shows Drill Down Report
Avg Dining Time The average dining time forguests served by theemployee.
Table Turns Total number of table turnsperformed by the employee.
Voids Total monetary value ofvoids performed or requiredby the employee.
Discounts Total monetary value ofdiscounts associated with theemployee.
Service Charges Total monetary value ofservice charges applied orrequired by the employee.
Employees ReportThe Employee report shows all employees by location with their human resources andpayroll information, as described in the following table:
Column Shows Drill Down Report
Employee A list of all employees. HR Employee Detail
Location The location at which theemployee works.
Payroll ID Any external payroll ID.
Hired The hiring date for theemployee.
Terminated The termination date for theemployee.
Total Pay The total earnings for theemployee.
Employee Earnings Detail
Overtime Pay The total overtime earningsfor the employee.
Sales The total monetary value ofsales by the employee.
Employee Sales Summary
Tips The total monetary value oftips claimed by the employee.
Time Card Totals
HR Employee Detail ReportThe HR Employee Detail report shows human resources information for eachemployee, as described in the following table:
Employees Report
7-4 User Guide

Report Section Field Shows
Employee Name Hired The hiring date.
Payroll ID Any external payroll ID.
Date of Birth The date of birth.
Gender The gender.
SSN The social security number.
Terminated The termination date.
Salary Type The salary type.
Salary The salary.
Contact Address The street address.
City The city of residence.
County The county of residence.
Postal Code The zip or postal code ofresidence.
Country The country of residence.
Phone The primary phone number.
Fax The fax number.
Other Number Any alternate phone numberprovided by the employee.
Email The email address.
Emergencies Name The name of the emergencycontact.
Address The resident address of theemergency contact.
Phone The phone number of theemergency contact.
I9 Resident Status The residency status.
I9 Category The I9 category.
Doc 1 Type The document type fordocument 1.
Number The number for document 1.
Expires The expiration date fordocument 1.
Work Permit Number The work permit number, ifapplicable.
HR Employee Detail Report
Reporting on Employee Information 7-5
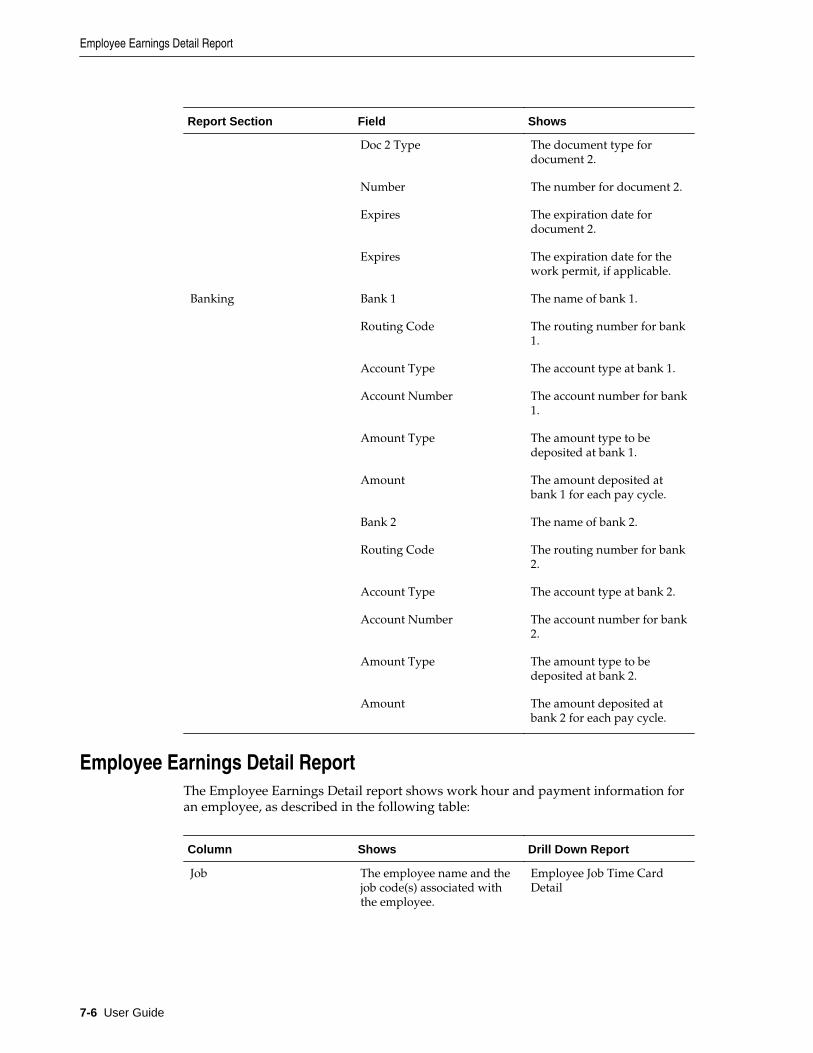
Report Section Field Shows
Doc 2 Type The document type fordocument 2.
Number The number for document 2.
Expires The expiration date fordocument 2.
Expires The expiration date for thework permit, if applicable.
Banking Bank 1 The name of bank 1.
Routing Code The routing number for bank1.
Account Type The account type at bank 1.
Account Number The account number for bank1.
Amount Type The amount type to bedeposited at bank 1.
Amount The amount deposited atbank 1 for each pay cycle.
Bank 2 The name of bank 2.
Routing Code The routing number for bank2.
Account Type The account type at bank 2.
Account Number The account number for bank2.
Amount Type The amount type to bedeposited at bank 2.
Amount The amount deposited atbank 2 for each pay cycle.
Employee Earnings Detail ReportThe Employee Earnings Detail report shows work hour and payment information foran employee, as described in the following table:
Column Shows Drill Down Report
Job The employee name and thejob code(s) associated withthe employee.
Employee Job Time CardDetail
Employee Earnings Detail Report
7-6 User Guide
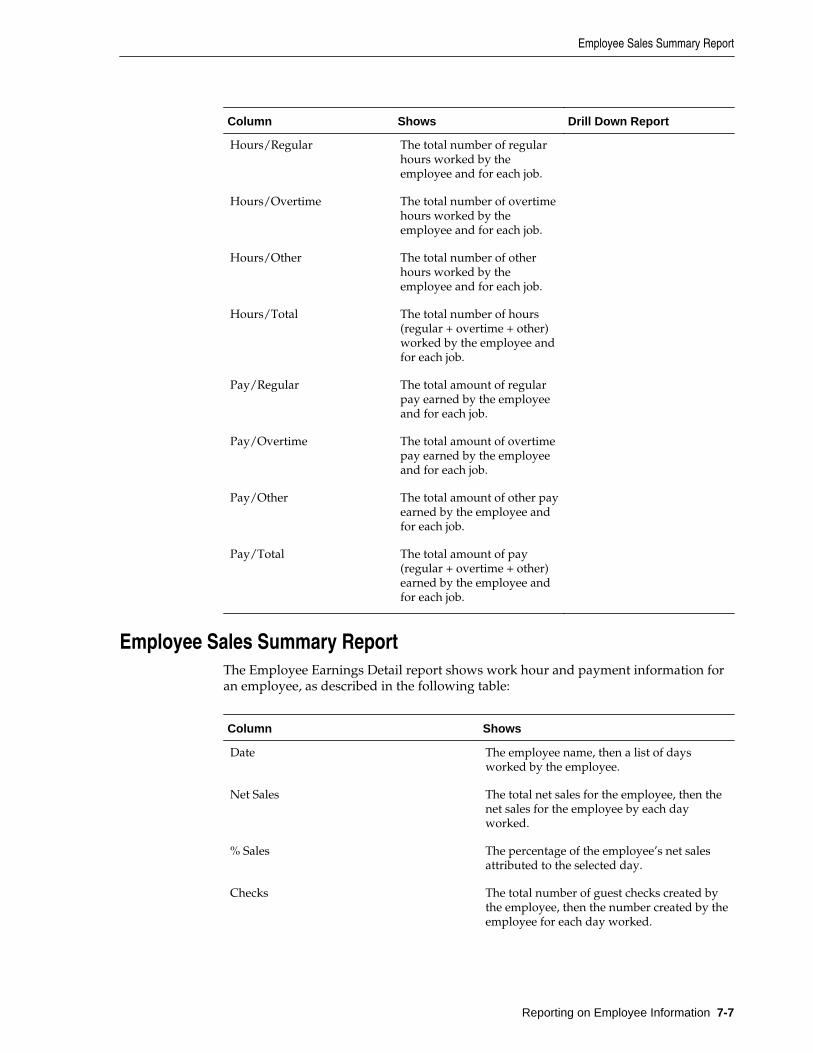
Column Shows Drill Down Report
Hours/Regular The total number of regularhours worked by theemployee and for each job.
Hours/Overtime The total number of overtimehours worked by theemployee and for each job.
Hours/Other The total number of otherhours worked by theemployee and for each job.
Hours/Total The total number of hours(regular + overtime + other)worked by the employee andfor each job.
Pay/Regular The total amount of regularpay earned by the employeeand for each job.
Pay/Overtime The total amount of overtimepay earned by the employeeand for each job.
Pay/Other The total amount of other payearned by the employee andfor each job.
Pay/Total The total amount of pay(regular + overtime + other)earned by the employee andfor each job.
Employee Sales Summary ReportThe Employee Earnings Detail report shows work hour and payment information foran employee, as described in the following table:
Column Shows
Date The employee name, then a list of daysworked by the employee.
Net Sales The total net sales for the employee, then thenet sales for the employee by each dayworked.
% Sales The percentage of the employee’s net salesattributed to the selected day.
Checks The total number of guest checks created bythe employee, then the number created by theemployee for each day worked.
Employee Sales Summary Report
Reporting on Employee Information 7-7

Column Shows
Avg Check The average monetary value of each guestcheck created by the employee, then theaverage value of each guest check created bythe employee for each day worked.
Guests The total number of guests served by theemployee, then the number served by theemployee for each day worked.
Voids The total monetary value of voids performedor required by the employee, then the valueof voids for the employee for each dayworked.
Discounts The total monetary value of discountsassociated with the employee, then the valueof discounts associated with the employee foreach day worked.
Service Charges The total monetary value of service chargesapplied or required by the employee, then thevalue of service charges for the employee foreach day worked.
Employee Time Card Detail Report
Manager Control ReportThe Manager Control report shows information for all transactions that wereperformed by someone other than the check owner that involved discounts, voids, andadjustments, as described in the following table:
Column Shows Drill Down Report
Location The name of the location.
Revenue Center The name of the revenuecenter in the location.
Check The check number. Check Detail
Type The transaction type.
Item Name The name of the item in thetransaction.
Transaction Time The date and time of thetransaction.
Check Employee The name of the employeewho entered the check.
Transaction/AuthorizingEmp
The name of the employeewho authorized thetransaction.
Employee Time Card Detail Report
7-8 User Guide

Column Shows Drill Down Report
Line Total The line total.
Staff Scheduling PerformanceThe Staff Scheduling Performance report provides detailed information comparingforecasted staffing, scheduled staffing, and actual staffing, as described in thefollowing table:
Column Shows
Location
Business Date
A list of the locations followed by a list ofbusiness dates.
Sched Hours The number of staffing hours scheduled.
Theo Hours The number of staffing hours forecasted.
Actual Hours The number of staffing hours worked.
Var to Actual Hours Sched The variances between the actual hours andthe scheduled hours.
Var to Actual Hours Theo The variances between the actual hours andthe forecasted hours.
Sched Pay The amount of payment scheduled.
Theo Pay The amount of payment forecasted.
Actual Pay The amount paid out to employees.
Var to Actual Pay Sched The variances between the actual amountpaid out and the scheduled amount.
Var to Actual Pay Theo The variances between the actual amountpaid out and the forecasted amount.
Time Card Summary ReportThe Time Card Summary report shows time card information by job code and byemployee, as described in the following table:
Column Shows Drill Down Report
Job Code Number
Employee Number
A list of job code numbersfollowed by the ID numbersof employees that workedunder the selected job code.
Job Code Name A list of job code namesfollowed by the names ofemployees that workedunder the selected job code.
Employee Time Card Detail
Staff Scheduling Performance
Reporting on Employee Information 7-9
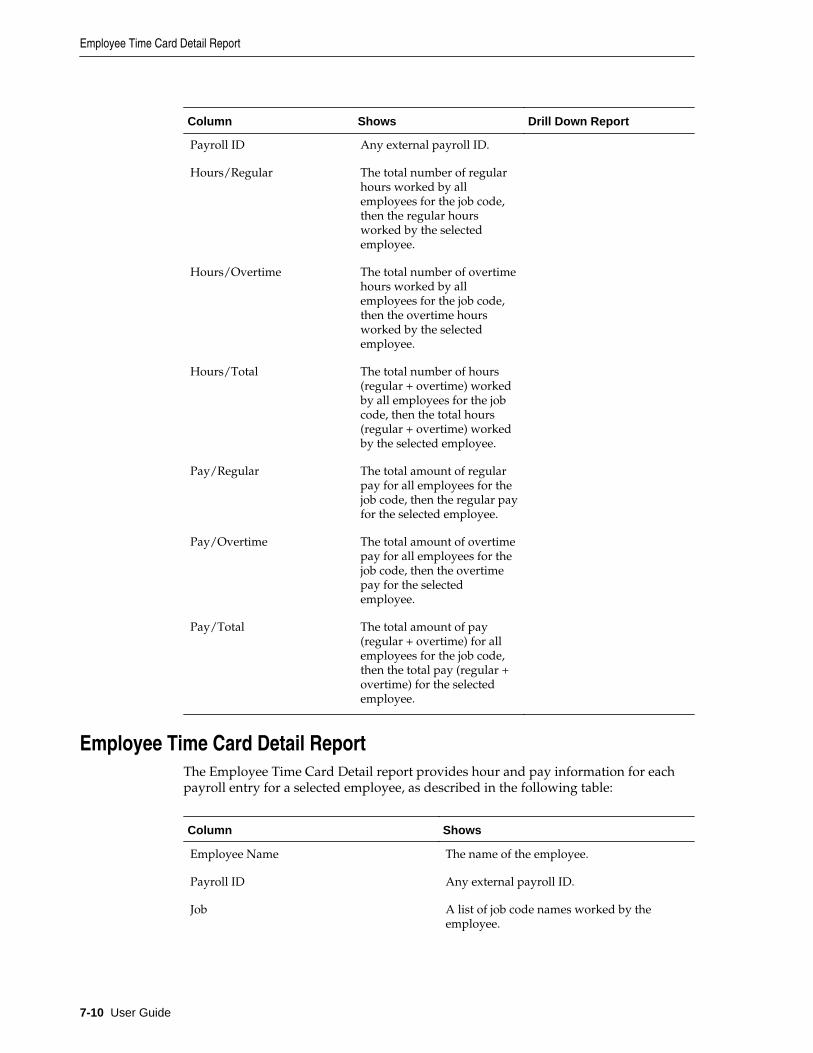
Column Shows Drill Down Report
Payroll ID Any external payroll ID.
Hours/Regular The total number of regularhours worked by allemployees for the job code,then the regular hoursworked by the selectedemployee.
Hours/Overtime The total number of overtimehours worked by allemployees for the job code,then the overtime hoursworked by the selectedemployee.
Hours/Total The total number of hours(regular + overtime) workedby all employees for the jobcode, then the total hours(regular + overtime) workedby the selected employee.
Pay/Regular The total amount of regularpay for all employees for thejob code, then the regular payfor the selected employee.
Pay/Overtime The total amount of overtimepay for all employees for thejob code, then the overtimepay for the selectedemployee.
Pay/Total The total amount of pay(regular + overtime) for allemployees for the job code,then the total pay (regular +overtime) for the selectedemployee.
Employee Time Card Detail ReportThe Employee Time Card Detail report provides hour and pay information for eachpayroll entry for a selected employee, as described in the following table:
Column Shows
Employee Name The name of the employee.
Payroll ID Any external payroll ID.
Job A list of job code names worked by theemployee.
Employee Time Card Detail Report
7-10 User Guide
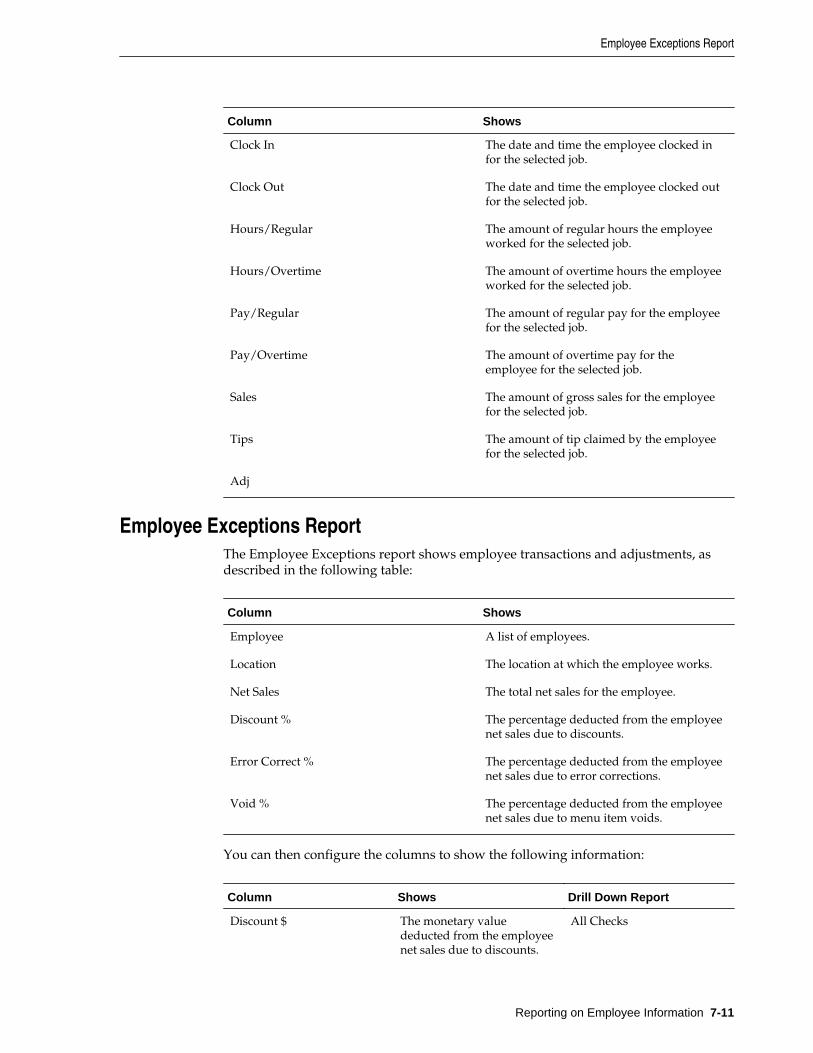
Column Shows
Clock In The date and time the employee clocked infor the selected job.
Clock Out The date and time the employee clocked outfor the selected job.
Hours/Regular The amount of regular hours the employeeworked for the selected job.
Hours/Overtime The amount of overtime hours the employeeworked for the selected job.
Pay/Regular The amount of regular pay for the employeefor the selected job.
Pay/Overtime The amount of overtime pay for theemployee for the selected job.
Sales The amount of gross sales for the employeefor the selected job.
Tips The amount of tip claimed by the employeefor the selected job.
Adj
Employee Exceptions ReportThe Employee Exceptions report shows employee transactions and adjustments, asdescribed in the following table:
Column Shows
Employee A list of employees.
Location The location at which the employee works.
Net Sales The total net sales for the employee.
Discount % The percentage deducted from the employeenet sales due to discounts.
Error Correct % The percentage deducted from the employeenet sales due to error corrections.
Void % The percentage deducted from the employeenet sales due to menu item voids.
You can then configure the columns to show the following information:
Column Shows Drill Down Report
Discount $ The monetary valuededucted from the employeenet sales due to discounts.
All Checks
Employee Exceptions Report
Reporting on Employee Information 7-11
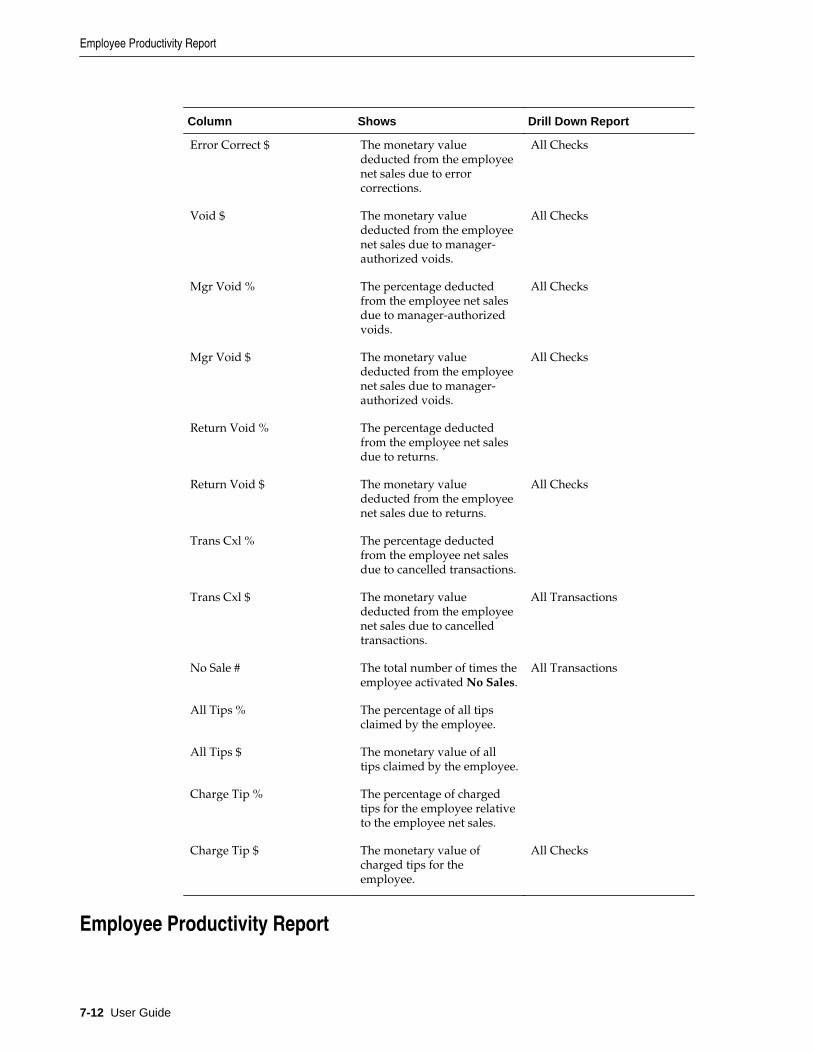
Column Shows Drill Down Report
Error Correct $ The monetary valuededucted from the employeenet sales due to errorcorrections.
All Checks
Void $ The monetary valuededucted from the employeenet sales due to manager-authorized voids.
All Checks
Mgr Void % The percentage deductedfrom the employee net salesdue to manager-authorizedvoids.
All Checks
Mgr Void $ The monetary valuededucted from the employeenet sales due to manager-authorized voids.
All Checks
Return Void % The percentage deductedfrom the employee net salesdue to returns.
Return Void $ The monetary valuededucted from the employeenet sales due to returns.
All Checks
Trans Cxl % The percentage deductedfrom the employee net salesdue to cancelled transactions.
Trans Cxl $ The monetary valuededucted from the employeenet sales due to cancelledtransactions.
All Transactions
No Sale # The total number of times theemployee activated No Sales.
All Transactions
All Tips % The percentage of all tipsclaimed by the employee.
All Tips $ The monetary value of alltips claimed by the employee.
Charge Tip % The percentage of chargedtips for the employee relativeto the employee net sales.
Charge Tip $ The monetary value ofcharged tips for theemployee.
All Checks
Employee Productivity Report
Employee Productivity Report
7-12 User Guide
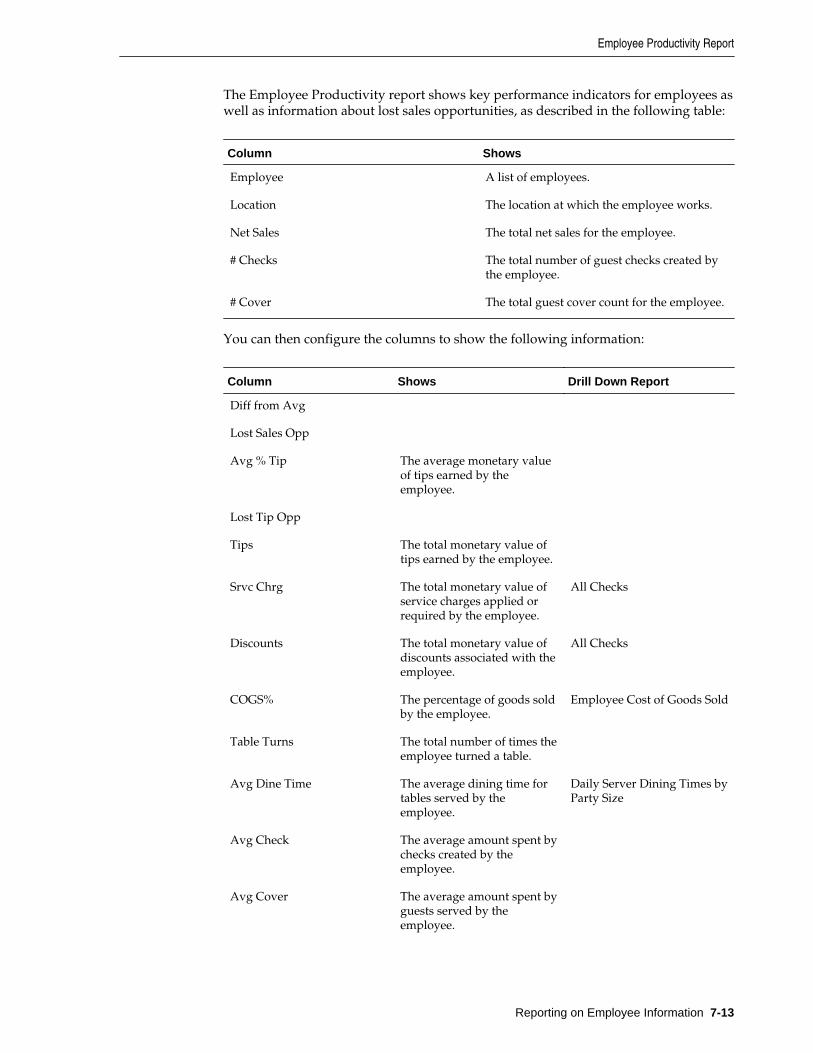
The Employee Productivity report shows key performance indicators for employees aswell as information about lost sales opportunities, as described in the following table:
Column Shows
Employee A list of employees.
Location The location at which the employee works.
Net Sales The total net sales for the employee.
# Checks The total number of guest checks created bythe employee.
# Cover The total guest cover count for the employee.
You can then configure the columns to show the following information:
Column Shows Drill Down Report
Diff from Avg
Lost Sales Opp
Avg % Tip The average monetary valueof tips earned by theemployee.
Lost Tip Opp
Tips The total monetary value oftips earned by the employee.
Srvc Chrg The total monetary value ofservice charges applied orrequired by the employee.
All Checks
Discounts The total monetary value ofdiscounts associated with theemployee.
All Checks
COGS% The percentage of goods soldby the employee.
Employee Cost of Goods Sold
Table Turns The total number of times theemployee turned a table.
Avg Dine Time The average dining time fortables served by theemployee.
Daily Server Dining Times byParty Size
Avg Check The average amount spent bychecks created by theemployee.
Avg Cover The average amount spent byguests served by theemployee.
Employee Productivity Report
Reporting on Employee Information 7-13

Column Shows Drill Down Report
Per Cov Hr. The average number ofguests served the employeeper hour.
Employee Productivity Report
7-14 User Guide
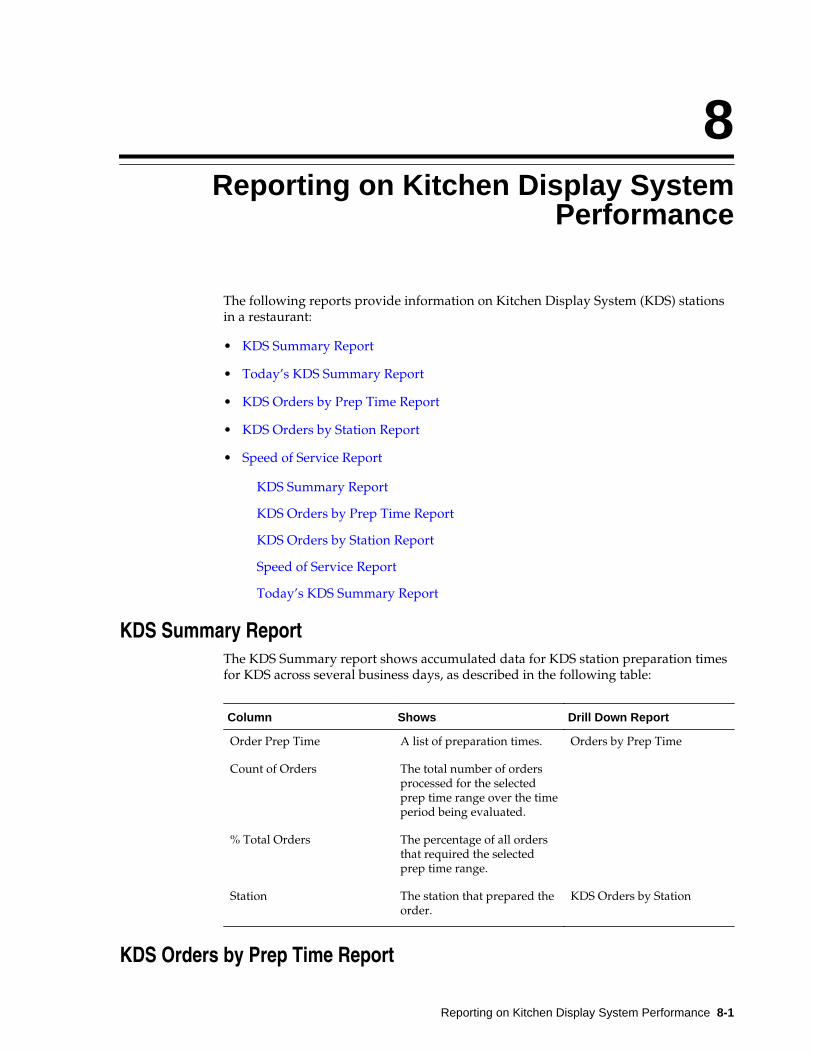
8Reporting on Kitchen Display System
Performance
The following reports provide information on Kitchen Display System (KDS) stationsin a restaurant:
• KDS Summary Report
• Today’s KDS Summary Report
• KDS Orders by Prep Time Report
• KDS Orders by Station Report
• Speed of Service Report
KDS Summary Report
KDS Orders by Prep Time Report
KDS Orders by Station Report
Speed of Service Report
Today’s KDS Summary Report
KDS Summary ReportThe KDS Summary report shows accumulated data for KDS station preparation timesfor KDS across several business days, as described in the following table:
Column Shows Drill Down Report
Order Prep Time A list of preparation times. Orders by Prep Time
Count of Orders The total number of ordersprocessed for the selectedprep time range over the timeperiod being evaluated.
% Total Orders The percentage of all ordersthat required the selectedprep time range.
Station The station that prepared theorder.
KDS Orders by Station
KDS Orders by Prep Time Report
Reporting on Kitchen Display System Performance 8-1
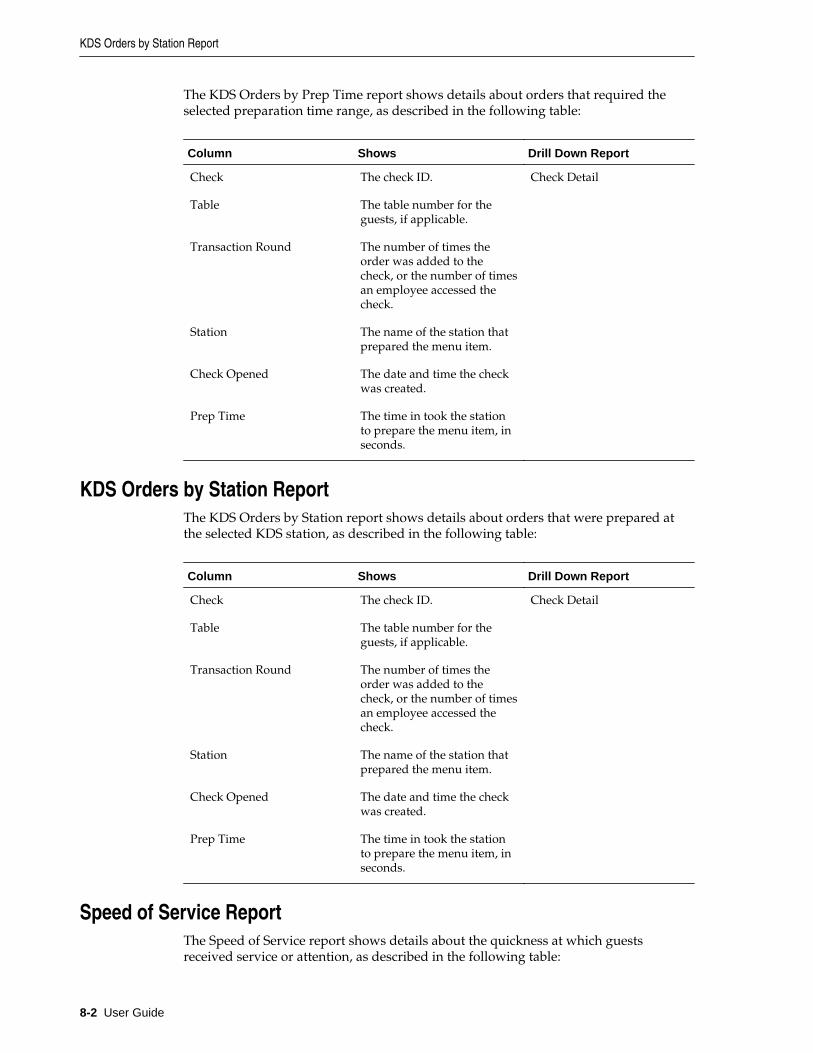
The KDS Orders by Prep Time report shows details about orders that required theselected preparation time range, as described in the following table:
Column Shows Drill Down Report
Check The check ID. Check Detail
Table The table number for theguests, if applicable.
Transaction Round The number of times theorder was added to thecheck, or the number of timesan employee accessed thecheck.
Station The name of the station thatprepared the menu item.
Check Opened The date and time the checkwas created.
Prep Time The time in took the stationto prepare the menu item, inseconds.
KDS Orders by Station ReportThe KDS Orders by Station report shows details about orders that were prepared atthe selected KDS station, as described in the following table:
Column Shows Drill Down Report
Check The check ID. Check Detail
Table The table number for theguests, if applicable.
Transaction Round The number of times theorder was added to thecheck, or the number of timesan employee accessed thecheck.
Station The name of the station thatprepared the menu item.
Check Opened The date and time the checkwas created.
Prep Time The time in took the stationto prepare the menu item, inseconds.
Speed of Service ReportThe Speed of Service report shows details about the quickness at which guestsreceived service or attention, as described in the following table:
KDS Orders by Station Report
8-2 User Guide
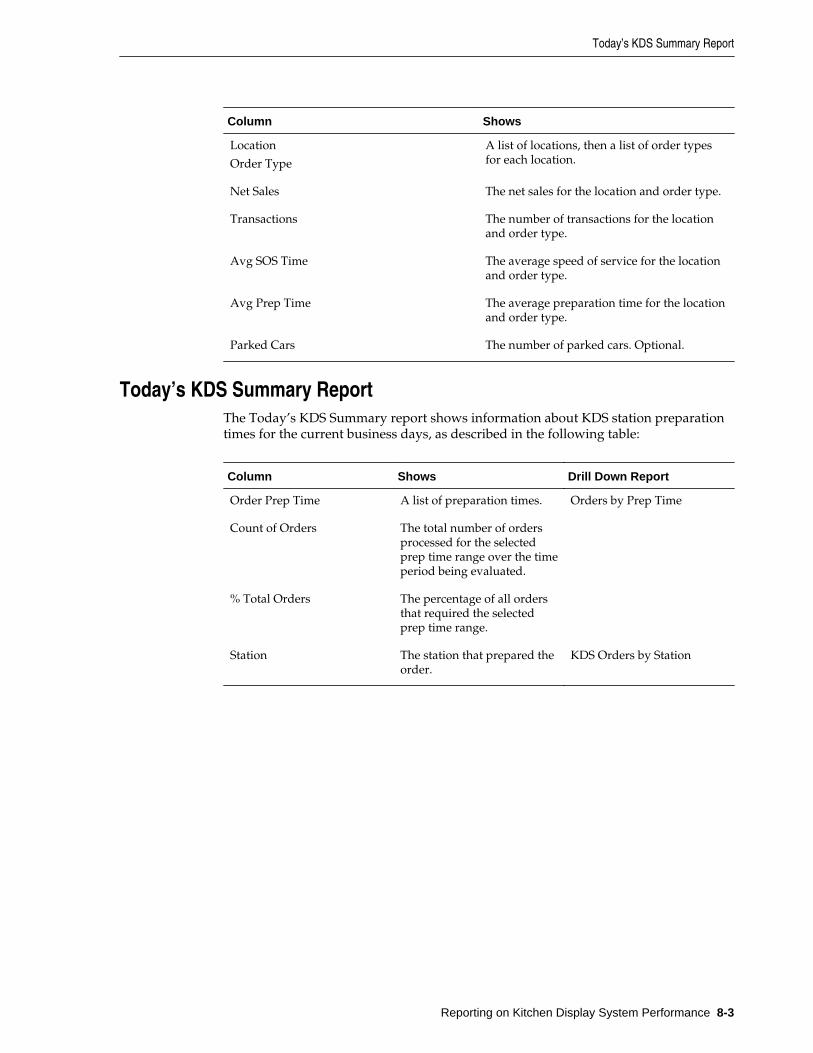
Column Shows
Location
Order Type
A list of locations, then a list of order typesfor each location.
Net Sales The net sales for the location and order type.
Transactions The number of transactions for the locationand order type.
Avg SOS Time The average speed of service for the locationand order type.
Avg Prep Time The average preparation time for the locationand order type.
Parked Cars The number of parked cars. Optional.
Today’s KDS Summary ReportThe Today’s KDS Summary report shows information about KDS station preparationtimes for the current business days, as described in the following table:
Column Shows Drill Down Report
Order Prep Time A list of preparation times. Orders by Prep Time
Count of Orders The total number of ordersprocessed for the selectedprep time range over the timeperiod being evaluated.
% Total Orders The percentage of all ordersthat required the selectedprep time range.
Station The station that prepared theorder.
KDS Orders by Station
Today’s KDS Summary Report
Reporting on Kitchen Display System Performance 8-3
Today’s KDS Summary Report
8-4 User Guide
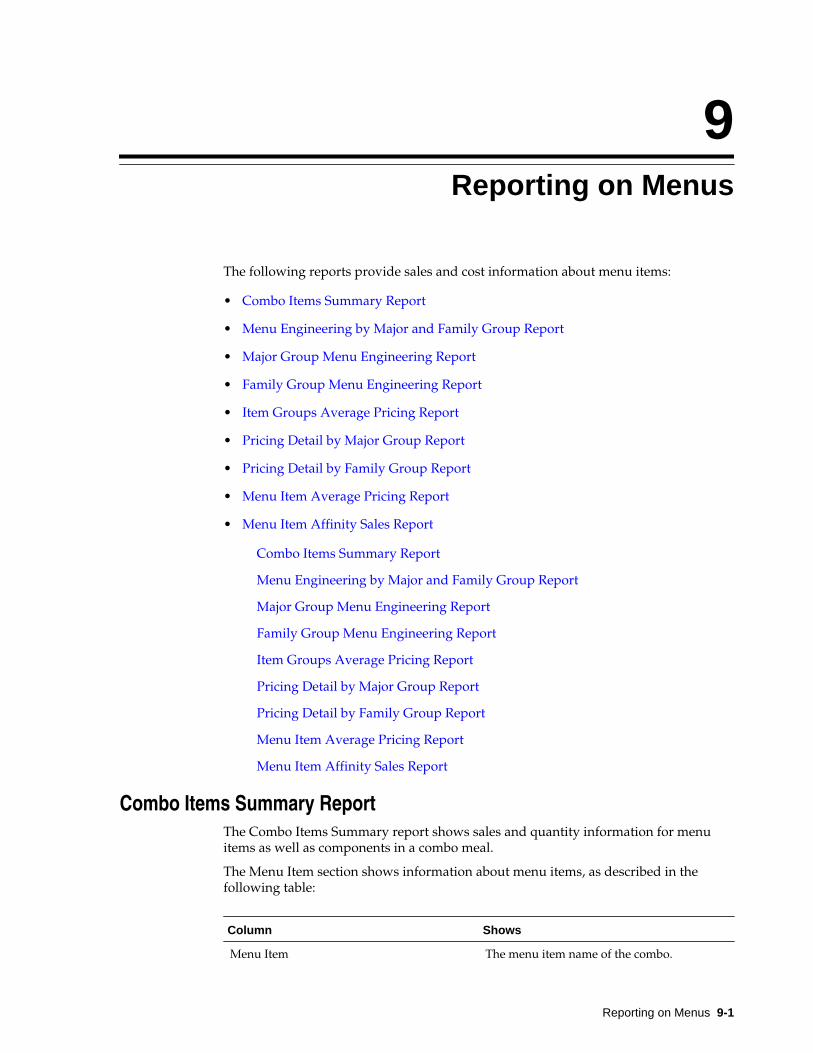
9Reporting on Menus
The following reports provide sales and cost information about menu items:
• Combo Items Summary Report
• Menu Engineering by Major and Family Group Report
• Major Group Menu Engineering Report
• Family Group Menu Engineering Report
• Item Groups Average Pricing Report
• Pricing Detail by Major Group Report
• Pricing Detail by Family Group Report
• Menu Item Average Pricing Report
• Menu Item Affinity Sales Report
Combo Items Summary Report
Menu Engineering by Major and Family Group Report
Major Group Menu Engineering Report
Family Group Menu Engineering Report
Item Groups Average Pricing Report
Pricing Detail by Major Group Report
Pricing Detail by Family Group Report
Menu Item Average Pricing Report
Menu Item Affinity Sales Report
Combo Items Summary ReportThe Combo Items Summary report shows sales and quantity information for menuitems as well as components in a combo meal.
The Menu Item section shows information about menu items, as described in thefollowing table:
Column Shows
Menu Item The menu item name of the combo.
Reporting on Menus 9-1

Column Shows
Net Sales The net sales for the combo.
% Net Sales The percentage of all combo menu item netsales attributed to the selected combo.
Qty Sold The total number of the combo sold.
% Qty Sold The percentage of the quantity of all combosales attributed to the selected combo.
Sales as Combo The total number of sales generated by thecombo.
% Net Sales The percentage of all combo sales attributedto the selected combo.
Qty as Combo The quantity of the menu item sold as acombo.
Qty A La Carte The quantity of the menu item sold a la carte.
% Qty as Combo The percentage of the menu item sales whereit was sold as a combo.
The Combo Item section shows information about the combo meals and details foreach component, as described in the following table:
Column Shows
Combo Meal
Component
The menu item name of the combo.
Combo Sales The total monetary value of sales created bythe combo.
% Net Sales The percentage of the net sales attributed tothe combo.
Combos Sold The total number of combo sales.
Menu Items Sold The total number of menu items sold.
% Items Sold The percentage of combo sales relative to allmenu items.
% Combo Component The percentage all menu item sales in whichthe menu item is a combo component.
Menu Engineering by Major and Family Group ReportThe Menu Engineering by Major and Family Group report shows individual itemrevenues and contribution margins as organized by major and family menu itemgroups, as described in the following table:
Menu Engineering by Major and Family Group Report
9-2 User Guide

Column Shows Drill Down Report
Item Group The name of the item group. Major Group MenuEngineering or Family GroupMenu Engineering
Qty Sold The total number of items inthe item group that weresold.
Gross Sales after Disc The gross sales after applyingdiscounts.
Prep Cost The total expenditure forpreparing menu itemsbelonging to the group.
Cost %
Margin Less Item Disc The net sales after applyingdiscounts.
% Qty
%Margin
You can also click Sales Detail by Menu Item to view the more detailed Sales Detailby Menu Item report, or click a listed day part to view information specific to the daypart on the Day Part Menu Engineering by Menu Item report.
Major Group Menu Engineering ReportThe Major Group Menu Engineering report shows individual menu item revenues andcontribution margins for a specific major item group, as described in the followingtable:
Column Shows
Menu Item Name A list of the menu items that belong to themajor group.
Qty Sold The total number of items sold.
Gross Sales after Disc The gross sales after applying discounts.
Prep Cost The total expenditure for preparing the menuitem.
Cost %
Margin Less Item Disc The net sales after applying discounts.
% Qty
%Margin
Family Group Menu Engineering Report
Major Group Menu Engineering Report
Reporting on Menus 9-3

The Family Group Menu Engineering report shows individual menu item revenuesand contribution margins for a specific family item group, as described in thefollowing table:
Column Shows
Menu Item Name A list of the menu items that belong to thefamily group.
Qty Sold The total number of items sold.
Gross Sales after Disc The gross sales after applying discounts.
Prep Cost The total expenditure for preparing the menuitem.
Cost %
Margin Less Item Disc The net sales after applying discounts.
% Qty
%Margin
Item Groups Average Pricing ReportThe Item Groups Average Pricing report shows the average prices for groups of stores,as described in the following table:
Column Shows Drill Down Report
Major Group
Family Group
A list of major groups, and alist of the family groups thatbelong to each major group.
Pricing Detail by MajorGroup
Pricing Detail by FamilyGroup Report
Avg Price The average price of items inthe selected group.
Menu Item Average PricingReport
Avg Cost The average cost of items inthe selected group.
Avg FC% The average food costpercentage in the selectedgroup.
Avg Margin The average margin earnedby the selected group.
Pricing Detail by Major Group ReportThe Pricing Detail by Major Group report shows price and cost information for menuitems sorted by major groups, as described in the following table:
Item Groups Average Pricing Report
9-4 User Guide

Column Shows
Menu Item A list of major groups, then a list of menuitems that belong to the major group.
POS Number The POS reference number.
Location The location selling the menu item.
Revenue Center The revenue centers at the location that sellthe menu item.
Level Name The menu level of the menu item.
Price Level The price level of the menu item.
Price The price of the menu item.
Cost The cost of the menu item.
Pricing Detail by Family Group ReportThe Pricing Detail by Family Group report shows price and cost information for menuitems sorted by family groups, as described in the following table:
Column Shows
Menu Item A list of family groups, then a list of menuitems that belong to the family group.
POS Number The ID number of the point of sales terminal.
Location The location selling the menu item.
Revenue Center The revenue centers at the location that sellthe menu item.
Level Name The menu level of the menu item.
Price Level The price level of the menu item.
Price The price of the menu item.
Cost The cost of the menu item.
Menu Item Average Pricing ReportThe Menu Item Averaging Pricing report shows average price and cost information formenu items.
The Family Group section shows information about family groups at variouslocations, as described in the following table:
Pricing Detail by Family Group Report
Reporting on Menus 9-5

Column Shows Drill Down Report
Family Group Avg ByLocation
A list of family groups, then alist locations selling items inthat family group.
Pricing Detail by FamilyGroup
Avg Price The average price of menuitems belonging to the familygroup at the selectedlocation.
Avg Cost The average cost of menuitems belonging to the familygroup at the selectedlocation.
Avg FC%
Avg Margin The average amount earnedfor each menu item sold thatbelongs to the family groupat the selected location.
The Menu Item section shows information about each menu item, as described in thefollowing table:
Column Shows Drill Down Report
Menu Item A list of menu items. Pricing Detail by Menu Item
Avg Price The average price of menuitems belonging to the familygroup at the selectedlocation.
Avg Cost The average cost of menuitems belonging to the familygroup at the selectedlocation.
Avg FC%
Avg Margin The average amount earnedfor each menu item sold thatbelongs to the family groupat the selected location.
Menu Item Affinity Sales ReportThe Menu Item Affinity Sales report shows the frequency at which items are soldtogether, as described in the following table:
Column Shows
Parent Item - All Checks
Affinity Items
A list of menu items, then a list of menu itemswith which the first menu item was sold.
Menu Item Affinity Sales Report
9-6 User Guide
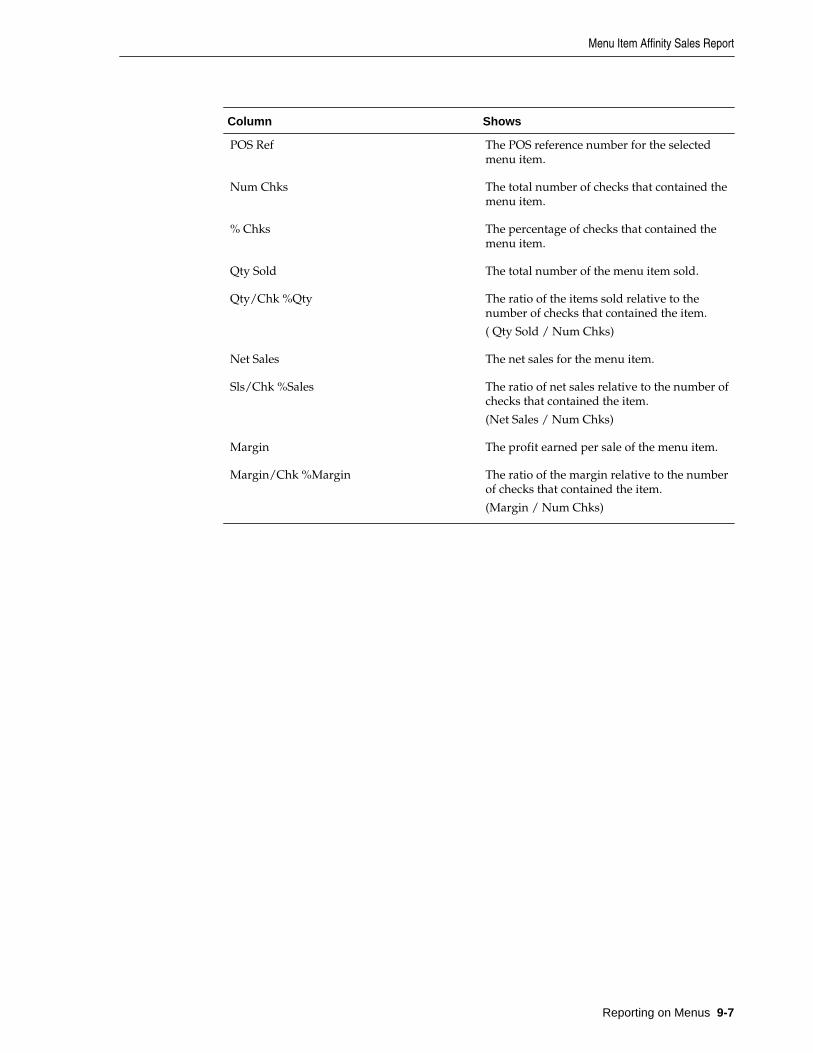
Column Shows
POS Ref The POS reference number for the selectedmenu item.
Num Chks The total number of checks that contained themenu item.
% Chks The percentage of checks that contained themenu item.
Qty Sold The total number of the menu item sold.
Qty/Chk %Qty The ratio of the items sold relative to thenumber of checks that contained the item.
( Qty Sold / Num Chks)
Net Sales The net sales for the menu item.
Sls/Chk %Sales The ratio of net sales relative to the number ofchecks that contained the item.
(Net Sales / Num Chks)
Margin The profit earned per sale of the menu item.
Margin/Chk %Margin The ratio of the margin relative to the numberof checks that contained the item.
(Margin / Num Chks)
Menu Item Affinity Sales Report
Reporting on Menus 9-7

Menu Item Affinity Sales Report
9-8 User Guide

10Reporting on Menu Item Alignment
The following reports provide information on menu item alignment:
• Definitions Alignment Report
• Major and Family Group Alignment Report
• Menu Item Alignment Major Group Masters Report
• Menu Item Alignment Family Group Masters Report
• Menu Item Alignment Report
• Unaligned Definitions Report
• Unaligned Item Groups Report
• Unaligned Menu Items Report
Definitions Alignment Report
Major and Family Group Alignment Report
Menu Item Alignment Major Group Masters Report
Menu Item Alignment Family Group Masters Report
Menu Item Alignment Report
Unaligned Definitions Report
Unaligned Item Groups Report
Unaligned Menu Items Report
Definitions Alignment ReportYou can create definitions, or specific instances, of the following item types inReporting and Analytics:
• Revenue Centers
• Order Types
• Discounts
• Service Charges
• Taxes
• Tenders
Reporting on Menu Item Alignment 10-1

• Labor Categories
• Job Codes
• Activities
You can then align a definition to inherit the properties of a master item. For example,if you create a master revenue center named Restaurant. You can then create adefinition, or instance, of a restaurant revenue center in multiple locations. The reportthen shows all revenue center definitions under the master Restaurant revenuecenter.
The Definitions Alignment report shows the alignment information for definitions asdescribed in the following table:
Column Shows
Item Type The name of the item type. For example,Service Charges.
Master Name A list of master items defined for the itemtype. For example, Charge Tip and GCSale.
Master POS Number The POS reference number for the masteritem.
Item Type Name The master item name for the location. Forexample, if an Alabama location uses theCharge Tip Service Charge, this columnvalue is Charge Tip and the entry is listedunder the Charge Tip master item.
POS Number The POS reference number for the location.This field typically aligns with the MasterPOS Number for the master item thatmatches with the Item Type Name column.
Location The name of the location.
Major and Family Group Alignment ReportThe Major and Family Group Alignment report shows the alignment information fordefinitions of menu items sorted by major and family groups, as described in thefollowing table:
Column Shows
Item Type The name of the item type. For example,Service Charges.
Master Name A list of master items defined for the itemtype. For example, Charge Tip and GCSale.
Master POS Number The POS reference number for the masteritem.
Major and Family Group Alignment Report
10-2 User Guide
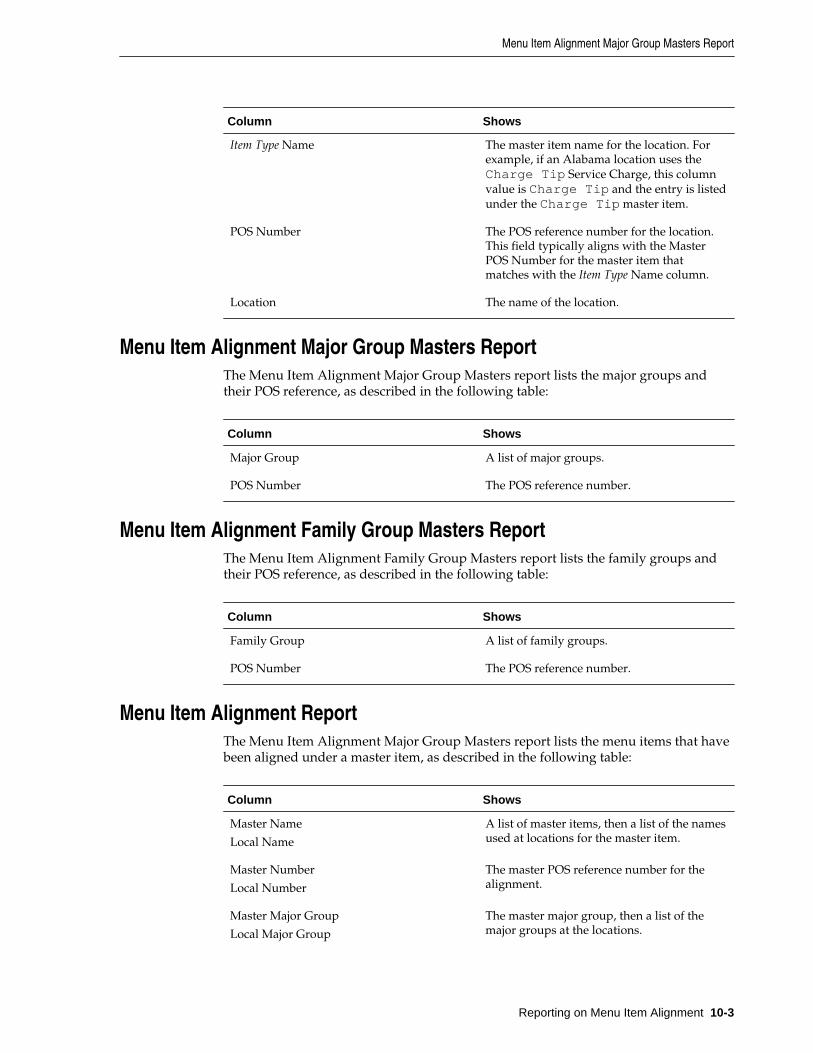
Column Shows
Item Type Name The master item name for the location. Forexample, if an Alabama location uses theCharge Tip Service Charge, this columnvalue is Charge Tip and the entry is listedunder the Charge Tip master item.
POS Number The POS reference number for the location.This field typically aligns with the MasterPOS Number for the master item thatmatches with the Item Type Name column.
Location The name of the location.
Menu Item Alignment Major Group Masters ReportThe Menu Item Alignment Major Group Masters report lists the major groups andtheir POS reference, as described in the following table:
Column Shows
Major Group A list of major groups.
POS Number The POS reference number.
Menu Item Alignment Family Group Masters ReportThe Menu Item Alignment Family Group Masters report lists the family groups andtheir POS reference, as described in the following table:
Column Shows
Family Group A list of family groups.
POS Number The POS reference number.
Menu Item Alignment ReportThe Menu Item Alignment Major Group Masters report lists the menu items that havebeen aligned under a master item, as described in the following table:
Column Shows
Master Name
Local Name
A list of master items, then a list of the namesused at locations for the master item.
Master Number
Local Number
The master POS reference number for thealignment.
Master Major Group
Local Major Group
The master major group, then a list of themajor groups at the locations.
Menu Item Alignment Major Group Masters Report
Reporting on Menu Item Alignment 10-3

Column Shows
Master Family Group
Local Family Group
The master family group, then a list of thefamily groups at the locations.
Level Name The level name.
Location The locations at which the alignments takeeffect.
Unaligned Definitions ReportThe Unaligned Definitions report shows definitions that are not aligned with masteritem, as described in the following table:
Column Shows
Item Type The name of the item type. For example,Service Charges.
Master Name A list of master items defined for the itemtype. For example, Charge Tip and GCSale.
Master POS Number The POS reference number for the masteritem.
Item Type Name The master item name for the location.
POS Number The POS reference number for the location.
Location The name of the location.
Unaligned Item Groups ReportThe Unaligned Item Groups report lists the major and family groups that are notaligned, as described in the following table:
Column Shows
Major Group Name
Family Group Name
A list of major groups or family groupsdepending on the section of the report.
All items are listed as temporary because themajor and family groups have not beenidentified.
Master Name The name of the master item.
Master names are listed as temporary becausethey have not been identified.
POS Number The POS reference number.
Location The location of the group.
Unaligned Definitions Report
10-4 User Guide

Unaligned Menu Items ReportThe Unaligned Menu Items report lists the menu items that are not aligned, asdescribed in the following table:
Column Shows
Menu Item Name A list of menu items.
Master Name The name of the master item.
POS Number The POS reference number.
Location The location of the group.
Unaligned Menu Items Report
Reporting on Menu Item Alignment 10-5

Unaligned Menu Items Report
10-6 User Guide

11Reporting on System Administration
The following reports provide information for Enterprise Back Office administrators:
• Daily Checklist Report
• Revenue Center Sales Comparison: Transactions vs. Daily Report
• Employee Sales Comparison: Transaction vs. Daily Report
• Menu Item Sales Comparison: Transaction vs. Daily Report
• Daily Exceptions List Report
• The Download Report does not work due to security requirements.
• EMS Batch Status Report
• Posting Exceptions Report
• Labor Runtime Error Log Report
• Last Posting Report
• Portal Log-on Report
• Portal Log-on Report Detail Report
• Portal Server Runtime Errors Report
• Posting Server Runtime Errors Report
• Posting Report
• Posting Date Detail Report
• Business Date Posting Detail Report
• VAT Comparison Report
• VAT Report Menu Item Report
• VAT Report MenuItem FixedPeriods Report
• VAT Report Tax Report
Daily Checklist Report
Revenue Center Sales Comparison: Transactions vs. Daily Report
Employee Sales Comparison: Transaction vs. Daily Report
Reporting on System Administration 11-1
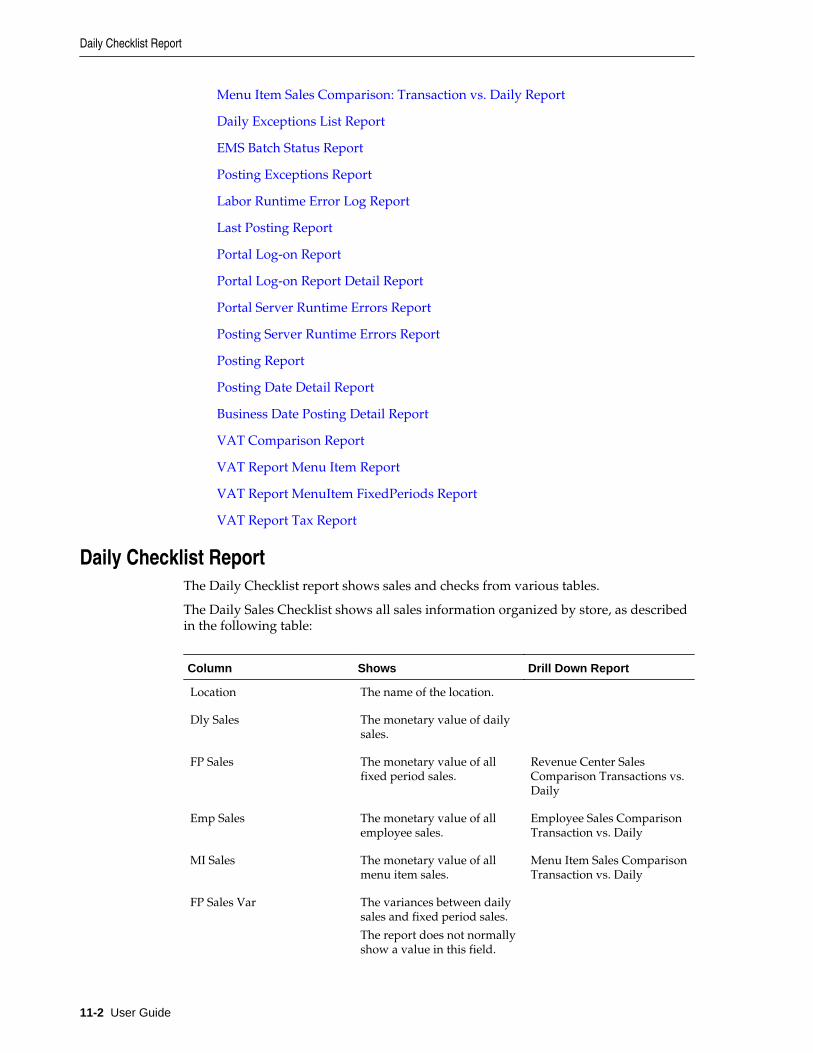
Menu Item Sales Comparison: Transaction vs. Daily Report
Daily Exceptions List Report
EMS Batch Status Report
Posting Exceptions Report
Labor Runtime Error Log Report
Last Posting Report
Portal Log-on Report
Portal Log-on Report Detail Report
Portal Server Runtime Errors Report
Posting Server Runtime Errors Report
Posting Report
Posting Date Detail Report
Business Date Posting Detail Report
VAT Comparison Report
VAT Report Menu Item Report
VAT Report MenuItem FixedPeriods Report
VAT Report Tax Report
Daily Checklist ReportThe Daily Checklist report shows sales and checks from various tables.
The Daily Sales Checklist shows all sales information organized by store, as describedin the following table:
Column Shows Drill Down Report
Location The name of the location.
Dly Sales The monetary value of dailysales.
FP Sales The monetary value of allfixed period sales.
Revenue Center SalesComparison Transactions vs.Daily
Emp Sales The monetary value of allemployee sales.
Employee Sales ComparisonTransaction vs. Daily
MI Sales The monetary value of allmenu item sales.
Menu Item Sales ComparisonTransaction vs. Daily
FP Sales Var The variances between dailysales and fixed period sales.
The report does not normallyshow a value in this field.
Daily Checklist Report
11-2 User Guide
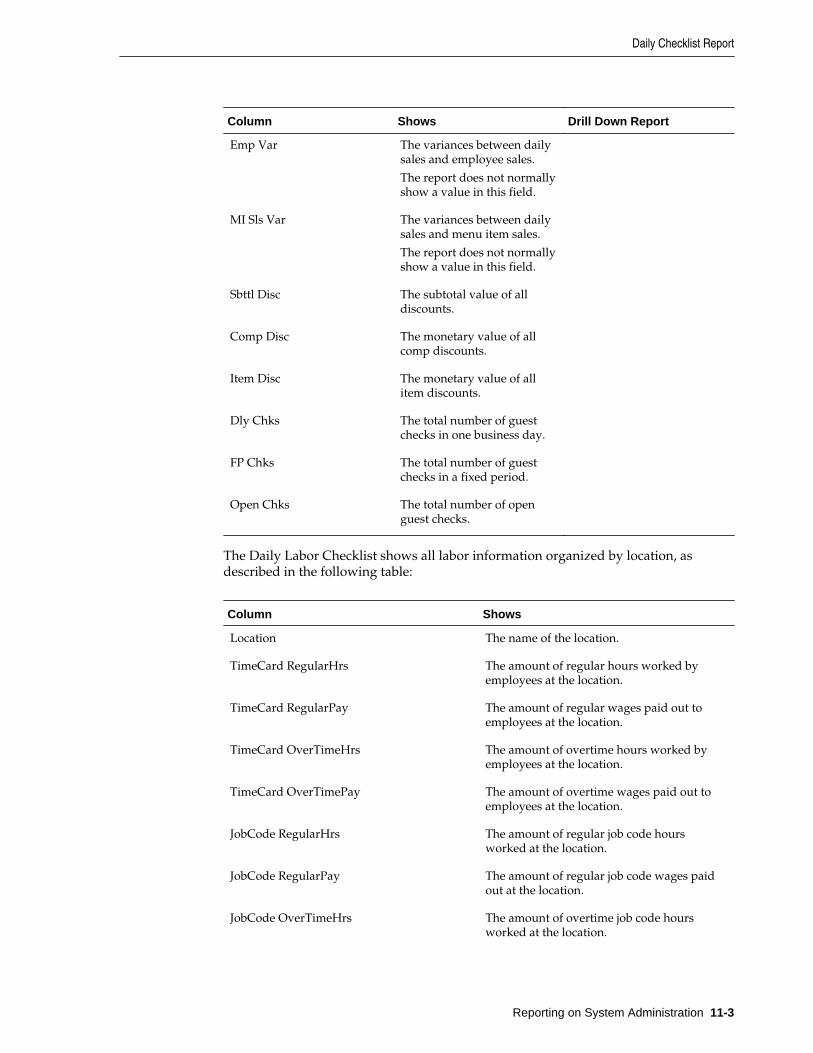
Column Shows Drill Down Report
Emp Var The variances between dailysales and employee sales.
The report does not normallyshow a value in this field.
MI Sls Var The variances between dailysales and menu item sales.
The report does not normallyshow a value in this field.
Sbttl Disc The subtotal value of alldiscounts.
Comp Disc The monetary value of allcomp discounts.
Item Disc The monetary value of allitem discounts.
Dly Chks The total number of guestchecks in one business day.
FP Chks The total number of guestchecks in a fixed period.
Open Chks The total number of openguest checks.
The Daily Labor Checklist shows all labor information organized by location, asdescribed in the following table:
Column Shows
Location The name of the location.
TimeCard RegularHrs The amount of regular hours worked byemployees at the location.
TimeCard RegularPay The amount of regular wages paid out toemployees at the location.
TimeCard OverTimeHrs The amount of overtime hours worked byemployees at the location.
TimeCard OverTimePay The amount of overtime wages paid out toemployees at the location.
JobCode RegularHrs The amount of regular job code hoursworked at the location.
JobCode RegularPay The amount of regular job code wages paidout at the location.
JobCode OverTimeHrs The amount of overtime job code hoursworked at the location.
Daily Checklist Report
Reporting on System Administration 11-3
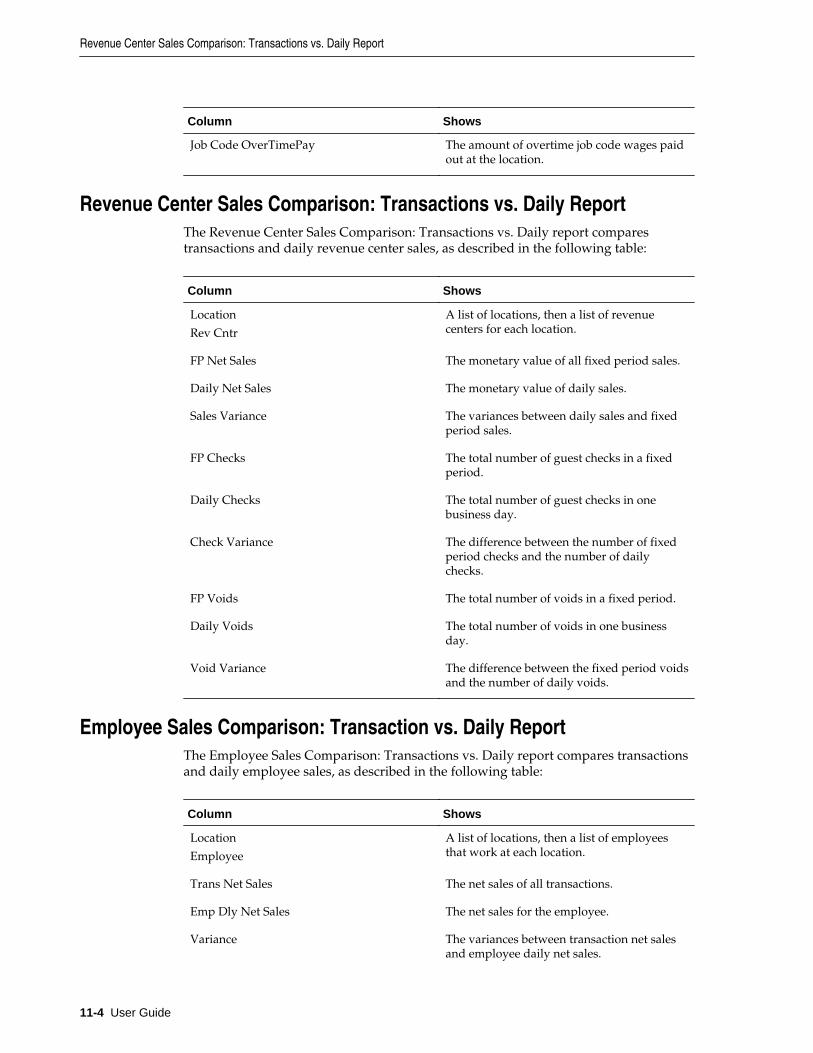
Column Shows
Job Code OverTimePay The amount of overtime job code wages paidout at the location.
Revenue Center Sales Comparison: Transactions vs. Daily ReportThe Revenue Center Sales Comparison: Transactions vs. Daily report comparestransactions and daily revenue center sales, as described in the following table:
Column Shows
Location
Rev Cntr
A list of locations, then a list of revenuecenters for each location.
FP Net Sales The monetary value of all fixed period sales.
Daily Net Sales The monetary value of daily sales.
Sales Variance The variances between daily sales and fixedperiod sales.
FP Checks The total number of guest checks in a fixedperiod.
Daily Checks The total number of guest checks in onebusiness day.
Check Variance The difference between the number of fixedperiod checks and the number of dailychecks.
FP Voids The total number of voids in a fixed period.
Daily Voids The total number of voids in one businessday.
Void Variance The difference between the fixed period voidsand the number of daily voids.
Employee Sales Comparison: Transaction vs. Daily ReportThe Employee Sales Comparison: Transactions vs. Daily report compares transactionsand daily employee sales, as described in the following table:
Column Shows
Location
Employee
A list of locations, then a list of employeesthat work at each location.
Trans Net Sales The net sales of all transactions.
Emp Dly Net Sales The net sales for the employee.
Variance The variances between transaction net salesand employee daily net sales.
Revenue Center Sales Comparison: Transactions vs. Daily Report
11-4 User Guide
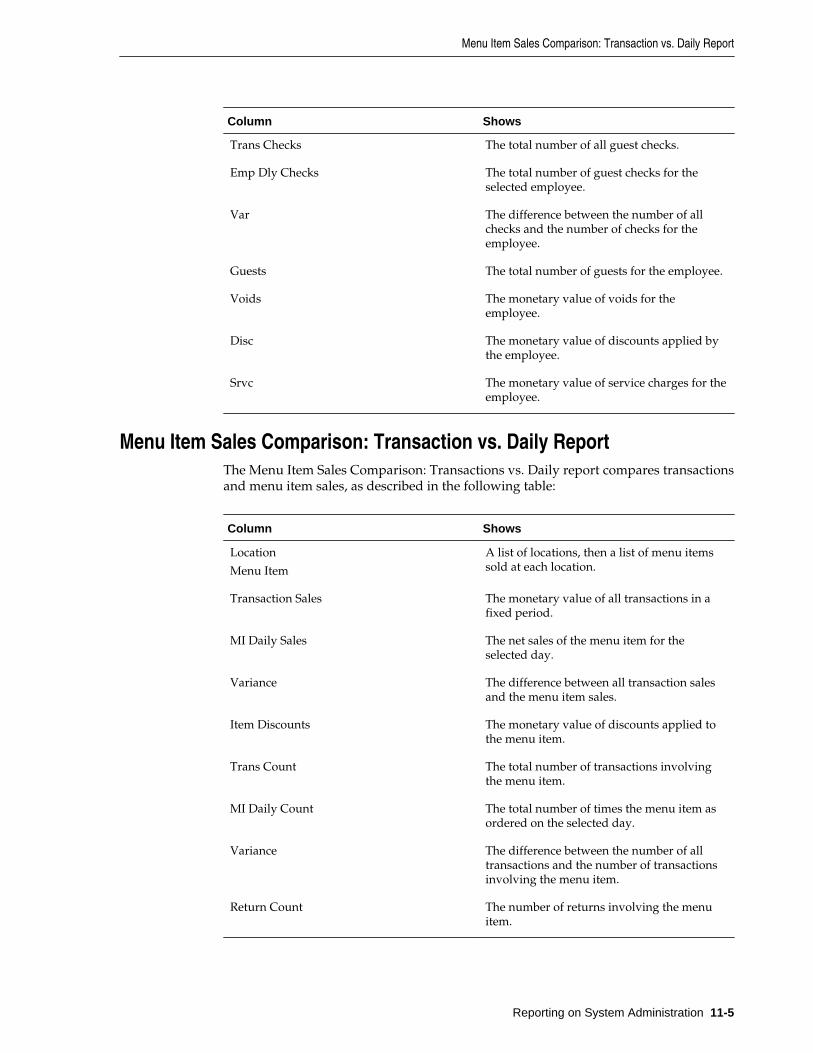
Column Shows
Trans Checks The total number of all guest checks.
Emp Dly Checks The total number of guest checks for theselected employee.
Var The difference between the number of allchecks and the number of checks for theemployee.
Guests The total number of guests for the employee.
Voids The monetary value of voids for theemployee.
Disc The monetary value of discounts applied bythe employee.
Srvc The monetary value of service charges for theemployee.
Menu Item Sales Comparison: Transaction vs. Daily ReportThe Menu Item Sales Comparison: Transactions vs. Daily report compares transactionsand menu item sales, as described in the following table:
Column Shows
Location
Menu Item
A list of locations, then a list of menu itemssold at each location.
Transaction Sales The monetary value of all transactions in afixed period.
MI Daily Sales The net sales of the menu item for theselected day.
Variance The difference between all transaction salesand the menu item sales.
Item Discounts The monetary value of discounts applied tothe menu item.
Trans Count The total number of transactions involvingthe menu item.
MI Daily Count The total number of times the menu item asordered on the selected day.
Variance The difference between the number of alltransactions and the number of transactionsinvolving the menu item.
Return Count The number of returns involving the menuitem.
Menu Item Sales Comparison: Transaction vs. Daily Report
Reporting on System Administration 11-5

Daily Exceptions List ReportThe Daily Exceptions List report shows the errors and exceptions that occurred at anorganization, as described in the following table:
Column Shows
Location The location at which the exception occurred.
Business Date The business day on which the exceptionoccurred.
Dly sales The daily sales for the business day.
FP Sales The fixed period sales for the location.
FP Sls Var The variance between the fixed period salesad the daily sales at the location.
Dly Chks The daily checks at the location.
FP Chks The fixed period checks at the location.
EMS Batch Status ReportThe EMS Batch Status report shows the processing status of Enterprise ManagementSystem (EMS) batch reports, as described in the following table:
Shows Column
The batch creation date. Created Date
The batch processing status. Status
The batch name. Name
The batch publishing date. Published Date
The batch owner. Owner
The remote message to be displayed for thebatch.
Remote Message
Posting Exceptions ReportThe Posting Exceptions report shows the following data posting exceptions and errormessages for the portal:
• SEV_WARNING
• SEV_DATAINCONSISTENT
• SEV_MISSINGRESULTSET
• SEV_ROWNOTFOUND
• SEV_ERROR
Daily Exceptions List Report
11-6 User Guide
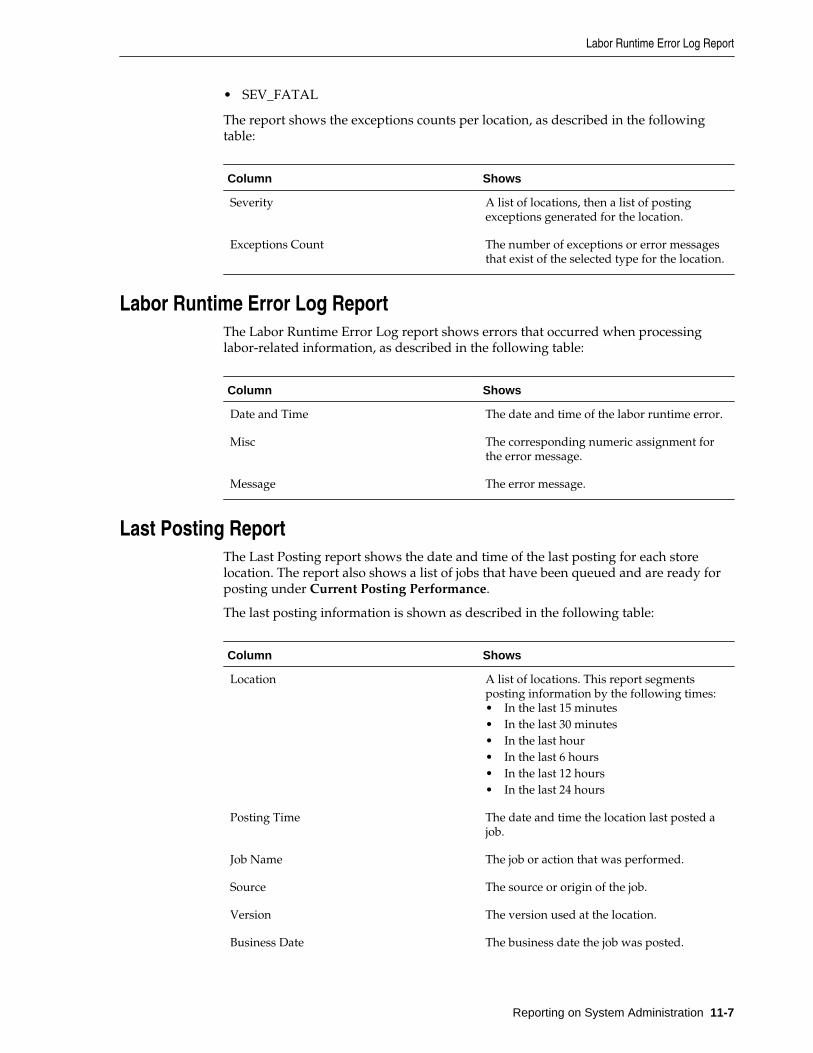
• SEV_FATAL
The report shows the exceptions counts per location, as described in the followingtable:
Column Shows
Severity A list of locations, then a list of postingexceptions generated for the location.
Exceptions Count The number of exceptions or error messagesthat exist of the selected type for the location.
Labor Runtime Error Log ReportThe Labor Runtime Error Log report shows errors that occurred when processinglabor-related information, as described in the following table:
Column Shows
Date and Time The date and time of the labor runtime error.
Misc The corresponding numeric assignment forthe error message.
Message The error message.
Last Posting ReportThe Last Posting report shows the date and time of the last posting for each storelocation. The report also shows a list of jobs that have been queued and are ready forposting under Current Posting Performance.
The last posting information is shown as described in the following table:
Column Shows
Location A list of locations. This report segmentsposting information by the following times:• In the last 15 minutes• In the last 30 minutes• In the last hour• In the last 6 hours• In the last 12 hours• In the last 24 hours
Posting Time The date and time the location last posted ajob.
Job Name The job or action that was performed.
Source The source or origin of the job.
Version The version used at the location.
Business Date The business date the job was posted.
Labor Runtime Error Log Report
Reporting on System Administration 11-7
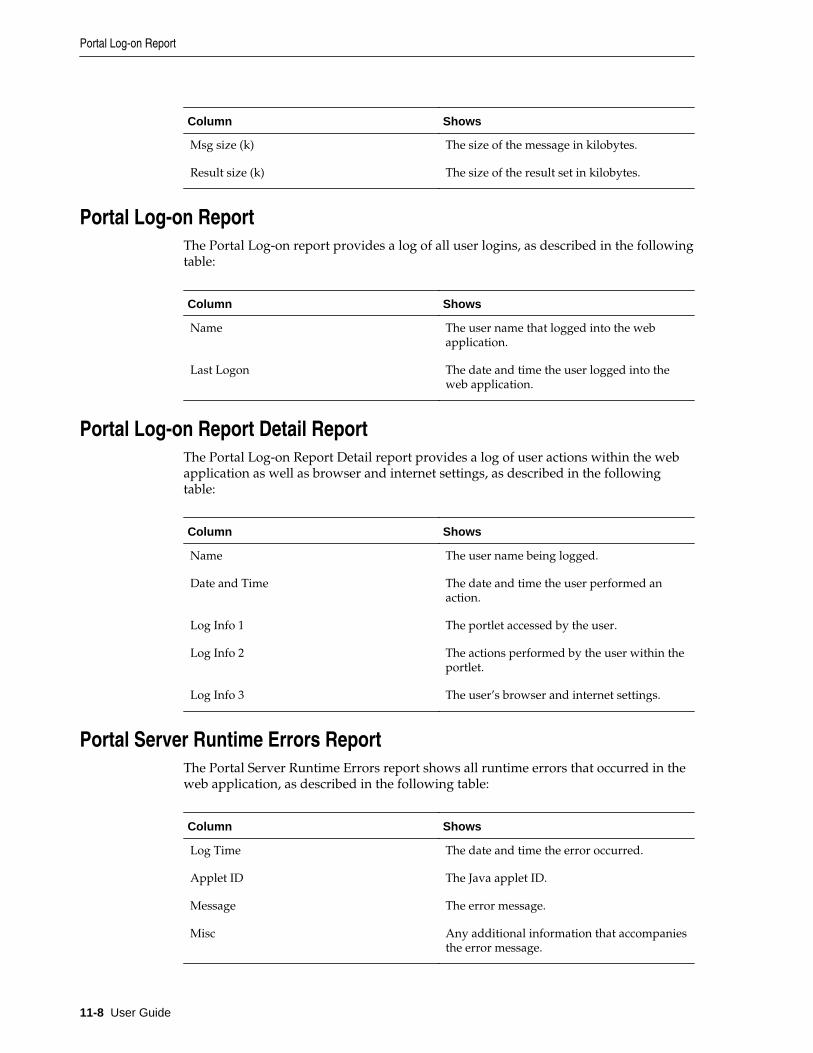
Column Shows
Msg size (k) The size of the message in kilobytes.
Result size (k) The size of the result set in kilobytes.
Portal Log-on ReportThe Portal Log-on report provides a log of all user logins, as described in the followingtable:
Column Shows
Name The user name that logged into the webapplication.
Last Logon The date and time the user logged into theweb application.
Portal Log-on Report Detail ReportThe Portal Log-on Report Detail report provides a log of user actions within the webapplication as well as browser and internet settings, as described in the followingtable:
Column Shows
Name The user name being logged.
Date and Time The date and time the user performed anaction.
Log Info 1 The portlet accessed by the user.
Log Info 2 The actions performed by the user within theportlet.
Log Info 3 The user’s browser and internet settings.
Portal Server Runtime Errors ReportThe Portal Server Runtime Errors report shows all runtime errors that occurred in theweb application, as described in the following table:
Column Shows
Log Time The date and time the error occurred.
Applet ID The Java applet ID.
Message The error message.
Misc Any additional information that accompaniesthe error message.
Portal Log-on Report
11-8 User Guide

Posting Server Runtime Errors ReportThe Posting Server Runtime Errors report shows all runtime errors that occurred whenposting information to reports, as described in the following table:
Column Shows
Log Time The date and time the error occurred.
Applet ID The Java applet ID.
Message The error message.
Misc Any additional information that accompaniesthe error message.
Posting ReportThe Posting report shows information regarding all data postings and compression ofmessages.
The Posting Date section shows aggregate posting information by date, as described inthe following table:
Column Shows Drill Down Report
Posting Date A list of business days inwhich posting occurred.
Posting Date Detail
Posting Start The starting date and timerange for the informationposted on the report.
Posting End The ending date and timerange for the informationposted on the report.
Count of Msg The number of messagesposted.
Msg Size (k) The size of the messages inkilobytes.
Result Size (k) The size of the result set inkilobytes.
Compress % The percentage of the sizecompressed.
The Business Date section shows posting information organized by location and date,as described in the following table:
Posting Server Runtime Errors Report
Reporting on System Administration 11-9
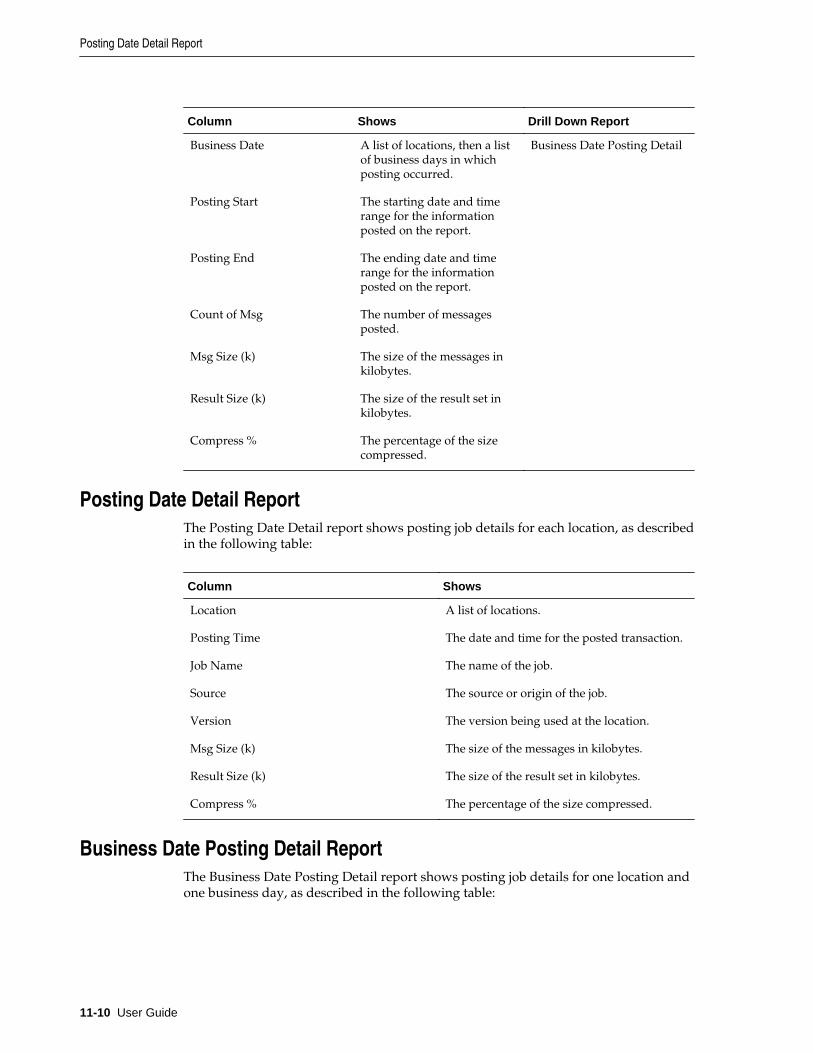
Column Shows Drill Down Report
Business Date A list of locations, then a listof business days in whichposting occurred.
Business Date Posting Detail
Posting Start The starting date and timerange for the informationposted on the report.
Posting End The ending date and timerange for the informationposted on the report.
Count of Msg The number of messagesposted.
Msg Size (k) The size of the messages inkilobytes.
Result Size (k) The size of the result set inkilobytes.
Compress % The percentage of the sizecompressed.
Posting Date Detail ReportThe Posting Date Detail report shows posting job details for each location, as describedin the following table:
Column Shows
Location A list of locations.
Posting Time The date and time for the posted transaction.
Job Name The name of the job.
Source The source or origin of the job.
Version The version being used at the location.
Msg Size (k) The size of the messages in kilobytes.
Result Size (k) The size of the result set in kilobytes.
Compress % The percentage of the size compressed.
Business Date Posting Detail ReportThe Business Date Posting Detail report shows posting job details for one location andone business day, as described in the following table:
Posting Date Detail Report
11-10 User Guide

Column Shows
Location The selected location.
Posting Time The selected business day, and the times witha posted transaction.
Job Name The name of the job.
Source The source or origin of the job.
Version The version being used at the location.
Msg Size (k) The size of the messages in kilobytes.
Result Size (k) The size of the result set in kilobytes.
Compress % The percentage of the size compressed.
VAT Comparison ReportThe VAT Comparison report compares Value Added Tax (VAT) information forlocations and for the organization.
The Tax Summed section shows aggregate VAT information by tax and menu items,as described in the following table:
Column Shows
Tax Total The tax total for all taxes, then the tax total foreach tax type.
Tax Name A list of taxes.
Taxable Sales The total of all taxable sales, then the taxablesales for each tax type.
Taxexemption Sales The total of all tax-exempt sales, then the tax-exempt sales for each tax type.
SalesNetVat All sales after including VAT, then all salesafter including VAT for each tax type.
Menu Item FP Summed
Menu Item Daily Total Summed
The Menu Item FP Summed row shows totalsfor menu item sales in a fixed period.
The Menu Item daily Total Summed rowshows totals for menu item sales in a businessday.
Item VAT + Disc VAT The sum of the Item VAT and the DiscountVAT.
Item VAT The total value of menu item VAT.
Disc VAT The total value of discounts affected by VAT.
Discount Total The total value of discounts.
VAT Comparison Report
Reporting on System Administration 11-11
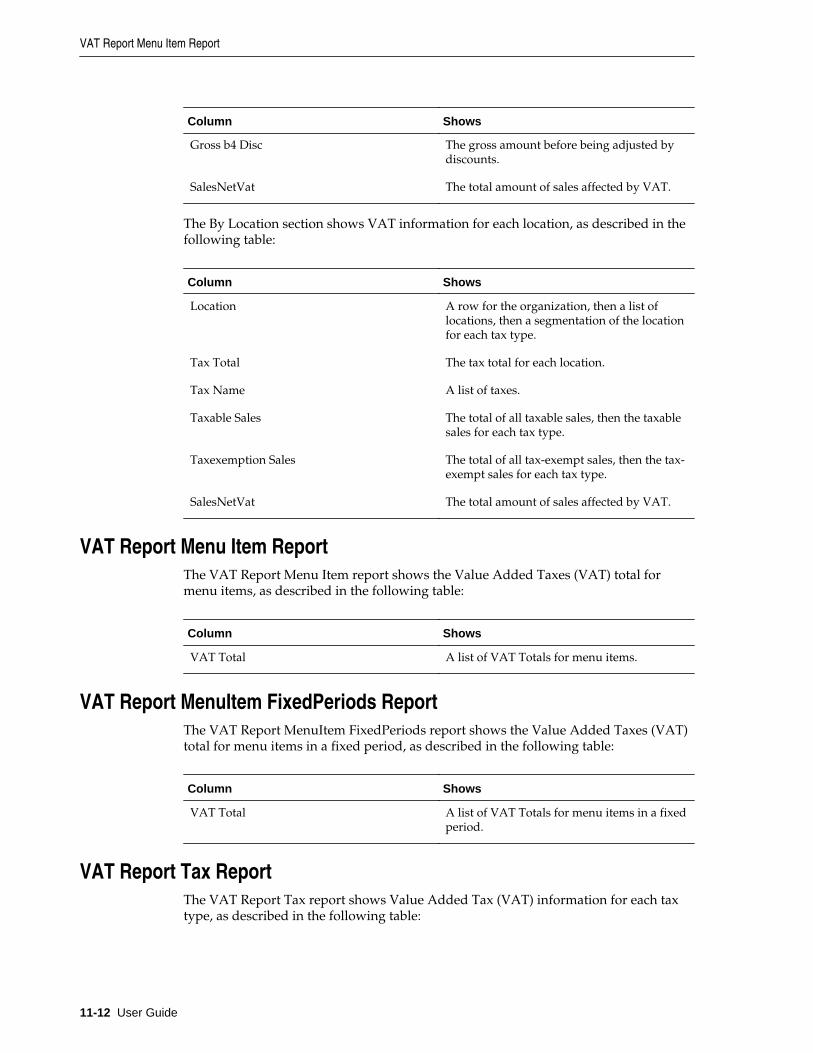
Column Shows
Gross b4 Disc The gross amount before being adjusted bydiscounts.
SalesNetVat The total amount of sales affected by VAT.
The By Location section shows VAT information for each location, as described in thefollowing table:
Column Shows
Location A row for the organization, then a list oflocations, then a segmentation of the locationfor each tax type.
Tax Total The tax total for each location.
Tax Name A list of taxes.
Taxable Sales The total of all taxable sales, then the taxablesales for each tax type.
Taxexemption Sales The total of all tax-exempt sales, then the tax-exempt sales for each tax type.
SalesNetVat The total amount of sales affected by VAT.
VAT Report Menu Item ReportThe VAT Report Menu Item report shows the Value Added Taxes (VAT) total formenu items, as described in the following table:
Column Shows
VAT Total A list of VAT Totals for menu items.
VAT Report MenuItem FixedPeriods ReportThe VAT Report MenuItem FixedPeriods report shows the Value Added Taxes (VAT)total for menu items in a fixed period, as described in the following table:
Column Shows
VAT Total A list of VAT Totals for menu items in a fixedperiod.
VAT Report Tax ReportThe VAT Report Tax report shows Value Added Tax (VAT) information for each taxtype, as described in the following table:
VAT Report Menu Item Report
11-12 User Guide
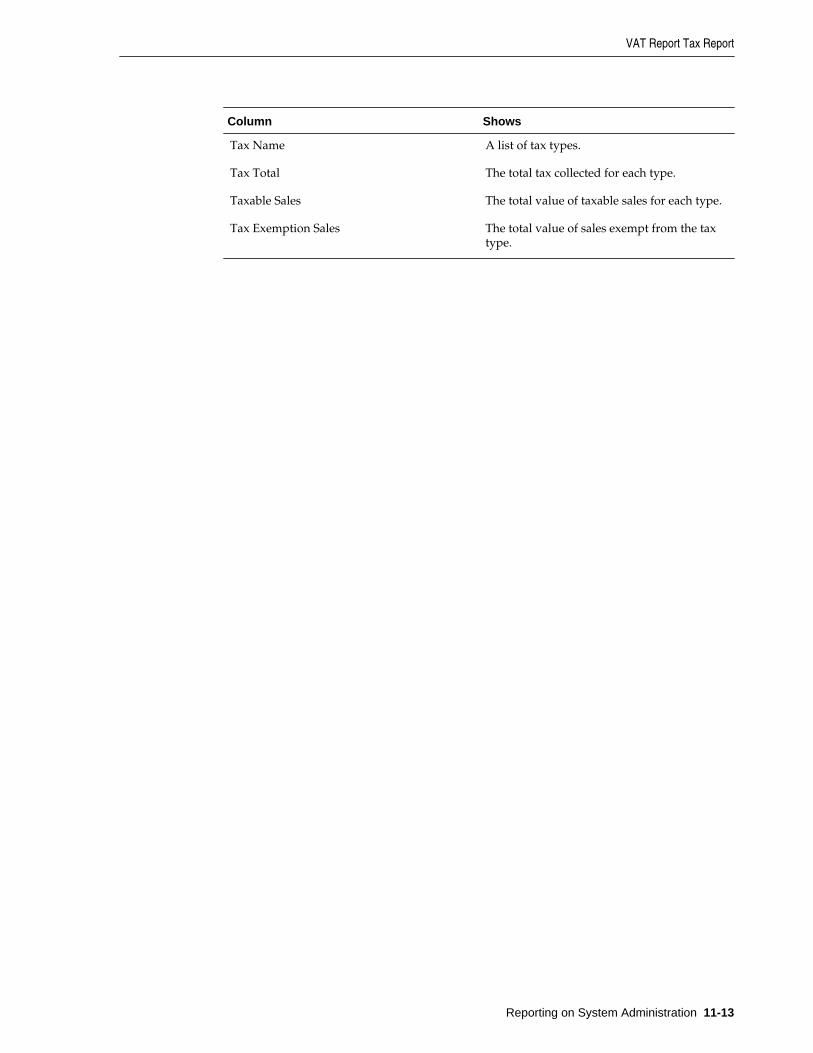
Column Shows
Tax Name A list of tax types.
Tax Total The total tax collected for each type.
Taxable Sales The total value of taxable sales for each type.
Tax Exemption Sales The total value of sales exempt from the taxtype.
VAT Report Tax Report
Reporting on System Administration 11-13
VAT Report Tax Report
11-14 User Guide
12Reporting on Import and Export
The following report provides information on imports and exports established by theorganization:
• Import Export Log Report
Import Export Log Report
Import Export Log ReportThe Import Export Log report shows information regarding import and exporttransactions, as described in the following table:
Column Shows
Location The location executing the transaction.
Bus Date The business date of the transaction.
Name The name of the transaction.
Exec Date The execution date of the transaction.
Type The transaction type.
Stat The transaction status.
Description A status description.
Man. Init Whether the transaction was startedmanually or automatically:• Yes: manual start• No: automatic start
FileName The name of the transaction file.
Destination The e-mail address for the transaction.
Reporting on Import and Export 12-1
Import Export Log Report
12-2 User Guide

13Reporting on Cash Management
The following reports provide information on the location, flow, and activity of cash inthe restaurant:
• Safes Report
• Till Report
• Bank Deposit Report
• Count Adjustments Report
• Starting Amount Adjustments Report
• Over/Short Report
• Paid-In/Paid-Out Report
• Server Bank Report
• Bank Deposit Adjustments Report
• Petty Cash Report
• Cash Management Activity Report
Safes Report
Till Report
Bank Deposit Report
Count Adjustments Report
Starting Amount Adjustments Report
Over/Short Report
Paid-In/Paid-Out Report
Server Bank Report
Bank Deposit Adjustments Report
Petty Cash Report
Cash Management Activity Report
Safes Report
Reporting on Cash Management 13-1

The Safes Report shows an overview of the safe receptacles and their activities for thebusiness date that you select. You can use this report to determine the current cashvalue of any money regardless of the defined currency within the safe.
Column Shows Drill Down Report
Location The location name.
Revenue Center The revenue center name.
Safe Name The names of the safereceptacles belonging to therevenue center.
Session The session ID. Cash Management ActivityReport
Status The session status:• Open• Closed
Currency The currency type.
Deposited The total amount deposited. Deposit Activity Report
Balance The total amount remainingin the safe at the end of thebusiness day.
Till ReportThe Till Report shows an overview of the till sessions and their activities for thebusiness date that you select. You can use this report to determine the value of anyactivity that took place within the till session regardless of the defined currency.
Column Shows Drill Down Report
Location The location name. Cash Management ActivityReport
Revenue Center The revenue center name. Cash Management ActivityReport
Till Name The names of the tillsbelonging to the revenuecenter.
Cash Management ActivityReport
Status The session status:• Open• Closed
Cash Management ActivityReport
Session The session ID.
Workstation/Drawer The workstation and drawerIDs, then the date, open time,and close time of the tillsession.
Till Report
13-2 User Guide
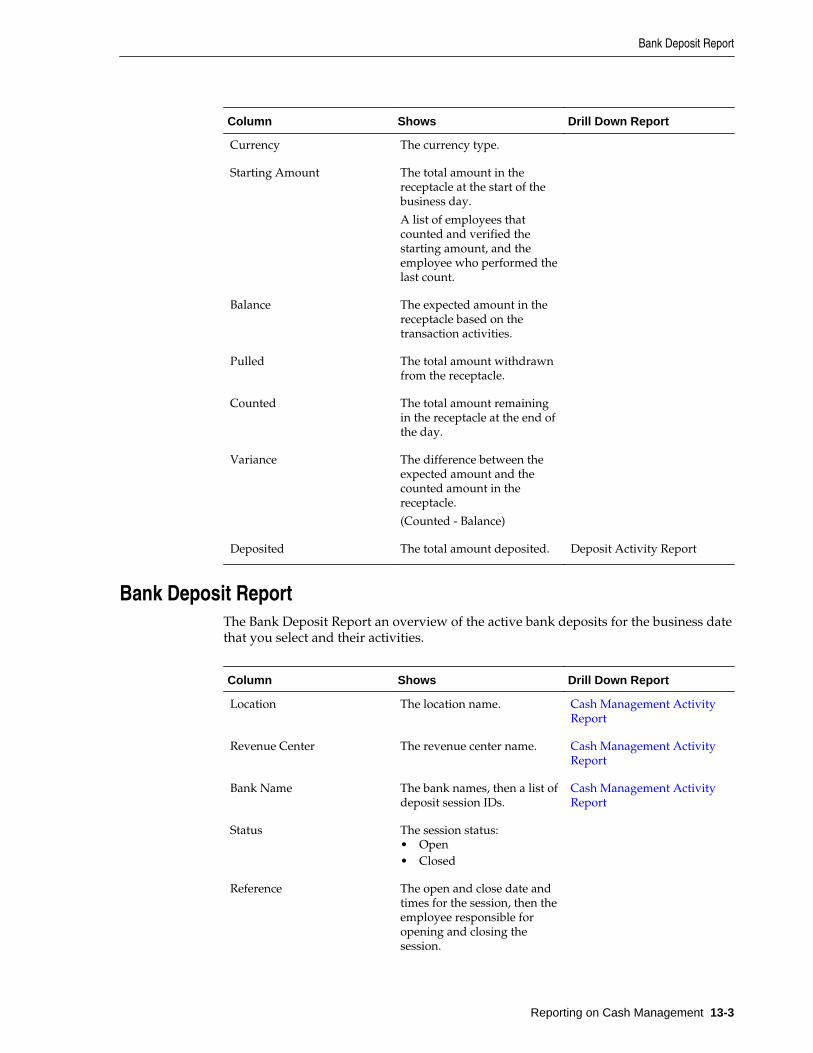
Column Shows Drill Down Report
Currency The currency type.
Starting Amount The total amount in thereceptacle at the start of thebusiness day.
A list of employees thatcounted and verified thestarting amount, and theemployee who performed thelast count.
Balance The expected amount in thereceptacle based on thetransaction activities.
Pulled The total amount withdrawnfrom the receptacle.
Counted The total amount remainingin the receptacle at the end ofthe day.
Variance The difference between theexpected amount and thecounted amount in thereceptacle.
(Counted - Balance)
Deposited The total amount deposited. Deposit Activity Report
Bank Deposit ReportThe Bank Deposit Report an overview of the active bank deposits for the business datethat you select and their activities.
Column Shows Drill Down Report
Location The location name. Cash Management ActivityReport
Revenue Center The revenue center name. Cash Management ActivityReport
Bank Name The bank names, then a list ofdeposit session IDs.
Cash Management ActivityReport
Status The session status:• Open• Closed
Reference The open and close date andtimes for the session, then theemployee responsible foropening and closing thesession.
Bank Deposit Report
Reporting on Cash Management 13-3

Column Shows Drill Down Report
Currency The currency type.
Deposit Amount The total amount deposited.
Count Adjustments ReportThe Count Adjustments Report shows an overview of count adjustments for thebusiness date that you select. You can use this report to determine the value of anyadjustment activity that took place on a receptacle. The accepted receptacles are till,safe, server bank, and petty cash.
Column Shows Drill Down Report
Location The location name.
Revenue Center The revenue center name.
Receptacle The names of the receptacles.
Type The receptacle type:• Till• Safe• Bank• Petty cash
Class The cash management class.
Session The session ID. Cash Management ActivityReport
Currency The currency type.
Adjustment The difference between theoriginal count and the newcount.
Reference The count reference.
Reason The reason for making theadjustment.
Starting Amount Adjustments ReportThe Starting Amount Adjustments Report shows an overview of starting amountadjustments for the business date that you select. You can use this report to determinethe value of any starting amount adjustment activity that took place on a receptacle.The accepted receptacles are till and server bank.
Column Shows Drill Down Report
Location The location name.
Revenue Center The revenue center name.
Count Adjustments Report
13-4 User Guide

Column Shows Drill Down Report
Receptacle The names of the receptacles.
Type The receptacle type:• Till• Safe• Bank• Petty cashThen the session ID.
Cash Management ActivityReport
Org. Starting Amount The original amount in thereceptacle at the start of thebusiness day, then the reasonfor adjustment.
Starting Amount The revised amount in thereceptacle at the start of thebusiness day.
Adjustment The difference between theoriginal count and the newcount.
(Starting Amount - Org.Starting Amount)
Over/Short ReportThe Over/Short Report shows an overview of the counts that are greater or less thanthe value predicted for the business date that you select based on transaction activities.You can use this report to determine the value of any over or short activity reportedfor a receptacle.
Column Shows Drill Down Report
Location The location name.
Revenue Center The revenue center name.
Receptacle The names of the receptacles.
Counted By The employee that countedand verified the amount inthe receptacle.
Type The receptacle type:• Till• Safe• Bank• Petty cashThen the session ID.
Session ID The session ID. Cash Management ActivityReport
Over/Short Report
Reporting on Cash Management 13-5

Column Shows Drill Down Report
Workstation/Drawer The workstation and drawerIDs.
Currency The currency type.
Over/Short The amount over or short ofthe predicted amount in thereceptacle.
Reason The reason for the variance inamount.
Paid-In/Paid-Out ReportThe Paid-In/Paid-Out Report shows paid-in and paid-out transactions for the datethat you select. You can use this report to see transaction information for paid-in andpaid-out activities reported for a receptacle. The accepted receptacles are safe, till,server bank, and petty cash.
Column Shows Drill Down Report
Location The location name.
Revenue Center The revenue center name.
Receptacle The names of the receptacles.
Employee The employee that performedthe transaction as well as thefollowing details:• Account/Vendor: The
general ledger accountinginformation associatedwith the transaction andthe vendor to whommoney is paid in or paidout.
• Acct/Vndr Code: Theaccount number and thevendor reference code.
• Invoice Num/Date: Theinvoice number and dateof the transaction.
• Notes: Any additionalnotes for the transaction.
Type The receptacle type:• Till• Safe• Bank• Petty cashThen the session ID.
Session The session ID. Cash Management ActivityReport
Paid-In/Paid-Out Report
13-6 User Guide

Column Shows Drill Down Report
Reference The count reference. Cash Management ActivityReport
Currency The currency type.
Reason The reason for thetransaction.
Total Amount The total amount withdrawnfrom or deposited to thereceptacle.
Server Bank ReportThe Server Bank Report shows an overview of server bank sessions for the employeesthat logged into the workstation for the business date that you select. You can use thisreport to determine the value of any activity that took place within the server banksession regardless of the defined currency.
Column Shows Drill Down Report
Location The location name.
Revenue Center The revenue center name.
Employee The employee name.
Session The session ID. Cash Management ActivityReport
Status The session status:• Open• Closed
Cash Management ActivityReport
Reference The count reference.
Currency The currency type.
Starting Amount The amount in the receptacleat the start of the businessday.
Balance The total amount remainingin the safe at the end of thebusiness day.
Counted The total amount remainingin the receptacle at the end ofthe day.
Variance The difference between theexpected amount and thecounted amount in thereceptacle.
(Counted - Balance)
Server Bank Report
Reporting on Cash Management 13-7

Column Shows Drill Down Report
Deposited The total amount deposited. Deposit Activity Report
Bank Deposit Adjustments ReportThe Bank Deposit Adjustments Report shows an overview of item adjustments for thebusiness date that you select. You can use this report to determine the values of anyadjustment activity that took place on a bank deposit receptacle.
Column Shows Drill Down Report
Location The location name. Cash Management ActivityReport
Revenue Center The revenue center name. Cash Management ActivityReport
Bank Name The bank name and sessionID.
Cash Management ActivityReport
Type The receptacle type:• Till• Safe• Bank• Petty cash
Class The cash management class.
Org. Amount The original amount in thereceptacle.
Amount The amount in the receptacleafter the adjustment.
Adjustment The difference between theoriginal amount and the newamount.
(Amount - Org. Amount)
Reason The reason for making theadjustment.
Petty Cash ReportThe Petty Cash Report shows and overview of petty cash receptacles and theiractivities for the business date that you select. You can use this report to determine thecurrent cash value of any money, regardless of the defined currency within the pettycash receptacles.
Column Shows Drill Down Report
Location The location name.
Revenue Center The revenue center name.
Bank Deposit Adjustments Report
13-8 User Guide

Column Shows Drill Down Report
Petty Cash The names of the petty cashreceptacles belonging to therevenue center.
Session The session ID. Cash Management ActivityReport
Status The session status:• Open• Closed
Currency The currency type.
Balance The total amount remainingin the petty cash receptacle atthe end of the business day.
Cash Management Activity ReportThe Cash Management Activity Report provides a chronological list of transactions ona receptacle session for the business date that you select. You can use this report totrack the flow of cash in and out of the receptacle.
Column Shows Drill Down Report
Location The location name.
Revenue Center The revenue center name.
Receptacle The names of the safereceptacles belonging to therevenue center.
Activity Type The type of activity, such as:• Open• Closed• Adjustment• Transfer
Time The time of the transaction.
Type The receptacle type.
Employee The employee that performedthe transaction.
Session ID The session ID. Session ID Activity Report
Audit Ref A list of source of targetsession IDs.
Session ID Activity Report
Class The cash management class.
Amount The value of the transaction.
Cash Management Activity Report
Reporting on Cash Management 13-9
Column Shows Drill Down Report
Activity Details Any additional detailsregarding the transaction.
Balance The total amount remainingin the receptacle.
Cash Management Activity Report
13-10 User Guide
14Building Custom Reports in Microsoft Excel
iQuery is an add-in that enables you to build custom queries in Microsoft Excel. Whenyou build a query, you select data that appears in a Microsoft Excel spreadsheet afteryou run the query.
You can save the queries in Microsoft Excel or you can save them as reports. Whenyou save a query as a report, users assigned to the custom reports role can run thereports from the Reporting and Analytics web application.
Installing iQuery
Building a Query
Installing iQuery
1. Close Microsoft Excel if it is open.
2. Go to the Reporting and Analytics home page, click LINKS, and then click iQuery.
3. Click Install MICROS iQuery - Office 2007+ and then save iQuerySetup.exe toa temporary location on your computer.
4. Double-click the iQuerySetup.exe file and then follow the prompts to install thesoftware.
5. Validate the installation:
a. Open Microsoft Excel.
b. Locate the iQuery plug-in, and then open iQuery.
The location varies depending on the version of Microsoft Excel. For example, inMicrosoft Excel 2013, access iQuery from the ADD-INS ribbon.
c. Log in to iQuery.
Building a Query
1. Select a query subject.
2. Select the column data that you want to appear in the spreadsheet after you run thequery.
Building Custom Reports in Microsoft Excel 14-1

For numerical data marked with an asterisk, you can apply mathematicalcalculations by selecting an operation. For example, you select Operations DailyTotal as the subject and then you select the Check Closed Total column. To add allthe values in the spreadsheet column when you run the query, select Sum from theOperation drop-down list.
Use the up and down arrows to adjust the order of the columns in the spreadsheet.For example, if you move a column to the top of the list, that column is the firstcolumn in the spreadsheet.
3. In the Filters node on the dialog box window, select a filter and then select optionsto further refine query results.
The filters that appear depend on the subject that you select. For example, for mostmenu item subjects, you can filter by category groups and family group.
4. In the Sort Orders node, define the order in which iQuery sorts the data.
5. Click Preview to verify the query returns expected results.
Change query settings and preview the query again to fine-tune the query results.
6. Click Run to show the results in a Microsoft Excel spreadsheet.
7. Save the query.
To save the query on your computer so you can run it at a later time from MicrosoftExcel, click Query.
To save the query as a report, click Report. Users assigned to the custom reportsrole can run the report from the Reporting and Analytics web application.
Building a Query
14-2 User Guide
15Building Interactive Reports
Interactive Reports enable you to build custom reports and view them in real time.The report updates as you drag and drop data fields onto the canvas. You can saveand publish Interactive Reports and you can configure Reporting and Analytics tosend them in report emails.
Creating Interactive Reports
Modifying and Deleting Interactive Reports
Publishing Interactive Reports
Creating Interactive Reports
1. In the side menu on the Reporting and Analytics home page, click InteractiveReport.
Your system administrator configures the link to appear in the Reports section orLINKS section.
2. Click Create New Interactive Report, and then click the report type.
3. Double-click Untitled and then type a report name.
4. Drag data fields to the canvas.
To add a data field as a column header, drag the field to the column bar. A verticalline appears to indicate you are creating a column header.
To add a data field as a group header, drag the field above the column bar. Ahorizontal line appears to indicate you are creating a group header.
To reorganize fields, drag them to their new location on the canvas or click andthen drag them to their new location in the Columns field.
To rename a field, double-click it on the canvas and then type the new name.
To remove a data field, click it and then drag it to the trash can.
5. To format data fields, click the Formatting tab and then specify format settings.
The options that appear vary by field type. Press and hold the Ctrl key to select andformat multiple fields.
6. To change general preferences such as the report template and page setup, click theGeneral tab and then specify the settings.
Building Interactive Reports 15-1
7. To define filters that limit data in the report:
a. Click the filter icon ( ) on the tool bar, and then drag a field from the canvasto the Filters box.
b. Specify filter conditions and parameters.
c. Click OK.
To remove a filter, click the filter icon, and then click .
To edit a filter, click the filter icon, and then click .
8. To sort report data:
• For group headers, under Group Sorting on the Data tab, click the drop-downlist for that header, and then select Ascending or Descending.
• For column headers, right-click on a column, select Sort, and then selectAscending , Descending, or None. Selecting None removes the previous sortoption.
9. Click Save, enter the report name, and then click OK.
10. To generate the report, click the Export icon ( ) on the tool bar, and then selectthe output type.
Modifying and Deleting Interactive Reports
1. Click Reports, and then select Interactive Reporting.
2. Select Modify/Delete Interactive Reports.
3. To find a report:
• Click Find All to show all saved Interactive Reports.
• Enter the search criteria for a specific report, and then click Find.
4. Click Next and Previous to navigate through the search results, if applicable.
5. Click the report.
6. To modify a report, click Edit. See Creating Interactive Reports for details onmodifying the report’s data fields.
7. To delete a report, click Delete, and then click OK twice.
Publishing Interactive Reports
Modifying and Deleting Interactive Reports
15-2 User Guide

1. Click Reports, and then select Interactive Reporting.
2. Click Publish Interactive Reports.
3. To find a report:
• Click Find All to show all saved Interactive Reports.
• Enter the search criteria for a specific report, and then click Find.
4. Click Next and Previous to navigate the search results, if applicable.
5. Click the report.
6. To view the list of roles and users assigned to the report, click Publish To.
7. Click Publish at the top of the screen.
8. Enter a new Name for the report, if applicable.
9. Enter a Description for the report.
10. Click By Role or By User.
11. Select the role or user, and then click >> to move the selection to the panel.
12. Click Save, and then click OK.
Publishing Interactive Reports
Building Interactive Reports 15-3

Publishing Interactive Reports
15-4 User Guide
16Retrieving Guest Check Information
Oracle Hospitality Reporting and Analytics Advanced enables you to retrieve high-level guest check information and transaction-level information from the system.
To retrieve high-level information, use Check Query to retrieve basic checkinformation. For example, you can search for check totals less than $10.00 for a daterange from a specific location.
To retrieve transaction-level information, use Audit & Analysis to query the system.Audit & Analysis enables you to build custom queries by applying filters. You can usethe query results to identify trends that require research, such as a high number oferror corrections or voided transactions. The following table describes the Audit &Analysis queries you can create. Your role or user type determines the queries you cancreate.
Type Description
Transaction Detail Retrieves transaction-level data. For example,you can query transactions for specific menuitem purchases at a location.
Transaction Summary Retrieves summary-level data. For example,you can query transactions for a tender mediatype such as credit card purchases for acustomer.
Non-Check Transaction Retrieves data for non-check transactions. Forexample, you can query training transactionsfor workstations at a location.
Authorization Retrieves data for transactions that requireauthorization. For example, you can queryvoided service charges from a round for arevenue center.
Retrieving Information with Check Query
Retrieving Transaction Information with Audit & Analysis
Exporting Audit & Analysis Queries
Retrieving Information with Check Query
1. On the Oracle Hospitality Reporting and Analytics home page, click Check Query.
2. Specify the search criteria.
Retrieving Guest Check Information 16-1
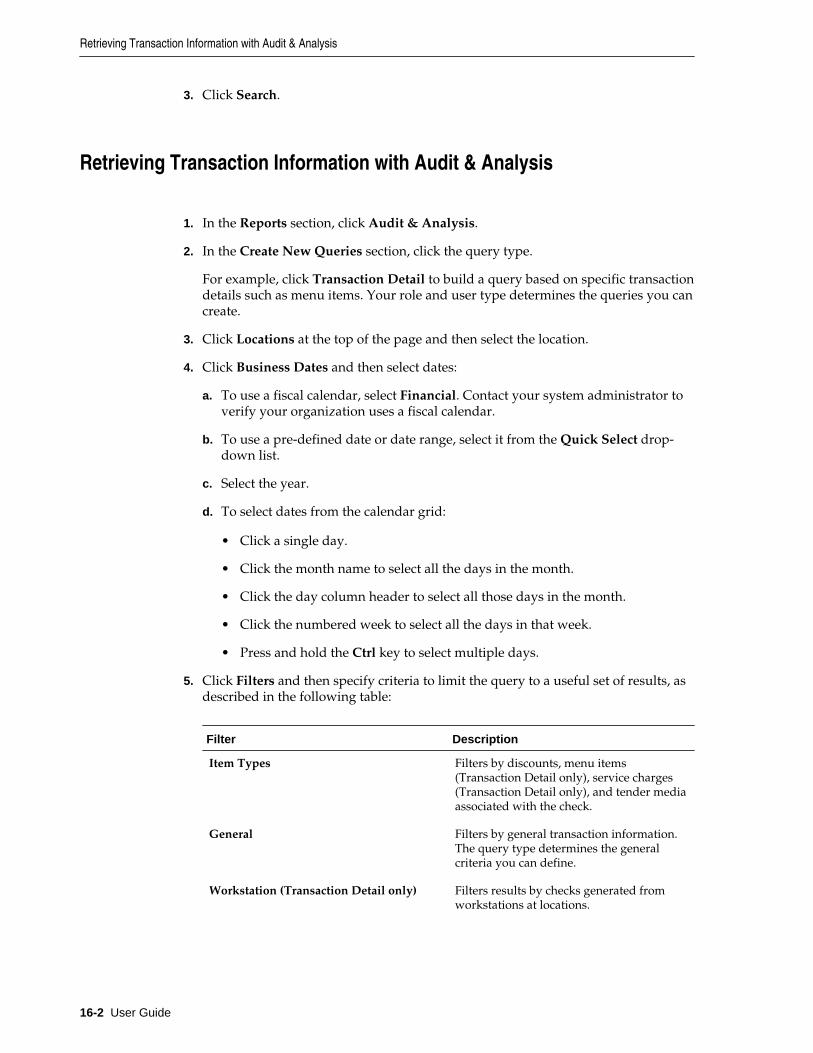
3. Click Search.
Retrieving Transaction Information with Audit & Analysis
1. In the Reports section, click Audit & Analysis.
2. In the Create New Queries section, click the query type.
For example, click Transaction Detail to build a query based on specific transactiondetails such as menu items. Your role and user type determines the queries you cancreate.
3. Click Locations at the top of the page and then select the location.
4. Click Business Dates and then select dates:
a. To use a fiscal calendar, select Financial. Contact your system administrator toverify your organization uses a fiscal calendar.
b. To use a pre-defined date or date range, select it from the Quick Select drop-down list.
c. Select the year.
d. To select dates from the calendar grid:
• Click a single day.
• Click the month name to select all the days in the month.
• Click the day column header to select all those days in the month.
• Click the numbered week to select all the days in that week.
• Press and hold the Ctrl key to select multiple days.
5. Click Filters and then specify criteria to limit the query to a useful set of results, asdescribed in the following table:
Filter Description
Item Types Filters by discounts, menu items(Transaction Detail only), service charges(Transaction Detail only), and tender mediaassociated with the check.
General Filters by general transaction information.The query type determines the generalcriteria you can define.
Workstation (Transaction Detail only) Filters results by checks generated fromworkstations at locations.
Retrieving Transaction Information with Audit & Analysis
16-2 User Guide

Filter Description
Day Parts Filters by checks generated during parts ofa day configured for your organization.Examples of day parts include breakfast,lunch, dinner, and late night. You can alsoselect 15-minute intervals within an hour.
Order Types Filters by order types configured for yourorganization.
Revenue Centers Filters by revenue center. For example, youcan filter on guest check transactions fromthe bar or restaurant.
Customer (Transaction Summary only) Filters by customer information associatedwith transactions. For example, you canfilter by the name on the credit card acustomer used for the transaction.
Employee Filters by employee information associatedwith transactions. For example, you canfilter by all transactions for check employeeBrian Smith.
Tax (Transaction Summary only) Filter by tax information associated withtransactions.
6. Click Format and define query output settings:
a. Select the output type.
b. To show location-specific names of menu items, tender and media, discounts,and service charges in the query, select Use location names rather than masternames.
Clearing this option shows the names from the master definition table.
c. Select the columns that appear in the query and then define how the columndata appears in the query.
For example, you can group data by revenue center in ascending order. Toapply a mathematical operation, select the operation from the Function column.
7. Click Run to run the query.
8. Click Publish to save the query and make it available to other users:
a. Type a name and description for the query.
b. On the Publish To tab, specify if the members of a role or specific users can runthe query.
c. On the Prompted Filters tab, select the filters that other users can set whenrunning the published query.
d. Click Save.
The query appears in the Public Queries section on the Audit & Analysis page.
Retrieving Transaction Information with Audit & Analysis
Retrieving Guest Check Information 16-3

Exporting Audit & Analysis Queries
1. Build and run an Audit & Analysis query or run a published query.
2. Click the export format icon as shown in the following example:
Exporting Audit & Analysis Queries
16-4 User Guide
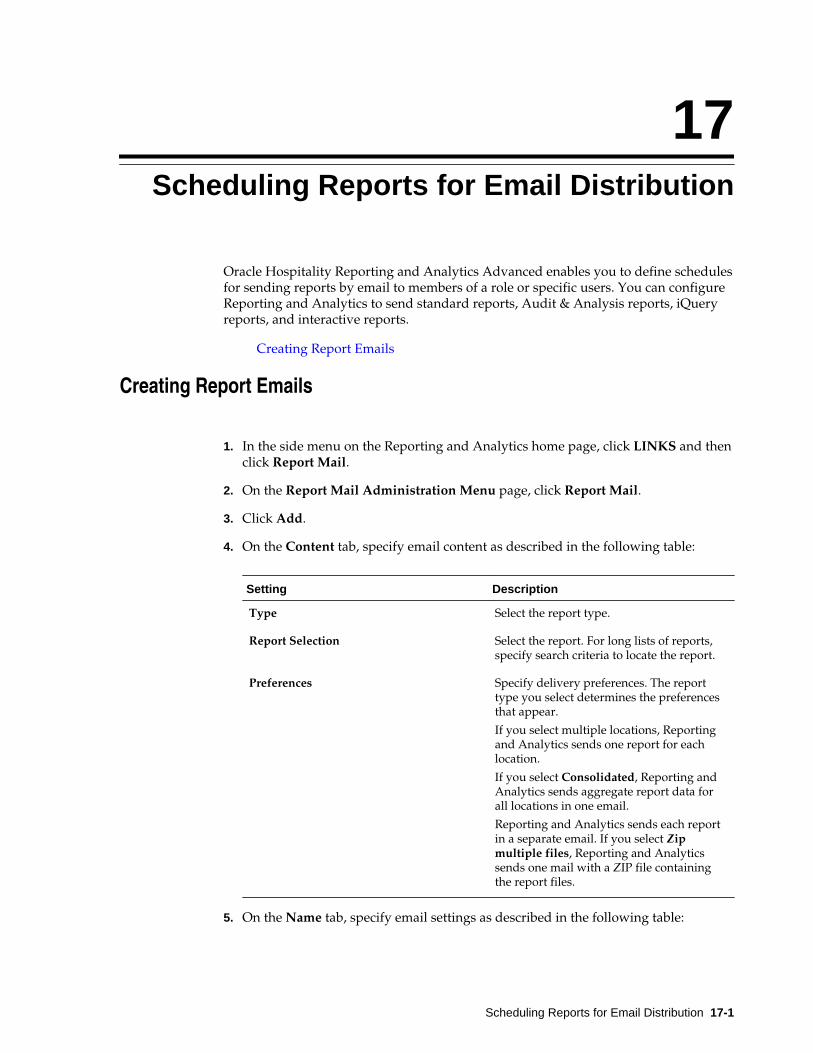
17Scheduling Reports for Email Distribution
Oracle Hospitality Reporting and Analytics Advanced enables you to define schedulesfor sending reports by email to members of a role or specific users. You can configureReporting and Analytics to send standard reports, Audit & Analysis reports, iQueryreports, and interactive reports.
Creating Report Emails
Creating Report Emails
1. In the side menu on the Reporting and Analytics home page, click LINKS and thenclick Report Mail.
2. On the Report Mail Administration Menu page, click Report Mail.
3. Click Add.
4. On the Content tab, specify email content as described in the following table:
Setting Description
Type Select the report type.
Report Selection Select the report. For long lists of reports,specify search criteria to locate the report.
Preferences Specify delivery preferences. The reporttype you select determines the preferencesthat appear.
If you select multiple locations, Reportingand Analytics sends one report for eachlocation.
If you select Consolidated, Reporting andAnalytics sends aggregate report data forall locations in one email.
Reporting and Analytics sends each reportin a separate email. If you select Zipmultiple files, Reporting and Analyticssends one mail with a ZIP file containingthe report files.
5. On the Name tab, specify email settings as described in the following table:
Scheduling Reports for Email Distribution 17-1

Setting Description
Name Type the name of the report email. Thename identifies the report email in theReporting and Analytics web application.
Description Type a description of the report email. Thedescription appears in the Reporting andAnalytics web application.
Subject Type a subject for the report email. Thevalue appears in the subject line of theemail sent to recipients.
Active Clear the option to deactivate the reportemail. Reporting and Analytics saves thereport email settings but does not sendreport emails.
Email When Error Select to notify the system administrator ofreport email errors.
6. On the Recipients tab, select the email recipients.
If you select a specific user, and you want to send the email to more users, selectAdditional recipient(s) emails and then type the email addresses.
7. On the Frequency tab, specify the intervals Reporting and Analytics uses to sendreport emails.
Creating Report Emails
17-2 User Guide
Index
R
report, tax, 4-16
Index-1

Index-2