Oracle AWR Report
64
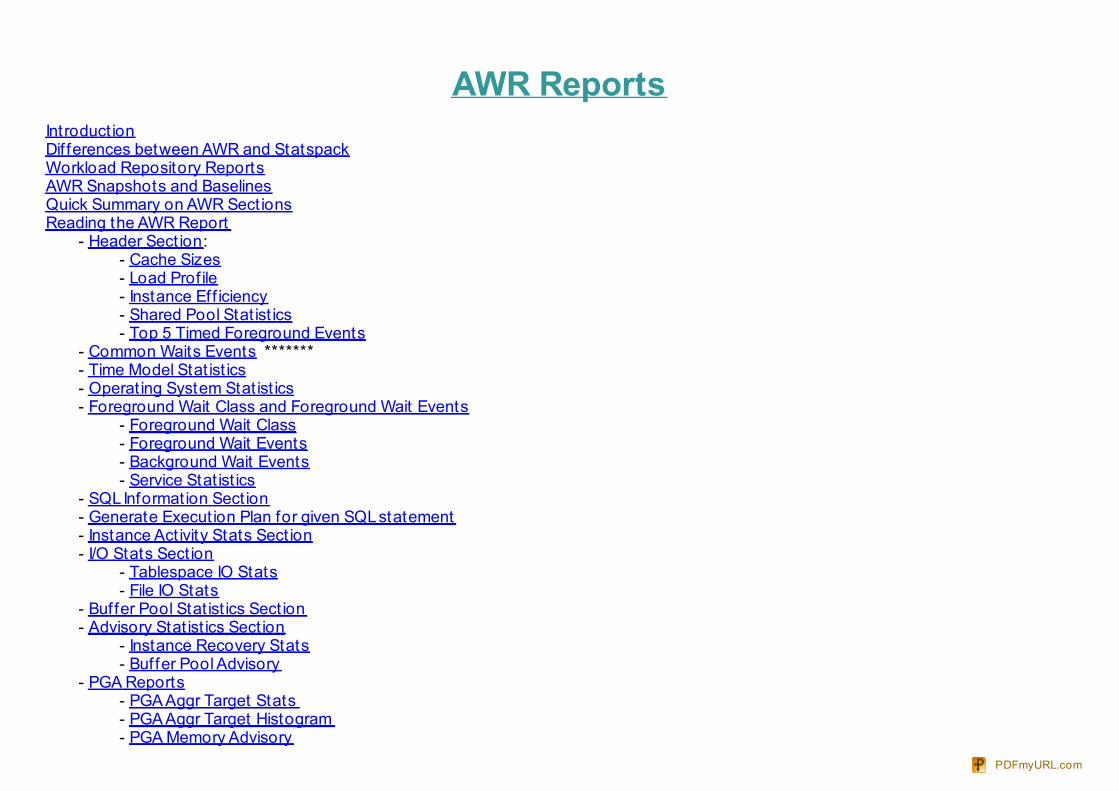
AWR Reports Introduction Differences between AWR and Statspack Workload Repository Reports AWR Snapshots and Baselines Quick Summary on AWR Sections Reading the AWR Report - Header Section : - Cache Sizes - Load Profile - Instance Efficiency - Shared Pool Statistics - Top 5 Timed Foreground Events - Common Waits Events ******* - Time Model Statistics - Operating System Statistics - Foreground Wait Class and Foreground Wait Events - Foreground Wait Class - Foreground Wait Events - Background Wait Events - Service Statistics - SQL Information Section - Generate Execution Plan for given SQL statement - Instance Activity Stats Section - I/O Stats Section - Tablespace IO Stats - File IO St at s - Buffer Pool Statistics Section - Advisory Statistics Section - Instance Recovery Stats - Buffer Pool Advisory - PGA Reports - PGA Aggr Target Stats - PGA Aggr Target Histogram - PGA Memory Advisory PDFmyURL.com
Transcript of Oracle AWR Report
AWR ReportsIntroduct ionDif ferences between AWR and StatspackWorkload Repository ReportsAWR Snapshots and BaselinesQuick Summary on AWR Sect ionsReading the AWR Report - Header Sect ion: - Cache Sizes - Load Prof ile - Instance Eff iciency - Shared Pool Stat ist ics - Top 5 Timed Foreground Events - Common Waits Events ******* - Time Model Stat ist ics - Operat ing System Stat ist ics - Foreground Wait Class and Foreground Wait Events - Foreground Wait Class - Foreground Wait Events - Background Wait Events - Service Stat ist ics - SQL Informat ion Sect ion - Generate Execut ion Plan for given SQL statement - Instance Act ivity Stats Sect ion - I/O Stats Sect ion - Tablespace IO Stats - File IO Stats - Buffer Pool Stat ist ics Sect ion - Advisory Stat ist ics Sect ion - Instance Recovery Stats - Buffer Pool Advisory - PGA Reports - PGA Aggr Target Stats - PGA Aggr Target Histogram - PGA Memory Advisory
PDFmyURL.com
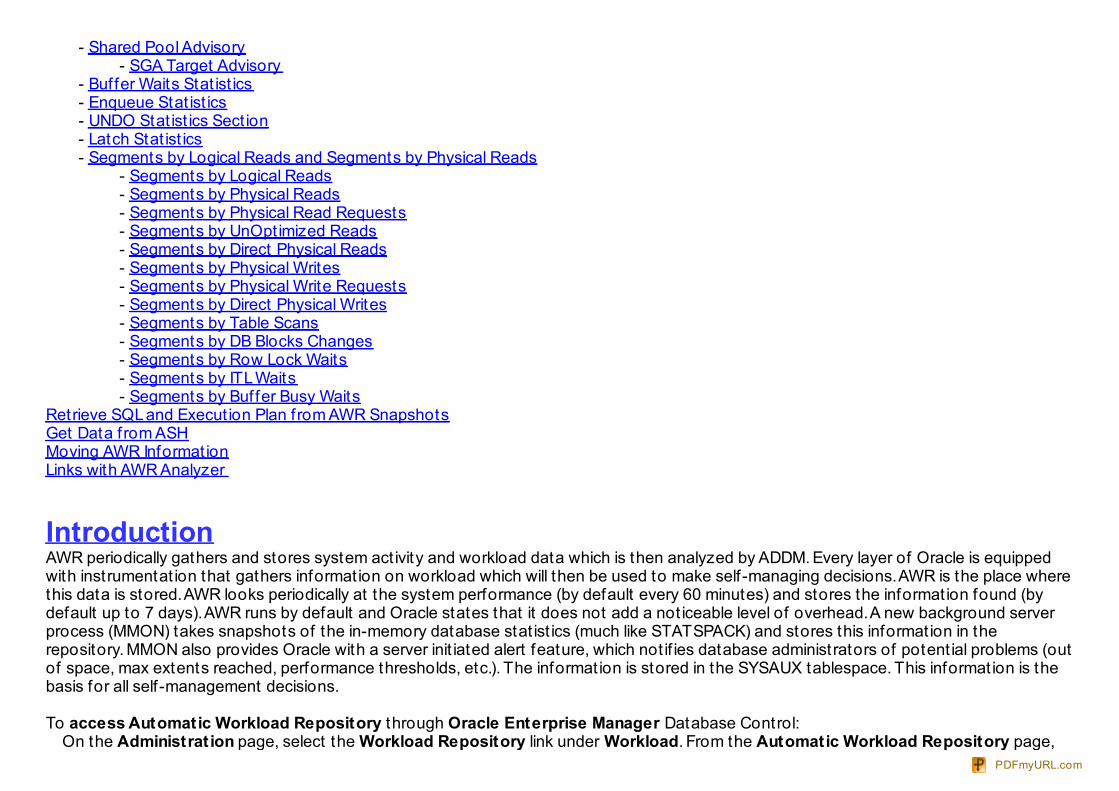
- Shared Pool Advisory - SGA Target Advisory - Buffer Waits Stat ist ics - Enqueue Stat ist ics - UNDO Stat ist ics Sect ion - Latch Stat ist ics - Segments by Logical Reads and Segments by Physical Reads - Segments by Logical Reads - Segments by Physical Reads - Segments by Physical Read Requests - Segments by UnOptimized Reads - Segments by Direct Physical Reads - Segments by Physical Writes - Segments by Physical Write Requests - Segments by Direct Physical Writes - Segments by Table Scans - Segments by DB Blocks Changes - Segments by Row Lock Waits - Segments by ITL Waits - Segments by Buffer Busy WaitsRetrieve SQL and Execut ion Plan from AWR SnapshotsGet Data f rom ASHMoving AWR Informat ionLinks with AWR Analyzer
IntroductionAWR periodically gathers and stores system act ivity and workload data which is then analyzed by ADDM. Every layer of Oracle is equippedwith instrumentat ion that gathers informat ion on workload which will then be used to make self -managing decisions. AWR is the place wherethis data is stored. AWR looks periodically at the system performance (by default every 60 minutes) and stores the informat ion found (bydefault up to 7 days). AWR runs by default and Oracle states that it does not add a not iceable level of overhead. A new background serverprocess (MMON) takes snapshots of the in-memory database stat ist ics (much like STATSPACK) and stores this informat ion in therepository. MMON also provides Oracle with a server init iated alert feature, which not if ies database administrators of potent ial problems (outof space, max extents reached, performance thresholds, etc.). The informat ion is stored in the SYSAUX tablespace. This informat ion is thebasis for all self -management decisions.
To access Automatic Workload Repository through Oracle Enterprise Manager Database Control: On the Administrat ion page, select the Workload Repository link under Workload. From the Automatic Workload Repository page,
PDFmyURL.com
you can manage snapshots or modify AWR sett ings. o To manage snapshots, click the link next to Snapshots or Preserved Snapshot Sets. On the Snapshots or Preserved SnapshotSets pages, you can: + View informat ion about snapshots or preserved snapshot sets (baselines). + Perform a variety of tasks through the pull-down Actions menu, including creat ing addit ional snapshots, preserved snapshot setsfrom an exist ing range of snapshots, or an ADDM task to perform analysis on a range of snapshots or a set of preserved snapshots. o To modify AWR sett ings, click the Edit button. On the Edit Sett ings page, you can set the Snapshot Retent ion period andSnapshot Collect ion interval.
Most informative sect ions of the reportI f ind the following sect ions most useful:- Summary- Top 5 t imed events- Top SQL (by elapsed t ime, by gets, somet imes by reads)
When viewing AWR report , always check corresponding ADDM report for act ionable recommendat ions. ADDM is a self diagnost ic enginedesigned from the experience of Oracle’s best tuning experts. Analyzes AWR data automat ically af ter an AWR snapshot. Makes specif icperformance recommendat ions.
Both the snapshot f requency and retent ion t ime can be modif ied by the user. To see the present set t ings, you could use: select snap_interval, retention from dba_hist_wr_control;
SNAP_INTERVAL RETENTION------------------- -------------------+00000 01:00:00.0 +00007 00:00:00.0
orselect dbms_stats.get_stats_history_availability from dual;select dbms_stats.get_stats_history_retention from dual;
This SQL shows that the snapshots are taken every hour and the collect ions are retained for 7 days
If you want to extend that retent ion period you can execute:execute dbms_workload_repository.modify_snapshot_settings( interval => 60, -- In Minutes. Current value retained if NULL. retention => 43200); -- In Minutes (= 30 Days). Current value retained if NULL
In this example the retent ion period is specif ied as 30 days (43200 min) and the interval between each snapshot is 60 min.
PDFmyURL.com
Differences between AWR and STATSPACK report 1)Statspack snapshot purges must be scheduled manually. When the Statspack tablespace runs out of space, Statspack quits working. AWRsnapshots are purged automat ically by MMON every night. MMON, by default , t ries to keep one week's worth of AWR snapshots available. IfAWR detects that the SYSAUX tablespace is in danger of running out of space, it will f ree space in SYSAUX by automat ically delet ing theoldest set of snapshots. If this occurs, AWR will init iate a server-generated alert to not ify administrators of the out-of-space error condit ion.
2)The AWR repository holds all of the stat ist ics available in STATSPACK as well as some addit ional stat ist ics which are not.
3)STATSPACK does not store the Act ive Session History (ASH) stat ist ics which are available in the AWR dba_hist_act ive_sess_history view.
4)STATSPACK does not store history for new metric stat ist ics introduced in Oracle. The key AWR views are: dba_hist_sysmetric_history anddba_hist_sysmetric_summary.
5)The AWR also contains views such as dba_hist_service_stat , dba_hist_service_wait_class and dba_hist_service_name , which storehistory for performance cumulat ive stat ist ics t racked for specif ic services.
6)The latest version of STATSPACK included with Oracle contains a set of specif ic tables, which track history of stat ist ics that ref lect theperformance of the Oracle Streams feature. These tables are stats$streams_capture , stats$streams_apply_sum ,stats$buffered_subscribers , stats$rule_set , stats$propagat ion_sender , stats$propagat ion_receiver and stats$buffered_queues . TheAWR does not contain the specif ic tables that ref lect Oracle Streams act ivity; therefore, if a DBA relies heavily on the Oracle Streamsfeature, it would be useful to monitor its performance using STATSPACK ut ility.
7)Statspack snapshots must be run by an external scheduler (dbms_jobs, CRON, etc.). AWR snapshots are scheduled every 60 minutes bydefault .
8)ADDM captures a much greater depth and breadth of stat ist ics than Statspack does. During snapshot processing, MMON transfers an in-memory version of the stat ist ics to the permanent stat ist ics tables.
Workload Repository ReportsOracle provide two main scripts to produce workload repository reports. They are similar in format to the statspack reports and give theopt ion of HTML or plain text formats. The two reports give essent ial the same output but the awrrpt i.sql allows you to select a singleinstance. The reports can be generated as follows:
PDFmyURL.com
@$ORACLE_HOME/rdbms/admin/awrrpt .sql @$ORACLE_HOME/rdbms/admin/awrrpt i.sql
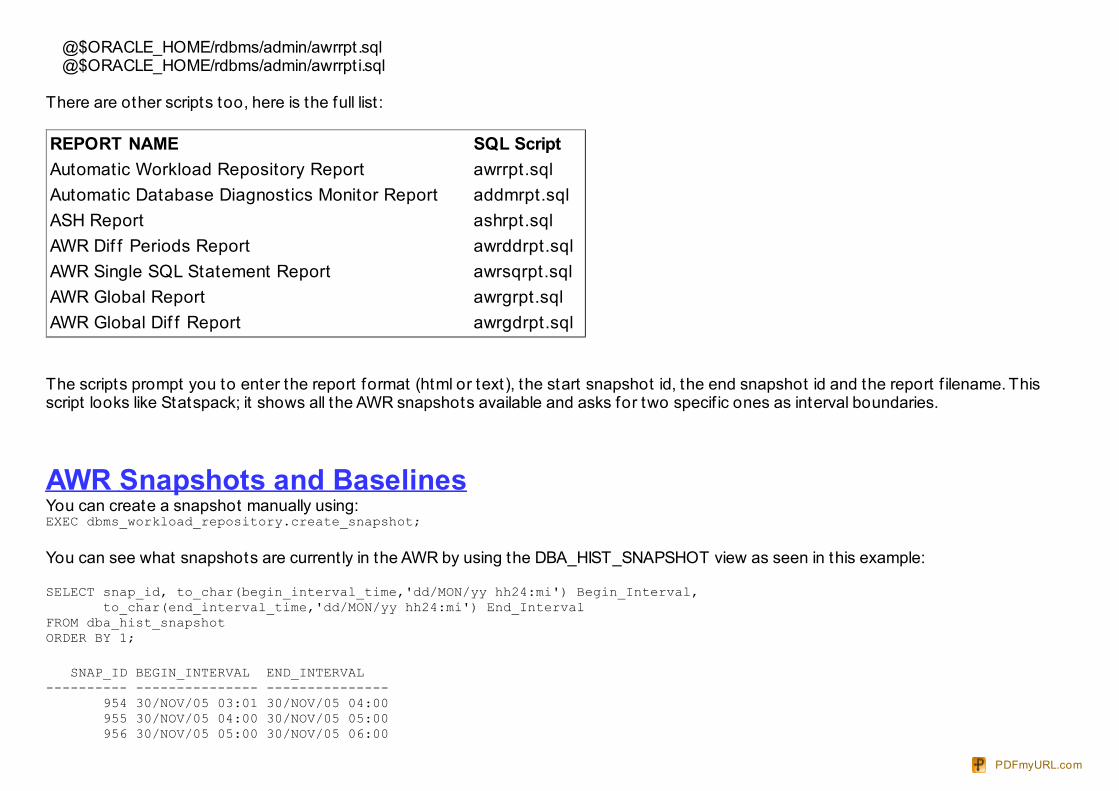
There are other scripts too, here is the full list :
REPORT NAME SQL ScriptAutomatic Workload Repository Report awrrpt.sqlAutomatic Database Diagnostics Monitor Report addmrpt.sqlASH Report ashrpt.sqlAWR Dif f Periods Report awrddrpt.sqlAWR Single SQL Statement Report awrsqrpt.sqlAWR Global Report awrgrpt.sqlAWR Global Dif f Report awrgdrpt.sql
The scripts prompt you to enter the report format (html or text), the start snapshot id, the end snapshot id and the report f ilename. Thisscript looks like Statspack; it shows all the AWR snapshots available and asks for two specif ic ones as interval boundaries.
AWR Snapshots and BaselinesYou can create a snapshot manually using:EXEC dbms_workload_repository.create_snapshot;
You can see what snapshots are current ly in the AWR by using the DBA_HIST_SNAPSHOT view as seen in this example:
SELECT snap_id, to_char(begin_interval_time,'dd/MON/yy hh24:mi') Begin_Interval, to_char(end_interval_time,'dd/MON/yy hh24:mi') End_IntervalFROM dba_hist_snapshotORDER BY 1;
SNAP_ID BEGIN_INTERVAL END_INTERVAL---------- --------------- --------------- 954 30/NOV/05 03:01 30/NOV/05 04:00 955 30/NOV/05 04:00 30/NOV/05 05:00 956 30/NOV/05 05:00 30/NOV/05 06:00
PDFmyURL.com
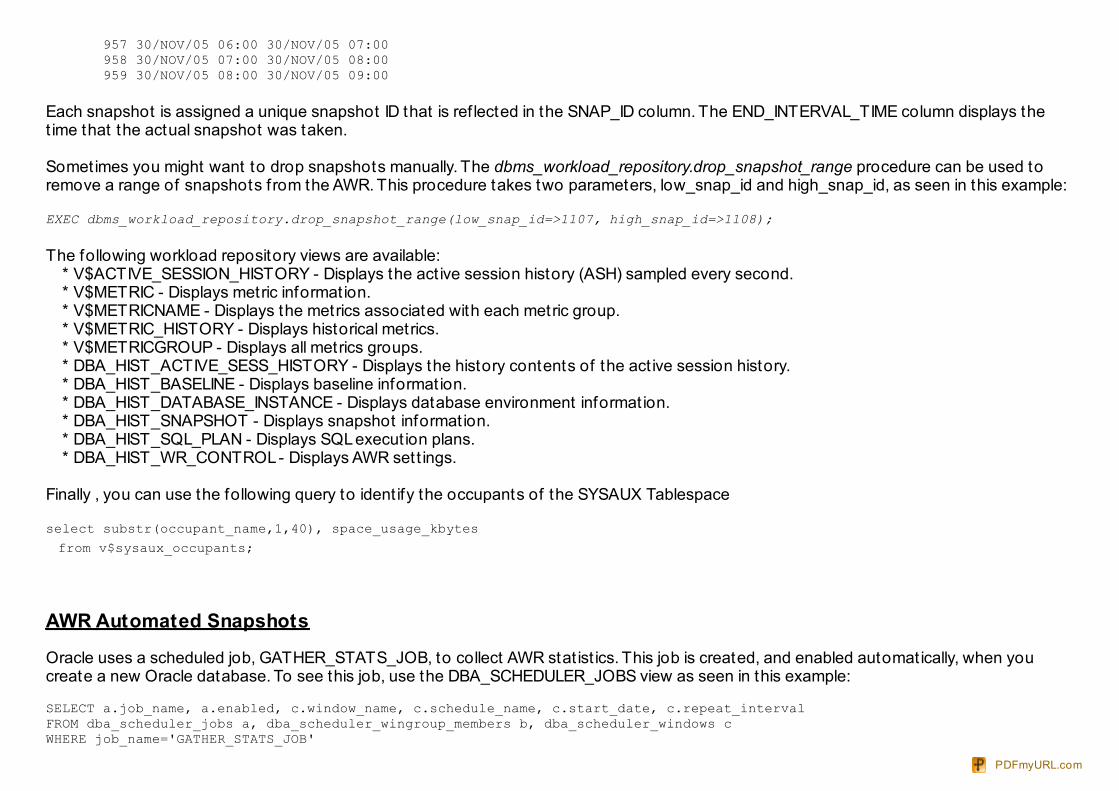
957 30/NOV/05 06:00 30/NOV/05 07:00 958 30/NOV/05 07:00 30/NOV/05 08:00 959 30/NOV/05 08:00 30/NOV/05 09:00
Each snapshot is assigned a unique snapshot ID that is ref lected in the SNAP_ID column. The END_INTERVAL_TIME column displays thet ime that the actual snapshot was taken.
Sometimes you might want to drop snapshots manually. The dbms_workload_repository.drop_snapshot_range procedure can be used toremove a range of snapshots f rom the AWR. This procedure takes two parameters, low_snap_id and high_snap_id, as seen in this example:
EXEC dbms_workload_repository.drop_snapshot_range(low_snap_id=>1107, high_snap_id=>1108);
The following workload repository views are available: * V$ACTIVE_SESSION_HISTORY - Displays the act ive session history (ASH) sampled every second. * V$METRIC - Displays metric informat ion. * V$METRICNAME - Displays the metrics associated with each metric group. * V$METRIC_HISTORY - Displays historical metrics. * V$METRICGROUP - Displays all metrics groups. * DBA_HIST_ACTIVE_SESS_HISTORY - Displays the history contents of the act ive session history. * DBA_HIST_BASELINE - Displays baseline informat ion. * DBA_HIST_DATABASE_INSTANCE - Displays database environment informat ion. * DBA_HIST_SNAPSHOT - Displays snapshot informat ion. * DBA_HIST_SQL_PLAN - Displays SQL execut ion plans. * DBA_HIST_WR_CONTROL - Displays AWR sett ings.
Finally , you can use the following query to ident ify the occupants of the SYSAUX Tablespace
select substr(occupant_name,1,40), space_usage_kbytes from v$sysaux_occupants;
AWR Automated Snapshots
Oracle uses a scheduled job, GATHER_STATS_JOB, to collect AWR stat ist ics. This job is created, and enabled automat ically, when youcreate a new Oracle database. To see this job, use the DBA_SCHEDULER_JOBS view as seen in this example:
SELECT a.job_name, a.enabled, c.window_name, c.schedule_name, c.start_date, c.repeat_intervalFROM dba_scheduler_jobs a, dba_scheduler_wingroup_members b, dba_scheduler_windows cWHERE job_name='GATHER_STATS_JOB'
PDFmyURL.com
And a.schedule_name=b.window_group_name And b.window_name=c.window_name;
You can disable this job using the dbms_scheduler.disable procedure as seen in this example:Exec dbms_scheduler.disable('GATHER_STATS_JOB');
And you can enable the job using the dbms_scheduler.enable procedure as seen in this example:Exec dbms_scheduler.enable('GATHER_STATS_JOB');
AWR BaselinesIt is f requent ly a good idea to create a baseline in the AWR. A baseline is def ined as a range of snapshots that can be used to compare toother pairs of snapshots. The Oracle database server will exempt the snapshots assigned to a specif ic baseline f rom the automated purgerout ine. Thus, the main purpose of a baseline is to preserve typical runt ime stat ist ics in the AWR repository, allowing you to run the AWRsnapshot reports on the preserved baseline snapshots at any t ime and compare them to recent snapshots contained in the AWR. Thisallows you to compare current performance (and conf igurat ion) to established baseline performance, which can assist in determiningdatabase performance problems.
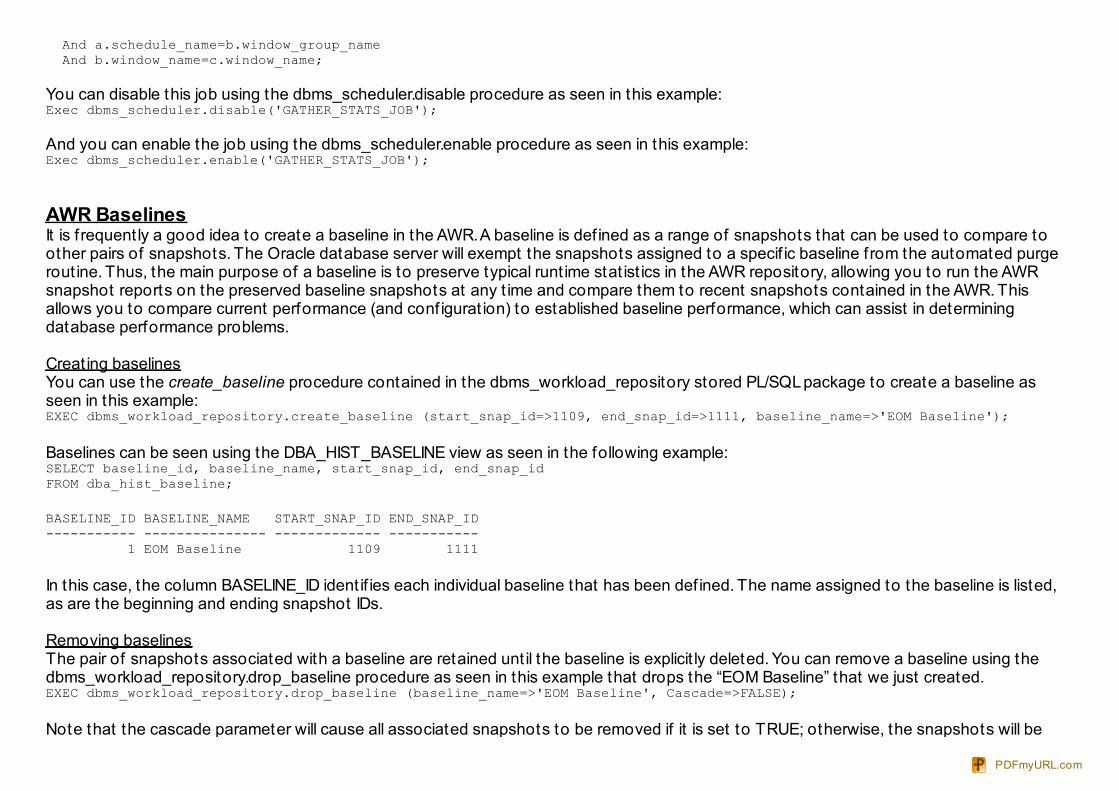
Creat ing baselinesYou can use the create_baseline procedure contained in the dbms_workload_repository stored PL/SQL package to create a baseline asseen in this example:EXEC dbms_workload_repository.create_baseline (start_snap_id=>1109, end_snap_id=>1111, baseline_name=>'EOM Baseline');
Baselines can be seen using the DBA_HIST_BASELINE view as seen in the following example:SELECT baseline_id, baseline_name, start_snap_id, end_snap_idFROM dba_hist_baseline;
BASELINE_ID BASELINE_NAME START_SNAP_ID END_SNAP_ID----------- --------------- ------------- ----------- 1 EOM Baseline 1109 1111
In this case, the column BASELINE_ID ident if ies each individual baseline that has been def ined. The name assigned to the baseline is listed,as are the beginning and ending snapshot IDs.
Removing baselinesThe pair of snapshots associated with a baseline are retained unt il the baseline is explicit ly deleted. You can remove a baseline using thedbms_workload_repository.drop_baseline procedure as seen in this example that drops the “EOM Baseline” that we just created.EXEC dbms_workload_repository.drop_baseline (baseline_name=>'EOM Baseline', Cascade=>FALSE);
Note that the cascade parameter will cause all associated snapshots to be removed if it is set to TRUE; otherwise, the snapshots will be
PDFmyURL.com
cleaned up automat ically by the AWR automated processes.
Quick Summary on AWR SectionsThis sect ion contains detailed guidance for evaluat ing each sect ion of an AWR report . Report Summary Section:This gives an overall summary of the instance during the snapshot period, and it contains important aggregate summary information.- Cache Sizes: This shows the size of each SGA region after AMM has changed them. This information can be compared to the original init.ora parametersat the end of the AWR report.- Load Profile: This section shows important rates expressed in units of per second and transactions per second.- Instance Efficiency Percentages: With a target of 100%, these are high-level ratios for activity in the SGA.- Shared Pool Statistics: This is a good summary of changes to the shared pool during the snapshot period.- Top 5 Timed Events: This is the most important section in the AWR report. It shows the top wait events and can quickly show the overall databasebottleneck.
Wait Events Statistics SectionThis section shows a breakdown of the main wait events in the database including foreground and background database wait events as well as time model,operating system, service, and wait classes statistics.- Time Model Statistics: Time mode statistics report how database-processing time is spent. This section contains detailed timing information on particularcomponents participating in database processing.- Wait Class: - Wait Events: This AWR report section provides more detailed wait event information for foreground user processes which includes Top 5 wait eventsand many other wait events that occurred during the snapshot interval.- Background Wait Events: This section is relevant to the background process wait events.- Operating System Statistics: The stress on the Oracle server is important, and this section shows the main external resources including I/O, CPU,memory, and network usage.- Service Statistics: The service statistics section gives information about how particular services configured in the database are operating.- Service Wait Class Stats:
SQL Statistics SectionThis section displays top SQL, ordered by important SQL execution metrics.- SQL Ordered by Elapsed Time: Includes SQL statements that took significant execution time during processing.- SQL Ordered by CPU Time: Includes SQL statements that consumed significant CPU time during its processing.- SQL Ordered by Gets: These SQLs performed a high number of logical reads while retrieving data.- SQL Ordered by Reads: These SQLs performed a high number of physical disk reads while retrieving data.- SQL Ordered by Executions:
PDFmyURL.com
- SQL Ordered by Parse Calls: These SQLs experienced a high number of reparsing operations.- SQL Ordered by Sharable Memory: Includes SQL statements cursors which consumed a large amount of SGA shared pool memory.- SQL Ordered by Version Count: These SQLs have a large number of versions in shared pool for some reason.- Complete List of SQL Text:
Instance Activity StatsThis section contains statistical information describing how the database operated during the snapshot period.- Instance Activity Stats - Absolute Values: This section contains statistics that have absolute values not derived from end and start snapshots.- Instance Activity Stats - Thread Activity: This report section reports a log switch activity statistic.
I/O Stats SectionThis section shows the all important I/O activity for the instance and shows I/O activity by tablespace, data file, and includes buffer pool statistics.- Tablespace IO Stats - File IO Stats
Buffer Pool Statistics Section
Advisory Statistics SectionThis section show details of the advisories for the buffer, shared pool, PGA and Java pool.- Instance Recovery Stats: - Buffer Pool Advisory: - PGA Aggr Summary: PGA Aggr Target Stats; PGA Aggr Target Histogram; and PGA Memory Advisory. - Shared Pool Advisory: - SGA Target Advisory- Stream Spool Advisory- Java Pool Advisory
Wait Stat ist ics Sect ion- Buffer Wait Statistics: This important section shows buffer cache waits statistics.- Enqueue Activity: This important section shows how enqueue operates in the database. Enqueues are special internal structures which provide concurrentaccess to various database resources.
Undo Statistics Section- Undo Segment Summary: This section gives a summary about how undo segments are used by the database.- Undo Segment Stats: This section shows detailed history information about undo segment activity.
Latch Statistics Section:This sect ion shows details about latch stat ist ics. Latches are a lightweight serializat ion mechanism that is used to single-thread access to
PDFmyURL.com
internal Oracle structures.- Latch Activity- Latch Sleep Breakdown- Latch Miss Sources- Parent Latch Statistics- Child Latch Statistics
Segment Statistics Section:This report sect ion provides details about hot segments using the following criteria:- Segments by Logical Reads: Includes top segments which experienced high number of logical reads.- Segments by Physical Reads: Includes top segments which experienced high number of disk physical reads.- Segments by Row Lock Waits: Includes segments that had a large number of row locks on their data.- Segments by ITL Waits: Includes segments that had a large contention for Interested Transaction List (ITL). The contention for ITL can be reduced byincreasing INITRANS storage parameter of the table.- Segments by Buffer Busy Waits: These segments have the largest number of buffer waits caused by their data blocks.
Dictionary Cache Stats SectionThis sect ion exposes details about how the data dict ionary cache is operat ing.
Library Cache Sect ionIncludes library cache statistics describing how shared library objects are managed by Oracle.
Memory Statistics Section- Process Memory Summary- SGA Memory Summary: This section provides summary information about various SGA regions.- SGA Breakdown difference:
Streams Statistics Section- Streams CPU/IO Usage- Streams Capture- Streams Apply- Buffered Queues- Buffered Subscribers- Rule Set
Reading the AWR Report PDFmyURL.com
The main sect ions in an AWR report include:
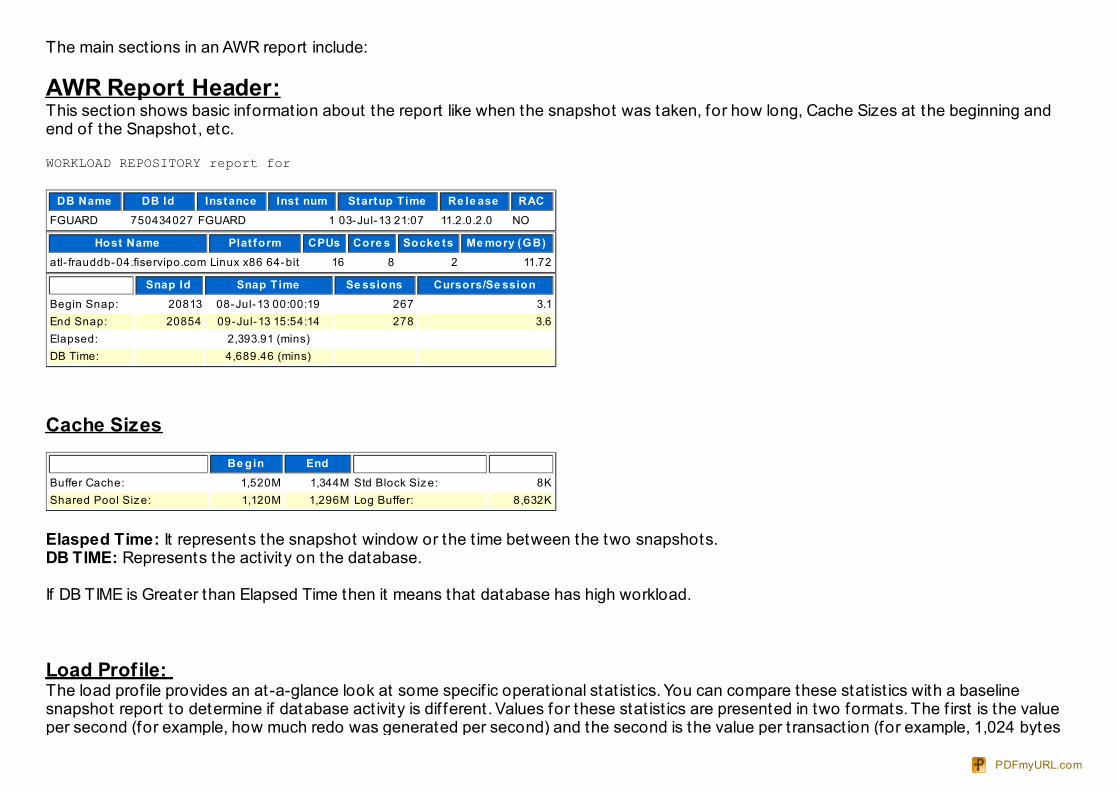
AWR Report Header:This sect ion shows basic informat ion about the report like when the snapshot was taken, for how long, Cache Sizes at the beginning andend of the Snapshot, etc.
WORKLOAD REPOSITORY report for
DB Name DB Id Instance Inst num Startup T ime Re le ase RACFGUARD 750434027 FGUARD 1 03-Jul-13 21:07 11.2.0.2.0 NO
Host Name Plat form CPUs Core s Socke ts Me mory (GB)atl- frauddb-04.fiservipo.com Linux x86 64-bit 16 8 2 11.72
Snap Id Snap T ime Se ssions Cursors/Se ssionBegin Snap: 20813 08-Jul-13 00:00:19 267 3.1End Snap: 20854 09-Jul-13 15:54:14 278 3.6Elapsed: 2,393.91 (mins) DB Time: 4,689.46 (mins)
Cache Sizes
Be gin EndBuffer Cache: 1,520M 1,344M Std Block Siz e: 8KShared Pool Siz e: 1,120M 1,296M Log Buffer: 8,632K
Elasped Time: It represents the snapshot window or the t ime between the two snapshots.DB TIME: Represents the act ivity on the database.
If DB TIME is Greater than Elapsed Time then it means that database has high workload.
Load Profile: The load prof ile provides an at-a-glance look at some specif ic operat ional stat ist ics. You can compare these stat ist ics with a baselinesnapshot report to determine if database act ivity is dif ferent. Values for these stat ist ics are presented in two formats. The f irst is the valueper second (for example, how much redo was generated per second) and the second is the value per t ransact ion (for example, 1,024 bytes
PDFmyURL.com
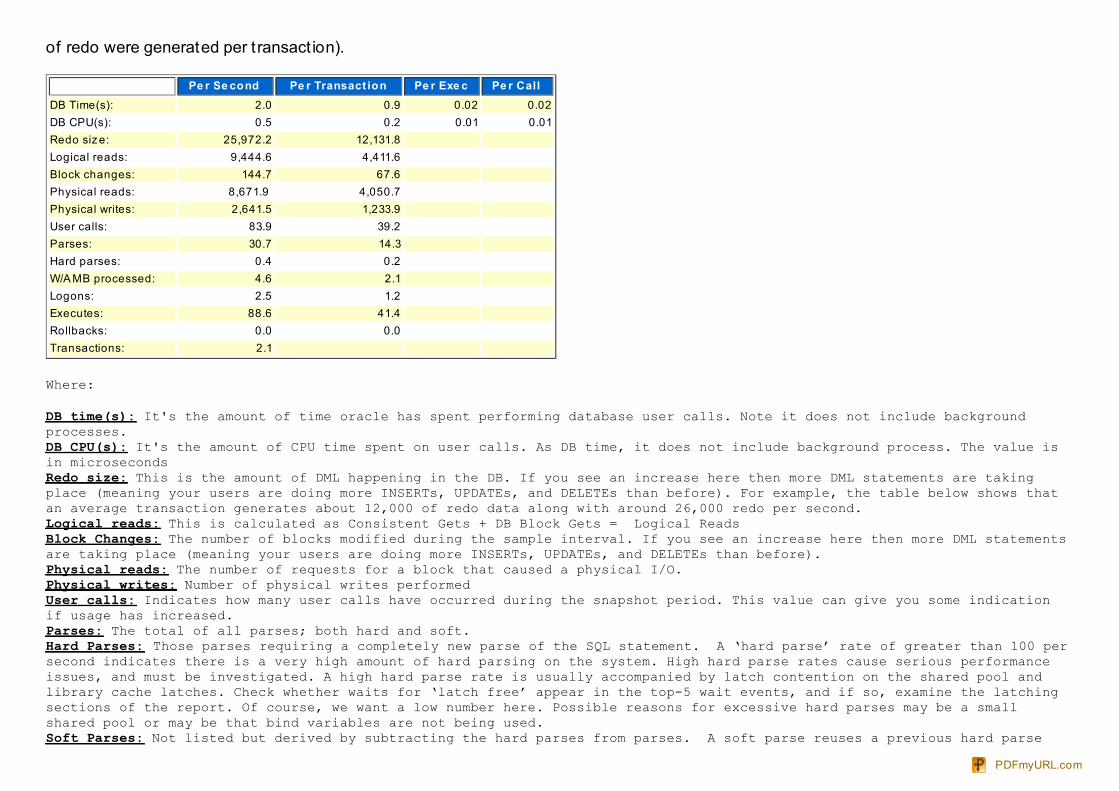
of redo were generated per t ransact ion).
Pe r Se cond Pe r Transact ion Pe r Exe c Pe r CallDB Time(s): 2.0 0.9 0.02 0.02DB CPU(s): 0.5 0.2 0.01 0.01Redo siz e: 25,972.2 12,131.8 Logical reads: 9,444.6 4,411.6 Block changes: 144.7 67.6 Physical reads: 8,671.9 4,050.7 Physical writes: 2,641.5 1,233.9 User calls: 83.9 39.2 Parses: 30.7 14.3 Hard parses: 0.4 0.2 W/A MB processed: 4.6 2.1 Logons: 2.5 1.2 Executes: 88.6 41.4 Rollbacks: 0.0 0.0 Transactions: 2.1
Where:
DB time(s): It's the amount of time oracle has spent performing database user calls. Note it does not include backgroundprocesses.DB CPU(s): It's the amount of CPU time spent on user calls. As DB time, it does not include background process. The value isin microsecondsRedo size: This is the amount of DML happening in the DB. If you see an increase here then more DML statements are takingplace (meaning your users are doing more INSERTs, UPDATEs, and DELETEs than before). For example, the table below shows thatan average transaction generates about 12,000 of redo data along with around 26,000 redo per second.Logical reads: This is calculated as Consistent Gets + DB Block Gets = Logical ReadsBlock Changes: The number of blocks modified during the sample interval. If you see an increase here then more DML statementsare taking place (meaning your users are doing more INSERTs, UPDATEs, and DELETEs than before).Physical reads: The number of requests for a block that caused a physical I/O.Physical writes: Number of physical writes performedUser calls: Indicates how many user calls have occurred during the snapshot period. This value can give you some indicationif usage has increased.Parses: The total of all parses; both hard and soft.Hard Parses: Those parses requiring a completely new parse of the SQL statement. A ‘hard parse’ rate of greater than 100 persecond indicates there is a very high amount of hard parsing on the system. High hard parse rates cause serious performanceissues, and must be investigated. A high hard parse rate is usually accompanied by latch contention on the shared pool andlibrary cache latches. Check whether waits for ‘latch free’ appear in the top-5 wait events, and if so, examine the latchingsections of the report. Of course, we want a low number here. Possible reasons for excessive hard parses may be a smallshared pool or may be that bind variables are not being used.Soft Parses: Not listed but derived by subtracting the hard parses from parses. A soft parse reuses a previous hard parse
PDFmyURL.com
and hence consumes far fewer resources. A high soft parse rate could be anywhere in the rate of 300 or more per second.Unnecessary soft parses also limit application scalability; optimally a SQL statement should be soft-parsed once per session,and executed many times.Sorts: Number of sorts occurring in the databaseLogons: No of logons during the intervalExecutes: how many statements we are executing per second / transactionTransactions: How many transactions per second we process
The per-second stat ist ics show you the changes in throughput (i.e. whether the instance is performing more work per second). For example:• a signif icant increase in ‘redo size’, ‘block changes’ and ‘pct of blocks changed per read’ would indicate the instance is performing moreinserts/updates/deletes.• an increase in the ‘redo size’ without an increase in the number of ‘t ransact ions per second’ would indicate a changing transact ion prof ile.Similarly, looking at the per-t ransact ion stat ist ics allows you to ident ify changes in the applicat ion characterist ics by comparing these to thecorresponding stat ist ics f rom the baseline report .
Addit ionally, the load prof ile sect ion provides the percentage of blocks that were changed per read, the percentage of recursive calls thatoccurred, the percentage of t ransact ions that were rolled back and the number of rows sorted per sort operat ion.
In this example• Comparing the number of Physical reads per second to the number of Physical writes per second shows the physical read to physical writerat io is very high. Typical OLTP systems have a read-to-write rat io of 10:1 or 5:1• This system is busy, with 84 User calls per second.
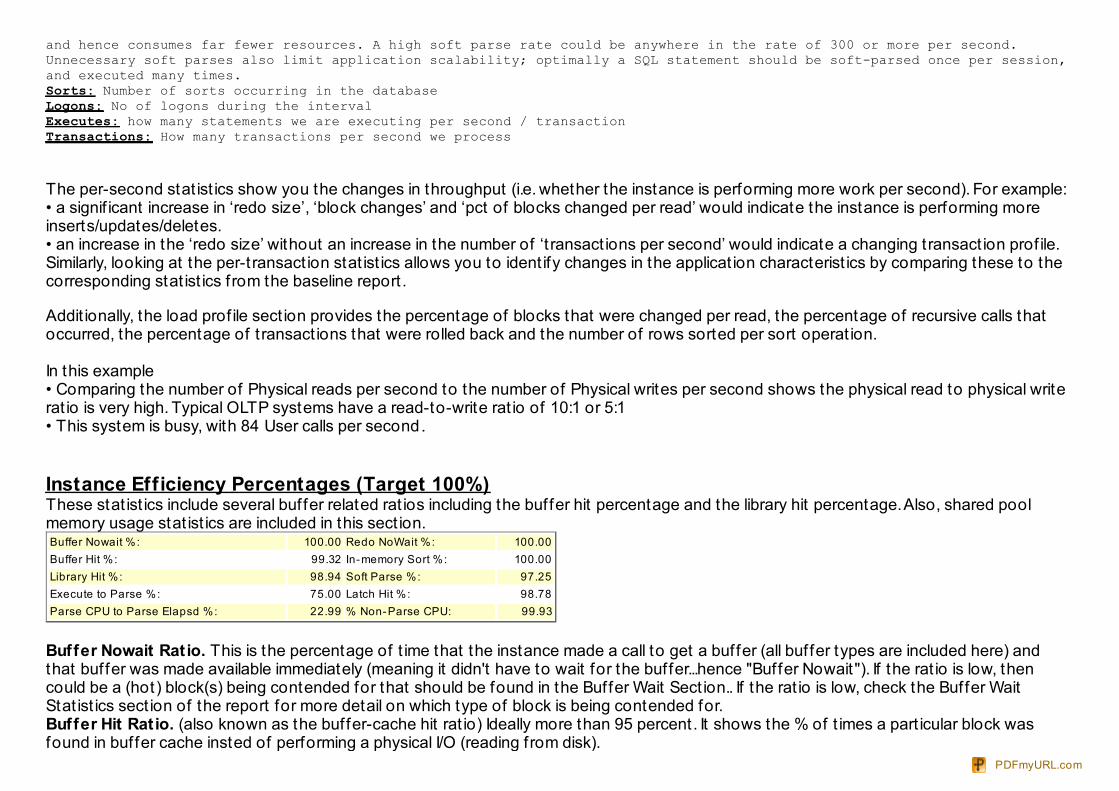
Instance Efficiency Percentages (Target 100%)These stat ist ics include several buffer related rat ios including the buffer hit percentage and the library hit percentage. Also, shared poolmemory usage stat ist ics are included in this sect ion.Buffer Nowait %: 100.00 Redo NoWait %: 100.00Buffer Hit %: 99.32 In-memory Sort %: 100.00Library Hit %: 98.94 Soft Parse %: 97.25Execute to Parse %: 75.00 Latch Hit %: 98.78Parse CPU to Parse Elapsd %: 22.99 % Non-Parse CPU: 99.93
Buffer Nowait Rat io. This is the percentage of t ime that the instance made a call to get a buffer (all buf fer types are included here) andthat buffer was made available immediately (meaning it didn't have to wait for the buffer...hence "Buffer Nowait"). If the rat io is low, thencould be a (hot) block(s) being contended for that should be found in the Buffer Wait Sect ion.. If the rat io is low, check the Buffer WaitStat ist ics sect ion of the report for more detail on which type of block is being contended for.Buffer Hit Rat io. (also known as the buffer-cache hit rat io) Ideally more than 95 percent. It shows the % of t imes a part icular block wasfound in buffer cache insted of performing a physical I/O (reading from disk).
PDFmyURL.com
Although historically known as one of the most important stat ist ics to evaluate, this rat io can sometimes be misleading. A low buffer hit rat iodoes not necessarily mean the cache is too small; it may be that potent ially valid full-table scans are art if icially reducing what is otherwise agood rat io. Similarly, a high buffer hit rat io (say, 99 percent) normally indicates that the cache is adequately sized, but this assumption maynot always be valid. For example, f requent ly executed SQL statements that repeatedly refer to a small number of buffers via indexedlookups can create a misleadingly high buffer hit rat io. When these buffers are read, they are placed at the most recent ly used (MRU) end ofthe buffer cache; iterat ive access to these buffers can art if icially inf late the buffer hit rat io. This inf lat ion makes tuning the buffer cache achallenge. Sometimes you can ident ify a too-small buf fer cache by the appearance of the write complete waits event, which indicates thathot blocks (that is, blocks that are st ill being modif ied) are aging out of the cache while they are st ill needed; check the Wait Events list forevidence of this event. If the number is negat ive, the BUFFER_CACHE is too small and the data is bein aged out before it can be used.Library Hit Rat io. This rat io, also known as the library-cache hit rat io, gives the percentage of pin requests that result in pin hits. A pin hitoccurs when the SQL or PL/SQL code to be executed is already in the library cache and is valid to execute. If the "Library Hit rat io" is low, itcould be indicat ive of a shared pool that is too small (SQL is prematurely pushed out of the shared pool), or just as likely, that the system didnot make correct use of bind variables in the applicat ion. If the soft parse rat io is also low, check whether there's a parsing issue. A lowerrat io could also indicate that bind variables are not used or some other issue is causing SQL not to be reused (in which case a smaller sharedpool may only be a band-aid that will potent ially f ix a library latch problem which may result ). Execute to Parse. If value is negat ive, it means that the number of parses is larger than the number of execut ions. Another cause for anegat ive execute to parse rat io is if the shared pool is too small and queries are aging out of the shared pool and need to be reparsed. Thisis another form of thrashing which also degrades performance tremendously. So, if you run some SQL and it has to be parsed every t imeyou execute it (because no plan exists for this statement) then your percentage would be 0%. The more t imes that your SQL statement canreuse an exist ing plan the higher your Execute to Parse rat io is. This is very BAD!! One way to increase your parse rat io is to use bindvariables. Parse CPU to Parse Elapsd %: Generally, this is a measure of how available your CPU cycles were for SQL parsing. If this is low, you maysee "latch f ree" as one of your top wait events.Redo Nowait Rat io. This rat io indicates the amount of redo entries generated for which there was space available in the redo log. Theinstance didn't have to wait to use the redo log if this is 100%The redo-log space-request stat ist ic is incremented when an Oracle process at tempts to write a redo-log entry but there is not suf f icientspace remaining in the online redo log. Thus, a value close to 100 percent for the redo nowait rat io indicates minimal t ime spent wait ing forredo logs to become available, either because the logs are not f illing up very of ten or because the database is able to switch to a new logquickly whenever the current log f ills up.If your alert log shows that you are switching logs frequent ly (that is, more than once every 15 minutes), you may be able to reduce theamount of switching by increasing the size of the online redo logs. If the log switches are not f requent, check the disks on which the redologs reside to see why the switches are not happening quickly. If these disks are not overloaded, they may be slow, which means you couldput the f iles on faster disks.In-Memory Sort Rat io. This rat io gives the percentage of sorts that were performed in memory, rather than requiring a disk-sort segment tocomplete the sort . Opt imally, in an OLTP environment, this rat io should be high. Sett ing the PGA_AGGREGATE_TARGET (orSORT_AREA_SIZE) init ializat ion parameter ef fect ively will eliminate this problem, as a minimum you pretend to have this one in 95%Soft Parse Ratio. This rat io gives the percentage of parses that were soft , as opposed to hard. A soft parse occurs when a sessionattempts to execute a SQL statement and a usable version of the statement is already in the shared pool. In other words, all data (such as
PDFmyURL.com
the opt imizer execut ion plan) pertaining to the statement in the shared pool is equally applicable to the statement current ly being issued. Ahard parse, on the other hand, occurs when the current SQL statement is either not in the shared pool or not there in a shareable form. Anexample of the lat ter case would be when the SQL statement in the shared pool is textually ident ical to the current statement but the tablesreferred to in the two statements resolve to physically dif ferent tables.Hard parsing is an expensive operat ion and should be kept to a minimum in an OLTP environment. The aim is to parse once, execute manyt imes.Ideally, the soft parse rat io should be greater than 95 percent. When the soft parse rat io falls much below 80 percent, invest igate whetheryou can share SQL by using bind variables or force cursor sharing by using the init.ora parameter cursor_sharing.Before you jump to any conclusions about your sof t parse rat io, however, be sure to compare it against the actual hard and soft parse ratesshown in the Load Prof ile. If the rates are low (for example, 1 parse per second), parsing may not be a signif icant issue in your system.Another useful standard of comparison is the proport ion of parse t ime that was not CPU-related, given by the following rat io:(parse time CPU) / (parse time elapsed)
A low value for this rat io could mean that the non-CPU-related parse t ime was spent wait ing for latches, which might indicate a parsing orlatching problem. To invest igate further, look at the shared-pool and library-cache latches in the Latch sect ions of the report for indicat ionsof content ion on these latches.Latch Hit Rat io. This is the rat io of the total number of latch misses to the number of latch gets for all latches. A low value for this rat ioindicates a latching problem, whereas a high value is generally good. However, as the data is rolled up over all latches, a high latch hit rat iocan art if icially mask a low get rate on a specif ic latch. Cross-check this value with the Top 5 Wait Events to see if latch f ree is in the list , andrefer to the Latch sect ions of the report . Latch Hit % of less than 99 percent is usually a big problem.
Also check the "Shared Pool Stat ist ics", if the "End" value is in the high 95%-100% range ,this is a indicat ion that the shared pool needs tobe increased (especially if the "Begin" value is much smaller)
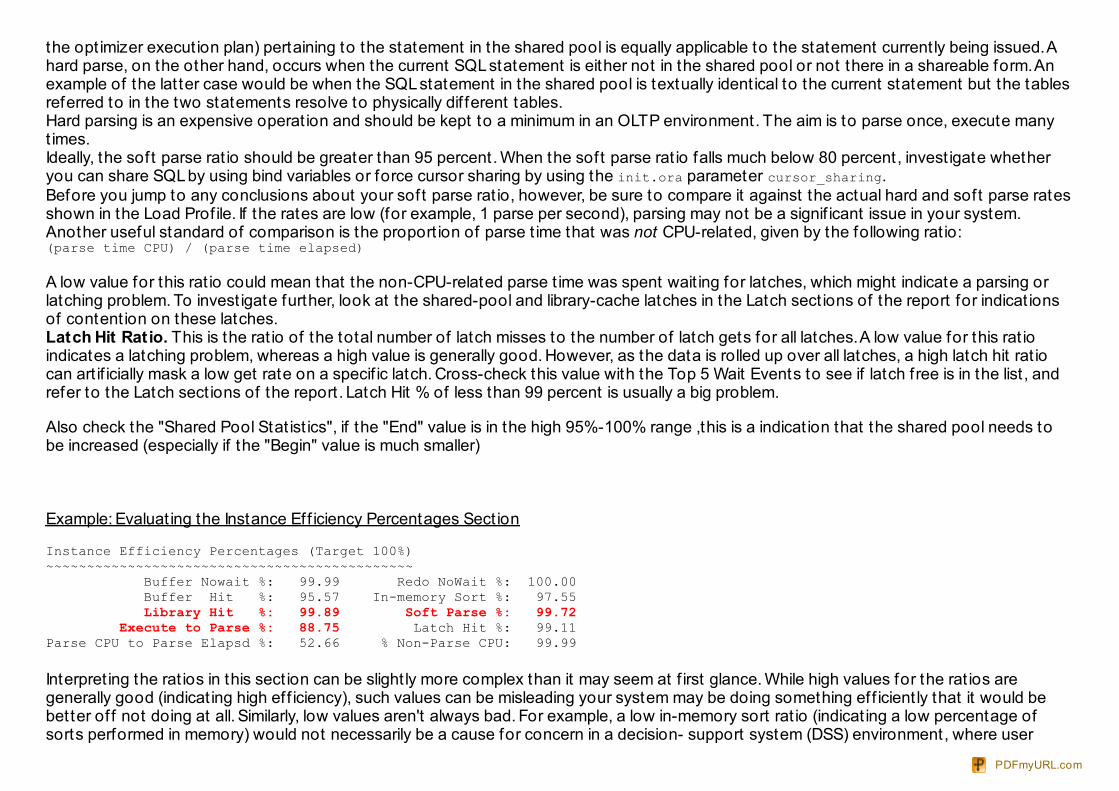
Example: Evaluat ing the Instance Eff iciency Percentages Sect ion
Instance Efficiency Percentages (Target 100%)~~~~~~~~~~~~~~~~~~~~~~~~~~~~~~~~~~~~~~~~~~~~~ Buffer Nowait %: 99.99 Redo NoWait %: 100.00 Buffer Hit %: 95.57 In-memory Sort %: 97.55 Library Hit %: 99.89 Soft Parse %: 99.72 Execute to Parse %: 88.75 Latch Hit %: 99.11Parse CPU to Parse Elapsd %: 52.66 % Non-Parse CPU: 99.99
Interpret ing the rat ios in this sect ion can be slight ly more complex than it may seem at f irst glance. While high values for the rat ios aregenerally good (indicat ing high ef f iciency), such values can be misleading your system may be doing something ef f icient ly that it would bebetter of f not doing at all. Similarly, low values aren't always bad. For example, a low in-memory sort rat io (indicat ing a low percentage ofsorts performed in memory) would not necessarily be a cause for concern in a decision- support system (DSS) environment, where user
PDFmyURL.com
response t ime is less crit ical than in an online t ransact ion processing (OLTP) environment.Basically, you need to keep in mind the characterist ics of your applicat ion - whether it is query-intensive or update-intensive, whether itinvolves lots of sort ing, and so on - when you're evaluat ing the Instance Eff iciency Percentages.
The following rat ios should be above 90% in a database.Buffer NowaitBuffer Hit Library HitRedo NoWait In-memory Sort Soft Parse Latch Hit Non-Parse CPU
The execute to parse rat io should be very high in a ideal database.The execute to parse rat io is basically a measure between the number of t imes a sql is executed versus the number of t imes it is parsed.The rat io will move higher as the number of executes go up, while the number of parses either go down or remain the same.The rat io will be close to zero if the number of executes and parses are almost equal.The rat io will be negat ive executes are lower but the parses are higher.
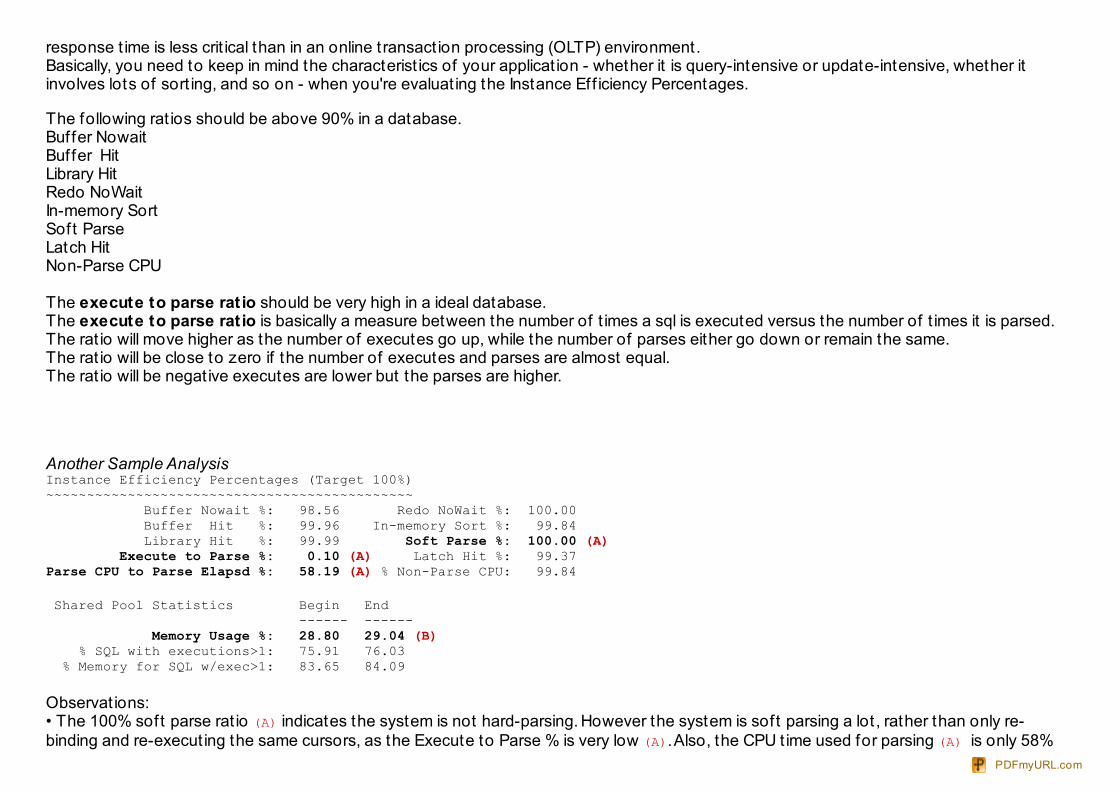
Another Sample AnalysisInstance Efficiency Percentages (Target 100%)~~~~~~~~~~~~~~~~~~~~~~~~~~~~~~~~~~~~~~~~~~~~~ Buffer Nowait %: 98.56 Redo NoWait %: 100.00 Buffer Hit %: 99.96 In-memory Sort %: 99.84 Library Hit %: 99.99 Soft Parse %: 100.00 (A) Execute to Parse %: 0.10 (A) Latch Hit %: 99.37Parse CPU to Parse Elapsd %: 58.19 (A) % Non-Parse CPU: 99.84
Shared Pool Statistics Begin End ------ ------ Memory Usage %: 28.80 29.04 (B) % SQL with executions>1: 75.91 76.03 % Memory for SQL w/exec>1: 83.65 84.09
Observat ions:• The 100% soft parse rat io (A) indicates the system is not hard-parsing. However the system is sof t parsing a lot , rather than only re-binding and re-execut ing the same cursors, as the Execute to Parse % is very low (A). Also, the CPU t ime used for parsing (A) is only 58%
PDFmyURL.com
of the total elapsed parse t ime (see Parse CPU to Parse Elapsd). This may also imply some resource content ion during parsing (possiblyrelated to the latch f ree event?).• There seems to be a lot of unused memory in the shared pool (only 29% is used) (B). If there is insuff icient memory allocated to otherareas of the database (or OS), this memory could be redeployed
***Please see the following NOTES on shared pool issues[NOTE:146599.1] Diagnosing and Resolving Error ORA-04031[NOTE:62143.1] Understanding and Tuning the Shared Pool[NOTE:105813.1] SCRIPT TO SUGGEST MINIMUM SHARED POOL SIZE
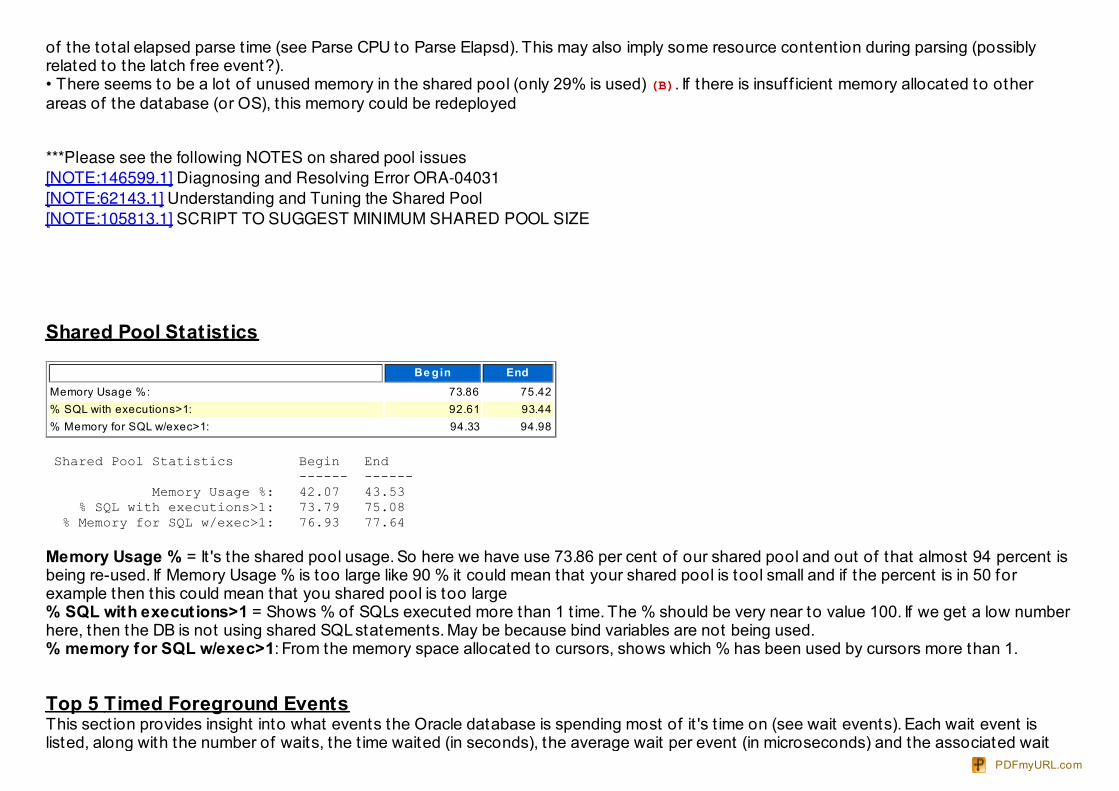
Shared Pool Statistics
Be gin EndMemory Usage %: 73.86 75.42% SQL with executions>1: 92.61 93.44% Memory for SQL w/exec>1: 94.33 94.98
Shared Pool Statistics Begin End ------ ------ Memory Usage %: 42.07 43.53 % SQL with executions>1: 73.79 75.08 % Memory for SQL w/exec>1: 76.93 77.64
Memory Usage % = It 's the shared pool usage. So here we have use 73.86 per cent of our shared pool and out of that almost 94 percent isbeing re-used. If Memory Usage % is too large like 90 % it could mean that your shared pool is tool small and if the percent is in 50 forexample then this could mean that you shared pool is too large% SQL with executions>1 = Shows % of SQLs executed more than 1 t ime. The % should be very near to value 100. If we get a low numberhere, then the DB is not using shared SQL statements. May be because bind variables are not being used.% memory for SQL w/exec>1: From the memory space allocated to cursors, shows which % has been used by cursors more than 1.
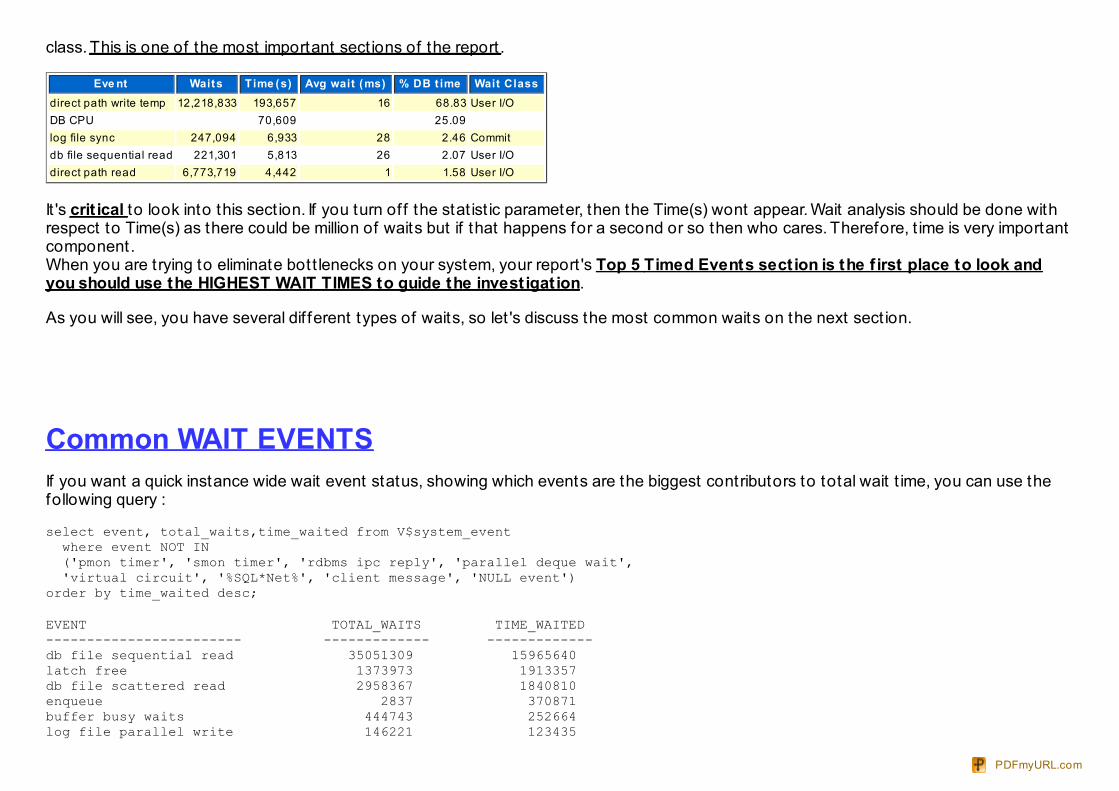
Top 5 Timed Foreground EventsThis sect ion provides insight into what events the Oracle database is spending most of it 's t ime on (see wait events). Each wait event islisted, along with the number of waits, the t ime waited (in seconds), the average wait per event (in microseconds) and the associated wait
PDFmyURL.com
http://metalink.oracle.com/metalink/plsql/ml2_documents.showDocument?p_id=146599.1&p_database_id=NOT
class. This is one of the most important sect ions of the report .
Eve nt Waits Time (s) Avg wait (ms) % DB t ime Wait Classdirect path write temp 12,218,833 193,657 16 68.83 User I/ODB CPU 70,609 25.09 log file sync 247,094 6,933 28 2.46 Commitdb file sequential read 221,301 5,813 26 2.07 User I/Odirect path read 6,773,719 4,442 1 1.58 User I/O
It 's crit ical to look into this sect ion. If you turn of f the stat ist ic parameter, then the Time(s) wont appear. Wait analysis should be done withrespect to Time(s) as there could be million of waits but if that happens for a second or so then who cares. Therefore, t ime is very importantcomponent.When you are t rying to eliminate bott lenecks on your system, your report 's Top 5 Timed Events sect ion is the f irst place to look andyou should use the HIGHEST WAIT TIMES to guide the invest igat ion.
As you will see, you have several dif ferent types of waits, so let 's discuss the most common waits on the next sect ion.
Common WAIT EVENTSIf you want a quick instance wide wait event status, showing which events are the biggest contributors to total wait t ime, you can use thefollowing query :
select event, total_waits,time_waited from V$system_event where event NOT IN ('pmon timer', 'smon timer', 'rdbms ipc reply', 'parallel deque wait', 'virtual circuit', '%SQL*Net%', 'client message', 'NULL event')order by time_waited desc;
EVENT TOTAL_WAITS TIME_WAITED------------------------ ------------- -------------db file sequential read 35051309 15965640latch free 1373973 1913357db file scattered read 2958367 1840810enqueue 2837 370871buffer busy waits 444743 252664log file parallel write 146221 123435
PDFmyURL.com
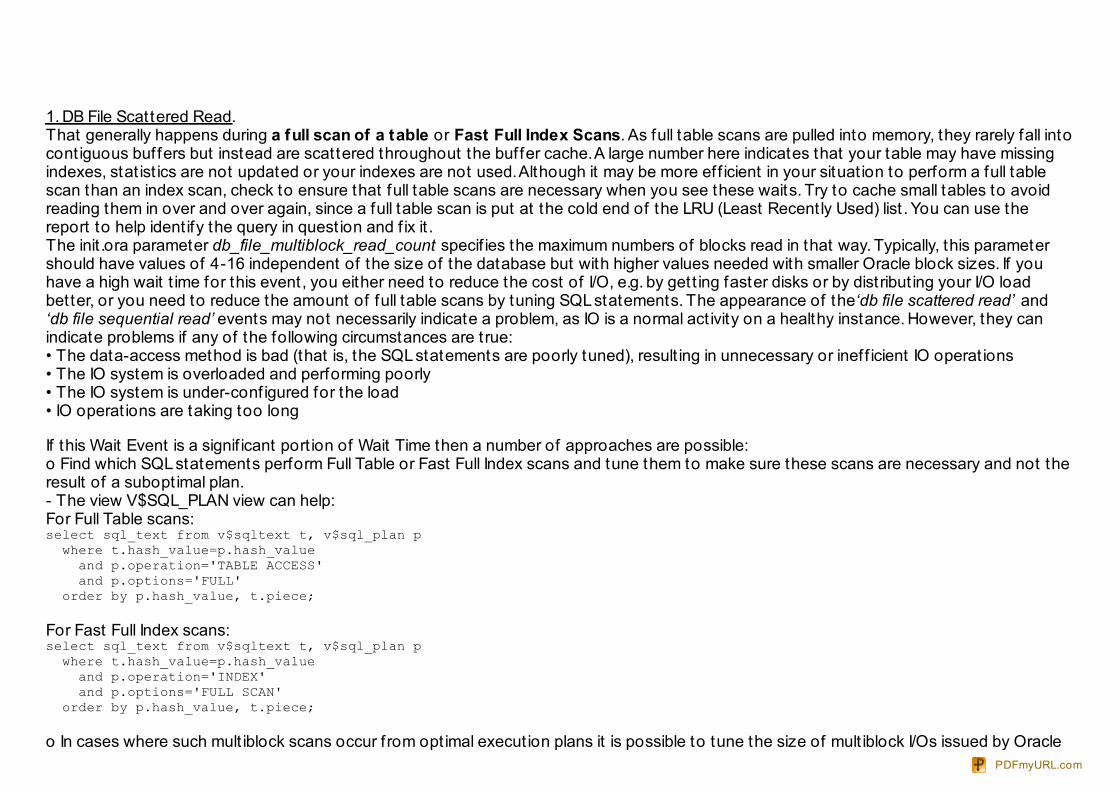
1. DB File Scattered Read. That generally happens during a full scan of a table or Fast Full Index Scans. As full table scans are pulled into memory, they rarely fall intocont iguous buffers but instead are scattered throughout the buffer cache. A large number here indicates that your table may have missingindexes, stat ist ics are not updated or your indexes are not used. Although it may be more ef f icient in your situat ion to perform a full tablescan than an index scan, check to ensure that full table scans are necessary when you see these waits. Try to cache small tables to avoidreading them in over and over again, since a full table scan is put at the cold end of the LRU (Least Recent ly Used) list . You can use thereport to help ident ify the query in quest ion and f ix it .The init .ora parameter db_file_multiblock_read_count specif ies the maximum numbers of blocks read in that way. Typically, this parametershould have values of 4-16 independent of the size of the database but with higher values needed with smaller Oracle block sizes. If youhave a high wait t ime for this event, you either need to reduce the cost of I/O, e.g. by gett ing faster disks or by distribut ing your I/O loadbetter, or you need to reduce the amount of full table scans by tuning SQL statements. The appearance of the‘db file scattered read’ and‘db file sequential read’ events may not necessarily indicate a problem, as IO is a normal act ivity on a healthy instance. However, they canindicate problems if any of the following circumstances are t rue:• The data-access method is bad (that is, the SQL statements are poorly tuned), result ing in unnecessary or inef f icient IO operat ions• The IO system is overloaded and performing poorly• The IO system is under-conf igured for the load• IO operat ions are taking too long
If this Wait Event is a signif icant port ion of Wait Time then a number of approaches are possible:o Find which SQL statements perform Full Table or Fast Full Index scans and tune them to make sure these scans are necessary and not theresult of a subopt imal plan.- The view V$SQL_PLAN view can help:For Full Table scans:select sql_text from v$sqltext t, v$sql_plan p where t.hash_value=p.hash_value and p.operation='TABLE ACCESS' and p.options='FULL' order by p.hash_value, t.piece;
For Fast Full Index scans:select sql_text from v$sqltext t, v$sql_plan p where t.hash_value=p.hash_value and p.operation='INDEX' and p.options='FULL SCAN' order by p.hash_value, t.piece;
o In cases where such mult iblock scans occur f rom opt imal execut ion plans it is possible to tune the size of mult iblock I/Os issued by Oracle PDFmyURL.com
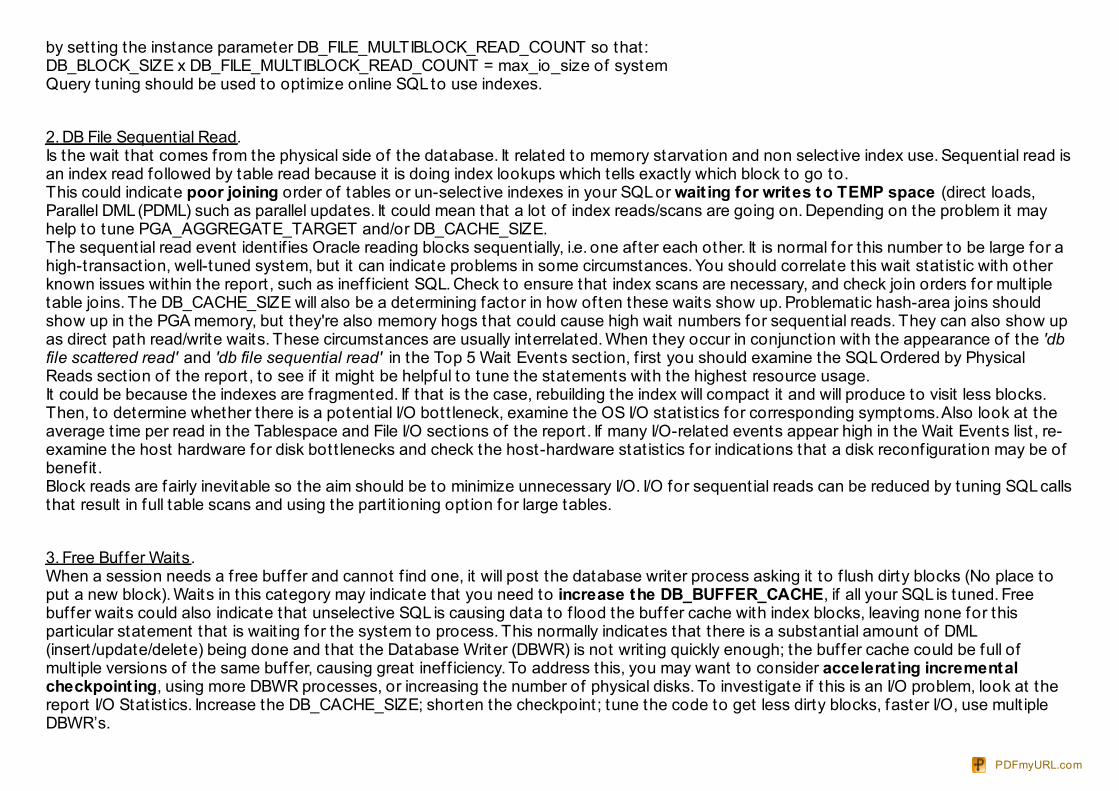
by sett ing the instance parameter DB_FILE_MULTIBLOCK_READ_COUNT so that:DB_BLOCK_SIZE x DB_FILE_MULTIBLOCK_READ_COUNT = max_io_size of system Query tuning should be used to opt imize online SQL to use indexes.
2. DB File Sequent ial Read. Is the wait that comes from the physical side of the database. It related to memory starvat ion and non select ive index use. Sequent ial read isan index read followed by table read because it is doing index lookups which tells exact ly which block to go to.This could indicate poor joining order of tables or un-select ive indexes in your SQL or wait ing for writes to TEMP space (direct loads,Parallel DML (PDML) such as parallel updates. It could mean that a lot of index reads/scans are going on. Depending on the problem it mayhelp to tune PGA_AGGREGATE_TARGET and/or DB_CACHE_SIZE. The sequent ial read event ident if ies Oracle reading blocks sequent ially, i.e. one af ter each other. It is normal for this number to be large for ahigh-transact ion, well-tuned system, but it can indicate problems in some circumstances. You should correlate this wait stat ist ic with otherknown issues within the report , such as inef f icient SQL. Check to ensure that index scans are necessary, and check join orders for mult ipletable joins. The DB_CACHE_SIZE will also be a determining factor in how often these waits show up. Problemat ic hash-area joins shouldshow up in the PGA memory, but they're also memory hogs that could cause high wait numbers for sequent ial reads. They can also show upas direct path read/write waits. These circumstances are usually interrelated. When they occur in conjunct ion with the appearance of the 'dbfile scattered read' and 'db file sequential read' in the Top 5 Wait Events sect ion, f irst you should examine the SQL Ordered by PhysicalReads sect ion of the report , to see if it might be helpful to tune the statements with the highest resource usage. It could be because the indexes are f ragmented. If that is the case, rebuilding the index will compact it and will produce to visit less blocks.Then, to determine whether there is a potent ial I/O bott leneck, examine the OS I/O stat ist ics for corresponding symptoms. Also look at theaverage t ime per read in the Tablespace and File I/O sect ions of the report . If many I/O-related events appear high in the Wait Events list , re-examine the host hardware for disk bott lenecks and check the host-hardware stat ist ics for indicat ions that a disk reconf igurat ion may be ofbenef it .Block reads are fairly inevitable so the aim should be to minimize unnecessary I/O. I/O for sequent ial reads can be reduced by tuning SQL callsthat result in full table scans and using the part it ioning opt ion for large tables.
3. Free Buffer Waits.When a session needs a f ree buffer and cannot f ind one, it will post the database writer process asking it to f lush dirty blocks (No place toput a new block). Waits in this category may indicate that you need to increase the DB_BUFFER_CACHE, if all your SQL is tuned. Freebuffer waits could also indicate that unselect ive SQL is causing data to f lood the buffer cache with index blocks, leaving none for thispart icular statement that is wait ing for the system to process. This normally indicates that there is a substant ial amount of DML(insert /update/delete) being done and that the Database Writer (DBWR) is not writ ing quickly enough; the buffer cache could be full ofmult iple versions of the same buffer, causing great inef f iciency. To address this, you may want to consider accelerat ing incrementalcheckpoint ing, using more DBWR processes, or increasing the number of physical disks. To invest igate if this is an I/O problem, look at thereport I/O Stat ist ics. Increase the DB_CACHE_SIZE; shorten the checkpoint ; tune the code to get less dirty blocks, faster I/O, use mult ipleDBWR’s.
PDFmyURL.com
4. Buffer Busy Waits. A buffer busy wait happens when mult iple processes concurrent ly want to modify the same block in the buffer cache.This typically happens during massive parallel inserts if your tables do not have free lists and it can happen if you have too few rollbacksegments. Buffer busy waits should not be greater than 1 percent . Check the Buffer Wait Stat ist ics sect ion (or V$WAITSTAT) to f indout if the wait is on a segment header. If this is the case, increase the freelist groups or increase the pctused to pct f ree gap. If the wait is onan undo header, you can address this by adding rollback segments; if it 's on an undo block, you need to reduce the data density on the tabledriving this consistent read or increase the DB_CACHE_SIZE. If the wait is on a data block, you can move data to another block to avoid thishot block, increase the freelists on the table, or use Locally Managed Tablespaces (LMTs). If it 's on an index block, you should rebuild theindex, part it ion the index, or use a reverse key index. To prevent buffer busy waits related to data blocks, you can also use a smaller blocksize: fewer records fall within a single block in this case, so it 's not as "hot." When a DML (insert /update/ delete) occurs, Oracle writesinformat ion into the block, including all users who are "interested" in the state of the block (Interested Transact ion List , ITL). To decreasewaits in this area, you can increase the init rans, which will create the space in the block to allow mult iple ITL slots. You can also increase thepctfree on the table where this block exists (this writes the ITL informat ion up to the number specif ied by maxtrans, when there are notenough slots built with the init rans that is specif ied). Buffer busy waits can be reduced by using reverse-key indexes for busy indexes and bypart it ioning busy tables.Buffer Busy Wait on Segment Header – Add freelists (if inserts) or f reelist groups (esp. RAC). Use ASSM.Buffer Busy Wait on Data Block – Separate ‘hot ’ data; potent ially use reverse key indexes; f ix queries to reduce the blocks popularity, usesmaller blocks, I/O, Increase init rans and/or maxtrans (this one’s debatable). Reduce records per blockBuffer Busy Wait on Undo Header – Add rollback segments or increase size of segment area (auto undo) Buffer Busy Wait on Undo block – Commit more (not too much) Larger rollback segments/area. Try to f ix the SQL.
5. Latch Free. Latches are low-level queuing mechanisms (they're accurately referred to as mutual exclusion mechanisms) used to protectshared memory structures in the system global area (SGA). Latches are like locks on memory that are very quickly obtained and released.Latches are used to prevent concurrent access to a shared memory structure. If the latch is not available, a latch f ree miss is recorded. Mostlatch problems are related to the failure to use bind variables (library cache latch), redo generat ion issues (redo allocat ion latch), buf fer cachecontent ion issues (cache buffers LRU chain), and hot blocks in the buffer cache (cache buffers chain). There are also latch waits related tobugs; check MetaLink for bug reports if you suspect this is the case. When latch miss rat ios are greater than 0.5 percent, you shouldinvest igate the issue. If latch f ree waits are in the Top 5 Wait Events or high in the complete Wait Events list , look at the latch-specif icsect ions of the report to see which latches are contended for.
6. Enqueue. An enqueue is a lock that protects a shared resource. Locks protect shared resources, such as data in a record, to prevent twopeople f rom updat ing the same data at the same t ime applicat ion, e.g. when a select for update is executed.. An enqueue includes a queuingmechanism, which is FIFO (f irst in, f irst out). Note that Oracle's latching mechanism is not FIFO. Enqueue waits usually point to the STenqueue, the HW enqueue, the TX4 enqueue, and the TM enqueue. The ST enqueue is used for space management and allocat ion fordict ionary-managed tablespaces. Use LMTs, or t ry to preallocate extents or at least make the next extent larger for problemat ic dict ionary-managed tablespaces. HW enqueues are used with the high-water mark of a segment; manually allocat ing the extents can circumvent this
PDFmyURL.com
wait . TX4s are the most common enqueue waits. TX4 enqueue waits are usually the result of one of three issues. The f irst issue isduplicates in a unique index; you need to commit /rollback to f ree the enqueue. The second is mult iple updates to the same bitmap indexfragment. Since a single bitmap fragment may contain mult iple rowids, you need to issue a commit or rollback to f ree the enqueue whenmult iple users are t rying to update the same fragment. The third and most likely issue is when mult iple users are updating the same block.If there are no free ITL slots, a block-level lock could occur. You can easily avoid this scenario by increasing the init rans and/or maxtrans toallow mult iple ITL slots and/or by increasing the pct f ree on the table. Finally, TM enqueues occur during DML to prevent DDL to the af fectedobject . If you have foreign keys, be sure to index them to avoid this general locking issue.Enqueue - ST Use LMT’s or pre-allocate large extents Enqueue - HW Pre-allocate extents above HW (high water mark.)Enqueue – TX Increase init rans and/or maxtrans (TX4) on (t ransact ion) the table or index. Fix locking issues if TX6. Bitmap (TX4) &Duplicates in Index (TX4).Enqueue - TM Index foreign keys; Check applicat ion (t rans. mgmt.) locking of tables. DML Locks.
7. Log Buffer SpaceLook at increasing log buffer size. This wait occurs because you are writ ing the log buffer faster than LGWR can write it to the redo logs, orbecause log switches are too slow. To address this problem, increase the size of the redo log f iles, or increase the size of the log buffer,or get faster disks to write to. You might even consider using solid-state disks, for their high speed. The session is wait ing for space in the log buffer. (Space becomes available only af ter LGWR has writ ten the current contents of the logbuffer to disk.) This typically happens when applicat ions generate redo faster than LGWR can write it to disk.
8. Log File Switchlog f ile switch (checkpoint incomplete): May indicate excessive db f iles or slow IO subsystemlog f ile switch (archiving needed): Indicates archive f iles are writ ten too slowlylog f ile switch complet ion: May need more log f iles perMay indicate excessive db f iles or slow IO subsystem. All commit requests are wait ing for "logf ile switch (archiving needed)" or "logf ile switch(chkpt. Incomplete)." Ensure that the archive disk is not full or slow. DBWR may be too slow because of I/O. You may need to add more orlarger redo logs, and you may potent ially need to add database writers if the DBWR is the problem.
9. Log File SyncCould indicate excessive commits. A Log File Sync happens each t ime a commit (or rollback) takes place. If there are a lot of waits in this areathen you may want to examine your applicat ion to see if you are commit t ing too frequent ly (or at least more than you need to). When auser commits or rolls back data, the LGWR f lushes the session's redo from the log buffer to the redo logs. The log f ile sync process mustwait for this to successfully complete. To reduce wait events here, t ry to commit more records (t ry to commit a batch of 50 instead of oneat a t ime, use BULKS, , for example). Put redo logs on a faster disk, or alternate redo logs on dif ferent physical disks (with no other DBFiles, ASM, etc) to reduce the archiving ef fect on LGWR. Don't use RAID 5, since it is very slow for applicat ions that write a lot ; potent iallyconsider using f ile system direct I/O or raw devices, which are very fast at writ ing informat ion. The associated event, ‘log buffer parallel write’
PDFmyURL.com
is used by the redo log writer process, and it will indicate if your actual problem is with the log f ile I/O. Large wait t imes for this event can alsobe caused by having too few CPU resources available for the redolog writer process.
10. Idle Event. There are several idle wait events listed af ter the output; you can ignore them. Idle events are generally listed at the bottom ofeach sect ion and include such things as SQL*Net message to/f rom client and other background-related t imings. Idle events are listed in thestats$idle_event table.
11. global cache cr request: (OPS) This wait event shows the amount of t ime that an instance has waited for a requested data block for aconsistent read and the transferred block has not yet arrived at the request ing instance. See Note 157766.1 'Sessions Wait Forever for'global cache cr request ' Wait Event in OPS or RAC'. In some cases the 'global cache cr request ' wait event may be perfect ly normal if largebuffer caches are used and the same data is being accessed concurrent ly on mult iple instances. In a perfect ly tuned, non-OPS/RACdatabase, I/O wait events would be the top wait events but since we are avoiding I/O's with RAC and OPS the 'global cache cr request ' waitevent of ten takes the place of I/O wait events.
12. library cache pin: Library cache latch content ion may be caused by not using bind variables. It is due to excessive parsing of SQLstatement. The session wants to pin an object in memory in the library cache for examinat ion, ensuring no other processes can update the object atthe same t ime. This happens when you are compiling or parsing a PL/SQL object or a view.
13. CPU t imeThis is not really a wait event (hence, the new name), but rather the sum of the CPU used by this session, or the amount of CPU t ime usedduring the snapshot window. In a heavily loaded system, if the CPU t ime event is the biggest event, that could point to some CPU-intensiveprocessing (for example, forcing the use of an index when a full scan should have been used), which could be the cause of the bott leneck.When CPU Other is a signif icant component of total Response Time the next step is to f ind the SQL statements that access the mostblocks. Block accesses are also known as Buffer Gets and Logical I/Os. The report lists such SQL statements in sect ion SQL ordered byGets.
14. DB File Parallel Read If you are doing a lot of part it ion act ivity then expect to see that wait even. it could be a table or index part it ion.This Wait Event is used when Oracle performs in parallel reads from mult iple dataf iles to non-cont iguous buffers in memory (PGA or BufferCache). This is done during recovery operat ions or when buffer prefetching is being used as an opt imizat ion i.e. instead of performingmult iple single-block reads. If this wait is an important component of Wait Time, follow the same guidelines as 'db f ile sequent ial read'. This may occur during recovery or during regular act ivity when a session batches many single block I/O requests together and issues them inparallel.
PDFmyURL.com
15. PX qref latch Can of ten mean that the Producers are producing data quicker than the Consumers can consume it . Maybe we couldincrease parallel_execut ion_message_size to t ry to eliminate some of these waits or we might decrease the degree of parallelism. If thesystem workload is high consider to decrease the degree of parallelism. If you have DEFAULT parallelism on your object you can decreasethe value of PARALLEL_THREADS_PER_CPU. Have in mind DEFAULT degree = PARALLEL_THREADS_PER_CPU * #CPU's
16. Log File Parallel Write. It occurs when wait ing for writes of REDO records to the REDO log f iles to complete. The wait occurs in log writer(LGWR) as part of normal act ivity of copying records f rom the REDO log buffer to the current online log. The actual wait t ime is the t imetaken for all the outstanding I/O requests to complete. Even though the writes may be issued in parallel, LGWR needs to wait for the last I/Oto be on disk before the parallel write is considered complete. Hence the wait t ime depends on the t ime it takes the OS to complete allrequests.Log f ile parallel write waits can be reduced by moving log f iles to the faster disks and/or separate disks where there will be less content ion.
17. SQL*Net more data to clientThis means the instance is sending a lot of data to the client . You can decrease this t ime by having the client bring back less data. Maybe theapplicat ion doesn't need to bring back as much data as it is.
18. SQL*Net message to clientThe “SQL*Net message to client” Oracle metric indicates the server (foreground process) is sending a message to the client , and it can beused to ident ify throughput issues over a network, especially distributed databases with slow database links. The SQL*Net more data toclient event happens when Oracle writes mult iple data buffers (sized per SDU) in a single logical network call.
19. enq: TX - row lock content ion:Oracle keeps data consistency with the help of locking mechanism. When a part icular row is being modif ied by the process, either throughUpdate/ Delete or Insert operat ion, oracle t ries to acquire lock on that row. Only when the process has acquired lock the process can modifythe row otherwise the process waits for the lock. This wait situat ion t riggers this event. The lock is released whenever a COMMIT is issuedby the process which has acquired lock for the row. Once the lock is released, processes wait ing on this event can acquire lock on the rowand perform DML operat ion
20. direct Path writes: You wont see them unless you are doing some appends or data loads. The session has issued asynchronous I/Orequests that bypass the buffer cache and is wait ing for them to complete. These wait events of ten involve temporary segments, sort ingact ivity, parallel query or hash joins.
21. direct Path reads / direct path writes: Could happen if you are doing a lot of parallel query act ivity. The session has issued asynchronous PDFmyURL.com
I/O requests that bypass the buffer cache and is wait ing for them to complete. These wait events of ten involve temporary segments,sort ing act ivity, parallel query or hash joins. Usually sort ing to Temp. Can also be parallel query. Could also be insert append, etc AdjustPGA_AGGREGATE_TARGET to f ix it .
22. write complete waits: The session is wait ing for a requested buffer to be writ ten to disk; the buffer cannot be used while it is beingwrit ten.
23. direct path read temp or direct path write temp: This wait event shows Temp f ile act ivity (sort ,hashes,temp tables, bitmap) check pgaparameter or sort area or hash area parameters. You might want to increase them
24. Undo segment extension: The session is wait ing for an undo segment to be extended or shrunk. If excessive, tune undo
25. wait for a undo record: Usually only during recovery of large transact ions, look at turning of f parallel undo recovery.
26. Control File Parallel Write: The session has issued mult iple I/O requests in parallel to write blocks to all control f iles, and is wait ing for all ofthe writes to complete.
27. Control File Sequent ial Read: The session is wait ing for blocks to be read from a control f ile.
28. DB File Parallel Write: The process, typically DBWR, has issued mult iple I/O requests in parallel to write dirty blocks f rom the buffer cacheto disk and is wait ing for all requests to complete.
29. Library Cache load lock: The session is wait ing for the opportunity to load an object or a piece of an object into the library cache. (Onlyone process can load an object or a piece of an object at a t ime.)
30. log f ile sequent ial read: The session is wait ing for blocks to be read from the online redo log into memory. This primarily occurs atinstance startup and when the ARCH process archives f illed online redo logs.
Time Model Statistics PDFmyURL.com
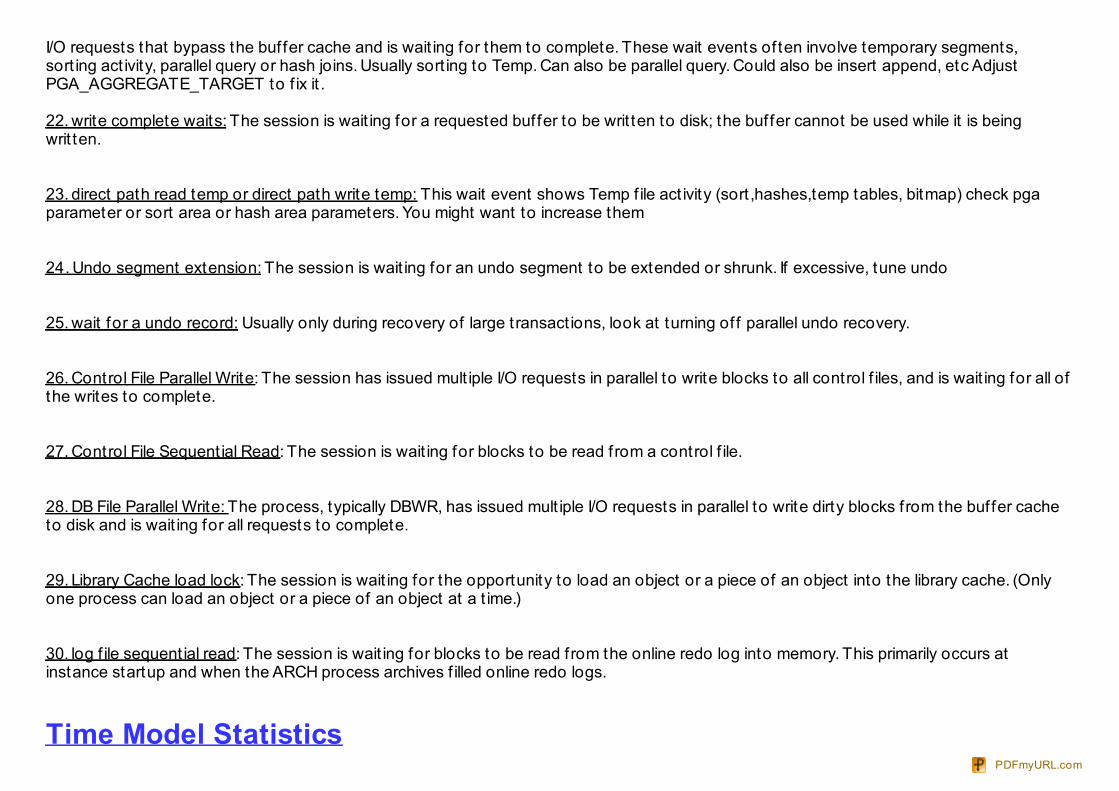
Oracle Database t ime model related stat ist ics are presented next. The t ime model allows you to see a summary of where the database isspending it 's t ime. The report will present the various t ime related stat ist ic (such as DB CPU) and how much total t ime was spent in the modeof operat ion represented by that stat ist ic. Here is an example of the t ime model stat ist ic report :
Total time in database user-calls (DB Time): 20586.1sStatistics including the word "background" measure background process time, and so do not contribute to the DB time statisticOrdered by % or DB time desc, Statistic name
Stat ist ic Name Time (s) % of DB T imesql execute elapsed time 19,640.87 95.41DB CPU 17,767.20 86.31parse time elapsed 73.75 0.36hard parse elapsed time 38.35 0.19PL/SQL execution elapsed time 32.04 0.16hard parse (sharing criteria) elapsed time 6.98 0.03connection management call elapsed time 4.25 0.02repeated bind elapsed time 3.43 0.02PL/SQL compilation elapsed time 3.04 0.01hard parse (bind mismatch) elapsed time 1.62 0.01sequence load elapsed time 0.74 0.00failed parse elapsed time 0.04 0.00DB time 20,586.08 background elapsed time 859.22 background cpu time 68.05
If parsing time is very high, or if hard parsing is significant, you must investigate it further. You should not expect the % of DB Time to add up to 100%because there is overlap among statistics.Generally you want SQL processing time high, parsing and other stuff low. Time related statistics presents the various operations which are consumingmost of the database time.If SQL time>>DB CPU t ime then probably have IO issues. If Hard parses or parsing time is very high then further investigation should be done to resolve the problem. .
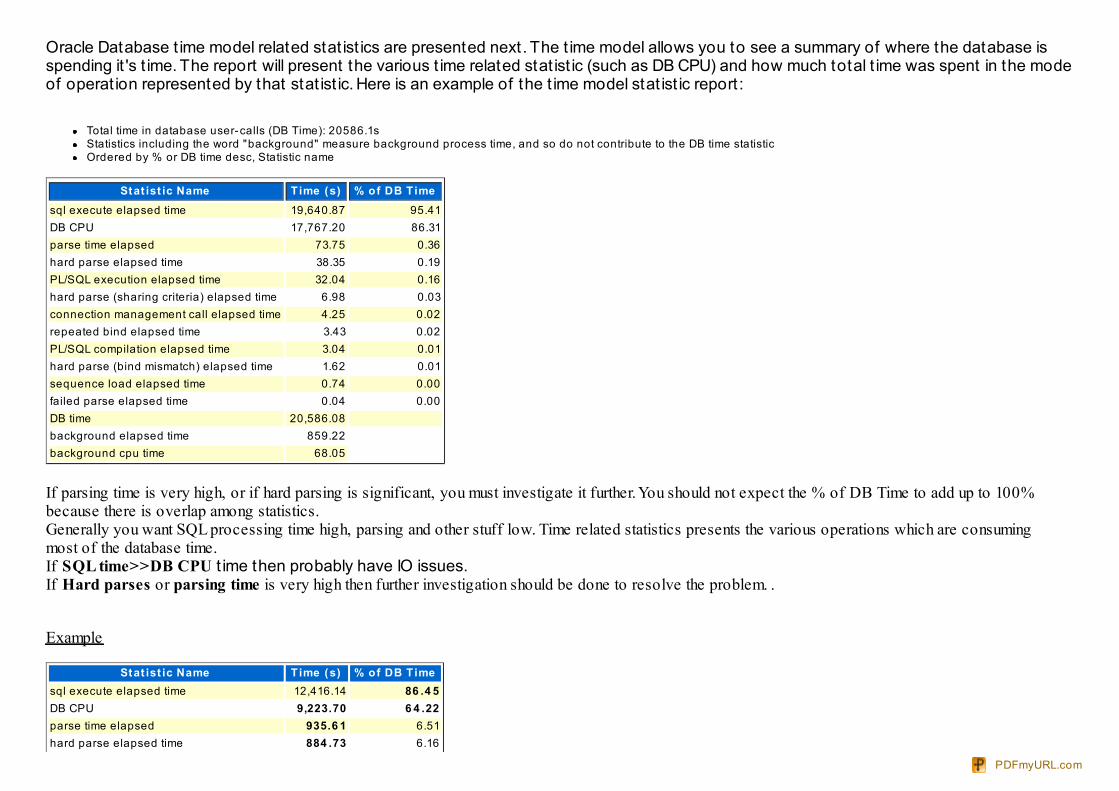
Example
Stat ist ic Name Time (s) % of DB T imesql execute elapsed time 12,416.14 86 .4 5DB CPU 9,223.70 6 4 .22parse time elapsed 935.6 1 6.51hard parse elapsed time 884 .73 6.16
PDFmyURL.com
failed parse elapsed time 821.39 5.72PL/SQL execution elapsed time 153.51 1.07hard parse (sharing criteria) elapsed time 25.96 0.18connection management call elapsed time 14.00 0.10hard parse (bind mismatch) elapsed time 4.74 0.03PL/SQL compilation elapsed time 1.20 0.01repeated bind elapsed time 0.22 0.00sequence load elapsed time 0.11 0.00DB time 14 ,36 2.96 background elapsed time 731.00 background cpu time 72.00
In the above example, 9,223.70 seconds CPU t ime was used for all user sessions. This was just under 65% of database resources. In total there was 14363 seconds database t ime used. The total wait event t ime can be calculated as 14363 – 9223.70 = 5139.3 seconds. The lion share of database t ime (86.45%) was spent onexecut ing sql which is a good sign. The total parse t ime was 935.61 seconds of which 884.73 seconds was hard parsing. The rest ofstat ist ics is t iny in this case
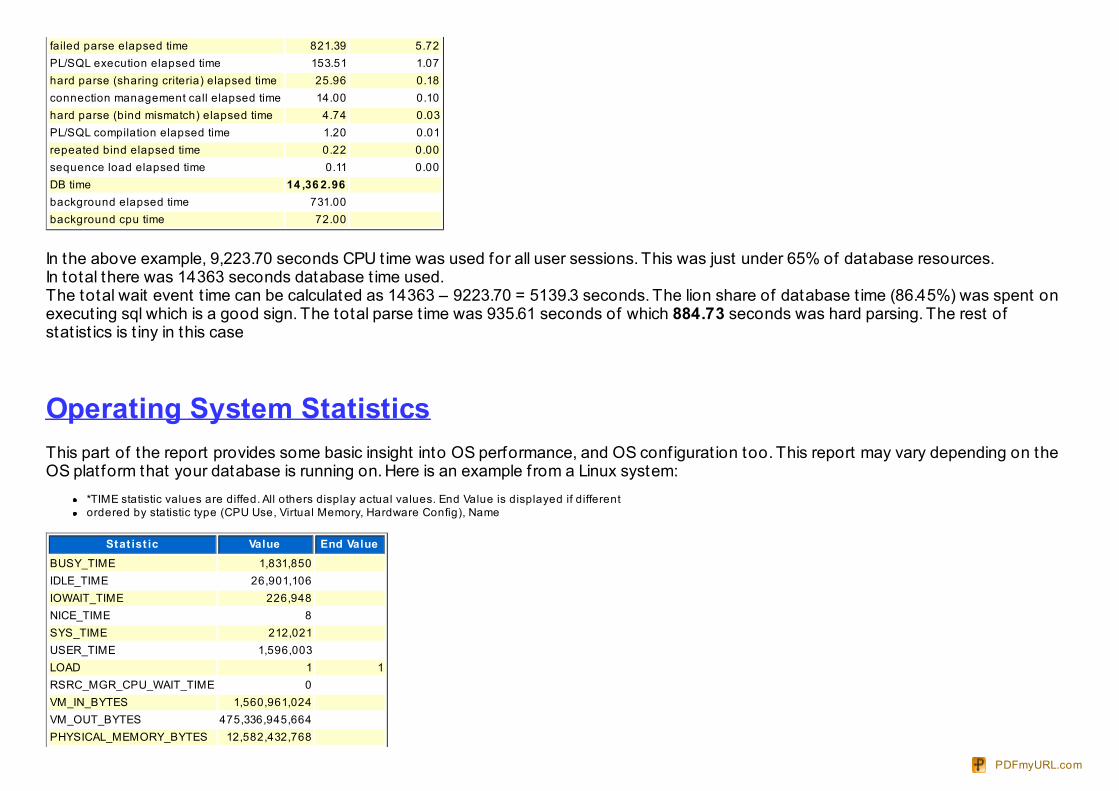
Operating System StatisticsThis part of the report provides some basic insight into OS performance, and OS conf igurat ion too. This report may vary depending on theOS plat form that your database is running on. Here is an example f rom a Linux system:
*TIME statistic values are diffed. All others display actual values. End Value is displayed if differentordered by statistic type (CPU Use, Virtual Memory, Hardware Config), Name
Stat ist ic Value End ValueBUSY_TIME 1,831,850 IDLE_TIME 26,901,106 IOWAIT_TIME 226,948 NICE_TIME 8 SYS_TIME 212,021 USER_TIME 1,596,003 LOAD 1 1RSRC_MGR_CPU_WAIT_TIME 0 VM_IN_BYTES 1,560,961,024 VM_OUT_BYTES 475,336,945,664 PHYSICAL_MEMORY_BYTES 12,582,432,768
PDFmyURL.com
NUM_CPUS 16 NUM_CPU_CORES 8 NUM_CPU_SOCKETS 2 GLOBAL_RECEIVE_SIZE_MAX 4,194,304 GLOBAL_SEND_SIZE_MAX 1,048,576 TCP_RECEIVE_SIZE_DEFAULT 87,380 TCP_RECEIVE_SIZE_MAX 174,760 TCP_RECEIVE_SIZE_MIN 4,096 TCP_SEND_SIZE_DEFAULT 16,384 TCP_SEND_SIZE_MAX 131,072 TCP_SEND_SIZE_MIN 4,096
In this example output, for example, we have 16 CPU's on the box.
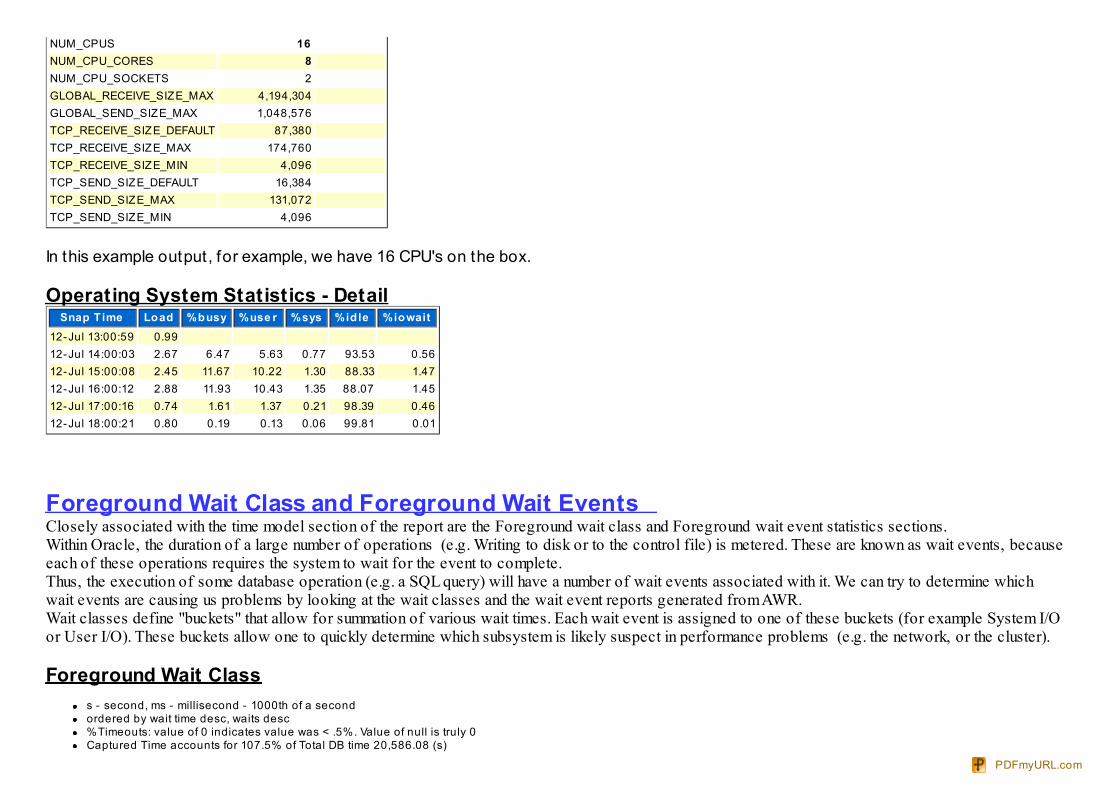
Operating System Statistics - DetailSnap T ime Load %busy %use r %sys %idle %iowait
12-Jul 13:00:59 0.99 12-Jul 14:00:03 2.67 6.47 5.63 0.77 93.53 0.5612-Jul 15:00:08 2.45 11.67 10.22 1.30 88.33 1.4712-Jul 16:00:12 2.88 11.93 10.43 1.35 88.07 1.4512-Jul 17:00:16 0.74 1.61 1.37 0.21 98.39 0.4612-Jul 18:00:21 0.80 0.19 0.13 0.06 99.81 0.01
Foreground Wait Class and Foreground Wait Events Closely associated with the time model section of the report are the Foreground wait class and Foreground wait event statistics sections. Within Oracle, the duration of a large number of operations (e.g. Writing to disk or to the control file) is metered. These are known as wait events, becauseeach of these operations requires the system to wait for the event to complete. Thus, the execution of some database operation (e.g. a SQL query) will have a number of wait events associated with it. We can try to determine whichwait events are causing us problems by looking at the wait classes and the wait event reports generated from AWR.Wait classes define "buckets" that allow for summation of various wait times. Each wait event is assigned to one of these buckets (for example System I/Oor User I/O). These buckets allow one to quickly determine which subsystem is likely suspect in performance problems (e.g. the network, or the cluster).
Foreground Wait Classs - second, ms - millisecond - 1000th of a secondordered by wait time desc, waits desc%Timeouts: value of 0 indicates value was < .5%. Value of null is truly 0Captured Time accounts for 107.5% of Total DB time 20,586.08 (s)
PDFmyURL.com
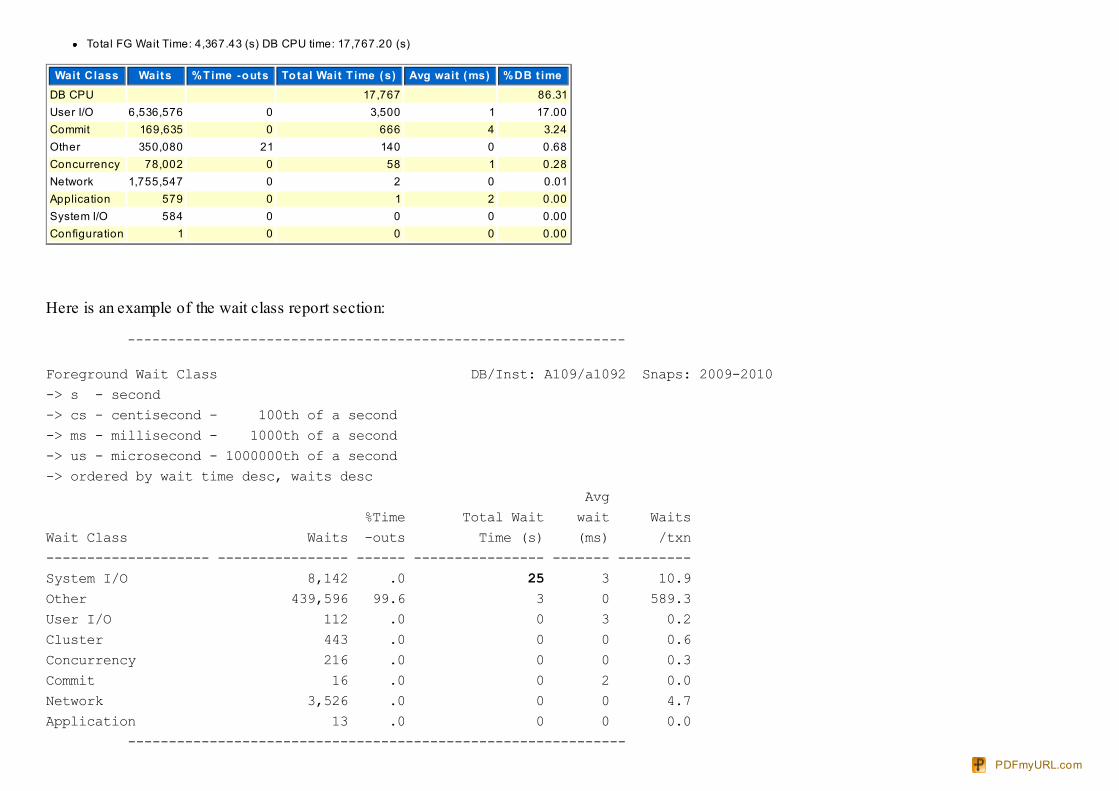
Total FG Wait Time: 4,367.43 (s) DB CPU time: 17,767.20 (s)
Wait Class Waits %Time -outs Total Wait T ime (s) Avg wait (ms) %DB t imeDB CPU 17,767 86.31User I/O 6,536,576 0 3,500 1 17.00Commit 169,635 0 666 4 3.24Other 350,080 21 140 0 0.68Concurrency 78,002 0 58 1 0.28Network 1,755,547 0 2 0 0.01Application 579 0 1 2 0.00System I/O 584 0 0 0 0.00Configuration 1 0 0 0 0.00
Here is an example of the wait class report section:
-------------------------------------------------------------
Foreground Wait Class DB/Inst: A109/a1092 Snaps: 2009-2010-> s - second-> cs - centisecond - 100th of a second-> ms - millisecond - 1000th of a second-> us - microsecond - 1000000th of a second-> ordered by wait time desc, waits desc Avg %Time Total Wait wait WaitsWait Class Waits -outs Time (s) (ms) /txn-------------------- ---------------- ------ ---------------- ------- ---------System I/O 8,142 .0 25 3 10.9Other 439,596 99.6 3 0 589.3User I/O 112 .0 0 3 0.2Cluster 443 .0 0 0 0.6Concurrency 216 .0 0 0 0.3Commit 16 .0 0 2 0.0Network 3,526 .0 0 0 4.7Application 13 .0 0 0 0.0 -------------------------------------------------------------
PDFmyURL.com
In this report the system I/O wait class has the largest number of waits (total of 25 seconds) and an average wait of 3 milliseconds.
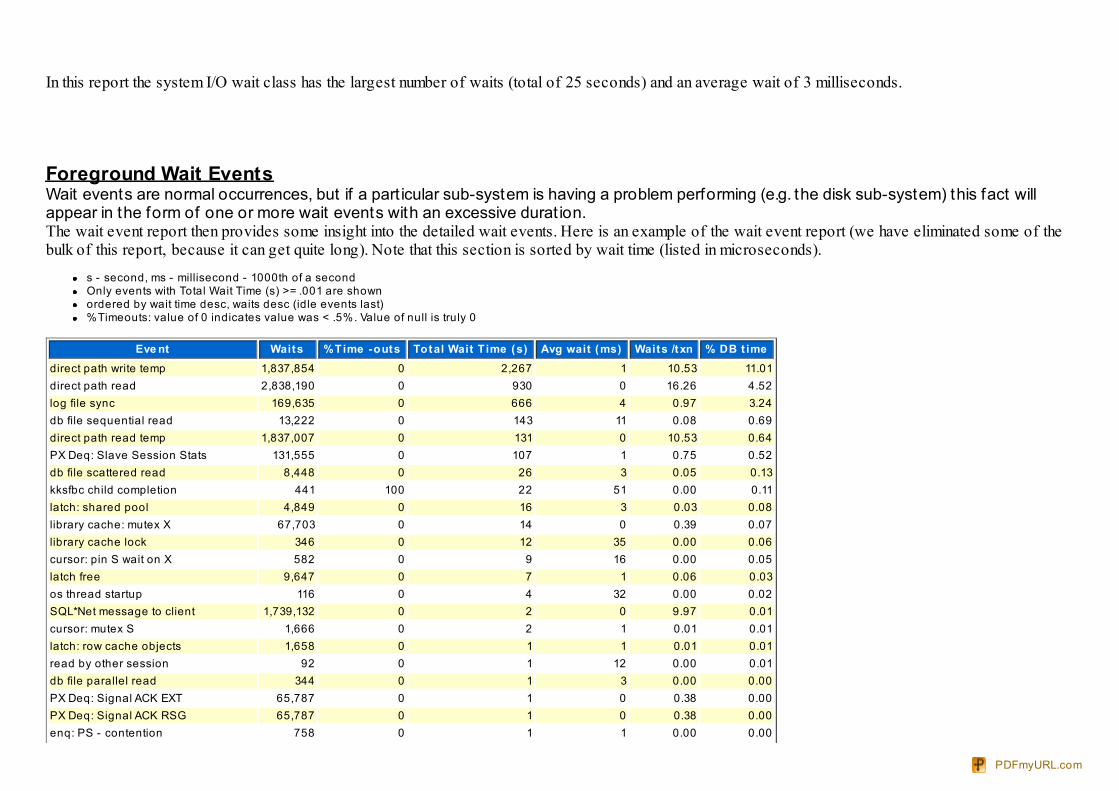
Foreground Wait EventsWait events are normal occurrences, but if a part icular sub-system is having a problem performing (e.g. the disk sub-system) this fact willappear in the form of one or more wait events with an excessive durat ion. The wait event report then provides some insight into the detailed wait events. Here is an example of the wait event report (we have eliminated some of thebulk of this report, because it can get quite long). Note that this section is sorted by wait time (listed in microseconds).
s - second, ms - millisecond - 1000th of a secondOnly events with Total Wait Time (s) >= .001 are shownordered by wait time desc, waits desc (idle events last)%Timeouts: value of 0 indicates value was < .5%. Value of null is truly 0
Eve nt Waits %Time -outs Total Wait T ime (s) Avg wait (ms) Waits /txn % DB t imedirect path write temp 1,837,854 0 2,267 1 10.53 11.01direct path read 2,838,190 0 930 0 16.26 4.52log file sync 169,635 0 666 4 0.97 3.24db file sequential read 13,222 0 143 11 0.08 0.69direct path read temp 1,837,007 0 131 0 10.53 0.64PX Deq: Slave Session Stats 131,555 0 107 1 0.75 0.52db file scattered read 8,448 0 26 3 0.05 0.13kksfbc child completion 441 100 22 51 0.00 0.11latch: shared pool 4,849 0 16 3 0.03 0.08library cache: mutex X 67,703 0 14 0 0.39 0.07library cache lock 346 0 12 35 0.00 0.06cursor: pin S wait on X 582 0 9 16 0.00 0.05latch free 9,647 0 7 1 0.06 0.03os thread startup 116 0 4 32 0.00 0.02SQL*Net message to client 1,739,132 0 2 0 9.97 0.01cursor: mutex S 1,666 0 2 1 0.01 0.01latch: row cache objects 1,658 0 1 1 0.01 0.01read by other session 92 0 1 12 0.00 0.01db file parallel read 344 0 1 3 0.00 0.00PX Deq: Signal ACK EXT 65,787 0 1 0 0.38 0.00PX Deq: Signal ACK RSG 65,787 0 1 0 0.38 0.00enq: PS - contention 758 0 1 1 0.00 0.00
PDFmyURL.com
enq: RO - fast object reuse 40 0 1 13 0.00 0.00Disk file operations I/O 1,386 0 0 0 0.01 0.00enq: KO - fast object checkpoint 539 0 0 1 0.00 0.00PX qref latch 964 100 0 0 0.01 0.00latch: parallel query alloc buffer 836 0 0 0 0.00 0.00latch: cache buffers chains 174 0 0 1 0.00 0.00SQL*Net more data to client 16,415 0 0 0 0.09 0.00enq: TX - index contention 5 0 0 37 0.00 0.00library cache load lock 1 0 0 139 0.00 0.00asynch descriptor resiz e 71,974 100 0 0 0.41 0.00PX Deq: Table Q Get Keys 486 0 0 0 0.00 0.00reliable message 577 0 0 0 0.00 0.00buffer busy waits 676 0 0 0 0.00 0.00cursor: pin S 189 0 0 0 0.00 0.00row cache lock 17 0 0 2 0.00 0.00direct path sync 15 0 0 2 0.00 0.00latch: cache buffer handles 1 0 0 29 0.00 0.00utl_file I/O 18 0 0 1 0.00 0.00PX Deq: Table Q qref 1,160 0 0 0 0.01 0.00wait list latch free 13 0 0 1 0.00 0.00latch: object queue header operation 32 0 0 0 0.00 0.00control file sequential read 584 0 0 0 0.00 0.00SQL*Net message from client 1,739,106 0 260,904 150 9.97 jobq slave wait 41,892 100 20,964 500 0.24 PX Deq: Execution Msg 746,687 0 1,612 2 4.28 PX Deq: Table Q Normal 1,057,627 0 387 0 6.06 PX Deq Credit: send blkd 128,373 0 266 2 0.74 PX Deq: Execute Reply 710,735 0 51 0 4.07 PX Deq: Parse Reply 65,790 0 13 0 0.38 PX Deq: Join ACK 65,790 0 4 0 0.38 PX Deq Credit: need buffer 1,783 0 3 1 0.01 PX Deq: Table Q Sample 1,275 0 1 0 0.01
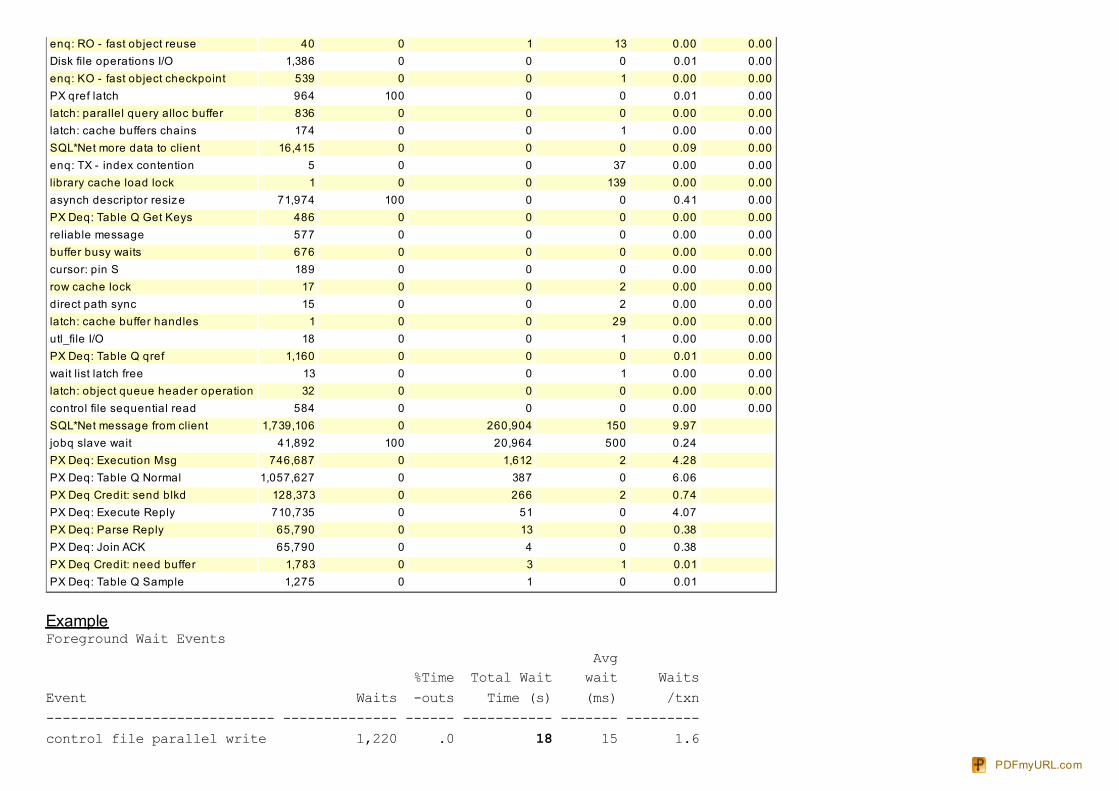
ExampleForeground Wait Events Avg %Time Total Wait wait WaitsEvent Waits -outs Time (s) (ms) /txn---------------------------- -------------- ------ ----------- ------- ---------control file parallel write 1,220 .0 18 15 1.6
PDFmyURL.com
control file sequential read 6,508 .0 6 1 8.7CGS wait for IPC msg 422,253 100.0 1 0 566.0change tracking file synchro 60 .0 1 13 0.1db file parallel write 291 .0 0 1 0.4db file sequential read 90 .0 0 4 0.1reliable message 136 .0 0 1 0.2log file parallel write 106 .0 0 2 0.1lms flush message acks 1 .0 0 60 0.0gc current block 2-way 200 .0 0 0 0.3change tracking file synchro 59 .0 0 1 0.1
In this example our control file parallel write waits (which occurs during writes to the control file) are taking up 18 seconds total, with an average wait of15 milliseconds per wait. Additionally we can see that we have 1.6 waits per transaction (or 15ms * 1.6 per transaction = 24ms).
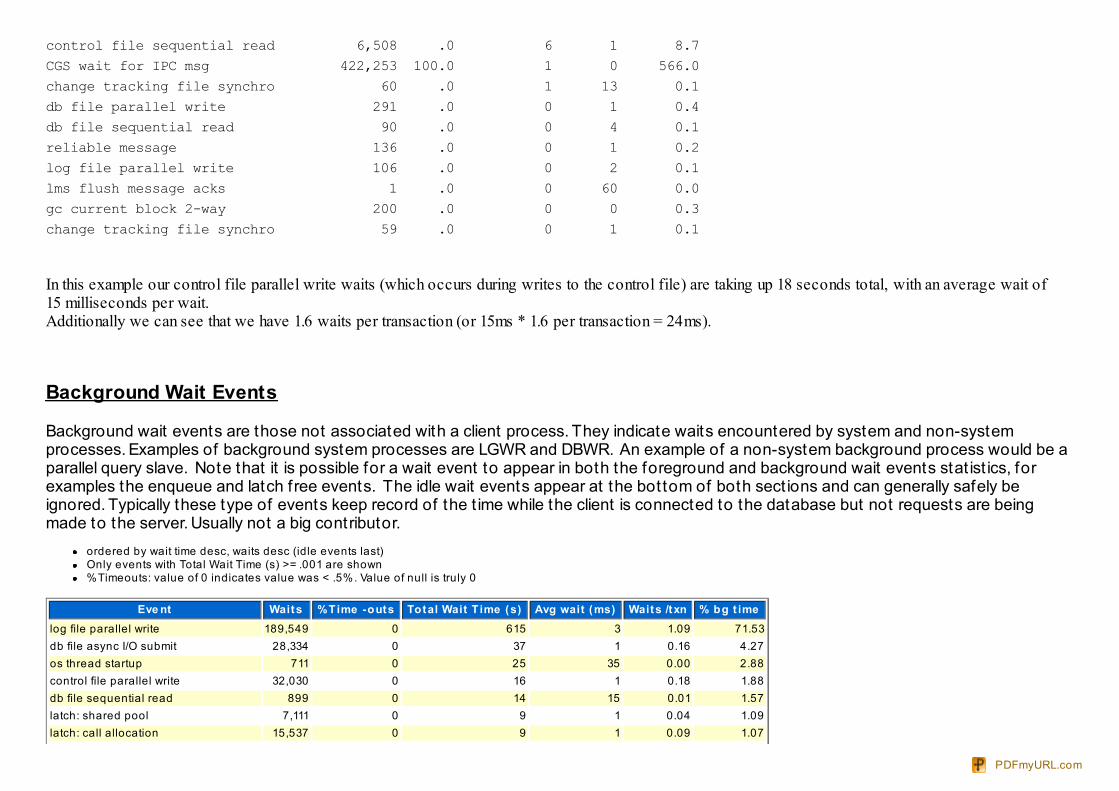
Background Wait Events
Background wait events are those not associated with a client process. They indicate waits encountered by system and non-systemprocesses. Examples of background system processes are LGWR and DBWR. An example of a non-system background process would be aparallel query slave. Note that it is possible for a wait event to appear in both the foreground and background wait events stat ist ics, forexamples the enqueue and latch f ree events. The idle wait events appear at the bottom of both sect ions and can generally safely beignored. Typically these type of events keep record of the t ime while the client is connected to the database but not requests are beingmade to the server. Usually not a big contributor.
ordered by wait time desc, waits desc (idle events last)Only events with Total Wait Time (s) >= .001 are shown%Timeouts: value of 0 indicates value was < .5%. Value of null is truly 0
Eve nt Waits %Time -outs Total Wait T ime (s) Avg wait (ms) Waits /txn % bg t imelog file parallel write 189,549 0 615 3 1.09 71.53db file async I/O submit 28,334 0 37 1 0.16 4.27os thread startup 711 0 25 35 0.00 2.88control file parallel write 32,030 0 16 1 0.18 1.88db file sequential read 899 0 14 15 0.01 1.57latch: shared pool 7,111 0 9 1 0.04 1.09latch: call allocation 15,537 0 9 1 0.09 1.07
PDFmyURL.com
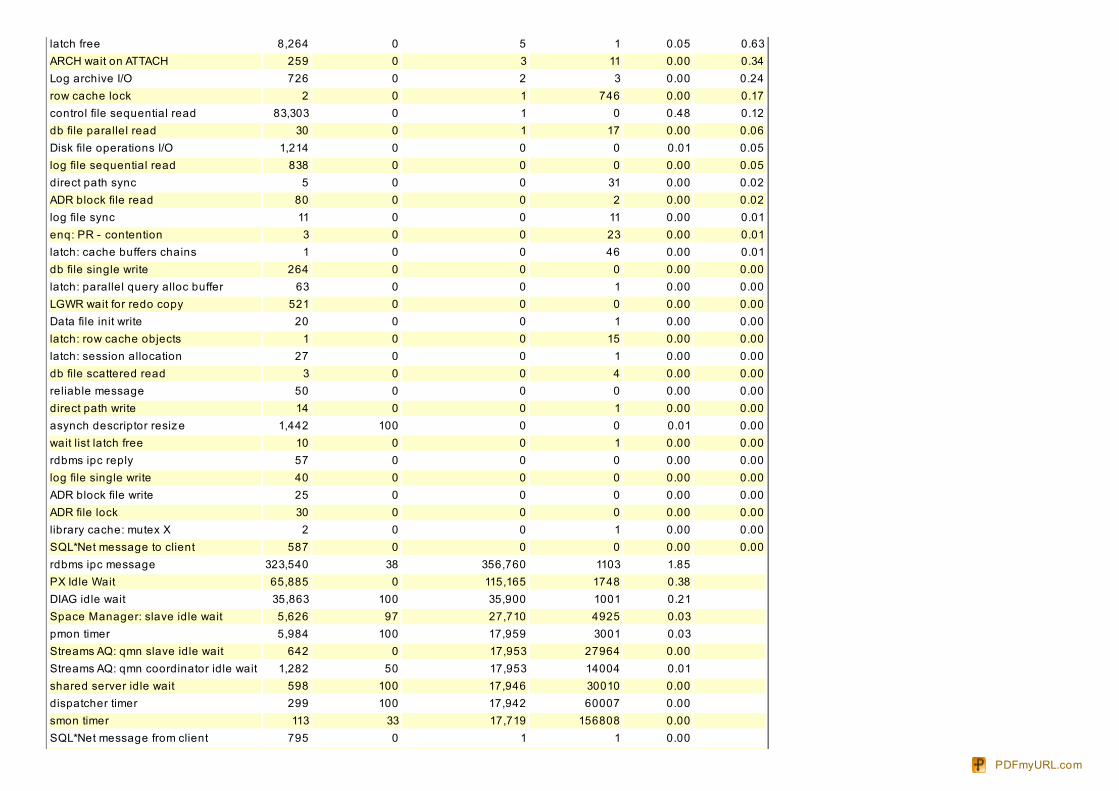
latch free 8,264 0 5 1 0.05 0.63ARCH wait on ATTACH 259 0 3 11 0.00 0.34Log archive I/O 726 0 2 3 0.00 0.24row cache lock 2 0 1 746 0.00 0.17control file sequential read 83,303 0 1 0 0.48 0.12db file parallel read 30 0 1 17 0.00 0.06Disk file operations I/O 1,214 0 0 0 0.01 0.05log file sequential read 838 0 0 0 0.00 0.05direct path sync 5 0 0 31 0.00 0.02ADR block file read 80 0 0 2 0.00 0.02log file sync 11 0 0 11 0.00 0.01enq: PR - contention 3 0 0 23 0.00 0.01latch: cache buffers chains 1 0 0 46 0.00 0.01db file single write 264 0 0 0 0.00 0.00latch: parallel query alloc buffer 63 0 0 1 0.00 0.00LGWR wait for redo copy 521 0 0 0 0.00 0.00Data file init write 20 0 0 1 0.00 0.00latch: row cache objects 1 0 0 15 0.00 0.00latch: session allocation 27 0 0 1 0.00 0.00db file scattered read 3 0 0 4 0.00 0.00reliable message 50 0 0 0 0.00 0.00direct path write 14 0 0 1 0.00 0.00asynch descriptor resiz e 1,442 100 0 0 0.01 0.00wait list latch free 10 0 0 1 0.00 0.00rdbms ipc reply 57 0 0 0 0.00 0.00log file single write 40 0 0 0 0.00 0.00ADR block file write 25 0 0 0 0.00 0.00ADR file lock 30 0 0 0 0.00 0.00library cache: mutex X 2 0 0 1 0.00 0.00SQL*Net message to client 587 0 0 0 0.00 0.00rdbms ipc message 323,540 38 356,760 1103 1.85 PX Idle Wait 65,885 0 115,165 1748 0.38 DIAG idle wait 35,863 100 35,900 1001 0.21 Space Manager: slave idle wait 5,626 97 27,710 4925 0.03 pmon timer 5,984 100 17,959 3001 0.03 Streams AQ: qmn slave idle wait 642 0 17,953 27964 0.00 Streams AQ: qmn coordinator idle wait 1,282 50 17,953 14004 0.01 shared server idle wait 598 100 17,946 30010 0.00 dispatcher timer 299 100 17,942 60007 0.00 smon timer 113 33 17,719 156808 0.00 SQL*Net message from client 795 0 1 1 0.00
PDFmyURL.com
class slave wait 83 0 0 0 0.00
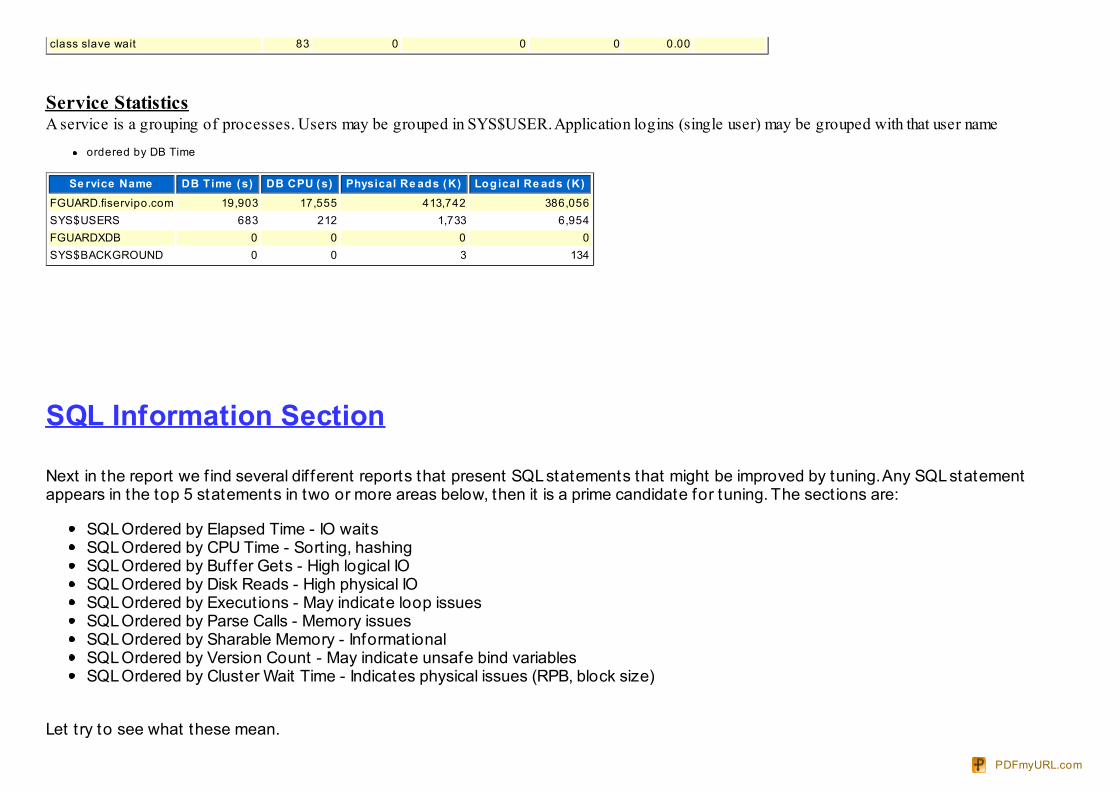
Service StatisticsA service is a grouping of processes. Users may be grouped in SYS$USER. Application logins (single user) may be grouped with that user name
ordered by DB Time
Se rvice Name DB Time (s) DB CPU (s) Physical Re ads (K) Logical Re ads (K)FGUARD.fiservipo.com 19,903 17,555 413,742 386,056SYS$USERS 683 212 1,733 6,954FGUARDXDB 0 0 0 0SYS$BACKGROUND 0 0 3 134
SQL Information Section
Next in the report we f ind several dif ferent reports that present SQL statements that might be improved by tuning. Any SQL statementappears in the top 5 statements in two or more areas below, then it is a prime candidate for tuning. The sect ions are:
SQL Ordered by Elapsed Time - IO waitsSQL Ordered by CPU Time - Sort ing, hashingSQL Ordered by Buffer Gets - High logical IOSQL Ordered by Disk Reads - High physical IOSQL Ordered by Execut ions - May indicate loop issuesSQL Ordered by Parse Calls - Memory issuesSQL Ordered by Sharable Memory - Informat ionalSQL Ordered by Version Count - May indicate unsafe bind variablesSQL Ordered by Cluster Wait Time - Indicates physical issues (RPB, block size)
Let t ry to see what these mean.
PDFmyURL.com
SQL Ordered by Elapsed TimeTotal Elapsed Time = CPU Time + Wait Time. If a SQL statement appears in the total elapsed t ime area of the report this means its CPU t imeplus any other wait t imes made it pop to the top of the pile. Excessive Elapsed Time could be due to excessive CPU usage or excessive waitt imes.This is the area that you need to examine and probably the one that will be reported by the users or applicat ion support . From a consumerperspect ive, the f iner details don’t matter. The applicat ion is slow. Full stop.In conjunct ion with excessive Elapsed t ime check to see if this piece of SQL is also a high consumer under Total CPU Time. It is normally thecase. Otherwise check the wait t imes and Total Disk Reads. They can either indicate issues with wait t imes (slow disks, latch gets etc) or toomuch Physical IO associated with tables scans or sub-opt imal indexes. This sect ion is a gate opener and of ten you will need to examineother sect ions.
SQL Ordered by CPU TimeWhen a statement appears in the Total CPU Time area this indicates it used excessive CPU cycles during its processing. Excessive CPUprocessing t ime can be caused by sort ing, excessive funct ion usage or long parse t imes. Indicators that you should be looking at this sect ionfor SQL tuning candidates include high CPU percentages in the service sect ion for the service associated with this SQL (a hint , if the SQL isuppercase it probably comes from a user or applicat ion; if it is lowercase it usually comes from the internal or background processes). Toreduce total CPU t ime, reduce sort ing by using composite indexes that can cover sort ing and use bind variables to reduce parse t imes.
SQL Ordered by Buffer GetsTotal buffer gets mean a SQL statement is reading a lot of data f rom the db block buffers. Generally speaking buffer gets (AKA logical IO orLIO) are OK, except when they become excessive. The old saying that you reduce the logical IO, because then the physical IO (disk read) willtake care of itself holds t rue. LIO may have incurred a PIO in order to get the block into the buffer in the f irst place. Reducing buffer gets isvery important and should not be underest imated. To get a block f rom db block buffers, we have to latch it (i.e. in order to prevent someonefrom modifying the data structures we are current ly reading from the buffer). Although latches are less persistent than locks, a latch is st ill aserializat ion device. Serializat ion devices inhibit scalability, the more you use them, the less concurrency you get. Therefore in most casesopt imal buffer gets can result in improved performance. Also note that by lowering buffer gets you will require less CPU usage and lesslatching. |Thus to reduce excessive buffer gets, opt imize SQL to use appropriate indexes and reduce full table scans. You can also look atimproving the indexing strategy and consider deploying part it ioning (licensed).
SQL Ordered by Disk ReadsHigh total disk reads mean a SQL statement is reading a lot of data f rom disks rather than being able to access that data f rom the db blockbuffers. High physical reads af ter a server reboot are expected as the cache is cold and data is fetched from the disk. However, disk reads(or physical reads) are undesirable in an OLTP system, especially when they become excessive. Excessive disk reads do cause performanceissues. The usual norm is to increase the db buffer cache to allow more buffers and reduce ageing . Total disk reads are typif ied by highphysical reads, a low buffer cache hit rat io, with high IO wait t imes. Higher wait t imes for Disk IO can be associated with a variety of reasons(busy or over saturated SAN, slower underlying storage, low capacity in HBC and other hardware causes). Stat ist ics on IO sect ion in AWR,plus the Operat ing System diagnost ic tools as simple as iostatcan help in ident ifying these issues. To reduce excessive disk reads, considerpart it ioning, use indexes and look at opt imizing SQL to avoid excessive full table scans.
PDFmyURL.com
SQL Ordered by Execut ionsHigh total execut ions need to be reviewed to see if they are genuine execut ions or loops in SQL code. I have also seen situat ions whereautosys jobs f ire duplicate codes erroneously. In general statements with high numbers of execut ions usually are being properly reused.However, there is always a chance of unnecessary loop in PL/SQL, Java or C# . Statements with high number of execut ions, high number oflogical and or physical reads are candidates for review to be sure they are not being executed mult iple t imes when a single execut ion wouldserve. If the database has excessive physical and logical reads or excessive IO wait t imes, then look at the SQL statements that showexcessive execut ions and show high physical and logical reads.
Parse CallsWhenever a statement is issued by a user or process, regardless of whether it is in the SQL pool it undergoes a parse. As explained underParsing, the parse can be a hard parse or a sof t parse. Excessive parse calls usually go with excessive execut ions. If the statement is usingwhat are known as unsafe bind variables then the statement will be reparsed each t ime. If the header parse rat ios are low look here and inthe version count areas.
SQL Ordered by MemorySharable Memory refers to Shared Pool memory area in SGA , hence this part icular sect ion in AWR Report states about the SQLSTATEMENT CURSORS which consumed the maximum amount of the Shared Pool for their execut ion.In general high values for Sharable Memory doesn’t necessary imply there is an issue It simply means that: - These SQL statements are big or complex and Oracle has to keep lots of informat ion about these statements OR - big number of child cursors exist for those parent cursors - combinat ion of 1 & 2In case of point 2, it may be due to poor coding such as bind variables mismatch, security mismatch or overly large SQL statements that joinmany tables. In a DSS or DW environment large complex statements are normal. In an OLTP database large or complex statements areusually the result of over-normalizat ion of the database design, at tempts to use an OLTP system as a DW or simply poor codingtechniques. Usually large statements will result in excessive parsing, recursion, and large CPU usage.
SQL Ordered by Version CountHigh version counts are usually due to mult iple ident ical-schema databases, unsafe bind variables, or Oracle bugs.
The SQL that is stored in the shared pool SQL area (Library cache) is reported in this sect ion in dif ferent ways:. SQL ordered by Buffer Gets. SQL ordered by Physical Reads. SQL ordered by Execut ions. SQL ordered by Parse Calls
- SQL ordered by Gets:This sect ion reports the contents of the SQL area ordered by the number of buffer gets and can be used to ident ify the most CPU Heavy
PDFmyURL.com
SQL.- Many DBAs feel that if the data is already contained within the buffer cache the query should be ef f icient . This could not be further f romthe truth. Retrieving more data than needed, even from the buffer cache, requires CPU cycles and interprocess IO. Generally speaking, thecost of physical I/O is not 10,000 t imes more expensive. It actually is in the neighborhood of 67 t imes and actually almost zero if the data isstored in the UNIX buffer cache.- The statements of interest are those with a large number of gets per execut ion especially if the number of execut ions is high.- High buffer gets generally correlates with heavy CPU usage
- SQL ordered by Reads:This sect ion reports the contents of the SQL area ordered by the number of reads from the data f iles and can be used to ident ify SQLcausing IO bott lenecks which consume the following resources.- CPU t ime needed to fetch unnecessary data.- File IO resources to fetch unnecessary data.- Buffer resources to hold unnecessary data.- Addit ional CPU t ime to process the query once the data is retrieved into the buffer.
- SQL ordered by Execut ions:This sect ion reports the contents of the SQL area ordered by the number of query execut ions. It is primarily useful in ident ifying the mostfrequent ly used SQL within the database so that they can be monitored for ef f iciency. Generally speaking, a small performance increase ona frequent ly used query provides greater gains than a moderate performance increase on an infrequent ly used query. Possible reasons forhigh Reads per Exec are use of unselect ive indexes require large numbers of blocks to be fetched where such blocks are not cached well inthe buffer cache, index fragmentat ion, large Clustering Factor in index etc.
- SQL ordered by Parse Calls:This sect ion shows the number of t imes a statement was parsed as compared to the number of t imes it was executed. One to oneparse/execut ions may indicate that:- Bind variables are not being used. The shared pool may be too small and the parse is not being retained long enough for mult iple execut ions.- cursor_sharing is set to exact (this should NOT be changed without considerable test ing on the part of the client).
Generate Execution Plan for given SQL statementIf you have ident if ied one or more problemat ic SQL statement, you may want to check the execut ion plan. Remember the "Old Hash Value"from the report above (1279400914), then execute the scrip to generate the execut ion plan.
PDFmyURL.com
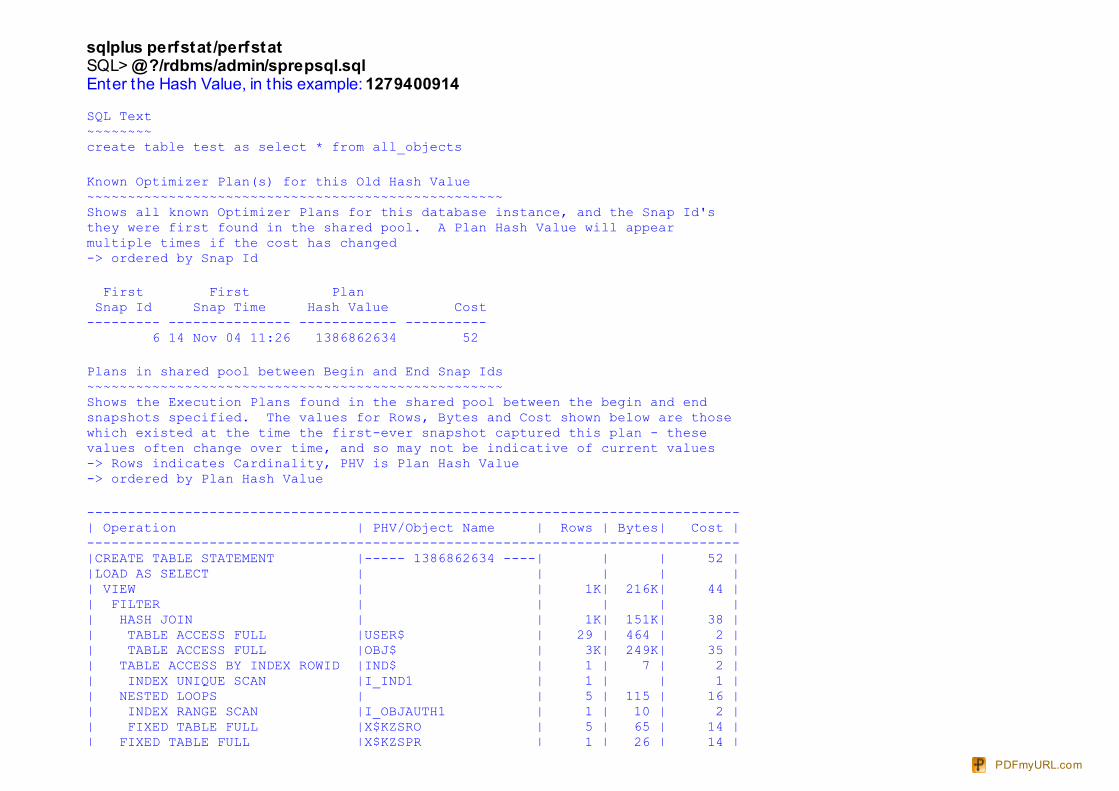
sqlplus perfstat /perfstatSQL> @?/rdbms/admin/sprepsql.sqlEnter the Hash Value, in this example: 1279400914
SQL Text~~~~~~~~create table test as select * from all_objects
Known Optimizer Plan(s) for this Old Hash Value~~~~~~~~~~~~~~~~~~~~~~~~~~~~~~~~~~~~~~~~~~~~~~~~~~~Shows all known Optimizer Plans for this database instance, and the Snap Id'sthey were first found in the shared pool. A Plan Hash Value will appearmultiple times if the cost has changed-> ordered by Snap Id
First First Plan Snap Id Snap Time Hash Value Cost--------- --------------- ------------ ---------- 6 14 Nov 04 11:26 1386862634 52
Plans in shared pool between Begin and End Snap Ids~~~~~~~~~~~~~~~~~~~~~~~~~~~~~~~~~~~~~~~~~~~~~~~~~~~Shows the Execution Plans found in the shared pool between the begin and endsnapshots specified. The values for Rows, Bytes and Cost shown below are thosewhich existed at the time the first-ever snapshot captured this plan - thesevalues often change over time, and so may not be indicative of current values-> Rows indicates Cardinality, PHV is Plan Hash Value-> ordered by Plan Hash Value
--------------------------------------------------------------------------------| Operation | PHV/Object Name | Rows | Bytes| Cost |--------------------------------------------------------------------------------|CREATE TABLE STATEMENT |----- 1386862634 ----| | | 52 ||LOAD AS SELECT | | | | || VIEW | | 1K| 216K| 44 || FILTER | | | | || HASH JOIN | | 1K| 151K| 38 || TABLE ACCESS FULL |USER$ | 29 | 464 | 2 || TABLE ACCESS FULL |OBJ$ | 3K| 249K| 35 || TABLE ACCESS BY INDEX ROWID |IND$ | 1 | 7 | 2 || INDEX UNIQUE SCAN |I_IND1 | 1 | | 1 || NESTED LOOPS | | 5 | 115 | 16 || INDEX RANGE SCAN |I_OBJAUTH1 | 1 | 10 | 2 || FIXED TABLE FULL |X$KZSRO | 5 | 65 | 14 || FIXED TABLE FULL |X$KZSPR | 1 | 26 | 14 |
PDFmyURL.com
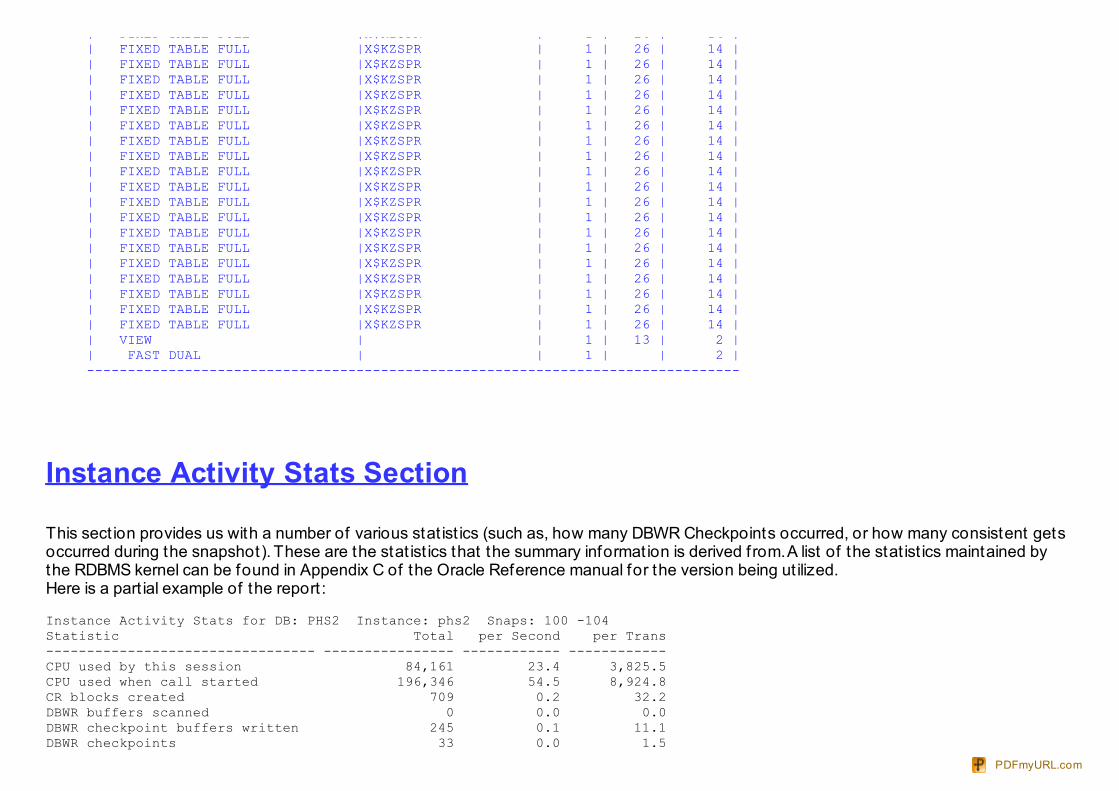
| FIXED TABLE FULL |X$KZSPR | 1 | 26 | 14 || FIXED TABLE FULL |X$KZSPR | 1 | 26 | 14 || FIXED TABLE FULL |X$KZSPR | 1 | 26 | 14 || FIXED TABLE FULL |X$KZSPR | 1 | 26 | 14 || FIXED TABLE FULL |X$KZSPR | 1 | 26 | 14 || FIXED TABLE FULL |X$KZSPR | 1 | 26 | 14 || FIXED TABLE FULL |X$KZSPR | 1 | 26 | 14 || FIXED TABLE FULL |X$KZSPR | 1 | 26 | 14 || FIXED TABLE FULL |X$KZSPR | 1 | 26 | 14 || FIXED TABLE FULL |X$KZSPR | 1 | 26 | 14 || FIXED TABLE FULL |X$KZSPR | 1 | 26 | 14 || FIXED TABLE FULL |X$KZSPR | 1 | 26 | 14 || FIXED TABLE FULL |X$KZSPR | 1 | 26 | 14 || FIXED TABLE FULL |X$KZSPR | 1 | 26 | 14 || FIXED TABLE FULL |X$KZSPR | 1 | 26 | 14 || FIXED TABLE FULL |X$KZSPR | 1 | 26 | 14 || FIXED TABLE FULL |X$KZSPR | 1 | 26 | 14 || FIXED TABLE FULL |X$KZSPR | 1 | 26 | 14 || FIXED TABLE FULL |X$KZSPR | 1 | 26 | 14 || FIXED TABLE FULL |X$KZSPR | 1 | 26 | 14 || VIEW | | 1 | 13 | 2 || FAST DUAL | | 1 | | 2 |--------------------------------------------------------------------------------
Instance Activity Stats Section
This sect ion provides us with a number of various stat ist ics (such as, how many DBWR Checkpoints occurred, or how many consistent getsoccurred during the snapshot). These are the stat ist ics that the summary informat ion is derived from. A list of the stat ist ics maintained bythe RDBMS kernel can be found in Appendix C of the Oracle Reference manual for the version being ut ilized.Here is a part ial example of the report :
Instance Activity Stats for DB: PHS2 Instance: phs2 Snaps: 100 -104Statistic Total per Second per Trans--------------------------------- ---------------- ------------ ------------CPU used by this session 84,161 23.4 3,825.5CPU used when call started 196,346 54.5 8,924.8CR blocks created 709 0.2 32.2DBWR buffers scanned 0 0.0 0.0DBWR checkpoint buffers written 245 0.1 11.1DBWR checkpoints 33 0.0 1.5
PDFmyURL.com
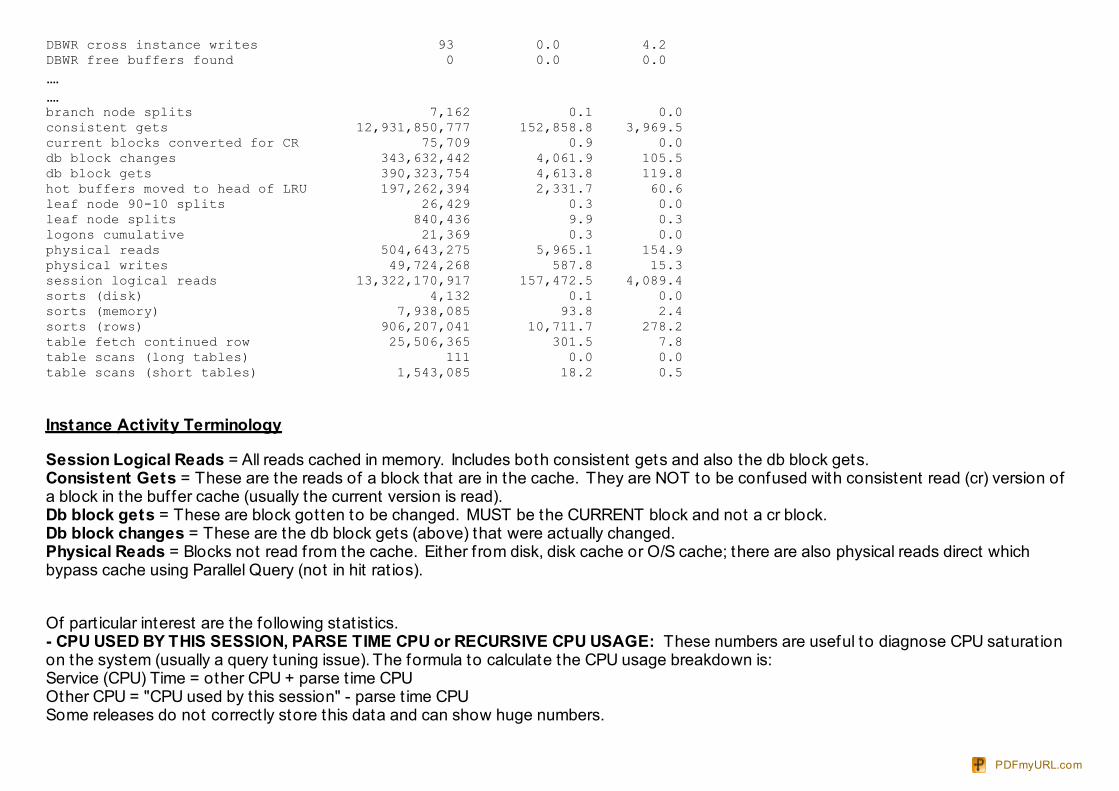
DBWR cross instance writes 93 0.0 4.2DBWR free buffers found 0 0.0 0.0........branch node splits 7,162 0.1 0.0consistent gets 12,931,850,777 152,858.8 3,969.5current blocks converted for CR 75,709 0.9 0.0db block changes 343,632,442 4,061.9 105.5db block gets 390,323,754 4,613.8 119.8hot buffers moved to head of LRU 197,262,394 2,331.7 60.6leaf node 90-10 splits 26,429 0.3 0.0leaf node splits 840,436 9.9 0.3logons cumulative 21,369 0.3 0.0physical reads 504,643,275 5,965.1 154.9physical writes 49,724,268 587.8 15.3session logical reads 13,322,170,917 157,472.5 4,089.4sorts (disk) 4,132 0.1 0.0sorts (memory) 7,938,085 93.8 2.4sorts (rows) 906,207,041 10,711.7 278.2table fetch continued row 25,506,365 301.5 7.8table scans (long tables) 111 0.0 0.0table scans (short tables) 1,543,085 18.2 0.5
Instance Activity Terminology
Session Logical Reads = All reads cached in memory. Includes both consistent gets and also the db block gets.Consistent Gets = These are the reads of a block that are in the cache. They are NOT to be confused with consistent read (cr) version ofa block in the buffer cache (usually the current version is read).Db block gets = These are block gotten to be changed. MUST be the CURRENT block and not a cr block.Db block changes = These are the db block gets (above) that were actually changed.Physical Reads = Blocks not read from the cache. Either f rom disk, disk cache or O/S cache; there are also physical reads direct whichbypass cache using Parallel Query (not in hit rat ios).
Of part icular interest are the following stat ist ics.- CPU USED BY THIS SESSION, PARSE TIME CPU or RECURSIVE CPU USAGE: These numbers are useful to diagnose CPU saturat ionon the system (usually a query tuning issue). The formula to calculate the CPU usage breakdown is:Service (CPU) Time = other CPU + parse t ime CPUOther CPU = "CPU used by this session" - parse t ime CPUSome releases do not correct ly store this data and can show huge numbers.
PDFmyURL.com
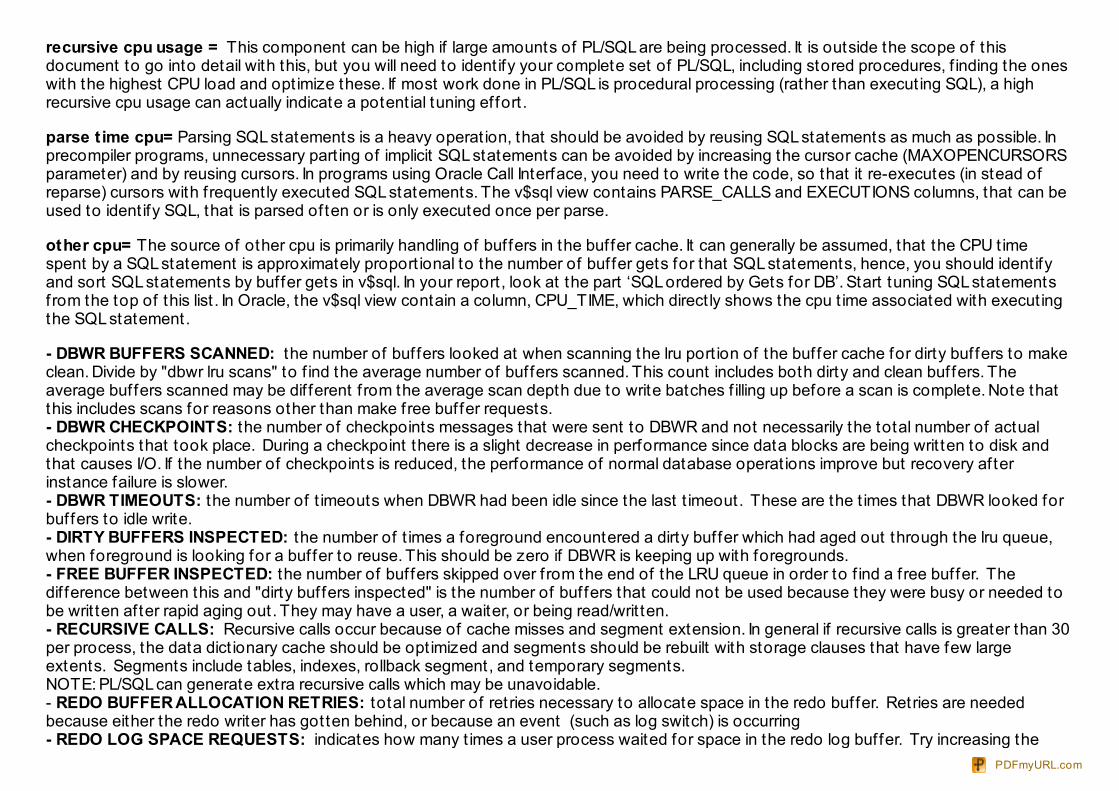
recursive cpu usage = This component can be high if large amounts of PL/SQL are being processed. It is outside the scope of thisdocument to go into detail with this, but you will need to ident ify your complete set of PL/SQL, including stored procedures, f inding the oneswith the highest CPU load and opt imize these. If most work done in PL/SQL is procedural processing (rather than execut ing SQL), a highrecursive cpu usage can actually indicate a potent ial tuning ef fort .
parse t ime cpu= Parsing SQL statements is a heavy operat ion, that should be avoided by reusing SQL statements as much as possible. Inprecompiler programs, unnecessary part ing of implicit SQL statements can be avoided by increasing the cursor cache (MAXOPENCURSORSparameter) and by reusing cursors. In programs using Oracle Call Interface, you need to write the code, so that it re-executes (in stead ofreparse) cursors with f requent ly executed SQL statements. The v$sql view contains PARSE_CALLS and EXECUTIONS columns, that can beused to ident ify SQL, that is parsed of ten or is only executed once per parse.
other cpu= The source of other cpu is primarily handling of buffers in the buffer cache. It can generally be assumed, that the CPU t imespent by a SQL statement is approximately proport ional to the number of buffer gets for that SQL statements, hence, you should ident ifyand sort SQL statements by buffer gets in v$sql. In your report , look at the part ‘SQL ordered by Gets for DB’. Start tuning SQL statementsfrom the top of this list . In Oracle, the v$sql view contain a column, CPU_TIME, which direct ly shows the cpu t ime associated with execut ingthe SQL statement.
- DBWR BUFFERS SCANNED: the number of buffers looked at when scanning the lru port ion of the buffer cache for dirty buffers to makeclean. Divide by "dbwr lru scans" to f ind the average number of buffers scanned. This count includes both dirty and clean buffers. Theaverage buffers scanned may be dif ferent f rom the average scan depth due to write batches f illing up before a scan is complete. Note thatthis includes scans for reasons other than make free buffer requests.- DBWR CHECKPOINTS: the number of checkpoints messages that were sent to DBWR and not necessarily the total number of actualcheckpoints that took place. During a checkpoint there is a slight decrease in performance since data blocks are being writ ten to disk andthat causes I/O. If the number of checkpoints is reduced, the performance of normal database operat ions improve but recovery af terinstance failure is slower.- DBWR TIMEOUTS: the number of t imeouts when DBWR had been idle since the last t imeout. These are the t imes that DBWR looked forbuffers to idle write.- DIRTY BUFFERS INSPECTED: the number of t imes a foreground encountered a dirty buffer which had aged out through the lru queue,when foreground is looking for a buffer to reuse. This should be zero if DBWR is keeping up with foregrounds.- FREE BUFFER INSPECTED: the number of buffers skipped over f rom the end of the LRU queue in order to f ind a f ree buffer. Thedif ference between this and "dirty buffers inspected" is the number of buffers that could not be used because they were busy or needed tobe writ ten af ter rapid aging out. They may have a user, a waiter, or being read/writ ten.- RECURSIVE CALLS: Recursive calls occur because of cache misses and segment extension. In general if recursive calls is greater than 30per process, the data dict ionary cache should be opt imized and segments should be rebuilt with storage clauses that have few largeextents. Segments include tables, indexes, rollback segment, and temporary segments.NOTE: PL/SQL can generate extra recursive calls which may be unavoidable.- REDO BUFFER ALLOCATION RETRIES: total number of retries necessary to allocate space in the redo buffer. Retries are neededbecause either the redo writer has gotten behind, or because an event (such as log switch) is occurring- REDO LOG SPACE REQUESTS: indicates how many t imes a user process waited for space in the redo log buffer. Try increasing the
PDFmyURL.com
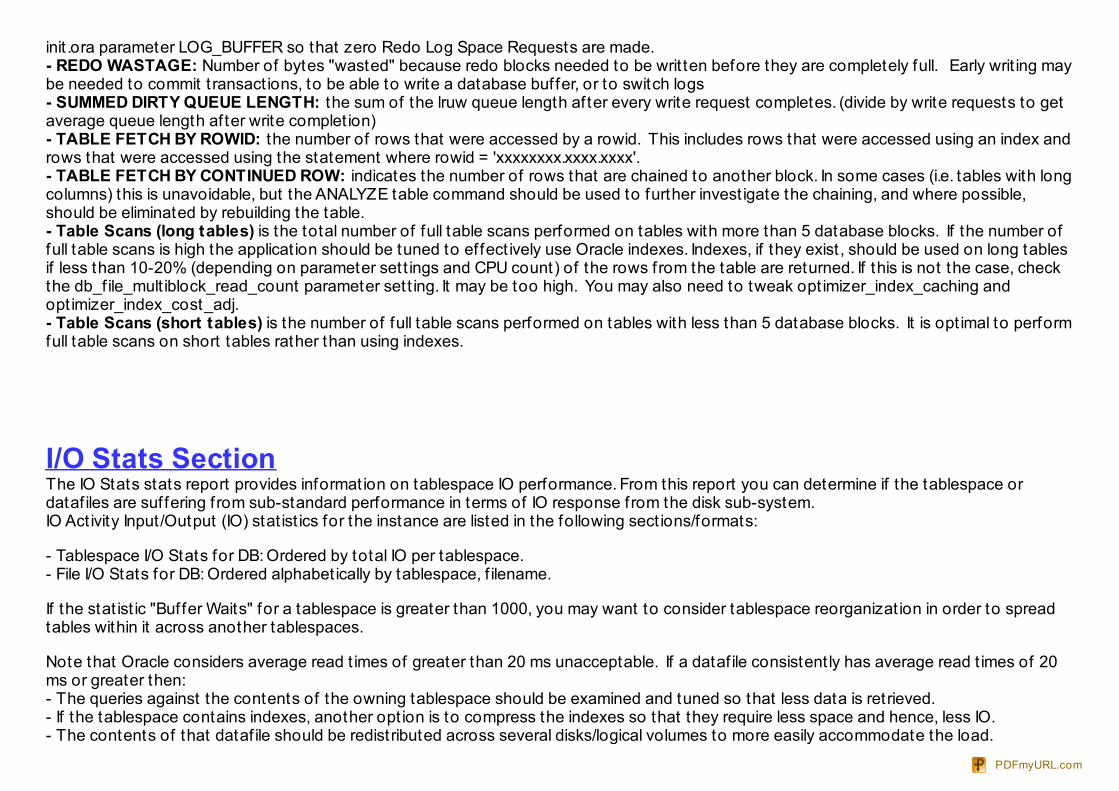
init .ora parameter LOG_BUFFER so that zero Redo Log Space Requests are made.- REDO WASTAGE: Number of bytes "wasted" because redo blocks needed to be writ ten before they are completely full. Early writ ing maybe needed to commit t ransact ions, to be able to write a database buffer, or to switch logs- SUMMED DIRTY QUEUE LENGTH: the sum of the lruw queue length af ter every write request completes. (divide by write requests to getaverage queue length af ter write complet ion)- TABLE FETCH BY ROWID: the number of rows that were accessed by a rowid. This includes rows that were accessed using an index androws that were accessed using the statement where rowid = 'xxxxxxxx.xxxx.xxxx'.- TABLE FETCH BY CONTINUED ROW: indicates the number of rows that are chained to another block. In some cases (i.e. tables with longcolumns) this is unavoidable, but the ANALYZE table command should be used to further invest igate the chaining, and where possible,should be eliminated by rebuilding the table.- Table Scans (long tables) is the total number of full table scans performed on tables with more than 5 database blocks. If the number offull table scans is high the applicat ion should be tuned to ef fect ively use Oracle indexes. Indexes, if they exist , should be used on long tablesif less than 10-20% (depending on parameter set t ings and CPU count) of the rows from the table are returned. If this is not the case, checkthe db_f ile_mult iblock_read_count parameter set t ing. It may be too high. You may also need to tweak opt imizer_index_caching andopt imizer_index_cost_adj.- Table Scans (short tables) is the number of full table scans performed on tables with less than 5 database blocks. It is opt imal to performfull table scans on short tables rather than using indexes.
I/O Stats SectionThe IO Stats stats report provides informat ion on tablespace IO performance. From this report you can determine if the tablespace ordataf iles are suffering f rom sub-standard performance in terms of IO response from the disk sub-system.IO Act ivity Input/Output (IO) stat ist ics for the instance are listed in the following sect ions/formats:
- Tablespace I/O Stats for DB: Ordered by total IO per tablespace. - File I/O Stats for DB: Ordered alphabet ically by tablespace, f ilename.
If the stat ist ic "Buffer Waits" for a tablespace is greater than 1000, you may want to consider tablespace reorganizat ion in order to spreadtables within it across another tablespaces.
Note that Oracle considers average read t imes of greater than 20 ms unacceptable. If a dataf ile consistent ly has average read t imes of 20ms or greater then: - The queries against the contents of the owning tablespace should be examined and tuned so that less data is retrieved. - If the tablespace contains indexes, another opt ion is to compress the indexes so that they require less space and hence, less IO. - The contents of that dataf ile should be redistributed across several disks/logical volumes to more easily accommodate the load.
PDFmyURL.com
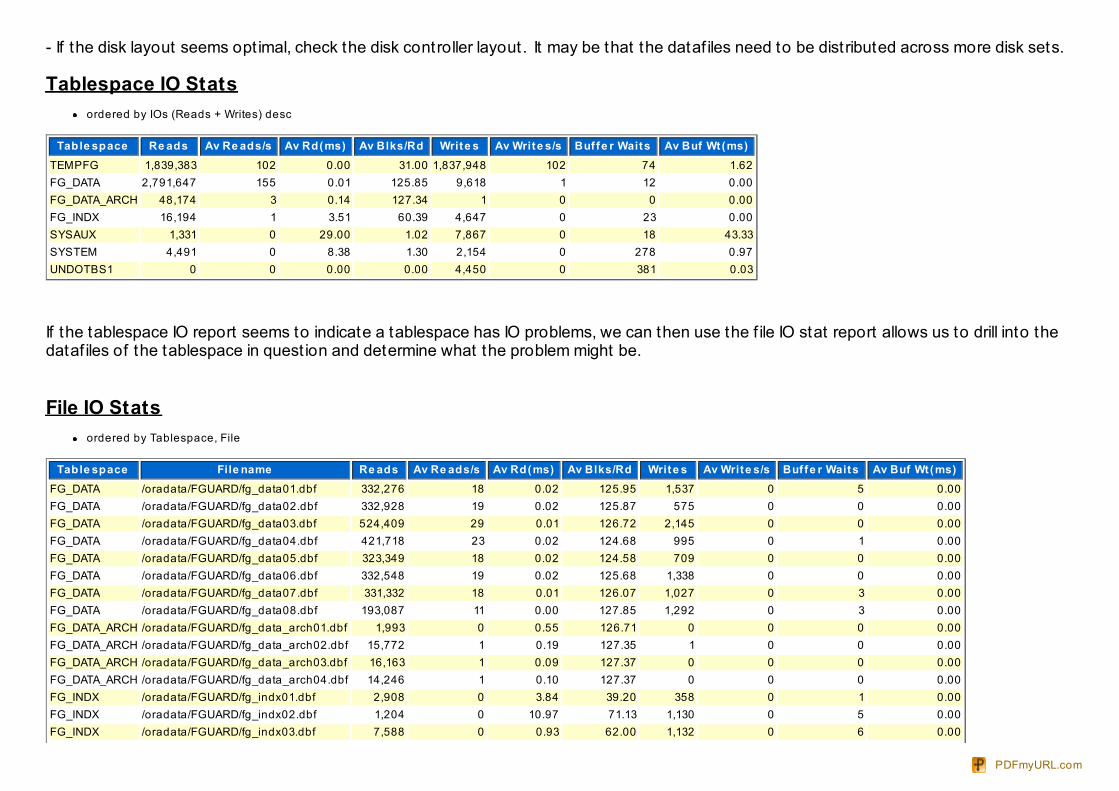
- If the disk layout seems opt imal, check the disk controller layout. It may be that the dataf iles need to be distributed across more disk sets.
Tablespace IO Statsordered by IOs (Reads + Writes) desc
Table space Re ads Av Re ads/s Av Rd(ms) Av Blks/Rd Write s Av Write s/s Buf fe r Waits Av Buf Wt (ms)TEMPFG 1,839,383 102 0.00 31.00 1,837,948 102 74 1.62FG_DATA 2,791,647 155 0.01 125.85 9,618 1 12 0.00FG_DATA_ARCH 48,174 3 0.14 127.34 1 0 0 0.00FG_INDX 16,194 1 3.51 60.39 4,647 0 23 0.00SYSAUX 1,331 0 29.00 1.02 7,867 0 18 43.33SYSTEM 4,491 0 8.38 1.30 2,154 0 278 0.97UNDOTBS1 0 0 0.00 0.00 4,450 0 381 0.03
If the tablespace IO report seems to indicate a tablespace has IO problems, we can then use the f ile IO stat report allows us to drill into thedataf iles of the tablespace in quest ion and determine what the problem might be.
File IO Statsordered by Tablespace, File
Table space File name Re ads Av Re ads/s Av Rd(ms) Av Blks/Rd Write s Av Write s/s Buf fe r Waits Av Buf Wt (ms)FG_DATA /oradata/FGUARD/fg_data01.dbf 332,276 18 0.02 125.95 1,537 0 5 0.00FG_DATA /oradata/FGUARD/fg_data02.dbf 332,928 19 0.02 125.87 575 0 0 0.00FG_DATA /oradata/FGUARD/fg_data03.dbf 524,409 29 0.01 126.72 2,145 0 0 0.00FG_DATA /oradata/FGUARD/fg_data04.dbf 421,718 23 0.02 124.68 995 0 1 0.00FG_DATA /oradata/FGUARD/fg_data05.dbf 323,349 18 0.02 124.58 709 0 0 0.00FG_DATA /oradata/FGUARD/fg_data06.dbf 332,548 19 0.02 125.68 1,338 0 0 0.00FG_DATA /oradata/FGUARD/fg_data07.dbf 331,332 18 0.01 126.07 1,027 0 3 0.00FG_DATA /oradata/FGUARD/fg_data08.dbf 193,087 11 0.00 127.85 1,292 0 3 0.00FG_DATA_ARCH /oradata/FGUARD/fg_data_arch01.dbf 1,993 0 0.55 126.71 0 0 0 0.00FG_DATA_ARCH /oradata/FGUARD/fg_data_arch02.dbf 15,772 1 0.19 127.35 1 0 0 0.00FG_DATA_ARCH /oradata/FGUARD/fg_data_arch03.dbf 16,163 1 0.09 127.37 0 0 0 0.00FG_DATA_ARCH /oradata/FGUARD/fg_data_arch04.dbf 14,246 1 0.10 127.37 0 0 0 0.00FG_INDX /oradata/FGUARD/fg_indx01.dbf 2,908 0 3.84 39.20 358 0 1 0.00FG_INDX /oradata/FGUARD/fg_indx02.dbf 1,204 0 10.97 71.13 1,130 0 5 0.00FG_INDX /oradata/FGUARD/fg_indx03.dbf 7,588 0 0.93 62.00 1,132 0 6 0.00
PDFmyURL.com
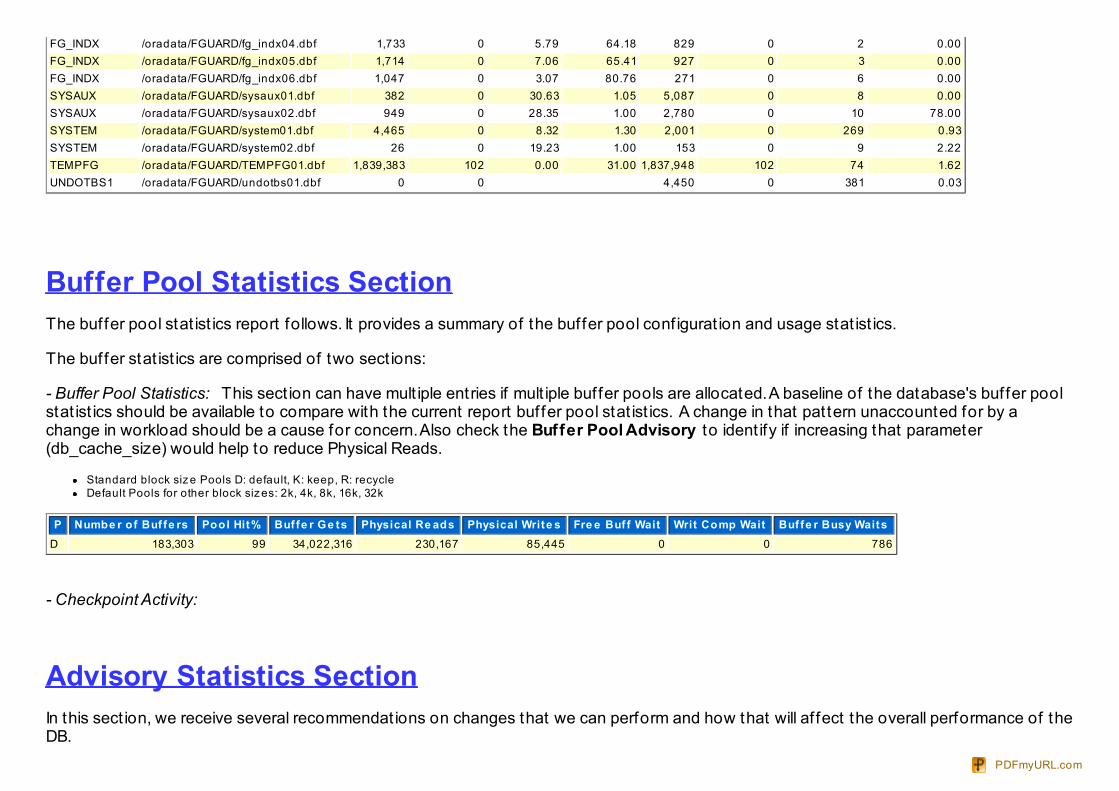
FG_INDX /oradata/FGUARD/fg_indx04.dbf 1,733 0 5.79 64.18 829 0 2 0.00FG_INDX /oradata/FGUARD/fg_indx05.dbf 1,714 0 7.06 65.41 927 0 3 0.00FG_INDX /oradata/FGUARD/fg_indx06.dbf 1,047 0 3.07 80.76 271 0 6 0.00SYSAUX /oradata/FGUARD/sysaux01.dbf 382 0 30.63 1.05 5,087 0 8 0.00SYSAUX /oradata/FGUARD/sysaux02.dbf 949 0 28.35 1.00 2,780 0 10 78.00SYSTEM /oradata/FGUARD/system01.dbf 4,465 0 8.32 1.30 2,001 0 269 0.93SYSTEM /oradata/FGUARD/system02.dbf 26 0 19.23 1.00 153 0 9 2.22TEMPFG /oradata/FGUARD/TEMPFG01.dbf 1,839,383 102 0.00 31.00 1,837,948 102 74 1.62UNDOTBS1 /oradata/FGUARD/undotbs01.dbf 0 0 4,450 0 381 0.03
Buffer Pool Statistics SectionThe buffer pool stat ist ics report follows. It provides a summary of the buffer pool conf igurat ion and usage stat ist ics.
The buffer stat ist ics are comprised of two sect ions:
- Buffer Pool Statistics: This sect ion can have mult iple entries if mult iple buffer pools are allocated. A baseline of the database's buffer poolstat ist ics should be available to compare with the current report buffer pool stat ist ics. A change in that pattern unaccounted for by achange in workload should be a cause for concern. Also check the Buffer Pool Advisory to ident ify if increasing that parameter(db_cache_size) would help to reduce Physical Reads.
Standard block siz e Pools D: default, K: keep, R: recycleDefault Pools for other block siz es: 2k, 4k, 8k, 16k, 32k
P Numbe r of Buf fe rs Pool Hit% Buf fe r Ge ts Physical Re ads Physical Write s Fre e Buf f Wait Writ Comp Wait Buf fe r Busy WaitsD 183,303 99 34,022,316 230,167 85,445 0 0 786
- Checkpoint Activity:
Advisory Statistics SectionIn this sect ion, we receive several recommendat ions on changes that we can perform and how that will af fect the overall performance of theDB.
PDFmyURL.com
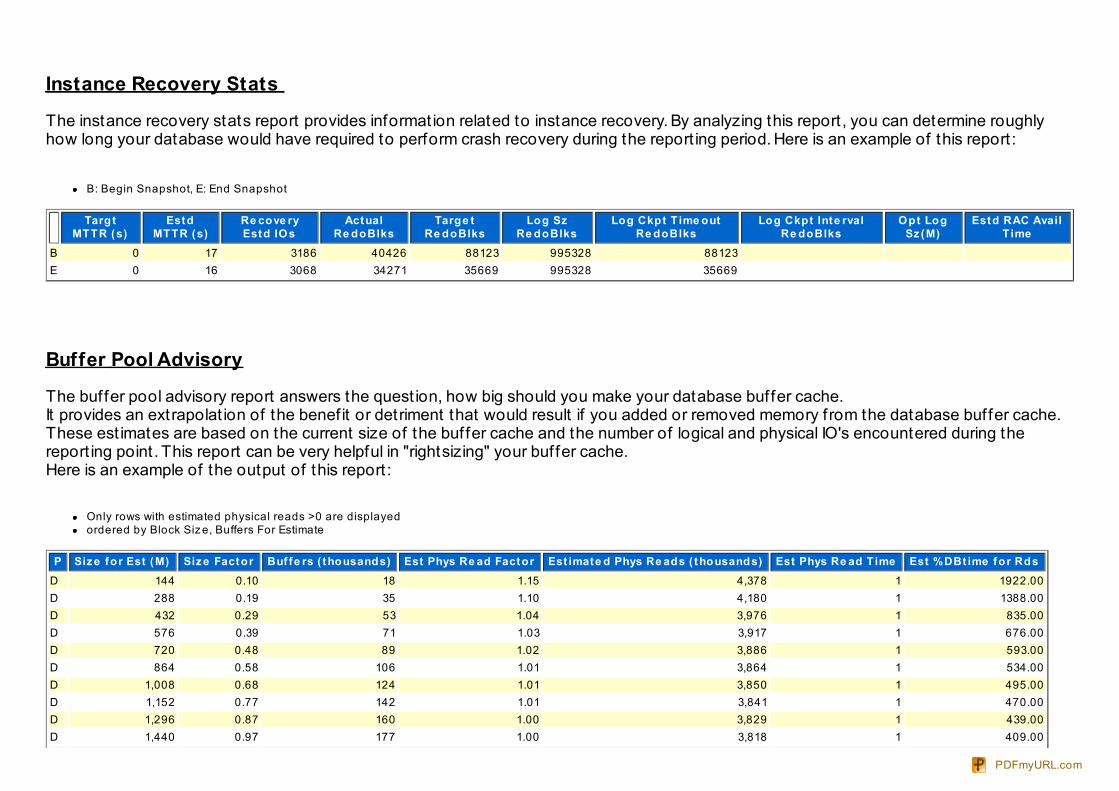
Instance Recovery Stats
The instance recovery stats report provides informat ion related to instance recovery. By analyzing this report , you can determine roughlyhow long your database would have required to perform crash recovery during the report ing period. Here is an example of this report :
B: Begin Snapshot, E: End Snapshot
TargtMTTR (s)
EstdMTTR (s)
Re cove ryEstd IOs
ActualRe doBlks
Targe tRe doBlks
Log SzRe doBlks
Log Ckpt T ime outRe doBlks
Log Ckpt Inte rvalRe doBlks
Opt LogSz (M)
Estd RAC AvailT ime
B 0 17 3186 40426 88123 995328 88123 E 0 16 3068 34271 35669 995328 35669
Buffer Pool Advisory
The buffer pool advisory report answers the quest ion, how big should you make your database buffer cache. It provides an extrapolat ion of the benef it or detriment that would result if you added or removed memory f rom the database buffer cache.These est imates are based on the current size of the buffer cache and the number of logical and physical IO's encountered during thereport ing point . This report can be very helpful in "rightsizing" your buffer cache. Here is an example of the output of this report :
Only rows with estimated physical reads >0 are displayedordered by Block Siz e, Buffers For Estimate
P Siz e for Est (M) Siz e Factor Buf fe rs ( thousands) Est Phys Re ad Factor Est imate d Phys Re ads ( thousands) Est Phys Re ad T ime Est %DBt ime for RdsD 144 0.10 18 1.15 4,378 1 1922.00D 288 0.19 35 1.10 4,180 1 1388.00D 432 0.29 53 1.04 3,976 1 835.00D 576 0.39 71 1.03 3,917 1 676.00D 720 0.48 89 1.02 3,886 1 593.00D 864 0.58 106 1.01 3,864 1 534.00D 1,008 0.68 124 1.01 3,850 1 495.00D 1,152 0.77 142 1.01 3,841 1 470.00D 1,296 0.87 160 1.00 3,829 1 439.00D 1,440 0.97 177 1.00 3,818 1 409.00
PDFmyURL.com
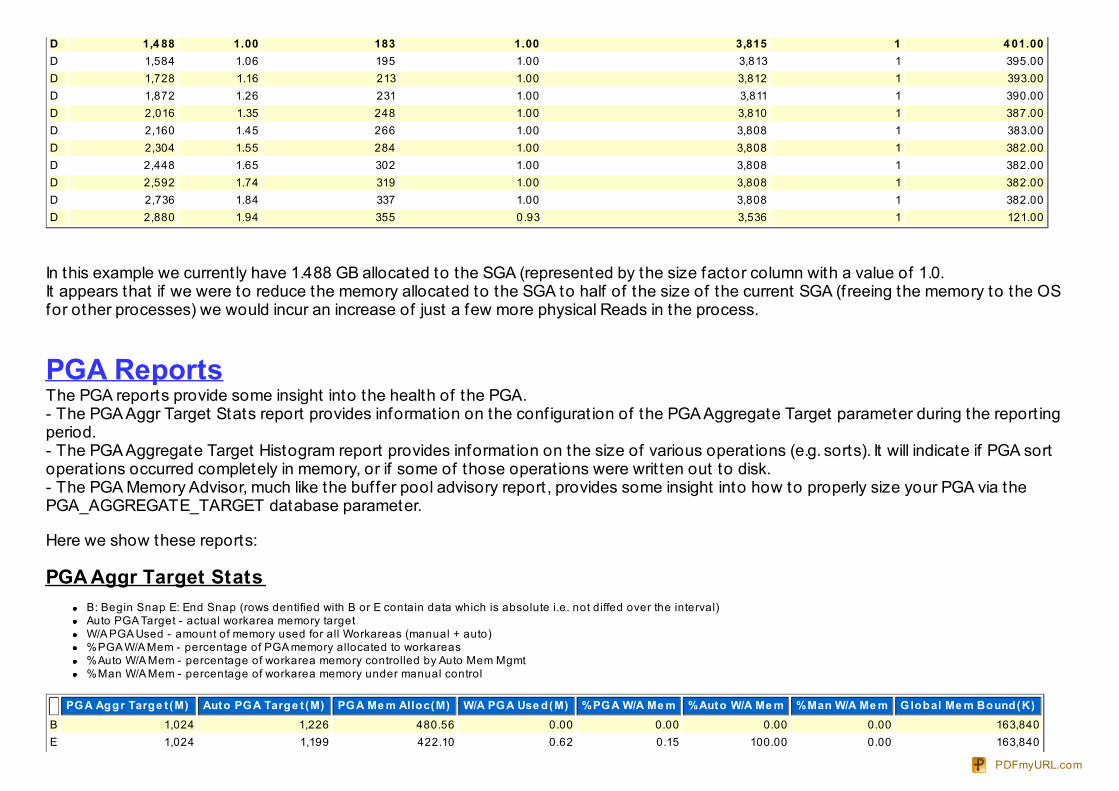
D 1,4 88 1.00 183 1.00 3,815 1 4 01.00D 1,584 1.06 195 1.00 3,813 1 395.00D 1,728 1.16 213 1.00 3,812 1 393.00D 1,872 1.26 231 1.00 3,811 1 390.00D 2,016 1.35 248 1.00 3,810 1 387.00D 2,160 1.45 266 1.00 3,808 1 383.00D 2,304 1.55 284 1.00 3,808 1 382.00D 2,448 1.65 302 1.00 3,808 1 382.00D 2,592 1.74 319 1.00 3,808 1 382.00D 2,736 1.84 337 1.00 3,808 1 382.00D 2,880 1.94 355 0.93 3,536 1 121.00
In this example we current ly have 1.488 GB allocated to the SGA (represented by the size factor column with a value of 1.0. It appears that if we were to reduce the memory allocated to the SGA to half of the size of the current SGA (freeing the memory to the OSfor other processes) we would incur an increase of just a few more physical Reads in the process.
PGA ReportsThe PGA reports provide some insight into the health of the PGA. - The PGA Aggr Target Stats report provides informat ion on the conf igurat ion of the PGA Aggregate Target parameter during the report ingperiod.- The PGA Aggregate Target Histogram report provides informat ion on the size of various operat ions (e.g. sorts). It will indicate if PGA sortoperat ions occurred completely in memory, or if some of those operat ions were writ ten out to disk.- The PGA Memory Advisor, much like the buffer pool advisory report , provides some insight into how to properly size your PGA via thePGA_AGGREGATE_TARGET database parameter.
Here we show these reports:
PGA Aggr Target StatsB: Begin Snap E: End Snap (rows dentified with B or E contain data which is absolute i.e. not diffed over the interval)Auto PGA Target - actual workarea memory targetW/A PGA Used - amount of memory used for all Workareas (manual + auto)%PGA W/A Mem - percentage of PGA memory allocated to workareas%Auto W/A Mem - percentage of workarea memory controlled by Auto Mem Mgmt%Man W/A Mem - percentage of workarea memory under manual control
PGA Aggr Targe t (M) Auto PGA Targe t (M) PGA Me m Alloc(M) W/A PGA Use d(M) %PGA W/A Me m %Auto W/A Me m %Man W/A Me m Global Me m Bound(K)B 1,024 1,226 480.56 0.00 0.00 0.00 0.00 163,840E 1,024 1,199 422.10 0.62 0.15 100.00 0.00 163,840
PDFmyURL.com
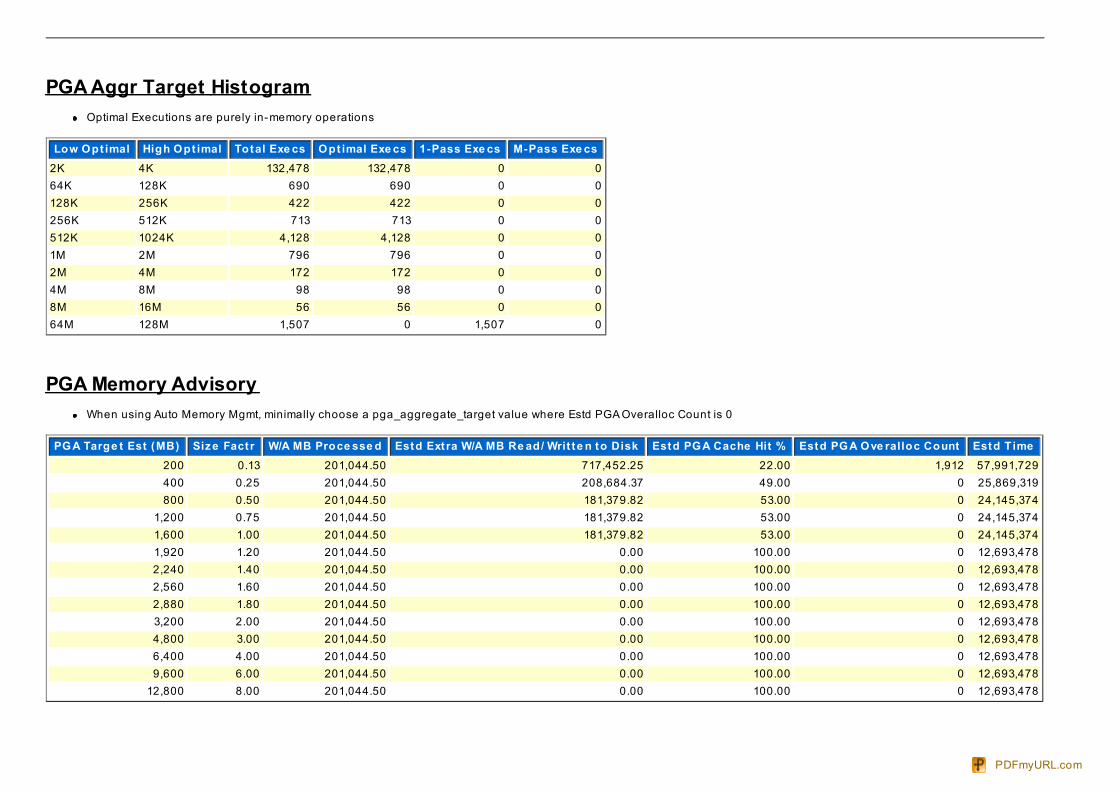
PGA Aggr Target HistogramOptimal Executions are purely in-memory operations
Low Opt imal High Opt imal Total Exe cs Opt imal Exe cs 1-Pass Exe cs M-Pass Exe cs2K 4K 132,478 132,478 0 064K 128K 690 690 0 0128K 256K 422 422 0 0256K 512K 713 713 0 0512K 1024K 4,128 4,128 0 01M 2M 796 796 0 02M 4M 172 172 0 04M 8M 98 98 0 08M 16M 56 56 0 064M 128M 1,507 0 1,507 0
PGA Memory AdvisoryWhen using Auto Memory Mgmt, minimally choose a pga_aggregate_target value where Estd PGA Overalloc Count is 0
PGA Targe t Est (MB) Siz e Fact r W/A MB Proce sse d Estd Ext ra W/A MB Re ad/ Writ te n to Disk Estd PGA Cache Hit % Estd PGA Ove ralloc Count Estd T ime200 0.13 201,044.50 717,452.25 22.00 1,912 57,991,729400 0.25 201,044.50 208,684.37 49.00 0 25,869,319800 0.50 201,044.50 181,379.82 53.00 0 24,145,374
1,200 0.75 201,044.50 181,379.82 53.00 0 24,145,3741,600 1.00 201,044.50 181,379.82 53.00 0 24,145,3741,920 1.20 201,044.50 0.00 100.00 0 12,693,4782,240 1.40 201,044.50 0.00 100.00 0 12,693,4782,560 1.60 201,044.50 0.00 100.00 0 12,693,4782,880 1.80 201,044.50 0.00 100.00 0 12,693,4783,200 2.00 201,044.50 0.00 100.00 0 12,693,4784,800 3.00 201,044.50 0.00 100.00 0 12,693,4786,400 4.00 201,044.50 0.00 100.00 0 12,693,4789,600 6.00 201,044.50 0.00 100.00 0 12,693,478
12,800 8.00 201,044.50 0.00 100.00 0 12,693,478
PDFmyURL.com
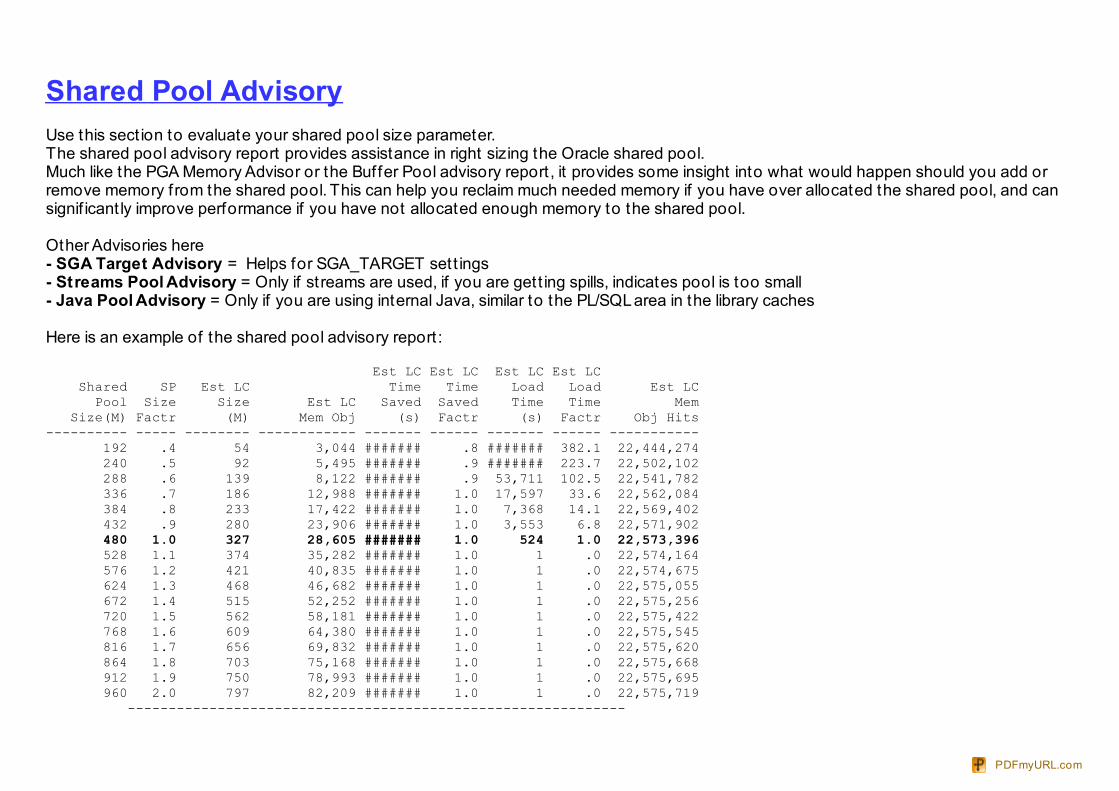
Shared Pool AdvisoryUse this sect ion to evaluate your shared pool size parameter.The shared pool advisory report provides assistance in right sizing the Oracle shared pool. Much like the PGA Memory Advisor or the Buffer Pool advisory report , it provides some insight into what would happen should you add orremove memory f rom the shared pool. This can help you reclaim much needed memory if you have over allocated the shared pool, and cansignif icant ly improve performance if you have not allocated enough memory to the shared pool.
Other Advisories here- SGA Target Advisory = Helps for SGA_TARGET sett ings- Streams Pool Advisory = Only if streams are used, if you are gett ing spills, indicates pool is too small- Java Pool Advisory = Only if you are using internal Java, similar to the PL/SQL area in the library caches
Here is an example of the shared pool advisory report :
Est LC Est LC Est LC Est LC Shared SP Est LC Time Time Load Load Est LC Pool Size Size Est LC Saved Saved Time Time Mem Size(M) Factr (M) Mem Obj (s) Factr (s) Factr Obj Hits---------- ----- -------- ------------ ------- ------ ------- ------ ----------- 192 .4 54 3,044 ####### .8 ####### 382.1 22,444,274 240 .5 92 5,495 ####### .9 ####### 223.7 22,502,102 288 .6 139 8,122 ####### .9 53,711 102.5 22,541,782 336 .7 186 12,988 ####### 1.0 17,597 33.6 22,562,084 384 .8 233 17,422 ####### 1.0 7,368 14.1 22,569,402 432 .9 280 23,906 ####### 1.0 3,553 6.8 22,571,902 480 1.0 327 28,605 ####### 1.0 524 1.0 22,573,396 528 1.1 374 35,282 ####### 1.0 1 .0 22,574,164 576 1.2 421 40,835 ####### 1.0 1 .0 22,574,675 624 1.3 468 46,682 ####### 1.0 1 .0 22,575,055 672 1.4 515 52,252 ####### 1.0 1 .0 22,575,256 720 1.5 562 58,181 ####### 1.0 1 .0 22,575,422 768 1.6 609 64,380 ####### 1.0 1 .0 22,575,545 816 1.7 656 69,832 ####### 1.0 1 .0 22,575,620 864 1.8 703 75,168 ####### 1.0 1 .0 22,575,668 912 1.9 750 78,993 ####### 1.0 1 .0 22,575,695 960 2.0 797 82,209 ####### 1.0 1 .0 22,575,719 -------------------------------------------------------------
PDFmyURL.com
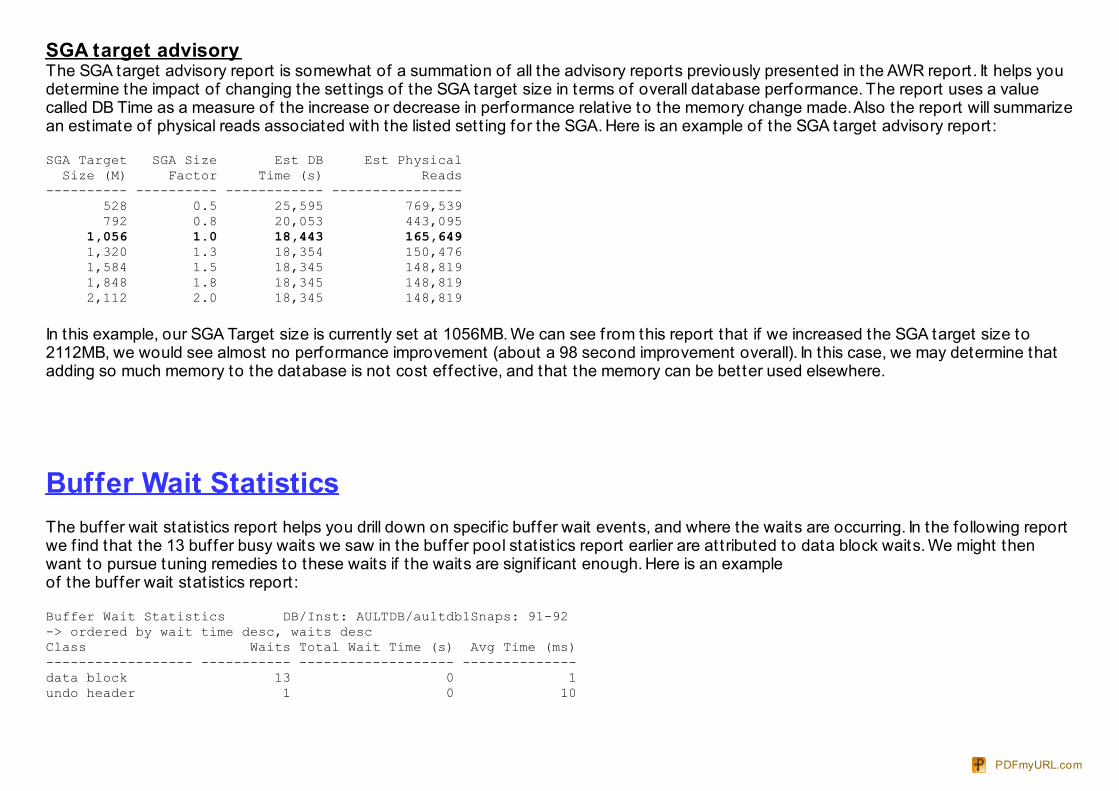
SGA target advisoryThe SGA target advisory report is somewhat of a summation of all the advisory reports previously presented in the AWR report . It helps youdetermine the impact of changing the sett ings of the SGA target size in terms of overall database performance. The report uses a valuecalled DB Time as a measure of the increase or decrease in performance relat ive to the memory change made. Also the report will summarizean est imate of physical reads associated with the listed sett ing for the SGA. Here is an example of the SGA target advisory report :
SGA Target SGA Size Est DB Est Physical Size (M) Factor Time (s) Reads---------- ---------- ------------ ---------------- 528 0.5 25,595 769,539 792 0.8 20,053 443,095 1,056 1.0 18,443 165,649 1,320 1.3 18,354 150,476 1,584 1.5 18,345 148,819 1,848 1.8 18,345 148,819 2,112 2.0 18,345 148,819
In this example, our SGA Target size is current ly set at 1056MB. We can see from this report that if we increased the SGA target size to2112MB, we would see almost no performance improvement (about a 98 second improvement overall). In this case, we may determine thatadding so much memory to the database is not cost ef fect ive, and that the memory can be better used elsewhere.
Buffer Wait StatisticsThe buffer wait stat ist ics report helps you drill down on specif ic buffer wait events, and where the waits are occurring. In the following reportwe f ind that the 13 buffer busy waits we saw in the buffer pool stat ist ics report earlier are at t ributed to data block waits. We might thenwant to pursue tuning remedies to these waits if the waits are signif icant enough. Here is an example of the buffer wait stat ist ics report :
Buffer Wait Statistics DB/Inst: AULTDB/aultdb1Snaps: 91-92-> ordered by wait time desc, waits descClass Waits Total Wait Time (s) Avg Time (ms)------------------ ----------- ------------------- --------------data block 13 0 1undo header 1 0 10
PDFmyURL.com
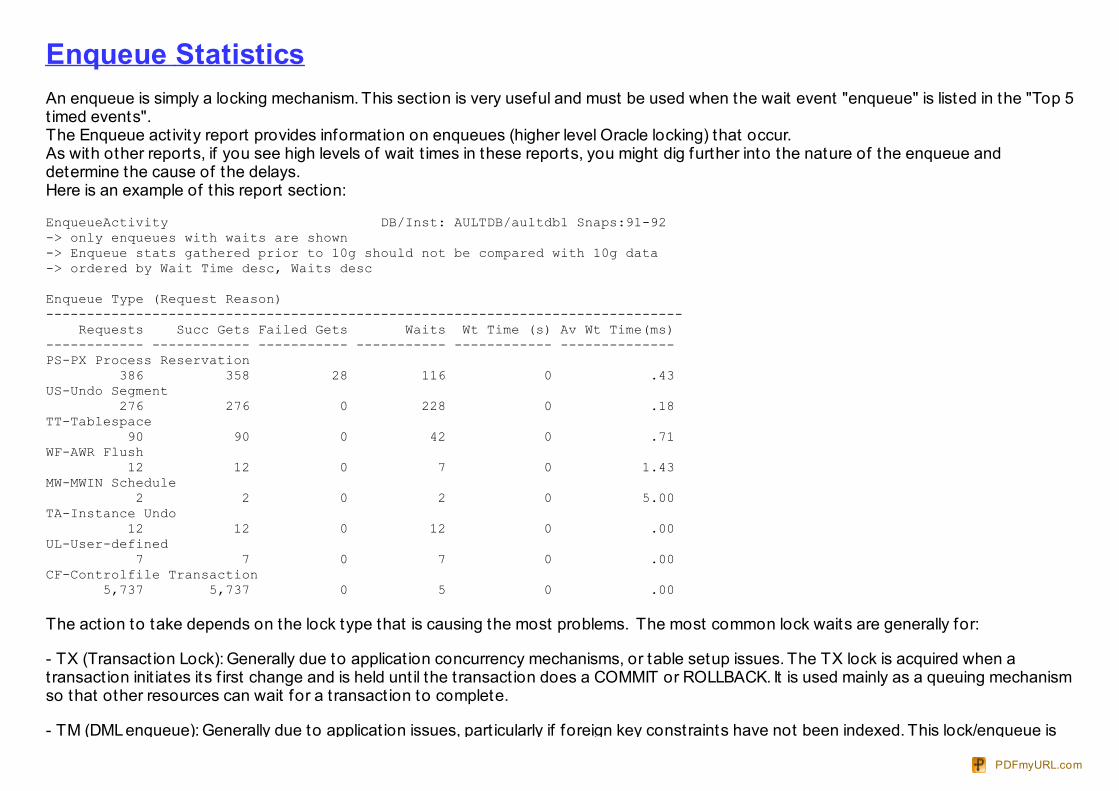
Enqueue StatisticsAn enqueue is simply a locking mechanism. This sect ion is very useful and must be used when the wait event "enqueue" is listed in the "Top 5t imed events".The Enqueue act ivity report provides informat ion on enqueues (higher level Oracle locking) that occur. As with other reports, if you see high levels of wait t imes in these reports, you might dig further into the nature of the enqueue anddetermine the cause of the delays. Here is an example of this report sect ion:
EnqueueActivity DB/Inst: AULTDB/aultdb1 Snaps:91-92-> only enqueues with waits are shown-> Enqueue stats gathered prior to 10g should not be compared with 10g data-> ordered by Wait Time desc, Waits desc
Enqueue Type (Request Reason)------------------------------------------------------------------------------ Requests Succ Gets Failed Gets Waits Wt Time (s) Av Wt Time(ms)------------ ------------ ----------- ----------- ------------ --------------PS-PX Process Reservation 386 358 28 116 0 .43US-Undo Segment 276 276 0 228 0 .18TT-Tablespace 90 90 0 42 0 .71WF-AWR Flush 12 12 0 7 0 1.43MW-MWIN Schedule 2 2 0 2 0 5.00TA-Instance Undo 12 12 0 12 0 .00UL-User-defined 7 7 0 7 0 .00CF-Controlfile Transaction 5,737 5,737 0 5 0 .00
The act ion to take depends on the lock type that is causing the most problems. The most common lock waits are generally for:
- TX (Transact ion Lock): Generally due to applicat ion concurrency mechanisms, or table setup issues. The TX lock is acquired when atransact ion init iates its f irst change and is held unt il the t ransact ion does a COMMIT or ROLLBACK. It is used mainly as a queuing mechanismso that other resources can wait for a t ransact ion to complete.
- TM (DML enqueue): Generally due to applicat ion issues, part icularly if foreign key constraints have not been indexed. This lock/enqueue is
PDFmyURL.com
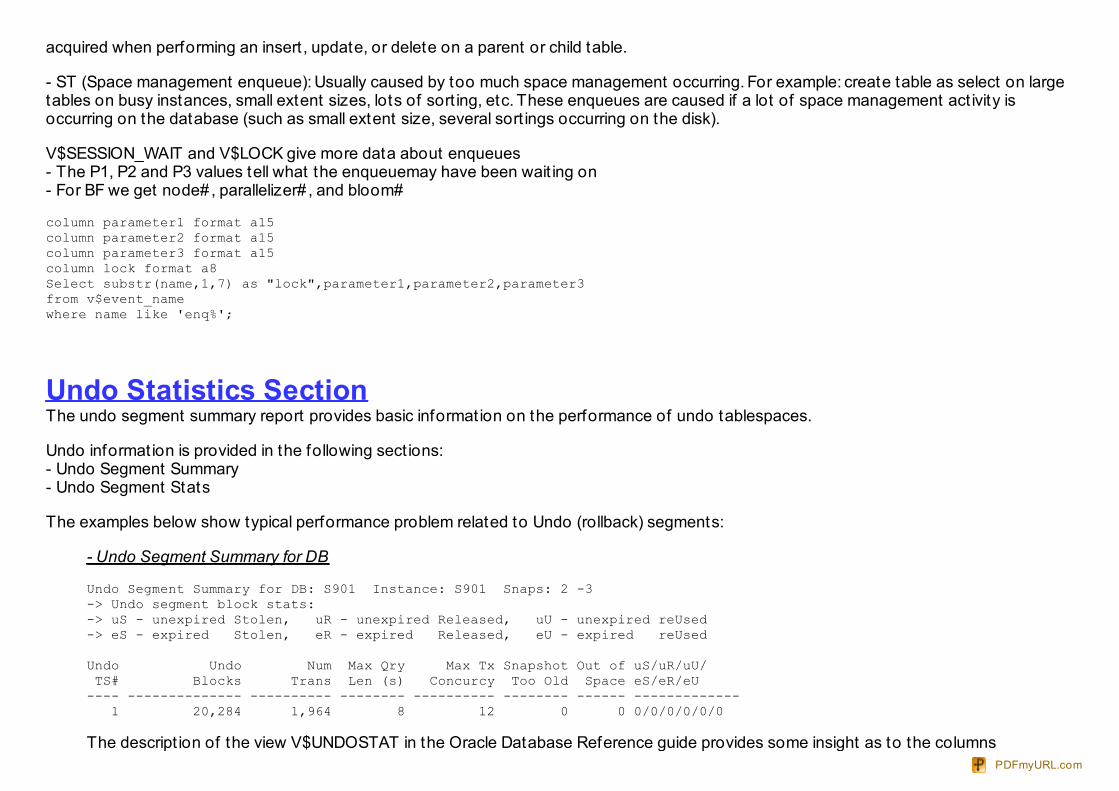
acquired when performing an insert , update, or delete on a parent or child table.
- ST (Space management enqueue): Usually caused by too much space management occurring. For example: create table as select on largetables on busy instances, small extent sizes, lots of sort ing, etc. These enqueues are caused if a lot of space management act ivity isoccurring on the database (such as small extent size, several sort ings occurring on the disk).
V$SESSION_WAIT and V$LOCK give more data about enqueues- The P1, P2 and P3 values tell what the enqueuemay have been wait ing on- For BF we get node# , parallelizer# , and bloom#
column parameter1 format a15column parameter2 format a15column parameter3 format a15column lock format a8Select substr(name,1,7) as "lock",parameter1,parameter2,parameter3 from v$event_namewhere name like 'enq%';
Undo Statistics SectionThe undo segment summary report provides basic informat ion on the performance of undo tablespaces.
Undo informat ion is provided in the following sect ions:- Undo Segment Summary- Undo Segment Stats
The examples below show typical performance problem related to Undo (rollback) segments:
- Undo Segment Summary for DB
Undo Segment Summary for DB: S901 Instance: S901 Snaps: 2 -3-> Undo segment block stats:-> uS - unexpired Stolen, uR - unexpired Released, uU - unexpired reUsed-> eS - expired Stolen, eR - expired Released, eU - expired reUsed Undo Undo Num Max Qry Max Tx Snapshot Out of uS/uR/uU/ TS# Blocks Trans Len (s) Concurcy Too Old Space eS/eR/eU---- -------------- ---------- -------- ---------- -------- ------ ------------- 1 20,284 1,964 8 12 0 0 0/0/0/0/0/0
The descript ion of the view V$UNDOSTAT in the Oracle Database Reference guide provides some insight as to the columns PDFmyURL.com
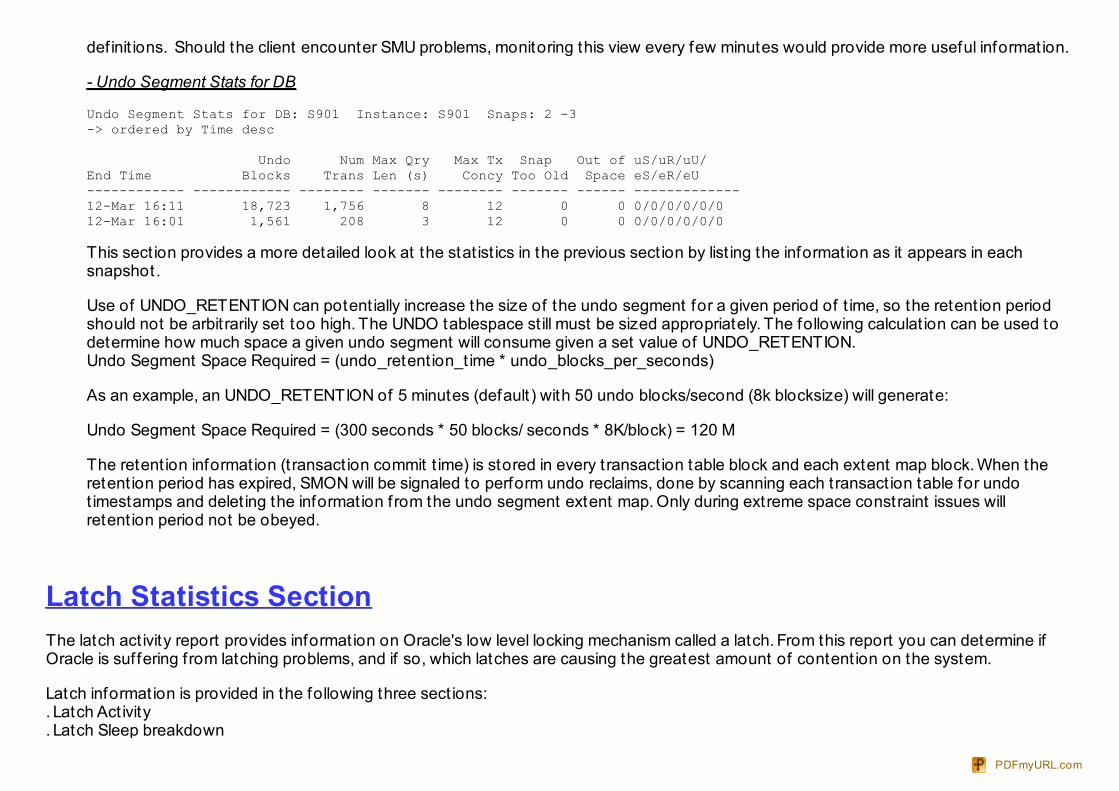
def init ions. Should the client encounter SMU problems, monitoring this view every few minutes would provide more useful informat ion.
- Undo Segment Stats for DB
Undo Segment Stats for DB: S901 Instance: S901 Snaps: 2 -3-> ordered by Time desc Undo Num Max Qry Max Tx Snap Out of uS/uR/uU/End Time Blocks Trans Len (s) Concy Too Old Space eS/eR/eU------------ ------------ -------- ------- -------- ------- ------ -------------12-Mar 16:11 18,723 1,756 8 12 0 0 0/0/0/0/0/012-Mar 16:01 1,561 208 3 12 0 0 0/0/0/0/0/0
This sect ion provides a more detailed look at the stat ist ics in the previous sect ion by list ing the informat ion as it appears in eachsnapshot.
Use of UNDO_RETENTION can potent ially increase the size of the undo segment for a given period of t ime, so the retent ion periodshould not be arbit rarily set too high. The UNDO tablespace st ill must be sized appropriately. The following calculat ion can be used todetermine how much space a given undo segment will consume given a set value of UNDO_RETENTION.Undo Segment Space Required = (undo_retent ion_t ime * undo_blocks_per_seconds)
As an example, an UNDO_RETENTION of 5 minutes (default ) with 50 undo blocks/second (8k blocksize) will generate:
Undo Segment Space Required = (300 seconds * 50 blocks/ seconds * 8K/block) = 120 M
The retent ion informat ion (t ransact ion commit t ime) is stored in every t ransact ion table block and each extent map block. When theretent ion period has expired, SMON will be signaled to perform undo reclaims, done by scanning each transact ion table for undot imestamps and delet ing the informat ion from the undo segment extent map. Only during extreme space constraint issues willretent ion period not be obeyed.
Latch Statistics SectionThe latch act ivity report provides informat ion on Oracle's low level locking mechanism called a latch. From this report you can determine ifOracle is suf fering f rom latching problems, and if so, which latches are causing the greatest amount of content ion on the system.
Latch informat ion is provided in the following three sect ions:. Latch Act ivity . Latch Sleep breakdown
PDFmyURL.com
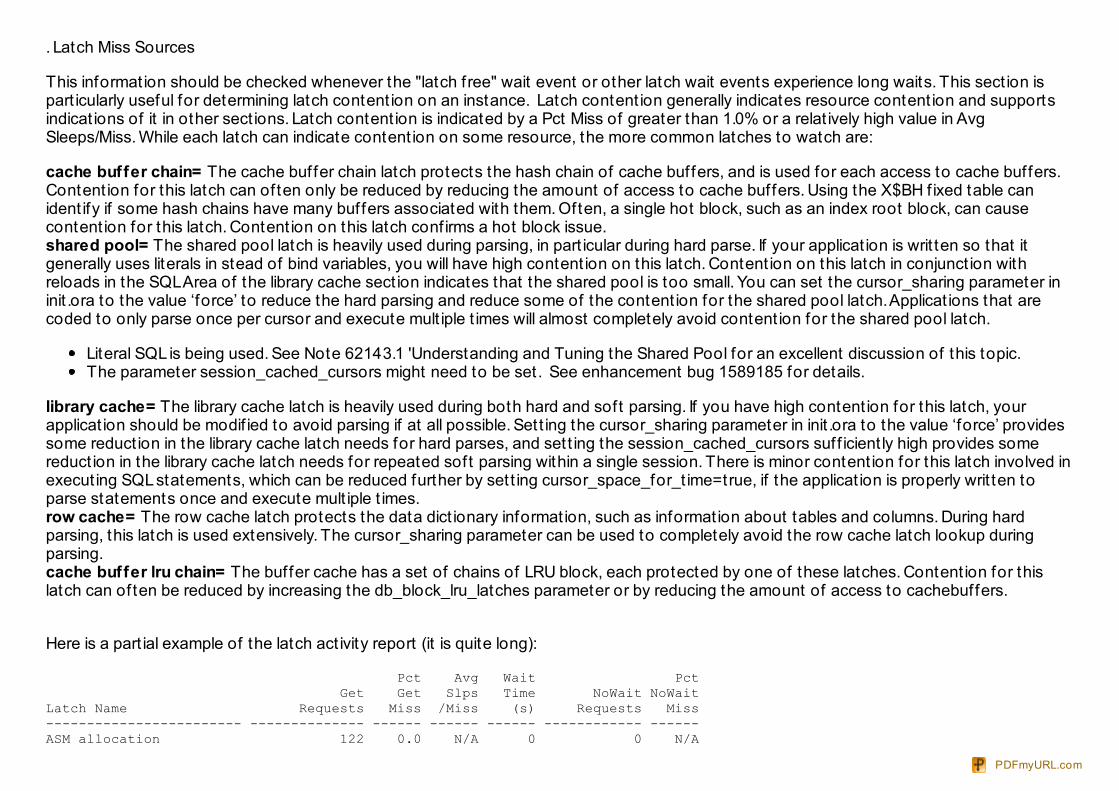
. Latch Miss Sources
This informat ion should be checked whenever the "latch f ree" wait event or other latch wait events experience long waits. This sect ion ispart icularly useful for determining latch content ion on an instance. Latch content ion generally indicates resource content ion and supportsindicat ions of it in other sect ions. Latch content ion is indicated by a Pct Miss of greater than 1.0% or a relat ively high value in AvgSleeps/Miss. While each latch can indicate content ion on some resource, the more common latches to watch are:
cache buffer chain= The cache buffer chain latch protects the hash chain of cache buffers, and is used for each access to cache buffers.Content ion for this latch can of ten only be reduced by reducing the amount of access to cache buffers. Using the X$BH f ixed table canident ify if some hash chains have many buffers associated with them. Often, a single hot block, such as an index root block, can causecontent ion for this latch. Content ion on this latch conf irms a hot block issue.shared pool= The shared pool latch is heavily used during parsing, in part icular during hard parse. If your applicat ion is writ ten so that itgenerally uses literals in stead of bind variables, you will have high content ion on this latch. Content ion on this latch in conjunct ion withreloads in the SQL Area of the library cache sect ion indicates that the shared pool is too small. You can set the cursor_sharing parameter ininit .ora to the value ‘force’ to reduce the hard parsing and reduce some of the content ion for the shared pool latch. Applicat ions that arecoded to only parse once per cursor and execute mult iple t imes will almost completely avoid content ion for the shared pool latch.
Literal SQL is being used. See Note 62143.1 'Understanding and Tuning the Shared Pool for an excellent discussion of this topic.The parameter session_cached_cursors might need to be set. See enhancement bug 1589185 for details.
library cache= The library cache latch is heavily used during both hard and soft parsing. If you have high content ion for this latch, yourapplicat ion should be modif ied to avoid parsing if at all possible. Sett ing the cursor_sharing parameter in init .ora to the value ‘force’ providessome reduct ion in the library cache latch needs for hard parses, and sett ing the session_cached_cursors suf f icient ly high provides somereduct ion in the library cache latch needs for repeated soft parsing within a single session. There is minor content ion for this latch involved inexecut ing SQL statements, which can be reduced further by sett ing cursor_space_for_t ime=true, if the applicat ion is properly writ ten toparse statements once and execute mult iple t imes.row cache= The row cache latch protects the data dict ionary informat ion, such as informat ion about tables and columns. During hardparsing, this latch is used extensively. The cursor_sharing parameter can be used to completely avoid the row cache latch lookup duringparsing.cache buffer lru chain= The buffer cache has a set of chains of LRU block, each protected by one of these latches. Content ion for thislatch can of ten be reduced by increasing the db_block_lru_latches parameter or by reducing the amount of access to cachebuffers.
Here is a part ial example of the latch act ivity report (it is quite long):
Pct Avg Wait Pct Get Get Slps Time NoWait NoWaitLatch Name Requests Miss /Miss (s) Requests Miss------------------------ -------------- ------ ------ ------ ------------ ------ASM allocation 122 0.0 N/A 0 0 N/A
PDFmyURL.com
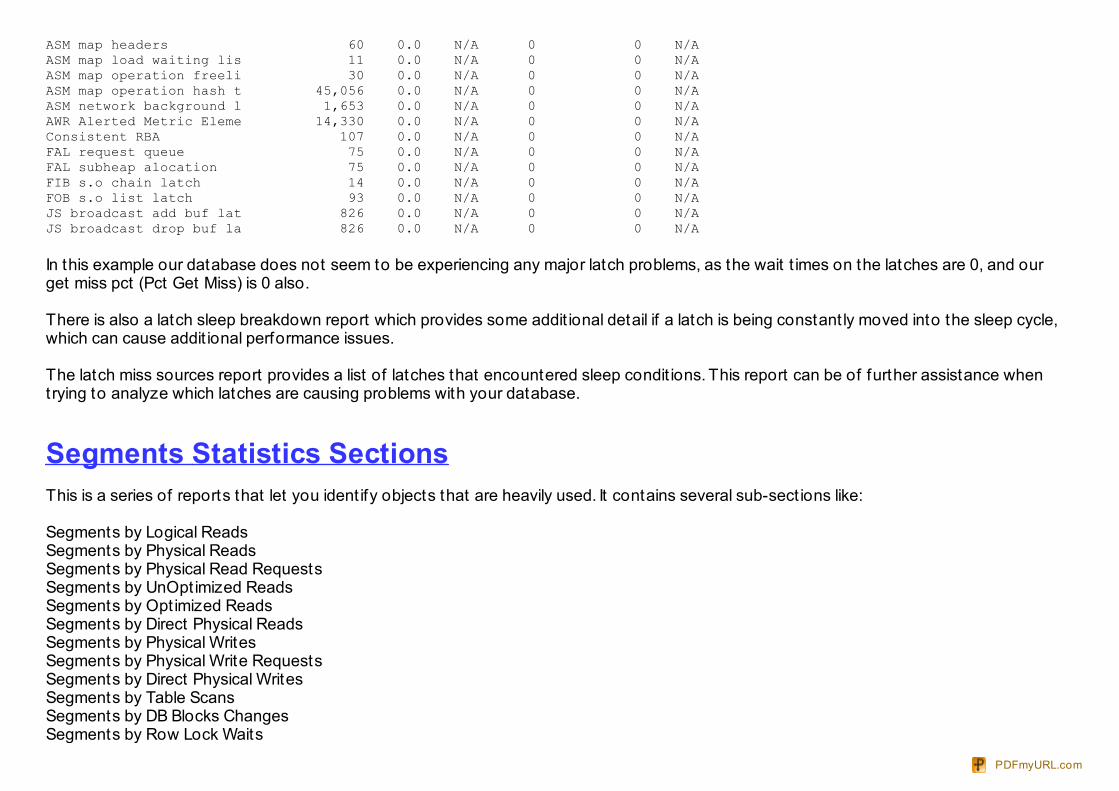
ASM map headers 60 0.0 N/A 0 0 N/AASM map load waiting lis 11 0.0 N/A 0 0 N/AASM map operation freeli 30 0.0 N/A 0 0 N/AASM map operation hash t 45,056 0.0 N/A 0 0 N/AASM network background l 1,653 0.0 N/A 0 0 N/AAWR Alerted Metric Eleme 14,330 0.0 N/A 0 0 N/AConsistent RBA 107 0.0 N/A 0 0 N/AFAL request queue 75 0.0 N/A 0 0 N/AFAL subheap alocation 75 0.0 N/A 0 0 N/AFIB s.o chain latch 14 0.0 N/A 0 0 N/AFOB s.o list latch 93 0.0 N/A 0 0 N/AJS broadcast add buf lat 826 0.0 N/A 0 0 N/AJS broadcast drop buf la 826 0.0 N/A 0 0 N/A
In this example our database does not seem to be experiencing any major latch problems, as the wait t imes on the latches are 0, and ourget miss pct (Pct Get Miss) is 0 also.
There is also a latch sleep breakdown report which provides some addit ional detail if a latch is being constant ly moved into the sleep cycle,which can cause addit ional performance issues.
The latch miss sources report provides a list of latches that encountered sleep condit ions. This report can be of further assistance whentrying to analyze which latches are causing problems with your database.
Segments Statistics SectionsThis is a series of reports that let you ident ify objects that are heavily used. It contains several sub-sect ions like:
Segments by Logical ReadsSegments by Physical ReadsSegments by Physical Read RequestsSegments by UnOptimized ReadsSegments by Opt imized ReadsSegments by Direct Physical ReadsSegments by Physical WritesSegments by Physical Write RequestsSegments by Direct Physical WritesSegments by Table ScansSegments by DB Blocks ChangesSegments by Row Lock Waits
PDFmyURL.com
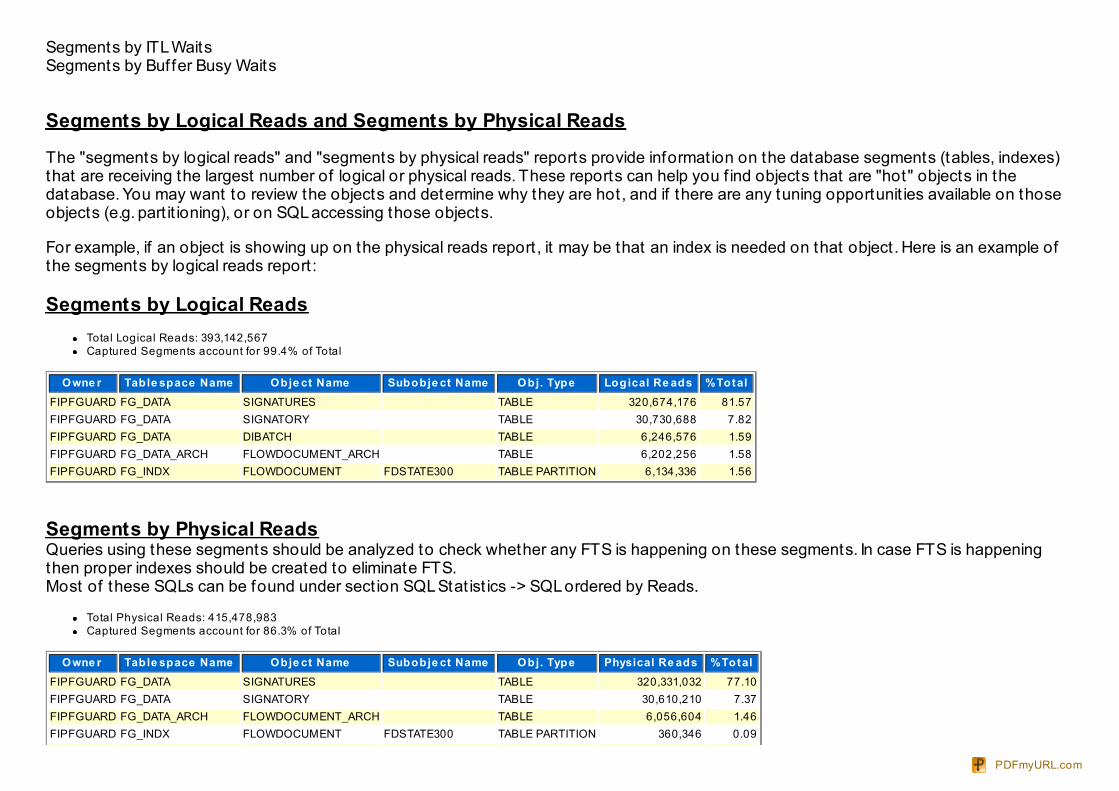
Segments by ITL WaitsSegments by Buffer Busy Waits
Segments by Logical Reads and Segments by Physical Reads
The "segments by logical reads" and "segments by physical reads" reports provide informat ion on the database segments (tables, indexes)that are receiving the largest number of logical or physical reads. These reports can help you f ind objects that are "hot" objects in thedatabase. You may want to review the objects and determine why they are hot, and if there are any tuning opportunit ies available on thoseobjects (e.g. part it ioning), or on SQL accessing those objects.
For example, if an object is showing up on the physical reads report , it may be that an index is needed on that object . Here is an example ofthe segments by logical reads report :
Segments by Logical ReadsTotal Logical Reads: 393,142,567Captured Segments account for 99.4% of Total
Owne r Table space Name Obje ct Name Subobje ct Name Obj. Type Logical Re ads %TotalFIPFGUARD FG_DATA SIGNATURES TABLE 320,674,176 81.57FIPFGUARD FG_DATA SIGNATORY TABLE 30,730,688 7.82FIPFGUARD FG_DATA DIBATCH TABLE 6,246,576 1.59FIPFGUARD FG_DATA_ARCH FLOWDOCUMENT_ARCH TABLE 6,202,256 1.58FIPFGUARD FG_INDX FLOWDOCUMENT FDSTATE300 TABLE PARTITION 6,134,336 1.56
Segments by Physical ReadsQueries using these segments should be analyzed to check whether any FTS is happening on these segments. In case FTS is happeningthen proper indexes should be created to eliminate FTS. Most of these SQLs can be found under sect ion SQL Stat ist ics -> SQL ordered by Reads.
Total Physical Reads: 415,478,983Captured Segments account for 86.3% of Total
Owne r Table space Name Obje ct Name Subobje ct Name Obj. Type Physical Re ads %TotalFIPFGUARD FG_DATA SIGNATURES TABLE 320,331,032 77.10FIPFGUARD FG_DATA SIGNATORY TABLE 30,610,210 7.37FIPFGUARD FG_DATA_ARCH FLOWDOCUMENT_ARCH TABLE 6,056,604 1.46FIPFGUARD FG_INDX FLOWDOCUMENT FDSTATE300 TABLE PARTITION 360,346 0.09
PDFmyURL.com
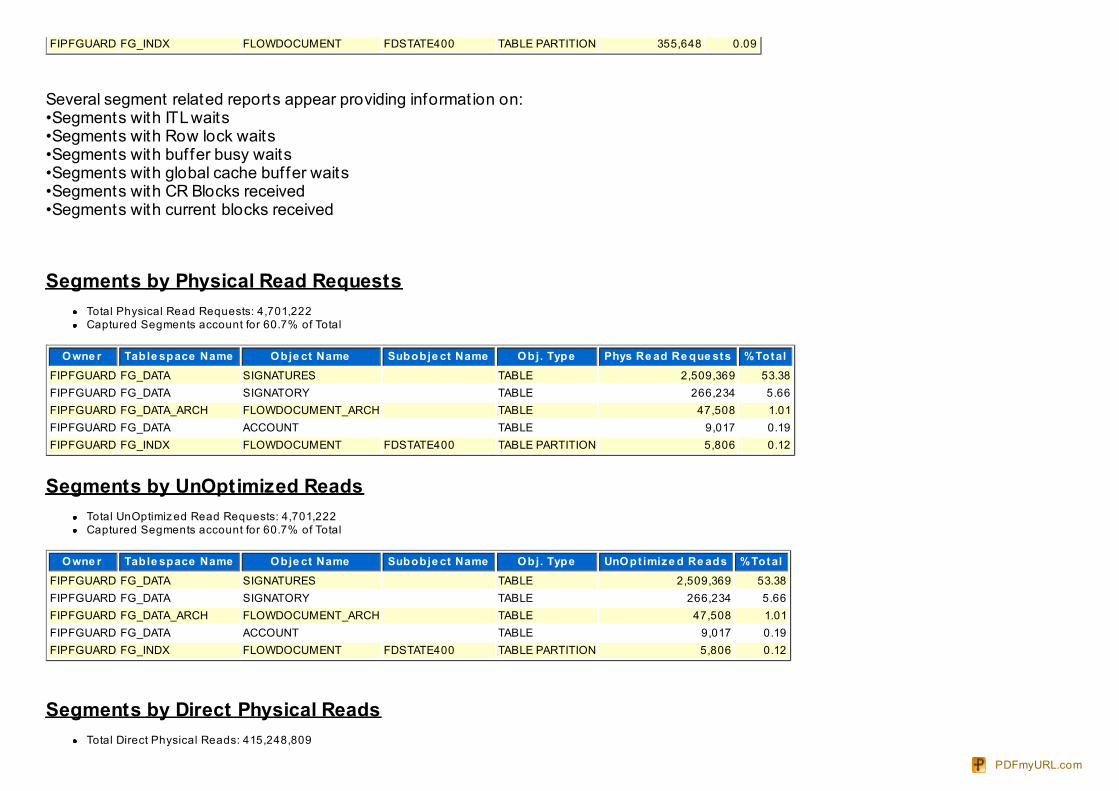
FIPFGUARD FG_INDX FLOWDOCUMENT FDSTATE400 TABLE PARTITION 355,648 0.09
Several segment related reports appear providing informat ion on:•Segments with ITL waits •Segments with Row lock waits •Segments with buffer busy waits •Segments with global cache buffer waits •Segments with CR Blocks received •Segments with current blocks received
Segments by Physical Read RequestsTotal Physical Read Requests: 4,701,222Captured Segments account for 60.7% of Total
Owne r Table space Name Obje ct Name Subobje ct Name Obj. Type Phys Re ad Re que sts %TotalFIPFGUARD FG_DATA SIGNATURES TABLE 2,509,369 53.38FIPFGUARD FG_DATA SIGNATORY TABLE 266,234 5.66FIPFGUARD FG_DATA_ARCH FLOWDOCUMENT_ARCH TABLE 47,508 1.01FIPFGUARD FG_DATA ACCOUNT TABLE 9,017 0.19FIPFGUARD FG_INDX FLOWDOCUMENT FDSTATE400 TABLE PARTITION 5,806 0.12
Segments by UnOptimized ReadsTotal UnOptimiz ed Read Requests: 4,701,222Captured Segments account for 60.7% of Total
Owne r Table space Name Obje ct Name Subobje ct Name Obj. Type UnOpt imiz e d Re ads %TotalFIPFGUARD FG_DATA SIGNATURES TABLE 2,509,369 53.38FIPFGUARD FG_DATA SIGNATORY TABLE 266,234 5.66FIPFGUARD FG_DATA_ARCH FLOWDOCUMENT_ARCH TABLE 47,508 1.01FIPFGUARD FG_DATA ACCOUNT TABLE 9,017 0.19FIPFGUARD FG_INDX FLOWDOCUMENT FDSTATE400 TABLE PARTITION 5,806 0.12
Segments by Direct Physical ReadsTotal Direct Physical Reads: 415,248,809
PDFmyURL.com
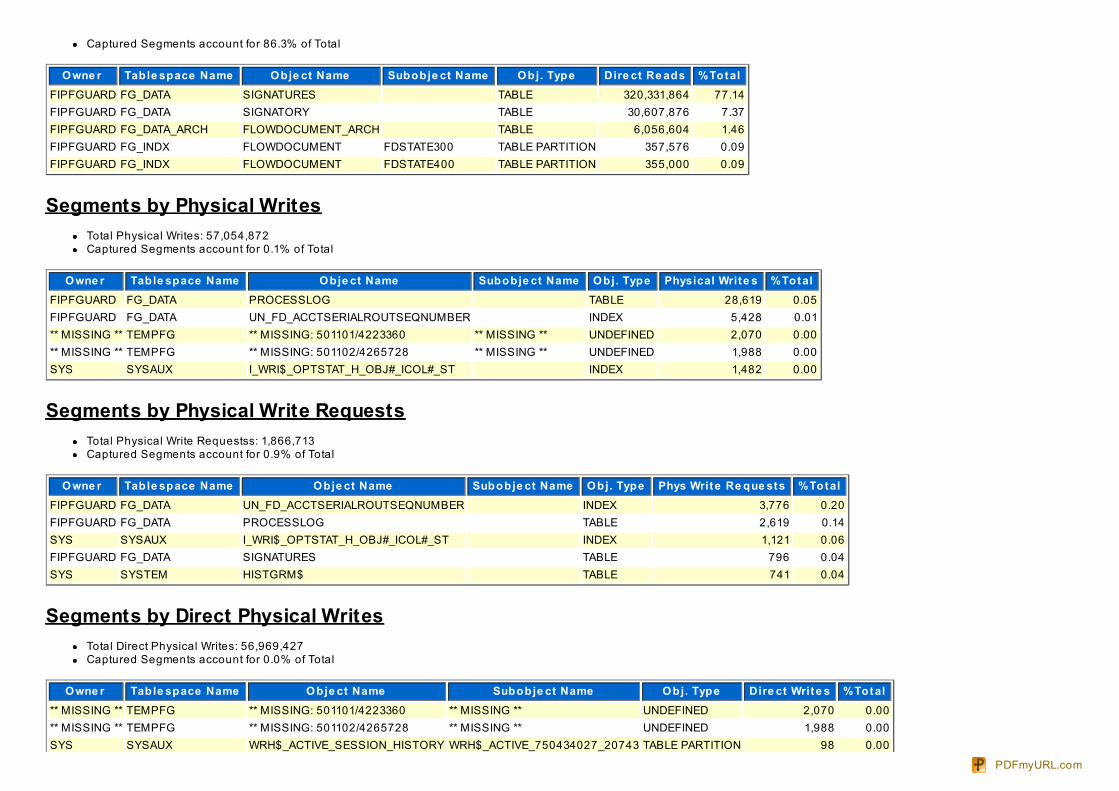
Captured Segments account for 86.3% of Total
Owne r Table space Name Obje ct Name Subobje ct Name Obj. Type Dire ct Re ads %TotalFIPFGUARD FG_DATA SIGNATURES TABLE 320,331,864 77.14FIPFGUARD FG_DATA SIGNATORY TABLE 30,607,876 7.37FIPFGUARD FG_DATA_ARCH FLOWDOCUMENT_ARCH TABLE 6,056,604 1.46FIPFGUARD FG_INDX FLOWDOCUMENT FDSTATE300 TABLE PARTITION 357,576 0.09FIPFGUARD FG_INDX FLOWDOCUMENT FDSTATE400 TABLE PARTITION 355,000 0.09
Segments by Physical WritesTotal Physical Writes: 57,054,872Captured Segments account for 0.1% of Total
Owne r Table space Name Obje ct Name Subobje ct Name Obj. Type Physical Write s %TotalFIPFGUARD FG_DATA PROCESSLOG TABLE 28,619 0.05FIPFGUARD FG_DATA UN_FD_ACCTSERIALROUTSEQNUMBER INDEX 5,428 0.01** MISSING ** TEMPFG ** MISSING: 501101/4223360 ** MISSING ** UNDEFINED 2,070 0.00** MISSING ** TEMPFG ** MISSING: 501102/4265728 ** MISSING ** UNDEFINED 1,988 0.00SYS SYSAUX I_WRI$_OPTSTAT_H_OBJ#_ICOL#_ST INDEX 1,482 0.00
Segments by Physical Write RequestsTotal Physical Write Requestss: 1,866,713Captured Segments account for 0.9% of Total
Owne r Table space Name Obje ct Name Subobje ct Name Obj. Type Phys Write Re que sts %TotalFIPFGUARD FG_DATA UN_FD_ACCTSERIALROUTSEQNUMBER INDEX 3,776 0.20FIPFGUARD FG_DATA PROCESSLOG TABLE 2,619 0.14SYS SYSAUX I_WRI$_OPTSTAT_H_OBJ#_ICOL#_ST INDEX 1,121 0.06FIPFGUARD FG_DATA SIGNATURES TABLE 796 0.04SYS SYSTEM HISTGRM$ TABLE 741 0.04
Segments by Direct Physical WritesTotal Direct Physical Writes: 56,969,427Captured Segments account for 0.0% of Total
Owne r Table space Name Obje ct Name Subobje ct Name Obj. Type Dire ct Write s %Total** MISSING ** TEMPFG ** MISSING: 501101/4223360 ** MISSING ** UNDEFINED 2,070 0.00** MISSING ** TEMPFG ** MISSING: 501102/4265728 ** MISSING ** UNDEFINED 1,988 0.00SYS SYSAUX WRH$_ACTIVE_SESSION_HISTORY WRH$_ACTIVE_750434027_20743 TABLE PARTITION 98 0.00
PDFmyURL.com
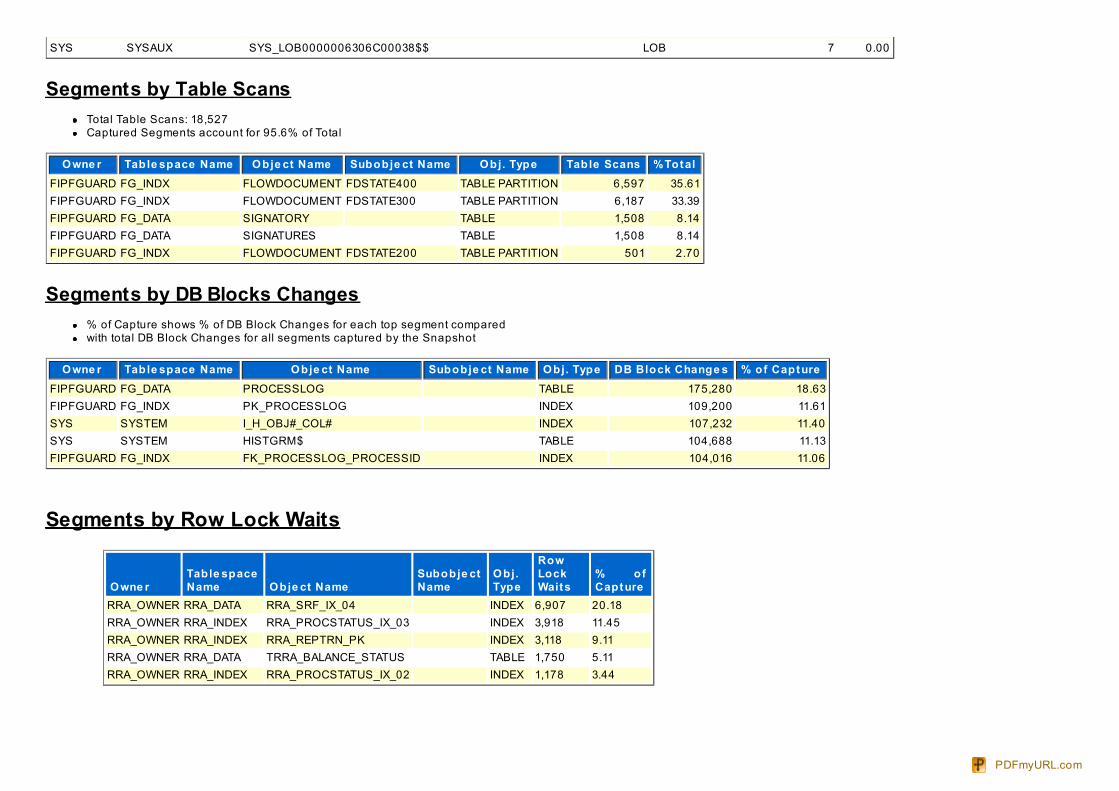
SYS SYSAUX SYS_LOB0000006306C00038$$ LOB 7 0.00
Segments by Table ScansTotal Table Scans: 18,527Captured Segments account for 95.6% of Total
Owne r Table space Name Obje ct Name Subobje ct Name Obj. Type Table Scans %TotalFIPFGUARD FG_INDX FLOWDOCUMENT FDSTATE400 TABLE PARTITION 6,597 35.61FIPFGUARD FG_INDX FLOWDOCUMENT FDSTATE300 TABLE PARTITION 6,187 33.39FIPFGUARD FG_DATA SIGNATORY TABLE 1,508 8.14FIPFGUARD FG_DATA SIGNATURES TABLE 1,508 8.14FIPFGUARD FG_INDX FLOWDOCUMENT FDSTATE200 TABLE PARTITION 501 2.70
Segments by DB Blocks Changes% of Capture shows % of DB Block Changes for each top segment comparedwith total DB Block Changes for all segments captured by the Snapshot
Owne r Table space Name Obje ct Name Subobje ct Name Obj. Type DB Block Change s % of CaptureFIPFGUARD FG_DATA PROCESSLOG TABLE 175,280 18.63FIPFGUARD FG_INDX PK_PROCESSLOG INDEX 109,200 11.61SYS SYSTEM I_H_OBJ#_COL# INDEX 107,232 11.40SYS SYSTEM HISTGRM$ TABLE 104,688 11.13FIPFGUARD FG_INDX FK_PROCESSLOG_PROCESSID INDEX 104,016 11.06
Segments by Row Lock Waits
Owne rTable spaceName Obje ct Name
Subobje ctName
Obj.Type
RowLockWaits
% ofCapture
RRA_OWNER RRA_DATA RRA_SRF_IX_04 INDEX 6,907 20.18RRA_OWNER RRA_INDEX RRA_PROCSTATUS_IX_03 INDEX 3,918 11.45RRA_OWNER RRA_INDEX RRA_REPTRN_PK INDEX 3,118 9.11RRA_OWNER RRA_DATA TRRA_BALANCE_STATUS TABLE 1,750 5.11RRA_OWNER RRA_INDEX RRA_PROCSTATUS_IX_02 INDEX 1,178 3.44
PDFmyURL.com
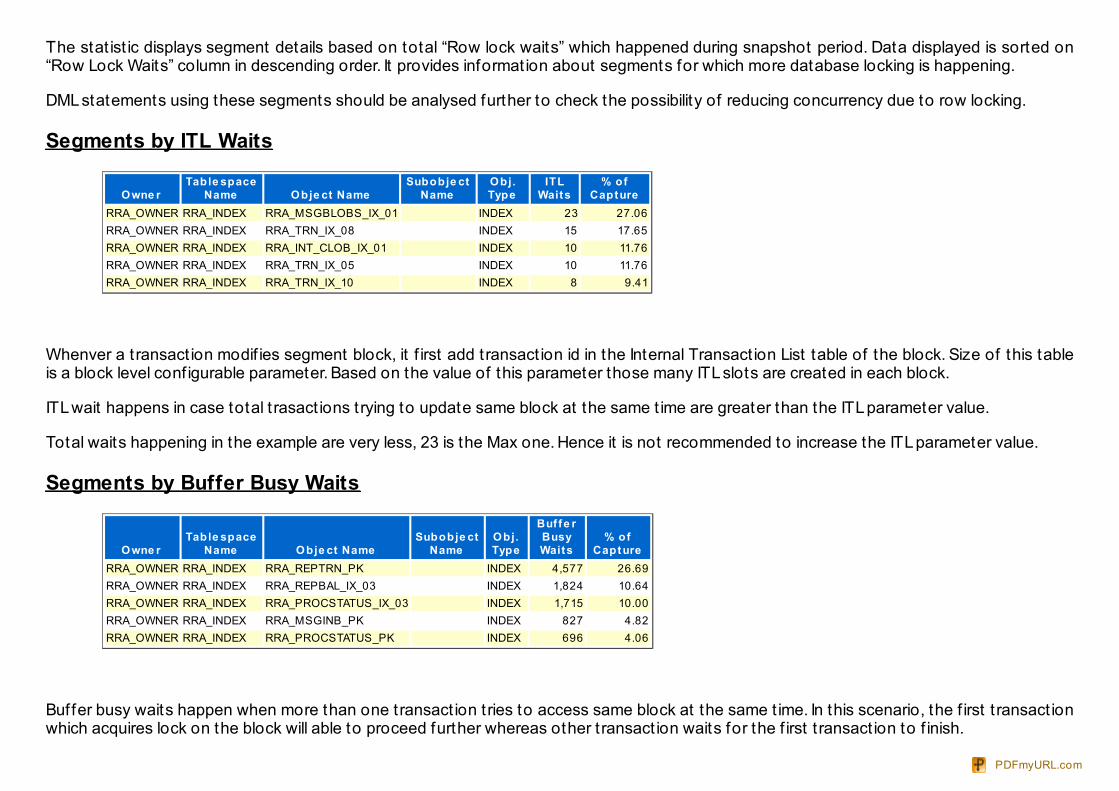
The stat ist ic displays segment details based on total “Row lock waits” which happened during snapshot period. Data displayed is sorted on“Row Lock Waits” column in descending order. It provides informat ion about segments for which more database locking is happening.
DML statements using these segments should be analysed further to check the possibility of reducing concurrency due to row locking.
Segments by ITL Waits
Owne rTable space
Name Obje ct NameSubobje ct
NameObj.Type
ITLWaits
% ofCapture
RRA_OWNER RRA_INDEX RRA_MSGBLOBS_IX_01 INDEX 23 27.06RRA_OWNER RRA_INDEX RRA_TRN_IX_08 INDEX 15 17.65RRA_OWNER RRA_INDEX RRA_INT_CLOB_IX_01 INDEX 10 11.76RRA_OWNER RRA_INDEX RRA_TRN_IX_05 INDEX 10 11.76RRA_OWNER RRA_INDEX RRA_TRN_IX_10 INDEX 8 9.41
Whenver a t ransact ion modif ies segment block, it f irst add transact ion id in the Internal Transact ion List table of the block. Size of this tableis a block level conf igurable parameter. Based on the value of this parameter those many ITL slots are created in each block.
ITL wait happens in case total t rasact ions trying to update same block at the same t ime are greater than the ITL parameter value.
Total waits happening in the example are very less, 23 is the Max one. Hence it is not recommended to increase the ITL parameter value.
Segments by Buffer Busy Waits
Owne rTable space
Name Obje ct NameSubobje ct
NameObj.Type
Buf fe rBusyWaits
% ofCapture
RRA_OWNER RRA_INDEX RRA_REPTRN_PK INDEX 4,577 26.69RRA_OWNER RRA_INDEX RRA_REPBAL_IX_03 INDEX 1,824 10.64RRA_OWNER RRA_INDEX RRA_PROCSTATUS_IX_03 INDEX 1,715 10.00RRA_OWNER RRA_INDEX RRA_MSGINB_PK INDEX 827 4.82RRA_OWNER RRA_INDEX RRA_PROCSTATUS_PK INDEX 696 4.06
Buffer busy waits happen when more than one transact ion t ries to access same block at the same t ime. In this scenario, the f irst t ransact ionwhich acquires lock on the block will able to proceed further whereas other t ransact ion waits for the f irst t ransact ion to f inish.
PDFmyURL.com
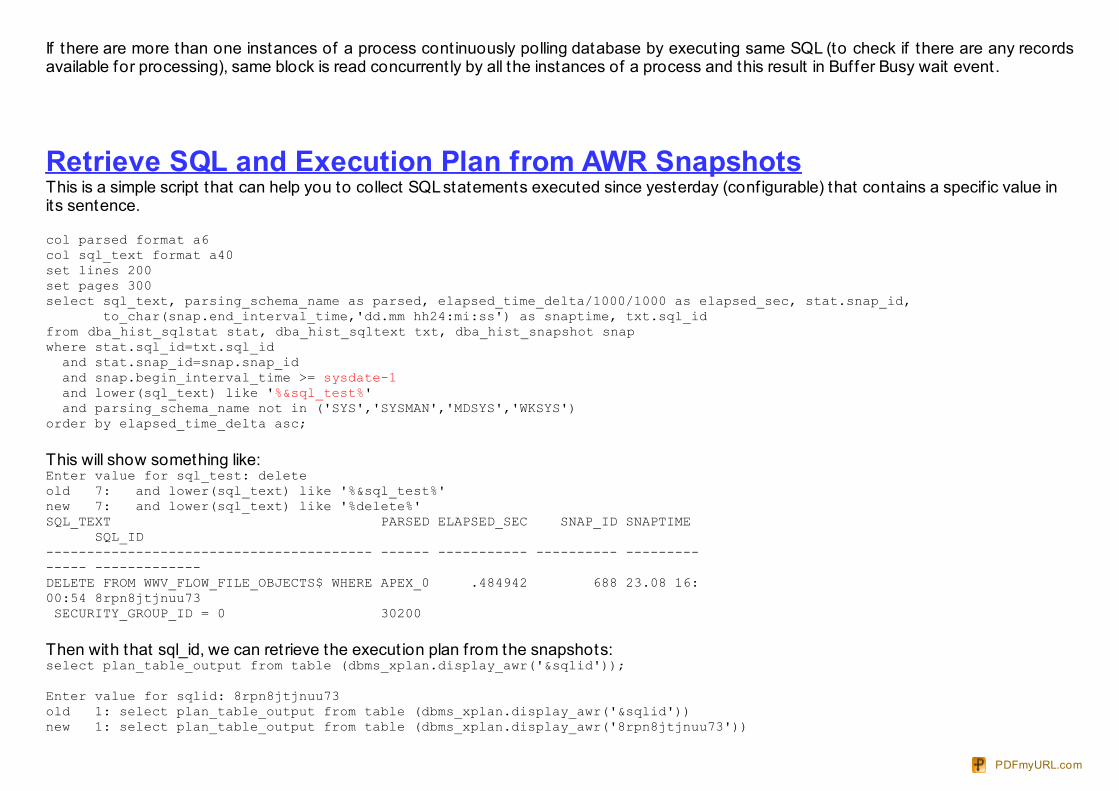
If there are more than one instances of a process cont inuously polling database by execut ing same SQL (to check if there are any recordsavailable for processing), same block is read concurrent ly by all the instances of a process and this result in Buffer Busy wait event.
Retrieve SQL and Execution Plan from AWR SnapshotsThis is a simple script that can help you to collect SQL statements executed since yesterday (conf igurable) that contains a specif ic value inits sentence.
col parsed format a6col sql_text format a40set lines 200set pages 300select sql_text, parsing_schema_name as parsed, elapsed_time_delta/1000/1000 as elapsed_sec, stat.snap_id, to_char(snap.end_interval_time,'dd.mm hh24:mi:ss') as snaptime, txt.sql_idfrom dba_hist_sqlstat stat, dba_hist_sqltext txt, dba_hist_snapshot snapwhere stat.sql_id=txt.sql_id and stat.snap_id=snap.snap_id and snap.begin_interval_time >= sysdate-1 and lower(sql_text) like '%&sql_test%' and parsing_schema_name not in ('SYS','SYSMAN','MDSYS','WKSYS')order by elapsed_time_delta asc;
This will show something like:Enter value for sql_test: deleteold 7: and lower(sql_text) like '%&sql_test%'new 7: and lower(sql_text) like '%delete%'SQL_TEXT PARSED ELAPSED_SEC SNAP_ID SNAPTIME SQL_ID---------------------------------------- ------ ----------- ---------- -------------- -------------DELETE FROM WWV_FLOW_FILE_OBJECTS$ WHERE APEX_0 .484942 688 23.08 16:00:54 8rpn8jtjnuu73 SECURITY_GROUP_ID = 0 30200
Then with that sql_id, we can retrieve the execut ion plan from the snapshots:select plan_table_output from table (dbms_xplan.display_awr('&sqlid'));
Enter value for sqlid: 8rpn8jtjnuu73old 1: select plan_table_output from table (dbms_xplan.display_awr('&sqlid'))new 1: select plan_table_output from table (dbms_xplan.display_awr('8rpn8jtjnuu73'))
PDFmyURL.com
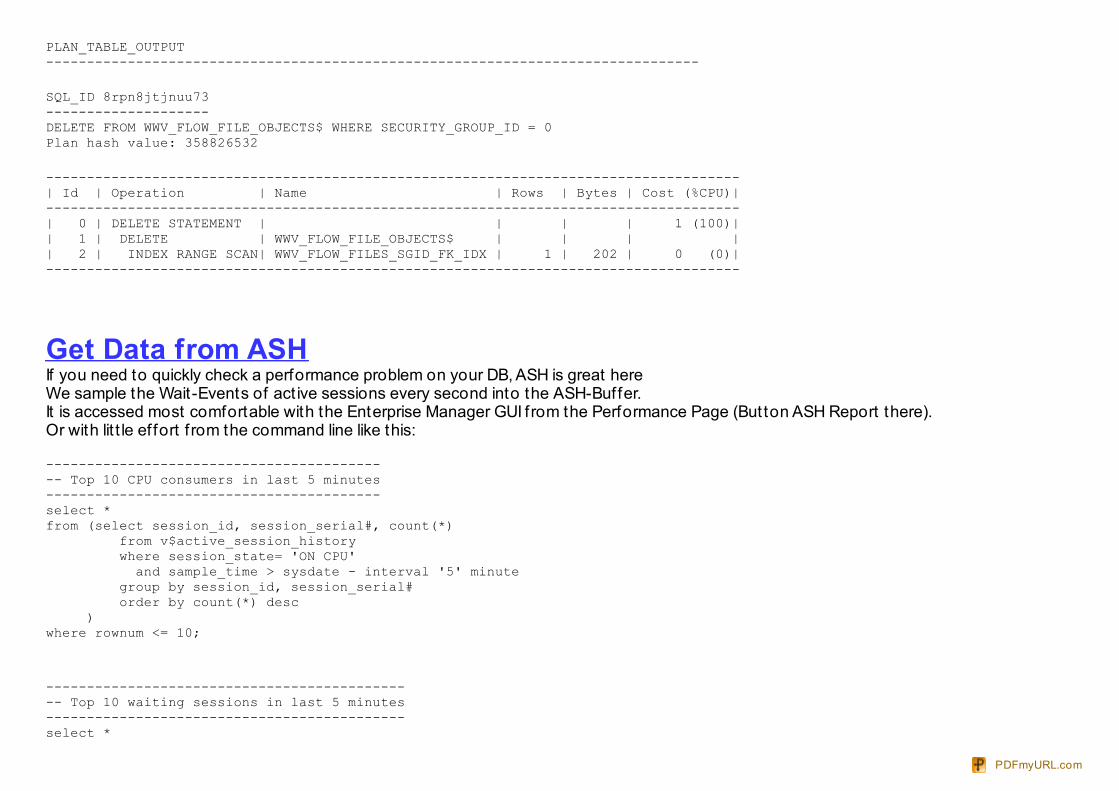
PLAN_TABLE_OUTPUT--------------------------------------------------------------------------------
SQL_ID 8rpn8jtjnuu73--------------------DELETE FROM WWV_FLOW_FILE_OBJECTS$ WHERE SECURITY_GROUP_ID = 0Plan hash value: 358826532
-------------------------------------------------------------------------------------| Id | Operation | Name | Rows | Bytes | Cost (%CPU)|-------------------------------------------------------------------------------------| 0 | DELETE STATEMENT | | | | 1 (100)|| 1 | DELETE | WWV_FLOW_FILE_OBJECTS$ | | | || 2 | INDEX RANGE SCAN| WWV_FLOW_FILES_SGID_FK_IDX | 1 | 202 | 0 (0)|-------------------------------------------------------------------------------------
Get Data from ASHIf you need to quickly check a performance problem on your DB, ASH is great hereWe sample the Wait-Events of act ive sessions every second into the ASH-Buffer. It is accessed most comfortable with the Enterprise Manager GUI f rom the Performance Page (Button ASH Report there).Or with lit t le ef fort f rom the command line like this:
------------------------------------------- Top 10 CPU consumers in last 5 minutes-----------------------------------------select * from (select session_id, session_serial#, count(*) from v$active_session_history where session_state= 'ON CPU' and sample_time > sysdate - interval '5' minute group by session_id, session_serial# order by count(*) desc )where rownum <= 10;
---------------------------------------------- Top 10 waiting sessions in last 5 minutes--------------------------------------------select *
PDFmyURL.com
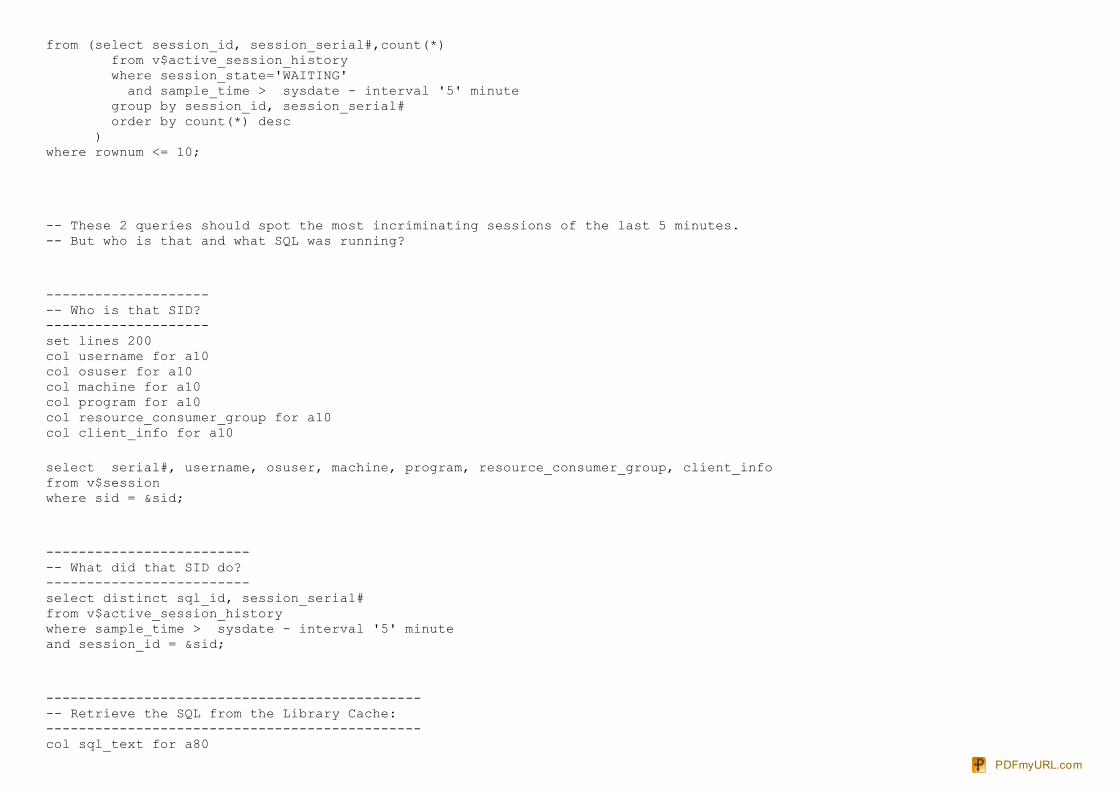
from (select session_id, session_serial#,count(*) from v$active_session_history where session_state='WAITING' and sample_time > sysdate - interval '5' minute group by session_id, session_serial# order by count(*) desc )where rownum <= 10;
-- These 2 queries should spot the most incriminating sessions of the last 5 minutes. -- But who is that and what SQL was running?
---------------------- Who is that SID?--------------------set lines 200col username for a10col osuser for a10col machine for a10col program for a10col resource_consumer_group for a10col client_info for a10
select serial#, username, osuser, machine, program, resource_consumer_group, client_infofrom v$session where sid = &sid;
--------------------------- What did that SID do?-------------------------select distinct sql_id, session_serial# from v$active_session_historywhere sample_time > sysdate - interval '5' minuteand session_id = &sid;
------------------------------------------------ Retrieve the SQL from the Library Cache:----------------------------------------------col sql_text for a80
PDFmyURL.com
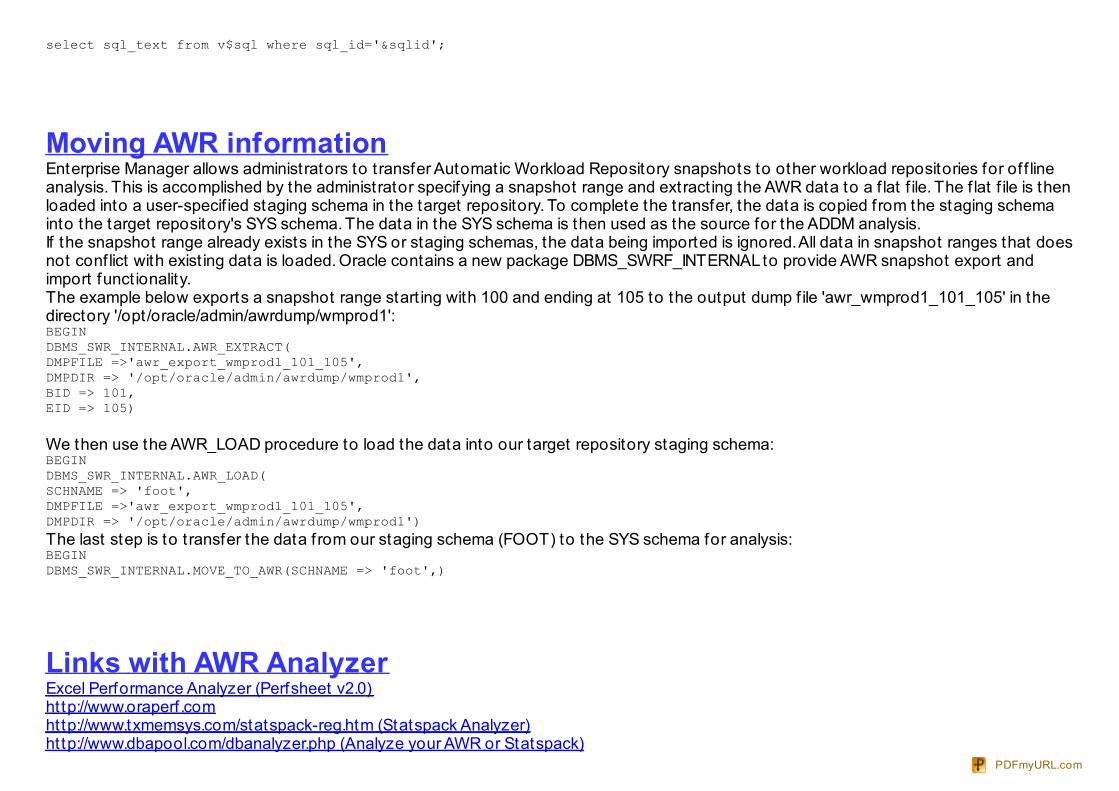
select sql_text from v$sql where sql_id='&sqlid';
Moving AWR informationEnterprise Manager allows administrators to t ransfer Automat ic Workload Repository snapshots to other workload repositories for of f lineanalysis. This is accomplished by the administrator specifying a snapshot range and extract ing the AWR data to a f lat f ile. The f lat f ile is thenloaded into a user-specif ied staging schema in the target repository. To complete the transfer, the data is copied from the staging schemainto the target repository's SYS schema. The data in the SYS schema is then used as the source for the ADDM analysis.If the snapshot range already exists in the SYS or staging schemas, the data being imported is ignored. All data in snapshot ranges that doesnot conf lict with exist ing data is loaded. Oracle contains a new package DBMS_SWRF_INTERNAL to provide AWR snapshot export andimport funct ionality. The example below exports a snapshot range start ing with 100 and ending at 105 to the output dump f ile 'awr_wmprod1_101_105' in thedirectory '/opt /oracle/admin/awrdump/wmprod1':BEGINDBMS_SWR_INTERNAL.AWR_EXTRACT(DMPFILE =>'awr_export_wmprod1_101_105',DMPDIR => '/opt/oracle/admin/awrdump/wmprod1',BID => 101,EID => 105)
We then use the AWR_LOAD procedure to load the data into our target repository staging schema:BEGINDBMS_SWR_INTERNAL.AWR_LOAD(SCHNAME => 'foot',DMPFILE =>'awr_export_wmprod1_101_105',DMPDIR => '/opt/oracle/admin/awrdump/wmprod1')The last step is to t ransfer the data f rom our staging schema (FOOT) to the SYS schema for analysis:BEGINDBMS_SWR_INTERNAL.MOVE_TO_AWR(SCHNAME => 'foot',)
Links with AWR AnalyzerExcel Performance Analyzer (Perfsheet v2.0)ht tp://www.oraperf .com ht tp://www.txmemsys.com/statspack-reg.htm (Statspack Analyzer)ht tp://www.dbapool.com/dbanalyzer.php (Analyze your AWR or Statspack)
PDFmyURL.com
http://www.softpedia.com/get/Internet/Servers/Database-Ut ils/spReporter.shtml (Download Tool to Analyze AWR or Statspack Reports)ht tp://www.ondataf ine.com/ (web based applicat ion. It processes plain-text statspack or AWR)http://www.spviewer.com/index.html (STATSPACK and AWR Viewer sof tware)Scripts: ht tp://www.evdbt.com/tools.htm
PDFmyURL.com


![Oracle Streams Performance Tuning Best Practices: Oracle ... · Performance and Tuning Guide 10g Release 2 (10.2) [6] documentation for details about AWR. Install the STRMMON Utility](https://static.fdocuments.us/doc/165x107/5f34922a63202533f33e04bd/oracle-streams-performance-tuning-best-practices-oracle-performance-and-tuning.jpg)