betuco.be Options for Sustainable... · Technology Options for Sustainable Livestock Production in...
224
Technology Options for Sustainable Livestock Production in India National Centre for Agricultural Economics and Policy Research International Crops Research Institute for the Semi-Arid Tropics International Livestock Research Institute
Transcript of betuco.be Options for Sustainable... · Technology Options for Sustainable Livestock Production in...
Technology Options for SustainableLivestock Production in India
National Centre for Agricultural Economics and Policy Research
International Crops Research Institute for the Semi-Arid Tropics
International Livestock Research Institute
National Centre for Agricultural Economics and Policy ResearchLibrary Avenue, Pusa, New Delhi 110 012, India
International Crops Research Institute for the Semi-Arid TropicsPatancheru 502 324, Andhra Pradesh, India
Systemwide Livestock ProgramInternational Livestock Research Institute
Addis Ababa, Ethiopia
ISBN 92-9066-444-4 144–2002Order Code CPE 137
Techn
olo
gy O
ptio
ns fo
r Sustain
able Livesto
ck Prod
uctio
n in
Ind
ia
Cover-finnew.p65 4/18/02, 3:03 PM1

Citation: Birthal, P. and Parthasarathy Rao, P. (eds). 2002. Technology options for sustainablelivestock production in India: proceedings of the Workshop on Documentation, Adoption, andImpact of Livestock Technologies in India, 18–19 Jan 2001, ICRISAT-Patancheru, India.New Delhi 110 012, India and Patancheru 502 324, Andhra Pradesh, India: National Centrefor Agricultural Economics and Policy Research and International Crops Research Institute forthe Semi-Arid Tropics. 220 pp. ISBN 92-9066-444-4. Order code CPE 137.
The opinions expressed in this publication are those of the authors and not necessarily those ofNCAP or ICRISAT. The designations employed and the presentation of the materials in thispublication do not imply the expression of any opinion whatsoever on the part of NCAP orICRISAT concerning the legal status of any country, city, or area, or of its authorities, or concerningthe delimitation of its frontiers or boundaries. Where trade names are used this does not constituteendorsement of or discrimination against any product either by NCAP or by ICRISAT.
About NCAPAbout NCAPAbout NCAPAbout NCAPAbout NCAPThe National Centre for Agricultural Economics and Policy Research (NCAP) wasestablished by the Indian Council of Agricultural Research (ICAR) with a view to upgradeagricultural economics research through the integration of economics input in theplanning, design, and evaluation of agricultural research programs, and to strengthenthe competence in agricultural policy analysis within the Council. The Centre is assigneda leadership role in this area, not only for various ICAR institutions, but also for theState Agricultural Universities. In order to make agricultural research a more effectiveinstrument for agricultural and rural change and to strengthen policy-making andplanning machinery, NCAP undertakes and sponsors research in agricultural economicsrelating to problems of regional and national importance.
About ICRISAAbout ICRISAAbout ICRISAAbout ICRISAAbout ICRISATTTTTThe semi-arid tropics (SAT) encompasses parts of 48 developing countries includingmost of India, parts of southeast Asia, a swathe across sub-Saharan Africa, much ofsouthern and eastern Africa, and parts of Latin America. Many of these countries areamong the poorest in the world. Approximately one-sixth of the world’s populationlives in the SAT, which is typified by unpredictable weather, limited and erratic rainfall,and nutrient-poor soils.
ICRISAT’s mandate crops are sorghum, pearl millet, finger millet, chickpea,pigeonpea, and groundnut; these six crops are vital to life for the ever-increasingpopulations of the SAT. ICRISAT’s mission is to conduct research that can lead toenhanced sustainable production of these crops and to improved management of thelimited natural resources of the SAT. ICRISAT communicates information ontechnologies as they are developed through workshops, networks, training, libraryservices, and publishing.
ICRISAT was established in 1972. It is one of 16 nonprofit, research and trainingcenters funded through the Consultative Group on International Agricultural Research(CGIAR). The CGIAR is an informal association of approximately 50 public and privatesector donors; it is co-sponsored by the Food and Agriculture Organization of the UnitedNations (FAO), the United Nations Development Programme (UNDP), the UnitedNations Environment Programme (UNEP), and the World Bank.
About the SLPAbout the SLPAbout the SLPAbout the SLPAbout the SLPPoverty, food insecurity, and a deteriorating environment threaten the livelihoods andeven the lives of millions of rural people in developing countries. Smallholder farmers inthese countries have few resources or opportunities to improve their situation, but oneoption is widely available: by integrating crop and livestock production, farmers can improvetheir farm productivity while protecting their natural resources.
Linking the livestock-related research of its partners worldwide, the SystemwideLivestock Program of the Consultative Group on International Agricultural Research(CGIAR) is a unique vehicle for enhancing the contribution of animal agriculture to theCGIAR’s objectives of increasing food production, eradicating poverty, and protectingthe environment.
Coververso.p65 4/17/02, 1:44 PM1
Black

i
Technology Options forSustainable Livestock Production in India
Edited by
Pratap S BirthalP Parthasarathy Rao
ICRISATInternational Crops Research Institute for the Semi-Arid Tropics
Patancheru 502 324, Andhra Pradesh
NCAPNational Centre for Agricultural Economics and Policy Research
Library Avenue, Pusa, New Delhi 110 012
2002
Proceedings of the Workshop on
Documentation, Adoption, and Impact of Livestock Technologies in IndiaICRISAT-Patancheru, India
18–19 January 2001
Systemwide Livestock ProgramInternational Livestock Research Institute
Addis Ababa, Ethiopia
ii
Acknowledgements
We are grateful to Dr William D Dar, Director General, ICRISAT, for histhought-provoking inaugural speech and support for the workshop. Oursincere thanks to Dr JM Lenne, Deputy Director General (Research),ICRISAT; Dr MCS Bantilan, Director, SEPP, ICRISAT; and Dr Mruthyunjaya,Director, NCAP, who have been a source of constant encouragement and haveprovided the required logistics support. ICRISAT and NCAP gratefullyacknowledge the funding provided by the Systemwide Livestock Program(SLP) for the workshop under the project on Livestock Productivity in MixedCrop-Livestock Systems in South Asia.
We would like to thank Drs Mruthyunjaya and PK Joshi (NCAP), Dr RBandhopadhyay (ICRISAT), Dr M Blummel (ILRI), and Dr D Thomas (NRI,UK) for their invaluable critical inputs on early drafts. We thank Mr VNKrishnan for administrative support, Ms Shubha Rao Benipuri for editing, andMr TR Kapoor and his team at the Public Awareness Office (ICRISAT) fordesign and layout of the book.
We are grateful to all the lead paper authors and participants who made theworkshop possible.
Pratap S BirthalP Parthasarathy Rao
iii
Contents
Foreword ............................................................................................................ v
Introduction and overview of the conclusions................................................... 1Pratap S Birthal and P Parthasarathy Rao
Economic contributions of the livestock subsector in India .............................. 12Pratap S Birthal and P Parthasarathy Rao
Technological change in India’s livestock subsector: Evidence and issues ...... 20Pratap S Birthal
Crossbreeding of indigenous Indian cattle with exotic breedsto increase milk production: a critical analysis ................................................. 41
M P G Kurup
Milk production technology and its impact on dairying in Tamil Nadu ........... 58R A Christopher Dhas
Impact of mechanization on draught animal power use in agriculture.............. 69Gyanendra Singh
Livestock technologies for small farm systems ................................................. 78H P S Arya, M P Yadav and R Tiwari
Technological developments in the poultry subsector ...................................... 90Raj Vir Singh, V K Saxena and D Sharma
Goats in India: Status and technological possibilities for improvement ........... 104Shalander Kumar and K P Pant
Enhancing productivity of sheep: Technology dimensions ............................... 113B U Khan, A L Arora and R C Sharma
Conservation of farm animals in India: Challenges and strategies ................... 125R Sahai
Potential of nutritional technologies in improving livestock productivity ........ 132Khub Singh and C S Prasad
Oilseed cakes for improving animal nutrition ................................................... 147D M Hegde
iv
Status of forage breeding technologies in India ................................................ 154N P Melkania and G P Shukla
Potential technological and management interventionsfor improving the productivity of grasslands .................................................... 164
P S Pathak
Conversion from free range grazing to managed feeding:technological and institutional issues ................................................................ 183
Ranjitha Puskur
Food processing technologies for the sustained growth of dairying ................. 198B N Mathur and Alok Jha
List of participants ............................................................................................. 212

v
William D DarDirector GeneralInternational Crops Research Institutefor the Semi-Arid Tropics
Patancheru, Andhra Pradesh, India
MruthyunjayaDirectorNational Centre for AgriculturalEconomics and Policy Research
New Delhi, India
Foreword
Livestock are an integral part of agriculture in India, and are likely to be theinstruments of future growth and development of the agricultural sector. Theygenerate employment, provide draft power and manure, and earn foreign exchangethrough exports. Although the per capita consumption of foods of animal origin islow in India, demand has been rising due to the growing human population,sustained growth in per capita incomes, and increasing urbanization. This demand-driven growth, besides improving food and nutritional security, can benefit millionsof landless and small landholders who constitute more than 60% of the total ruralpopulation and possess about three-fourths of the country’s livestock wealth.
The issue that needs addressing is how current output trends of 4–5% perannum can be sustained without disturbing the equilibrium between crops andlivestock. Improving food supply from animals through higher livestock numbers(as in the past) is now severely constrained due to the feed-fodder deficit anddeclining per capita land availability. Technological and management options are theonly alternatives to accelerate the growth in productivity, which is currently low.
A number of livestock technologies are available for field application, but theyare yet to gain wide acceptance. This poses several questions for researchers,research administrators, and policy-makers: Is the technology economically feasibleand tested on-farm in different farming systems? To what extent have farmers’perceptions and needs been taken into consideration in the design of thetechnology? Have proper pathways been followed to transfer the technology?
The National Centre for Agricultural Economics and Policy Research(NCAP) of ICAR, and ICRISAT’s Socioeconomics and Policy Program (SEPP)jointly organized a multidisciplinary workshop (Documentation, Adoption, andImpact of Livestock Technologies) on 18–19 January 2001 to deliberate on suchissues, and identify technological, institutional, and policy interventions toimprove livestock productivity. The workshop was organized under the ICAR-ICRISAT Partnership Program and was financially supported by the SystemwideLivestock Program (SLP) of the Consultative Group on International AgriculturalResearch (CGIAR). This volume contains the lead papers and key findings of theworkshop, and will be a valuable source of information to all concerned withlivestock development.
vi
William D Dar
Director General
International Crops Research Institute for the Semi-Arid Tropics
Patancheru, Andhra Pradesh, India
Mruthyunjaya
Director
National Centre for Agricultural Economics and Policy Research
ICAR, New Delhi, India

1
Introduction and Overview of the ConclusionsIntroduction and Overview of the ConclusionsIntroduction and Overview of the ConclusionsIntroduction and Overview of the ConclusionsIntroduction and Overview of the Conclusions
Pratap S Birthal1 and P Parthasarathy Rao2
IntroductionGrowing human population, rising per capita income, and increasingurbanization are fuelling rapid growth in the demand for food of animal originin the developing countries (Delgado et al. 1999). However, current per capitaconsumption is low. For instance, in India in 1993–94, per capita annualconsumption of milk was 51 kg and meat 1.7 kg, much less than the worldaverage of 75 kg milk and 34 kg meat. By 2020 the per capita consumption ofmilk is likely to more than double and that of meat more than triple (Kumar1998; Delgado et al. 1999).
On the supply side, production of both milk and meat has increased at arate of about 5% annum-1. If these trends continue, increases in demandwould be met adequately from domestic supplies. The sustainability of thesetrends, however, is uncertain. In the past, expanding livestock populationsmainly contributed to the observed increases in production. India has a hugelivestock population comprising different species, and further increase in thelivestock population would be constrained severely by the declining landavailability. Productivity of Indian livestock is low compared to manydeveloped and developing countries. Cattle milk yield in India is about 12–15% that in the USA, Canada, and Israel. Meat yield of sheep and goats isabout 60% less. Feed and fodder scarcity has been the main constraint inraising livestock productivity. Most of the feed requirement is met from cropby-products and grazing on common lands. The latter, however, have beendwindling quantitatively as well as qualitatively. The levels of adoption ofbreeding-, feed and nutrition-, and health-related technologies are low. It isimperative to raise these since future growth in the livestock subsector has tocome from technological changes.
The importance of livestock in India goes beyond the function of foodproduction. It is an important source of draught power, manure for crop
1. National Centre for Agricultural Economics and Policy Research, New Delhi 110 012.2. Socioeconomics and Policy Program, International Crops Research Institute for the Semi-Arid Tropics,
Patancheru 502 324, Andhra Pradesh, India.
2
production and fuel for domestic use. Thus, by minimizing use ofnonrenewable energy, livestock make a positive contribution to theenvironment. Although crops and livestock are interdependent to a largeextent, the latter constitute an important mechanism for coping with the risksof crop failure. In land-scarce economies livestock provide livelihood supportin terms of income and employment generation to the millions of landless andsmall landholders. In India, livestock wealth is mainly concentrated among themajority of marginal and small landholders.
Technology-induced growth in the livestock subsector would thusimprove food and nutritional security, alleviate poverty, and reduceinterregional and interpersonal economic inequities. India spends only about0.5% of the agricultural gross domestic product on agricultural research. Thisis low compared to the average of developing countries (0.7%) and developedcountries (2.5%). Livestock research receives about 20% of the totalagricultural research resources. This corresponds to the contribution oflivestock to the agricultural gross domestic product (Birthal et al. 2001).Despite the low intensity of investment in research, animal science researchover the last few decades has generated a number of technologies in the areasof animal genetics and breeding, feed and nutrition, health, and management.The technical feasibility of many of these has been proven under experimentalconditions. Examples include crossbreeding in cattle, sheep, pigs, and poultry;chemical and biological treatment of cereal straws; and vaccines againstrinderpest, influenza, and foot and mouth disease.
Studies on returns to investment in livestock research are limited.However, sporadic evidences indicate a very high payoff to investment inlivestock research and development (Kumar et al. 1977; Gaddi and Kunal1996). Despite this, the application of many technologies in the field remainslimited. Except for crossbreeding, not much information is available regardingadoption and impact of other technologies. There is, thus, considerable scopeto raise the productivity of livestock through application of the existingtechnologies.
It is against this background that the National Centre for AgriculturalEconomics and Policy Research (NCAP), New Delhi – an offshoot of theIndian Council of Agricultural Research (ICAR) – and the International CropsResearch Institute for the Semi-Arid Tropics (ICRISAT), Patancheru, jointlyorganized a workshop entitled Documentation, Adoption and Impacts ofLivestock Technologies in Mixed Crop-livestock Farming Systems in India onJanuary 18–19, 2001 at ICRISAT. The overall goal of the workshop was to

3
assess the technological changes taking place in India’s livestock subsector andtheir potential in sustaining the production of livestock in particular andagricultural economy in general.
The specific objectives were to:• Document livestock technologies related to breeding, health, nutrition, and
processing;
• Identify potential technologies whose adoption and impact assessmentcould be tracked; and
• Identify constraints in large-scale dissemination of these technologies.
Adoption and Impact of Livestock TechnologiesThe workshop was multidisciplinary in nature and was attended by 30–35experts from animal, crop, and social sciences. The deliberations, apart fromdocumentation and identification of potential technologies for their adoptionand impact, also brought out some technical, socioeconomic, infrastructure,and policy issues that could help accelerate the pace of adoption of existingtechnologies. A synthesis of the major conclusions is presented below.
Adoption of Technologies
Over the past few decades, animal science research has offered a number oftechnological options that could raise the productivity of different livestockspecies if adopted area-wide. These include genetic enhancement ofindigenous breeds through crossbreeding with exotic breeds, improvement ofnutritive quality of feed and fodder through biological and chemicaltreatments, development of vaccines against animal diseases, improvedlivestock management practices, and post harvest management. Additionally,processing technologies have been developed to strengthen the verticallinkages between the farm and dairy industry. The adoption pattern of thesetechnologies varies widely across species, farm typologies and regions.
Breeding Technologies
Genetics and breeding research have evolved many new breeds of cattle, pig,sheep, and poultry using crossbreeding techniques. These breeds have betterproduction coefficients compared to indigenous ones. However, theiradoption in the field is limited and sporadic; only about 8% of cattle, 5% of

4
sheep, 15% of pigs, and 33% of poultry populations belong to the crossbred/improved category. The adoption level is higher in urban areas compared torural areas. In general wide scale adoption of crossbreeds is restricted due totheir non-acclimatization to the tropical climates prevailing in most parts ofthe country. Besides, their higher maintenance cost, lower disease resistance,and the poor success of artificial insemination (AI) are other barriers toadoption of crossbreeding. There are also species-specific constraints. Thecrossbred cow has to be replaced frequently to maintain the flow of benefits.Thus, frequent and higher acquisition costs, lack of disposal facilities (cattleslaughter is banned in most Indian states), and poor draught characteristics ofmale cattle are important impediments to wide-scale adoption ofcrossbreeding technology in cattle. Nonetheless, under certain ecological andeconomic conditions, adoption of crossbreeding technology in cattle has beenquite encouraging. The states of Kerala and Punjab, for instance, have aconsiderably higher proportion of crossbred cattle.
Sheep husbandry in India is practiced largely by the poor and isdependent on availability of grazing lands, which have been deteriorating interms of both quantity and quality. In contrast to the indigenous sheep breedsthat are capable of surviving even on sparse vegetation, the crossbred sheeprequire better nutrition. This also applies to pigs, which are often managed inscavenger systems.
In the dairy subsector the buffalo could emerge as a promising alternativeto crossbred cattle because of its adaptability to varied ecological conditions,higher milk yield and higher fat content, realizing a premium price. Unlikecattle, buffalo slaughter is not banned and animals have a disposal value. Thesefactors have favored a higher growth in buffalo population even withoutimproved breeding interventions. However, in certain regions, nondescriptlow-yielding species have been upgraded using high-yielding breeds such asthe Murrah.
The poultry subsector has responded well to technological changes andhas grown faster than the dairy and ruminant meat sector. Enhancement ofgenetic potential has been the most important factor in the growth of thissector. However, this has been complemented by health and nutritiontechnologies. The growth trends are more prominent in specialized peri-urban/urban poultry systems, because of higher demand for poultry meat andeggs in urban areas. Here, the entry of the private sector has boosted theadoption of technology and growth in poultry outputs. Backyard poultryproduction, however, continues to languish technologically.
5
Feed and Nutrition Technologies
A large number of India’s livestock, particularly in the arid and semi-aridenvironments, suffer from inadequate feeding. The feed and fodder shortages,in fact, have been the main limiting factors in raising livestock productivity.Cereal crop residues comprise the main feed for livestock. However, these aredeficient in crude protein and several other nutrients. Concentrate feeding isrestricted to lactating, high-yielding bovines and work animals. Smallruminants derive their feed requirements mainly from grazing on commonlands.
Animal nutrition and crop breeding (straw/stover) research has yieldedmany new technologies that could augment production and improve thenutritional quality of feeds and fodder. Research on breeding for higher yieldand superior quality crop residues (such as in rice, wheat, sorghum, andmillets) is in progress. Studies have indicated that a 1% increase in digestibilityof sorghum/millet straw increases bovine milk yield by 5–6% (Kristjanson etal. 1998). Apart from traditional techniques of fodder chopping andconservation, technologies such as urea treatment of fodder, strategicsupplementation, urea molasses mineral blocks, and bypass protein use havethe potential to alleviate feed and fodder scarcity. These technologies improvedigestibility and palatability of feed, reduce feed requirements, avoid feedwastage, and contribute towards improving animal productivity.
Some of these techniques, such as fodder chopping and bypass proteinuse, have long been in practice in many parts of the country, but are notpracticed widely. The main constraint to large-scale adoption of nutritiontechnologies in general has been the lack of information to users.
The area under green fodder crops is also low; constituting no more than5% of the gross cropped area. The growth in area under fodder crops has beensluggish in most parts of the country, except in the irrigated regions. This is areflection of the rising competition between food and fodder crops for limitedland and other resources. Crop breeding research has evolved high-yieldingvarieties of a number of forage crops. However, these have not been adoptedwidely due to lack of awareness about new cultivars, nonavailability ofirrigation water throughout the year, and problems of insect pests/diseases.
Common grazing lands comprise an important source of grasses, andthere exists considerable scope to raise the production of grasses/shrubs fromthese lands through technological and management interventions.Technological interventions such as reseeding with high-yielding grasses andwatershed development, complemented with appropriate management

6
interventions such as preventing encroachment, promotion of rotationalgrazing practices, and charging grazing fees have helped raise the productivityof common grazing resources and thereby improved animal performance.
Disease Control Technologies
Diseases reduce the production potential of livestock. In India many deadlydiseases such as rinderpest, foot and mouth disease, hemorrhagic septicemia,and black quarter are major threats to profitable livestock production.Livestock disease control has undergone a paradigm shift in recent years. Anumber of biological products (vaccines) have been developed for preventiveand curative disease management. The infrastructure for disease control hasalso expanded considerably. The main limitations to effective livestock healthmanagement are an inadequate focus on preventive measures, lack ofmedicines and equipment in the veterinary clinics, and ignorance among thefarmers about the diseases and preventive measures. This is reflected in thefrequent occurrence of many of these diseases in most parts of the country.
Processing Technologies
Postharvest technologies help producers to realize better gains fromtechnological changes in the primary production sector. But the postharvestprocessing facilities are lacking in the country. Only about 20% of the totalmilk production is processed into value-added products. The bulk of it,however, is processed into ghee and curds by the producers, and a largeproportion of this is consumed at source. Although considerable efforts havegone into developing infrastructure for milk processing in the cooperativesector, only about 5% of the total milk output is processed into table butter,cheese, milk powder, and baby foods. Information on the proportion of otherlivestock products entering into the value-added chain is not available. Thereis a considerable demand for processed meat products, but it remainsconstricted due to inadequate processing facilities. The same applies to exportof these products. Furthermore, not enough attention has been paid towardssanitary and phytosanitary measures. Slaughterhouses are often ill equippedand unhygienic.
Low-cost processing technologies have been developed for both cottageand large industries. The rising demand for processed milk products inurban and rural areas is expected to boost future adoption of processingtechnologies.

7
Impact of Technological Change
Technological change improves the production potential of livestock and isreflected in productivity growth. The improvements in production lead toincreased welfare of the producers as well as consumers of livestock products.In India, although the intensity of adoption of different technologies is low, thetechnological changes as discussed above, together with improvedmanagement practices have contributed to the increased output of manylivestock products.
Productivity and Production
In the last three decades milk production has increased at an annual rate ofabout 4.5%, and meat and egg production at about 5.5% each. The Total FactorProductivity (TFP) index, which is a joint measure of contribution oftechnology and technical efficiency, has grown at a rate of 1.4% a year since1970, while the pre-1970 growth in TFP index was marginally negative. Thegrowth in TFP is largely a result of yield-augmenting technological changesthat have taken place in the dairy and poultry subsectors. The milk yield ofcattle and buffalo has grown at a rate of 3.2% and 1.9%, respectively. In thecase of poultry the egg yield has almost doubled and the feed conversionefficiency in broiler production has improved tremendously. The growth inproductivity of species such as sheep and goats has been negligible.
Consumption, Prices, and Trade
Per capita consumption of livestock products has increased in the last threedecades. The share of livestock products in food expenditure has almostdoubled to 21% since 1972–73. This is due partly to increases in theavailability of livestock products and a decline in prices of major products suchas milk and eggs. The real prices of milk, eggs, and pork have declined, partlydue to technology-driven growth in outputs. The real prices of products ofsheep and goat, where technology uptake had been lacking, witnessed anupward movement.
Improvements in productivity of dairy animals have also helped achieveself-sufficiency in milk production. The imports of milk and milk productshave declined to almost zero. Also, exports of certain livestock products areincreasing.

8
Poverty and Equity
Livestock are an important source of income for the rural poor. The growth inthe livestock subsector is expected to contribute to poverty alleviation, as thelivestock wealth is largely concentrated among the marginal and smalllandholders. These categories of farmers, however, face the problem of feedand fodder scarcity. Technologies, particularly those related to nutrition andhealth, are not capital intensive and could easily be adopted by them.Nevertheless, the intensity of adoption of capital-intensive technologies suchas crossbreeding cattle has been observed to be higher on the landless andmarginal farms; in 1991–92 there were about 10% crossbreeds in the adultfemale cattle herds of large landholders, while the landless and marginallandholders maintained 20% of the crossbreeds in their herds. It is thusconjectured that technological change in the livestock subsector wouldgenerate more income and employment opportunities for the resource-poorhouseholds and contribute towards alleviation of poverty and improvementsin interpersonal income distribution.
Rural-Urban Disparities
Peri-urban/urban livestock systems have long existed to cater to the urbandemand for foods of animal origin. Rising urbanization and a higher growth inper capita income of the urban population is causing rapid growth in demandfor food of animal origin. Developments in processing and packagingtechnologies have also contributed considerably to this. Thus, to meet therapidly growing demand for milk, meat, and eggs, peri-urban livestock systemshave developed much faster than the rural systems. Technology adoption andproduction coefficients are better in peri-urban systems. Thus this type oftechnological dualism is likely to strengthen with further increase in the urbandemand for animal foods.
Looking AheadSeveral important points emerged from the deliberations in the workshop thatneed to be taken into consideration in future research and developmentprograms for the livestock subsector. These are:• The success or failure of crossbreeding technologies in certain species and in
certain ecologically- and economically-different environments calls for acritical review of the crossbreeding program, particularly from the point of

9
view of adaptability of the crossbreeds to different agroecologicalconditions and socioeconomic environments. The future research anddevelopment strategies should be devised accordingly, but with dueconsideration to animal biodiversity. In view of frequent and higheracquisition cost of crossbred cattle and a lack of outlets for surplus animalsdue to the ban on cattle slaughtering, the crossbreeding program shouldemphasize species with a short generation interval and high social demand.
• The success rate of AI is currently low (about 20%). AI services are largelyin the public sector and are heavily subsidized. The low success rate seemsto act as a deterrent to adoption. It is, therefore, imperative to improvequality of breeding material, techniques, and delivery services so as to instilland reclaim the confidence of livestock owners in AI.
• Buffalo should receive increased attention in research and developmentprograms in view of their better adaptability to varied climates, higher milkyields, higher fat content, and disposal value.
• India is considered a storehouse of animal biodiversity in terms of speciesand breeds. Although India has a rich database on numbers of differentspecies, their genetic characterization has been limited. This makes itdifficult to assess the genetic diversity and evolve conservation strategies.Enumeration of breeds is a difficult task that needs considerable resourcesand the establishment of interdepartmental linkages, especially betweenthose dealing with field surveys and animal husbandry.
• The huge livestock populations of different species are still growing(although at a slower rate) putting pressure on the feed and fodderresources. The numbers of different species thus need to be optimizedconsidering the demand for their products and the availability of feed andfodder resources.
• Technological alternatives to improve quantity and quality of feed requiregreater emphasis. There are a number of traditional and new feed andfodder production and management technologies that are cost-effectiveand have sufficient potential to mitigate feed and fodder scarcity. The bestway to promote these technologies is to generate wide awareness among thefarmers and to publicize their improved benefit-cost ratios.
• Cereal crop residues form the bulk of the feed dry matter. Therefore, crop-breeding programs should emphasize breeding of superior quality straw/stover of dual-purpose crops without sacrificing grain yield. Straw qualityshould also be improved through better management of diseases.

10
• In view of the small proportion of total cropped area under fodder cropsand sluggish growth therein, crop breeding should focus on high-yieldingand high-quality fodder and forage varieties. Economic incentives (inputsubsidies for growing forage crops) and vertical integration of the livestocksubsector, by developing marketing and processing infrastructure andinstitutions, would result in farmers bringing more land into fodder cropproduction.
• Deterioration of common grazing lands is a matter of concern, particularlyfor sustainability of small ruminant production in ecologically-fragileregions. It is therefore imperative to check quantitative and qualitativedeterioration of common grazing lands through technological (watershedmanagement, reseeding with improved grasses), social (participatorymanagement), and policy interventions (legal action against encroachment).
• Disease monitoring should be accorded a high priority, considering thefrequent occurrence of many potentially lethal animal diseases. The policyemphasis should shift from curative to preventive disease management.There is sufficient manpower available for this in the public sector that canbe utilized gainfully without much additional overhead costs. Marginalinvestments in medicines and supplies would yield considerable economicand social benefits.
• Linkages between research and extension need to be strengthened foreffective transfer of technologies. The huge numbers of field veterinariansand auxiliaries should shoulder the responsibility of technology transfer.
• Social scientists should play a proactive role in evaluation of technologiesfor their social acceptability, constraints, and impact. This kind ofintegration of biological and social sciences would help improve the socialand economic efficiency of research.
• Developments in biotechnology are expected to provide solutions to manyproblems constraining livestock production. The biotechnology researchhowever needs to be prioritized considering the importance of theproduction constraints. The largest impact of biotechnology in the shortterm can be realized in the field of animal nutrition and health.
ReferencesBirthal, P.S., Joshi, P.K. and Anjani Kumar. 2002. Assessment of research priorities inlivestock sector of India. Policy-15. National Centre for Agricultural Economics andPolicy Research, New Delhi.

11
Delgado, C., Rosegrant, M., Steinfeld, H., Ehui S. and Courbois, C. 1999. Livestockto 2020: The next food revolution. Discussion paper 28. IFPRI, Washington D.C.,FAO, Rome, and ILRI, Nairobi.
Gaddi, G.M. and Kunal, L.B. 1996. Sources of output growth in new milk productiontechnology and some implications to research investment. Indian Journal ofAgricultural Economics 51(3):389-395.
Kumar, P. 1998. Food demand-supply projections. Indian Agricultural ResearchInstitute, New Delhi.
Kumar, P., Maji, C.C. and Patel, R.K. 1977. Returns on investment in research andextension: a study on Indo-Swiss cattle improvement project, Kerala. Indian Journal ofAgricultural Economics 32(3).

12
1. National Centre for Agricultural Economics and Policy Research, New Delhi 110 012.2. Socioeconomics and Policy Program, International Crops Research Institute for the Semi-Arid Tropics,
Patancheru 502 324, Andhra Pradesh, India.
Economic Contributions of the LivestockEconomic Contributions of the LivestockEconomic Contributions of the LivestockEconomic Contributions of the LivestockEconomic Contributions of the LivestockSubsector in IndiaSubsector in IndiaSubsector in IndiaSubsector in IndiaSubsector in India
Pratap S Birthal1 and P Parthasarathy Rao2
Livestock are an integral component of agriculture in India and makemultifaceted contributions to the growth and development of the agriculturalsector. Livestock help improve food and nutritional security by providingnutrient-rich food products, generate income and employment and act as acushion against crop failure, provide draught power and manure inputs to thecrop subsector, and contribute to foreign exchange through exports. Also, byusing crop residues as feed, livestock save land for food production that wouldotherwise be used for fodder production. Additionally, livestock makesubstantial contributions to environmental conservation, supplying draughtpower and manure for fertilizer and domestic fuel that save on the use ofpetro-products. This paper assesses the contribution of livestock subsector tothe growth of agriculture and socioeconomic development.
Structure of Livestock ProductionIndia possesses one of the largest livestock populations in the world. In 1992the country had 205 million cattle, 84 million buffalo, 115 million goats, 51million sheep, 13 million pigs, 1 million horses and 307 million poultry (Table1). The livestock sector is both expanding and adapting in response toeconomic, technological, and environmental factors. In general, the numbersof different species are increasing; populations of poultry, pigs, goats, andbuffalo have grown faster compared to other species. The populations ofdraught animals have witnessed negative and decelerating trend.
13
Broadly these trends indicate:• Deceleration in growth of populations of almost all species except poultry.
The decelerating trend is, however, stronger in the case of small ruminants.Thus there is a tendency towards stabilization of the livestock population inthe long run.
• A gradual shift in favor of animals that are less capital intensive, have shortgeneration intervals, and better feed conversion and economic efficiency.
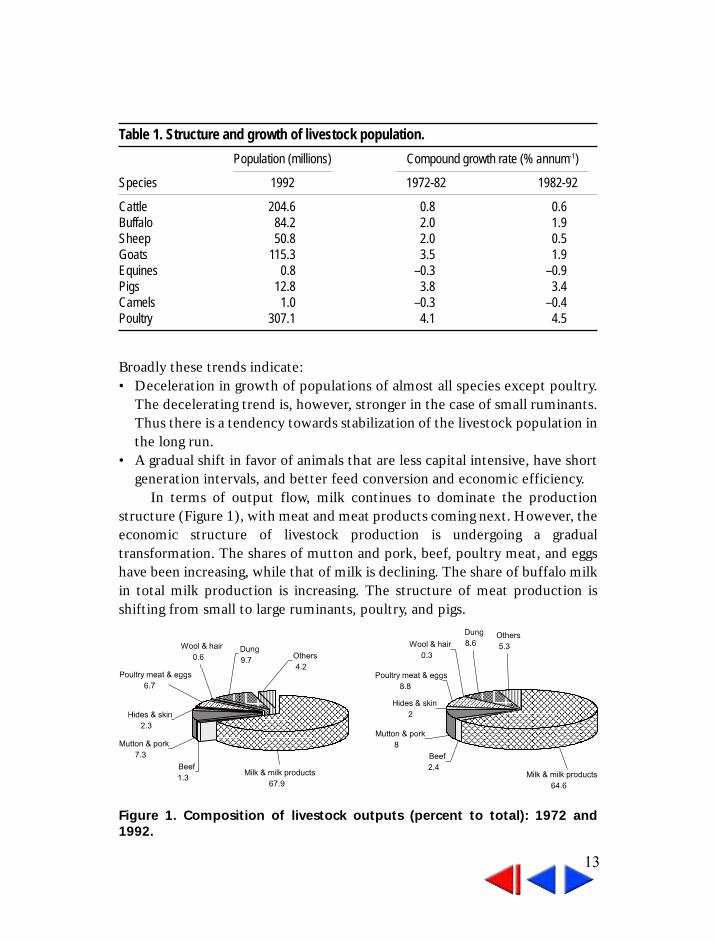
In terms of output flow, milk continues to dominate the productionstructure (Figure 1), with meat and meat products coming next. However, theeconomic structure of livestock production is undergoing a gradualtransformation. The shares of mutton and pork, beef, poultry meat, and eggshave been increasing, while that of milk is declining. The share of buffalo milkin total milk production is increasing. The structure of meat production isshifting from small to large ruminants, poultry, and pigs.
Table 1. Structure and growth of livestock population.
Population (millions) Compound growth rate (% annum-1)
Species 1992 1972-82 1982-92
Cattle 204.6 0.8 0.6Buffalo 84.2 2.0 1.9Sheep 50.8 2.0 0.5Goats 115.3 3.5 1.9Equines 0.8 –0.3 –0.9Pigs 12.8 3.8 3.4Camels 1.0 –0.3 –0.4Poultry 307.1 4.1 4.5
Figure 1. Composition of livestock outputs (percent to total): 1972 and1992.
14
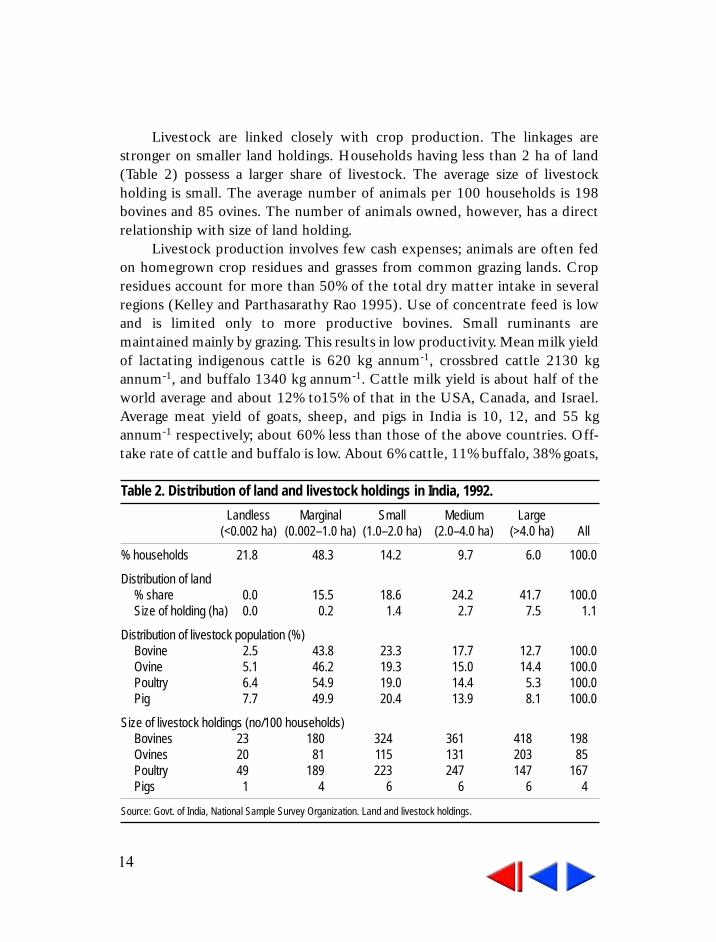
Livestock are linked closely with crop production. The linkages arestronger on smaller land holdings. Households having less than 2 ha of land(Table 2) possess a larger share of livestock. The average size of livestockholding is small. The average number of animals per 100 households is 198bovines and 85 ovines. The number of animals owned, however, has a directrelationship with size of land holding.
Livestock production involves few cash expenses; animals are often fedon homegrown crop residues and grasses from common grazing lands. Cropresidues account for more than 50% of the total dry matter intake in severalregions (Kelley and Parthasarathy Rao 1995). Use of concentrate feed is lowand is limited only to more productive bovines. Small ruminants aremaintained mainly by grazing. This results in low productivity. Mean milk yieldof lactating indigenous cattle is 620 kg annum-1, crossbred cattle 2130 kgannum-1, and buffalo 1340 kg annum-1. Cattle milk yield is about half of theworld average and about 12% to15% of that in the USA, Canada, and Israel.Average meat yield of goats, sheep, and pigs in India is 10, 12, and 55 kgannum-1 respectively; about 60% less than those of the above countries. Off-take rate of cattle and buffalo is low. About 6% cattle, 11% buffalo, 38% goats,
Table 2. Distribution of land and livestock holdings in India, 1992.
Landless Marginal Small Medium Large(<0.002 ha) (0.002–1.0 ha) (1.0–2.0 ha) (2.0–4.0 ha) (>4.0 ha) All
% households 21.8 48.3 14.2 9.7 6.0 100.0
Distribution of land% share 0.0 15.5 18.6 24.2 41.7 100.0Size of holding (ha) 0.0 0.2 1.4 2.7 7.5 1.1
Distribution of livestock population (%)Bovine 2.5 43.8 23.3 17.7 12.7 100.0Ovine 5.1 46.2 19.3 15.0 14.4 100.0Poultry 6.4 54.9 19.0 14.4 5.3 100.0Pig 7.7 49.9 20.4 13.9 8.1 100.0
Size of livestock holdings (no/100 households)Bovines 23 180 324 361 418 198Ovines 20 81 115 131 203 85Poultry 49 189 223 247 147 167Pigs 1 4 6 6 6 4
Source: Govt. of India, National Sample Survey Organization. Land and livestock holdings.

15
and 33% sheep are slaughtered every year. These figures suggest considerablescope for raising livestock productivity and production.
Economic ContributionsEven at low productivity and off-take rates, livestock contribute significantlyto economic development. Their developmental role in the mixed farmingsystems transcends direct economic benefits. Use of manure contributes toagricultural sustainability and conservation of the environment. Using draughtanimal power helps save nonrenewable energy such as petroleum. Livestockprovide raw material for industry. Additionally, livestock act as a storehouse ofcapital and an insurance against crop failure. With production concentratedamong small landholders, livestock help improve income distribution.
Contribution to National Income
In 1997-98 the livestock subsector accounted for about 23% of theagricultural gross domestic product (AGDP). This has increased graduallyfrom 14% in 1980-81. On the other hand the contribution of the agriculturalsector to gross domestic product (GDP) decreased from 35% in 1980-81 to26% in 1997-98. In other words the livestock subsector has grown at a fasterrate than the crop sector (Figure 2). The respective annual rates of growth inGDP from livestock and agriculture are about 7.3% and 3.1% respectively.
050
100150200250
300350
1980
-81
1982
-83
1984
-85
1986
-87
1988
-89
1990
-91
1992
-93
1994
-95
1996
-97
Inde
x (1
981-
81=1
00)
Livestock
Agriculture
Figure 2. Trends in livestock GDP vis-à-vis agricultural GDP , 1993–94 prices

16
Inputs to Agriculture
Livestock provide draught power and dung manure to the crop subsector. In1996–97, draught animals accounted for 14% of the total power available tothe agricultural sector (Table 3). Share of livestock in the total poweravailability declined sharply from 69% in 1961–62 to 25% in 1981–82.However, its absolute contribution has remained almost unchanged at about20 million kilowatt.
Dung manure is an important contribution. About half of the total dungproduced is used as manure and the rest as domestic fuel. In 1970–71 dungmanure accounted for about 43% of the total value of manure and fertilizersused in agriculture. This declined drastically to 23% in 1980–81 and to about13% during the 1990s. However the absolute value of manure has beenincreasing steadily.
Employment and Poverty
Livestock provide livelihood support to millions of people having little accessto land. About one-third of the population lives below the poverty line, mainlycomprising of landless, marginal, and small farmers. Since the distribution oflivestock is more equitable compared to land (Table 2), growth in the livestock
Table 3. Draught power and manure contributions of livestock.
1970–71 1980–81 1990–91 1997–98
Draught powerTotal power available (mKW) 44.1 69.1 113.6 136.3Share of draught animals (%) 45.8 24.7 17.1 14.1
ManureValue of manure (million Rs, 1980–81 prices) 11730 13520 15230 18110Manure used as fertilizer (%) 49.5 51.2 47.3 48.2Value of manure and fertilizers used in
agriculture (million Rs, 1980–81 prices) 13440 29840 60170 67510Share of manure in value of
total soil nutrient inputs (%) 43.2 22.7 12.1 12.9
Source: Gyanendra Singh, p 73, Table 6 (this volume).
Govt. of India. Manure contributions from National Accounts Statistics, various issues, Central Statistical
Organization, Ministry of Programme Planning and Implementation.

17
sector is considered to be anti-poverty and equity-oriented (Adams and He1995; Birthal and Singh 1995).
Though the contribution of livestock to AgGDP has been risingcontinuously, contribution to rural employment is not so encouraging. In termsof principal activity status livestock employs about 5 percent of the rural workforce (Table 4). Its share however has declined to 3 percent in 1990s. Lowshare in rural employment is because livestock rearing in India is taken up as asubsidiary to crop production.
Food and Nutrition
The diet of an average Indian is cereal-based and lacks nutrient-rich foods suchas pulses, fruits, vegetables, and animal products. Low intake of theseproducts results in nutritional deficiencies. About 30% of the populationsuffers from malnutrition (Kumar and Joshi 1999). The problem is severe inpopulations having little access to cultivated land. Diversification of diettowards animal products can help improve nutrition. Intake of livestockproducts, however, is low (Table 5) compared to that in many developing anddeveloped countries. The food basket, though, is gradually diversifyingtowards livestock products. In 1972-73 livestock products accounted forabout 14% of the food expenditure, which gradually increased to about 20% in1993-94. Consumption of livestock products is expected to increase fasterwith sustained economic growth and attendant increases in per capitaincomes.
Table 4. Contribution of livestock to rural employment.
Source 1972–73 1977–78 1982–83 1987–88 1993–94
(million workers employed)
Agriculture 158.3 172.8 171.1 174.8 195.8(81.0) (78.5) (80.0) (76.6) (76.9)
Livestock 9.0 10.6 10.4 10.7 7.9(4.6) (4.8) (4.9) (4.7) (3.1)
Total 195.4 220.1 241.2 252.2 254.6
Values in parentheses are percent of total number of workers by usual principal activity status.
Source: Govt. of India. 1999. Basic Animal Husbandry Statistics, Department of Animal Husbandry, Ministry of Agriculture.

18
Trade
India has a negligible share in world trade in livestock products. During thetriennium ending 1998, the average value of livestock product exports was Rs13500 million annum-1, which was only 1% of the total export earnings and6.2% of the agricultural export earnings (Table 6). Meat and meat products arethe main livestock products exported, accounting for over 90% of the totalexport earnings from the livestock subsector. In recent years the exportperformance of livestock products has improved due to trade liberalization.
Table 5. Consumption of livestock products in India.
Consumption(kg capita-1 annum-1) Expenditure shares (%)
Product 1993–94 1972–73 1993–94
Milk 51.0 10.0 15.0Meat, eggs, and fish 3.4 5.2Goat meat 0.7 - -Mutton 0.2 - -Beef 0.3 - -Buffalo meat 0.3 - -Chicken 0.3 - -Total meat 1.7 - -Eggs (number) 10.5 - -Total livestock products - 13.4 20.3
Source: Govt. of India. National Sample Survey Organization, Ministry of Statistics and Program Implementation.
Table 6. Export and import of livestock products.
1980–82 1989–91 1996–98
Exports Value of exports of livestock products (million rupees) 761.0 1830.0 13505.0 Share of livestock exports in total exports (%) 1.0 0.5 1.1 Share of livestock exports in agricultural exports (%) 3.5 3.3 6.2
Imports Value of imports of livestock products (million rupees) 1824.0 910.0 1877.0 Share of livestock imports in total imports (%) 1.4 0.1 0.1 Share of livestock imports in agricultural imports (%) 14.3 4.8 1.5
Source: FAO Trade Year Book, various issues.

19
In 1998 India imported livestock products worth Rs 1877 millioncomprising 0.1% of total imports and 1.5% of agricultural imports. Hides andskins account for 95% of the total value of livestock product imports. India’simport of milk, hides, and skins has declined sharply in the last few years. Atpresent almost the entire demand for milk is met through domestic supplies.
Livestock also contribute towards environmental conservation, althoughin recent years this has been criticized by environmentalists due to certainnegative externalities caused by overgrazing and greenhouse gas emissions.Despite these criticisms, the livestock subsector will remain an importanteconomic activity benefiting millions of landless, marginal, and small farmersin the country.
ReferencesAdams Jr., R.H. and He, J.J. 1995. Sources of income inequality and poverty in ruralPakistan. International Food Policy Research Institute, Washington, D.C.
Birthal, P.S. and Singh, M.K. 1995. Structure of rural income inequality: a study inwestern Uttar Pradesh. Indian Journal of Agricultural Economics 50(2):168-175.
Kelley, T.G. and Parthasarathy Rao, P. 1995. Availability and requirement of differentsources of livestock feed in India, with special reference to sorghum and millet straw.Page 146 in Global Agenda for Livestock Research: proceedings of the consultation forthe South Asia Region, 6-8 Jun 1995, (Devendra C. and Gardiner P., eds.). ICRISATAsia Center, Patancheru, India. International Livestock Research Institute (ILRI)Nairobi, Kenya.
Kumar P. and Joshi, P.K. 1999. Socioeconomic factors contributing to nutritionalsecurity of rural households. In Diversification of agriculture for human nutrition.National Academy of Agricultural Science and National Institute of Nutrition,Hyderabad.

20
TTTTTechnological Change in India’echnological Change in India’echnological Change in India’echnological Change in India’echnological Change in India’s Livestocks Livestocks Livestocks Livestocks LivestockSubsector: Evidence and IssuesSubsector: Evidence and IssuesSubsector: Evidence and IssuesSubsector: Evidence and IssuesSubsector: Evidence and Issues
Pratap S Birthal1
The contribution of science and technology to the growth and development ofIndia’s agricultural sector since the mid-1960s is self-evident. Developmentsin research and production infrastructure and encouraging governmentpolicies acted as catalysts for the technology-driven growth in agriculture,helping the country achieve self-sufficiency in foodgrains and many othercommodities. In other areas such as horticulture, fisheries, and livestockconsiderable technical progress has taken place, but impacts have been slowand sporadic, and its analysis in an economic framework has largely remainedundocumented.
The contribution of livestock to income and employment generation issecond only to that of crops. However, its productivity is low compared to theworld average. Cattle milk yield is about half the world average of 2072 kgannum-1, and the same applies to beef and pork production. The situationbecomes more depressing when compared with the developed countries.Average milk yield of cattle is 13% that of the USA and 16% that of Canada.Sheep and pork yields are about 60% less. These figures suggest considerablescope for improvement of India’s livestock productivity.
Nonetheless, in recent years certain outputs of livestock such as milk,meat, and eggs have been growing at an annual rate of 5% or more. Thesustainability of these trends in the long run is unclear, as the currentproduction environment has several constraints. Feed has been a limitingconstraint to ruminant livestock production and this problem is likely tocontinue in the near future, considering the huge dimensions of livestockpopulations. Common grazing lands have been deteriorating quantitatively aswell qualitatively (Jodha 1991). Animals are fed on crop by-products andgrasses from roadsides and other marginal lands. Feeding of grains and otherconcentrates is inadequate, and the competition for grains will intensify withincreasing human and livestock populations. Thus technology will be a keyfactor in improving the productivity of India’s livestock subsector.
1. National Centre for Agricultural Economics and Policy Research, New Delhi 110 012.

21
Status of Technological ChangeSignificant research advances have been made in the areas of animal breeding,nutrition, and health. Many research products have been found to betechnically and economically viable under controlled experimental conditions,but the extent of their on-farm application has been rather low. Examples ofsuch technologies include improved animal breeds, and chemical/biologicaltreatment of straw and fodder. A brief review of the existing, as well aspotential, technologies that could influence the growth of the livestocksubsector is presented below.
Breed Improvement
Crossbreeding of low-yielding indigenous breeds with high-yielding exoticbreeds has been widely acknowledged as a valuable strategy to improve animalproductivity. Sporadic attempts to improve the genetic potential of differentlivestock species (poultry, sheep, and cattle) in India were initiated during thelatter half of the nineteenth century, but no significant achievements werereported. In the 1950s, systematic crossbreeding research and developmentprograms were initiated. Crossbreeding research has focused mainly on cattlebecause of their dual role of milk production and use as draught animals in thecrop subsector. A number of crossbreeds with improved production potentialshave evolved, which include Haryana × Friesian, Haryana × Jersey, Haryana ×Brown Swiss, Rathi × Jersey, Gir × Jersey, Gir × Friesian, and Sahiwal × Jersey.
Adoption of crossbreeding technology has been slow. Only 7.5% of thecattle population consists of crossbreeds (Table 1). In other animal species toothe status of crossbreeding is similar. About 5% of the sheep and 15% of pigsare crossbreeds. The reasons are nonacclimatization of crossbreeds to theIndian climate and lack of resistance to disease. The poultry subsector,however, has achieved notable success. Improved poultry constitute about34% of the total population. Crossbreeding is also practiced in other species.Statistical information regarding these, however, is lacking.
Between 1982 and 1992, the population of crossbred cattle increased atan annual rate of 5.6% (Table 2). On the other hand, indigenous stock seemedto be approaching stabilization. The annual growth rate of indigenous cattlewas 0.5% although the female population witnessed a slightly higher growth.Low milk yield and decreasing demand for draught animals are the mainfactors for slow growth in indigenous stock. These trends indicate a gradualsubstitution of indigenous cattle by crossbreds.

22
Despite being an important milch species, the buffalo has not receivedmuch attention in breed improvement. Development efforts have focused onupgrading low-yielding breeds through artificial insemination. The buffalopopulation increased at a rate of 1.9% per year between 1982 and 1992. Thefemale population witnessed faster growth than the male population. Itsadaptability to a wide range of climatic conditions, higher milk yield comparedto indigenous cattle, and price premium on milk due to its higher fat contenthave favored faster growth in the buffalo population. Furthermore, thedisposal value of buffalo is higher; unlike cattle there are fewer restrictions onbuffalo slaughter.
The population of improved poultry grew at an annual rate of about 9%,more than double that of indigenous poultry (Table 2). Technologicaltransformation of the poultry subsector seems to be market-driven as thedemand for poultry meat and eggs is income-elastic and has been risingcontinuously. The populations of crossbred sheep and pigs also grew fasterthan their indigenous counterparts.
Empirical evidence from the field proves the scientific claims of bettereconomic performance of crossbred animals (Sharma et al. 1995; Gaddi andKunal 1996; Dhaka et al. 1998; Lalwani 1989). Despite this, crossbreedingtechnology has not gained a foothold. One of the possible reasons is non-acclimatization of crossbred animals to varying climatic conditions in thecountry, causing a number of health- and physiology-related problems. In thiscontext, Steane (1999) mentions that ‘in using exotic breeds as a strategy for
Table 1. Percentage of crossbreds in different livestock populations.
Rural Urban All
1982 1992 1982 1992 1982 1992
CattleTotal 4.3 6.9 15.6 20.2 4.7 7.4Male 3.9 4.4 11.9 11.5 4.1 4.6Female 4.7 9.4 17.5 25.6 5.3 10.3
Sheep 3.1 4.9 8.8 7.5 3.3 5.0
Pig 8.8 14.2 15.7 16.1 9.5 14.5
Poultry 20.1 31.9 42.1 44.8 21.7 32.9
Source: Computed using data from Livestock Census reports.

23
improvement it seems to have been assumed that genotype-environmentalinteractions do not exist or the optimal economic and sustainable crossingstructure would automatically be developed. Indeed in much of Asia, there
Table 2. Growth in crossbreds vis-à-vis the indigenous livestock population,1982–1992.
Annual compound growth rate (%)
Rural Urban Total
CattleCrossbred
Total 5.5 6.4 5.6Male 1.3 4.8 1.6Female 8.4 6.9 8.2
IndigenousTotal 0.4 3.1 0.5Male 0.2 5.3 0.3Female 0.7 1.8 0.7
All cattle 0.7 3.7 0.8Male 0.3 5.2 0.4Female 1.2 2.9 1.3
BuffaloTotal 1.9 2.8 1.9Male 0.7 0.3 0.7Female 2.2 3.2 2.3
SheepCrossbred 4.8 2.7 4.7Indigenous 0.3 4.3 0.4All 0.4 4.2 0.5
Goats 1.8 5.1 1.9
PigsCrossbred 8.4 4.9 7.9Indigenous 2.6 4.6 2.9All 3.3 4.6 3.4
PoultryImproved 9.4 6.1 9.0Indigenous 3.9 5.1 3.9All 4.4 5.5 4.5
Source: As in Table 1.

24
appears to be a history of introducing breeds without proper evaluation andwith little or no thought given to the breeding structure which will best use theavailable material’.
Higher initial investment and maintenance costs also limit widespreadadoption of crossbreds. The first cross animals perform very well, but theperformance of animals from subsequent crosses declines significantly.Therefore crossbred animals need to be replaced frequently in order to sustainthe flow of benefits. Frequent acquisition of first crossbreds, without realizingappropriate disposal value of the subsequently crossed animals, renderscrossbreeding technology capital intensive. In this context, Alderman (1987)observed that more than 50% of the farmers in Karnataka maintainingcrossbreeds depend on the market for replacement of first cross animals. Thisis to avoid the risk of getting unwanted male calves and the associatedproblems of breeding and feeding the calf.
As indigenous cattle are sources of both milk and draught power foragriculture, their replacement by crossbred cattle has been slow. Crossbredmales are considered inefficient for draught purposes compared to indigenousmales, although animal physiology research has shown that the difference ismarginal. Furthermore, machines have emerged as a major source of power inIndian agriculture, although mechanization does not appear to have affectedthe population of working animals significantly. The number of tractors perthousand ha increased from 0.6 in 1972 to 10.9 in 1992, while the workingbovines declined marginally (Table 3). Mechanization has affected workingbovines mainly on medium and large farms. The number of working bovinesdeclined from 410 in 1972 to 180 per 1000 ha in 1992 on medium farms andfrom 210 to 50 on large farms. On small and marginal farms, most of whichdid not have tractors, working animals provided most of the draught powerrequirement in 1972. In 1992, the number of tractors on these farms hadincreased to 4.1 and 7.8 per thousand ha without a concomitant decline in thenumber of working animals.
Nonetheless, crossbreeding strategies have been successful under certainenvironments and economic conditions as in Kerala and Punjab. In Kerala themilk production system is cattle-based. Indigenous breeds are poor as milkproducers and for draught power (Rajapurohit 1979). Cropping pattern islargely plantation-oriented, requiring less draught power. Furthermore, unlikein many other states, cattle slaughter is not prohibited by law in Kerala, thusmaking it easier to cull out the low-yielding and unwanted animals. In Punjab,

25
on the other hand, increasing intensification of agriculture required morepower to perform agricultural operations on time, which indigenous cattlewere not capable of providing. Moreover, feed resources have never been aproblem in Punjab.
Feed and Nutrition
Adequate provision of feed is essential to livestock production, and its scarcityhas been one of the major limiting factors in improving productivity in India.Crop residues and by-products comprise the main feeds, accounting for 40%of the total consumption (World Bank 1996). Green fodder contributes 26%,while concentrates contribute only 3 percent. The rest comes from grazing.Stall-feeding is largely confined to buffalo, crossbred cattle, and draughtanimals. Small ruminants mainly feed on grasses from village commonproperty resources, roadsides, and harvested fields, and supplementaryfeeding is lacking except in large commercial herds.
There is a large gap between requirement and availability of feed at thenational level. Recent estimates indicate that in India the dry fodder deficit is31%, green fodder 23% and concentrates 47% (Table 4). Regional deficits arehowever, more important than the national deficit. Of 55 micro-agroecoregions, 43 are deficient in feed (Singh and Mazumdar 1992). Most ofthe deficient regions lie in the arid and semi-arid agroecological zones. Thefeed deficiency is due to heavy population pressure, the quantitative andqualitative deterioration in common grazing lands resulting in low biomassproduction, and the lack of adoption of fodder production technologies.
Table 3. Changes in number of tractors and working bovine stock, 1972–92.
Tractors/1000 ha Working bovines/1000 ha
Category 1972 1992 1972 1992
Marginal 0.0 4.1 1600 1540Small 0.0 7.8 1060 810Semi-medium 0.1 10.5 700 420Medium 0.7 15.4 410 180Large 1.2 14.7 210 50All 0.6 10.9 650 590
Source: NSSO 1997. Report on Land and Livestock Holdings.

26
The problem of underfeeding can be overcome partly throughtechnological interventions such as the biological/chemical treatment of feed.Techniques such as urea treatment of straws, urea-molasses mineral blocks,and bypass protein improve nutritional value of feed and its palatability. Ureatreatment has been reported to reduce green fodder requirements by about20–40% and increase cattle milk yield by 10–20% (Patil et al. 1994; Rai et al.1994; Saha and Singh 1994). Under experimental conditions, bypass proteintechnology has been found to reduce concentrate requirements by 40% anddry matter requirements by 24% (Chatterjee and Acharya 1992, Tripathi1997). Despite such benefits, its application is limited because of supplyconstraints and a lack of concerted efforts to transfer the technologies anddemonstrate their cost-benefit ratios.
The area under fodder crops in the country has hardly ever exceeded 5%of the gross cropped area and it is uncertain whether this will increase in thefuture. Increasing demand for livestock products calls for more allocation ofland to fodder crops, but current priorities for food grains, pulses, and oilseedsseem to constrain the fodder area expansion. Availability of by-products offood crops as animal feed is expected to increase with an increase in area underthese crops.
Plant breeding research has also focused more on increasing grain yieldthan vegetative yield, both in terms of quantity and quality. In an ex-anteframework Kristjanson et al. (1998) have estimated that a 1% improvement indigestibility of coarse cereal fodder through genetic manipulation wouldenhance production of different livestock outputs by 3–10%.
Animal Health
Diseases reduce the production potential of livestock. There are a number ofdiseases such as rinderpest (RP), foot and mouth disease (FMD), hemorrhagicsepticemia (HS), mastitis, brucellosis, tuberculosis, and black quarter (BQ)
Table 4. Feed availability and requirements, 1993.
Availability Requirement DeficiencyFeed stuff (million t) (million t) (%)
Straw 399 584 31Green fodder 574 745 23Concentrate 42 79 47
Source: Govt. of India. 1993. Ministry of Environment and Forests.

27
that affect livestock production and cause enormous economic losses. Anestimated livestock output worth Rs 50 billion is lost annually due to disease.In view of this, the National Commission on Agriculture (1976) observed that‘livestock development programs cannot possibly succeed unless a wellorganized animal health service is built up and protection of livestock againstdiseases and pests, particularly the deadly infectious ones, is assured’. To thisend, animal health infrastructure has been strengthened. Between 1984–85and 1997–98 the number of veterinary polyclinics, hospitals, and dispensarieshas increased considerably (Table 5). There are 27543 first aid centers andmobile dispensaries. Apart from these, there are 250 diagnostic laboratoriesand 26 veterinary vaccine production units. Twenty-one viral vaccines, 14bacterial vaccines and 13 diagnostic reagents are now produced in the country.
Impact of Technological ChangeContribution of Technology
The contribution of the livestock subsector to agricultural gross domesticproduct has increased from 14% in 1980–81 to 23% in 1998–99 at 1980–81prices. Since 1970–71 the livestock subsector has been growing at a rate ofabout 3.6% a year. The growth is a result of technological change, betterfeeding and management (Table 6). The Total Factor Productivity (TFP) index,a joint measure of contribution of technology and technical efficiency, hasbeen growing at an annual rate of 1.4% since 1970, while in the pre-1970sgrowth in the TFP index was marginally negative. This implies that technologyalong with management is gradually becoming a driving force in the growth ofthe livestock subsector.
Table 5. Growth in animal health infrastructure.
1984–85 1997–98
Number of veterinary polyclinics, hospitals, and dispensaries 14500 23303
Number of veterinary aid centers, stockman centers,and mobile dispensaries 14800 27543
Number of professional veterinarians 25300 36000
Number of veterinary auxiliaries 51000 70000
Source: 1. Govt. of India, Deptt. of Animal Husbandry and Dairying, Ministry of Agriculture.
2. FAO/WHO Animal Health Year Books.

28
Production and ProductivityFrom the point of research and development priorities, it is more important toassess the contribution of technology at the commodity or species level.However the data limitations, particularly on the input side, make it difficultto generate commodity-specific estimates of TFP. Still, productivity trendsprovide a fair assessment of the impact of technological change (Table 7).
Milk
Between 1972 and 1997 cattle and buffalo milk production grew at rates of5.2% and 4.4% a year, respectively (Table 7). The productivity of cattle and
Table 6. Compound growth rates of output, input, and total factor productivityindices.
1950–51 to 1970–71 1970–71 to 1995–96 1950–51 to 1995–96
Output index 1.3 3.6 2.6Input index 1.3 2.2 1.8TFP index –0.04 1.4 0.8
Source: Birthal et al (1999).
Table 7. Annual growth rates (%) in production and yield of livestock products,1972–1997.
1972–1988 1989–1997 1972–1997
Commodity Production Yield Production Yield Production Yield
MilkCattle 5.2 3.0 (58.4) 4.9 4.0 (82.8) 5.2 3.2 (61.4)Buffalo 4.4 1.7 (38.1) 4.7 3.8 (80.8) 4.4 1.9 (44.0)
MeatBeef and veal 7.5 –0.13 (–1.7) 4.2 2.1 (49.2) 7.1 0.15 (2.1)Buffalo 4.0 –0.07 (–1.7) 4.6 0.4 (8.5) 4.1 0.01 (–0.2)Mutton and lamb 2.0 0.3 (16.7) 3.9 3.3 (86.5) 2.2 0.07 (3.2)Goats 2.5 0.6 (25.2) 1.7 –0.02 (–1.2) 2.4 0.52 (22.0)Pigs 6.4 0.13 (2.0) 5.1 0.01 (–0.2) 6.3 0.12 (1.9)Poultry 5.1 9.3 5.7Total meat 4.2 4.6 4.2Eggs 6.2 3.9 5.6
Figures in parentheses indicate percent share of yield growth in output growth.
Source: Computed from data in FAO Production Year Book, various issues.
29
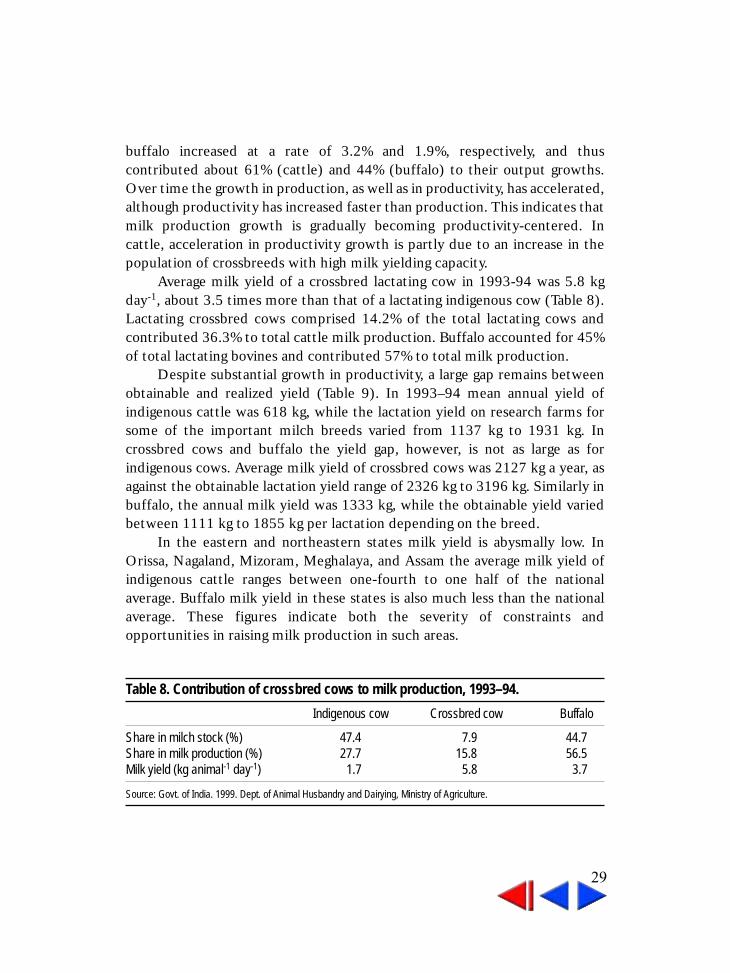
buffalo increased at a rate of 3.2% and 1.9%, respectively, and thuscontributed about 61% (cattle) and 44% (buffalo) to their output growths.Over time the growth in production, as well as in productivity, has accelerated,although productivity has increased faster than production. This indicates thatmilk production growth is gradually becoming productivity-centered. Incattle, acceleration in productivity growth is partly due to an increase in thepopulation of crossbreeds with high milk yielding capacity.
Average milk yield of a crossbred lactating cow in 1993-94 was 5.8 kgday-1, about 3.5 times more than that of a lactating indigenous cow (Table 8).Lactating crossbred cows comprised 14.2% of the total lactating cows andcontributed 36.3% to total cattle milk production. Buffalo accounted for 45%of total lactating bovines and contributed 57% to total milk production.
Despite substantial growth in productivity, a large gap remains betweenobtainable and realized yield (Table 9). In 1993–94 mean annual yield ofindigenous cattle was 618 kg, while the lactation yield on research farms forsome of the important milch breeds varied from 1137 kg to 1931 kg. Incrossbred cows and buffalo the yield gap, however, is not as large as forindigenous cows. Average milk yield of crossbred cows was 2127 kg a year, asagainst the obtainable lactation yield range of 2326 kg to 3196 kg. Similarly inbuffalo, the annual milk yield was 1333 kg, while the obtainable yield variedbetween 1111 kg to 1855 kg per lactation depending on the breed.
In the eastern and northeastern states milk yield is abysmally low. InOrissa, Nagaland, Mizoram, Meghalaya, and Assam the average milk yield ofindigenous cattle ranges between one-fourth to one half of the nationalaverage. Buffalo milk yield in these states is also much less than the nationalaverage. These figures indicate both the severity of constraints andopportunities in raising milk production in such areas.
Table 8. Contribution of crossbred cows to milk production, 1993–94.
Indigenous cow Crossbred cow Buffalo
Share in milch stock (%) 47.4 7.9 44.7Share in milk production (%) 27.7 15.8 56.5Milk yield (kg animal-1 day-1) 1.7 5.8 3.7
Source: Govt. of India. 1999. Dept. of Animal Husbandry and Dairying, Ministry of Agriculture.

30
Meat
Total meat production in the country grew at a rate of 4.2% annually between1972 and 1997. The growth in contributions from different species, however,varied widely. Maximum growth occurred in beef and veal output (7.1%),followed by pork (6.3%), poultry meat (5.6%), buffalo meat (4.1%), goatmeat (2.4%), and mutton and lamb (2.2%). Growth in total meat productionhas improved slightly in recent years, mainly due to accelerated growth incontributions from buffalo, sheep, and poultry.
Table 9. Obtainable milk yields of some important breeds of cattle and buffalo.
Lactation yield Lactation length Realized yield, 1993–94Species/breed (kg) (days) (kg annum-1)
Indigenous cattle 618Gir 1403 257Haryana 1137 232Kankrej 1850 351Rathi 1931 331Red Sindhi 1605 284Sahiwal 1719 284Tharparkar 1659 280
Crossbred cattle 2127Haryana × Friesian 3196 340Haryana × Brown Swiss 2785 336Haryana × Jersey 2868 308Gir × Jersey 2713 324Gir × Friesian 2713 324Red Sindhi × Friesian 2326 284Rathi × Jersey 2802 321Tharparkar × Friesian 2600 311Sahiwal × Friesian 2357 294Sahiwal × Jersey 2660 314
Buffalo 1333Bhadwari 1111 276Mahsana 1744 279Murrah 1597 296Nili-Ravi 1855 316Surti 1772 350
Source: 1. Pundhir and Sahai (1997) for obtainable yield.
2. Realized yield is based on the source in Table 8.

31
Growth in meat production is due largely to increases in the number ofanimals slaughtered, as the increase in yield is negligible in almost all species.Recent trends, however, indicate improvement in meat yield of cattle, buffalo,and sheep, and a decline in meat yield of goats and pigs. A number of factorsare responsible for poor meat productivity and growth. Cattle and buffalo areraised mainly for milk and provide meat as an adjunct. Poor quality animals areslaughtered. Only surplus buffalo males and unproductive cattle and buffalostock, often old, infertile, and malnourished are sent to slaughterhouses.Among the reasons for stagnation in yields of small ruminants are adeterioration of common grazing lands (Jodha 1991, Pasha 1991), and lack ofsupplementary feeding. Improved nutrition and veterinary care would helpraise meat yields. However, in the long run, genetic improvement would be akey factor in sustaining the output growth of these animals.
Eggs
During 1972–97, egg and poultry meat production increased at the rate of5.6% a year. However, in recent years, growth in poultry meat productionaccelerated while egg production growth decreased substantially. Geneticimprovement efforts contributed substantially to fast growth of the poultrysubsector. About two-thirds of the total egg production in the country in1993-94 came from improved layers that comprised 48% of the total egglaying population (Table 10). Average egg yield of an improved layer is 232 eggsannum-1, more than double the yield of an indigenous layer. There is clearlyconsiderable scope for increasing egg production by substituting indigenouslayers with improved breeds.
Incidence of disease
Many diseases such as FMD, BQ, HS, and anthrax still prevail in varyingintensities despite the substantial growth in animal health infrastructure.However concerted efforts under the rinderpest eradication program haveachieved notable success in alleviating the incidence of the disease (Fig. 1). Onthe other hand, the incidence of FMD, BQ, and HS has increased in recentyears (Figs. 2, 3, and 4). This implies a lack of focus on preventive diseasemanagement.

32
Prices of Livestock Products
Technological change influences commodity prices via a shift in supply. Adownward shift in supply of a commodity is expected to bring down its price,ceteris paribus. Trends in real wholesale prices2 of some major livestockproducts since 1970 are shown in Figures 5 to10.
The price of milk did not exhibit any definite trends during the 1970s(Figure 5). It showed some stability during the 1980s and thereafter starteddeclining. A similar trend is observed in the case of butter (Fig. 6), exceptduring the late 1980s when its price showed an upward trend. There has beensignificant growth in milk production in the country since the initiation of theOperation Flood program under which concerted efforts have been made tocreate a production and marketing infrastructure. Besides raising domesticproduction it also helped reduce dependence on imports, so that about 99% ofthe milk demand in the country is met through domestic production.
The real wholesale price of mutton has shown a rising trend with slightyear to year fluctuations (Fig. 7). This is because of slow growth in muttonproduction. On the other hand, beef prices showed a declining trend between
Table 10. Contribution of improved poultry in total egg production, 1993–94.
Fowl Ducks
Population (millions)Improved layers 65.0 (48) 0.5 (5)Indigenous layers 70.2 (52) 9.9 (95)Total 135.3 (100) 10.5 (100)
Egg production (millions)Improved layers 15095.3 (66) 103.9 (8)Indigenous layers 7671.9 (34) 1139.5 (92)Total 22767.2 (100) 1243.4 (100)
Egg yield (number bird-1 annum-1)Improved layers 232 193Indigenous layers 109 114
Figures in parentheses are percent of total.
Source: As in Table 8.
2. The prices are averages of prices in different markets. The Agricultural GDP deflator was used toconvert the current prices into real prices.

33
y = 9.4426x + 16.926
R2 = 0.2536
0
50
100
150
200
250
300
350
400
1981
1983
1985
1987
1989
1991
1993
1995
1997
Nos
./mill
ion
Figure 1. Trends in the incidence ofrinderpest in bovines in India.
Figure 2. Trends in the incidence ofFMD in bovines in India.
y = 0.6666x - 0.0171
R2 = 0.1922
0
5
10
15
20
25
30
35
40
1981
1983
1985
1987
1989
1991
1993
1995
1997
Nos
./mill
ion
Figure 3. Trends in the incidence ofblack quarter in bovines in India.
y = 4.398x - 14.051
R2 = 0.1447
-25
0
25
50
75
100
125
150
175
200
225
250
275
1981
1983
1985
1987
1989
1991
1993
1995
1997
Nos
./mill
ion
Figure 4. Trends in the incidence ofHS in bovines in India.
y = -0.1584x + 2.8265
R2 = 0.243
0
1
2
3
4
5
6
1981
1982
1983
1984
1985
1986
1987
1988
1989
1990
1991
1992
1993
1994
1995
Nos
./mill
ion
y = -1.5011x + 365.89
R2 = 0.1453
0
50
100
150
200
250
300
350
400
450
1970
-71
1972
-73
1974
-75
1976
-77
1978
-79
1980
-81
1982
-83
1984
-85
1986
-87
1988
-89
1990
-91
1992
-93
1994
-95
1996
-97
Rs/
100
litre
Figure 5. Trends in real wholesaleprice of milk.
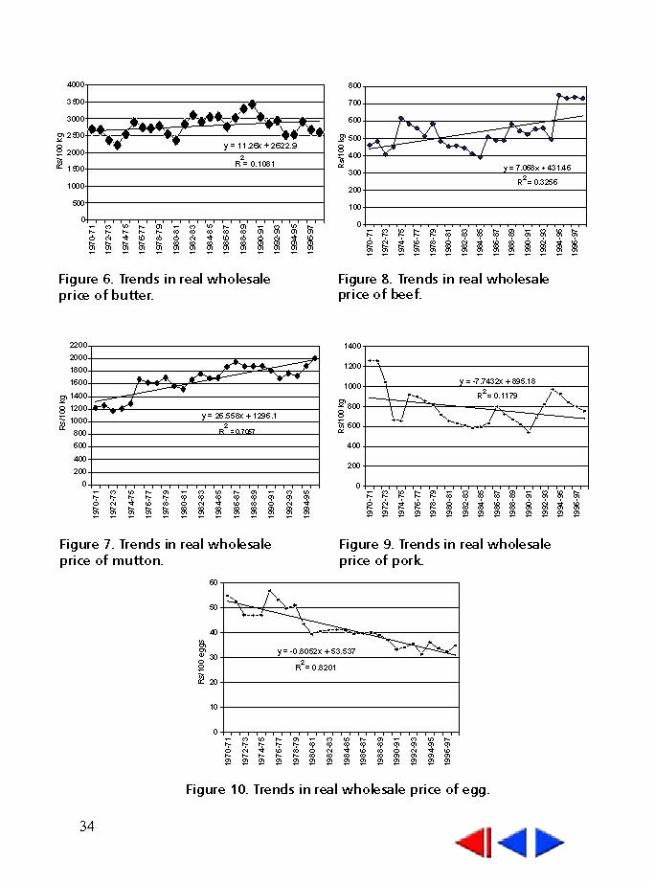

35
1974–75 and 1985–86, and began increasing thereafter due to a rise in exportdemand (Fig. 8). The general trend in the price of pork is declining but withwide fluctuations (Fig. 9). The real price of eggs has been declining steadily(Fig. 10).
Putting together price and productivity trends gives an idea of the impactof technological change in the livestock subsector. In general a negativerelationship exists between productivity and real price trends in the case ofmilk, egg, and pork, supplies of which have partially increased due to adoptionof improved technology.
Equity
Improving efficiency of livestock production through technologicalinterventions is considered equity-oriented on the premise that the livestockwealth is more equitably distributed than land (Adams and He 1995; Birthaland Singh 1995). The relationship between rate of adoption of crossbredcattle and size of land holding shows higher proportions of crossbreeds in totalcattle stock in the landless and marginal farm categories, although the size ofcattle holding there is smaller (Table 11). It is thus conjectured thattechnological change would create more income-generating opportunities forlandless and marginal farmers. But larger farmers would benefit more from itby virtue of having larger number of crossbreeds and better access to feedresources. This is however a contentious issue and needs to be examinedfurther.
Table 11. Distribution of adult female crossbred cattle by size of land holding, 1992.
Size of land holding (ha) Indigenous Crossbred Total % crossbreeds
.............. (number per household) ...........Landless 0.04 0.01 0.05 20.1
< 1.0 0.35 0.08 0.43 18.2
1.0–2.0 0.59 0.08 0.67 11.9
2.0–4.0 0.61 0.09 0.70 12.9
4.0–10.0 0.64 0.10 0.74 13.5
>10.0 0.75 0.07 0.82 8.5
All 0.36 0.07 0.43 15.4
Source: As in Table 3.

36
Rural-Urban Disparities
The rising urban populations are causing a rapid increase in the demand foranimal foods. This has resulted in the rapid growth of peri-urban livestocksystems. Higher growth in urban livestock populations is an indicator of this(Table 2). Unlike rural livestock systems, peri-urban systems are commerciallyoriented and intensive in nature, depending mainly on purchased inputs.Technical coefficients of crossbred animals are better under peri-urbansystems (Birthal et al. 1999) and adoption of technology is therefore alsoexpected to be higher (Table 1). For instance, in 1992 about 20% of the cattleand 45% of the poultry population in urban areas were that of crossbred/improved species. Corresponding figures for rural areas stood at 7% and 32percent. Adoption of technologies related to health, nutrition, andmanagement is also expected to be higher in peri-urban areas. Thus theremight be increasing technological dualism between rural and urban areas withthe rising demand for livestock products.
Future PerspectivesIndia’s livestock subsector is at the crossroads. On the one hand India has anenormous and diverse livestock population, the production potential of whichremains untapped due to feed and fodder scarcity and poor application oftechnologies. On the other hand sustained economic growth, market-orientedpolicies, and trade liberalization are opening up opportunities for the growthand development of this subsector. The demand for livestock products isincome elastic and is expected to grow further (Kumar 1998). India can alsoderive substantial benefits from the emerging international economic orderunder WTO through export of livestock products. At present, export oflivestock products is constrained by low livestock productivity, lack of valueaddition, and inadequate phytosanitary standards. The pace of developmentand diffusion of yield-improving technologies and the development ofprocessing infrastructure would determine largely how best the emergingopportunities could be used for the benefit of producers and consumers.• Crossbreeding programs should be reviewed at regional levels for their
success as well as failure. The strategy of introducing exotic breeds toimprove the local breeds also requires rethinking.
• The buffalo, which holds the promise of increasing milk productionconsidering its adaptability to a wide range of climatic conditions and betterfeed conversion efficiency, should be studied intensively. Unlike cattle,
37
there are few restrictions on buffalo slaughter and a breakthrough in buffalocrossbreeding would provide a big impetus to the livestock economy.
• Optimization of the livestock population and qualitative improvements infeed resources are the main ways to improve productivity. This involvesculling of unproductive and unwanted surplus population, which is oftennot feasible because of restrictions on cattle slaughter and sociocultural andreligious taboos on meat consumption. The export of live cattle to countrieswhere demand for beef is high is a possibility that should be explored(Mishra 1995). Besides earning foreign exchange, this would also relievepressure on feed resources and improve productivity of the remaining stock.Improving quality of available feed resources is technology dependent andshould be accorded high priority in the research agenda of both crop andanimal science research.
• Disease prevention and control must complement these efforts. Veterinaryinstitutions often lack the essential medicines and equipment, and thequality of veterinary services is poor. The emphasis should shift fromcurative to preventive disease management and to improvement ofinfrastructure.
• Developments in biotechnology are expected to provide solutions to manyproblems currently constraining the livestock production potential. Therole of biotechnology in improving fodder quality is well established.Similarly, research in the areas of animal breeding, embryo transfer, andgene cloning could help improve animal productivity.
• Research strategies must be prioritized on the basis of their urgency,gestation period, probability of success and adoption, availability of researchresources, and economic outcomes. Research strategies that are less capitalintensive, with a low gestation period, a higher probability of success andacceptability by clientele, and that yield a good rate of return should beemphasized. Animal nutrition and health fall in this category. In the long runhowever, genetic research would be a key factor in growth and developmentof the livestock subsector.
• Current livestock economics research is inadequate for a properunderstanding of the livestock subsector as it has focused mainly onassessment of microlevel production efficiency of crossbred cattle vis-à-visother dairy animals. Aspects related to nutrition, health, and processingtechnologies have remained largely unexplored. There is a similar lack ofsocioeconomic studies on ovine, caprine, equine, and poultry production

38
systems. Social sciences, particularly economics, should therefore beintegrated into biological research in a significant way from the initiation oftechnology generation to its diffusion and impact assessment.
• Other issues of economic importance that should be addressed areestimation of feed consumption, and economic losses due to disease. Theformer are currently based on feeding norms and few efforts have beenmade to estimate actual feed fodder consumption or the contributions fromgrazing lands and forests. Similarly, information available on economiclosses due to disease is based on guesses rather than on sound economicprinciples. These issues need to be addressed in a multidisciplinary modefor proper planning of development of the livestock subsector.
• Issues of sustainability of livestock production systems, their environmentaleffects, and the role of technology in addressing these issues also meritattention for an in-depth empiricism in a resource economics perspective.
ReferencesAdams, Jr. R.H. and He, J. J. 1995. Sources of income inequality and poverty in ruralPakistan. International Food Policy Research Institute, Washington, D.C.
Alderman, H. 1987. Cooperative dairy development in Karnataka, India: anassessment. International Food Policy Research Institute, Washington, D.C.
Birthal, P.S. and Singh, M.K. 1995. Structure of rural income inequality: a study inwestern Uttar Pradesh. Indian Journal of Agricultural Economics 50(2):168-175.
Birthal, P.S., Kumar, A., Ravishankar, A. and Pandey, U.K. 1999. Sources of growthin the livestock sector. Policy Paper 9, National Centre for Agricultural Economics andPolicy Research, New Delhi.
Chatterjee, A.K. and Acharya, R.M. 1992. Heading for 21st century. Dairy India,1992. Gupta Publishers, New Delhi.
Dhaka, J.P., Jain, D.K., Kesavan, V.K. and Singh, L. 1998. A study of production andmarketed surplus functions for milk in India. National Dairy Research Institute,Karnal.
FAO/WHO Animal Health Yearbook. Various years.
FAO Production Yearbooks. Various years.
Gaddi, G.M. and Kunal, L.B. 1996. Sources of output growth in new milk productiontechnology and some implications to research investment. Indian Journal ofAgricultural Economics 51(3):389-95.

39
Government of India. 1999. Basic animal husbandry statistics. Department of AnimalHusbandry and Dairying, Ministry of Agriculture, New Delhi.
Jodha, N.S. 1991. Rural common property resources – A growing crisis. GateKeeperSeries 24, International Institute for Environment and Development.
Kristjanson, P.M., Zerbini, E., Rao, K.P.C., Kiresur, Hofs, V. P. and Ravindra, K.V.1998. Genetic enhancement of sorghum and millet residues fed to ruminants – An ex-ante assessment of returns to research. International Livestock Research Institute,Nairobi.
Kumar, P. 1998. Food demand-supply projections. Indian Agricultural ResearchInstitute, New Delhi.
Lalwani, M. 1989. Technological change in India’s dairy farming sector: Distributionand Decomposition of Output Gains. Indian Journal of Agricultural Economics44(1):55-66.
Mishra, S.N. 1995. India’s livestock economy: A perspective on research. IndianJournal of Agricultural Economics 50(3):255-63.
National Commission on Agriculture. 1976. Report of the National Commission onAgriculture, Part VII, Animal Husbandry, Ministry of Agriculture and Irrigation, Govt.of India, New Delhi.
National Sample Survey Organisation. 1997. Report on land and livestock holdings.Ministry of Programme Planning and Implementation, Govt. of India.
Pasha, S.A. 1991. Sustainability and viability of small and large farmers: animalhusbandry and common property resources. Economic and Political Weekly26(13):A27-30.
Patil, B.R., Pradhan, P.K., Rangnekar, D.V. and Udo, H. 1994. Supplementation ofmilking cows in Gujarat. In On-Farm Research for Testing of Appropriate Technologiesin Crop-livestock Production Systems (Singh, K. and Schiere, J.B., eds.). IndianCouncil of Agricultural Research, New Delhi, India and Wageningen AgriculturalUniversity, The Netherlands.
Pundhir, R.K. and Sahai, R. 1997. Conservation of indigenous cattle breeds. DairyIndia, 1997. Gupta Publishers, New Delhi.
Rai, S.N., Singh, C.B. and Dhaka, J.P. 1994. Response of crossbred dairy cattle andbuffaloes to feeding of urea-treated paddy straw, Karnal district, Haryana. In On-FarmResearch for Testing of Appropriate Technologies in Crop-livestock ProductionSystems(Singh, K. and Schiere, J.B., eds.). Indian Council of Agricultural Research,New Delhi, India and Wageningen Agricultural University, The Netherlands.
Rajapurohit, A.R. 1979. Crossbreeding of Indian cattle: an evaluation. Economic andPolitical Weekly 14(12/13):A9-24.

40
Saha, R.C. and Singh, R. B. 1994. Response of dairy cows to feeding of urea-treatedstraw, West Bengal. In On-Farm Research for Testing of Appropriate Technologies inCrop -livestock Production Systems (Singh, K. and Schiere, J.B., eds.). Indian Councilof Agricultural Research, New Delhi, India and Wageningen Agricultural University,The Netherlands.
Sharma, S.C., Riyazuddin, and Rawat, P.S. 1995. Evaluation of crossbreedingprograms in sheep in Rajasthan. Wool and Woolens of India, January-March.
Singh, P. and Majumdar, A.B. 1992. Current status of feed and fodder management oflivestock. Agricultural Situation in India, August:375-382.
Steane, D.E. Introduction to the objectives of the workshop: proceedings of theWorkshop on Implications of the Asian Economic Crisis for the Livestock Industry, 6-9 July 1999. FAO Bangkok.
Tripathi, A.K. 1997. New concepts in feeding. Dairy India 1997. Gupta Publishers,New Delhi.
World Bank. 1996. India livestock sector review: Enhancing growth and development,The World Bank, Washington D.C.
41
1. International Consultant: Livestock and Dairy, Anand, Gujarat, India.
Crossbreeding of Indigenous Indian CattleCrossbreeding of Indigenous Indian CattleCrossbreeding of Indigenous Indian CattleCrossbreeding of Indigenous Indian CattleCrossbreeding of Indigenous Indian Cattlewith Exotic Breeds to Increase Milkwith Exotic Breeds to Increase Milkwith Exotic Breeds to Increase Milkwith Exotic Breeds to Increase Milkwith Exotic Breeds to Increase Milk
Production: A Critical AnalysisProduction: A Critical AnalysisProduction: A Critical AnalysisProduction: A Critical AnalysisProduction: A Critical Analysis
M P G Kurup1
Planned development of the livestock subsector in India began with the launchof the first Five Year Plan in 1951. This sought to break the centuries-oldvicious cycle of large numbers, acute shortage of feeds, recurrent animalepidemics, and low productivity. The First Plan goals in cattle developmentwere primarily to:
• Increase milk production;• Improve milk supply to the large urban demand centers; and• Improve the quality and supply of draught animals for agriculture.
The policies laid down for achieving these goals were selective breedingof indigenous cows belonging to the descript dairy breeds, upgrading ofnondescript cows with indigenous dairy breeds, and selective breeding ofdraught breeds.
The launch of the Key Village Scheme (KVS) in 1951 was the actionprogram to increase milk production and, to an extent, alleviate the shortagesin fodder supply. The Livestock Improvement Act enabling compulsorycastration of scrub bulls was an attempt to regulate the cattle populationgrowth as well as to enforce a degree of selectivity in breeding. Artificialinsemination (AI) was introduced around the same period, as a tool for rapidimprovement in the genetic make-up of the stock. Crossbreeding of Indiancattle with European dairy breeds was introduced as an experiment in the hillareas during this period.
The country’s milk production continued to be stagnant over the firsttwo decades postindependence. The increase in milk production during thefirst three plan periods was a mere 3 million tonnes. By the end of the thirdplan the inadequacies of the KVS were apparent, and serious policy
42
reorientation was required to engineer sustained increases in milk production.The interval between the third and fourth plans during 1966–69 witnessedsome of the most momentous policy initiatives by the government in thelivestock subsector, particularly for cattle. Development of rural milk shedsand movement of processed milk from the rural areas to urban demandcenters became the cornerstone of government policy. This single, epoch-making policy of the government in the late 1960s – to develop dairying inrural milk sheds through milk producers’ cooperatives – galvanized the Indiandairy industry to erupt into unprecedented growth.
This policy found institutionalization in the National Dairy DevelopmentBoard (NDDB), its translation into action in the “Operation Flood Project”and the nationwide cooperative movement launched under the project formarketing the rurally produced milk during the early 1970s. The sluggishnessin milk production gave way to rapid growth – from 22 million tonnes in 1970to nearly 69 million tonnes in 1996. The KVS matured into the IntensiveCattle Development Project, which later became the Government’s flagshipprogram for cattle development. Crossbreeding of nondescript cattle becamethe National Policy for increasing milk production and gained momentum andeconomic relevance, as the cooperative network under Operation Floodprovided the much needed market stimulus and price support for milk.
Under the different Five Year Plans, the central policy for cattledevelopment was direct action through state departments. All breedingsupport activities such as production of bulls, evaluation of bulls, andproduction of semen are part of the direct action of the various stategovernments. Infrastructure for generating these inputs, such as breedingfarms, semen production stations, and training institutions, is exclusively inthe government sector. Over the fifty years of planned development, this hassaddled the state governments with a vast infrastructure and an army ofprofessionals.
Breeding Policy for CattleBreeding policies for cattle were formally attempted and finalized by the stateand central governments based on the recommendations of the working groupappointed by the Ministry of Agriculture in 1962. The breeding policyrecommended:• Selective breeding of the pure Indian dairy breeds of cattle for milk
production.

43
• Selective breeding of pure Indian draught breeds of cattle for better draughtanimals.
• Selective breeding of dual-purpose breeds for improving both their milkand work output.
• Upgrading of the nondescript Indian cattle with selected Indian donorbreeds for improving body size and milk/work output.
Crossbreeding of Indigenous Cattle
Crossbreeding of Indian cattle with exotic dairy breeds was a practiceencouraged by the British in the late 19th century and there were manypockets of high-yielding crossbred cows, particularly the plantation areas inthe hills. With the advent of AI and the limited introduction of crossbreedingin the hill areas (1961), official policy started recognizing crossbreeding ofcattle with European donor breeds as a major option for improving milkproduction. Several bilateral crossbreeding projects in collaboration withexternal agencies (UNDP in Haringhatta, West Bengal; Indo-Danish Project inHasserghatta, Bangalore, Karnataka; and the Indo-Swiss Project in Mattupatty,Kerala) were established during 1962–64, to study the potential of the policyand to evaluate its impact on milk production and sustainability under Indianconditions.
Crossbreeding of nondescript Indian cattle on field scale started only in1964 with the launch of the Intensive Cattle Development Project (ICDP) bythe Government of India. By 1969 it had become the official policy. Thepioneering work on large-scale crossbreeding in different parts of India by theBharathiya Agro-Industries Foundation (BAIF) and the strong recommendationsof the National Commission on Agriculture (NCA) in 1974, laid all adversecriticism to rest and legitimised crossbreeding as a powerful tool to rapidlyenhance milk production in India.
The technical program for crossbreeding approved by the governmentswas to use nondescript cattle as the foundation stock and to breed them usingsemen from exotic donor breeds. This would produce half-breeds with equalinheritance from the two widely different parents, one contributing enduranceand the other the much-needed higher productivity. The policy thereafter wasto breed the half-breeds among themselves inter se in subsequent generations,to create large intermating populations of half-breeds, perpetually maintainingthe share of inheritance halfway between the Indian and the exotic parents.Genetic progress in the intermating populations would be maintained and

44
promoted through use of genetically evaluated half-bred sires for the inter semating. The exotic donor breeds initially used were Jersey, Brown Swiss, RedDane, and Holstein-Friesian. The choice of the exotic donor has now narroweddown to Jersey and Holstein – with Holstein predominating by popularchoice.
The government did not plan to crossbreed pure Indian breeds of cattle,but the spectacular increase in milk yield in the crossbred progenies generatedoverwhelming demand for such cattle all over India. This necessitated theexpansion of the crossbreeding program nationwide; even to the home tractsof the pure Indian breeds. The policy for selectively breeding indigenousbreeds of cattle did not take off for various reasons:• Improvement in production and productivity were not spectacular enough
to encourage farmers to progressively support it.• Proven sires among these breeds were not available.• There were no breeders’ organizations for these breeds in their respective
home tracts to provide technical and advisory services to breeders.
Technologies involved in Crossbreeding of CattleCrossbreeding of cattle is based on the following techniques from two majorbranches of biological sciences, reproductive biology, and quantitativegenetics:
• Genetic evaluation of sires and dams as aids for selection.• Artificial insemination for moving massive genetic payloads into animal
populations.• Multiple ovulation and embryo transfer to improve the intensity and
accuracy of selection and to reduce the period of evaluation.
The rapid growth of molecular biology and biotechnology foundapplication in the field of animal reproduction not only to develop and exploitdomesticated animals, but also as models for epoch-making research inembryo biotechnology such as cloning, gene therapy, gene transfers, andtransgenic animals. This explosion of knowledge has influenced breedingtechnology, particularly in bovine species, and presented the professionals inthis field with powerful technologies and precision techniques.
For inter se mating of half-breeds, genetically evaluated half-breed bullsare a basic requirement that India does not have in adequate numbers. Bulls tobe used for AI are evaluated for their ability to transmit economic traits

45
advantageous to the breeders and the industry, i.e. milk yield, fat and proteinpercentage, fertility, and a number of allied factors. None of these factors canbe measured on the bull itself. The bulls are evaluated on the basis of actualmeasurement of the desired traits in their daughters (progeny tests) orsiblings, both full and half (sibling tests in open nucleus breeding systems orONBS).
Genetic Evaluation of Crossbred Sires
Sire Evaluation through Progeny Tests
A progeny-testing program requires (1) a large ongoing AI service and (2) awell-structured Field Performance Recording Program. The duration of thetest under Indian conditions would be about 60 months for the provisionalevaluation based on past records of daughters, and 65 months for evaluationbased on full first lactation records. By the time the test is completed the bullis 5 to 6 years old. Only a few select institutions have succeeded in producingproven crossbred sires through progeny tests. The Kerala LivestockDevelopment Board (KLDB) has been successfully testing several batches ofcrossbred bulls for the past 20 years. The BAIF, Pune and the SabarmatiAshram Gaushala, Bidaj, Gujarat, have ongoing programs for progeny testingof crossbred bulls.
The test involves complex statistical models for analysis of the data oncecollected, but the data themselves and the data collection procedures aresimple enough, even though they need organization and accuracy. Thestatistical design involves testing of provisionally selected bulls, at least 20 to abatch, testing mating (a minimum of some 2000 randomly identified matesper bull spread over several districts or even states), and collection of the firstlactation records of at least 200 randomly chosen daughters per bull.
The principle of the test is to analyze the variance among the records,partition the genetic variance from the total variance, and work out thebreeding value of the bulls. The actual procedure practiced is to compare thestandardized records of the daughters of each bull with the daughters of allother bulls in the batch and estimating the breeding values of the bulls usingbest linear unbiased prediction (BLUP) or similar procedures. The bulls arethen ranked according to their breeding value for milk yield as well as fat andprotein yield and percentage (Sire Index). The top two or three bulls in eachbatch are used to produce the breeding stock for the next generation. This

46
process is continued generation after generation and brings in steady geneticimprovement in the population with each successive generation. Data on thecrossbred bull progeny-testing program from the KLDB are given in Table 1, anexample of the sire-evaluation programs for crossbred bulls in the country.
The steadily increasing milk yield of the test daughters is a measure of thegenetic progress in the population. The data on standard first lactation milkyield are presented in Figure 1. Milk yield is an additive genetic trait withthousands of gene pairs interacting in its inheritance and manifestation.Therefore, heterosis has very little role to play in these hybrids and their interse mating populations.
The behavior of the inter se mated populations of crossbreds in Keralawith regard to nonadditively inherited traits such as age at first calving, calvinginterval, and service period show higher variance over several generations ofinter se mating, but no decline in the mean values (Fig. 2). These traits shownot only some heterosis, but also the mitigating impact of selection onheterosis.
Sire Evaluation through Sibling Tests
With the advent of multiple Ovulation and Embryo Transfer (MOET), it isnow possible to produce genetically evaluated crossbred bulls for the AI
Table 1. Crossbred bull progeny test program in Kerala, 1977–2000.
Test Test Test TestBatch Year Bulls AI *Daughters Batch Year Bulls AI *Daughters
1 1977-78 10 4289 709 12 1989 39 76731 98312 1978-79 9 12657 1351 13 1990 40 75050 83603 1979-80 12 22416 2956 14 1991 39 62215 70904 1980-81 18 26001 3252 15 1992 40 58939 67595 1981-82 23 44704 4638 16 1993 43 63498 65746 1982-83 29 40221 4423 17 1994 51 62219 58437 1983-84 36 45415 5887 18 1995 38 41607 41248 1985-86 40 54174 7124 19 1996 38 39611 44469 1986-87 48 65646 8317 20 1997 26 Incomplete Incomplete10 1987-88 45 69682 9045 21 1998 44 Incomplete Incomplete11 1988-89 53 78206 9052 22 1999 39 Incomplete Incomplete
Notes: * Daughters born reported.
Source: Kerala Livestock Development Board Annual Report 1998-99 and 1999-00.

47
Figure 1. Mean milk yield of test daughters: standard first lactation.
Figure 2. General production traits of Sunandini cows (nonadditive inherit-ance).Notes: 1. AFC: Age at First Calving; CI: Calving Interval; SP: Service Period;
2. Data relate to institutional herds in the KLDB Farms at Mattupatty, Dhoniand Peermedu.
Source: KLDB Annual Reports 1998-99 & 1999-2000.
0
500
1000
1500
2000
2500
3000
3500
83 84 85 86 87 88 89 90 91 92 93 94 95 96 97 98
Years
Num
bers
kg-
1
Daughters Mean Yield
0
200
400
600
800
1000
1200
85 86 87 88 89 90 91 92 93 94 95 96 97 98 99Years
Day
s
AFC
Cl
SP

48
system in about half the time required under the conventional progeny testroute. MOET enables the production of several embryos per cow per year andtherefore many offspring per bull mother per year. It is thus possible toevaluate young bulls while they are growing up, using what is called a SiblingTest, based on the records of the number of contemporary full sisters (full-sibs) and half sisters (half-sibs). Using the Sibling Test it is possible to prove abull in less than 40 months while traditional progeny tests take up to 65months.
Generation interval being the denominator of the equation, genetic gainper generation would double when the generation interval is cut by half:
Im × Rm + If × Rfg / year = × √h2
Gm + GfWhere:
• Im and Rm are intensity of selection and accuracy of selection among males;• If and Rf are intensity of selection and accuracy selection among females;• Gm and Gf are generation interval among male and female; and• h2 is the heritability of milk production.
Other things being equal, the accuracy of the selection under Sibling Testin ONBS could be lower than that achieved under the progeny test, but this ismore than compensated for by the greatly reduced generation interval andtherefore the greater genetic gain per generation. The Sibling Test is a newtechnique and the accuracy of genetic evaluation in this test has yet to becorrelated with that under the progeny test. For this reason, bulls producedthrough Sibling Tests in ONBS must be put through conventional progeny testprocedures for at least the first ten batches. This is possible while the youngbulls are already in use for AI.
Selection of AI bulls through Sibling Tests in ONBS are of immenseimportance to the national crossbreeding program as it gives the program ahead start even in the absence of sires proven through progeny performance.This technique will provide genetically evaluated bulls in large numbers for theinter se breeding programs within four years of its inception.
The Sibling Test needs an open nucleus herd of donors (dams) of some100 elite breeding females from a selected Indian dairy breed (Sahiwal/RedSindhi/Gir), of which 20% move out and 20% move in each year. This herdcan be in a farm or preferably in a compact area of some 20 selected villages.Each year 32 dams from these are selected and divided into 8 sire families

49
(4 cows to each sire; exotic frozen semen from top proven Holstein/Jerseybulls from the world market). The dams are superovulated and inseminated toproduce about 16 embryos per cow. These are transferred to recipients in thefarm or the villages, resulting in 8 offspring per cow, 4 male, and 4 female.Each male under this arrangement will have 4 full sisters and 12 half sisters(probability).
Evaluation of the bull is based on the first records of the full and halfsisters, the available records of the dam, and breeding value of the sire. SiblingTests in ONBS are currently in operation only in the Sabarmati AshramGoshala, managed by the NDDB in Bidaj, Gujarat. So far three sets of bullshave been produced, of which the first set of siblings have completed theirfirst lactation. The first set comprises 4 exotic bulls, and 4 sire families, andyielded 143 offspring. Of these 11 bulls were selected and are now in semenproduction.
Artificial Insemination
Artificial insemination is the most significant scientific invention for increasinganimal productivity in the 20th century. This is still the only tool available tomankind for moving massive genetic payloads into populations and for rapidlyre-engineering the desired changes in their genetic architecture. Planned andsystematic use of AI, combined with the principles of quantitative genetics,has aided genetic improvement programs in bovines the world over withspectacular productivity gains. Although developed in the early part of the20th century, application of AI for breeding cattle began only in the late 1940sin developed countries. Large-scale use of AI in India started with the FirstFive Year Plan in 1951.
AI made a quantum leap when the technique of cryopreservation ofbovine semen was developed for commercial application in the late 1950s.The next major development occurred in the early 1980s, when MOET andthe many allied applications of embryo biotechnology such ascryopreservation, splitting, cloning, and sexing of embryos became routinelyavailable. The infrastructure for the development and application of thesetechniques is available in India.
India established its first large scale Frozen Bovine Semen ProductionStation in Mattupatty, Kerala in 1965. Extensive use of frozen bovine serumfor AI began here. Today virtually all AI carried out in India uses frozen semen.

50
In 1999 about 19 million AIs were carried out in the country by the statedepartments (5% of them in buffalo), 5 million AI by the milk cooperativesystem (3.3 million in cattle, 1.7 million in buffalo) and 0.5 million jointly byNGOs and other private AI practitioners.
Institutions for Technology Development and Deliveryof ServicesThe State Departments of Animal Husbandry and Dairy Development andthe Milk Producers’ Cooperative Unions are the institutions responsible fordevelopment and dissemination of AI technologies, and for training andhuman resources development. The Animal Sciences Research Institutesunder the ICAR and the State Agricultural Universities (SAUs) providesupport to the AI system.
India has perhaps the world’s largest AI network – over 40 thousand AIoutlets altogether – of which 28 thousand are owned by the government, 10thousand by the milk cooperatives, and the rest by NGOs and others. The 28thousand AI centers directly operated by the government departments arestationary centers where the farmer has to bring the animal for service. Thislimits their reach, covering approximately 500 adult females per center. Thecooperative sector AI centers are located in the village dairy cooperativesocieties and deliver AI at those premises within the village. Thenongovernmental, voluntary, and private sectors deliver AI to the farmer’sdoorstep.
In spite of such a vast spread of institutions the reach of the system islimited to less than 20% of adult females among cattle and less than 10% inbuffalo. The service is of poor quality and the conception rate is less than 20%.The bulls are not genetically evaluated and therefore, AI does not result insuperior progeny generation after generation. The central and stategovernments have recently reviewed the AI system and initiated a majorrestructuring of the entire cattle and buffalo breeding program, infrastructure,institutions and breeding operations in the country. The aim is to maximise thereturns on existing investments, to ensure that the system covers much largerpopulations of breeding animals, and creates genetically superior progenygeneration after generation. To this end, the Government of India has nowlaunched a National Project for Cattle and Buffalo Breeding.

51
Adoption of CrossbreedingAfter the initial slow start, crossbreeding spread throughout the country and inits wake brought problems of overzealous application and issues related tosustainability. The breeding policy prescribed by the government wasscientifically and environmentally appropriate, but the application of thepolicy was mismanaged by almost all states except Kerala, parts of Gujarat,and Andhra Pradesh. The adoption of crossbreeding across the country, andthe speed with which it spread, is clearly established in the successive roundsof the Livestock Census. Separate enumeration of crossbreds started only withthe 1982 Census round (Table 2).
The growth rate of the crossbreeds would have been much higher if theAI service in India was of higher quality. Eighty-five percent of the total 24.5million AIs are conducted to generate crossbreeds, but less than 20% of theseresult in pregnancies and even fewer calves are born.
Table 2. Growth in crossbred population.
1982 1987 1992
Population (million)
IndigenousTotal 180.3 188.3 189.3Adult female 55.7 56.4 56.7
CrossbredTotal 8.8 11.4 15.2Adult female 3.0 4.5 6.4
Compound annual growth (%)
IndigenousTotal - 0.9 0.1Adult female - 1.2 -0.03
CrossbredTotal - 5.9 5.9Adult female - 10.5 7.0
Source: Animal numbers are based on Census Tables of Livestock Census Rounds 1982, 1987, and 1992.
Growth rates for 1982-87 are derived from census figures.
Growth rates for 1987-92 are derived from tables in Basic Animal Husbandry Statistics 1997, AHS Series 6,
Department of A H & D, Government of India.

52
The demand for crossbreeding of cattle is high in all states exceptRajasthan and Gujarat, where the agroclimatic conditions are extremelyunsuitable for crossbred cattle to thrive. Also the indigenous breeds of cattle inRajasthan and Gujarat are some of the best dairy and draught breeds in Indiaand there is immense scope for their development through selective breeding.In states such as Kerala and Punjab crossbred cattle have virtually replaced theindigenous cattle and now account for 70% of the cattle population in Keralaand 80% in Punjab (Livestock Census 1997). The other states with largecrossbred cattle populations are Uttar Pradesh, Tamil Nadu, Maharashtra, andWest Bengal.
Impact of CrossbreedingThe impact of crossbreeding on the Indian economy and at the farm level isimpressive. However the enormous increase in milk production in the countryis more due to market pull, improved though discriminatory feeding practices,and increase in the number of animals.
Milk production in India increased from 19 million tonnes in 1951 to74.7 million tonnes by 1999. Of this, 55% comes from buffalo, cattleaccounting for only 41%. The projected population of crossbred cows in 2001is about 9.35 million and their estimated contribution to total milk productionis 10 million tonnes or 33% of the total cattle output. The contribution of themilk group to the total output value of the livestock subsector in 1998-99 wasRs 826.24 billion, with crossbred cattle contributing about Rs 110.61 billion.
At the farm level the impact is more dramatic as the milk yield increasein crossbred cows is three- to five-fold (Garcha and Dev, 1994; Venkita-subramanian and Fulzele 1996; Rao et al. 2000). The farmers profit from themuch higher output of milk and comparatively lower cost per unit of milkoutput. Yield increases and better breeding parameters in the crossbred cowsare universally accepted facts even under farm conditions.
While most states were indifferent to the prescribed breeding policyKerala had been following it strictly with commendable results. Punjabcompletely deviated from the central prescription and followed a policy of itsown, for progressive upgrading of the local cattle with Holsteins, taking intoaccount the quality of farmers in Punjab, and the resources available in thestate. Several years of this policy implementation endowed Punjab with ahighly productive population of cattle closer to the Holstein both inproduction traits and appearance.
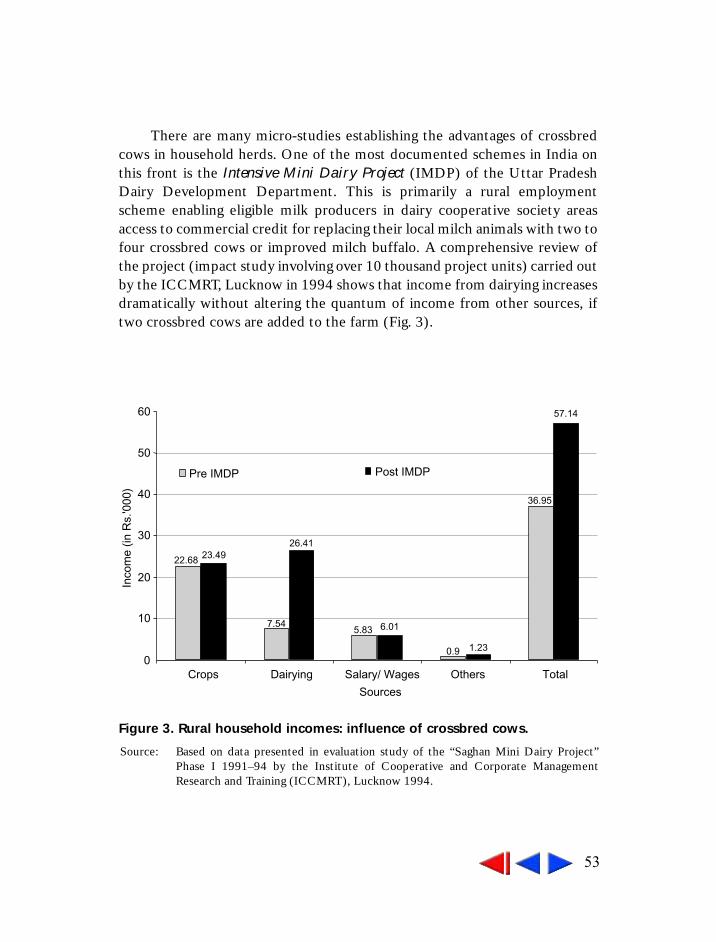
53
There are many micro-studies establishing the advantages of crossbredcows in household herds. One of the most documented schemes in India onthis front is the Intensive Mini Dairy Project (IMDP) of the Uttar PradeshDairy Development Department. This is primarily a rural employmentscheme enabling eligible milk producers in dairy cooperative society areasaccess to commercial credit for replacing their local milch animals with two tofour crossbred cows or improved milch buffalo. A comprehensive review ofthe project (impact study involving over 10 thousand project units) carried outby the ICCMRT, Lucknow in 1994 shows that income from dairying increasesdramatically without altering the quantum of income from other sources, iftwo crossbred cows are added to the farm (Fig. 3).
22.68
7.545.83
0.9
36.95
23.4926.41
6.01
1.23
57.14
0
10
20
30
40
50
60
Crops Dairying Salary/ Wages Others Total
Sources
Inco
me
(in R
s.'0
00)
Pre IMDP Post IMDP
Figure 3. Rural household incomes: influence of crossbred cows.
Source: Based on data presented in evaluation study of the “Saghan Mini Dairy Project”Phase I 1991–94 by the Institute of Cooperative and Corporate ManagementResearch and Training (ICCMRT), Lucknow 1994.

54
Farming Systems and Social DimensionsIn India milk is produced in over 70 million small, marginal, and landlessholdings scattered across the length and breadth of the country. The vastmajority of these holdings are comprised of mixed crop-livestock systems andfarmers keep livestock depending on the crop residues available. The stockholdings are tiny – two to three animals, cows, and/or buffalo per holding isthe modal holding size. Large holdings are seen only among the nomadicherders in Gujarat and Rajasthan; and in stables in cities such as Mumbai andKolkata. There are some specialized dairy farms among the smallholders, butthe numbers are very few and they are mostly in the peri-urban areas, dairycooperative society villages, or close to processing plants. Organized moderndairy farms also exist, but their numbers are far too small to express as apercentage of total holdings. Larger landowners tend to hold larger herds andthe stock holding size is larger as a rule in Punjab, Haryana, and Western UP.
Livestock holdings seem to be less skewed compared to land holdings andtherefore, gains from livestock production are more equitably distributed. In1977, the bottom 60% of the households in rural areas owned only 41% of thetotal milch animals. This inequity in the distribution of livestock appears to bedeclining over time. All-India Input Surveys in 1981–82 and 1986–87 indicatethat the share of the bottom 60% households in the ownership of bovinesincreased from 59 to 66% during this period (Table 3). By 1992, the small andmarginal farmers accounted for 62% of all rural households. They constitutedthe core of the milk production subsector and owned two-thirds of all milking
Table 3. Distribution of bovines according to size of land holding.
No. of holdings Area per No. of bovines (million) holding (ha) per holding
Size ofholding (ha) 1981–82 1986–87 1981–82 1986–87 1981–82 1986–87
< 1.00. 46.8 50.9 0.4 0.4 1.6 2.31.00-1.99 16.0 16.4 1.4 1.5 3.8 3.72.00-3.99 12.0 12.4 2.7 2.8 4.7 5.54.00-9.99 7.5 7.4 6.0 5.9 6.4 7.310.00 > 1.9 1.8 16.2 14.3 9.4 9.2All 84.1 89.0 1.8 1.7 3.3 3.7
Source: All India Input Surveys 1981-82 and 1986-87, vide “ Report of the Technical Committee of Direction for
Improvement of Animal Husbandry and Dairying Statistics”: AHS Series 4 1993.

55
animals. The more productive crossbred cows too seem to fit this distributionpattern. Many among the landless, who account for some 20% of ruralhouseholds, also own milch animals and participate in milk production.
Among all livestock in India, cattle are the most critical threat tosustainability as they account for the bulk of the livestock load on land.Production of work animals for the crop system was all along the excuse forthe relentless increase in overall cattle population size. With draught animalsbecoming increasingly redundant, this excuse is no longer valid. Even thoughthere is a decreasing trend in the cattle population over the last two decades,an increase in mechanization of farm operations and growing numbers ofhigher-yielding crossbred cows have not yet produced a matching reduction incattle numbers. Progressive replacement of the indigenous cattle populationby crossbreeds and cows of developed Indian dairy breeds would reduceoverall cattle numbers and improve sustainability. Crossbreeding ofnondescript indigenous cattle is thus a major solution to India’s oversizedcattle population.
Constraints in Adoption of Crossbreeding• The millions of tiny stock holdings across the country comprising two or
three animals per holding are a major constraint in the spread of newertechnologies. Fragmentation of these smallholdings year after year, reducingtheir size and viability, relentlessly pushes the smallholders below thepoverty line. This compels the state to invest increasingly larger resourceson poverty alleviation and livelihood protection measures. Often thebottom end of the smallholder spectrum is therefore unable to adopt newertechnologies without subsidy/credit support.
• There are huge and progressively widening gaps between supply anddemand of feed for livestock as shown by estimates over the last fifty years.These estimates are mostly inaccurate (population numbers grew two- tothree fold and output of all species grew four times between 1951 and1991). However it is a fact that feed resources in the country are scarce andinadequate. A reduction in bovine numbers, therefore, assumes highpriority in the policy framework.
• The common property resources have shrunk by 30% between 1950 and1990. What little is left can no longer support any meaningful livestockproduction, as it is in an advanced state of degradation, with scanty biomasscover and little or no maintenance.

56
• Almost all diseases of livestock, many of them already eradicated or undercontrol in the more developed countries, are still rampant in India.Livestock production is seriously hampered by the regular recurrence ofdevastating epidemics in all species throughout the country, leading toannual losses of over Rs 50 billion, thus denying India access to lucrativeglobal markets for animal products. Development of high-yielding milchanimals without adequate protection against disease is a very high-riskinvestment.
• All services in the livestock subsector such as veterinary services, AI, andproduction support are offered exclusively by the state departments ofanimal husbandry and are usually absolutely free. This overwhelminggovernment monopoly in delivery of free services has compromised qualityand accountability, and crowded out the emergence of free markets forthese services.
• The need to take the animals to the center for AI services limits its reachand coverage and also causes severe stress to the animal. Stress beinginconducive to pregnancy, is one of the major causes for low conceptionrates due to AI in India.
• Breeding of cattle is almost random, as 80% of the breeding females receiveno scientific or organized human intervention. The vast state government AInetwork currently covers less than 20% of the breeding female cattle andonly 10% of the buffalo.
• Use of unselected bulls for AI leads to progeny with virtually no geneticprogress from generation to generation.
• The apparent fertility problems in crossbred bulls seriously hamper theirselection. The rejection rate among crossbred bulls is as high as 40% andthere is no research support to mitigate the problem.
• Extension support to agricultural production was recognized as essentialwhen planned increases in agricultural production were initiated in the early1950s. Despite a promising start, by the end of the Third Five Year Plan,extension services degenerated into mere delivery of services by animalhusbandry departments. While a reasonably effective extension networkevolved in the crop production subsector nationwide, no such effort wasmade in the livestock subsector. Absence of a well-conceived extensionsupport system seriously undermined the pace of development under thedifferent plans.

57
• Sociocultural factors are a negative influence on dairy enterprise in thecountry. Culling of unproductive cattle is seldom undertaken, leading tolarge numbers in the population. Over 30% of the adult female cattle arenot fit for breeding. Lack of reforms in the alternate use of animals saps theIndian dairy industry of almost 40% of its supplementary revenue, greatlycompromising the interests of the dairy farmer.
• Accelerating livestock subsector development in India has to be balancedwith conservation of ecology, as livestock – particularly cattle – are a majorcause of environmental degradation. The relentless growth of the cattlepopulation far beyond the land’s capacity to support it is a threat that needswell-focused policy attention while exploiting livestock potential forlivelihood generation and alleviation of poverty.
ReferencesGarcha, D.S. and Dev, D.S. 1994. Factors affecting milk yield performance ofcrossbred cattle under field conditions of Punjab Journal of Dairying, Foods, andHome Science 13(1):48-32.
Rao, S.J., Rao, B.V.R. and Rao, G.N. 2000. Performance of crossbred cows andbuffalo under village conditions of Visakhapatnam district of Andhra Pradesh. IndianJournal of Dairy Science 53:3.
Venkitasubramanian, V. and Fulzele, R.M. 1996. Factors influencing productionperformances of cross and indigenous cattle under field conditions. Indian Journal ofDairy Science 49:5.

58
1. The American College, Madurai, Tamil Nadu.
Milk Production TMilk Production TMilk Production TMilk Production TMilk Production Technology and itsechnology and itsechnology and itsechnology and itsechnology and itsImpact on Dairying in TImpact on Dairying in TImpact on Dairying in TImpact on Dairying in TImpact on Dairying in Tamil Naduamil Naduamil Naduamil Naduamil Nadu
R A Christopher Dhas1
Technology has played an important role in the growth of the dairy economy ofTamil Nadu state (Kalamani 1984, Dhas 1990). High-yielding bovines havebeen introduced and the existing stocks are being improved by crossbreedingthrough artificial insemination (AI). Feeding practices have undergoneconsiderable changes to facilitate realization of the potential of crossbreedingtechnology. The paper examines these changes and their impact on milkproduction in the state.
Technological Change in the Dairy Sector
Changes in Breeding Technology
Crossbreeding of cattle and upgrading of buffalo are the main thrust of thebreeding policy, the rationale being that new breeds are more productive andtheir unit cost of milk production is lower than the local nondescript animals.Although crossbreeding of indigenous breeds with exotic breeds of cows andMurrah buffalo could be carried out naturally or by AI, the latter has beenemphasized in all dairy development programs.
The progress in diffusion of breeding technology is reflected in the trendsin the number of AIs done in the state. The Department of Animal Husbandryand the Milk Producers’ Cooperative Societies extend artificial inseminationfacilities to farmers. The former carries out about 75% of the AI. Those carriedout through milk cooperatives have increased from 10% in the early 1980s to25% in the mid-1990s. During this period, there was a steady increase in thenumber of AIs performed, from 1.5 million (1981–82) to 3.6 million in 1997–98 (Table 1).
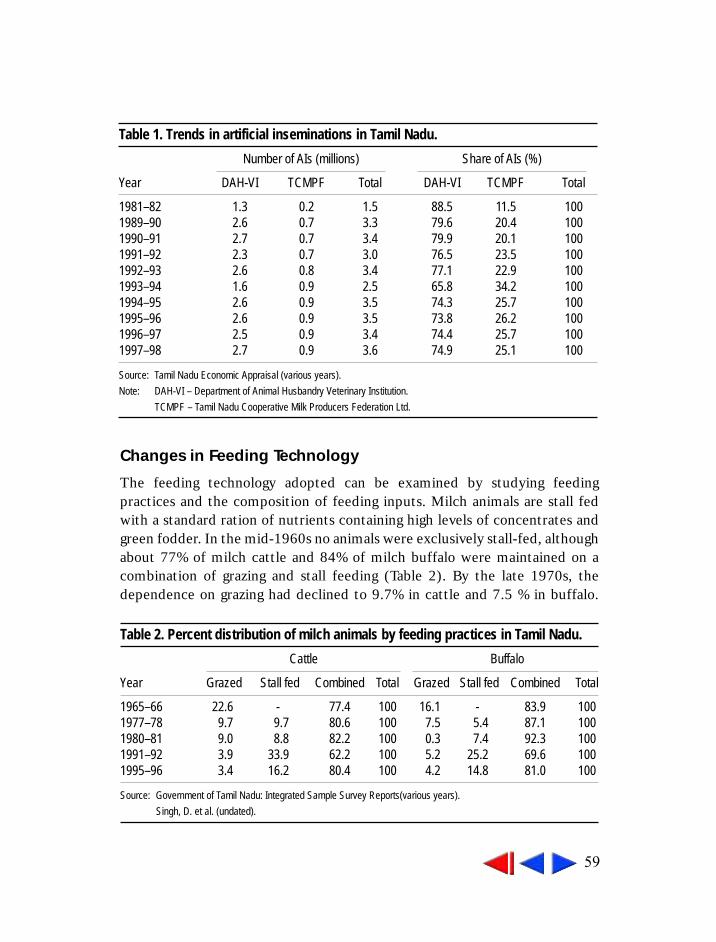
59
Changes in Feeding Technology
The feeding technology adopted can be examined by studying feedingpractices and the composition of feeding inputs. Milch animals are stall fedwith a standard ration of nutrients containing high levels of concentrates andgreen fodder. In the mid-1960s no animals were exclusively stall-fed, althoughabout 77% of milch cattle and 84% of milch buffalo were maintained on acombination of grazing and stall feeding (Table 2). By the late 1970s, thedependence on grazing had declined to 9.7% in cattle and 7.5 % in buffalo.
Table 1. Trends in artificial inseminations in Tamil Nadu.
Number of AIs (millions) Share of AIs (%)
Year DAH-VI TCMPF Total DAH-VI TCMPF Total
1981–82 1.3 0.2 1.5 88.5 11.5 1001989–90 2.6 0.7 3.3 79.6 20.4 1001990–91 2.7 0.7 3.4 79.9 20.1 1001991–92 2.3 0.7 3.0 76.5 23.5 1001992–93 2.6 0.8 3.4 77.1 22.9 1001993–94 1.6 0.9 2.5 65.8 34.2 1001994–95 2.6 0.9 3.5 74.3 25.7 1001995–96 2.6 0.9 3.5 73.8 26.2 1001996–97 2.5 0.9 3.4 74.4 25.7 1001997–98 2.7 0.9 3.6 74.9 25.1 100
Source: Tamil Nadu Economic Appraisal (various years).
Note: DAH-VI – Department of Animal Husbandry Veterinary Institution.
TCMPF – Tamil Nadu Cooperative Milk Producers Federation Ltd.
Table 2. Percent distribution of milch animals by feeding practices in Tamil Nadu.
Cattle Buffalo
Year Grazed Stall fed Combined Total Grazed Stall fed Combined Total
1965–66 22.6 - 77.4 100 16.1 - 83.9 1001977–78 9.7 9.7 80.6 100 7.5 5.4 87.1 1001980–81 9.0 8.8 82.2 100 0.3 7.4 92.3 1001991–92 3.9 33.9 62.2 100 5.2 25.2 69.6 1001995–96 3.4 16.2 80.4 100 4.2 14.8 81.0 100
Source: Government of Tamil Nadu: Integrated Sample Survey Reports(various years).
Singh, D. et al. (undated).

60
About 10% of cows and 5% of buffalo were exclusively stall-fed and the shareof animals that were grazed and stall-fed had also increased. During the 1990s,feeding practices changed significantly. About 3% to 4% of milch animals wereunder grazing system, 14% to 16% under stall-feeding system, and the restwere maintained under combined feeding system (grazing and stall-fed).
As the genotype of milch animals improved due to the breeding efforts,the resultant high-yielding breeds required better feeding and therefore stall-feeding had to be practiced. At the same time, due to population pressure theamount and quality of land available for grazing had been declining in the state.These aspects played a part in the decrease in dependence on grazing and theconcomitant shift in feeding practices.
Impact of Technological Change on Dairying
Breed Composition of Milch Animals
According to the various Livestock Censuses (1982, 1989, and 1994), thecattle population is divided into exotic, crossbred, native pure, and indigenousbreeds. Buffalo are similarly divided into Murrah, graded, and indigenousbreeds. Among cattle, exotic and crossbreeds are high yielding, while native(pure) and indigenous breeds provide both draught power and milk. Murrahand graded buffalo give high milk yields.
According to the 1994 Livestock Census, high-yielding breeds accountedfor about 21%, native-pure about 14% and indigenous breeds about 65% of thecattle population (Table 3). Only about 18% of the buffalo were high-yieldingstock and the remaining 82% were indigenous. Thus, the data indicate that thediffusion of high-yielding types of both cattle and buffalo was low in the state.
A comparison of the breed data of the 1994 Census with those of 1982and 1989 indicated only marginal changes in the breed composition. Theabsolute figures showed a reduction in the exotic, native-pure, and indigenouscattle population and an increase in the crossbred cattle population. In buffalothere was an absolute decline in numbers of all breeds during the early 1990s.While the share of crossbreeds in the total cattle population had increasedmarginally, there was no change in composition of the buffalo population. Thediffusion and adoption rate of crossbred cattle was thus relatively higher thanthat of graded buffalo. It must however be taken into account that thebreeding policy had focused on increasing milk production throughcrossbreeding of cattle, without much attention paid to buffalo.

61
Advanced breeding and feeding technologies have caused changes indistribution of milch animals by milk yield levels, lactation order, andproductivity levels.
Distribution of Animals by Milk Yield
In the mid-1960s, 86% of milch cows and 74% of buffalo were yielding less than2 kg of milk and only between 2–4% were yielding 4 kg and above. This patternof distribution of milch cows and buffalo then underwent a significant changeover time (Table 4). In the late 1970s and thereafter, the number of milchanimals giving lower milk yields had declined significantly. By the mid-1980sthere was a sharp increase in the number of animals yielding more than 4 kg ofmilk and a significant decline in the share of those yielding less than 2 kg.
The distributional changes in the milch animals could be partiallyaffected by the changes in the breed composition of cows. As exotic andcrossbred animals are high yielding and economical to maintain, an increase inthese would certainly alter the distribution of animals. Table 5 shows theextent of variation in the distribution of animals by yield rates across breedsand its trend over time. While a large number of indigenous cows aredistributed in the lower milk yield levels, most of exotic and crossbreeds are
Table 3. Trends in breed composition of bovines in Tamil Nadu, 1982–1994.
Composition ofComposition of cattle population (%) buffalo population (%)
Total TotalYear Exotic Crossbred NativePure Indigenous (million) Murrah Graded Indigenous (million)
Male1982 0.5 6.2 14.2 79.1 5.2 1.7 12.2 86.1 0.71989 0.1 7.9 12.5 79.5 4.3 2.0 11.9 86.1 0.51994 0.3 12.2 13.5 74.0 3.7 2.4 13.5 84.1 0.5
Female1982 1.0 9.5 14.4 75.1 5.2 1.8 13.1 85.1 2.51989 0.3 15.5 14.3 69.9 5.1 2.1 15.7 82.2 2.61994 1.8 24.5 15.0 58.7 5.4 2.0 16.0 82.0 2.4
Total1982 0.7 7.8 14.3 77.2 10.4 1.7 13.0 85.3 3.21989 0.2 12.0 13.5 4.3 9.4 2.0 15.1 82.9 3.11994 1.1 19.5 14.4 65.0 9.1 2.1 15.6 82.3 2.9
Source: Livestock Census Reports for the years 1982, 1989, and 1994.

62
Table 4. Distribution of milch animals by milk yields in Tamil Nadu.
Percentage distribution of animals by milk yield (kg day-1)
Year < 0.9 1-1.9 2-2.9 3-3.9 4+ Total
Cattle1965–66 64.2 21.8 7.6 4.4 2.0 1001977–78 18.4 34.2 15.1 10.4 21.9 1001980–81 9.2 38.5 28.5 15.1 8.7 1001985–86 12.7 21.2 21.6 16.6 27.9 1001990–91 1.7 4.8 34.6 28.9 30.0 1001995–96 2.0 6.7 25.0 17.4 48.9 100
Buffalo1965–66 46.0 28.2 12.8 8.7 4.3 1001977–78 6.5 23.2 27.9 22.0 20.4 1001980–81 4.6 19.5 33.7 18.7 23.5 1001985–86 5.2 13.7 28.7 24.3 28.1 1001990–91 1.5 4.9 26.8 43.5 23.3 1001995–96 0.7 5.0 20.5 26.9 46.9 100
Source: Compiled from the records of the TCMPF, Chennai.
Table 5. Distribution of cows by milk yields and breeds in Tamil Nadu.
Distribution of cows by milk yield (kg day-1)
Breed Year < 0.9 1-1.9 2-2.9 3-3.9 4-4.9 5+ Total
Indigenous 1991–92 2.4 28.5 62.6 6.3 0.2 - 1001992–93 2.6 31.1 45.1 20.7 0.5 - 1001993–94 4.0 27.9 41.9 17.7 6.6 1.9 1001994–95 3.6 27.0 44.2 16.9 7.1 1.2 1001995–96 4.6 15.0 47.7 25.0 4.8 2.9 100
Exotic and 1991–92 - - 4.1 27.8 64.2 3.9 100crossbred 1992–93 - 15.0 34.6 39.5 9.5 1.4 100
1993–94 - 0.7 2.4 8.1 20.5 8.3 1001994–95 - 0.8 2.9 8.2 20.6 7.5 1001995–96 0.3 1.6 11.2 13.0 17.7 6.2 100
Source: Integrated Sample Survey Reports, various years.
distributed towards higher yield levels. It is interesting to observe that theshare of exotic and crossbreeds yielding less than 1 kg of milk is almost nil.Moreover, in both indigenous and exotic/crossbred cows, the share of animalsyielding more than 4 kg had been increasing steadily.

63
Productivity of Milch AnimalsA survey conducted by the Indian Agricultural Statistics Research Institute(IASRI) showed that, in the mid-1960s, the average milk yield per day perlactating cow was about 1.2 kg and for female buffalo it was 2.0 kg (Table 6).The yield of buffalo was almost 60% higher than that of the cow. By the mid-1970s, the yield rates of cattle and buffalo showed a sharp increase (IntegratedSample Survey Reports). Furthermore, between 1977–78 and 1995–96, theyield of both species once again showed an increasing trend. The productivityof cows was 3.3 kg and of buffalo was 3.5 kg in 1995–96. A similar trend in themilk yield rates per lactating stock was also observed.
Interestingly, although the average milk yields per day of buffalo havebeen higher than that of cattle, the divergence between the yield rates hasbeen declining over time due to a faster growth in the yield of cattle. This isreflected in a steady upward trend in the yield ratio (yield of cow to buffalo).
Milk Production
According to the IASRI estimate, the total milk production in Tamil Nadu in1965–66 was about 0.87 million tonnes. The estimated milk production as perthe Integrated Sample Survey (ISS) Report was about 1.7 million tonnes in1977–78. Thus, within a period of about 13 years, the production of milk hadalmost doubled and the annual average growth rate was 7.2% (Table 7).
During the subsequent two decades beginning 1977–78 there was asteady increase in milk production and this trend was maintained with a
Table 6. Trends in milk yield per day per lactating animal / milch animal.
Milk yield (kg day-1)Yield ratio
per lactating animal per milch animal (cow / buffalo)
Year Cow Buffalo Cow Buffalo In milk Milch
1965–66 1.2 2.0 0.5 1.0 0.60 0.501977–78 1.9 2.5 0.7 1.2 0.76 0.581981–82 2.0 2.8 0.7 1.4 0.71 0.501985–86 2.5 3.5 1.5 2.2 0.71 0.681991–92 2.8 3.3 1.8 2.0 0.85 0.901995–96 3.3 3.5 2.0 2.2 0.94 0.90
Source: The same as for Table 2.

64
marginal decline in a few years. The total milk production during 1995–96 was3791 thousand tonnes, comprising of 60% cow milk and 40% buffalo milk. Ingeneral, a differential growth pattern and a shift in the composition of milkproduction were observed during the period. The growth of milk productionwas at the higher order up to the mid-1980s and slowed down thereafter. Theshare of cattle and buffalo milk remained steady up to the mid-1980s, anddecreased slightly thereafter.
Alhough the official estimates of milk production in Tamil Nadu providea broad understanding of the trends in milk production and its composition,there are some problems in using the data as such for an in-depth analysis.There are significant differences between the estimated number of milchanimals based on the ISS and the Livestock Census data. During 1966 and1982, the estimates of milch animals from the ISS were lower than thosereported in the Livestock Census; in 1989 and 1994, they were higher than thelatter, and the difference between them was minimal (4%) during 1977 (Table8). According to the Livestock Census, the total milch animals, both in-milkand dry, in the state were about 4.3 million in 1989, but the ISS estimated thisat 5.3 million; about 24% higher than the Census data. For other years also,similar discrepancies were observed. Moreover, while the Census showed anincrease in the population during 1982 over 1977, the ISS showed a decline.Since the ISS provided an underestimate of the number of milch animals insome years and an overestimate in other years, the difference between theCensus and ISS estimates varied significantly over time. Thus, to obtaincomparable estimates of milk production, it becomes imperative to re-estimate total milk production.
Table 7. Trends in milk production and its composition.
Total milk production(thousand tonnes) Composition of milk production (%)
Year Cow Buffalo Total Cow Buffalo Total
1965–66 458.0 411.0 869 52.7 47.3 1001977–78 894.4 785.6 1680 53.2 46.8 1001980–81 906.1 831.9 1738 52.1 47.9 1001985–86 1818.8 1299.6 3118 58.3 41.7 1001990–91 2021.6 1353.1 3375 59.9 40.1 1001995–96 2273.5 1517.4 3791 60.0 40.0 100
Source: The same as for Table 2.

65
To obtain a comparable unbiased estimate of milk production, the data onthe number of milch animals that were lactating were taken from LivestockCensus reports. The average yield per lactating animal from ISS reports andthe total milk production in the state were estimated for the Census years.Table 9 shows the revised estimates of milk production in Tamil Nadu.
Total milk production in the state had increased from about 1.0 milliontonnes in 1966 to 2.4 million tonnes in 1982. The rates of growth of milk
Table 8. Comparison of milch animal populations from the Livestock Census andIntegrated Sample Surveys.
1966 1977 1982 1989 1994
.................................... (millions) ...............................Census Cattle 2.5 2.6 3.0 2.8 2.9
Buffalo 1.1 1.4 1.5 1.5 1.3Total 3.6 4.0 4.6 4.3 4.2
ISS Cattle 2.0 2.8 2.4 3.5 3.0Buffalo 0.9 1.4 1.2 1.9 1.7Total 3.0 4.2 3.7 5.3 4.7
Difference (Census–ISS) Cattle 0.4 –0.2 0.6 –0.6 –0.1Buffalo 0.2 0.1 0.3 –0.4 –0.4Total 0.7 –0.2 0.9 –1.0 –0.5
% difference Cattle 17.9 –8.0 19.8 –22.8 –2.8Buffalo 21.0 3.6 19.1 –25.9 –28.6Total 18.8 –4.0 19.6 –23.8 –10.9
Source: (i) Livestock Census, Tamil Nadu, 1966, 1977, 1982, 1989, and 1994.
(ii) Integrated Sample Survey Reports, various years.
Table 9. Revised estimates of milk production in Tamil Nadu: Trends andcomposition.
Milk production Composition of milk production(thousand tonnes) (%)
Year Cattle Buffalo Total Cattle Buffalo Total
1966 531.9 491.9 1024 52.0 48.1 1001977 937.1 (6.9) 786.9 (5.5) 1724.0 (6.2) 54.4 45.6 1001982 1301.1 (7.8) 1046.3 (6.6) 2347.4 (7.2) 55.4 44.6 1001989 1759.3 (5.0) 1191.1 (2.0) 2950.4 (3.7) 59.6 40.4 1001994 2199.3 (5.0) 1193.4 (0.04) 3392.7 (3.0) 64.8 35.8 100
Note: Figures in brackets indicate annual average growth rates.

66
production were found to be much faster from the mid-1970s than earlier.Since the early 1980s growth rate has begun declining. The growth rate ofbuffalo milk production was lower than that for cattle.
A structural change in the composition of milk production has takenplace. In the mid-1960s, the share of cattle and buffalo milk to the total milkproduction was almost equal. Over time, this composition changedsignificantly in favor of cattle. Comparison of the trends in the composition ofthe milch animal population and milk production provides significant insights.In the mid-1960s, the number of milch buffalo was only about 25% of thetotal milch bovines, but it contributed about 50% to the total milk production.By the 1990s, the number of milch buffalo had increased to 31% of the total,but the share in milk production declined to 35%.
During 1966–77, the share of cattle milk to the increase in total milkproduction was 57.9 %, which increased to 67.0% during 1977–89 (Table 10).Obviously, the relative contribution of buffalo had declined steadily, while thecontribution of cattle had increased.
In this context, it is important to examine the contribution oftechnological change to growth in milk production. This growth could beinfluenced either by an increase in the milch animal population, orproductivity, or both. The additive decomposition model developed by Minhasand Vaidyanathan (1965) has been used to analyze the relative contribution ofthese factors to the growth in total milk production:
Mt – Mt-1 = (Pt – Pt-1)Yt-1 + (Yt – Yt-1) Pt-1 + (Pt – Pt-1) (Yt – Yt-1)
‘M’ refers to total milk production of a species‘P’ refers to in-milk population‘Y’ refers to average yield of in-milk population‘t’ and ‘t-1’ refer to the terminal and base years respectively.
Table 10. Contribution of cattle and buffalo to the increase in milk production.
Increase in total milk production (%)
Year Cattle Buffalo
1966–77 57.9 42.11977–89 67.0 33.01989–94 99.5 0.51966–94 70.4 29.6

67
The left-hand side of the equation refers to the growth in milkproduction. The right hand side of the equation has three terms. The first termrefers to the population effect, the second refers to the yield effect, and thelast term refers to the interaction effect. By population effect we mean thecontribution of changes in the milch animal population to the growth of milkproduction while the yield level is assumed unchanged. The yield effect refersto the contribution of changes in the yield while the population is assumed toremain unchanged. The interaction effect refers to the contribution due tochanges in both population and yield. The results are given in Table 11.
The dominant factor contributing to the growth in milk production wasthe productivity of the milch animals. About 52% of the growth in bovine milkproduction between 1966 and 1994 was due to yield effect, 22% topopulation growth and the remaining due to their interaction. The dominanceof the yield effect was observed in the case of both cattle and buffalo.
A comparison of the relative contributions of the sources of growth in theproduction of cattle and buffalo milk revealed that, although yield was themajor contributing factor to the growth in milk production during 1966–77, adifferential pattern was seen over time. In the case of cattle milk production,yield was the major contributing factor during 1966–77, but declined insubsequent periods, while the population effect kept on strengthening. In thecase of buffalo milk, the contribution of yield consolidated over time and thepopulation effect weakened.
There was a boom in the spread of AI in the 1980s, which slowed downin the following decade. A decrease was seen in the dependence on grazing anda shift in feeding practice from grazing to stall-feeding. A marginal change took
Table 11. Relative contribution (%) of different factors to the growth of milk production.
Output Source of contribution 1966–77 1977–89 1989–94 1966–94
Bovine milk Population effect 25.5 28. 6 44.8 21.9Yield effect 63.4 59.4 51.8 51.8Interaction effect 11.1 12.1 3.5 26.3
Cattle milk Population effect 18.2 24.2 62.4 19.0Yield effect 71.9 62.5 32.6 50.8Interaction effect 10.0 13.3 5.1 30.2
Buffalo milk Population effect 39.6 36.7 - 25.0Yield effect 48.8 53.2 - 55.3Interaction effect 11.6 10.0 - 19.7

68
place in the breed composition of milch animals towards crossbred animals,indicating the slow diffusion and partial success of crossbreeding technology inthe state. Distribution of animals shifted from low to high milk yield levels,and from animals of higher orders of lactation to lower orders of lactation. Theproductivity of milch animals witnessed a steady increase during the period,reflecting the positive contribution of technological change to milk outputgrowth.
Alhough milk production had shown a steadily increasing trend from theearly 1980s to the mid-1990s, the growth rate had reduced sharply. Astructural change in the composition of milk production had taken place in thestate. The dominant factor contributing to the growth in milk production wasthe productivity of the animals. The relative contribution of population effecton the growth of cattle milk production increased and that of yield declinedover time. On the other hand, in buffalo the contribution of populationshowed a steady decline and that of yield an increase over time. These trendscould largely be attributed to changes in the breeding and feedingtechnologies.
ReferencesDhas, A.C. 1990. Structure of Milk Production in Tamil Nadu: An Analysis of Trendsand Sources of Growth. In Resources, Institutions and Strategies: Operation Floodand Dairying. (Doornbos and Nair, eds.). Indo-Dutch Studies on DevelopmentAlternatives-4, Sage Publications, New Delhi.
Government of Tamil Nadu. Various years. Livestock Census Reports. Directorate ofEconomics and Statistics, Government of Tamil Nadu, Chennai.
Government of Tamil Nadu. Various years. Report on the Integrated Sample Surveys.Directorate of Economics and Statistics, Government of Tamil Nadu, Chennai.
Kalamani, A. 1984. Comparative Efficiency of Milk Production of Crossbred andNondescript Cows and Murrah Graded in Sulur Block, Coimbatore District.M.A.Thesis (unpublished) Department of Economics, PSG College of Arts andScience, Coimbatore.
Minhas, B.S., and Vaidyanathan, A. 1965. Growth of Crop Output in India (1951–52to 1958–61): An Analysis by Component Elements. Indian Journal of AgriculturalStatistics 17(2).
Singh, D. et al. (undated). Sample Survey for Estimation of Milk Production andStudy of Bovine Practices. Report of a survey conducted in Tamil Nadu state during1965–66. Institute of Agricultural Research Statistics, New Delhi.
69
1. Central Institute of Agricultural Engineering, Nabi Bagh, Berasia Road, Bhopal – 462 038, India.
Impact of Mechanization on Draught AnimalImpact of Mechanization on Draught AnimalImpact of Mechanization on Draught AnimalImpact of Mechanization on Draught AnimalImpact of Mechanization on Draught AnimalPower Use in AgriculturePower Use in AgriculturePower Use in AgriculturePower Use in AgriculturePower Use in Agriculture
Gyanendra Singh1
Before the introduction of new technologies (modern seeds, chemicalfertilizers, and pesticides) in the mid-1960s, draught animals (particularlymale cattle) were the major source of motive power (tractive and rotary) forIndian agriculture. Increasing use of new technologies led to expansion of areaunder crops and intensive use of land. This demanded more draught power toensure timeliness in field operations. The draught animals were not capable ofmeeting the increased demand and thus machines were introduced/used to fillthe gap. Machines subsequently replaced the draught animals for various farmoperations such as irrigation and threshing (Singh 1992 and 1996). Further,with increasing subdivision of land holdings, maintaining draught animalsbecame an uneconomical proposition for small landholders. These farmerstherefore prefer custom hiring of tractors, threshers, and power tillers tomaintaining draught animals. Custom hiring of tractor-drawn tillageequipment is now an accepted practice in many parts of the country. Thispaper investigates the trends in use of draught animal power vis-à-vismechanical power in Indian agriculture.
The Process of MechanizationDuring the last thirty years the net cultivated area has remained more or lessstagnant (138–142 million ha), while the gross cropped area has increased to189 million ha. The average size of holdings is 1.6 ha, with 79% of holdingsbelow 1.3 ha. Indian farmers have been dependent on draught animal powerfor irrigation, threshing, transport, tillage, sowing, and cultivation. As croppingintensity has increased, animate power has been found inadequate to maintainschedules, and has been supplemented by mechanical power sources (tractors,

70
engines, and electric motors). Tillage, irrigation, and threshing operations,which require higher energy and are arduous to perform, are gradually beingperformed using mechanical power. Small farmers in agriculturally backwardregions are still using the traditional animal-operated country plow.
Table 1 shows trends in the numbers of bullock-operated implementssuch as steel plow, puddler, disc harrow, sprayer and duster, spring tine harrow,and sowing devices since the early 1970s. The numbers of traditionalimplements such as wooden plows, cane crushers, Olpad thresher, Persianwheels, and bullock carts have either remained almost unchanged or decreasedmarginally, while those of improved implements such as the steel plow andpuddler have increased.
Human Power
Human power is predominantly used for sowing, transplanting, fertilizerapplication, harvesting, and digging. Use of human power is likely to continuein hilly regions, diara lands, smallholdings, and in areas where mechanizationhas not been adopted. The population of agricultural workers has grown from97.2 million in 1951 to 186.5 million in 1991 (Table 2), so human power inagriculture is available in plenty.
Table 1. Trends in the numbers of bullock-drawn implements.
Implements 1971–72 1976–77 1981–82 1986–87 1991–92
.................................................. (millions) ...........................................Wooden plow 39.3 41.0 43.0 43.0 39.6Steel plow 5.4 6.5 6.7 8.9 9.6Disc harrow – – 3.4 1.2 2.3Cultivator – – 4.3 5.0 5.3Puddler 1.7 2.1 2.3 3.3 2.4Sowing devices 4.1 4.9 5.6 6.5 6.7Leveling karaha 4.0 9.0 10.5 8.7 9.6Olpad thresher – – 0.4 0.4 0.3Cane crusher 0.7 0.8 0.7 0.7 0.8Persian wheel 0.6 0.6 0.5 0.3 0.2Bullock cart 13.0 12.7 13.7 14.4 13.4Sprayer and duster 0.4 1.6 1.6 1.7 2.6
Source: Livestock Census, 1977, 1982, 1987 and 1992.

71
Draught Animal Power
Draught animal power (DAP) is used for crop production and transportation.Bullock and male buffalo over three years of age are the main draught animalsfor field operations. India possesses famous draught breeds of cattle such asNagori, Khilari, Helikar, Amrit Mahal, Kangayam, Malvi, Hariana, Gir, Angol,Tharparkar, and Gaulao. Adult male and female camels are used for fieldoperations and for transport, but their population is estimated at less than 1%of total draught animals. The population of draught animals declined from80.8 million in 1971–72 to about 77.7 million in 1991–92 (Table 3). Thepower availability too declined from 20.2 mkW to 19.4 mkW during thisperiod.
Tractors
There were only 8635 tractors in use in 1951. Local tractor production beganin 1961–62 with 880 tractors. Today, India manufactures more than 265 000tractors per year. Different sizes of tractors are manufactured in India, rangingfrom less than 15 kW to more than 37.5 kW, but the most popular range is15–30 kW.
Table 2. Population dynamics of agricultural workers.
Type of workers 1951 1961 1971 1981 1991
Total population (millions) 361.1 439.2 549.0 685.2 846.3Agricultural workers (millions) 97.2 131.1 126.0 151.7 186.5Agricultural workers’ power (mkW) 4.9 6. 6 6.3 7.6 9.3
Source: Agricultural Statistics at a Glance, 1995.
Note: Capacity: 0.05kW/person.
Table 3. Trends in the population of draught animals for field operations.
Animal 1961–62 1971–72 1981–82 1986–87 1991–92
Total (millions) 77.8 80.8 68.4 70.4 77.7Cattle (millions) 70.7 73.2 61.1 63.6 70.3Buffalo (millions) 7.1 7.6 7.3 6.8 7.4DAP (mkW) 19.5 20.2 17.1 17.6 19.4
Source : Livestock Census 1972,1982, 1987 and 1992.
Capacity: Bovine-0.25 kW/animal.

72
Power Tillers
Power tillers were introduced in the country in the 1960s, but did not becomeas popular as the tractor due to limitations in the field and on the road, andergonomic weaknesses. Power tillers are presently used more in rice andsugarcane-producing areas of Tamil Nadu, Andhra Pradesh, Kerala, Karnataka,West Bengal, Orissa, Bihar, and Maharashtra. The annual production wasabout 14,000 units in 1999–2000. The potential power availability isestimated to be 0.66 mkW (Table 4).
Diesel Engines and Electric Motors
These are used for stationary operations, especially the lifting of water forirrigation and operating grain mills, oil ghanis, sugarcane crushers, powerthreshers, and chaff cutters. The number of irrigation pumps has increasedfrom 0.11 million in 1951–52 to about 15.3 million in 1996–97. As a result,the gross irrigated area increased from 22.6 to 70.6 million ha. Governmentsupport through financial incentives for irrigation hardware has played animportant role in this growth. The electric pumps are preferred in electrifiedareas due to lower recurring cost. In 1996–97 the number of electric motorsused for irrigation was 9.7 million with potential power availability of 36.3mkW, and that of diesel engines was 5.6 million with potential poweravailability of 30.2 mkW (Table 5).
Farm power per unit area is one of the parameters used for expressing themechanization status. The total farm power availability in 1951–52 was 0.20kW ha-1, which increased to 1 kW ha-1 in 1996–97 (Table 6). Human andanimal power contributed 60% of the total farm power in 1971–72 and
Table 4. Trends in mechanical tractive power.
Tractive power 1961–62 1971–72 1981–82 1991–92 1996–97*
Tractor (millions) 0.03 0.15 0.52 1.23 1.82Power tiller (millions) - 0.02 0.08 0.10 0.11Total power (mkW) 0.70 3.44 12.18 28.4 41.70
Source: Livestock Census Reports.
Automobile Association of India.
* Estimated capacity: Tractor-22.5 kW, Power tiller-6.5kW.

73
Table 5. Trends in the number of irrigation pumps.
Mechanical power 1951–52 1961–62 1971–72 1981–82 1991–92 1996–97
Electric pump (millions) 0.02 0.1 1.6 4.3 8.9 9.7Diesel pump (millions) 0.08 0.2 1.6 3.1 4.7 5.6Power (mkW) 0.47 1.6 14.1 32.3 56.5 65.3
Source: Livestock Census Reports.
Capacity: Electric motor-3.73 kW, Diesel engine-5.2 kW.
Table 6. Farm power availability per unit net cropped area.
Power 1961–62 1971–72 1981–82 1991–92 1996–97
Total farm power (mkW) 28.3 44.1 69.1 113.6 136.3Unit farm power (kW ha-1) 0.2 0.3 0.5 0.8 1.0% draught animal power 68.8 45.8 24.7 17.1 14.1
Table 7. Share of farm power sources.
Total power (mkW)
Power source 1971–72 1996–97
Human 6.3 (14.2) 10.1 (7.4)Animal 20.2 (45.8) 19.2 (14.1)Mechanical and electrical 17.6 (40.0) 107.0 (78.5)Total farm power 44.1 136.4
Note: Figures in brackets are percent of the total power.
mechanical and electrical together contributed only 40% (Table 7). In 1996–97 the contribution from human and animal power was reduced to 21%, andthe contribution of mechanical and electrical power increased to 79%.However, in terms of area coverage, draught animals continue to dominate(Table 8). About 55% of the area is dependent on draught animals. One-fifthof the area uses mechanical power. The remainder, especially shiftingcultivation, hilly land, and waterlogged areas is cultivated by human power.
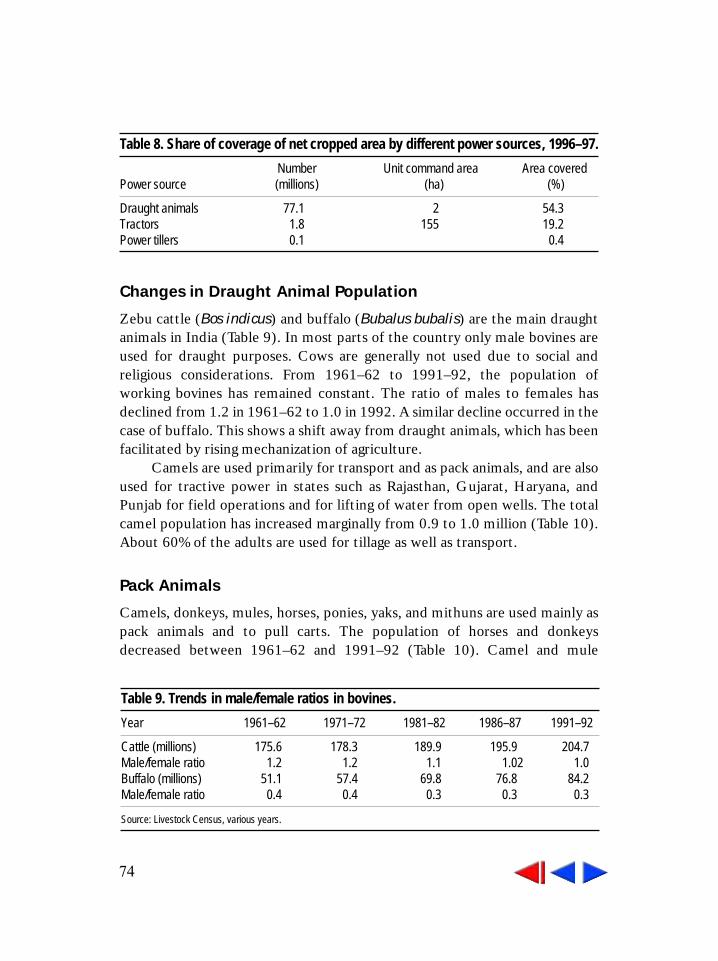
74
Changes in Draught Animal Population
Zebu cattle (Bos indicus) and buffalo (Bubalus bubalis) are the main draughtanimals in India (Table 9). In most parts of the country only male bovines areused for draught purposes. Cows are generally not used due to social andreligious considerations. From 1961–62 to 1991–92, the population ofworking bovines has remained constant. The ratio of males to females hasdeclined from 1.2 in 1961–62 to 1.0 in 1992. A similar decline occurred in thecase of buffalo. This shows a shift away from draught animals, which has beenfacilitated by rising mechanization of agriculture.
Camels are used primarily for transport and as pack animals, and are alsoused for tractive power in states such as Rajasthan, Gujarat, Haryana, andPunjab for field operations and for lifting of water from open wells. The totalcamel population has increased marginally from 0.9 to 1.0 million (Table 10).About 60% of the adults are used for tillage as well as transport.
Pack Animals
Camels, donkeys, mules, horses, ponies, yaks, and mithuns are used mainly aspack animals and to pull carts. The population of horses and donkeysdecreased between 1961–62 and 1991–92 (Table 10). Camel and mule
Table 8. Share of coverage of net cropped area by different power sources, 1996–97.
Number Unit command area Area coveredPower source (millions) (ha) (%)
Draught animals 77.1 2 54.3Tractors 1.8 155 19.2Power tillers 0.1 0.4
Table 9. Trends in male/female ratios in bovines.
Year 1961–62 1971–72 1981–82 1986–87 1991–92
Cattle (millions) 175.6 178.3 189.9 195.9 204.7Male/female ratio 1.2 1.2 1.1 1.02 1.0Buffalo (millions) 51.1 57.4 69.8 76.8 84.2Male/female ratio 0.4 0.4 0.3 0.3 0.3
Source: Livestock Census, various years.

75
populations showed positive growth. The total population of adult pack animalsfor work in 1961 was 3 million, but this declined to 2.5 million in 1992. Thefarmers’ preference for faster modes of mechanical transport such as tractor,Maruta (local improvised four-wheel transport), and the mini-truck for haulageis one of the reasons for a decrease in the population of pack animals.
Draught Animals and Size of Land Holdings
Table 11 shows the distribution of draught animals across size groups of landholdings. Although all groups of farmers possess draught animals, the areacommanded by a pair of animals on semi-medium, medium, and large farmholdings is very large, indicating that owners of these holdings may not be in aposition to perform farm operations on schedule. Marginal and small farmershave a lower area per animal pair, but the ownership of draught animals islimited.
Table 10. Changes in the populations of pack animals.
Animal 1961–62 1971–72 1981–82 1986–87 1991–92
..................................................... (millions) ...................................................Horses 1.3 1.0 0.9 0. 8 0.8Camels 0.9 1.1 1.1 1.1 1.0Mules 0.1 0.1 0.13 0.2 0.2Donkeys 1.1 1 1 1.0 1.0Yaks 0.02 0.04 0.12 0.04 0.1Total 3.4 3.1 3.2 3.0 3.0
For work 3 2.5 2.32 2.2 2.5
Source: Livestock Census, various years.
Table 11. Distribution of draught animals according to size of farm holding, 1986–87.
Farm holdings (ha)
Marginal Small Semi-medium Medium Large AllInputs <1 1–2 2–4 4–10 10 sizes
Draught animals (millions) 26.0 16.3 14.7 11.1 3.2 71.3Ha animal pair-1 1.6 2.9 4.6 7.9 15.8 4.1Farmers possessing
pair of animals (%) 23.1 45.5 55.6 70.2 84.4 36.7
Source: Input Survey 1987-88, Ministry of Agriculture.

76
Animal Energy Use in Crop ProductionThe animal energy used in crop production, computed from the information inthe Cost of Cultivation of Principal Crops in India operated by the Ministry ofAgriculture, Government of India, is shown in Table 12. There has been adecrease in use of animal energy for all crops since 1971–72. A maximumdecrease of 5% per annum was recorded in wheat, 3% in sugarcane, and 2.8%in pulses. On average, there has been a gradual reduction in use of animalenergy. It has been reduced from 159 pair hours ha-1 in 1971–72 to 109 pairhours ha-1 in 1991–92. This indicates that although the population of draughtanimals has not changed much over time, their utilization has declinedconsiderably.
ConclusionsMale cattle and buffalo are the chief sources of DAP for field operations.Although use of mechanical and electrical power has increased, draught
Table 12. Trends in animal energy utilization.
Crops 1971–72 1975–76 1981–82 1986–87 1990–91
Paddy 197 197 198 188 157Wheat 187 213 128 91 71Sorghum 121 90 90 100 103Pearl millet 71 65 61 51 103Maize 146* 134 125 113 103Gram 138* 138 108 102 83Pigeon pea 146* 146* 146 87 83Groundnut 122 131 135 123 93Rapeseed and mustard 105* 105 88 75 93Soybean 145* 145 109 108* 93Sugarcane 135* 135 101 75 74Cotton 113 101 90 101 62Jute and mesta 241 235 203 203 229Potato 162* 162* 162 120 n. a.#
Onion 173 173 191 127 n. a.#
Weighted average 159 147 139 123 109
Note: * Previous or following year’s data used.
# Data of all the crops not available.
Data for coarse cereal (103), pulses (83) and oil seeds (93) combined for the year 1990–91.
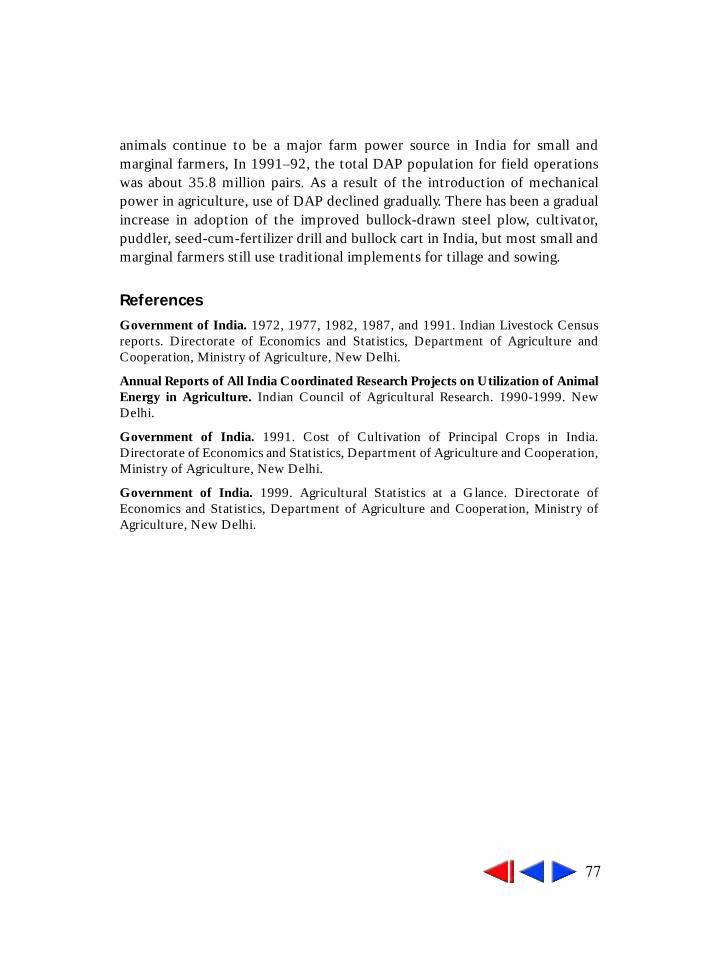
77
animals continue to be a major farm power source in India for small andmarginal farmers, In 1991–92, the total DAP population for field operationswas about 35.8 million pairs. As a result of the introduction of mechanicalpower in agriculture, use of DAP declined gradually. There has been a gradualincrease in adoption of the improved bullock-drawn steel plow, cultivator,puddler, seed-cum-fertilizer drill and bullock cart in India, but most small andmarginal farmers still use traditional implements for tillage and sowing.
ReferencesGovernment of India. 1972, 1977, 1982, 1987, and 1991. Indian Livestock Censusreports. Directorate of Economics and Statistics, Department of Agriculture andCooperation, Ministry of Agriculture, New Delhi.
Annual Reports of All India Coordinated Research Projects on Utilization of AnimalEnergy in Agriculture. Indian Council of Agricultural Research. 1990-1999. NewDelhi.
Government of India. 1991. Cost of Cultivation of Principal Crops in India.Directorate of Economics and Statistics, Department of Agriculture and Cooperation,Ministry of Agriculture, New Delhi.
Government of India. 1999. Agricultural Statistics at a Glance. Directorate ofEconomics and Statistics, Department of Agriculture and Cooperation, Ministry ofAgriculture, New Delhi.

78
1. Indian Veterinary Research Institute, Izatnagar 243 122, UP, India.
Livestock TLivestock TLivestock TLivestock TLivestock Technologies forechnologies forechnologies forechnologies forechnologies forSmall Farm SystemsSmall Farm SystemsSmall Farm SystemsSmall Farm SystemsSmall Farm Systems
H P S Arya, M P Yadav and R Tiwari1
India is endowed with huge livestock populations of various species. It hasabout 300 million bovines, which are used to produce milk, draught power,and dung manure. There are about 180 million small ruminants that providemeat and fiber. The animal productivity is, however, far below the worldaverage. Malnutrition and poor health are the two most important constraintsto raising animal productivity. Animals primarily feed on crop residues andcommon grazing lands. Supplementation with green fodder and concentratefeed is inadequate. Public sector animal health and breeding infrastructure hasseen unrestrained growth, but the delivery of these services is poor. Theemphasis in health services is on curative treatment rather than on preventivemanagement. As a result, many fatal diseases that have been eradicatedelsewhere in the world are rampant among Indian livestock. This indicates thatthere is considerable scope to raise productivity of Indian livestock throughtechnological and policy interventions. Accordingly, the aim of this paper is todocument the livestock technologies available for field applications.
Livestock Production under Small Farm SystemsIndia is predominantly a country of small farms, which account for nearlythree-fourths of the total milk and meat production. More than 70% of ruralhouseholds possess one or two large animals or 2 to 5 small animals such as thegoat, pigs, and poultry. Animals are largely maintained on crop residues. Largeanimals are partially stall-fed and partly grazed on community land. Smallanimals are maintained solely on grazing. Their movements are not controlledand they are free to mix with other animals. Most small livestock holders donot have proper housing facilities for animals. The animals are either keptoutdoors or indoors with the humans. Some farmers maintain thatched orpucca sheds for large animals.
Small holders rarely apply scientific technology for breeding, feeding,health care, or management. They are unable to isolate or suitably care for sick
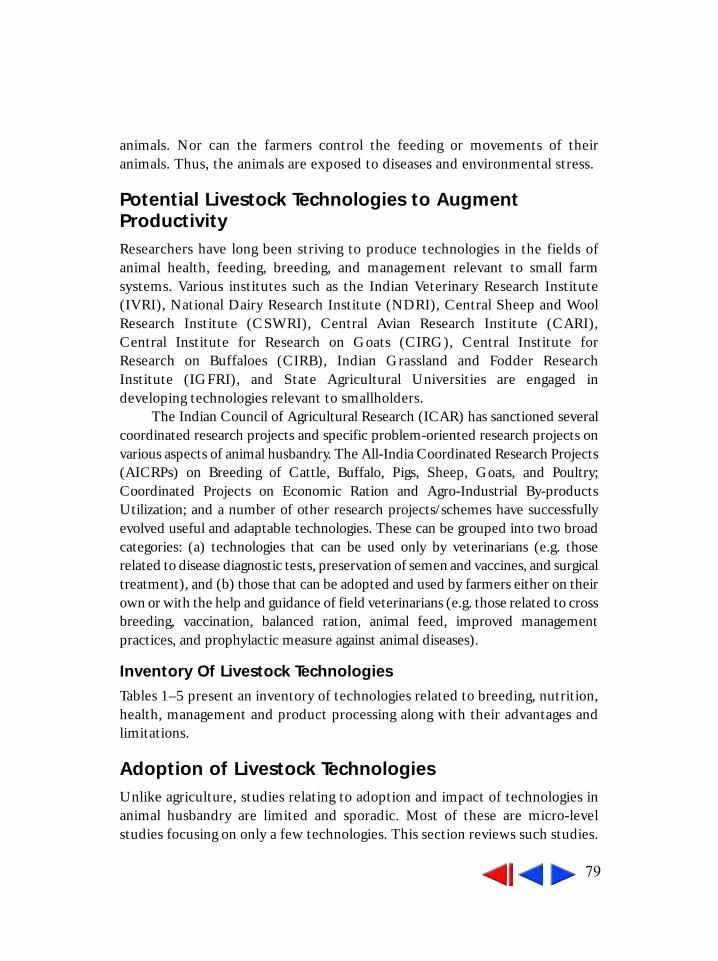
79
animals. Nor can the farmers control the feeding or movements of theiranimals. Thus, the animals are exposed to diseases and environmental stress.
Potential Livestock Technologies to AugmentProductivityResearchers have long been striving to produce technologies in the fields ofanimal health, feeding, breeding, and management relevant to small farmsystems. Various institutes such as the Indian Veterinary Research Institute(IVRI), National Dairy Research Institute (NDRI), Central Sheep and WoolResearch Institute (CSWRI), Central Avian Research Institute (CARI),Central Institute for Research on Goats (CIRG), Central Institute forResearch on Buffaloes (CIRB), Indian Grassland and Fodder ResearchInstitute (IGFRI), and State Agricultural Universities are engaged indeveloping technologies relevant to smallholders.
The Indian Council of Agricultural Research (ICAR) has sanctioned severalcoordinated research projects and specific problem-oriented research projects onvarious aspects of animal husbandry. The All-India Coordinated Research Projects(AICRPs) on Breeding of Cattle, Buffalo, Pigs, Sheep, Goats, and Poultry;Coordinated Projects on Economic Ration and Agro-Industrial By-productsUtilization; and a number of other research projects/schemes have successfullyevolved useful and adaptable technologies. These can be grouped into two broadcategories: (a) technologies that can be used only by veterinarians (e.g. thoserelated to disease diagnostic tests, preservation of semen and vaccines, and surgicaltreatment), and (b) those that can be adopted and used by farmers either on theirown or with the help and guidance of field veterinarians (e.g. those related to crossbreeding, vaccination, balanced ration, animal feed, improved managementpractices, and prophylactic measure against animal diseases).
Inventory Of Livestock TechnologiesTables 1–5 present an inventory of technologies related to breeding, nutrition,health, management and product processing along with their advantages andlimitations.
Adoption of Livestock TechnologiesUnlike agriculture, studies relating to adoption and impact of technologies inanimal husbandry are limited and sporadic. Most of these are micro-levelstudies focusing on only a few technologies. This section reviews such studies.

80
Table 1. Breeding technologies. Technology
Advantage
Remarks To be used by:
Artificial Insemination Genetic improvement of animals to increase milk yields
Farmers with the help of veterinarians
Frozen semen technology Semen of proven sires can be preserved for a long period, transported easily and utilized to upgrade Desi or nondescript animals
Veterinarians at their own level
Kool pack system to screen bulls for semen freezing under field conditions
Useful for veterinary practitioners Veterinarians at their own level
Crossbreeding of Landrace and indigenous breeds of pigs with 50% exotic blood
Obtaining crossbreeds for higher production potential of the animal
Farmers
Crossbreeding zebu cows with exotic semen (Holstein Friesian, Brown Swiss, and Jersey breed) to obtain 50% exotic blood
Increased milk yield and other parameters
Farmers with the help of veterinarians
Inter se mating of 50% crossbred cows with progeny-tested halfbreed bulls
Increased milk yield -do-
Selective breeding in buffalo with Murrah and Nili Ravi breeds
Increased milk yield -do-
Treatment of chronic anestrus in animals Makes useless animals reproductively useful
-do-
Treatment of chronic repeat breeding -do- -do- Timely examination and treatment of subclinical reproductive inefficiency
Timely conception leads to higher production.
-do-
Pregnancy diagnosis within 60-90 days after insemination
Reduces the dry period -do-
Service on 90-120 days after parturition -do- -do-
Insemination during mid-heat preferably twice during the same heat
Increased breeding efficiency -do-
Observing animals for sign of heat Timely conception Farmers at their own level
Observing animals for symptoms of pregnancy after service/insemination
-do- -do-
Feeding of green fodder and concentrates during advanced pregnancy
Improves animal health and production -do-
Taking care of animals at the time of parturition
-do- -do-
Parturition in a clean place Maintaining hygiene leads to good animal health and production
-do-
Arranging materials at the time of parturition
-do- -do-
Keeping watch on the dropping of the placenta
-do- -do-
Disposal of placenta Maintaining hygiene leads to good animal health
-do-
Drying the cows two months before parturition
Good animal health and production -do-
Freezing of semen by "Tupol" Effective semen freezing Veterinarians Superovulation of cows and goats to harvest large numbers of embryos
Large number of embryos per flushing Scientists, breeders, and veterinarians

81
Studies reveal varying levels of different livestock technologies. Kakoty(1975) observed a very high adoption of improved breeding and diseasecontrol practices, while the adoption of feeding and management practiceswas low.
Several studies have reported that protective vaccination againstcontagious diseases, fodder feeding, clean watering, and proper shelter foranimals are the technologies having the highest adoption percentages. AI hasbeen partially adopted at some places and not at others. Practices such asdehorning calves, castrating young calves, use of improved fodder seeds,crossbreeding, balanced feeding, and scientific milking have had very lowadoption levels. (Singh 1978; Halyal et al. 1980; Sohal and Kherde 1980;Ramkumar 1989; Singh 1989).
Furthermore, some technologies are suitable for smallholders, whileothers are more suited to the large farmers. Sohal (1976) reported thatspacious housing and year-round fodder production are more likely to beadopted by resourceful dairy farmers. Practices like taking special care of the
Table 2. Feeding technologies. Technology
Advantage
Remarks To be used by:
Urea-molasses liquid feed (UMLF) UMLF supplies 50-60% of protein and energy requirement of growing cattle and cows yielding less than 10 kg milk daily and buffaloes yielding less than 6 kg milk daily
Farmers
Enrichment of low-grade roughage with urea-molasses.
Economic gain of Rs 60/- to Rs 84/- per 100 kg of wheat straw.
-do-
Urea enrichment of straw Increase in milk yield from 0.5-1.5 litres animal-1 day-1. Better growth performance and animal health
-do-
Urea-Molasses Mineral Block Useful for feed-scarce areas -do-
Urea-Molasses impregnated dry roughage
-do- -do-
Balanced compounded animal feed Improvement in animal health -do-
Changing ration during pre- and postnatal periods
High production -do-
Regular feeding of mineral mixture Proper health, growth and production -do-
Use of industrial by-products and crop residues as animal feed
Economy in input use -do-
Year-round production and feeding of high quality green fodder.
Better health & economy in growth and production
-do-
Drinking water to animals from a hygienic source.
Better animal health and production -do-
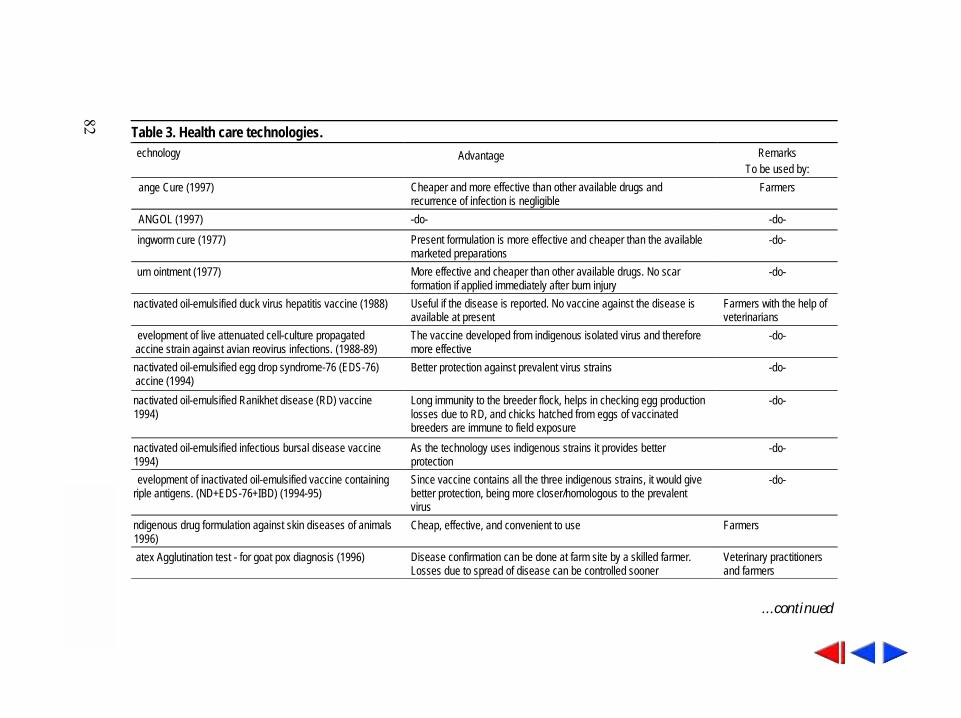
82
Table 3. Health care technologies. echnology Advantage
Remarks To be used by:
ange Cure (1997) Cheaper and more effective than other available drugs and recurrence of infection is negligible
Farmers
ANGOL (1997) -do- -do-
ingworm cure (1977) Present formulation is more effective and cheaper than the available marketed preparations
-do-
urn ointment (1977) More effective and cheaper than other available drugs. No scar formation if applied immediately after burn injury
-do-
nactivated oil-emulsified duck virus hepatitis vaccine (1988) Useful if the disease is reported. No vaccine against the disease is available at present
Farmers with the help of veterinarians
evelopment of live attenuated cell-culture propagated accine strain against avian reovirus infections. (1988-89)
The vaccine developed from indigenous isolated virus and therefore more effective
-do-
nactivated oil-emulsified egg drop syndrome-76 (EDS-76) accine (1994)
Better protection against prevalent virus strains -do-
nactivated oil-emulsified Ranikhet disease (RD) vaccine 1994)
Long immunity to the breeder flock, helps in checking egg production losses due to RD, and chicks hatched from eggs of vaccinated breeders are immune to field exposure
-do-
nactivated oil-emulsified infectious bursal disease vaccine 1994)
As the technology uses indigenous strains it provides better protection
-do-
evelopment of inactivated oil-emulsified vaccine containing riple antigens. (ND+EDS-76+IBD) (1994-95)
Since vaccine contains all the three indigenous strains, it would give better protection, being more closer/homologous to the prevalent virus
-do-
ndigenous drug formulation against skin diseases of animals 1996)
Cheap, effective, and convenient to use Farmers
atex Agglutination test - for goat pox diagnosis (1996) Disease confirmation can be done at farm site by a skilled farmer. Losses due to spread of disease can be controlled sooner
Veterinary practitioners and farmers
...continued

83
Technology
Advantage
Remarks To be used by:
Experimental kit for maintaining the immune response against Newcastle (Ranikhet) Disease vaccination in chicks (1994)
Centrifuge and electricity not required, hence most suitable for field conditions
Veterinary practitioners
Experimental kit for monitoring the immune response against infectious Bursal Disease vaccination in chicks (1994)
The plates can be prepared at the farm, hence most suitable for field conditions
-do-
Plant molluscicide for control of aquatic pulmonate snails (1987)
Eradication of intermediate snail host which results in eradication of diseases such as Fascioliasis and Amphistomiasis
Farmers
Rinderpest tissue-culture vaccine Good protection against disease Farmers with the help of veterinarians
Foot and Mouth Disease (FMD) tissue-culture polyvalent vaccine
-do- -do-
Hemorrhagic Septicemia (HS) Oil-adjuvant vaccine -do- -do-
Anthrax spore vaccine -do- -do-
Black Quarter (BQ) vaccine -do- -do-
BPL inactivated rabies vaccine -do- -do-
Tissue culture sheep pox vaccine -do- -do-
Goat pox vaccine -do- -do-
Lungworm pneumonia vaccine -do- -do-
Contagious caprine pleuropneumonia vaccine -do- -do-
Vaccine against infectious bronchitis in poultry -do- -do-
Modified live virus Rabies vaccine - Flury LEP (CEO) -do- -do-
Vaccine against Marek's disease in poultry -do- -do-
Vaccine against infectious laryngotrachitis -do- -do-
Lapinised swine fever vaccine -do- -do-
Table 3. Continued.
...continued

84
Technology
Advantage
Remarks To be used by:
B. abortus strain-19 vaccine -do- -do-
Salmonella abortus equi vaccine -do- -do-
Enterotoxemia vaccine Provides good protection against disease -do-
Fowl Pox vaccine (Chick Embryo Living Virus) -do- Farmers with the help of veterinarians
Fowl Cholera vaccine -do- -do-
Theileria Schizont vaccine -do- -do-
Horn Plate for internal fixing of long bone fracture in animals Effective and speedy healing of bone joint and wound Veterinary practitioners
COFAL test kit for diagnosis of avian leukosis Effective and speedy diagnosis of disease -do-
ELISA kit for diagnosis of FMD Virus -do- -do-
Timely treatment of sick animals Avoidance of economic losses through reduced morbidity and mortality
Farmers with the help of veterinarians
Identifying a sick animal Timely treatment of animals leading to better animal health and productivity
Farmers
Isolating the sick animals Preventing the healthy stock from disease and infection -do-
Observing the ectoparasites in animals at regular intervals Better animal health and production -do-
Regular deworming of animals Better animal health and production -do-
Year of release in parentheses wherever available
Table 3. Continued.

85
calves and feeding of good quality grass during periods of scarcity have a betterchance of adoption by smaller farmers. Some other technologies, such as AIand pregnancy diagnosis, are almost uniformly applicable to all categories offarmers. A study conducted in the Karnal district of Haryana found that“feeding rations for milk production” by landless agricultural laborers,marginal farmers, small farmers, and medium farmers was a highly suitableinnovation. On the other hand, vaccination against hemorrhagic septicemia(HS), rinder pest (RP), foot and mouth disease (FMD), black quarter (BQ)and anthrax was found to be most suitable for adoption by large farmers.
Sohal (2000) identified a number of constraints related to the adoptionof various livestock technologies. He reported that the presence ofunimproved bulls, males of crossbreeds, poor conception rates, andunavailability of AI facilities on farm are all constraints to adoption of breedingtechnologies. Unavailability of fodder seed, mineral mixture, and compoundcattle feeds at convenient places, and their high costs, are the constraints in
Table 4. Livestock products processing technologies. Technology
Advantage
Remarks To be used by:
Use of rabbit meat to prepare different products (sausages, patties, meatballs, kababs)
Economic profitability since the technology offers delicacy meat products. Employment generation
Farmers
Boiling of milk Kills germs and makes milk safe for human consumption
Preparation of milk products (paneer, ghee, butter, shrikhand, cheese, rabri, rasgulla, sandesh, yogurt.)
Increased economic profitability leads to increased employment
-do-
Preparation of various mutton and buffalo meat products (tikka, kabab, meatballs, curry, keema, samosa, sausages.)
Increased economic profitability and employment generation
-do-
Tenderisation of buffalo meat Increase in sale value of meat and meat products
-do-
Preparation of various chicken meat products (curry, tandoori chicken, butter chicken, fried chicken, cutlets, sausages.)
Increased economic profitability and employment generation
-do-
Preparation of various pork meat products (curry, mince, Hamburger patties.)
Increased economic profitability and employment generation
-do-
Preparation of various fish products (fish papad, pickle, dried fish, fish curry, fish cutlets, pakora, fried fish.)
Increased economic profitability and employment generation
-do-
Preparation of various egg products (egg roll, boiled egg, fried egg, egg pickle, cakes.)
Increased economic profitability and employment generation
-do-

86
adoption of feeding technologies. The unavailability and high cost of medicineand absence of precise advice on cheap and comfortable housing are the mainconstraints to animal health and improved management practices.
Livestock Technologies and Small Production SystemsA number of technologies that are technically feasible under experimentalconditions do not find wide acceptance among the final users because amajority of the users is either unaware of the technologies or unable to meetthe requirements to make the technologies a success. Technologists attributenon-adoption or poor adoption to the inability of the extension systems to
Table 5. Management technologies. Technology
Advantage
Remarks To be used by:
Early colostrum feeding to calves Reduces calf mortality Farmers
Regular control of parasitic infestations Increase in the number of healthy calves and adults
-do-
Milk feeding according to recommended schedules
-do- -do-
Milk replacer feeding Reduced cost of calf rearing -do-
Spacious housing with proper drinking water facilities
Savings in labor and increased production -do-
Periodical spraying of sheds against parasites
Better health, growth, and production -do-
Cleanliness of animals, sheds, utensils and workers
Avoidance of infections and diseases -do-
Culling of animals of lower productivity Increased profitability -do-
Crossbred bullocks for draught purposes Low priced -do-
Dehorning Avoidance of injury and horn diseases -do-
Proper record keeping Economic efficiency ensured -do-
Cleaning the nostrils and body of newborn calves
Reduces calf mortality and maintains health -do-
Maintaining regularity in feeding and milking
Better animal health and production -do-
Right method of milking (full hand milking) Avoids injury to teats and leads to higher production
-do-
Castration of male calves Higher productivity and easy to control -do-
Weaning of cattle/buffalo calves Clean milk production and profitability -do-
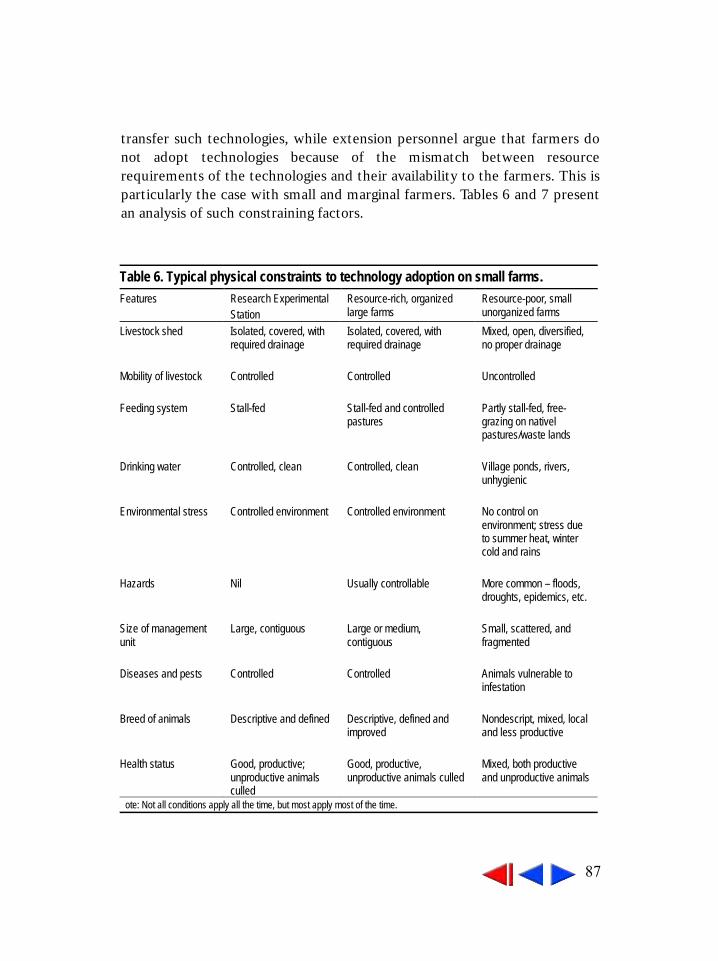
87
transfer such technologies, while extension personnel argue that farmers donot adopt technologies because of the mismatch between resourcerequirements of the technologies and their availability to the farmers. This isparticularly the case with small and marginal farmers. Tables 6 and 7 presentan analysis of such constraining factors.
Table 6. Typical physical constraints to technology adoption on small farms. Features
Research Experimental Station
Resource-rich, organized large farms
Resource-poor, small unorganized farms
Livestock shed Isolated, covered, with required drainage
Isolated, covered, with required drainage
Mixed, open, diversified, no proper drainage
Mobility of livestock Controlled Controlled Uncontrolled Feeding system Stall-fed Stall-fed and controlled
pastures Partly stall-fed, free-grazing on nativel pastures/waste lands
Drinking water Controlled, clean Controlled, clean Village ponds, rivers,
unhygienic Environmental stress Controlled environment Controlled environment No control on
environment; stress due to summer heat, winter cold and rains
Hazards Nil Usually controllable More common – floods,
droughts, epidemics, etc. Size of management unit
Large, contiguous Large or medium, contiguous
Small, scattered, and fragmented
Diseases and pests Controlled Controlled Animals vulnerable to
infestation Breed of animals Descriptive and defined Descriptive, defined and
improved Nondescript, mixed, local and less productive
Health status Good, productive;
unproductive animals culled
Good, productive, unproductive animals culled
Mixed, both productive and unproductive animals
ote: Not all conditions apply all the time, but most apply most of the time.

88
Issues In Livestock Technology Generation andAdoptionAnimal science research has generated a number of useful technologies thatcan be gainfully adopted by farmers. The adoption level of most of thetechnologies is very low. The major reasons for the low level of adoption are:• High cost of available technologies.• Lack of awareness among the users (farmers).• Lack of training in the proper use of technology.• Technology is not situation- or farmer-specific.• Inadequacy of veterinary facility for livestock in rural areas.• Lack of adequate, organized processing and marketing facilities for animal
products.• Side effects of technology.• Absence of field-testing and refinement of technology.
This analysis has questioned the appropriateness of livestocktechnologies under small farming systems prevailing in India. The alternativesare either to change the conditions as per the requirement of technology,which of course is impossible, or to generate technology appropriate to theresource-poor, risk-prone, diversified, and scattered small production units.
Table 7. Typical social and economic constraints to technology adoption on small farms. Feature
Research Experimental Station
Resource-rich, organized large farms
Resource-poor, small unorganized farms
Access to livestock feeds, medicines, etc.
Unlimited, reliable High, reliable Low, unreliable
Tested quality semen High quality High quality Low quality, unreliable,
lack of accessibility Drinking water and grazing pastures
Fully controlled Controlled Uncontrolled or controlled by others
Access to credit/cash Unlimited Good access Poor access and shortage
when most needed Labor Unlimited Limited, hired Family labor, constraints
on occasion Prices Irrelevant Lower for inputs
Higher for outputs Higher for inputs Lower for outputs
Appropriateness of technology generated on research station
Very high by definition High Very low

89
Generation of technology appropriate to such conditions is possible onlythrough two approaches:• Generation of technology through on-farm experimentation at the site and
on the animals under small farming system units – which is difficult and notalways possible.
• Generation of technology at the research stations and its subsequent assess-ment and refinement through experimentation in collaboration with thefarmers.
The lack of established and standardized methodology for assessmentand refinement of livestock technology and for conducting experimentation atthe unorganized scattered small farm units needs to be viewed seriously.Research needs to be diverted to the design and development of suchmethodologies and approaches under participatory modes. Proper recognitionand necessary incentives to the scientists, as well as farmers, would encourageparticipatory research.
ReferencesHalyal, K.G., Chetani, L.M., and Popat, M.N. 1980. Adoption of improved animalhusbandry practices in ICDP of Junagarh district. Rural India 100:225-227.
Kakoty, H.N. 1975. A study on the impact of ICDP on adoption of improved dairypractices by farmers around Guwahati city. M.Sc. Thesis (Unpub.), Jawaharlal NehruKrishi Vishwa Vidyalaya, Jabalpur.
Ramkumar, S. 1989. Adoption pattern of selected animal husbandry practices by dairyfarmers: An extensive study. Journal of Educational Research and Extension.25(4):192-197.
Singh, J. 1978. A study of some selected factors affecting adoption of dairy innovationby different categories of dairy farmers in the milkshed areas of Ludhiana milk plant.M.Sc. Thesis (Unpub.) NDRI, Karnal.
Singh, S. 1989. A study of differential level of knowledge and adoption of adoptedvillage of dairy extension division, NDRI, Karnal. M.Sc. Thesis (Unpub.), NDRI, Karnal.
Sohal, T.S. 1976. Dairy farming technology for small, marginal, and agriculturallaborers. Paper presented at National Seminar on Agricultural Technology andExtension Strategy for Small and Marginal farmers, PAU, Ludhiana.
Sohal, T.S. 2000. Constraints in the transfer of technology in livestock sector. Paperpresented in Summer School on “Animal Husbandry & Veterinary ExtensionEducation”, May 8-28, IVRI, Izatnagar.
Sohal, T.S. and Kherde, R.L. 1980. A study of dairy adoption behaviour of small andmarginal farmers in Punjab. Indian Journal of Extension Education 16(142):84-88.

90
1. Central Avian Research Institute, Izatnagar 243 122, Uttar Pradesh.
TTTTTechnological Developmentsechnological Developmentsechnological Developmentsechnological Developmentsechnological Developmentsin the Poultry Subsectorin the Poultry Subsectorin the Poultry Subsectorin the Poultry Subsectorin the Poultry Subsector
Raj Vir Singh, V K Saxena, and D Sharma1
The emergence of the modern poultry industry in India has its roots inbackyard poultry farming. It began with the introduction of scientific poultryfarming by a few Christian missionary organizations towards the end of thenineteenth century with imports of some improved poultry breeds from theircountries. However, systematic efforts to develop the poultry industry onscientific lines began postindependence. In the last five decades (1950 to2000), egg production increased from 2.8 million to 30,000 million. Similarly,broiler production too witnessed considerable growth. The tremendousgrowth in the poultry subsector is a result of application of moderntechnologies and growth of commercial poultry farming. There are now 60thousand poultry farms under modern intensive systems of management. Theindigenous fowl, however continues to play the key role in backyard poultry,and more than 100,000 families have flocks ranging from 5–250 birds.
The per capita availability of poultry products is considerably low; 30eggs and 500g meat per annum as against the requirement of 160 eggs and 10kg meat per annum. The growing human population and sustained growth inper capita income will fuel higher growth in demand for eggs and poultrymeat. There is thus a considerable potential for development of the poultrysubsector in the country.
Extensive research has been carried out in various areas of poultryproduction such as breeding, nutrition, health care, and management. Thepaper briefly discusses the research achievements in the poultry subsector, andidentifies future research thrusts to accelerate its growth.
91
Development of the Poultry IndustryCommercial poultry farming began under the first Five Year Plan (1951–55)with the establishment of 33 extension centers for providing improved breedsto interested farmers. The second Five Year Plan gave further impetus tobackyard poultry farming in rural areas and commercial farming in urban areas.In subsequent Five Year Plans poultry developments efforts were furtherstrengthened with aid from foreign agencies such as United States Agency forInternational Development (USAID) and United Nations DevelopmentProgram (UNDP), and collaborations with foreign hatcheries.
Research InfrastructurePoultry research is conducted in both the public and private sectors. In thepublic sector, ICAR, the apex organization for agricultural research in thecountry plays the key role in poultry research and development (R&D)activities. Research is carried out through its institutes such as the CentralAvian Research Institute (CARI) and Indian Veterinary Research Institute(IVRI), Izatnagar project directorate, and also through 26 State AgriculturalUniversities (SAUs), and two veterinary universities. Other public sectorinstitutions that contribute are Central Poultry Breeding Farms (CPBF),Central Food Technology Research Institute (CFTRI), and Animal HusbandryDepartments of state governments. In the private sector the research focus ison pure-line breeding of layers and broilers, development of compoundedfeed, vaccines, and biologicals. Various poultry equipment such as incubators,hatchers, and farm equipment are also manufactured by private sectoragencies.
Technological ChangeDevelopment of Superior Germplasm
Commercial Layers and Broilers
Production of superior germplasm was the main focus of poultrydevelopment. Since the indigenous fowl was central to backyard farming,initial efforts aimed at genetically improving the indigenous stock. Later, thelarge-scale import of elite poultry stock as grandparents by the private sector,and as pure lines by the public sector, opened the way for commercial poultry

92
farming. The incorporation of elite stock provided poultry breeders with achoice and resulted in a substantial increase in poultry meat and eggproduction. Initially, White Leghorn was imported for egg production, and thebreed was further improved through the family-selection method.
Subsequently, Rhode Island Red (RIR) populations were imported andother criteria for selection such as part-period production and egg mass wereused for improvement. Rock and Cornish breeds were imported for crossingand selection to improve broiler production. Multi-trait selection indexprocedures were also used for selecting the better genotype in layers andbroilers. The specialized selection and breeding programs such as ReciprocalRecurrent Selection (RRS), modified RRS and diallele were employed forselecting parent lines suitable for hybrid production.
The Central Avian Research Institute (CARI) explored possibilities forbringing an overall improvement in poultry productivity. A number of purebreeding programs were established at CARI, at different centers of the All-India Coordinated Research Project (AICRP) on poultry and at SAUs fordevelopment of superior germplasm of layers and broilers. The pure lines werethen used for production of high-yielding hybrids. High-performing syntheticbroiler stocks were also developed at the Punjab Agricultural University,Ludhiana (PAU), and CARI. As a result different superior layer and broilerstocks evolved and were released for use by the commercial poultry industry(Table 1).
Backyard Poultry Farming
The indigenous poultry population is approximately 70 million, with annualegg production of 55-60 eggs per hen and egg weight of 40 g. Early efforts forimprovement of the indigenous fowl failed due to the introduction of high-yielding commercial stocks. There is now a new concept of “Phenotypicreplica of indigenous fowl” in backyard poultry farming for improvingproductivity. A number of crossbred stocks resembling indigenous fowls havebeen developed (Table 2). Also, CARI has contributed significantly to theconservation and improvement of indigenous germplasm.
Testing and Evaluation of Germplasm
The superior stocks developed have undergone intensive testing by poultrybreeders, large private hatcheries, nongovernmental organizations (NGOs),
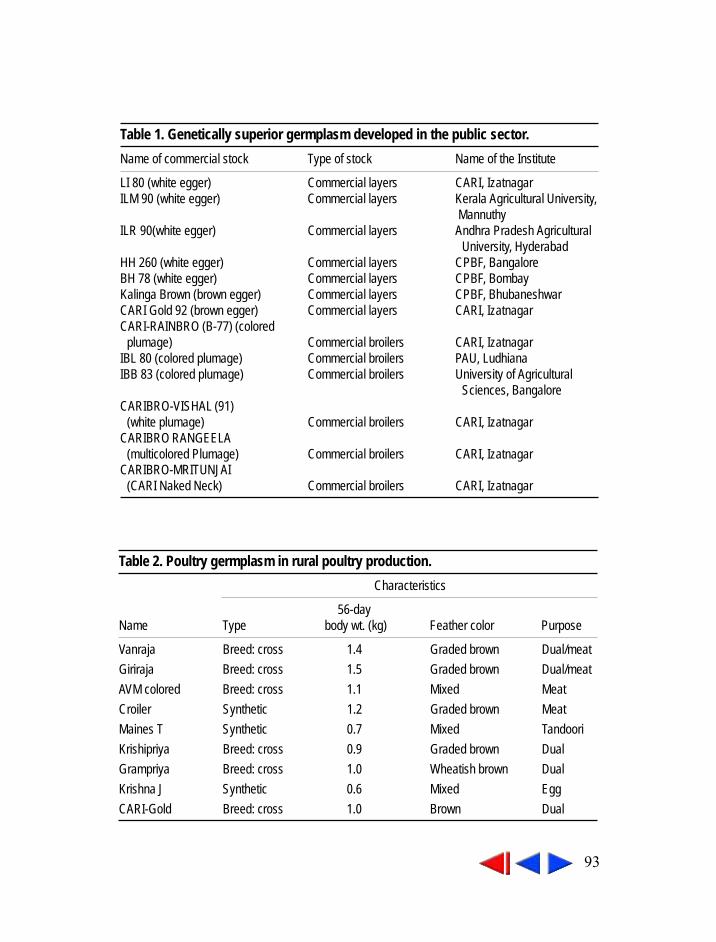
93
Table 1. Genetically superior germplasm developed in the public sector.
Name of commercial stock Type of stock Name of the Institute
LI 80 (white egger) Commercial layers CARI, IzatnagarILM 90 (white egger) Commercial layers Kerala Agricultural University,
MannuthyILR 90(white egger) Commercial layers Andhra Pradesh Agricultural
University, HyderabadHH 260 (white egger) Commercial layers CPBF, BangaloreBH 78 (white egger) Commercial layers CPBF, BombayKalinga Brown (brown egger) Commercial layers CPBF, BhubaneshwarCARI Gold 92 (brown egger) Commercial layers CARI, IzatnagarCARI-RAINBRO (B-77) (colored
plumage) Commercial broilers CARI, IzatnagarIBL 80 (colored plumage) Commercial broilers PAU, LudhianaIBB 83 (colored plumage) Commercial broilers University of Agricultural
Sciences, BangaloreCARIBRO-VISHAL (91)
(white plumage) Commercial broilers CARI, IzatnagarCARIBRO RANGEELA
(multicolored Plumage) Commercial broilers CARI, IzatnagarCARIBRO-MRITUNJAI
(CARI Naked Neck) Commercial broilers CARI, Izatnagar
Table 2. Poultry germplasm in rural poultry production.
Characteristics
56-dayName Type body wt. (kg) Feather color Purpose
Vanraja Breed: cross 1.4 Graded brown Dual/meat
Giriraja Breed: cross 1.5 Graded brown Dual/meat
AVM colored Breed: cross 1.1 Mixed Meat
Croiler Synthetic 1.2 Graded brown Meat
Maines T Synthetic 0.7 Mixed Tandoori
Krishipriya Breed: cross 0.9 Graded brown Dual
Grampriya Breed: cross 1.0 Wheatish brown Dual
Krishna J Synthetic 0.6 Mixed Egg
CARI-Gold Breed: cross 1.0 Brown Dual
94
and different centers using random sample poultry performance tests(RSPPT). Most of the layer and broiler stocks developed at CARI anddifferent centers of the AICRP on poultry have repeatedly given excellentperformances at RSPPT and were found comparable to those of private sectorhatcheries. The commercial broilers developed at CARI attained a bodyweight of 1700 g at six weeks and 2100 g at seven weeks of age in RSPPT. TheCARI stocks also had maximum survival rate and ranked higher incompetition. The superior layer stock developed at different institutionsshowed encouraging performance. CARI-Golden stock topped the brownegger entries with an egg production (HH) of 281and 283(HD) at randomsample layer test (RSLT).
Required Inputs
To increase and sustain productivity of superior stocks, inputs such as qualityfeed, better health care, and a package of management practices need to bestrengthened. The research and technological advancement in these areas aresummarized below.
Nutrition and Feed Technology
Feed accounts for 70–75% of the total operational cost of poultry production.Therefore, improving feed efficiency is important in maximizing profitability.Poultry feed formulations were developed/revised for tropical climaticconditions and alternative and nonconventional feed resources wereidentified. Research proved the acceptability of de-oiled rice polish, sorghum,finger millet, pearl millet, and rice polish in poultry mashes and de-oiledsunflower cake, and ramtill cake as protein sources. The fishmeal was reducedand replaced by synthetic amino acids (lysine and methionine) and vitamins.
The nutrient requirement of different classes and age groups of birdswere determined to optimize production. Methods for improving nutrientvalues (enzyme utilization) were evolved, nonconventional poultry feeds wereidentified, and procedures for detoxification and improving the quality offeedstuff were standardized. The important technological innovations andtheir utilities in the area of poultry nutrition are presented in Table 3.

95
Health Care and Biosecurity
High mortality and morbidity caused by various diseases have been the majorhandicap in poultry production in the past. The facilities for disease diagnosisand production of pharmaceuticals and vaccines were inadequate. However inthe last three decades there has been a significant breakthrough in poultrydisease control. At present there are about 250 diagnostic laboratories, 28veterinary colleges, three major vaccine-producing projects in the privatesector and 14 in the public sector. The advances in technologies such asSpecific Pathogen Free (SPF) egg, monoclonal antibodies, rDNA andmembrane antigen system are used for vaccine production. Research hasgenerated effective diagnostic measures and vaccines against several killerdiseases such as Newcastle Disease (ND), fowl pox (FP), Marek’s disease
Table 3. Important technological innovations in poultry nutrition. Name of technology Example Utility
Low cost ration
a. Use of agro industrial by-products
De-oiled rice polish, de-oiled sunflower cake, soybean meal, salseed cake
b. Alternative protein sources
Meat meal, silkworm pupae meal, Lucern meal
c. Use of by-products and wastes
Manure, mortalities and feather meal, hatchery waste
• Reduces cost without affecting nutritive value of feed
• Uses feed ingredients not used by humans
• Recycling of waste
d. Use of probiotics
Lactobacillus sp., Streptococcus sp., Pediococeies sp., Bacillus sp.
• Establishes favorable intestinal flora
• Serves the function of antibiotic feed additive
e. Use of antibiotic feed additives
Zinc, Bacitracin, Oreomycin, Monnacin • Promotes growth and feed conversion efficiency (FCE)
f. Use of feed grade enzymes
Hemicellulase, cellulase, amylase, tannase, phystase, proteinase
• Improves nutritive value and feed utilization
• Improves body weight gain and FCE
• Reduces volume of excreta
g. Feed processing Pelleting /crumbing • Improves growth and FCE by 10%-25%
• Releases encapsulated nutrients
• Improves digestibility of food • Reduces deleterious factors
96
(MD), and Infectious Bursal disease (IBD). There is still, however, a lack offacilities for testing vaccine efficacy, spot diagnosis, and farmer-oriented healthcare in rural areas.
Uncontrolled movement of poultry and its products has furthercomplicated the situation. The changing management practices have enabledpathogens to modify themselves and appear as new pathogens causing newdiseases. There has been a re-emergence of old diseases such as ND, AvianInfluenza (AI) and FP, and new disease problems such as leechi disease,Inclusion Body Hepatitis (IBH) and Egg Drop Syndrome (EDS) have alsoemerged. Variation of recognized diseases such as IBD, Infectious Bronchitis(IB), and MD and syndromes, resulting from the interaction of more than onepathogen, such as Swollen Head Syndrome (SHS), Blue Wing disease, andinfectious enteropathies have also been observed. Biotechnological tools suchas diagnostic probes and PCR-based DNA amplification have proved useful inproper diagnosis. Use of endogenous and thermostable microorganisms forvaccine development have proved efficient in controlling diseases in ruralareas. The development of immunomodulators and pharmaceuticals has alsocontributed significantly.
Poultry Reproduction
Poultry reproduction technologies have contributed considerably towardsincreasing the use of superior germplasm. Advances in semen evaluation,semen diluents, and artificial insemination of poultry germplasm have allhelped augment the production. A simple semen diluent has been developedthat successfully preserves the fertilizing ability of chicken spermatozoa for 24hours at low temperature. A technique for evaluating the fertilizing ability ofmale quail has also been developed.
Poultry Equipment
India has made considerable progress in manufacturing a wide range ofhousing, incubation, watering, and vaccination equipment. The automationand innovation in poultry-shed ventilation and environmentally controlledhouses have been demonstrated widely. There has been a rise in the use ofautomated feeding and drinking systems, nipple and cup drinkers, mediatorsand dosers, electric time switches, manure drying and disposal machines, andbeak trimming and mass vaccination equipment. The hatchery equipmentsegments are manufacturing large incubators.
97
Automatic small, broiler processing plants that meet local demand andexport norms are the need of the new millennium. The quality of factory-dressed chicken, cut-up parts, and deboned chicken needs to be improved.
Potential BenefitsThe superior stocks of broilers and layers have altogether revolutionized thepoultry industry. In the 1950s a layer used to produce 200–220 eggs with anefficiency of 3.4–3.5 kg feed kg-1egg., which has now increased to 290–300eggs with efficiency of 2.5–2.6 kg feed kg-1 egg. Similarly, 30–40 years ago,broilers used to attain a body weight of 0.8 kg in eight weeks andapproximately 3.2 kg feed was required per kg body weight. Now, averagebody weight reaches 1.7–1.8 kg, with feed efficiency of 1.8–2.0 kg feed kg-1
live weight at six weeks.
Adoption of Technologies
The level of adoption of technologies in the organized sector has beenadequate. A large number of farmers and commercial poultry breeders haveadopted many technologies related to poultry breeding, nutrition, health andmanagement. However, in the unorganized sector, the adoption is slow due toseveral constraints. On average, more than one-third of the total poultrypopulation in the country belongs to the improved category.
The dissemination and adoption of technologies take place via differentpathways. In the public sector, the ICAR institutes such as CARI, Izatnagarand Project Directorate on Poultry (PDP), Hyderabad are the main centersthat develop technologies and disseminate them among farmers, large privatehatcheries and NGOs. The large commercial breeders and hatcheries in theprivate sector procure and develop the superior grandparent stock. The parentstocks are sold to the franchisees, which ultimately produce the commercialhybrids that are sold to end-users. Thus, there is a network of functionariesengaged in poultry farming.
The superior stocks require better feed, proper vaccination, medication,and a package of improved management practices. The main constraint in theadoption of technologies is higher cost of inputs resulting in low profitability.Fluctuating market trends in terms of seasonality in consumption of poultryproducts and their prices also restrict adoption. Various myths prevalent inIndian society were also responsible for the non-adoption of new techniques

98
during the early years of introduction of improved poultry. These included theidea that the egg from the indigenous fowl is more nutritious than that ofcommercial hybrids, and that the same holds good for the meat. Illiteracy, lackof awareness, and religious taboos have also been major causes for slowadoption of poultry technologies. The myths are however on the wane andincreasing literacy and easily available credit facilities are encouraging poultryfarmers to adopt new technologies.
Other Poultry GermplasmThe chicken has been in the forefront of research because it accounts for morethan 90% of the poultry population. Ducks come next and are popular instates such as Assam, West Bengal, Orissa, Andhra Pradesh, Tamil Nadu,Kerala and Tripura. However, the research efforts on ducks are severelylacking.
Quail has enormous potential as a producer of meat of excellent quality,taste and delicacy. Quails were primarily imported as pilot animals in 1974 atthe Poultry Research Division (now the CARI) of IVRI. The good qualities ofquail include smaller gestation interval, small space requirement, and highproductivity, making this species suitable for commercial exploitation. Theresearch at CARI has led to production of superior stock (Table 4), as well asdevelopment of a package of practices for quail farming. Quail meat and eggsare now becoming popular in several parts of the country. Nevertheless, moreresearch efforts are required to expand quail farming.
Research on guinea fowl was initiated about a decade ago. Selectivebreeding for juvenile weight and high immunocompetence has resulted inincreased body weights (Table 4) and improved lifespan. Guinea fowl ispopular for its excellent meat, foraging habits, inherent hardiness, andresistance to common poultry diseases. Recently, research on turkeys has alsobeen initiated at CARI with the objective of developing an adaptable smallturkey.
Emerging Technologies
Ex Vivo Embryo Culture, Chimera Production and Transgenesis
The advances in the areas of molecular biology and embryo manipulation havemade it possible to transfer the gene of choice from a donor to a heterologous
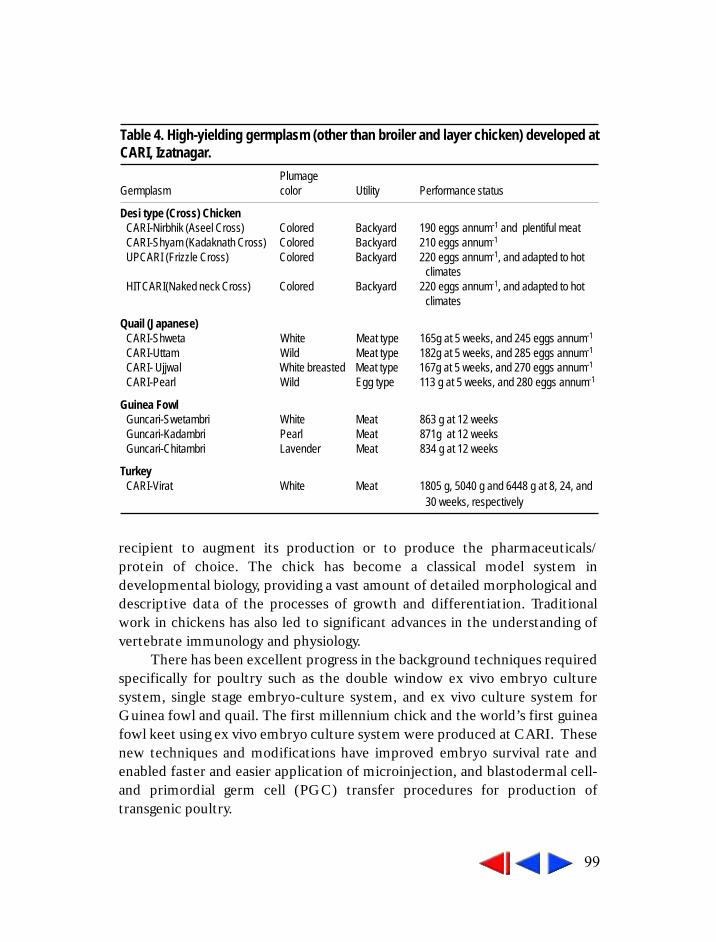
99
recipient to augment its production or to produce the pharmaceuticals/protein of choice. The chick has become a classical model system indevelopmental biology, providing a vast amount of detailed morphological anddescriptive data of the processes of growth and differentiation. Traditionalwork in chickens has also led to significant advances in the understanding ofvertebrate immunology and physiology.
There has been excellent progress in the background techniques requiredspecifically for poultry such as the double window ex vivo embryo culturesystem, single stage embryo-culture system, and ex vivo culture system forGuinea fowl and quail. The first millennium chick and the world’s first guineafowl keet using ex vivo embryo culture system were produced at CARI. Thesenew techniques and modifications have improved embryo survival rate andenabled faster and easier application of microinjection, and blastodermal cell-and primordial germ cell (PGC) transfer procedures for production oftransgenic poultry.
Table 4. High-yielding germplasm (other than broiler and layer chicken) developed atCARI, Izatnagar.
PlumageGermplasm color Utility Performance status
Desi type (Cross) ChickenCARI-Nirbhik (Aseel Cross) Colored Backyard 190 eggs annum-1 and plentiful meatCARI-Shyam (Kadaknath Cross) Colored Backyard 210 eggs annum-1
UPCARI (Frizzle Cross) Colored Backyard 220 eggs annum-1, and adapted to hotclimates
HITCARI(Naked neck Cross) Colored Backyard 220 eggs annum-1, and adapted to hotclimates
Quail (Japanese)CARI-Shweta White Meat type 165g at 5 weeks, and 245 eggs annum-1
CARI-Uttam Wild Meat type 182g at 5 weeks, and 285 eggs annum-1
CARI- Ujjwal White breasted Meat type 167g at 5 weeks, and 270 eggs annum-1
CARI-Pearl Wild Egg type 113 g at 5 weeks, and 280 eggs annum-1
Guinea FowlGuncari-Swetambri White Meat 863 g at 12 weeksGuncari-Kadambri Pearl Meat 871g at 12 weeksGuncari-Chitambri Lavender Meat 834 g at 12 weeks
TurkeyCARI-Virat White Meat 1805 g, 5040 g and 6448 g at 8, 24, and
30 weeks, respectively

100
The stage X blastoderm cells collected from freshly laid eggs containPGC and start to differentiate at around stage X from the pluripotentblastodermal cells. For transgenic chicken to be produced using blastodermalcell chimeras, techniques for in vitro genetic modification of blastodermalcells are required. Since chicken embryonic stem cell lines are currentlyunavailable and blastodermal cells capable of forming germline chimeras canonly be maintained in culture for up to seven days, research to date hasfocused on the transfection of freshly isolated blastodermal cells.
Breeding for Tolerance to Climatic Stresses
Certain major genes, such as those for the naked neck and frizzle, contributesignificantly to heat stress tolerance. These genes reduce the total feathercover and the feather structure of the bird to enable more efficient heatdissipation. Research has resulted in the production of a naked neckpopulation (CARI-MRITUNJAI) that is better adapted to tropical climates.Naked neck stocks developed at CARI performed excellently when tested atdifferent centers of RSPPT and in the field.
Molecular and Immunocompetence Investigations
Variability is one of the important tools for improving stocks. The variabilityinvestigated at genome level, through RAPD-PCR and DNA fingerprinting,enables selection of suitable parents for production of commercial hybrids.Research on these lines has generated a lot of data in layers and broilers.Molecular investigations may thus prove of immense value in augmentingproduction through production of further superior germplasm.
Genetic resistance to diseases has always been an important issue forpoultry research. Several investigations have shown that indirect selection byincorporating immunocompetence traits into selection procedure is the bestmethod for enhancing the bird’s overall resistance to diseases. Investigationshave shown that commercial broilers have high immunocompetence levels.Further investigations through marking lines for immunological traits andstudying the differences at major histocompatibility complex (MHC) regionare under way in order to find suitable marker(s)/immunological trait(s) thatcan be used as selection criteria.

101
Future PerspectivesAlthough the poultry industry has grown tremendously on all fronts there isstill scope for improving productivity. The explosion of knowledge inmolecular biology will have profound impact on all branches of poultryscience.
Molecular Genetic Mapping and Transgenesis
• Good progress has been made at integrating poultry maps, representingsome 1400 loci so far. The average spacing between markers on the com-bined linkage maps is approaching 2 centiMorgans (cM), which is adequatefor knowing the location of functional genes. Such a minimal genome map isnormally a prerequisite for locating useful Quantitative Trait Loci (QTL)for subsequent marker-assisted selection (MAS). In the future, researcherswill attempt to integrate MAS optimally with the conventional quantitativegenetics approach to poultry breeding.
• Identification, localization, and cloning of useful candidate genes are pre-requisites for their manipulation to produce transgenic chicken using thenew rDNA technology
• There has been considerable progress in development of background tech-niques for producing transgenic poultry. Application of these could enabledramatic gains in egg and meat productivity, disease resistance, and produc-tion of human proteins in eggs.
• Transgenic poultry would help to give new insights into many areas such asimmunology, cancer biology, developmental biology, and physiology. Theproduction of transgenic chicken will give scientists a unique opportunity toinvestigate gene expression and function within the complexity of a livingorganism.
• The time scale of progress in molecular biotechnology is largely propor-tional to the resources made available for the necessary research and devel-opment. In the case of poultry biotechnology, the resources have been mini-mal and need to be increased substantially.
• Poultry biodiversity, i.e. the set of genetically diverse poultry resources,must be preserved and conserved to sustain agricultural development.
• Blastodermal cells, PGCs, DNA, and spermatozoa can be preserved in theform of genome banks storing these at -196 0C in liquid nitrogen.
102
Poultry Health
• The application of molecular biotechnology to produce improved diagnostickits and vaccines is now well established and will continue to grow as amajor component of disease control in the years ahead.
• Increasing the innate resistance of birds to infections and parasites can in-crease disease control.
• Significant progress has been made in recent years on many aspects of theimmune system and MHC-related basic studies that will ensure practicalindustrial applications in the near future.
• Low-cost thermostable vaccines and effective disease control of poultry inrural small-scale poultry production are required.
• Disease surveillance and forecasting systems need further strengthening.
Poultry Nutrition
• Basic research in nutritional biochemistry and physiology requires attentionso that future nutritional technologies can be more science-based and lessempirical.
• Alternative and cheaper ingredients for poultry feed must be developed,preferably locally.
• Production of genetically modified feeds with higher nutritive value forpoultry should also be looked into more seriously.
• The definition of specific nutrient requirements for new and specific strainsof poultry should become a regular feature of applied nutrition research.
• Low cost feed supplements should be developed based on local ingredientsnot used for human consumption.
Poultry Reproduction
• The poor reproductive performance of broiler breeder females should begiven priority in poultry reproduction research. Solving the problem willdepend on a deeper understanding of the basic neuroendocrine mechanismsinvolved.
• A further area of research likely to yield practical applications is that of thegenetics of sex determination and the possibility of manipulating the sexratio, i.e., to maximize female chicks in commercial layer strains or malechicks in commercial broiler strains.

103
General Considerations
• Cost effectiveness of various technologies should be evaluated.• Collaboration among institutes and with NGOs and related agencies should
be encouraged.• Superior genetic stocks should be imported as and when required for im-
proving efficiency of breeding programs.• Poultry science courses must be given more emphasis at graduate and post-
graduate levels in all the veterinary colleges and universities.

104
1. Central Institute for Research on Goats, Makhdoom 281 122, P.O. Farah, Mathura, Uttar Pradesh.
Goats in India: Status and TGoats in India: Status and TGoats in India: Status and TGoats in India: Status and TGoats in India: Status and TechnologicalechnologicalechnologicalechnologicalechnologicalPossibilities for ImprovementPossibilities for ImprovementPossibilities for ImprovementPossibilities for ImprovementPossibilities for Improvement
Shalander Kumar and K P Pant1
The goat is one of the most important species of livestock in India. It has shortgeneration interval, high prolificacy, and is easily adaptable to a wide range ofclimatic conditions. These characteristics give it a greater relevance in thehousehold economy of the poor, particularly in the marginal environmentsincluding arid, semi-arid, and mountain regions. In these environments rainfallis erratic and frequency of crop failure is high. The goat is capable of survivingon sparse vegetation and in extreme climates.
Goat meat is the most preferred meat in the country. Almost 95% of thegoat meat produced in the country is consumed locally; though per capitaavailability is far below the requirement. The goat produces a variety of otheruseful products and by-products including milk, skins, fleeces, and manure. Inhilly regions, goats are valued for both meat and fine fiber (pashmina)production.
The productivity of goats in India is low. The average carcass weight isonly 10 kg, lower than the world average of 12 kg. The milk productivity is alsolow. One of the main causes of low productivity is lack of adoption of scientificmethods of production, and limited commercialisation of goat keeping.Nevertheless, there is considerable potential to raise the productivity of goatsand their economic and food security contributions, as India has a largenumber of important breeds of goat. This paper examines the populationdynamics and contribution of goats, and identifies potential technologies forimproving meat and milk productivity.
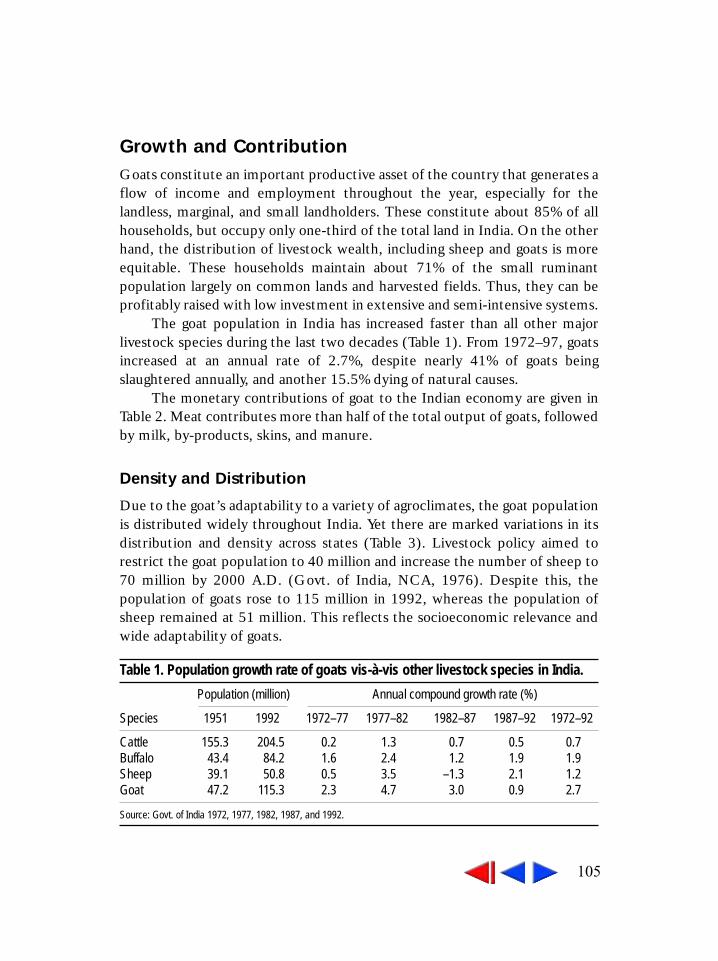
105
Growth and ContributionGoats constitute an important productive asset of the country that generates aflow of income and employment throughout the year, especially for thelandless, marginal, and small landholders. These constitute about 85% of allhouseholds, but occupy only one-third of the total land in India. On the otherhand, the distribution of livestock wealth, including sheep and goats is moreequitable. These households maintain about 71% of the small ruminantpopulation largely on common lands and harvested fields. Thus, they can beprofitably raised with low investment in extensive and semi-intensive systems.
The goat population in India has increased faster than all other majorlivestock species during the last two decades (Table 1). From 1972–97, goatsincreased at an annual rate of 2.7%, despite nearly 41% of goats beingslaughtered annually, and another 15.5% dying of natural causes.
The monetary contributions of goat to the Indian economy are given inTable 2. Meat contributes more than half of the total output of goats, followedby milk, by-products, skins, and manure.
Density and Distribution
Due to the goat’s adaptability to a variety of agroclimates, the goat populationis distributed widely throughout India. Yet there are marked variations in itsdistribution and density across states (Table 3). Livestock policy aimed torestrict the goat population to 40 million and increase the number of sheep to70 million by 2000 A.D. (Govt. of India, NCA, 1976). Despite this, thepopulation of goats rose to 115 million in 1992, whereas the population ofsheep remained at 51 million. This reflects the socioeconomic relevance andwide adaptability of goats.
Table 1. Population growth rate of goats vis-à-vis other livestock species in India.
Population (million) Annual compound growth rate (%)
Species 1951 1992 1972–77 1977–82 1982–87 1987–92 1972–92
Cattle 155.3 204.5 0.2 1.3 0.7 0.5 0.7Buffalo 43.4 84.2 1.6 2.4 1.2 1.9 1.9Sheep 39.1 50.8 0.5 3.5 –1.3 2.1 1.2Goat 47.2 115.3 2.3 4.7 3.0 0.9 2.7
Source: Govt. of India 1972, 1977, 1982, 1987, and 1992.

106
Their population is concentrated largely in Bihar and West Bengal in theeast; Rajasthan, Maharashtra, and Madhya Pradesh in the west; and UttarPradesh in the north. The density of goats is highest in West Bengal (160 goatskm-2), followed by Bihar. In Assam, Kerala, Madhya Pradesh, Rajasthan, TamilNadu and Uttar Pradesh there are 40–50 goats km-2. The lowest density is inJammu & Kashmir (8 goats km-2), closely followed by Punjab.
Table 2. Contribution of goats to the Indian economy, 1994.
Quantity ValueProduct (thousand t) (million Rs)
Meat 470 27 360Milk 2 200 11 000Pashmina 0.04 20By-products - 3 650Manure 18 790 1 879Blood 46 46Skin - 3 283
Total 47 283
Table 3. The density and distribution of goats in India.
Population DensityState (million) (goats km-2)
Andhra Pradesh 4.3 15.7Assam 3.5 44.0Bihar 17.5 100.4Gujarat 4.2 21.6Haryana 0.8 18.1Himachal Pradesh 1.1 20.8Jammu and Kashmir 1.8 8.0Karnataka 6.3 32.8Kerala 1.9 47.6Madhya Pradesh 8.4 18.9Maharashtra 10.0 32.3Orissa 4.9 31.7Punjab 0.5 10.8Rajasthan 15.3 44.7Tamil Nadu 6.3 48.8Uttar Pradesh 13.1 44.5West Bengal 14.2 159.7
Source: Govt. of India. 1972, 1977, 1982, 1987, and 1992.

107
Goats are often blamed for denuding the vegetative cover and causingdesertification. If the density of goats is an indicator, the blame is unfounded.West Bengal and Bihar have the highest densities of goats, but there are nosigns of desertification in these states. It is undoubtedly true that largepopulations of goats or any other livestock continuously grazing throughoutthe year in a small area would be extremely harmful to the growth ofvegetation. Deforestation coupled with overgrazing by livestock will also haveadverse consequences on the forests and wastelands (Acharya 1992).Therefore, in order to get the best from the system, the animals and commonproperty resources (CPRs) must be properly managed.
Technologies for Enhancing Goat ProductivityThe Central Institute for Research on Goats (CIRG), an offshoot of ICAR, isthe main institute that conducts basic and applied research on goatproduction. The Institute has developed technologies and standardizedmethods for improving the productivity of goats. If effectively transferred tothe goat farmers, these would go a long way in improving goat productivity.The rest of the paper deals with the technologies available for application inthe field.
Genetic Improvement of Goats
There are twenty well-recognized goat breeds in India suited to differentgeographical and climatic conditions. Since 1971, systematic scientific effortshave been made to improve the genetic potential of goats in terms ofincreasing milk, meat, and fiber production. The superior germplasm,especially those of Barbari and Jamunapari breeds maintained at CIRG, couldbe used for breeding high-yielding animals.
Optimizing Survival of Goats
The well-managed goat is less likely to succumb to diseases. Those such aspeste des petits ruminants (PPR), foot and mouth disease, brucellosis, andpustular dermatitis are widely prevalent in different regions. A number ofresearch projects in the area of goat health have been successful to someextent in reducing mortality due to diseases. The CIRG has developed anannual goat health calendar for organized flocks (Table 4). Implementation of

108
this calendar could help check the mortality and production losses due todiseases up to 70 percent.
Artificial Insemination
Limited access to good quality breeding bucks is one of the reasons for lowproductivity of goats. Artificial insemination, which has been standardized,
Table 4. Annual preventive goat health calendar.
Months
Operations Jan Feb Mar Apr May Jun Jul Aug Sep Oct Nov Dec
VaccinationFoot and mouth + +
disease (FMD)* +Foot and mouth
disease (FMD)**ET + +peste des petits +
ruminants (PPR)Sheep pox# +Hemorrhagic + Or+
septicemia (HS)DrenchingCoccidiosis + +Parasites + Or+ +DippingLice + +Ticks + + +Watch forEcthyma + + +Coccidiosis + + +Tapeworm + + +Haemonchus +Ticks + + + +Wounds # + + +Abortions + + + +Pod-Toxicity + + +Screen forBrucellosis + + + +Johne’s disease +
* Immunity 6 months ** Immunity one year # Only for sheep.

109
could be used effectively as a breeding method for multiplication of superiorquality animals. Semen production potentials have been worked out forbreeds such as the Jamunapari, Baribari, Jhakrana, Kutchi, Marwari, andSirohi. Studies have been conducted on sexual maturity and optimal age forsemen production in different goat breeds. Bacterial load in buck semen hasbeen worked out. A protocol for freezing buck semen has been developed thatretains 50–55% motility and 40% fertility. The deep cervical inseminationtechnique with freshly diluted semen has been standardized with a 75%fertility rate in goats. A fertility rate of 50% has been obtained with frozensemen using deep cervical insemination.
Structures and Appliances for Organized Goat Farms
Various structures and appliances for goat farms have been standardized thatare essential for better management and the higher growth rate of goats. Theyalso reduce contamination and wastage of feed.
Provision of optimum floor space in goat houses is essential for thecomfort of goats and to maintain higher survival rates and minimize diseaseincidence. Goats need covered as well as open space (paddock), and therequirement for the latter was found to be different for different age groups.Table 5 shows the optimal floor space requirement for goats at different ages.
Ventilation Space
Proper ventilation provides enough oxygen for the animals, helps removespent gases and moisture, and maintains a suitable vapor pressure in the shed.Ventilation also allows sufficient sunlight into the sheds. Ventilation of shedsaffects the performance of goats and should be maintained at an optimum. In
Table 5. Optimum floor space requirement for goats.
Floor space ( m2 goat-1 )
Category/ age of goat Covered Open space
0 – 3 months 0.2 – 0.3 0.4 – 0.63 – 9 months 0.6 – 0.8 1.2 – 1.59 –12 months 0.8 – 1.0 1.5 – 2.0Yearlings (above 12 months) 1.0 2.0Adult bucks 1.5 – 2.0 3.0 – 4.0Lactating does 1.5 3.0
110
hot dry periods a total ventilation space 70% of the floor area should beprovided. In hot humid regions, two facing sides of the wall should be kepttotally open. During cool weather, 2–10% ventilation is required, and duringthe rest of the year ventilation space should not be less than 25%.
A set of suitable feeders and watering mangers for goats of different agegroups were developed for use in organized goat farms and villages to reducecontamination and wastage of feeds. Skilled and semi-skilled persons canfabricate this equipment in small workshops, using easily available materialssuch as angle iron, GI sheets, iron bars, and welding rods. The feeders andwatering mangers were extensively tested and found suitable for use by bothgoats and sheep. The height of the feeding trough should be kept at theaverage shoulder point height of the animal for goats aged more than threemonths. For kids below three months the height should be 25% less than theaverage shoulder point height. The feeders developed were suitable forfeeding of concentrate, pelleted feed, dry fodder (straw), green fodder, andsilage. The wastage of feed materials was reduced drastically using these, andthere was no contamination by goat feces and urine.
Grazing and Carrying Capacity
As grazing resources are shrinking, tree fodder will be an important alternativefor feeding goats. Harvested dried leaves could form part of a complete feed(pellets). Some of the promising feeds are 1) 60% Anni (Chlorodendronphlomides) leaves, and 40% concentrate mixture (maize, barley, groundnutcake, sesame cake, mineral mixture and salt); 2) 40% Heens (Capparishorrida) leaves, 20% Arhar (Cajanus cajan) straw, and 40% concentratemixture; and 3) 40% neem (Azadirachta indica) dry leaves (winter season),30% arhar straw, and 30% concentrate mixture.
Urea treatment was found to be economical for improving poor qualitystraws. A complete ration was formulated using treated barley straw 47%,barley grain 32%, arhar straw 20% and mineral mixture with salt 1%, whichcan maintain adult goats.
Twenty percent subabul (Leucaena spp.) leaves in a complete feedyielded better growth and higher carcass production. Leaves of indigenousbabul (Acacia nilotica) at 15% level in a complete feed were found to improvemilk productivity. Subabul also has potential as feed for chevon production asit has no deleterious effect on various economic traits and carcasscharacteristics.

111
Value-added Products
Meat from Spent Goats
A nutrient dense shelf-stable dehydrated minced meat product (Chevon) hasbeen prepared from spent (those animals that are no longer useful orproductive) goats using 20% split dehusked lentil paste. Good quality chevonpickle with better shelf life at ambient temperature could be prepared usingmustard oil, acetic acid, dry and green spices, and cane sugar (flavor enhancer).Curing and mechanical tenderizing of partially frozen meat chunks from spentgoat carcasses helped overcome the problem of dark red color, strong flavor,and toughness. Good quality sausages with higher yield were manufacturedfrom spent buck meat and have a shelf life of seven days under refrigeration.
Incorporation of 0.5% phosphate mixture in shami kabab formulationresulted in an improvement of organoleptic scores, and yield and retention ofthe product’s organoleptic traits on cold storage. The major cause of spoilagewas visible surface mold growth. The product could safely be preserved for 14days under refrigeration. Good quality Chevon samosa may be prepared fromspent goat meat using 10% cooked mashed potatoes. Goat stomach, oftenrejected by meat eaters, can be used to manufacture a crisp snack containing55% protein.
Goat Milk Products
Good quality paneer could be prepared from goat milk using citric acid (0.15%w/w) and fermented paneer whey as coagulants. Paneer packed inpolypropylene bags could safely be preserved for three days underrefrigeration (4+1°C). Addition of 2.0–2.5% food grade gelatin was foundbeneficial for producing goat milk shrikhand of desired quality. The shrikhandcould be preserved safely in glass containers for three days at ambienttemperature and 30 days under refrigeration (4±1°C). Among thenonconventional milk coagulants used, chhana prepared using lactic acid wasfound superior to chhana prepared using hydrochloric acid solution,fermented paneer whey, and citric acid.

112
ConclusionsThe technologies and methods discussed in this paper have the potential toenhance the productivity and thereby the profitability of goats. Although bothsmall and large goat farmers could use these, technologies befitting smallfarmers are needed for development of these systems.
To ensure sustainable development of goat husbandry, the research anddevelopment efforts in the following areas should be given priority:• Provision of good quality breeding bucks.• Intensified efforts to prevent and control diseases, especially PPR and
Johne’s disease.• Improvement of common grazing resources.• Cessation of slaughter of underage animals.• Commercialization and intensification of the goat enterprise.
ReferencesAcharya, R.M. 1992. Pages 49-53 in Recent advances in goat production. Proceedingsof the fifth International Conference on Goats, 2-8 Mar 1992, New Delhi, India.
Government of India. 1972, 1977, 1982, 1987, and 1992. Livestock Census.Directorate of Economics and Statistics, Ministry of Agriculture, New Delhi.
Government of India. 1976. Report of the National Commission on Agriculture, PartVII, Animal Husbandry, Ministry of Agriculture and Irrigation, New Delhi.
113
1. Central Sheep and Wool Research Institute, Avikanagar, Rajasthan-304501, India.
Enhancing Productivity of Sheep: TEnhancing Productivity of Sheep: TEnhancing Productivity of Sheep: TEnhancing Productivity of Sheep: TEnhancing Productivity of Sheep: TechnologyechnologyechnologyechnologyechnologyDimensionsDimensionsDimensionsDimensionsDimensions
B U Khan, A L Arora and R C Sharma1
Sheep husbandry is an important enterprise in the arid and semi-arid areas ofIndia characterized by sparse vegetation, marginal land, and a high incidence ofpoverty. It is a low-investment sustainable enterprise yielding reasonably highrates of return. The sheep are valued for both mutton and wool production,although sheep productivity in terms of both is low. Wool yield in India isabout 0.9 kg annum-1, about 60% less than the world average. The muttonyield is about 12 kg annum-1, compared to a world average of 15 kg annum-1.The reasons for low productivity of sheep in India are poor exploitation ofgenetic potential of native stock, inadequate feed resources, nutritionaldeficiency, heat stress, poor health monitoring, and inadequate marketing andcredit support to sheep owners.
Various breeding strategies have evolved for improving body weight, andwool production and its quality. The emphasis has been on improving theproduction and quality of apparel wool. Limited efforts have been made toimprove the production and quality of carpet wool or mutton production. Anumber of sheep strains have been evolved in India through crossbreeding ofindigenous sheep with superior temperate breeds such as Dorset, Suffolk,Rambouillet, and Merino. The developed genotypes have demonstrated theirproduction potential under experimental conditions. This paper attempts todocument the technologies that can be employed gainfully under fieldconditions.
Sheep BiodiversityIndia is a rich repository of sheep genetic resources and diversity. Sheepdiversity is related basically to the geography of the region, production system,

114
ecological and environmental variations, and the genetic constitution ofbreeds. India has the fourth largest sheep population in the world, accountingfor 4.6% of the global population. The country produces about 2% of theworld’s sheep meat, 0.8% of raw wool, and 1.1% of scoured wool. It isestimated that India produces about 169 million kg of mutton, 42.7 million kgof wool, and 40 million skins annually. The national sheep flock is worth Rs 24billion producing an annual flow of outputs worth Rs 8 billion.
The sheep population remained almost static at about 40 million untilthe 1970s. In 1982, it increased to 49 million, and then declined to 45.7million in 1987. In 1992, there was a subsequent increase to 51 million (Table1). The decline in 1987 was due mainly to widespread drought in the country,which resulted in a higher slaughter rate in that year.
The four distinct sheep breeding tracts in the country are NorthTemperate (Himalayan region), Northwestern (Rajasthan, Maharashtra,Gujarat, Madhya Pradesh), Eastern (West Bengal, Bihar), and SouthernPeninsular (Andhra Pradesh, Karnataka, Tamil Nadu). The regionaldistribution of sheep breeds is shown in Table 2. There are 57 breeds of sheepin India. Most of these are nondescript due to indiscriminate breeding andintermixing of breeds. They have evolved primarily through natural selectionunder the prevailing climatic conditions (usually harsh), migration, tropicaldiseases, poor nutrition, and shortage of drinking water. There are no breedsocieties or agencies that register animals of a particular breed, maintain flockbooks, or the purity of breed or type. The bulk of sheep is raised in the
Table 1. Sheep population trends.
Population Annual growth rateCensus year (millions) (%)
1951 39.1 -1956 39.3 0.11961 40.2 0.51966 42.0 0.91972 40.0 –1.01977 41.0 0.51982 48.8 3.51987 45.7 –1.31992 50.8 2.1
Source: AHS Series-6, Deptt. of Animal Husbandry and Dairying, Govt. of India, New Delhi.

115
northwestern arid and semi-arid regions. In the north temperate regions sheepare mainly raised for apparel wool. Sheep are raised mainly for mutton in thesouthern peninsular region. Management, husbandry systems and breeds, ineach of these agroecological zones, are distinctly different.
Technologies for Improving Mutton ProductivitySeveral methods for increasing body weight of sheep have been tried byselection within the indigenous and crossbred populations. In muttonproduction programs, more emphasis has been given to six-month body weightthan to greasy fleece. Since the characteristics related to mutton production(body weight gains, efficiency of feed conversion, and dressing percentage) aremoderate to highly heritable, selection within indigenous breeds can bringabout considerable improvement. Countries with developed sheep industriesmaintain special breeding flocks to supply superior germplasm to commercialflocks.
Table 2. Sheep breeds and their distribution in different regions.
North temperate Northwestern Eastern Southern peninsular
Gaddi (CW) Chokla (CW) Chhota Nagpuri (MCW) Deccani (M)Rampur Bushair (CW) Nali (CW) Shahbadi (M) Bellary (MCW)Poonchi (CW) Marwari (MCW) Belangir (MCW) Nellore (M)Karnah (AW) Magra (CW) Ganjam (MCW)Mandya (M)Gurez (CW) Jaisalmeri (MCW) Bonpala (MCW)Hassan (M)Kashmir Merino (AW) Pugal (MCW) Garole (M) Coimbatore (MCW)Changthangi (CW) Malpura (M) Tibetan (CW) Nilgiri (AW)Bhakarwal (CW) Sonadi (MCW) Ramnad White (M)
Patanwadi (CW) Madras Red (M)Muzaffarnagari (MCW) Trichi Black (M)Jalauni (MCW) Kanguri (M)Kheri (M) Kilakarsal (M)Munjal (M) Mecheri (M)
Vembur (M)
Note: Figures in parentheses are the major products of each breed: AW = Apparel wool; CW = Carpet wool;
MCW = Mutton and Carpet wool; M = Mutton.

116
The performance of Indian indigenous and crossbred sheep with respectto growth, feed efficiency, and carcass traits is shown in Tables 3 and 4. Resultson growth performance reveal that Malpura and Muzaffarnagari breeds of thenorthwestern region, and the Nellore and Mandya in the southern region havegreat potential for use as improver breeds for mutton production. Newsynthetics generally attain a live weight of about 30 kg at six months of ageunder intensive feeding conditions.
In crossbreeds, improvement in body weight up to six months of age overindigenous breeds is conspicuous. However, only marginal improvement isobserved at 12 months of age. This indicates that crossbreeds/new syntheticsrequire high levels of nutrition. If they are managed on the same feedingregime as the indigenous breeds, the differences that are conspicuous up to sixmonths of age narrow gradually and become marginal at the age of one year.
Table 3. Comparative growth performance of native and crossbred mutton-type sheep.
Weight (kg) at
Breed/Genetic group Birth 3 months 6 months 9 months 12 months Source
Malpura 2.9 12.9 19.2 22.3 25.6 1Sonadi 2.8 12.5 18.5 22.1 25.4 1Avimaans/Mutton Synthetic 3.2 14.1 22.1 23.8 26.7 1Mandya 2.2 13.5 17.3 20.1 22.9 2Mandya Synthetic 2.6 14.9 22.2 22.2 25.1 2Nellore 3.0 13. 5 17.8 21.2 24.5 2Nellore Synthetic 3.2 14.8 21.0 23.3 26.4 2Muzaffarnagari 3.3 14.5 19.7 23.9 28.0 2Dorset × Muzaffarnagari 3.5 15.2 21.3 25.7 30.3 2Suffolk × Muzaffarnagari 3.9 16.3 23.6 27.7 32.0 2Deccani 2.9 12.6 16.7 18.8 22.2 2Dorset × Deccani 3.5 13.8 20.3 22.1 25.1 2Madras Red 2.2 9.0 12.5 15.3 16.2 2Dorset × Madras Red 3.0 12.0 16.5 19.4 21.2 2Awassi × Malpura 3.6 16.5 24.4 27.1 30.4 3Avikalin 3.0 14.9 19.9 23.0 30.2 3Avikalin × Avimaans 3.0 15.8 20.8 25.2 30.6 3
Source: 1. Final Report (Mutton unit), 1991. CSWRI, Avikanagar.
2. Final Report, 1993. Project Coordinator, Sheep Breeding (AICRP).
3. Annual Report 1996 CSWRI, Avikanagar.

117
Superior Germplasm for Mutton Production
Through selective breeding and intensive selection some of the importantindigenous sheep breeds such as the Malpura, Sonadi, Muzaffarnagari, MadrasRed, Mandya, Nellore, and Deccani have been improved.
Production of Fat Lamb
Production of fat lamb is a very promising commercial program. The majoradvantage of this technology is that sheep owners need rear the animals onlyfor about three months. Further, the profit earned after three months is on apar with or more than that earned after rearing lambs for 12 months underextensive grazing. After considering all the inputs required for raising thelambs to finishing weight, a net profit of about Rs 316 per slaughtered lambcould be obtained (Table 5). In addition, this technology would help avoidmortality risk and the unnecessary expense of rearing lambs for the wholeyear.
Malpura, an indigenous sheep breed, is well adapted to harsh climaticconditions with good mothering ability and sufficient milk to sustain lambs.An elite Malpura flock has been developed through intensive selection.
Table 4. Feedlot performance of native and crossbred mutton-type sheep.
Breed/ Initial weight Final Average Feed Hot carcass Dressing (%)genetic dressing weight daily gain efficiency weight Exotic woolgroup (kg) (kg) (g) (%) (kg) breeds
Malpura 16.0 29.1 146 15.6 - 59.1Avimaans 18.9 32.5 151 15.7 - 59.1Mandya 10.2 18.1 87 13.5 8.5 54.5Mandya Synthetic 13.9 23.8 110 14.5 10.6 55.2Nellore 13.5 20.1 91 14.6 10.6 58.2Nellore Synthetic 14.8 26.5 134 14.7 13.0 59.3Muzaffarnagari 16.7 26.7 110 14.1 - 57.3Dorset × Muzaffarnagari 18.6 32.3 152 19.5 - 58.8Suffolk × Muzaffarnagari 13.3 26.4 145 23.6 - 56.9Deccani 11.2 25.3 119 13.0 8.3 52.7Dorset × Deccani 12.2 27.4 143 13.9 10.8 55.0Madras Red 9.3 17.7 87 12.3 8.2 51.4Dorset × Madras Red 12.0 26.0 123 14.1 11.1 57.5

118
Malpura weaner lambs (two months of age) are now capable of achieving abody weight of 25 kg at about five months of age.
Technologies for Improving Wool ProductivityWool production increased from 27.5 million kg in 1951 to 45.6 million kg in1992-93. The sheep population in India constitutes 4.6% of world population,but accounts for only 0.8 % of the world greasy and 1.1% of the scoured woolproduction. The quantity and quality of wool produced in different regions areshown in Table 6. About 65% of wool is produced the northwestern region,followed by the southern peninsular region (20%).
The average wool production per sheep is only 0.9 kg against the worldaverage of 2.4 kg. The sheep of the northwestern region produce the highest
Table 5. Economics of fattening lambs for mutton production.
Cost (Rs)
A. Cost itemsApproximate cost of 2 month old lamb (@ Rs 35 kg-1) for weaning weight 11 kg 385Fattening cost (i.e. 25 kg live weight) 276Required body weight gain = 14.0 kgAverage Feed Efficiency = 18.7% or 5.35 kg feed
required for 1 kg gain in body weightTotal feed required 14.0 × 5.35 (74.9 kg)
(Cost of feed at Rs 368 per quintal)Labor cost (Rs 67 day-1 for 90 days, one laborer per 150 lambs) 40Shearing cost 5Health costs 10Interest on investment per lamb 18Total cost/lamb 734
B. Returns from meat productionMeat yield (12.5 kg meat; dressing % = 50), @ Rs 72 kg-1 900Wool (400 g at Rs 35) and skin 90Head, hooves, and offal 28Manure 10Stomach/Intestine 16Lungs 6Total returns lamb-1 1050
Net returns lamb-1 316
Note: 1 US $ = Rs 40.
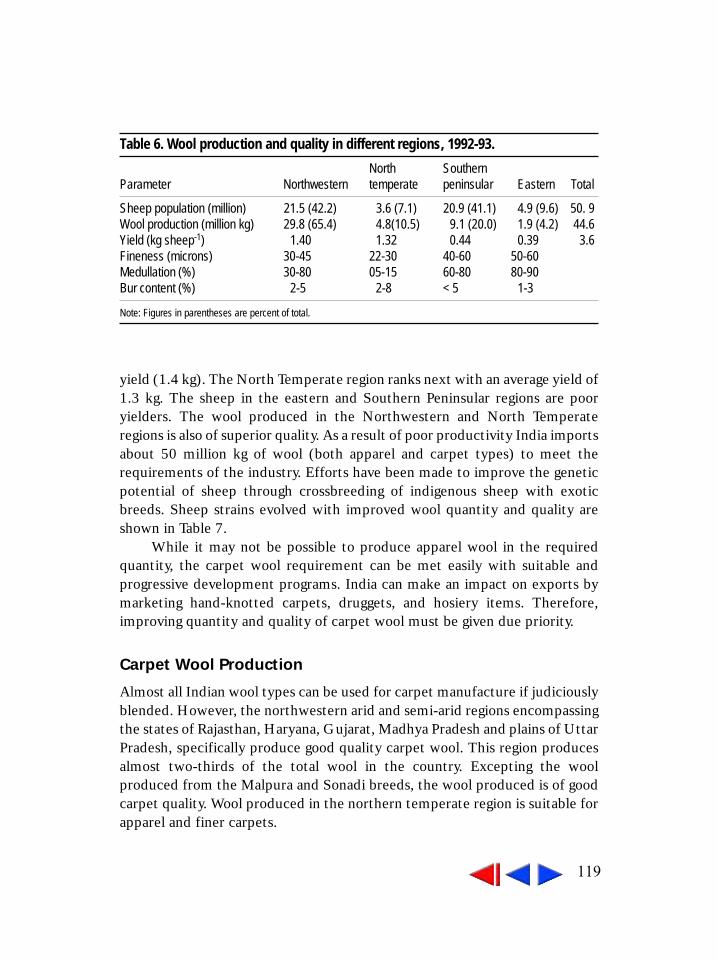
119
yield (1.4 kg). The North Temperate region ranks next with an average yield of1.3 kg. The sheep in the eastern and Southern Peninsular regions are pooryielders. The wool produced in the Northwestern and North Temperateregions is also of superior quality. As a result of poor productivity India importsabout 50 million kg of wool (both apparel and carpet types) to meet therequirements of the industry. Efforts have been made to improve the geneticpotential of sheep through crossbreeding of indigenous sheep with exoticbreeds. Sheep strains evolved with improved wool quantity and quality areshown in Table 7.
While it may not be possible to produce apparel wool in the requiredquantity, the carpet wool requirement can be met easily with suitable andprogressive development programs. India can make an impact on exports bymarketing hand-knotted carpets, druggets, and hosiery items. Therefore,improving quantity and quality of carpet wool must be given due priority.
Carpet Wool Production
Almost all Indian wool types can be used for carpet manufacture if judiciouslyblended. However, the northwestern arid and semi-arid regions encompassingthe states of Rajasthan, Haryana, Gujarat, Madhya Pradesh and plains of UttarPradesh, specifically produce good quality carpet wool. This region producesalmost two-thirds of the total wool in the country. Excepting the woolproduced from the Malpura and Sonadi breeds, the wool produced is of goodcarpet quality. Wool produced in the northern temperate region is suitable forapparel and finer carpets.
Table 6. Wool production and quality in different regions, 1992-93.
North SouthernParameter Northwestern temperate peninsular Eastern Total
Sheep population (million) 21.5 (42.2) 3.6 (7.1) 20.9 (41.1) 4.9 (9.6) 50. 9Wool production (million kg) 29.8 (65.4) 4.8(10.5) 9.1 (20.0) 1.9 (4.2) 44.6Yield (kg sheep-1) 1.40 1.32 0.44 0.39 3.6Fineness (microns) 30-45 22-30 40-60 50-60Medullation (%) 30-80 05-15 60-80 80-90Bur content (%) 2-5 2-8 < 5 1-3
Note: Figures in parentheses are percent of total.

120
Superior Germplasm for Carpet Wool
Indigenous Sheep Breeds
Research efforts have been made to improve wool yield and its quality amongindigenous breeds through selective breeding and selection. Since thecharacteristics connected with carpet wool production (greasy fleece yield,fiber diameter, medullation, and staple length) are heritable, selection withinthe indigenous breed can bring about considerable improvement. PromisingIndian sheep breeds that produce carpet wool are the Chokla, Magra, Nali,Patanwadi, Marwari, Jaisalmeri, Pugal, Bhakarwal, Gurez, Gaddi, and RampurBushair.
New Types
Avikalin. Much research has been conducted on improving carpet woolproduction and quality through crossing the extremely coarse and hairyMalpura breed with exotic fine wool breeds such as the Rambouillet. The half-breeds from such a crossing yield about twice as much wool as the indigenous
Table 7. Improved breeds/types of sheep.
Parent breedsLevel of exotic
New genotype / location Indigenous Exotic inheritance (%)
Bharat Merino (CSWRI, Avikanagar) Chokla, Nali Rambouillet, 75Merino
Avivastra (CSWRI, Avikanagar) Chokla, Nali Rambouillet, 50Merino
Nilgiri Synthetic (SRRS, TNVASU Sandynallah) Nilgiri Merino 62.5/75Patanwadi Synthetic (GAU, Dntiwada) Patanwadi Rambouillet, 50
Merino
Avikalins (CSWRI, Avikanagar) Malpura Rambouillet 50Avimaans (CSWRI, Avikanagar) Malpura, Sonadi Dorset, Suffolk 50Indian Karakul (CSWRI, ARC Bikaner) Marwari, Karakul 75
Malpura, Sonadi
Kashmir Merino (J &K State) Gaddi, Delaine Merino 50-75Bhakarwal Rambouillet,
Soviet Merino
Names in parentheses indicate location of development of the genotype.

121
breed, which is of excellent carpet quality. The Avikalin strain evolved fromRambouillet × Malpura halfbreeds has been evaluated for its carpet woolquality the wool produced by this strain is superior to the carpet wool from allindigenous breeds.
Under field conditions, with the use of superior Avikalin rams, there wasan increase of about 15–20% in wool quantity in addition to an increase inbody weight. The quality of wool was also better. Avikalin can be used as animprover breed for crossbreeding with the coarse wool breeds of sheep toincrease carpet wool production. This breed is thus suitable as a dual-purposetype for carpet wool and mutton production.
Fine Wool Production
Attempts to crossbreed native sheep with exotic fine wool breeds forincreasing wool production and quality were made even during the pre-independence period. The major emphasis was to enhance fine woolproduction. As a result of crossbreeding experiments a few new fine woolsheep types were developed in the country and the wool characteristics ofthese are depicted in Table 8.
Bharat Merino
The Bharat Merino breed was developed at the CSWRI, Avikanagar bycrossing Rambouillet/Russian Merino with native Chokla, Malpura, Nali andJaisalmeri ewes and stabilizing exotic inheritance at a level of 75 percent. Thebreed produced annually 2.5–2.8 kg greasy fleece of 20µ fiber diameter,
Table 8. Fleece characteristics of developed types of sheep in India.
Greasy fleece Average staple Average fiber MedullationBreed weight (kg) length (cm) diameter (cm) (%)
Hissardale 1.5 – 2.7 5.5 – 6.2 21.5 – 24.5 0.0 – 0.6Kashmir Merino 2.5 – 2.8 4.8 – 5.6 20.4 – 20.9 0.0Nilgiri 0.2 – 1.4 7.0 – 8.7 21.6 – 27.4 8.4 – 18.0Deccani Merino 1.5 5.8 22.1 1.6Nilgiri Synthetic 1.0 – 1.5 4.6 – 5.0 20.6 – 21.6 1.0 – 3.2Patanwadi Synthetic 1.2 – 1.7 4.6 – 5.2 19.3 – 23.2 9.0 – 20.8Bharat Merino 2.6 – 2.8 2.9 – 9.4 17.6 – 20.2 1.0 – 1.1Avivastra 1.9 3.5 21.6 7.6

122
medullation of less than one percent, and a staple length of 4–5 cm. Since1987, a part of the flock is being performance tested under the subtemperateclimate of the Kodai hills. The performance has been very satisfactory.
This is a promising substitute for fine wool sheep that are imported asimprover breeds. The shorter staple length and lower greasy fleece weightunder semi-arid conditions are attributed to climatic constraints and theinadequate availability of grazing and feed resources. The performance of theBharat Merino at the CSWRI regional station at Mannavanur has beenencouraging. Since it has not been possible to get fine wool with desirablestaple length from the higher crosses in the arid and semi-arid regions, apparelwool production can be intensified only in temperate areas such as thenorthern temperate hilly region and Nilgiri/Kodai hills in the southern region.In these areas three-fourth crosses of the Rambouillet or Merino, including theBharat Merino can be propagated and annual clips obtained to meet therequirements for apparel manufacture.
Kashmir Merino
The Kashmir Merino breed was developed at the Government Sheep Breedingand Research Farm, Reasi (Jammu) using the foundation population producedby mating ewes of Kashmir valley, Gaddi, Bhakarwal, and Poonch breeds withexotic rams of Delaine Merino, Rambouillet and Soviet Merino breeds. Thepresent population of this breed that has 75–82% exotic genes exceeds onemillion. This was achieved after sustained use of the genetic technique over 20years. Inter se mating and rigorous selection has been followed for improvingthe fleece characteristics and body weights in Kashmir Merino. Due to theinvolvement of a number of native and exotic breeds, the Kashmir Merinosheep are highly variable in their morphological and production performancecharacteristics.
Feeding ManagementThere has been a continuous decline in availability of grazing areas for livestockdue to increased population, urbanization, industrialization, and use of fallowlands for cultivation and other activities. It is, therefore, important to developand use the remaining lands for pasture development and tree plantation. Theborder areas under farms or defence artillery ranges can be developed aspasture and used for grazing sheep. Agroforestry, silvipasture, and hortipasture

123
should be popularized. Forest areas, after initial protection for three years,could be used for controlled grazing. The system of extensive grazing should bemodified to semi-intensive system. It may be possible to introduce the feedlotsystem in states such as Punjab, Haryana, and Andhra Pradesh where surplusbroken grains and crop residues for feeding lambs are more readily available atcompetitive rates. Identification of new sources of protein or cheaper sourcesof compound animal feeds and fodder is also necessary. Utilization of by-product and nonconventional feed resources and enrichment of low-gradefeeds is desirable.
Health ManagementDiseases in sheep adversely affect the production performance of the animalsand, in turn, the net profit. Prophylactic health measures against prevalentdiseases and antihelminthic drenching against internal parasites are theimportant health practices that must be strengthened in farmer’s flocks tominimize losses and increase the productivity of sheep. Effective vaccines inadequate quantities against diseases such as enterotoxemia, hemorrhagicsepticemia, foot and mouth disease (FMD), and sheep pox.are essential.Effective control measures against emerging diseases such as Blue Tongue andpeste de petite ruminantes (PPR) must be developed. There should beeffective arrangements for storage and transport of vaccines for which a propercold storage infrastructure must be developed. It is important to controldevelopment of drug resistance. Hence, a proper drenching strategy must bedeveloped to control this problem.
Conclusions• Potential mutton-type breeds such as the Malpura, Sonadi,
Muzzaffarnagari, Madras Red, Mandya, Nellore, Deccani, Mecheri, andGanjam should be restricted to selective breeding by using superior rams forenhancing mutton production.
• Carpet wool producing breeds such as the Nali, Chokla, Patanwadi,Marwari, Magra, Pugal, Gaddi, and Jaisalmeri should be further improvedthrough selective breeding by distribution of good quality rams of the re-spective breeds. Wool quality traits of these breeds better meet the carpetwool requirements of industry.
124
• Efforts should be made to introduce luster in indigenous carpet wool breeds to gain maximum returns through sale of quality carpet wool.
• Apparel wool production should be intensified only in temperate areas suchas northern temperate hilly region and Nilgiri/Kodai hills in the South. Inthese areas three-fourth crosses of Rambouillet or Merino, including theBharat Merino, could be propagated and annual clips obtained to meet therequirements for apparel manufacture.
• Crossbreeds could be tried in areas where adequate feed resources are avail-able.
ReferencesCentral Sheep and Wool Research Institute. 1991. Final Report. AICRP on SheepBreeding and Mutton Unit, CSWRI, Avikanagar, Rajasthan-304501, India.
Central Sheep and Wool Research Institute. 1993. Final Report. AICRP on SheepBreeding, CSWRI, Avikanagar, Rajasthan-304501, India.
Central Sheep and Wool Research Institute. 1996. Annual report. CSWRI,Avikanagar, Rajasthan-304501, India.
Central Sheep and Wool Research Institute. 1998. Annual report. CSWRI,Avikanagar, Rajasthan-304501, India.
Central Sheep and Wool Research Institute. 1998. Transferable Technologies.CSWRI, Avikanagar, Rajasthan-304501, India.
Government of India. 1997. AHS Series-6, Department of Animal Husbandry andDairying, Ministry of Agriculture, New Delhi.

125
1. National Bureau of Animal Genetic Resources, Karnal-132 001, Haryana.
Conservation of Farm Animals in India:Conservation of Farm Animals in India:Conservation of Farm Animals in India:Conservation of Farm Animals in India:Conservation of Farm Animals in India:Challenges and StrategiesChallenges and StrategiesChallenges and StrategiesChallenges and StrategiesChallenges and Strategies
R Sahai1
The term sustainable management has several definitions or connotations.The World Commission on Environment and Development definessustainable management for development as a type of development thatmeets the needs of the present generation without jeopardizing its ability tomeet the requirements of future generations. In the economic context,sustainable development means that the number of users and quantity ofproducts/goods are maintained or made on some constant level, which isecologically non-destructive or depletive over time. It should also meet atleast the basic needs of all segments of the population.
At present, sustainable management is a subject of serious debate. Oneschool of thought proposes that sustainability and continuous developmentare contradictory terms. The process of development involves an increase inentropy and therefore, cannot remain sustainable ad infinitum. Alternateresources or production systems must replace the original one after sometime.
Exploitative production systems have depleted resources at an alarmingrate in recent times. Modern production systems depend heavily on a fewstrains, breed types or crosses, in plants and animals. The local breeds orstrains have therefore been neglected. Low economic viability has alsocontributed to endangerment and degeneration leading to extinction ofcertain forms of genetic resources.
Sustainable management assumes special importance with respect todomestic animals as they are vital sources of milk, meat, hides, fiber, draughtpower, and manure. With the application of biotechnology, genetic resourceshave been increasingly used for obtaining value-added products such as

126
biochemicals, pharmaceuticals, and other genetically engineered substances.Thus, sustainability should be determined on the holistic value of domesticbreeds, though this is seldom done.
Conservation in its broadest sense comprises judicious management of aresource to derive full benefits for the present and ensuring that it retainsproductivity potential so as to meet the needs of the future. Althoughconservation of animal genetic resources is known to be essential, overridingeconomic considerations often jeopardize the attempts to preserve them. Newbiotechnological approaches have the potential for the conservation of geneticresources in the form of sperm, embryos, oocytes, isolated chromosomes,genomic DNA libraries, and isolated genes. Some of these technologies arestill in the experimental stage but hold promise for the preservation of animalgermplasm, which cannot be retained in situ due to poor production.
Conservation of Domestic Animal BiodiversityConservation of animal biodiversity is of the utmost importance because:
• Domestic animals are a part of global biodiversity and heritage of man-kind and should be appropriately conserved and utilized.
• Human societies all over the world have developed social and culturalbonds with certain species or breeds of animals. Numerous religious ritu-als, festivals, and folklore are interwoven with native domestic animals. Insome societies ownership of certain breeds is a status symbol.
• Animal production in the future will require new gene combinations. Onlyconservation of biodiversity can provide genetic variability and materialfor genetic engineering and developing more productive forms.
• Many minor breeds have not been exploited owing to their poor economicvalue and are rapidly decreasing in number. Minority breeds are also valu-able reserves of genetic diversity and should be adequately recognized andexploited.
• Unplanned breeding has led to genetic erosion, dilution, and degenerationof some established breeds. Conservation becomes a vital necessity insuch situations. Conserved germplasm can be used for reintroduction andrevival of lost breeds.
• India is among the countries that have signed the 1992 Global Conventionon Conservation of Biological Diversity. This places the onus for the con-servation of all forms of biodiversity on the country of origin and use.Thus, conservation has become a national commitment.

127
Issues in Sustainable Management
Evaluation of Breeds vis-à-vis Economic Viability
Barring sporadic studies on a few breeds reared on organized farms,domestic animals have not been evaluated systematically for their totalutility and economic viability. The production systems adopted by ruralfarming communities are radically different from those of organized farms.Therefore, information on productivity of breeds in organized farms cannotbe extrapolated to farmer’s herds. Improved breeds with high productionpotential require special care and quality inputs for better performance. Fornative breeds, strategies for production improvement are urgently needed toensure their conservation.
Population and Production Paradox
The animal genetic resources scenario in India is a strange paradox ofprosperity and poverty. Farm livestock populations are exceedingly high inrelation to the land area, while the productivity of the animals is much lowerthan in Europe, America, and Australia. The high livestock populationdensity leads to diminished availability of inputs as well as poor maintenance,causing deterioration in the quality of animals. Thus, conservation in Indiashould also include measures to prevent dilution in qualitative terms inlivestock breeds.
Authentic information on population and status of various breeds offarm animals is scanty. Farm animals have been enumerated in eachsuccessive livestock census on the basis of species with no reference tobreed. An attempt has been recently made to separately catalogue crossbredcattle. It is thus difficult to infer the status of a breed as threatened orendangered. The problem is further compounded by the fact that a numberof breeds have not been accredited and characterized.
Dilution, Decline, and Degeneration
Between 60–80% of farm animals fall into the nondescript category. Barringa few organized farms which still maintain small nuclear herds of purebreeds, there is unrestricted interbreeding. Furthermore, breeding plansrecommended by Central and various state governments are seldomfollowed rigorously.
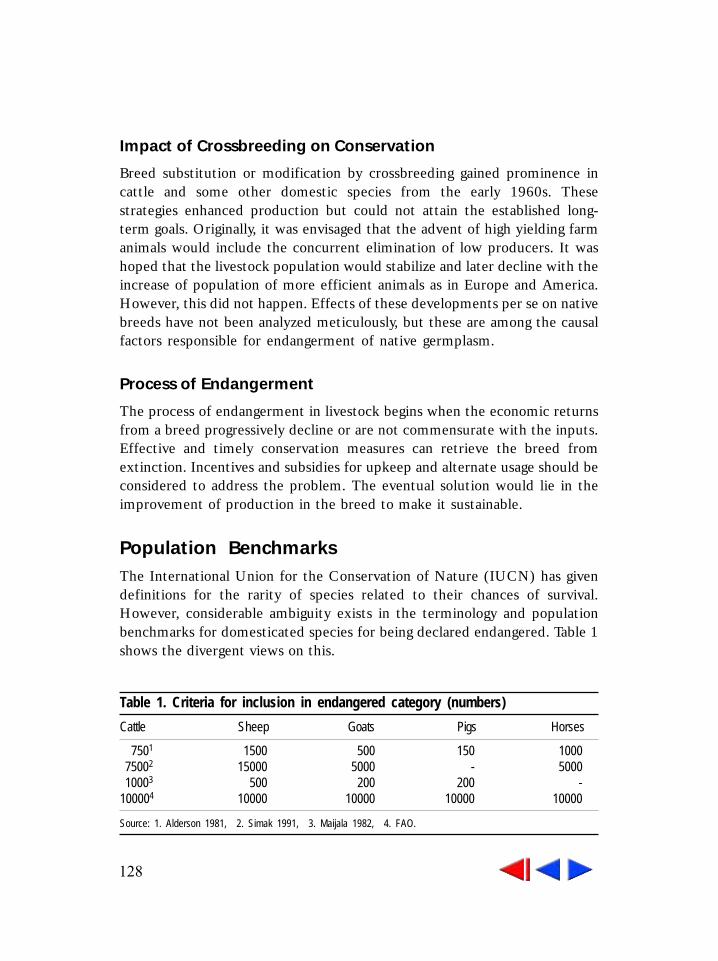
128
Impact of Crossbreeding on Conservation
Breed substitution or modification by crossbreeding gained prominence incattle and some other domestic species from the early 1960s. Thesestrategies enhanced production but could not attain the established long-term goals. Originally, it was envisaged that the advent of high yielding farmanimals would include the concurrent elimination of low producers. It washoped that the livestock population would stabilize and later decline with theincrease of population of more efficient animals as in Europe and America.However, this did not happen. Effects of these developments per se on nativebreeds have not been analyzed meticulously, but these are among the causalfactors responsible for endangerment of native germplasm.
Process of Endangerment
The process of endangerment in livestock begins when the economic returnsfrom a breed progressively decline or are not commensurate with the inputs.Effective and timely conservation measures can retrieve the breed fromextinction. Incentives and subsidies for upkeep and alternate usage should beconsidered to address the problem. The eventual solution would lie in theimprovement of production in the breed to make it sustainable.
Population BenchmarksThe International Union for the Conservation of Nature (IUCN) has givendefinitions for the rarity of species related to their chances of survival.However, considerable ambiguity exists in the terminology and populationbenchmarks for domesticated species for being declared endangered. Table 1shows the divergent views on this.
Table 1. Criteria for inclusion in endangered category (numbers)
Cattle Sheep Goats Pigs Horses
7501 1500 500 150 100075002 15000 5000 - 500010003 500 200 200 -
100004 10000 10000 10000 10000
Source: 1. Alderson 1981, 2. Simak 1991, 3. Maijala 1982, 4. FAO.

129
In developing countries, the risk of population/breed loss due to disease,adverse climatic conditions, and drought are high. Therefore, population sizeof domesticated breeds of various species from the standpoint of vulnerabilityshould be much higher than those suggested by various experts.
Survival Value of Breed for ConservationProgressive improvement in the production potential over a period of time isan in-built security for the survival of breeds. It has been contended thatexotic breeds with superior productivity or crosses are less adaptable thanthe indigenous breeds; yet they have better survival value in the productionsystem owing to higher monetary return. The majority of indigenouslivestock breeds have genetic attributes like better capacity to withstanddrought, superior resistance to tropical diseases, and better capacity toutilize coarse forages. Despite this, low productivity diminishes their survivalvalue necessitating conservation.
Herd Books of Animal Genetic ResourcesThe creation of herd books in the 1940s was the first meaningful attempt toregister animals conforming to certain well-defined genetic attributes andproduction traits. The aim was to identify promising animals and ensuretheir optimal utilization particularly in improving the production level of thebreed. So far, Haryana, Gir, Kankrej and Ongole cattle, and Murrah andSurti buffalo have been included in registration programs. Additional breedssuch as Rathi, Nagori, and Khillari cattle will soon be included. No schemefor other livestock breeds exists at present.
Participation of Farming Communities in ConservationThe Convention on Biological Diversity recognizes that the localcommunities are the real custodians of biological diversity and have vitalstakes in conservation. They should thus be involved fully in conservationprograms. Farming communities should also share the benefits fromsustainable utilization. At present, many financial institutions provideincentives and loans for the rearing of exotic or high-yielding crossbreeds,but do not provide similar assistance for indigenous stocks. Encouraging thepropagation of native breeds will progressively increase their sustainabilityand they will be automatically conserved.

130
Legal Framework – a Gray Area in ConservationThe new patent laws and issues relating to intellectual property rights haveneither been properly understood nor assessed in relation to their impact ondomestic animal genetic resources. The laws on domesticated animals areinadequate and are not strictly observed in the absence of stringent punitivemeasures. These laws should cover all aspects of conservation such asbenefit sharing, transfer, acquisition, accession, generation and sharing ofinformation, and misuse and abuse of domestic animals. Currently, misuse,overexploitation, and non-judicious utilization of genetic resources arerampant. The following aspects require examination from the legalstandpoint:
• Laws regarding trusteeship/ownership of animal genetic resources in genebanks outside the country.
• Laws prohibiting/permitting use of genetic resources/material, and puni-tive measures for infringements.
• Terms, conditions, rights, and obligations in such transactions involvingthird parties and further transfer of genetic resources.
• Transfer of genetic resources for commercial use and research – rightsand obligations, and benefit sharing.
• Laws on the piracy and acquisition of classified data on animal geneticresources.
• Regulations on networking with global agencies.• Legal guidelines on negotiations for bilateral agreements.• Legal frameworks for the establishment and working of databanks.• Laws regarding benefit sharing by parties and local communities.• Rules and monetary obligations of nongovernmental organizations
(NGOs) handling animal genetic resource conservation programs.• Laws covering breed registration societies and other similar organizations.
Vistas of ConservationThe vistas of conservation and utilization in the Indian context aremultifaceted and complex. These should cover the following aspects:• Judicious and scientific management of livestock breeds to progressively
enhance their sustainability.• Strategies for the preservation of less productive breeds with adequate
genetic variability and distinctive characteristics as a part of genetic security.

131
• Development of technologies for enhancing sustainability. Alternate usesof the breed may at times ensure conservation.
• Establishment of in situ and ex situ gene banks.• Establishment of informatics system having data banks with interactive
networking with other organizations and global agencies.• Development and progressive upgrading of software and hardware for
computerized inventory systems.• Building of regional level Livestock Conservation Boards/Conservation
Units. Attempts should be made to enlist services of avid conservationistsand committed NGOs in such ventures.
• Formulation of breeding policies with well defined objectives consistentwith the economic conditions of the farmers, and ethos of conservation;
• Formulation of livestock population policy to ensure that animal popula-tions are consistent with the carrying capacity and environmental manage-ment;
• Steps for people’s participation in conservation programs through BreedSocieties, Associations, Breed Survival Trusts and NGOs.
• Enactment of laws pertaining to data banks, gene banks, transfer/move-ment of genetic resources, patenting of genetic resources, prohibitiveand punitive laws for preventing abuse, and misuse.
• Development of financial and institutional mechanisms that are mandatedto support conservation of domesticated animals.
It is obvious that sustainable management, coupled with enhancementof the economic returns are key elements for conservation. However, lessviable breeds should be supported being a part of the genetic heritage ofmankind as well as to maintain genetic diversity.
ReferencesAlderson, L. 1981. The conservation of animal genetic resources in U.K. FAO AnimalProduction and Health Paper 24, Rome, Italy, pp.53-76.
Maijala, K. 1982. Preliminary report of the working party on animal genetic resourcesin Europe. In Conservation of animal genetic resources, Session 1. Commission onAnimal Genetics, EAAP, GI, Leningrad, Russia.
Simak, E. 1991. The conservation of rare breeds of West Germany. Pages 65-69 inGenetic Conservation of Domestic Livestock (Alderson, L., ed.). CAB International,Wallingford, UK.

132
1. National Institute of Animal Nutrition and Physiology, Adugodi, Bangalore 560 030.
Potential of Nutritional TPotential of Nutritional TPotential of Nutritional TPotential of Nutritional TPotential of Nutritional Technologies inechnologies inechnologies inechnologies inechnologies inImproving Livestock ProductivityImproving Livestock ProductivityImproving Livestock ProductivityImproving Livestock ProductivityImproving Livestock Productivity
Khub Singh and C S Prasad1
Adequate nutrition is important for maintenance, growth, and reproduction ofanimals. Indian livestock are underfed and undernourished. India is short ofdry fodder by 31%, green fodder by 23%, and concentrate feeds by 47%(World Bank, 1996). This is due per se to the huge numbers of animals inrelation to available feed and fodder resources. Animals largely derive theirfeed requirements from crop by-products and grazing on common lands.Further, a majority of livestock is owned by small landholders and the landless,who often face acute shortage of feed and fodder.
Animal science research has yielded a number of biochemical andmechanical technologies that, besides improving the nutritional quality offeed, also help avoid wastage of these resources. The efficacy of many of thesetechniques has been proved, yet their adoption has remained restricted andsporadic due to a number of operating constraints. This paper describesdifferent nutritional technologies and attempts a subjective assessment oftheir adoption and impact.
Chopping Green FodderChopping of green fodder and unthreshed straws/stovers is a simple buteffective technology. This has developed gradually from use of various hand-operated chaffing blades to power-operated mechanical mega-chaff cutters ofvarying capacities. Residues of crops such as rice, millets, and maize are longand need chopping before being fed to livestock.
Ruminants reduce feed particle size by chewing. Energy spent onchewing reduces the amount of metabolizable energy (ME) used for
133
production, and can thus have a substantial negative effect on productivity.Feeding of chopped roughage reduces the energy wasted while chewing.Chopping green fodder, straws and stovers helps in adopting strategicsupplementation, improves the palatability of less-preferred roughages bymixing with highly palatable fodder, improves digestibility, and reduceswastage. The net biological value of the feed also improves.
Chaffing of all varieties of green fodder including sugar tops, straws, andstovers such as rice, maize, pearl millet (bajra), and sorghum (jowar) ispracticed in most of northern India.
Wetting and SoakingWetting and soaking of roughage and concentrates is also a simple and age-oldtechnology. The straws, stovers, and concentrates (ingredients or mixtures) areeither soaked in water or moistened just prior to feeding. This hydration of theparticles facilitates their digestion in the rumen.
Soaking of concentrate mixtures or ingredients is a common practicefollowed in most parts of the country. Soaking or wetting of straws and stoversis however not as common. During the hot-dry periods in some parts of thecountry the wheat straw (bhoosa) is soaked/wetted before feeding toruminants.
Addition of soaked concentrate mixture or ingredients such as cakes,bran, chuni, and flour to chopped straws and stovers improves theirpalatability and the total dry matter intake of basal diets comprising dryroughage. Mixing of high density concentrates and low density roughagesresults in even distribution of nutrients and facilitates better microbial andenzymatic action in the rumen.
Soaking or wetting of straws helps remove some of the undesirableelements such as excess oxalate in rice straw. Soaking roughage andconcentrate is common where animals are fed a gruel. Soaking of straws orstovers for long periods however may result in the loss of some solublenutrients, so care must be taken that the soaking is only for very short periods.
Grinding and PelletingGrinding and pelleting involve physical treatment that enhances the utilizationof fibrous feed stuffs by ruminants. Grinding decreases particle size andincreases the bulk density of leaf and stem fraction of forages. Ground

134
roughage is further processed by pelleting or cubing before feeding to theanimals. Pelleting helps increase the bulk density and decrease dustiness. Thisis a common practice wherever concentrates are fed.
Commercial feed-manufacturing mills/factories pellet the concentratemixture for different species of livestock. Preparation of a complete feedcomprising of concentrate and roughages has not been adopted by commercialfeed manufacturers mainly because of the high processing costs.
Grinding and pelleting of roughages increase feed intake and reducefeed:gain ratio. Digestibility of ground and pelleted roughages is generally lowcompared to the original material fed in either long or chopped forms due to areduction in fiber digestion. However, grinding and pelleting of foragesdramatically reduces the time that ruminants spend on chewing the longcoarse material, resulting in the increased availability of digestible energy forproduction. Although the performance of animals improves with processedfeeds, net energy (NE) content of poor quality roughages still remains poor.Furthermore, the process of grinding and pelleting is energy dependent and,hence, the technology has not received much attention.
Conservation of Feeds and FodderSeasonal feed deficits can be reduced considerably or overcome throughconservation and storage of feed resources during surplus seasons for use inlean periods. During the monsoon, plenty of green fodder is available in fields,on bunds, roadsides, and under forest covers. These can be profitablyconserved for feeding. The surplus fodder can be conserved as hay in a dryform or as silage in a wet form.
Haymaking
This involves reducing the moisture content of green forages to less than 15%,so that they can be stored without spoilage or further nutrient loss. Greenforages with 80–85% dry matter preserve most of their nutrients. Crops withthin stems and more leaves are better suited for haymaking as they dry fasterthan those with a thick, pithy stem and small leaves. Leguminous fodder cropsshould be harvested at the flower initiation stage or when crown buds start togrow, while grasses and other fodder crops should be harvested at the pre-flowering stage. They should preferably be harvested when air humidity is low.

135
The harvested forage is spread in the field and raked a few times for quickdrying. The dried forage is then collected and baled when the moistureconcentration is low (<15%) which helps storage and requires less space.Crops with thick and juicy stems are dried after chaffing to speed up thedrying process and to prevent loss of nutrients.
Field curing is conducted during bright sunny weather but may result inbleaching of the forage and loss of leaves due to shattering. To avoid this,drying can be done in barns by passing hot air through the forage. Althoughartificial drying produces hay of good quality, it is expensive and beyond thereach of small and marginal farmers.
The technology of haymaking is fully standardized and can be easilyapplied under favorable conditions. However slight carelessness could result inloss of quality or even complete spoilage. Conservation of fodder is notundertaken routinely by the average Indian farmer.
The reasons for the low adoption of this technology are:
• Lack of knowledge of the benefits of fodder conservation.• High losses due to incorrect harvesting time and weather conditions.• Lack of interest and skills for proper preservation and storage.• Losses due to shattering and dropping of leaves, especially in legumes.• Losses of soluble nutrients due to leaching caused by rain during the drying
period.• Storage of hay with high moisture content resulting in mold growth.• Extra expenditure in terms of labor and materials for the processing of
green fodder.Haymaking is one of the best methods of preserving forages. Feeding hay
to livestock helps reduce the amount of concentrate feeding, and thereby, thecost of feeding. The low moisture content of hay considerably reduces costsand efforts involved in transportation and handling. The surplus green grassesavailable during the monsoon in the forest go unused and could be put to thebest possible use by this process.
Silage Making
Silage is the product of controlled fermentation of green fodder retaining highmoisture content. Naturally produced organic acids, chiefly lactic acid,preserve the green fodder. Silage making involves selecting crops and plantmaterials rich in soluble sugars with dry matter concentration of about

136
15–30%. The material is stored in pits under anaerobic conditions. Chaffing ofthe material for ensiling increases the compactness. The silo should be airtightafter filling. Fermentation begins within hours of closing the silo andaccelerates in the next two to three days. Molasses or jaggery is added toincrease the fermentation. Organic acids (primarily lactic and acetic acid),ethanol, and gases such as carbon dioxide (CO2), methane (CH4), andammonia (NH3) are produced during the fermentation process. The pH of thebiomass is reduced to below 4.0, resulting in the termination of all biologicalactivities. The material remains conserved. This method preserves the foragematerial for a long period with minimal nutrient loss.
Crops rich in soluble carbohydrates, such as maize, oats, sorghum, pearlmillet, and cultivated grasses are most suitable for ensiling. During abundantgreen fodder availability they can be converted to silage and stored for use intimes of scarcity. The crops should contain about 30–35% dry matter at thetime of ensiling. Sorghum and oats should be harvested at the flowering stagewhile maize has to be harvested at the milk stage.
Large quantities of sugarcane tops rich in soluble carbohydrates areavailable in sugarcane growing areas during the crushing season. Only 30% ofthe available sugarcane tops is used for animal feeding as fresh feed and therest is partly used as fuel. Conversion of these to silage would providesufficient wet fodder during summer.
Tall varieties of rice are grown in some traditional rice-growing areas inIndia. They are susceptible to lodging under conditions of high fertilization, toavoid which, one-third of the top portion is removed during the vegetativestage. Fresh straw of many dwarf varieties is quite succulent at maturity andcontains about 50–65% moisture at harvest, making it suitable for ensiling.Silage making is not an established practice in most parts of India due toreasons such as:
• Lack of surplus forage during the rainy season.• Labor requirement for cutting, raking, collecting, chopping, pit construc-
tion, and materials (polyethylene, molasses) are a problem in some areas.
Some of these problems may be overcome if the milk cooperatives andstate animal husbandry departments prepare large silos. Preparing silage nearreserve forest areas by harvesting the forest grasses at a proper stage andensiling them, rather than drying and burning, would be useful.
137
Urea-Ammoniation of StrawsUrea treatment of straws is so far the most accepted chemical treatment. Urea(fertilizer grade) available in all parts of the country is relatively safe, easy tostore, and dissolves easily in water. Urea treatment is more feasible in tropicalclimates because it breaks down quickly into ammonia under higher ambienttemperatures. The treatment is quite flexible, as it can be adapted to localconditions and preferences. Of all treatments the economics of urea treatmentis best understood.
The treatment process is simple, and 4 kg urea is the optimal amount totreat 100 kg of air-dried straw. Water is essential as it helps in the hydrolysis ofurea and also acts as a carrier for the ammonia to penetrate the cell walls of theplant material. The moisture level is not very critical to the process but a 30–40% moisture level gives the desired effect. The total cost for treating onetonne straw is Rs 800/-. Feeding livestock with urea-treated straw can result insaving of concentrates to the extent of 1.5 kg animal-1 day-1.
The key factor that determines the economics and practicality of ureatreatment is the method of storage. Cemented storage structures are ideal butnot practical in the field. Pits or mud structures may also be used. Coveringthe stack is important and can be achieved by using polythene sheets, emptyurea bags stitched together, or even dried grass/leaves to keep it airtight.
This technology is most likely to work when:
• Plenty of dry, slender straw is available.• Straw is cheap compared to other feeds.• There is a shortage of grasses or other green fodder.• Water is freely and conveniently available.• The price of urea is not prohibitive.• The cost of polythene covering is low.• Labor is easily available
Microbial growth in the rumen depends on the nitrogen supply, rumen-digestible energy, and sources of phosphorus and sulfur. The efficiency ofmicrobial production depends on the amount of microbial biomass producedper unit of adenosine triphosphate (ATP) during fermentation ofcarbohydrates in the rumen to volatile fatty acids (VFAs). Cell wallcarbohydrates are the major source of energy for rumen microbes on a strawdiet. Insufficient energy from cell wall-rich crop residues is often a limitingfactor to ruminant productivity in the tropics. Urea ammoniation, apart from

138
being a source of nitrogen for microbial synthesis, also provides additionalenergy due to the weakening/loosening of the lignocellulose bonds in thetreated straw.
Urea-treated straw feeds save on concentrate feeding, increase milk yieldby 1–2 litres animal-1 day-1, reduce the land area required for green fodderproduction, and offer better economic returns to the farmer. Treated straw canbe fed to growing, lactating, and pregnant cattle and buffalo. The feedbackfrom farmers who have adopted this technology indicates:
• Increase in straw consumption.• Better growth performance.• Improvement in health.• Increase in milk yield ranging from 0.5–1.5 litres animal-1 day-1.
Despite acknowledging the benefit of the technology duringdemonstrations, farmers have not enthusiastically continued urea treatment.The most important reason for this is that in most cases the returns aremarginal. Other constraints are:
• Production of sticky dung complicates the preparation of dung cakes.• Pungent smell of ammonia.• Spoilage of straw in open stacks.
Urea-Molasses TreatmentMolasses is used to improve the palatability of the basal feed or as a source ofreadily fermentable energy, which may stimulate microbial fermentation inthe presence of other nutrients such as nitrogen (urea) and phosphorus(phosphoric acid). Spraying of straw with 10% molasses and 2% urea is foundto improve intake and digestibility of the basal roughage. Urea provides anadditional source of nitrogen.
A urea-molasses-mineral block (UMMB) has been developed recently,which contains soluble and fermentable nitrogen from urea, highlyfermentable energy from molasses, and essential minerals. Natural proteinsources such as groundnut extract and cottonseed extract have also beenadded to provide preformed peptides and amino acids.
The field application of urea-molasses by spraying is limited owing todifficulty in handling of the mixture and toxicity in cases of uncontrolledintake. The high cost of molasses is also a limiting factor. The method is

139
particularly useful in situations where there is plenty of straw, medium to lowanimal production, and limited access to other supplements. The UMMBtechnology has been tested on-farm in Gujarat and was more popular withfarmers maintaining buffalo. Modifications have been made to improve thenutrient balance and consistency for better acceptance by farmers.
Supplementation of UMMB has been found to improve the dry matterintake of the basal roughage and the feed digestibility. The nutrients from theblock are well utilized by the animals and UMMB supplementation improvesreproductive performance of cows due to enhanced availability and utilizationof nutrients, particularly micronutrients.
Calf Starter/Milk ReplacerCalf starter is a balanced concentrate mixture fed to calves from the 10th dayof age to supplement the nutrients and raise them on a limited milk intake.This provides a balanced diet to the calf and cuts down the cost of milkfeeding. Generally 16% digestible crude protein (DCP) and 70% totaldigestible nutrients (TDN) in the calf starter are sufficient for a satisfactorygrowth. The protein quality is important during the pre-ruminant stage. Thecalf starter should contain a major proportion of grains to provide readilysoluble carbohydrates, protein-rich sources such as cakes, fat sources, andmineral mixture. The constituents of the calf starters can be altered accordingto the feed availability. Ingredients such as barley/oats/millet grains,groundnut cake/linseed oil meal/soybean oil meal, wheat bran/rice bran,fishmeal, and mineral supplements can be used to make a good quality calfstarter. Good quality hay or leguminous green fodder given in addition to calfstarters has been found to encourage the early development of rumenfunctions.
The adoption of this technology has been limited because of thefollowing reasons:
• The farmer feels that he is unethically depriving the calf of milk.• There is a lack of awareness of the technology.• There is a (wrong) perception that the health of the calf would be affected.

140
Bypass NutrientsBypass nutrients are fractions of the nutrients that are fermented to acomparatively lower degree in the rumen. They then become available intactat the lower part of the gastrointestinal tract for subsequent digestion andabsorption. The approach envisages minimization of ruminal fermentationlosses and better utilization of the nutrients after their digestion andabsorption in the small intestine. There are three types of major nutrients thatcould bypass rumen fermentation to a certain degree. These are proteins/amino acids, starch/glucose, and fats/fatty acids.
Slowly degradable or bypass nutrients may occur in feeds in their naturalform. Alternatively, feeds that are highly degradable in the rumen can also bemanipulated to restrict their degradation.
Bypass Proteins
A high proportion of the soluble plant protein from roughage-based diets isdeaminated and lost as ammonia during digestion in the rumen. This isbecause the rate of protein degradation is faster than the utilization of nitrogenfor microbial growth. Thus, if part of the protein is not degraded in the rumenit can be utilized more efficiently in the small intestine.
Several feed ingredients have been screened for their bypass proteinvalue. Some of them such as cottonseed cake, fishmeal, solvent-extractedcoconut cake, subabul leaf meal, soybean extract, sunflower extract, andmaize gluten meal have bypass characteristics in their natural form. Howeverfeeds such as groundnut cake, wheat bran, gingelly cake, and horse gram haveto be manipulated to reduce their rumen degradability for optimization ofratios between degradable and nondegradable fractions in the diet.
Chemical- or heat treatments are the main methods used for protectingproteins. Heat treatment of groundnut cake at 130°C for two hours orformaldehyde treatment at 1% of crude protein (CP) significantly increasesthe bypass protein of the cake (up to 50%).
Feeding bypass protein to high yielding animals (about 10 litres day-1 ormore) and fast growing calves (500 g day-1) would offer better economicreturns to farmers by way of increased milk production/growth rate. Lactatingcows yielding 8 litres and above require about 50% of CP in the feed in theform of bypass protein particularly when fed on straw based diets. Theeconomic returns of feeding bypass protein to animals are quite substantialbecause of increased production (1.5 kg animal-1 day-1).

141
Use of bypass protein feeds by farmers is limited. Lack of awareness is amajor constraint. In some parts of the country the farmers use natural highbypass protein sources and even heat treatment to a limited extent.
Bypass Starch and Bypass Fat
Starch can be protected from ruminal hydrolysis with formaldehyde- orammonia treatment. Encapsulating fats/lipids with formaldehyde-treatedprotein is an effective method of protection against ruminal hydrolysis andbiohydrogenation of lipids. However, the method has its limitations due to theuse of formaldehyde. A simpler approach is the conversion to calcium salts offree fatty acids removed from edible oils during refining. These are protectedagainst rumen degradation.
Feeding bypass starch reduces excess production of lactic acid in therumen, which otherwise inhibits digestion of fiber. The starch leftunfermented in the rumen is digested in the small intestine, producing glucosewhich, after absorption, is more efficiently used as an energy source by theanimals.
Feeding protected fats to high-yielding animals that receive low fatdensity diets increases milk yield and also efficiency of energy utilization.Providing higher fat supplements without protection affects the utilization offiber in the rumen. Providing bypass fat is necessary to meet the energyrequirements of high-yielding cows, especially in early lactation.
Both the technologies are useful only for high yielding animals and thushave limited level of adoption. The technology is being commercialized.
Mineral SupplementationAlthough minerals are required in only small quantities, mineral deficiency canhave a marked effect on productivity, reproductive performance, and health.Under farming systems, where straws/stovers form the major source ofroughage, the role of minerals becomes more pertinent as these roughages arelow in many minerals and contain certain antinutritional factors such asoxalates, tannins, and silica, which may affect mineral utilization. Mineralimbalances depend on the type of feed and where it is grown. Mineral needsdepend on animal output and supplements are particularly important for high-yielding animals.
Feeding of formulated mineral mixtures or pure ingredients, although

142
simple, is not a cost-effective method. Besides, the bioavailability of mineralsis greater from organic than inorganic sources. Selection is therefore based onthe biological availability or release and absorption coefficient. In areas ofacute mineral deficiency or where animals exhibit chronic symptoms ofdeficiency, providing chelated organomineral complexes with highbioavailability is a better approach. Providing region-specific mineralsupplements based on mineral mapping is an alternative cost-effectiveapproach. The best way of providing mineral supplements is through the feedor fodder/top feed sources, which are rich in minerals, without affecting thefeeding practices followed by the farmers. Few farmers use mineralsupplements, except on the advice of a veterinarian.
Supplementation of the diet with a mineral mixture is an effective way ofovercoming most reproductive problems such as repeat breeding, low fertility,infertility, delayed postpartum estrus, and silent heat. It is also essential foroptimum level of production whether it be milk, meat, egg, or woolproduction.
Strategic SupplementationFeeding only straw does not provide sufficient nutrients to maintain theanimals, although coarse straws (millets, sorghum, maize) give better resultsthan slender straws (rice, wheat, barley). Feeding straw for a short period maybe good for survival or for dung production, but to achieve higher levels ofmilk, meat, or draught power, straw must be either treated or supplementedwith better feeds. Supplementation can be made with concentrates, roughage,or both.
Supplementation of straws with deficient nutrients such as nitrogen andminerals to improve straw intake and digestibility is called catalyticsupplementation. Use of small amounts of concentrate supplements, licks,kitchen waste, or green fodder may achieve this objective. Supplementationfor increased straw intake is achieved through improved rumen function. Theamount of supplement is small in this case, since higher levels ofsupplementation decreases straw intake through a substitution effect, whichmay be inevitable when feeding high-producing animals as the level ofsupplement required is very high.
Farmers generally feed cakes/bran or grass to their productive stock alongwith straw. This technology is viable and sustainable and does not greatlyinterfere with the existing farming system. Technical information available on

143
the nutritive value of supplementary diets and strong extension support arerequired for increased adoption of this technology.
For an animal to maintain body weight and produce 2–3 litres of milkday-1 catalytic supplementation (provision of urea, small amounts of cake,bran, or green fodder) is recommended. For higher levels of productivitysupplementation with concentrates, green forages, or compound feeds isrequired. The level and type of supplementation depend on the availability ofsupplements, their prices, and the desired level of production. Forsupplementation to be economically attractive, the value of increased outputhas to be greater than the cost of the supplement.
The addition of small amounts of supplements increases the intake ofpoor quality roughage. Supplements such as urea, oil cakes, or green fodderimprove the intake of crop residues by providing a more favorable rumenenvironment. Straw sprayed with 2% urea improves straw intake by about10%; just enough for an animal to achieve maintenance. Groundnut cake fedat a rate of 20% of straw dry matter intake (finger millet straw-based diets)improves dry matter intake and digestibility. Furthermore, supplementing a
Table 1. Screening of supplementation strategies for three hypothetical andsimplified farming systems.
Survival feeding; Survival feeding;Urban Village plenty of low no roughagedairies conditions quality roughage available
System characteristicsCost ratio
(supplement/roughage) Low High Very high Not availablePrice ratio
(milk/supplement) High Low Very low Very lowSystem objectives Milk Milk, dung, Survival Survival
draught
Supplementation strategiesCatalytic Not relevant Not very Very relevant Not relevant
relevantStrategic Not relevant Sometimes Relevant Not available
relevantSubstitutional Very common Not common Irrelevant Not available
Source: Handbook for straw feeding systems (Singh , K. and Schiere, J.B. 1995).
Note: This screening is an approximation.

144
diet of finger millet straw and wheat bran (75:25) with groundnut cakeimproves nutrient digestibility. Use of legumes or top feeds (Sesbania,Gliricidia, Leucaena) which supply nitrogen and minerals increases strawintake. Mixing local grasses/top feeds/green fodder with straw duringchopping will enhance intake and digestibility and also helps in producing goodquality dung. This technology is suitable where straw is cheap, supplementsare expensive, and where only low production/growth is achievable.
Probiotics / Growth PromotersAntibiotics and antimicrobials when used in low quantities (subtherapeutic) asgrowth promoters, increase feed and reproductive efficiency, and reducemortality. However, their use has created much controversy on the possibilityof drug residues in animal products that may be toxic to humans. Theantibiotics are pure chemical compounds and are absorbed in the digestivetract. They improve growth and feed efficiency but can cause mutation ofother microorganisms.
Most probiotics are specific in their action and are used to improve feedutilization, uptake of nutrients, or feed efficiency by altering the rumenfermentation and/or improving feed conversion efficiency. The mostcommonly used probiotics are yeast cultures (Saccharomyces cerevisae andAspergillus) and bacteria (Lactobacillus spp., Bacillus subtilis, Streptococcusspp.), which are available commercially in the form of water-soluble powders,liquids, or as feed additives. In addition to bacteria and yeast, some enzymecultures are also being used as additives for improving the nutritionalefficiency of feedstuffs.
Some enzymes when added to the feed increase the availability ofpolysaccharides (starch) and proteins, partially hydrolyze viscouscarbohydrates (beta-glucans, arabinoxylans) present in some grains,supplement the animal’s endogenous enzymes, and hydrolyze fibrousmaterials that are not hydrolyzed by the endogenous enzymes. These effectsare generally more evident in young animals whose digestive systems are notcompletely developed.
Several manufacturers are now adding probiotics to their compoundfeed. The use of probiotics by farmers themselves is negligible due toprohibitive cost, lack of awareness, and inconsistent results.
145
Manipulation of the Rumen EcosystemIncreasing digestion of fiber by manipulating rumen microbes is beingexperimentally tested. The types and numbers of fiber-degradingmicroorganisms in the rumen have been identified under varying feedingconditions. Knowledge of the genetic diversity and number of these organismsat the species and strain level is lacking. The identification of specificpopulations of rumen microorganisms in their natural environment is likely toimprove due to molecular techniques based on 16S rDNA sequences that canphylogenetically identify these organisms. Further studies may alsodemonstrate the possibility of ascribing activity to organisms on a phylogeneticbasis.
The enzymes reintroduced into the dominant rumen bacteria have beenprimarily cellulases, xylanases, and more recently, esterases. Howevermechanisms involved with the binding and presentation of rumen bacteria andenzymes to cellulose (e.g. cellulosome complex) are still poorly understood,impeding the ability to manipulate a rate-limiting step in the kinetics ofruminal fiber digestion. Recent studies have demonstrated that the genusRuminococcus is very diverse in both genotype and fiber-digesting ability andmay therefore be amenable to manipulation. The technology has not beenperfected so far and efforts in this direction are continuing.
Non-genetic manipulation of the protozoa in the rumen by chemical andbiological means has been tried. Although the balance of nutrients available tothe animal may improve, treatment of ruminants with defaunating agents toremove ciliate protozoa from the rumen had a secondary effect on populationof rumen fungi and bacteria. This technology has thus not been accepted as aneffective approach.
Genetic Manipulation for Improvement in NutritiveValue of Straws/StoversThe nutritive value of crop residues can be improved by genetic manipulation.Genetic manipulation has been used to increase grain production, resistance todisease, and drought resistance in crops. Some of the attributes incorporatedin this process might adversely affect the quality of crop residues. High silicaand lignin for example could be protective for the plant but adversely affectthe nutritive value of crop residues. Genetic manipulation for improvement in

146
quality and/or quantity of straws and stovers, without negatively affecting thegrain yield, could resolve many problems in mixed crop-livestock farmingsystems. Not much emphasis has been laid in the past on genetic manipulationof crops for improvement in quality and/or quantity of straws and stovers.
Recombinant DNA technology is being used to produce transgenicsubterranean clover (Trifolium subterraneum) and lucerne with increasedconcentrations of proteins that are resistant to rumen degradation and arehydrolyzed rapidly by intestinal proteases. These forage legumes have beentransformed with genes encoding for the sulfur amino acid-rich proteinssunflower albumin and ovalbumins, which are degraded slowly by rumenmicroorganisms. Improving forage protein quality through geneticmanipulation is promising but progress is relatively slow.
The adoption of this technology does not require much effort. However,the relative contribution of genetic and environmental effects needs to bebetter studied. This requires a coordinated approach by the plant breeders,geneticists, animal nutritionists and physiologists. Controlled experimentsleading to a better understanding of the effects of environmental factors onplant physiology and straw quality such as leafiness, translocation of cellsolubles from stem to grain, hemicellulose-cellulose ratio, lignification of cellwalls, and digestibility need to be conducted.
The ultimate decision to adopt a particular technology depends to a greatextent on the farmer’s perceptions about the technology attributes and theirsocioeconomic relevance. There is a growing concern among researchers,extension personnel, and policy makers to include farmers’ perceptions ingeneration and adoption of technology. Lack of coordination among variousagencies has often resulted in delay or failure in the accomplishment of thegoals. There is an urgent need to work out possible feed options, utilizing feedresources available to farmers in different agroecological zones of the country,to match the nutrient requirements of the animals. This is a gigantic butnecessary task that should not be delayed any further.
ReferencesSingh, K. and Schiere, J.B. (eds.) 1995. Handbook for straw feeding systems:principles and applications with emphasis on Indian livestock production. Indo-DutchProject on Bioconversion of Crop Residues.

147
Oilseed Cakes for Improving Animal NutritionOilseed Cakes for Improving Animal NutritionOilseed Cakes for Improving Animal NutritionOilseed Cakes for Improving Animal NutritionOilseed Cakes for Improving Animal Nutrition
D M Hegde1
Improving efficiency of feed use is critical to raising the productivity andprofitability of animal agriculture. The cost of feed accounts for 50–60% of thetotal cost of production in ruminants and 65–80% in nonruminants underintensive production systems. The significant impact of improved nutrition onanimal productivity in the developing countries has repeatedly beenhighlighted (ILRI 1995). Crop residues and other cellulosic materials arestaple ruminant feeds in India. The low nitrogen and mineral content, alongwith high lignin and silica contents of roughage, lead to its low digestibility. Toachieve productive levels in the animal consistent with their genetic make-up,the straw-based rations need protein-rich oilseeds and oil cakes assupplements. This is important in countries such as India that have enormouslivestock populations and shortages of feed in relation to requirements. Theobjective of this paper is to assess the oil cake availability for feed use and itscontribution towards improving the nutritional security of livestock byexamining various oil cakes for their nutritional attributes.
Oilseed Meals and CakesIndia is the third largest producer of oilseeds after the USA and China. Itaccounts for 8.8% of world oilseed production and 7% of world oil mealproduction (Tables 1–2). It has about 27 thousand ha under oilseeds,producing about 25000 tonnes of oilseeds. The major oilseeds cultivated inIndia are groundnut, rapeseed-mustard, soybean, sunflower, sesame, linseed,castor, and niger. The yield level of most of these oilseeds is below the worldaverage. For some crops such as soybean, sunflower, rapeseed-mustard, andlinseed the yield levels are about 50% of the world average.
1. Directorate of Oilseeds Research, Rajendranagar, Hyderabad-500 030, India.

148
Oilseed meals are rich in protein and other valuable feed nutrients forlivestock (Table 3). Oil is extracted from oilseeds by using pressure to forceout the oil, or by using an organic solvent, usually hexane, to dissolve oil fromthe seed. Seeds such as groundnut, cottonseed, and sunflower have a thickcoat or husk, rich in fiber and of low digestibility, which lowers the nutritivevalue of the material. This husk may be completely or partially removed bycracking and riddling, the process being known as decortication. Removal ofthe husk lowers the crude fiber content (Table 3) and improves the apparent
Table 1. Area, production, and yield of oilseeds in India ,1998–99.
India World
Area Production Yield Area Production YieldOilseed (’000 ha) (’000 t) (kg ha-1) (’000 ha) (’000 t) (kg ha-1)
Groundnut 7572 9163 1210 23799 30972 1301Rapeseed-mustard 6598 5774 875 24987 33568 1343Soybean 6309 6942 1100 70690 158327 2240Sesame 1673 555 332 6706 2292 342Sunflower 2004 1170 584 21251 24942 1174Safflower 529 324 614 1121 947 845Linseed 798 275 344 3520 2653 754Castor 689 842 1221 1290 1189 922Niger seed 538 164 304 - - -
Total 26711 25211 944 153364 254890 1662
Table 2. Oil meal production in India and the world.
India World
Oil meal 1997–98 1998–99 1997–98 1998–99
.................................................. (’000 t) .................................................Soybean 3682 4141 104440 105421Cotton 3052 3213 15553 15200Groundnut 2253 2281 6415 6796Sunflower 503 481 10327 11003Rapeseed 2699 3015 19079 20700Sesame 253 240 905 912Palm kernel - - 2628 2810Linseed 169 163 1361 1442Copra 265 256 1815 1625
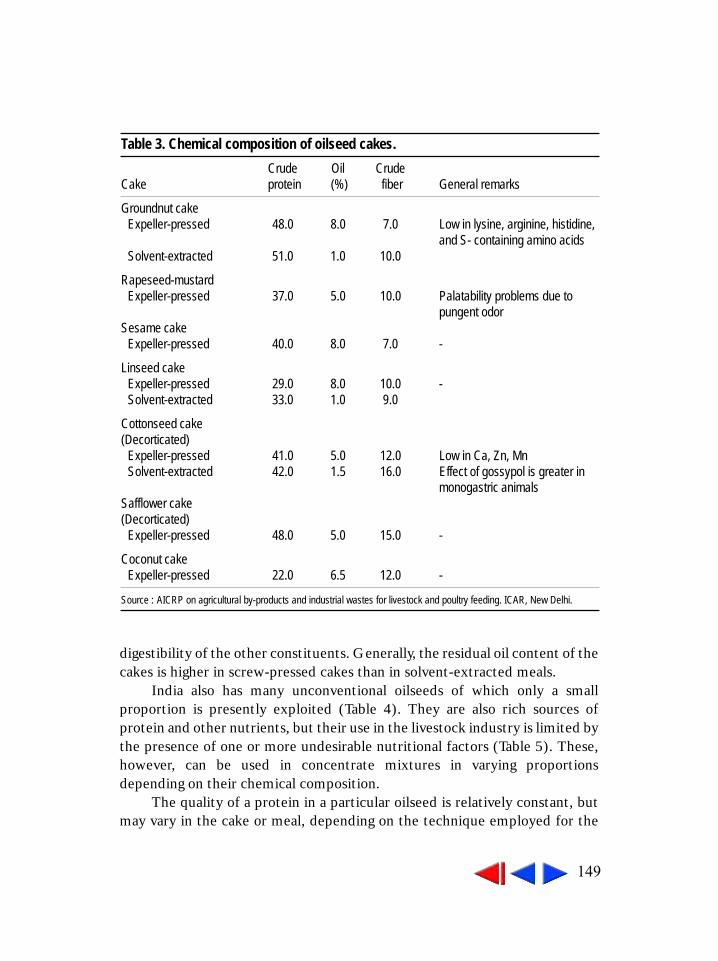
149
digestibility of the other constituents. Generally, the residual oil content of thecakes is higher in screw-pressed cakes than in solvent-extracted meals.
India also has many unconventional oilseeds of which only a smallproportion is presently exploited (Table 4). They are also rich sources ofprotein and other nutrients, but their use in the livestock industry is limited bythe presence of one or more undesirable nutritional factors (Table 5). These,however, can be used in concentrate mixtures in varying proportionsdepending on their chemical composition.
The quality of a protein in a particular oilseed is relatively constant, butmay vary in the cake or meal, depending on the technique employed for the
Table 3. Chemical composition of oilseed cakes.
Crude Oil CrudeCake protein (%) fiber General remarks
Groundnut cakeExpeller-pressed 48.0 8.0 7.0 Low in lysine, arginine, histidine,
and S- containing amino acidsSolvent-extracted 51.0 1.0 10.0
Rapeseed-mustardExpeller-pressed 37.0 5.0 10.0 Palatability problems due to
pungent odorSesame cake
Expeller-pressed 40.0 8.0 7.0 -
Linseed cakeExpeller-pressed 29.0 8.0 10.0 -Solvent-extracted 33.0 1.0 9.0
Cottonseed cake(Decorticated)
Expeller-pressed 41.0 5.0 12.0 Low in Ca, Zn, MnSolvent-extracted 42.0 1.5 16.0 Effect of gossypol is greater in
monogastric animalsSafflower cake(Decorticated)
Expeller-pressed 48.0 5.0 15.0 -
Coconut cakeExpeller-pressed 22.0 6.5 12.0 -
Source : AICRP on agricultural by-products and industrial wastes for livestock and poultry feeding. ICAR, New Delhi.

150
Table 4. Unconventional oil meals/cakes available for animal feed.
Availability of By-product ExtractionSource oilseeds availability rate (%) By-product
................ (’000 t) ..............Sal seed meal 5504 4806 88 MealMahua seed 2176 1414 65 CakeNeem seed 418 334 80 CakeRubber seed 336 117 35 CakeKaranj 111 81 73 CakeKusum 105 70 67 CakeKhankan, Undi, Nahar,
Tobacco seed 102 59 40-75 CakeMango seeds 1000 500 50-55 Meal/Kernel
Source: AICRP on agricultural by-products and industrial wastes for livestock and poultry feeding, ICAR, New Delhi.
Table 5. Chemical composition, toxic factors, and safe level of inclusion in theconcentrate mixture (CM) of unconventional oil cakes.
Crude CrudeExtractions protein fiber TDN Toxic factors Level of inclusion in diet
.............. (%) .............Mahua seed cake 20 13 50 Mowrin (19%) 20% in CM of crossbred
calves
Karanj cake 34 4-5 62 Karanjia, 15% in CM of growing andPongamol, glabrin lactating cows
Kusum seed cake 22 5-7 79 HCN 35% in CM of crossbred(2.4 mg/100 g DM) calves and 17% in broiler
chickens
Sal seed cake 9-20 2-4 40-58 Tannic acid 10% in CM of milch cattle(8-10%),glucosides (3.83%)
Kokam cake 16 4 70 - 15% in CM of crossbredcalves
Castor cake 35 33 - Ricin (0.22%) Only detoxified meal at 10% in CM of sheep
Neem seed cake 17 42 57 Nimbia, Salamin Only detoxified cake at 10% in CM of adult animals
Source: AICRP on agricultural by-products and industrial wastes for livestock and poultry feeding, ICAR, New Delhi.

151
extraction of the oil. As mentioned earlier, generally, the residual oil content ofthe cakes is generally higher in screw-pressed cakes than in solvent-extractedmeals. High temperatures and pressures of expeller processing may result inthe lowering of the nutritive value. For ruminants, such denaturation may bebeneficial, owing to an associated reduction in degradability. High temperaturesand pressures also degrade some deleterious substances such as gossypol.Solvent extraction does not involve pressing, temperatures are comparativelylow, and protein value of meals is almost the same as that of the original seed.The oilseed cakes may make a significant contribution to the energy content ofthe diet, particularly when the oil contents are high.
Antinutritional FactorsSome oil meals contain certain antimetabolites or other antinutritional factorswhich when consumed may be toxic to animals. Table 6 shows some of theimportant antinutritional factors found in different oilseed cakes/meals. Thesefactors may affect the absorption of dietary nutrients in the digestive tract as aresult of toxic action on some organ or tissue, or production traits.Detoxification of some factors is possible by treating a particular ingredient.
Table 6. Antinutritional factors in oilseeds/plant protein meals.
Meals Antinutritional factors
Soybean Protease inhibitors*, allergins*, oligosaccharides, phytin, lipoxygenase*, lectins*,saponin, hemagglutinins, citrinin
Rapeseed Erucic acid, glucosinolates, sinapine, tannins, pertins, oligosaccharides
Canola Glucosinolates, sinapine, pectins, oligosaccharides
Cottonseed Gossypol, tannins, cyclopropenoid fatty acids
Sunflower Chlorogenic acid, high fiber, achratoxin
Groundnut Mycotoxins, tannins, oligosaccharides, protease inhibitors*
Copra Fiber, mannans
Palm kernel Fiber and sharp shells, galactomannans
Sesame Phytase, oxalate
Sal seed Tannins
Linseed Prussic acid
* Destroyed by heating.
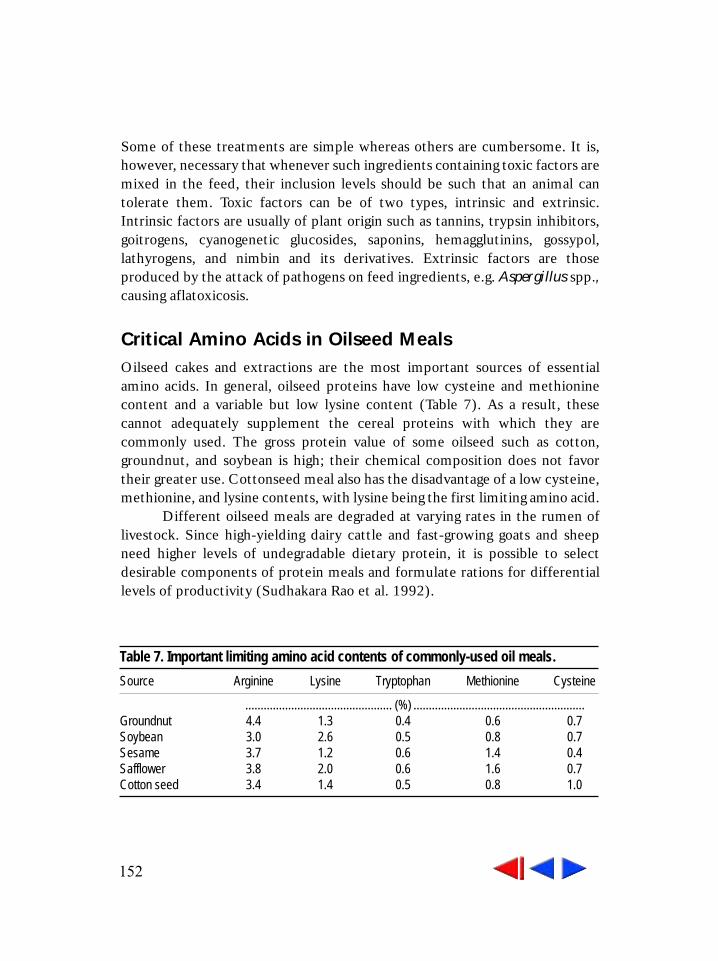
152
Some of these treatments are simple whereas others are cumbersome. It is,however, necessary that whenever such ingredients containing toxic factors aremixed in the feed, their inclusion levels should be such that an animal cantolerate them. Toxic factors can be of two types, intrinsic and extrinsic.Intrinsic factors are usually of plant origin such as tannins, trypsin inhibitors,goitrogens, cyanogenetic glucosides, saponins, hemagglutinins, gossypol,lathyrogens, and nimbin and its derivatives. Extrinsic factors are thoseproduced by the attack of pathogens on feed ingredients, e.g. Aspergillus spp.,causing aflatoxicosis.
Critical Amino Acids in Oilseed MealsOilseed cakes and extractions are the most important sources of essentialamino acids. In general, oilseed proteins have low cysteine and methioninecontent and a variable but low lysine content (Table 7). As a result, thesecannot adequately supplement the cereal proteins with which they arecommonly used. The gross protein value of some oilseed such as cotton,groundnut, and soybean is high; their chemical composition does not favortheir greater use. Cottonseed meal also has the disadvantage of a low cysteine,methionine, and lysine contents, with lysine being the first limiting amino acid.
Different oilseed meals are degraded at varying rates in the rumen oflivestock. Since high-yielding dairy cattle and fast-growing goats and sheepneed higher levels of undegradable dietary protein, it is possible to selectdesirable components of protein meals and formulate rations for differentiallevels of productivity (Sudhakara Rao et al. 1992).
Table 7. Important limiting amino acid contents of commonly-used oil meals.
Source Arginine Lysine Tryptophan Methionine Cysteine
................................................ (%) ........................................................Groundnut 4.4 1.3 0.4 0.6 0.7Soybean 3.0 2.6 0.5 0.8 0.7Sesame 3.7 1.2 0.6 1.4 0.4Safflower 3.8 2.0 0.6 1.6 0.7Cotton seed 3.4 1.4 0.5 0.8 1.0

153
Limitations to the Use of Oilseed CakesThe problem of aflatoxins in animal feeds is being debated at length. The useof groundnut meal, which is very susceptible to fungal infection and aflatoxincontamination, has drastically decreased recently despite the superiority of itsproteins. Improper harvesting, transport, processing, and storage all contributeto aflatoxin contamination. Preventive measures during crop production andpostharvest handling of seeds would greatly reduce the level of contaminationin feeds. Creating an awareness among farmers about aflatoxins would helpincrease groundnut meal use in animal feeds. While soybean meal is notnormally found to contain detectable amounts of aflatoxins, the incidence ofthese metabolites has been on the rise recently.
Sunflower meal is very rich in many essential amino acids, but its use hasbeen restricted owing to its high fiber content. Decorticating the sunflowerseeds prior to expelling/solvent extraction produces oil with less gum content,better clarity, and a meal with lower fiber. However, the economic viability ofthe process has yet to be established. Similar problems limit the use of othermeals such as safflower meal, and niger seed meal in animal feeds.
ReferencesInternational Livestock Research Institute (ILRI). 1995. Global agenda for livestockresearch (Gardiner, P. and Devendra, C., eds.). Proceedings of a consultation, ILRI,Nairobi, Kenya.
Sudhakara Rao, M., Krishna, N. and Prasad, A. 1992. Determination of effectiveprotein degradability of some unconventional protein sources in cattle by nylon bagtechnique. Indian Journal of Agricultural Sciences 52:280-281.

154
1. All India Coordinated Project for Research on Forage Crops, Indian Grassland and Fodder ResearchInstitute, Jhansi—284 003, India.
2. Data on area and production of specific fodder crops is difficult to obtain, although some information isavailable from State Departments of Agriculture.
Status of Forage Breeding TStatus of Forage Breeding TStatus of Forage Breeding TStatus of Forage Breeding TStatus of Forage Breeding Technologies in Indiaechnologies in Indiaechnologies in Indiaechnologies in Indiaechnologies in India
N P Melkania and G P Shukla1
The availability of feed resources in India improved considerably after theintroduction of Green Revolution technologies in the mid-1960s, but the gainsremain largely confined to irrigated regions. At an all-India level, the deficit isestimated at 31% for dry fodder and 23% for green fodder. The deficit in greenfodder is due to low priority accorded to fodder crops in research anddevelopment efforts compared to food crops. The share of fodder crops intotal cropped area has remained stagnant during the last two decades. Inrecent years India has enlarged its food buffer stock considerably and thus it isexpected that the policy emphasis will shift from foodgrains to fodder crops inview of the growing demand for livestock products. The increase in area underforage crops particularly leguminous crops, besides alleviating fodderconstraints would impart sustainability to agricultural systems by improvingsoil fertility and contributing towards increased production of sequentialcrops. Fodder breeding research efforts have generated a number of highyielding fodder cultivars that can be profitably cultivated under fieldconditions in different agroecological conditions. The purpose of this paper isto document the varieties of different forage crops and identify constraints totheir adoption by farmers.
Trends in the Area under Fodder CropsDuring the triennium ending (TE) 1992–94, about 8.5 million ha of land wereunder fodder crops, comprising only 4.6% of the gross cropped area.2 Thisincludes area under guar crop, which is grown for fodder as well as grainproduction in Rajasthan, Gujarat, and Haryana. The total area under foddercrops has been increasing steadily at an annual rate of 1.3% (Fig. 1 and Table1), mainly due to an increase in area under irrigated fodder that grew at amuch faster rate of 2.2% per annum (Kelley and Parthasarathy Rao 1994).

155
There is considerable regional variation in the area in fodder crops(Table 1). Fodder crops are relatively more important in the states ofRajasthan, Punjab, Haryana, and Gujarat, where they account for about 10%of the gross cropped area. In Madhya Pradesh, Maharashtra, Tamil Nadu, and
5000
6000
7000
8000
9000
10000
1970
-71
1973
-74
1976
-77
1979
-80
1982
-83
1985
-86
1988
-89
1991
-92
1994
-95
Are
a (0
00 h
a)
Figure 1. Trends in the area under fodder crops in India.
Table 1. Area under fodder crops in selected states of India, 1992–94.
Fodder area Share in Compound growth rateState (thousand ha) gross cropped area (%) (%) (1984–94)
Andhra Pradesh 152.0 1.2 –0.1Assam 9.0 0.2 12.0Bihar 15.0 0.2 1.3Gujarat 1205.0 10.7 4.6Haryana 545.0 9.3 –1.8Himachal Pradesh 4.0 0.4 –14.9Jammu & Kashmir 42.0 3.9 4.1Karnataka 77.0 0.6 –0.4Kerala 2.0 0.1 -Madhya Pradesh 805.0 3.3 –1.2Maharashtra 860.0 4.0 2.0Punjab 770.0 10.1 0.1Rajasthan 2850.0 14.3 1.9Tamil Nadu 188.0 2.7 5.6Uttar Pradesh 1003.0 3.9 1.6West Bengal 3.0 neg -All India 8535.0 4.6 1.3

156
Uttar Pradesh fodder crops account for 3–4% of the total cultivated area. Inother states it rarely exceeds 1% of the total cropped area.
Changes in area under fodder at state level have been dynamic despitethe stagnancy at national level (Table 1). In Assam, the fodder area expandedat a rate of about 12% a year, followed by Tamil Nadu, Gujarat, Jammu andKashmir, Maharashtra, Rajasthan, and Uttar Pradesh. The area under foddercrops showed a negative growth in Haryana, Himachal Pradesh, and MadhyaPradesh. In other states it has been either marginally positive or negative.
Improved Forage Cultivars/VarietiesA number of institutes under the Indian Council of Agricultural Research(ICAR) and the State Agricultural Universities (SAUs) conduct research onforage crops. The ICAR has generated a number of improved forage varietiesthrough the All-India Coordinated Project for Research on Forage Crops(AICRP-FC) in collaboration with State Agricultural Universities (SAUs),nongovernmental organizations (NGOs), and ICAR institutes. Besides, theIndian Grassland and Fodder Research Institute (IGFRI), an offshoot ofICAR, has also contributed significantly towards development of improvedfodder production technologies.
The forage variety improvement program under AICRP-FC and the All-India Coordinated Sorghum Improvement Programs released 54 differentvarieties of forage crops during the last decade. A few importantcharacteristics of these cultivars/varieties include their wide adaptability andresistance to major insect pests and diseases. Some of them can be grownthroughout the country, and others are suited to specific agroclimates.
An important aspect was the development of forage sorghum hybridswith multiple improvements in yield in irrigated multicut systems. Varietiesresistant to Maydis blight and downy mildew in pearl millet have also beenreleased for cultivation. The oat improvement program also led to theevolution of multicut and more productive varieties. Good varieties of Napierx Bajra hybrid have broken the yield plateau of the traditional variety NB-21(Tables 2 and 3). A notable breakthrough was the genetic improvement ofTrifolium and Medicago. In Trifolium, a diploid variety resistant to Rhizotoniaand Fusarium root rot and Sclerotinia stem rot with high dry matter contentwas released as Bundel Berseem-2. A tetraploid variety with multiple generesistance and gigantic plant type has been released recently. Besides, UPB-

157
Table 2. Forage crop varieties (cereals) released during 1989–2000.
Crop Variety Year of release
Green forage yield
(t ha-1) Target domain Specific features
Jowar-Sorghum (Sorghum vulgare)
GFS-1 1990 32–50 Gujarat Single- to double-cut variety; resistant to major foliar diseases
Pro-Agro chari
1991 60–90 Throughout the country
Multicut (3–5 cuts); resistant to various foliar diseases and insect pests
Pant Chari-3 (UPFS-23)
1991 35–45 Uttar Pradesh Single-cut; resistant to major stem and foliar diseases and insect pests
Gujarat Forage Sorghum-1 (AS-16)
1992 40–70 Gujarat Multicut (2–3); resistant to foliar diseases
MFSH-3 1993 50–85 Throughout the country
Multicut (3–5); resistant to major foliar diseases
Punjab Sudex (Hybrid)
1994 60–95 Punjab Multicut; resistant to foliar diseases, and fairly tolerant to major insect pests
Hara Sona (Hybrid)
1995 60–90 Throughout the country
Multicut (3–5); resistant to various major foliar diseases
HC-308 1995 35–55 Throughout the country
Single-cut; fairly tolerant to major foliar diseases
CSV-15 1996 40–60 Sorghum growing tract
Multicut; fairly resistant to major foliar diseases and insect pests
CSH-13 1997 60–90 Sorghum growing tract
Multicut; fairly resistant to major foliar diseases and insect pests
PCH-106 (hybrid)
1996 65–90 Throughout the country
Multicut (3–4); resistant to leaf spot and stem borer
Bajra-Pearl millet (Pennisetum typhoides)
Rajbajra chari-2
1990 30–45 Bajra growing tract
Resistant to all major diseases including downy mildew, and insect pests
Fodder Kumbu-8 (TNSC-1)
1993 27–40 Bajra growing tract
Resistant to all foliar diseases and insect pests
Makka-Maize (Zea mays)
J-1006 1993 35–45 Punjab Resistant to Maydis blight and brown striped downy mildew and stem borer
Jai-Oats (Avena sativa)
Bundel Jai-822
1989 35–40 Throughout the country
Multicut; resistant to all major diseases, and insect pests
UPO-212 1990–91 37–52 Throughout the country
Multicut; resistant to all major diseases and insect pests
OL-125 1994 35–48 Throughout the country
Multicut; fairly tolerant to major diseases and insect pests
Bundel Jai-851
1997 40–62 Northern and Northwest regions
Multicut (3–4 cuts); resistant to major diseases and insect pests
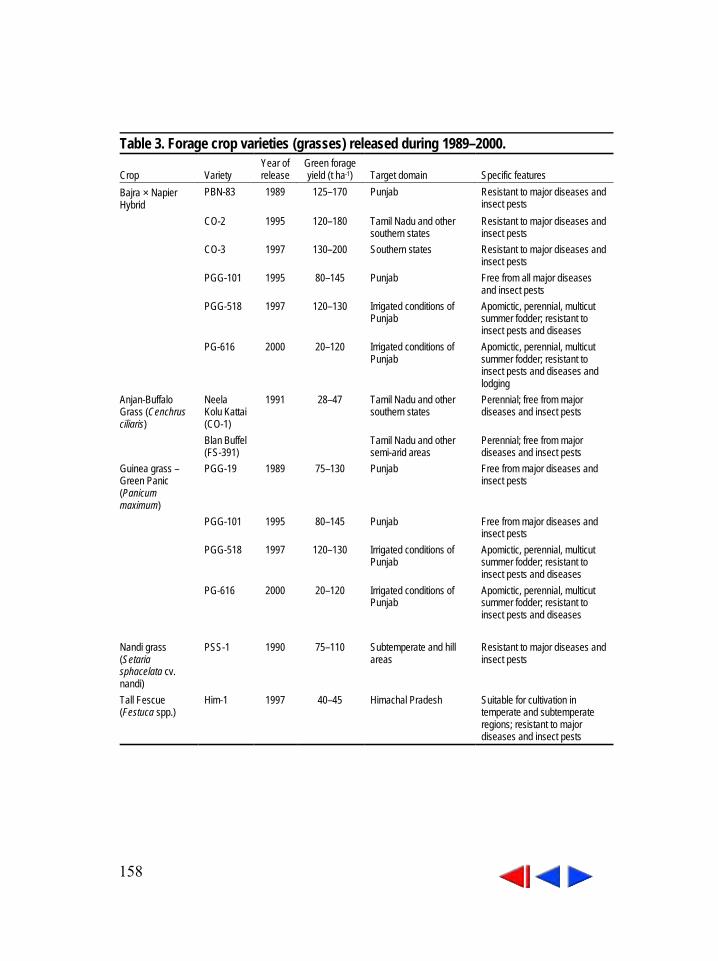
158
Table 3. Forage crop varieties (grasses) released during 1989–2000.
Crop Variety Year of release
Green forage yield (t ha-1) Target domain Specific features
Bajra × Napier Hybrid
PBN-83 1989 125–170 Punjab Resistant to major diseases and insect pests
CO-2 1995 120–180 Tamil Nadu and other southern states
Resistant to major diseases and insect pests
CO-3 1997 130–200 Southern states Resistant to major diseases and insect pests
PGG-101 1995 80–145 Punjab Free from all major diseases and insect pests
PGG-518 1997 120–130 Irrigated conditions of Punjab
Apomictic, perennial, multicut summer fodder; resistant to insect pests and diseases
PG-616 2000 20–120 Irrigated conditions of Punjab
Apomictic, perennial, multicut summer fodder; resistant to insect pests and diseases and lodging
Anjan-Buffalo Grass (Cenchrus ciliaris)
Neela Kolu Kattai (CO-1)
1991 28–47 Tamil Nadu and other southern states
Perennial; free from major diseases and insect pests
Blan Buffel (FS-391)
Tamil Nadu and other semi-arid areas
Perennial; free from major diseases and insect pests
Guinea grass – Green Panic (Panicum maximum)
PGG-19 1989 75–130 Punjab Free from major diseases and insect pests
PGG-101 1995 80–145 Punjab Free from major diseases and insect pests
PGG-518 1997 120–130 Irrigated conditions of Punjab
Apomictic, perennial, multicut summer fodder; resistant to insect pests and diseases
PG-616 2000 20–120 Irrigated conditions of Punjab
Apomictic, perennial, multicut summer fodder; resistant to insect pests and diseases
Nandi grass (Setaria sphacelata cv. nandi)
PSS-1 1990 75–110 Subtemperate and hill areas
Resistant to major diseases and insect pests
Tall Fescue (Festuca spp.)
Him-1 1997 40–45 Himachal Pradesh Suitable for cultivation in temperate and subtemperate regions; resistant to major diseases and insect pests

159
110 has broken climate boundaries and performs reasonably well in thetemperature range of 10–20oC. In Medicago, Anand-3 was adapted to highelevation and low temperatures below 0oC during crop growth. Anothervariety, RL-88, appears to behave as a self-pollinated crop and does not getcontaminated at short to medium isolation distances (Table 4).
Other noteworthy developments in forage research include productionof hybrids in forage sorghum and pearl millet (Table 2), contraclimaticadaptive varieties in berseem (Trifolium alexandrinum) and Medicago sativa,highly productive Napier × Bajra hybrid materials, and highly adaptive diseaseresistant multicut varieties in oats. Additionally, the breeding program pavedthe way for developing exploitable varieties of nontraditional crops such asricebean, gobhi sarson, and metha (Trigonella foenum graecum) (Tables 4 and5). Advances were also made with the temperate forages. Promising varietiesof Persian clover and Tall Fescue have been developed. The selection andimprovement of forage varieties for desert and drought-prone areas is a majorbreakthrough. The improved varieties of Cenchrus ciliaris are also worth amention.
Adoption of Improved VarietiesUnlike food crops, where considerable information has been generated on areaunder high-yielding varieties, there are few if any statistics available to indicatethe area under various fodder crops and adoption of improved varieties. This isbecause not much importance has been attached to the livestock sector andthereby fodder crops in the process of agricultural development. The generalobservations indicate that although farmers are aware of the benefits offeeding green fodder to animals, a majority of them do not grow fodder cropsor grow them only on a small fraction of their land (Prasad et al. 1995, Rai etal. 1995). A review of literature indicates the following limitations to adoptionof fodder crops/varieties:
• Average size of land holding is small and is the main limitation to shiftingarea away from food to fodder crops.
• Livestock production is subsistence-oriented, and a major part of the feedconsumption is derived from crop residues and grazing lands. Fodder mar-kets are not developed and are fragmented because of lack of commercial-ization of livestock production. Thus, the market signals to bring greaterarea under fodder crops are not encouraging.

160
Table 4. Forage crop varieties (legumes) released during 1989–2000.
Crop Variety Year of release
Green forage yield
(t ha-1) Target domain Specific features
Cowpea (Vigna unguiculata)
Gujarat Lobia-3 1990 25–40 Gujarat Growing upward at 27 to 32oC; resistant to major diseases and insect pests
UPC-4200 1991 27–42 Northern & Eastern regions
Resistant to cowpea mosaic virus, Pythium and Rhizoctonia root rot
Bundel Lobia-1 (IFC-8401)
1992 25–32 Throughout the country
Tolerant to cowpea yellow mosaic virus, flea beetle and semi-looper insect pests
Lobia-88 1992 25–35 Punjab Highly resistant to cowpea mosaic virus and anthracnose; fairly tolerant to semi-looper and leaf minor pests
Bundel Lobia-2 (IFC-8503)
1995 22–35 Northeastern regions
Fairly resistant to cowpea mosaic virus and anthracnose
UPC-8705 1997 30–42 Throughout the country
Resistant to dry root rot and collar rot
Haryana Lobia-88
1997 28–35 Northwestern regions
Resistant to cowpea mosaic virus
UPC-9202 1999 35–42 Sub-tropical to temperate conditions in the central zone of the country
Biomass stays green after pod maturity even during Oct.–Nov., resistant to yellow mosaic virus disease, root and stem rot, anthracnose and wilt diseases, pod borers, aphids, and leaf hopper; pods tolerant to seed shattering, fodder-cum-grain type
Guar-Cluster bean (Cymopsis tetragonaloba)
Bundel Guar-1 (IGFRI-212-1)
1993 22–35 Northwest regions Resistant to Xanthomonas and Alternaria, and fairly tolerant to insect pests
Guara-80 1994 30–45 Punjab Tolerant to bacterial leaf blight
Bundel Guar-2 (IGFRI-2395-2)
1995 28–40 Guar growing tract Resistant to foliar diseases including Xanthomonas; good seed producer
Bundel Guar-3 (IGFRI-1019-1)
1999 26–30 Guar growing tract Resistant to lodging, free from pod shattering and highly responsive to fertilizers; dual purpose, moderately resistant to drought, bacterial blight powdery mildew diseases and major insect pests; high in vitro dry matter digestibility (71.2%)
...continued

161
Sem-Hyacinth bean (Lablab purpureus)
JLP-4 1993 22–35 Throughout the country
Resistant to all major diseases and insect pests; suitable for rainfed and drought-prone areas
Berseem-Egyptian clover (Trifolium alexandrinum)
UPB-110 1993 50–65 Southern zone Tolerant to major diseases and insect pests in field conditions
Bundel Berseem-2
1997 58–85 Central and Northwest zones
Resistant to Rhizoctonia and Fusarium root rot, Sclerotinia stem rot, lodging, shattering, and major insect pests
Bundel Berseem-4
2000 50–60 Northeastern region
A tetraploid variety with broad leaves, vigorous plant type; multiple resistance to root rot, stem rot, and major insect pests
Rijka-Lucerne (Medicago sativa)
Anand-3 1994 60–90 Himachal Pradesh Resistant to powdery mildew, other major diseases, and insect pests, suitable for cultivation in temperate zones at higher elevations, ranging from 1200–2500 m above sea level; temperature 0oC and below during growth period
RL-88 1995 70–100 Throughout the country
Perennial; resistant to major diseases and insect pests, behaves as if self pollinated, and requires less isolation distance for maintenance
Shaftal-Persian clover (Trifolium resupinatum)
SH-48 1994 80–105 Himachal Pradesh Free from major diseases and insect pests; highly resistant to Sclerotinia stem rot in wetland and damp conditions; suitable for cultivation in acidic soils after harvest of rice crop
SH-69 1995 75–110 Punjab Free from major diseases and pests, highly resistant to Sclerotinia stem rot in wetland and damp conditions, suitable for cultivation in acidic soils after harvest of rice crop
Rice bean (Vigna umbellata)
RBL-1 1994 25–40 Punjab Resistant to major diseases, and insect pests; basically a pulse crop but also proved its worth as a forage crop
RBL-6 1997 22–45 Punjab Resistant to major diseases, and insect pests; basically a pulse crop but also proved its worth as a forage crop
Bidhan-1 (K-1) 2000 25–50 Northeast, Southwest and South-central regions
Resistant to major diseases and insect pests, flourishes well at high humidity, and survives well at low soil pH
Table 4. Continued.

162
• Farmers lack orientation in cultivation of green fodder, and transfer of tech-nical information related to different fodder crops to farmers is inadequate.Lack of seed availability is another major limitation.
• Availability of timely irrigation is an important requirement, particularly formulticut fodder crops.
ConclusionsBreeding research has developed a number of forage cultivars that grow undervarying agroecological conditions. Their adoption, however, has been slow as isindicated by the sluggish growth in the area under fodder crops. Appropriateincentives to farmers to grow fodder crops, strengthening information flow onfodder cultivation practices as well as livestock feeding practices, andexpansion of fodder markets would help alleviate the fodder scarcity andcontribute towards improving animal productivity.
ReferencesKelley, T.G. and Parthasarathy Rao, P. 1994. Trends in cultivated green fodder crops inIndia. In Proceedings of the workshop on variation in the quantity and quality of
Table 5. Other forage crop varieties released during 1989–2000.
GreenYear of forage yield
Crop Variety release (t ha-1) Target domain Specific features
Gobhi Sarson GSL-1 1994 25–35 Punjab Comparatively tolerant to major(Brassica sp.) diseases and insect pests
including aphids; basicallyoilseed crop but also proved itsworth as a fodder crop
Sheetal 1995 18–30 Himachal Pradesh Comparatively tolerant to major (HPN-1) diseases and insect pests
including aphids; basically oilseedcrop but also proved its worth asa fodder crop
Metha ML-150 1995 27–35 Punjab Highly resistant to powdery(Trigonalla mildew and stem rot diseasesfoenum-graecum)
163
fibrous crop residues, 8-9 February 1994, (Joshi, A.L., Doyle, P.T., and Oosting, S.J.,eds.) Bharatiya Agro Industries Foundation, Pune, Maharashtra.
Prasad, C.S., Subba Rao, A., Sitaramaswamy, J., Dixit, P.K., Ranganathan, K.,Krishnamurthy, C.S., Ramanand, and Vasantha, G. 1995. Rapid rural appraisal onfodder production and feeding practices in Banagalore district. In Farming SystemsResearch for Improving Livestock Production and Crop Residue Utilization (Singh,C.B., Rao, S.V.N., and Jain, D.K., eds.). Indian Council of Agricultural Research, NewDelhi, and National Agricultural University, The Netherlands.
Rai, S.N., Singh, C.B. and Sohi, D.S. 1995. Rapid rural appraisal in problemidentification and technology targeting. In Farming Systems Research for ImprovingLivestock Production and Crop Residue Utilization (Singh, C.B., Rao, S.V.N., and Jain,D.K., eds.). Indian Council of Agricultural Research, New Delhi, and NationalAgricultural University, The Netherlands.
164
1. Indian Grassland and Fodder Research Institute, Jhansi- 284 003, India.
Potential TPotential TPotential TPotential TPotential Technological and Managementechnological and Managementechnological and Managementechnological and Managementechnological and ManagementInterventions for Improving the ProductivityInterventions for Improving the ProductivityInterventions for Improving the ProductivityInterventions for Improving the ProductivityInterventions for Improving the Productivity
of Grasslandsof Grasslandsof Grasslandsof Grasslandsof Grasslands
P S Pathak1
India is a country with tropical monsoon climate where most of the rains occurbetween June and September. Thus, the active growth period in rainfed areasis 3–4 months. In this climate the native vegetation comprises different typesof woodland. Seminatural grazing lands grow only on clearing of the woodbunds. Grazing lands are controlled by the degree of grazing. Pastures are notmaintained due to the prevalent ecoclimate and exist only at high altitudes inthe Himalayas beyond the tree line.
The total area of grazing lands in India is about 86 million ha (Pandeya1986). This, together with crop residues and by-products, supports India’sentire livestock population. The total arable land in the country is about 147.4million ha. Assuming that croplands donate one-tenth of production as fodder,the total arable land supporting livestock feed would be about 14.7 million ha,thereby increasing the potential grazing area to about 100 million ha. Takingthe average potential above-ground net primary productivity as 500 g m-2 yr-1,the total fodder production is 501.5 million t of dry fodder yr-1 for 239 millionanimals, excluding sheep, goats, horses, camels, and donkeys. Also, assumingthat a normal healthy cow consumes 7 t dry herbage yr-1, the annualconsumption is 1673 million t yr-1. The net primary production level of Indiangrasslands is thus far below the total requirement. The overgrazing andcontinuous degradation of grazing lands, along with loss of fertility, is furtherdecreasing their productivity (Pandeya and Jain 1979). The problems ofgrazing lands are related to ecological and socioeconomic causes (Pandeya1986). In arid areas water is the limiting factor; in semi-arid areas improperland utilization and excessive grazing are the main problems; and in the highrainfall zones the low nutritive value of the herbage is a constraint. Anotherserious problem is the low legume component of the grasslands.

165
This paper analyzes the capability of grassland technologies to improvegrazing capacity of Indian rangelands and its implications for animal production.
The Present ScenarioOver the past 40 years while the net area sown increased by about 20%, thegross cropped area increased by over 40%, implying an increase in the croppingintensity from 1.1 in 1950–51 to 1.3 in 1992–93 (Table 1). Although the areaunder forests shows an increase, the area under the tree canopy has decreaseddrastically. The area under pastures, cultivable waste, fallow, and barren landshas also decreased. Thus, common grazing lands have declined in area, bothquantitatively and qualitatively.
The fodder demand and supply position has always been considered inrelation to the grazing animal population and the area under forage crops.Estimates show a deficiency of feed and fodder (Singh and Majumdar 1992).A different feeding strategy and feed quality are required for different animalspecies. Buffalo and cattle require stall feedng. Small ruminants need a greaterfodder supply from tree leaves besides grazing/browsing in forests. Also, thereare large areas facing land degradation, which progressively reduces theproductivity of the grasslands (Table 2).
Table 1. Land use in India.
Area (million ha)
Category 1950–51 1992–93 % change
Geographic area 284.3 305.0 7.3Forests 40.5 68.1 68.1Unavailable for cultivation /non-agriculture / barren land 47.5 41.3 –13.1Pastures 26.5 15.0 –43.4Cultivable waste 22.9 14.6 –36.2Fallow land 28.1 23.6 –16.0Net area sown 118.7 142.5 20.0Gross cropped area 131.9 185.5 40.6Cropping intensity 1.1 1.3 17.1Net irrigated area 20.9 50.1 139.7Gross irrigated area 22.6 66.1 192.5
Source: Agricultural Statistics at a Glance 1996.

166
Indian Grasslands – Types, Production, and Potential
The Grass Cover of India
A survey of the grasslands of India conducted between 1954 and 1962revealed five major grass covers (Dabadghao and Shankarnarayan 1973).These were Sehima-Dichanthium, Dichanthium-Cenchrus-Lasiurus,Phragmites-Saccharum-Imperata, Themeda-Arundinella, and TemperateAlpine associations.
Sehima-Dichanthium
This cover type spreads over the whole of peninsular India, including theCentral Indian Plateau, the Chhota Nagpur Plateau and the Aravali Rangeswith a potential coverage of approximately 1.74 million km2. It is representedby dominant perennial grasses such as Dichanthium annulatum, Sehimanervosum, Bothrichloa pertusa, Chrysopogon fulvus, Heteropogon contortus,Iseilema laxum, Themeda triandra, Cynodon dactylon, Aristida setacea, andCymbopogon spp. Important associated species are Apluda mutica,Bothrichloa intermedia, Arundinella nepalensis, Desmostachya bipinnata,Eragrostis, and Eragrostiella spp.
Dicanthium-Cenchrus-Lasiurus
This type is associated with subtropical arid and semi-arid regions comprisingthe northern part of Gujarat, the whole of Rajasthan, excluding the AravalliRanges in the south, western Uttar Pradesh, Delhi, Punjab, and Haryana witha potential area of more than 0.44 million km2. The principal perennial grass
Table 2. Severity and extent of soil degradation.
Severity of degradation (million ha)Total area
Type of degradation L M H VH (million ha)
Water erosion 5.0 24.3 107.2 12.4 148.9Wind erosion - - 10.8 2.7 13.5Chemical deterioration 2.8 2.0 9.0 - 13.8Physical deterioration 6.4 5.2 - - 11.6Total 14.2 33.2 124.3 16.1 187.8
L = Low, M = Medium, H = High, VH = Very High

167
species are Cenchrus ciliaris, C. setigerus, Dicanthium annulatum, Cymbopogonjwarancusa, Cynodon dactylon, Eleusine compressa, Lesiurus sindicus,Sporobolus marginatus, Dactyloctenium sindicum, and Desmostachya bipinnata.Important associated species are Chloris dolichostachya, Heteropogon contortus,Saccharum bengalense, and Vitevaria zyzanioides.
Phragmites-Saccharum-Imperata
This association occurs throughout the Gangetic Plain and the BrahmaputraValley and extends into the plains of Punjab. The area covers approximately2.8 million km2 in the northeastern states, West Bengal, Bihar, Uttar Pradesh,Punjab, and Haryana. The principal perennial species in drier regions areImperata cylindrica, Saccharum arundinaceum, S. spontaneum, Phragmiteskarka, and Desmostachya bipinnata. Other important species are Bothrichloaintermedia, Vitevaria zizanioides, Imperata cylindrica, Chrysopogonaciculatus, and Panicum notatum.
Themeda-Arundinella
This association occurs in the entire northern and northwestern mountaintract, in an approximate area of 230 thousand km2 in the northeastern states,West Bengal, Uttar Pradesh, Punjab, Haryana, Himachal Pradesh, and Jammuand Kashmir. This type is associated with undifferentiated forest and hill soils,and also with undifferentiated forest submountain regional soils. The principalgrass vegetation is represented by Arundinella bengalensis, A. nepalensis,Bothrichloa intermedia, Chrysopogon fulvus, Cymbopogon jwarancusa,Cynodon dactylon, Heteropogon contortus, Themeda anathera, Eulaliopsisbinata, and Ischaemum barbatum. Associated perennial species are Apludamutica, Arundinella khaseana, Pennisetum flaccidum, and Chlorisdolichostachys.
Table 3. Production levels of various grass covers in India.
Harvestable biomass (t ha-1)
Grass cover Actual Potential
Sehima - Dichanthium 3.5 6.0Dichanthium - Cenchrus - Lasiurus 3.3 5.0Phragmitis- Saccharum - Imperata 5.0 5.0Themeda - Arundinella 2.2 4.0

168
Temperate Alpine
These grasslands occur on the high hills of Uttaranchal, Jammu and Kashmir,Himachal Pradesh, West Bengal, and the northeastern regions. They differfrom the Themeda-Arundinella type in that they essentially occur at higherelevations beyond the tree line, approximately above 3000 m in the west andabove 2000 m in the east. The principal perennial species are Agropyronconaliculatum, Chrysopogon gryllus, Dactylis glomerata, Danthoniacachemyiana, Phleum alpinum, Carex nubigena, Poa pratensis, and Stipaconcinna. Associated species are Poa alpina, Festuca lucida, Eragrostis nigra,and Bromus ramosus.
Research on Grassland ImprovementGrassland improvement is possible through various ecological approaches suchas protection of grassland for recovery of vegetation, removal of unwantedbushes, reseeding, application of fertilizers, and better management. Theseimprovement techniques are discussed below:
Protection from Grazing
Overgrazing results in degradation of grasslands with sparse vegetation anddominance of unpalatable and noxious vegetation. Increased protectionthrough fencing can improve vegetation recovery. Grazing lands can beprotected with barbed wire/chicken wire or chain links supported by angleiron/cement/stone/wooden poles or by fencing with unpalatable bushes. Areview of the efficacy and cost effectiveness of various kinds of fencing(Kanodia and Patil 1982) indicated that living fences were most cost effectivefor protecting large areas. Species suitable for live hedges are Pithecelobiumdulce, Carissa carandas, Agave sisalana, Agave Americana, Opuntia ficus-indica, Zizyphus nummularia, Jatropha curcas, Parkinsonia aculeata, andLawsonia inermis.
For grazing lands in the hills, Tandon et al. (1982) recommended fiveyears’ protection to improve the degraded low-altitude grazing areas. Effectivefencing for 5 years with no improvement measures could increase herbageyield from 0.9–3.0 t ha-1. Closing these grazing lands not only improves foragequantity but also its quality (Table 4). A stone wall (1 m high and 45 m wide)supported by live hedges of Agave americana, Barberis, and Yucca sp. wasfound to be economically and ecologically viable.

169
Studies revealed an increase in the herbage yield from 0.1 to 3.5 t ha-1
within 3 years of protecting degraded grazing lands. The plant population ofdesired perennial grasses increased from 11 plants m-2 to 397 plants m-2 andthat of undesirable forbs decreased from 444 plants m-2 to 33 plants m-2
(Table 5) during a period of five years on semi-rocky land (Trivedi and Kanodia1982). After two years of protection, the forage yield increased by 148% in‘poor’, 92% in ‘fair’, and 116% in ‘good’ condition classes of rangelands intropical arid regions with sandy to sandy loam soils (Paroda et al 1980).
Bush Clearing
Heavy infestation of bushes in grazing lands adversely affects the availability ofopen space for growing grasses and forage. Studies conducted at the IndianGrassland and Fodder Research Institute (IGFRI), Jhansi (Table 6), andelsewhere in arid regions (Table 7), reveal the adverse effect of high bushdensity on forage yield. The standard practice of bush clearing involves eithermanual or mechanical felling and removal of stumps, or application ofselective herbicides on the cut stumps to prevent them from coppicing. Thosetrees providing fodder, however, should be maintained in the grazing lands asfeed reserves.
Table 4. Effect of closure on the average herbage production, number of species, andnutrient content of grasses in the hills of Uttar Pradesh.
Herbage Number Crudeproduction of protein P K
Management type (t ha-1 yr-1) species (%) (%) (%)
Open grazing lands 0.9 13.0 3.2 0.2 1.1Two year closure 2.4 21.0 3.7 0.2 1.2Five year closure 3.0 25.0 3.7 0.2 1.2
Table 5. Effect of protection on species composition on a rocky site.
Plants per m2
Plant groups Years: 1 2 3 4 5
Perennial grasses 11 28 43 182 397Annual grasses 1023 204 150 142 85Legumes 111 81 148 190 65Forbs 444 116 148 46 33
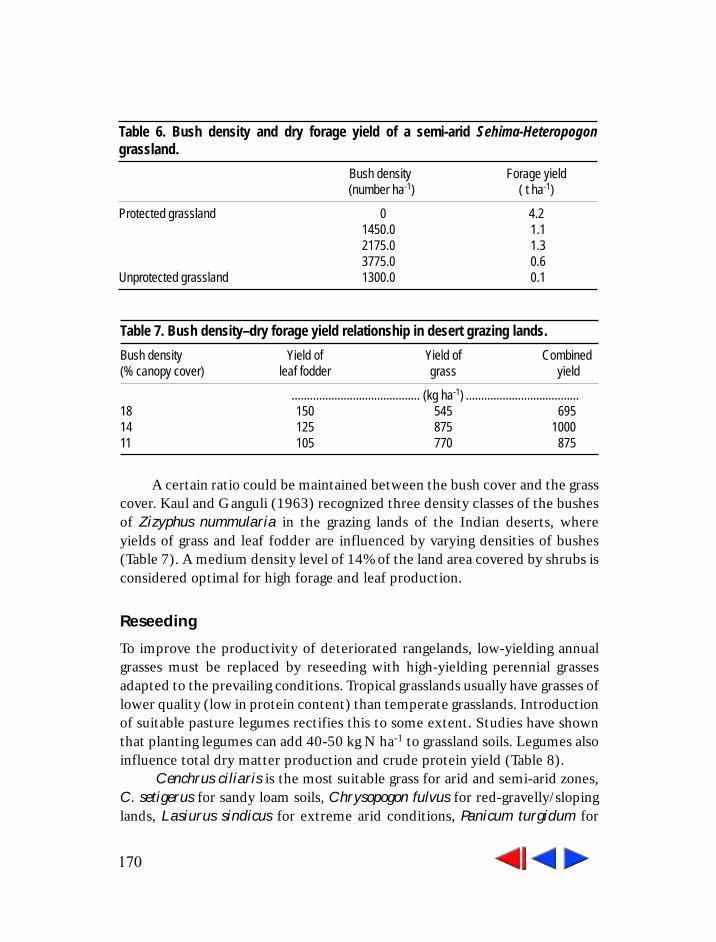
170
A certain ratio could be maintained between the bush cover and the grasscover. Kaul and Ganguli (1963) recognized three density classes of the bushesof Zizyphus nummularia in the grazing lands of the Indian deserts, whereyields of grass and leaf fodder are influenced by varying densities of bushes(Table 7). A medium density level of 14% of the land area covered by shrubs isconsidered optimal for high forage and leaf production.
Reseeding
To improve the productivity of deteriorated rangelands, low-yielding annualgrasses must be replaced by reseeding with high-yielding perennial grassesadapted to the prevailing conditions. Tropical grasslands usually have grasses oflower quality (low in protein content) than temperate grasslands. Introductionof suitable pasture legumes rectifies this to some extent. Studies have shownthat planting legumes can add 40-50 kg N ha-1 to grassland soils. Legumes alsoinfluence total dry matter production and crude protein yield (Table 8).
Cenchrus ciliaris is the most suitable grass for arid and semi-arid zones,C. setigerus for sandy loam soils, Chrysopogon fulvus for red-gravelly/slopinglands, Lasiurus sindicus for extreme arid conditions, Panicum turgidum for
Table 7. Bush density–dry forage yield relationship in desert grazing lands.
Bush density Yield of Yield of Combined(% canopy cover) leaf fodder grass yield
.......................................... (kg ha-1) .....................................18 150 545 69514 125 875 100011 105 770 875
Table 6. Bush density and dry forage yield of a semi-arid Sehima-Heteropogongrassland.
Bush density Forage yield (number ha-1) ( t ha-1)
Protected grassland 0 4.2 1450.0 1.1 2175.0 1.3 3775.0 0.6
Unprotected grassland 1300.0 0.1

171
sand dunes, Dichanthium annulatum for moist loamy soils, and Iseilemalaxum and Panicum maximum for clay soils with higher moisture contents(Kanodia 1987 and 1988; Yadav 1987). In sandy or sandy loam soils withrainfall up to 750 mm, suitable legumes are Stylosanthes hamata, Alysicarpusrugosus, and Lablab purpureus.
Fertilizer Application
Application of nitrogen can considerably improve forage production andquality of grasses in terms of crude protein. Application of 40–60 kg N ha-1
and 20–30 kg P ha-1 could increase pasture production by 50–100% (Table 9).Increases in pasture production due to the application of P2O5 are of a lowerorder compared to nitrogen application. No significant effect on pastureproduction is observed due to potash application (Shankarnarayan et al. 1973,Shankarnarayan and Rai 1975a, Shankarnarayan et al. 1975b). However,potassium is important for the long-term maintenance of pastures. In north-west Himalayan grazing lands Sharma and Koranne (1988) have shownincrease in forage yield on application of N and P (Table 10).
Table 8. Effect of range legumes on dry forage yield of natural grasslands (t ha-1) andthe organic carbon in soil.
Dry matter yield Organic carbonTreatment (t ha-1) (%)
Control (No legume, no fertilizer) 3.3 0.6Fertilizer (40 kg N/ha) 4.6 0.7Legume introduction
Alysicarpus rugosus 4.2 0.6Atylosia scarebaeoides 4.1 0.7Clitoria ternatea 4.4 0.6Dolichos lablab 4.7 0.8Desmodium tortuosum 4.2 0.7Neonotonia wightii 3.8 0.7Macroptelium atropurpureum 4.1 0.6M. lathyroides 4.9 0.8Mimosa invisa 3.7 0.7Stylosanthes guianensis 4.2 0.8S. humilis 4.0 0.6Sesbania sesban 4.1 0.6

172
The use of nitrogenous fertilizers on grasslands is expensive. Therefore,introduction of legumes into native grasslands is a cheap alternative due totheir nitrogen-fixing capacity.
Cutting Management
The ultimate objective of pasture management is to provide maximumdigestible dry matter per unit area per growing season through a series ofharvests. Table 11 shows that harvesting at 60 day intervals at 15 cm above theground level gave the highest forage yield. However, crude protein content hasbeen found to be higher at shorter cutting intervals.
Table 9. Effects of fertilizers on dry matter yields in major range grasses.
Treatment S. nervosum C. fulvus B. intermedia C. ciliaris C. setigerus L. laxam H. contortus
................................................................. (t ha-1) ...........................................................N (kg ha-1)
0 3.9 4.4 2.5 2.7 2.6 4.4 3.520 - - - - 5.3 4.730 - 6.8 3.1 4.0 4.2 - -40 - - - - - 6.4 5.660 6.1 8.3 3.3 4.7 5.3 - -90 - 10.0 3.3 5.6 6.2 - 6.4
P (kg ha-1)0 4.5 6.4 2.3 3.6 4.0 5.1 4.1
20 4.7 7.9 - - - 5.7 5.030 - - 3.5 4.3 4.2 5.7 -40 5.7 7.8 - - - - 6.760 - - 3.6 4.9 5.1 - -
Source: IGFRI, Jhansi
Table 10. Effect of N and P fertilization on forage production (t ha-1) in the northwestHimalayan grasslands.
P levels (kg ha-1)N levels(kg ha-1) 0 30 60 Mean
0 1.8 2.3 3.2 2.430 3.4 4.3 5.3 4.360 4.7 5.5 7.0 5.7Mean 3.3 4.0 5.2

173
Grazing Management
The greatest single factor responsible for deterioration of grasslands isovergrazing. While grazing, animals tend to favor certain grasses and avoidothers. Desirable species thus become depleted much faster than species thatare less palatable. Most perennial grasses utilize the reserve food materialstored in the underground parts to produce new shoots. When overgrazingoccurs the reserve food material is lost faster, and perennial grasses are unableto regenerate due to a continuous drain on food reserves. A certain period ofrest is thus essential for perennial grasses to recuperate and rejuvenate. Basedon these considerations the following types of grazing systems arerecommended:
• Continuous grazing• Deferred grazing• Rotational grazing• Deferred-rotational grazing
In the continuous grazing system the grassland is not divided intocompartments or paddocks and animals are free to move in the whole area.Continuous grazing with high stocking rates can lead to a deterioration incomposition and production of good forage grasses and an increase inunpalatable ones. It also affects soil fertility levels and exposes the area to runoff
Table 11. Effects of cutting intervals on forage yield (t ha-1) and crude protein content(%) in different grasses.
C. ciliaris C. setigerus S. nervosum C. fulvus D. annulatum I. laxam
Treatment DM CP DM CP DM CP DM CP DM CP DM CP
Cutting intervals (days)10 0.3 11.7 0.4 12.9 0.8 11.1 0.7 11.5 0.9 7.3 0.4 9.920 0.7 9.5 1.0 10.5 1.6 8.9 1.5 9.9 1.7 8.8 0.7 7.930 1.0 8.1 1.1 8.6 2.1 7.6 2.2 8.7 2.0 8.5 1.0 6.960 2.0 6.3 2.2 7.4 4.1 6.5 4.2 7.0 2.8 7.3 1.5 5.0
Cutting height (cm)5 0.8 8.9 1.1 10.0 1.8 8.4 0.9 9.3 1.6 8.9 0.8 7.5
10 1.0 9.0 1.2 9.6 2.2 8.6 2.3 9.1 1.9 8.4 1.0 7.415 1.2 8.8 1.5 9.9 2.4 8.5 2.3 9.2 2.1 8.2 1.0 7.8
DM – Dry matter
CP – crude protein

174
and soil loss. In the deferred system, the grazing area is divided intocompartments and at least one of these is rested until seed setting. In rotationalgrazing compartments are grazed in rotation for a specific duration. The deferredrotational grazing system is a mix of the latter two types and is considered thebest system of grazing because (1) the same grassland supports a greater numberof grazing days, (2) proper vegetation composition is maintained through selfseeding, (3) health of the sward is maintained as the optimum utilization ofbiomass takes place and a period of rest is available to grasses, (4) soil fertility ismaintained, and (5) potential erosion hazards are avoided.
In Sehima-dominated grasslands, the deferred rotational grazing systemis superior to the continuous system (Upadhyay et al. 1971). For aridrangelands, there was an increase of 22% in dry matter yield of Cenchrusspecies under deferred-rotational grazing and an increase in carrying capacityfrom 0.49 to 0.73 sheep ha-1. Under continuous grazing only 0.53 sheep ha-1
were carried. In the Lasiurus-dominated grasslands in western Rajasthan, thedeferred-rotational grazing system is superior to the continuous grazing systemin terms of average body weight gain of Tharparker heifers. The calving ratewas also higher (26%) under a deferred-rotational grazing system compared tothe continuous system (Shankarnarayan et al. 1981).
Animal Production
Animal production based on pastures and the silvipastoral system has been lessstudied. Upadhyay et al. (1980) compared two grass species for growth andmilk production under grazing conditions, but found no significant differences.Other studies have shown that animal productivity can be sustained withproper management with improved vegetation in a multi-tier system. Rai et al.(1987) reported higher weight gains in animals grazed on leguminous mixedpastures compared to native grasslands.
Silvipastoral Systems
The silvipastoral systems involve the establishment of multipurpose trees inexisting pastures/grazing lands or wastelands, with grasses, legumes or cerealsplanted between the lines of trees. The pastures are used for cut and carry orin situ grazing. During the initial years of tree establishment and growth, thegrasses and legumes are harvested as hay, and the area is maintained as a

175
seasonal hay plot followed by grazing in a rotational or deferred rotationalgrazing system. The technique seems simple but the land area, soil type,topography, natural vegetation, local socioeconomic conditions, stocking rates,rainfall, temperature, and wind are some of the important factors thatdetermine its success (Pathak and Roy 1994; Pathak et al. 1995).
Forage Production
Depending upon the land capability, soil type, and its fertility, forageproduction rises from the first year and peaks in the 2nd or 3rd year. Forageproduction of up to 7.9 and 7.4 t ha-1 could be easily harvested depending onthe choice of grass. The canopy of different trees did not make a significantdifference to grass growth. Thus, depending upon the soil moisture andnutrients, yield differences of 2–10 t ha-1 yr-1 could be obtained from thegrasses (Muthana and Shankarnarayan 1978, Prajapati 1979).
Firewood
Four to six t ha-1 yr-1 of firewood can be expected from short rotation species ondegraded lands at a tree density of 500 plants ha-1 in a 10-year cycle. Annuallopping when trees are 6–7 years old has been found to give 2.3–3.5 t ha-1 fodderand 4.5–6.5 t ha-1 firewood. Thus, combining the forage and top feed yield, thesystem could easily produce 5.3–9.5 t ha-1 forage and 5 t ha-1 firewood or10–14.5 t ha-1 total biomass. With the correct plant species, geometry, andmanagement it might be possible to raise this to12–15 t ha-1 yr-1.
Grazing
The stubble after the grass harvest can be grazed by different species ofanimals from the 4th year onwards between December and June. Theproductivity of grasses during the next monsoon is not affected. The leaf litterof the trees, the legume component in the pasture, and occasional lopped treeleaves provide a balanced ration.
Seed Production
The production of grass, legume, and tree seeds is a profitable enterprise. Onslightly better sites, in a rotation of 5–6 years at the time of system renewal acrop of pigeon pea or cowpea could be obtained. Good production of thesecrops has been obtained in many situations (Deb Roy et al. 1978; Muthana andShankarnarayan 1978).

176
Hortipastoral System
Dryland fruit crops such as Zizyphus mauratiana, custard apple, and Emblicaofficinalis, when grown in a hortipastoral system with grasses and legumes,provide early income from fruits, firewood from prunings, and forage from thegrasses and legumes. These systems have been found to provide an annualforage yield of 4–6 t ha-1. The presence of Stylosanthes hamata helps toincrease fruit production.
Techniques and Choice of Species for Different Types ofDegraded Lands
Table 12 shows the techniques and choice of species for rehabilitating differenttypes of degraded lands to optimize land productivity. Species such as Acacianilotica and Dalbergia sissoo account for 86% and 84% interception ofseepage. Trees interplanted with Napier grass are more efficient atintercepting seepage (Patil et al. 1994).
Grasses and legumes can provide early colonization of mine overburdens.Species such as Stylosanthes hamata, Clitoria ternata, and Macroptiliumatropurpureum produce poor root/shoot ratios but are desirable as colonizingand nitrogen-fixing species. Grasses such as Bothrichloa intermedia,B. pertusa, Cenchrus setigerus, and Chrysopogon fulvus colonize early withhigh production but poor root/shoot ratios.
Soil Productivity
Six years after silvipasture establishment, nitrogen, phosphorus, organiccarbon, and potassium levels have been found to increase with time even whengrasses are harvested and removed every year (Singh et al. 1977; Misra et al.1982).
Socioeconomic Implications of Silvipastoral Systems
Privately owned land improves and appreciates when managed well. However,common property resources are highly susceptible to degradation due to a lackof responsibility sharing. In such situations, institutional arrangements to suitlocal/regional problems and policies are required to protect and improve thedegraded resources. Production-related activities having direct impact on

177
Table 12. Techniques and choices of species for the rehabilitation of degraded lands. Degraded lands Mechanical Trees Grasses/legumes Waterlogged areas Creating drainage
facilities, leveling, bunding and lining of canals to check seepage
Eucalyptus robusta, E. hybrid, Casuarina equisetifolia, Pterospermum acerifolium, Sesbania sesban, S. macrocarpa, S. aculeata, S. rostrata, Terminalia arjuna, Acacia nilotica
Brachiaria mutica, B. brizantha, Echinochloa colona, Iseilema laxum, Dichanthium annulatum
Barren and fallow lands
Proper leveling and drainage in the watershed concept to ensure application of water and nutrients. Breaking hard pans of calcium carbonate nodules. Applying gypsum/ pyrite/ lime/ manure to balance the nutrients or adding some essential nutrients through chemical fertilizers.
Acacia nilotica, Albizia lebbeck, A.amara, A.procera, Dalbergia sissoo, Leucaena leucocephala, Hardwickia binata, Melia azedarach, Azadirachta indica, Bamboo
Cenchrus ciliaris, C.setigerus, Chrysopogon fulvus, Sehima nervosum, Panicum maximum, Pennisetum pedicellatum, P. polystachyon, Stylosanthes hamata, S. guanensis, Macroptelium atropurpureum
Ravines Depending upon the suitability for a specific purpose, bulldozing, leveling and bunding the shallow ravines to grow crops. Providing mild soil and water conservation treatments to medium and deep ravines
Acacia nilotica, A. tortilis, A.farnesiana, Prosopis juliflora, Dichrostachys cinerea, Albizia lebbeck
Cenchrus ciliaris, C. setigerus, Dichanthium annulatum, Bothrichloa intermedia, Stylosanthes hamata, Macroptilium atropurpureum
Alkaline/Saline sodic lands
Scraping surface salts, flushing with water to wash excess salts, impounding water to leach injurious salts, trenching and flushing to remove surface salts, providing subsurface drainage, pumping water to lower the water table, deep plowing /breaking deep hard pan layers to remove hard pan. Adding gypsum, pyrite, sulfur, manure, growing green manuring crops, adding crop residues
Acacia nilotica, A. tortilis, Prosopis juliflora, Casuarina equisetifolia, Azadirachta indica, Sesbania sesban
Brachiaria mutica, Bothrichloa intermedia, Panicum maximum, Dichanthium annulatum, Desmanthes virgatus, Stylosanthes hamata

178
natural resources need to be analyzed in an economic framework includingnon-monetary costs.
The production from degraded lands has been analyzed financially.Gupta and Mohan (1982) reported the merit of silvipastoral and hortipastoralsystems indicating the high benefit/cost (B/C) ratios with higher employmentpotential and environmental benefits. In another study on the sub-Himalayanboundary degraded lands, Dhruvanarayana and Ram Babu (1984) reported aB/C value of 3.43 under Acacia catechu plantation with bhabar grass(Eulaliopsis binata (Retz) Hubbard). They observed that silvipasture orsilviculture of fast-growing species in ravines was the best option with a B/Cratio of 1.9. They observed that on good lands, hortipastoral systems gave a B/C ratio of 3.2, while on highly degraded lands silvipastoral systems gave a B/Cratio of 1.8 (Dhruvanarayana and Ram Babu 1990). On highly degraded rockyand gravelly areas or ravines in the central Indian semi-arid zone, silvipastoral,energy plantations, and hortipastoral systems provided the most viable optionof land use and land cover. Several studies by Pathak (1991), Pathak and Khan(1990,1992), and Pathak et al. (1995) reported very high B/C ratio andinternal rates of return (IRR) on energy plantations and silvipastoral systems(Table 13).
Future Thrust Areas• The grassland cover survey carried out during 1954 needs updating.• Changing land use and land cover demands reinvesting in proper land use
decisions for degraded lands where silvipastoral systems are most ideal.Habitat-specific studies are required to optimize forage supply from suchlands.
• System synthesis for producing diversity in the components, and designs foroptimizing yields are needed for different types of degraded lands.
Table 13. Present and expected returns from a silvipastoral system on degraded land.
Present Expected
Productivity Production Productivity ProductionProducts (t ha-1 yr-1) (M t yr-1.) (t ha-1 yr-1.) (M t yr-1)
Forage 0.5 –1.0 25–50 4.0–5.5 200–275Topfeeds Negligible - 1.6–2.5 80–125Firewood Negligible - 2.0–3.0 100– 150

179
• Research and development emphasis is required on high altitude pasturemanagement systems.
• Grazing management is needed to sustain productive grasslands and im-proved animal productivity.
• Grass densification (baling), storage, and improved transport efficiency todeficit zones in the country during adverse weather.
• Socioeconomic analysis and interventions for optimizing pasture productiv-ity and sustenance through participatory management on common propertyresources, and through Joint Forest Management, need urgent attention.
ReferencesDabadghao, P.M. and Shankarnarayan, K.A. 1973. The grass covers of India. IndianCouncil of Agricultural Research, New Delhi.
Debroy, R., Patil, B.D., and Pathak, P.S. 1978. Silvipastoral farming for ameliorationand increased land productivity of the arid and semi-arid regions. Proc. InternationalSymposium on Arid Zone Research and Development, 345-350.
Dhruvanarayana, V.V. and Ram Babu. 1990. Social and economic considerations inthe management of soils of hilly regions. Pages 273-284 in Technologies for WastelandDevelopment. (Abrol, I.P. and Dhruvanarayana, V.V., eds.). ICAR, New Delhi.
Dhruvanarayana, V.V. and Ram Babu. 1984. Economic viability of tree/grass crops onhighly eroded soils. Pages 37-45 in (Sharma, K., ed.) Economics of WastelandsDevelopment, SPWD, New Delhi.
Gupta, R. K. and Rao, D.L.N. 1994. The potential of agroforestry for sequesteringcarbon in wastelands and mitigating climatic change. Pages 90-95 in AgroforestrySystems for Sustainable Land Use. (Singh P., Pathak P.S. and Roy, M.M., eds.). Oxford& IBH Pub. Co. Pvt. Ltd., New Delhi
Gupta, T. and Mohan, D. 1982. Economics of Trees vs. Annual Crops on MarginalAgricultural Lands. Oxford & IBH Pub. Co., New Delhi.
Kanodia, K.C. 1987. Forage resources of heavy rainfall areas in western India withspecial reference to grassland amelioration. Pages 153-163 in Forage Production inIndia (Singh, P., ed.) RMSI, IGFRI, Jhansi, India,.
Kanodia, K.C. 1988. Production potentials of grazing lands and their managementstrategies. Pages 58-65 in Rangeland Resource and Management (Singh, P. and Pathak,P.S., eds.) RMSI, IGFRI, Jhansi, India,
Kanodia, K.C. and Patil. B.D. 1982. Pasture development. Pages 263-305 in DesertResources and Technology (Singh, A., ed.) Scientific Publishers, Jodhpur, India.

180
Kaul, R.W. and Ganguli, B.N. 1963. Fodder potential of Zizyphus in the shrub grazinglands of arid zone. Indian For. 39:623-630.
Mimeograph, National Wastelands Development Board, New Delhi.
Misra, S.M., Patil, B.D. and Pathak, P.S. 1982. Comparative differences in soilproperties as a result of growing different grass, legume, and tree combinations. IndianJ. Range management 3(1 & 2) :71-74.
Muthana, K.D. and Shankarnarayan, K.A. 1978. The scope of silvipastoralmanagement in arid regions. Arid Zone Research in India, Souvenir, Silver Jubilee,CAZRI, Jodhpur.
Pandeya, S.C. 1986. Impact of human activities on the organic productivity ofseminatural grazing lands: from arid to dry subhumid areas of western India. FinalReport, Department of Environment Project, Department of Special Assistance inBiosciences, Saurashtra University, Rajkot, 499 pp.
Pandeya, S.C. and Jain, H.K. 1979. Pages 630-655 in Tropical Grazing landsEcosystems (UNESCO) A State of Knowledge Report, Natural Resources Series XVI.
Paroda, R.S., Mann, H.S. and Verma, C.M. 1980. Management of Indian aridrangelands. Tech. Bull. No.4. Central Arid Zone Research Instt., Jodhpur, India.
Pathak, P.S. 1991. Economic analysis of silvipastoral systems. Pages 41-51 in ForestryEconomics Research in Asia, (Thammincha, S. L. Puangchit and Woods, H. eds). KaSetsart University Bangkok and IDRC, Canada.
Pathak, P.S. and Roy, M.M. 1994. Silvipastoral Ststem of Production, Bulletin, IGFRI,Jhansi.
Pathak, P.S. and Khan, T.A. 1990. Silvipastoral systems in economic framework. InSilvipastoral systems in India, 1981-1989. (Pathak, P.S. and Singh, P. eds.). RangeManagement Society of India, IGFRI, Jhansi.
Pathak, P.S. and Khan, T.A. 1992. Economics of minirotation energy plantations onmoist wastelands. Pages 1-8 in Economics of Energy Plantation (Mathur, A.N.,Hussain, I. and Rathore, N.S., eds.). Himanshu Publications, Delhi.
Pathak, P.S., Gupta, S.K. and Singh, P. 1995. IGFRI Approaches to rehabilitation ofdegraded lands, IGFRI, Bulletin, Indian Grassland and Fodder Research Institute,Jhansi, 23 pp.
Patil, S.G., Manjunatha, M.V., Hebbara, M., Kuligod, V.B. and Gupta, R.K. 1994.Evaluation of tree species for their biodrainagability in irrigation commands. Pages 35-56 in Agroforestry Systems for Degraded Lands, (Singh, P., Pathak, P.S. and Roy,M.M., eds.). Oxford & IBH Pub. Co, (Pvt.) Ltd., New Delhi.
Prajapati, M.C. 1979. Silvipastoral system of production in ravines. Proc. SummerInstt. on Silvipastoral Production, IGFRI, Jhansi 28- 40 pp.
181
Rai, P. and Kanodia, K.C. 1981. Effect of split application of nitrogen on the quantityand quality of Sehima-Heteropogon grasslands. Forage Res.7:8385.
Rai, P., Kanodia, K.C., Patil, B.D., Velayudhan, K.C. and Agrawal, R. 1980. Nitrogenequivalence of range legumes introduced in natural grasslands. Indian J. RangeMgmt.1:97-101.
Rai, P., Kanodia, K.C. and Upadhyay, V.S. 1987. Role of range legumes in sheepproduction. Indian J. Range Mgmt. 8(2):113-115.
Rai, P., Velayudhan, K.C., Shankarnarayan, K.A. and Kanodia, K.C. 1981. Effect ofneem cake blended urea and its time of application on quality and quantity of Sehima-Heteropogon grasslands at Jhansi. Ann. Arid Zone 29:107-116.
Ranjhan, S.K. 1994. Availability and requirements of feed and fodder for livestock andpoultry. Report, Department of Animal Husbandry, Government of India, New Delhi.
Shankarnarayan, K.A. and Rai, P. 1975a. Effect of fertilizer application on dry matterproduction in Iseilema laxum grassland at Jhansi. Forage Res. 1:155-157.
Shankarnarayan, K.A., Dabadghao, P.M., Rai, P., Upadhyay, V.S. and Maurya, R.K.1973. Fertilizers for the grasslands of Heteropogon contortus in Jhansi. Indian J. Agric.Sci. 43:562-566.
Shankarnarayan, K.A., Kacker, N.L. and Mertia, R.S. 1981. Productivity of largeherbivores, cattle and sheep productivity of arid grazing land ecosystem., MonographNo. 19. Central Arid Zone Research Instt., Jodhpur, India.
Shankarnarayan, K.A., Dabadghao, P.M., Upadhyay, V.S. and Rai, P. 1975b. Note ofthe effect of NPK on Sehima grasslands. Indian J. Agric. Sci. 45:383-386.
Sharma, B.R. and Karanne, K.D. 1988. Present status and management strategies forincreasing biomass production in northwestern Himalayan rangelands. Pages 138 -147in Rangeland Resource and Management (Singh, P. and Pathak, P.S., eds.). RMSI,IGFRI, Jhansi, India.
Singh P. and Mazumdar A.B. 1992. Current status of feed and forage management oflivestock in India. Agricultural Situation in India 47(5):375 – 382. Directorate ofEconomics and Statistics, Department of Agriculture and Co-operation, Ministry ofAgriculture, New Delhi, India.
Singh, D., Mannikar, N.D., Srivas, N.C. and Saxena, D.C. 1977. Changes in soilfertility under long term cultivation of fodder crops and grasses. J.Indian Soc. Soil25:28-32.
Tandon, J.P., Melkania, N.P. and Singh, S.P. 1982. Herbage production, structure andpossible measures for improvement of mid-Himalayan grasslands. Indian J. RangeMgmt. 3:21-27.

182
Trivedi, B.K. and Kanodia, K.C. 1982. Succession of grassland vegetation on semi-rocky substratum at Jhansi. Indian J. Range Mgmt. 3:1-10.
Upadhyay, V.S., Dabadghao, P.M. and Shankarnarayan, K.A. 1971. Annual Report.Indian Grassland and Fodder Res. Instt., Jhansi.
Upadhyay, V.S., Rai, P. and Patil, B.D. 1980. Comparison of two tropical grass speciesfor growth and milk production in dairy cattle under grazing conditions. Indian J.Range Mgmt. 1(2):129-136.
Yadav, M.S. 1987. Reseeding arid rangelands with improved pasture grasses. Pages149-152 in Forage Production in India (Singh, P. ed.). RMSI, IGFRI, Jhansi, India.

183
Conversion from Free Range Grazing toConversion from Free Range Grazing toConversion from Free Range Grazing toConversion from Free Range Grazing toConversion from Free Range Grazing toManaged Feeding: TManaged Feeding: TManaged Feeding: TManaged Feeding: TManaged Feeding: Technological andechnological andechnological andechnological andechnological and
Institutional IssuesInstitutional IssuesInstitutional IssuesInstitutional IssuesInstitutional Issues
Ranjitha Puskur1
The study examines technological and institutional issues in conversion of freerange grazing to managed feeding in the semi-arid Bundelkhand region ofcentral India. The region is spread over 72 000 km2 and supports a populationof 12 million humans as well as 10 million cattle and buffalo. Growing humanand animal populations have resulted in an increased pressure on the land,which has in turn led to a decline in the productivity and availability of grazinglands (natural grasslands, wastelands, and forests). The region thus suffersfrom a serious shortage of livestock feed for most of the year, leaving manyfarmers with little option but to allow their animals to graze freely. Suchpractices damage cropped fields and discourage farmers from growing crops inthe summer season.
The intensification of livestock production is often considered a solutionto the problems arising from free-range grazing. The farmers may replace theircurrent large numbers of free grazing, low-productivity animals with smallernumbers of stall-fed, more productive animals. In an effort to stimulate thischange, technologies have been developed for fodder production fromirrigated, rainfed, and rehabilitated lands; the latter including grasslands,wastelands, and forests. Although technically sound, most of thesetechnologies have not been adopted by the local farmers. This study is anattempt to address such issues. The study was conducted in 1998 with thespecific objectives of:
• Determining the reasons for the persistence of free grazing;• Identifying constraints and opportunities for conversion from free grazing
to managed feeding systems; and• Identifying context-specific and client-oriented technologies required for
managed feeding systems.
1. Indian Grassland and Fodder Research Institute, Jhansi 284 003, India.
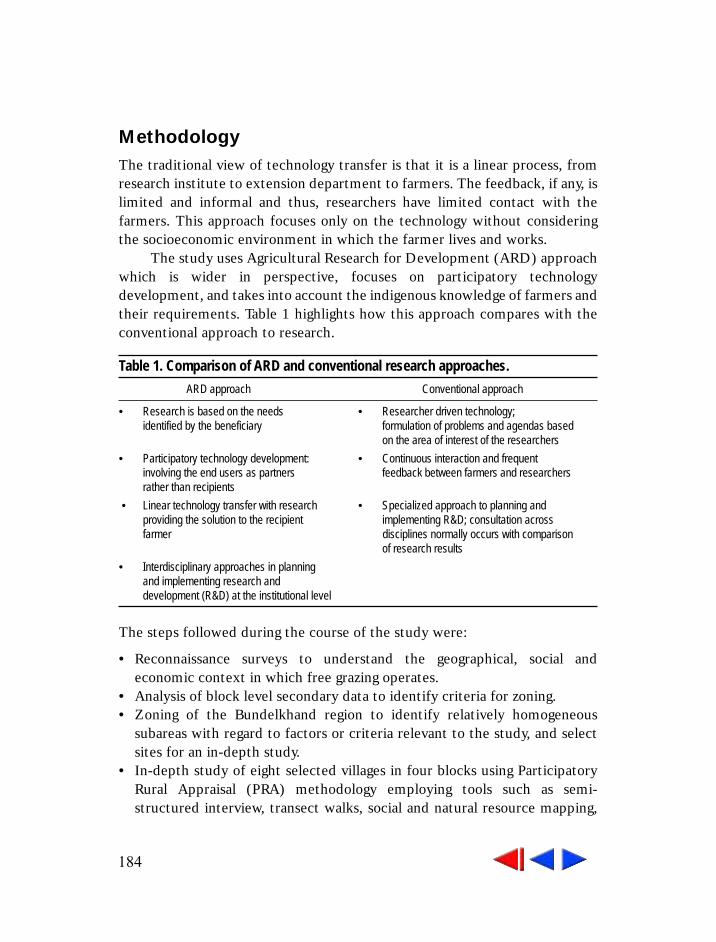
184
MethodologyThe traditional view of technology transfer is that it is a linear process, fromresearch institute to extension department to farmers. The feedback, if any, islimited and informal and thus, researchers have limited contact with thefarmers. This approach focuses only on the technology without consideringthe socioeconomic environment in which the farmer lives and works.
The study uses Agricultural Research for Development (ARD) approachwhich is wider in perspective, focuses on participatory technologydevelopment, and takes into account the indigenous knowledge of farmers andtheir requirements. Table 1 highlights how this approach compares with theconventional approach to research.
Table 1. Comparison of ARD and conventional research approaches.
ARD approach Conventional approach
• Research is based on the needs • Researcher driven technology;identified by the beneficiary formulation of problems and agendas based
on the area of interest of the researchers
• Participatory technology development: • Continuous interaction and frequentinvolving the end users as partners feedback between farmers and researchersrather than recipients
• Linear technology transfer with research • Specialized approach to planning andproviding the solution to the recipient implementing R&D; consultation acrossfarmer disciplines normally occurs with comparison
of research results
• Interdisciplinary approaches in planningand implementing research anddevelopment (R&D) at the institutional level
The steps followed during the course of the study were:
• Reconnaissance surveys to understand the geographical, social andeconomic context in which free grazing operates.
• Analysis of block level secondary data to identify criteria for zoning.• Zoning of the Bundelkhand region to identify relatively homogeneous
subareas with regard to factors or criteria relevant to the study, and selectsites for an in-depth study.
• In-depth study of eight selected villages in four blocks using ParticipatoryRural Appraisal (PRA) methodology employing tools such as semi-structured interview, transect walks, social and natural resource mapping,
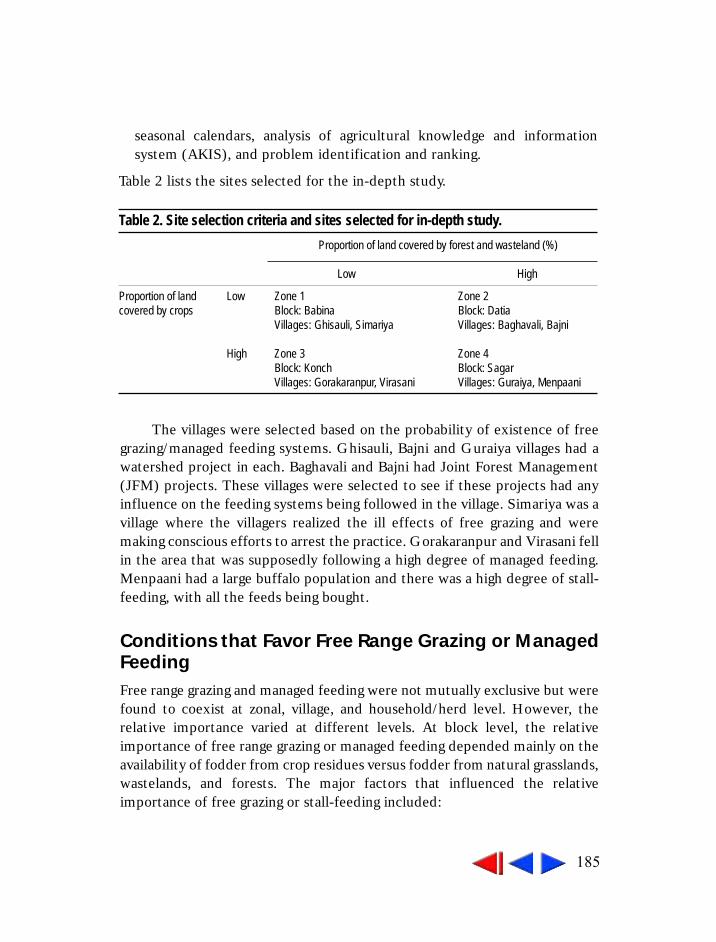
185
seasonal calendars, analysis of agricultural knowledge and informationsystem (AKIS), and problem identification and ranking.
Table 2 lists the sites selected for the in-depth study.
The villages were selected based on the probability of existence of freegrazing/managed feeding systems. Ghisauli, Bajni and Guraiya villages had awatershed project in each. Baghavali and Bajni had Joint Forest Management(JFM) projects. These villages were selected to see if these projects had anyinfluence on the feeding systems being followed in the village. Simariya was avillage where the villagers realized the ill effects of free grazing and weremaking conscious efforts to arrest the practice. Gorakaranpur and Virasani fellin the area that was supposedly following a high degree of managed feeding.Menpaani had a large buffalo population and there was a high degree of stall-feeding, with all the feeds being bought.
Conditions that Favor Free Range Grazing or ManagedFeedingFree range grazing and managed feeding were not mutually exclusive but werefound to coexist at zonal, village, and household/herd level. However, therelative importance varied at different levels. At block level, the relativeimportance of free range grazing or managed feeding depended mainly on theavailability of fodder from crop residues versus fodder from natural grasslands,wastelands, and forests. The major factors that influenced the relativeimportance of free grazing or stall-feeding included:
Table 2. Site selection criteria and sites selected for in-depth study.
Proportion of land covered by forest and wasteland (%)
Low High
Proportion of land Low Zone 1 Zone 2covered by crops Block: Babina Block: Datia
Villages: Ghisauli, Simariya Villages: Baghavali, Bajni
High Zone 3 Zone 4Block: Konch Block: SagarVillages: Gorakaranpur, Virasani Villages: Guraiya, Menpaani

186
• Cropping intensity: In zones and villages with high cropping intensities, theamount of crop residues was high, while natural grazing resources werelimited. In these areas, stall-feeding was relatively important. The reverseheld for zones and villages with a low cropping intensity.
• Proximity to forests, wastelands, and fallow lands: Villages nearer to theseareas had a high proportion of free range grazing.
• Access to land: Smallholders and the landless practiced free range grazingeven in irrigated (high fodder producing) areas.
• Access to markets for milk and fodder: Villages with access to milk andfodder markets had a higher proportion of stall feeding than those in remoteand inaccessible areas.
Economic Rationale for Free Grazing or Managed FeedingBefore designing or recommending new technologies, it is important thatscientists understand the farmer’s viewpoint. Stall-feeding is assumed to beeconomically better than free grazing. This is because stall-fed animals areusually of better genotype, and produce more milk than free grazing animals.In this sense, improved breeds are considered to be more productive.
On the other hand, the decisions of farmers are based on the output perunit of capital (and labor), and influenced by their resource endowments, andthe constraints/ opportunities existing in the surroundings. For example, aninvestment of Rs 20 thousand to buy 20 local cattle that are free grazed atlimited labor costs may well be only as productive as spending the equivalentamount on the purchase of one buffalo. Although the latter yields more milkper head than the local breed, it may not be as profitable as 20 local cows.
Farmers may practice free grazing only because they have theopportunity to do so. They are not interested in more productive animalsexcept for a few that they can feed with their home-produced crop residues.Low productivity becomes a problem when local animals can no longer be freegrazed, and farmers are forced to stall-feed them. The breed then does notperform well enough and farmers replace these animals with buffalo.
Stall-fed, high-producing breeds are not necessarily always more profitableeconomically than free range grazed, local breeds. Farmers might opt for a systemwith a high degree of stall-feeding because it is economically more productive thanfree grazing (a positive choice) or because the circumstances preclude the option offree grazing (a negative choice). Also, farmers who practice free grazing might do sobecause they have no other option (a negative choice), or because they have nothing

187
to gain from converting to a stall-feeding regime (a positive choice for free grazing).The labor requirement for the livestock subsector shows considerable
variation between villages and households where free range grazing prevailsand those where stall-feeding is predominant. In free grazing, labor is requiredfor supervision of grazing during the winter and monsoon seasons and isusually drawn from the family. One person can supervise a large herd. In thevillages and households practicing stall-feeding one of the setbacks of thesystem is that labor is required on a continuous basis. Children are sometimeskept away from school to keep up with the high labor requirements.
A detailed partial budgeting analysis was carried out with three types offarmers practicing various degrees of stall-feeding to examine the profitabilityof free grazing vis-à-vis stall-feeding. These three types were:
1. A farmer with a herd of six cows and buffalo and an irrigated land area of 9ha. The grazing practice varied according to the season. During summer, allanimals were on unsupervised grazing for the whole day. In winter, non-lactating animals were grazed under supervision in the morning and evening.In the monsoon, all animals grazed unsupervised in the farmer’s grasslandduring the morning and evening. In the afternoon, they were grazed undersupervision on the common lands. The farmer gave a concentrate mixtureof linseed, cotton seed cake, barley flour, and gram flour to both lactatingand dry cows and buffalo three times a day during winter and summer. Onlythe lactating buffalo were given concentrates during the monsoon. The herdwas fed with wheat straw every day during summer and winter. The farmerused 30 man-days of hired labor and 16 man-days of family laboranimal-1yr-1.
2. A system where there was no land available for grazing and a system ofdairying largely based on stall feeding with purchased inputs and minimalfree grazing. Wheat straw was provided to the animals for 10 months. Con-centrates were fed for eight months (during the lactation period). On aver-age, a farmer used nine man-days of family labor animal-1 yr-1. Replacementof stock was done every three years. The herd size ranged from 4–60 rumi-nants per household.
3. A commercial, peri-urban dairy farmer with an average herd of six cows and10 buffalo practicing a totally stall-fed system without any grazing. All in-puts were purchased and wheat straw and concentrates provided to animalsthroughout the year. Twenty-six man-days of hired labor and 11 man-daysof family labor animal-1 yr-1 were used. Stock was replaced every two years.

188
The best estimates of major variables were used to determine the grossmargin. These estimates were based on information collected from the farmers,direct observations, the literature, and expert knowledge. Tables 3 to 6 give thebest estimates of the gross production value, gross costs, and gross margins for theabove three systems as well as a completely free grazing system on a per animalbasis, and an estimate of the cash inflow and outflow. The latter excludes theimputed costs incurred in milk production or ‘costs’ that do not require cashpayments, such as the imputed values of farm-produced fodder and crop by-products, interest on own capital, and family labor. The tables also showhousehold cash income from the different systems under varying assumptions ofherd sizes. The household cash income was based on herd size x cash flow peranimal, minus the value of home-consumed milk at 0.6 l day-1. For large herd sizes(that exceeded the number that could be fed with the crop residues of a large nineha farm, or that could be managed with family labor of 547.5 man-days per year),the additional costs of fodder and labor were also deducted from the herd size xcash flow per animal to obtain the net household cash income. The cash flowfigures for the free grazing and mixed systems are based on the best estimates of
Table 3. Gross production value, costs, and gross margins for a free grazing systemfor indigenous cows.
Rs animal-1 yr-1 (indigenous cows)
Minimum Best estimate Cash flow Maximum
Fresh milk 600 1845 1845 4020Manure 150 150 150 150Sale of calves (imputed) 300 500 0 600Gross production value 1050 2495 4770Total cash flow 1995
Labor (hired+family) 1200 1200 1800Concentrates 0 0 0 0Other feeds 0 0 0Veterinary services 0 0 0 0Interest on capital (24%) 168 168 600Depreciation 80 50 50 75Transportation (imputed) 0 0 0 0Gross costs 1448 1418 2475Total cash outflow 50Gross margin (398) 1077 2295Net cash flow 1945
Note: 1 US $ = Rs 40.

189
Table 4. Gross production value, costs, and gross margins for a mixed system.
Good quality indigenous cow Buffalo (local breed)
Mini- Best Cash Maxi- Mini- Best Cash Maxi-mum estimate flow mum mum estimate flow mum
............................................. (Rs animal-1 yr-1) ............................................
Fresh milk 3120 5355 5355 14280 3780 9360 9360 17100Dung 300 300 300 300 300 300 300 300Sale from calf (imputed) 400 500 500 800 400 600 600 800Gross production value 3820 6155 15380 4480 10260 18200Total cash flow 6155 10260Labor (hired+family) 2550 2550 3375 3450 3450 4388Concentrates 506 2205 2205 3600 759 2940 2940 4500Other feeds 0 5340 8380 1825 7215 10500Veterinary services 250 250 250 250 250 250 250 250Interest on capital (24%) 480 480 2400 1080 2400 6000Depreciation 229 260 217 750 700 1400 1400 1500Transportation (imputed) 48 210 210 240 60 210 210 240Gross costs 4063 11295 2882 18995 8124 17865 4800 27378Total cash outflowGross margin (243) (5140) (3615) (3644) (7605) (9178)Net cash flow 3273 5460
Table 5. Gross production value, costs and gross margins for a stall-feeding systemwith minimal free grazing, and all inputs purchased
Good quality indigenous cow Buffalo (local breed)
Mini- Best Cash Maxi- Mini- Best Cash Maxi-mum estimate flow mum mum estimate flow mum
............................................. (Rs animal-1 yr-1) ............................................
Fresh milk 3120 5355 14280 14280 3780 9360 17100 17100Manure 500 500 500 500 500 500 500 500Sale from calf (imputed) 400 500 500 800 400 600 800 800Gross Production Value 4020 6355 15580 4680 10460 18400
Total cash flow 15280 18400
Labor (hired+family) 2550 2550 3375 3450 3450 4388Concentrates 506 2205 2205 3600 759 2940 2940 4500Other feeds 0 5340 5340 7300 1825 7215 7215 10500Veterinary services 400 400 400 400 400 400 400 400Interest on capital (24%) 480 480 2400 1080 2400 6000Depreciation 229 260 217 750 700 1400 1400 1500Transportation (imputed) 60 210 210 240 60 210 210 240Gross costs 4225 11445 18065 8274 18015 27528Total cash outflow 8372 12165
Gross margin (205) (5090) (2485) (3594) (7555) (9128)Net cash flow 6908 6235

190
Table 6. Gross production value, costs, and gross margins for a system based ontotal stall feeding and all inputs purchased.
Buffalo (good breed)
Minimum Best estimate Cash flow Maximum
.............................................. (Rs animal-1 yr-1) ..........................................Fresh milk 6300 14910 29040 29040Manure 600 600 600 600Sale from calves (imputed) 700 800 1000 1000Gross production value 7600 16310 30640
Total cash flow 30640
Labor (hired+family) 3600 3600 4725Concentrates 911 2940 2940 5625Other feeds 1825 8415 8415 11700Veterinary services 250 250 250 250Interest on capital (24%) 2400 4320 15000Depreciation 2933 3500 3500 4750Transportation (imputed) 72 240 240 300Gross costs 11992 23265 42350
Total cash outflow 15345
Gross margin (4392) (6955) (11710)
Net cash flow 15295
production value and gross cash costs, whereas the cash flow for the two stall-fedsystems are based on maximum estimates of production value, and best estimatesof gross cash costs. Only then do the latter two systems seem to produce a positivecash flow. The assumption seems justified, moreover, that these stall-feedingsystems yield closer to the maximum estimates than mixed feeding systems.
Analysis of the results suggests that:
• In real economic terms, i.e., when all the costs (including costs that do notrequire cash payments, such as the imputed values of farm produced fodderand crop by-products, imputed interest on own capital, and family labor)are taken into account, free grazing would be the only viable system. Allother systems would produce negative gross margins.
• The positive household cash incomes for the mixed and stall-fed systemswould only be obtained when imputed costs of household labor, capitalinvolved, and crop residues are not considered. The comparison of thehousehold cash income for the two herd sizes (3 cattle + 1 buffalo vs. 7cattle + 3 buffalo) of the mixed system suggests that, in areas where there

191
is no land for free range grazing, increasing the herd beyond the size that canbe supported by farm-produced crop residues is not an economically viableoption.
This comparative economic analysis suggests that, if economic costs areconsidered but environmental and social costs to the community ignored, freegrazing is the only system that gives a positive gross margin. Stall-feeding isonly sustainable when farmers disregard the cost of own labor, capital, andcrop residues. The analysis suggests that gross margins and cash flows dropdramatically when herd sizes are extended beyond the numbers that farmerscan feed with their own crop residues, and they have to purchase fodder tocover the deficit. The economic analysis suggests that farmers who practicefree range grazing may do so because it is the best allocation of their capital,while those who practice complete stall-feeding or mixed systems (involvingsome purchased inputs) may only do so because there is not enough land tograze their animals.
The potential for further intensification of livestock production and thetechnologies required must, therefore, be looked at in relation to the resourceavailability at zonal, household, and village level. At current prices, a highdependence on stall-feeding is unlikely to become a viable option unless thequality and quantity of homegrown crop residues can be increasedsubstantially on a year-round basis at low or no additional cost, and theconversion efficiency of animals considerably increased through low-costgenetic improvements.
Marketing SystemsMarket access is necessary for the application of systems involving a highdegree of stall-feeding. The fodder market found in the region had threefeatures:• In most of the villages studied, the most readily available fodder consisted
of crop by-products, especially wheat straw. The price of fodder fluctuatedconsiderably, i.e., low immediately after harvesting and increasing as theseason advanced. The highest price was during winter. The farmers inGorakaranpur reported that they bought dried wheat straw from theirneighbors at Rs 100 to Rs 150 per 100 kg. Farmers who could afford it andhad storage space usually bought fodder just after the harvesting season.
192
• Farmers living in villages with Joint Fodder Management (JFM) activitiesdid sell some of the fodder harvested from the protected forests. They didthis due to lack of storage space or because it was a means of earning someready cash.
• Some buyers of fodder guaranteed their supply through an arrangementwhere a farmer raised a fodder crop on their request. The purchaser col-lected fodder and weeds from the designated plot. This was supposedlycheaper than purchasing the fodder from the market. However, when com-paring the costs incurred this seemed doubtful. The buyer got about 500 kgof green sorghum from a plot of 46.45 m2 at a cost of Rs 900, while 100 kgof green fodder could be bought in the market for Rs 100. The only advan-tage was that the farmer could collect other grasses and weeds from thefield as well. The same field produced 350 kg of Berseem during winter.
Knowledge and Information SystemZonal variations must be taken into account when developing technologies.Links between farmers and technology sources tend to be limited. Farmerswho want to use forest resources without restriction often clash with theForestry Department, which has a legal enforcement role. JFM is a moreviable alternative as it creates opportunities for better collaboration. Farmersshould be made aware of the long-term benefits of the approach instead oflooking only at short-term benefits such as free fodder and employment intrench digging.
Furthermore, farmers are not interested in taking an active role in thesustainable use of natural resources, if these do not belong to them and theydo not have a stake in the benefits.
Farmers appreciate contacts with extension staff. However, thetechnological training of the latter is limited to technology transfer, and theyare rarely capable of providing organizational and leadership training tofarmers.
The researchers have even less contact with farmers. Due to the absenceof good mechanisms for dissemination, the technologies do not reach thefarmers, leaving a big gap in terms of flow of information and feedback fromboth researchers and farmers.
Nongovernmental organizations are other potential collaborators in thedissemination of technologies. They have the advantage of a more appropriateapproach in mobilizing people.

193
Policy InfluencesCentral and state government policies also influence the choice of free grazingor stall-feeding. Agriculture is a state subject, yet the central and stategovernments have control over various issues related to forest and wastelands.Different governments control different categories of land e.g. revenue land,and protected/unprotected forests. The lack of co-ordination among variousagencies is a hindrance to implementing the wasteland development projects.Some issues in this regard are now mentioned.
Land Ceiling Act
The ceiling of irrigated land in Uttar Pradesh and Madhya Pradesh is 7.3 ha fortwo crops a year, and 10.9 ha for one crop a year. The ceiling for dry land is18.3 ha in Uttar Pradesh and 21.9 ha in Madhya Pradesh. Many largelandowners do not want to opt for a second crop, as that will reduce theamount of land they can own. According to government officials this failure orreluctance to have a second crop leaves a lot of land area uncultivated andpromotes free grazing. However, the Ceiling Act is not a major factor, as onlya few farmers possess more than 7.3 ha of land. Irrigation facilities have beendesigned for rabi (dry season) crops only. Another reason is failure topopularize short duration kharif (wet season) crops. The lack of fodder insummer due to nonproduction of zaid (summer) crop is mainly due to a lackof irrigation. At present, only small areas of vegetables are grown duringsummer, which do not provide any crop residues.
Forests and Wasteland Policy
Increasing the productivity of wastelands and forests, which are categorized asrevenue lands, protected, unprotected, and grazing lands is complex asdifferent government departments and ministries control these. Grassplantations can be harvested legally by community organizations in theabsence of formal lease deeds. Various authorities are permitted to lease outdifferent categories of lands. Lack of coordination and information on landownership often causes delays in obtaining the lease. For example, a DistrictCollector in Rajasthan leased some revenue land to a tree growers’ co-operative. Five years into the project it was realized that the land was reserveforest, which can only be leased by the central government. The deed wascancelled and the project had to be rolled back (Mishra 1998). Due to
194
encroachment, and state government policy to distribute common lands tolandless people, the area under village common land in the country has beenreduced by 41–55% (Jodha 1985).
Before the New Forest Policy of 1988, the community rights forownership of pasture and share of forest produce were not recognized. TheGovernment of India issued guidelines in 1990 for participation of the peoplein the management and sharing of forest produce, with emphasis on non-timber forest products (Saigal et al. 1997). This concept is in its pilot phaseand, presently, does not induce true participation.
Fodder Policy
The National Commission on Agriculture (NCA 1976) emphasized thatfeeding is of crucial importance. The NCA recommended identification ofgrass species suitable for wastelands and development of technologies forimproving productivity of such lands. The Commission observed that high-yielding nutritious fodder crops should compete favorably with any food orcash crop. This policy was not coupled with similar suitable policies (such ascredit facilities and provision of bulls in the villages for crossing) in otherdepartments for replacement of unproductive livestock by high-yieldingbreeds. The government put much emphasis on artificial inseminationprograms to produce high-yielding animals, but farmers refuted the programfor many valid reasons. The NCA did not at the time realize the importance ofcrop residues that can be used for fodder.
Grazing Policy
There is presently no national grazing policy, although it is in the process offormulation. Madhya Pradesh has a grazing policy, which imposes severalrestrictions and grazing fees, but does not discuss pasture development. In theabsence of a grazing policy, only forest regulations cover grazing restrictions,and these often contradict the fodder policy. All these factors lead to animbalance between grazing pressure and carrying capacity of grazing lands.
Industrial Policy
The significant influence of industrial policy on free grazing was observed inJalaun district. A multinational soybean-processing company popularized

195
soybean cultivation in the area, distributed minikits and bought back thesoybeans at good prices. Farmers accepted the technology because of itsprofitability. Now, many farmers grow soybean as a second crop during thekharif season. However, the free grazing is restricted. In some of thesevillages, farmers now use soybean straw as fodder.
Technology Needs and RecommendationsA number of technologies have been developed to address the issues of foddershortages and overgrazing. Approaches have included wasteland rehabilitationschemes coupled with grassland/silvipasture development, development ofimproved varieties of fodder grasses and legumes, and identification of speciesresistant to grazing pressure. The main aim has been to provide farmers withsufficient fodder for managed feeding systems (which may include stallfeeding as well as rotational grazing), thereby reducing the widespreaddegradation of forest and grasslands due to free range grazing.
The wide range of farm types in the region means that solutions need tobe tailored differently depending on whether the farmers own large or smallholdings, or are landless. The landless animal owner, for example, wouldbenefit from the increased employment opportunities and the increasedfodder availability provided through wasteland rehabilitation and grasslandmanagement schemes. Provision of improved fodder crop varieties andimproved cropping schemes (fodder/food intercrops), and improved animalscould be targeted at large-scale farmers. The smallholder would benefit fromdual-purpose (food and fodder) crop varieties, enabling maximum use of thelimited land available.
Table 7 shows the technological and strategic interventionsrecommended for various zones.
Availability of water can solve the problem of free grazing, as it is themain reason for the severe shortage of fodder, especially during the summermonths. This problem affects on-farm crop production and also theproductivity of forests and grasslands. In areas where water conservationmethods are used, the land is more productive; the grasses produced oftenbeing ‘cut and carried’ for use in stall feeding systems. Water conservationschemes need to be coupled with grassland management projects.
A major problem faced by small farmers in the study area was theshortage of land for crop production. Farmers with access to irrigation and

196
Table 7. Zone-wise major problems and related technological and strategic recommendations.
Zone 1 Zone 2 Zone 3 Zone 4 Characteristics § Low animal
pressure § Rainfed cropping
(37%) § Wasteland (18%) § Free grazing on
degraded grasslands
§ Low animal pressure
§ Forest (45%) § Rainfed
cropping (26%)
§ JFM projects provide cut & carry fodder and fuel wood
§ Majority of animals free grazed
§ High animal pressure
§ Rainfed cropping (48%)
§ Wasteland (15%)
§ Severe shortage of fodder
§ High animal pressure
§ Irrigated cropping (40%)
§ Wasteland (11%) § Free grazing on
common property resources (CPRs)
§ Food crop residues provide fodder for stall-feeding
Problems § Low fodder availability
§ Lack of water harvesting infrastructure
§ Limited food crop residues
§ Forest degradation
§ Low crop residue production
§ Lack of water harvesting infrastructure
§ Low fodder production
§ Low food crop residue production
§ Lack of water harvesting infrastructure
§ Insufficient fodder production
§ Low fodder quality § Limited fodder
markets
Technological and strategic recommenda- tions
§ Grassland development (silvipastures, agroforestry, wasteland rehabilitation)
§ Wasteland rehabilitation (check dams, staggered trenching, emphasis on organizational and managerial aspects)
§ Participatory project planning, implementation, and management
§ JFM development (including social, organizational and managerial aspects)
§ Wasteland rehabilitation
§ Participatory project planning, implementationand management
§ Selection and breeding of dual purpose (food/fodder) crops for rainfed conditions
§ Development of food/fodder intercropping systems
§ Water harvesting – on farm (ridging, bunding, tied ridging)
§ Distribution of improved bulls
§ Wasteland rehabilitation
§ Grassland development
§ Participatory project planning, implementatio, and management
§ Selection and breeding of dual purpose (food/fodder) crops for irrigated conditions
§ Improved marketing systems to distribute fodder
§ Distribution of improved bulls
§ Development of fodder processing
§ Techniques for improved nutrition
§ Participatory project planning, implementation and management

197
thus the potential for high crop yields, tended to grow only food crops. Lessthan one percent of the land was put to fodder cultivation. The developmentof dual-purpose crops (food/fodder) is almost certainly the only practicalsolution to the fodder shortages of the area.
A number of watershed projects in the area, although technically sound,failed to adequately involve the local people. For example, in Guraiya andGhisauli villages, watershed projects were seen more as an employmentopportunity than for the increased land productivity. This was because thepeople did not have a sense of project ownership, nor were they fully aware ofthe advantages of sustaining the project once the implementing agency hadleft.
This shows that technological experiments need to be conducted incombination with social experiments to find the most suitable match oftechnology and the form of organization to manage a common property.Parallel or separate experiments may not be successful as social organizationalconstraints may well rule out the use of certain technologies despite theirrelative merits. For example, it may prove that cut and carry is the onlytechnology that can be controlled or managed, given the constraints of theorganization concerned, although other technologies (rotational grazing ordeferred rotational grazing) may well produce higher quantities of biomass.The technical optimum is not necessarily the most feasible social solution.Research should then focus on optimizing cut and carry systems, despite thelower biomass production of this technology.
ReferencesJodha, N. S. 1985. Population, growth, and decline of common property resources inRajasthan, India. Population and development Review Vol. 2(2).
Mishra, V. K. 1998. Legal, administrative and procedural hassles in greening ofwasteland in India. Wasteland News 13(2): Nov 97-Jan 98.
Government of India. 1976. Field Crops. National Commission on Agriculture.Ministry of Agriculture Vol. 15
Saigal et al. 1997. Food and fuel wood. NTFP can sustain JFM. Wasteland News 3(1)Aug-Oct:46-55.

198
Food Processing TFood Processing TFood Processing TFood Processing TFood Processing Technologies echnologies echnologies echnologies echnologies for the for the for the for the for theSustained Growth of DairyingSustained Growth of DairyingSustained Growth of DairyingSustained Growth of DairyingSustained Growth of Dairying
B N Mathur and Alok Jha1
The importance of the dairy subsector in the Indian economy is reflected bythe fact that it is the second largest contributor to the gross value of output ofthe agricultural sector, after rice. Milk production has grown at an annualgrowth rate of 4.1% between 1980–81 and 1998–99. The annual per capitaavailability of milk in the country has increased at an average annual growthrate of 2.5% during this period. As a result, India’s import dependence hasreduced. At present, almost the entire milk demand is met through domesticsupplies. Various agencies such as the National Dairy Development Board(NDDB), Dairy Cooperatives, National Dairy Research Institute (NDRI), andother research and developmental institutions have contributed to thisphenomenal growth.
The remarkable growth in dairying achieved over the last few decadesneeds to be sustained in an efficient and economic manner so as to ensureadequate returns to investments at farm and industry levels, and thecontinued availability of milk and milk products at economical rates toconsumers. This would be possible by developing vertical linkages betweenproducers and consumers with the processing sector in between. This paperfirst examines the prospects of value addition to milk and then identifiesefficient value added technologies.
Prospects for Value AdditionOf the total milk produced in the country, about one-third is retained by theproducers for personal consumption, and the rest finds its way to the market.There is little information on the utilization pattern of milk; yet the bulk isconsumed as whole milk and/or as ghee and curds. Available statistics indicatethat only about one-fifth of the total milk produced is processed into products
1. National Dairy Research Institute, Karnal 132 001, India.

199
such as cheese, butter, whey, and sweetmeats. (Dairy India 1999). This is dueto the lack of processing and associated infrastructures. Nevertheless, there isa huge potential for development of the market for processed milk food.Several factors underline this proposition. First, India’s huge population itselfis a source of demand for processed milk products. However, the effectivedemand is constrained due to the low per capita income of the majority of thepopulation. The rapid growth in per capita income in recent years indicatesthe gradual emergence of an upwardly mobile middle class, which because ofits nouveau riche behavior, is expected to be a great source of demand forprocessed foods. Second, a large part of the demand comes from the urbanpopulation, which has been growing rapidly in recent decades. Third, India’spresent share in world exports of dairy products is miniscule. This is becauseof higher domestic demand for milk and lack of competitiveness in the worldmarket due to high levels of support to producers, industry and exporters ofmilk and milk products in Europe and the USA. With the implementation ofthe WTO agreement the cost of milk production, as well as processing, isexpected to rise in major exporting countries. This is to the advantage of manydeveloping countries including India. Furthermore, processing costs in Indiaare also high for a number of reasons. The application of improved processingtechnologies would help reduce processing costs.
Dairy Production TechnologiesImproving Quality of Raw Milk
Lactoperoxidase System for Preservation of Raw Milk
Refrigeration of raw milk in rural areas is difficult because of the inadequacyand frequent breakdown of power supply, voltage fluctuations, and high costof refrigeration equipment. Thus, an alternative method for preservation ofmilk, known as the lactoperoxidase (LP) system, has been developed.
The advantages of this method are:
• LP is a naturally occurring antimicrobial agent in bovine milk, which can beharnessed for effective preservation of raw milk.
• LP can be activated with an exogenous dose of thiocyanate and hydrogenperoxide within 2-3 hours of milk production.
• Milk remains in a good condition up to 30 hours at 37°C.• The cost of preservation is low.

200
Technologies for Process Upgradation of Traditional MilkProducts
The sector engaged in the preparation of a wide range of indigenous milkproducts lacks organization and requires modernization. Intensive scientific,research/development (R&D), and financial inputs are necessary to developindustrial manufacturing and packaging systems. Significant work has beendone to this end; some of the new processes are discussed here.
Khoa Powder
Khoa cannot be stored for more than five days at room temperature withoutspoiling. Addition of preservatives to khoa is illegal in India. Thus, in manyparts of the country, khoa production is banned during summer.Unfortunately this is the time when the demand for khoa is invariably at itspeak. The cost of packaging and transportation of khoa is also high due to itsbulk. The technology developed for manufacture of khoa powder would helpeliminate these problems. Standardized buffalo milk is vacuum concentratedto the desired level and heated to accentuate flavor prior to drying.Antioxidants and free-flowing agents are added to improve the chemical andphysical properties.
The advantages of the new process are:• About 14 kg of khoa powder is obtained from 100 liters of standardized
buffalo milk. On reconstitution with water, this quantity produces about 21kg of khoa.
• Khoa powder can be used directly for the preparation of various sweets(burfi, milk-cake, kalakand, and gulab jamun). The quality of sweets madefrom khoa powder is highly acceptable.
• With appropriate preservative techniques khoa powder can be stored up to10 months at 30°C.
Instant Kulfi Mix Powder
Kulfi is a popular frozen milk product. The chemical and organolepticqualities of commercially sold kulfi vary and tend to be of inferior microbialquality. A technology has been perfected for the manufacture of kulfi mixpowder by spray drying. The mix is formulated from milk fat, milk solid notfat (MSNF), sucrose, and isabgol (Plantago psyllium) husk. The concentrationof solids in the mix is adjusted and only 25% of the total sugar required added
201
before drying. The mix is homogenized and heat-treated in a tubular heatexchanger, then spray dried. The remaining sugar is powdered, dry blendedwith the mixture, and packaged in tin cans. The approximate chemicalcomposition of kulfi mix powder is: fat 25.4%, MSNF 37.0%, isabgol 0.5%,sugar 34.7%, and moisture 2.5%.
The advantages of the new process are:
• The product has a shelf life of seven months at 30°C in tin cans.• The cost of production of kulfi mix powder at current prices works out to
Rs 90 per kg; much lower than that from regular processes.• Kulfi mix powder can be instantly reconstituted and frozen to get kulfi of
consistently good quality throughout the year at an affordable price.
Gulab Jamun Mix Powder
Gulab Jamun is traditionally prepared from a mixture of khoa, bleachedwheat flour (maida), and baking powder. There are wide variations in thechemical composition, flavor, and texture of khoa; these affect the finalquality of gulab jamun. The shelf life of traditionally prepared Gulab Jamun isabout one week at ambient temperatures. Refrigeration adversely affects itstexture and quality. The instant Gulab Jamun mix powder overcomes theseproblems, with several additional benefits.
Gulab Jamun mix powder is formulated from milk powder, vanaspatioils, maida, semolina, baking powder, and ground cardamom. Two differentformulae have been developed for spray and roller-dried skimmed milk. Theproduct can be packed and sold in a metallized polyester laminate.
The steps involved in Gulab Jamun preparation such as making thedough, deep fat frying, and soaking of balls in sugar syrup were standardizedfor the mix powder. One kg mix powder yields about 150 gulab jamuns ofaverage size (25 g each).
The advantages of the new process are:
• Gulab Jamun mix powder packaged in metallized polyester laminateswithout preservatives remains fit for use for up to eight months at30°C.
• The cost of Gulab Jamun mix powder formulated from roller driedskimmed milk is estimated to be Rs 70 per kg; the spray-based mixformulation is slightly costlier (Rs 75 per kg).
• The technology is simple and the product convenient to use.

202
Instant Kheer Mix
Kheer is a dessert popular throughout India, but has limited life even underrefrigeration. In the past, several unsuccessful attempts have been made toextend the shelf life of kheer. Rice kheer produced in a dry form suitable forready reconstitution has overcome the problem of a limited shelf life.
The process for an instant rice-based kheer mix consists of separateinstantization of the milk and rice phases of the product employing two-stagespray-bed and fluid-bed drying systems. Appropriate compositional andprocess manipulations ensure a high product quality. The two-phase productcomprising powdered liquid/milk fraction and a particulate (rice) fraction ispackaged bag-in-bag, a small polyethylene pouch of rice being carried in abigger bag containing the powder. The mix packaged in metallized polyester/LDPE pouches has a shelf life of at least six months at 37oC. Reconstitutioninvolves rehydration of instant rice in boiling water for 10 minutes followed bydispersal of the powder into the rice-water mixture. The reconstitutedproduct can be suitably flavored and enriched with dry fruits if desired, and isvery close to conventional kheer.
The advantages of the new process are:
• The shelf life of kheer is enhanced to six months compared to 1-2 days forthe conventional product.
• It is of considerable convenience to consumers – no sourcing of rawmaterials is required.
• Cooking time is reduced to 10 minutes as compared to one hour inconventional process; therefore there are savings in terms of fuel.
• The cost of manufacture is low.
Paneer and Related Products
Paneer is prepared by acid and heat coagulation of milk. Traditionally, smalldealers or the consumers themselves have produced it in very small quantities.Commercial production of paneer helps dairies utilize surplus milk during theflush season and provides an outlet for relatively inferior quality milk. Thelimitations of paneer production on a large scale are lack of improvedtechnology of manufacture and limited shelf life.
203
The advantages of the new process using buffalo milk are:
• Higher yield and improved rheology achieved by incorporation ofhydrocolloids.
• Improved rheological characteristics by proper pH and temperature control.• Economical production through use of low cost unconventional coagulants.• Savings in energy and water requirement.• The simplified manufacturing technique makes the process more suitable
for mechanization.
UF - Paneer. Membrane technology has been used for the manufacture ofpaneer. The process involves standardization and heating of milk followed byultrafiltration (UF) whereby lactose, water, and some minerals are removed.The concentrated mass is cooled, acidified, and then placed in suitablecontainers. This is followed by texturization using microwave technique. Theresulting product has typical characteristics of normal paneer. The process alsohelps increase the shelf life.
The advantages of this technique are:• Uniformity of production.• Improved shelf life and increased yield.• It is a nutritionally improved product.
Long Shelf-life Paneer in Retort Pouches. The traditional technology issuitable for batch operations and handling of milk from 5 to 10 thousand litersin batches, but has certain limitations. Nearly half the milk solids are lost inwhey. It has a limited shelf life and production is labor intensive. Properpackaging and quality assurance systems are lacking. The new process achievesthe in-package sterilization and texturization of paneer in retort pouches.
The advantages of the new process are:• The product yield is almost doubled.• Whey solids are retained in the product and there is no problem of whey
disposal.• The product has a shelf life of three months at 30°C.• Various unit operations are integrated fully with mechanized energy-
efficient equipment.• An appropriate packaging system is available.• Cost of manufacture is low.
204
Technologies for Manufacture of Cheese and Related Products
Accelerated Ripening of Cheese
The traditional process of manufacturing ripened varieties of cheeses such asCheddar and Gouda takes a long time to yield the product. The long-timecuring is cumbersome, labor intensive, energy consuming, and expensive. Thisproblem is aggravated further in the case of Cheddar cheese production frombuffalo milk. Technologies have been developed that accelerate the ripeningprocess of cheeses, thus saving on refrigeration and labor.
The new process involves standardization of buffalo milk, relativelyhigher heat treatment, addition of a higher rate of starter culture andmicrobial rennet, and cooking at lower temperature. Supplementing thestarter culture with adjunct bacteria, addition of exogenous free enzymes,such as lipase and protease, and microencapsulated enzymes, and partialcuring of cheese at elevated temperatures accelerates the rate of ripening.Supplementation of buffalo milk with goat milk also improves the flavor, andthe development of body and texture.
The advantages of the new process are:• Buffalo milk can be used to manufacture good quality Cheddar cheese.• Supplementation with goat milk provides a profitable outlet for using goat
milk.• The process saves a considerable amount of labor, space, and energy and
curtails the amount of money tied up in cold storage.• It reduces the total ripening costs to about 20–27% of the original.
Cheddar Cheese Flavor Base
A process technology for Cheddar Cheese Flavor Base (CCFB) in a paste andspray-dried form has been developed. This form has 15 to 20 times more intensityof flavor and is a cheap and convenient substitute for matured natural Cheddarcheese, which is used conventionally for flavoring different food products.
The CCFB is made by incubating young cheese slurry and exogenousenzymes at elevated temperatures under controlled reaction conditions.Cheddar cheese flavor develops within hours. All the critical control points ofthe process are standardized to obtain a uniform product. The flavorcomponents are retained during spray drying using microencapsulationtechniques. The shelf life of spray dried CCFB packed in metallized polyesterlaminate pouches is more than eight months at 15°C.

205
The advantages of the new process are:
• Production costs are reduced by as much as 40–80%.• Production capacity is increased and product stability enhanced• There is improved consistency and batch-to-batch product uniformity.• There is better control in the development of new products.
Technologies for Manufacture of Fermented Milk Products
Mishti dahi
Mishti dahi is a popular traditional fermented milk product from easternIndia. Since the manufacturing conditions are not controlled, the quality ofeach lot of mishti dahi is different. A standard method has now beendeveloped, which is also suitable to large-scale production.
Skimmed milk is concentrated into known total solids employing avacuum process. Cream is added to adjust fat in the partially concentratedmilk. The standardized concentrated milk is heated and homogenized,followed by addition of sugar. The sweetened milk is heated to generate thecharacteristic caramel flavor, cooled to 30°C, and inoculated with LF-40starter culture (1% by weight of milk). It is then filled in pasteurizedpolystyrene cups and incubated at 30°C for seven hours.
UF-Shrikhand
Shrikhand is an indigenous fermented milk product presently beingmanufactured by conventional methods. The conventional method allows thewhey proteins to drain along with whey during chakka (curd cheese) making.The yield of skimmed milk chakka is about 18% by the conventional method.
A new method of skimmed milk chakka manufacture has been standardizedthat gives 23% extra yield (due to the recovery of whey proteins) using an UFtechnique. The quality of shrikhand made from UF-chakka has been found to beexcellent.
Coagulated skimmed milk is concentrated by ultrafiltration using amineral membrane module so as to recover whey proteins in the form of UF-retentate (chakka). Cream and sugar are added to the retentate. Theminimum shelf life of the product is two weeks under refrigeration.
206
Technologies for Manufacture of Formulated Foods
Bifidus-containing Infant Formula
Existing infant formulae being marketed currently in India do not offer thebioprotective features essential to protect the health of bottle-fed babies.Higher instances of diarrheal diseases are reported among bottle-fed babies.
The advantages of the new technology are:
• The ratio of whey protein: casein:fat:carbohydrate:mineral is similar to thatof human milk.
• Essential nutrient and caloric content conform to WHO/FAO, CodexAlimentarius Commission standards
• The product contains 1.2 x 10⁵ cfu per gm of Bifidobacterium bifidumsuitable for intestinal implantation in babies.
• Nutritional/biological adequacy has been established through feeding trialscarried out under pediatric supervision.
• The cost of manufacture is 40% lower than that of conventional formulae.
Low Fat Spread
Butter is one of the most consumed dairy items. However, very few of thosewho would like to eat butter can afford to buy it. When refrigerated, butterbecomes hard and brittle and loses its spreading consistency. When left atambient temperature, it loses its plasticity.
It is therefore necessary to provide a product that is acceptable in allrespects including spreadable consistency at ambient and refrigeratedtemperatures. An attempt was made to develop a low-fat, low-cholesterol,and low-cost spread, which could serve as a substitute for butter.
Low fat spreads usually have about 40% moisture content.Consequently, its shelf life is slightly less than that of conventional butter thathas only 15-16% moisture. The butter-flavored spread is prepared withskimmed milk powder, a blend of hydrogenated fat and refined soybean oil,carrageenan, trisodium citrate, common salt, diacetyl, glycerol monostearate,and annatto butter color. The cheese-flavored spread can be prepared in thesame way except that part of the skimmed milk powder is replaced withripened Cheddar cheese to impart the typical flavor.
The advantages of the new process are:
• Butter-flavored spread packaged in polystyrene cups (100 g) can be storedfor six weeks at 5°C.
207
• Butter-flavored low-fat spread costs only 58% the price of conventionalbutter, whereas the cheese-flavored product is slightly more expensivebeing 70% the cost of butter
Low Lactose Milk
Per capita consumption of milk, which is low in India, is expected to rise withan increase in milk production in the near future. Nearly 62% of the Indianpopulation cannot digest lactose in milk. The incidence of lactose intolerancevaries from region to region. The problem can be overcome by conversion ofthe lactose in milk into glucose and galactose by the enzyme ß-galactosidase.Since lactose in milk is converted into these monosaccharides in the humanbody following ingestion of milk, consumption of low lactose milk prepared bytreatment of milk with ß-galactosidase will overcome lactose intolerancewithout any side effects.
The critical factor in preparation of low lactose milk is the enzymeß-galactosidase. A number of microorganisms have been screened and identifiedas suitable sources for the enzyme. Strains of the yeast Kluvyeromyces fragilisand bacterial strains of Streptococcus cremoris, S. thermophilus, Lactobacillusbulgaricus, and Leuconostoc cremoris are all suitable for production of theenzyme. Whey (a by-product of the cheese industry) supplemented with anitrogen source serves as the medium for the propagation of the organism.
The enzyme is also commercially available. The quantity of the enzyme isexpressed in terms of enzyme units; one unit being equivalent to hydrolysis of1.0 µmole of lactose into glucose and galactose in one minute. The advantageof the new process is that low lactose milk has the same shelf life asnonhydrolyzed milk.
Technologies for the Manufacture of Dairy By-products
Whey Powder
Whey is the by-product obtained during the manufacture of cheese,paneer, chhana, casein, and other coagulated products. The growingdemands for cheese and increasing industrial production of casein andother coagulated products have generated enormous quantities of whey.On average, about 800 million kg of whey are produced annually as a by-product, with about 52 million kg of nutritious whey solids. Unfortunatelymost of this goes waste.
208
Besides being nutritious, whey solids possess excellent functionalattributes such as solubility, emulsifying and foaming property, gel-formation,water binding property, flavor, and viscosity. Whey is rich in organic matter.The BOD (Biological Oxygen Demand) of whey is as high as 35–50 thousandmg O2 L-1. Disposal of untreated whey can therefore be harmful to theenvironment and human health. Thus, recovery of whey solids offers dualadvantages. A technology has been developed for the manufacture of wheypowder, whey protein concentrate, and lactose using membrane technology,which is less energy intensive and more cost effective.
The method of production of whey powder involves clarification ofwhey, its partial concentration employing reverse osmosis, followed byvacuum concentration, precrystallization of lactose using alpha-lactosemonohydrates as seeding material, and finally spray-drying and packaging.
Whey Protein Concentrates
Whey protein concentrates (WPC) are used mainly as ingredients in non-dairyproducts, but also to some extent in dairy products such as infant and weaningfoods. Additionally, they can be utilized for designing speciality food products,such as health food, hospital meals, fruit juices, and beverage mixtures.
The process for WPC manufacture involves pretreatment andultrafiltration of whey, followed by spray drying of the UF-retentate. The pHof whey obtained from buffalo milk Cheddar cheese is adjusted to 7.2 prior toheating. Whey is cooled to 50°C before ultrafiltration. The retentate is spraydried using 180°C inlet and 80°C outlet temperatures. Whey proteinconcentrate powder thus obtained is cooled to room temperature, andpackaged in polyethylene or metallized polyester laminates.
The advantages of the new process are:
• Energy requirements of membrane processes are low compared toevaporation processes.
• Adoption of membrane technology has distinct advantages in terms ofimproved yield and enhanced nutritive value.
• The product is stable for six months at room temperature.
Acido Whey – A Whey Drink
A process has been developed to prepare a palatable soft beverage utilizingwhey that has been named ‘Acido-whey’. Acido-whey is a noncarbonated

209
drink, fermented with a selected strain of lactic acid bacteria and retaining allthe nutrients of the whey intact. No preservative or synthetic color is added. Itis highly refreshing, therapeutic in nature, and costs less compared to otherbeverages. The process is commercially feasible and economical to those dairyindustries that are engaged in simultaneously processing fluid milk andmanufacturing paneer and cheese.
Technologies for Use of Probiotics in Dairy Products
Probiotic Cheese
The tremendous growth of the market for probiotic food in Japan, Europe, theUSA, and Australia are indicative of a trend that could be emulated by thedairy industry in India. A process was standardized for manufacturing Edamcheese containing an adequate number of viable cells of the probioticmicroorganism Bifidobacterium bifidum (ATCC 15696). This cheese wascomparable to the conventional product in its organoleptic andphysicochemical characteristics. The efficacy of the probiotic characteristicsimparted to the cheese was demonstrated through animal bioassays, i.e.intestinal implantation, antagonism towards colonic coliforms, and reductionin b-glucuronidase activity. The cheese also contains physiologically activepeptides that augment its functional value. It is expected that theimplantation of this health-promoting strain in the human intestine will leadto the manifestation of the probiotic attributes in the human system. Thisneeds to be further investigated through clinical trials.
The advantages of the new process are:
• Product diversification and value addition.• Added therapeutic and physiological benefits in the cheese.• Distinct anticarcinogenic properties besides antagonism towards enteric
coliforms, thus reducing the risk of gastrointestinal diseases.
Technologies for Manufacture of Dairy Equipment
Continuous Butter Melter
The melting of butter is an important unit operation that precedes the use ofthe continuous ghee-making system. Butter is received from cold storage inthe form of large slabs normally at 4°C, and melts in jacketed tanks very slowly

210
due to poor heat transfer coefficient. The melting operation has to be startedin advance to keep the system in operation. The handling of large bricks ofbutter is also difficult. Continuous butter melters are not manufactured inIndia.
The continuous butter melter consists of a tank type heat exchanger witha rotor comprised of three components: a cutter, a conveying and turbulencegenerator, and a retainer disc to disintegrate butter lumps.
The advantages of the new process are:
• Quick operation: The melting capacity of 600-1000 kg/h is obtained with aheat-transfer surface area of only 0.72 m2. The initial temperature of butteris 12–14°C and temperature at the outlet is 55–65°C.
• It is a safe and convenient way of handling butter.• The heat transfer coefficients are high.• Less energy is required compared with that in the jacketed kettle.
Approximately 50 kJ kg-1 butter can be saved.
Continuous Ghee-making Machine
Ghee is currently manufactured by a batch process, which suffers from manydisadvantages:
• A low heat transfer coefficient and unhygienic method of operation.• An excessive strain on the operator due to the heat and humidity.• Problems of severe scaling and foaming leading to inefficient utilization of
the heat transfer surface and product loss.• A high energy requirement.
A new process has been designed on the principle of heat transfer and hydro-dynamics in a horizontal thin film-scraped surface-heat exchanger with a specificrate of water evaporation of 75 kg h-1 m2 at 3.5–4.0 atm. steam pressure.
Continuous Khoa Making Machine
Khoa is an important ingredient in the manufacture of milk-based sweets.Presently, khoa is made primarily in jacketed kettles, which have the followingdisadvantages:
• They are unhygienic to operate.• The heat transfer cannot be controlled and optimized• An excessive strain on the operator due to the heat and humidity.• Handling of large volumes is cumbersome.

211
A cascade system comprising two horizontal straight-sided thin film-scraped surface-heat exchangers has been fabricated to manufacture khoafrom standardized buffalo milk. The rotor of the first heat exchanger isprovided with four variable clearance blades and rotated at 3.3 rps. In this heatexchanger, milk is concentrated to about 40% total solids, which then flowsinto the second heat exchanger by gravity. The rotor of this heat exchanger hastwo helical conveying ribbons in addition to two variable clearance-scrapingblades rotated at 2.5 rps.
The advantages of the new process are:
• The heat transfer rates are high.• Cleaning is easy due to the absence of fouling.• There is a negligible hold-up volume as the product remains in the form of
a thin film.• The product is of uniform quality.
India has undoubtedly made tremendous progress in dairying, but this ismore quantitative than qualitative. What India now requires is a qualitativeimprovement in the entire food chain so that the country can establish itself asa reliable supplier of dairy products conforming to international standards andthe quality assurance systems as envisaged under WTO agreements. Fasturbanization, increased purchasing power, nutritional awareness, and demandfor region-specific milk products require new technologies to be developed fortailormade products.

212
ICAR-ICRISAT Collaborative Workshop on“Documentation, Adoption, and Impacts of Livestock
Technologies in Mixed Crop-Livestock FarmingSystems in India”
List of Participants
Anjani KumarNational Centre for AgriculturalEconomics and Policy Research(NCAP)
New Delhi 110 012
AL AroraCentral Sheep and Wool ResearchInstitute
Avaikanagar, (via Jaipur) 304 501Rajasthan
HPS AryaIndian Veterinary Research Institute(IVRI)
Izatnagar 243 122, UP
N BalaramanJoint DirectorNational Dairy Research Institute(NDRI)
Karnal 132 001, Haryana
PS BirthalSenior ScientistNCAPNew Delhi 110 012
PG ChengappaDirector of Instruction (Agriculture)College of AgricultureUniversity of Agricultural SciencesGKVK
Bangalore 560 065, Karnataka
RA Christopher DhasAmerican CollegeMadurai, TN
MR GargAnimal NutritionistNational Dairy Development BoardAnand, Gujarat
DM HegdeDirectorDirectorate of Oilseeds ResearchRajendranagarHyderabad 500 030, AP
D JhaNCAPP.O. Box 11305, Library Avenue, PusaNew Delhi 110 012
PK JoshiPrincipal ScientistNCAPP.O. Box 11305, Library Avenue, PusaNew Delhi 110 012
Khub SinghDirectorNational Institute for AnimalNutrition and Physiology
Adugodi, Bangalore 560 030,Karnataka
213
MPG KurupConsultant (Livestock & Dairy)16/2 A Borsad roadJitodia 388 001Gujarat
BN MathurDirectorNDRIKarnal 132 001, Haryana
NP MelkaniaProject Co-ordinatorAICRP on Forage CropsIndian Grassland andFodder Research Institute (IGFRI)
Jhansi 284 003, UP
AK MisraSenior ScientistLivestock Production andManagement
CRIDAHyderabad 500 059, AP
TRK MurthyNRC on MeatCRIDA Campus, SantoshnagarSaidabadHyderabad 500 059, AP
VC PachauriPrincipal ScientistIGFRIJhansi 284 003, UP
PS PathakDirectorIGFRIJhansi 284 003, UP
CS PrasadSenior ScientistNational Institute for AnimalNutrition and Physiology
Adugodi,Bangalore 560 030, Karnataka
Raj Vir SinghProfessor & HeadDivision of Dairy EconomicsNDRIKarnal 132 001, Haryana
K Rama DeviConsultant, SocioeconomicsJubilee HillsHyderabad 500 033, AP
Ranjitha PuskurIGFRIJhansi 284 003, UP
KPC RaoNational Academy of AgriculturalResearch Management
RajendranagarHyderabad 500 030, AP
R SahaiFormer DirectorNational Bureau of Animal GeneticResources (NBAGR)
Karnal 132 001, Haryana.
S SaranSr. ScientistCentral Avian Research Institute(CARI)
Izatnagar 243 122, UP
KN SelvakumarProfessor & HeadDepartment of Animal HusbandryEconomics
Madras Veterinary CollegeChennai 600 007, TN
Shalander KumarC/o Dr KP PantCentral Institute for Research onGoats
Makhdoom 281 122, P.O. FarahMathura, UP

214
D SharmaSr. ScientistCARIIzatnagar 243 122, UP
VP SharmaCentre for Management in AgricultureIndian Institute of Management (IIM)Ahmedabad 380 015, Gujarat
G SinghDirectorCentral Institute for AgriculturalEngineering
Bhopal 462 003, MP
N SinghJoint Director (Research)IVRIIzatnagar 243 122, UP
RK SinghDepartment of AgriculturalEconomics and Statistics
CS Azad University of AgriculturalTechnology
Kanpur 808 002, UP
SP SinghProject Division on Cattle (PDC)P.O. Box No. 17, Grass Farm RoadNear Military Farm School and CenterMeerut Cantt 250 001, UP
ICRISAT
William D DarDirector General
JM LennéDeputy Director General (Research)
Genetic Resources and EnhancementProgram
R BandhyopadhyayaFR BidingerCT HashCLL GowdaBelum VS Reddy
Natural Resource Management Program
TJ RegoOP RupelaSP Wani
Socioeconomics and Policy Program
VK ChopdeUK DebA HallD KarY Mohan RaoGD Nageswara RaoR PadmajaP Parthasarathy Rao

Citation: Birthal, P. and Parthasarathy Rao, P. (eds). 2002. Technology options for sustainablelivestock production in India: proceedings of the Workshop on Documentation, Adoption, andImpact of Livestock Technologies in India, 18–19 Jan 2001, ICRISAT-Patancheru, India.New Delhi 110 012, India and Patancheru 502 324, Andhra Pradesh, India: National Centrefor Agricultural Economics and Policy Research and International Crops Research Institute forthe Semi-Arid Tropics. 220 pp. ISBN 92-9066-444-4. Order code CPE 137.
The opinions expressed in this publication are those of the authors and not necessarily those ofNCAP or ICRISAT. The designations employed and the presentation of the materials in thispublication do not imply the expression of any opinion whatsoever on the part of NCAP orICRISAT concerning the legal status of any country, city, or area, or of its authorities, or concerningthe delimitation of its frontiers or boundaries. Where trade names are used this does not constituteendorsement of or discrimination against any product either by NCAP or by ICRISAT.
About NCAPAbout NCAPAbout NCAPAbout NCAPAbout NCAPThe National Centre for Agricultural Economics and Policy Research (NCAP) wasestablished by the Indian Council of Agricultural Research (ICAR) with a view to upgradeagricultural economics research through the integration of economics input in theplanning, design, and evaluation of agricultural research programs, and to strengthenthe competence in agricultural policy analysis within the Council. The Centre is assigneda leadership role in this area, not only for various ICAR institutions, but also for theState Agricultural Universities. In order to make agricultural research a more effectiveinstrument for agricultural and rural change and to strengthen policy-making andplanning machinery, NCAP undertakes and sponsors research in agricultural economicsrelating to problems of regional and national importance.
About ICRISAAbout ICRISAAbout ICRISAAbout ICRISAAbout ICRISATTTTTThe semi-arid tropics (SAT) encompasses parts of 48 developing countries includingmost of India, parts of southeast Asia, a swathe across sub-Saharan Africa, much ofsouthern and eastern Africa, and parts of Latin America. Many of these countries areamong the poorest in the world. Approximately one-sixth of the world’s populationlives in the SAT, which is typified by unpredictable weather, limited and erratic rainfall,and nutrient-poor soils.
ICRISAT’s mandate crops are sorghum, pearl millet, finger millet, chickpea,pigeonpea, and groundnut; these six crops are vital to life for the ever-increasingpopulations of the SAT. ICRISAT’s mission is to conduct research that can lead toenhanced sustainable production of these crops and to improved management of thelimited natural resources of the SAT. ICRISAT communicates information ontechnologies as they are developed through workshops, networks, training, libraryservices, and publishing.
ICRISAT was established in 1972. It is one of 16 nonprofit, research and trainingcenters funded through the Consultative Group on International Agricultural Research(CGIAR). The CGIAR is an informal association of approximately 50 public and privatesector donors; it is co-sponsored by the Food and Agriculture Organization of the UnitedNations (FAO), the United Nations Development Programme (UNDP), the UnitedNations Environment Programme (UNEP), and the World Bank.
About the SLPAbout the SLPAbout the SLPAbout the SLPAbout the SLPPoverty, food insecurity, and a deteriorating environment threaten the livelihoods andeven the lives of millions of rural people in developing countries. Smallholder farmers inthese countries have few resources or opportunities to improve their situation, but oneoption is widely available: by integrating crop and livestock production, farmers can improvetheir farm productivity while protecting their natural resources.
Linking the livestock-related research of its partners worldwide, the SystemwideLivestock Program of the Consultative Group on International Agricultural Research(CGIAR) is a unique vehicle for enhancing the contribution of animal agriculture to theCGIAR’s objectives of increasing food production, eradicating poverty, and protectingthe environment.
Coververso.p65 4/17/02, 1:44 PM1
Black

Technology Options for SustainableLivestock Production in India
National Centre for Agricultural Economics and Policy Research
International Crops Research Institute for the Semi-Arid Tropics
International Livestock Research Institute
National Centre for Agricultural Economics and Policy ResearchLibrary Avenue, Pusa, New Delhi 110 012, India
International Crops Research Institute for the Semi-Arid TropicsPatancheru 502 324, Andhra Pradesh, India
Systemwide Livestock ProgramInternational Livestock Research Institute
Addis Ababa, Ethiopia
ISBN 92-9066-444-4 144–2002Order Code CPE 137
Techn
olo
gy O
ptio
ns fo
r Sustain
able Livesto
ck Prod
uctio
n in
Ind
ia
Cover-finnew.p65 4/18/02, 3:03 PM1