Optimizing the Cocos2D-X library A DS-5 Streamline case...
34
1 Optimizing the Cocos2D-X library A DS-5 Streamline case study 彭晓波/Bob Peng Technical Marketing Manager, Strategic Software Alliances November 2013
Transcript of Optimizing the Cocos2D-X library A DS-5 Streamline case...
1
Optimizing the Cocos2D-X library A DS-5 Streamline case study
彭晓波/Bob Peng
Technical Marketing Manager,
Strategic Software Alliances
November 2013
2
Agenda
Streamline Overview
Getting start with streamline
Cocos2d-x case study
* Event-based sampling is available on kernels 3.0 or later
3
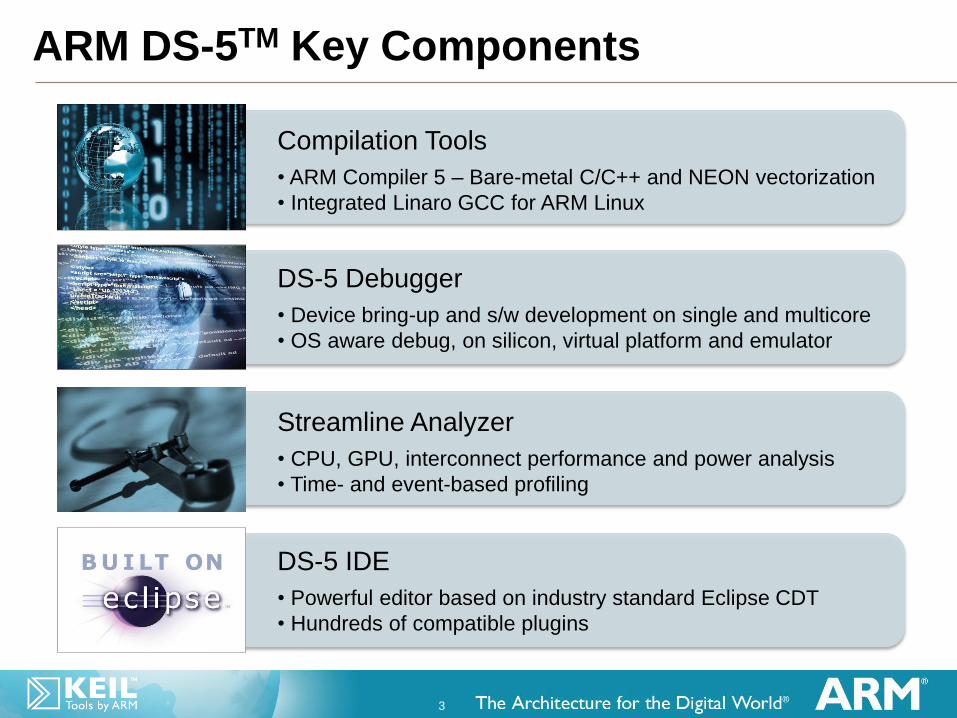
ARM DS-5TM Key Components
DS-5 IDE
• Powerful editor based on industry standard Eclipse CDT
• Hundreds of compatible plugins
Streamline Analyzer
• CPU, GPU, interconnect performance and power analysis
• Time- and event-based profiling
DS-5 Debugger
• Device bring-up and s/w development on single and multicore
• OS aware debug, on silicon, virtual platform and emulator
Compilation Tools
• ARM Compiler 5 – Bare-metal C/C++ and NEON vectorization
• Integrated Linaro GCC for ARM Linux
4
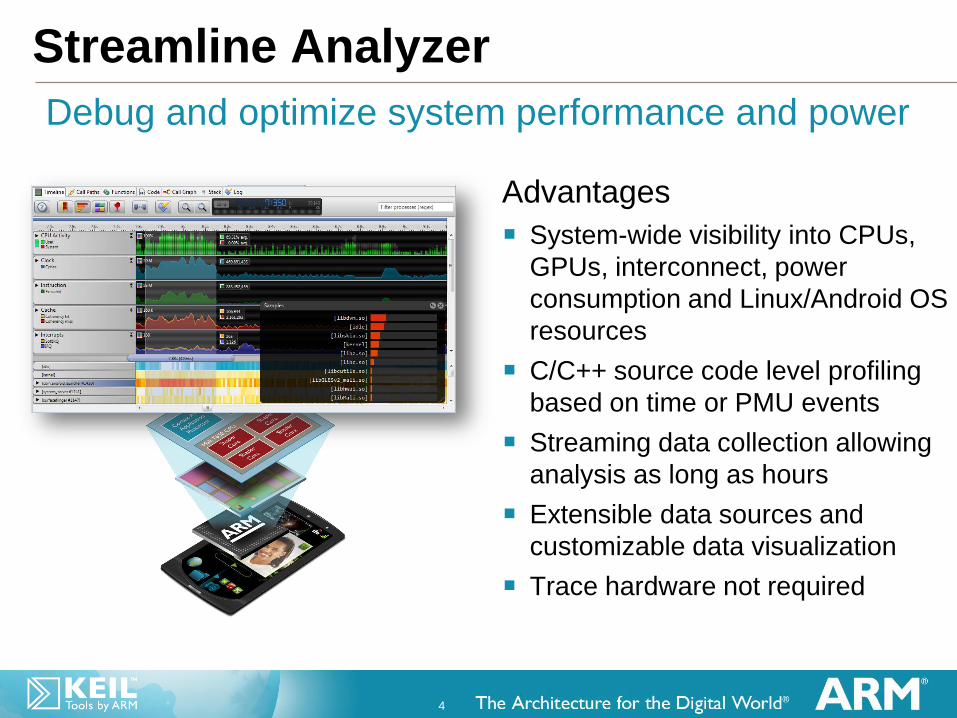
Streamline Analyzer
Advantages
System-wide visibility into CPUs,
GPUs, interconnect, power
consumption and Linux/Android OS
resources
C/C++ source code level profiling
based on time or PMU events
Streaming data collection allowing
analysis as long as hours
Extensible data sources and
customizable data visualization
Trace hardware not required
Debug and optimize system performance and power
5
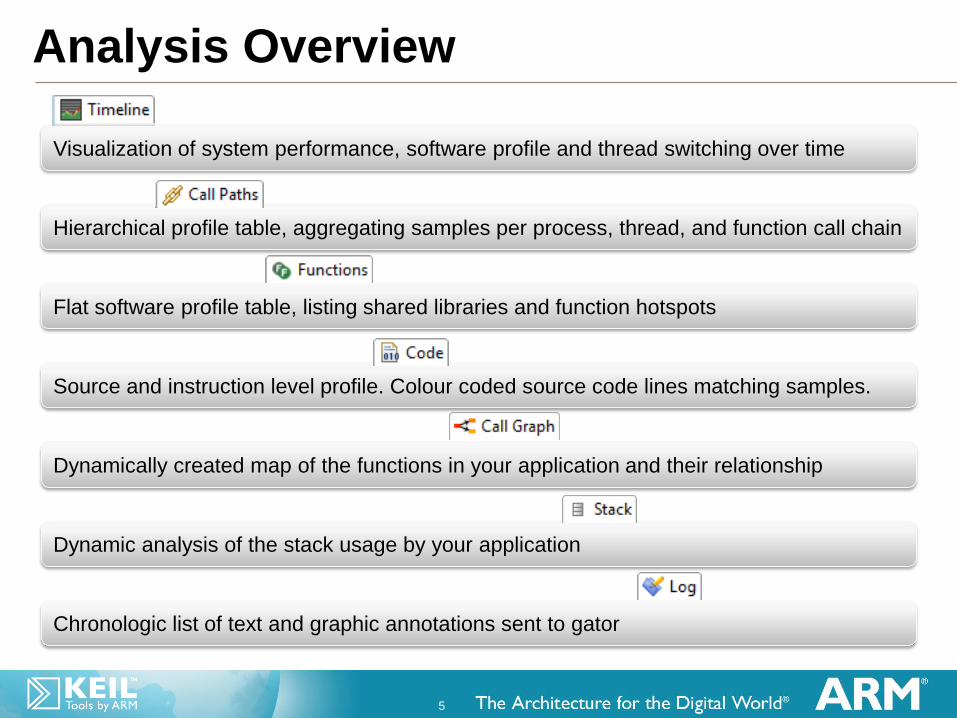
Visualization of system performance, software profile and thread switching over time
Hierarchical profile table, aggregating samples per process, thread, and function call chain
Flat software profile table, listing shared libraries and function hotspots
Source and instruction level profile. Colour coded source code lines matching samples.
Dynamically created map of the functions in your application and their relationship
Dynamic analysis of the stack usage by your application
Analysis Overview
Chronologic list of text and graphic annotations sent to gator
6
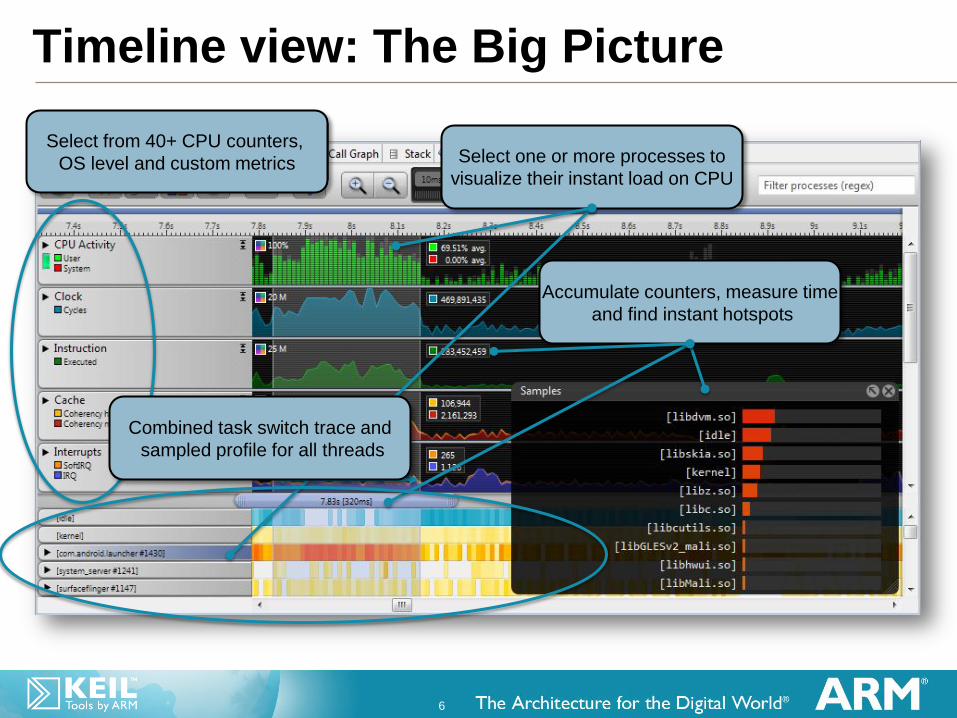
Timeline view: The Big Picture
Select from 40+ CPU counters,
OS level and custom metrics
Accumulate counters, measure time
and find instant hotspots
Select one or more processes to
visualize their instant load on CPU
Combined task switch trace and
sampled profile for all threads
7
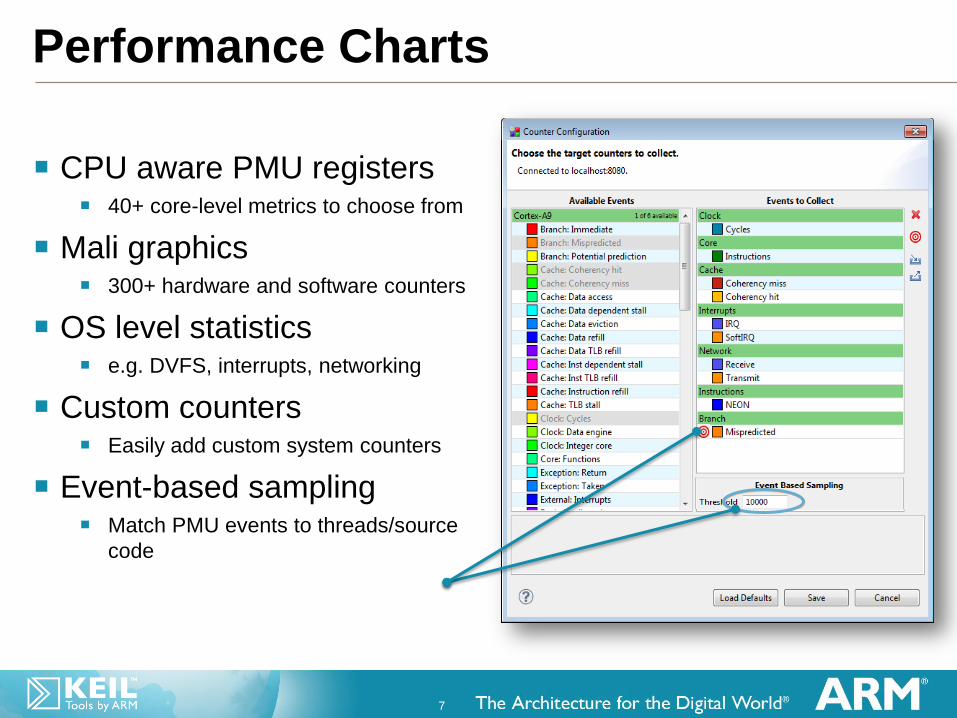
Performance Charts
CPU aware PMU registers 40+ core-level metrics to choose from
Mali graphics 300+ hardware and software counters
OS level statistics e.g. DVFS, interrupts, networking
Custom counters Easily add custom system counters
Event-based sampling Match PMU events to threads/source
code
8
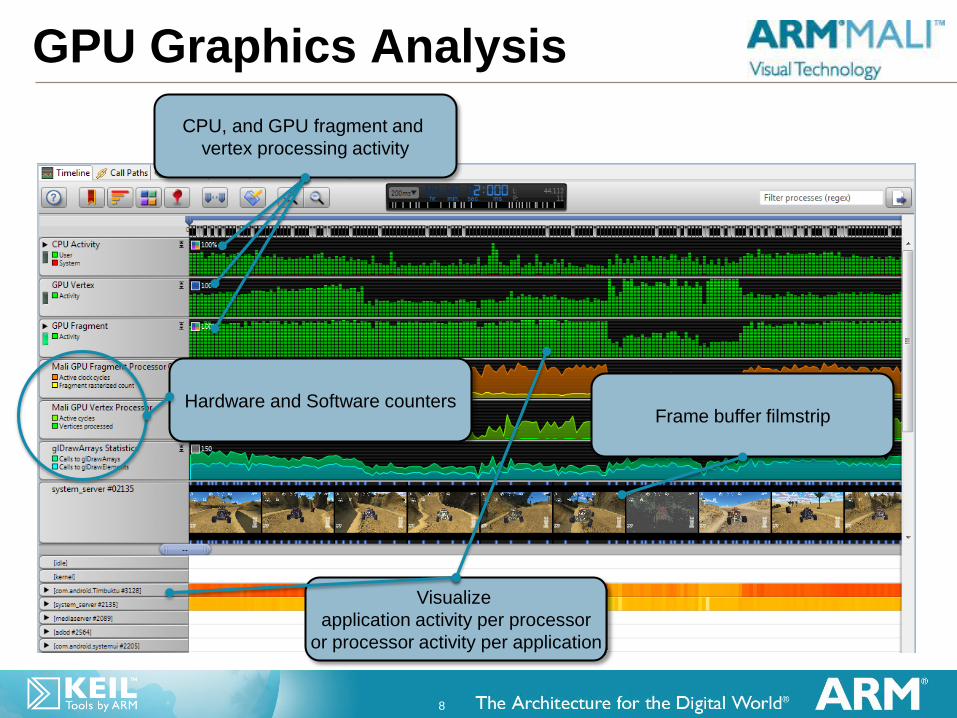
GPU Graphics Analysis
CPU, and GPU fragment and
vertex processing activity
Frame buffer filmstrip Hardware and Software counters
Visualize
application activity per processor
or processor activity per application
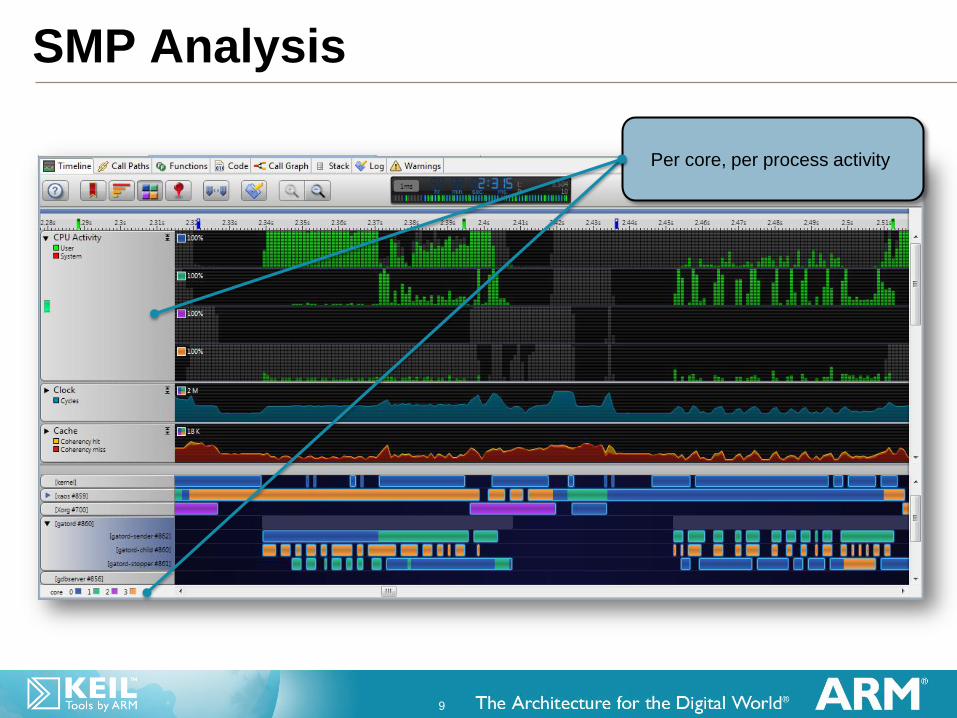
9
Per core, per process activity
SMP Analysis
10
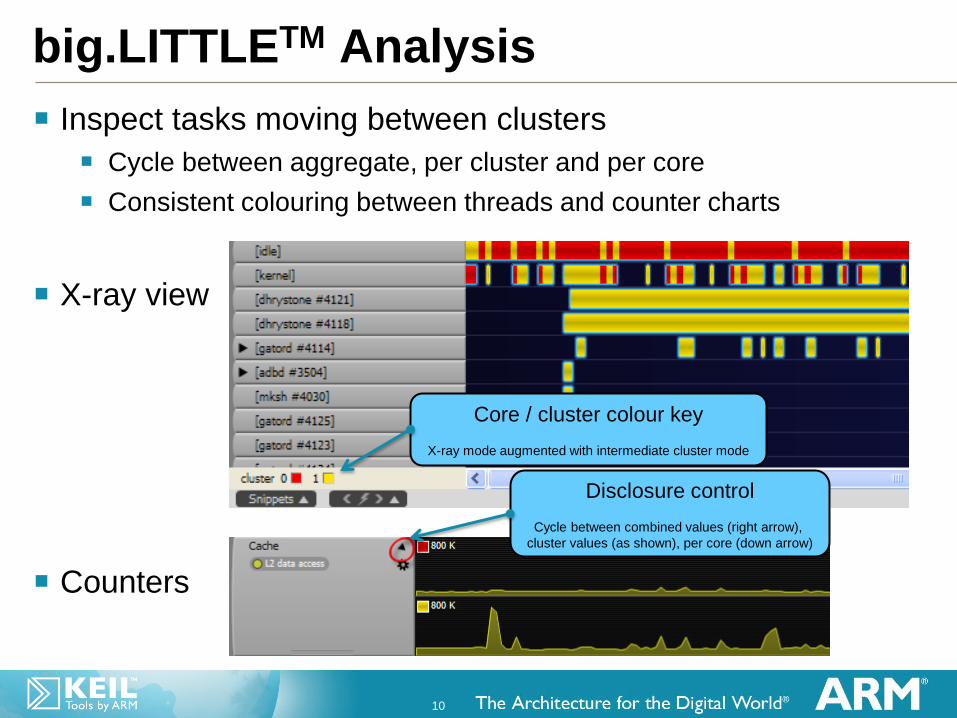
big.LITTLETM Analysis
Inspect tasks moving between clusters
Cycle between aggregate, per cluster and per core
Consistent colouring between threads and counter charts
X-ray view
Counters
Disclosure control
Cycle between combined values (right arrow),
cluster values (as shown), per core (down arrow)
Core / cluster colour key
X-ray mode augmented with intermediate cluster mode
11
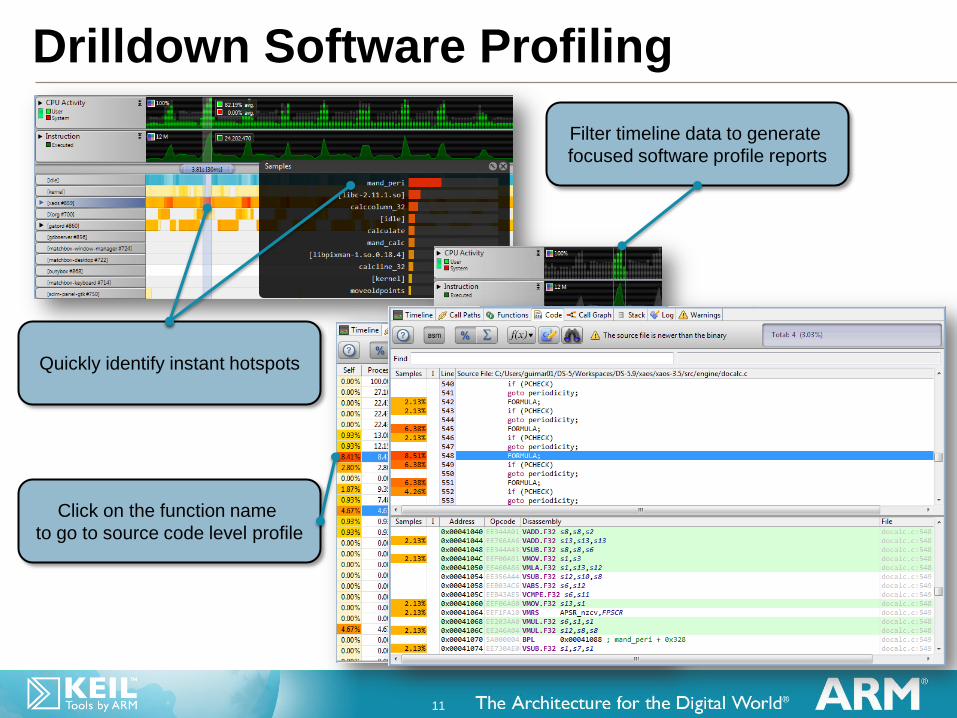
Drilldown Software Profiling
Quickly identify instant hotspots
Filter timeline data to generate
focused software profile reports
Click on the function name
to go to source code level profile
12
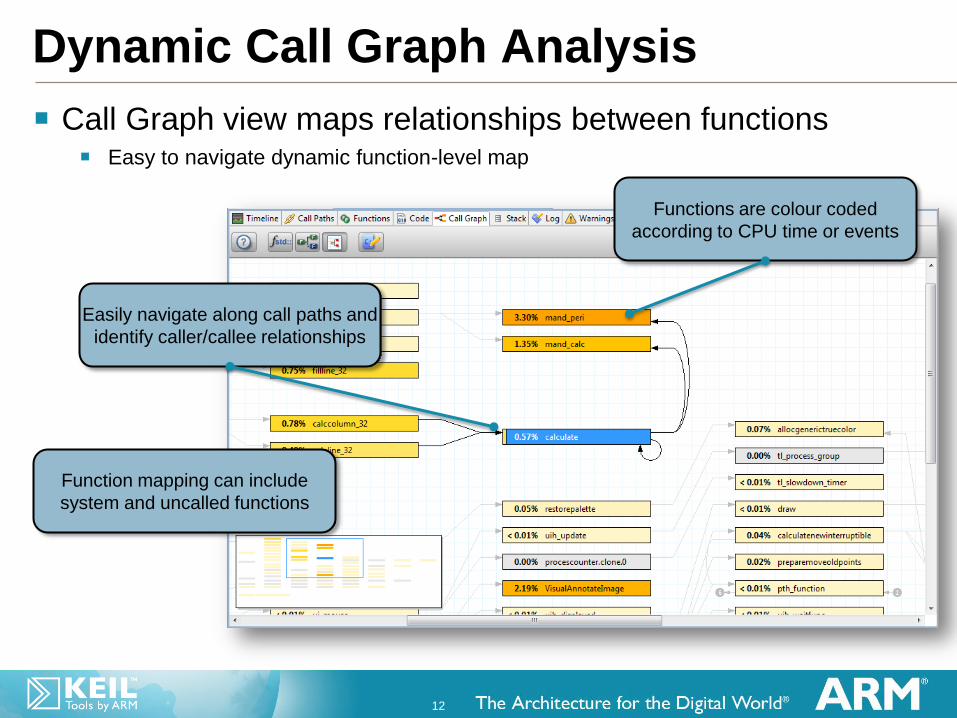
Call Graph view maps relationships between functions Easy to navigate dynamic function-level map
Dynamic Call Graph Analysis
Functions are colour coded
according to CPU time or events
Easily navigate along call paths and
identify caller/callee relationships
Function mapping can include
system and uncalled functions
13
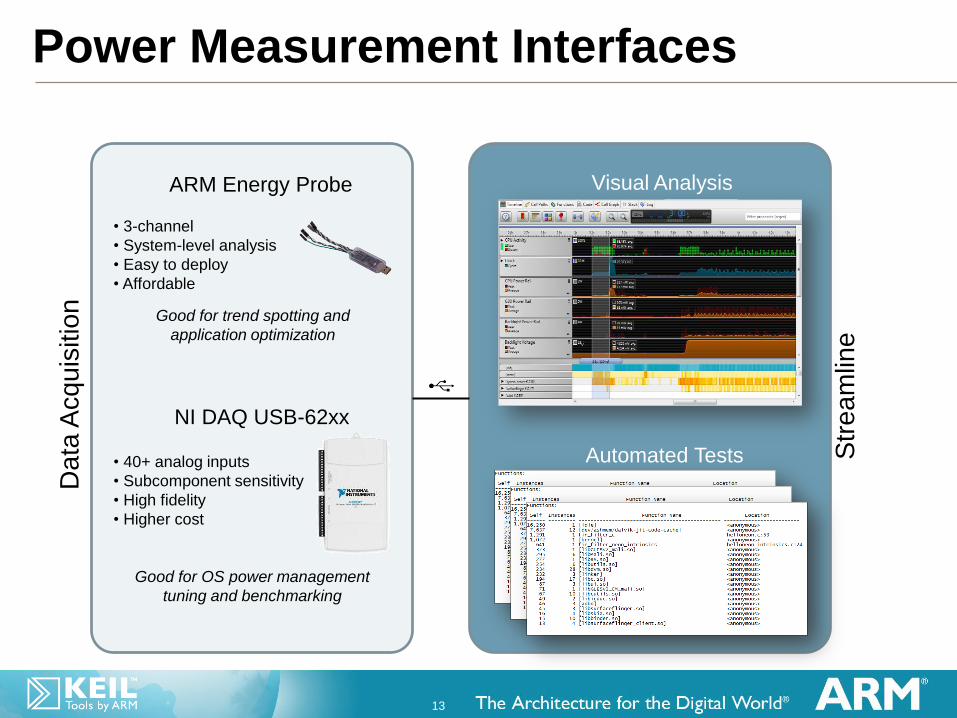
Power Measurement Interfaces
V
Visual Analysis
Automated Tests Str
eam
line
ARM Energy Probe
NI DAQ USB-62xx
• 3-channel
• System-level analysis
• Easy to deploy
• Affordable
Good for trend spotting and
application optimization
• 40+ analog inputs
• Subcomponent sensitivity
• High fidelity
• Higher cost
Good for OS power management
tuning and benchmarking
Da
ta A
cq
uis
itio
n
14
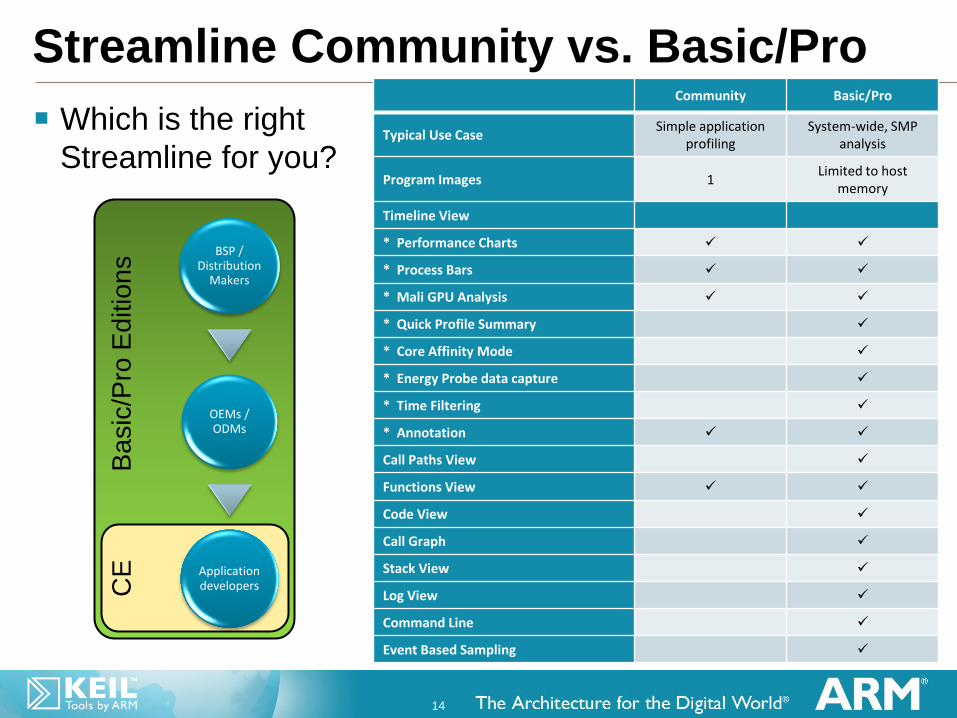
Streamline Community vs. Basic/Pro
Which is the right
Streamline for you?
BSP / Distribution
Makers
OEMs / ODMs
Application developers
Ba
sic
/Pro
Ed
itio
ns
CE
Community Basic/Pro
Typical Use Case Simple application
profiling System-wide, SMP
analysis
Program Images 1 Limited to host
memory
Timeline View
* Performance Charts
* Process Bars
* Mali GPU Analysis
* Quick Profile Summary
* Core Affinity Mode
* Energy Probe data capture
* Time Filtering
* Annotation
Call Paths View
Functions View
Code View
Call Graph
Stack View
Log View
Command Line
Event Based Sampling

15
Agenda
Streamline Overview
Getting start with streamline
Cocos2d-x case study
* Event-based sampling is available on kernels 3.0 or later
16
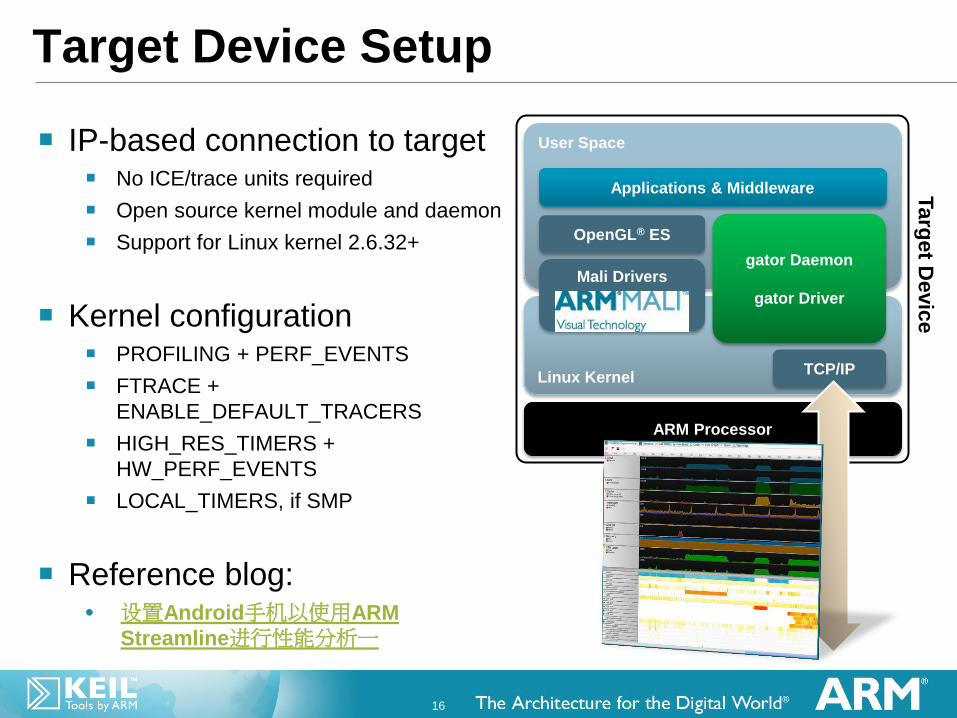
Target Device Setup
IP-based connection to target No ICE/trace units required
Open source kernel module and daemon
Support for Linux kernel 2.6.32+
Kernel configuration PROFILING + PERF_EVENTS
FTRACE +
ENABLE_DEFAULT_TRACERS
HIGH_RES_TIMERS +
HW_PERF_EVENTS
LOCAL_TIMERS, if SMP
Reference blog: • 设置Android手机以使用ARM
Streamline进行性能分析一
User Space
ARM Processor
OpenGL® ES
Applications & Middleware
Linux Kernel
Mali Drivers
gator Daemon
gator Driver
TCP/IP
Targ
et D
evic
e
17
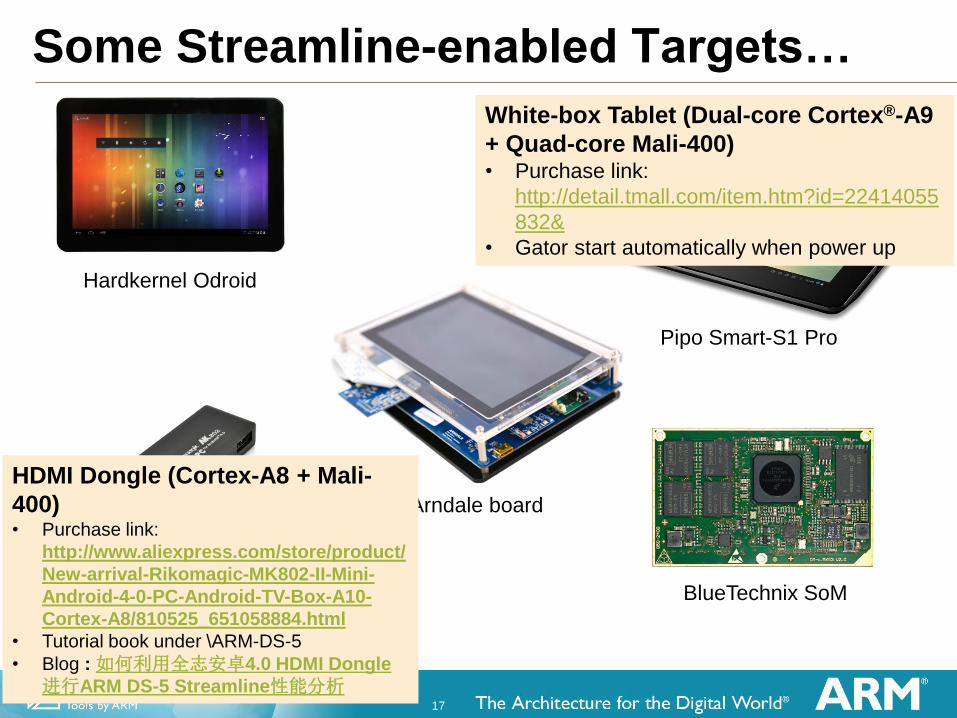
Some Streamline-enabled Targets…
Pipo Smart-S1 Pro
Rikomagic MK802 II
Hardkernel Odroid
BlueTechnix SoM
Arndale board
HDMI Dongle (Cortex-A8 + Mali-
400) • Purchase link:
http://www.aliexpress.com/store/product/
New-arrival-Rikomagic-MK802-II-Mini-
Android-4-0-PC-Android-TV-Box-A10-
Cortex-A8/810525_651058884.html
• Tutorial book under \ARM-DS-5
• Blog : 如何利用全志安卓4.0 HDMI Dongle
进行ARM DS-5 Streamline性能分析
White-box Tablet (Dual-core Cortex® -A9
+ Quad-core Mali-400) • Purchase link:
http://detail.tmall.com/item.htm?id=22414055
832&
• Gator start automatically when power up
18
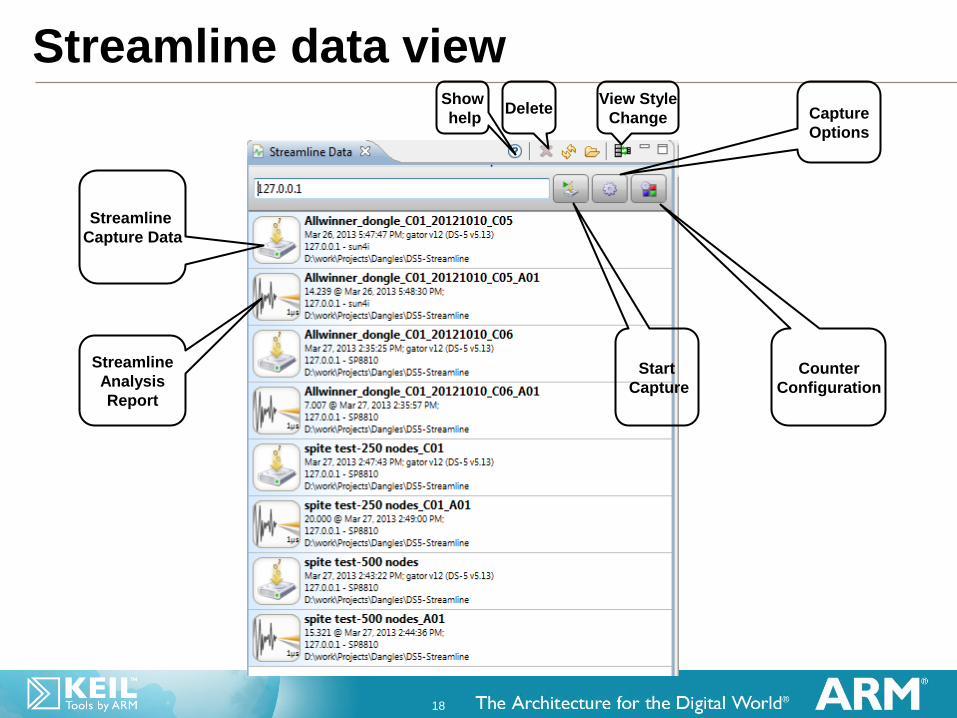
Streamline data view Show
help Delete
View Style
Change
Streamline
Capture Data
Streamline
Analysis
Report
Start
Capture
Counter
Configuration
Capture
Options
19
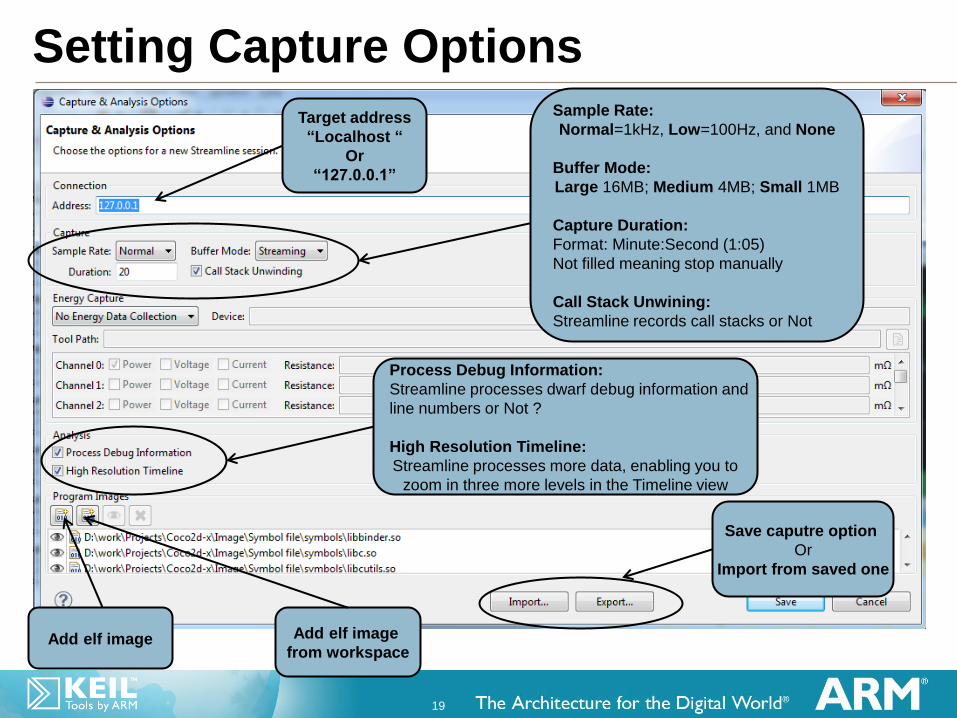
Setting Capture Options
Target address
“Localhost “
Or
“127.0.0.1”
Sample Rate:
Normal=1kHz, Low=100Hz, and None
Buffer Mode:
Large 16MB; Medium 4MB; Small 1MB
Capture Duration:
Format: Minute:Second (1:05)
Not filled meaning stop manually
Call Stack Unwining:
Streamline records call stacks or Not
Process Debug Information:
Streamline processes dwarf debug information and
line numbers or Not ?
High Resolution Timeline:
Streamline processes more data, enabling you to
zoom in three more levels in the Timeline view
Add elf image Add elf image
from workspace
Save caputre option
Or
Import from saved one
20
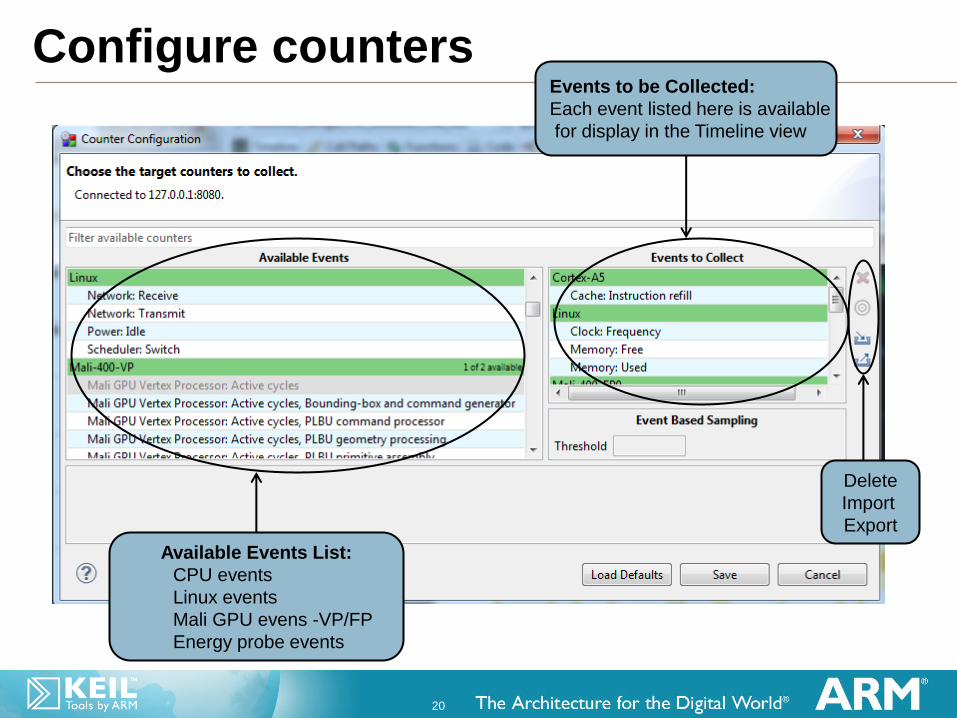
Configure counters
Available Events List:
CPU events
Linux events
Mali GPU evens -VP/FP
Energy probe events
Events to be Collected:
Each event listed here is available
for display in the Timeline view
Delete
Import
Export
21
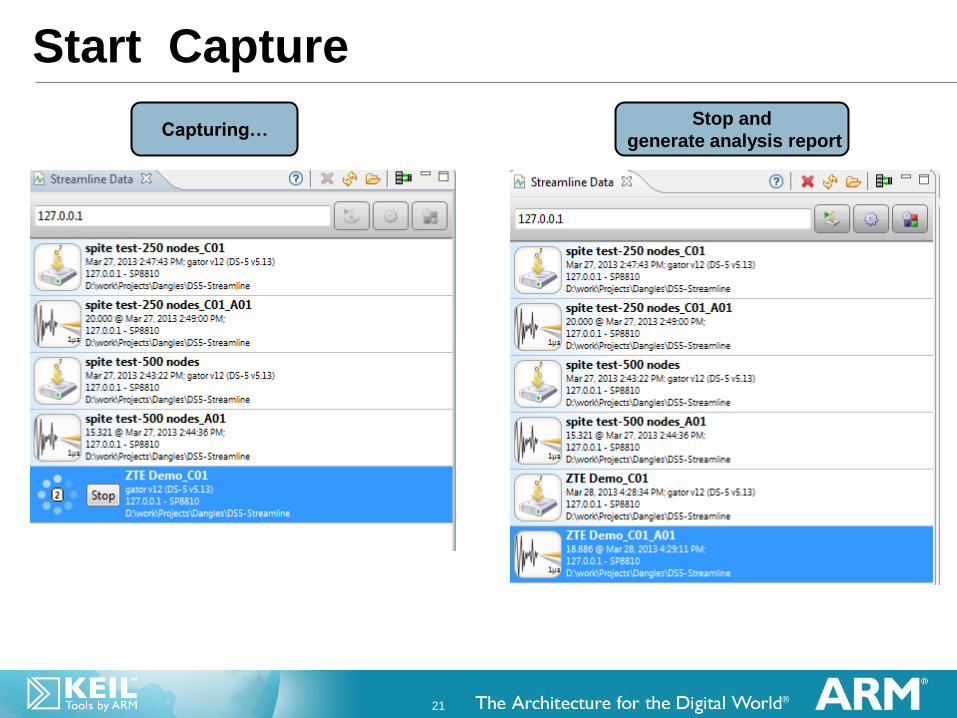
Start Capture
Capturing… Stop and
generate analysis report

22
Agenda
Streamline Overview
Getting start with streamline
Cocos2d-x case study
* Event-based sampling is available on kernels 3.0 or later
23
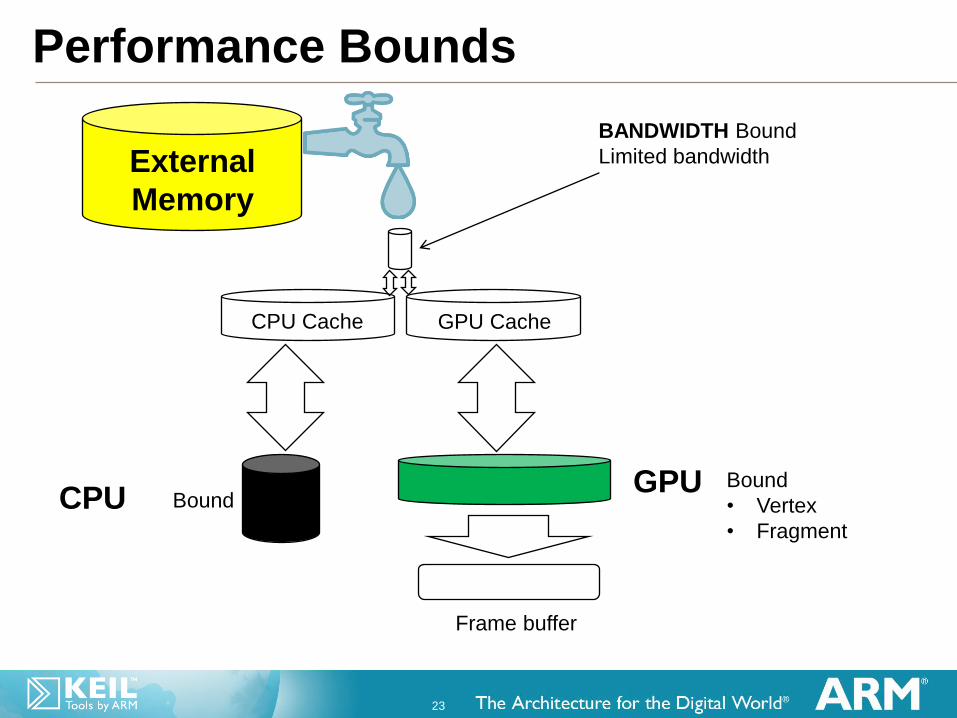
Performance Bounds
CPU GPU
External
Memory
CPU Cache
BANDWIDTH Bound
Limited bandwidth
Frame buffer
GPU Cache
Bound
Bound
• Vertex
• Fragment
24
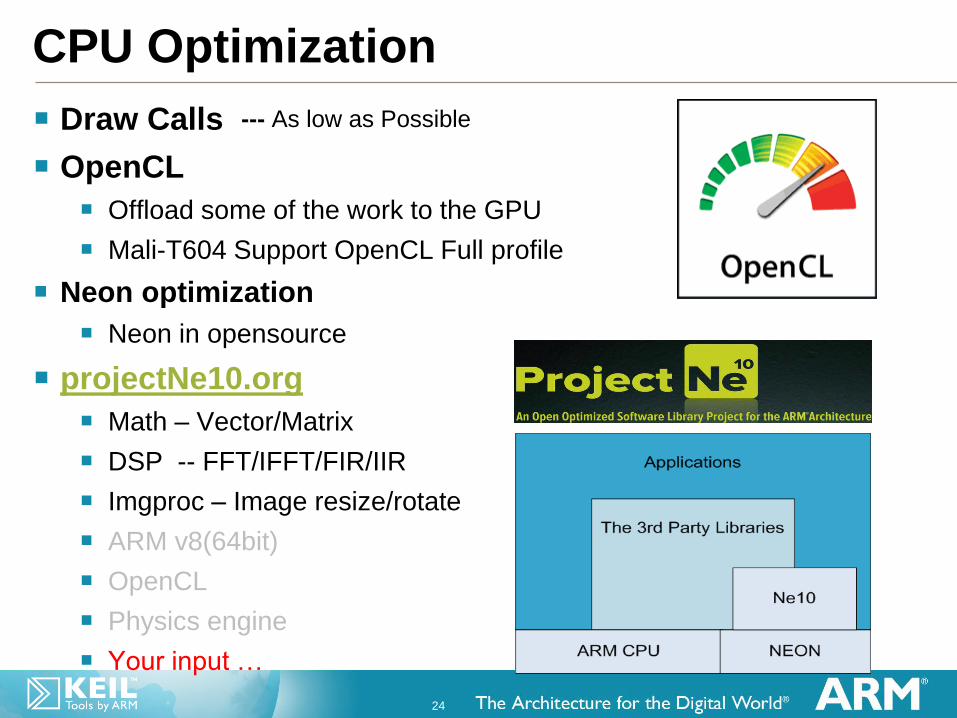
CPU Optimization
Draw Calls --- As low as Possible
OpenCL
Offload some of the work to the GPU
Mali-T604 Support OpenCL Full profile
Neon optimization
Neon in opensource
projectNe10.org
Math – Vector/Matrix
DSP -- FFT/IFFT/FIR/IIR
Imgproc – Image resize/rotate
ARM v8(64bit)
OpenCL
Physics engine
Your input …
25
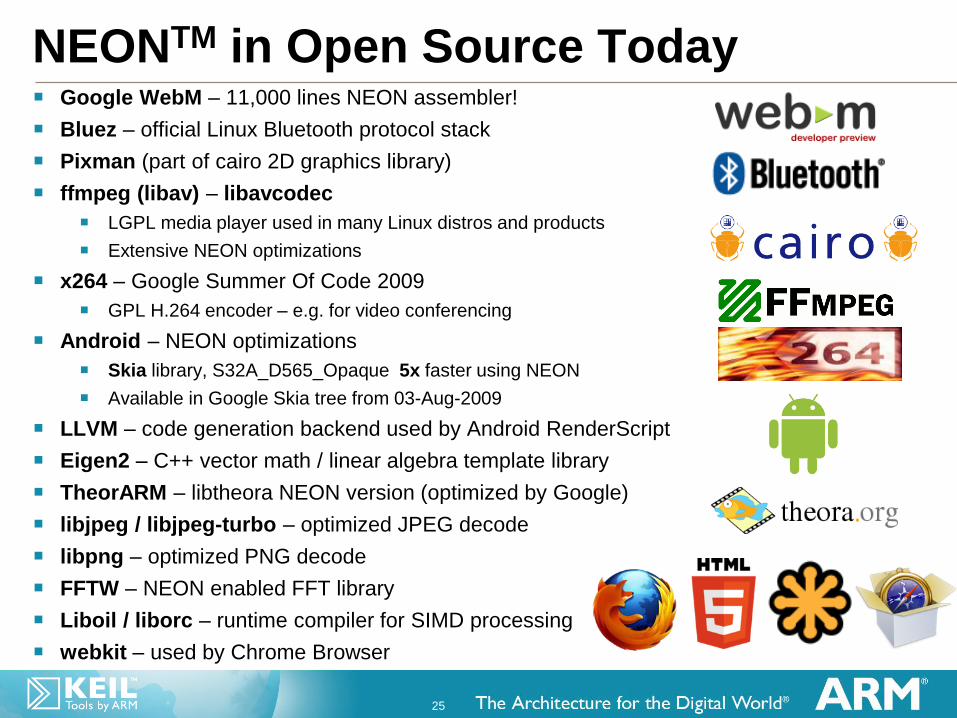
NEONTM in Open Source Today Google WebM – 11,000 lines NEON assembler!
Bluez – official Linux Bluetooth protocol stack
Pixman (part of cairo 2D graphics library)
ffmpeg (libav) – libavcodec
LGPL media player used in many Linux distros and products
Extensive NEON optimizations
x264 – Google Summer Of Code 2009
GPL H.264 encoder – e.g. for video conferencing
Android – NEON optimizations
Skia library, S32A_D565_Opaque 5x faster using NEON
Available in Google Skia tree from 03-Aug-2009
LLVM – code generation backend used by Android RenderScript
Eigen2 – C++ vector math / linear algebra template library
TheorARM – libtheora NEON version (optimized by Google)
libjpeg / libjpeg-turbo – optimized JPEG decode
libpng – optimized PNG decode
FFTW – NEON enabled FFT library
Liboil / liborc – runtime compiler for SIMD processing
webkit – used by Chrome Browser
26
Vertex Optimization
Using VBO (vertex buffer object)
Cache vertex data in GPU memory, no need copy from CPU every frame
Using culling
backface culling
view frustum culling
occlusion culling
Using LOD (Levels of Detail)
Remove unnecessary vertices
It’s Mobile, not PC!
27
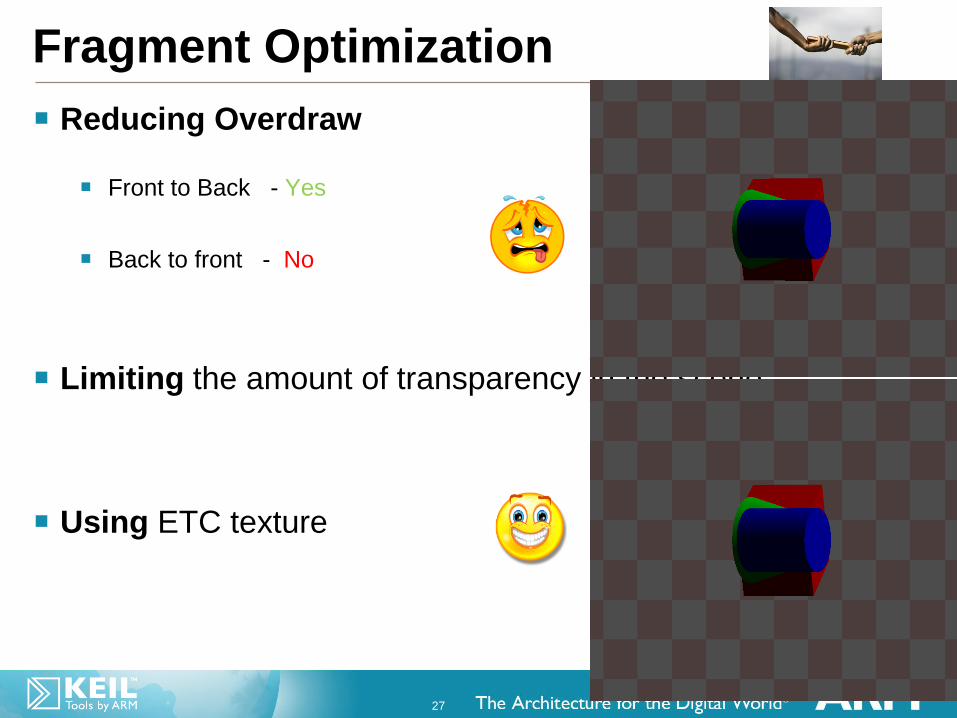
Fragment Optimization
Reducing Overdraw
Front to Back - Yes
Back to front - No
Limiting the amount of transparency in the scene
Using ETC texture
28
Bandwidth Optimization
Bandwidth is a scarce resource
A typical embedded device can handle ≈ 5.0 Gigabytes a second of
bandwidth
A typical desktop GPU can do in excess of 100 Gigabytes a second
Use texture compression
The main popular format is ETC Texture Compression
This can help reduce your 32 bits per pixel texture into
a 4 bits per pixel texture
Mali Texture Compression Tool
use 16 bit textures instead of 32
You won’t often notice the difference
29
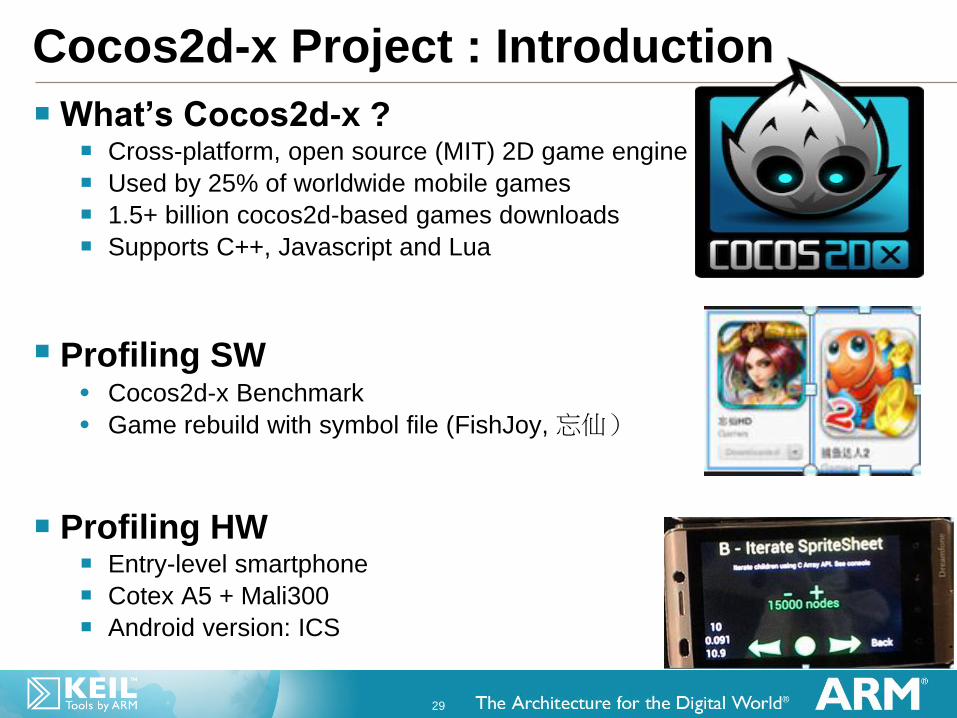
Cocos2d-x Project : Introduction
What’s Cocos2d-x ? Cross-platform, open source (MIT) 2D game engine
Used by 25% of worldwide mobile games
1.5+ billion cocos2d-based games downloads
Supports C++, Javascript and Lua
Profiling SW • Cocos2d-x Benchmark
• Game rebuild with symbol file (FishJoy, 忘仙)
Profiling HW Entry-level smartphone
Cotex A5 + Mali300
Android version: ICS
30
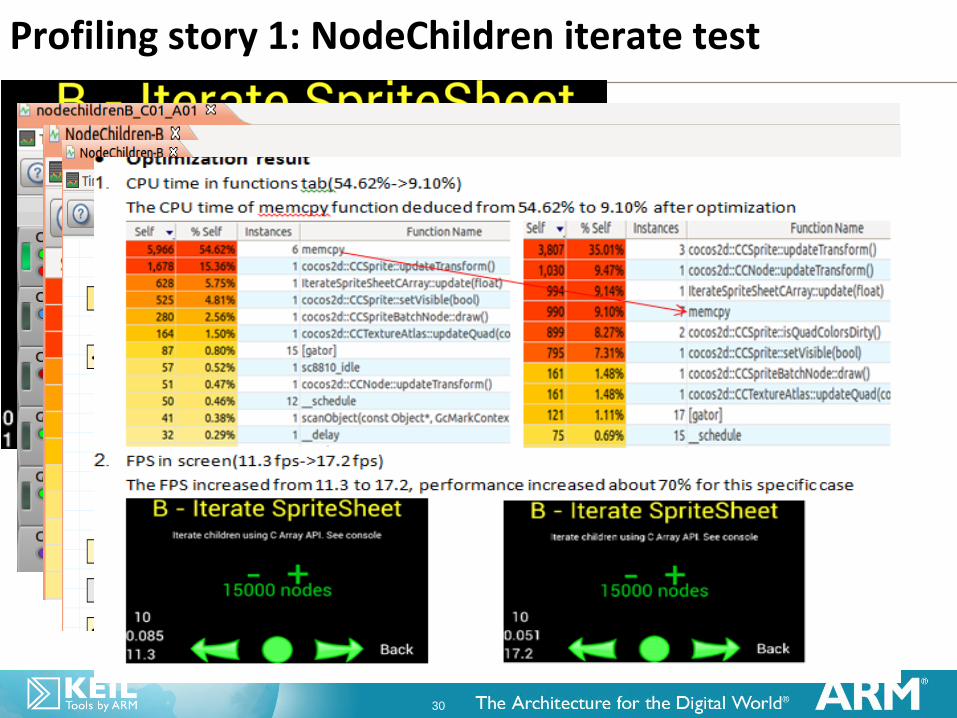
Profiling story 1: NodeChildren iterate test
31
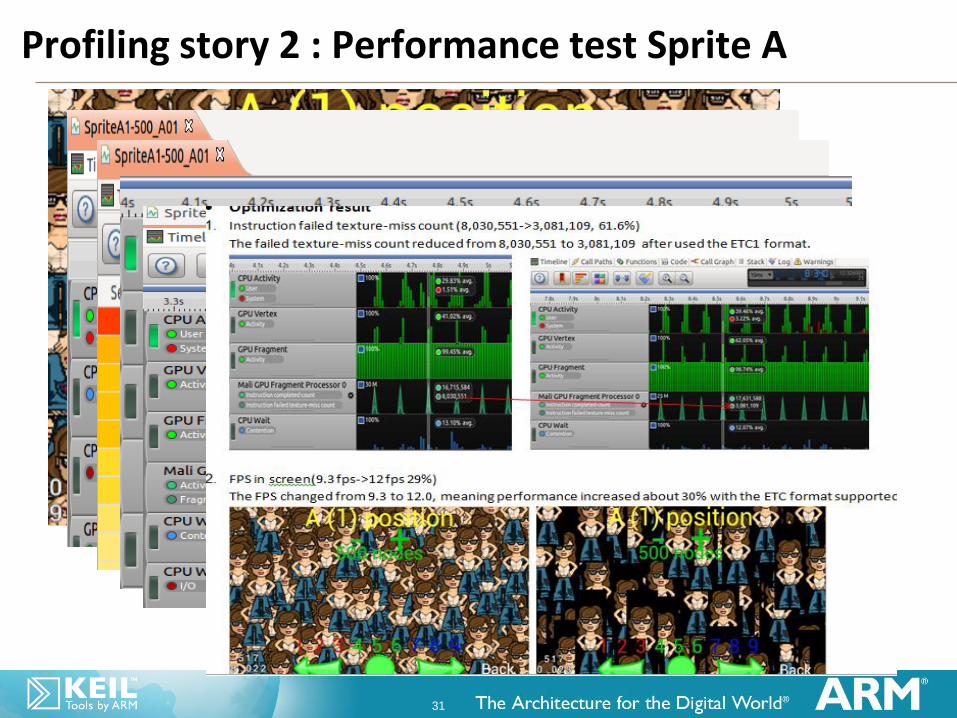
Profiling story 2 : Performance test Sprite A
32
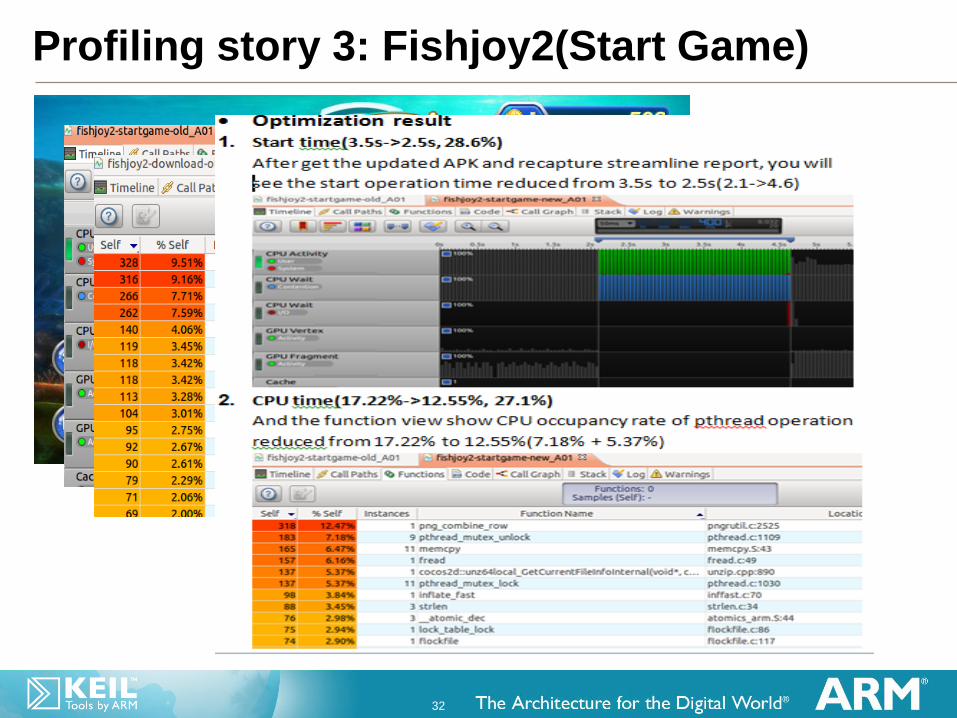
Profiling story 3: Fishjoy2(Start Game)
33
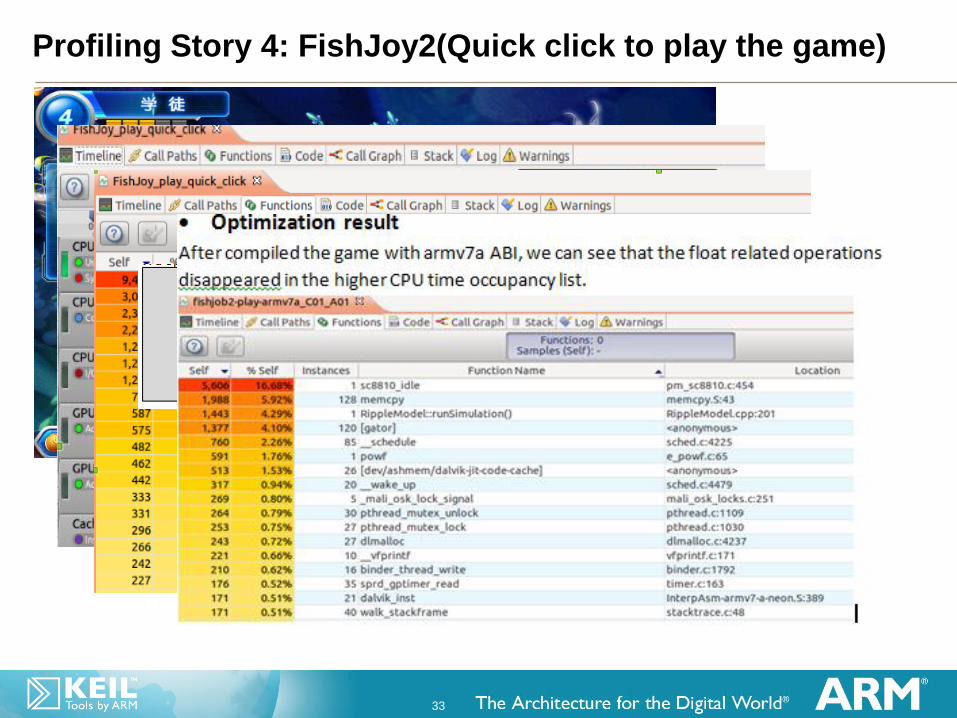
Profiling Story 4: FishJoy2(Quick click to play the game)
34
Reference
Blog post
@cocos2d-x.org http://www.cocos2d-x.org/news/137
Current status
Chinese key mobile internet companies start using Streamline itself now
Alibaba inc.
Tencent inc
Ucweb inc
Cocos2d-x
Sohu Game