Optimizing SPARQL Query Processing On Dynamic and Static Data Based on Query Time/Freshness...
13
JIST 2014 Optimizing SPARQL Query Processing On Dynamic and Static Data Based on Query Time/Freshness Requirements Using Materialization Soheila Dehghanzadeh, Marcel Karnstedt, Stefan Decker, Josiane Xavier Parreira, Juergen Umbrich and Manfred Hauswirth
-
Upload
soheila-dehghanzadeh -
Category
Education
-
view
42 -
download
2
Transcript of Optimizing SPARQL Query Processing On Dynamic and Static Data Based on Query Time/Freshness...
JIST 2014Optimizing SPARQL Query Processing On
Dynamic and Static Data Based on Query
Time/Freshness Requirements Using
MaterializationSoheila Dehghanzadeh, Marcel Karnstedt, Stefan Decker, Josiane Xavier Parreira, Juergen Umbrich and Manfred Hauswirth

Insight Centre for Data Analytics
Outline
•Introduction
•Terminology
•Problem definition
•Proposed solution
•Experimental results
•Conclusion
Slide 2
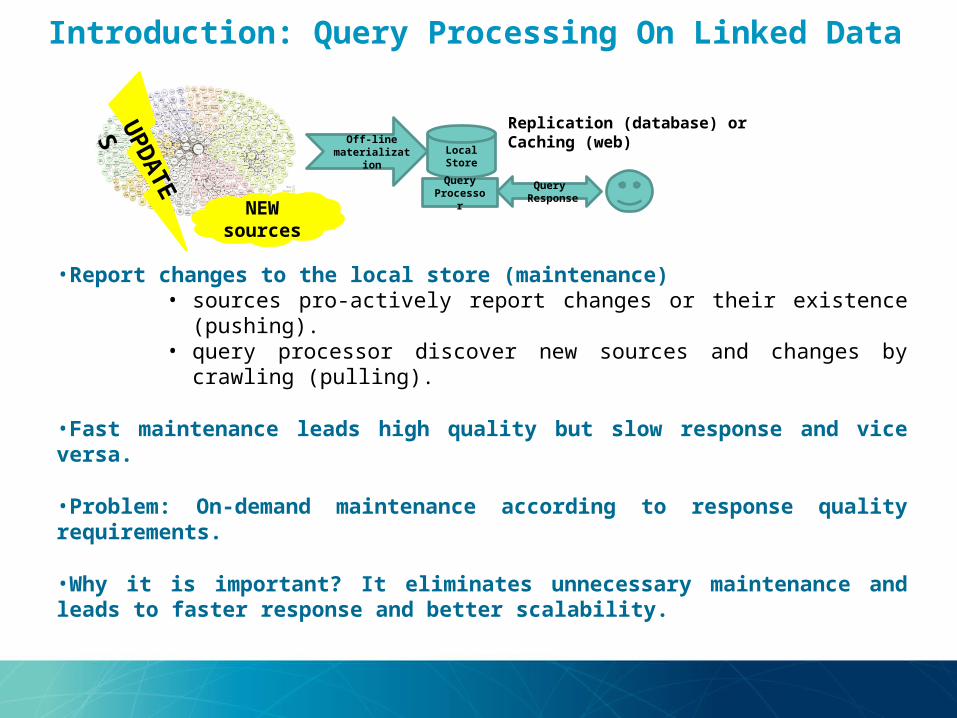
Introduction: Query Processing On Linked Data
•Report changes to the local store (maintenance)• sources pro-actively report changes or their existence (pushing).• query processor discover new sources and changes by crawling
(pulling).
•Fast maintenance leads high quality but slow response and vice versa.
•Problem: On-demand maintenance according to response quality requirements.
•Why it is important? It eliminates unnecessary maintenance and leads to faster response and better scalability.
Replication (database) or Caching (web)Off-line
materialization
Local Store
Query Processo
r
Query Response
UPDATES NEW source
s
Insight Centre for Data Analytics
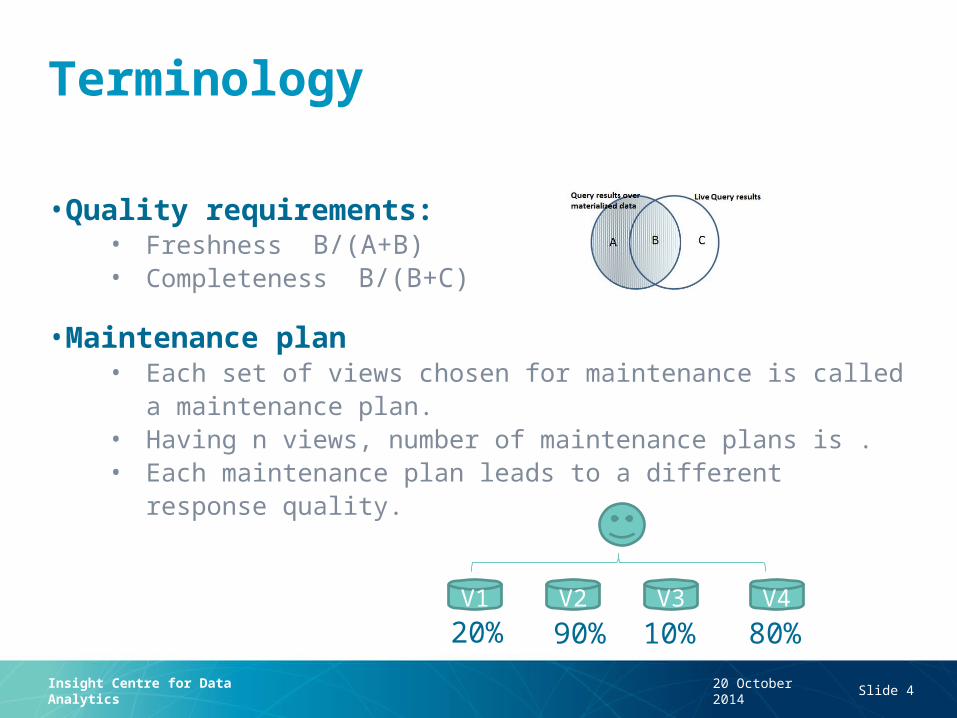
Terminology
•Quality requirements:• Freshness B/(A+B)• Completeness B/(B+C)
•Maintenance plan• Each set of views chosen for maintenance is called a
maintenance plan.• Having n views, number of maintenance plans is .• Each maintenance plan leads to a different response
quality.
20 October 2014 Slide 4
V1 V2 V3 V4
20% 90% 10% 80%

Insight Centre for Data Analytics
Freshness Examplea1 b1 T
a2 b2 T
a3 b3 F
a4 b4 T
a5 b5 F
20 October 2014 Slide 5
a1
c1
F
a1
c2
F
a1
c3
T
a2
c4
T
a6
c5
F
a1 b1
c1 F
a1 b1
c2 F
a1 b1
c3 T
a2 b2
c4 T
60%
40%
50%
a1
b1
T
a2
b2
T
a3
b3
T
a4
b4
T
a5
b5
T
a1 c1 F
a1 c2 F
a1 c3 T
a2 c4 T
a6 c5 F
a1 b1 c1 F
a1 b1 c2 F
a1 b1 c3 T
a2 b2 c4 T100%
40%
50%
a1 b1 T
a2 b2 T
a3 b3 F
a4 b4 T
a5 b5 F
a1
c1
T
a1
c2
T
a1
c3
T
a2
c4
T
a6
c5
T
a1 b1 c1 T
a1 b1 c2 T
a1 b1 c3 T
a2 b2 c4 T60%
100%
100%
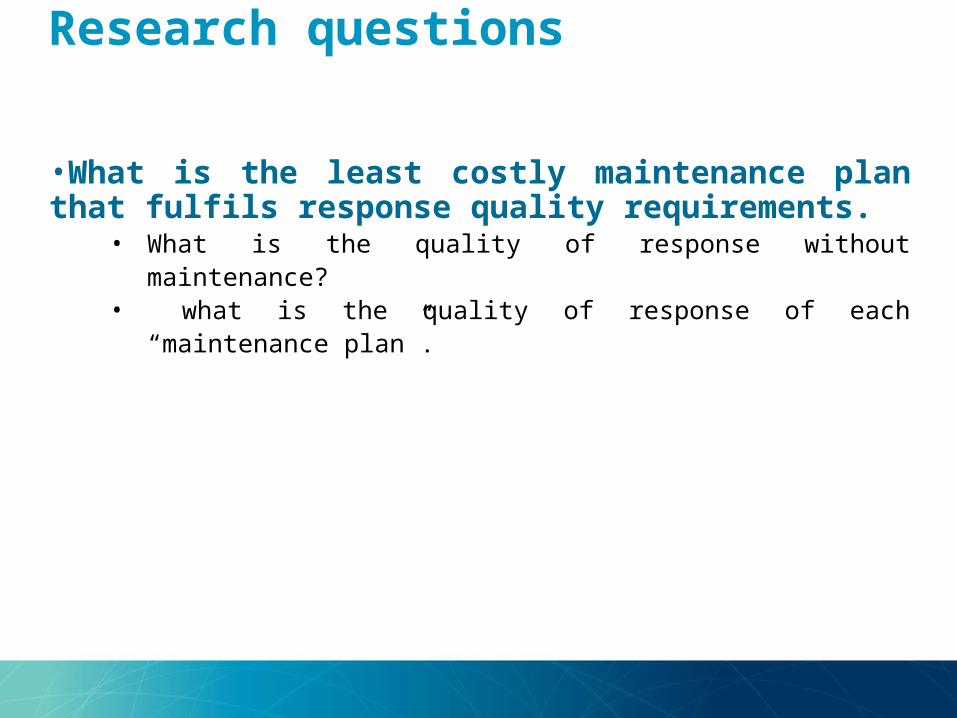
Research questions
•What is the least costly maintenance plan that fulfils response quality requirements.
• What is the quality of response without maintenance?• what is the quality of response of each “maintenance
plan”.

Insight Centre for Data Analytics
Experiment
•We use BSBM benchmark to create a dataset and a query set.
•We label triples with true/false to specify their freshness status.
•We summarize the cache to estimate the quality of a query response without actually executing the query on cache.
•To summarize the cache we extended the cardinality estimation techniques for freshness estimation problem.
Slide 7
Alice
Lives Dublin True
Bob Lives Berlin False
Alice
Job Teacher True
Bob Job Developer
False
Insight Centre for Data Analytics
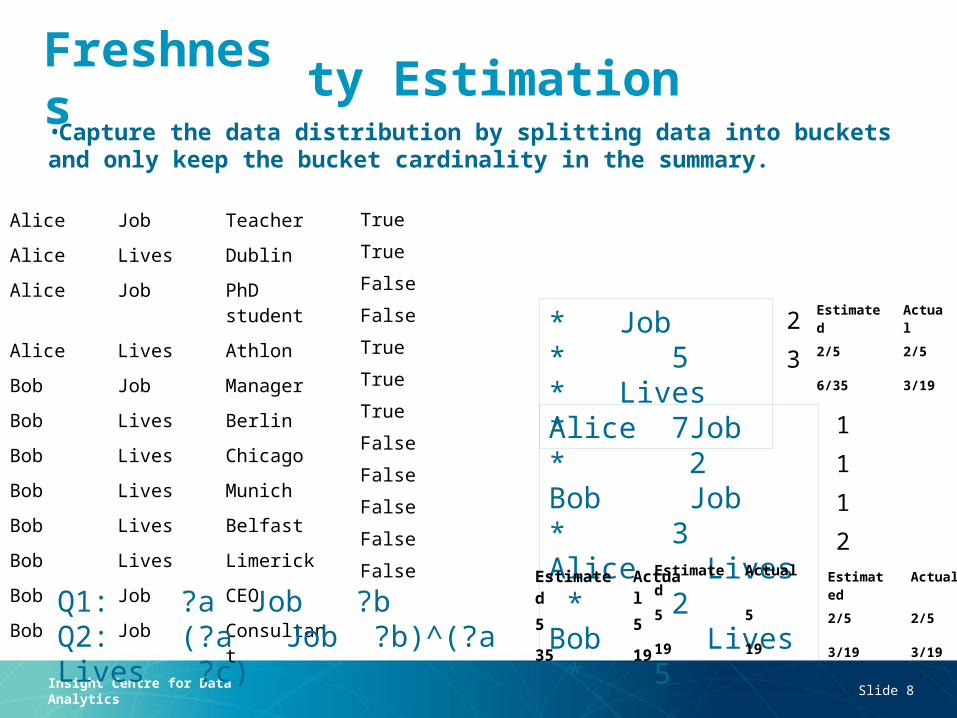
Cardinality Estimation•Capture the data distribution by splitting data into buckets and only keep the bucket cardinality in the summary.
Slide 8
Alice Job Teacher
Alice Lives Dublin
Alice Job PhD student
Alice Lives Athlon
Bob Job Manager
Bob Lives Berlin
Bob Lives Chicago
Bob Lives Munich
Bob Lives Belfast
Bob Lives Limerick
Bob Job CEO
Bob Job Consultant
Alice Job * 2 Bob Job * 3 Alice Lives * 2 Bob Lives * 5
* Job * 5 * Lives * 7
Freshness
True
True
False
False
True
True
True
False
False
False
False
False
2
3
1
1
1
2
Q1: ?a Job ?bQ2: (?a Job ?b)^(?a Lives ?c)
Estimated
Actual
5 5
35 19
Estimated
Actual
5 5
19 19
Estimated
Actual
2/5 2/5
6/35 3/19
Estimated
Actual
2/5 2/5
3/19 3/19
Insight Centre for Data Analytics
Cardinality Estimation Approaches•System R assumptions for cardinality estimation:
• data is uniformly distributed per attribute.• join predicates are independent.
• Indexing approaches make both assumptions.
•Histogram captures the distribution of attributes for more accurate estimation.
•Probabilistic Graphical Models captures dependencies among attributes.
Slide 9

Insight Centre for Data Analytics
Measure accuracy of the estimation approach
Slide 10
n is the number of queries
Measure the difference between the actual and estimated freshness of queries in a query set.

Preliminary results

Insight Centre for Data Analytics
Conclusion
•We proposed a new approach for on-demand view maintenance based on the response quality requirements.
•We defined quality requirements based on freshness and completeness.
•We summarized a synthetic dataset to estimate the freshness of various queries using indexing and histogram for our freshness estimation problem.
•Using probabilistic graphical model to summarize the dataset is the future work and it is promising to reduce the estimation error.
Slide 12

Insight Centre for Data Analytics
Thanks a lot for your attention !
Any question is welcomed!
Slide 13