Optimizing De-NOx Control by Modification of the Control ... · PDF fileOptimizing De-NOx...
14
1 Optimizing De-NOx Control by Modification of the Control Logic and Measurement System without Retrofit Sangjae Lee, KOSEP, [email protected] Geechan Park, KOSEP, [email protected] Jeyoung Shin, KOSEP, [email protected] 1.0 Abstract & Introduction This paper describes Optimizing De-NOx Control by Modification of the Control Logic and Measurement System without Retrofit Young-Heung power plant is one of the largest thermal power plants in Korea and it generates 5,080M W with 6 units. the plant is located close to the capital area and thus subject to strict environmental restriction by the government, the plant was designed to emit very low concentrations of environmental pollutants: SOx 2 5ppm, NOx 15ppm, and Dust 5mg/Sm3. In actual practice, it emits only 22ppm, 12ppm, and 2mg/Sm3 respectively because the municipality of the plant and citizens demand higher standards. The plant adopted the Selective Catalytic Reactor to remove nitrogen oxides. However, ABS (Ammoni um Bisulfate) generated by the chemical combination of ammonia, an absorbent of nitrogen oxide, and SO2 gas, cause clogging to the heat exchanger elements like an air preheater. This led to disruption in fluid flow, aggravating the draft fan load and causing fan stall. It was necessary to solve this problem as effectively and economically as possible. We analyzed and i dentified the De-NOx control system. These included the fluctuation of NOx at the SCR inlet, the devi ation of gas concentration in ducts, the influence of various factors on measurement, response time of the gas analyzer, the location of the measuring point, the condition of the catalyst, etc. We solved all these problems, stage by stage. The existing control concept and measuring system was suitable for general power plants, which have normal environmental restrictions and SCR. Such systems, however, were not suitable for large scale power plants with high efficiency SCR like Young-Heung. We carefully rechecked the catalyst and injection grid. At the same time, we optimized the De-NOx SYS by modifying the control logic and the measuring instruments. Without resorting to a retrofit of the facility, we attained satisfactory results.The ammonia consumption and ammonia slip was significantly reduced. Naturally, this resolved the problems caused by ABS like clogging of the heat exchangers 1.1 Introduction of the company Korea South East Power Co., Ltd is a specialized company for electricity generation which was started in separation from the electricity generation division from Korea Electric Power Corporation in line with the re- organization of the electric power industry of Korean government in April 2nd, 2001.
Transcript of Optimizing De-NOx Control by Modification of the Control ... · PDF fileOptimizing De-NOx...
1
Optimizing De-NOx Control by Modification of the Control Logic and
Measurement System without Retrofit
Sangjae Lee, KOSEP, [email protected]
Geechan Park, KOSEP, [email protected]
Jeyoung Shin, KOSEP, [email protected]
1.0 Abstract & Introduction
This paper describes Optimizing De-NOx Control by Modification of the Control Logic and Measurement
System without Retrofit
Young-Heung power plant is one of the largest thermal power plants in Korea and it generates 5,080M
W with 6 units.
the plant is located close to the capital area and thus subject to strict environmental restriction by the
government, the plant was designed to emit very low concentrations of environmental pollutants: SOx 2
5ppm, NOx 15ppm, and Dust 5mg/Sm3. In actual practice, it emits only 22ppm, 12ppm, and 2mg/Sm3
respectively because the municipality of the plant and citizens demand higher standards.
The plant adopted the Selective Catalytic Reactor to remove nitrogen oxides. However, ABS (Ammoni
um Bisulfate) generated by the chemical combination of ammonia, an absorbent of nitrogen oxide, and
SO2 gas, cause clogging to the heat exchanger elements like an air preheater. This led to disruption in
fluid flow, aggravating the draft fan load and causing fan stall.
It was necessary to solve this problem as effectively and economically as possible. We analyzed and i
dentified the De-NOx control system. These included the fluctuation of NOx at the SCR inlet, the devi
ation of gas concentration in ducts, the influence of various factors on measurement, response time of
the gas analyzer, the location of the measuring point, the condition of the catalyst, etc.
We solved all these problems, stage by stage. The existing control concept and measuring system was suitable
for general power plants, which have normal environmental restrictions and SCR. Such systems, however, were
not suitable for large scale power plants with high efficiency SCR like Young-Heung. We carefully rechecked
the catalyst and injection grid. At the same time, we optimized the De-NOx SYS by modifying the control logic
and the measuring instruments. Without resorting to a retrofit of the facility, we attained satisfactory results.The
ammonia consumption and ammonia slip was significantly reduced. Naturally, this resolved the problems
caused by ABS like clogging of the heat exchangers
1.1 Introduction of the company
Korea South East Power Co., Ltd is a specialized company for electricity generation which was started in
separation from the electricity generation division from Korea Electric Power Corporation in line with the re-
organization of the electric power industry of Korean government in April 2nd, 2001.

2
We have been operating the facilities for 9,976MW, 10.7% of the Korean total capacity for electricity
generation facilities of 92,825MW in 2015 status quo. With regard to the maintained facilities, 4 plants of
Bundang complex power in Sungnam, Gyeonggi-do, Yeong Dong power in Gangneung, Gangwon-do, Yeosu
power in Yeosu, Chunnam and the Korean first 870MW class large capacity coal power in Wongjin, the
economic free zone of Incheon have been operating including the Samchunpo power in Gosung,
Gyeongsangnam-do.
Fig.1 Facilities of KOSEP
We have realized not only the accomplishment of net profits beyond 380 billion Won consecutively for 3 years,
but also the best achievements in terms of the facility utilization ratio, electricity generation cost, operation
profit ratio and labor productivity through the vehicle of intensive management efficiency policy since the
inauguration of the current president, Heo-Yup.
In addition, we have developed coal power plant, biomass, and wind power generation projects by actively
investing on the new growing business and overseas projects for sustainable growth in Malaysia, Indonesia,
Kazakhstan, Sri Lanka, China and Thailand. We have been implementing many projects such as the test
operation service and O&M in India, Bahrain and Vietnam in utilization of the technologies of coal mixing,
combustion, operation, maintenance and repowering.
1.2 Plant Overview
The Yeongheung Thermal Power Site is located on picturesque Yeongheung Island on the western coast of
South Korea, southwest of Seoul. This modern power plant has a generating capacity of 5,080 MW and is the
largest plant in KOSEP’s fleet. The plant provided nearly 25% of the power demand for the greater metropolitan
area of Seoul.
The Yeongheung power plant has been the recipient of a number of environmental awards as the start-of-the-art
environmental controls in place at the site, including the Best Cleanness Coal-Fired Steam Plant in Asia award
in 2006.

3
The majority of power from the Yeongheung plant is generated by six coal-fired steam generators. The
characteristics of these units are summarized in Table 1-1. Units 1 and 2 were the first units and started up in
2004. Units 3 and 4 were added later and started up in 2008. And Units 5, 6 just started up last year and has a
same capacity as Unit 3,4
Unit 1 2 3 4
Maximum Capacity, BMCR (MW) 847 847 921 921
Nominal Operation (MW) 800 800 880 880
A & E Turbine/Generator Doosan / GE Hitachi
Boiler Doosan / Alstom Doosan
Construction Mech./Elec Doosan / Dongoh Hyundai SK
Construction Hyundai Sambu
Commercial Operation 7/2004 11/2004 6/2008 12/2008
Table. 1 Yeongheung thermal Power site fossil assets
1.3 Unit Description
Figure 2. shows an overview of Units 1 and 2. The arrangement for Units 3~6 is similar to the older units. Coal
is supplied to the plant via a unloading system capable of handling bulk freighter ships with a capacity of
150,000 or 200,000 tons and stored in the coal yard, which has a capacity of 600,000 tons.
Coal is fed to each boiler, where the energy in the coal is used to generate high pressure (255 kg/cm2, 3627
psig), high temperature steam (596°C, 1,105°F). The steam is then sent to a tandem compound steam turbine
where the steam is expanded to generate mechanical energy.
Fig.2 Yeongheung Plant Overview

4
The steam turbines at plant feature a four flow, regenerative, reheat and condensing design. The mechanical
energy from the steam turbine is converted to electricity via a generator capable of generating 25,000 volts at a
frequency of 60 Hz. The generators on Units 1 and 2 have a capacity of 978 MVA; Units 3 to 6 have a capacity
of 1,028 MVA.
2.0 Main Contents
2.1 Regulations on environmental pollutants
As interest and concern over the environment are growing along with industrial development, investment in
environmental facilities at plants has increased. Coal-fired power generation emits several environmental
pollutants due to its fuel characteristics, and among them, NOx, SOx, and dust are legally regulated.
The current status of environmental regulations in Korean coal-fired generation plants is as follows:
[Unit: ppm]
Classification
Metropolitan area Non-metropolitan area
Yeongheung
(#1,2)
Yeongheung
(#3,4)
Taean
Dangjin
(#1~8)
Dangjin
(#9,10)
Hadong
(#1~6)
Hadong
(#7,8)
SOx 45 25 100 100 80 100 80
NOx 55 15 150 150 80 150 80
Table. 2 The current status of environmental regulations in Korea
Accordingly, Yeongheung Thermal Power Plant, to which strict environmental regulations are applied, operates
denitrification, desulfurization, and dust collection facilities and requires accuracy in the control system. This
research began with the aim of improving issues in the process of operating SCR (Selective Catalytic Reduction)
denitrification facilities among other environmental facilities.
2.2 Current status of exhaust denitrification facilities at Yeongheung Thermal Power Site
Classification Unit 1 and Unit 2 Unit 3 and Unit 4
SCR Inlet SCR Outlet SCR Inlet SCR Outlet
Standard concentration 190ppm 53.2ppm 150ppm 15ppm
Catalyst efficiency 72% 90%
NH3 Slip concentration 1)
3ppm and under
2ppm and under
(After 24,000 hrs: 3ppm and
under)
SO3 oxidation rate2)
1.0% and under 1.0% and under
Catalyst performance warranty After 24,000 hrs After 24,000 hrs
Table 3 Standard for performance warranty of exhaust denitrification facilities
Note1) NH3 Slip concentration: Concentration where injected ammonia does not react to NOx but is discharged to the catalyst
downstream
Note2) SO3 oxidation rate: Rate of SO2 changing into SO3 in catalyst

5
※ Limitation within the standard as ammonium bisulfate (NH4HSO4), which induces plugging, is caused from
the air pre-heater depending on NH3 slip concentration and SO3 oxidation rate.
☞ Creating ammonium bisulfate: SO3+NH3+H2O → NH4HSO4
Item Unit 1 and Unit 2 Unit 3 Unit 4
Producer BHK BHK Sesin/Frauental
Denitrification efficiency 72.0% and over 90.0% and over
NOx concentration (In/Out) 190/53.2ppm 150/15ppm
NH3/NOx mole fraction 0.736 0.920
Catalyst
Form Plate type Plate type Honeycomb
Filling quantity (2×304.5 ㎥)/Unit (2×438 ㎥)/Unit (2×368.5 ㎥)/Unit
Lifespan 24,000Hr 24,000Hr
Amount of ammonia
consumption 250kg/hr ㆍ Unit 273.8kg/hrㆍUnit
Table 4 Standard for the design of exhaust denitrification facilities
2.3 Ammonia supply system
Fig.3 Ammonia Supply System Overview

6
Ammonia passes from the ammonia storage tank to the carburetor and accumulator and is supplied to the SCR
through the ammonia flow control valve.
Via the PCV installed between the carburetor and accumulator, ammonia pressure remains stable at 1kg/cm2.
Downstream of the ammonia control valve is the NH3/Air mixer, and air, which is supplied via the dilution air
blower, is consistently combined with ammonia and sprayed evenly on the catalyst via the ammonia injection
grid.
Fig.4 Ammonia Supply units
As shown in the figure, exhaust gas is emitted after being divided into two ducts (exposure section) from the
exposure section, and SCR is also divided into two.
Fig.5 Draft System(Furnace to Stack)
The SCR is divided as shown in the figure above and the amount of ammonia supply flow is determined based
on NOx concentration measured by analyzer.
And ammonia is supplied to the SCR via each flow control valve.
(Ammonia flow is calculated by the amount of exhaust gas flow, stack-emitting NOx concentration, and NOx
concentration at the entry of SCR. This part is further described in the explanation on logic.)

7
2.4 Ammonia distribution test
Ammonia distribution test is performed in a trial run test or after catalyst is exchanged and intends to supply
ammonia to SCR catalyst evenly by adjusting the opening part of ammonia injection valve, which is located
downstream of the flow control valve.
The following is a brief summary of ammonia distribution test.
Measuring sections are divided into Inlet and Outlet based on SCR, and NOx is measured at a total of 12 points
by having different depth (a, b, c) in six holes for each duct.
Fig.6 Measuring points
Based on *NOx elimination rate for each measuring point, each ammonia injection valve (18ea/duct) is adjusted
so that NOx elimination efficiency can be equal for each branch.
* NOx elimination rate = (SCR Inlet NOx - SCR Outlet NOx) / SCR Inlet NOx
○ Valve opening adjustment
Fig.6 Valve opening adjustment
8
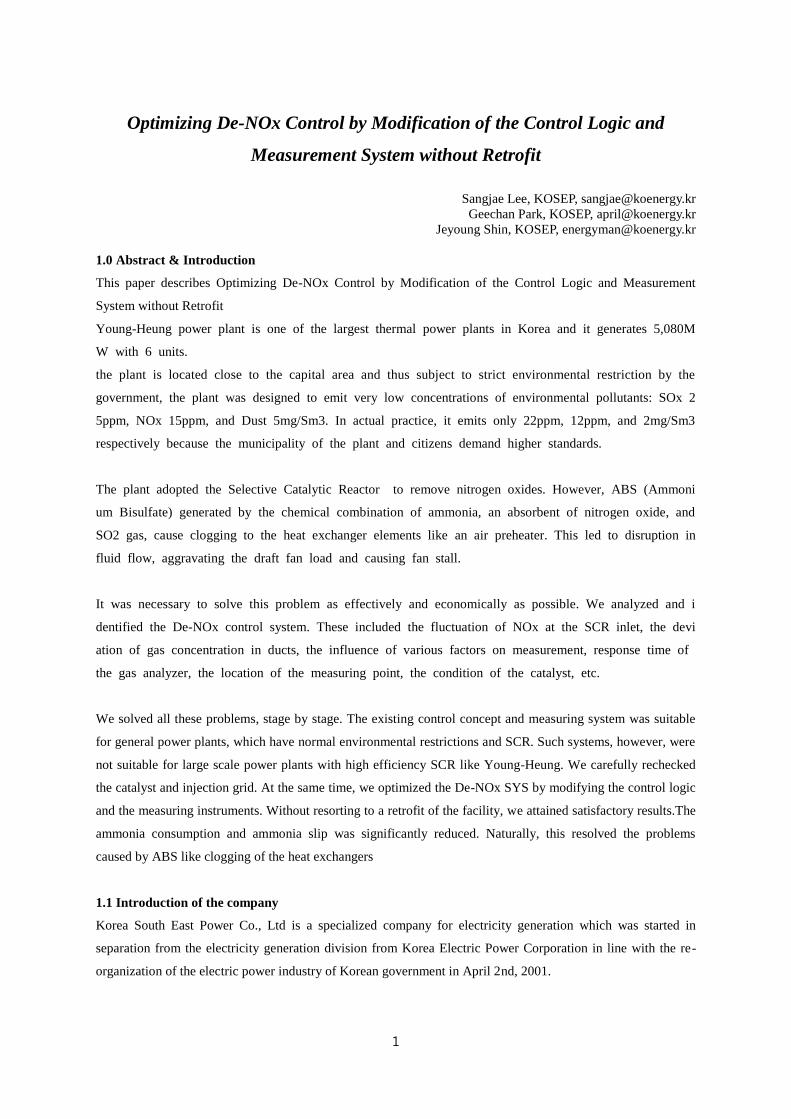
○ Results of ammonia distribution test
SCR-A Outlet NOx (Before correction) SCR-A Outlet NOx (After correction)
SCR Outlet NH3 (Before correction) SCR Outlet NH3 (After correction)
Fig.7 Results of ammonia distribution test
Thus, via ammonia distribution test, catalyst lifespan can be extended as well as reducing ammonia injection
costs. Also, the amount of ammonium sulfate, which has several negative impacts on facilities, can decrease by
reducing the amount of ammonia slip.
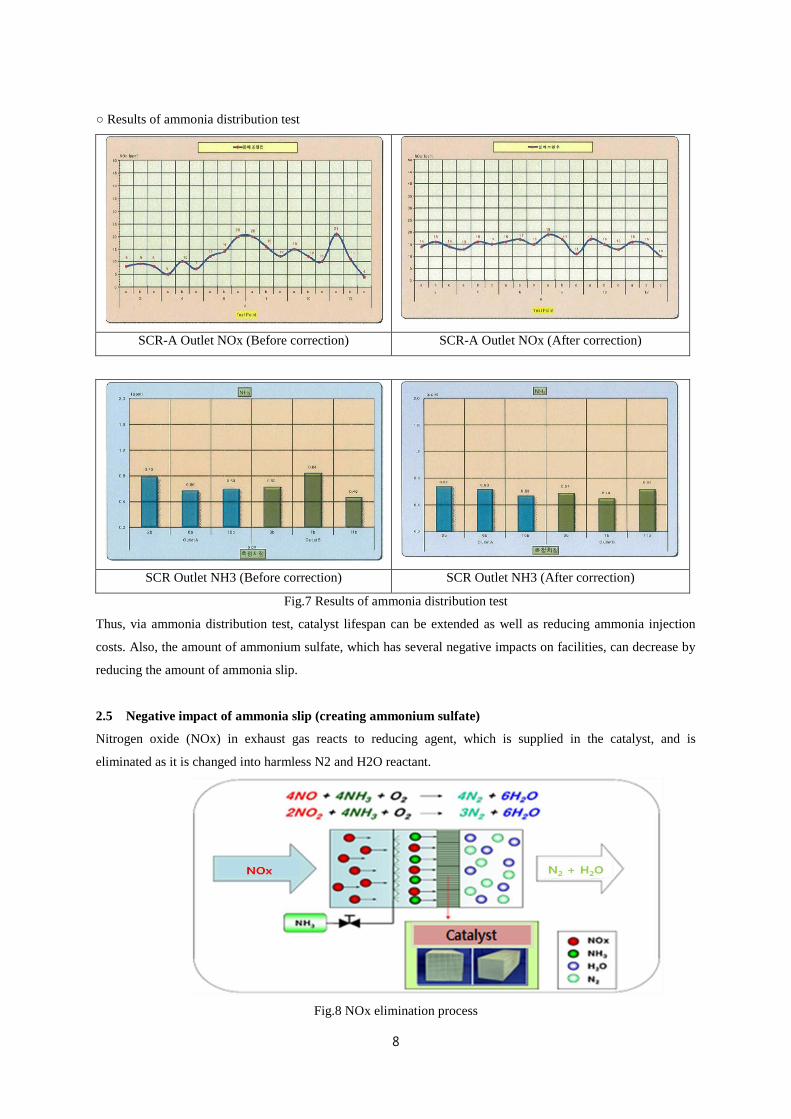
2.5 Negative impact of ammonia slip (creating ammonium sulfate)
Nitrogen oxide (NOx) in exhaust gas reacts to reducing agent, which is supplied in the catalyst, and is
eliminated as it is changed into harmless N2 and H2O reactant.
Fig.8 NOx elimination process

9
Then, ammonia (slip), which does not react yet in catalyst, is combined with sulfur oxides (SO3), which is
created in coal combustion, and creates the following (ammonium sulfate) ammonium bisulfate:
○ NH3 + SO3 + H2O → NH4HSO4 (Ammonium Bisulfate, ABS)
○ 2NH3 + SO3 + H2O → (NH4)2SO4 (Ammonium Sulfate)
As attached to the element of GAH (Gas Air Heater, Regerative), which is located at SCR downstream, this ammonium
sulfate causes blockage and low-temperature corrosion and the blockage reduces ventilation efficiency, which is one of the
causes of fan stall. (* Due to GAH blockage, Yeongheung Thermal Power Site once conducted water washing for GAH On-
Line by decreasing generator output (870MW→400MW))
※ On-Line water washing: Performing GAH water washing by only one chain operation for ventilation system without
stopping the unit
Element in the high-temperature section
Element in the mid-temperature section
Fig.8 Blockaged GAH by ammonia sulfate
As SO3, and NH3 influences create ammonium sulfate, SO3, is determined by the quantity of sulfur in coal and
oxygen for combustion, and quantity of non-reacting NH3 increases or decreases depending on catalyst
efficiency and ammonia injection amount.
Yeongheung Thermal Power Site operates desulfurization facilities to remove SOx and limits the amount of
SOx, which is caused via mixed coal.
(* Mixed coal: As each coal-producing area and mine has different characteristics, problems in combustion are
different. To improve such issue, more than two different types of coal are properly mixed and burned.)
As introduced above, ammonia is evenly supplied to the catalyst layer through ammonia distribution test and
catalyst is changed every six years to reduce non-reacting ammonia and enhance denitrification efficiency.
10
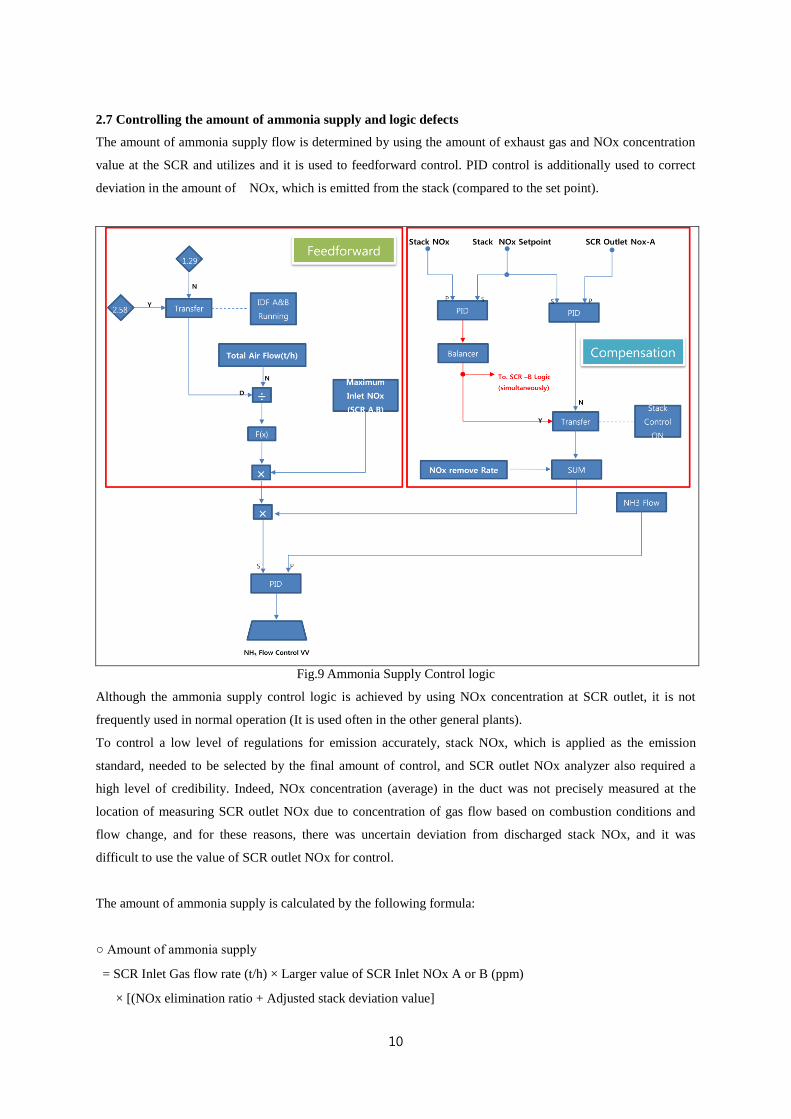
2.7 Controlling the amount of ammonia supply and logic defects
The amount of ammonia supply flow is determined by using the amount of exhaust gas and NOx concentration
value at the SCR and utilizes and it is used to feedforward control. PID control is additionally used to correct
deviation in the amount of NOx, which is emitted from the stack (compared to the set point).
Fig.9 Ammonia Supply Control logic
Although the ammonia supply control logic is achieved by using NOx concentration at SCR outlet, it is not
frequently used in normal operation (It is used often in the other general plants).
To control a low level of regulations for emission accurately, stack NOx, which is applied as the emission
standard, needed to be selected by the final amount of control, and SCR outlet NOx analyzer also required a
high level of credibility. Indeed, NOx concentration (average) in the duct was not precisely measured at the
location of measuring SCR outlet NOx due to concentration of gas flow based on combustion conditions and
flow change, and for these reasons, there was uncertain deviation from discharged stack NOx, and it was
difficult to use the value of SCR outlet NOx for control.
The amount of ammonia supply is calculated by the following formula:
○ Amount of ammonia supply
= SCR Inlet Gas flow rate (t/h) × Larger value of SCR Inlet NOx A or B (ppm)
× [(NOx elimination ratio + Adjusted stack deviation value]
11
※ SCR Inlet Gas flow rate (t/h) = Converted value by total air flow (t/h) [ based on vendor design]
※ NOx elimination ratio
= (Inlet NOx concentration – Nox discharge concentration (Setpoint)) / Inlet NOx concentration
It is difficult to directly measure the flow rate from exhaust gas, so total air flow (primary air + secondary air) is
used after calculation (converted value based on vendor design).
The total amount of NOx is calculated by multiplying the converted exhaust gas weight flow rate to the larger
value of NOx concentration measured at SCR Inlet –A and B.
And also PID control is used to adjust deviation in NOx (compared to the set point), which is emitted from the
stack, and such adjusted deviation value is equally applied to SCR-A and B.
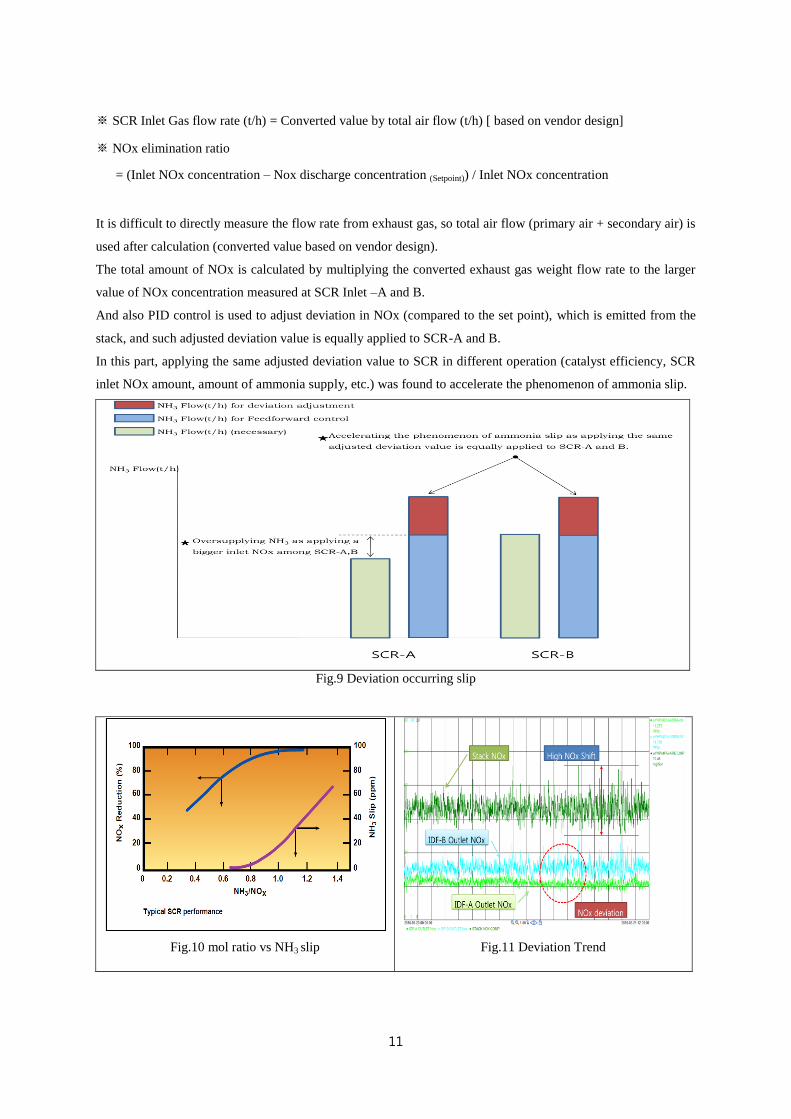
In this part, applying the same adjusted deviation value to SCR in different operation (catalyst efficiency, SCR
inlet NOx amount, amount of ammonia supply, etc.) was found to accelerate the phenomenon of ammonia slip.
Fig.9 Deviation occurring slip
Fig.10 mol ratio vs NH3 slip
Fig.11 Deviation Trend
12
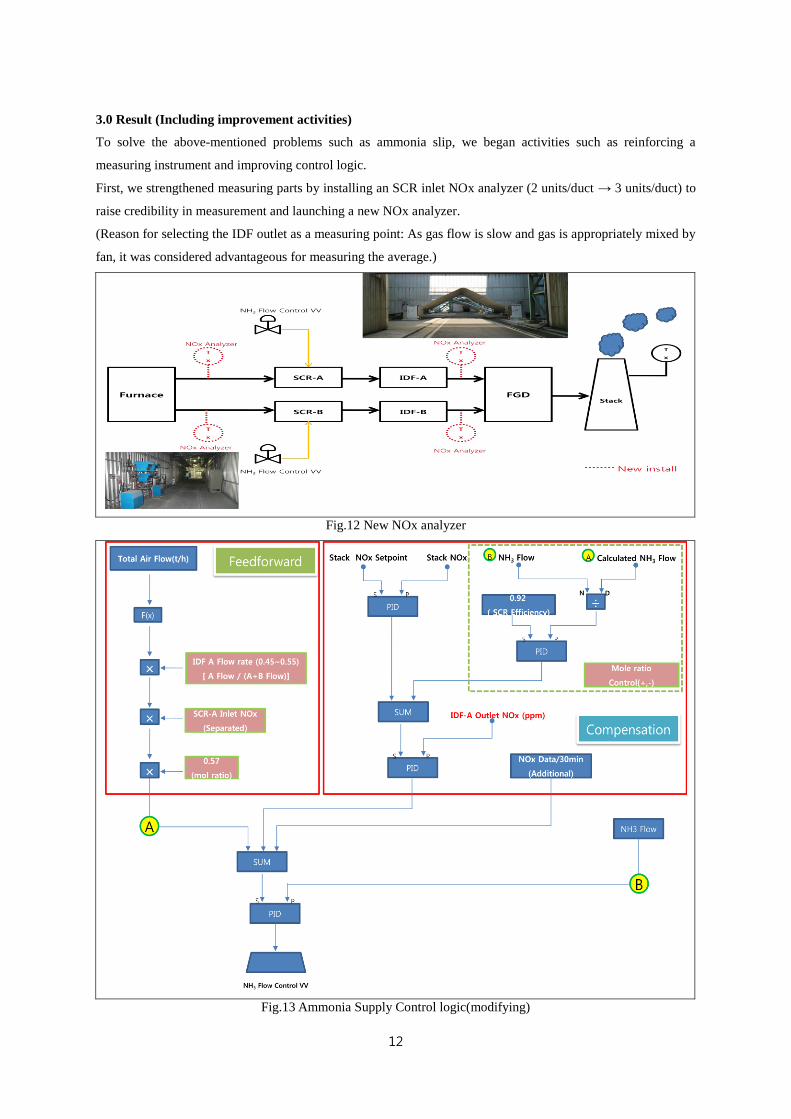
3.0 Result (Including improvement activities)
To solve the above-mentioned problems such as ammonia slip, we began activities such as reinforcing a
measuring instrument and improving control logic.
First, we strengthened measuring parts by installing an SCR inlet NOx analyzer (2 units/duct → 3 units/duct) to
raise credibility in measurement and launching a new NOx analyzer.
(Reason for selecting the IDF outlet as a measuring point: As gas flow is slow and gas is appropriately mixed by
fan, it was considered advantageous for measuring the average.)
Fig.12 New NOx analyzer
Fig.13 Ammonia Supply Control logic(modifying)

13
○ Amount of ammonia supply
= [SCR Inlet Gas flow rate (t/h) × SCR Inlet NOx A (applied for each duct)
× NOx elimination ratio × mole Ratio]
+ Cascade control [(Stack deviation PID +mole ratio) → IDF Out PID] +NOx Data/30min
In the feedforward part, SCR Inlet NOx value, which used to be applied to both ducts equally(as a bigger value),
was individually applied(SCR-A,B Inlet NOx) , and the amount of ammonia supply flow rate was calculated by
applying the concept of mole ratio.
The total NOx amount is calculated by multiplying the flow rate of converted exhaust gas and NOx
concentration measured at SCR inlet.
The mole ratio is calculated as follows:
○ NOx = NO + NO2 (NO accounts for about 95%)
○ SCR chemical reaction (NH3 Injection)
* 4NO + 4NH3 + O2 → 4N2 + 6H2O
* 2NO2+ 4NH3 + O2 → 3N2 + 6H2O
As shown in the chemical formula above, NH3 1 mole reacts to NO 1 mol.
Therefore, the necessary amount of ammonia can be calculated by the amount of NO in exhaust gas. To
eliminate NO 30g (1 mole), NH3 17g (1 mole) is necessary. (About 0.57 times)
[Refer to Periodic Table of Elements]
Further, cascade control was achieved by adding a PID control device, which controls another IDF Outlet NOx,
to the PID control device, which was used as a single tool to adjust stack NOx deviation.
When it comes to merits of control by using the IDF outlet NOx value, ammonia flow control can be carried out
earlier than PID control by using only the existing stack NOx value.
A significant amount of time is delayed until NOx which is left after ammonia supplied to the injection grid
reacts to NOx is detected from the stack.
As the concentration of NOx, which is discharged before being detected from the stack, can be identified in
advanced by utilizing IDF outlet NOx value, it allows advanced ammonia flow control as well as reduction of
any increase in stack NOx
In addition, logic to reduce imbalance in the ammonia supply between ducts was applied by employing mole
ratio control to the stack deviation logic (PID).
When more ammonia is supplied than existing catalyst efficiency, mole ratio decreases ammonia flow rate and
prevents any slip phenomenon. Although stack NOx increases as much as ammonia decreases, ammonia supply
amount rises on the other SCR, which helps to supply ammonia in a balanced manner.
Such functions can reduce ammonia slip and achieve swift control.

14
Fig.14 Trend after modifying Control logic
Finally, with the aim of complying with emission regulations firmly, logic to supply ammonia additionally
based on “Excess NOx Value(average)/remaining sampling time” was added.
* Emission regulations: = Average of NOx concentration which is emitted for 30 minutes
* Remaining sampling time = 30 minutes – Elapsed time (within 30 minutes)
Fig.15 Yeongheung Thermal Power Site TMS (Telemonitoring System)
4.0 Conclusion
We achieved more stable denitrification control by reinforcing a measuring instrument and applying cascade
control and accomplished positive results such as reduction in ammonia slip, delay of GAH blockage, decreased
fan ventilation loss and ammonia cost, etc.
Yeongheung Thermal Power Plant will strive further for environmental conservation and make every effort to
improve environmental facilities.