Optimizing Capacity of Nuclear Power Plants: Thermal ...
9
OPTIMIZING CAPACITY OF NUCLEAR POWER PLANTS – THERMAL PERFORMANCE ASSESSMENT USING A CASE STUDY Komandur Sunder Raj President Power & Energy Systems Services 880 Ridgewood Avenue Oradell, New Jersey 07649 Tel. No. 201-638-4635 Fax No. 201-265-1516 E-mail: [email protected] ABSTRACT The U.S. nuclear power industry has witnessed significant capacity additions through power uprates since 2001. Almost 3800 MWe was added during the period 2001-2011 out of total of about 6000 MWe added since 1977. Capacity additions, however, have not been accompanied by an increase in capacity factors which have essentially leveled off at around 90%. The Capacity Optimization Working Group of the World Nuclear Association has identified several factors affecting capacity. These are: outage execution, equipment reliability, regulatory environment, organizational factors, engineering, safety performance, finances and, supply chain processes. This paper focuses on the engineering factor, specifically thermal performance, which is becoming increasingly important in optimizing capacity. Using a case study, the paper examines some of the key capacity issues that were investigated, the findings and corrective actions that were implemented. INTRODUCTION According to the World Nuclear Association (WNA), the median global energy utilization of the maximum reactor power capability increased significantly from 68% in 1980 to 86% in 2002. Since then, however, this growth has leveled off at around 85% suggesting a need for more effective utilization of capacity. The Capacity Optimization Working Group (COWG) of the WNA was formed to identify means by which nuclear power plants worldwide could attain their optimal capacity. COWG identified several factors affecting capacity as shown in Table 1 [1]. Some of the significant conclusions reached by COWG were: • Technology choice between the predominant reactor designs has no significant impact on capacity factor. • Best-performing plants achieve both higher available capacity and lower unavailable capacity. • The vast majority of loss is within plant management control. • Combined maintenance and refueling outages are the single biggest cause of loss. • The biggest cause of unplanned loss is an extension to a planned outage. • Plant equipment problems and failure contribute to the largest direct cause of unplanned loss. • The turbine and auxiliary system are responsible for the highest proportion of unplanned losses. To achieve global gains, COWG recommended that root cause analysis be applied to unplanned energy losses but this would require adequate data collection and industry-sharing of information. Case studies would be useful for sharing operational experiences and in examining best practices for managing planned energy loss. The North American Electric Reliability (NERC) Corporation maintains the Generating Availability Data System (GADS) power plant performance database for improving the performance of electric generating equipment. Component availabilities are used to calculate system availabilities which in turn determine plant availability. Table 2 shows the GADS annual scheduled and forced outages and derates for various components for the 5-year period 2006-2010 for nuclear units of all sizes [2]. It may be noted from Table 2 that over half of the forced outages and derates related to balance-of-plant and steam turbine-generator issues. 1 Copyright © 2012 by ASME Proceedings of the 2012 20th International Conference on Nuclear Engineering collocated with the ASME 2012 Power Conference ICONE20-POWER2012 July 30 - August 3, 2012, Anaheim, California, USA ICONE20-POWER2012-54348
Transcript of Optimizing Capacity of Nuclear Power Plants: Thermal ...

OPTIMIZING CAPACITY OF NUCLEAR POWER PLANTS – THERMAL PERFORMANCE ASSESSMENT USING A CASE STUDY
Komandur Sunder Raj
President Power & Energy Systems Services
880 Ridgewood Avenue Oradell, New Jersey 07649
Tel. No. 201-638-4635 Fax No. 201-265-1516 E-mail: [email protected]
ABSTRACT
The U.S. nuclear power industry has witnessed significant capacity additions through power uprates since 2001. Almost 3800 MWe was added during the period 2001-2011 out of total of about 6000 MWe added since 1977.
Capacity additions, however, have not been accompanied by an increase in capacity factors which have essentially leveled off at around 90%. The Capacity Optimization Working Group of the World Nuclear Association has identified several factors affecting capacity. These are: outage execution, equipment reliability, regulatory environment, organizational factors, engineering, safety performance, finances and, supply chain processes.
This paper focuses on the engineering factor, specifically thermal performance, which is becoming increasingly important in optimizing capacity. Using a case study, the paper examines some of the key capacity issues that were investigated, the findings and corrective actions that were implemented.
INTRODUCTION
According to the World Nuclear Association (WNA), the median global energy utilization of the maximum reactor power capability increased significantly from 68% in 1980 to 86% in 2002. Since then, however, this growth has leveled off at around 85% suggesting a need for more effective utilization of capacity.
The Capacity Optimization Working Group (COWG) of the WNA was formed to identify means by which nuclear power plants worldwide could attain their optimal capacity. COWG identified several factors affecting capacity as shown in Table 1 [1].
Some of the significant conclusions reached by COWG were:
• Technology choice between the predominant reactor designs has no significant impact on capacity factor.
• Best-performing plants achieve both higher available capacity and lower unavailable capacity.
• The vast majority of loss is within plant management control.
• Combined maintenance and refueling outages are the single biggest cause of loss.
• The biggest cause of unplanned loss is an extension to a planned outage.
• Plant equipment problems and failure contribute to the largest direct cause of unplanned loss.
• The turbine and auxiliary system are responsible for the highest proportion of unplanned losses.
To achieve global gains, COWG recommended that root cause analysis be applied to unplanned energy losses but this would require adequate data collection and industry-sharing of information. Case studies would be useful for sharing operational experiences and in examining best practices for managing planned energy loss.
The North American Electric Reliability (NERC) Corporation maintains the Generating Availability Data System (GADS) power plant performance database for improving the performance of electric generating equipment. Component availabilities are used to calculate system availabilities which in turn determine plant availability.
Table 2 shows the GADS annual scheduled and forced outages and derates for various components for the 5-year period 2006-2010 for nuclear units of all sizes [2].
It may be noted from Table 2 that over half of the forced outages and derates related to balance-of-plant and steam turbine-generator issues.
1 Copyright © 2012 by ASME
Proceedings of the 2012 20th International Conference on Nuclear Engineering collocated with the
ASME 2012 Power Conference ICONE20-POWER2012
July 30 - August 3, 2012, Anaheim, California, USA
ICONE20-POWER2012-54348

TABLE 1 FACTORS AFFECTING CAPACITY – (SOURCE: CAPACITY OPTIMIZATION WORKING GROUP - WNA)
1 . O u ta g e E x e c u tio n 5 . E n g in e e r in g D u ra tio n D e s ig n c h a n g e s F re q u e n c y P o w e r u p ra te s S c o p e D e s ig n u p g ra d e s M a n a g e m e n t D e s ig n c h a n g e p ro c e ss C o s t ( life c y c le m a n a g e m e n t)
2 . E q u ip m e n t R e lia b ility F u e l H u m a n p e rfo rm a n c e D e s ig n L ife c y c le m a n a g e m e n t, a s se t m a n a g e m e n t R e lia b ility P re d ic tiv e m a in te n a n c e F ro n t a n d b a c k e n d ( lim itin g fa c to r) S y s te m re d u n d a n c y E n v iro n m e n t C o m p o n e n t re lia b ility W a te r S y s te m d ia g n o s tic s H e a t s in k C u ltu re o f o p e ra tio n s H u rr ic a n e D ig ita l c o n tro ls E a r th q u a k e
3 . R e g u la to r y E n v ir o n m e n t G rid s ta b ility L ic e n se s L ife e x te n s io n W o rk in g re g u la tio n s A g in g - lo n g e r te rm m a n a g e m e n t M a rk e t c o n d itio n s T h e rm a l p e rfo rm a n c e B a se lo a d v s . lo a d fo llo w in g 6 . S a fe ty P e r fo r m a n c e F u e l c y c le s (1 2 , 1 8 , 2 4 m o n th s) S c ra m ra te G re e n h o u se g a s e m iss io n s R a d ia tio n e x p o su re L ic e n s in g p ro c e ss In d u s tr ia l sa fe ty P u b lic re la tio n s F u e l re lia b ility F u e l c y c le S a fe ty sy s te m a v a ila b ility S u rv e illa n c e e x te n s io n s S a fe ty c u ltu re O u ta g e o p e ra tio n s re q u ire m e n ts 7 . F in a n c e s
4 . O r g a n iz a t io n a l F a c to r s C o st b e n e fit H u m a n re so u rc e a v a ila b ili ty In v e s tm e n t a n a ly s is T ra in in g a n d e d u c a tio n re q u ire m e n ts O p e ra tin g a n d M a in te n a n c e (O & M ) c o s t K n o w le d g e m a n a g e m e n t C a p ita l c o s t G o v e rn a n c e (c e n tra liz e d /d e c e n tra liz e d ) 8 . S u p p ly C h a in P r o c e sse s F in a n c ia l d e c is io n m a k in g - f in a n c ia l s te e r in g m o d e l C o n tra c t m a n a g e m e n t
P a r tn e rsh ip s a n d a llia n c e sP ro c u re m e n t
Over 30% of the balance of plant issues dealt with the feedwater heater and heater drain systems.
In the context of the COWG and NERC findings, using a case study, this paper discusses issues for the feedwater heater and heater drain systems, failure analysis and the corrective actions that were implemented.
NOMENCLATURE
BP Booster Pump BTU British Thermal Unit BWR Boiling Water Reactor CLR Cooler COND Condenser COWG Capacity Optimization Working Group CP Condensate Pump CRD Control Rod Drive DCA Drain Cooler Approach, °F DRN(S) Drain(s) EMER Emergency EPU Extended Power Uprate
°F Fahrenheit (Degrees) FMA Failure Mode Analysis FWH(S) Feedwater Heater(s) 1STG First Stage GADS Generating Availability Data System GPM Gallons Per Minute GSC Gland Steam Condenser HP High-Pressure HR Hour HTR Heater LCV Level Control Valve LP Low-Pressure MOIST Moisture MS Moisture Separator MSR(s) Moisture Separator Reheater(s) MW Megawatts MWe Megawatts, Electrical MWH Megawatt Hour
2 Copyright © 2012 by ASME

MWt Megawatts, Thermal NERC North American Electric Reliability Corp. NSSS Nuclear Steam Supply System P Pressure, psia PSIG lb/sq.in., gauge RFP Reactor Feed Pump RFPT Reactor Feed Pump Turbine RFO Refueling Outage RHTR Reheater 2STG Second Stage SEP Separator SJAE Steam Jet Air Ejector STM Steam STOR Storage
TTD Terminal Temperature Difference, °F TK(S) Tank(s) W Mass Flow Rate, lb/hr WNA World Nuclear Association
CASE STUDY – 800 MW BWR NUCLEAR POWER PLANT
(A) Plant Design The case study is an 800-MW BWR nuclear power plant
that has been in operation since 1975. The plant was originally licensed to operate at a reactor core power of 2436 MWt and was uprated in 1997 to operate at 2536 MWt (NSSS thermal power of 2539 MWt). In 2008, the operating license was renewed for an additional 20 years (expiration date 2034).
TABLE 2 NERC GADS SCHEDULED & FORCED OUTAGES & DERATES FOR NUCLEAR UNITS 2006 – 2010
N o. per U nit-Y r
M W H per U nit-Y r
H rs per U nit-Y r
N o. per U nit-Y r
M W H per U nit-Y r
H rs per U nit-Y r
N o. per U nit-Y r
M W H per U nit-Y r
H rs per U nit-Y r
All 1 .36 177997 187.40 9.31 47542 49.23 27.32 889849 936.73External T otal 0 .03 3843 3.82 0.32 2267 2.45 1.22 16887 16.89Inactive States 1 .36 177997 187.40 9.29 47092 48.74 27.27 889366 936.20N uclear Reactor T otal 0 .52 78625 87.07 2.93 15240 14.69 13.77 689315 734.56
C ore/Fuel 0 .07 9430 10.00 0.92 1894 2.15 7.70 533395 548.02C ontrol Rods And D rives 0.06 6217 6.42 0.16 759 0.80 1.22 8825 9.38R eactor V essel And Internals 0 .02 3471 3.51 0.01 132 0.16 0.12 36353 54.63R eactor Coolant System 0.19 21934 25.53 0.86 4527 4.84 1.93 47950 57.24Steam G enerators A nd Steam System 0.04 3434 4.48 0.58 2836 2.47 1.83 10371 12.83C ore Cooling/Safety Injection 0.04 5049 4.71 0.08 4059 3.20 0.23 17774 14.85E lectrical Safety Systems 0.03 6078 6.63 0.07 299 0.31 0.11 7251 7.69C ontainm ent System 0.03 17778 20.21 0.09 349 0.33 0.14 18856 21.28C hemical And V olum e C ontrol/R eact 0 .01 521 0.69 0.06 57 0.09 0.09 587 0.79N uclear Cooling W ater Systems 0.01 1644 1.42 0.03 170 0.15 0.06 2996 2.71A uxiliary System s 0.01 1554 1.65 0.04 69 0.07 0.21 2541 2.48M iscellaneous (N uclear R eactor) 0 .02 1511 1.83 0.04 86 0.13 0.15 2410 2.68
B alance of P lant T otal 0 .40 41136 42.80 3.97 23339 24.59 7.48 87992 91.35C ondensing System 0.05 3621 3.80 0.57 2504 2.66 1.27 9340 10.15C irculating W ater System s 0.03 3402 3.52 0.80 5837 6.03 1.76 12144 12.24C ondensate System 0.04 2886 2.95 0.50 2373 2.70 0.69 7763 7.98Feedwater System 0.10 11714 11.03 0.75 5731 6.12 1.35 22371 22.86H eater D rain Systems 0.01 908 0.85 0.39 1881 2.06 0.62 3457 3.68E xtraction Steam 0.01 599 0.75 0.07 304 0.31 0.21 2964 3.10E lectrical 0 .12 13808 15.04 0.26 1770 2.08 0.52 20715 22.08A uxiliary System s 0.02 3980 4.66 0.06 382 0.35 0.10 4366 5.01M iscellaneous (B alance O f P lant) 0 .00 213 0.20 0.59 2554 2.28 0.95 4867 4.25
Steam T urbine T otal 0 .24 37376 37.40 0.72 3717 3.98 3.15 46732 47.12H igh P ressure T urbine 0.02 661 1.09 0.06 317 0.42 0.12 2555 2.86Interm ediate P ressure T urbine 0.00 0 0.00 0.00 0 0.00 0.00 0 0.00Low Pressure T urbine 0.03 25748 23.55 0.05 611 0.57 0.09 26416 24.21V alves 0.03 1850 1.94 0.18 492 0.56 1.93 4533 4.83P iping 0.01 41 0.06 0.01 32 0.05 0.02 94 0.15Lube O il 0 .01 1747 1.64 0.03 109 0.10 0.04 1859 1.74C ontrols 0 .09 4366 5.41 0.18 1013 1.18 0.39 5891 7.12M iscellaneous (Steam T urbine) 0 .05 2960 3.72 0.22 1140 1.08 0.55 5381 6.22
G enerator T otal 0 .13 14682 13.85 0.18 1308 1.60 0.43 18847 17.94G enerator 0 .02 2433 2.37 0.03 201 0.19 0.06 4305 3.85E xciter 0 .01 1011 0.92 0.00 1 0.00 0.01 1012 0.92C ooling System 0.03 4770 4.37 0.07 677 0.97 0.12 6098 6.07C ontrols 0 .05 3389 3.33 0.04 213 0.21 0.11 3667 3.60M iscellaneous (G enerator) 0 .03 3077 2.87 0.04 215 0.22 0.13 3763 3.50
Regulatory; Safety; Environm ental 0 .00 0 0.00 1.10 950 1.12 1.11 26937 25.52Personnel E rrors 0 .04 2332 2.46 0.06 267 0.31 0.11 2654 2.82Perform ance 0.00 0 0.00 0.03 449 0.49 0.05 482 0.53
D escription
Scheduled & Forced O utages & D eratesForced O utages Forced D erates
3 Copyright © 2012 by ASME

As shown in Fig. 1, the turbine cycle utilizes one double-flow HP turbine section and two, double-flow LP turbine sections. Two strings (“A” and “B”) of 50% capacity FWHs are utilized, each string consisting of one HP FWH and five LP FWHs and an external drain cooler. All FWHs, excepting for the lowest-pressure FWH, are equipped with condensing and drain cooler sections. The lowest-pressure FWH is a single-zone straight condensing FWH.
The HP FWHs 6A and 6B receive drains from the 1Stg and 2Stg reheater drain tanks which have provisions for subcooling injection flows. LP FWHs 5A and 5B receive drains from the HP FWHs 6A and 6B, respectively. Besides receiving drains from LP FWHs 5A and 5B, LP FWHS 4A and 4B receive drains from the MS drain tanks which have provisions for subcooling injection flows.
It should be noted that FWHs 6A, 6B and 4A, 4B were not designed for the MSR subcooling injection flows.
With the exception of the drains from LP FWHs 1A and 1B which drain directly to the condenser, normal drains cascade successively from the HP FWHs through the LP FWHs and the external drain coolers to the condenser.
(B) History of Feedwater Heaters Table 3 shows the history of the feedwater heaters as of
January 2010. The following may be noted: (1) Prior to 1997 Power Uprate
• All FWHs were original equipment designed for TTDs of 5.0 °F and DCAs of 10.0 °F.
• FWH 6A had about 5% plugged tubes and FWH 6B less than 1%.
• FWH 5A had about 16% plugged tubes and FWH 5B about 9%.
• Due to the higher percentage of plugged tubes in FWHs 6A, 5A and 5B, increased demand was placed on FWH 6B to compensate for the difference.
• FWH 1A had about 8% plugged tubes and FWH 1B about 14%.
• The feedwater flow through each FWH was about 5% lower compared to the design flow of 5,463,176 lb/hr.
FIGURE 1 SCHEMATIC OF TURBINE CYCLE FOR CASE STUDY
4 Copyright © 2012 by ASME

TABLE 3 HISTORY OF FEEDWATER HEATERS FOR CASE STUDY
(2) After 1997 Power Uprate • Without the subcooling injection flows to the MSR
drain tanks, the condensate flow through each LP FWH heater and the feedwater flow through each HP FWH were very close to the design value of 5,463,176 lb/hr.
• With subcooling injection flows to the MSR drain tanks, the condensate and feedwater flows were about 3% higher than the design flow of 5,463,176 lb/hr.
• As of November 1998, FWH 6A had 7% plugged tubes and FWH 6B about 6%.
• FWHs 5A, 5B and FWHs 1A, 1B were replaced in Nov. 1998.
• Since the plant had been operating with subcooling injection flows to the MSRs, the increased burden on FWH 6B resulted in a forced outage in March 2001 to repair tube leaks and plug 60 tubes.
• Following the March 2001 forced outage, FWHs 6A and 6B had about the same number of plugged tubes (9%).
• As of October 2000, FWH 4A had 4% plugged tubes and FWH 4B less than 2%.
• In November 2001, trending of plant data as well as performance modeling and analysis confirmed tube leaks in FWH 4B amounting to about 600 gpm (5% of incoming condensate flow).
• In the following RFO, the tube leaks in FWH 4B were fixed and additional tubes were plugged.
(3) 2004 – 2006 • Up until March 2004, the plant continued to operate
with the subcooling injection flows to the MSR drain tanks.
• As of 2006, FWHs 6A and 6B had about 9% plugged tubes in each. FWH 4A had about 4% plugged tubes and FWH 4B about 5%.
Design Plugged/Limit
1. Prior to 1997 power uprate - 106 plugged tubes (total)2. Nov. 1998 - 164 plugged tubes (total)1. Prior to 1997 power uprate - 8 plugged tubes (total)2. Dec. 1998 - 136 plugged tubes (total)3. March 2001 - 196 plugged tubes (total)1. Prior to 1997 power uprate - 201 plugged tubes (total)2. Heater replaced in Nov. 19981. Prior to 1997 power uprate - 110 plugged tubes (total)2. Heater replaced in Nov. 19981. Prior to 1997 power uprate - 26 plugged tubes (total)2. Oct. 2000 - 55 plugged tubes (total)1. Prior to 1997 power uprate - 3 plugged tubes (total)2. Dec. 1998 - 19 plugged tubes (total)1. Prior to 1997 power uprate - 22 plugged tubes (total)2. Bundle replaced in 1981
1. Prior to 1997 power uprate - 0 plugged tubes (total)2. Bundle replaced in 19813. Nov. 1998 - 9 plugged tubes (total)1. Prior to 1997 power uprate - 51 plugged tubes (total)2. Nov. 1998 - 56 plugged tubes (total)1. Prior to 1997 power uprate - 73 plugged tubes (total)2. Oct. 2000 - 77 plugged tubes (total)1. Prior to 1997 power uprate - 99 plugged tubes (total)2. Heater replaced in Nov. 19981. Prior to 1997 power uprate - 173 plugged tubes (total)2. Heater replaced in Nov. 19981. Prior to 1997 power uprate - 0 plugged tubes (total)2. Nov. 1998 - 10 plugged tubes (total)1. Prior to 1997 power uprate - 0 plugged tubes (total)2. Oct. 2000 - 4 plugged tubes (total)
Original 5,463,176 5.0 10.0
FWH 2A 2470 88/957 Original
Bundle replaced
19815,463,176 5.0 10.0
FWH 3A 2290 22/589
FWH 3B 2290 9/589
5,463,176 5.0 10.0
Bundle replaced
19815,463,176 5.0 10.0
FWH 4B 1270 67/204 Original
FWH 6B
FWH 6A 2260 205/248
2260 206/248
5,463,176 5.0 10.0
Original 5,463,176 5.0 10.0
5,463,176 4.2 8.8
New - Nov. 1998
FWH 4A 1270 55/204 Original
5,463,176 4.2 8.8
FWH 5A 1312 10/218 New -
Nov. 1998FWH
5B 1312 10/218
5,463,176 5.0 10.0
FWH 2B 2470 78/957 Original 5,463,176 5.0 10.0
FWH 1A 1215 0/249 New -
Nov. 1998 5,463,176 5.0 None
FWH 1B 1215 2/249 New -
Nov. 1998 5,463,176 5.0 None
Drn. Clr. A 2206 10/729 Original 5,463,176 None 10.0
Drn. Clr. B 2206 4/729 Original 5,463,176 None 10.0
Heater No.
No. of Tubes Original or New
Design FW
Flow,
Design TTD,
°F
Design DCA,
°FComments
5 Copyright © 2012 by ASME

(C) 2009/2010 Feedwater/Heater Drain Systems Issues
In December 2009, the plant staff noticed that FWH 6A was indicating high level with an unknown actual level.
The following were the observations: • The normal LCV was indicating fully open both
through air signal on the controller and local visual verification of the stem.
• As of January 8, 2010, the indicated level per the controller was 61 to 64% and, the dump valve was approximately 25% open.
Figure 2 shows the change that occurred in the dump valve position and the tail pipe temperature between December 2009 and January 2010. (1) Failure Mode Analysis (FMA)
The plant staff undertook the following actions: • Developed a FMA regarding the issue (see Table 4). • Calculated the expected leakage from one sheared
tube to be approximately 150 to 300 gpm.
(2) Analysis Using Performance Model As noted in the FMA, the FWH 6A issue was analyzed
using a detailed thermal performance model.
The following were the findings and results: • Prior to March 2004, FWHs 6A and 6B had been
operating with the subcooling injection flows from the 1Stg and 2Stg reheater drain tanks operational.
• The normal drain flow handled by FWH 6A at that time was about 1,100,000 lb/hr and, 970,000 lb/hr by FWH 6B, with the dump valves closed for both FWHs. After March 2004, the subcooling injection flows to both the 1Stg and 2Stg reheater drain tanks were isolated.
• Table 5 shows the calculated results for FWH 6A based on plant data that was analyzed from November 13, 2006 to January 24, 2010.
• The calculated normal drain flow for November 13, 2006 was 852,218 lb/hr at a drain temperature of approximately 381.0 °F. The DCA was about 15.0 °F.
• Assuming that the valve plug was linear and that 100% of normal stroke corresponded to a drain flow 1,139,000 lb/hr, the calculated drain flow of 852,218 lb/hr for November 13, 2006 represented 75% of the normal stroke.
6.06.57.07.58.08.59.09.5
10.010.511.011.512.012.513.013.514.014.515.015.516.016.517.017.518.018.519.019.520.0
12/1
5/09
12/1
7/09
12/1
9/09
12/2
1/09
12/2
3/09
12/2
5/09
12/2
7/09
12/2
9/09
12/3
1/09
01/0
2/10
01/0
4/10
01/0
6/10
01/0
8/10
01/1
0/10
01/1
2/10
01/1
4/10
01/1
6/10
01/1
8/10
01/2
0/10
Date
Air
Sign
al (p
si)
90
95
100
105
110
115
120
125
130
135
140
145
150
155
160
165
170
175
180
185
190
Tem
pera
ture
(F)
Dump Valve Average Temperature (F)
Dump Valve Average Air Signal (psig)
Data taken during a downpower
FIGURE 2 FWH 6A DUMP VALVE POSITION
6 Copyright © 2012 by ASME

TABLE 4 FAILURE MODE ANALYSIS FOR FWH 6A ISSUE
Component Possible Cause Supporting Evidence Refuting Evidence Addtl. Information Action/Conclusion StatusFWH 6A Tube leak causes 1. Normal LCV indicating fully open on normal level 1. Preliminary analysis using performance 1. Cascading drains 1. Using performance
increased water supply to controller and local visual indication on valve stem model showed normal LCV can handle in FWH A train model confirm amountFWH that normal LCV 2. Normal level indicator indicating level at 63% with level tube leak of 500 gpm without opening the indicating further of leakcannot keep up with setpoint at 53% dump valve open than B train 2. Pressure test all FWHsup with 3. Dump valve drain pipe temperature increased suspected to have tube
from ~103-107 °F to 180 °F indicating valve open leaks in next RFO and4. Rising trend in the total daily average of plug all leaks
condensate demineralizer flows (increase of approx.500 gpm)
1Stg, 2Stg. Excessive input to FWH 1. Normal LCV indicating fully open on normal level 1. Walkdown of level control for 1Stg., 2Stg.Rhtr. Drn. 6A causes increased controller and local visual indication on valve stem Rhtr. tanks found level control to beTk. A drain flow to FWH that 2. Normal level indicator indicating level at 63% with level satisfactory
normal LCV cannot keep setpoint at 53% 2. Walkdown of level control for 1Stg., 2Stg.up with 3. Dump valve indicating valve open Rhtr. tanks found the A train controlling
4. Dump valve drain pipe temperature increased at the same position as the B trainfrom ~103-107 °F to 180 °F indicating valve open 3. FWH drain line temperature indicated
380 °F. Excessive high temperatureinputs would cause drain temperature to be higher than 380 °F
4. Walkdown of level control for FWH 6Afound no leaks
FWH 6A Valve stuck mid position 1. Normal LCV indicating fully open on normal level 1. Local position indication shows valve 1. Cascading drains 1. See next itemNormal LCV causes restriction in flow controller and local visual indication on valve stem full open in FWH A train
from FWH 6A normal 2. Normal level indicator indicating level at 63% with level 2. Radiography performed on LCV showed indicating furtherdrain which raises level setpoint at 53% that the distance from disc to seat was open than B trainand causes dump valve 3. Dump valve drain pipe temperature increased approx. equal to a full open stroketo open from ~103-107 °F to 180 °F indicating valve open indicating that LCV was indeed fully open
FWH 6A Stem/disk separation 1. Normal LCV indicating fully open on normal level 1. Radiography performed on LCV showed 1. Cascading drains 1. See belowNormal LCV causes restriction in flow controller and local visual indication on valve stem that the distance from disc to seat was in FWH A train
from FWH 6A normal 2. Normal level indicator indicating level at 63% with level approx. equal to a full open stroke indicating furtherdrain which raises level setpoint at 53% indicating that LCV was indeed fully open open than B trainand causes dump valve 3. Dump valve drain pipe temperature increasedto open from ~103-107 °F to 180 °F indicating valve open
FWH 6A Restriction in drain line or 1. Normal LCV indicating fully open on normal level 1. Preliminary analysis using performance 1. Inspect drain line downDrn. Line drain path causes controller and local visual indication on valve stem model showed normal LCV can handle to FWH 5A and back up
restriction in flow from 2. Normal level indicator indicating level at 63% with level tube leak of 500 gpm without opening the flow path to FWH 6AFWH 6A normal drain setpoint at 53% dump valve and into FWH 6A shell towhich raises level and 3. Dump valve drain pipe temperature increased look for flow restrictioncauses the dump valve to from ~103-107 °F to 180 °F indicating valve openopen
FWH 6A Disk has backed of steam 1. Normal LCV indicating fully open on normal level 1. Radiography performed on LCV showed 1. Disassemble and inspectNormal LCV or stem has backed out of controller and local visual indication on valve stem that the distance from disc to seat was LCV including positioner
valve marriage block 2. Normal level indicator indicating level at 63% with level approx. equal to a full open strokecausing the distance that setpoint at 53% indicating that LCV was indeed fully openthe valve can stroke to 3. Dump valve drain pipe temperature increased 2. Preliminary analysis using performancedecrease which causes a from ~103-107 °F to 180 °F indicating valve open model showed normal LCV can handlerestriction in flow from tube leak of 500 gpm without opening theFWH 6A normal drain dump valvewhich raises level andcauses the dump valve toopen
7 Copyright © 2012 by ASME

TABLE 5 PERFORMANCE ANALYSIS OF FWH 6A ISSUE
Date FW Flow In, lb/hr
FW Flow Out, lb/hr
Postulated Tube
Leakage, lb/hr
FW Temp. In, °F
FW Temp. Out, °F
FWH Shell
Press., psia
FWH Sat.
Steam Temp.,
°F
Extraction Steam
Flow, lb/hr
1Stg & 2Stg Rhtr. Drain Flow, lb/hr
Normal Drain Flow, lb/hr
Normal Drain Temp.
°F
Assumed /Calculated
Normal Drain Valve Position, %
DCA, °F
Dump Valve Drain Flow, lb/hr
Assumed Dump Valve
Position, %
Condensate Flow, lb/hr
Measured Gross
Output, MWe
11/13/2006 5,465,802 5,465,802 0 365.93 423.85 339.56 428.86 375,480 476,738 852,218 380.92 75% 14.99 0 0% 11,163,572 888.97312/15/2007 5,463,344 5,463,344 0 365.66 423.71 339.28 428.79 375,992 476,839 852,831 380.74 75% 15.08 0 0% 11,157,917 886.11712/24/2008 5,455,230 5,455,230 0 363.85 423.30 337.79 428.37 388,865 476,338 865,203 383.19 76% 19.34 0 0% 11,141,586 884.9569/23/2009 5,476,275 5,429,420 46,855 364.10 423.23 337.76 428.36 387,941 476,412 911,208 384.97 80% 20.87 0 0% 11,184,058 874.1209/24/2009 5,497,061 5,412,648 84,413 364.13 423.26 338.07 428.45 382,144 476,586 943,143 380.90 83% 16.77 0 0% 11,225,629 872.96212/3/2009 5,497,564 5,404,726 92,838 363.62 422.90 337.78 428.37 382,831 475,662 951,331 380.70 84% 17.08 0 0% 11,226,703 882.48612/14/2009 5,506,036 5,397,237 108,799 363.71 422.85 337.81 428.38 381,459 475,958 966,216 380.70 85% 16.99 0 0% 11,243,451 881.07212/15/2009 5,577,959 5,326,951 251,008 363.70 422.84 337.72 428.35 378,880 475,994 1,105,882 380.70 97% 17.00 0 0% 11,387,309 881.4001/10/2010 5,562,656 5,312,336 250,320 363.22 422.62 336.73 428.07 380,305 474,055 754,258 380.88 66% 17.66 350,422 30% 11,356,452 878.0141/11/2010 5,563,038 5,312,702 250,336 363.24 422.62 336.77 428.09 380,241 474,235 754,348 380.92 66% 17.68 350,464 32% 11,357,554 877.7351/23/2010 5,576,764 5,297,926 278,838 363.10 422.40 336.65 428.05 380,173 474,304 770,654 381.64 68% 18.54 362,661 32% 11,384,860 876.5391/24/2010 5,576,535 5,297,708 278,827 363.11 422.41 336.65 428.05 380,192 474,263 770,632 381.63 68% 18.52 362,650 32% 11,384,400 875.811
• By December 24, 2008, the DCA had increased by about 4.0 °F and the feedwater outlet temperature showed a slight decrease. The extraction steam flow increased slightly and the normal drain flow also increased. The drain temperature increased by about 2.0 °F.
• Based on assumed changes in the normal drain valve position and tube leaks postulated to correspond to increases in condensate demineralizer flow, the normal drain flows increased from about 911,000 lb/hr (80% normal drain valve position) on September 23, 2009 to 966,000 lb/hr (85% normal drain valve position) on December 14, 2009.
• On December 15, 2009, with a postulated tube leak of about 251,000 lb/hr corresponding to an increase in condensate demineralizer flow, the normal drain valve was handling about 1,100,000 lb/hr (97% normal drain capacity).
• After December 15, 2009, the dump valve started to open and it was about 30% open on January 10, 2010. The estimated flow through the dump valve was about 350,000 lb/hr. The flow through the normal drain valve was about 754,000 lb/hr (66% normal drain valve position) although the valve position was indicating fully open.
• By January 24, 2010, the emergency dump valve had opened further to about 32% passing a flow of about 363,000 lb/hr. Corresponding to a lower gross output and increase in condensate demin flow, the tube leak
was estimated to increase to 279,000 lb/hr (558 gpm). The normal drain temperature as well as DCA had also increased.
• As of January 24, 2010, the total calculated leakage flow of about 550 gpm and dump valve flow of about 726 gpm from FWH 6A were consistent with the increase in condensate demineralizer flow of about 550 gpm and a loss of about 5 MWe in gross electrical output.
• Between January 24, 2010 and the plant shutdown in September 2010, the drain temperature from FWH 6A had increased further to 383.0 °F and the dump valve position had also increased indicating additional tube leakage.
• As of August 2010, the total loss in output due to the leaking tubes and the dump valve flow from FWH 6A was calculated to be about 7 MWe.
(3) Recommendations
The following recommendations were made: • Investigate the causes for the flow restriction to the
normal drainage capability from FWH 6A. • Inspect FWH 6A during the September 2010 RFO and
plug the leaking tubes. • Replace FWHs 6A and 6B at a convenient outage with
the new heaters that had been already procured during an earlier cycle.
8 Copyright © 2012 by ASME
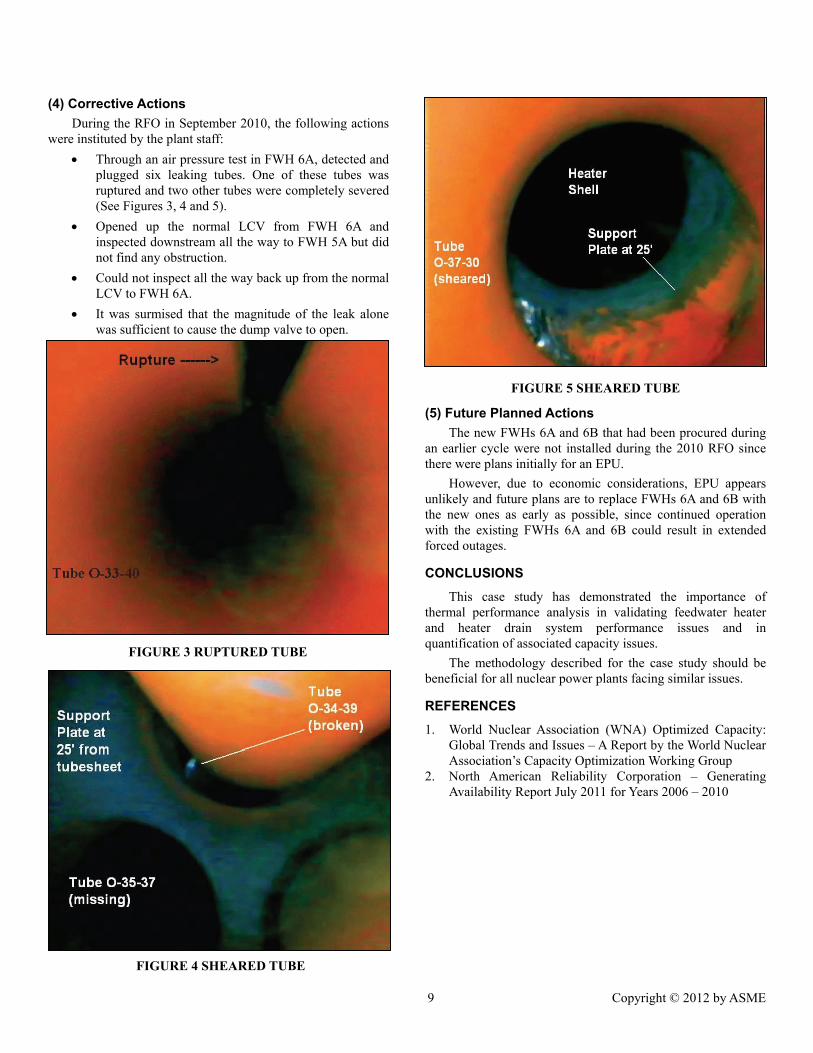
(4) Corrective Actions During the RFO in September 2010, the following actions
were instituted by the plant staff: • Through an air pressure test in FWH 6A, detected and
plugged six leaking tubes. One of these tubes was ruptured and two other tubes were completely severed (See Figures 3, 4 and 5).
• Opened up the normal LCV from FWH 6A and inspected downstream all the way to FWH 5A but did not find any obstruction.
• Could not inspect all the way back up from the normal LCV to FWH 6A.
• It was surmised that the magnitude of the leak alone was sufficient to cause the dump valve to open.
FIGURE 5 SHEARED TUBE
(5) Future Planned Actions The new FWHs 6A and 6B that had been procured during
an earlier cycle were not installed during the 2010 RFO since there were plans initially for an EPU.
However, due to economic considerations, EPU appears unlikely and future plans are to replace FWHs 6A and 6B with the new ones as early as possible, since continued operation with the existing FWHs 6A and 6B could result in extended forced outages.
CONCLUSIONS
This case study has demonstrated the importance of thermal performance analysis in validating feedwater heater and heater drain system performance issues and in quantification of associated capacity issues. FIGURE 3 RUPTURED TUBE
The methodology described for the case study should be beneficial for all nuclear power plants facing similar issues.
REFERENCES
1. World Nuclear Association (WNA) Optimized Capacity: Global Trends and Issues – A Report by the World Nuclear Association’s Capacity Optimization Working Group
2. North American Reliability Corporation – Generating Availability Report July 2011 for Years 2006 – 2010
FIGURE 4 SHEARED TUBE
9 Copyright © 2012 by ASME