Optimized gating and reference ranges of reticulated platelets in ...
11
METHODOLOGY ARTICLE Open Access Optimized gating and reference ranges of reticulated platelets in dogs for the Sysmex XT-2000iV Dana E. Oellers 1* , Natali Bauer 1 , Melanie Ginder 2 , Sigrid Johannes 3 , Iris Pernecker 3 and Andreas Moritz 1 Abstract Background: Canine reticulated platelets (r-PLTs) i.e., juvenile PLTs reflecting thrombopoiesis can be measured automatically with the hematology analyzer Sysmex XT-2000iV using manual gating options. However, the impact of interferences on r-PLT measurements performed with the gates published previously (Pankraz et al., Vet Clin Path 38:30–38, 2009; Gelain et al., High fluorescent platelets fraction in macrothrombocytopenic Norfolk terrier, 2010) is largely unknown. The aim was to compare different published gates for measurement of r-PLTs with the Sysmex XT-2000iV with an own, optimized gate (“Oellers-gate”) and to establish reference intervals (RIs) in > 120 dogs. Data of 362 measurements of diseased and healthy dogs were analyzed retrospectively. Several gates were applied and RIs for r-PLTs and platelet indices were established for pet dogs and a group of 153 healthy Beagles kept under defined housing conditions. Intra-assay precision (CV) was also assessed. Results: In 30/362 samples, interferences consistent with small erythrocytes/reticulocytes were seen in the previously published gates but not in the “Oellers-gate”. Good correlation was found between the different gates (r s : 0.88–1.00). RIs for the “Pankraz-gate”, the “Gelain-gate”, and the “Oellers-gate” were 0.0–1.2, 0.2–3.7 and 0.2–3.9 % respectively. CVs were ranging between 22 and 41 %. Conclusions: Optimization of previously published gates minimized interferences of small erythrocytes with r-PLT measurements. Keywords: RNA-rich platelets, Canine, Hematology analyzer Background Canine reticulated platelets (r-PLTs) i.e., juvenile plate- lets were first described in 1969 following acute blood loss in dogs [1]. Later, r-PLTs were detected with flow cytometry using Thiazol Orange [2] comparable to the measurement of reticulocytes [3]. Thiazol Orange posi- tive platelets are shown to be less than 24 h old [4], so that their measurement is useful to estimate the platelet production by the bone marrow as it has been shown for human patients [5, 6]. Megakaryopoiesis can be esti- mated by evaluating a bone marrow aspirate or biopsy; however, taking a blood sample is much easier, less invasive and therefore the better choice for a continuous monitoring of the patient. Moreover, evaluation of bone marrow samples is subjective, time consuming and re- quires a highly skilled examiner. Measuring r-PLTs in whole blood using flow cytometry with Thiazol Orange is noninvasive and objective, but the method is both ex- pensive and time-consuming. The Sysmex XE-2100 and the closely related Sysmex XT-2000iV are automated hematology analyzers designed for their use in human and animal specimens, respectively. Both analyzers measure platelets by impedance (PLT-I) and laser based methods (PLT-O). Due to its option of manual gating, the Sysmex analyzer XT-2000iV is capable of detecting immature r-PLTs by flow cytometry in the PLT-O chan- nel, whereby a proprietary dye containing polymethine and oxazine is applied. The dye penetrates cell mem- branes and stains nucleic acids in reticulocytes and * Correspondence: [email protected] 1 Department of Veterinary Clinical Sciences, Clinical Pathophysiology and Clinical Pathology, Justus-Liebig University Giessen, Frankfurter Str. 126, 35392 Giessen, Germany Full list of author information is available at the end of the article © 2016 The Author(s). Open Access This article is distributed under the terms of the Creative Commons Attribution 4.0 International License (http://creativecommons.org/licenses/by/4.0/), which permits unrestricted use, distribution, and reproduction in any medium, provided you give appropriate credit to the original author(s) and the source, provide a link to the Creative Commons license, and indicate if changes were made. The Creative Commons Public Domain Dedication waiver (http://creativecommons.org/publicdomain/zero/1.0/) applies to the data made available in this article, unless otherwise stated. Oellers et al. BMC Veterinary Research (2016) 12:148 DOI 10.1186/s12917-016-0779-4
Transcript of Optimized gating and reference ranges of reticulated platelets in ...
METHODOLOGY ARTICLE Open Access
Optimized gating and reference ranges ofreticulated platelets in dogs for the SysmexXT-2000iVDana E. Oellers1*, Natali Bauer1, Melanie Ginder2, Sigrid Johannes3, Iris Pernecker3 and Andreas Moritz1
Abstract
Background: Canine reticulated platelets (r-PLTs) i.e., juvenile PLTs reflecting thrombopoiesis can be measuredautomatically with the hematology analyzer Sysmex XT-2000iV using manual gating options. However, the impactof interferences on r-PLT measurements performed with the gates published previously (Pankraz et al., Vet Clin Path38:30–38, 2009; Gelain et al., High fluorescent platelets fraction in macrothrombocytopenic Norfolk terrier, 2010) islargely unknown.The aim was to compare different published gates for measurement of r-PLTs with the Sysmex XT-2000iV with anown, optimized gate (“Oellers-gate”) and to establish reference intervals (RIs) in > 120 dogs.Data of 362 measurements of diseased and healthy dogs were analyzed retrospectively. Several gates were appliedand RIs for r-PLTs and platelet indices were established for pet dogs and a group of 153 healthy Beagles kept underdefined housing conditions. Intra-assay precision (CV) was also assessed.
Results: In 30/362 samples, interferences consistent with small erythrocytes/reticulocytes were seen in the previouslypublished gates but not in the “Oellers-gate”. Good correlation was found between the different gates (rs: 0.88–1.00).RIs for the “Pankraz-gate”, the “Gelain-gate”, and the “Oellers-gate” were 0.0–1.2, 0.2–3.7 and 0.2–3.9 % respectively. CVswere ranging between 22 and 41 %.
Conclusions: Optimization of previously published gates minimized interferences of small erythrocytes with r-PLTmeasurements.
Keywords: RNA-rich platelets, Canine, Hematology analyzer
BackgroundCanine reticulated platelets (r-PLTs) i.e., juvenile plate-lets were first described in 1969 following acute bloodloss in dogs [1]. Later, r-PLTs were detected with flowcytometry using Thiazol Orange [2] comparable to themeasurement of reticulocytes [3]. Thiazol Orange posi-tive platelets are shown to be less than 24 h old [4], sothat their measurement is useful to estimate the plateletproduction by the bone marrow as it has been shownfor human patients [5, 6]. Megakaryopoiesis can be esti-mated by evaluating a bone marrow aspirate or biopsy;however, taking a blood sample is much easier, less
invasive and therefore the better choice for a continuousmonitoring of the patient. Moreover, evaluation of bonemarrow samples is subjective, time consuming and re-quires a highly skilled examiner. Measuring r-PLTs inwhole blood using flow cytometry with Thiazol Orangeis noninvasive and objective, but the method is both ex-pensive and time-consuming. The Sysmex XE-2100 andthe closely related Sysmex XT-2000iV are automatedhematology analyzers designed for their use in humanand animal specimens, respectively. Both analyzersmeasure platelets by impedance (PLT-I) and laser basedmethods (PLT-O). Due to its option of manual gating,the Sysmex analyzer XT-2000iV is capable of detectingimmature r-PLTs by flow cytometry in the PLT-O chan-nel, whereby a proprietary dye containing polymethineand oxazine is applied. The dye penetrates cell mem-branes and stains nucleic acids in reticulocytes and
* Correspondence: [email protected] of Veterinary Clinical Sciences, Clinical Pathophysiology andClinical Pathology, Justus-Liebig University Giessen, Frankfurter Str. 126,35392 Giessen, GermanyFull list of author information is available at the end of the article
© 2016 The Author(s). Open Access This article is distributed under the terms of the Creative Commons Attribution 4.0International License (http://creativecommons.org/licenses/by/4.0/), which permits unrestricted use, distribution, andreproduction in any medium, provided you give appropriate credit to the original author(s) and the source, provide a link tothe Creative Commons license, and indicate if changes were made. The Creative Commons Public Domain Dedication waiver(http://creativecommons.org/publicdomain/zero/1.0/) applies to the data made available in this article, unless otherwise stated.
Oellers et al. BMC Veterinary Research (2016) 12:148 DOI 10.1186/s12917-016-0779-4
immature platelets. These cells are classified by flow cy-tometry based on their size (forward light scatter) andtheir fluorescence intensity (nucleic acid content) [7].Since 2009, the detection of r-PLTs in dogs with the Sys-mex XT-2000iV automated hematology analyzer hasbeen evaluated and a reference interval has been estab-lished (n = 40 dogs [8] and 86 dogs respectively [9]).Similar to human medicine [10], a large reference
population of > 120 reference individuals has been rec-ommended also in veterinary medicine to reliably estab-lish reference intervals (ASVCP recommendations) [11].To the authors’ knowledge, reference intervals based onsuch a large reference population have not been estab-lished for r-PLTs and platelet indices for the Sysmex XT-2000iV (thereafter XT-2000iV) analyzer before. More-over, the impact of potentially interfering cell popula-tions such as small erythrocytes and reticulocytes on r-PLT measurements performed with the manual gatespublished previously is largely unknown.
Several platelet indices such as mean platelet vol-ume (MPV), platelet distribution width (PDW), plate-let large cell ratio (P-LCR) and plateletcrit (PCT) areprovided automatically by the XT-2000iV with eachmeasurement. The diagnostic use of platelet indicesreflecting platelet size as marker for juvenile plateletshas been controversially discussed [12–17]. We previ-ously demonstrated that there was no difference be-tween platelet indices assessed with the XT-2000iV inthrombocytopenic dogs and controls despite a signifi-cantly higher percentage of r-PLTs observed in thediseased dogs [8]. However, the number of dogs eval-uated previously was comparatively small (n = 40 con-trol dogs, n = 8 thrombocytopenic dogs) so that apotential association between mean platelet volume(MPV) and the number of r-PLTs might have beenmissed. In contrast, the MPV was significantly higherin dogs with immune mediated thrombocytopeniathan in healthy control dogs [18].
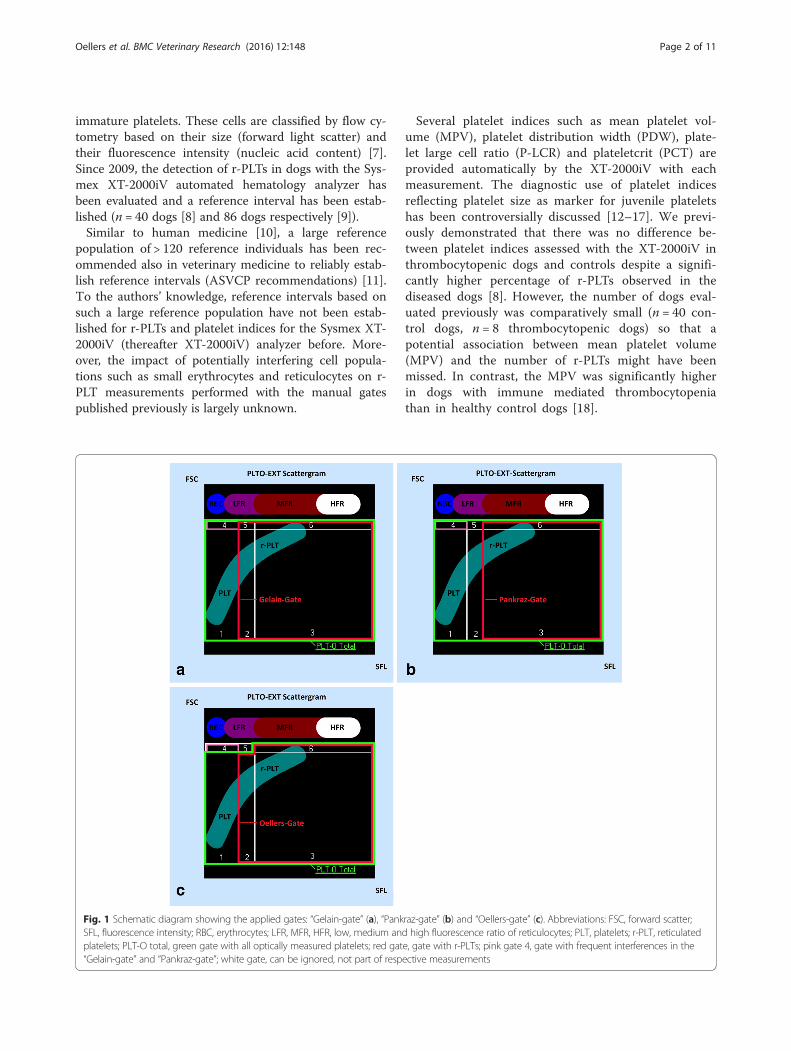
Fig. 1 Schematic diagram showing the applied gates: “Gelain-gate” (a), “Pankraz-gate” (b) and “Oellers-gate” (c). Abbreviations: FSC, forward scatter;SFL, fluorescence intensity; RBC, erythrocytes; LFR, MFR, HFR, low, medium and high fluorescence ratio of reticulocytes; PLT, platelets; r-PLT, reticulatedplatelets; PLT-O total, green gate with all optically measured platelets; red gate, gate with r-PLTs; pink gate 4, gate with frequent interferences in the“Gelain-gate” and “Pankraz-gate”; white gate, can be ignored, not part of respective measurements
Oellers et al. BMC Veterinary Research (2016) 12:148 Page 2 of 11
The aims of our study were 1) to compare an opti-mized gate with the two previously published gatingmethods [8, 9], 2) to assess the impact of potentiallyinterfering cellular populations on r-PLT measurements,3) to optimize the gates for measurement of r-PLTs withthe XT-2000iV to eliminate possible interferences, and4) to establish reference intervals for r-PLTs measuredwith the own and the previously published gating methodsas well as for platelet indices in a reference population of >120 dogs as recommended by the ASVCP [11].
MethodsData of 362 canine complete blood cell counts (CBCs)including 14 follow-up samples was analyzed retrospect-ively. Follow-up samples are defined as blood samples,which have been taken from the same diseased dog butat different dates. The blood samples have been collectedbetween July 2006 and April 2007 in the department ofveterinary clinical sciences, Giessen, Germany and be-tween June 2009 and February 2010 in the departmentof Global Non-Clinical Safety, Merck Serono, Darmstadt,Germany. Overall, 169/362 samples were obtained from
diseased dogs and 193/362 samples were taken fromhealthy dogs respectively.
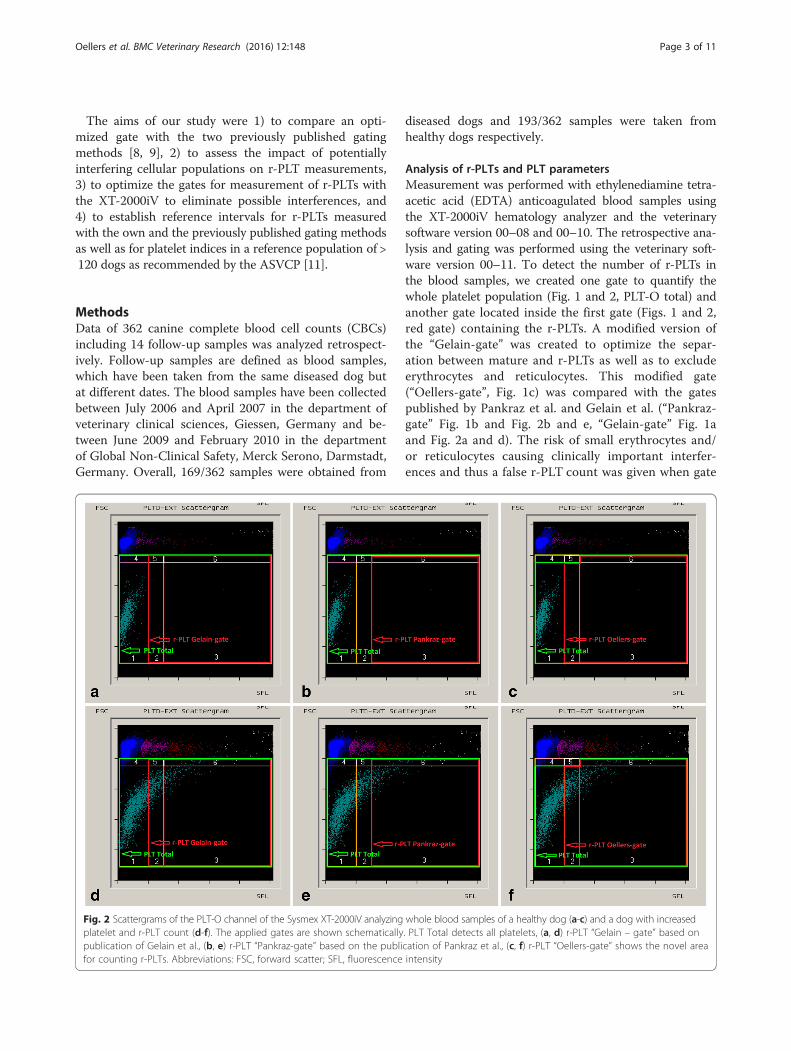
Analysis of r-PLTs and PLT parametersMeasurement was performed with ethylenediamine tetra-acetic acid (EDTA) anticoagulated blood samples usingthe XT-2000iV hematology analyzer and the veterinarysoftware version 00–08 and 00–10. The retrospective ana-lysis and gating was performed using the veterinary soft-ware version 00–11. To detect the number of r-PLTs inthe blood samples, we created one gate to quantify thewhole platelet population (Fig. 1 and 2, PLT-O total) andanother gate located inside the first gate (Figs. 1 and 2,red gate) containing the r-PLTs. A modified version ofthe “Gelain-gate” was created to optimize the separ-ation between mature and r-PLTs as well as to excludeerythrocytes and reticulocytes. This modified gate(“Oellers-gate”, Fig. 1c) was compared with the gatespublished by Pankraz et al. and Gelain et al. (“Pankraz-gate” Fig. 1b and Fig. 2b and e, “Gelain-gate” Fig. 1aand Fig. 2a and d). The risk of small erythrocytes and/or reticulocytes causing clinically important interfer-ences and thus a false r-PLT count was given when gate
Fig. 2 Scattergrams of the PLT-O channel of the Sysmex XT-2000iV analyzing whole blood samples of a healthy dog (a-c) and a dog with increasedplatelet and r-PLT count (d-f). The applied gates are shown schematically. PLT Total detects all platelets, (a, d) r-PLT “Gelain – gate” based onpublication of Gelain et al., (b, e) r-PLT “Pankraz-gate” based on the publication of Pankraz et al., (c, f) r-PLT “Oellers-gate” shows the novel areafor counting r-PLTs. Abbreviations: FSC, forward scatter; SFL, fluorescence intensity
Oellers et al. BMC Veterinary Research (2016) 12:148 Page 3 of 11
4 (Fig. 1) contained more than 5 % of the sum of dotsmeasured in gates 1 and 4. The suspicion of potentialinterferences of small erythrocytes/reticulocytes withthe r-PLT count was confirmed by visual control of thematching scattergram.Retrospective analysis of each CBC included the fol-
lowing variables: platelet count by optical (PLT-O) andimpedance methods (PLT-I), MPV, platelet distributionwidth (PDW), platelet large cell ratio (P-LCR), and plate-letcrit (PCT).The analyzer-specific canine reference intervals estab-
lished previously for the XT-2000iV [19] were used ascut-off values to define anemia or regeneration of eryth-rocytes (i.e., anemia was diagnosed when the RBC countwas < 5.1 × 10¹²/L and a reticulocyte count > 150.1 × 10⁹/L was considered regenerative).
Reference populationThe CBCs obtained from healthy dogs (n = 193, onesample per dog) included mainly samples taken fromhealthy Beagle dogs (153/193) obtained from onebreeder (Marshall BioResources, USA). The Beagledogs were kept under defined housing conditions: For20 h a day, they were housed in groups of three to fivedogs. Each dog spent the remaining four hours sepa-rated from the others in a standard kennel of 6.54 m2
and natural light. The Beagle dogs were fed once a daywith 300 g of a commercially available pelleted dryfood (Provimi Kliba AG, Kaiseraugust, Switzerland).Water was offered ad libitum. All Beagle dogs weredewormed and vaccinated against canine distemper,leptospirosis, canine parvovirus, parainfluenza, Bordetella,canine adenovirus 2, and rabies.The other 40/193 healthy dogs kept as pet dogs were
of various breeds including mixed-breed dogs (n = 17),Border Collies (n = 6), Great Danes (n = 3), West High-land White Terrier (n = 2), and one Beagle dog, BergerBlanc Suisse, Cocker Spaniel, Dalmatian, German Shep-herd, Golden Retriever, Groenendael, Jack Russel Terrier,Labrador Retriever, Old German Shepherd Dog, RoughCollie, and Small Munsterlander each.
Statistical analysisData was analyzed using Microsoft Excel®, ReferenceValue Adviser© version 2.1 for Microsoft Excel®,Analyse-it® version 2.04 for Microsoft Excel®, andGraphPad Prism® version 6. Data distribution wasassessed visually with a histogram.Spearman’s rank correlation, Passing-Bablok-Analysis,
and Bland-Altman-Analysis were performed to deter-mine correlation and bias between r-PLTs measurementsobtained with the various gates. A Kruskal-Wallis-Testwas used to assess the impact of the gating methodon r-PLT results, whereby the P values were adaptedfor multiple comparisons. Level of significance wasset at P < 0.05.Intra-assay repeatability was assessed by 25 repeated
measurements of one blood sample. For platelet indices,the XT-2000iV did not report results in 18/25 measure-ments so that calculation of intra-assay CV was basedon 7 results.
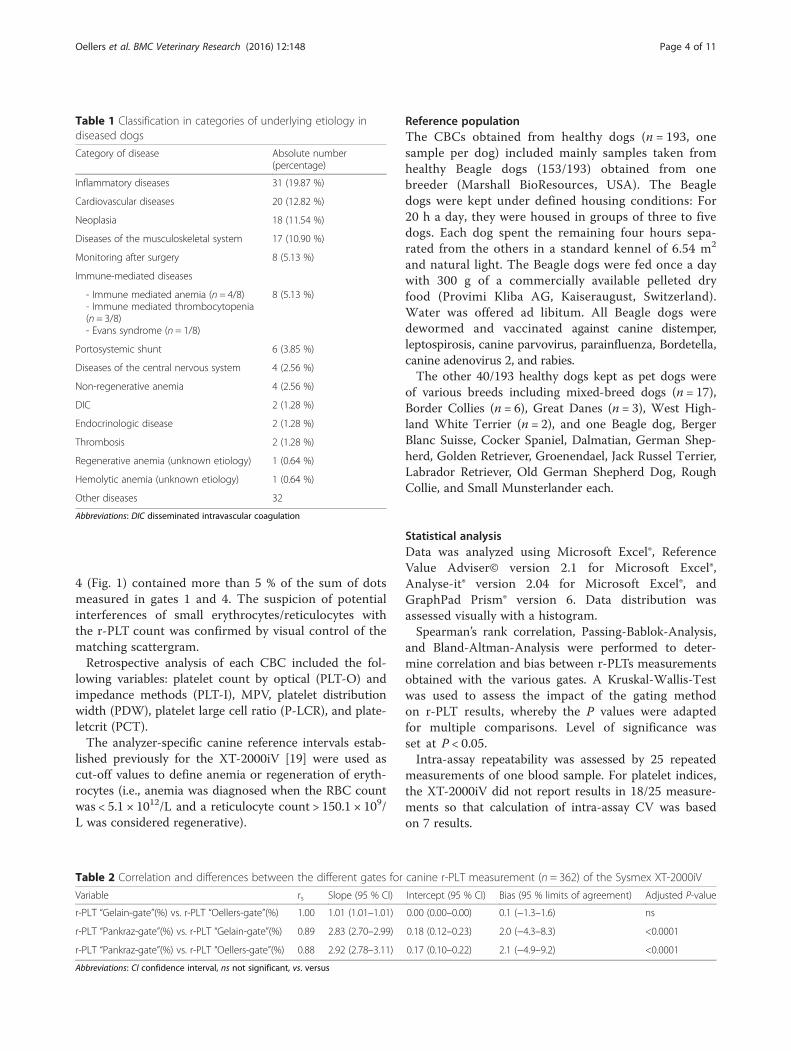
Table 1 Classification in categories of underlying etiology indiseased dogs
Category of disease Absolute number(percentage)
Inflammatory diseases 31 (19.87 %)
Cardiovascular diseases 20 (12.82 %)
Neoplasia 18 (11.54 %)
Diseases of the musculoskeletal system 17 (10.90 %)
Monitoring after surgery 8 (5.13 %)
Immune-mediated diseases
- Immune mediated anemia (n = 4/8)- Immune mediated thrombocytopenia(n = 3/8)- Evans syndrome (n = 1/8)
8 (5.13 %)
Portosystemic shunt 6 (3.85 %)
Diseases of the central nervous system 4 (2.56 %)
Non-regenerative anemia 4 (2.56 %)
DIC 2 (1.28 %)
Endocrinologic disease 2 (1.28 %)
Thrombosis 2 (1.28 %)
Regenerative anemia (unknown etiology) 1 (0.64 %)
Hemolytic anemia (unknown etiology) 1 (0.64 %)
Other diseases 32
Abbreviations: DIC disseminated intravascular coagulation
Table 2 Correlation and differences between the different gates for canine r-PLT measurement (n = 362) of the Sysmex XT-2000iV
Variable rs Slope (95 % CI) Intercept (95 % CI) Bias (95 % limits of agreement) Adjusted P-value
r-PLT “Gelain-gate”(%) vs. r-PLT “Oellers-gate”(%) 1.00 1.01 (1.01–1.01) 0.00 (0.00–0.00) 0.1 (−1.3–1.6) ns
r-PLT “Pankraz-gate”(%) vs. r-PLT “Gelain-gate”(%) 0.89 2.83 (2.70–2.99) 0.18 (0.12–0.23) 2.0 (−4.3–8.3) <0.0001
r-PLT “Pankraz-gate”(%) vs. r-PLT “Oellers-gate”(%) 0.88 2.92 (2.78–3.11) 0.17 (0.10–0.22) 2.1 (−4.9–9.2) <0.0001
Abbreviations: CI confidence interval, ns not significant, vs. versus
Oellers et al. BMC Veterinary Research (2016) 12:148 Page 4 of 11
Reference intervals for r-PLTs and platelet indices weregenerated for all healthy dogs independent of the breed(n = 193), and also for the subgroups “Beagles” (n = 153)and “non-Beagles” (n = 40). As recommended by theAmerican Society of Veterinary Clinical Pathology(ASVCP) [11], the statistical method used for calcula-tion of the respective reference intervals was chosenbased on the number of dogs included in the respective ref-erence population and data distribution. The whole groupof healthy dogs (n = 193) and the group of Beagle dogs (n= 153) included ≥ 120 individuals, so that the nonparamet-ric method was chosen to calculate reference intervals [11].
The group of pet dogs contained 40 (r-PLT, PLT-O, PLT-I)and 38 (MPV, PDW, P-LCR, PCT) dogs, respectively.When the number of samples was 40 ≤ × ≤ 120, the robustmethod was chosen for symmetrical (Gaussian) data distri-bution [11]. In case of non-Gaussian distribution, a Box-Cox transformation was performed prior to calculation ofreference intervals. Depending on data distribution afterBox-Cox transformation, a the parametric method waschosen for data with Gaussian distribution, while a non-parametric method was used in case of non-Gaussian dis-tribution. As the XT-2000iV did not report MPV, PDW,P-LCR and PCT for 3/193 healthy dogs, data of merely38/40 samples was available in the group of “non-Beagles”for these variables. As recommended previously for refer-ence populations of < 40 individuals [11], the paramet-ric method and robust method were used in case ofGaussian and non-Gaussian distribution, respectively.For all reference intervals, the 90 % confidence interval(CI) of the upper and lower ends of the reference limitswas calculated using bootstrap methods.
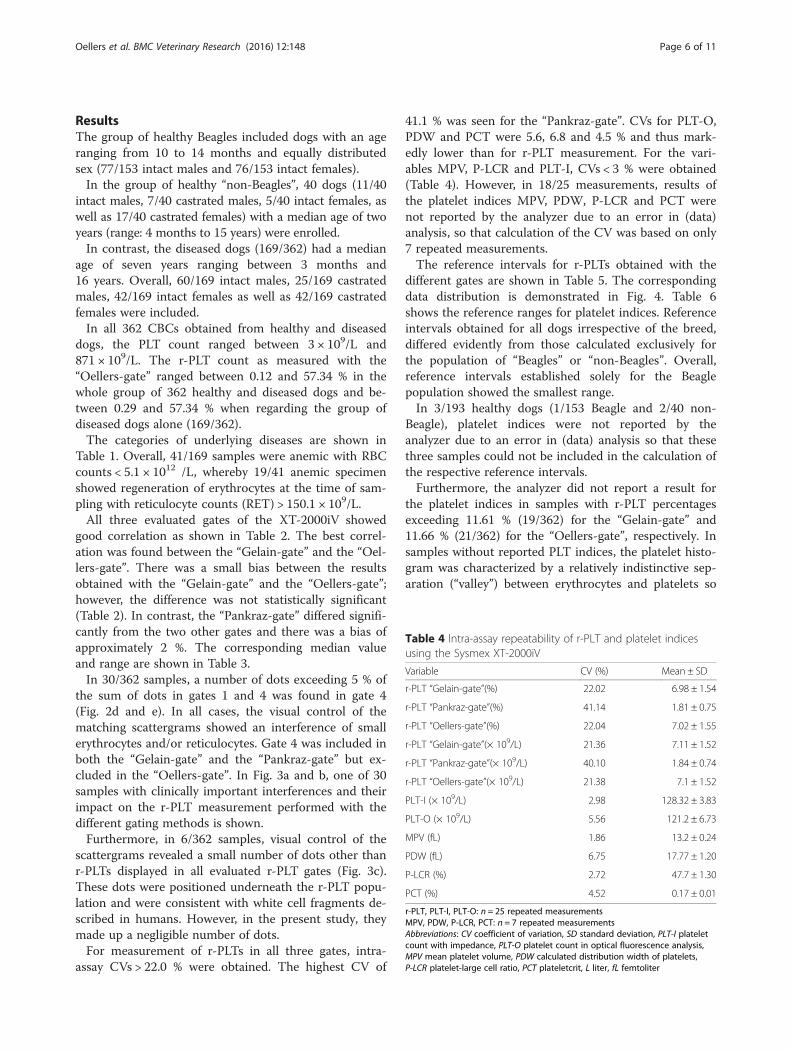
Table 3 Median, minimum and maximum r-PLT counts of theanalyzed group of healthy and diseased dogs (n = 362)
Variable Median Minimum Maximum
r-PLT “Gelain-gate”(%) 1.33 0.11 54.89
r-PLT “Pankraz-gate”(%) 0.40 0.0 35.02
r-PLT “Oellers-gate”(%) 1.33 0.12 57.34
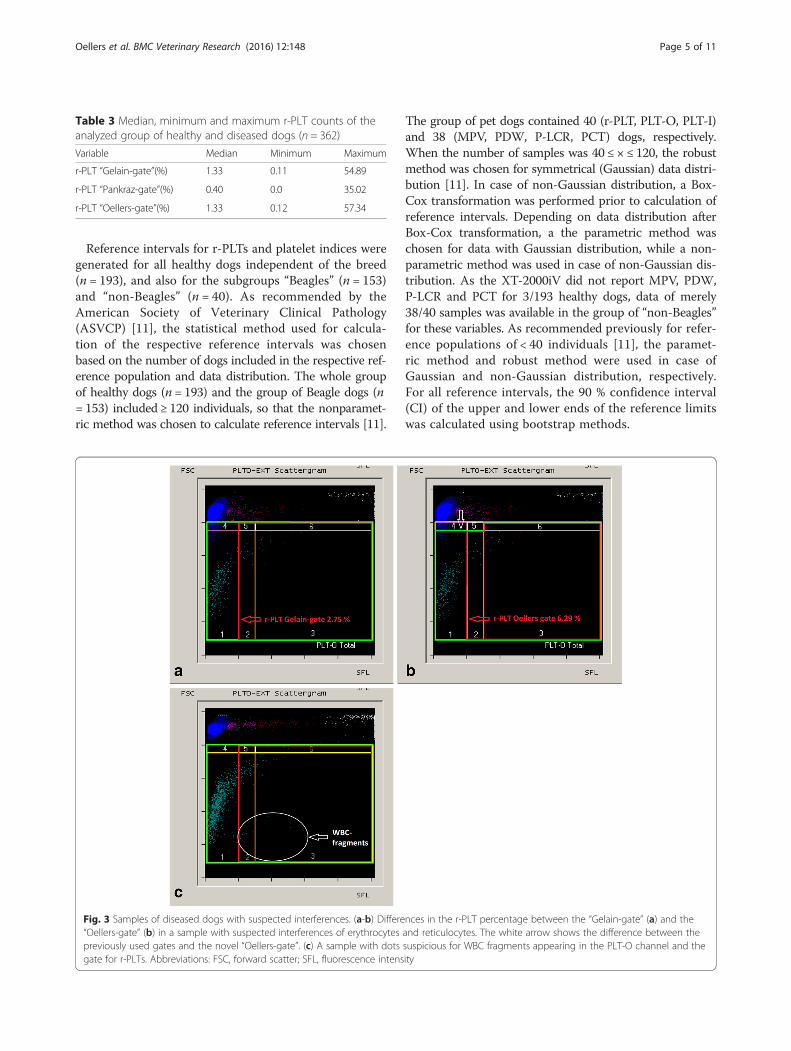
Fig. 3 Samples of diseased dogs with suspected interferences. (a-b) Differences in the r-PLT percentage between the “Gelain-gate” (a) and the“Oellers-gate” (b) in a sample with suspected interferences of erythrocytes and reticulocytes. The white arrow shows the difference between thepreviously used gates and the novel “Oellers-gate”. (c) A sample with dots suspicious for WBC fragments appearing in the PLT-O channel and thegate for r-PLTs. Abbreviations: FSC, forward scatter; SFL, fluorescence intensity
Oellers et al. BMC Veterinary Research (2016) 12:148 Page 5 of 11
ResultsThe group of healthy Beagles included dogs with an ageranging from 10 to 14 months and equally distributedsex (77/153 intact males and 76/153 intact females).In the group of healthy “non-Beagles”, 40 dogs (11/40
intact males, 7/40 castrated males, 5/40 intact females, aswell as 17/40 castrated females) with a median age of twoyears (range: 4 months to 15 years) were enrolled.In contrast, the diseased dogs (169/362) had a median
age of seven years ranging between 3 months and16 years. Overall, 60/169 intact males, 25/169 castratedmales, 42/169 intact females as well as 42/169 castratedfemales were included.In all 362 CBCs obtained from healthy and diseased
dogs, the PLT count ranged between 3 × 10⁹/L and871 × 109/L. The r-PLT count as measured with the“Oellers-gate” ranged between 0.12 and 57.34 % in thewhole group of 362 healthy and diseased dogs and be-tween 0.29 and 57.34 % when regarding the group ofdiseased dogs alone (169/362).The categories of underlying diseases are shown in
Table 1. Overall, 41/169 samples were anemic with RBCcounts < 5.1 × 10¹² /L, whereby 19/41 anemic specimenshowed regeneration of erythrocytes at the time of sam-pling with reticulocyte counts (RET) > 150.1 × 10⁹/L.All three evaluated gates of the XT-2000iV showed
good correlation as shown in Table 2. The best correl-ation was found between the “Gelain-gate” and the “Oel-lers-gate”. There was a small bias between the resultsobtained with the “Gelain-gate” and the “Oellers-gate”;however, the difference was not statistically significant(Table 2). In contrast, the “Pankraz-gate” differed signifi-cantly from the two other gates and there was a bias ofapproximately 2 %. The corresponding median valueand range are shown in Table 3.In 30/362 samples, a number of dots exceeding 5 % of
the sum of dots in gates 1 and 4 was found in gate 4(Fig. 2d and e). In all cases, the visual control of thematching scattergrams showed an interference of smallerythrocytes and/or reticulocytes. Gate 4 was included inboth the “Gelain-gate” and the “Pankraz-gate” but ex-cluded in the “Oellers-gate”. In Fig. 3a and b, one of 30samples with clinically important interferences and theirimpact on the r-PLT measurement performed with thedifferent gating methods is shown.Furthermore, in 6/362 samples, visual control of the
scattergrams revealed a small number of dots other thanr-PLTs displayed in all evaluated r-PLT gates (Fig. 3c).These dots were positioned underneath the r-PLT popu-lation and were consistent with white cell fragments de-scribed in humans. However, in the present study, theymade up a negligible number of dots.For measurement of r-PLTs in all three gates, intra-
assay CVs > 22.0 % were obtained. The highest CV of
41.1 % was seen for the “Pankraz-gate”. CVs for PLT-O,PDW and PCT were 5.6, 6.8 and 4.5 % and thus mark-edly lower than for r-PLT measurement. For the vari-ables MPV, P-LCR and PLT-I, CVs < 3 % were obtained(Table 4). However, in 18/25 measurements, results ofthe platelet indices MPV, PDW, P-LCR and PCT werenot reported by the analyzer due to an error in (data)analysis, so that calculation of the CV was based on only7 repeated measurements.The reference intervals for r-PLTs obtained with the
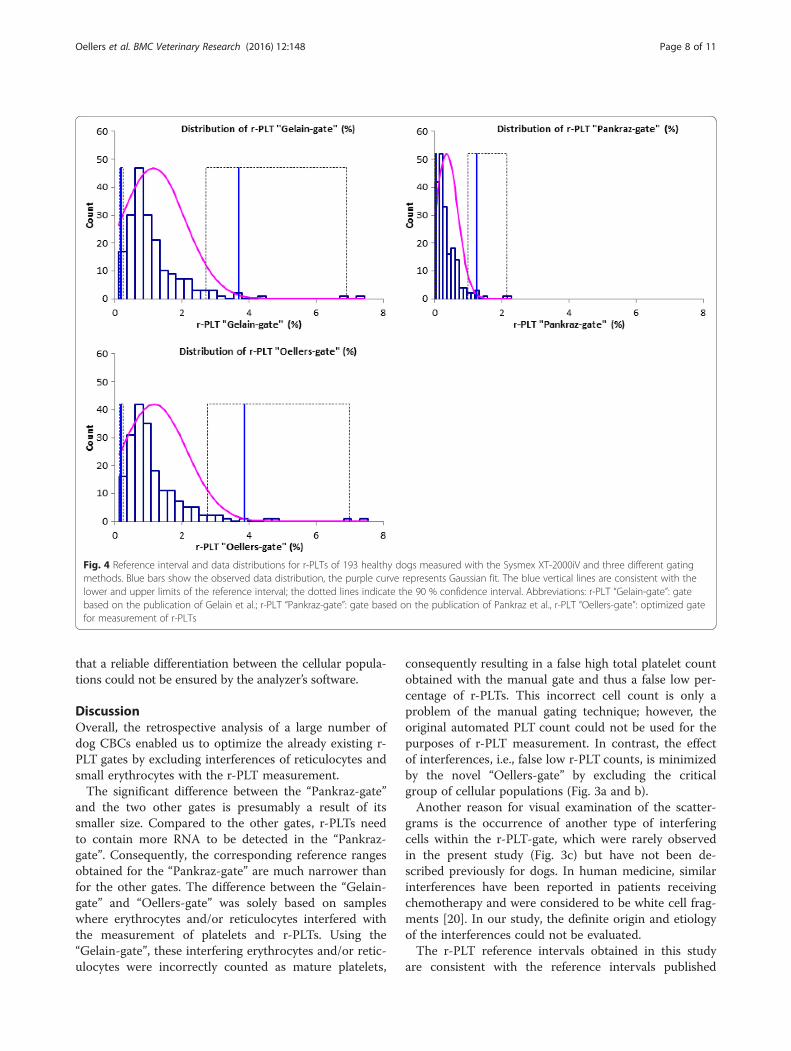
different gates are shown in Table 5. The correspondingdata distribution is demonstrated in Fig. 4. Table 6shows the reference ranges for platelet indices. Referenceintervals obtained for all dogs irrespective of the breed,differed evidently from those calculated exclusively forthe population of “Beagles” or “non-Beagles”. Overall,reference intervals established solely for the Beaglepopulation showed the smallest range.In 3/193 healthy dogs (1/153 Beagle and 2/40 non-
Beagle), platelet indices were not reported by theanalyzer due to an error in (data) analysis so that thesethree samples could not be included in the calculation ofthe respective reference intervals.Furthermore, the analyzer did not report a result for
the platelet indices in samples with r-PLT percentagesexceeding 11.61 % (19/362) for the “Gelain-gate” and11.66 % (21/362) for the “Oellers-gate”, respectively. Insamples without reported PLT indices, the platelet histo-gram was characterized by a relatively indistinctive sep-aration (“valley”) between erythrocytes and platelets so
Table 4 Intra-assay repeatability of r-PLT and platelet indicesusing the Sysmex XT-2000iV
Variable CV (%) Mean ± SD
r-PLT “Gelain-gate”(%) 22.02 6.98 ± 1.54
r-PLT “Pankraz-gate”(%) 41.14 1.81 ± 0.75
r-PLT “Oellers-gate”(%) 22.04 7.02 ± 1.55
r-PLT “Gelain-gate”(× 109/L) 21.36 7.11 ± 1.52
r-PLT “Pankraz-gate”(× 109/L) 40.10 1.84 ± 0.74
r-PLT “Oellers-gate”(× 109/L) 21.38 7.1 ± 1.52
PLT-I (× 109/L) 2.98 128.32 ± 3.83
PLT-O (× 109/L) 5.56 121.2 ± 6.73
MPV (fL) 1.86 13.2 ± 0.24
PDW (fL) 6.75 17.77 ± 1.20
P-LCR (%) 2.72 47.7 ± 1.30
PCT (%) 4.52 0.17 ± 0.01
r-PLT, PLT-I, PLT-O: n = 25 repeated measurementsMPV, PDW, P-LCR, PCT: n = 7 repeated measurementsAbbreviations: CV coefficient of variation, SD standard deviation, PLT-I plateletcount with impedance, PLT-O platelet count in optical fluorescence analysis,MPV mean platelet volume, PDW calculated distribution width of platelets,P-LCR platelet-large cell ratio, PCT plateletcrit, L liter, fL femtoliter
Oellers et al. BMC Veterinary Research (2016) 12:148 Page 6 of 11
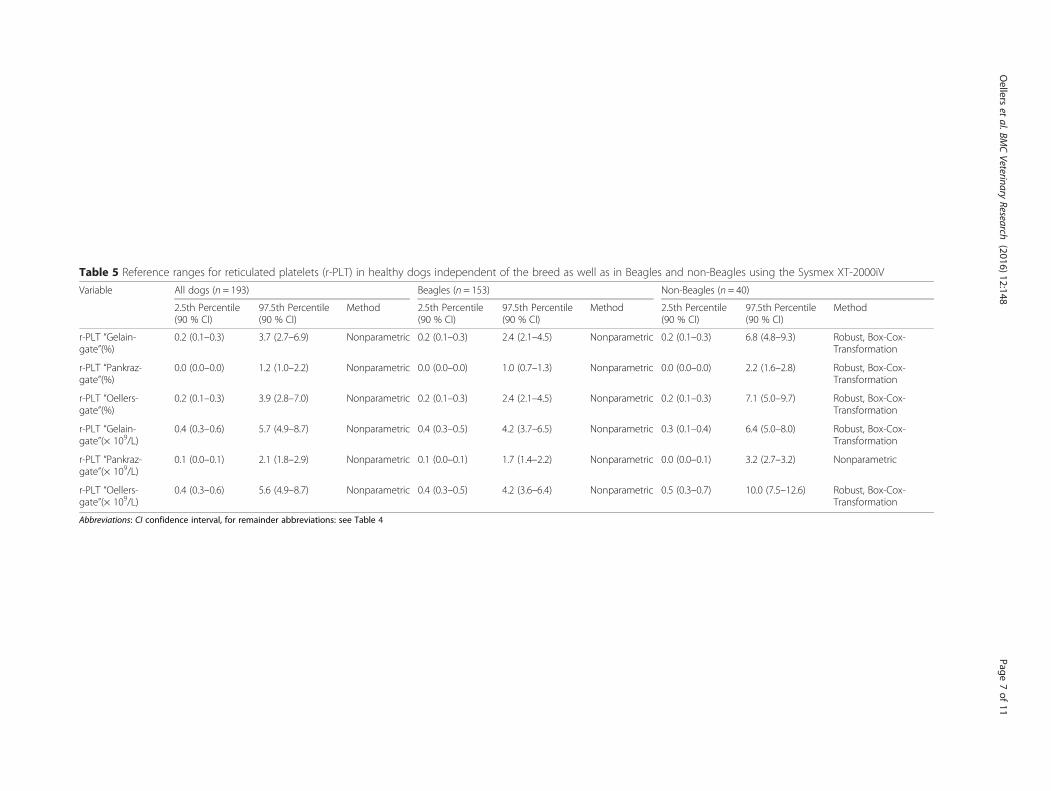
Table 5 Reference ranges for reticulated platelets (r-PLT) in healthy dogs independent of the breed as well as in Beagles and non-Beagles using the Sysmex XT-2000iV
Variable All dogs (n = 193) Beagles (n = 153) Non-Beagles (n = 40)
2.5th Percentile(90 % CI)
97.5th Percentile(90 % CI)
Method 2.5th Percentile(90 % CI)
97.5th Percentile(90 % CI)
Method 2.5th Percentile(90 % CI)
97.5th Percentile(90 % CI)
Method
r-PLT “Gelain-gate”(%)
0.2 (0.1–0.3) 3.7 (2.7–6.9) Nonparametric 0.2 (0.1–0.3) 2.4 (2.1–4.5) Nonparametric 0.2 (0.1–0.3) 6.8 (4.8–9.3) Robust, Box-Cox-Transformation
r-PLT “Pankraz-gate”(%)
0.0 (0.0–0.0) 1.2 (1.0–2.2) Nonparametric 0.0 (0.0–0.0) 1.0 (0.7–1.3) Nonparametric 0.0 (0.0–0.0) 2.2 (1.6–2.8) Robust, Box-Cox-Transformation
r-PLT “Oellers-gate”(%)
0.2 (0.1–0.3) 3.9 (2.8–7.0) Nonparametric 0.2 (0.1–0.3) 2.4 (2.1–4.5) Nonparametric 0.2 (0.1–0.3) 7.1 (5.0–9.7) Robust, Box-Cox-Transformation
r-PLT “Gelain-gate”(× 109/L)
0.4 (0.3–0.6) 5.7 (4.9–8.7) Nonparametric 0.4 (0.3–0.5) 4.2 (3.7–6.5) Nonparametric 0.3 (0.1–0.4) 6.4 (5.0–8.0) Robust, Box-Cox-Transformation
r-PLT “Pankraz-gate”(× 109/L)
0.1 (0.0–0.1) 2.1 (1.8–2.9) Nonparametric 0.1 (0.0–0.1) 1.7 (1.4–2.2) Nonparametric 0.0 (0.0–0.1) 3.2 (2.7–3.2) Nonparametric
r-PLT “Oellers-gate”(× 109/L)
0.4 (0.3–0.6) 5.6 (4.9–8.7) Nonparametric 0.4 (0.3–0.5) 4.2 (3.6–6.4) Nonparametric 0.5 (0.3–0.7) 10.0 (7.5–12.6) Robust, Box-Cox-Transformation
Abbreviations: CI confidence interval, for remainder abbreviations: see Table 4
Oellers
etal.BM
CVeterinary
Research (2016) 12:148
Page7of
11
that a reliable differentiation between the cellular popula-tions could not be ensured by the analyzer’s software.
DiscussionOverall, the retrospective analysis of a large number ofdog CBCs enabled us to optimize the already existing r-PLT gates by excluding interferences of reticulocytes andsmall erythrocytes with the r-PLT measurement.The significant difference between the “Pankraz-gate”
and the two other gates is presumably a result of itssmaller size. Compared to the other gates, r-PLTs needto contain more RNA to be detected in the “Pankraz-gate”. Consequently, the corresponding reference rangesobtained for the “Pankraz-gate” are much narrower thanfor the other gates. The difference between the “Gelain-gate” and “Oellers-gate” was solely based on sampleswhere erythrocytes and/or reticulocytes interfered withthe measurement of platelets and r-PLTs. Using the“Gelain-gate”, these interfering erythrocytes and/or retic-ulocytes were incorrectly counted as mature platelets,
consequently resulting in a false high total platelet countobtained with the manual gate and thus a false low per-centage of r-PLTs. This incorrect cell count is only aproblem of the manual gating technique; however, theoriginal automated PLT count could not be used for thepurposes of r-PLT measurement. In contrast, the effectof interferences, i.e., false low r-PLT counts, is minimizedby the novel “Oellers-gate” by excluding the criticalgroup of cellular populations (Fig. 3a and b).Another reason for visual examination of the scatter-
grams is the occurrence of another type of interferingcells within the r-PLT-gate, which were rarely observedin the present study (Fig. 3c) but have not been de-scribed previously for dogs. In human medicine, similarinterferences have been reported in patients receivingchemotherapy and were considered to be white cell frag-ments [20]. In our study, the definite origin and etiologyof the interferences could not be evaluated.The r-PLT reference intervals obtained in this study
are consistent with the reference intervals published
Fig. 4 Reference interval and data distributions for r-PLTs of 193 healthy dogs measured with the Sysmex XT-2000iV and three different gatingmethods. Blue bars show the observed data distribution, the purple curve represents Gaussian fit. The blue vertical lines are consistent with thelower and upper limits of the reference interval; the dotted lines indicate the 90 % confidence interval. Abbreviations: r-PLT “Gelain-gate”: gatebased on the publication of Gelain et al.; r-PLT “Pankraz-gate”: gate based on the publication of Pankraz et al., r-PLT “Oellers-gate”: optimized gatefor measurement of r-PLTs
Oellers et al. BMC Veterinary Research (2016) 12:148 Page 8 of 11
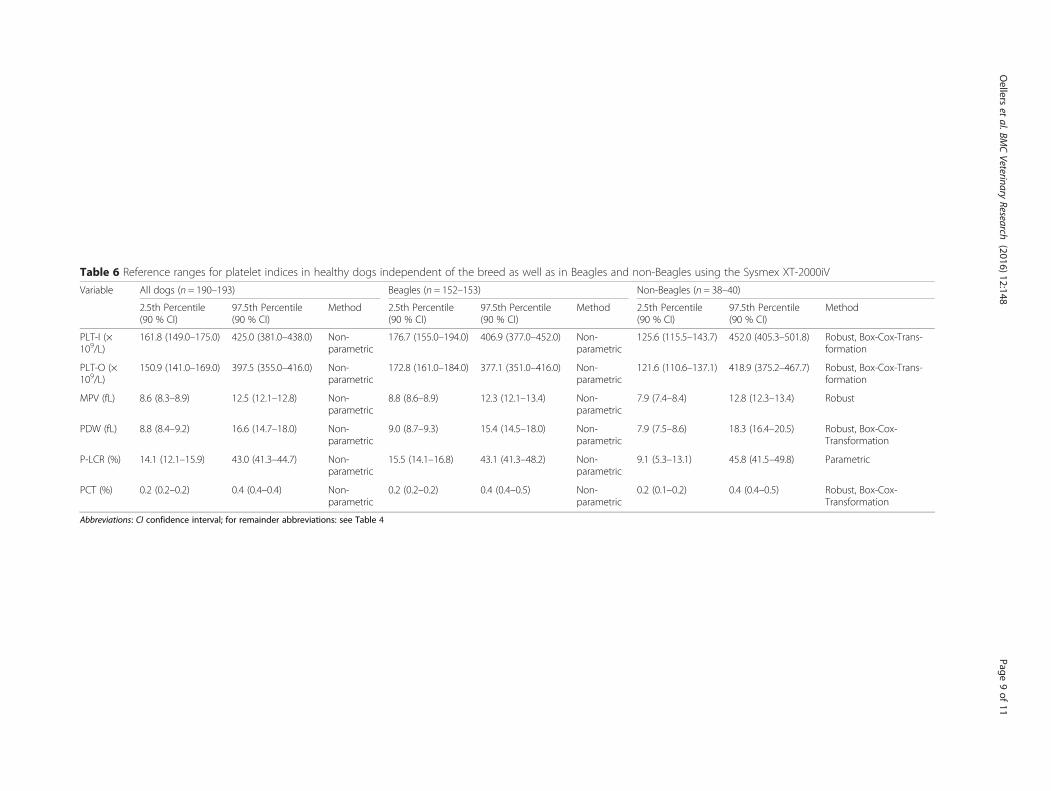
Table 6 Reference ranges for platelet indices in healthy dogs independent of the breed as well as in Beagles and non-Beagles using the Sysmex XT-2000iV
Variable All dogs (n = 190–193) Beagles (n = 152–153) Non-Beagles (n = 38–40)
2.5th Percentile(90 % CI)
97.5th Percentile(90 % CI)
Method 2.5th Percentile(90 % CI)
97.5th Percentile(90 % CI)
Method 2.5th Percentile(90 % CI)
97.5th Percentile(90 % CI)
Method
PLT-I (×109/L)
161.8 (149.0–175.0) 425.0 (381.0–438.0) Non-parametric
176.7 (155.0–194.0) 406.9 (377.0–452.0) Non-parametric
125.6 (115.5–143.7) 452.0 (405.3–501.8) Robust, Box-Cox-Trans-formation
PLT-O (×109/L)
150.9 (141.0–169.0) 397.5 (355.0–416.0) Non-parametric
172.8 (161.0–184.0) 377.1 (351.0–416.0) Non-parametric
121.6 (110.6–137.1) 418.9 (375.2–467.7) Robust, Box-Cox-Trans-formation
MPV (fL) 8.6 (8.3–8.9) 12.5 (12.1–12.8) Non-parametric
8.8 (8.6–8.9) 12.3 (12.1–13.4) Non-parametric
7.9 (7.4–8.4) 12.8 (12.3–13.4) Robust
PDW (fL) 8.8 (8.4–9.2) 16.6 (14.7–18.0) Non-parametric
9.0 (8.7–9.3) 15.4 (14.5–18.0) Non-parametric
7.9 (7.5–8.6) 18.3 (16.4–20.5) Robust, Box-Cox-Transformation
P-LCR (%) 14.1 (12.1–15.9) 43.0 (41.3–44.7) Non-parametric
15.5 (14.1–16.8) 43.1 (41.3–48.2) Non-parametric
9.1 (5.3–13.1) 45.8 (41.5–49.8) Parametric
PCT (%) 0.2 (0.2–0.2) 0.4 (0.4–0.4) Non-parametric
0.2 (0.2–0.2) 0.4 (0.4–0.5) Non-parametric
0.2 (0.1–0.2) 0.4 (0.4–0.5) Robust, Box-Cox-Transformation
Abbreviations: CI confidence interval; for remainder abbreviations: see Table 4
Oellers
etal.BM
CVeterinary
Research (2016) 12:148
Page9of
11
previously for the XT-2000iV [8, 9]. Reference intervalsestablished here for the “Gelain-gate” (0.2–3.7 %; 0.4–5.7 × 10⁹/L) and the “Oellers-gate” (0.2–3.9 %; 0.4–5.6 ×10⁹/L) in 193 dogs are comparable with results pub-lished previously by Gelain et al. [9] (1.4 ± 0.7 %; 4 ±2.5 × 10⁹/L, n = 86). Furthermore, our reference intervalestablished for the “Pankraz-gate” (0.0–1.2 %) is in ac-cordance to the reference range shown previously byPankraz et al. for the XT-2000iV [8] (0.56 ± 0.82 %, n = 40).Our results clearly showed that the reference intervals
in Beagle dogs are much smaller than in non-Beagle dogs,which is most likely because of the lower genetic variation,the similar age and the identical housing conditions.Moreover, the reference intervals published by Smith
et al. for flow cytometry with Thiazol Orange and CD61[21] are also comparable (1.9 ± 1.2 %; 5.2 ± 3.4 × 10⁹/L,n = 36) with our results. However, when regarding otherreference intervals for r-PLTs determined flow-cytometrically with the Thiazol Orange method, thereis a large discrepancy between results reported in theliterature ranging from 3.4 ± 2.0 % (n = 8 dogs) [22] to9.3 ± 2.7 % (n = 20 dogs) [23] and the respective refer-ence intervals are generally higher than those obtainedin our study. Overall, it is obvious that reference inter-vals for flow cytometry differ clearly between differentstudies, whereas reference intervals for the XT-2000iVusing similar gates showed good accordance. A possiblecause could be different methodology, i.e., variations instaining protocols or gating of r-PLTs in laboratoriesusing flow cytometry [24].Furthermore, our reference intervals for platelet indi-
ces (n = 190–193, depending on the variable) showedgood accordance with reference ranges published beforefor the XT-2000iV (n = 160–182, n = 126–132, depend-ing on the variable [19, 25]).However, the study is limited by its retrospective na-
ture so that a comparison with a reference method otherthan the previously published gates was not performed.For interpretation of the reference intervals, it has to beconsidered that the group of non-Beagle dogs is alsosmaller than recommended by the ASVCP [11] and ref-erence intervals have to be therefore considered as arough estimate.Despite the optimization of the gating method de-
scribed here, interferences could not be totally avoided.Only flow cytometric assessment of specifically antibody-labeled platelets would allow a definite distinction betweenplatelets and other cellular populations. Another potentiallimitation of the gating method applied by us and the pre-vious authors evaluating the r-PLT count measured by theSysmex XT is that the gates are based on visual – andtherefore subjective and potentially imprecise – assess-ment of the dot plots. Additionally, the position and sizeof the gates is fixed, so that in some samples, the shape of
the gates did not entirely match the shape of the totalplatelet population. Thus, each measurement should beverified by visual examination of the scattergram. Ideally,algorithms would be generated to adapt the gate’s positionto the properties of the platelet population.Similar to results of previous studies using the Sysmex
XT-2000iV, the platelet indices MPV, PDW, P-LCR andPCT [8, 19, 25] are frequently not reported by theanalyzer. Because of the retrospective nature of thisstudy, resampling was not possible so that the intra-assay repeatability could not be calculated for platelet in-dices, which is a limitation of this study. It should benoted that in samples with more than 11.61 % r-PLTs, asmeasured with the “Gelain-gate”, no platelet indiceswere given. Consequently, the platelet indices cannot beused to reflect presence of large numbers of young –presumably large - platelets and consequently a markedplatelet regeneration as has been controversially dis-cussed in previous studies [12, 16, 26, 27].
ConclusionsIn conclusion, we managed to optimize the previouslypublished gates by excluding interferences from erythro-cytes. However, visual assessment of the scattergramsstill remains necessary. Future improvement might beachieved by the generation of algorithms automaticallyadapting the gate to the position of the platelet popula-tion. The use of platelet indices as a marker of PLT re-generation is questionable as their measurement is oftennot reliably possible especially in samples with evidenceof larger numbers of immature PLTs.The reference intervals obtained from a large population
of Beagle dogs for r-PLTs and platelet indices might becomeparticularly useful for experimental studies using Beagles.
AcknowledgementsWe thank Sysmex Europe GmbH, Norderstedt, Germany, for kindly providingthe Sysmex XT-2000iV hematology analyzer.
FundingThe authors received the following financial support for the research,authorship, and/or publication of this article: The Sysmex XT-2000iVhematology analyzer was provided as a loan by the Sysmex Company.
Availability of data and materialsData will not be shared because of unpublished content.
Authors’ contributionsDO collected the data, created the gates, performed the statistical analysisand drafted the manuscript. NB performed the statistical analysis andparticipated in writing of the manuscript. MG participated the data collectionand analysis. SJ was involved in project planning and discussion of theresults. IP collected a great number of blood samples. AM conceived of thestudy and participated in its design and coordination. All authors read andapproved the final manuscript.
Competing interestsThe authors declare that they have no competing interests.
Oellers et al. BMC Veterinary Research (2016) 12:148 Page 10 of 11
Consent for publicationNot applicable.
Ethics approval and consent to participateBlood samples of healthy Beagle dogs were collected in accordance withArticle 8 of German Law on the Protection of Animals and the DarmstadtRegional Council. In healthy and diseased dogs presented in the departmentof veterinary clinical sciences in Giessen, Germany, the hematology was partof the routine diagnostic procedure. According to the information of ourethics committee (ethics committee number: GI 17/18), a particular approvalwas not needed, because the study itself was not the indication of bloodsampling and did not require taking an additional amount of blood.
Author details1Department of Veterinary Clinical Sciences, Clinical Pathophysiology andClinical Pathology, Justus-Liebig University Giessen, Frankfurter Str. 126,35392 Giessen, Germany. 2IDEXX BioResearch Europe, A Division of IDEXXLaboratories, Ludwigsburg, Germany. 3Merck Serono, Global Non-ClinicalSafety, Merck KGaA, Darmstadt, Germany.
Received: 2 June 2015 Accepted: 20 July 2016
References1. Ingram M, Coopersmith A. Reticulated platelets following acute blood loss.
Brit J Haematol. 1969;17:225–9.2. Kienast J, Schmitz G. Flow cytometric analysis of thiazole orange uptake by
platelets: a diagnostic aid in the evaluation of thrombocytopenic disorders.Blood. 1990;75:116–21.
3. Lee LG, Chen C, Chiu LA. Thiazole orange: a new dye for reticulocyteanalysis. Cytometry. 1986;7:508–17.
4. Dale GL, Friese P, Hynes LA, Burstein SA. Demonstration that thiazole-orange-positive platelets in the dog are less than 24 hours old. Blood. 1995;85:1822–5.
5. Zucker ML, Murphy CA, Rachel JM, Martinez GA, Abhyankar S, McGuirk JP, etal. Immature platelet fraction as a predictor of platelet recovery followinghematopoietic progenitor cell transplantation. Lab Hematol. 2006;12:125–30.
6. Saigo K, Sakota Y, Masuda Y, Matsunaga K, Takenokuchi M, Nishimura K, etal. Automatic detection of immature platelets for decision making regardingplatelet transfusion indications for pediatric patients. Transfus Apher Sci.2008;38:127–32.
7. Briggs C, Kunka S, Hart D, Oguni S, Machin SJ. Assessment of an immatureplatelet fraction (IPF) in peripheral thrombocytopenia. Brit J Haematol. 2004;126:93–9.
8. Pankraz A, Bauer N, Moritz A. Comparison of flow cytometry with theSysmex XT2000iV automated analyzer for the detection of reticulatedplatelets in dogs. Vet Clin Pathol. 2009;38:30–8.
9. Gelain E, Tutino G, Rossi G, Bertazzolo W. High fluorescent platelets fractionin macrothrombocytopenic Norfolk terrier. Toulouse: 20th ECVIM-CA AnnualCongress; 2010.
10. Solberg HE. International Federation of Clinical Chemistry (IFCC), ScientificCommittee, Clinical Section, Expert Panel on Theory of Reference Values,and International Committee for Standardization in Haematology (ICSH),Standing Committee on Reference Values. Approved recommendation(1986) on the theory of reference values. Part 1. The concept of referencevalues. J Clin Chem Clin Biochem. 1987;25:337–42.
11. Friedrichs K, Barnhart K, Blanco J, Freeman K, Harr K, Szladovits B, et al.Qualitiy Assurance and Laboratory Standards Commitee (QALS). Guidelinesfor the determination of reference intervals in veterinary species and otherrelated topics: SCOPE. American Society of Veterinary Clinical Pathology(ASVCP). 2011.
12. Bommer NX, Shaw DJ, Milne EM, Ridyard AE. Platelet distribution width andmean platelet volume in the interpretation of thrombocytopenia in dogs. JSmall Anim Pract. 2008;49:518–24.
13. Joutsi-Korhonen L, Sainio S, Riikonen S, Javela K, Teramo K, Kekomäki R.Detection of reticulated platelets: estimating the degree of fluorescence ofplatelets stained with thiazole orange. Eur J Haematol. 2000;65:66–71.
14. O’Malley CJ, Rasko JEJ, Basser RL, McGrath KM, Cebon J, Grigg AP, et al.Administration of pegylated recombinant human megakaryocyte growth anddevelopment factor to humans stimulates the production of functionalplatelets that show no evidence of in vivo activation. Blood. 1996;88:3288–98.
15. Kickler TS, Oguni S, Borowitz MJ. A clinical evaluation of high fluorescentplatelet fraction percentage in thrombocytopenia. Am J Clin Pathol. 2006;125:282–7.
16. Kaito K, Otsubo H, Usui N, Yoshida M, Tanno J, Kurihara E, et al. Platelet sizedeviation width, platelet large cell ratio, and mean platelet volume havesufficient sensitivity and specificity in the diagnosis of immunethrombocytopenia. Brit J Haematol. 2005;128:698–702.
17. Ogura M, Yasuno M, Kobayashi Y, Tsukada T. Clinical significance of plateletvolume indices estimated by automated blood cell analyzer. Rinsho Byori.1995;43:385–90.
18. Schwartz D, Sharkey L, Armstrong PJ, Knudson C, Kelley J. Platelet volumeand plateletcrit in dogs with presumed primary immune-mediatedthrombocytopenia. J Vet Intern Med. 2014;28:1575–9.
19. Bourgès-Abella N, Geffré A, Concordet D, Braun J, Trumel C. Caninereference intervals for the Sysmex XT-2000iV hematology analyzer. Vet ClinPathol. 2011;40:303–15.
20. Rowan RM, Linssen J. A picture is worth a thousand words. Sysmex J Int.2005;15(1):27–32.
21. Smith R, Thomas JS. Quantitation of reticulated platelets in healthy dogsand in nonthrombocytopenic dogs with clinical disease. Vet Clin Pathol.2002;31:26–32.
22. Hanahachi A, Moritomo T, Kano R, Watari T, Tsujimoto H, Hasegawa A.Thiazole orange-positive platelets in healthy and thrombocytopenic dogs.Vet Rec. 2001;149:122–3.
23. Weiss DJ, Townsend E. Evaluation of reticulated platelets in dogs. CompHaematol Int. 1998;8:166–70.
24. Schmitz G, Rothe G, Ruf A, Barlage S, Tschöpe D, Clemetson KJ, et al.European Working Group on Clinical Cell Analysis: consensus protocol forthe flow cytometric characterisation of platelet function. Thromb Haemost.1998;79:885–96.
25. Serra M, Freeman KP, Campora C, Sacchini F. Establishment of caninehematology reference intervals for the Sysmex XT-2000iV hematologyanalyzer using a blood donor database. Vet Clin Pathol. 2012;41:207–15.
26. Balduini CL, Noris P, Spedini P, Belletti S, Zambelli A, Da Prada GA. Relationshipbetween size and thiazole orange fluorescence of platelets in patientsundergoing high-dose chemotherapy. Brit J Haematol. 1999;106:202–7.
27. Bowles KM, Cooke LJ, Richards EM, Baglin TP. Platelet size has diagnosticpredictive value in patients with thrombocytopenia. Clin Lab Haematol.2005;27:370–3.
• We accept pre-submission inquiries
• Our selector tool helps you to find the most relevant journal
• We provide round the clock customer support
• Convenient online submission
• Thorough peer review
• Inclusion in PubMed and all major indexing services
• Maximum visibility for your research
Submit your manuscript atwww.biomedcentral.com/submit
Submit your next manuscript to BioMed Central and we will help you at every step:
Oellers et al. BMC Veterinary Research (2016) 12:148 Page 11 of 11